Sociologia dello Sport e Etica dello sport: la prospettiva dell´approccio relazionale
Upload
khangminh22Category
view
1download
0
Health Prom
otion in Children and Adolescents through Sport and Physical Activities • Antonino Bianco
Health Promotion in Children and Adolescents through Sport and Physical Activities2nd Edition
Printed Edition of the Special Issue Published in Journal of Functional Morphology and Kinesiology
www.mdpi.com/journal/jfmk
Antonino BiancoEdited by

Health Promotion in Children andAdolescents through Sport andPhysical Activities—2nd Edition


Health Promotion in Children andAdolescents through Sport andPhysical Activities—2nd Edition
Editor
Antonino Bianco
MDPI • Basel • Beijing • Wuhan • Barcelona • Belgrade • Manchester • Tokyo • Cluj • Tianjin

Editor
Antonino Bianco
Department of Psychology,
Educational Science and Human
Movement
University of Palermo
PALERMO
Italy
Editorial Office
MDPI
St. Alban-Anlage 66
4052 Basel, Switzerland
This is a reprint of articles from the Special Issue published online in the open access journal
Journal of Functional Morphology and Kinesiology (ISSN 2411-5142) (available at: www.mdpi.com/
journal/jfmk/special issues/adolescents sport 2).
For citation purposes, cite each article independently as indicated on the article page online and as
indicated below:
LastName, A.A.; LastName, B.B.; LastName, C.C. Article Title. Journal Name Year, Volume Number,
Page Range.
ISBN 978-3-0365-1197-9 (Hbk)
ISBN 978-3-0365-1196-2 (PDF)
© 2021 by the authors. Articles in this book are Open Access and distributed under the Creative
Commons Attribution (CC BY) license, which allows users to download, copy and build upon
published articles, as long as the author and publisher are properly credited, which ensures maximum
dissemination and a wider impact of our publications.
The book as a whole is distributed by MDPI under the terms and conditions of the Creative Commons
license CC BY-NC-ND.

Contents
About the Editor . . . . . . . . . . . . . . . . . . . . . . . . . . . . . . . . . . . . . . . . . . . . . . vii
Preface to ”Health Promotion in Children and Adolescents through Sport and Physical
Activities—2nd Edition” . . . . . . . . . . . . . . . . . . . . . . . . . . . . . . . . . . . . . . . . . . ix
Antonino Bianco
Preface to “Health Promotion in Children and Adolescents through Sport and PhysicalActivities—2nd Edition”Reprinted from: Journal of Functional Morphology and Kinesiology 2021, 6, 23,doi:10.3390/jfmk6010023 . . . . . . . . . . . . . . . . . . . . . . . . . . . . . . . . . . . . . . . . . . 1
Kwok W Ng, Fiona McHale, Karen Cotter, Donal O’Shea and Catherine Woods
Feasibility Study of the Secondary Level Active School Flag Programme: Study ProtocolReprinted from: Journal of Functional Morphology and Kinesiology 2019, 4, 16,doi:10.3390/jfmk4010016 . . . . . . . . . . . . . . . . . . . . . . . . . . . . . . . . . . . . . . . . . . 3
Ivan Chulvi-Medrano, Manuel Pombo, Miguel Angel Saavedra-Garcıa, Tamara Rial
Rebullido and Avery D Faigenbaum
A 47-Year Comparison of Lower Body Muscular Power in Spanish Boys: A Short ReportReprinted from: Journal of Functional Morphology and Kinesiology 2020, 5, 64,doi:10.3390/jfmk5030064 . . . . . . . . . . . . . . . . . . . . . . . . . . . . . . . . . . . . . . . . . . 23
Josip Karuc and Marjeta Misigoj-Durakovic
Relation between Weight Status, Physical activity, Maturation, and Functional Movement inAdolescence: An OverviewReprinted from: Journal of Functional Morphology and Kinesiology 2019, 4, 31,doi:10.3390/jfmk4020031 . . . . . . . . . . . . . . . . . . . . . . . . . . . . . . . . . . . . . . . . . . 29
Nemanja Lakicevic
The Effects of Alcohol Consumption on Recovery Following Resistance Exercise: A SystematicReviewReprinted from: Journal of Functional Morphology and Kinesiology 2019, 4, 41,doi:10.3390/jfmk4030041 . . . . . . . . . . . . . . . . . . . . . . . . . . . . . . . . . . . . . . . . . . 37
Avery D. Faigenbaum, Jie Kang, Nicholas A. Ratamess, Anne C. Farrell, Mina Belfert, Sean
Duffy, Cara Jenson and Jill Bush
Acute Cardiometabolic Responses to Multi-Modal Integrative Neuromuscular Training inChildrenReprinted from: Journal of Functional Morphology and Kinesiology 2019, 4, 39,doi:10.3390/jfmk4020039 . . . . . . . . . . . . . . . . . . . . . . . . . . . . . . . . . . . . . . . . . . 55
Pedro Migliano, Laura S. Kabiri, Megan Cross, Allison Butcher, Amy Fruge, Wayne Brewer
and Alexis Ortiz
Validation of Cardiorespiratory Fitness Measurements in AdolescentsReprinted from: Journal of Functional Morphology and Kinesiology 2019, 4, 44,doi:10.3390/jfmk4030044 . . . . . . . . . . . . . . . . . . . . . . . . . . . . . . . . . . . . . . . . . . 69
v
Mustafa Sogut, Omer Barıs Kaya, Kubra Altunsoy, Cain C. T. Clark, Filipe Manuel Clemente
and Ali Ahmet Dogan
Anthropometric Obesity Indices, Body Fat Percentage, and Grip Strength in Young Adults withdifferent Physical Activity LevelsReprinted from: Journal of Functional Morphology and Kinesiology 2019, 4, 51,doi:10.3390/jfmk4030051 . . . . . . . . . . . . . . . . . . . . . . . . . . . . . . . . . . . . . . . . . . 79
Clare M. P. Roscoe, Rob S. James and Michael J. Duncan
Accelerometer-Based Physical Activity Levels Differ between Week and Weekend Days inBritish Preschool ChildrenReprinted from: Journal of Functional Morphology and Kinesiology 2019, 4, 65,doi:10.3390/jfmk4030065 . . . . . . . . . . . . . . . . . . . . . . . . . . . . . . . . . . . . . . . . . . 87
Ludovica Gasbarro, Elvira Padua, Virginia Tancredi, Giuseppe Annino, Michela Montorsi,
Grazia Maugeri and Agata Grazia D’Amico
Joint Mobility Protection during the Developmental Age among Free Climbing Practitioners: APilot StudyReprinted from: Journal of Functional Morphology and Kinesiology 2020, 5, 14,doi:10.3390/jfmk5010014 . . . . . . . . . . . . . . . . . . . . . . . . . . . . . . . . . . . . . . . . . . 99
Ewan Thomas, Marianna Alesi, Garden Tabacchi, Carlos Marques da Silva, David J. Sturm,
Fatma Nese Sahin, Ozkan Guler, Manuel Gomez-Lopez, Simona Pajaujiene, Michele Basile,
Ante Rada, Antonio Palma and Antonino Bianco
Cognitive and Physical Activity-Related Aspects of Children Associated to the Performance ofthe Crunning MovementReprinted from: Journal of Functional Morphology and Kinesiology 2021, 6, 9,doi:10.3390/jfmk6010009 . . . . . . . . . . . . . . . . . . . . . . . . . . . . . . . . . . . . . . . . . . 111
Terence Chua, Abdul Rashid Aziz and Michael Chia
Four Minutes of Sprint Interval Training Had No Acute Effect on Improving Alertness, Mood,and Memory of Female Primary School Children and Secondary School Adolescents: ARandomized Controlled TrialReprinted from: Journal of Functional Morphology and Kinesiology 2020, 5, 92,doi:10.3390/jfmk5040092 . . . . . . . . . . . . . . . . . . . . . . . . . . . . . . . . . . . . . . . . . . 123
Tamara Rial Rebullido, Cinta Gomez-Tomas, Avery D. Faigenbaum and Ivan
Chulvi-Medrano
The Prevalence of Urinary Incontinence among Adolescent Female Athletes: A SystematicReviewReprinted from: Journal of Functional Morphology and Kinesiology 2021, 6, 12,doi:10.3390/jfmk6010012 . . . . . . . . . . . . . . . . . . . . . . . . . . . . . . . . . . . . . . . . . . 135
vi

About the Editor
Antonino Bianco
Antonino Bianco (41 years old) is living in Palermo, Italy. He grew up in Resuttano (CL), a little town
located in the middle of Sicily. Prof. Bianco is married to Esamuela Pieretta Mancuso and the Father
of Barbara Alison Bianco. He graduated from Palermo University in Sport and Exercise Sciences;
afterwards, he received a Ph.D. in Exercise Physiology (University of Palermo Medical School) and
a Post-Doc in Exercise Physiology from Greenwich University (UK). He has worked for Palermo
University since December 2008, and he has been an Associate Professor at the University of Palermo
since November 2019. He has co-authored more than 150 peer-reviewed articles, including the GSSI
Sports Nutrition Award at ECSS 2017. Of interest is that, at the age of 39, he was included within the
list of the top Italian scientists in Sport and Exercise Sciences. His main research interests include:
pediatric exercise and cognitive functions development; fundamentals of training methodology for
muscle hypertrophy.
vii


Preface to ”Health Promotion in Children and
Adolescents through Sport and Physical
Activities—2nd Edition”
The second edition of the Special Issue entitled “Health Promotion in Children and Adolescents
through Sport and Physical Activities”has been successfully completed, as expected. As stated in the
preface to the first edition, this Special Issue (SI) was initially intended to address a challenge in this
field, but this over time topic is becoming an important cornerstone for scientists who are exploring
the fascinating subject of pediatric exercise. I’m grateful to all contributors for choosing MPDI and in
particular my Special Issue.
Antonino Bianco
Editor
ix

Journal of
Functional Morphology and Kinesiology
Editorial
Preface to “Health Promotion in Children and Adolescentsthrough Sport and Physical Activities—2nd Edition”
Antonino Bianco
���������������
Citation: Bianco, A. Preface to
“Health Promotion in Children and
Adolescents through Sport and
Physical Activities—2nd Edition”. J.
Funct. Morphol. Kinesiol. 2021, 6, 23.
https://doi.org/10.3390/jfmk6010023
Received: 23 February 2021
Accepted: 24 February 2021
Published: 1 March 2021
Publisher’s Note: MDPI stays neutral
with regard to jurisdictional claims in
published maps and institutional affil-
iations.
Copyright: © 2021 by the author.
Licensee MDPI, Basel, Switzerland.
This article is an open access article
distributed under the terms and
conditions of the Creative Commons
Attribution (CC BY) license (https://
creativecommons.org/licenses/by/
4.0/).
Sport and Exercise Sciences Research Unit, University of Palermo, Via Giovanni Pascoli, 6, 90144 Palermo, Italy;[email protected]
The second edition of the Special Issue entitled “Health Promotion in Children andAdolescents through Sport and Physical Activities” has been successfully completed, asexpected. As stated in the preface to the first edition, this special issue (SI) was initiallyintended to address a challenge in this field, but this topic is becoming, over time, animportant cornerstone for scientists who are exploring the fascinating subject of pediatricexercise. We open the second edition of this Special Issue with an interesting study protocoldescribed by Ng et al., from the Health Research Institute, University of Limerick. Themanuscript presents a useful overview of initiatives designed to encourage people tobecome more active and increase their awareness of the potential benefits of physicalactivity (PA). Chulvi-Medrano et al. present a 47-year comparison of lower body muscularpower in Spanish boys. The authors conclude that a decline in lower body muscular poweroccurs in 10–11-year-old Spanish boys, which may be due to the increasing prevalence ofsedentary lifestyles across Europe, particularly in the southern regions. Josip Karuc andMarjeta Mišigoj-Durakovic investigate the relationship between functional movement (FM)patterns, PA level, and weight status in an average adolescent population. As expected,the authors reinforce the consensus that overweight and obese adolescents exhibit poorerfunctional movement than normal-weight adolescents. Nemanja Lakicevic, a PhD studentfrom Palermo University, presents evidence of the effects of alcohol consumption onrecovery following resistance exercise. The systematic review was publicized on socialmedia and provides an interesting overview of the potentially negative effects of alcohol,particularly in regard to adolescents.
The acute cardiometabolic responses to multi-modal integrative neuromuscular train-ing are reported by a pioneer in the science of modern pediatric exercise. Prof. AveryFaigenbaum is currently regarded as a major contributor in the field, often proposing newideas and highlighting resistance training as the driving force behind the proper growthand development of coming generations. In line with Faigenbaum et al., Migliano et al.significantly contribute to this SI with their validation of cardiorespiratory fitness measure-ments in adolescents living in Texas (USA). Mustafa Sögüt et al. report interesting dataregarding anthropometric obesity indices, body fat percentage, and grip strength in youngadults. Of interest, Roscoe et al. investigate accelerometer-based physical activity levels inBritish preschoolers. On the other hand, joint mobility among young people participatingin free climbing has been investigated by Gasbarro et al.
The ESA Program is also discussed in this Special Issue, in the contribution of EwanThomas et al., who consider the entire consortium involved in this innovative and sus-tainable European project (more than 60 people involved). The randomized controlledtrial carried out by Chua et al. shows that four minutes of sprint interval training has noacute positive effects on alertness, mood, and memory in children. The study also providesuseful information for physical education teachers interested in introducing new settingsand scenarios to their lessons. The closing paper of the Special Issue is that by Tamara Rialand colleagues. Their investigation considers urinary incontinence (UI) among adolescentfemale athletes. Interestingly, the prevalence of UI among such athletes participating in
J. Funct. Morphol. Kinesiol. 2021, 6, 23. https://doi.org/10.3390/jfmk6010023 https://www.mdpi.com/journal/jfmk
1

J. Funct. Morphol. Kinesiol. 2021, 6, 23
impact sports was most dominant and higher in those engaged in trampolining, followedby rope skipping. In conclusion, I wish to thank the MDPI Editorial Office, and particularlyMolly Lu, for supporting me in the role of SI editor. I am also grateful to the EIC GiuseppeMusumeci for the valuable guidance he provided following several rejections.
This Special Issue presents a total of 12 papers, encompassing 31 different affiliations,with authors from 12 different countries spanning three different regions of the world(Europe, North America, and Asia).
I hope to continue the success of this Special Issue with a third edition in the near future.
Conflicts of Interest: The authors declare no conflict of interest.
2
Journal of
Functional Morphology and Kinesiology
Protocol
Feasibility Study of the Secondary Level ActiveSchool Flag Programme: Study Protocol
Kwok W Ng 1,2,* , Fiona McHale 1, Karen Cotter 3, Donal O’Shea 4 and Catherine Woods 1
1 Department of Physical Education and Sport Sciences; Centre of Physical Activity and Health Research;Health Research Institute, University of Limerick, V94 T9PX Limerick, Ireland; [email protected] (F.M.);[email protected] (C.W.)
2 School of Educational Sciences and Psychology, University of Eastern Finland, 80101 Joensuu, Finland3 Active Schools Flag, Mayo Education Centre, F23 HX48 Castlebar, Ireland; [email protected] St. Vincent’s University Hospital, University College Dublin, D04 T6F4 Dublin, Ireland; [email protected]* Correspondence: [email protected] or [email protected]; Tel.: +358-50-472-4051
Received: 27 February 2019; Accepted: 19 March 2019; Published: 26 March 2019���������������
Abstract: Taking part in regular physical activity (PA) is important for young adolescents to maintainphysical, social and mental health. Schools are vibrant settings for health promotion and thecomplexity of driving a whole-school approach to PA has not been tested in the Irish school context.The feasibility of the pilot programme of the Department of Education and Skills second level ActiveSchool Flag (SLASF) is needed. SLASF is a two year process that consists of the Active School Flag(ASF) certificate programme (year 1) and the ASF flag programme (year 2). This protocol paperis specific to the first year certificate process. Three schools around Ireland were recruited as pilotschools to carry out the year-long SLASF programme with 17 planned actions involving the entireschool. Students in the transition year programme have a particular role in the promotion of PA inSLASF. Data collection consists of physical measures, accelerometers, survey data and interviewsat the beginning and the end of the academic year. The primary focus on the feasibility of theprogramme is through process evaluation tools and fidelity checks consisting of implementation ofthe SLASF programme through whole-school surveys, focus group discussions of key stakeholdergroups, as well as one-to-one interviews with a member of management at each school and the SLASFcoordinator of the school. Secondary outcomes include PA levels and its social cognitive theoriesbased correlates through physical health measures, surveys carried out pre- and post-intervention, aswell as focus group discussions of the students. The results of this study are needed to improve thedevelopment of the SLASF through a predetermined stopping criteria and inclusion into systemsthinking approaches such as the Healthy Ireland Demonstration Project.
Keywords: physical activity; adolescent; health promotion; activePal; intervention
1. Introduction
There are multiple reasons—physical, psychological, social, environmental—health foradolescents to take part in regular physical activity (PA). However, adolescence forms a highlyvolatile stage in life where transitional periods can influence behaviour [1] and is a critical time forPA participation where habits—good or bad—developed, later persist into adulthood [2]. Despite theevidence of health benefits from PA, a clear reduction in PA levels is apparent alongside increasingage in adolescence. Data from the Children’s Sport Participation and Physical Activity (CSPPA) studyhighlighted a decline in meeting the PA guidelines, at least 60 min of moderate-to-vigorous (MVPA)per day, from 18% among 12y olds (first year of second level education in Ireland) to 6% among 18yolds (last year of second level education in Ireland) [3]. Similarly, a systematic review and pooled
J. Funct. Morphol. Kinesiol. 2019, 4, 16; doi:10.3390/jfmk4010016 www.mdpi.com/journal/jfmk3

J. Funct. Morphol. Kinesiol. 2019, 4, 16
analysis indicated that PA levels decline by a mean of 7% per year over this period [4,5]. By the ageof 15y, on average, across 42 countries in the Health Behaviour in School-aged Children study, only11% of girls and 21% of boys self-reported sufficient MVPA levels [6]. Global PA decline throughoutadolescence, across a range of measurement units, appears as high as 60–70% [4]. Action is needed toreduce the drop in PA levels.
Actions that target the drop in PA levels can include interventions at the individual, communityand within policy [7]. Although policy interventions may provide the best return on investment [8],creating such changes requires a strong evidence base that interventions targeting the behavioursactually works. At the individual level, interventions that were designed to increase school-based PAlevels have yet to demonstrate its effectiveness [8]. In particular, multi-component PA interventionshave yet to demonstrate improvements in overall MVPA [9]. However, at the community level,school-based PA programmes have demonstrated some positive effect on overall PA levels [10].
1.1. Whole-School Approaches to Physical Activity Promotion
Successfully run school-based PA programmes includes quality physical education, physicalactivities before-, during- and after-school, at the school grounds, as well as activities based in the localcommunity [11]. Haapala and colleagues [11] suggested that recess time activities before, during andafter school are opportune moments to promote PA. Similarly, a study based on a 12 week walkingintervention among girls who took part before-school and during recess times increased the time inlight intensity PA by 10 min but differences in MVPA were not statistically significant when comparedto the intervention group [12]. Some recent studies have investigated the role of peers in boostingPA levels. For example, peer leaders (15–16y olds) slightly older than the target group (13–15y olds)encouraged after-school activities. By the end of the 7-week after-school intervention, there was astatistically significant increase of three minutes of daily MVPA [13]. Same-aged peers were alsoeffective in promoting six minutes of daily MVPA through diffusion messages among girls during theentire school day [14]. Statistically significant changes on PA levels were found for those identified aslow active at baseline in an intervention that focused on increasing step count in both boys and girls [15].Few school-based programmes managed to succeed in increasing boys’ PA levels for school-basedinterventions through a peer-led model [16,17]. Programmes with in-class activities that promote PA bythe class teachers are another way to increase PA levels [18]. The latter activities requires a whole-schoolapproach towards PA promotion and in Ireland, this is known as the Active School Flag (ASF) [19].
The ASF (www.activeschoolflag.ie) is a Department of Education and Skills (DES) initiativesupported by Healthy Ireland. It takes a ‘whole-school approach’ and requires all members of theschool community to work together to strengthen the delivery of the physical education programmeand to promote PA throughout the school in a fun and inclusive manner. It emphasises quality PE,co-curricular PA as well as partnerships with students, parents and the wider community. In 2018, 29%(N = 1329) of primary schools in Ireland had achieved ASF status. Some have the need for renewal,thus at the time of print, 722 primary schools currently have possession of an Active Flag. The journeytowards achieving this status begins with self-evaluation in the areas of (i) physical education (ii) PAand (iii) partnerships. Following this, schools are expected to devise a strategic plan and implementchanges to help improve the quality of PE, provide additional opportunities for PA and supportadditional involvement with the wider community. Lastly, the school has to provide a week-long focuson PA in an Active School Week.
The ASF is well-established as a primary school initiative but has yet to be developed for thesecondary level education sector. A generic model has been tried among secondary level schools,although it did not achieve the same effect because the uptake of secondary level schools is below 5%.The most notable differences were the lack of whole-school engagement in the secondary level schools.Feedback from those experiences suggested that the generic ASF in secondary level was viewed asa physical education programme as opposed to a whole-school initiative. Furthermore, there arestructural differences between primary and secondary level schools, thus a direct translation of the
4
J. Funct. Morphol. Kinesiol. 2019, 4, 16
primary ASF to the secondary level setting would be specious. Some examples of differences include;in primary schools, a single teacher generally remains with the same class throughout the entire day,whereas at secondary level schools, students are taught by multiple teachers. In the secondary levelschools, many schools do not have a compulsory timetabled physical education in accordance withDES recommendations (i.e., a double timetabled period for all students every week). Secondary levelschools tend to be larger and cater for more students than primary schools, yet facilities for promotingPA can be limiting. Peer influences tend to be stronger at secondary level education [20] and studentswill often choose to socialise with their friends and be sedentary rather than take part in PA [21].In primary schools, all teachers are encouraged to take part in continuous professional development(CPD) as part of their classroom responsibility in the areas of physical education and PA. Class teachersin secondary level schools tend to be specialists in their subject area and may not have the confidenceor competence to create active breaks in the classroom [22].
In the majority of Irish secondary level schools, there is the ‘Transition Year’ (TY) period,whereby it is non- examinable and students may go on to try out activities beyond the normalschool curriculum [23]. The aims of TY are to “increase social awareness and social competence with‘education through experience of adult and working life’ as a basis for personal development andmaturity” [24]. TY programmes can cover various aspects of personal development, including visits tohospitals to learn about health behaviours [25], as well as taking part in other science programmes [26].Many TY based programmes seek to develop youth leadership skills (i.e., Gaisce the President’s Award,Young Social Innovators, Gaelic Athletic Association (GAA) future leaders, etc.).
1.2. Theoretical Background to the Study
The theoretical premise of this feasibility study is underpinned by social cognitive theories [27]These theories are the most cited for health behaviour change interventions [28]. In these theories,there is a triad relationship between personal and environmental factors with behaviours beingexplored through individual level factors such as self-efficacy, stages of readiness for behaviouralchange and school related autonomy. In self-efficacy theory [29] there are four sources; masteryaccomplishments, vicarious experiences, verbal persuasion and physiology are strong predictors ofbehaviour. Novice learners, such as students in TY, tend to have low confidence to promote PA atthe beginning of the year [30]. When schools express their interest to be an SLASF school, a resourcepack (see methods section) would support these students to improve the self-efficacy (opportunitiesfor mastery accomplishments), create timetabled meetings with the purpose to focus on the SLASF(opportunities for vicarious experiences) and regular contact with others who are also carrying out theSLASF (opportunities for verbal persuasions), the sources of self-efficacy may create a better suitedenvironment for promoting PA.
Being autonomous in making decisions is known to be directly related to intrinsic motivationstowards a behaviour [31]. However, in the school context, students may feel their overall autonomy isrestricted to the bounds of the school. As a result, some students may find the school environmentsomething that they can thrive in, whereas others may feel the environment restricts individual choices.The autonomy supportive environment is as important as having autonomy among school-agedchildren because it can lead to greater levels of PA outside of the school context [32]. Factors thatmay influence the autonomy or autonomy support can include the perception of school academicperformance and the way teachers and peers support academic performance [33], perceptions of abilityto make decisions in the school [34] and feelings of belonging in the school [35]. Furthermore, ithas been reported that individual well-being is associated with individual’s sense of autonomy [36],therefore studies may need to consider the mediating factors of student well-being.
The levels of readiness for taking part in regular PA would vary vastly among the studentsthroughout the school. According to the transtheoretical model [37] individuals are at differentstages of their intention for behavioural change. Progression between the five noted stages includepre-contemplation (not ready), contemplation (getting ready), preparation (ready), action and
5

J. Funct. Morphol. Kinesiol. 2019, 4, 16
maintenance. According to the model, the factors that influence moving between these stages consist ofbiopsychosocial factors, including self-efficacy, own and socially supported decisions and going throughthe process of change [38]. Through awareness of the stages of change among the target population,there is a greater understanding of how to create targeted interventions for the promotion of PA.
1.3. Measures of Feasibility
The SLASF programme is in its pilot phase as part of a larger systems based Healthy IrelandDemonstration Project. It is also a feasibility study, because we aim to investigate whether itis suitable in secondary level schools and if so, how to do that [39]. According to Bowen andcolleagues [40], designing feasibility studies can have eight areas of focus; acceptability, demand,implementation, practicality, adaptation, integration, expansion and limited efficacy. Although theSLASF is a non-clinical study, the feasibility study is useful to provide an indicator for stopping,revisions or continuing for a scaling up a randomised control trial [41]. Moreover, the predefined rulesneed to be put in place prior to the analysis to prevent uncontrollable biases [42]. In Table 1, Bowenand colleagues’ areas of foci for this feasibility study are broken down into the areas which this studyresearches and stopping criteria.
Table 1. Areas of focus for feasibility studies with measures and stopping criteria.
Focus Measures Stopping Criteria
AcceptabilityPragmatic survey instrument on suitability, satisfyingand attractiveness for SLASF in schools for the TY and
the whole-school at the end of the year.
When less than half the school students and TYconsider SLASF to be suitable, satisfying or attractive
to them.
Focus group and interviews to describe the process ofsatisfaction of the programme, fit into the school’sculture and the positive and negative effect on the
school.
When interviews describe strong statements that havea negative impact on the school’s culture or too much
dissatisfaction to the programme.
Demand PA audit of sections of the school. No improvement over the academic year.
Attendance list at the specific activities Unsustainable numbers in attendance.
Survey instrument based on readiness for PAbehaviours.
Over half of students increased their readiness if theycan.
Focus groups based on the TY engagement in theSLASF process.
Discussions confirm low attendance rates and lack ofdemand for activities.
Implementation Action Logs from the logbook. Over half actions left incomplete
Focus groups on implementation ease Discussions where respondents report too manychallenges preventing implementation
Staff interviews Data that suggests lack of resources to implement theprogramme and failures to execute the actions.
Practicality Action plans for promotion of PA If action plans could not be drawn up by the specifiedtime frame
Adaptation Registrations at events carried out as part of the actionplan
Substantial decrease in participation over a 6 weekperiod
Integration Pre- and post-test results on PA opportunities and itsparticipation
No increased opportunities since the beginning of theprogramme.
Interviews with management about costs toorganization and school policies
Descriptions whereby the costs are not sustainable.Indicators that there is a lack of staff
Expansion Interviews of management Descriptions of the uniqueness of the programme tothe school and difficulties to roll out to other schools.
Limited Efficacy Pre- and post-test results from the comprehensivesurveys
Reduction in main outcome variables over the courseof the year that is greater than the difference between
each year cohort at the baseline measurements
ASF logbook entries Notes that report barriers to completing actions thatare not manageable
PA audit Low level of usage when compared with the beginningof the year
6

J. Funct. Morphol. Kinesiol. 2019, 4, 16
1.4. Purpose of the Study
The primary objective for this study is to see if the SLASF certificate is an acceptable programmein secondary level Irish schools. The secondary objectives are to see how feasible it is to operationalisethe components needed for testing a year-long intervention. These include collecting accelerometerand physical health measures of students in the schools, completion of survey questions for pre- andpost-intervention evaluation and investigate areas for improvement from a pilot study to scale-upintervention programme.
2. Methods and Design
2.1. Setting
Eligible schools include secondary level schools in the Republic of Ireland that have not previouslyapplied for the SLASF. Special educational needs schools or schools without a range of students fromeach year group are excluded. The feasibility study will be conducted in three secondary levelschools, covering the demographics of a girls only school, a mixed school with designated ‘DeliveringEquality of Opportunity in Schools’ (DEIS) status and a mixed mainstream school. A DEIS schoolis part of the Department of Education and Skill’s action plan for educational inclusion to addressdisadvantaged education.
2.2. Recruitment
2.2.1. School Recruitment
The SLASF programme is a comprehensive programme and employs a whole school approach.As an intervention programme, schools were invited to take part if they are not currently in the processof obtaining the Active School Flag. The normal process of the SLASF recruitment is for schools tomake an application but this was suspended to allow time to develop the new model. Schools thatwere interested in carrying out the feasibility study contacted the Active Schools office and requestedto pilot the second level programme. There were three schools that responded and accepted becausethey each have a strong well-being structure in place in their schools. This is a feasibility study withsecondary outcomes on efficacy hence matched control schools (one girls only, one mixed and onemixed DEIS school) were recruited to take part in the survey component of the study. No reservelist was formed for this cohort but engagement of all three schools throughout the year to follow thefeasibility and evaluate the SLASF process.
2.2.2. Student Recruitment
In the participating schools, there are two levels of student engagement—basic and comprehensive.Although all students are exposed to the same SLASF programme, those engaged in the SLASF Basicare required to complete less data collection measures than those in the SLASF Comprehensive.The whole school is involved in the SLASF Basic and a random class from each year group is selectedto take part in the SLASF Comprehensive. Classes are known as mixed ability tutor groups. Studentsobtain their consent to take part in the study. Even though there may be some students who do notobtain consent or would not like to withdraw from the comprehensive aspect of the study, there is nolikely reason for them to influence the feasibility of the study.
The SLASF initiative is structured to fit into the TY framework providing real and meaningfulopportunities for student voice and youth leadership. A TY class would be nominated by the school asthe SLASF TY class. This TY class attends classes in relation to SLASF tasks including youth leadership,mentoring and PA promotion.
7

J. Funct. Morphol. Kinesiol. 2019, 4, 16
2.3. Consent
All students are given information letters for their parents. The information stated the purpose ofthe study as well as components of the study that would involve their child. Also, the letter invites theparents to speak to their children about the study and there are contact details to the research team toanswer questions the parents may have. Because of population bias from active consent, passive consentwas used for all students in the basic part of the programme. The school manages the returned forms ofwithdrawal. This is because it is part of the whole-school process and as a feasibility of programme,schools need to be aware of how to handle withdrawal from the programme. The online survey requeststhe students to give their assent (if under the age of 16) or consent (if over the age of 16).
Students assigned to the comprehensive study, receive the same information sheets as the basicprogramme but in addition, information about the other measures that are included as part of thefeasibility and process evaluation. Parents are asked to give opt in consent due to the nature of datacollection (i.e., use of accelerometers). As part of Irish law, students over the age of 16 can give theirown consent to take part in the study. All students were asked to opt in to be included in videorecordings of interviews.
2.4. Allocation Strategy
There was no allocation strategy used to select the schools. As a feasibility study, it was importantto test the SLASF in various contexts. Three contexts were chosen; a DEIS school, a girls only schooland a mixed school. All schools are considered to be large in size and this would test out the possiblewhole-school approach.
2.5. Active School Flag Intervention
The SLASF feasibility model is co-designed by a SLASF steering group and staff, researchers ofthe University of Limerick and feedback from the three lead schools. The SLASF process is designedto be peer-led by a TY SLASF class, who will have the support of an SLASF coordinator, SLASFcommittee members, school staff and school management. The initiative challenges peers to findways to encourage more students in their school to engage in school-based PA opportunities (year1—SLASF certificate) and community-based PA opportunities (year 2—SLASF flag). During year 1(Active School Flag certificate) the focus is on increasing participation in school-based PA opportunities.Year 2 (Active School Flag) is focused on community-based activities.
Previously the SLASF was viewed as a physical education initiative. In order to generate greaterwhole-school engagement, the SLASF tasks are formatted to draw support for the SLASF TY teamfrom school management and teachers across a variety of different subjects. The new format of theSLASF process complements two current key educational initiatives: The Well-Being Framework bythe Irish National Council for Curriculum and Assessment, the School Self-Evaluation process bythe Department of Education and Skills and a new initiative presently at draft stage: The Parent andStudent Charter also by the Department of Education and Skills. Students working towards Gaiscethe President’s Award can use their SLASF work to fulfil their Community or Personal Skill challengerequirement. Another benefit of SLASF is that it will link schools with the current national HealthyIreland PA programmes and national youth charity events including:
• Get Ireland Walking—www.getirelandwalking.ie• Parkrun—www.parkrun.ie• Get Ireland Swimming—www.swimireland.ie/get-swimming• Swim for a Mile Challenge—www.swimireland.ie/get-swimming/swim-for-a-mile• Darkness into Light—www.darknessintolight.ie• Cycle Against Suicide—www.cycleagainstsuicide.com
8

J. Funct. Morphol. Kinesiol. 2019, 4, 16
The SLASF programme is a whole-school approach to increase PA opportunities and generateopportunities for student voice and youth leadership. Currently, there are two levels. The first levelis a certificate. This is open to all secondary level schools. It can serve as a good link from primaryschools to continue on the ethos of active schools and allow a school to consider whether to take thenext step or not. Moreover, SLASF is a DES (Department of Education and Skills) initiative and it canonly be awarded to schools that adhere to physical education timetable recommendations that is, adouble timetabled period of physical education for all year groups. This provision is not in place ina large number of secondary level schools, thus heretofore excluding them from the SLASF process.The introduction of the certificate level, without eligibility criteria, opens the SLASF process to allinterested post primary schools. If the SLASF certificate proves beneficial it may encourage them torevisit their timetable policy.
Achievement of the flag is a whole school process, meaning that management, staff and studentsall play a role in the programme. There is a requirement for website updates and an online presence.In order to achieve the SLASF Certificate a number of tasks must be completed during year 1.These include: (1) a staff slideshow, (2) an SLASF team slideshow, (3) class time slideshow (4) SLASFtraining day, (5) an SLASF awareness week (towards the beginning of the year), (6) website showcase,(7) SLASF whole school questionnaire, (8) SLASF launch event, (9) SLASF action plan, (10) ‘Did YouKnow?’ campaign, (11) PA module as part of Social, personal and health education (SPHE) subject forjunior cycle students, (12) Active School WALKWAY, (13) Community Mapping of extra curriculumactivities, (14) Community Event, (15) Active School Week, (16) SLASF accreditation visit and (17)school PA space audits (Figure 1).
Figure 1. Second Level Active School Flag (SLASF) Intervention and Research Components Timeline.
All 17 activities are scheduled throughout the school year including a combination of staff andstudents as the main actors in this process. The SLASF TY class should take leadership guided andsupported by the SLASF coordinator and committee on the programme. A key part of the process isthat the SLASF coordinator has timetable provision allocated to two class periods per week to carryout work with the TY class. The committee includes staff representatives from the school, includingone from management, an SLASF coordinator, two other staff who work on the well-being curriculumto include SPHE, Civic, Social, Political Education (CSPE) and Physical Education teachers, as well asfour youth leaders. Structure of different actors in the process can be viewed in Figure 2.
9
J. Funct. Morphol. Kinesiol. 2019, 4, 16
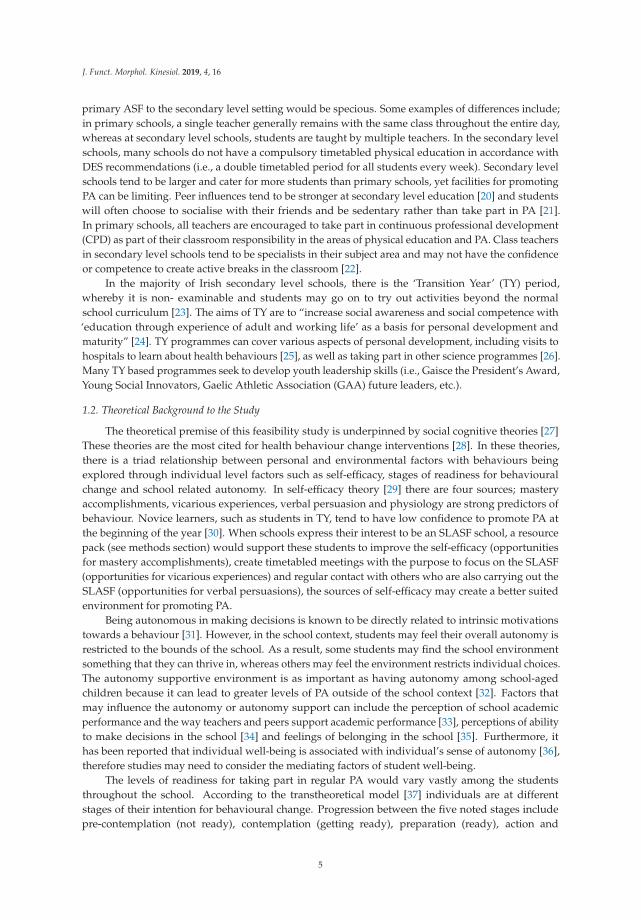
Figure 2. Actors of the Second Level Active school Flag.
Schools wishing to work towards the second level of the SLASF process, the Active School Flag,must have completed the certificate level and be able to confirm that they timetable physical educationin accordance with DES recommendations.
At the student level, there are three levels of involvement. There is the SLASF team, which iscomprised of the SLASF TY programme group. There are four SLASF youth leaders who representthe team at the school committee level. To be a youth leader, the SLASF team member needs to applyfor the position through an application process that is evaluated by the staff members of the SLASFcommittee. The youth leaders end up representing the student voice at the SLASF committee and havethe responsibility of presenting the SLASF action plan and the SLASF end of year review to the schoolPrincipal. The third student level is the SLASF class representatives. There are two in every class in theschool and students can also apply for this position through an application form. The selection will bemade by the class tutor in consultation with the SLASF coordinator.
2.5.1. TY Leader Role
The TY leader role is responsible for planning, promoting and implementing the SLASF initiativesand events throughout the school year. Based on self-efficacy theory [29], TY leaders are a closerconnection to the students in the schools than teachers, thus strengthen vicarious experiences.Moreover, social support and leadership from the TYs can reinforce the basic premise of proactivebehaviour change [43]. The SLASF team can be identified by being given pins to wear on their uniform.Moreover, part of the time spent on SLASF activities can be used as part of a time bank for othervolunteering programmes, such as, Gaisce the President’s Award. The selected SLASF youth leaderswill receive their own distinct pins to wear on the uniform.
2.5.2. Activities for Certification
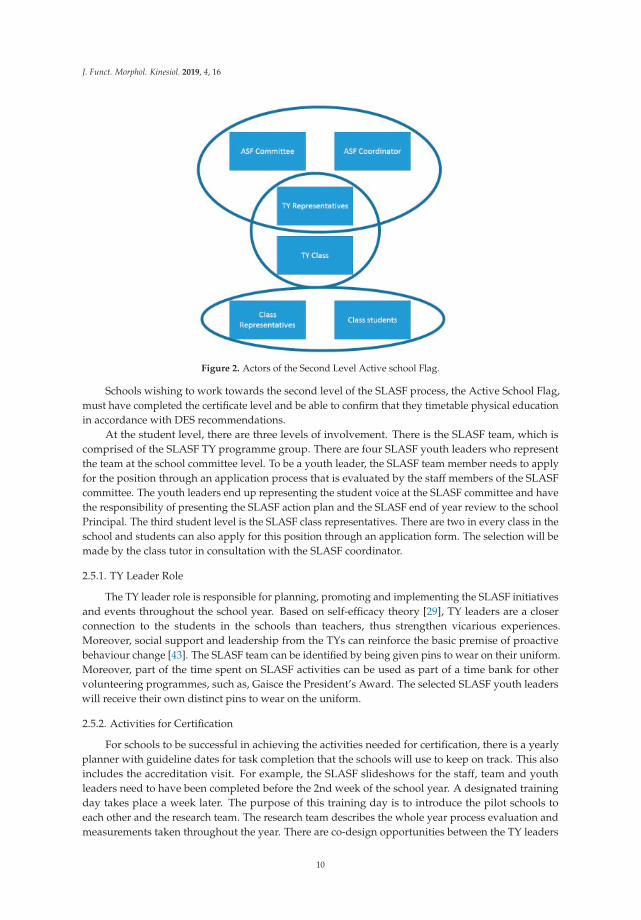
For schools to be successful in achieving the activities needed for certification, there is a yearlyplanner with guideline dates for task completion that the schools will use to keep on track. This alsoincludes the accreditation visit. For example, the SLASF slideshows for the staff, team and youthleaders need to have been completed before the 2nd week of the school year. A designated trainingday takes place a week later. The purpose of this training day is to introduce the pilot schools toeach other and the research team. The research team describes the whole year process evaluation andmeasurements taken throughout the year. There are co-design opportunities between the TY leaders
10
J. Funct. Morphol. Kinesiol. 2019, 4, 16
and researchers to formulate the surveys used to collect data. The training day is not expected to runevery year once feasibility is over. At this training day, two members of staff, the SLASF coordinatorand another on the SLASF team take four student leaders to a training venue to learn about how torun the activities throughout the year. The website should also go live at the outset of the process.The website should encompass an easy to find link to the SLASF section of the site and there are thefour core parts of the SLASF process; Physical Education; PA; Partnerships; and Active School Week.
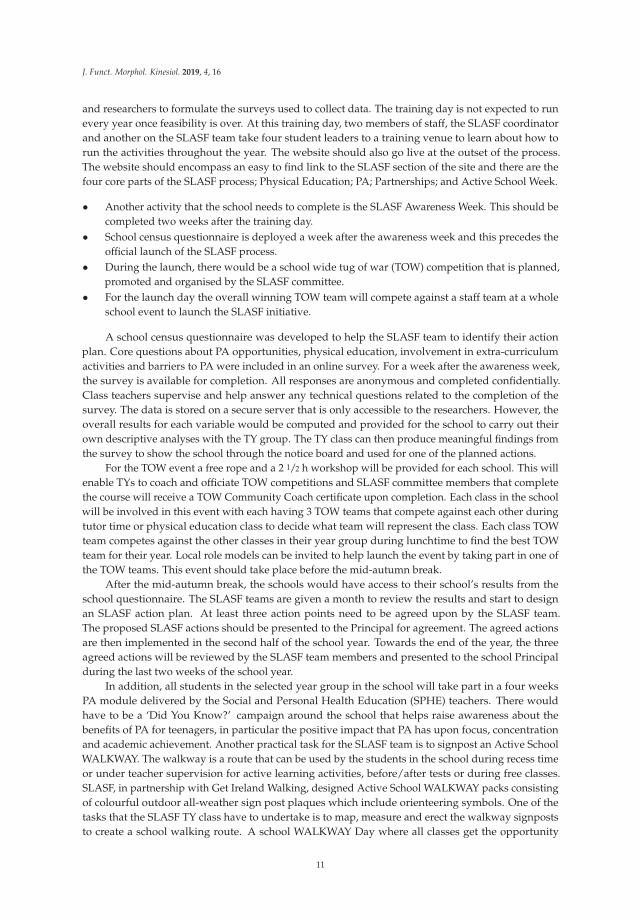
• Another activity that the school needs to complete is the SLASF Awareness Week. This should becompleted two weeks after the training day.
• School census questionnaire is deployed a week after the awareness week and this precedes theofficial launch of the SLASF process.
• During the launch, there would be a school wide tug of war (TOW) competition that is planned,promoted and organised by the SLASF committee.
• For the launch day the overall winning TOW team will compete against a staff team at a wholeschool event to launch the SLASF initiative.
A school census questionnaire was developed to help the SLASF team to identify their actionplan. Core questions about PA opportunities, physical education, involvement in extra-curriculumactivities and barriers to PA were included in an online survey. For a week after the awareness week,the survey is available for completion. All responses are anonymous and completed confidentially.Class teachers supervise and help answer any technical questions related to the completion of thesurvey. The data is stored on a secure server that is only accessible to the researchers. However, theoverall results for each variable would be computed and provided for the school to carry out theirown descriptive analyses with the TY group. The TY class can then produce meaningful findings fromthe survey to show the school through the notice board and used for one of the planned actions.
For the TOW event a free rope and a 2 1/2 h workshop will be provided for each school. This willenable TYs to coach and officiate TOW competitions and SLASF committee members that completethe course will receive a TOW Community Coach certificate upon completion. Each class in the schoolwill be involved in this event with each having 3 TOW teams that compete against each other duringtutor time or physical education class to decide what team will represent the class. Each class TOWteam competes against the other classes in their year group during lunchtime to find the best TOWteam for their year. Local role models can be invited to help launch the event by taking part in one ofthe TOW teams. This event should take place before the mid-autumn break.
After the mid-autumn break, the schools would have access to their school’s results from theschool questionnaire. The SLASF teams are given a month to review the results and start to designan SLASF action plan. At least three action points need to be agreed upon by the SLASF team.The proposed SLASF actions should be presented to the Principal for agreement. The agreed actionsare then implemented in the second half of the school year. Towards the end of the year, the threeagreed actions will be reviewed by the SLASF team members and presented to the school Principalduring the last two weeks of the school year.
In addition, all students in the selected year group in the school will take part in a four weeksPA module delivered by the Social and Personal Health Education (SPHE) teachers. There wouldhave to be a ‘Did You Know?’ campaign around the school that helps raise awareness about thebenefits of PA for teenagers, in particular the positive impact that PA has upon focus, concentrationand academic achievement. Another practical task for the SLASF team is to signpost an Active SchoolWALKWAY. The walkway is a route that can be used by the students in the school during recess timeor under teacher supervision for active learning activities, before/after tests or during free classes.SLASF, in partnership with Get Ireland Walking, designed Active School WALKWAY packs consistingof colourful outdoor all-weather sign post plaques which include orienteering symbols. One of thetasks that the SLASF TY class have to undertake is to map, measure and erect the walkway signpoststo create a school walking route. A school WALKWAY Day where all classes get the opportunity
11

J. Funct. Morphol. Kinesiol. 2019, 4, 16
to complete the walkway route with their teachers on a nominated school day needs to be agreedby school management. Then it is organised and promoted by the SLASF TY team. The organisedwalkway can be used as part of orienteering activities during timetabled physical education, as well asother school-based initiatives.
As the year ends, the school prepares for the accreditation visit for the certificate. A follow upvisit takes place during the acquisition of the flag year. Prior to this, the school needs to organisea community mapping exercise and community events which should help with the design of theActive School Week (ASW) programme. The main aims of the ASW are to promote PA in a fun andinclusive way, as well as raising awareness about the availability and variety of PA opportunitiesfor teenagers and their families in their local community. Throughout this week the school providesmany and varied opportunities for staff and students to become more physically active throughout theschool day.
2.5.3. Expected Outcomes Tables and Measures
According to their training resources, the programme aims to impact on a number of areas.However, to measure them all, multiple sources are required. A collection of survey instruments canbe used to measure some of the outcomes, whereas some interviews can be used to evaluate otheroutcomes. In addition, the programme is year-long and a whole-school approach, hence site visits andchecking on progress through logbook entries would be used to determine the processes carried outduring the study. In Table 2, there is a list of the areas that SLASF aims to promote and some measuresthat can be used to test these outcomes.
Table 2. Aligning outcomes with measures.
SLASF Target Areas Measures of Efficacy Details
Physically educated Self-efficacy in PA Student surveyPhysically active school
communityComprehensive Survey and focus
groups Survey item and discussions
Broad physical education Whole-school survey and focusgroups
List of physical educationactivities and discussions
Balanced physical education Teacher scheme of work Teacher recordsMore inclusiveness Teacher scheme of work Teacher records
Partnership with others topromote pa culture TY logbook Taster session from ASW
Active school week TY logbook Record of entriesIncreased concentration Harter scale Student survey
Improved learning Teachers perceptions Student and teacher surveyMaintenance of discipline Teacher records Discipline records
Improved test results Winter and summer test Academic recordsSchool enjoyment Questionnaire Student surveyIncrease Daily PA Accelerometers Comprehensive Data
Reduced sitting time Accelerometers Comprehensive DataReduction in overweight and
obesitySelf-report and anthropometricmeasures of height and weight Comprehensive data
2.5.4. Questionnaires
There are two types of online surveys carried out throughout the year. The basic survey iscompleted by the entire school. This survey is anonymous and the focus is on PA participation andbarriers to school related physical activities. This survey is a compulsory part of the SLASF process.Administration of the survey is decided by the school, with the intention to cover the entire school.Ideally, a census sweep of the school takes place at the same time. However, there may be sometechnical issues that may prevent this from happening. For example, schools may have a limitednumber of computers accessing the internet at any one time (bandwidth limits), may have a limitednumber of units to complete the survey (lack of tablets or computers) or could not get all the school
12
J. Funct. Morphol. Kinesiol. 2019, 4, 16
to take part at the same time (timetabling issues). The results of the survey will be given back tothe school for the purpose to plan specific school-based interventions. Therefore, it is important thatthe mode of data collection, analysis and reporting can be completed quickly and easily. Failing alltechnical capabilities to collect from an online platform, extra resources would be dedicated to ensuredouble coding from pen and paper surveys.
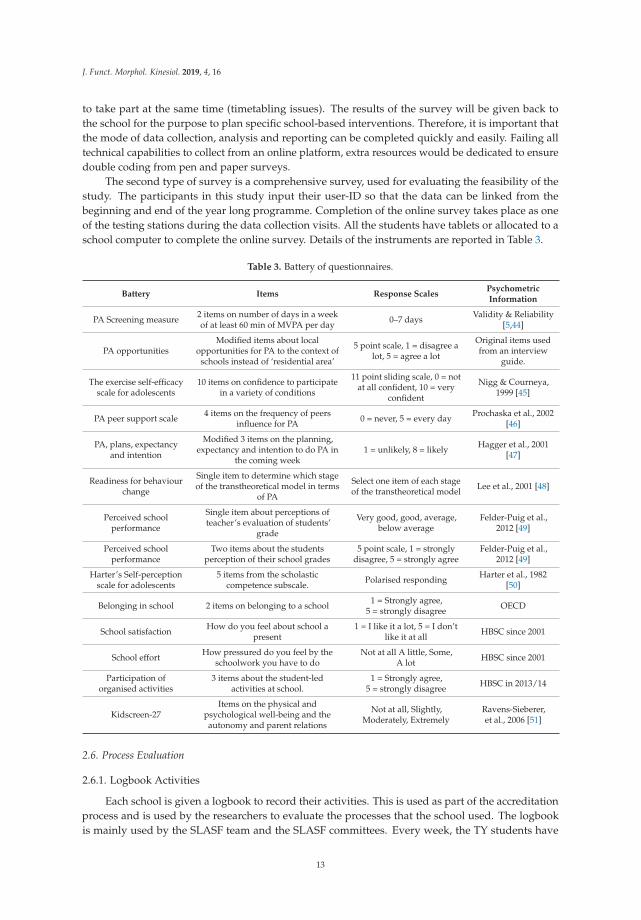
The second type of survey is a comprehensive survey, used for evaluating the feasibility of thestudy. The participants in this study input their user-ID so that the data can be linked from thebeginning and end of the year long programme. Completion of the online survey takes place as oneof the testing stations during the data collection visits. All the students have tablets or allocated to aschool computer to complete the online survey. Details of the instruments are reported in Table 3.
Table 3. Battery of questionnaires.
Battery Items Response ScalesPsychometricInformation
PA Screening measure 2 items on number of days in a weekof at least 60 min of MVPA per day 0–7 days Validity & Reliability
[5,44]
PA opportunitiesModified items about local
opportunities for PA to the context ofschools instead of ‘residential area’
5 point scale, 1 = disagree alot, 5 = agree a lot
Original items usedfrom an interview
guide.
The exercise self-efficacyscale for adolescents
10 items on confidence to participatein a variety of conditions
11 point sliding scale, 0 = notat all confident, 10 = very
confident
Nigg & Courneya,1999 [45]
PA peer support scale 4 items on the frequency of peersinfluence for PA 0 = never, 5 = every day Prochaska et al., 2002
[46]
PA, plans, expectancyand intention
Modified 3 items on the planning,expectancy and intention to do PA in
the coming week1 = unlikely, 8 = likely Hagger et al., 2001
[47]
Readiness for behaviourchange
Single item to determine which stageof the transtheoretical model in terms
of PA
Select one item of each stageof the transtheoretical model Lee et al., 2001 [48]
Perceived schoolperformance
Single item about perceptions ofteacher’s evaluation of students’
grade
Very good, good, average,below average
Felder-Puig et al.,2012 [49]
Perceived schoolperformance
Two items about the studentsperception of their school grades
5 point scale, 1 = stronglydisagree, 5 = strongly agree
Felder-Puig et al.,2012 [49]
Harter’s Self-perceptionscale for adolescents
5 items from the scholasticcompetence subscale. Polarised responding Harter et al., 1982
[50]
Belonging in school 2 items on belonging to a school 1 = Strongly agree,5 = strongly disagree OECD
School satisfaction How do you feel about school apresent
1 = I like it a lot, 5 = I don’tlike it at all HBSC since 2001
School effort How pressured do you feel by theschoolwork you have to do
Not at all A little, Some,A lot HBSC since 2001
Participation oforganised activities
3 items about the student-ledactivities at school.
1 = Strongly agree,5 = strongly disagree HBSC in 2013/14
Kidscreen-27Items on the physical and
psychological well-being and theautonomy and parent relations
Not at all, Slightly,Moderately, Extremely
Ravens-Sieberer,et al., 2006 [51]
2.6. Process Evaluation
2.6.1. Logbook Activities
Each school is given a logbook to record their activities. This is used as part of the accreditationprocess and is used by the researchers to evaluate the processes that the school used. The logbookis mainly used by the SLASF team and the SLASF committees. Every week, the TY students have
13
J. Funct. Morphol. Kinesiol. 2019, 4, 16
the opportunity to complete a small section in the diary to record what took place. The diary islinked to the school year and the expected timescale for carrying out specific activities. There is also achart for the SLASF team to complete by recording the agreed actions to be carried out by the SLASFteam. The team need to record the date of the agreed action, a short title for the action, the person(s)responsible, date of the action completed and a check box.
The TY team carries out a brief version of the System of Observing Play and Leisure Activityin Youth (SOPLAY) [52]. SOPLAY is a direct observation tool that is used by the TYs to assess PAlevels within specific PA areas in the school. Due to resources, the full SOPLAY protocol had to bereduced down to three specific areas around the school. Furthermore, the TYs use tablets to videorecord the specific area and retrospectively carry out the observations. It is designed in this waybecause the technology is more readily available in schools than the time when SOPLAY was createdby McKenzie and colleagues [52]. Through, observing the video recordings, the results can be verifiedso the validity of the results are stronger. Trained researchers with the SOPLAY counting system canverify the results from the TYs by matching the observation results. The videos can also be used as partof a TY class, where the students can get an understanding of ways to record the different intensities ofPA. The SOPLAY exercise is carried out over six times throughout the school year. The assignmentof the dates are researcher assigned days. The TYs are informed of the audit in the morning of theday the recording takes place. To reduce potential bias in the results, the TYs are reminded not to tellothers that they are carrying out the observation. Observations take place twice during lunchtimes,one 10 min into the beginning and the second when there is 10 min left.
Another activity recorded in the logbook is the SLASF committee meetings. The logbook providesspace for six meetings throughout the year. The meeting minutes include the people in attendance,the areas of discussion and the actions that were agreed. There is also space in the logbook has spacefor a list of agreed action created by the TY class during their timetabled class time. To encouragecompliance, there is room for information such as the agreed action, the person responsible and thedate for completion. In addition, there is room in the logbook for the TY team and coordinator to noteactivities that take place in a specific week. For each week, tasks that are suggested, such as the slideshow, presentation of the action plan and so forth are available for the TY and coordinator to helpremind to be on track.
2.6.2. Whole-School Surveys
There are three surveys to be carried out by all students in the school. The whole-school survey ispart of the feasibility study and is carried out through an online survey platform. It is a mandatoryaction to be carried out by the school and is carried out during the first two months of the academicyear. The school uses this information for creating and implementing three school specific actionplans. Within this survey there are details of participation levels and barriers to taking part in physicaleducation and extra curriculum activities. Both staff and students complete a second survey halfwaythrough the process with items also related to process evaluation. Items will test implementation,fidelity and satisfaction of the tasks completed to date. The final whole-school survey has itemsrelated to process evaluation and is completed towards the end of the academic year but before theaccreditation visit. The survey will also be held on an online survey platform. Due to the difficultiesin getting whole-school engagement towards the end of the school year, the survey has pragmaticevaluation items whereby it can be completed on a mobile device such as a tablet or smart phone.
2.7. Sample Size
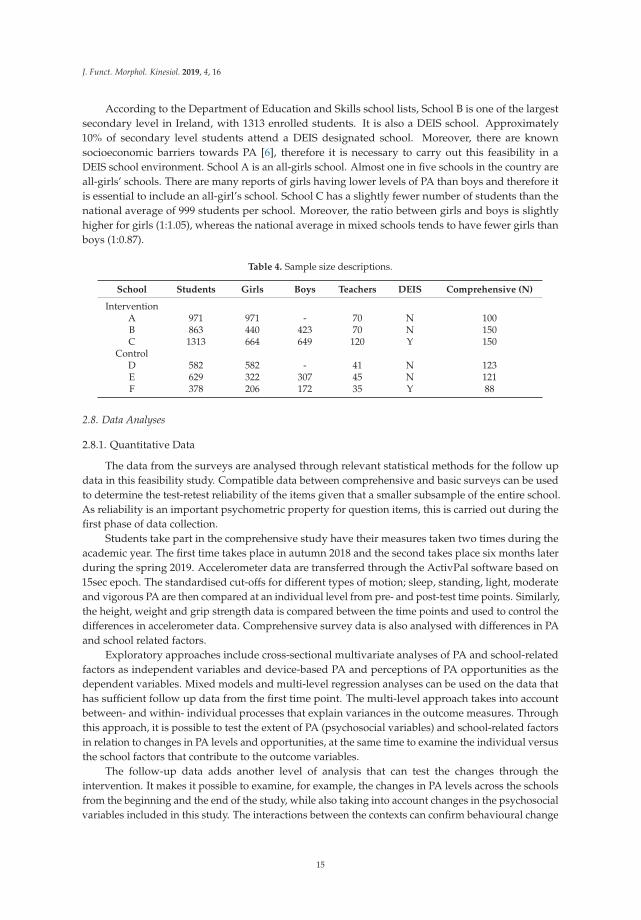
There are three schools that are part of the feasibility study. Unlike a sample size calculation, ajustification is made for feasibility studies [53]. In Table 4, information about the size of the school,the type and the number of participants expected to complete the comprehensive arm of the studyis presented.
14
J. Funct. Morphol. Kinesiol. 2019, 4, 16
According to the Department of Education and Skills school lists, School B is one of the largestsecondary level in Ireland, with 1313 enrolled students. It is also a DEIS school. Approximately10% of secondary level students attend a DEIS designated school. Moreover, there are knownsocioeconomic barriers towards PA [6], therefore it is necessary to carry out this feasibility in aDEIS school environment. School A is an all-girls school. Almost one in five schools in the country areall-girls’ schools. There are many reports of girls having lower levels of PA than boys and therefore itis essential to include an all-girl’s school. School C has a slightly fewer number of students than thenational average of 999 students per school. Moreover, the ratio between girls and boys is slightlyhigher for girls (1:1.05), whereas the national average in mixed schools tends to have fewer girls thanboys (1:0.87).
Table 4. Sample size descriptions.
School Students Girls Boys Teachers DEIS Comprehensive (N)
InterventionA 971 971 - 70 N 100B 863 440 423 70 N 150C 1313 664 649 120 Y 150
ControlD 582 582 - 41 N 123E 629 322 307 45 N 121F 378 206 172 35 Y 88
2.8. Data Analyses
2.8.1. Quantitative Data
The data from the surveys are analysed through relevant statistical methods for the follow updata in this feasibility study. Compatible data between comprehensive and basic surveys can be usedto determine the test-retest reliability of the items given that a smaller subsample of the entire school.As reliability is an important psychometric property for question items, this is carried out during thefirst phase of data collection.
Students take part in the comprehensive study have their measures taken two times during theacademic year. The first time takes place in autumn 2018 and the second takes place six months laterduring the spring 2019. Accelerometer data are transferred through the ActivPal software based on15sec epoch. The standardised cut-offs for different types of motion; sleep, standing, light, moderateand vigorous PA are then compared at an individual level from pre- and post-test time points. Similarly,the height, weight and grip strength data is compared between the time points and used to control thedifferences in accelerometer data. Comprehensive survey data is also analysed with differences in PAand school related factors.
Exploratory approaches include cross-sectional multivariate analyses of PA and school-relatedfactors as independent variables and device-based PA and perceptions of PA opportunities as thedependent variables. Mixed models and multi-level regression analyses can be used on the data thathas sufficient follow up data from the first time point. The multi-level approach takes into accountbetween- and within- individual processes that explain variances in the outcome measures. Throughthis approach, it is possible to test the extent of PA (psychosocial variables) and school-related factorsin relation to changes in PA levels and opportunities, at the same time to examine the individual versusthe school factors that contribute to the outcome variables.
The follow-up data adds another level of analysis that can test the changes through theintervention. It makes it possible to examine, for example, the changes in PA levels across the schoolsfrom the beginning and the end of the study, while also taking into account changes in the psychosocialvariables included in this study. The interactions between the contexts can confirm behavioural change
15
J. Funct. Morphol. Kinesiol. 2019, 4, 16
theories by examining the mediating and moderation mechanisms in PA levels. The majority of thestatistical analysis would be carried out using IBM SPSS.
2.8.2. Qualitative Data
The majority of the qualitative data comprises of focus group data. The way data is captured is asummary of individuals who collectively agree and discuss on the content [54]. Therefore, the firstphase of analysis is to provide quantitative analysis of the subjects and the group types [55]. Focusgroups can be useful to find a consensus on a phenomenon, as well as to engage with participants todiscuss and share ideas that would otherwise be difficult to gather from one to one interviews [56].In particular, the structural approach to children’s group research can be used and transferred acrossto adolescents so that the students’ voice to be heard [57]. Because the way a person in the focusgroup may consider a way to respond to the moderators’ questions could differ from what otherindividuals may be thinking at the time, it is important to consider the way individuals respond, withwhom and in what ways [55]. Transcriptions are matched with assistant moderator notes of verbaland non-verbal behaviours.
The data from one-to-one interviews is more straightforward. A semi-structure interview guideis used to direct the respondent to focus on the research questions and is used for further probinginto these questions if the respondent needs to explain something further. Interviewees data are alsomerged with intonation coding to help reinforce the importance of non-verbal behaviour. The doublecoding from the transcription across the different qualitative approaches creates a rich source of data.
The combination of data is inserted into NVivo software for qualitative analysis. The metadataand types of data are used to create a rich data set. The data undergoes a thematic analysis assuggested by Lederman [58] by (1) identifying the big ideas, (2) creating units of data, (3) categorizingthe units, (4) negotiating categories and (5) identifying themes and use of theory. The theoriessurrounding social-cognitive theories, including self-efficacy theory [29], self-determination theory [31]and competence motivation theory [50] are lens used in the final steps of the content analyses.
The data are collected through follow up measures throughout the year. The researchersincorporate verification checking at the beginning of each session to place a point where the respondentscan focus on. In particular, we are interested in the processes of the intervention, as well as the potentialtransformation in beliefs, thoughts and actions over the course of the year. These steps are useful fordesigning the results in a way that allows for multi-method approach to the overall research questions.
2.8.3. Mixed Methods Analyses
Both quantitative and qualitative data can complement each other. We hope that the data thatderives from both methods of inquiry can be partly explained through the literature to date andother types of data that is collected. To return to the points of evaluation of the feasibility study,there are various numbers of expected outcomes that the school is expected to achieve and they aremeasured directed through particular sources (Table 2). For example, the expected outcome of abroad physical education curriculum is measured through the whole school survey on participation ofvarious physical education activities. The data taken from the beginning of the year gives insight tothe types of activities that the students reported to have attended in the past 12 months. Through datacollection across all year groups, the survey data can be used to determine how broad the physicaleducation programme actually is. The post-test survey would give an indication of the extent of thephysical education programme. However, reliance solely on this measure may be limited to the actualitem that is included in the survey [59]. Therefore, combining the data from focus groups by thestudents and staff at the school can give more details about what was popular, who experienced thechanges and the mechanisms in place to make the broader physical education opportunities. Therefore,the focus on the results are on the processes of creating the change, thus allowing further insight intothe behavioural change techniques used to facilitate such changes.
16
J. Funct. Morphol. Kinesiol. 2019, 4, 16
The SLASF log data contains both quantitative and qualitative data and can be analysed for thepercent of completion towards the SLASF. Actions in relation to SLASF throughout the year formdescriptive feasibility analyses. Differences in the PA audit across the year are analysed throughdescriptive statistics over time. In combination with the logbook of actions and the results of the PAaudit more details about the feasibility of schools’ actions from the TY class can be determined inrelation to desired outcomes.
2.9. Availability of Data and Materials
After completion of the study, data will be stored at the University of Limerick’s Data archivewithout potential identifiers and request for data can be made through the study’s principal investigator(Last author). All supplementary materials for the SLASF programme including the resource pack,template logbook and accompanying resources will be available at https://osf.io/frx6t/.
2.10. Ethics Approval and Consent to Participate
The study follows the principles of the Declaration of Helsinki. The study protocol has beenapproved by the research ethics committee of the Faculty of Education and Health Sciences, Universityof Limerick (ref no. 2018/10/18_EHS). Written informed consent will be sought from participatingteachers, students and students’ guardians. All participants have permission to withdraw from thestudy at any time and data deleted if collected. In cases of important protocol changes, requestsfrom the ethical committee will be sought for. Trial Registration: https://osf.io/keubz/register/5771ca429ad5a1020de2872e; Registered 24th September 2018; Clinical Trial Registration: NCT03847831.
3. Discussion
In this year-long feasibility study of the SLASF, a mixed-method approach is used to giverecommendation to stop, revise or conduct a randomised control trial. The whole-school approachrequires multiple stakeholders, primarily the students in secondary level schools, the TY students, theSLASF staff and its committee, as well as the management. The theories used in this paper are basedon social cognitive theories and stages of change model [29,31,50].
Whole-school based interventions in the promotion of PA have been increasing [11,19] althoughthe inception of the SLASF in the secondary level schools is more complicated than primary levelschools. The diversity of foci at secondary level schools brings challenges towards a uniform andnational programme. This is evident to date, whereby 29% of primary schools are ASF schools, whereasless than 5% of secondary level schools have this status. Therefore, a feasibility study is needed to testthe readiness prior to national roll-out.
The results from this study would be used to help inform the development of the SLASF andreport the experiences of the schools in the feasibility study. Secondary outcomes from the measurescarried out in the study may lead to improved understanding of the mechanisms of the promotionof PA. Moreover, the direct mapping of the stated goals of the SLASF with measures would provideevidence. Future iterations of the SLASF may include opt in by the students to take part in the SLASFTY programme, thus providing a mixture of students who are active and inactive.
The challenges to this programme include the fidelity of the year-long programme. Schools aredynamic systems all with different characteristics based on the people who attend it. Challengingaspects could include issues arising from the coordination of the staff and pupils to carry out thetasks. There may be other activities that take place in the school, which reduce the efforts needed torun the programme or conversely, highly engagement that roles are dispersed more than previouslyplanned. Monitoring of fidelity and carrying out process evaluations would help inform the way theprogramme is run.
This feasibility study is novel in design in that it a whole-school approach to the promotion ofphysical activity among adolescents who are empowered to organize activities over the course of theyear. School management also receive an incentive by striving towards the goal and recognition of
17
J. Funct. Morphol. Kinesiol. 2019, 4, 16
an Active School Flag. Successful piloting of the SLASF can lead to upscaling to all secondary levelschools around the Republic of Ireland due to the programme endorsement by the Department ofEducation and Skills. Testing of the programme can be part of large scale RCT that would fit under theHealthy Ireland Demonstration Project.
Author Contributions: K.W.N. drafted the manuscript. All authors were responsible for writing part of themanuscript and critically revising the complete manuscript. F.M. contributed to the background and conceptof the study. K.C. contributed to the design of the programme. D.O. contributed to the study design. C.W. isthe principal investigator and contributed to the concept and design of the study. All authors approved thefinal manuscript.
Funding: The feasibility study is funded by Mayo Education Centre, Healthy Ireland and St. Vincent’s Foundation.
Acknowledgments: K.W.N., F.M., D.O. and C.W. are researchers who have remained independent in the designof the SLASF programme. K.C. is a member of the ASF steering committee and designed the SLASF programme.K.C.’s involvement was to ensure all the aspects of this protocol are correct. K.C. has no involvement with carryingout the research, either in data collection or analyses.
Conflicts of Interest: K.C. is employed by the Mayo Education Centre although K.C. is not involved in carryingout the research. All other authors declare that they have no competing interests.
References
1. Patton, G.C.; Sawyer, S.M.; Santelli, J.S.; Ross, D.A.; Afifi, R.; Allen, N.B.; Arora, M.; Azzopardi, P.;Baldwin, W.; Bonell, C.; et al. Our future: A Lancet commission on adolescent health and wellbeing.Lancet 2016, 387, 2423–2478. [CrossRef]
2. Telama, R. Tracking of physical activity from childhood to adulthood: A review. Obes. Facts 2009, 2, 187–195.[CrossRef] [PubMed]
3. Woods, C.B.; Tannerhill, D.; Quinlan, A.; Moyna, N.; Walsh, J. The Children’s Sport Participation and PhysicalActivity Study (CSPPA); Irish Sports Council: Dublin, Ireland, 2010.
4. Dumith, S.C.; Gigante, D.P.; Domingues, M.R.; Kohl, H.W. Physical activity change during adolescence: Asystematic review and a pooled analysis. Int. J. Epidemiol. 2011, 40, 685–698. [CrossRef] [PubMed]
5. Hardie Murphy, M.; Rowe, D.A.; Woods, C.B. Impact of physical activity domain on subsequent activity inyouth: A 5-year longitudinal study. J. Sports Sci. 2017, 35, 262–268. [CrossRef]
6. Inchley, J.; Currie, D.; Young, T.; Samdal, O.; Torsheim, T.; Augustson, L.; Mathison, F.; Aleman-Diaz, A.;Molcho, M.; Weber, M.; Barnekow, V. Growing Up Unequal: Gender and Socioeconomic Differences in YoungPeople’s Health and Well-Being. Health Behaviour in School-Aged Children (HBSC) Study: International Report fromthe 2013/2014 Survey; Report No.: Health Policy for Children and Adolescents, No.7; WHO Regional Officefor Europe: Copenhagen, Denmark, 2016.
7. Schilling, J.M.; GilesCorti, B.; Sallis, J.F. Connecting active living research and public policy: Transdisciplinaryresearch and policy interventions to increase physical activity. J. Public Health Policy 2009, 30 (Suppl. 1),S1–S15. [CrossRef] [PubMed]
8. Masters, R.; Anwar, E.; Collins, B.; Cookson, R.; Capewell, S. Return on investment of public healthinterventions: A systematic review. J. Epidemiol. Community Health 2017, 71, 827–834. [CrossRef]
9. Love, R.; Adams, J.; van Sluijs, E.M.F. Are school-based physical activity interventions effective and equitable?A meta-analysis of cluster randomized controlled trials with accelerometer-assessed activity. Obes. Rev. 2019.[CrossRef]
10. Pate, R.R.; Dowda, M. Raising an Active and Healthy Generation: A Comprehensive Public Health Initiative.Exerc. Sport Sci. Rev. 2019, 47, 3–14. [CrossRef]
11. Haapala, H.L.; Hirvensalo, M.H.; Laine, K.; Laakso, L.; Hakonen, H.; Kankaanpää, A.; Lintunen, T.;Tammelin, T.H. Recess physical activity and school-related social factors in Finnish primary and lowersecondary schools: Cross-sectional associations. BMC Public Health 2014, 14, 1114. [CrossRef]
12. Carlin, A.; Murphy, M.H.; Nevill, A.; Gallagher, A.M. Effects of a peer-led Walking in ScHools intervention(the WISH study) on physical activity levels of adolescent girls: A cluster randomised pilot study. Trials 2018,19, 31. [CrossRef]
18
J. Funct. Morphol. Kinesiol. 2019, 4, 16
13. Owen, M.B.; Kerner, C.; Taylor, S.L.; Noonan, R.J.; Newson, L.; Kosteli, M.C.; Curry, W.B.; Fairclough, S.J.The Feasibility of a Novel School Peer-Led Mentoring Model to Improve the Physical Activity Levels andSedentary Time of Adolescent Girls: The Girls Peer Activity (G-PACT) Project. Children 2018, 5, 67. [CrossRef]
14. Sebire, S.J.; Jago, R.; Banfield, K.; Edwards, M.J.; Campbell, R.; Kipping, R.; Blair, P.S.; Kadir, B.; Garfield, K.;Matthews, J.; et al. Results of a feasibility cluster randomised controlled trial of a peer-led school-basedintervention to increase the physical activity of adolescent girls (PLAN-A). Int. J. Behav. Nutr. Phys. Act.2018, 15, 50. [CrossRef] [PubMed]
15. Lubans, D.; Morgan, P. Impact of an extra-curricular school sport programme on determinants of objectivelymeasured physical activity among adolescents. Health Educ. J. 2008, 67, 305–320. [CrossRef]
16. Lubans, D.R.; Morgan, P.J.; Aguiar, E.J.; Callister, R. Randomized controlled trial of the Physical ActivityLeaders (PALs) program for adolescent boys from disadvantaged secondary schools. Prev. Med. 2011, 52,239–246. [CrossRef]
17. Smith, J.J.; Morgan, P.J.; Plotnikoff, R.C.; Stodden, D.F.; Lubans, D.R. Mediating effects of resistance trainingskill competency on health-related fitness and physical activity: The ATLAS cluster randomised controlledtrial. J. Sports Sci. 2016, 34, 772–779. [CrossRef]
18. Dobbins, M.; Husson, H.; DeCorby, K.; LaRocca, R.L. School-based physical activity programs for promotingphysical activity and fitness in children and adolescents aged 6 to 18. Cochrane Database Syst. Rev. 2013, 2.[CrossRef]
19. McMullen, J.; Ní Chróinín, D.; Tammelin, T.; Pogorzelska, M.; van der Mars, H. International Approaches toWhole-of-School Physical Activity Promotion. Quest 2015, 67, 384–399. [CrossRef]
20. Davison, K.K.; Jago, R. Change in parent and peer support across ages 9 to 15 yr and adolescent girls’physical activity. Med. Sci. Sports Exerc. 2009, 41, 1816–1825. [CrossRef]
21. Fitzgerald, A.; Fitzgerald, N.; Aherne, C. Do peers matter? A review of peer and/or friends’ influence onphysical activity among American adolescents. J. Adolesc. 2012, 35, 941–958. [CrossRef]
22. Jenkinson, K.A.; Benson, A.C. Barriers to Providing Physical Education and Physical Activity in VictorianState Secondary Schools. Aust. J. Teach. Educ. 2010, 35, 1–17. [CrossRef]
23. Clerkin, A. Personal development in secondary education: The Irish transition year. Educ. Policy Anal. Arch.2012, 20. [CrossRef]
24. Jeffers, G. The Transition Year programme in Ireland. Embracing and resisting a curriculum innovation.Curric. J. 2011, 22, 61–76. [CrossRef]
25. Kelleher, C.; Kelly, D.; Finnegan, O.; Kerley, M.; Doherty, K.; Gilroy, I.; Conlon, G.; Fitzpatrick, P.; Daly, L.Gender and content influence second-level students’ expectations of health education seminars provided ina health promoting hopital setting. Clin. Health Promot. 2014, 4, 5–11.
26. Hayes, S. A Critical Examination and Evaluation of the Place of Science in the Irish Transition Year. Ph.D.Thesis, University of Limerick, Limerick, Ireland, 2011.
27. Plotnikoff, R.C.; Costigan, S.A.; Karunamuni, N.; Lubans, D.R. Social cognitive theories used to explainphysical activity behavior in adolescents: A systematic review and meta-analysis. Prev. Med. 2013, 56,245–253. [CrossRef] [PubMed]
28. Davis, R.; Campbell, R.; Hildon, Z.; Hobbs, L.; Michie, S. Theories of behaviour and behaviour change acrossthe social and behavioural sciences: A scoping review. Health Psychol. Rev. 2015, 9, 323–344. [CrossRef]
29. Bandura, A. Self-efficacy: Toward a unifying theory of behavioral change. Psychol. Rev. 1977, 84, 191–215.[CrossRef] [PubMed]
30. Martin, J.J.; Kulinna, P.H. A Social Cognitive Perspective of Physical-Activity-Related Behavior in PhysicalEducation. J. Teach. Phys. Educ. 2005, 24, 265–281. [CrossRef]
31. Deci, E.L.; Ryan, R.M. Intrinsic Motivation and Self-Determination in Human Behaviour; Plenum Press: New York,NY, USA, 1985.
32. Hagger, M.S.; Chatzisarantis, N.L.D.; Culverhouse, T.; Biddle, S.J.H. The Processes by Which PerceivedAutonomy Support in Physical Education Promotes Leisure-Time Physical Activity Intentions and Behavior:A Trans-Contextual Model. J. Educ. Psychol. 2003, 95, 784–795. [CrossRef]
33. Hagger, M.S.; Chatzisarantis, N.L.D.; Hein, V.; Soos, I.; Karsai, I.; Lintunen, T.; Leemans, S. Teacher, peer andparent autonomy support in physical education and leisure-time physical activity: A trans-contextual modelof motivation in four nations. Psychol. Health 2009, 24, 689–711. [CrossRef] [PubMed]
19

J. Funct. Morphol. Kinesiol. 2019, 4, 16
34. Mameli, C.; Molinari, L.; Passini, S. Agency and responsibility in adolescent students: A challenge for thesocieties of tomorrow. Br. J. Educ. Psychol. 2019, 89, 41–56. [CrossRef]
35. McNeely, C.; Falci, C. School Connectedness and the Transition into and Out of Health-Risk Behavior AmongAdolescents: A Comparison of Social Belonging and Teacher Support. J. Sch. Health 2004, 74, 284–292.[CrossRef]
36. Dowd, A.J.; Chen, M.Y.; Jung, M.E.; Beauchamp, M.R. “Go Girls!” psychological and behavioral outcomesassociated with a group-based healthy lifestyle program for adolescent girls. Transl. Behav. Med. 2015, 5,77–86. [CrossRef]
37. Prochaska, J.O.; DiClemente, C.C. Stages and processes of self-change of smoking: Toward an integrativemodel of change. J. Consult. Clin. Psychol. 1983, 51, 390–395. [CrossRef]
38. De Bourdeaudhuij, I.; Philippaerts, R.; Crombez, G.; Matton, L.; Wijndaele, K.; Balduck, A.; Lefevre, J. Stagesof change for physical activity in a community sample of adolescents. Health Educ. Res. 2005, 20, 357–366.[CrossRef]
39. Eldridge, S.M.; Lancaster, G.A.; Campbell, M.J.; Thabane, L.; Hopewell, S.; Coleman, C.L.; Bond, C.M.Defining Feasibility and Pilot Studies in Preparation for Randomised Controlled Trials: Development of aConceptual Framework. PLoS ONE 2016, 11, e0150205. [CrossRef]
40. Bowen, D.J.; Kreuter, M.; Spring, B.; Cofta-Woerpel, L.; Linnan, L.; Weiner, D.; Bakken, S.; Kaplan, C.P.;Squiers, L.; Fabrizio, C.; et al. How We Design Feasibility Studies. Am. J. Prev. Med. 2009, 36, 452–457.[CrossRef]
41. Thabane, L.; Ma, J.; Chu, R.; Cheng, J.; Ismaila, A.; Rios, L.P.; Robson, R.; Thabane, M.; Giangregorio, L.;Goldsmith, C.H. A tutorial on pilot studies: The what, why and how. BMC Med. Res. Methodol. 2010, 10, 1.[CrossRef]
42. Ferguson, C.J.; Heene, M. A Vast Graveyard of Undead Theories: Publication Bias and PsychologicalScience’s Aversion to the Null. Perspect. Psychol. Sci. 2012, 7, 555–561. [CrossRef]
43. Rosenbaum, P.; Gorter, J.W. The ‘F-words’ in childhood disability: I swear this is how we should think!Child Care Health Dev. 2012, 38, 457–463. [CrossRef]
44. Ng, K.; Hämylä, R.; Tynjälä, J.; Villberg, J.; Tammelin, T.; Kannas, L.; Kokko, S. Test-retest reliability ofadolescents’ self-reported physical activity item in two consecutive surveys. Arch. Public Health 2019, 77, 9.[CrossRef] [PubMed]
45. Nigg, C.R.; Courneya, K.S. Transtheoretical model: Examining adolescent exercise behavior. J. Adoles. Health1998, 22, 214–224. [CrossRef]
46. Prochaska, J.J.; Rodgers, M.W.; Sallis, J.F. Association of Parent and Peer Support with Adolescent PhysicalActivity. Res. Q. Exerc. Sport 2002, 73, 206–2010. [CrossRef] [PubMed]
47. Hagger, M.S.; Chatzisarantis, N.L.D.; Biddle, S.J.H. The influence of self-efficacy and past behaviour on thephysical activity intentions of young people. J. Sports Sci. 2001, 19, 711–725. [CrossRef] [PubMed]
48. Lee, R.E.; Nigg, C.R.; Diclemente, C.C.; Courneya, K.S. Validating Motivational Readiness for ExerciseBehavior with Adolescents. Res. Q. Exerc. Sport 2001, 72, 401–410. [CrossRef] [PubMed]
49. Felder-Puig, R.; Griebler, R.; Samdal, O.; King, M.A.; Freeman, J.G.; Duer, W. Does the School PerformanceVariable Used in the International Health Behavior in School-Aged Children (HBSC) Study Reflect Students’School Grades? J. Sch. Health 2012, 82, 404–409. [CrossRef] [PubMed]
50. Harter, S. The Perceived Competence Scale for Children. Child Dev. 1982, 53, 87–97. [CrossRef]51. Ravens-Sieberer, U.; KIDSCREEN Group Europe. The KIDSCREEN Questionnaires. Quality of Life
Questionnaires for Children and Adolescents—Handbook; Papst Science Publisher: Lengerich, Germany, 2006.52. McKenzie, T.L.; Marshall, S.J.; Sallis, J.F.; Conway, T.L. Leisure-time physical activity in school environments:
An observational study using SOPLAY. Prev. Med. 2000, 30, 70–77. [CrossRef]53. Lancaster, G.A. Pilot and feasibility studies come of age! Pilot Feasibility Stud. 2015, 1, 1. [CrossRef] [PubMed]54. Krueger, R.A. Developing Questions for Focus Groups; Sage: Thousand Oaks, CA, USA, 1998.55. Vaughn, S.; Schumm, J.S.; Sinagub, J. Focus Group Interviews in Education and Psychology; Sage Research
Methods: Thousand Oaks, CA, USA, 2018.56. Hollander, J.A. The social contexts of focus groups. J. Contemp Ethnogr. 2004, 33, 602–637. [CrossRef]57. McDonald, W.J.; Topper, G.E. Focus group research with children: A structural approach. Appl. Mark. Res.
1988, 28, 3–11.
20
J. Funct. Morphol. Kinesiol. 2019, 4, 16
58. Lederman, L.C. Assessing educational effectiveness: The focus group interview as a technique for datacollection. Commun. Educ. 1990, 39, 117–127. [CrossRef]
59. Moran, A.P.; Matthews, J.J.; Kirby, K. Whatever happened to the third paradigm? Exploring mixed methodsresearch designs in sport and exercise psychology. Qual. Res. Sport Exerc. Health 2011, 3, 362–369. [CrossRef]
© 2019 by the authors. Licensee MDPI, Basel, Switzerland. This article is an open accessarticle distributed under the terms and conditions of the Creative Commons Attribution(CC BY) license (http://creativecommons.org/licenses/by/4.0/).
21

Journal of
Functional Morphology and Kinesiology
Brief Report
A 47-Year Comparison of Lower Body MuscularPower in Spanish Boys: A Short Report
Iván Chulvi-Medrano 1,* , Manuel Pombo 2, Miguel Ángel Saavedra-García 3,
Tamara Rial Rebullido 4 and Avery D Faigenbaum 5
1 Sport Performance and Physical Fitness Research Group (UIRFIDE), Department of Physical and SportsEducation, Faculty of Physical Activity and Sport Sciences, University of Valencia, 46010 Valencia, Spain
2 Department of Physical Education and Sport, University of Coruña, 15179 A Coruña, Spain; [email protected] Group of Research in Sport Science (INCIDE), Department of Physical Education and Sport, University of
Coruña, 15179 A Coruña, Spain; [email protected] Exercise & Women’s Health, Newtown, CT 18940, USA; [email protected] Department of Health and Exercise Science, The College of New Jersey, Ewing, NJ 08628, USA;
[email protected]* Correspondence: [email protected]
Received: 11 July 2020; Accepted: 18 August 2020; Published: 20 August 2020���������������
Abstract: Much of the evidence examining temporal trends in fitness among youth has found adecrease in measures of muscular strength and muscular power over recent decades. The aim of thisstudy was to examine trends in lower body muscular power in Spanish boys over 47 years. In 1969140 boys (10–11 years; body mass index = 19.24, SD = 2.91 kg/m2) and in 2016, 113 boys (10–11 years;body mass index = 19.20, SD = 3.15 kg/m2) were recruited. Lower body power was assessed usingthe vertical jump (VJ) and standing long jump (SLJ) tests. Significant differences and a large effect sizewere shown between groups in the SLJ (p = 0.001; d = 0.94) and the VJ (p = 0.001; d = 0.66). SLJ datain 1969 were higher (1.52 m, SD = 0.19) when compared to the 2016 data (1.34 m, SD = 0.18). The VJperformance of the 1969 sample was also higher (25.95 cm; SD = 6.58) than the 2016 sample (21.56 cm;SD = 4.72). SLJ and VJ performance of the 2016 group decreased 11.8% and 16.9%, respectively. Therewere no significant differences between groups in body mass index. The results indicate a seculardecline in lower body muscular power in 10–11-year-old Spanish boys with no significant changes inbody mass index over the 47-year study period.
Keywords: pediatric dynapenia; children; resistance training
1. Introduction
Low levels of muscular fitness (i.e., muscular strength, muscular power and local muscularendurance) in children and adolescents are associated with poor motor competence, functionallimitations and adverse health outcomes [1,2]. Recent findings indicate that measures of muscularstrength and power in modern-day youths are lower than in previous generations [3–6]. Sandercock andCohen reported a decline in muscular fitness (bent-arm hang, sit-ups and handgrip) using allometricequations in 10-year-old English children from 1998 to 2014, and noted this trend was independentof secular changes in body size [5]. A similar trend in muscular fitness was observed in Spanishadolescents between 2001–2002 and 2006–2007 [4], and in an international sample of children andadolescents between 1964 and 2017 [7].
Lower levels of muscular strength and power in modern day youths appear to be consequentto lifestyles characterized by reduced physical activity and increased sedentary behavior [3,5,8].Importantly, muscular strength and fundamental movement skill proficiency are considered
J. Funct. Morphol. Kinesiol. 2020, 5, 64; doi:10.3390/jfmk5030064 www.mdpi.com/journal/jfmk23

J. Funct. Morphol. Kinesiol. 2020, 5, 64
foundational for ongoing participation in physical activity across the lifespan [8,9]. Therefore,it is critical to examine temporal trends in muscular fitness in youth due to the far-reaching implicationsfor disease prevention and health promotion. A recent meta-analysis concluded that poor muscularfitness was associated with lower levels of bone mineral density and self-esteem, as well as higherlevels of body fat and cardiometabolic risk [1]. In support of these observations, lower handgrip levelsin youth with obesity have been associated with increased cardiometabolic risk [10]. Further, low levelsof performance on selected measures of muscular fitness, including the handgrip, push-up and longjump early in life have been found to be associated with an increased risk of metabolic syndrome laterin life [11]. Specifically, the long jump is a field test commonly used in youths as a general measure oflower body muscular fitness [12].
Temporal trends of muscular fitness performance in youth can be used to inform public healthpolicies about youths’ physical activity and health [13]. However, there are a limited number of studiesexamining trends in lower body muscular fitness in youths over recent decades. Additional data areneeded to fill this research gap. The aim of this study was to describe temporal trends in lower bodymuscular power in Spanish boys over a 47-year time period from 1969 to 2016. We hypothesized thatcontemporary trends towards decreasing levels of muscular strength and muscular power shown inprevious studies will be similar in Spanish children in 2016 as compared to Spanish children in 1969.
2. Materials and Methods
Data were collected from two separate cross-sectional samples from the same school in Galicia,Spain. The sample consisted of the total boys (10 to 11 years of age) enrolled in the school during bothyears. Participants included 140 boys (10–11 years; body mass index = 19.24, SD = 2.91 kg/m2) in 1969and 113 boys (10–11 years; body mass index = 19.20, SD = 3.15 kg/m2) in 2016. The University DaCoruña Ethics Committee approved this research study and parents and participants were informedabout experimental procedures and provided parental permission and child assent, respectively.
Body mass index (BMI) was calculated as body mass measured on an analogic scale to the nearest0.1 kg divided by height measured on a stadiometer to the nearest 0.5 cm squared. Lower body powerwas assessed using the vertical jump (VJ) and standing long jump (SLJ) tests following standardizedprocedures [14]. In the SLJ the participant stood with both feet just behind the starting line on a markedfloor. The distance between the starting line and the back edge of the participant’s heel was measuredafter each jump. For the VJ test, participants were instructed to jump as high as possible and markthe wall with chalk on their fingers. The vertical jump was calculated by subtracting a participant’sstanding reach height from the maximal jump height. Participants were permitted to perform acountermovement prior to jumping vertically or horizontally. The test order was randomized, and allparticipants performed 3 trials per test. Participants were allowed to rest for 1 min between trialsand for 3 min between the VJ and SLJ tests. The best score from each test was used for data analysis.In 2016, the same testing protocols and procedures were followed as in 1969. The VJ and SLJ were partof the Spanish physical education curricula during the study period and therefore all participants had2 familiarization sessions with these tests.
A Kolmogorov–Smirnov test was conducted to determine whether the data met the assumptionsof normality of distribution. When the data met the normal distribution, two-tailed t-tests were appliedfor normally distributed data and the Mann–Whitney test was used for non-normal data to determinedifferences between cohorts. Significance was stablished at p < 0.05. D-Cohen effect size (ES) wascalculated using the recommended Equation (1) [15].
ES =mean of the experimental group − mean of the control group
standard deviation of the control group(1)
24

J. Funct. Morphol. Kinesiol. 2020, 5, 64
3. Results
In 1969, the sample mean age was 10.53 (0.50) years-old (min 10- max 11-years-old) and the medianwas 11-years-old. In 2016, the sample mean age was 10.43 (0.49) years-old (min 10- max 11-years-old)and the median was 10-years-old. Characteristic outcomes in the different cohorts are presented inTable 1.
Table 1. Participant demographics and lower body muscle power over a 47-year-period in Spanish boys.
VariablesSample 1
1969 n= 140 Mean (SD)Sample 2
2016 n= 113 Mean (SD)Δ p-Value Cohen’s d
Height (cm) 147.06 (6.21) 140.25 (6.17) −4.6 0.001 1.18Mass (kg) 41.68 (6.21) 38.01(8.08) −8.8 0.001 0.50
BMI 1 (kg/m2) 19.24 (2.91) 19.20 (3.15) −0.20% 0.473 0.01SLJ 1 (m) 1.52 (0.19) 1.34 (0.8) −11.8% 0.001 0.94VJ 1 (vm) 25.95 (6.58) 21.56 (4.72) −16.9% 0.001 0.66
1 BMI: Body Mass Index; SLJ: Standing Long Jump; VJ: Vertical Jump.
4. Discussion
Significant differences and a large effect size were found in SLJ and VJ performance from 1969 to2016. Over this 47-year period, SLJ performance decreased 11.8% and VJ decreased 16.9%. These resultsindicate a declining trend in lower body muscular power in 10–11-year-old Spanish boys with nosignificant changes in BMI. Our findings show a greater decline in SLJ than in previous research.We observed an 11.8% decline in SLJ between 1969 and 2016, whereas Moliner-Urdiales and colleaguesfound a decline in SLJ performance of 4.8% in 12.5- to 17.5-year-old Spanish adolescents assessedbetween 2001–2002 and 2006–2007 [4]. Similarly, Hardy and colleagues reported a decline in SLJ in youthbetween 1985 and 2015, with 10-year-old boys decreasing SLJ performance by 4.8% [13]. These trendsin measures of lower body muscular strength and muscular power in youth may be explained bydeclining levels of regular participation in physical education, outdoor active play, and sport activitiesduring the respective study periods [16]. Of interest, Tomkinson and colleagues quantified globalchanges in anaerobic fitness in more than 20 million youths and reported improvements in performancefrom 1958 to 1982, followed by a plateau and eventual decline in anaerobic test performance until2003 [17]. This observed decline in anaerobic performance is consistent with our observed temporaltrends in musculoskeletal fitness. Similarly, Kaster and colleagues evaluated temporal trends insit-up performance in almost 10 million children and adolescents and reported large internationalimprovements from 1964 to 2000 before then stabilizing near zero until 2010 before declining [7].Of note, national trends in sit-up performance were strongly and positively associated with trendsin vigorous physical activity, with countries with the largest improvements in sit-up performancereporting the largest increases in vigorous physical activity [7].
Another outcome of interest is the BMI. Our findings indicate that there was no significantdifference in BMI between 1969 and 2016. However, the 2016 boys were shorter with a lower body massthan in 1969. These differences could be attributed to a younger age of development. While BMI inour study showed no significant differences over a 47-year period, other reports observed an increasein BMI over a period of 30 years [13]. Our findings are not consistent with others who reported thattoday’s youths are taller and heavier than previous generations [13]. Of interest, the Spanish physicaleducation curricula in the 1960s, 1970s and 1980s typically included more strength- and skill-buildingphysical exercises, as compared to the more recent focus on aerobic games and activities. As such,trends in BMI and body composition must be viewed in light of the type and intensity of exerciseperformed, as well as the age, sex and biological maturation of the study participants.
We found a decrease in lower body power independent of changes in body size and BMI overthe study period. The same downward trend in muscular fitness independent of secular changes inbody size and BMI was also observed in 10-year-old English children, as reported by Sandercock and
25

J. Funct. Morphol. Kinesiol. 2020, 5, 64
Cohen [5]. While our 1969 sample was heavier and taller than our 2016 sample, with no significantdifferences in BMI, English children in the Sandercock and Cohen study were taller and heavier in2014 than in 2008 and 1998, with no significant differences in BMI [5]. Collectively, these resultssuggest that changes in muscular fitness over time may not be associated with secular changes inBMI and body size. It is possible that other factors, such as trends in quality and quantity of physicalactivity engagement, may contribute to the observed decline in muscular fitness in modern day youths.This downward trend in muscular fitness in modern day youths has also been reported in childrenand adolescents from other countries [3]. It should be noted that, without regular opportunities toengage regularly in strength-building exercises, today’s youths may be less likely to attain the adequatelevels of muscular fitness that are needed for ongoing participation in MVPA [3,18]. Since low levelsof muscular strength and power early in life are risk factors for pediatric dynapenia and associatedhealth-related concerns [19], the SLJ has been suggested as a valid general index for assessing muscularfitness in youths [12].
Our results show that the 2016 cohort was shorter and their SLJ performance was significantlylower than in 1969. In young adults, SLJ performance has been found to be influenced by severalfactors, including anthropometrics [20]. Taller subjects have a higher center of gravity and longer leglever that can produce greater mechanical jump forces. It has been reported that femur length hasa significant influence on VJ performance [21]. In 10- to 12-year-old children, a positive moderatecorrelation between femur length and SJL, and a weak positive correlation between standing heightand SLJ, were reported [22]. Given these observations, participant’s anthropometrics may affect thetake-off angle during the SLJ and, consequently, the jump distance.
Our study has several limitations that should be considered when interpreting the data. Notably,we included a relatively small sample of boys from Galicia, a region of Spain. Therefore, our dataare not representative of all Spanish youths. Additionally, we did not assess the biologic maturationof the participants and we did not measure their current levels of physical activity with validatedquestionnaires. Additionally, we did not include the periodic testing of muscular fitness duringthe 47-year study period and, therefore, changes in performance during selected periods of timecannot be analyzed. The assessment of body composition in order to differentiate between lean bodymass and fat mass was not performed. Additional research is warranted to address the changesin muscular phenotype (e.g., muscular strength and power) in girls and boys, while controlling forconfounding variables, such as exercise participation and training history. Finally, it has been reportedthat sociodemographic variables [13] and the trends towards unhealthy eating habits [23] may influencefitness performance in youths; however, we did not assess these variables.
5. Conclusions
To the best of our knowledge no previous studies have examined temporal trends in muscularfitness in youths over a 47-year period. Our novel findings are consistent with other reports fromwestern societies that highlight declines in measures of muscular strength and muscular powerin modern day children and adolescents. To alter the current trajectory towards lower levels ofmuscular fitness in children and adolescents, developmentally appropriate interventions that targetneuromuscular deficiencies and enhance muscular strength and power are needed to avert the troublingconsequences of pediatric dynapenia.
Author Contributions: Conceptualization, M.P. and I.C.-M.; methodology, M.P. and M.Á.S.-G.; software, M.Á.S.-G.;formal analysis, I.C.-M., M.Á.S.-G., T.R.R., and A.D.F.; data curation, M.Á.S.-G, I.C.-M., T.R.R., and A.D.F.;writing—original draft preparation, I.C.-M., M.P., and M.Á.S.-G.; writing—review and editing, T.R.R. and A.D.F.All authors have read and agreed to the published version of the manuscript.
Funding: This research received no external funding.
Conflicts of Interest: The authors declare no conflict of interest.
26
J. Funct. Morphol. Kinesiol. 2020, 5, 64
References
1. Smith, J.J.; Eather, N.; Morgan, P.J.; Plotnikoff, R.C.; Faigenbaum, A.D.; Lubans, D.R. The health benefits ofmuscular fitness for children and adolescents: A systematic review and meta-analysis. Sports Med. 2014, 44,1209–1223. [CrossRef] [PubMed]
2. García-Hermoso, A.; Ramírez-Campillo, R.; Izquierdo, M. Is muscular fitness associated with future healthbenefits in children and adolescents? A systematic review and meta-analysis of longitudinal studies. SportsMed. 2019, 49, 1079–1094. [CrossRef] [PubMed]
3. Faigenbaum, A.D.; Rebullido, T.R.; Peña, J.; Chulvi-Medrano, I. Resistance exercise for the prevention andtreatment of pediatric dynapenia. J. Sci. Sport Exerc. 2019, 1, 208–216. [CrossRef]
4. Moliner-Urdiales, D.; Ruiz, J.R.; Ortega, F.B.; Jiménez-Pavón, D.; Vicente-Rodriguez, G.; Rey-López, J.P.;Martínez-Gómez, D.; Casajús, J.A.; Mesana, M.I.; Marcos, A.; et al. Secular trends in health-related physicalfitness in Spanish adolescents: The AVENA and HELENA Studies. J. Sci. Med. Sport 2010, 13, 584–588.[CrossRef]
5. Sandercock, G.R.H.; Cohen, D.D. Temporal trends in muscular fitness of English 10-year-olds 1998–2014:An allometric approach. J. Sci. Med. Sport 2018, 22, 201–205. [CrossRef]
6. Cohen, D.; Voss, C.; Taylor, M.; Delextrat, A.; Ogunleye, A.; Sandercock, G. Ten-year secular changes inmuscular fitness in English children. Acta Paediatr. Int. J. Paediatr. 2011, 100, 175–177. [CrossRef]
7. Kaster, T.; Dooley, F.L.; Fitzgerald, J.S.; Walch, T.J.; Annandale, M.; Ferrar, K.; Lang, J.J.; Smith, J.J.;Tomkinson, G.R. Temporal trends in the sit-ups performance of 9,939,289 children and adolescents between1964 and 2017. J. Sports Sci. 2020, 1–11. [CrossRef]
8. Smith, J.J.; Eather, N.; Weaver, R.G.; Riley, N.; Beets, M.W.; Lubans, D.R. Behavioral correlates of muscularfitness in children and adolescents: A systematic review. Sport. Med. 2019, 49, 887–904. [CrossRef]
9. Hulteen, R.M.; Morgan, P.J.; Barnett, L.M.; Stodden, D.F.; Lubans, D.R. Development of foundationalmovement skills: A conceptual model for physical activity across the lifespan. Sport. Med. 2018, 48,1533–1540. [CrossRef]
10. Laitinen, T.T.; Saner, C.; Nuotio, J.; Sabin, M.A.; Fraser, B.J.; Harcourt, B.; Juonala, M.; Burgner, D.P.;Magnussen, C.G. Lower grip strength in youth with obesity identifies those with increased cardiometabolicrisk. Obes. Res. Clin. Pract. 2020, 14, 286–289. [CrossRef]
11. Fraser, B.J.; Huynh, Q.L.; Schmidt, M.D.; Dwyer, T.; Venn, A.J.; Magnussen, C.G. Childhood muscular fitnessphenotypes and adult metabolic syndrome. 2016, 48, 1715–1722. [CrossRef] [PubMed]
12. Castro-Piñero, J.; Ortega, F.B.; Artero, E.G.; Girela-Rejón, M.J.; Mora, J.; Sjöström, M.; Ruiz, J.R. Assessingmuscular strength in youth: Usefulness of standing long jump as a general index of muscular fitness.J. Strength Cond. Res. 2010, 24, 1810–1817. [CrossRef] [PubMed]
13. Hardy, L.L.; Merom, D.; Thomas, M.; Peralta, L. 30-year changes in Australian children’s standing broadjump: 1985–2015. J. Sci. Med. Sport 2018, 21, 1057–1061. [CrossRef]
14. Haff, G.G.; Tripplet, N. Essentials of Strength Training and Conditioning, 4th ed.; Human Kinetics PublishersInc.: Champaing, IL, USA, 2016; pp. 267–269.
15. Rhea, M.R. Determining the magnitude of treatment effects in strength training research trough the use ofthe effect size. J. Strength Cond. Res. 2004, 18, 918–920. [CrossRef] [PubMed]
16. Aubert, S.; Barnes, J.D.; Abdeta, C.; Nader, P.A.; Adeniyi, A.F.; Aguilar-Farias, N.; Tenesaca, D.S.A.; Bhawra, J.;Brazo-Sayavera, J.; Cardon, G.; et al. Global Matrix 3.0 physical activity Report Card grades for children andyouth: Results and analysis from 49 countries. J. Phys. Act. Health 2018, 15, S251–S273. [CrossRef]
17. Tomkinson, G.R. Global changes in anaerobic fitness test performance of children and adolescents (1958-2003).Scand. J. Med. Sci. Sports 2006, 17, 497–507. [CrossRef]
18. Stricker, P.R.; Faigenbaum, A.D.; Mccambridge, T.M.; Sports, O.N. Resistance training for children andadolescents. Pediatrics 2020, 145, e20201011. [CrossRef]
19. Faigenbaum, A.D.; MacDonald, J.P. Dynapenia: It’s not just for grown-ups anymore. Acta Paediatr. 2017, 106,696–697. [CrossRef]
20. Wakai, M.; Linthorne, N.P. Optimum take-off angle in the standing long jump. Hum. Mov. Sci. 2005, 24,81–96. [CrossRef]
21. Sharma, H.B.; Gandhi, S.; Meitei, K.K.; Dvivedi, J.; Dvivedi, S. Anthropometric basis of vertical jumpperformance: A study in young Indian national players. J. Clin. Diagn. Res. 2017, 11, CC01–CC05. [CrossRef]
27

J. Funct. Morphol. Kinesiol. 2020, 5, 64
22. Sidhu, J.S. Physical attributes as indicator of performance for broad jumping. Int. J. Curr. Res. Rev. 2018, 10,22–25. [CrossRef]
23. Ribas-Barba, L.; Serra-Majem, L.; Salvador, G.; Castell, C.; Cabezas, C.; Salleras, L.; Plasencia, A. Trends indietary habits and food consumption in Catalonia, Spain (1992–2003). Public Health Nutr. 2007, 10, 1340–1353.[CrossRef] [PubMed]
© 2020 by the authors. Licensee MDPI, Basel, Switzerland. This article is an open accessarticle distributed under the terms and conditions of the Creative Commons Attribution(CC BY) license (http://creativecommons.org/licenses/by/4.0/).
28

Journal of
Functional Morphology and Kinesiology
Review
Relation between Weight Status, Physical activity,Maturation, and Functional Movement inAdolescence: An Overview
Josip Karuc * and Marjeta Mišigoj-Durakovic
Faculty of Kinesiology, University of Zagreb, Horvacanski zavoj 15, 10 000 Zagreb, Croatia;[email protected]* Correspondence: [email protected]; Tel.: +3859-1582-3504
Received: 4 April 2019; Accepted: 29 May 2019; Published: 30 May 2019���������������
Abstract: Obesity, low level of physical activity and dysfunctional movement patterns presents one ofthe leading health issues that can contribute to increased risk for developing not only metabolic andcardiovascular disease, but also musculoskeletal problems. The aim of this paper is to summarizeliterature and evidence about relationship between functional movement (FM) patterns, physicalactivity (PA) level and weight status in average adolescent population. In addition, this papersummarized current evidence about relations between maturation effects and functional movementamong athletic adolescent populations. Summary of current evidence suggests that decreasedphysical activity level is negatively correlated to functional movement in adolescence. Additionally,most studies suggest that weight status is negatively correlated to functional movement patternsalthough there is conflicting evidence in this area. Evidence consistently showed that overweightand obese adolescents exhibit poorer functional movement compared to normal weight adolescents.In addition, it appears that maturation has effects on functional movement in athletic populations ofadolescents. It is therefore important that practitioners consider interventions which develop optimalfunctional movement alongside physical activity and weight management strategies in children, inorder to reduce the risks of injuries and pathological abnormality arising from suboptimal movementpatterns in later life.
Keywords: FMS; pubescence; pediatric population; fundamental movement
1. Introduction
According to WHO, obesity has tripled since 1975 and thus represents one of the leading worldhealth problems [1]. Along with the obesity and overweight, low level of physical activity (PA) putsoverweight children at a higher risk for developing noncommunicable diseases. Although PA levelis important for health of the locomotor system and represents a quantitative measure of humanmovement, due to importance of locomotor health, qualitative aspects of movement need to beconsidered as well. Functional movement (FM) considers qualitative aspects of movement, and can bedefined as optimal postural control and mobility of joints and body regions involved in a particularmovement. On the other hand, dysfunctional movement patterns present low level of quality ofFM and can be related to injury incidence and thus endanger musculoskeletal (MSK) health and cancontribute to developing degenerative changes in adulthood.
Looking altogether, obesity, low level of PA, and dysfunctional movement, can contribute toeven more increased risk for developing not only metabolic and cardiovascular disease, but alsoMSK problems in adulthood. Therefore, literature about mutual adverse effects of dysfunctional
J. Funct. Morphol. Kinesiol. 2019, 4, 31; doi:10.3390/jfmk4020031 www.mdpi.com/journal/jfmk29
J. Funct. Morphol. Kinesiol. 2019, 4, 31
movement on mentioned variables need to be considered in order to provide practical information forprofessionals in the field of kinesiology, medicine, and related areas.
The importance and influence of PA and weight status on adolescent health has been investigatedwidely, however only few studies have examined the relationship between FM, PA level, and obesityamong the pediatric population. To date, only few studies have examined FM in the general adolescentpopulation [2–11]. There are only four studies that investigated relation between weight status and FMin children [8–11]. Additionally, only one study by Duncan and Stanley, investigated the associationbetween FM and PA level among children [10]. However, no study appears to have summarizedliterature about functional movement and its relation to PA level, weight status, and maturation in theaverage adolescent population.
Therefore, the aim of this paper is to summarize literature and evidence about the relationshipbetween FM patterns, PA level, and weight status in the average adolescent population. Additionally,this paper will summarize current evidence about relations between maturation effects and functionalmovement among the athletic adolescent population.
2. Materials and Methods
The author of this study conducted a search in PUBMED (from 1 January 1990 to 1 May 2019)searching for association between functional movement, weight status, physical activity level,and maturation in adolescent populations. Key words used for electronic searches were: “functionalmovement”, “functional movement screen”, “weight status”, “physical activity”, “physical activitylevel”, and “maturation”. Combining the key words “functional movement” and “functional movementscreen” with the other key words: “adolescents”, “intervention”, “weight status”, “physical activity”,“physical activity level”, and “maturation” were used according to Boolean logic. The studies werechecked by one researcher (J.K.) and were searched by title/abstract. In this study, inclusion criteriawere (1) studies that investigated functional movement on average adolescent population and exerciseintervention aimed to improve functional movement outcomes in average adolescents, (2) studies thatexamined the association between functional movement and weight status and physical activity levelin average adolescent populations, (3) studies that investigated the association between functionalmovement and maturation in athletic adolescent populations, and (4) English as a publication language.Exclusion criteria in this study were (1) studies that investigated adult populations, special populations(e.g., firefighters, officers, military population etc.) and populations with specific diseases or injuries,and (2) studies that investigated functional movement skills (FMS) or functional capacity/competencein pediatric populations were excluded as well. In addition, manually selected papers from referenceswithin selected researches were included in this paper.
3. Results
After an electronic search, the total number of studies that investigated functional movementvia functional movement screen was 202. After inclusion and exclusion criteria were met, and aftermanually selection of references, 14 studies were included in this narrative review. After search,studies were categorized into three distinct areas: (1) functional movement in the average adolescentpopulation and exercise intervention aimed to improve functional movement outcomes (six studiesselected), (2) physical activity, weight status and functional movement among the adolescent population(four studies) and (3) maturation and functional movement among the athletic population of adolescents(four studies). Each of these study areas are incorporated and interpreted in the discussion section.
4. Discussion
4.1. Clinical Importance of the Functional Movement and Functional Movement Screen as a Diagnostic Tool
The Functional Movement ScreenTM (FMSTM), originally created by Gray Cook and Lee Burton, is ascreening instrument intended to evaluate deficiencies in mobility and stability [12,13]. FMSTM includes
30

J. Funct. Morphol. Kinesiol. 2019, 4, 31
seven tests: the deep squat, hurdle step, inline lunge, shoulder mobility, ASLR, trunk stabilitypush-up and rotary stability. To the author’s knowledge, this is the only diagnostic instrumentavailable, described and validated in scientific literature for the purpose of screening functionalmovement patterns.
Scoring the FMSTM has its own rules and procedures. The FMS raters use a standardized procedureto evaluate movement function. While performing FMS testing, each participant has a maximumof three trials for each test in accordance with the recommended protocol. Each test is scored on athree-point scale, from 0 to 3, with higher scores indicating better FM. In the presence of pain, a scoreof zero is noted. For each test, the highest score from three trials is recorded. An overall compositescore was calculated with a total FMS score of 21 according to standardized guidelines. Descriptions ofeach FMS test, as well as standardized guidelines for the complete FMS testing is well written in theliterature and can be studied elsewhere [12,13].
Some studies have shown the efficiency of the FMS in determining injury risk in athletes [14–16],however, others indicated the opposite [17–19]. Although there is conflicting evidence about the FMSas an injury predictive tool, the author’s opinion is that the FMS has critical value for identifyingmovement mobility and stability deficiencies. Deficits in movement mobility and joint stabilitypotentially predispose athletes and average populations to higher injury risk since optimal movementpatterns can possibly prevent and reduce that risk.
Several studies reported moderate to good inter-rater and intra-rater reliability of the FMS evenamong novice raters [20,21]. In addition, two-hour education on using FMS as a diagnostic tool seemsto be efficient according to prior research [21].
4.2. Functional Movement in the Average Adolescent Population and Exercise Intervention aimed to improveFunctional Movement Outcomes
Although there are a number of studies that investigated functional movement among athleticadolescents, only few studies investigated FM in the average adolescent population. These studiesinvestigated relations between FM and PA or weight status. Additionally, few studies investigatedmaturation effect on functional movement in the athletic adolescent population. Only one studyprovided normative values for the FMS in the adolescent population [2]. Another study investigatedthe prevalence of functional movement patterns in children over the first three years of post-primaryeducation [3].
Abraham et al. [2] investigated functional movement patterns in the average population ofadolescents. This study included a large number of participants (n = 1005) with ages from 10 to17 years old. They reported a mean value of the total FMS score of 14.5 points. Additionally, resultsshowed a significant difference in total FMS score between females and males. However, no significantdifference in scores existed between those who reported a previous injury and those who did not.In addition, the authors suggested normative values for the individual functional movement patternsfor this population that can be found in their paper [2]. However, there are few limitations of thisstudy that should be considered while implementing normative values in the practice. Large age span(10–17 years) among participants in this study reveals that pre-pubertal and pubertal subjects wereincluded in the sample. Additionally, this study excluded all inactive children which could potentiallylead to higher mean values. Although there are few limitations in this study, this is the first study thatprovided normative values for a school aged adolescent population.
Lester et al. [3] examined the age-related association of functional movement among children inIreland. The aim of this study was to gather data on prevalence of movement skills and functionalmovement patterns in children over the first three years of post-primary education (n = 181,mean age = 14.4). In this research, 43.6% of adolescents were in year one, 23.8% of adolescentswere in year two and 32.6% adolescents were in year three with age range from 12.3 to 16.4 years old.Looking altogether, authors reported that results of the functional movement outcomes in their samplewere suboptimal across all years. As authors stated, significant age-related differences were reported.
31
J. Funct. Morphol. Kinesiol. 2019, 4, 31
When we look this data, as age increases, scores on the in-line lunge pattern decrease (differencebetween the first and third year). Additionally, the mean total FMS score reported in this studywas 14.05, which is similar to results obtained by Abraham et al. The authors of this study stronglysuggest that school-based intervention should be incorporated across the post-primary education childpopulation in order to decrease decline in the impaired movement patterns.
Four studies investigated the impact of exercise intervention on functional movement outcomes.Coker [4] investigated the impact of the standardized warm-up protocol in middle school children onfunctional movement parameters. Participants from seventh-grade and four eighth-grade physicaleducation classes participated in this study (n= 120, mean age= 13.1 years old). A six-week interventionincluded exercises that targeted mobility and stability of joints and muscle activation (exercise targetedankle joint mobility, pelvic stability and dysfunctional gluteal, abductors, and adductors muscles).Results of this study suggest that a warm-up, which consists of exercises that target typical movementand body dysfunctions among adolescents of a sensitive age, can significantly reduce dysfunctionalmovement patterns. It is the author’s opinion that school policies should implement these programsinto the physical education curriculum in order to reduce dysfunctional movement pattern prevalenceand potentially reduce risk injury incidence among the average adolescent population.
A study done by Nourse et al. [5] investigated the impact of live video diet and exercise interventionon vascular and functional outcomes in overweight and obese children (mean age = 14.5, n = 20).The intervention lasted 12 weeks and included three times per week videoconferences with a trainerand diet consultations. Results of this study showed a significant reduction in waist-hip ratio andimprovement in total functional movement screen score. Average improvement of the participantsin total FMS score was 13 to 17 points, from baseline to the end of this intervention, respectively.Authors of study concluded that a 12-week live video intervention improves functional movementoutcomes in the population of overweight and obese adolescents.
St Laurent et al. [6] investigated the impact of a suspension-training movement on functionalmovement in children (n = 28, average age = 9.3 years old). Participants were divided into two groups(control and intervention group). After the six-week suspension-training movement program wasfinished, the intervention group showed better results in functional movement outcomes relative tothe control group. Authors of this study suggest that intervention using this kind of training modalitycould be beneficial for improving functional movement outcomes.
Wright et al. [7] examined the impact of fundamental movement training on functional movementoutcomes in physically active children (n = 22, average age = 13.4). Participants were divided into twogroups, where the intervention group was included in the training that focused on movement quality(weekly 4 × 30-min session) and participants from the control group were involved in multisportactivity. Interestingly, results showed that short-term intervention focusing on movement quality didnot have an effect on functional movement parameters in physically active children compared to thecontrol group.
4.3. Physical Activity, Weight Status, and Functional Movement among Adolescent Populations
Although PA level and FM have critically important roles for general health of children, to date,only three studies appear to have examined relations between FM, weight status, and PA level amongadolescents [8–11].
Study performed in Moldova investigated the relationship between FM, core strength, posture,and body mass index (BMI) [8]. Researchers collected data from 77 children, from 8 to 11 years old withan average BMI value of 16.4. Mitchell et al. reported the average total FMS score of 14.9 [8], which isslightly higher than the study done by Abraham et al. [2]. The results of this study showed that staticposture and BMI are not related to FM. Additionally, researchers did not find a correlation betweenposture and FMS total score. These results are obvious since posture in this study was assessed in thestatic position while FMS tests assess movement and dynamic postural stabilization. On the otherhand, results showed that core strength was positively related to the total FMS score. The authors of
32
J. Funct. Morphol. Kinesiol. 2019, 4, 31
the study concluded that the individual test scores indicate that none of the test items were too difficultfor the children, which means that the same tests can be directly used in clinical practice and schoolclasses with school-aged children.
An interesting study done by Duncan et al. [9] examined the association between FM andoverweight and obesity in British children. Data were obtained from 90 children, 7–10 years old.After BMI was determined, children were classified as normal weight, overweight, or obese accordingto international official guidelines. The results for total FMS score for normal weight children was14.7, for overweight 12.2, and for obese children 9.0. Duncan et al., showed that total FMS score wasnegatively correlated with BMI. Additionally, the scores in all individual FMS tests were higher fornormal weight children compared to obese children. In addition, normal weight children performedbetter than overweight children in the two tests: deep squat and shoulder mobility. On the other hand,overweight children scored better than obese children in four movement patterns (hurdle step, inlinelunge, shoulder mobility, and ASLR). This result puts overweight and obese children in the group ofchildren with increased risk for injury incidence. These are clinically important findings, because overtime, dysfunctional movement patterns along with the effect of excess weight and consequently higherload on the joints, can possibly lead to degenerative changes in later life. This research highlights thatoverweight and obesity are significantly associated with poorer functional movement in children.
Findings of this study seems to be contradictory with the results of the study mentioned before [8].However, in a study done by Mitchell et al., there are few limitations that need to be considered.The authors did not separate participants into three categories (normal weight, overweight, and obese).In addition, 9% of the children were categorized as overweight (with no information about numberand percentage of obese children), whereas in study done by Duncan et al. one third of children wereclassified as overweight/obese [9]. This limitation can potentially lead to opposite results and limitedconclusion, and therefore can minimize the importance of potential relations between higher values ofthe BMI and suboptimal functional movement patterns in children.
In this research field, one more interesting study was performed by the same authors [10].Duncan and Stanley investigated relations between weight status, physical activity level, and functionalmovement in British children. This study was performed on 58, 10–11 year old children. The resultsshowed that the total FMS score was negatively correlated with BMI and positively related to PA level.Normal weight children scored significantly better for total FMS score compared to children classifiedas overweight/obese. The mean of total FMS scores was 15.5 for normal weight children and 10.6 inoverweight/obese children.
Duncan and Stanley explained these results through few possible mechanisms. These authorssuggested that deficits in FM could exist prior to being overweight. They pointed out that: “Excessweight and functional prowess are the results of natural selection since children who are functionallylimited will remain inactive and will not develop optimal functional movement patterns that underpinperformance to the same level of mastery as children without functional limitation.” [10]. Additionally,the authors discussed that children who are not functionally limited may more likely enjoy PA, and thus,engage in more regular practice of functional movement patterns that underpin performance. Lookingaltogether, the results presented in these studies support the need for interventions to increase level ofphysical activity and improve functional movement in overweight and obese pediatric populations.
Garcia-Pinillos et al. [11] examined relations between functional movement patterns and weightstatus in children aged between 6 and 13 years old (n = 333). Results of this study show that weightstatus is moderately negatively correlated with total FMS score. In addition, overweight and obesechildren showed poorer functional movement compared to normal weight children. These resultsare consistent with the study done by Duncan et al. In addition, significant differences were foundbetween normal weight, overweight, and obese children in lower-extremity movement patterns (deepsquat, hurdle step, in-line lunge) and flexibility tests (shoulder mobility, straight leg-raise), but also intrunk stability pattern (push-up). This research revealed that girls outperformed boys in tests that
33

J. Funct. Morphol. Kinesiol. 2019, 4, 31
require flexibility and balance, while boys outperformed girls in stability tests which support previousfindings in context of sex dimorphism in individual functional movement patterns [2].
The information presented in the paragraphs above are essentially important for the practice ofphysical education teachers, coaches, and other professionals who work with pediatric populations.Optimal level of PA and optimal FM in children can reduce the risks of orthopedic abnormality arisingfrom suboptimal movement patterns in later life. Since suboptimal movement patterns and low PAlevel could predispose children to a higher risk of the injury incidence, practitioners should considerfunctional movement interventions. It is the author’s opinion that this population needs specificexercises that address suboptimal movement patterns first, and then exercises targeting weight statusto minimize risk of high-load exercise on the skeletal system in the pediatric population.
4.4. Maturation and Functional Movement among Athletic Populations of Adolescents
To date, a number of studies investigated maturation effects in the average and athletic populationof adolescents. However, only few studies appear to have examined the relationship between maturityand functional movement patterns [22–25]. These studies included only the athletic adolescentpopulation. Within this paragraph, the author will briefly provide a review of current evidence andconclusions about maturation effects on functional movement among athletic adolescents.
A study done by Portas et al. investigated the effect of maturity on functional movement screenscores in elite, adolescent soccer players [22]. The authors showed that maturity has substantialeffects on FMS performance. Although this research highlights that findings are relevant only tothose analyzing movement of soccer players, the authors of the mentioned study concluded that FMSassessment appears to be invalid for practical usage for very young players.
Paszkewicz et al. compared functional and static evaluation tools among adolescent athletes [23].The authors of this study compared FMS scores and Beighton and Horan joint mobility index (BHJMI)scores among pubescence in adolescent athletes. Based on the results of the modified pubertalmaturation observational scale, the authors separated subjects into three groups: prepubescent,early-pubescent, and postpubescent groups. The researchers revealed a main effect for FMS scoresacross pubertal groups, but not in BHJMI composite scores. The postpubescent participants hadhigher FMS scores compared with the prepubescent participants and the early-pubescent athletes.Additionally, the results of this study did not confirm any correlation between FMS composite scoresand BHJMI composite scores. The results of this study suggest that the FMS can discriminate betweenlevels of pubescence and detect alterations during the pubertal growth cycle, whereas the BHJMImay not.
Lloyd et al. examined relationships between functional movement screen scores, maturation,and physical performance in young soccer players [24]. This study demonstrated that variation ofphysical performance of youth soccer players could be explained by a combination of both functionalmovement screen scores and maturation.
Wright and Chesterton [25] aimed to investigate differences between individual functionalmovement patterns at different stages of maturation in young athletes (mean age = 14.1 years, agebetween 8 and 18 years old) from various sports (field athletics, endurance sport, team sports, combat,and water sports). Participants were categorized in the three distinct maturation groups, participantswho were before, at, and after their adolescent growth spurt (peak height velocity (PHV)). The authorsfound that differences among these groups were greatest in movement patterns that have high demandson stability, which suggests that adolescents potentially develop stability in this period of growth.These findings are consistent with studies mentioned before in this section [22,23]. In addition, resultsof the push-up test were higher in children who were at growth spurt or after growth spurt, whencompared with children before growth spurt. In addition, authors of this study concluded thatmaturation has no effect on total FMS score.
However, it appears that there is no study that investigated the relationship between maturationeffects and functional movement patterns among the average adolescent population. Due to the
34
J. Funct. Morphol. Kinesiol. 2019, 4, 31
importance of this research field, the author is of the opinion that more studies are necessary in thisresearch field.
5. Conclusions
This paper gave a detailed description and summarization of the current literature in the fieldof pediatric PA level, obesity, and maturation related to functional movement. Although there areonly few studies in this field of research, the author highlights the importance and health benefitsof optimal FM in children, as well as the consequences of dysfunctional movement patterns on thehealth of the locomotor system. Summary of current evidence suggests that decreased physical activitylevel is negatively correlated to functional movement in adolescence. Additionally, most studiessuggest that weight status is negatively correlated to functional movement patterns, although there isconflicting evidence in this area. Evidence consistently showed that overweight and obese adolescentexhibit poorer functional movement compared to normal weight adolescents. Most of the studies thatexamined effects of exercise intervention on functional movement improved functional movementoutcomes, while one study showed the opposite. It is clear that more research is needed on this topicto establish true intervention effects. In addition, it appears that maturation has effects on functionalmovement in the athletic population of adolescents. It is therefore important that practitioners considerinterventions which develop optimal functional movement alongside physical activity and weightmanagement strategies in children, in order to reduce the risks of injuries and pathological abnormalityarising from suboptimal movement patterns in later life.
Funding: This work was funded by the Croatian Science Foundation, foundation under the number IP-06-2016-9926and DOK-2018-01-2328.
Conflicts of Interest: The authors declare no conflict of interest.
References
1. World Health Organization. WHO Media Centre. Obesity and overweight: Fact sheet. Available online:www.who.int/mediacentre/factsheets/fs311/en/ (accessed on 29 May 2019).
2. Abraham, A.; Sannasi, R.; Nair, R. Normative values for the functional movement screentm in adolescentschool aged children. Int. J. Sports Phys. Ther. 2015, 10, 29–36.
3. Lester, D.; McGrane, B.; Belton, S.; Duncan, M.J.; Chambers, F.C.; O’ Brien, W. The Age-Related Associationof Movement in Irish Adolescent Youth. Sports 2017, 5, 77. [CrossRef] [PubMed]
4. Coker, C.A. Improving Functional Movement Proficiency in Middle School Physical Education. Res. Q.Exerc. Sport 2018, 89, 367–372. [CrossRef]
5. Nourse, S.E.; Olson, I.; Popat, R.A.; Stauffer, K.J.; Vu, C.N.; Berry, S.; Kazmucha, J.; Ogareva, O.; Couch, S.C.;Urbina, E.M.; et al. Live Video Diet and Exercise Intervention in Overweight and Obese Youth: Adherenceand Cardiovascular Health. J. Pediatr. 2015, 167, 533–539.e1. [CrossRef] [PubMed]
6. St Laurent, C.W.; Masteller, B.; Sirard, J. Effect of a Suspension-Trainer-Based Movement Program onMeasures of Fitness and Functional Movement in Children: A Pilot Study. Pediatr. Exerc. Sci. 2018, 30,364–375. [CrossRef]
7. Wright, M.D.; Portas, M.D.; Evans, V.J.; Weston, M. The effectiveness of 4 weeks of fundamental movementtraining on functional movement screenand physiological performance in physically active children.J. Strength. Cond. Res. 2015, 29, 254–261. [CrossRef] [PubMed]
8. Mitchell, U.H.; Johnson, A.W.; Adamson, B. Relationship between functional movement screen scores, corestrength, posture, and body mass index in school children in moldova. J. Strength. Cond. Res. 2015, 29,1172–1179. [CrossRef]
9. Duncan, M.J.; Stanley, M.; Leddington Wright, S. The association between functional movement andoverweight and obesity in British primary school children. Sport Med. Arthrosc. Rehabil. Ther. Technol. 2013,5, 11. [CrossRef] [PubMed]
10. Duncan, M.J.; Stanley, M. Functional movement is negatively associated with weight status and positivelyassociated with physical activity in British primary school children. J. Obes. 2012, 2012. [CrossRef] [PubMed]
35
J. Funct. Morphol. Kinesiol. 2019, 4, 31
11. García-Pinillos, F.; Roche-Seruendo, L.E.; Delgado-Floody, P.; Jerez Mayorga, D.; Latorre-Román, P.Á. Is thereany relationship between functional movement and weight status? A study in Spanish school-age children.Nutr. Hosp. 2018, 35, 805–810.
12. Cook, G.; Burton, L.; Hoogenboom, B. Pre-Participation Screening: The Use of Fundamental Movements AsAn Assessment of Function–Part 1. North Am. J. Sport Phys. Ther. 2006, 1, 62–72.
13. Cook, G.; Burton, L.; Hoogenboom, B. Pre-Participation Screening: The Use of Fundamental Movements AsAn Assessment of Function–Part 2. North Am. J. Sport Phys. Ther. 2006, 1, 132–139.
14. Kiesel, K.B.; Butler, R.J.; Plisky, P.J. Prediction of Injury by Limited and Asymmetrical Fundamental MovementPatterns in American Football Players. J. Sport Rehabil. 2014, 23, 88–94. [CrossRef]
15. Garrison, M.; Westrick, R.; Johnson, M.R.; Benenson, J. Association between the functional movement screenand injury development in college athletes. Int. J. Sports Phys. Ther. 2015, 10, 21–28. [PubMed]
16. Shojaedin, S.S.; Letafatkar, A.; Hadadnezhad, M.; Dehkhoda, M.R. Relationship between functional movementscreening score and history of injury and identifying the predictive value of the FMS for injury. Int. J. Inj.Contr. Saf. Promot. 2014, 21, 355–360. [CrossRef]
17. Dossa, K.; Cashman, G.; Howitt, S.; West, B.; Murray, N. Can injury in major junior hockey players bepredicted by a pre-season functional movement screen—A prospective cohort study. J. Can. Chiropr. Assoc.2014, 58, 421–427.
18. Bardenett, S.M.; Micca, J.J.; DeNoyelles, J.T.; Miller, S.D.; Jenk, D.T.; Brooks, G.S. Functional MovementScreen Normative Values and Validity in High School Athletes: Can the FmsTM Be Used As a Predictor ofInjury? Int. J. Sports Phys. Ther. 2015, 10, 303–308. [PubMed]
19. Dorrel, B.S.; Long, T.; Shaffer, S.; Myer, G.D. Evaluation of the Functional Movement Screen as an InjuryPrediction Tool Among Active Adult Populations: A Systematic Review and Meta-analysis. Sports Health2015, 7, 532–537. [CrossRef]
20. Teyhen, D.S.; Shaffer, S.W.; Lorenson, C.L.; Halfpap, J.P.; Donofry, D.F.; Walker, M.J.; Dugan, J.L.; Childs, J.D.The Functional Movement Screen: A Reliability Study. J. Orthop. Sport Phys. Ther. 2012, 42, 530–540.[CrossRef]
21. Smith, C.A.; Chimera, N.J.; Wright, N.J.; Warren, M. Interrater and intrarater reliability of the functionalmovement screen. J. Strength. Cond. Res. 2013, 27, 982–987. [CrossRef] [PubMed]
22. Portas, M.D.; Parkin, G.; Roberts, J.; Batterham, A.M. Maturational effect on Functional Movement ScreenTM
score in adolescent soccer players. J. Sci. Med. Sport 2016, 19, 854–858. [CrossRef]23. Paszkewicz, J.R.; McCarty, C.W.; Van Lunen, B.L. Comparison of Functional and Static Evaluation Tools
Among Adoslecent Athletes. J. Strength. Cond. Res. 2013, 27, 2842–2850. [CrossRef] [PubMed]24. Lloyd, R.S.; Oliver, J.L.; Radnor, J.M.; Rhodes, B.C.; Faigenbaum, A.D.; Myer, G.D. Relationships between
functional movement screen scores, maturation and physical performance in young soccer players.J. Sports Sci. 2015, 33, 11–19. [CrossRef]
25. Wright, M.D.; Chesterton, P. Functional Movement ScreenTM total score does not present a gestalt measureof movement quality in youth athletes. J. Sports Sci. 2019, 37, 1393–1402. [CrossRef] [PubMed]
© 2019 by the authors. Licensee MDPI, Basel, Switzerland. This article is an open accessarticle distributed under the terms and conditions of the Creative Commons Attribution(CC BY) license (http://creativecommons.org/licenses/by/4.0/).
36

Journal of
Functional Morphology and Kinesiology
Review
The Effects of Alcohol Consumption on RecoveryFollowing Resistance Exercise: A Systematic Review
Nemanja Lakicevic
Sport and Exercise Research Unit, Department of Psychological, Pedagogical and Educational Sciences,University of Palermo, 90144 Palermo, Italy; [email protected]; Tel.: +39-3515881179
Received: 14 May 2019; Accepted: 21 June 2019; Published: 26 June 2019���������������
Abstract: Background: The aim of this manuscript was to describe the effects of alcohol ingestionon recovery following resistance exercise. Methods: A literature search was performed usingthe following database: Web of Science, NLM Pubmed, and Scopus. Studies regarding alcoholconsumption after resistance exercise evaluating recovery were considered for investigation. The mainoutcomes took into account biological, physical and cognitive measures. Multiple trained researchersindependently screened eligible studies according to the eligibility criteria, extracted data andassessed risk of bias. Results: A total of 12 studies were considered eligible and included in thequantitative synthesis: 10 included at least one measure of biological function, 10 included at leastone measure of physical function and one included measures of cognitive function. Conclusions:Alcohol consumption following resistance exercise doesn’t seem to be a modulating factor for creatinekinase, heart rate, lactate, blood glucose, estradiol, sexual hormone binding globulin, leukocytes andcytokines, C-reactive protein and calcium. Force, power, muscular endurance, soreness and rate ofperceived exertion are also unmodified following alcohol consumption during recovery. Cortisollevels seemed to be increased while testosterone, plasma amino acids, and rates of muscle proteinsynthesis decreased.
Keywords: strength; training; muscle mass; muscle function; performance
1. Introduction
Resistance exercise (RE) is a commonly practiced modality of physical exercise used by bothamateurs and elite athletes [1]. RE is a type of exercise that has gained a lot of interest over thepast two decades, specifically for its role in improving athletic performance by developing muscularstrength, power and speed, hypertrophy, local muscular endurance, motor performance, balance,and coordination [2]. While non-athletes use it to simply develop muscular physique, professionalathletes engage in RE to enhance their athletic capabilities in various sports [3]. Variables such asexercise intensity, exercise frequency, load, number of sets and repetitions, rest periods and trainingvolume can be manipulated in order to maximize RE induced effects in terms of muscle hypertrophyand strength [4]. Physiological and psychological constraints leading to a reduction in physical ormental performance can be classified as fatigue which is a phenomenon that has protective role inhuman physiology [5]. Exercise is a potent stimulus with respect to altering homeostatic variableswhich triggers adaptive reactions that counter the metabolic changes and repair the structural damagecaused by the previous training session [5]. The stressful effects of RE can temporarily impair athlete’sperformance [6]. Therefore, the speed and quality of recovery are absolutely essential for the highperformance athlete and, if done correctly, optimal recovery can lead to numerous benefits training andupcoming competition [7]. The main purpose of recovery is to restore physiological and psychologicalprocesses, so that the person engaging in vigorous exercise can repeat training sessions at an appropriate
J. Funct. Morphol. Kinesiol. 2019, 4, 41; doi:10.3390/jfmk4030041 www.mdpi.com/journal/jfmk37
J. Funct. Morphol. Kinesiol. 2019, 4, 41
level [7]. It is also typically dependent on the nature of the exercise performed and any other outsidestressors that the athlete may be exposed to [7].
Certainly, one of the unnecessary stressors during recovery phase is alcohol (ALC) consumption [8,9]. Worldwide, alcohol is the most commonly used psychoactive drug; it is estimated that each adultperson consumes, on average, about 4.3 L of pure alcohol per year [10]. In the current era, consumptionof alcohol is increasing exponentially in Western society [11–13] and it is common knowledge thatalcohol can permeate virtually every organ and tissue in the body, resulting in tissue injury andorgan dysfunction [14]. Alcohol consumption results in hormonal disturbances that can disrupt thephysiological ability to maintain homeostasis and eventually can lead to various disorders, such ascardiovascular diseases, reproductive deficits, immune dysfunction, certain cancers, bone disease, andpsychological and behavioral disorders [14]. In terms of post exercise recovery, acute alcohol ingestionreduces muscle protein synthesis in a dose-and time-dependent manner, after the cessation of exercisestimulus [8]. Alcohol does this mainly by suppressing the phosphorylation and activation of the mTORpathways, the crucial kinase cascade regulating translation initiation [8,15]. Concomitantly, alcoholincreases the expression of muscle specific enzymes that are up regulated by conditions that promoteskeletal muscle atrophy [8,16].
Emerging research provides new insights into the effect of alcohol consumption on post-exercisemuscle recovery but more research is needed to determine how this relationship exists and establish thephysiological mechanisms governing this response. Therefore, the aim of this review is to understandthe effects of alcohol consumption during recovery, on muscle function, following RE.
2. Materials and Methods
Preferred Reporting Items for Systematic Reviews and Meta-Analyses (PRISMA) statement hasbeen used to structure this manuscript.
2.1. Inclusion and Exclusion Criteria
Studies that meet the following criteria will be included or excluded in this systematic review.
2.2. Eligibility Criteria
When it comes to eligibility criteria, only articles written in English language and published inpeer-reviewed journals have been considered during the search. There was no limit on publication datewhen it comes to article eligibility. Different formats of publications such as reviews, meta-analysis,abstracts, citations, scientific conference abstracts, opinion pieces, books, book reviews, statements,letters, editorials, non-peer reviewed journal articles and commentaries have been excluded. Withrespect to intervention, publications were included only if they used a specific measure of performanceor biomarker, that considered recovery following RE and alcohol intoxication. Articles exploringrecovery after endurance type of training have been eliminated.
2.3. Participants
All the analyzed participants were adults to whom an ALC intervention was administeredfollowing a bout of RE. Children were not considered for analysis. There was no limitation whenit comes to age, gender, number of participants, and duration of intervention or follow up period.Furthermore, there was no limitation when it comes to training status.
2.4. Interventions
The interventions described in the eligibility criteria will be included in this review. Theinterventions aimed to understand the effects of ALC on biological, physical and cognitive measuresfollowing RE. According to the nature of the review different methodological approaches whichevaluate similar outcomes will be considered.
38
J. Funct. Morphol. Kinesiol. 2019, 4, 41
2.5. Comparators
Comparators will be control groups (people not consuming ALC [NO-ALC]) if present orif cross-over designs will be adopted the intervention groups will act as controls after eachwash-out period.
2.6. Outcomes
The primary outcome will be to understand the effects of ALC compared to the NO-ALCintervention. Such findings will be applied to all the biological, physical and cognitivemeasures retrieved.
2.7. Search Strategy
We used EndNote v. 8.1 software (Clarivate Analytics, Jersey, UK) for the article search. Thepapers have been collected through PubMed (NLM), Web of Science (TS), and Scopus using the string:((“alcohol” AND “exercise*” and “recovery*”; “ethanol” AND “exercise” AND “recovery”; “alcohol*”AND “resistance training” AND “recovery”; “ethanol” AND “resistance training*” AND “recovery”;“alcohol*” AND “strength*” AND “recovery”; “ethanol” AND “strength” AND “recovery”; “alcohol*”AND “training” AND “recovery”; “ethanol” and “training” and “recovery”)).
2.8. Selection of Study Objects
The article screening was carried out in a three-step process: title reading, abstract reading andfull text reading, respectively. If any disagreements were noticed between the two investigators, athird one considered the current process independently and discussed the decision with the otherinvestigators. Furthermore, investigators were not blinded to the manuscripts, study title, authors, orassociated institutions during the selection process. Both qualitative and quantitative articles wereincluded in the review. The screening processes have been summarized via PRISMA flow diagram(Figure 1).
2.9. Risk of Bias
Risk of bias for the included studies was assessed through Downs and Black checklist [17]. Thistool is useful when evaluating the quality of original research articles in order to synthesize evidencefor public health purposes. This checklist contains 27 ‘yes’-or-’no’ questions over five different domains.It offers both an overall score for study quality and a numeric score out of a possible 32 points. Thefive domains contain questions about study quality, external validity, study bias, confounding andselection bias, and power of the study.
Two independent researchers have completed the Downs and Black checklist of all includedarticles to determine the quality of each study. The maximum score a study can receive is 32, withhigher scores indicating better quality. The studies were then divided into groups and marked as ‘highquality’ (score 23–32), ‘moderate quality’ (score 19–22), ‘lower quality’ (score 16–18) or ‘poor quality’(<14) (Supplementary File S1 and S2). Kendall Tau correlation coefficient statistical method was usedto determine inter-rater reliability. We used R statistical software (Bell Laboratories, Murray Hill, NJ,USA) version 3.6 to perform this analysis. Quality of evidence was determined by the study designand by Downs and Black score.
39
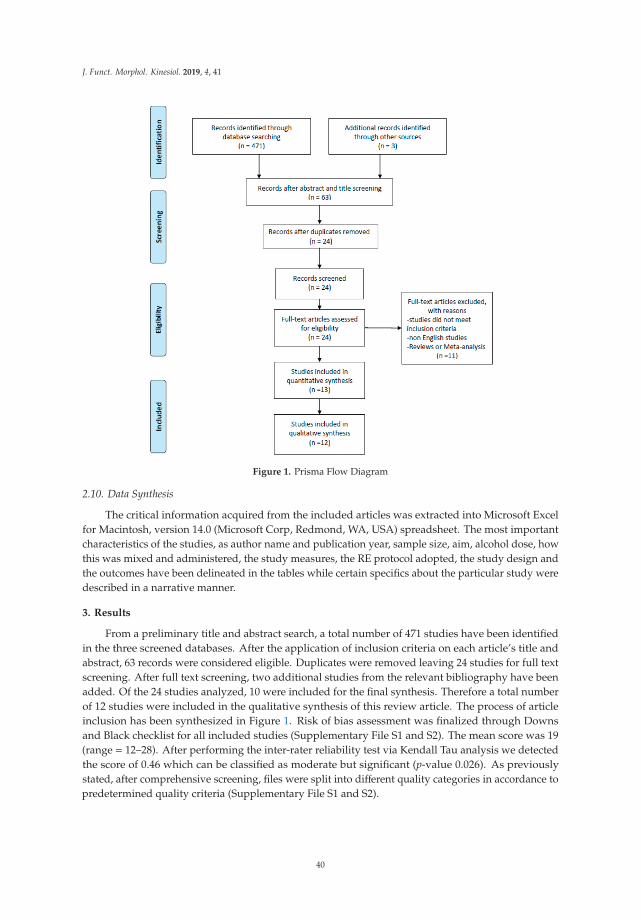
J. Funct. Morphol. Kinesiol. 2019, 4, 41
Figure 1. Prisma Flow Diagram
2.10. Data Synthesis
The critical information acquired from the included articles was extracted into Microsoft Excelfor Macintosh, version 14.0 (Microsoft Corp, Redmond, WA, USA) spreadsheet. The most importantcharacteristics of the studies, as author name and publication year, sample size, aim, alcohol dose, howthis was mixed and administered, the study measures, the RE protocol adopted, the study design andthe outcomes have been delineated in the tables while certain specifics about the particular study weredescribed in a narrative manner.
3. Results
From a preliminary title and abstract search, a total number of 471 studies have been identifiedin the three screened databases. After the application of inclusion criteria on each article’s title andabstract, 63 records were considered eligible. Duplicates were removed leaving 24 studies for full textscreening. After full text screening, two additional studies from the relevant bibliography have beenadded. Of the 24 studies analyzed, 10 were included for the final synthesis. Therefore a total numberof 12 studies were included in the qualitative synthesis of this review article. The process of articleinclusion has been synthesized in Figure 1. Risk of bias assessment was finalized through Downsand Black checklist for all included studies (Supplementary File S1 and S2). The mean score was 19(range = 12–28). After performing the inter-rater reliability test via Kendall Tau analysis we detectedthe score of 0.46 which can be classified as moderate but significant (p-value 0.026). As previouslystated, after comprehensive screening, files were split into different quality categories in accordance topredetermined quality criteria (Supplementary File S1 and S2).
40

J. Funct. Morphol. Kinesiol. 2019, 4, 41
In order to evaluate the effects of alcohol consumption on recovery following RE, the resultshave been summarized into three categories: (1) biological and (2) physical measures and (3)cognitive function.
Of the retrieved studies, 10 took into account at least one biological measure [9,18–26], 11 tookinto account at least one physical measure [9,18–25,27,28] and cognitive function only one [24].
The retrieved biological measures include creatine kinase (CK) [18–25], heart rate [19,26],lactate [19,26], blood glucose [9], urine measures [24], cortisol [19,21,24,26], testosterone [19,21,24,26],estradiol [26], sexual hormone binding globulin (SHBG) [21,26], leukocytes and cytokines [19,21,22],C-reactive protein (CRP) [24], plasma amino acids [9], intracellular signaling proteins and ratesof muscle protein synthesis (MPS) [9] and calcium (Ca2+) [25]. The physical measures includeforce [18,20–25,27,28], power [19,21,24,28], muscular endurance [25], soreness [18,20,22,23,28] and rateof perceived exertion (RPE) [19,24,26]. The cognitive measures included a modified version of theSTROOP test which evaluated time and accuracy of each response for congruent and incongruentstimuli. The alcohol dose provided to the participants in the included studies ranged between 0.6g/kgto 1.5g/kg. As defined by Kalinowski and Humphreys [29] a standard drink equals to 10 g of alcohol.Therefore, the alcohol dose provided to the participants, if we consider a man of 70kg, equals to 42 to105 g of alcohol (4.2 to 10.5 standard drinks), which corresponds to 3 bottles of beer of 330 mL at 5%alcohol or a 370mL bottle of spirit at 37.5% alcohol, respectively. All the included studies adopted across-over research design. A summary of the retrieved studies is shown in Table 1.
3.1. Biological Measures
3.1.1. Creatine Kinase
Eight studies included CK measurement [18–25]. All the retrieved studies showed that CKincreases following each RE protocol in both ALC and NO-ALC conditions showing a time interactionwith RE. However, when analysing interaction with the different conditions, no differences were shownbetween the ALC and NO-ALC condition for none of the retrieved studies. Clarkson et al. [20], havealso correlated peak CK activity from the ALC and the NO-ALC condition and found a high correlationcoefficient (r=0.95), whereas Paulsen et al. [25] have also stratified the findings for man and womenfinding again no differences between the two groups neither for time or treatment assessment. Suchresults, as also highlighted by each author of the included studies, demonstrate that ALC cannot beconsidered as a modulating factor for CK following RE and that the increases of CK are the result ofmuscle damage following the exercise bouts.
3.1.2. Heart Rate
Two studies included measures of heart rate [19,26]. In both studies heart rate increasedfollowing the exercise intervention, however no difference was shown between the ALC and theNO-ALC condition.
3.1.3. Lactate
Two studies included measures of lactate [19,26]. In both studies lactate increased following theexercise intervention, however no difference was shown between the ALC and the NO-ALC condition.
3.1.4. Blood glucose
Only Parr et al. [9] evaluated the concentration of blood glucose. It has to be noted that Parradministered a concentration of alcohol in conjunction with either CHO or PRO. The results highlighta significant time and treatment interaction. Blood glucose concentration increased 0.5 and 4.5 h postintervention in the ALC-CHO group but not in the ALC-PRO or NO-ALC groups. Such findingsdemonstrate that blood glucose is affected by CHO but not ALC during recovery after RE.
41

J.Fu
nct.
Mor
phol
.Kin
esio
l.2019,4
,41
Ta
ble
1.
Des
crip
tive
char
acte
rist
ics
ofth
ere
trie
ved
stud
ies.
Au
tho
r[R
ef]
(Ye
ar)
nA
imA
lco
ho
l(d
ose
)M
ixA
dm
inis
tra
tio
nT
ime
Me
asu
res
Re
sist
an
ceT
rain
ing
Co
mp
ara
tor
Ou
tco
me
s(C
om
pa
red
toC
om
pa
rato
r)
Barn
eset
al.
[27]
(201
0)12
Eval
uate
ifA
LCin
tera
cts
wit
hda
mag
edm
uscl
es.
1g/k
g37
.5%
ALC/v
olum
e;Sm
irnoff
Vodk
ain
oran
geju
ice
(rat
io3.
2:1)
Abe
vera
gew
asco
nsum
edev
ery
15m
inov
era
tota
ltim
eof
90m
in.
-Str
engt
h.-P
eak
and
aver
aged
torq
ue.
300
max
imal
ecce
ntri
cco
ntra
ctio
nsof
the
quad
rice
psm
uscl
esof
one
low
erlim
bat
anan
gula
rsp
eed
of30◦ /
s.
Cro
ss-O
ver
No
diff
eren
ces
inac
ute
perf
orm
ance
mea
sure
s.D
ecre
ased
perf
orm
ance
was
seen
afte
r36
hfo
llow
ing
inge
stio
n.
Barn
eset
al.
[18]
(201
0)11
Toco
mpa
reth
eeff
ects
ofpo
st-e
xerc
ise
ALC
inge
stio
nw
ith
that
ofan
isoc
alor
icno
n-A
LCbe
vera
geon
chan
ges
inm
uscl
epe
rfor
man
ce.
1g/k
g37
.5%
ALC/v
olum
e;Sm
irnoff
Vodk
ain
oran
geju
ice
(rat
io3.
2:1)
.
Abe
vera
gew
asco
nsum
edev
ery
15m
inov
era
tota
ltim
eof
90m
in.
-Sor
enes
s-P
eak
and
aver
aged
torq
ue-C
K
300
max
imal
ecce
ntri
cco
ntra
ctio
nsof
the
quad
rice
psm
uscl
esof
one
low
erlim
bat
anan
gula
rsp
eed
of30◦ /
s.
Cro
ss-O
ver
Peak
conc
entr
ic,e
ccen
tric
wer
elo
wer
inth
eA
LCgr
oup.
No
diff
eren
ces
inC
Kan
dso
rene
ss
Barn
eset
al.
[19]
(201
2)10
Toin
vest
igat
eth
eeff
ects
ofpo
st-g
ame
ALC
cons
umpt
ion
onw
hole
-bod
y,sp
ort-
spec
ific
perf
orm
ance
.
1g/k
g37
.5%
ALC/v
olum
e;Sm
irnoff
Vodk
ain
oran
geju
ice
(rat
io3.
2:1)
.
Abe
vera
gew
asco
nsum
edev
ery
15m
inov
era
tota
ltim
eof
90m
in.
-HR
-Lac
tate
-RPE
-CM
J-H
PO-C
K-C
orti
sola
ndTe
stos
tero
ne-L
euko
cyte
s
BUR
STPr
otoc
ol(i
nten
se20
-msh
uttl
eru
nw
ith
180◦
turn
s)
Cro
ss-O
ver
HR
and
Lact
ate
show
edno
diff
eren
ce.R
PEva
ried
sign
ifica
ntly
.D
iffer
ence
sin
CM
Jbut
noti
nH
POw
ere
pres
ent.
No
diff
eren
ces
inth
ele
ukoc
yte
coun
t.C
Kw
ashi
gher
inth
eA
LCgr
oup
only
afte
r48
h.Te
stos
tero
nedi
dno
tsho
wan
ydiff
eren
ces.
Cor
tiso
lwas
high
erin
the
ALC
grou
paf
ter
36h.
Cla
rkso
net
al.
[20]
(199
0)10
Ass
ess
the
effec
tofa
cute
ALC
inge
stio
non
mus
cle
indi
cato
rs.
0.8g/k
gVo
dka
40%
wit
hor
ange
juic
e(r
atio
1:1)
Sing
ledo
se.
-CK
-Sor
enes
s-I
som
etri
cst
reng
th
50re
peti
tion
sat
ala
t-pu
lley.
Cro
ss-O
ver.
No
diff
eren
cein
CK
.N
odiff
eren
cein
sore
ness
.N
odiff
eren
cein
stre
ngth
.
Hau
gvad
etal
.[2
1](2
014)
9In
vest
igat
eth
eeff
ects
ofet
hano
lon
reco
very
ofm
uscl
efu
ncti
onaf
ter
RT.
-Low
dose
0.6
or0.
7g/
kg-H
igh
dose
1.2
or1.
4g/
kg
40%
etha
nol/v
olum
e,A
bsol
utvo
dka
dilu
ted
wit
h20
0-m
Lsu
gar-
free
lem
onad
e(ra
spbe
rry
flavo
ur)a
ndw
ater
toa
tota
lof1
.5L
The
beve
rage
was
cons
umed
inab
out9
0m
in.
-MV
C-P
ower
-Cor
tiso
land
Test
oste
rone
-SH
BG-C
K-L
euko
cyte
s.
Squa
ts,l
ower
limb
pres
ses,
and
bila
tera
lkn
eeex
tens
ions
wer
epe
rfor
med
in4
sets
wit
ha
load
of8R
Mw
ith
2m
inre
st.
Cro
ss-O
ver
MV
Cw
asde
crea
sed
afte
rth
eA
LCtr
ial1
2htr
aini
ng.M
VC
norm
aliz
edin
both
grou
psaf
ter
24h.
No
diff
eren
cein
Jum
ppe
rfor
man
ce;C
orti
solw
ashi
gher
at12
at24
hin
the
high
dose
grou
p.N
eith
erte
stos
tero
neor
SHBG
wer
ein
fluen
ced
byA
LC.F
ree
test
oste
rone
was
low
erin
the
high
dose
grou
pat
12an
d24
h.N
odiff
eren
ces
inth
eC
Kfo
ran
ygr
oup.
No
diff
eren
ces
inle
ukoc
ytes
.
42
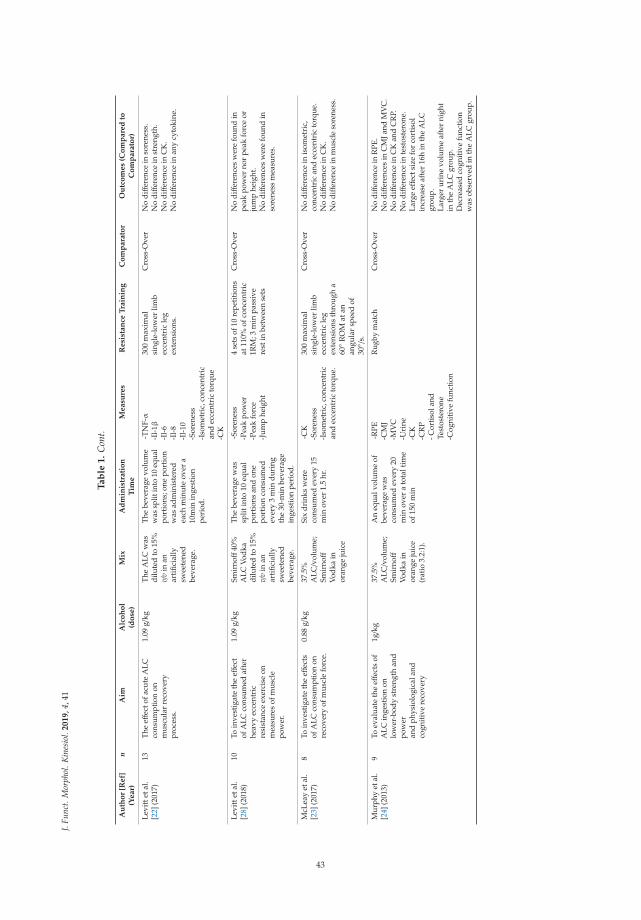
J.Fu
nct.
Mor
phol
.Kin
esio
l.2019,4
,41
Ta
ble
1.
Con
t.
Au
tho
r[R
ef]
(Ye
ar)
nA
imA
lco
ho
l(d
ose
)M
ixA
dm
inis
tra
tio
nT
ime
Me
asu
res
Re
sist
an
ceT
rain
ing
Co
mp
ara
tor
Ou
tco
me
s(C
om
pa
red
toC
om
pa
rato
r)
Levi
ttet
al.
[22]
(201
7)13
The
effec
tofa
cute
ALC
cons
umpt
ion
onm
uscu
lar
reco
very
proc
ess.
1.09
g/kg
The
ALC
was
dilu
ted
to15
%v/
vin
anar
tific
ially
swee
tene
dbe
vera
ge.
The
beve
rage
volu
me
was
split
into
10eq
ual
port
ions
;one
port
ion
was
adm
inis
tere
dea
chm
inut
eov
era
10m
inin
gest
ion
peri
od.
-TN
F-α
-Il-
1β-I
l-6
-Il-
8-I
l-10
-Sor
enes
s-I
som
etri
c,co
ncen
tric
and
ecce
ntri
cto
rque
-CK
300
max
imal
sing
le-l
ower
limb
ecce
ntri
cle
gex
tens
ions
.
Cro
ss-O
ver
No
diff
eren
cein
sore
ness
.N
odiff
eren
cein
stre
ngth
.N
odiff
eren
cein
CK
.N
odiff
eren
cein
any
cyto
kine
.
Levi
ttet
al.
[28]
(201
8)10
Toin
vest
igat
eth
eeff
ect
ofA
LCco
nsum
edaf
ter
heav
yec
cent
ric
resi
stan
ceex
erci
seon
mea
sure
sof
mus
cle
pow
er.
1.09
g/kg
Smir
noff
40%
ALC
Vodk
adi
lute
dto
15%
v/v
inan
arti
ficia
llysw
eete
ned
beve
rage
.
The
beve
rage
was
split
into
10eq
ual
port
ions
and
one
port
ion
cons
umed
ever
y3
min
duri
ngth
e30
-min
beve
rage
inge
stio
npe
riod
.
-Sor
enes
s-P
eak
pow
er-P
eak
forc
e-J
ump
heig
ht
4se
tsof
10re
petit
ions
at11
0%of
conc
entr
ic1R
M;3
min
pass
ive
rest
inbe
twee
nse
ts
Cro
ss-O
ver
No
diff
eren
ces
wer
efo
und
inpe
akpo
wer
nor
peak
forc
eor
jum
phe
ight
.N
odiff
eren
ces
wer
efo
und
inso
rene
ssm
easu
res.
McL
eay
etal
.[2
3](2
017)
8To
inve
stig
ate
the
effec
tsof
ALC
cons
umpt
ion
onre
cove
ryof
mus
cle
forc
e.
0.88
g/kg
37.5
%A
LC/v
olum
e;Sm
irnoff
Vodk
ain
oran
geju
ice
Six
drin
ksw
ere
cons
umed
ever
y15
min
over
1.5
hr.
-CK
-Sor
enes
s-I
som
etri
c,co
ncen
tric
and
ecce
ntri
cto
rque
.
300
max
imal
sing
le-l
ower
limb
ecce
ntri
cle
gex
tens
ions
thro
ugh
a60◦ R
OM
atan
angu
lar
spee
dof
30◦ /
s.
Cro
ss-O
ver
No
diff
eren
cein
isom
etri
c,co
ncen
tric
and
ecce
ntri
cto
rque
.N
odiff
eren
cein
CK
.N
odiff
eren
cein
mus
cle
sore
ness
.
Mur
phy
etal
.[2
4](2
013)
9To
eval
uate
the
effec
tsof
ALC
inge
stio
non
low
er-b
ody
stre
ngth
and
pow
eran
dph
ysio
logi
cala
ndco
gnit
ive
reco
very
1g/k
g37
.5%
ALC/v
olum
e;Sm
irnoff
Vodk
ain
oran
geju
ice
(rat
io3.
2:1)
.
An
equa
lvol
ume
ofbe
vera
gew
asco
nsum
edev
ery
20m
inov
era
tota
ltim
eof
150
min
-RPE
-CM
J-M
VC
-Uri
ne-C
K-C
RP
-Cor
tiso
land
Test
oste
rone
-Cog
niti
vefu
ncti
on
Rug
bym
atch
Cro
ss-O
ver
No
diff
eren
cein
RPE
.N
odiff
eren
ces
inC
MJa
ndM
VC
.N
odiff
eren
cein
CK
and
CR
P.N
odiff
eren
cein
test
oste
rone
.La
rge
effec
tsiz
efo
rco
rtis
olin
crea
seaf
ter
16h
inth
eA
LCgr
oup.
Larg
erur
ine
volu
me
afte
rni
ght
inth
eA
LCgr
oup.
Dec
reas
edco
gnit
ive
func
tion
was
obse
rved
inth
eA
LCgr
oup.
43

J.Fu
nct.
Mor
phol
.Kin
esio
l.2019,4
,41
Ta
ble
1.
Con
t.
Au
tho
r[R
ef]
(Ye
ar)
nA
imA
lco
ho
l(d
ose
)M
ixA
dm
inis
tra
tio
nT
ime
Me
asu
res
Re
sist
an
ceT
rain
ing
Co
mp
ara
tor
Ou
tco
me
s(C
om
pa
red
toC
om
pa
rato
r)
Parr
etal
.[9]
(201
4)8
Eval
uate
the
effec
tof
ALC
inta
keon
rate
sof
myo
fibri
llar
prot
ein
synt
hesi
sfo
llow
ing
stre
nuou
sex
erci
se
-1.5
g/kg
wit
hC
HO
-1.5
g/kg
wit
hPR
O
Vodk
aan
dO
rang
eju
ice
(rat
io1:
4)
6eq
ualv
olum
esw
ere
cons
umed
duri
nga
3h
peri
od.
-Bio
psy
-Blo
odgl
ucos
e-P
lasm
aA
Aco
ncen
trat
ion
-Int
race
llula
rsi
gnal
ling
prot
eins
-8×5
at,8
0%of
1RM
-10×3
0s
high
inte
nsit
yin
terv
als
at11
0%of
PPO
;3m
inre
stbe
twee
nse
ts
Cro
ss-O
ver
Bloo
dA
LCw
ashi
gher
inth
eC
HO
com
pare
dto
the
PRO
grou
paf
ter
6an
d8h
afte
rco
nsum
ptio
n.Bl
ood
Glu
cose
was
high
erin
the
ALC
-CH
Ogr
oup
afte
r5h
.AA
(EEA
and
BCA
A)w
ere
low
erin
the
ALC
grou
psco
mpa
red
toth
eno
ALC
grou
p.m
TOR
phos
phor
ylat
ion
was
high
erin
the
noA
LCgr
oup
at2
and
8hpo
stex
erci
se.
p70S
6Kph
osph
oryl
atio
nw
ashi
gher
inth
eno
ALC
and
the
ALC
-PR
Ogr
oup
at8h
post
exer
cise
.Mus
cle
prot
ein
synt
hesi
sw
asgr
eate
rin
the
No
ALC
grou
pth
anth
eA
LC-P
RO
,w
hich
was
grea
ter
than
the
ALC
-CH
Ogr
oup.
Poul
sen
etal
.[2
5](2
007)
19Ev
alua
teac
ute
ALC
into
xica
tion
onsk
elet
alm
uscl
efu
ncti
on
1.5
g/L
ALC
96%
with
oran
geju
ice
(rat
io1:
4)
5do
ses
with
inte
rval
sof
1hea
ch.
-CK
-Ca2+
-Str
engt
h-E
ndur
ance
MV
CIs
okin
etic
endu
ranc
ean
dis
omet
ric
knee
exte
nsor
s(3
0ex
tens
ions
ata
velo
city
of18
0◦/s
)
Cro
ss-O
ver
No
diff
eren
ces
inst
reng
than
den
dura
nce.
No
diff
eren
ces
inC
K.
Smal
lred
ucti
onin
Ca2+
only
inth
eA
LCgr
oup.
Vin
gren
etal
.[2
6](2
013)
8To
exam
ine
the
test
oste
rone
bioa
vaila
bilit
yan
dth
ean
abol
icen
docr
ine
mili
euin
resp
onse
toac
ute
etha
noli
nges
tion
1.09
g/kg
ALC
was
dilu
ted
toa
conc
entr
atio
nof
19%
v/v
abso
lute
etha
noli
nan
arti
ficia
llysw
eete
ned
and
calo
rie-
free
beve
rage
The
part
icip
ants
dran
k1/
10of
the
drin
kea
chm
inut
edu
ring
a10
-min
inge
stio
npe
riod
.
-HR
-RPE
-Tes
tost
eron
e-S
HBG
-Lac
tate
-Cor
tiso
l-E
stra
diol
6×1
0squ
ats
star
ting
at80
%of
1R
Man
d2
min
ofre
stbe
twee
nse
ts.
Cro
ss-O
ver
No
diff
eren
cein
HR
,RPE
and
lact
ate.
Seru
mte
stos
tero
nean
dfr
eete
stos
tero
new
ashi
gher
for
ALC
at30
0min
post
exer
cise
.FA
Iw
ashi
gher
inth
eA
LCgr
oup.
No
diff
eren
cein
cort
isol
leve
ls.
No
diff
eren
ces
ines
trad
iol.
Tot.
127
Mea
n1.
1g/k
g
N=
Num
ber
ofpa
rtic
ipan
ts;g/L=
gram
spe
rlit
er;g/k
g=gr
ams
per
kilo
gram
;ALC=
Alc
ohol
;CK=
Cre
atin
eki
nase
;Ca2+=
Cal
cium
;MV
C=
Max
imum
volu
ntar
yco
ntra
ctio
n;R
OM=
Ran
geof
mov
emen
t;H
R=
Hea
rtra
te;R
PE=
Rat
ing
ofpe
rcei
ved
exer
tion;
CM
J=C
ount
erm
ovem
entj
ump;
HPO=
Hor
izon
talp
ower
outp
ut;R
E=R
esis
tanc
eex
erci
se;S
HBG
:Sex
horm
one-
bind
ing
glob
ulin
;RM=
Rep
etiti
onm
axim
um;C
RP=
C-r
eact
ive
prot
ein;
CH
O=
carb
ohyd
rate
;PR
O=
Prot
ein.
;AA=
Am
ino
Aci
ds;P
PO=
Peak
pow
erou
tput
;EA
A=
Esse
ntia
lam
ino
acid
s;BC
AA=
Bran
ched
Cha
inam
ino
acid
s;FA
I=Fr
eean
drog
enin
dex.
44

J. Funct. Morphol. Kinesiol. 2019, 4, 41
3.1.5. Urine Measures
Only Murphy et al. [24] included urine measures. Post-intervention urine output, nude mass andurine-specific gravity were measured. No differences were found for nude mass and urine-specificgravity between conditions. The ALC group had an increased total volume output overnight whencompared to the NO-ALC group.
3.1.6. Cortisol
Four studies included measures of cortisol [19,21,24,26]. In the study of Barnes et al. [19] thecortisol levels increased after 12h after treatment in both conditions, after which at 24h returned tobaseline levels. A second rise in cortisol was seen at 36h under the ALC condition but not in theNO-ALC condition. Haugvard et al. [21] showed that no differences were shown between the twoconditions at any specific time point after the intervention (12 and 24 h post-treatment). However, ifthe 12 and 24 h cortisol values were combined and averaged, these resulted to be significantly elevatedonly in the ALC condition at 24 h after the intervention. Murphy et al. [24] showed that a significantdecrease post-match was followed by a significant increase at 16h post intervention. No differencewas found in the levels of cortisol between the two interventions. However, a large effect size wasfound between the %change from 2 to 16 h post-match for the increase in cortisol response after ALCconsumption. Vingren et al. [26] found that cortisol levels were not affected by ALC post intervention.Cortisol was elevated immediately after, after 20, 40, 60, 120, 140 and 300 min post-intervention in bothALC and NO-ALC conditions.
3.1.7. Testosterone
Four studies included measures of cortisol [19,21,24,26]. In the study of Barnes et al. [19] nodifference in the testosterone levels compared to baseline ware seen at any time point after theintervention in either two conditions (12-24-36 and 48 h after the intervention). In the study ofHaugvard et al. [21] the levels of testosterone were not altered across trials neither for the ALC andthe NO-ALC condition. Calculated free testosterone (testosterone/SHBG multiplied by a factor of 10)was not different between trials. However, if the measures at 12 and 24 h after the intervention werecombined and averaged the levels of testosterone resulted to be lower only in the ALC condition after24 h. Murphy et al. [24] showed that a reduction in testosterone was present after 2 h post-matchfollowed by a significant increase 16h post-match. However, no differences were shown between thetestosterone levels for the two conditions neither between %changes from 2 to 16 h post-match. Vingrenet al. [26] found a significant effect for treatment for testosterone in which the levels were increasedimmediately and 140 and 300 min after the intervention for the ALC group, whereas it appeared to bedecreased in the NO-ALC group between 60 and 300 min post-intervention. Free testosterone alsoseemed to be increased between 60 and 300 min post-intervention for both conditions.
3.1.8. Estradiol
Only one study included measures of estradiol after ALC consumption [26]. The study indicatesthat the levels of estradiol were elevated immediately after and between 20 and 40 min after theintervention, when compared to baseline measures, in both groups, with no significant differencesbetween the ALC and the NO-ALC group. The results underlie that ALC has no effect on estradiolduring recovery from RT.
3.1.9. Sexual Hormone Binding Globulin
Two studies included measures of SHBG [21,26]. In none of the included records the levels ofSHBG seemed to be altered by ALC intake, neither by the acute bouts of exercise proposed by the twoauthors. ALC does not seem to be a modulating factor for SHBG following RE.
45
J. Funct. Morphol. Kinesiol. 2019, 4, 41
3.1.10. Leukocytes and Cytokines
Three of the included studies included measures of leukocytes and cytokines [19,21,22]. Barnesperformed analysis of total and differential leukocytes and found that total, neutrophil and monocyteconcentration increased after the intervention but decreased to baseline values after 12h. However,no difference was present between the two conditions. Haugvard et al. [21] found no differencebetween conditions regarding the white blood cell, neutrophils or monocytes count. Following RE bothconditions showed a sub-clinical leucocytosis 1h post-exercise. Levitt et al. [22] analysed inflammatorymarkers in women post-exercise, in particular TNF-α, IL-1β, IL-6, IL-8 and IL-10 before, at 5, 24 and48h post-intervention.IL-10, IL-8 and TNF-α increased after the intervention in both groups. IL-6 andIL-1β remained unchanged over time for both conditions. No differences for cytokine was presentbetween the ALC and the NO-ALC condition. ALC doesn’t seem to affect neither leukocytes norcytokines after RE during recovery.
3.1.11. C-reactive Protein
C-reactive protein was evaluated only in the study of Murphy et al. [24], in which however nosignificant difference was highlighted neither regarding time, when data was compared to baseline,neither regarding condition, when ALC and NO-ALC where compared. The findings indicate thatpost-match alcohol consumption did not unduly affect CRP markers of damage.
3.1.12. Plasma Amino Acids
Plasma amino acids (AA) have been included only in the study of Parr et al. [9], who evaluatedEEA, BCAA and leucine at 0, 1, 2, 4, 6 and 8 h after alcohol consumption following RE. It has to benoted that Parr administered a concentration of alcohol in conjunction with either CHO or PRO. Theresults were then compared to a control group who did not ingest ALC but consumed a single dose of25 g of whey protein.
A significant effect for time and treatment were found. At all-time points the NO-ALC group hadsignificantly higher levels of essential AA (EEA), branched chain AA (BCAA) and leucine compared tothe ALC-PRO group. Both groups (the NO-ALC and the ALC-PRO) had at all-time points significantlyhigher levels of AA compared to the ALC-CHO group. No difference in the levels of AA comparedto baseline was shown, at any time point, in the ALC-CHO group. Leucine, EEA and BCAA wereelevated compared to baseline at 1 and 6 h post-ALC ingestion for the NO-ALC and ALC-PRO group.The data from the study of Parr et al. [9] indicates that ALC alone does not influence the levels ofplasma AA, however can be a factor that limits the rise of blood concentration of AA followingprotein consumption.
3.1.13. Intracellular Signaling Proteins and Rates of Muscle Protein Synthesis
mTOR, p70S6K, eEF2, 4E-BP1, AMPK, MuRF-1 mRNA and fractional synthetic rate of myofibrillarprotein synthesis were analysed in the study of Parr et al. [9]. ALC and NO-ALC consumptionmodalities have been described in the previous subsection. mTORSer2448 phosphorylation was higherin all groups at 2h post treatment. However, mTOR phosphorylation in the NO-ALC group washigher than the ALC-CHO (76%) and ALC-PRO (54%) group at 2 and 8 h post-exercise. p70S6Kphosphorylation was greater after 2h post-exercise compared to baseline only in the NO-ALC andthe ALC-PRO groups. No differences were shown for the ALC-CHO group. eEF2 phosphorylationdecreased below rest values at 2 and 8 h in the ALC-CHO and ALC-PRO groups. No differences wereshown for the NO-ALC group at any time point.
No differences for time and condition were shown for 4E-BP1Thr37/46 or AMPKThr172
phosphorylation. There were increases above rest in MuRF-1 mRNA at 2 h post- interventionwith no differences between treatments. All values returned to baseline at 8h post- intervention.
46
J. Funct. Morphol. Kinesiol. 2019, 4, 41
Fractional synthetic rate of myofibrillar protein synthesis were increased above baseline for allgroups from 2 to 8 h post-intervention. However, a hierarchical reduction was shown when data wascompared to the NO-ALC group in the ALC-PRO (-24% compared to NO-ALC) and ALC-CHO (−38%compared NO-ALC and −18% compared to ALC-PRO) groups. Data suggests that ALC consumptionimpairs the response of muscle protein synthesis during recovery despite optimal nutrient provision.
3.1.14. Calcium
Only one study has evaluated the effects of ALC on Ca2+ via blood sampling [25]. The authorsreport that the Ca2+ levels were similar before exercise for both conditions. A decrease of approximately2% was observed following the exercise bouts. A further decrease was observed in the ALC condition,and the difference with the NO-ALC condition was significant only after the strength evaluation.Hypocalcaemia was not induced by ALC and no differences were shown for resting free Ca2+ levelsindicating that free Ca2+ concentrations were not affected by alcohol per se.
3.2. Physical Measures
3.2.1. Force
Nine studies have examined the effects of post-exercise ALC consumption on force [18,20–25,27,28].McLeay et al. [23] evaluated maximal isometric, concentric and eccentric muscular contractions ofthe quadriceps femoris using an isokinetic dynamometer for both lower limbs using one lower limbas control. A significant difference between lower limbs was present post-treatment (exercised vs.non-exercised lower limb) up to 60 h post-exercise regarding maximal isometric tension, concentric andeccentric torque but no difference was observed between the ALC and the NO-ALC condition. Barneset al. [18,27] in both studies evaluated isometric, concentric and eccentric contractions of the quadricepsmuscles of both lower limbs using one lower limb as control. Isometric tension was measured at 75◦of knee angle. Concentric and eccentric torque was measured at an angular speed of 30◦/s. In bothstudies a decrease in performance was seen in both the ALC and NO-ALC groups over time in theexercised lower limb for all the evaluated measures (isometric and eccentric peak torques as wellas for isometric, concentric and eccentric average peak torques). A greater decrease in performancewas however seen in the ALC group in the first study [27] at 36h post-intervention (isometric andeccentric peak torques were reduced 39 and 44% compared to pre-exercise measures, respectively,with ALC whereas losses of 29 and 27% for the same measures in the NO-ALC group. Average peaktorque was reduced by 41% (isometric), 43% (concentric) and 45% (eccentric) with ALC comparedto 29, 32 and 26% with NO-ALC groups, respectively), while no differences were seen between 36and 60h post-intervention. In the second study [18], except for average peak isometric torque, allmeasures were different between interventions with the greatest decrements observed in the ALCgroup. Greatest decreases in peak torque were observed at 36 h with losses of 12%, 28% and 19%occurring in the NO-ALC group for isometric, concentric and eccentric contractions, respectively. Peaktorque loss was significantly larger in ALC with the same performance measures decreasing by 34%,40% and 34%). Levitt et al. [22] measured peak torque for the knee extension exercise on each lowerlimb using an isokinetic dynamometer. The same assessment procedure used by Barnes et al. [18,27]was adopted. A reduction post-intervention was found for peak isometric, concentric and eccentrictorque between the exercised and not-exercised lower limb, but no difference was found between theALC and NO-ALC condition immediately post nor at 24 and 48 h post-intervention. Poulsen et al. [25]evaluated isokinetic muscle strength of the dominant knee extensors and non-dominant wrist flexors.No differences in isometric strength was observed immediately post, 4, 24 or 48 h post intervention,neither regarding time, when compared to baseline, neither regarding ALC condition. Murphy etal. [24] measured peak MVC of the knee extensors and found that a significant reduction compared tobaseline was evident at all measured time points (2 and 16 h post-intervention), but no differenceswere present between the ALC and NO-ALC group. Haugvad et al. [21] have also measured isometric
47
J. Funct. Morphol. Kinesiol. 2019, 4, 41
MVC of the knee extensors and the results reported by the authors showed stable values in all analysedconditions (Low ALC dose, High ALC dose and NO-ALC). A decrease immediately after performanceand a recovery from immediately after to 12 and 24 h post intervention was seen in all groups, with nosignificant differences between trials. Clarkson et al. [20] measured isometric strength of the elbowflexors and the results are similar to those of Haugvad et al. with a reduction immediately post-exercisebut no difference between conditions. The level of isometric strength returned to baseline 5 days post-intervention. Except for the studies of Barnes et al. no differences seem to be present following ALCconsumption on force during recovery following RE. It has to be noted that the ALC dose provided byBarnes et al. is of 1g/kg, which is neither the minimum or maximum dose provided across the studies.
3.2.2. Power
Four studies [19,24,28,30] included measures of power following ALC consumption and RE.Barnes et al. [19] have included measures of counter movement jump (CMJ) and horizontal poweroutput (HPO). HPO did not vary neither over time neither regarding condition. CMJ instead showed asignificant time x treatment effect, where a decrease in jump performance was observed after 24 and48 h post-intervention only in the ALC group. However, the authors underline that the decrementsseen in performance are trivial as the decrease in the jumping performance of the CMJ was a meanvalue of 12 cm. Murphy et al. [24] have included a measure of CMJ over time, where each participantwas required to perform 10-maximal repeated CMJs. The results of Murphy et al. do not showany difference neither regarding time neither regarding condition. Levitt et al. [28] have includedmeasures of vertical power, and similarly to Barnes et al., the reported measures of power show atime effect, with a reduction in vertical power output after 24 and 48 h post-intervention, but no effectregarding condition. Haugvad et al. [21] included a measure of squat jump performed without anycounter movement on a force platform. Jump height was calculated for analysis. Jump height wasreduced immediately after and 12 h post-intervention in all groups (low-ALC, high-ALC and NO-ALCcondition). However, no difference between any group was present. ALC doesn’t seem to have aneffect on power output, at least in the 48 h following its consumption.
3.2.3. Muscular Endurance
Maximal isokinetic muscular endurance was calculated for the dominant knee extensors andnon-dominant wrist in the study of Poulsen et al. [25] using an isokinetic dynamometer. Thirty maximalreciprocal movements were performed at a velocity of 180◦/s without any rest interval. Subjects wereinstructed to exert maximal effort in every single movement and not to economise the muscle exertion.An endurance index was calculated defined as the mean-peak torque of the last five repetitions as apercentage of the mean-peak torque of the first five repetitions. The results obtained by the authorsshow no differences in muscular endurance 4, 24 and 48h after treatment neither after ALC intoxicationneither in the NO-ALC group. No changes were evident neither in the leg extensors neither in thewrist flexors or between the endurance index for both conditions for both muscle groups. The resultswere also stratified according to gender and similar findings were achieved.
3.2.4. Soreness
Five studies included measures of soreness [18,20,22,23,28]. Barnes et al. [18] evaluated sorenessby asking each participant at different time points their levels of soreness by giving a value from 0(no pain) to 10 (worst possible pain). Soreness was rated while stepping up (concentric muscularcontraction) onto a 40 cm box and lowering into a squatting position. Clarkson et al. [20] evaluatedsoreness by questionnaire, measured for the forearm flexor muscles, using a scale of 1 to 10. Levitt etal. [22] measured soreness applying on the vastuslateralis, in three different points along the musclebelly, a pressure of 35N. Each participant rated the pain giving a value from 0 to 10. In a subsequentstudy Levitt et al. [28] evaluated pain by asking the participants to self-report their level of pain usinga scale from 0 to 5. McLeay et al. [23] used the same protocol as above described in the study of Barnes
48
J. Funct. Morphol. Kinesiol. 2019, 4, 41
et al. [18]. All the retrieved records show a time effect for muscle soreness related to the interventionprotocol, with increases over a period of 24 and 48 h after the training intervention, with no differencesbetween the ALC and the NO-ALC condition. The results indicate that RT is a factor responsible toincrease muscle soreness between 24 and 48 h post training, whereas ALC consumption is not.
3.2.5. Rate of Perceived Exertion
Rates of perceived exertion were measured in three of the retrieved studies [19,24,26]. The study ofVingren [26], was the only one evaluating RPE before and after a single session of static RE. Barnes andMurphy [19,24] evaluated RPE before and after a rugby match. In particular Murphy et al. evaluatedRPE after a competitive rugby league game, whereas Barnes et al. after a simulated rugby match. Theresults of Vingren and Murphy highlight a significant time effect, with increases of RPE after the RTand the rugby league game, but no significant differences between the RPE of the ALC or the NO-ALCgroups. The results of Barnes et al. are in line to those of the previous authors regarding the timeeffect of RPE following the exercising protocol, however a difference was shown between conditions.The ALC group reported lower levels of RPE at the end of the third quarter of the simulated game,compared to the NO-ALC group at the same time measurement. Despite the significant results, themean difference between the two conditions is very small (ALC=15.2 ± 1.6; NO-ALC=16.5 ± 1.2) andnot present at any other time point.
3.3. Cognitive Function
Cognitive function was assessed only in the study of Murphy et al. [24] through a modified versionof the Stroop test. This test of cognitive function was a computer-based program requiring subjectsto react to repeated color and word stimuli. The program analyzed response time and accuracy forcongruent and incongruent stimuli. Measures of cognitive function were recorded before, immediatelypost, 2 and 16 h intervention. The results provided by the authors show no difference over time forcognition test time, congruent reaction time, or incongruent reaction time. However, the time requiredto complete the cognition test significantly increased in the ALC compared to the NO-ALC group anda large ES was shown for increased cognition test time, congruent and incongruent reaction time in theALC group compared to the NO-ALC group. The findings indicate that ALC consumption impairscognitive function during recovery, which may be a negative factor in sports where decision makingprocesses, speed and quality of responses to visual stimuli (especially team sports) are essential.
4. Discussion
By evaluating the effects of alcohol consumption on recovery following RE from biological,physical and cognitive perspective, we have been able to provide a comprehensive description of themultifactorial nature of alcohol consumption. Indeed, alcohol consumption is a common occurrence inthe general population on global scale and it is a phenomenon that has not been explored in depthwhen it comes to post-exercise recovery, even more so in RE post-exercise recovery. The main findingshighlight that ALC cannot be considered as a modulating factor for the majority of the retrievedbiological measures. In fact, creatine kinase, heart rate, lactate, blood glucose, estradiol, sexualhormone binding globulin, leukocytes and cytokines, C-reactive protein and calcium do not seem tobe modified following ALC consumption during the acute recovery phase post-resistance exercise.Only cortisol levels seem to be increased, conversely testosterone, plasma amino acids, and rates ofmuscle protein synthesis decreased. When considering the retrieved physical measures force, power,muscular endurance, soreness and rate of perceived exertion also seem to be unmodified followingalcohol consumption during recovery. The general findings therefore highlight that muscle function isnot altered by alcohol consumption following exercise bouts, however the altered endocrinologicalasset regarding cortisol and testosterone and the consequent suppressed rates of muscular proteinsynthesis and reduced circulating levels of amino acids, suggest that long-term muscular adaptationscould be impaired.
49

J. Funct. Morphol. Kinesiol. 2019, 4, 41
A trend of heart rate increase following the exercise intervention has been detected, however nodifference was shown between the ALC and the NO-ALC condition. This conclusion raises differentconcerns since alcohol acts as a diuretic and it contributes to faster elimination of water content fromthe bloodstream, leading to increased viscous blood plasma which is harder to pump and deliver tothe body tissues [31]. The heart has to adapt to these conditions to increase the cardiac output. Thereseems to be a dose response relationship between the alcohol consumption and heart rate i.e., there is apositive correlation between alcohol consumption and heart rate response [32]. Consequently, this hasthe potential to alter individual RPE [33]. This latter parameter also seems to not be influenced byalcohol consumption. Only one of the retrieved studies has shown there was a difference betweenthe ALC and NO-ALC group with the ALC group showing less perceived exertion compared to theNO-ALC group.
As previously stated alcohol acts as a diuretic and thus can explain why in the study of Murphyat al [24] the ALC group had an increased total volume output overnight when compared to theNO-ALC group.
One of the most interesting findings of this review was found in the study by Parr et al. [9] whodemonstrated that blood glucose is affected by CHO but not ALC during recovery after RE. This isin alignment with findings of Lustig [34] who claims that toxic effects of alcohol are very similar toexcessive sugar exposure mainly for its fructose content. Even though fructose does not show the sameacute toxic effects of ethanol, it encompasses all the chronic hazardous effects on long-term health [34].
Creatine kinase was also unmodified by ALC consumption. Such enzyme which is presentin the muscles, when detectable in the peripheral circulation, is commonly used as a measure ofmuscle damage [8]. None of the authors which reported measures of CK showed differences betweengroups, instead correlations were established between the ALC and the NO-ALC condition. ALCcannot be considered as a modulating factor for CK following RE and the increases of CK shown arethe result of muscle damage following the exercise bouts. Neither leukocytes nor cytokines seemto be changed following alcohol consumption, which means that the inflammatory response is notmodulated by alcohol consumption. Such is a controversial finding because as reported by differentauthors [35,36] alcohol abuse not only increases inflammation but also alters the immune function ofthe body. Probably healthy individuals, who regularly exercise, as those included in each study ofthis review, do not express altered inflammatory or immune function following a single acute alcoholintoxication. Same trend is shown by CRP, which confirms that muscle damage and inflammation arenot dependent, in the analyzed population, from the ingestion of alcohol [24]. Such findings may alsoexplain why perceived soreness was not different between the ALC and NO-ALC groups analyzed.
Cortisol and testosterone levels during post RE when compared between ALC and NO-ALCgroups appear to be altered. On average, the participants who consumed ALC expressed higher levelsof cortisol and lower levels of testosterone in comparison to the NO-ALC group. Decreased levelsof testosterone and increased levels of cortisol are suggested to be indicative for a disturbance in theanabolic-catabolic balance, which likely leads to decreased recovery and therefore, decreased levels ofperformance [24,37]. When present in excessive levels, cortisol is an overall catabolic hormone, whichdecreases lean body and muscle mass and increases energy expenditure [38]. Conversely, testosteroneis an anabolic hormone, which may also explain why in the study of Parr et al. mTOR phosphorylationin the NO-ALC group was higher than the ALC-CHO (76%) and ALC-PRO (54%) group at 2 and 8 hpost-exercise. In addition, also rates of muscle protein synthesis were higher in the NO-ALC groupwhen compared to those who ingested ALC. However, muscle protein synthesis may also appeardecreased because of the decreased plasma levels of AA showed following ALC consumption. Thesefindings can have major implications with regards to the recovery and performance of both non athletesand professional athletes. An acute bout of vigorous RE can result in a transient increase in proteinturnover and until feeding, protein balance remains negative [39,40]. Protein ingestion post exerciseenhances muscle protein synthesis and net protein balance [41] by increasing myofibrillar proteinfraction with RE [42], but as seen in the study of Parr et al. alcohol ingestion after RE has the ability to
50
J. Funct. Morphol. Kinesiol. 2019, 4, 41
disrupt this process. Beyond physical aspects, decreased protein synthesis leads to impaired long-termmemory in humans [43–45], which can be particularly important in professional athletes who havemany cognitive demands with respect to both short and long term memory [17].
In regards to measures of force only study of Barnes et al. [18] showed that following ALCconsumption the levels of isometric, concentric and eccentric torque decreased, while other studies inthis review that measured force production showed no differences between the ALC and NO-ALCgroups during recovery following RE. As depicted in the results section, with respect to muscle functionand force, only study by Barnes et al. has shown that moderate consumption of alcohol can amplify theloss of force associated with strenuous eccentric exercise [18]. This particular study detected significantdecrements in average peak isometric, concentric and eccentric torques at 36 h post-exercise [18].Clearly more research is needed since the outcomes among the mentioned studies are quite distinct.All measures of force were assessed from 2 h to 48 h post RT or ALC ingestion and the measures allappear decreased because of the exercise performed. The retrieved measures of performance returnedto baseline within 2 days following both ALC consumption and the exercise bouts. Same trend isshown for the other two measures of performance retrieved: power and muscular endurance whichdecreased following the exercise bouts in both groups with no difference between those who consumedALC and those who did not.
Several limitations have been encountered during the realization of this manuscript. Firstly, avery limited body of evidence was present within each screened database, on the topic of alcoholconsumption following bouts of RE, therefore it is not possible to consider such review comprehensiveand definitive. Few studies have evaluated in depth biological measures of protein synthesis or specificmarkers of muscular function. Other important limitation is the timely evaluation of each study. Eachincluded measure was evaluated in a timeframe ranging from 2 h to 48h post exercise or alcoholconsumption. Therefore, only acute modifications were evaluated and it was not possible to considerhormonal fluctuations beyond 2 days and their relative effects. Lastly, the total sample size of eachstudy was small ranging between 8 and 19 participants.
5. Conclusions
Alcohol consumption following resistance exercise doesn’t seem to affect the majority of theretrieved biological and physical measures. However, levels of cortisol were increased, and levelstestosterone and rates of muscle protein synthesis were decreased, which indicates that long termmuscular adaptations could be impaired if alcohol consumption during recovery is consistent. Musclefunction doesn’t seem to be influenced by alcohol consumption during recovery. Studies with largercohorts evaluating the effects of alcohol consumption during recovery following resistance exercise areneeded to further understand the long-term effects of alcohol ingestion.
Supplementary Materials: Supplementary materials can be found at http://www.mdpi.com/2411-5142/4/3/41/s1.
Author Contributions: Conceptualization, N.L.; Methodology, N.L.; Writing – Original Draft Preparation, N.L.;Writing – Review & Editing, N.L;
Funding: This research received no external funding.
Acknowledgments: I would like to thank Kaltrina Feka and Valerio Giustino from PhD program in HealthPromotion and Cognitive Sciences at University of Palermo for helping me to do the article search and assess riskof bias.
Conflicts of Interest: The author declares no conflict of interest.
References
1. Schoenfeld, B. Science and Development of Muscle Hypertrophy. 2016. Available online: http://public.eblib.com/choice/publicfullrecord.aspx?p=4746185 (accessed on 13 May 2019).
2. Kraemer, W.; Ratamess, N. Physiology of resistance training: Current issues. Orthop. Physic. Ther. Clin. N.Am. 2000, 9, 467–513.
51
J. Funct. Morphol. Kinesiol. 2019, 4, 41
3. Harries, S.K.; Lubans, D.R.; Callister, R. Resistance training to improve power and sports performance inadolescent athletes: A systematic review and meta-analysis. J. Sci. Med. Sport 2012, 15, 532–540. [CrossRef][PubMed]
4. American College of Sports. American College of Sports Medicine position stand. Progression models inresistance training for healthy adults. Med. Sci. Sports Exerc. 2009, 41, 687–708. [CrossRef] [PubMed]
5. Hausswirth, C. Recovery for Performance in Sport; Human Kinetics: Champaign, IL, USA, 2019.6. Barnett, A. Using recovery modalities between training sessions in elite athletes: Does it help? Sports Med.
2006, 36, 781–796. [CrossRef] [PubMed]7. Halson, S. Recovery techniques for athletes. Aspetar Sports Med. J. 2013, 26, 1–6.8. Vella, L.D.; Cameron-Smith, D. Alcohol, athletic performance and recovery. Nutrients 2010, 2, 781–789.
[CrossRef]9. Parr, E.B.; Camera, D.M.; Areta, J.L.; Burke, L.M.; Phillps, S.M.; Hawley, J.A.; Coffey, V.G. Alcohol ingestion
impairs maximal post-exercise rates of myofibrillar protein synthesis following a single bout of concurrenttraining. PLoS ONE 2014, 9, e88384. [CrossRef] [PubMed]
10. Barnes, M.J. Alcohol: Impact on sports performance and recovery in male athletes. Sports Med. 2014, 44,909–919. [CrossRef] [PubMed]
11. Mager, A. ’White liquor hits black livers’: Meanings of excessive liquor consumption in South Africa in thesecond half of the twentieth century. Soc. Sci. Med. 2004, 59, 735–751. [CrossRef]
12. Miguez, H.A. Epidemiology of alcohol consumption in Argentina. Vertex 2003, 14, 19–26.13. Pretorius, L.; Naidoo, A.; Reddy, S.P. “Kitchen cupboard drinking”: A review of South African women’s
secretive alcohol addiction, treatment history, and barriers to accessing treatment. Soc. Work Public Health2009, 24, 89–99. [CrossRef] [PubMed]
14. Rachdaoui, N.; Sarkar, D.K. Effects of alcohol on the endocrine system. Endocrinol. Metab. Clin. N. Am. 2013,42, 593–615. [CrossRef] [PubMed]
15. Lang, C.H.; Pruznak, A.M.; Nystrom, G.J.; Vary, T.C. Alcohol-induced decrease in muscle protein synthesisassociated with increased binding of mTOR and raptor: Comparable effects in young and mature rats. Nutr.Metab. 2009, 6, 4. [CrossRef] [PubMed]
16. Vary, T.C.; Frost, R.A.; Lang, C.H. Acute alcohol intoxication increases atrogin-1 and MuRF1 mRNA withoutincreasing proteolysis in skeletal muscle. Am. J. Physiol. Regul. Integr. Comp. Physiol. 2008, 294, R1777–R1789.[CrossRef] [PubMed]
17. Downs, S.H.; Black, N. The feasibility of creating a checklist for the assessment of the methodological qualityboth of randomised and non-randomised studies of health care interventions. J. Epidemiol. Commun. Health1998, 52, 377–384. [CrossRef] [PubMed]
18. Barnes, M.J.; Mundel, T.; Stannard, S.R. Acute alcohol consumption aggravates the decline in muscleperformance following strenuous eccentric exercise. J. Sci. Med. Sport 2010, 13, 189–193. [CrossRef] [PubMed]
19. Barnes, M.J.; Mundel, T.; Stannard, S.R. The effects of acute alcohol consumption on recovery from a simulatedrugby match. J. Sports Sci. 2012, 30, 295–304. [CrossRef] [PubMed]
20. Clarkson, P.M.; Reichsman, F. The effect of ethanol on exercise-induced muscle damage. J. Stud. Alcohol 1990,51, 19–23. [CrossRef]
21. Haugvad, A.; Haugvad, L.; Hamarsland, H.; Paulsen, G. Ethanol Does Not Delay Muscle Recovery, butDecreases the Testosterone: Cortisol Ratio. Med. Sci. Sports Exerc. 2014, 46, 2175–2183. [CrossRef]
22. Levitt, D.E.; Hiu-Ying, L.; Duplanty, A.A.; McFarlin, B.K.; Hill, D.W.; Vingreen, J.L. Effect of alcohol aftermuscle-damaging resistance exercise on muscular performance recovery and inflammatory capacity inwomen. Eur. J. Appl. Physiol. 2017, 117, 1195–1206. [CrossRef]
23. McLeay, Y.; Stannard, S.R.; Mundel, L.; Foskett, A.; Barnes, M. Effect of Alcohol Consumption on RecoveryFrom Eccentric Exercise Induced Muscle Damage in Females. Int. J. Sport. Nutr. Exerc. Metab. 2017, 27,115–121. [CrossRef] [PubMed]
24. Murphy, A.P.; Snape, A.E.; Minett, G.M.; Skein, M.; Duffield, R. The effect of post-match alcohol ingestion onrecovery from competitive rugby league matches. J. Strength Cond. Res. 2013, 27, 1304–1312. [CrossRef][PubMed]
25. Poulsen, M.B.; Jakobsen, J.; Aagaard, N.K.; Andersen, H. Motor performance during and following acutealcohol intoxication in healthy non-alcoholic subjects. Eur. J. Appl. Physiol. 2007, 101, 513–523. [CrossRef][PubMed]
52

J. Funct. Morphol. Kinesiol. 2019, 4, 41
26. Vingren, J.L.; Hill, D.W.; Buddhadev, H.; Duplanty, A. Postresistance exercise ethanol ingestion and acutetestosterone bioavailability. Med. Sci. Sports Exerc 2013, 45, 1825–1832. [CrossRef] [PubMed]
27. Barnes, M.J.; Mundel, T.; Stannard, S.R. Post-exercise alcohol ingestion exacerbates eccentric-exercise inducedlosses in performance. Eur. J. Appl. Physiol. 2010, 108, 1009–1014. [CrossRef] [PubMed]
28. Levitt, D.E.; Idemudia, N.O.; Cregar, C.M.; Duplanty, A.A.; Hill, D.W.; Vingreen, J.L. Alcohol after ResistanceExercise Does not Affect Muscle Power Recovery. J. Strength Cond. Res. 2018. [CrossRef]
29. Kalinowski, A.; Humphreys, K. Governmental standard drink definitions and low-risk alcohol consumptionguidelines in 37 countries. Addiction 2016, 111, 1293–1298. [CrossRef] [PubMed]
30. Jones, A.W. Excretion of alcohol in urine and diuresis in healthy men in relation to their age, the doseadministered and the time after drinking. Forensic Sci. Int. 1990, 45, 217–224. [CrossRef]
31. Brunner, S.; Herber, R.; Drobesch, C.; Peters, A.; Massberg, S.; Kaab, S.; Sinner, M.F. Alcohol consumption,sinus tachycardia, and cardiac arrhythmias at the Munich Octoberfest: Results from the Munich Beer RelatedElectrocardiogram Workup Study (MunichBREW). Eur. Heart J. 2017, 38, 2100–2106. [CrossRef]
32. Borg, G.; Domserius, M.; Kaijser, L. Effect of alcohol on perceived exertion in relation to heart rate and bloodlactate. Eur. J. Appl. Physiol. Occup. Physiol. 1990, 60, 382–384. [CrossRef] [PubMed]
33. Lustig, R.H. Fructose: It’s “alcohol without the buzz”. Adv. Nutr. 2013, 4, 226–235. [CrossRef] [PubMed]34. Kelley, K.W.; Dantzer, R. Alcoholism and inflammation: Neuroimmunology of behavioral and mood
disorders. Brain Behav. Immun. 2011, 25, S13–S20. [CrossRef] [PubMed]35. Wang, H.J.; Zakhari, S.; Jung, M.K. Alcohol, inflammation, and gut-liver-brain interactions in tissue damage
and disease development. World J. Gastroenterol. 2010, 16, 1304–1313. [CrossRef] [PubMed]36. Hoogeveen, A.R.; Zonderland, M.L. Relationships between testosterone, cortisol and performance in
professional cyclists. Int. J. Sports Med. 1996, 17, 423–428. [CrossRef] [PubMed]37. Tataranni, P.A.; Larson, D.E.; Snitker, S.; Young, J.B.; Flatt, J.P.; Ravussin, E. Effects of glucocorticoids on
energy metabolism and food intake in humans. Am. J. Physiol. 1996, 271, E317–E325. [CrossRef] [PubMed]38. Phillips, S.M.; Van Loon, L.J. Dietary protein for athletes: From requirements to optimum adaptation. J.
Sports Sci. 2011, 29, S29–S38. [CrossRef] [PubMed]39. Rasmussen, B.B.; Tipton, K.D.; Miller, S.L.; Wolf, S.E.; Wolfe, R.R. An oral essential amino acid-carbohydrate
supplement enhances muscle protein anabolism after resistance exercise. J. Appl. Physiol. 2000, 88, 386–392.[CrossRef]
40. Kraemer, W.J.; Volek, J.S.; Bush, J.A.; Putukian, M.; Sebastianelli, W.J. Hormonal responses to consecutivedays of heavy-resistance exercise with or without nutritional supplementation. J. Appl. Physiol. 1998, 85,1544–1555. [CrossRef]
41. Wilkinson, S.B.; Phillips, S.M.; Atherton, P.J.; Patel, R.; Yarasheski, K.E.; Tarnopolsky, M.A.; Rennie, M.J.Differential effects of resistance and endurance exercise in the fed state on signalling molecule phosphorylationand protein synthesis in human muscle. J. Physiol. 2008, 586, 3701–3717. [CrossRef]
42. Gibbs, M.E.; Ng, K.T. Psychobiology of memory: Towards a model of memory formation. Biobehav. Rev.1977, 1, 113–136. [CrossRef]
43. Davis, H.P.; Spanis, C.W.; Squire, L.R. Inhibition of cerebral protein synthesis: Performance at different timesafter passive avoidance training. Pharmacol. Biochem. Behav. 1976, 4, 13–16. [CrossRef]
44. Hernandez, P.J.; Abel, T. The role of protein synthesis in memory consolidation: Progress amid decades ofdebate. Neurobiol. Learn. Mem. 2008, 89, 293–311. [CrossRef] [PubMed]
45. Faubert, J. Professional athletes have extraordinary skills for rapidly learning complex and neutral dynamicvisual scenes. Sci. Rep. 2013, 3, 1154. [CrossRef] [PubMed]
© 2019 by the author. Licensee MDPI, Basel, Switzerland. This article is an open accessarticle distributed under the terms and conditions of the Creative Commons Attribution(CC BY) license (http://creativecommons.org/licenses/by/4.0/).
53


Journal of
Functional Morphology and Kinesiology
Article
Acute Cardiometabolic Responses to Multi-ModalIntegrative Neuromuscular Training in Children
Avery D. Faigenbaum *, Jie Kang, Nicholas A. Ratamess, Anne C. Farrell, Mina Belfert,
Sean Duffy, Cara Jenson and Jill Bush
Department of Health and Exercise Science, The College of New Jersey, Ewing, NJ 08628, USA;[email protected] (J.K.); [email protected] (N.A.R.); [email protected] (A.C.F.); [email protected] (M.B.);[email protected] (S.D.); [email protected] (C.J.); [email protected] (J.B.)* Correspondence: [email protected]; Tel.: +1-609-771-2151
Received: 10 May 2019; Accepted: 21 June 2019; Published: 24 June 2019���������������
Abstract: Integrative neuromuscular training (INT) has emerged as an effective strategy forimproving health- and skill-related components of physical fitness, yet few studies have exploredthe cardiometabolic demands of this type of training in children. The aim of this study was toexamine the acute cardiometabolic responses to a multi-modal INT protocol and to compare theseresponses to a bout of moderate-intensity treadmill (TM) walking in children. Participants (n = 14,age 10.7 ± 1.1 years) were tested for peak oxygen uptake (VO2) and peak heart rate (HR) on a maximalTM test and subsequently participated in two experimental conditions on nonconsecutive days:a 12-min INT protocol of six different exercises performed twice for 30 s with a 30 s rest intervalbetween sets and exercises and a 12-min TM protocol of walking at 50% VO2peak. Throughout theINT protocol mean VO2 and HR increased significantly from 14.9 ± 3.6 mL·kg−1·min−1 (28.2% VO2
peak) to 34.0 ± 6.4 mL·kg−1·min−1 (64.3% VO2 peak) and from 121.1 ± 9.0 bpm (61.0% HR peak) to183.5 ± 7.9 bpm (92.4% HR peak), respectively. While mean VO2 for the entire protocol did not differbetween INT and TM, mean VO2 and HR during selected INT exercises and mean HR for the entireINT protocol were significantly higher than TM (all Ps ≤ 0.05). These findings suggest that INT canpose a moderate to vigorous cardiometabolic stimulus in children and selected INT exercises can beequal to or more metabolically challenging than TM walking.
Keywords: Heart rate; interval training; metabolism; oxygen consumption; physical activity;resistance training; strength training; youth
1. Introduction
A growing number of children and adolescents fail to accumulate at least 60 min of moderate tovigorous physical activity (MVPA) daily [1]. The far-reaching consequences of physical inactivity duringchildhood and adolescence are a constellation of cardiometabolic, musculoskeletal, and psychosocialrisk factors and diseases that are challenging to manage, difficult to treat and costly to individualsand society [2]. Current efforts to increase MVPA in youth with targeted interventions have had onlya small effect [3]. Notably, the impact of walking interventions on physical activity behaviors andhealth-related fitness measures in school-age youth have been limited [4–6]. While walking is a naturalform of physical activity that is practical and inexpensive, other types of exercise may be neededto enhance cardiometabolic health, target neuromuscular deficiencies, and increase participation inMVPA. The importance of integrating different types of resistance exercise into youth fitness programshas become particularly important in light of secular declines in measures of muscular strength andpower in modern day youth [7,8]. The available evidence supports a link between muscular fitnessand physical activity, particularly vigorous intensity physical activity, in children and adolescents [9].
J. Funct. Morphol. Kinesiol. 2019, 4, 39; doi:10.3390/jfmk4020039 www.mdpi.com/journal/jfmk55

J. Funct. Morphol. Kinesiol. 2019, 4, 39
Integrative neuromuscular training (INT) is a type of exercise characterized by intermittent boutsof different strength- and skill-building exercises that are designed to improve fundamental movementskills, increase muscular fitness and prepare participants for exercise and sport activities [10]. INT hasemerged as an effective strategy for improving health- and skill-related components of physical fitnessin school-age youth, [11–13], and limited evidence suggests that this type of training may also offercardiometabolic benefits [14,15]. Previous studies investigating the effects of INT on children havefound significant improvements in sprinting, running, jumping, throwing and lifting performancefollowing 8 to 10 weeks of training [11,12,16]. However, it is also important to examine the acutecardiometabolic responses to INT because the amount of time youth spend in vigorous physicalactivity is more strongly associated with positive health outcomes than light or moderate-intensityphysical activity [17–19]. An analysis of accelerometer data from a large sample of children foundvigorous physical activity was strongly associated with metabolic health whereas associations of lightto moderate physical activity were weak to moderate [18]. While research evidence supports the safety,efficacy and feasibility of INT for children [11,12,16], the acute cardiometabolic responses to INT arepoorly understood.
Researchers examined the acute cardiometabolic responses to a single-mode interval trainingprotocol with medicine balls [14] or battling ropes [15] in children and found that this type of exercisecan pose a potent cardiometabolic stimulus. For example, mean heart rate (HR) and oxygen uptake(VO2) values during a 10-min bout of medicine ball interval training ranged from 61.1% to 89.6% ofHR peak and from 28.2% to 63.5% of VO2 peak [14]. Similarly, others found that the acute responses toa 12-min session of resistance training or intermittent noncontact boxing in early adolescents could becharacterized as “vigorous” and therefore contribute to daily moderate to vigorous physical activity(MVPA) recommendations [20]. Due to the increasing interest in high-intensity interval training andthe potential for multi-modal INT to modulate disease risk factors and improve health outcomes inyouth [10,21,22], there is strong rational to further examine the acute cardiometabolic responses toINT in youth. Of relevance to the current study, strategic efforts to strengthen and improve physicaleducation and physical activity opportunities with novel and time efficient exercise interventions areneeded to increase MVPA in school-age youth and foster a healthy generation [23].
To the authors’ knowledge, no previous study has examined the acute cardiometabolic responses tomulti-modal INT in children and direct comparisons between INT and traditional exercise interventionssuch as walking have not been reported. While brisk walking can offer health benefits for children,INT has been found to enhance cardiometabolic health and neuromuscular fitness in youth [11–13].Additional research on the acute responses to INT could be used to establish preliminary cardiometabolicreferences values for INT and inform the design of novel exercise interventions for children. Therefore,the purpose of this study was to examine the acute cardiometabolic responses to a multi-modalINT protocol in children and to compare these responses to a bout of moderate-intensity treadmillwalking. Based on previous findings regarding the acute cardiometabolic responses to different exercisemodalities in youth [14,15], we hypothesized that selected INT exercises would elicit a cardiometabolicresponse that was equal to or greater than brisk walking in children.
2. Materials and Methods
2.1. Participants
A convenience sample of 14 healthy children (8 boys and 6 girls; mean ± SD age 10.7 ± 1.1 years;height 143.2 ± 6.8 cm and body mass 36.3 ± 9.9 kg) volunteered to participate in this study. Participantswere active members of local sports teams (primarily soccer and lacrosse), but none participatedregularly in resistance training. Parents completed a modified physical activity readiness questionnaireto evaluate the health status of the participants and assess the safety for performing vigorous exercise.All parents signed a parental permission form and all participants signed a child assent form and were
56

J. Funct. Morphol. Kinesiol. 2019, 4, 39
informed of the benefits and risks of this investigation. This study was approved by the InstitutionalReview Board at The College of New Jersey (process No: 2017-0080, 7 February 2018).
2.2. Peak Aerobic Capacity Testing
All participants reported to the Human Performance Laboratory at least 2 h postprandial for peakaerobic capacity testing. VO2 peak was assessed using the Fitkids treadmill test protocol [24] and ametabolic system (MedGraphics ULTIMA Metabolic System, MedGraphics Corporation, St. Paul, MN,USA). The Fitkids treadmill test is a valid and reproducible exercise test for children that consists of 90 sstages with incremental increases in speed and incline until volitional exhaustion [24]. Breath-by-breathVO2 data were obtained and VO2 peak was determined by recording the highest measure observedduring the test [25]. HR was monitored using a soft chest strap with a HR sensor (Model A300; PolarElectro Inc., Woodbury, NY, USA). HR peak was defined as the highest value achieved during the test.Participants were asked to manually signal without verbalizing their rating of perceived exertion (RPE)during the test [26]. Prior to testing, height was measured to the nearest 0.1 cm using a wall-mountedstadiometer and body mass was measured to the nearest 0.5 kg using an electronic scale. For bothmeasurements, participants wore light cloths and no shoes.
2.3. Integrative Neuromuscular Training Protocol
Participants returned to the Human Performance Laboratory to perform the INT protocol within2 to 7 days of the peak aerobic capacity test. The INT protocol used in this study was based onprevious pediatric research [11,14,15,27] and included strength- and skill-building exercises that wereappropriate for children [10]. Our INT protocol consisted of the following six exercises: (1) balanceboard squats (EX1; 15 repetitions), (2) medicine ball squats with toss and catch (EX2; 15 repetitions),(3) BOSU™ planks with side steps (EX3; 20 repetitions), (4) medicine ball forward lunges (EX4;16 repetitions), (5) battling rope double arm waves (EX5; 30 repetitions) and medicine balls slams (EX6;15 repetitions). The 6 INT exercises were performed in successive order with each exercise intervallasting 30 s in duration. Each exercise was performed twice with a rest interval of 30 s in between setsand exercises. The 12 time intervals corresponding to the initiation and termination of each 30 s INTset were carefully monitored and labeled. The total duration of the INT protocol was 12 min (including30 s recovery following the last exercise).
Pilot testing from our center found that a 2.3 kg medicine ball and a 4.1 kg battling rope wereappropriate for children. Participants were asked to follow a specific cadence using a metronome andto try and complete a target number of repetitions during each set. A research assistant performed theINT protocol at the desired cadence with each participant during each set and provided a quick reviewof the upcoming exercise during each rest interval. All participants performed the same exercisesin the same order. Participants were asked to manually indicate their RPE after each INT set on avisually presented scale consisting of verbal expressions with a numerical response range of 0 to 10 andfive pictorial descriptors that represent a child at varying levels of exertion [26]. Participants becamefamiliar with the INT protocol during a familiarization session which took place after the peak aerobiccapacity test. During the familiarization session participants practiced each INT exercise and propertechnique was reinforced with exercise-specific coaching cues.
2.4. Treadmill Protocol
Participants performed the TM trial 2 to 7 days after the INT protocol. The TM protocol used inthis study was designed to be a moderate-intensity walking protocol that is consistent with generalphysical activity recommendations for school-age children [28,29]. Participants walked briskly at apredetermined exercise intensity of 50% VO2 peak for 12 min. The speed and grade of the treadmill wereadjusted to maintain the desired exercise intensity throughout the 12-min session. Cardiometabolicdata were collected during the same 30 s time intervals as INT. Participants were asked to manuallyindicate their RPE during the TM trial [26].
57

J. Funct. Morphol. Kinesiol. 2019, 4, 39
2.5. Experimental Measurements: Oxygen Uptake and Heart Rate
VO2 and HR were measured at rest and throughout the INT and TM protocols following similarexperimental procedures. On arrival, each participant was asked to drink water ad libitum to prehydrateand was fitted with the same child-size respiratory mask and heart rate monitor used for the maximalaerobic capacity test. HR data were downloaded for analysis using a computer software program.HR data analyzed were the mean values collected during each 30-s time interval throughout the12-min INT and TM protocols. Breath-by-breath VO2 was measured during the INT and TM protocolsusing the same metabolic system used for maximal aerobic capacity testing. Values for relative VO2,minute ventilation (VE) and respiratory exchange ratio (RER) were recorded during the entire protocol.Individual breath-by-breath data points for all metabolic variables were averaged for each 30 s interval.Prior to each trial, each participant sat quietly in a chair for 5 min to collect baseline data. Once complete,the researcher briefly reviewed session instructions. Subsequently, each participant performed 2 to3 min of calisthenics (e.g., arm circles and knee lifts) prior to INT or 2 to 3 min of low intensity walkingprior to TM. Verbal encouragement was provided throughout the INT and TM trials.
2.6. Statistical Analysis
Descriptive statistics (mean ± SD) were calculated for all dependent variables. For each protocol,the mean values for VO2, VE, RER, and HR were averaged every 30 s in time-match intervals as wellas for the entire 12-min protocol. A 2 (INT or TM) × 12 (time interval sets) analysis of variance withrepeated measures was used to analyze within and between participant cardiometabolic and RPE data.A significant F ratio was followed by pairwise comparisons to detect differences between INT and TMat a given time interval using Bonferroni’s adjustments. In addition, a dependent t-test was used tocompare mean VO2, VE, RER, and HR of the entire protocol between INT and TM. For all statisticaltests, a probability level of p < 0.05 denoted statistical significance. Statistical analyses were conductedin SPSS (version 24; SPSS, Chicago, IL, USA).
3. Results
All participants completed study procedures and no injuries or unexpected events occurred. Ourpost hoc comparisons revealed a progressive increase in cardiometabolic demand as VO2, VE, RER, andHR increased significantly throughout our multi-exercise INT protocol. During the INT protocol meanHR significantly increased from 121.1 ± 9.0 b·min−1 to 183.5 ± 7.9 b·min−1 and mean VO2 significantlyincreased from 14.9 ± 3.6 mL·kg−1·min−1 to 34.0 ± 6.4 mL·kg−1·min−1 (Table 1). Values for HR, VE,and RER tended to increase with each successive INT exercise and paralleled VO2 data. Mean VO2
and HR during EX5 and EX6 of the INT protocol were significantly higher than during time-matchedTM intervals (Table 1) (all Ps < 0.05). Figure 1; Figure 2 depict the gradual increase in HR and VO2,respectively, during the INT protocol as compared to TM.
58

J.Fu
nct.
Mor
phol
.Kin
esio
l.2019,4
,39
Ta
ble
1.
Car
diom
etab
olic
resp
onse
sdu
ring
inte
grat
ive
neur
omus
cula
rtr
aini
ng(I
NT)
and
trea
dmill
(TM
)wal
king
.
Inte
rval
(min
)IN
TE
X/s
et
VO
2V
EH
RR
ER
INT
TM
INT
TM
INT
TM
INT
TM
1(0
–0.5
)1/
114
.9±3
.6b−
l19
.2±2
.514
.9±4
.5b−
l16
.8±2
.512
1.1±9
.0b−
d,g−
l12
1.1±1
1.7
0.88±0
.07
j−l0.
82±0
.05
2(1
.0–1
.5)
1/2
19.7±3
.9a,
d,h−
l23
.4±3
.719
.7±6
.6a,
d,e,
h−l
20.8±4
.512
9.6±1
0.9
a,c−
d,g−
l13
3.8±1
2.2
0.88±0
.08
j−l0.
85±0
.06
3(2
.0–2
.5)
2/1
23.9±8
.2a,
j−l25
.4±5
.724
.7±7
.7a,
i−l
23.8±6
.013
9.1±1
1.6
a,b,
d,i−
l13
9.3±1
3.7
0.90±0
.07
j−l0.
89±0
.04
4(3
.0–3
.5)
2/2
25.2±6
.3a,
b,j−l
25.8±6
.627
.9±9
.2a,
b,j−l
24.2±6
.614
7.3±1
2.4
a−c,
i−l
146.
0±1
4.5
0.93±0/0
7j−l
0.90±0
.05
5(4
.0–4
.5)
3/1
23.2±4
.7a,
j−l26
.6±5
.626
.7±9
.5a,
b,i−
l25
.4±7
.013
8.4±1
9.0
i−l
145.
1±1
6.1
0.96±0
.07
j−l0.
90±0
.06
6(5
.0–5
.5)
3/2
20.5±4
.3a,
h−l
26.4±5
.3*
23.4±9
.4a,
h−l
25.0±6
.913
4.3±1
6.5
i−l
148.
1±1
6.2
0.94±0
.06
j−l0.
90±0
.06
7(6
.0–6
.5)
4/1
21.2±3
.4a,
h−l
27.2±4
.7*
24.3±9
.1a,
b,i−
l25
.8±5
.814
2.8±1
3.6
a,b,
i−l
150.
0±1
6.4
0.95±0
.07
j−l0.
90±0
.04
8(7
.0–7
.5)
4/2
23.4±4
.2a,
b,f−
l27
.5±4
.9*
26.7±9
.1a,
b,f,i−l
26.6±7
.014
4.8±1
4.0
a,b,
i−l
150.
1±1
6.7
0.90±0
.05
j−l0.
90±0
.05
9(8
.0–8
.5)
5/1
30.9±9
.1a,
b,f,g
27.8±4
.638
.3±1
4.2
a−c,
e−j
26.7±6
.016
7.4±1
0.5
a−h,
j−l15
1.1±1
6.1
0.95±0
.08
j−l0.
91±0
.05
10(9
.0–9
.5)
5/2
34.0±6
.4a−
h27
.6±5
.1*
52.2±1
2.4
a−i
26.4±5
.6*
181.
6±8
.3a−
i,k,
l15
1.3±1
6.7
*1.
15±0
.07
a−i
0.90±0
.05
*
11(1
0–10
.5)
6/1
32.0±5
.4a−
h27
.6±5
.3*
46.2±1
0.2
a−h
26.7±5
.7*
181.
5±9
.0a−
i15
0.5±1
7.2
*1.
12±0
.07
a−i
0.90±0
.05
*
12(1
1–11
.5)
6/2
33.3±6
.0a−
h26
.8±6
.2*
48.6±1
1.0
a−h
25.1±6
.5*
183.
5±7
.9a−
i15
0.4±1
7.3
*1.
07±0
.06
a−i
0.89±0
.05
*
All
valu
esar
em
ean±S
D.E
X=
exer
cise
,VO
2=
oxyg
enup
take
,mL·k
g−1 ·m
in−1
;VE=
min
ute
vent
ilati
on,L/m
in;H
R=
hear
trat
e;R
ER=
resp
irat
ory
exch
ange
rati
o.a
vs.i
nter
val1
;bvs
.in
terv
al2;
cvs
.int
erva
l3;d
vs.i
nter
val4
;evs
.int
erva
l5;f
vs.i
nter
val6
;gvs
.int
erva
l7;h
vs.i
nter
val8
;ivs
.int
erva
l9;j
vs.i
nter
val1
0;k
vs.i
nter
val1
1;l
vs.i
nter
val1
2.*
diff
eren
ttha
nIN
T.p≤0
.05.
59
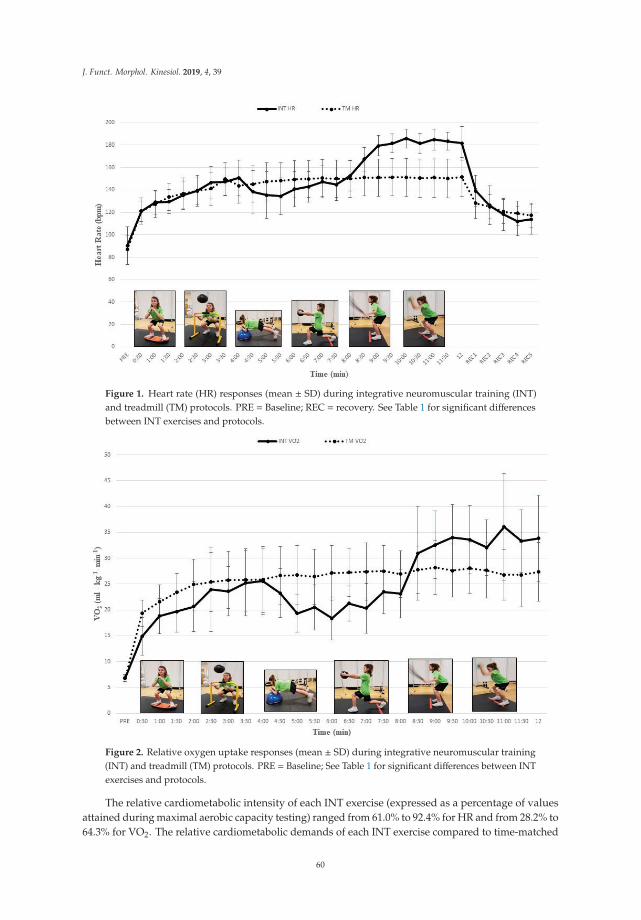
J. Funct. Morphol. Kinesiol. 2019, 4, 39
Figure 1. Heart rate (HR) responses (mean ± SD) during integrative neuromuscular training (INT)and treadmill (TM) protocols. PRE = Baseline; REC = recovery. See Table 1 for significant differencesbetween INT exercises and protocols.
Figure 2. Relative oxygen uptake responses (mean ± SD) during integrative neuromuscular training(INT) and treadmill (TM) protocols. PRE = Baseline; See Table 1 for significant differences between INTexercises and protocols.
The relative cardiometabolic intensity of each INT exercise (expressed as a percentage of valuesattained during maximal aerobic capacity testing) ranged from 61.0% to 92.4% for HR and from 28.2% to64.3% for VO2. The relative cardiometabolic demands of each INT exercise compared to time-matched
60

J. Funct. Morphol. Kinesiol. 2019, 4, 39
TM time intervals are outlined on Table 2. The significant increases in cardiometabolic responsesduring INT mirrored significant increases in RPE. The mean RPEs (out of 10) for INT EX1 to EX6 were1.14 ± 0.85, 2.26 ± 0.98, 2.91 ± 1.04, 3.55 ± 1.23, 5.42 ± 1.45 and 6.68 ± 1.67, respectively. There was nosignificant difference in mean VO2 between the entire 12-min INT and TM protocols; however, meanvalues for HR, VE and RER for the entire 12-min protocol were significantly higher during INT thanTM (all Ps < 0.05) (Table 3). The mean VO2 throughout the 12-min TM protocol was 49.5% of VO2 peakattained during maximal aerobic capacity testing.
Table 2. Relative cardiometabolic intensity during integrative neuromuscular training (INT) andtreadmill (TM) walking intervals.
Interval (min) INT EX/Set% VO2 Peak %HR Peak
INT TM INT TM
1(0–0.5) 1/1 28.2 36.3 61.0 61.0
2(1.0–1.5) 1/2 37.2 44.2 65.3 67.4
3(2.0–2.5) 2/1 45.1 48.0 70.1 70.1
4(3.0–3.5) 2/2 47.6 48.8 74.2 73.5
5(4.0–4.5) 3/1 43.8 50.2 69.7 73.1
6(5.0–5.5) 3/2 38.7 49.9 67.6 74.6
7(6.0–6.5) 4/1 40.0 51.4 71.9 75.6
8(7.0–7.5) 4/2 44.2 52.0 72.9 75.6
9(8.0–8.5) 5/1 58.4 52.5 84.3 76.1
10(9.0–9.5) 5/2 64.3 52.2 91.5 76.2
11(10–10.5) 6/1 60.5 52.2 91.4 75.8
12(11–11.5) 6/2 62.9 50.7 92.4 75.8
Table 3. Mean cardiometabolic responses during the entire 12 min integrative neuromuscular training(INT) and treadmill (TM) protocols.
INT TM
VO2(mL·kg−1·min−1) 25.4 ± 4.5 26.2 ± 4.5
VE(l·min−1) 29.79 ± 8.0 24.7 ± 5.5 *
HR(beats·min−1) 153.4 ± 10.6 145.2 ± 15.0 *
RER 0.96 ± 0.04 0.89 ± 0.05 *
All values are mean ± SD. * different than INT. p ≤ 0.05.
61
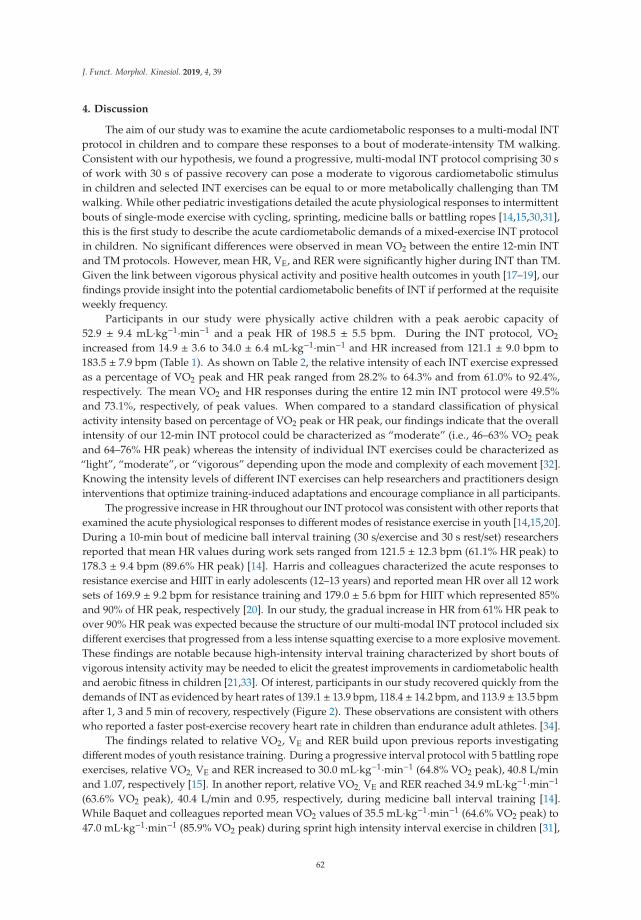
J. Funct. Morphol. Kinesiol. 2019, 4, 39
4. Discussion
The aim of our study was to examine the acute cardiometabolic responses to a multi-modal INTprotocol in children and to compare these responses to a bout of moderate-intensity TM walking.Consistent with our hypothesis, we found a progressive, multi-modal INT protocol comprising 30 sof work with 30 s of passive recovery can pose a moderate to vigorous cardiometabolic stimulusin children and selected INT exercises can be equal to or more metabolically challenging than TMwalking. While other pediatric investigations detailed the acute physiological responses to intermittentbouts of single-mode exercise with cycling, sprinting, medicine balls or battling ropes [14,15,30,31],this is the first study to describe the acute cardiometabolic demands of a mixed-exercise INT protocolin children. No significant differences were observed in mean VO2 between the entire 12-min INTand TM protocols. However, mean HR, VE, and RER were significantly higher during INT than TM.Given the link between vigorous physical activity and positive health outcomes in youth [17–19], ourfindings provide insight into the potential cardiometabolic benefits of INT if performed at the requisiteweekly frequency.
Participants in our study were physically active children with a peak aerobic capacity of52.9 ± 9.4 mL·kg−1·min−1 and a peak HR of 198.5 ± 5.5 bpm. During the INT protocol, VO2
increased from 14.9 ± 3.6 to 34.0 ± 6.4 mL·kg−1·min−1 and HR increased from 121.1 ± 9.0 bpm to183.5 ± 7.9 bpm (Table 1). As shown on Table 2, the relative intensity of each INT exercise expressedas a percentage of VO2 peak and HR peak ranged from 28.2% to 64.3% and from 61.0% to 92.4%,respectively. The mean VO2 and HR responses during the entire 12 min INT protocol were 49.5%and 73.1%, respectively, of peak values. When compared to a standard classification of physicalactivity intensity based on percentage of VO2 peak or HR peak, our findings indicate that the overallintensity of our 12-min INT protocol could be characterized as “moderate” (i.e., 46–63% VO2 peakand 64–76% HR peak) whereas the intensity of individual INT exercises could be characterized as“light”, “moderate”, or “vigorous” depending upon the mode and complexity of each movement [32].Knowing the intensity levels of different INT exercises can help researchers and practitioners designinterventions that optimize training-induced adaptations and encourage compliance in all participants.
The progressive increase in HR throughout our INT protocol was consistent with other reports thatexamined the acute physiological responses to different modes of resistance exercise in youth [14,15,20].During a 10-min bout of medicine ball interval training (30 s/exercise and 30 s rest/set) researchersreported that mean HR values during work sets ranged from 121.5 ± 12.3 bpm (61.1% HR peak) to178.3 ± 9.4 bpm (89.6% HR peak) [14]. Harris and colleagues characterized the acute responses toresistance exercise and HIIT in early adolescents (12–13 years) and reported mean HR over all 12 worksets of 169.9 ± 9.2 bpm for resistance training and 179.0 ± 5.6 bpm for HIIT which represented 85%and 90% of HR peak, respectively [20]. In our study, the gradual increase in HR from 61% HR peak toover 90% HR peak was expected because the structure of our multi-modal INT protocol included sixdifferent exercises that progressed from a less intense squatting exercise to a more explosive movement.These findings are notable because high-intensity interval training characterized by short bouts ofvigorous intensity activity may be needed to elicit the greatest improvements in cardiometabolic healthand aerobic fitness in children [21,33]. Of interest, participants in our study recovered quickly from thedemands of INT as evidenced by heart rates of 139.1 ± 13.9 bpm, 118.4 ± 14.2 bpm, and 113.9 ± 13.5 bpmafter 1, 3 and 5 min of recovery, respectively (Figure 2). These observations are consistent with otherswho reported a faster post-exercise recovery heart rate in children than endurance adult athletes. [34].
The findings related to relative VO2, VE and RER build upon previous reports investigatingdifferent modes of youth resistance training. During a progressive interval protocol with 5 battling ropeexercises, relative VO2, VE and RER increased to 30.0 mL·kg−1·min−1 (64.8% VO2 peak), 40.8 L/minand 1.07, respectively [15]. In another report, relative VO2, VE and RER reached 34.9 mL·kg−1·min−1
(63.6% VO2 peak), 40.4 L/min and 0.95, respectively, during medicine ball interval training [14].While Baquet and colleagues reported mean VO2 values of 35.5 mL·kg−1·min−1 (64.6% VO2 peak) to47.0 mL·kg−1·min−1 (85.9% VO2 peak) during sprint high intensity interval exercise in children [31],
62

J. Funct. Morphol. Kinesiol. 2019, 4, 39
differences in exercise characteristics, workload duration and rest interval length can explain, at least inpart, these findings. The progressive increase in RER that reached values above 1.0 which were greaterthan those observed during TM walking further attested to the intense nature of our INT protocol.Collectively, it appears that INT and other types of interval training could be used to bring aboutpositive cardiometabolic adaptations in children.
Our findings demonstrate that INT characterized by short exercise intervals interspersed withbrief rest intervals can pose a moderate to vigorous cardiometabolic stimulus in youth. Unlike briskwalking, INT typically requires the whole body to function as a unit in order to perform movementsproficiently with proper technique at the desired cadence. During our multi-modal INT protocol, thehighest VO2 and HR values were achieved during EX5 (battling rope double arm wave) and EX6(medicine ball slams), respectively. Both of these exercises require a substantial involvement of theupper and lower body since participants vigorously waved a 4.1 kg battling rope with both armsor forcibly slammed a 2.3 kg medicine ball against the floor at maximal or near maximal velocity.Interestingly, Ratamess and colleagues examined the acute cardiometabolic response to 13 differentresistance exercise protocols in adults and found that the battling rope double arm wave elicited thehighest responses [35]. While the greater complexity and muscle mass activation of the INT exercisestowards the end of our protocol suggest that the choice of exercise is a primary determinant of thecardiometabolic responses to INT, the cumulative effects of fatigue and cardiovascular drift during ourINT protocol should also be considered because the cardiometabolic responses to each INT exercisewere likely influenced by the subsequent fatigue from the previous exercise.
The structure of our INT protocol was based on previous fitness interventions with children andincluded 2 sets of 6 different exercises with a 30 s rest interval in between sets and exercises [11,27].Due to the age of the participants and the relative intensity of selected INT exercises, a progressive,multi-modal INT protocol with passive recovery intervals was arguably required to maintain safety,motivation and adherence. Sustained bouts (>10 min) of physical activity are rare in children and thenatural tempo of their activity is characterized by short bursts lasting a few seconds [36]. Furthermore,it is important to note that the objective of our investigation was not to disentangle the acute demandsof each INT exercise, but rather to examine the acute cardiometabolic responses to a novel INT protocoland to compare these responses to a more traditional form of continuous physical activity of comparabletime and overall VO2. Notably, we used a time period of 12 min so that the protocol could be readilyincorporated into a physical education class or sports practice. With that said, the results from ourinvestigation provide preliminary cardiometabolic reference values for a multi-modal INT protocol andhighlight the versatility of INT because different exercises could be combined to offer light, moderate,vigorous or variable intensity training depending on the needs, goals and abilities of the children.
Our findings support the integration of INT into school- and community-based youth fitnessprograms and inform the development of interventions aimed at increasing time spent in MVPA. Theprogressive increase in cardiometabolic intensity throughout the INT protocol was consistent withthe participants perceptions as evidenced by significant increases in RPE. Others found that youthcould rate their perceived exertion during resistance training and our observations support the useof RPE to monitor the intensity of INT in children [20,37]. We also observed that our INT protocolwas challenging and appealing for the participants. This was evidenced by 100% compliance withresearch instructions and testing protocols. Although the affective response to INT were not exploredin our investigation, Malik and colleagues found that enjoyment was higher following high-intensityinterval exercise compared with continuous moderate-intensity exercise in adolescents [38]. Giventhat a child’s level of enjoyment is a strong predictor of physical activity participation [39], furtherexamination of the affective responses to INT are warranted.
The INT exercises used in our investigation were intended to progress from less intense to moreintense. EX1 consisted of squatting on a balance board at a controlled cadence and EX6 requiredparticipants to repeatedly slam a 2.3 kg medicine ball against the floor with energy and vigor. Theseare important considerations when discussing our findings because the cardiometabolic responses
63

J. Funct. Morphol. Kinesiol. 2019, 4, 39
to INT are dependent upon various factors including the intensity of muscle actions, type of muscleactions, the amount of muscle mass used, rest intervals and body position [14,15,40]. In addition, age,fitness level and body mass index can influence the acute cardiometabolic responses to exercise and thekinetics of recovery after exercise [25,34,41]. Children appear to be less susceptible to neuromuscularfatigue than adults following resistance training [42] and the post-exercise decline in VO2 seems to befaster in children with a higher peak VO2 than those with a lower peak VO2 [34,43]. Thus, the resultsof our investigation should be interpreted within the context of a mixed model exercise approach thatreflects how children may actually perform INT during physical education or sports practice.
We acknowledge that the maturity status of the participants was not assessed and therefore wewere unable to determine if all participants were prepubertal. Also, the participants in our studywere active, healthy girls and boys so the homogeneity of our sample limits generalizability to otherpopulations including those with illnesses or disabilities that alter movement or mechanical efficiency.It is also important to consider the design of our INT protocol and the limited INT experience ofour participants. Acute program variables will impact the cardiometabolic responses to INT and aschildren become more skilled and efficient at performing INT exercises the acute cardiometabolicdemands to a given protocol will not be constant. While other pediatric researchers examined theacute cardiometabolic responses to single-mode exercise, the design of our progressive, multi-modalINT protocol arguably provides greater translatability to school- and community-based programs inwhich the physical fitness levels and activity interests of children can vary widely.
5. Conclusions
INT has been investigated as a potentially potent and time efficient method of enhancingneuromuscular fitness in youth [11,12,16] and our novel findings suggest that this innovative trainingmethod consisting of strength- and skill-building exercises could also provide a sufficient trainingstimulus needed to induce cardiometabolic adaptations. Considering the amount of time children spendin MVPA during physical education and youth sport practice is falling short of expectations [44,45],INT could be a worthwhile addition to school- and community-based programs to target exercisedeficits. Unlike continuous bouts of moderate-intensity walking, a progressive INT intervention withbattling rope and medicine ball exercises may better prepare youth for the vigorous intensity natureof game and sport activities. These observations have practical relevance for teachers, coaches andhealth care providers who design exercise programs and sport practices for children. Altogether, theacute cardiometabolic responses to INT along with high compliance to our study procedures providesupport for future training studies to better understand the multidimensional benefits of INT on health,fitness and performance in youth.
Author Contributions: Conceptualization, A.D.F., J.K. and N.A.R.; Formal analysis, A.D.F., J.K., N.A.R. and J.B.;Investigation, A.D.F., J.K., A.C.F., M.B., S.D. and C.J.; Methodology, A.D.F., J.K., M.B., S.D. and C.J.; Resources,A.D.F., J.K., N.A.R., A.C.F. and J.B.; Supervision, A.D.F., J.K. and A.C.F.; Writing—original draft, A.D.F. and J.K.;Writing—review & editing, A.D.F., J.K., N.A.R., A.C.F., M.B., S.D., C.J. and J.B.
Funding: This research received no external funding.
Conflicts of Interest: The authors declare no conflict of interest.
References
1. Aubert, S.; Barnes, J.; Abdeta, C.; Abi Nader, P.; Adeniyi, A.; Aguilar-Farias, N.; Andrade Tenesaca, D.;Bhawra, J.; Brazo-Sayavera, J.; Cardon, G.; et al. Global Matrix 3.0 Physical Activity Report Card Gradesfor Children and Youth: Results and Analysis From 49 Countries. J. Phys. Act. Health 2018, 15, S251–S273.[CrossRef] [PubMed]
2. Faigenbaum, A.; Rial Rebullido, T.; MacDonald, J. The unsolved problem of paediatric physical inactivity:It is time for a new perspective. Acta Paediatr. 2018, 107, 1857–1859. [CrossRef] [PubMed]
64
J. Funct. Morphol. Kinesiol. 2019, 4, 39
3. Metcalf, B.; Henley, W.; Wilkin, T. Effectiveness of intervention on physical activity of children: Systematicreview and meta-analysis of controlled trials with objectively measured outcomes (EarlyBird 54). BMJ 2012,345, e5888. [CrossRef] [PubMed]
4. Carlin, A.; Murphy, M.; Nevill, A.; Gallagher, A. Effects of a peer-led Walking In ScHools intervention (theWISH study) on physical activity levels of adolescent girls: a cluster randomised pilot study. Trials 2018, 19,31. [CrossRef] [PubMed]
5. Villa-González, E.; Ruiz, J.; Mendoza, J.; Chillón, P. Effects of a school-based intervention on active commutingto school and health-related fitness. BMC Public Health 2017, 17, 20. [CrossRef] [PubMed]
6. Ruiz-Hermosa, A.; Martínez-Vizcaíno, V.; Alvarez-Bueno, C.; García-Prieto, J.; Pardo-Guijarro, M.;Sánchez-López, M. No association between active commuting to school, adiposity, fitness, and cognition inSpanish children: The MOVI-KIDS Study. J. Sch. Health 2018, 88, 836–846. [CrossRef] [PubMed]
7. Sandercock, G.; Cohen, D. Temporal trends in muscular fitness of English 10-year-olds 1998–2014: Anallometric approach. J. Sci. Med. Sport 2019, 22, 201–205. [CrossRef] [PubMed]
8. Fraser, B.; Blizzard, L.; Tomkinson, G.; Lycett, K.; Wake, M.; Burgner, D.; Ranganathan, S.; Juonala, M.;Dwyer, T.; Venn, A.; et al. The great leap backward: changes in the jumping performance of Australianchildren aged 11-12-years between 1985 and 2015. J. Sports Sci. 2019, 37, 748–754. [CrossRef]
9. Smith, J.; Eather, N.; Weaver, R.; Riley, N.; Beets, M.; Lubans, D. Behavioral correlates of muscular fitness inchildren and adolescents: A systematic review. Sports Med. 2019. epub ahead of print. [CrossRef]
10. Myer, G.; Faigenbaum, A.; Ford, K.; Best, T.; Bergeron, M.; Hewett, T. When to initiate integrativeneuromuscular training to reduce sports-related injuries and enhance health in youth? Curr. Sports Med. Rep.2011, 10, 155–166. [CrossRef]
11. Faigenbaum, A.; Farrell, A.; Fabiano, M.; Radler, T.; Naclerio, F.; Ratamess, N.; Kang, J.; Myer, G. Effects ofintegrated neuromuscular training on fitness performance in children. Pediatr. Exerc. Sci. 2011, 23, 573–584.[CrossRef]
12. Duncan, M.; Eyre, E.; Oxford, S. The effects of 10 weeks Integrated Neuromuscular Training on fundamentalmovement skills and physical self-efficacy in 6–7 year old children. J. Strength Cond. Res. 2018, 32, 3348–3356.[CrossRef] [PubMed]
13. Foss, K.; Thomas, S.; Khoury, J.; Myer, G.; Hewett, T. A school-based neuromuscular training program andsport-related injury incidence: A prospective randomized controlled clinical trial. J. Athl. Train. 2018, 53,20–28. [CrossRef] [PubMed]
14. Faigenbaum, A.; Kang, J.; Ratamess, N.; Farrell, A.; Ellis, N.; Vought, I.; Bush, J. Acute cardiometabolicresponses to medicine ball interval training in children. Int. J. Exerc. Sci. 2018, 11, 886–899. [PubMed]
15. Faigenbaum, A.; Kang, J.; Ratamess, N.; Farrell, A.; Golda, S.; Stranieri, A.; Coe, J.; Bush, J. Acutecardiometabolic responses to battling rope exercise in children. J. Strength Cond. Res. 2018, 32, 1197–1206.[CrossRef] [PubMed]
16. Panagoulis, C.; Chatzinikolaou, A.; Avloniti, A.; Leontsini, D.; Deli, C.; Draganidis, D.; Stampoulis, T.;Oikonomou, T.; Papanikolaou, K.; Rafailakis, L.; et al. In-season integrative neuromuscular strength trainingimproves performance of early adolescent soccer athletes. J. Strength Cond. Res. 2018. epub before print.[CrossRef]
17. Tarp, J.; Child, A.; White, T.; Westgate, K.; Bugge, A.; Grøntved, A.; Wedderkopp, N.; Andersen, L.; Cardon, G.;Davey, R.; et al. Physical activity intensity, bout-duration, and cardiometabolic risk markers in children andadolescents. Int. J. Obes. (Lond.) 2018, 42, 1639–1650. [CrossRef]
18. Aadland, E.; Andersen, L.; Anderssen, S.; Resaland, G.; Kvalheim, O. Associations of volumes and patternsof physical activity with metabolic health in children: A multivariate pattern analysis approach. Prev. Med.2018, 115, 12–18. [CrossRef]
19. Hamer, M.; Stamatakis, E. Relative proportion of vigorous physical activity, total volume of moderate tovigorous activity, and body mass index in youth: the Millennium Cohort Study. Int. J. Obes. (Lond.) 2018, 42,1239–1242. [CrossRef]
20. Harris, N.; Dulson, D.; Logan, G.; Warbrick, I.; Merien, F.; Lubans, D. Acute responses to resistance andhigh-intensity interval training in early adolescents. J. Strength Cond. Res. 2016, 31, 1177–1186. [CrossRef]
21. Bond, B.; Weston, K.; Williams, C.; Barker, A. Perspectives on high-intensity interval exercise for healthpromotion in children and adolescents. Open Access J. Sports Med. 2017, 8, 243–265. [CrossRef] [PubMed]
65

J. Funct. Morphol. Kinesiol. 2019, 4, 39
22. Thivel, D.; Masurier, J.; Baquet, G.; Timmons, B.; Pereira, B.; Berthoin, S.; Duclos, M.; Aucouturier, J.High-intensity interval training in overweight and obese children and adolescents: systematic review andmeta-analysis. J. Sports Med. Phys. Fitness 2019, 59, 310–324. [CrossRef] [PubMed]
23. Institute of Medicine. Educating the Student Body: Taking Physical Activity and Physical Education to School;The National Academies Press: Washington, DC, USA, 2013.
24. Kotte, E.; DE Groot, J.; Bongers, B.; Winkler, A.; Takken, T. Validity and reproducibility of a new treadmillprotocol: The fitkids treadmill test. Med. Sci. Sports Exerc. 2015, 47, 2241–2247. [CrossRef]
25. Armstrong, N.; McManus, A. Aerobic Fitness. In Oxford Textbook of Children’s Sport and Exercise Medicine,3rd ed.; Armstrong, N., van Mechelen, W., Eds.; Oxford University Press: Oxford, UK, 2017; pp. 161–180.
26. Faigenbaum, A.D.; Milliken, L.A.; Cloutier, G.; Westcott, W.L. Perceived exertion during resistance exerciseby children. Percept. Mot. Skills 2004, 98, 627–637. [CrossRef]
27. Faigenbaum, A.; Bush, J.; McLoone, R.; Kreckel, M.; Farrell, A.; Ratamess, N.; Kang, J. Benefits of strengthand skill-based training during primary school physical education. J. Strength Cond. Res. 2015, 29, 1255–1262.[CrossRef]
28. U.S. Department of Health and Human Services. Physical Activity Guidelines for Americans; U.S. Departmentof Health and Human Services: Washington, DC, USA, 2018; p. 49.
29. Butte, N.; Watson, K.; Ridle, Y.K.; Zakeri, I.; McMurray, R.; Pfeiffer, K.; Crouter, S.; Herrmann, S.; Bassett, D.;Long, A.; et al. A Youth Compendium of Physical Activities: Activity Codes and Metabolic Intensities.Med. Sci. Sports Exerc. 2018, 50, 246–256. [CrossRef]
30. Chuensiri, N.; Tanaka, H.; Suksom, D. The acute effects of supramaximal high-intensity intermittent exerciseon vascular function in lean vs. obese prepubescent boys. Pediatr. Exerc. Sci. 2015, 27, 503–509. [CrossRef][PubMed]
31. Baquet, G.; Gamelin, F.; Aucouturier, J.; Berthoin, S. Cardiorespiratory responses to continuous andintermittent exercise in children. Int. J. Sports Med. 2017, 38, 755–762. [CrossRef]
32. American College of Sports Medicine. ACSM’s Guidelines for Exercise Testing and Prescription, 10th ed.;Lippincott, Williams and Wilkins: Baltimore, MD, USA, 2018.
33. Eddolls, W.; McNarry, M.; Stratton, G.; Winn, C.; Mackintosh, K. High-intensity interval training interventionsin children and adolescents: A systematic review. Sports Med. 2017, 47, 2326–2374. [CrossRef]
34. Birat, A.; Bourdier, P.; Piponnier, E.; Blazevich, A.; Maciejewski, H.; Duché, P.; Ratel, S. Metabolic andfatigue profiles are comparable between prepubertal children and well-trained adult endurance athletes.Front. Pediatr. 2018, 9, 387. [CrossRef]
35. Ratamess, N.; Rosenberg, J.; Klei, S.; Dougherty, B.; Kang, J.; Smith, C.; Ross, R.; Faigenbaum, A. Comparisonof the acute metabolic responses to traditional resistance, body-weight, and battling rope exercise. J. StrengthCond. Res. 2015, 29, 47–57. [CrossRef]
36. Riddoch, C.; Mattocks, C.; Deere, K.; Saunders, J.; Kirkby, J.; Tilling, K.; Leary, S.; Blair, S.; Ness, A. Objectivemeasurement of levels and patterns of physical activity. Arch. Dis. Childhood 2007, 92, 963–969. [CrossRef]
37. Robertson, R.; Goss, F.; Aaron, D.; Nagle, E.; Gallagher, M.; Kane, I.; Tessmer, K.; Schafer, M.; Hunt, S.Concurrent muscle hurt and perceived exertion of children during resistance exercise. Med. Sci. Sports Exerc.2009, 41, 1146–1154. [CrossRef]
38. Malik, A.; Williams, C.; Bond, B.; Weston, K.; Barker, A. Acute cardiorespiratory, perceptual and enjoymentresponses to high-intensity interval exercise in adolescents. Eur. J. Sport Sci. 2017, 17, 1335–1342. [CrossRef]
39. Sebire, S.; Jago, R.; Fox, K.; Edwards, M.; Thompson, J. Testing a self-determination theory model of children’sphysical activity motivation: a cross-sectional study. Int. J. Behav. Nutr. Phys. Act. 2013, 10, 111. [CrossRef]
40. Ratamess, N. ACSM’s Foundations of Strength Training and Conditioning; Lippincott, Williams and Wilkins:Philadelphia, PA, USA, 2012.
41. Nikolaidis, P.; Kintziou, E.; Georgoudis, G.; Afonso, J.; Vancini, R.; Knechtle, B. The effect of body mass indexon acute cardiometabolic responses to graded exercise testing in children: A narrative review. Sports 2018, 6,103. [CrossRef]
42. Murphy, J.; Button, D.; Chaouachi, A.; Behm, D. Prepubescent males are less susceptible to neuromuscularfatigue following resistance exercise. Eur. J. Appl. Physiol. 2014, 114, 825–835. [CrossRef]
43. Singh, T.; Alexander, M.; Gauvreau, K.; Curran, T.; Rhodes, Y.; Rhodes, J. Recovery of oxygen consumptionafter maximal exercise in children. Med. Sci. Sports Exerc. 2011, 43, 555–559. [CrossRef]
66
J. Funct. Morphol. Kinesiol. 2019, 4, 39
44. Hollis, J.; Williams, A.; Sutherland, R.; Campbell, E.; Nathan, N.; Wolfenden, L.; Morgan, P.; Lubans, D.;Wiggers, J. A systematic review and meta-analysis of moderate-to-vigorous physical activity levels inelementary school physical education lessons. Prev. Med. 2016, 86, 34–54. [CrossRef]
45. Schlechter, C.; Rosenkranz, R.; Milliken, G.; Dzewaltowski, D. Physical activity levels during youth sportpractice: Does coach training or experience have an influence? J. Sports Sci. 2017, 35, 22–28. [CrossRef]
© 2019 by the authors. Licensee MDPI, Basel, Switzerland. This article is an open accessarticle distributed under the terms and conditions of the Creative Commons Attribution(CC BY) license (http://creativecommons.org/licenses/by/4.0/).
67


Journal of
Functional Morphology and Kinesiology
Article
Validation of Cardiorespiratory FitnessMeasurements in Adolescents
Pedro Migliano 1 , Laura S. Kabiri 2 , Megan Cross 1, Allison Butcher 1 , Amy Frugé 1,
Wayne Brewer 1 and Alexis Ortiz 3,*
1 School of Physical Therapy, Texas Woman’s University, 6700 Fannin, Houston, TX 77030, USA2 Department of Kinesiology, Rice University, 6100 Main Street, Houston, TX 77005, USA3 Department of Physical Therapy, UT Health San Antonio, 7703 Floyd Curl Dr. San Antonio, TX 78229, USA* Correspondence: [email protected]; Tel.: +1-210-567-8750; Fax: +1-210-567-8774
Received: 28 June 2019; Accepted: 11 July 2019; Published: 13 July 2019���������������
Abstract: Cardiorespiratory fitness (CRF) is an important indicator of adolescent cardiovascularwell-being and future cardiometabolic health but not always feasible to measure. The purpose of thisstudy was to estimate the concurrent validity of the non-exercise test (NET) for adolescents against theProgressive Aerobic Capacity Endurance Run (PACER®) and direct measures of VO2max as well as toexamine the concurrent validity of the PACER® with a portable metabolic system (K4b2™). Forty-sixadolescents (12–17 years) completed the NET prior to performing the PACER® while wearing theK4b2™. The obtained VO2max values were compared using linear regression, intra-class correlation(ICC), and Bland–Altman plots, and α was set at 0.05. The VO2max acquired directly from the K4b2™
was significantly correlated to the VO2max indirectly estimated from the NET (r = 0.73, p < 0.001,r2 = 0.53, ICC = 0.67). PACER® results were significantly related to the VO2max estimates from theNET (r = 0.81, p < 0.001, r2 = 0.65, ICC = 0.72). Direct measures from the K4b2™ were significantlycorrelated to the VO2max estimates from the PACER® (r = 0.87, p < 0.001, r2 = 0.75, ICC = 0.93). TheNET is a valid measure of CRF in adolescents and can be used when an exercise test is not feasible.
Keywords: VO2max; PACER; non-exercise test
1. Introduction
Low cardiorespiratory fitness (CRF) levels in adolescents have been linked to insulin resistanceas well as cardiovascular and cardiometabolic risk factors [1–5]. Higher levels of CRF in adolescentshave also been linked to improved academic outcomes and an improved ability to regulate attentionand behavior [6,7]. There is a strong positive relationship between CRF and cognitive performance,with multiple studies showing that adolescents with higher levels of CRF outperformed their peerswith lower levels of CRF in cognitive tests involving working memory, cognitive flexibility, andinhibition, which is the ability to ignore extraneous environmental information [8–10]. The improvedcognitive ability is thought to be due to the increased volume in different regions of the brain such as thehippocampus and basal ganglia found in adolescents with higher levels of CRF [8,11]. Moreover, higherCRF has been shown to be an excellent predictor of physical activity level during adulthood [12,13].Since CRF is an important health predictor in adolescents, it should be regularly assessed in bothhealthcare and school settings.
Maximal oxygen uptake (VO2max), expressed as mL/kg/min of oxygen, is the gold standardmeasure of CRF and can be measured both directly and indirectly [14,15]. A direct measure ofVO2max is obtained by ventilatory gas analysis during a graded exercise test at maximum exertionand is the most precise measure of VO2max [14]. An indirect measure estimates VO2max from amaximal or submaximal exercise test and is usually estimated from total time, total work, or heart
J. Funct. Morphol. Kinesiol. 2019, 4, 44; doi:10.3390/jfmk4030044 www.mdpi.com/journal/jfmk69
J. Funct. Morphol. Kinesiol. 2019, 4, 44
rate [15]. Especially in school settings, VO2max is often indirectly measured and estimated using afield test. While there are a few different options when it comes to field tests to indirectly measureVO2max, the 20-m multistage shuttle run test (20MSR) is the most frequently used test, as it hasshown moderate to high criterion validity compared to direct measures of VO2max and is a morepractical test compared to longer duration endurance tests, such as the 6-min endurance run [16,17].The Progressive Aerobic Cardiovascular Endurance Run (PACER®) is part of the FitnessGram® testsadministered to adolescents in schools [18]. The PACER® is a 20MSR meant to mimic a maximalexertion exercise test with workloads increasing every stage until the participant reaches volitionalexhaustion. The standardized procedure of the PACER® has participants run between two markersplaced 20 m apart while keeping pace to a prerecorded audio cadence that increases every minute.The test is terminated if a participant fails to reach a marker for the second time or if the participantcan no longer continue. This field test has been shown to be both reliable (intra-class correlation (ICC):0.77–0.93) and valid (r: 0.62–0.83) [16,19,20], when compared to directly measured VO2max during atreadmill maximal exercise test.
It is not always possible to directly assess VO2max in all settings, such as schools, gyms, or even ina clinical setting. Ventilatory gas analysis is time-consuming and requires expensive equipment thatprevents the mass screening which would be required in a school setting or in the daily caseload andtime restraints of a healthcare professional. The non-exercise test (NET) is a paper-based questionnaireused to estimate VO2max from different variables including sex, age, body mass index (BMI), restingheart rate, and self-reported habitual physical activity levels [21,22]. Use of this questionnaire allowsfor both quick and widespread CRF screening without any health risk to the participants. The NEThas been shown to be valid within the adult population [21], but to the best of our knowledge, has notbeen tested within the adolescent population. Therefore, the purpose of this study was to estimate theconcurrent validity of the NET for adolescents against the PACER® test and objective measures ofVO2max as well as to examine the concurrent validity of the VO2max estimated by the PACER® with theVO2max obtained from the Cosmed K4b2™ portable metabolic system (Cosmed K4b2, Cosmed, Rome,Italy) during the PACER® test.
2. Materials and Methods
2.1. Subjects
Adolescents aged 12–17 years were recruited by email, education support groups, co-operatives,and word of mouth. Parents were asked if their child had any physical or mental limitations thatwould prevent them from safely and accurately completing the test and if any were noted, the childwas excluded. Institutional review board approval (Protocol #19736 on 19 January 2017) from TexasWoman’s University in Houston, TX, parental informed consent, and minor assent were secured priorto any subject enrollment or data collection.
2.2. Procedures
Height and weight were assessed barefoot with light clothing using a medical-grade stadiometercalibrated prior to its use. Pubertal level was assessed using the pubertal developmental scale.
Prior to participating in the PACER and being fitted with the K4b2™, participants were giventhe NET questionnaire previously validated in adults by Jurca et al. [21]. As required by the NET,each participant was asked to choose the physical activity level which best described their daily levelof activity, as listed in Table 1. Participant BMI was calculated based on their weight and heightmeasurement. Resting heart rate (RHR) was measured with the SantaMedical SM150BL finger pulseoximeter (SantaMedical, Tustin, CA, USA) as the final measurement after sitting for at least five minutes.
70

J. Funct. Morphol. Kinesiol. 2019, 4, 44
Table 1. Physical Activity Levels for NET.
PhysicalActivity Level
Description Score
1 Inactive or little activity other than usual daily activities. 0.00
2 Regularly (≥5 d/wk) participate in physical activities requiring low levels of exertion thatresult in slight increases in breathing and heart rate for at least 10 min at a time. 0.32
3Participate in aerobic exercises such as brisk walking, jogging or running, cycling,
swimming, or vigorous sports at a comfortable pace or other activities requiring similarlevels of exertion for 20 to 60 min per week.
1.06
4 Participate in aerobic exercises such as brisk walking, jogging or running at a comfortablepace, or other activities requiring similar levels of exertion for 1 to 3 h per week. 1.76
5 Participate in aerobic exercises such as brisk walking, jogging or running at a comfortablepace, or other activities requiring similar levels of exertion for over 3 h per week. 3.03
NET equation: VO2max = 3.5 * ((Sex * 2.77) − (age * 0.1) − (BMI*0.17) − (RHR * 0.03) + (physical activity score * 1.00)+ 18.07); Sex: 0 = F, 1 =M.
The K4b2™ portable metabolic system was used to directly measure VO2max during the PACER®.The K4b2™ has demonstrated high test–retest reliability (ICC = 0.70–0.90) [23] and has shown to be validin VO2 measurement when compared to a traditional stationary gas exchange system (r: 0.93–0.97) [24].The K4b2™ was calibrated according to manufacturer’s recommendations using known gases androom air sampling. After calibration, participants were fitted with a mask and connected to the K4b2™
prior to initiating the PACER®.After donning the K4b2™, adolescents were allowed to wear and familiarize themselves with
the device for 5 min. Participants completed the 20-m PACER® individually as per the standardizedinstructions. Two pieces of tape were placed 20 m apart, denoting the crossing lines for the PACER®,and the FitnessGram® cadence soundtrack was played at a volume loud enough for the participant tohear. Participants were instructed to begin running when they heard the first beep on the soundtrack.For the lap to be valid, each participant was required to clear at least one foot over the line prior tothe next beep. The test was terminated following the second miss or if the participant desired to stop.All raters were trained and followed the standardized test procedures. Once the PACER® had beenterminated, total laps were recorded, the K4b2™ data was saved, and the mask was doffed.
VO2max with the K4b2™ system was determined in the same manner used by Silva et al. [25].Respiratory variables were recorded breath-by-breath and averaged over a 10-s period. VO2max wasdetermined when a plateau in the VO2 curve was detected and if the plateau was absent the VO2peak
was taken instead. VO2max with the PACER® was calculated using the quadratic model established byMahar, Guerieri, Hanna, and Kemble [26]: VO2max = 41.76799 + (0.49261 × laps) − (0.00290 x laps2) −(0.61613 × BMI) + (0.34787 × sex × age), where sex is 0 for males and 1 for females.
2.3. Statistical Analyses
The Shapiro–Wilk test, Levene’s test, and box plots were utilized to screen all data for normalityassumptions, homoscedasticity, and outliers, respectively. Linear regressions with Pearson correlationswere performed on the VO2max estimates acquired from the PACER® and the NET, and the VO2max
acquired from the K4b2™ system. Intra-class correlations (ICCs), standard error of estimate (SEE),paired sample t-tests, and Bland–Altman plots were performed to assess agreement and differencesbetween the measures of VO2max. All statistical analyses were conducted with IBM SPSS software forWindows (v. 25.0; IBM Corp., Armonk, NY, USA).
3. Results
Forty-six adolescents (male: 24; female: 22) were recruited. All data met all assumptions fornormality, homoscedasticity, and outlier assumptions. Sex specific demographic and anthropometriccharacteristics are listed in Table 2.
71

J. Funct. Morphol. Kinesiol. 2019, 4, 44
Table 2. Demographic and anthropometric characteristics.
VariablesAll Participants (n = 46)
Mean ± SD [range]
Age (years) 14.56 ± 1.69; [12.00–18.00]Height (cm) 165.65 ± 10.05; [147.00–188.00]Weight (kg) 60.44 ± 13.57; [38.20, 93.80]BMI (kg/m2) 21.88 ± 3.91; [16.20–33.40]
BMI Percentiles (%) 61.89 ± 26.35; [9.00, 98.00]Bodyfat % (DXA) 24.27 ±8.35; [13.20, 45.10]
Pubertal Level (PDS) 2.71 ± 0.81; [0.00, 4.00]K4b2 VO2max (mL/kg/min) 42.29 ± 8.37; [20.99, 54.09]
PACER VO2max Estimate (mL/kg/min) 42.67 ± 7.49; [25.88, 54.20]NET VO2max Estimate (mL/kg/min) 49.82 ± 7.67; [33.11, 60.99]
Pearson correlation coefficients as well as ICC and SEE values are listed in Table 3. Scatterplotsdepicting the correlations are listed in Figure 1. All assessment methods demonstrated moderateto strong statistically significant correlations and levels of agreement as defined by Portney andWatkins [27] for correlations and Koo and Lee [28] for ICC.
Table 3. Correlation matrix between oxygen consumption estimates per test for both sexes combined.
Correlations
PACER NET K4B2
PACER
NET
r = 0.81; p < 0.001r2 = 0.65
ICC = 0.72SEE = 8.53 mL/kg/min
[0.57, 0.99]
K4B2
r = 0.87; p < 0.001r2 = 0.75
ICC = 0.93SEE = 4.17 mL/kg/min
[0.70, 1.0]
r = 0.73; p < 0.001r2 = 0.53
ICC = 0.67SEE = 9.56 mL/kg/min
[0.50, 0.97]
A
Figure 1. Cont.
72
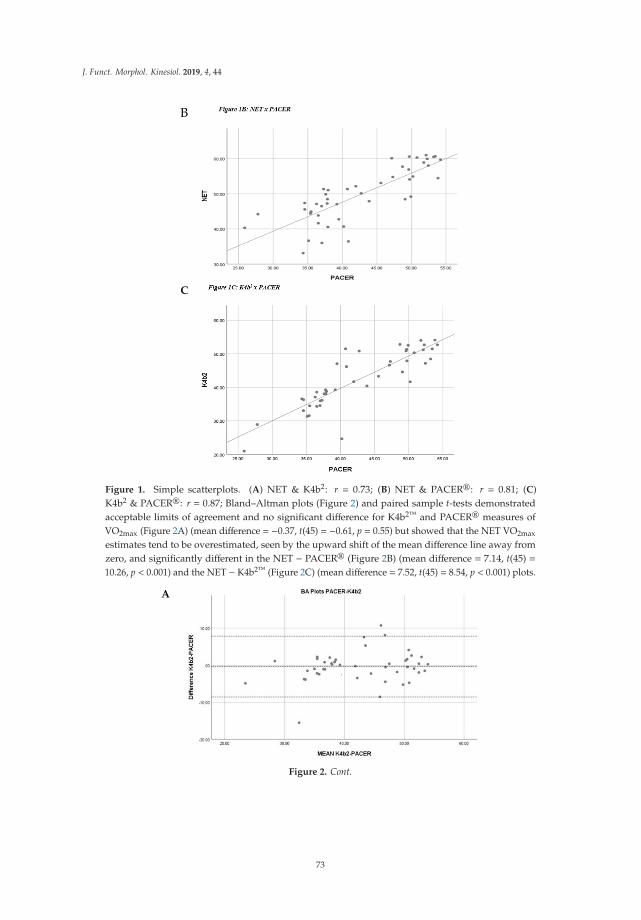
J. Funct. Morphol. Kinesiol. 2019, 4, 44
B
C
Figure 1. Simple scatterplots. (A) NET & K4b2: r = 0.73; (B) NET & PACER®: r = 0.81; (C)K4b2 & PACER®: r = 0.87; Bland–Altman plots (Figure 2) and paired sample t-tests demonstratedacceptable limits of agreement and no significant difference for K4b2™ and PACER® measures ofVO2max (Figure 2A) (mean difference = −0.37, t(45) = −0.61, p = 0.55) but showed that the NET VO2max
estimates tend to be overestimated, seen by the upward shift of the mean difference line away fromzero, and significantly different in the NET − PACER® (Figure 2B) (mean difference = 7.14, t(45) =10.26, p < 0.001) and the NET − K4b2™ (Figure 2C) (mean difference = 7.52, t(45) = 8.54, p < 0.001) plots.
A
Figure 2. Cont.
73

J. Funct. Morphol. Kinesiol. 2019, 4, 44
B
C
Figure 2. Bland–Altman plots. Middle line represents mean difference while other dotted linesrepresent the limits of agreement: ±1.96s. (A) K4b2 & PACER®: mean difference = −0.37, limits ofagreement of −8.61 & 7.85; (B) NET & PACER®: mean difference = 7.14, limits of agreement of −2.10 &16.39; (C) K4b2 & NET: mean difference = 7.52, limits of agreement of −4.19 & 19.23.
4. Discussion
The aim of this study was to estimate the concurrent validity of the NET for adolescents againstthe PACER® and objective measures of VO2max as well as to examine the concurrent validity ofthe VO2max estimation by the PACER® with the VO2max from the K4b2™ portable metabolic systemduring the PACER® test. Past studies have shown that the NET is a valid measure of CRF in adultpopulations [21,22], and our results show that the NET is a valid predictor of VO2max in the adolescentpopulation. This is important, as it offers a quick, easy, inexpensive, and risk-free method of assessingCRF in adolescents. To our knowledge, this is the first report to measure CRF in adolescents withoutrequiring any form of exertion from the participant, which allows for widespread use among largegroups and offers a feasible tool for CRF measurement in healthcare settings.
The PACER® test has been validated several times [16,19,20], and our results comparing it to thedirect measure of VO2max from the K4b2™ (r = 0.87) align with past results (r = 0.62–0.83) acquireddirectly from treadmill maximal exercise tests [16,19,20]. Our study offers a different perspective,as most studies compare the PACER® estimate to a traditional treadmill maximal exercise test, butour research compared the estimate to the direct measure of VO2max acquired at the same time theparticipant was performing the PACER®. This further strengthens the validity of the PACER® as anindirect measure of VO2max and shows that the PACER® protocol is a valid substitute for a maximallygraded exercise test.
In practice, the NET could offer schools a quick and inexpensive tool to assess CRF more frequentlythan the PACER® test allows, providing valuable information to implement changes in physicaleducation. At the clinical level, the NET can be implemented into healthcare settings as a snapshot ofcurrent CRF and can be used as a tool to assess risk for cardiovascular and cardiometabolic disease [1–5].
74
J. Funct. Morphol. Kinesiol. 2019, 4, 44
For efficient use in either setting, the NET results can be analyzed similar to the PACER®, which groupsstudents based on having sufficient or insufficient CRF into the healthy fitness zone (HFZ), the needsimprovement zone (NIZ), or the health risk zone (HRZ) [18]. Based on our results, the group valuesfor the zones could be adjusted with the linear regression equation: PACER® = 10.92 + 0.96(NET).For example, a 10-year-old male with a NET score of 46.82–49.42 would fall into the NIZ, a score of≤46.81 would put him in the HRZ, and a score ≥49.43 would place him into the HFZ. This would allowfor a quick assessment to deduce whether an adolescent patient is at risk and requires intervention.
As seen with the Bland–Altman plots and t-tests, the NET VO2max estimates were generallymuch higher and were significantly different than the values acquired directly through the K4b2™
or estimated through the PACER®. This could be due to the fact the descriptions of the physicalactivity levels were intended for adults, so it may not have been directly relatable to adolescents. Also,the added weight of the K4b2™ unit, weighing roughly 1 kg, plus the addition of the mask couldhave resulted in a decreased outcome during the PACER® test. While the NET measures of VO2max
were significantly higher, the moderately strong levels of agreement show that the NET is valid andby using the CRF grouping suggested above, as is used by the PACER®, the NET overestimationis inconsequential.
Limitations of this study include a small sample of females and males, thus limiting the abilityto fully explore sexes separately, and the running of the PACER® test individually instead of ingroups, as is the norm in schools, thus potentially affecting participants’ motivation to maximally exertthemselves. Regardless of the limitations of this study, there are several strengths in our design andfindings, including validating the NET against two different validated measures of VO2max and testinga representative sample of adolescents. Future studies on using the NET for adolescents could examinea larger sample size, perhaps in public schools, to compare against the PACER® or investigate theNET’s sensitivity to change in an adolescent’s CRF. Future studies need to also assess the reliability ofthe NET in adolescents, so it can be established as a tool to measure CRF over time.
5. Conclusions
This article gives researchers, clinicians, and coaches a simple, quick, and inexpensive toolto indirectly estimate VO2max in the adolescent population as opposed to a time-consuming andexhausting exercise test. This article also strengthens the evidence for use of the PACER® test as anindirect measure of VO2max, as it provided ventilatory gas analysis during the test itself, showing thatthe PACER® is a valid graded maximal exertion exercise test, as direct measures of VO2max acquiredduring performing the PACER® were in agreement with PACER® estimates based on regressionequations established against the more traditional treadmill VO2max tests.
Author Contributions: Conceptualization: A.O., L.K., P.M.; Methodology: A.O.; Formal Analysis: P.M.;Investigation: P.M., M.C., A.B., A.F. L.K., A.O., W.B.; Resources: L.K., A.O., W.B.; Data Curation: P.M., M.C.;Writing—Original Draft Preparation: P.M.; Writing—Review and Editing: P.M., A.O., L.K.; Supervision: A.O.,L.K., W.B.
Funding: This study was funded by the Texas Physical Therapy Foundation. The results of this study arepresented clearly, honestly, and without fabrication, falsification, or inappropriate data manipulation. The resultsfrom this study do not constitute endorsement by the Texas Physical Therapy Association.
Conflicts of Interest: The authors have no conflict of interest to disclose.
References
1. Parrett, A.L.; Valentine, R.J.; Arngrimsson, S.A.; Castelli, D.M.; Evans, E.M. Adiposity and aerobic fitness areassociated with metabolic disease risk in children. Appl. Physiol. Nutr. Metab. 2011, 36, 72–79. [CrossRef][PubMed]
2. Lukacs, A.; Varga, B.; Kiss-Toth, E.; Soos, A.; Barkai, L. Factors influencing the diabetes-specific health-relatedquality of life in children and adolescents with type 1 diabetes mellitus. J. Child Heal. Care 2014, 18, 253–260.[CrossRef] [PubMed]
75
J. Funct. Morphol. Kinesiol. 2019, 4, 44
3. Twisk, J.W.R.; Kemper, H.C.G.; Mechelen, W. Van Tracking of activity and fitness and the relationship withcardiovascular disease risk factors. Med. Sci. Sport. Exerc. 2000, 1455–1461. [CrossRef]
4. Houston, E.L.; Baker, J.S.; Buchan, D.S.; Stratton, G.; Fairclough, S.J.; Foweather, L.; Gobbi, R.;Graves, L.E.F.; Hopkins, N.; Boddy, L.M. Cardiorespiratory fitness predicts clustered cardiometabolicrisk in 10–11.9-year-olds. Eur. J. Pediatr. 2013, 172, 913–918. [CrossRef] [PubMed]
5. Bailey, D.P.; Boddy, L.M.; Savory, L.A.; Denton, S.J.; Kerr, C.J. Associations between cardiorespiratoryfitness, physical activity and clustered cardiometabolic risk in children and adolescents: The HAPPY study.Eur. J. Pediatr. 2012, 171, 1317–1323. [CrossRef] [PubMed]
6. Chaddock, L.; Hillman, C.H.; Pontifex, M.B.; Johnson, C.R.; Raine, L.B.; Kramer, A.F. Childhood aerobicfitness predicts cognitive performance one year later. J. Sports Sci. 2012, 30, 421–430. [CrossRef] [PubMed]
7. Haapala, E.A. Cardiorespiratory Fitness and Motor Skills in Relation to Cognition and Academic Performancein Children – A Review by. J. Hum. Kinet. 2013, 36, 55–68. [CrossRef]
8. Chaddock, L.; Erickson, K.I.; Prakash, R.S.; Vanpatter, M.; Voss, M.W.; Pontifex, M.B.; Raine, L.B.;Hillman, C.H.; Kramer, A.F. Basal ganglia volume is associated with aerobic fitness in preadolescentchildren. Dev. Neurosci. 2010, 32, 249–256. [CrossRef]
9. Hillman, C.H.; Erickson, K.I.; Kramer, A.F. Be smart, exercise your heart: exercise effects on brain andcognition. Nat. Rev. Neurosci. 2008, 9, 58–65. [CrossRef]
10. Pontifex, M.B.; Raine, L.B.; Johnson, C.R.; Chaddock, L.; Voss, M.W.; Cohen, N.; Kramer, A.F.; Hillman, C.H.Cardiorespiratory Fitness and the Flexible Modulation of Cognitive Control in Preadolescent Children.J. Cogn. Neurosci. 2010, 23, 1332–1345. [CrossRef]
11. Chaddock, L.; Erickson, K.I.; Prakash, R.S.; Kim, J.S.; Voss, M.W.; VanPatter, M.; Pontifex, M.B.; Raine, L.B.;Konkel, A.; Hillman, C.H.; et al. A neuroimaging investigation of the association between aerobic fitness,hippocampal volume, and memory performance in preadolescent children. Brain Res. 2014, 1358, 172–183.[CrossRef] [PubMed]
12. Huotari, P.; Nupponen, H.; Mikkelsson, L.; Laakso, L.; Kujala, U. Adolescent physical fitness and activity aspredictors of adulthood activity. J. Sports Sci. 2011, 29, 1135–1141. [CrossRef] [PubMed]
13. Jose, K.A.; Blizzard, L.; Dwyer, T.; Mckercher, C.; Venn, A.J. Childhood and adolescent predictors of leisuretime physical activity during the transition from adolescence to adulthood: A population based cohort study.Int. J. Behav. Nutr. Phys. Act. 2011, 8, 1–9. [CrossRef] [PubMed]
14. Davis, J. Direct determination of aerobic power. In Physiological Assessment of Human Fitness; Human Kinetics:Champaign, IL, USA, 1995; pp. 9–17.
15. Ward, A.; Ebbeling, C.; Ahlquist, L. Indirect methods for estimation of aerobic power. In PhysiologicalAssessment of Human Fitness; Human Kinetics: Champaign, IL, USA, 1995; pp. 37–56.
16. Van Mechelen, W.; Hlobil, H.; Kemper, H.C.G. Validation of two running tests as estimates of maximalaerobic power in children. Eur. J. Appl. Physiol. 1986, 55, 503–506. [CrossRef]
17. Mayorga-Vega, D.; Aguilar-Soto, P.; Viciana, J. Criterion-related validity of the 20-m shuttle run test forestimating cardiorespiratory fitness: A meta-analysis. J. Sport. Sci. Med. 2015, 14, 536–547.
18. Meredith, M.; Welk, G. FITNESSGRAM®/ACTIVITYGRAM® Test Administration Manual, 4th ed.; HumanKinetics: Champaign, IL, USA, 2013; Available online: www.cooperinstitute.org/vault/2440/web/files/662.pdf(accessed on 31 December 2017).
19. Kabiri, L.S.; Mitchell, K.; Brewer, W.; Ortiz, A. Muscular and Cardiorespiratory Fitness in Homeschool versusPublic School Children Running. Pediatr. Exerc. Sci. 2017, 29, 371–376. [CrossRef] [PubMed]
20. Mahar, M.T.; Welk, G.J.; Rowe, D.A.; Crotts, D.J.; Mciver, K.L. Development and Validation of a Regres- sionModel to Estimate VO2peak From PACER 20-m Shuttle Run Performance. J. Phys. Act. Health 2006, 3, 34–46.[CrossRef]
21. Jurca, R.; Jackson, A.S.; Lamonte, M.J.; Morrow, J.R., Jr.; Blair, S.N.; Wareham, N.J.; Haskell, W.L.;Van Mechelen, W.; Church, T.S.; Jakicic, J.M. Assessing Cardiorespiratory Fitness Without PerformingExercise Testing. Am. J. Prev. Med. 2005, 29, 185–193. [CrossRef]
22. Jackson, A.S.; Sui, X.; Connor, D.P.O.; Church, T.S.; Lee, D.; Artero, E.G.; Blair, S.N. LongitudinalCardiorespiratory Fitness Alogrithms for Clinical Settings. Am. J. Prev. Med. 2012, 43, 512–519. [CrossRef]
23. Duffield, R.; Dawson, B.; Pinnington, H.; Wong, P. Accuracy and reliabillity of a Cosmed K4b 2 portable gasaScience, Exercisenalysis system. J. Sci. Med. Sport 2004, 7, 11–22. [CrossRef]
76
J. Funct. Morphol. Kinesiol. 2019, 4, 44
24. Schrack, J.A.; Simonsick, E.M.; Ferrucci, L. Comparison of the Cosmed K4b2 Portable Metabolic System inMeasuring Steady-State Walking Energy Expenditure. PLoS ONE 2010, 5, 2–6. [CrossRef] [PubMed]
25. Silva, G.; Oliveira, N.L.; Aires, L.; Mota, J.; Oliveira, J.; Ribeiro, J.C. Calculation and validation of models forestimating VO2max from the 20-m shuttle run test in children and adolescents Gustavo. Arch. Exerc. Heal. Dis.2012, 2, 145–152. [CrossRef]
26. Mahar, M.T.; Guerieri, A.M.; Hanna, M.S.; Kemble, C.D. Estimation of Aerobic Fitness from 20-m MultistageShuttle Run Test Performance. Am. J. Prev. Med. 2011, 41, S117–S123. [CrossRef] [PubMed]
27. Portney, L.G.; Watkins, M.P. Foundations of Clinical Research: Applications to Practice, 3rd ed.; F.A. DavisCompany: Philadelphia, PA, USA, 2015; p. 525.
28. Koo, T.K.; Li, M.Y. A Guideline of Selecting and Reporting Intraclass Correlation Coefficients for ReliabilityResearch. J. Chiropr. Med. 2016, 15, 155–163. [CrossRef] [PubMed]
© 2019 by the authors. Licensee MDPI, Basel, Switzerland. This article is an open accessarticle distributed under the terms and conditions of the Creative Commons Attribution(CC BY) license (http://creativecommons.org/licenses/by/4.0/).
77

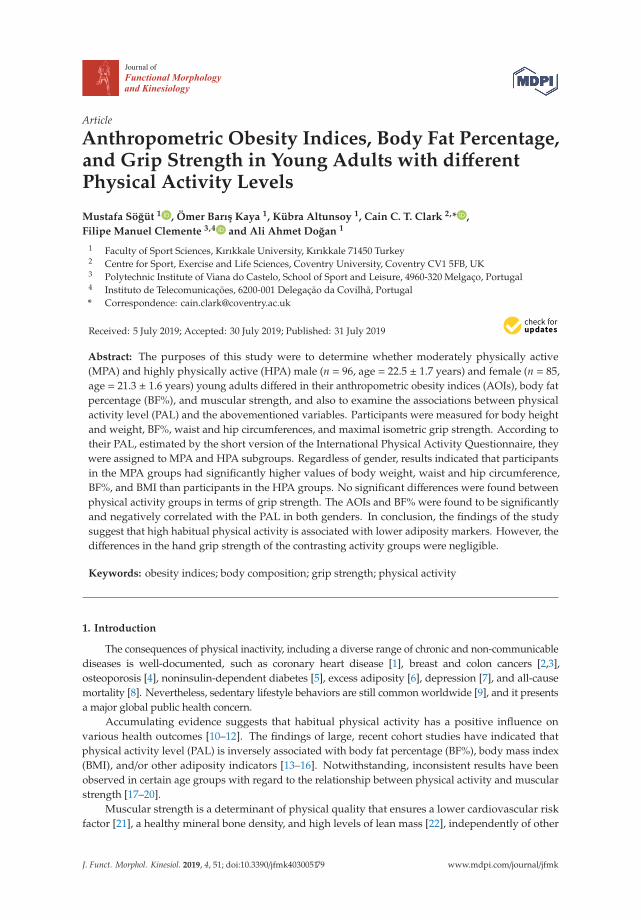
Journal of
Functional Morphology and Kinesiology
Article
Anthropometric Obesity Indices, Body Fat Percentage,and Grip Strength in Young Adults with differentPhysical Activity Levels
Mustafa Sögüt 1 , Ömer Barıs Kaya 1, Kübra Altunsoy 1, Cain C. T. Clark 2,* ,
Filipe Manuel Clemente 3,4 and Ali Ahmet Dogan 1
1 Faculty of Sport Sciences, Kırıkkale University, Kırıkkale 71450 Turkey2 Centre for Sport, Exercise and Life Sciences, Coventry University, Coventry CV1 5FB, UK3 Polytechnic Institute of Viana do Castelo, School of Sport and Leisure, 4960-320 Melgaço, Portugal4 Instituto de Telecomunicações, 6200-001 Delegação da Covilhã, Portugal* Correspondence: [email protected]
Received: 5 July 2019; Accepted: 30 July 2019; Published: 31 July 2019���������������
Abstract: The purposes of this study were to determine whether moderately physically active(MPA) and highly physically active (HPA) male (n = 96, age = 22.5 ± 1.7 years) and female (n = 85,age = 21.3 ± 1.6 years) young adults differed in their anthropometric obesity indices (AOIs), body fatpercentage (BF%), and muscular strength, and also to examine the associations between physicalactivity level (PAL) and the abovementioned variables. Participants were measured for body heightand weight, BF%, waist and hip circumferences, and maximal isometric grip strength. According totheir PAL, estimated by the short version of the International Physical Activity Questionnaire, theywere assigned to MPA and HPA subgroups. Regardless of gender, results indicated that participantsin the MPA groups had significantly higher values of body weight, waist and hip circumference,BF%, and BMI than participants in the HPA groups. No significant differences were found betweenphysical activity groups in terms of grip strength. The AOIs and BF% were found to be significantlyand negatively correlated with the PAL in both genders. In conclusion, the findings of the studysuggest that high habitual physical activity is associated with lower adiposity markers. However, thedifferences in the hand grip strength of the contrasting activity groups were negligible.
Keywords: obesity indices; body composition; grip strength; physical activity
1. Introduction
The consequences of physical inactivity, including a diverse range of chronic and non-communicablediseases is well-documented, such as coronary heart disease [1], breast and colon cancers [2,3],osteoporosis [4], noninsulin-dependent diabetes [5], excess adiposity [6], depression [7], and all-causemortality [8]. Nevertheless, sedentary lifestyle behaviors are still common worldwide [9], and it presentsa major global public health concern.
Accumulating evidence suggests that habitual physical activity has a positive influence onvarious health outcomes [10–12]. The findings of large, recent cohort studies have indicated thatphysical activity level (PAL) is inversely associated with body fat percentage (BF%), body mass index(BMI), and/or other adiposity indicators [13–16]. Notwithstanding, inconsistent results have beenobserved in certain age groups with regard to the relationship between physical activity and muscularstrength [17–20].
Muscular strength is a determinant of physical quality that ensures a lower cardiovascular riskfactor [21], a healthy mineral bone density, and high levels of lean mass [22], independently of other
J. Funct. Morphol. Kinesiol. 2019, 4, 51; doi:10.3390/jfmk4030051 www.mdpi.com/journal/jfmk79

J. Funct. Morphol. Kinesiol. 2019, 4, 51
fitness variables or sociodemographic measures. Despite there being many ways to assess muscularstrength, one of the most common tests carried out in adults is grip strength, which is an importantclinical and prognostic value [23]. Usually, strong and positive correlations have been found betweenhand grip strength and muscle mass [24]. On the other hand, low hand grip strength is associated withincreased risk of functional limitations and disability in one’s later years, as well as a general causeof mortality [25]. In spite of such evidence, there is a lack of studies testing the relationship betweenPALs and strength, and this should be considered to understand the mechanism that explains goodmaintenance of strength.
Although young adulthood is a critical developmental period characterized by important changesin health status, such as unhealthy weight gain [26,27] and physical inactivity [28], the majority of therelevant examinations have been conducted with children and older adults. Thus, current literatureprovides limited evidence on the disparities in adiposity and muscular strength in university studentswith different PALs. Therefore, the purposes of the present study were to examine whether moderatelyphysically active (MPA) and highly physically active (HPA) male and female young adults differed intheir anthropometric obesity indices (AOIs), BF%, and muscular strength, and to analyze the relationsbetween PAL and the aforementioned variables.
2. Materials and Methods
2.1. Participants
A cohort of male (n = 96, age = 22.5 ± 1.7 years) and female (n = 85, age = 21.3 ± 1.6 years)university students from a state university located in central Anatolia (Turkey) were recruited to takepart in the study. They were initially briefed of the measurement procedures and the aims of thestudy, and then requested to sign informed consent forms. Ethical approval was obtained from theNon-interventional Researches Ethics Board of Kırıkkale University (approval number/identificationcode of the study is 2019.06.25).
2.2. Anthropometric Measurements
Anthropometric assessments were performed in accordance with standardized procedures [29].Body height was measured with a portable stadiometer (Seca 213, Hamburg, Germany) to the nearest0.1 cm. Body mass (0.1 kg) and BF% were evaluated by a bioelectrical impedance analyzer (Tanita,BC-418, Japan). Waist and hip circumferences were measured with a flexible steel tape to the nearestcentimeter at the smallest circumference between the ribs and the iliac crest and at the level of maximumprotuberance of the buttocks, respectively. BMI was calculated by dividing the body weight (kg) bythe body height squared (m).
2.3. Grip Strength
A digital hand dynamometer (T.K.K.5401 Grip-D, Takei, Japan) was used to assess maximalisometric grip strength. Participants were asked to stay in a standing position and keep one armstraight and parallel to the body. They were requested to hold the dynamometer with their dominanthand and squeeze the handle as hard as possible for three seconds. The highest value acquired fromthe three trials was used for the analysis.
2.4. Physical Activity
The PAL of the participants was estimated via the short form of the International Physical ActivityQuestionnaire (IPAQ) [30,31]. The IPAQ requires respondents to recall the frequency, duration, andintensity of physical activity they engaged in during the last seven days. Each type of activity (moderate-and vigorous-intensity walking) was then converted to metabolic equivalent (MET) minutes, enablingthe determination of total weekly physical activity. Based on their weekly MET minutes, they weredivided into two groups—MPA (≥600–3000 MET min/week) and HPA (≥3000 MET min/week) [30,31].
80

J. Funct. Morphol. Kinesiol. 2019, 4, 51
2.5. Statistical Analysis
Data were analyzed using SPSS for Windows. Descriptive statistics (mean ± SD) were calculatedfor all variables. An independent sample t-test was used to ascertain differences between PAL groups.Effect sizes (ES) were quantified to determine the magnitude of differences. Based on the Cohen’s dvalues, ES were considered as: <0.20 (trivial), 0.20 to 0.59 (small), 0.60 to 1.19 (moderate), 1.20 to 1.99(large), 2.0 to 3.9 (very large), and >4.0 (extremely large) [32]. A Pearson correlation coefficient wasconducted to examine the associations between PAL and other variables. Correlations were categorizedas 0.0–0.1 (trivial), 0.1–0.3 (small), 0.3–0.5 (moderate), 0.5–0.7 (large), 0.7–0.9 (very large), and 0.9–1.0(near perfect) [32].
3. Results
Descriptive statistics (mean ± SD), t-test results, and effect sizes for male and female participantsare presented in Tables 1 and 2. Results highlighted that participants in the HPA groups had significantlylower values in BF%, body mass, waist and hip circumference, and BMI than the participants in theMPA groups in both genders. There were no significant differences in age, body height, and gripstrength results between groups.
Table 1. Descriptive statistics, t-test results, and effect size values for male participants.
Physical ActivityGroups
MPA (n = 45) HPA (n = 51) t p d
Age (years) 22.8 (1.8) 22.2 (1.6) 1.861 0.066 0.38Activity (MET m/w) 1922.1 (799.2) 4883.1 (1203.3) −14.001 0.001 −2.89
Height (cm) 175.2 (6.3) 175.1 (6.8) 0.082 0.935 0.02Weight (kg) 71.9 (8.1) 68.4 (7.5) 2.245 0.027 0.46Waist (cm) 80.1 (5.7) 77.1 (4.9) 2.707 0.008 0.55Hip (cm) 96.2 (4.8) 93.7 (5.4) 2.347 0.021 0.46
BMI (kg/m2) 23.50 (2.7) 22.34 (2.2) 2.285 0.025 0.46Body fat (%) 13.5 (5.8) 10.5 (3.8) 3.275 0.001 0.67
Grip strength (kg) 47.5 (7.0) 47.9 (6.8) −0.291 0.772 −0.06
Table 2. Descriptive statistics, t-test results, and effect size values for female participants.
Physical ActivityGroups
MPA (n = 37) HPA (n = 48) t p d
Age (years) 21.2 (1.7) 21.3 (1.6) −0.324 0.747 −0.07Activity (MET m/w) 1665.3 (777.5) 4863.2 (821.2) −18.214 0.001 −3.98
Height (cm) 162.1 (5.6) 161.2 (6.6) 0.705 0.483 0.15Weight (kg) 60.8 (11.9) 54.8 (8.7) 2.646 0.010 0.58Waist (cm) 69.9 (8.1) 66.7 (5.2) 2.184 0.032 0.48Hip (cm) 96.8 (7.8) 93.3 (6.3) 2.257 0.027 0.49
BMI (kg/m2) 23.05 (4.2) 21.03 (2.7) 2.703 0.008 0.59Body fat (%) 27.6 (8.1) 22.4 (6.5) 3.301 0.001 0.72
Grip strength (kg) 27.2 (4.4) 27.3 (3.8) −0.182 0.856 −0.04
Table 3 presents the correlation coefficients between PAL and other variables for each gender,separately. Results indicated that the PAL, regardless of gender, was found to be significantly andnegatively correlated with all AOIs and BF%. On the other hand, no significant associations werefound between PAL and grip strength values in both male and female participants.
81
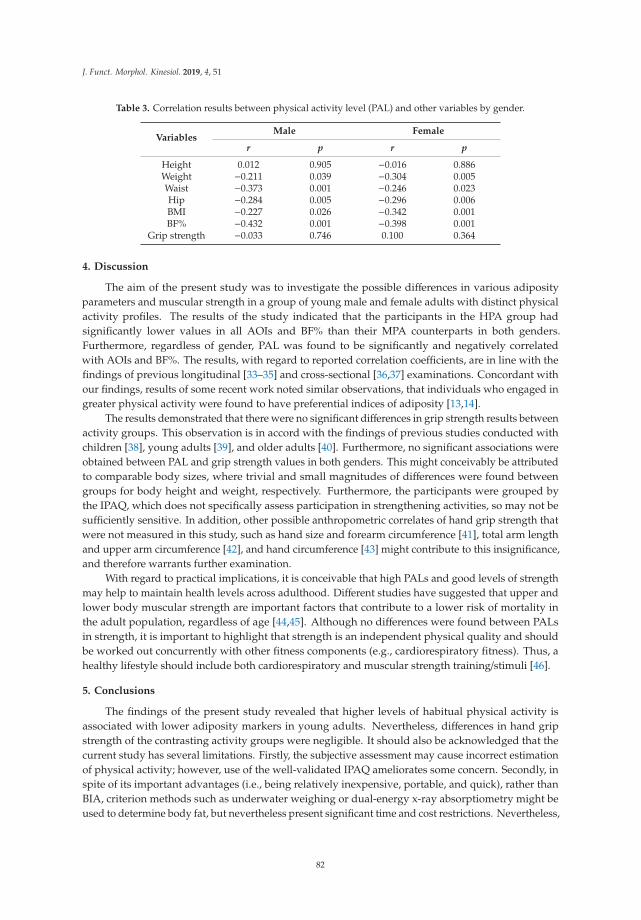
J. Funct. Morphol. Kinesiol. 2019, 4, 51
Table 3. Correlation results between physical activity level (PAL) and other variables by gender.
VariablesMale Female
r p r p
Height 0.012 0.905 −0.016 0.886Weight −0.211 0.039 −0.304 0.005Waist −0.373 0.001 −0.246 0.023Hip −0.284 0.005 −0.296 0.006BMI −0.227 0.026 −0.342 0.001BF% −0.432 0.001 −0.398 0.001
Grip strength −0.033 0.746 0.100 0.364
4. Discussion
The aim of the present study was to investigate the possible differences in various adiposityparameters and muscular strength in a group of young male and female adults with distinct physicalactivity profiles. The results of the study indicated that the participants in the HPA group hadsignificantly lower values in all AOIs and BF% than their MPA counterparts in both genders.Furthermore, regardless of gender, PAL was found to be significantly and negatively correlatedwith AOIs and BF%. The results, with regard to reported correlation coefficients, are in line with thefindings of previous longitudinal [33–35] and cross-sectional [36,37] examinations. Concordant withour findings, results of some recent work noted similar observations, that individuals who engaged ingreater physical activity were found to have preferential indices of adiposity [13,14].
The results demonstrated that there were no significant differences in grip strength results betweenactivity groups. This observation is in accord with the findings of previous studies conducted withchildren [38], young adults [39], and older adults [40]. Furthermore, no significant associations wereobtained between PAL and grip strength values in both genders. This might conceivably be attributedto comparable body sizes, where trivial and small magnitudes of differences were found betweengroups for body height and weight, respectively. Furthermore, the participants were grouped bythe IPAQ, which does not specifically assess participation in strengthening activities, so may not besufficiently sensitive. In addition, other possible anthropometric correlates of hand grip strength thatwere not measured in this study, such as hand size and forearm circumference [41], total arm lengthand upper arm circumference [42], and hand circumference [43] might contribute to this insignificance,and therefore warrants further examination.
With regard to practical implications, it is conceivable that high PALs and good levels of strengthmay help to maintain health levels across adulthood. Different studies have suggested that upper andlower body muscular strength are important factors that contribute to a lower risk of mortality inthe adult population, regardless of age [44,45]. Although no differences were found between PALsin strength, it is important to highlight that strength is an independent physical quality and shouldbe worked out concurrently with other fitness components (e.g., cardiorespiratory fitness). Thus, ahealthy lifestyle should include both cardiorespiratory and muscular strength training/stimuli [46].
5. Conclusions
The findings of the present study revealed that higher levels of habitual physical activity isassociated with lower adiposity markers in young adults. Nevertheless, differences in hand gripstrength of the contrasting activity groups were negligible. It should also be acknowledged that thecurrent study has several limitations. Firstly, the subjective assessment may cause incorrect estimationof physical activity; however, use of the well-validated IPAQ ameliorates some concern. Secondly, inspite of its important advantages (i.e., being relatively inexpensive, portable, and quick), rather thanBIA, criterion methods such as underwater weighing or dual-energy x-ray absorptiometry might beused to determine body fat, but nevertheless present significant time and cost restrictions. Nevertheless,
82
J. Funct. Morphol. Kinesiol. 2019, 4, 51
it is recommended that future studies expand this observation through using a larger sample and morecomplex reference methods to measure physical activity levels and body composition.
Author Contributions: Conceptualization, M.S. and O.B.K.; Data curation, M.S. and O.B.K.; Formal analysis, M.S.;Investigation, K.A. and F.M.C.; Software, M.S.; Supervision, C.C.T.C. and A.A.D.; Writing—original draft, M.S.,O.B.K., K.A., C.C.T.C. and F.M.C.; Writing—review and editing, C.C.T.C. and A.A.D.
Funding: This research received no external funding.
Conflicts of Interest: The authors declare no conflict of interest.
References
1. Sattelmair, J.; Pertman, J.; Ding, E.L.; Kohl, H.W., III; Haskell, W.; Lee, I.M. Dose response between physicalactivity and risk of coronary heart disease: A meta-analysis. Circulation 2011, 124, 789–795. [CrossRef][PubMed]
2. Friedenreich, C.M. Physical activity and breast cancer: Review of the epidemiologic evidence and biologicmechanisms. Recent Results Cancer Res. 2011, 188, 125–139. [PubMed]
3. Wolin, K.Y.; Yan, Y.; Colditz, G.A.; Lee, I.M. Physical activity and colon cancer prevention: A meta-analysis.Br. J. Cancer 2009, 100, 611. [CrossRef] [PubMed]
4. Lane, N.E. Epidemiology, etiology, and diagnosis of osteoporosis. Am. J. Obstet. Gynecol. 2006, 19, S3–S11.[CrossRef] [PubMed]
5. Jeon, C.Y.; Lokken, R.P.; Hu, F.B.; Van Dam, R.M. Physical activity of moderate intensity and risk of type 2diabetes: A systematic review. Diabetes Care 2007, 30, 744–752. [PubMed]
6. Pietiläinen, K.H.; Kaprio, J.; Borg, P.; Plasqui, G.; Yki-Järvinen, H.; Kujala, U.M.; Rose, R.J.; Westerterp, K.R.;Rissanen, A. Physical inactivity and obesity: A vicious circle. Obesity 2008, 16, 409–414. [CrossRef] [PubMed]
7. Weyerer, S. Physical Inactivity and Depression in the Community. Int. J. Sports Med. 1992, 13, 492–496.[CrossRef]
8. Lollgen, H.; Bockenhoff, A.; Knapp, G. Physical activity and all-cause mortality: An updated metaanalysiswith different intensity categories. Int. J. Sports Med. 2009, 30, 213–224. [CrossRef]
9. Hallal, P.C.; Andersen, L.B.; Bull, F.C.; Guthold, R.; Haskell, W.; Ekelund, U.; Lancet Physical Activity SeriesWorking Group. Global physical activity levels: Surveillance progress, pitfalls, and prospects. Lancet 2012,380, 247–257. [CrossRef]
10. Blair, S.N.; Cheng, Y.; Holder, J.S. Is physical activity or physical fitness more important in defining healthbenefits? Med. Sci. Sports Exerc. 2001, 33, 379–399.
11. Reiner, M.; Niermann, C.; Jekauc, D.; Woll, A. Long-term health benefits of physical activity—A systematicreview of longitudinal studies. BMC Public Health 2013, 13, 813. [CrossRef]
12. Warburton, D.E.; Nicol, C.W.; Bredin, S.S. Health benefits of physical activity: The evidence. Can. Med.Assoc. J. 2006, 174, 801–809. [CrossRef] [PubMed]
13. Besson, H.; Ekelund, U.; Luan, J.; May, A.M.; Sharp, S.; Travier, N.; Agudo, A.; Slimani, N.; Rinaldi, S.;Jenab, M.; et al. A cross-sectional analysis of physical activity and obesity indicators in European participantsof the EPIC-PANACEA study. Int. J. Obes. 2009, 33, 497–506. [CrossRef] [PubMed]
14. Maher, C.A.; Mire, E.; Harrington, D.M.; Staiano, A.E.; Katzmarzyk, P.T. The independent and combinedassociations of physical activity and sedentary behavior with obesity in adults: NHANES 2003-06. Obesity2013, 21, 730–737. [CrossRef] [PubMed]
15. Moliner-Urdiales, D.; Ruiz, J.R.; Ortega, F.B.; Rey-Lopez, J.P.; Vicente-Rodríguez, G.; España-Romero, V.;Izquierdo, D.M.; Castillo, M.J.; Sjöström, M.; Moreno, L.A. Association of objectively assessed physicalactivity with total and central body fat in Spanish adolescents; The HELENA Study. Int. J. Obes. 2009, 33,1126–1135. [CrossRef]
16. Ruiz, J.R.; Rizzo, N.S.; Hurtig-Wennlöf, A.; Ortega, F.B.; Wàrnberg, J.; Sjöström, M. Relations of total physicalactivity and intensity to fitness and fatness in children: The European Youth Heart Study. Am. J. Clin. Nutr.2006, 84, 299–303. [CrossRef]
83

J. Funct. Morphol. Kinesiol. 2019, 4, 51
17. Bann, D.; Hire, D.; Manini, T.; Cooper, R.; Botoseneanu, A.; McDermott, M.M.; Pahor, M.; Glynn, N.W.;Fielding, R.; King, A.C.; et al. Light intensity physical activity and sedentary behavior in relation to bodymass index and grip strength in older adults: Cross-sectional findings from the lifestyle interventions andindependence for elders (LIFE) study. PLoS ONE 2015, 10, e0116058.
18. Cooper, A.J.M.; Lamb, M.J.E.; Sharp, S.J.; Simmons, R.K.; Griffin, S.J. Bidirectional association betweenphysical activity and muscular strength in older adults: Results from the UK Biobank study. Int. J. Epidemiol.2016, 46, 141–148.
19. Martin, H.J.; Syddall, H.E.; Dennison, E.M.; Cooper, C.; Sayer, A.A. Relationship between customary physicalactivity, muscle strength and physical performance in older men and women: Findings from the HertfordshireCohort Study. Age Ageing 2008, 37, 589–593. [CrossRef]
20. Westbury, L.D.; Dodds, R.M.; Syddall, H.E.; Baczynska, A.M.; Shaw, S.C.; Dennison, E.M.; Roberts, H.C.;Sayer, A.A.; Cooper, C.; Patel, H.P. Associations Between Objectively Measured Physical Activity, BodyComposition and Sarcopenia: Findings from the Hertfordshire Sarcopenia Study (HSS). Calcif. Tissue Int.2018, 103, 237–245.
21. Grøntved, A.; Ried-Larsen, M.; Møller, N.C.; Kristensen, P.L.; Froberg, K.; Brage, S.; Andersen, L.B. Musclestrength in youth and cardiovascular risk in young adulthood (the European Youth Heart Study). Br. J.Sports Med. 2015, 49, 90–94. [CrossRef]
22. Guimarães, B.R.; Pimenta, L.D.; Massini, D.A.; Dos Santos, D.; da Cruz Siqueira, L.O.; Simionato, A.R.; dosSantos, L.G.A.; Neiva, C.M.; Filho, D.M.P. Muscle strength and regional lean body mass influence on mineralbone health in young male adults. PLoS ONE 2018, 13, e0191769. [CrossRef]
23. Bohannon, R.W. Muscle strength: Clinical and prognostic value of hand-grip dynamometry. Curr. Opin.Clin. Nutr. Metab. Care 2015, 18, 465–470. [CrossRef]
24. Steffl, M.; Bohannon, R.W.; Houdova, V.; Musalek, M.; Prajerova, K.; Cesak, P.; Petra, M.; Kohlikovaa, E.;Holmerova, I. Association between clinical measures of sarcopenia in a sample of community-dwellingwomen. Isokinet. Exerc. Sci. 2015, 23, 41–44. [CrossRef]
25. Norman, K.; Stobäus, N.; Gonzalez, M.C.; Schulzke, J.D.; Pirlich, M. Hand grip strength: Outcome predictorand marker of nutritional status. Clin. Nutr. 2011, 30, 135–142. [CrossRef]
26. Gordon-Larsen, P.; Adair, L.S.; Nelson, M.C.; Popkin, B.M. Five-year obesity incidence in the transitionperiod between adolescence and adulthood: The National Longitudinal Study of Adolescent Health. Am. J.Clin. Nutr. 2004, 80, 569–575.
27. Lee, H.; Lee, D.; Guo, G.; Harris, K.M. Trends in body mass index in adolescence and young adulthood in theUnited States: 1959–2002. J. Adolesc. Health 2011, 49, 601–608.
28. Telama, R.; Yang, X. Decline of physical activity from youth to young adulthood in Finland. Med. Sci. SportsExerc. 2000, 32, 1617–1622. [CrossRef]
29. Lohman, T.G.; Roche, A.F.; Martorell, R. Anthropometric Standardization Reference Manual; Human Kinetics:Champaign, IL, USA, 1988.
30. Craig, C.L.; Marshall, A.L.; Sjostrom, M.; Bauman, A.E.; Booth, M.L.; Ainsworth, B.E.; Pratt, M.; Ekelund, U.;Yngve, A.; Sallis, J.F.; et al. International physical activity questionnaire: 12-Country reliability and validity.Med. Sci. Sports Exer. 2003, 35, 1381–1395. [CrossRef]
31. IPAQ Research Committee. Guidelines for Data Processing and Analysis of the International PhysicalActivity Questionnaire-Short and Long Forms. 2005. Available online: http://www.ipaq.ki.se (accessed on 5May 2019).
32. Hopkins, W.G.; Marshall, S.W.; Batterham, A.M.; Hanin, J. Progressive statistics for studies in sports medicineand exercise science. Med. Sci. Sports Exer. 2009, 41, 3–13. [CrossRef]
33. Bell, A.C.; Ge, K.; Popkin, B.M. Weight gain and its predictors in Chinese adults. Int. J. Obes. 2001, 25,1079–1086. [CrossRef]
34. Schmitz, K.H.; Jacobs, D.R., Jr.; Leon, A.S.; Schreiner, P.J.; Sternfeld, B. Physical activity and body weight:Associations over ten years in the CARDIA study. Int. J. Obes. 2000, 24, 1475–1487. [CrossRef]
35. Wagner, A.; Simon, C.; Ducimetiere, P.; Montaye, M.; Bongard, V.; Yarnell, J.; Bingham, A.; Hedelin, G.;Amouyel, P.; FerrieÁres, J.; et al. Leisure-time physical activity and regular walking or cycling to work areassociated with adiposity and 5 y weight gain in middle-aged men: The PRIME Study. Int. J. Obes. 2001, 25,940–948. [CrossRef]
84
J. Funct. Morphol. Kinesiol. 2019, 4, 51
36. Bowen, L.; Taylor, A.E.; Sullivan, R.; Ebrahim, S.; Kinra, S.; Krishna, K.R.; Krishna, K.V.R.; Kulkarni, B.;Ben-Shlomo, Y.; Ekelund, U.; et al. Associations between diet, physical activity and body fat distribution:A cross sectional study in an Indian population. BMC Public Health 2015, 15, 281. [CrossRef]
37. Zanovec, M.; Lakkakula, A.P.; Johnson, L.G.; Turri, G. Physical activity is associated with percent body fatand body composition but not body mass index in white and black college students. Int. J. Exerc. Sci. 2009, 2,175–185.
38. Cho, M.; Kim, J.Y. Changes in physical fitness and body composition according to the physical activities ofKorean adolescents. J. Exerc. Rehabil. 2017, 13, 568–572.
39. Mikaelsson, K.; Eliasson, K.; Lysholm, J.; Nyberg, L.; Michaelson, P. Physical capacity in physically activeand non-active adolescents. J. Public Health 2011, 19, 131–138. [CrossRef]
40. Morie, M.; Reid, K.F.; Miciek, R.; Lajevardi, N.; Choong, K.; Krasnoff, J.B.; Storer, T.W.; Fielding, R.A.;Bhasin, S.; Lebrasseur, N.K. Habitual Physical Activity Levels are Associated with Performance in Measuresof Physical Function and Mobility in Older Men. J. Am. Geriatr. Soc. 2010, 58, 1727–1733. [CrossRef]
41. Günther, C.M.; Bürger, A.; Rickert, M.; Crispin, A.; Schulz, C.U. Grip strength in healthy caucasian adults:Reference values. J. Hand Surg. 2008, 33, 558–565. [CrossRef]
42. Koley, S.; Singh, A.P. An association of dominant hand grip strength with some anthropometric variables inIndian collegiate population. Anthropol. Anz. 2009, 67, 21–28. [CrossRef]
43. Li, K.; Hewson, D.J.; Duchêne, J.; Hogrel, J.Y. Predicting maximal grip strength using hand circumference.Man. Ther. 2010, 15, 579–585. [CrossRef]
44. García-Hermoso, A.; Cavero-Redondo, I.; Ramírez-Vélez, R.; Ruiz, J.R.; Ortega, F.B.; Lee, D.C.;Martínez-Vizcaíno, V. Muscular strength as a predictor of all-cause mortality in an apparently healthypopulation: A systematic review and meta-analysis of data from approximately 2 million men and women.Arch. Phys. Med. Rehabil. 2018, 99, 2100–2113. [CrossRef]
45. Volaklis, K.A.; Halle, M.; Meisinger, C. Muscular strength as a strong predictor of mortality: A narrativereview. Eur. J. Intern. Med. 2015, 26, 303–310. [CrossRef]
46. Schumann, M.; Yli-Peltola, K.; Abbiss, C.R.; Häkkinen, K. Cardiorespiratory adaptations during concurrentaerobic and strength training in men and women. PLoS ONE 2015, 10, e0139279. [CrossRef]
© 2019 by the authors. Licensee MDPI, Basel, Switzerland. This article is an open accessarticle distributed under the terms and conditions of the Creative Commons Attribution(CC BY) license (http://creativecommons.org/licenses/by/4.0/).
85

Journal of
Functional Morphology and Kinesiology
Article
Accelerometer-Based Physical Activity Levels Differbetween Week and Weekend Days in BritishPreschool Children
Clare M. P. Roscoe 1,* , Rob S. James 2 and Michael J. Duncan 2
1 Human Sciences Research Centre, University of Derby, Kedleston Road, Derby DE22 1GB, UK2 Centre for Applied Biological and Exercise Sciences, Coventry University, Priory Street, Coventry CV1 5FB,
UK; [email protected] (R.S.J.); [email protected] (M.J.D.)* Correspondence: [email protected]; Tel.: +44-1332-591284
Received: 10 August 2019; Accepted: 7 September 2019; Published: 12 September 2019���������������
Abstract: Participation in physical activity (PA) is fundamental to children’s future health. Studiesexamining the temporal pattern of PA between weekdays and weekends in British preschool childrenare lacking. Therefore, the aim of this study was to compare PA levels between week and weekend daysfor UK preschool children, using objective measurements. One hundred and eighty-five preschoolchildren (99 boys, 86 girls, aged 4–5 years), from central England wore a triaxial accelerometer(GENEActiv) for 4 days to determine PA. The time (min) and percentage (%) of time spent in light,moderate and vigorous PA (MVPA) was determined using specific cut-points for counts per minuterelated to 3–5 year olds. Of the sample, none of the children met the UK recommended 180 min ormore of PA per day. A significant difference (P < 0.05) was observed between the amount of time thatpreschool children spent in sedentary behaviours on weekdays (91.9%) compared to weekend days(96.9%). During weekdays and weekend days, 6.3% and 2.0% of time was spent in MVPA, respectively.Therefore, a substantial proportion of British preschool children’s day is spent in sedentary behaviours,with less MVPA accrued during the weekend. Regular engagement during the weekdays providesopportunities to accrue PA, which may not be present on weekend days.
Keywords: physical activity; preschool children; health promotion
1. Introduction
Physical activity (PA) during preschool years is critical to a child’s development and overallhealth and well-being [1,2]; therefore, it is important to integrate PA into early childhood [3,4]. In2016, over 41 million children worldwide under the age of 5 years were estimated to be overweight [5].Childhood obesity is an increasing public health concern [6] and weight gained by the age of 5 yearshas been reported as a predictor of being overweight in adulthood [7]. Physical activity levels andsedentary behaviours of children in the UK have been viewed as ‘obesogenic’ [8,9], with habitual PAdeclining over recent years and sedentary behaviour being the dominant state of children’s PA levelsduring their preschool day [4,10–12]. Although studies have examined PA in children aged 5 yearsand above, fewer studies have been conducted with preschool children. This limited evidence base inUK preschool children’s PA levels is therefore a cause for concern.
It has been recommended that preschool children in the UK should ideally be participating inat least 180 min of PA per day [13–15]. Studies have discovered that preschool children spend themajority of their day in sedentary behaviours and a low proportion of their day in moderate to vigorousPA (MVPA) (<15%) [10,16,17]. Of children aged between 2 and 4 years in England, only about onein 10 meet the recommendations of at least 180 min of PA per day [18,19]. It has been reported that
J. Funct. Morphol. Kinesiol. 2019, 4, 65; doi:10.3390/jfmk4030065 www.mdpi.com/journal/jfmk87

J. Funct. Morphol. Kinesiol. 2019, 4, 65
children engaged in 7.7 min of MVPA per hour at preschool [20]. Therefore, in accordance withPate et al. [20], if a child, for example, attends preschool for 8 h, they would only engage in ~1 h ofMVPA and it is unlikely they would participate in a further 2 h of PA outside of preschool. However,no study has systematically checked to see whether there is a difference in physical activity betweenweekdays, when the child attends preschool, and weekend days, when the child is influenced moreby their home environment. O’Dwyer et al. [21] reported that there were discrete periods duringthe after-preschool hours and at the weekend when PA levels were low, yet children who attendedpreschool for full days engaged in 11.1 min MVPA less than those attending for half days, suggestingthat the preschool environment is related to decreased PA. That said, studies have shown that PA inpreschoolers differs over the course of the day and the week in countries such as Sweden, Englandand Denmark [21–24], with some studies reporting that preschool children are more often physicallyactive on weekend days than on weekdays in Australia and England, for example [21,25], while othersfound that preschool children undertook more total PA and MVPA during preschool hours in Sweden,Denmark, England and Finland [22,24,26,27]. Therefore, additional research is required to identify anypotential differences in PA between weekdays and weekend days in preschool children.
The accurate measurement of PA is fundamental in evaluating the effectiveness of interventionsand understanding relationships between PA and health [28]. Measuring habitual PA accurately isbeneficial when observing the frequency and distribution of PA in preschool children and identifyingthe amount of PA that could influence their health. The objective monitoring of PA is importantand accelerometers have become a reliable and valid way of estimating children’s PA [29,30], whilstalso showing promise in monitoring preschool children’s PA. Accelerometers are an appropriateobjective measure in terms of validity, reliability and practicality as a method for the measurementof intensity, duration and frequency of movement for sedentary behaviour and habitual PA in 3–5year olds [1,31–33]. Accelerometers can be set at different sampling intervals, with some studiesbeing set at one-minute intervals [1,34]. However, one-minute sampling intervals may mask the shortintermittent bursts of activity that are representative of young children and therefore shorter samplingintervals have been recommended [20,35]. As very few studies have used objective monitoring of PAvia accelerometery in preschool children, then further research is required to examine the intensity ofPA that these children participate in on weekdays in preschool and at the weekend.
This is the first study to compare PA levels between week and weekend days, using objectivemeasurements in the form of the newly calibrated GENEActiv accelerometer cut-points for preschoolchildren in the UK. This study aims to determine whether the intensity and duration of PA variesbetween weekdays and weekend days.
2. Materials and Methods
2.1. Participants and Data Collection
Participants in this study were preschool aged children from 11 preschools in North Warwickshire,England. This study was completed in the Nuneaton and Bedworth Borough, which is in the top10% of the most deprived Super Output Area’s in England on the Index of Multiple Deprivation(IMD) and is ranked as the 111th most deprived Local Authority District out of 326 in England [36].Ethics approval (P45654) was granted by the Faculty of Health and Life Sciences Ethics Committee,Coventry University and parental consent was obtained. The participants were a convenience sampleand included 185 preschool children (99 boys, 86 girls), aged 3–4 years, from a deprived area.
2.2. Anthropometric Assessment
Height was measured to the nearest mm, in bare or sock feet, using a standard portable stadiometer(Leicester height measure, Leicester, UK). Body mass was measured to the nearest 0.1 kg using portableweighing scales (Tanita scales, Tokyo, Japan); the children were lightly dressed (t-shirt and lighttrousers/skirt) and barefoot or in socks. The measurements were repeated twice and the average score
88
J. Funct. Morphol. Kinesiol. 2019, 4, 65
was recorded. Body mass index (BMI) was calculated as kg/m2 and weight status was categorised asoverweight/obese or normal weight using standardised international cut-points [37].
2.3. Assessment of Physical Activity
Daily total PA was measured using a GENEActiv waveform triaxial accelerometer (ActivInsightsLtd., Kimbolton, UK). The accelerometer measured at 10 epochs (s) and a sample frequency of 100 Hz,so as to enable an accurate assessment of the intermittent activities of preschool children [38–40].The GENEA accelerometer was attached using a watch strap and positioned over the dorsal aspect ofthe right wrist, midway between the radial and ulnar styloid process. Accelerometers worn on the wristare more convenient to wear and lead to greater compliance during prolonged wearing when assessinghabitual activity [41]. The participants wore the accelerometers for four consecutive days; this includedtwo weekdays in the setting and two weekend days. Each child was required to wear the accelerometerfor a minimum of 6 h per day to be included in the study, although it was preferred that they wore themat all times. All children received a letter to take home describing how and when they should wearthe GENEActiv accelerometers. Non-wear time was defined as 90-minute windows of consecutivezero or nonzero counts [42]. “Nonzero” counts are caused by artefactual accelerometer movementsduring non-wear periods—for example, accidental movement of the accelerometer, such as the devicebeing nudged when on a bedside table [42]. The 90-minute window was chosen as this was foundto better predict time spent in sedentary behaviours and PA levels [42]. This said, Esliger et al. [43]suggested that a period of 20 min of consecutive zero counts is appropriate for children, as motionlessbouts of ≥20 min are biologically implausible. However, it was reported that this low thresholdcauses an unrealistically high number of non-wear periods [44]. Therefore, it was recommended touse 90 minute consecutive zero counts, as this prevents the overestimation of non-wear time and theunderestimation of sedentary behaviours in overweight to obese children [42]. The amount of weartime and percentage (%) of wear time that each child spent in different intensities of PA was calculatedfor weekdays and weekend days. It is recommended that four days, including one weekend day, isappropriate for measuring habitual PA [45]. Given the logistics of ensuring that children aged 3 yearsof age wore the accelerometer for the whole monitoring period, participants were included in thefinal data analysis providing they had worn the accelerometer for 3 days (when in the setting andat the weekend) and for a minimum of six hours each day, similar to previous research [46–48]. Ofthe 185 sample, 178 children’s accelerometer data were recorded; data for seven children were notuseable. This was due to the children either not wearing the GENEActiv accelerometers or technicaldifficulties with the accelerometers or recording of the data. The final sample included in the analysiswas 178 children (95 boys, 83 girls), aged 3–4 years. Only four out of the 178 participants were full-time;the remainder were part-time nursery attendees.
For each of the epochs (number of seconds), movement data (activity counts) were added andlogged; these were then processed and analysed. Accumulated activity counts were categorised interms of intensity such as sedentary behaviour, light, moderate and vigorous PA [1]. Cut-points forsedentary behaviour, light PA and moderate and vigorous PA were used to determine the PA intensityof the preschool children. The cut-points used were determined specifically for children aged 4–5years using GENEA accelerometers, albeit they were calibrated in a laboratory-based study; they arethe most relevant cut-points for the preschool children’s age in this study (3–4 years) as they are theclosest cut-points that are calibrated and reported in the literature [49]. The difference in age shouldhave very little impact on the results, as they are as closely aligned in age as possible and 4 yearolds/preschool children have been used for the calibration and ultimately are assessed in this study.The preschool children in the laboratory-based study that was used to determine cut-points for thiscurrent study completed six activities, which ranged from lying supine to running. They wore theGENEA accelerometers on both their left and right wrists and used a Cortex mask for gas analysis; VO2
data were used to assess criterion validity [49]. The cut-points determined were as follows: dominanthand <8.1 cpm for sedentary activity, 8.1–9.3 cpm for light activity and 9.3+ cpm for moderate and
89

J. Funct. Morphol. Kinesiol. 2019, 4, 65
vigorous PA. For the non-dominant hand, the cut-points were <5.3 cpm for sedentary activity, 5.3–8.6cpm for light activity and 8.6+ cpm for moderate and vigorous PA [49]. On the accelerometers, the‘Epoch Converter’ creates epochs of 1, 5, 10, 15, 30 or 60 s; the means that for each parameter, theSum Vector Magnitude is calculated for each epoch [50]. Children were classified as either meeting(sufficiently active) or not meeting (insufficiently active) the requirement of 180 min per day of PA for0–5 year olds.
2.4. Statistical Analysis
The percentage of time in sedentary behaviour, light PA and MVPA was determined, as wasthe mean amount of time (min) spent in sedentary behaviour, light PA and MVPA, during weekand weekend days. Each data set was tested for skewness and kurtosis. Arcsine or inverse datatransformation techniques were then used on any data set that did not have a normal distribution,as follows: mean time sedentary for the week and weekend (arcsine transformation); MVPA at theweekend (inverse transformation); percentage time for sedentary behaviour at the weekend (inversetransformation); and MVPA at the weekend (inverse transformation). Any differences in PA due tosex or day of the week were analysed using a series (separate ANCOVA for each category of PA) of2 (weekday vs. weekend) × 2 (sex) repeated measures analysis of covariance (ANCOVA) controllingfor wear time. The Statistical Package for Social Sciences (Version 22, SPSS Inc., Chicago, Ill, USA) wasused for statistical analysis and the alpha level was set a priori at P = 0.05.
3. Results
Descriptive characteristics, including mean time (min) spent in the different intensities of PAduring the week and weekend days, are summarised in Table 1. Of the sample, none of the 178 childrenmet the UK recommended 180 min or more of PA (light, moderate and vigorous intensity) per day.Two, circa 1%, of the children did meet the 180 mins on one of their days, but not on all days.
Table 1. Children’s descriptive characteristics. Data represent mean ± SD, n = 178.
Characteristics Values
Age (years) 3.4 ± 0.5Mass (kg) 16.8 ± 2.5Height (cm) 101.7 ± 4.8Body mass index (kg/m2) 16.3 ± 1.9Waist circumference (cm) 55.0 ± 3.9Mean wear time (min) during the week 572.0 ± 99.0Mean wear time (min) during the weekend 581.0 ± 126.0Mean sedentary behaviour (min) during the week 527.0 ± 94.0Mean sedentary behaviour (min) during the weekend 565.0 ± 117.0Mean light physical activity (PA) (min) during the week 10.0 ± 15.0Mean light PA (min) during the weekend 7.0 ± 10.0Mean moderate and vigorous PA (MVPA) (min) during the week 36.0 ± 22.0Mean moderate and vigorous PA (min) during the weekend 12.0 ± 9.0Sedentary behaviour (%) during the week 91.9 ± 4.3Sedentary behaviour (%) during the weekend 96.9 ± 2.0Light PA (%) during the week 1.8 ± 2.4Light PA (%) during the weekend 1.1 ± 1.5MVPA (%) during the week 6.3 ± 3.6MVPA (%) during the weekend 2.0 ± 1.6Met PA guidelines of at least 180 min per day total PA (%) Sufficiently Active
Insufficiently Active0
100
Preschool children respectively spent 91.9% and 1.8% of time in sedentary behaviour and lightPA on weekdays, and 96.9% and 1.1% of time in sedentary behaviour and light PA at the weekend.During weekdays and weekend days, 6.3% and 2.0% of time was spent in moderate and vigorous PA,
90
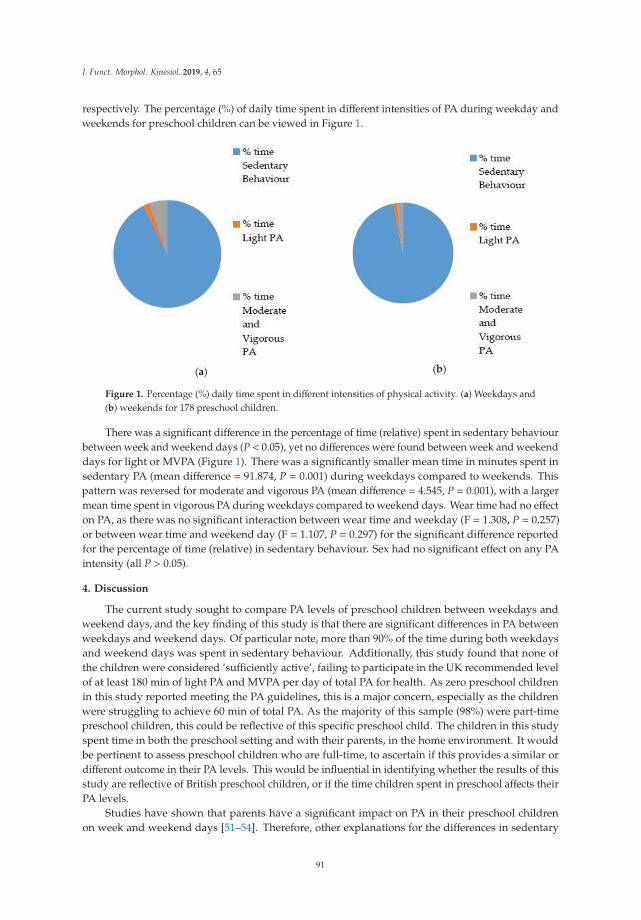
J. Funct. Morphol. Kinesiol. 2019, 4, 65
respectively. The percentage (%) of daily time spent in different intensities of PA during weekday andweekends for preschool children can be viewed in Figure 1.
(a) (b)
Figure 1. Percentage (%) daily time spent in different intensities of physical activity. (a) Weekdays and(b) weekends for 178 preschool children.
There was a significant difference in the percentage of time (relative) spent in sedentary behaviourbetween week and weekend days (P < 0.05), yet no differences were found between week and weekenddays for light or MVPA (Figure 1). There was a significantly smaller mean time in minutes spent insedentary PA (mean difference = 91.874, P = 0.001) during weekdays compared to weekends. Thispattern was reversed for moderate and vigorous PA (mean difference = 4.545, P = 0.001), with a largermean time spent in vigorous PA during weekdays compared to weekend days. Wear time had no effecton PA, as there was no significant interaction between wear time and weekday (F = 1.308, P = 0.257)or between wear time and weekend day (F = 1.107, P = 0.297) for the significant difference reportedfor the percentage of time (relative) in sedentary behaviour. Sex had no significant effect on any PAintensity (all P > 0.05).
4. Discussion
The current study sought to compare PA levels of preschool children between weekdays andweekend days, and the key finding of this study is that there are significant differences in PA betweenweekdays and weekend days. Of particular note, more than 90% of the time during both weekdaysand weekend days was spent in sedentary behaviour. Additionally, this study found that none ofthe children were considered ‘sufficiently active’, failing to participate in the UK recommended levelof at least 180 min of light PA and MVPA per day of total PA for health. As zero preschool childrenin this study reported meeting the PA guidelines, this is a major concern, especially as the childrenwere struggling to achieve 60 min of total PA. As the majority of this sample (98%) were part-timepreschool children, this could be reflective of this specific preschool child. The children in this studyspent time in both the preschool setting and with their parents, in the home environment. It wouldbe pertinent to assess preschool children who are full-time, to ascertain if this provides a similar ordifferent outcome in their PA levels. This would be influential in identifying whether the results of thisstudy are reflective of British preschool children, or if the time children spent in preschool affects theirPA levels.
Studies have shown that parents have a significant impact on PA in their preschool childrenon week and weekend days [51–54]. Therefore, other explanations for the differences in sedentary
91

J. Funct. Morphol. Kinesiol. 2019, 4, 65
behaviour between the week and weekend days could be a result of parents displaying higher sedentarybehaviours when they are with their children, and children who are exposed to these behaviours copythem during weekend days [55]. This is supported by Sigmundová et al. [56], who found that childrenfrom both urban and rural populations had a stronger significant association with sedentary behaviourduring weekend days as compared to weekdays. Moore et al. [57] discovered that middle-classAmerican children aged 4–7 years old (incorporating the preschool years), who have one physicallyactive parent, had a relative odds ratio of their child being active between 2.0 (mother) and 3.5 (father).However, if both parents were active then the relative odds ratio was 5.8, with no difference reportedbetween week versus weekend day. Sigmundová et al. [56] monitored children from both urban andrural areas, and discovered that if mothers are more active, then their children are more likely to bemore physically active. This was observed to be significant only on weekend days. We do not knowthe activity patterns of the parents of the children who took part in the present study, but this mayhave been a contributing factor to the sedentary behaviour patterns that were reported.
A second key finding of this present study is that there are differences in the percentage of timespent in different intensities of PA between weekdays and weekend days for preschool children.During weekdays, the children spent significantly less time in sedentary behaviours (91.9% vs. 96.9%),when compared to weekends. This finding was recorded using the right wrist, which in this study wasthe dominant hand for 169 of the children (91.4% of the sample). This finding contradicts research byVásquez et al. [58] in Chilean children (North of Santiago City), who objectively measured PA via aTritrac-R3D research ergometer and reported that preschool children spent more time in sedentaryactivities in day-care centres (week vs. weekend) and the children were more active at home atweekends. These differences were also linked with the children’s diet and it was discovered thatthe energy balance was appropriate during the week, as the energy intake in the preschools wasreduced. This could explain the differences, as the day-care settings were providing less energy intake;therefore, the children may have been less inclined to be active. Equally, these findings could havebeen representative of the cultural background, geographical location or differences in the methodused for objective measurement of the children involved. A further reason for potential differencesbetween the sedentary behaviours of preschool children during the week and weekend days couldbe attributed to the time that children spend watching television or playing on computer games,smart phones/tablets (screen time). Previous research has shown that Australian preschool childrenfrom different socio-economic backgrounds whose parents limit television viewing spent significantlyless time in sedentary behaviours [59]. A study of preschool children from a mixed socio-economicarea in the southwest of England reported that 12% of boys and 8% of girls watched ≥2 hours ofTV each weekday, compared to 45% of boys and 43% of girls who watched ≥2 h a day on weekenddays [60]. The amount of screen time that children in this current study participated in could havebeen a contributing factor to the differences in time spent in sedentary behaviours during week andweekend days. Parental influence on PA during weekend days may therefore be an important factorthat requires greater attention by public health professionals; this could be a result of parents lackingan understanding of appropriate PA to deliver to their children, or a lack of time. Despite this, theextant literature on parental influence on PA levels in British preschool children is scarce. Additionalwork is required on this topic, in the context of weekday to weekend day variations in children’s PA.Equally, the intensity levels of PA of preschool children could be improved through interventions, bothin preschools and at home with parents.
Research has reported PA levels and sedentary time as being highly varied and inconsistentbetween studies across different countries, making it hard to determine preschool children’s true PAlevels and sedentary behaviour [61]. Reilly [12] measured PA levels from studies over the period of2000–2008 and discovered that sedentary behaviour was particularly high. However, more recently,in a data collection period from 2006–2009 and a 7 month data collection period in the year 2013, itwas reported that 100% of UK preschool children met the recommend daily PA guidelines [22,23].The current data from this study show that a substantial proportion of each day is spent in sedentary
92

J. Funct. Morphol. Kinesiol. 2019, 4, 65
behaviour in British preschool children from a deprived area. This finding has important publichealth implications around the excessively high sedentary behaviours displayed by preschool childrenin the UK and therefore provides a clear indication that interventions aiming to convert sedentarybehaviours into light or MVPA are required. These data were obtained across a wide measurementperiod and across all seasons and therefore provide a spread of representative data for the whole ofthe year. However, this study did not assess each child at different points throughout the year, as it isvery labour-intensive and demanding to assess PA in preschool children at one time point and thenassess them again across different seasons, and would likely lead to much higher attrition. Therefore,this study did not consider seasonal adjustments. However, future research may consider this, toidentify if preschool children are more active in the summer months in England, when compared tothe cold environment in the winter months, similar to the results found in 437 preschool children inAmerica [62]. However, this was in contrast to a study of 214 children aged 3–5 years in America,which reported no differences in PA levels between the summer and autumn months [63]. Moreover,further studies in Sweden and America [64,65] also found no variation according to the season ofmeasurement in preschool children. As none of these studies were conducted in England, futureresearch into the seasonal variation of PA in England would be beneficial.
The amount of time spent in different intensities of PA was found to vary between weekdays andweekends, with less moderate and vigorous PA accrued during weekends. However, MVPA was verylimited in both parts of the week. Such a finding might be suggestive that regular engagement in thepreschool environment provides greater opportunities to accrue PA, which may not be present in thehome setting. The light intensity minutes were very low during both the week and weekend days.The wrist-worn accelerometers may not be very precise at detailing light ambulation, where playingwith Lego®was at the top end of the sedentary category. Therefore, future research to determine theaccuracy of the light PA classifications would be beneficial. Similar research using Actigraphs hasshown that using the cut-point of 160 cpm to distinguish light intensity from sedentary behavioursis questionable [66]. It is believed that this threshold may misclassify sedentary behaviours such asseated play and crafts as light intensity, which would cause an overestimation of total PA minutesand underestimate the steps per day [66] that are required to achieve the daily UK 180 minutes ofrecommended PA. This is a current problem, as there is no consensus on the optimal cut-points fordistinguishing sedentary from light PA in preschool children [56]. Also, the cut-points used for lightintensity PA in this study were taken from laboratory-derived tasks that were constant in nature,whereas the real-life activities of preschool children are more varied and intermittent. This may havemade it more difficult to differentiate light PA from sedentary behaviour, as the determination isdependent on the cut-point used. However, this is a feature of most of the research using accelerometersto classify/assess PA [66,67]. Therefore, it could be suggested that the cut-points used in this study weretoo conservative, however, as they are the only cut-points related to preschool children specifically forthe GENEActiv accelerometers, then they were the most appropriate to have adopted.
Using wrist-worn accelerometers can be logistically and practically challenging with preschoolchildren [31], as the accelerometer can sometimes be regarded as uncomfortable or an annoyance whenworn for long periods of time, thus questioning the appropriateness of the accelerometer for preschoolchildren. In the current study, although a cut-off of 6 h per day was employed for inclusion in thedata analysis, the participants exceeded this value with total mean wear time per day for all days,which was over 577 min (>9.6 h). The mean wear time for weekdays was 573 min (9.6 h) and that forweekend days was 581 min (>9.7 h). We took this to be an indication that the majority of the childrenin this study were comfortable wearing the accelerometers. It could be questioned whether <600min/day (10 h) is a true representation of a preschool child’s whole day (24 h). It would be beneficialfor future research to measure PA for a greater duration, for example 12 hours, to see if this affects thetotal PA in a day, in terms of less sedentary behaviours and more MVPA. As mentioned, it could bequestioned whether wearing the accelerometer on the wrist is suitable for preschool children. Researchhas looked at the difference between wearing a wrist and hip accelerometer on preschool children
93

J. Funct. Morphol. Kinesiol. 2019, 4, 65
and one study in Scotland found that wrist-worn accelerometers provided a valid estimate of totalphysical activity, whereas hip-worn accelerometers showed a reasonable agreement to cut-points [68].This was supported by a study in Stockholm, Sweden, which similarly monitored preschool childrenand found that wrist-worn accelerometers performed more accurately when assessing time spentin sedentary, light activity and MVPA, when compared to hip-worn accelerometers [69]. In terms astudy by Johannsson et al. [69], however, there were stark differences between the mean (SD) countsmeasured over 5 s for wrist and hip activity, with the vector magnitude (a combined measure of thethree axes, x, y and z) when watching a cartoon measuring 91 (73) for the wrist and 14 (15) for thehip, and when dancing, the 1093 (330) was measured for the wrist and 396 (148) for the hip. Theseare large contrasts, highlighting that where the accelerometers are worn is an important factor to beconsidered. This present study had the preschool children wearing them on their wrist, which, inaccordance with other studies [68,69], is the more accurate and valid place to wear them when usingthe vector magnitude measure, as opposed to the vertical axis measure.
Although the current study successfully used accelerometery as an objective monitoring tool inpreschool children, some limitations should also be considered. Some of the accelerometers failedto record data; this manufacturer problem caused no data to be recorded for seven participants.GENEActiv accelerometers worn at the wrist may not be capable of detailing light ambulation precisely,as possibly indicated by the low levels of light PA reported. Equally, wrist-worn accelerometers inyoung children may also impact the light intensity PA data; however, the research does appear to showthat the location, whether at the wrist or hip, has no significant effect on the PA levels reported [70,71].As previously stated, the preschool children were assessed once in a season and not across all seasons.Although children were assessed throughout different seasons, which provided representative data,the lack of assessment of each child in all seasons should be considered a limitation of the study. Thepreschool children that were monitored were drawn from a deprived part of the UK. It has beenreported that the prevalence of obesity amongst 4–5 year olds in the most deprived 10% of England isapproximately double the levels of the least deprived 10% of England [72]. In this current study, 10.8%(20 out of 185) were considered obese. Low socio-economic status (SES) children face greater barriersto becoming physically active and, as they age, low SES individuals have higher rates of obesity andassociated comorbidities [73]. Additionally, people from lower SES groups predominantly live inareas that do not support walking and cycling [74]. This viewpoint suggests that deprived areas donot facilitate PA as effectively as other areas and, as such, people living in deprived areas may notparticipate in PA as frequently. This said, further research comparing both high and low socio-economicstatus groups would be welcome to extend the literature on preschool children. Understanding thelevels of PA in this group is useful to allow for the planning of early interventions to improve currentand future health.
5. Conclusions
The current study is the first to objectively compare PA levels between weekdays and weekenddays in preschool children in the UK using GENEActiv accelerometers, and one of the first to reportobjectively monitored PA levels of preschool children from deprived areas in the UK. The results ofthis study suggest that none of the preschool children in this sample achieved the UK recommendedguidelines of PA for health. Additionally, and of great concern, it was found that preschool childrenspend 90% of their time engaged in sedentary behaviours. This study indicates that preschool childrenparticipate in more MVPA during weekdays compared to weekend days; however, participation inMVPA was minimal throughout the week. This information can help to promote future interventionsthat focus on enhancing PA and encouraging participation in LPA and MVPA during both week andweekend days, so as to improve physical development and a healthy weight status in preschool children.
Author Contributions: C.M.P.R.: conception and design of the study, data acquisition (participant measurements),analysis of the data, preparation of the tables and figures, preparation of the manuscript, finding relevantreferences and final approval of the manuscript. M.J.D.: conception and design of the study, analysis of the data,
94

J. Funct. Morphol. Kinesiol. 2019, 4, 65
writing—review and editing and final approval of the manuscript. R.S.J.: analysis of the data, writing—reviewand editing.
Funding: This research received no external funding.
Conflicts of Interest: The authors declare no conflict of interest.
References
1. Adolph, A.L.; Puyau, M.R.; Vohra, F.A.; Nicklas, T.A.; Zakeri, I.F.; Butte, N.F. Validation of unixal and triaxalaccelerometers for the assessment of physical activity in preschool children. J. Phys. Act. Health 2012, 9,944–953. [CrossRef] [PubMed]
2. Esliger, D.W.; Tremblay, M.S. Physical activity and inactivity profiling: The next generation. Can. J.Public Health 2007, 98, S195–S207. [CrossRef] [PubMed]
3. Strong, W.B.; Malina, R.M.; Blimkie, C.J.; Daniels, S.R.; Dishman, R.K.; Gutin, B.B.; Hergenroeder, A.C.;Must, A.; Nixon, P.A.; Pivarnik, J.M.; et al. Evidence based physical activity for school-age youth. J. Pediatr.2005, 146, 732–737. [CrossRef] [PubMed]
4. Tucker, P. The physical activity levels of preschool-aged children: A systematic review. Early Child. Res. Q.2008, 23, 547–558. [CrossRef]
5. World Health Organization. Global Strategy on Diet, Physical Activity and Health. ChildhoodOverweight and Obesity. Available online: https://www.who.int/dietphysicalactivity/childhood/en/(accessed on 16 May 2019).
6. de Onis, M.; Blossner, M. Prevalence and trends of overweight among preschool children in developingcountries. Am. J. Clin. Nutr. 2000, 72, 1032–1039. [CrossRef] [PubMed]
7. Guo, S.S.; Chumlea, W.C. Tracking of body mass index in children in relation to overweight in adulthood.Am. J. Clin. Nutr. 1999, 70, S145–S148. [CrossRef] [PubMed]
8. Reilly, J.J.; Jackson, D.M.; Montgomery, C.; Kelly, L.A.; Slater, C.; Grant, S.; Paton, J.Y. Total energyexpenditure and physical activity in young Scottish children: Mixed longitudinal study. Lancet 2004, 363,211–212. [CrossRef]
9. Reilly, J.J.; Armstrong, J.; Dorosty, A.R.; Emmett, P.M.; Ness, A.; Rogers, I.; Steer, C.; Sheriff, A. Earlylife risk factors for childhood obesity: Cohort study. Br. Med. J. 2005, 330, 1357–1362. Available online:http://www.bmj.com/content/330/7504/1357 (accessed on 24 October 2012).
10. Jackson, D.M.; Reilly, J.J.; Kelly, L.A.; Montgomery, C.; Grant, S.; Paton, J.Y. Objectively measured physicalactivity in a representative sample of 3- to 4-year old children. Obes. Res. 2003, 11, 420–425. [CrossRef][PubMed]
11. Raustorp, A.; Pagels, P.; Boldemann, C.; Cosco, N.; Söderström, M.; Martensson, F. Accelerometer measuredlevel of physical activity indoors and outdoors during preschool time in Sweden and the United States.J. Phys. Act. Health 2012, 9, 801–808. [CrossRef] [PubMed]
12. Reilly, J.J. Low levels of objectively measured physical activity in pre-schoolers in childcare. Med. Sci.Sports Exerc. 2010, 42, 502–507. [CrossRef]
13. Department of Health. Physical Activity Guidelines for Early Years (under 5s)—for Children Who Are Capableof Walking. Available online: https://www.gov.uk/government/publications/uk-physical-activity-guidelines(accessed on 18 May 2016).
14. National Association for Sport and Physical Education. Active Start: A Statement ofPhysical Activity Guidelines for Children from Birth to Age 5, 2nd Edition. Available online:https://www.columbus.gov/uploadedFiles/Public_Health/Content_Editors/Planning_and_Performance/Healthy_Children_Healthy_Weights/NASPE%20Active%20Start.pdf (accessed on 18 March 2016).
15. Reilly, J.J.; Okely, A.D.; Almond, L.; Cardon, G.; Prosser, L.; Hubbard, J. Making the Case for UKPhysical Activity Guidelines for Early Years: Recommendations and Draft Summary statements Basedon the Current Evidence. Working Paper. Available online: http://www.google.co.uk/url?sa=t&rct=j&q=&esrc=s&frm=1&source=web&cd=2&sqi=2&ved=0CCoQFjAB&url=http%3A%2F%2Fwww.paha.org.uk%2FFile%2FIndex%2Fe53f5ad2--85ed-443b-ae85--9f1d00fc9ee4&ei=UTSRUOKLJsq50QXQ4IDoBw&usg=AFQjCNEhmTG6oSxvGXpFWK5-pAdV1Kn0ww&sig2=DkO1rbQBs6MWNMPp6rHjyw (accessed on19 December 2012).
95

J. Funct. Morphol. Kinesiol. 2019, 4, 65
16. Montgomery, C.; Reilly, J.J.; Jackson, D.M.; Kelly, L.A.; Slater, C.; Paton, J.Y.; Grant, S. Relation betweenphysical activity and energy expenditure in a representative sample of young children. Am. J. Clin. Nutr.2004, 80, 591–596. [CrossRef] [PubMed]
17. Pate, R.R.; McIver, K.; Dowda, M.; Brown, W.H.; Addy, C. Directly observed physical activity levels inpreschool children. J. Sch. Health 2008, 78, 438–444. [CrossRef] [PubMed]
18. Health and Social Care Information Centre. Health Survey for England—2012. Available online: http://www.hscic.gov.uk/catalogue/PUB13218 (accessed on 10 July 2016).
19. National Health Service (NHS) Digital. Health Survey for England. 2015. Available online: http://www.content.digital.nhs.uk/catalogue/PUB22610/HSE2015-Child-phy-act.pdf (accessed on 12 April 2017).
20. Pate, R.R.; Pfeiffer, K.A.; Trost, S.G.; Ziegler, P.; Dowda, M. Physical activity among children attendingpreschools. Pediatrics 2004, 114, 1258–1263. [CrossRef] [PubMed]
21. O’Dwyer, M.; Fairclough, S.J.; Ridgers, N.D.; Knowles, Z.R.; Foweather, L.; Stratton, G. Patterns of ObjectivelyMeasured Moderate-to-Vigorous Physical Activity in Preschool Children. J. Phys. Act. Health 2014, 11,1233–1238. [CrossRef] [PubMed]
22. Hesketh, K.R.; McMinn, A.M.; Ekelund, U.; Sharp, S.J.; Collings, P.J.; Harvey, N.C.; Godfrey, K.M.; Inskip, H.M.;Cooper, C.; van Sluijs, E.M.F. Objectively measured physical activity in four-year-old British children: Across-sectional analysis of activity patterns segmented across the day. Int. J. Behav. Nutr. Phys. Act. 2014,11, 1. [CrossRef] [PubMed]
23. Hesketh, K.R.; Griffin, S.J.; van Sluijs, E.M.F. UK preschool-aged children’s physical activity levels in childcareand at home: A cross-sectional exploration’. Int. J. Behav. Nutr. Phys. Act. 2015, 12, 123. [CrossRef] [PubMed]
24. Møller, N.C.; Christensen, L.B.; Mølgaard, C.; Ejlerskov, K.T.; Pfeiffer, K.A.; Michaelsen, F. Descriptiveanalysis of preshool physical activity and sedentary behaviours—A cross sectional study of 3-year oldsnested in the SKOT cohort. BMC Public Health 2017, 17, 613. [CrossRef] [PubMed]
25. Hinkley, T.; Salmon, J.; Okely, A.D.; Crawford, D.; Hesketh, K. Preschoolers’ physical activity, screen time,and compliance with recommendations. Med. Sci. Sports Exerc. 2012, 44, 458–465. [CrossRef] [PubMed]
26. Berglind, D.; Tynelius, P. Objectively measured physical activity patterns, sedentary time and parent-reportedscreen-time across the day in four-year-old Swedish children. BMC Public Health 2017, 18, 69. [CrossRef][PubMed]
27. Soini, A.; Tammelin, T.; Sääkslahti, A.; Watt, A.; Villberg, J.; Kettunen, T.; Mehtälä, A.; Poskiparta, M. Seasonaland daily variation in physical activity among three-year-old Finnish preschool children. Early Child Dev.Care 2014, 184, 589–601. [CrossRef]
28. Haskell, W.L.; Lee, I.L.; Pate, R.R.; Powell, K.E.; Blair, S.N.; Franklin, B.A.; Macera, C.A.; Heath, G.W.;Thompson, P.D.; Bauman, A. Physical activity and public health: Updated recommendation for adults fromthe American College of Sports Medicine and the American Heart Association. Med. Sci. Sports Exerc. 2007,39, 1423–1434. [CrossRef] [PubMed]
29. Pate, R.R.; Almeida, M.J.; McIver, K.L.; Pfeiffer, K.A.; Dowda, M. Validation and calibration of an accelerometerin preschool children. Obesity 2006, 14, 2000–2006. [CrossRef] [PubMed]
30. Phillips, L.R.S.; Parfitt, G.; Rowlands, A.V. Calibration of the GENEA accelerometer for assessment of physicalactivity intensity in children. J. Sci. Med. Sport 2013, 16, 124–128. [CrossRef] [PubMed]
31. Cliff, D.P.; Okely, A.D.; Smith, L.M.; McKeen, K. Relationships between fundamental movement skills andobjectively measured physical activity in preschool children. Pediatr. Exerc. Sci. 2009, 21, 436–449. [CrossRef][PubMed]
32. Reilly, J.J.; Coyle, J.; Kelly, L.; Burke, G.; Grant, S.; Paton, J.Y. An objective method for measurement ofsedentary behaviour in 3- to 4-year olds. Obes. Res. 2003, 11, 1155–1158. [CrossRef] [PubMed]
33. Westerterp, K.R. Physical activity assessment with accelerometers. Int. J. Obes. Relat. Met. Disord. 1999, 23,S45–S49. [CrossRef]
34. Evenson, K.R.; Terry, J.W. Assessment of differing definitions of accelerometer non-wear time. Res. Q. Exerc.Sport 2009, 80, 355–362. [CrossRef] [PubMed]
35. Rowlands, A.V. Accelerometer assessment of physical activity in children: An update. Pediatr. Exerc. Sci.2007, 19, 252–266. [CrossRef] [PubMed]
36. Warwickshire Government. Warwickshire Joint Strategic Needs Assessment (JSNA) The Essential Tool toInform Commissioning. Deprivation in Warwickshire. Available online: http://hwb.warwickshire.gov.uk/warwickshire-people-and-place/deprivation/ (accessed on 21 June 2019).
96

J. Funct. Morphol. Kinesiol. 2019, 4, 65
37. Cole, T.J.; Bellizzi, M.C.; Flegal, K.M.; Dietz, W.H. Establishing a standard definition for children overweightand obesity worldwide: International survey. BMJ 2000, 320, 1240–1243. [CrossRef] [PubMed]
38. Hasselstrøm, H.; Karlsson, K.M.; Hansen, S.E.; Grønfeldt, V.; Froberg, K.; Andersen, L.B. Peripheral bonemineral density and different intensities of physical activity in children 6–8 years old: The CopenhagenSchool Child Intervention Study. Calcif. Tissue Int. 2007, 80, 31–38. [CrossRef] [PubMed]
39. Obeid, J.; Nguyen, T.; Gabel, L.; Timmons, B.W. Physical activity in Ontario preschoolers: Prevalence andmeasurement issues. Appl. Physiol. Nutr. Metab. 2011, 36, 291–297. [CrossRef]
40. Vale, V.; Santos, R.; Silva, P.; Soares-Miranda, L.; Mota, J. Preschool Children Physical Activity Measurement:Importance of Epoch Length Choice. Pédiatr. Exerc. Sci 2009, 21, 413–420. [CrossRef] [PubMed]
41. Zhang, S.; Rowlands, A.V.; Murray, P.; Hurst, T. Physical activity classification using the GENEA wrist-wornaccelerometer. Med. Sci. Sports Exerc. 2012, 44, 742–748. [CrossRef] [PubMed]
42. Choi, L.; Liu, Z.; Matthews, C.E.; Buchowski, M.S. Validation of accelerometer wear and nonwear timeclassification algorithm. Med. Sci. Sports Exerc. 2011, 43, 357–364. [CrossRef]
43. Esliger, D.W.; Copeland, J.; Barnes, J.D.; Tremblay, M.S. Standardizing and Optimizing the Use ofAccelerometer Data for Free-Living Physical Activity Monitoring. J. Phys. Act. Health 2005, 3, 366–383.[CrossRef]
44. Chinapaw, M.J.M.; de Niet, M.; Verloigne, M.; De Bourdeaudhuij, I.; Brug, J.; Altenburg, T.M. From sedentarytime to sedentary patterns: Accelerometer data reduction decisions in youth. PLoS ONE 2014, 9, e111205.[CrossRef]
45. Trost, S.G.; Pate, R.R.; Freedson, P.S.; Sallis, J.F.; Taylor, W.C. Using objective physical activity measures withyouth: How many days of monitoring are needed? Med. Sci. Sports Exerc. 2000, 32, 426–431. [CrossRef]
46. Benham-Deal, T. Preschool children’s accumulated and sustained physical activity. Percept. Mot. Ski. 2005,100, 443–450. [CrossRef]
47. King, N.; Horrocks, C. Interviews in Qualitative Research; Sage: London, UK, 2010.48. Trost, S.G.; Sirard, J.R.; Dowda, M.; Pfeiffer, K.A.; Pate, R.R. Physical activity in overweight and
non-overweight preschool children. Int. J. Obes. Relat. Metab. Disord. 2003, 27, 834–839. [CrossRef]49. Roscoe, C.M.P.; James, R.; Duncan, M. Calibration of GENEActiv accelerometer wrist cut-points for the
assessment of physical activity intensity of preschool aged children. Eur. J. Pediatr. 2017, 176, 1093–1098.[CrossRef]
50. GENEActiv. GENEActiv Instructions Manual version 1.2. 2012. Available online: http://www.geneactiv.org/wpcontent/uploads/2014/03/geneactiv_instruction_manual_v1.2.pdf (accessed on 18 January 2018).
51. Hesketh, K.R.; Goodfellow, L.; Ekelund, U.; McMinn, A.M.; Godfrey, K.M.; Inskip, H.M.; Cooper, C.;Harvey, N.C.; van Sluijs, E.M. Activity levels in mothers and their preschool children. Pediatrics 2014, 133,e973–e980. [CrossRef]
52. Oliver, M.; Schofield, G.M.; Schluter, P.J. Parent influences on preschoolers’ objectively assessed physicalactivity. J. Sci. Med. Sport 2010, 13, 403–409. [CrossRef]
53. Sigmundová, D.; Sigmund, E.; Badura, P.; Vokácová, J.; Trhliková, L.; Bucksch, J. Weekday-weekend patternsof physical activity and screen time in parents and their pre-schoolers. BMC Public Health 2016, 16, 898.[CrossRef]
54. Vollmer, R.L.; Adamsons, K.; Gorin, A.; Foster, J.S.; Mobley, A.R. Investigating the relationship of body massindex, diet quality, and physical activity level between fathers and their preschool-aged children. J. Acad.Nutr. Diet. 2015, 115, 919–926. [CrossRef]
55. Sigmund, E.; Turonová, K.; Sigmundová, D.; Pridalová, M. The effect of parent’s physical activity andinactivity on their children’s physical activity and sitting. Acta Univ. Palacki. Olomuc. Gymn. 2008, 38, 17–24.
56. Sigmundová, D.; Sigmund, E.; Vokácová, J.; Kopcáková, J. Parent-child associations in pedometer-determinedphysical activity and sedentary behaviour on weekdays and weekends in random samples of families in theCzech Republic. Int. J. Environ. Res. Public Health 2014, 11, 7163–7181. [CrossRef]
57. Moore, L.L.; Lombardi, D.A.; White, M.J.; Campbell, J.L.; Oliveria, S.A.; Ellison, R.C. Influence of parents’physical activity levels on activity levels of young children. J. Pediatr. 1991, 118, 215–219. [CrossRef]
58. Vasquez, F.; Salazar, G.; Andrade, M.; Vasquez, L.; Diaz, E. Energy balance and physical activity in obesechildren attending daycare centres. Eur. J. Clin. Nutr. 2006, 60, 1115–1121. [CrossRef]
97
J. Funct. Morphol. Kinesiol. 2019, 4, 65
59. Hnatiuk, J.A.; Salmon, J.; Campbell, K.J.; Ridgers, N.D.; Hesketh, K.D. Tracking of maternal self-efficacyfor limiting young children’s television viewing and associations with children’s television viewing time:A longitudinal analysis over 15-months. BMC Public Health 2015, 15, 517. [CrossRef]
60. Jago, R.; Thompson, J.; Sebire, S.; Wood, L.; Pool, L.; Zahra, J.; Lawlor, D. Crosssectional associations betweenthe screen-time of parents and young children: Differences by parent and child gender and day of the week.Int. J. Behav. Nutr. Phys. Act. 2014, 11, 54. [CrossRef]
61. O’Brien, K.T.; Vanderloo, L.M.; Bruijns, B.A.; Truelove, S.; Tucker, P. Physical activity and sedentary timeamong preschoolers in centre-based childcare: A systematic review. Int. J. Behav. Nutr. Phys. Act. 2018, 15,117. [CrossRef]
62. Rundle, A.; Goldstein, I.F.; Mellins, R.B.; Ashby-Thompson, M.; Hoepner, L.; Jacobson, J.S. Physical Activityand Asthma Symptoms among New York City Head Start Children. J. Asthma 2009, 46, 803–809. [CrossRef]
63. Finn, K.; Johannsen, N.; Specker, B. Factors associated with physical activity in preschool children. J. Pediatr.2002, 140, 81–85. [CrossRef]
64. Bringolf-Isler, B.; Grize, L.; Mader, U.; Ruch, N.; Sennhauser, F.H.; Braun-Fahrlander, C. Assessment ofintensity, prevalence and duration of everyday activities in Swiss school children: A cross-sectional analysisof accelerometer and diary data. Int. J. Behav. Nutr. Phys. Act. 2009, 6, 50. [CrossRef]
65. Burdette, H.L.; Whitaker, R.C.; Daniels, S.R. Parental report of outdoor playtime as a measure of physicalactivity in preschool-aged children. Arch. Pediatr. Adolesc. Med. 2004, 158, 353–357. [CrossRef]
66. Vale, S.; Trost, S.G.; Duncan, M.J.; Mota, J. Step based physical activity guidelines for preschool aged children.Prev. Med. 2015, 70, 78–82. [CrossRef]
67. Kim, Y.; Lee, J.-M.; Peters, B.P.; Gaesser, G.A.; Welk, G.J. Examination of different accelerometer cut-pointsfor assessing sedentary behaviours in children. PLoS ONE 2014, 9, e90630. [CrossRef]
68. Hislop, J.; Palmer, N.; Anand, P.; Aldin, T. Validity of writs worn accelerometers and comparability sites inestimating physical activity behaviour in preschool children. Physiol. Meas. 2016, 37, 1701–1714. [CrossRef]
69. Johansson, E.; Larisch, L.-M.; Marcus, C.; Hagströmer, M. Calibration and Validation of a Wrist- and Hip-WornActigraph Accelerometer in 4- Year-Old Children. PLoS ONE 2016, 11, e0162436. [CrossRef]
70. Dieu, O.; Mikulovic, J.; Fardy, P.S.; Bui-Xuan, G.; Beghin, L.; Vanhelst, J. Physical activity using wrist-wornaccelerometers: Comparison of dominant and non-dominant wrist. Clin. Physiol. Funct. Imaging 2017, 37,525–529. [CrossRef]
71. Rowlands, A.V.; Rennie, K.; Kozarski, R.; Stanley, R.M.; Eston, R.G.; Parfitt, G.C.; Olds, T.S. Children’sphysical activity assessed with wrist- and hip-worn accelerometers. Med. Sci. Sports Exerc. 2014, 46,2308–2316. [CrossRef]
72. Public Health England. NCMP Local Authority Profile. Available online: http://fingertips.phe.org.uk/profile/national-child-measurement-programme/data#gid/8000011/pat/6/ati/101/page/1/par/E12000005/are/E07000219 (accessed on 27 April 2014).
73. National Obesity Observatory. Patterns and Trends in Child Obesity. Available online: http://www.noo.org.uk/slide_sets (accessed on 25 April 2014).
74. The Marmot Review Team. Fair Society, Healthy Lives: Strategic Review of the Health Inequalities in Englandpost-2010: The Marmot Review: London. Available online: https://www.gov.uk/dfid-research-outputs/fair-society-healthy-lives-the-marmot-review-strategic-review-of-health-inequalities-in-england-post-2010(accessed on 28 March 2016).
© 2019 by the authors. Licensee MDPI, Basel, Switzerland. This article is an open accessarticle distributed under the terms and conditions of the Creative Commons Attribution(CC BY) license (http://creativecommons.org/licenses/by/4.0/).
98
Journal of
Functional Morphology and Kinesiology
Article
Joint Mobility Protection during the DevelopmentalAge among Free Climbing Practitioners: A Pilot Study
Ludovica Gasbarro 1,†, Elvira Padua 1,† , Virginia Tancredi 2, Giuseppe Annino 2,
Michela Montorsi 1,* , Grazia Maugeri 3,* and Agata Grazia D’Amico 1
1 Department of Human Sciences and Promotion of the Quality of Life, San Raffaele Roma Open University,00166 Rome, Italy; [email protected] (L.G.); [email protected] (E.P.);[email protected] (A.G.D.)
2 Department of Systems Medicine, University of Rome Tor Vergata, 00166 Rome, Italy;[email protected] (V.T.); [email protected] (G.A.)
3 Section of Anatomy, Histology and Movement Sciences, Department of Biomedical and BiotechnologicalSciences, University of Catania, 95123 Catania, Italy
* Correspondence: [email protected] (M.M.); [email protected] (G.M.);Tel.: +39-0652-252552 (M.M.); +39-0953-782127 (G.M.)
† These authors contributed equally to this work.
Received: 5 September 2019; Accepted: 10 February 2020; Published: 17 February 2020���������������
Abstract: Sport-climbing popularity increased intensely over the past years. Particularly, children’sand adolescents’ interest therein is constantly growing. Despite a large effort in preventing injuriesand muscle overloads, a fine-tuned training for each sensitive phase of child development is stillneeded. The objective of the study was to evaluate an innovative training program aimed at thepreservation of joint mobility during the developmental age. This article relies on the results of asteady training program allowing to retain joints integrity among the practice of sport climbing inchildren. Joint mobility changes have been monitored before and after a one-year training program infifteen subjects aged between 8 and 18 years. Subjects were divided into three groups depending onage (Turgor Secundus, Proceritas Secunda and Turgor Tertius). The motor tests administered were thesit-and-reach test, coxo-femoral mobility test and scapula–humeral mobility test. Our results showedthat one-year training improved joint mobility at each analyzed phase, suggesting that this trainingprogram could improve mobility and flexibility. Given the importance of joint mobility preservationfor discipline-related injuries prevention and eventually recovering, it is essential to provide a specifictraining program as a route to approach sport climbing, and even more importantly, at an early age.This work represents a preliminary study in order to demonstrate both efficacy on the joint mobilityand the requirement of our playful work to support the global sport-climbing workout.
Keywords: joint mobility; development phases; sport climbing; stretching
1. Introduction
In the last decades, rock climbing has become a popular sport among adults, adolescents andchildren, also since it being included in the 2018 Summer Olympic Youth Games in Buenos Aires andin the Summer Olympic program of the 2020 Games in Tokyo [1,2]. In using only their bare handsand climbing shoes to perform a range of hand and foot holds, athletes climb vertical walls in threedisciplines: Speed, with two climbers simultaneously climbing a route on a 15 m wall; Bouldering,with athletes performing in a given time a number of fixed routes on a 4m wall; and Lead, with athletesclimbing in a given time a 15 m wall [3]. It is possible to practice it not only outdoor, as now there alsoare indoor structures; so, this sport is becoming widespread in adults and adolescents, too.
J. Funct. Morphol. Kinesiol. 2020, 5, 14; doi:10.3390/jfmk5010014 www.mdpi.com/journal/jfmk99
J. Funct. Morphol. Kinesiol. 2020, 5, 14
Rock climbing has several benefits on both physical fitness and mental care. In fact, this sportimproves strength and endurance [4,5]. A recent study [6] has demonstrated that rock climbingsignificantly improves muscle power, ability to produce a maximal force in a short time, muscleendurance and skills to perform a continuous muscle work for a long time. This kind of sport alsohas beneficial effects on depressive disorders due to the positive effect on cognitive control of thephysical activity connected to high levels of coordination [7]. It has been demonstrated that only asingle rock-climbing session may have a positive effect in major depressive disorder [8].
Due to the increased popularity, the average age of rock climbers is decreasing, and more andmore young athletes win medals. Unfortunately, the increased number of young rock climbers involvesa major risk of an injury in the developmental age [9].
During climbing very small parts of the hands and feet are in contact with the climbingsurface [10–12] and climbers have to support and/or lift their bodies by combining a variety offinger grips with balanced, complex vertical and lateral movements and position holds [13,14]. Toguarantee grip and stability, specialized smooth climbing footwear with a sticky rubber sole are used.Although climbing shoes should fit snug without pain, the climbers tend to use smaller sizes, whichcould cause injuries or foot deformation [15].
Physical activity is essential to maintain good health and guarantee a better quality of life. Themajor sport-related benefits involve not only the body but also the mind. In fact, physical activityimproves motor and cognitive skills, reduces risk for obesity, exerts positive effects on blood pressureand lipidemia, as well as decreasing the risk of depression and other mental disorders [16,17]. However,incorrect or excessive training may lead to adverse effects, including musculoskeletal injuries, recentlydescribed in young soccer players, as well as social–occupational dysfunction [18,19]. In particular, inrock climbing the articulations are very solicited and the scientific literature reports injuries in fingersor in shoulders [15,20]. In particular, Garcia et al. [21] examined hands and fingers of young climbersversus a control group of non-climbers and they showed a non-physiological development of fingers.Similarly, another study [22] showed differences in the static scapular position between rock climbersand a control group.
In particularly the developmental age there is a major risk of sprains, strains and fractures withchronicle injuries at the upper extremity and acute injuries at the lower extremity [23]. A survey amongrock climbers [24] reports 90% upper extremity injuries, and among these the most common are fingersfollowed by shoulder/arm and elbow/forearm.
Rock climbing is positively related to increased bone mineral content, weight and mass body [15].However, for climbers a low body mass index is an ideal anthropometric requirement. Therefore, theyperform a restricted diet to maintain a low body weight, by inducing a negative effect on their healthand in particular on their bones [25,26]. Moreover, the stresses associated with rock climbing may havethe potential to create scapula–humeral or coxo–femoral injuries [22].
Despite the increase in rock-climbing practices and the consequent increase in studies on thebenefits or injuries of climbing, little data are available on adolescents.
To envision the development of effective preventative measures for preserving the joint mobilityand health of youth practitioners, the aim of this preliminary study was to evaluate the effectsof a specific pre-training rock climbing program to be administered to athletes according to theirdevelopmental status.
Therefore, in this preliminary study we evaluated an innovative training program to preservejoint mobility during the developmental age. Children were subjected to a steady training program inorder to retain joint integrity and to avoid climbing-associated injuries.
100

J. Funct. Morphol. Kinesiol. 2020, 5, 14
2. Materials and Methods
2.1. Subjects
Fifteen subjects aged between 8 and 18 years, working out regularly in sport climbing and jointmobility, were divided into 3 groups consisting of 5 athletes each according to their ages. TurgorSecundus (3 boys and 2 girls; aged between 8 and 10), Proceritas Secunda (2 boys and 3 girls; agedbetween 12 and 14) and Turgor Tertius (2 boys and 3 girls; aged between 15 and 18).
Table 1 reports the anthropometric characteristics of the athletes, divided in subgroups accordingto their developmental phase.
Table 1. Characteristics of participants recruited to conduct the present study expressed as mean foldchange ± SEM.
CharacteristicTURGOR SECUNDUS
(Mean ± SEM)PROCERITAS SECUNDA
(Mean ± SEM)TURGOR TERTIUS
(Mean ± SEM)
Age 8.80 ± 0.37 13.00 ± 0.45 16.60 ± 0.51Weight 28.80 ± 1.46 49.00 ± 2.97 55.20 ± 3.61Height 128.60 ± 1.81 160.00 ± 2.98 167.80 ± 3.44
BMI 17.46 ± 1.03 19.15 ± 1.08 19.53 ± 0.73
This study received the consence by the Institutional Research Board of the University San Raffaeleof Rome, Italy and all subjects’ legal tutors gave written informed consent in respecting the ethicalprinciples of the Declaration of Helsinki. All participants were novices regarding climbing experience.
2.2. Methodology
Knowledge of the main physiological changes and the sensitive phases of development isfundamental for the educator, as on the basis of this information he can develop a program suitable forthe child’s needs. The sensitive phases of development are periods of growth in which the child willbe predisposed to increase some motor skills rather than others. Furthermore, the differential growingof the bones, nervous system and muscles in the different evolutionary phases must be taken intoconsideration in the programming to avoid injuries and the onset of paramorphism.
Our study was conducted for 12 months, and during this experimental period the climbingtraining program was carried out according to the coach’s training plan. Children worked out twice aweek for 90 min divided as follow: 15 min for stretching, 20 min for specific training to improve jointmobility and 55 min for climbing.
Joint mobility variation was assessed over a one-year training period. All the measurementswere performed at baseline (time 0; start measurement) and repeated at the end of the training period(time 1; after 12 months) in order to evaluate scapula–humeral and coxo–femoral joint mobility andspine flexibility. The measures recorded in time 0 were considered our control data and the measuresobtained at the end of training program were compared to data recorded in time 0 in order to calculatethe improvement of joint mobility for each group.
Tests have been performed as follows:Sit-and-reach test: Participants sat on the floor with legs extended, backs straight and feet resting
on a cube with a graduated wooden board above it. The participants are asked to slide their handsabove the wooden board, keeping the knee extended [27].
Hip joint mobility: Participants are sitting with their back against the wall, slowly reaching themaximum opening of their hips. The measurement is then taken between the inner ankles [28].
Scapulo–humeral mobility test (measurement of shoulder mobility): Participants are in an uprightposition, holding a stick, bringing the arms outstretched behind the trunk and reaching the startingposition without bending the arms. Then, the minimum distance between the hands while the subjectis holding the stick was measured [29].
101
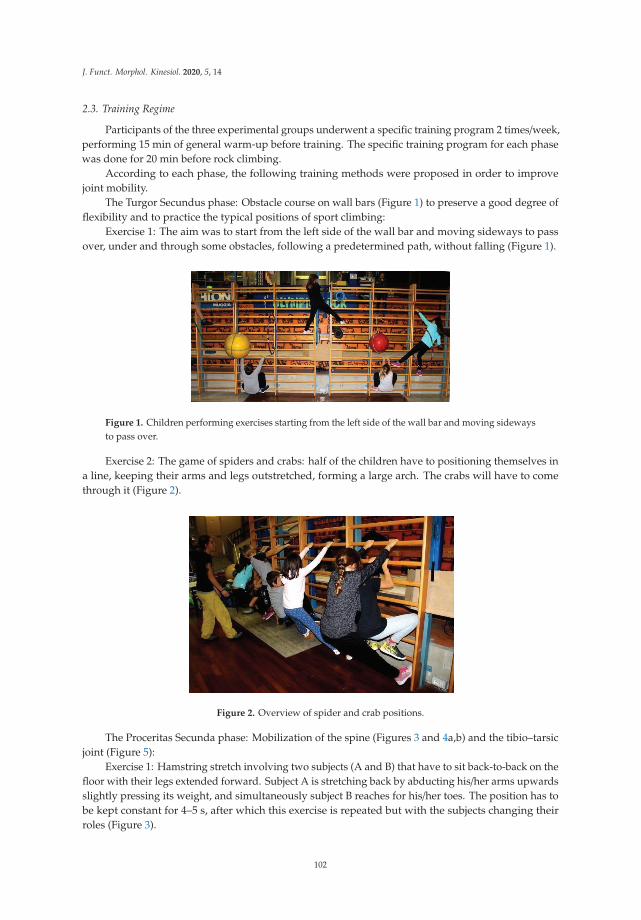
J. Funct. Morphol. Kinesiol. 2020, 5, 14
2.3. Training Regime
Participants of the three experimental groups underwent a specific training program 2 times/week,performing 15 min of general warm-up before training. The specific training program for each phasewas done for 20 min before rock climbing.
According to each phase, the following training methods were proposed in order to improvejoint mobility.
The Turgor Secundus phase: Obstacle course on wall bars (Figure 1) to preserve a good degree offlexibility and to practice the typical positions of sport climbing:
Exercise 1: The aim was to start from the left side of the wall bar and moving sideways to passover, under and through some obstacles, following a predetermined path, without falling (Figure 1).
Figure 1. Children performing exercises starting from the left side of the wall bar and moving sidewaysto pass over.
Exercise 2: The game of spiders and crabs: half of the children have to positioning themselves ina line, keeping their arms and legs outstretched, forming a large arch. The crabs will have to comethrough it (Figure 2).
Figure 2. Overview of spider and crab positions.
The Proceritas Secunda phase: Mobilization of the spine (Figures 3 and 4a,b) and the tibio–tarsicjoint (Figure 5):
Exercise 1: Hamstring stretch involving two subjects (A and B) that have to sit back-to-back on thefloor with their legs extended forward. Subject A is stretching back by abducting his/her arms upwardsslightly pressing its weight, and simultaneously subject B reaches for his/her toes. The position has tobe kept constant for 4–5 s, after which this exercise is repeated but with the subjects changing theirroles (Figure 3).
102

J. Funct. Morphol. Kinesiol. 2020, 5, 14
Figure 3. Final position of the spine mobilization exercise.
Exercise 2: The subjects sit up tall in the straddle position feet-to-feet, with straightened legs,and holding a ball in their hands (Figure 4a). They slowly lean down on the back, closing their legsand curling the pelvis inward until their toes touch the ball behind their heads, and then back to thestarting position (Figure 4b).
(a)
(b)
Figure 4. (a) Starting position of the mobilization of the spine and coxo–femoral joint exercises.(b) Ending position of the mobilization of the spine and coxo-femoral joint exercises.
Exercise 3: In single foot support, rotate the rope forward without jumping. After rotating therope forward, to pass the rope beyond the foot, flex the foot and then extend it. Do the same with theother foot (Figure 5).
Figure 5. Flex foot and rope locked by the foot.
Turgor Tertius phase: Mobility exercises for the fingers (Figure 6), coxo–femoral (Figure 7) andtibio–tarsic joints (Figure 8):
103
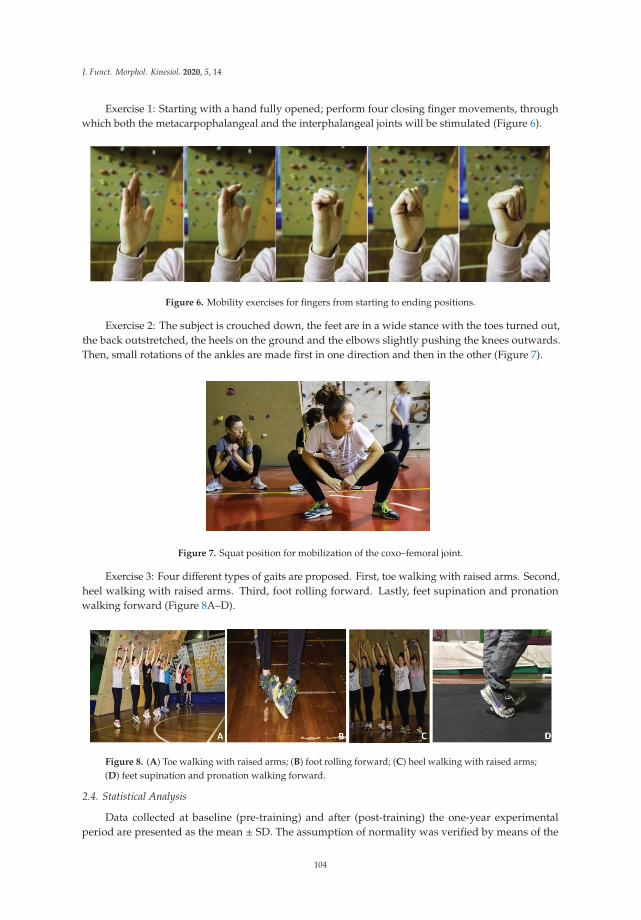
J. Funct. Morphol. Kinesiol. 2020, 5, 14
Exercise 1: Starting with a hand fully opened; perform four closing finger movements, throughwhich both the metacarpophalangeal and the interphalangeal joints will be stimulated (Figure 6).
Figure 6. Mobility exercises for fingers from starting to ending positions.
Exercise 2: The subject is crouched down, the feet are in a wide stance with the toes turned out,the back outstretched, the heels on the ground and the elbows slightly pushing the knees outwards.Then, small rotations of the ankles are made first in one direction and then in the other (Figure 7).
Figure 7. Squat position for mobilization of the coxo–femoral joint.
Exercise 3: Four different types of gaits are proposed. First, toe walking with raised arms. Second,heel walking with raised arms. Third, foot rolling forward. Lastly, feet supination and pronationwalking forward (Figure 8A–D).
Figure 8. (A) Toe walking with raised arms; (B) foot rolling forward; (C) heel walking with raised arms;(D) feet supination and pronation walking forward.
2.4. Statistical Analysis
Data collected at baseline (pre-training) and after (post-training) the one-year experimentalperiod are presented as the mean ± SD. The assumption of normality was verified by means of the
104
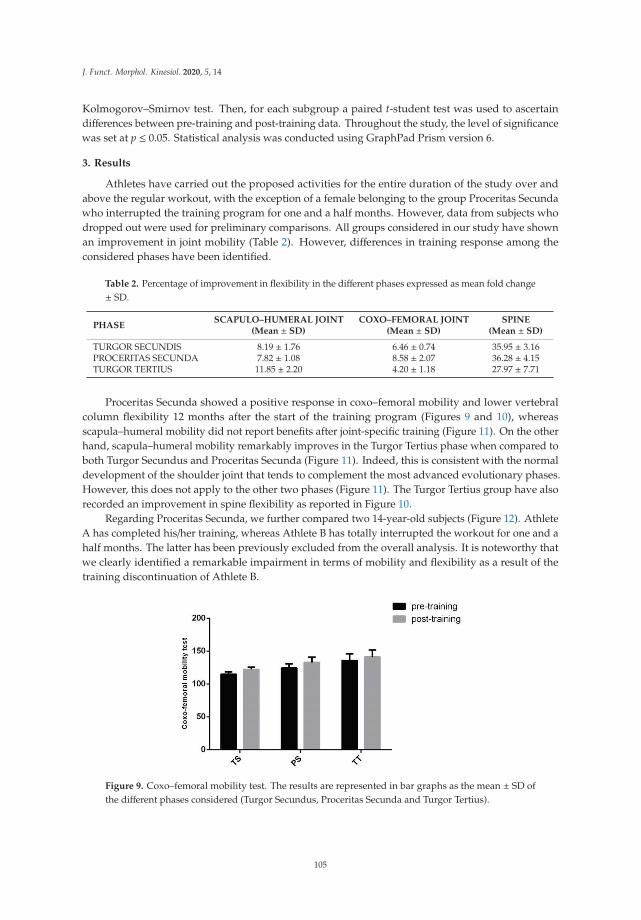
J. Funct. Morphol. Kinesiol. 2020, 5, 14
Kolmogorov–Smirnov test. Then, for each subgroup a paired t-student test was used to ascertaindifferences between pre-training and post-training data. Throughout the study, the level of significancewas set at p ≤ 0.05. Statistical analysis was conducted using GraphPad Prism version 6.
3. Results
Athletes have carried out the proposed activities for the entire duration of the study over andabove the regular workout, with the exception of a female belonging to the group Proceritas Secundawho interrupted the training program for one and a half months. However, data from subjects whodropped out were used for preliminary comparisons. All groups considered in our study have shownan improvement in joint mobility (Table 2). However, differences in training response among theconsidered phases have been identified.
Table 2. Percentage of improvement in flexibility in the different phases expressed as mean fold change± SD.
PHASESCAPULO–HUMERAL JOINT
(Mean ± SD)COXO–FEMORAL JOINT
(Mean ± SD)SPINE
(Mean ± SD)
TURGOR SECUNDIS 8.19 ± 1.76 6.46 ± 0.74 35.95 ± 3.16PROCERITAS SECUNDA 7.82 ± 1.08 8.58 ± 2.07 36.28 ± 4.15TURGOR TERTIUS 11.85 ± 2.20 4.20 ± 1.18 27.97 ± 7.71
Proceritas Secunda showed a positive response in coxo–femoral mobility and lower vertebralcolumn flexibility 12 months after the start of the training program (Figures 9 and 10), whereasscapula–humeral mobility did not report benefits after joint-specific training (Figure 11). On the otherhand, scapula–humeral mobility remarkably improves in the Turgor Tertius phase when compared toboth Turgor Secundus and Proceritas Secunda (Figure 11). Indeed, this is consistent with the normaldevelopment of the shoulder joint that tends to complement the most advanced evolutionary phases.However, this does not apply to the other two phases (Figure 11). The Turgor Tertius group have alsorecorded an improvement in spine flexibility as reported in Figure 10.
Regarding Proceritas Secunda, we further compared two 14-year-old subjects (Figure 12). AthleteA has completed his/her training, whereas Athlete B has totally interrupted the workout for one and ahalf months. The latter has been previously excluded from the overall analysis. It is noteworthy thatwe clearly identified a remarkable impairment in terms of mobility and flexibility as a result of thetraining discontinuation of Athlete B.
Figure 9. Coxo–femoral mobility test. The results are represented in bar graphs as the mean ± SD ofthe different phases considered (Turgor Secundus, Proceritas Secunda and Turgor Tertius).
105

J. Funct. Morphol. Kinesiol. 2020, 5, 14
Figure 10. Flexibility of the spine. The results are represented in bar graphs as the mean ± SD of thedifferent phases considered (Turgor Secundus, Proceritas Secunda and Turgor Tertius).
Figure 11. Scapulo–humeral mobility test. The results are represented in bar graphs as the mean ± SDof the different phases considered (Turgor Secundus, Proceritas Secunda and Turgor Tertius).
Figure 12. Comparison between the percentage mean variations of two athletes: Athlete A hascompleted the training, while Athlete B has totally interrupted the workout for one and a half months.
4. Discussion
This work represents a preliminary study in order to demonstrate both the efficacy on jointmobility and the requirement of our playful work, to support the global sport-climbing workout.Indeed, the increased interest in rock climbing practices creates the need to know all the possiblesport-related injuries in order to prevent and treat them. Hence, the importance to study the main jointsinvolved in climbing and that are at risk of injuries, such as joints of the hand and fingers, shoulders,the hip and ankles, in order to develop a preparation workout suitable for the discipline.
106

J. Funct. Morphol. Kinesiol. 2020, 5, 14
Since sport climbing does not need specific anthropometrical characteristic, and for this reason itcan be practiced by everyone [30], a specific training program in this sport can improve one’s strengthand resistance; essential skills that would allow to carry out increasingly difficult passages. In fact,climbers perform movements that require an isometric effort, resulting in an enhanced muscle tone toobtain a strong and harmonious body. Moreover, although it is not an aerobic discipline, it develops agood cardiovascular training; this is also due to the adrenaline that develops while climbing [31].
Because of a child’s incomplete maturation of both bone and muscular structures, and the laxityof ligaments, early and specific training would reasonably provide extensive room for improvement.We have proposed a playful training workout as a mobility workout in the first sensitive stages.
In the present work, we have conducted a preliminary study in an attempt to prove that a specifictraining program is fundamental for mobility and flexibility improvement. Participants enrolled forour study were novices regarding climbing experience and they worked out twice a week for 90 min inagreement with the coach’s training plan for 12 months.
Although the reported data did not reach statistical significance, we have recorded an improvementin joint mobility after the playful training program. However, not all the recorded ameliorationswere statistically significant. This might be due to external factors affecting joint mobility, such asanatomical and physiological differences among subjects. However, this can be also ascribable to thelow sample size. The latter stems from the direct correlation between the standard deviation value andthe sample size.
Moreover, by comparing continuous and discontinuous training between two athletes, we havesuggested the importance of early and constant training (Figure 12). Indeed, the suspension of ajoint-specific workout can lead to a blockage or even a regression of the subject’s abilities. Thus, injuriesrequire prompt treatment in order to avoid transient and permanent physical impairment.
Even if the study was conducted on a low number of subjects, this represent a starting project inorder to develop a specific training program for each developmental phase.
5. Conclusions
The recent proliferation of indoor climbing gyms and well-protected sport climbing areas havemade sport climbing accessible to everyone. Neither an age group nor a pre-existing medical conditionserves as a contraindication for sport climbing in the first instance. Sport climbing is an engagingmental and physical activity that contributes to an increase in muscle mass and strength, dynamicbalance, and other health benefits. However, in line with any exercise prescription, guidelines forsport-specific participation are desirable. Taking into account what was shown in this preliminarystudy, early and constant joint-mobility training that start from the early stages of the developmentalage is fundamental.
In conclusion, we suggest that joint-mobility exercises from the early stages of development willallow children to move harmoniously, even on the climbing walls.
Author Contributions: Conceptualization, L.G. and A.G.D.; methodology, L.G.; validation, E.P. and G.A.;formal analysis, M.M. and V.T.; investigation, L.G.; data curation, A.G.D.; statistical analysis, G.M. and A.G.D.;writing—original draft preparation, M.M., A.G.D. and E.P.; writing—review and editing, M.M.; G.M. and V.T.;supervision, A.G.D. All authors read and approved the final manuscript.
Funding: This research received no external funding.
Conflicts of Interest: The authors declare no conflict of interest.
References
1. Available online: https://www.ifsc-climbing.org/index.php (accessed on 29 July 2019).2. Available online: https://tokyo2020.org/en/ (accessed on 29 July 2019).3. Available online: https://www.ifsc-climbing.org/ (accessed on 29 July 2019).
107

J. Funct. Morphol. Kinesiol. 2020, 5, 14
4. Michailov, M.L.; Baláš, J.; Tanev, S.K.; Andonov, H.S.; Kodejška, J.; Brown, L. Reliability and Validity ofFinger Strength and Endurance Measurements in Rock Climbing. Res. Q. Exerc. Sport 2018, 89, 246–254.[CrossRef] [PubMed]
5. Baláš, J.; Pecha, O.; Martin, A.J.; Cochrane, D. Hand–arm strength and endurance as predictors of climbingperformance. Eur. J. Sport Sci. 2012, 12, 16–25. [CrossRef]
6. Li, L.; Ru, A.; Liao, T.; Zou, S.; Niu, X.H.; Wang, Y.T. Effects of Rock Climbing Exercise on Physical Fitnessamong College Students: A Review Article and Meta-analysis. Iran. J. Public Health 2018, 47, 1440–1452.[CrossRef]
7. Voelcker-Rehage, C.; Godde, B.; Staudinger, U.M. Cardiovascular and Coordination Training DifferentiallyImprove Cognitive Performance and Neural Processing in Older Adults. Front. Hum. Neurosci. 2011, 5, 1–12.[CrossRef] [PubMed]
8. Kleinstäuber, M.; Reuter, M.; Doll, N.; Fallgatter, A.J. Rock climbing and acute emotion regulation in patientswith major depressive disorder in the context of a psychological inpatient treatment: A controlled pilot trial.Psychol. Res. Behav. Manag. 2017, 10, 277–281. [CrossRef] [PubMed]
9. Lutter, C.; El-Sheikh, Y.; Schöffl, I.; Schöffl, V. Sport climbing: Medical considerations for this new Olympicdiscipline. Br. J. Sports Med. 2017, 51, 2–3. [CrossRef] [PubMed]
10. Quaine, F.; Vigouroux, L.; Martin, L. Effect of simulated rock climbing finger postures on force sharing amongthe fingers. Clin. Biomech 2003, 18, 385–388. [CrossRef]
11. Roloff, I.; Schöffl, V.R.; Vigouroux, L.; Quaine, F. Biomechanical model for the determination of the forcesacting on the finger pulley system. J. Biomech. 2006, 39, 915–923. [CrossRef]
12. Vigouroux, L.; Quaine, F. Fingertip force and electromyography of finger flexor muscles during a prolongedintermittent exercise in elite climbers and sedentary individuals. J. Sports Sci. 2006, 24, 181–186. [CrossRef]
13. Schöffl, V.; Einwag, F.; Strecker, W.; Schöffl, I. Strength measurement after conservatively treated pulleyruptures in climbers. Med. Sci. Sports Exerc. 2006, 38, 637–643. [CrossRef] [PubMed]
14. Schöffl, I.; Einwag, F.; Strecker, W.; Hennig, F.; Schöffl, V. Impact of taping after finger flexor tendon pulleyruptures in rock climbers. J. Appl. Biomech. 2007, 23, 52–62. [CrossRef] [PubMed]
15. Morrison, A.B.; Schöffl, V.R. Physiological responses to rock climbing in young climbers. Br. J. Sports Med.2007, 41, 852–861. [CrossRef] [PubMed]
16. Timmons, B.W.; Leblanc, A.G.; Carson, V.; Connor Gorber, S.; Dillman, C.; Janssen, I.; Kho, M.E.; Spence, J.C.;Stearns, J.A.; Tremblay, M.S. Systematic review of physical activity and health in the early years (aged 0–4years). Appl. Physiol. Nutr. Metab. 2012, 37, 773–792.
17. Janssen, I.; Roberts, K.C.; Thompson, W. Is adherence to the Canadian 24-Hour Movement BehaviourGuidelines for Children and Youth associated with improved indicators of physical, mental, and socialhealth? Appl. Physiol. Nutr. Metab. 2017, 42, 725–731. [CrossRef] [PubMed]
18. Malm, C.; Jakobsson, J.; Isaksson, A. Physical Activity and Sports—Real Health Benefits: A Review withInsight into the Public Health of Sweden. Sports 2019, 7, 127. [CrossRef] [PubMed]
19. Iwame, T.; Matsuura, T.; Suzue, N.; Iwase, J.; Uemura, H.; Sairyo, K. Factors Associated With Knee Pain andHeel Pain in Youth Soccer Players Aged 8 to 12 Years. Orthopaedic J. Sports Med. 2019, 7, 2325967119883370.[CrossRef]
20. Schöffl, V.; Lutter, C.; Woollings, K.; Schöffl, I. Pediatric and adolescent injury in rock climbing. Res. Sport.Med. 2018, 26, 91–113. [CrossRef]
21. Garcia, K.; Jaramillo, D.; Rubesova, E. Ultrasound evaluation of stress injuries and physiological adaptationsin the fingers of adolescent competitive rock climbers. Pediatr. Radiol. 2018, 48, 366–373. [CrossRef]
22. Roseborrough, A.; Lebec, M. Differences in static scapular position between rock climbers and a non-rockclimber population. N. Am. J. Sports Phys. Ther. 2007, 2, 44–50.
23. Schöffl, V.R.; Hoffmann, P.M.; Imhoff, A.; Küpper, T.; Schöffl, I.; Hochholzer, T.; Hinterwimmer, S. Long-TermRadiographic Adaptations to Stress of High-Level and Recreational Rock Climbing in Former AdolescentAthletes: An 11-Year Prospective Longitudinal Study. Orthop. J. Sport. Med. 2018, 6, 1–9. [CrossRef]
24. Nelson, C.E.; Rayan, G.M.; Judd, D.I.; Ding, K.; Stoner, J.A. Survey of Hand and Upper Extremity InjuriesAmong Rock Climbers. Hand 2017, 12, 389–394. [CrossRef] [PubMed]
25. Turner, C.H.; Robling, A.G. Exercise as an anabolic stimulus for bone. Curr. Pharm. Des. 2004, 10, 2629–2641.[CrossRef]
26. Watts, P.B. Physiology of difficult rock climbing. Eur. J. Appl. Physiol. 2004, 91, 361–372. [CrossRef]
108
J. Funct. Morphol. Kinesiol. 2020, 5, 14
27. Anloague, P.A.; Spees, V.; Smith, J.; Herbenick, M.A.; Rubino, L.J. Glenohumeral range of motion and lowerextremity flexibility in collegiate-level baseball players. Sports Health 2012, 4, 25–30. [CrossRef] [PubMed]
28. Boone, D.C.; Azen, S.P.; Lin, C.M.; Spence, C.; Baron, C.; Lee, L. Reliability of goniometric measurements.Phys. Ther. 1978, 58, 1355–1360. [CrossRef] [PubMed]
29. Sharma, J.P. Tests and Measurements in Physical Education; Khel Sahitya Kendra: New Delhi, Delhi, India, 2011;ISBN 8175243856.
30. Mermier, C.M.; Janot, J.M.; Parker, D.L.; Swan, J.G. Physiological and anthropometric determinants of sportclimbing performance. Br. J. Sports Med. 2000, 34, 359–366. [CrossRef] [PubMed]
31. Mermier, C.M. Energy expenditure and physiological responses during indoor rock climbing. Br. J. SportsMed. 1997, 31, 224–228. [CrossRef]
© 2020 by the authors. Licensee MDPI, Basel, Switzerland. This article is an open accessarticle distributed under the terms and conditions of the Creative Commons Attribution(CC BY) license (http://creativecommons.org/licenses/by/4.0/).
109


Journal of
Functional Morphology and Kinesiology
Article
Cognitive and Physical Activity-Related Aspects of ChildrenAssociated to the Performance of the Crunning Movement
Ewan Thomas 1,* , Marianna Alesi 1 , Garden Tabacchi 1 , Carlos Marques da Silva 2 , David J. Sturm 3 ,
Fatma Nese Sahin 4, Özkan Güler 4, Manuel Gómez-López 5 , Simona Pajaujiene 6 , Michele Basile 7,
Ante Rada 8, Antonio Palma 1 and Antonino Bianco 1
���������������
Citation: Thomas, E.; Alesi, M.;
Tabacchi, G.; Silva, C.M.d.; Sturm,
D.J.; Sahin, F.N.; Güler, Ö.;
Gómez-López, M.; Pajaujiene, S.;
Basile, M.; et al. Cognitive and
Physical Activity-Related Aspects of
Children Associated to the
Performance of the Crunning
Movement. J. Funct. Morphol. Kinesiol.
2021, 6, 9. https://doi.org/10.3390/
jfmk6010009
Received: 16 December 2020
Accepted: 13 January 2021
Published: 17 January 2021
Publisher’s Note: MDPI stays neu-
tral with regard to jurisdictional clai-
ms in published maps and institutio-
nal affiliations.
Copyright: © 2021 by the authors. Li-
censee MDPI, Basel, Switzerland.
This article is an open access article
distributed under the terms and con-
ditions of the Creative Commons At-
tribution (CC BY) license (https://
creativecommons.org/licenses/by/
4.0/).
1 Sport and Exercise Sciences Research Unit, Department of Psychology, Educational Science and HumanMovement, University of Palermo, 90146 Palermo, Italy; [email protected] (M.A.);[email protected] (G.T.); [email protected] (A.P.); [email protected] (A.B.)
2 CIEQV-Life Quality Research Centre, Escola Superior de Desporto de Rio Maior-IPSANTAREM, Avenida Dr.Mário Soares, 20413 RIO Maior, Portugal; [email protected]
3 Department of Sport and Health Sciences, Technical University of Munich, Uptown Munich Campus D,Georg-Brauchle-Ring 60/62, 80992 Munich, Germany; [email protected]
4 Department of Sport and Health, Faculty of Sport Sciences, Ankara University, Golbası Yerleskesi SporBilimleri Fakültesi, Golbası, 06830 Ankara, Turkey; [email protected] (F.N.S.);[email protected] (Ö.G.)
5 Department of Physical Activity and Sport, Faculty of Sports Sciences, University of Murcia, Calle Argentina,s/n., 30720 Murcia, Spain; [email protected]
6 Department of Coaching Science, Lithuanian Sports University, Sporto 6, LT-44221 Kaunas, Lithuania;[email protected]
7 University of Palermo Sport Center (CUS Palermo), Via Altofonte, 80, 90129 Palermo, Italy; [email protected] Faculty of Kinesiology, University of Split, Teslina 6, 21000 Split, Croatia; [email protected]* Correspondence: [email protected]; Tel.: +39-3208899934
Abstract: The aim of this investigation was to identify possible related factors associated to theperformance of the crunning test in European children and adolescents. A total number of 559children and adolescents (age range 6–14 years) of which 308 boys (55.1%) and 251 girls (44.9%), fromseven European countries, were screened. A questionnaire concerning demographic and personallife-related factors and a cognitive assessment were performed. A regression analysis was conductedwith the performance measures of the crunning movement. T-tests and ANCOVA were used toanalyze sub-group differences. Boys have greater crunning performance values compared to girls(5.55 s vs. 7.06 s, p < 0.001) and older children perform better than younger ones (R2 −0.23; p < 0.001).Children with healthy and active habits (exercising or spending time with family members vs. readingor surfing the internet) performed better in the test. Children engaged in team sports had bettercrunning performances compared to those engaged in individual sports (6.01 s vs. 6.66 s, p = 0.0166).No significant association was found regarding cognitive-related aspects in either children engagedin team or individual sports and the crunning performance. Older and male children performedbetter in the crunning test than younger and female children. Physical activity-related aspects ofchildren’s life are associated with crunning movement performance. No association was foundbetween higher cognitive performance and the crunning test results.
Keywords: crunning; socio-demographic; cognitive; fitness-tests
1. Introduction
Physical fitness (PF) during childhood and adolescence has been deeply investi-gated [1–3]. It has been recognized that PF is an important health-related factor, whichmay predict health status in adulthood, and which may also help physical and cognitivedevelopment [1,4–6]. Inverse associations have been found between PF and cardiovasculardisease, metabolic risk factors and adiposity, which overall suggest positive health-related
J. Funct. Morphol. Kinesiol. 2021, 6, 9. https://doi.org/10.3390/jfmk6010009 https://www.mdpi.com/journal/jfmk
111

J. Funct. Morphol. Kinesiol. 2021, 6, 9
aspects [5,7,8]. A recent review by Donnelly et al. [4], investigating the effects of PF oncognition, learning and brain structure and function in children aged 6–13 years old, founda general positive association regarding cognition and brain structure and function. How-ever, the study failed to identify a specific set of activity parameters which may betterpromote the abovementioned aspects. However, despite different evidence existing regard-ing a positive association between physical activity (PA) and academic achievements [9],there are still inconsistencies regarding aspects of PA and cognitive function [4].
In order to promote the level of PF through PA in adulthood, it is important toadequately modify lifestyle and behaviours in childhood and adolescence [10,11]. Differentinvestigations have suggested that children and adolescents who did not regularly practicePA are more prone to develop unhealthy habits as smoking or drinking alcohol [12,13],which would inevitably decrease PF. In addition, such aspects have also been linked tothe familial socio-economic status, parental education and food habits [12,13]. Therefore,since lifestyle and familial education are important factors which influence both physicaland psychological development of children and adolescence, these may be considered asimportant predictors of PF and health outcomes [14].
In order to quantify the levels of PF, a large body of scientific evidence exists whichtakes into account specific age ranges and genders [1,15–18], demographic characteris-tics [19–21] or more specific sub-populations [22,23]. Each investigation has evaluateddifferent aspects related to PF, such as aerobic activity, strength, power, speed, coordina-tion, flexibility, agility and other abilities, including for each of these, one or more field orlaboratory tests to appropriately discriminate such abilities.
Despite the large number of fitness tests and physical evaluation batteries available,performance values or predictors of the crunning movement, a specific type of locomotionwhich combines running and crawling, are scarce. Patrick et al. [24] evaluated the inter-limbcoordination during crawling in infants and adults, suggesting that a great involvementof coordination by the central nervous systems is required for quadrupedal locomotion.Other two investigations have included specific crawling exercises, within a fitness battery,to improve PF in a military environment [25,26]. The results of the studies underline thatthe military personnel increased the efficacy of different abilities, such as coordination,agility, speed, and power, following such interventions. Another investigation tried todetermine a link between the Illinois agility test, which evaluates agility, and the crunningtest. The results indicate a moderate correlation (r = 0.45) between the two tests [27],suggesting that a certain amount of agility is required to perform the crunning movement.In an attempt to understand if the crunning locomotion could provide further informationthan those offered from already known fitness tests, we included the crunning test in apreviously discussed project [15]. This project, namely, the Enriched Sport Activity (ESA)program, was a physical activity intervention with the aim to improve fitness of childrenand adolescents across Europe by including cognitively enriched stimuli within specificwarm-ups, prior to a structured physical activity [15]. However, such tests, together withthe Leger shuttle run for aerobic assessment [28], were the only tests not influenced by theESA intervention.
In order to clarify the characteristics of the crunning movement, this investigation willaim to identify lifestyle, physical activity and cognitive aspects associated with the resultsof this particular type of locomotion.
2. Materials and Methods
2.1. Participants
The sample was composed of 589 children of ages ranging from 6 to 14 years (aged10.25 ± 1.76 years and 9.98 ± 1.87 years) of which 308 boys (55.1%, age 9.1 ± 1.3 years;weight, 34.9 ± 9.5 kg; height, 139.0 ± 10.4 cm) and 251 girls (44.9%, 10.2 ± 1.8 years;39.4 ± 11.1 kg; 144.8 ± 14.3 cm), from 7 European countries (Italy, n = 164 of which 92boys and 72 girls; Germany, n = 64 of which 41 boys and 23 girls; Portugal, n = 111 boys;Spain, n = 37 of which 17 boys and 20 girls; Lithuania, n = 85 of which 53 boys and 32 girls;
112
J. Funct. Morphol. Kinesiol. 2021, 6, 9
Croatia, n = 50 of which 25 boys and 25 girls; and Turkey, n = 78 girls) within the ESAProgram, an evidence-based exercise program cofounded by the Erasmus + Program of theEuropean Union (Key action: Sport-579661-EPP-1-2016-2-IT-SPO-SCP).
Criteria for including participants were the following: 1. Able to perform the requiredtests; 2. Absence of a diagnosis of intellectual disability, visual or neurological impairments;3. Absence of a diagnosis of other neurodevelopmental disorders. All children wererecruited within a school or sport center. Before the inclusion of the children in the ESAprogram, a parent or legal representative of each child signed a declaration of informedconsent. The study was conducted in accordance with the Helsinki Declaration (Hong Kongrevision, September 1989) and the European Union recommendations for Good ClinicalPractice (document 111/3976/88, July 1990). The study was approved with permissionfrom the Lithuanian Sports University’s Research Ethics Committee in Social Sciences withapproval No 579661-EPP-1-2016-2-IT-SPO-SCP (2018-02-05).
2.2. Study Design
The ESA Program aimed to improve children’s motor skills and executive functionsthrough sport activities enriched by cognitive stimuli to enhance inhibitory control, work-ing memory and shifting.
Detailed description of the study design and the ESA Program can be found elsewhere,describing both the cognitive tests and their administration and motor components, aswell as the full description of the crunning test and administration procedures within theproject [15,29].
2.3. Intervention Procedure and Assessment Tools
Each ESA trainer underwent a training procedure before the start of the intervention,in order to adopt a standardized procedure. The procedure was shared across the partici-pating countries. This can be also found on a dedicated YouTube channel (ESA Program).Therefore, all testing procedures were performed in the same way and order. At the begin-ning of the project, each participant underwent a cognitive examination [29] and a physicalevaluation [15], which were repeated at the end of the intervention. Before the start of theESA training program, each participant also underwent a psychological test battery (ESAPTB, a 32 item questionnaire which includes questions regarding personal information,lifestyle-related factors and school-associated information), which was administered ontwo different occasions prior to the inclusion of the participants in the ESA program. On thefirst day, the participants underwent a cognitive assessment which lasted around 1 h [29].On the second day, a questionnaire was administered, which included questions related tohabits, family, recreational and social aspects. We retrospectively evaluated the predictingfactors of the crunning performance through these personal aspects.
The crunning performance, measured as the time in seconds needed to perform the test(10 m distance), was the dependent variable collected through the crunning test, includedin the ESA fitness battery. This battery is composed of six fitness tests (standing broadjump, seated medicine ball throw, 20 m shuttle run test, 30 m sprint, Illinois test and thecrunning test) to assess different skill-related components at once [30], but for the purposeof the present paper, only the outcomes of the crunning test have been considered [15].Low values in the test measure indicate better performance.
For the purpose of this study, gender and age were treated as covariates, while anumber of predictors were taken into account. These predictors included sport-relatedaspects, spare time-related aspects and cognitive or neuropsychological aspects.
Each aspect is discussed below.(a) Sport-related aspects: Sport type (individual/team and exercise intensity) and
sport frequency.Individual/team sport type classification was manually distinguished by the authors
on the basis of the sport practiced. The American Heart Association classification for sportwas adopted [31] for grouping the activities in relation to cardiovascular function. These
113

J. Funct. Morphol. Kinesiol. 2021, 6, 9
are divided by static and dynamic activities, and each is stratified according to exerciseintensity, categorized as low, moderate or high. Current sport frequency and past sportfrequency were measured in hours per week and relevant data were collected through adedicated section of the ESA PTB.
(b) Spare time-related aspects (frequencies in h/week): Aspects regarding time spentwith parents and siblings, reading, going to the cinema, theatre or museums, surfing theinternet, playing with electronic games, going out with friends, going to the gym, going tothe park or shopping were evaluated. All these items were collected through a dedicatedsection of the ESA PTB.
(c) Cognitive/neuropsychological variables: School marks (National language, Maths,Anthropology and History, Geography, Physical education, Foreign language), inhibitorycontrol, working memory, shifting of attention. The ESA PTB was used to collect the schoolmark items. The other items’ assessment was performed through the neuropsychologicaltests derived by the Inquisit Lab platform (Inquisit 6 (for Windows version 6.1). 2020.Retrieved from https://www.millisecond.com): the Color Word Stroop (CWS) task forthe inhibitory control, measured by the time needed to select the right color within thestroop test; the Digit Span Test (DST) for working memory, measured by the number ofrecalled digits in an exact order and in a reversed order; and the Trail Making Test (TMT)for shifting of attention, measured by error number and execution time. For further detailsregarding the cognitive test administration, please refer to Gentile et al. [29].
2.4. Statistical Analysis
Data are presented as means and standard deviations. The Student’s t-test was usedto assess differences in the crunning test for each variable (i.e., gender, sport type). Toestimate differences in the crunning performance by country, age range and sport type, theANCOVA test was performed. Age and gender were used as covariates for all analysis.
Linear regression analyses were performed to evaluate correlations between the crun-ning test and sport frequency, spare time-related aspects, cognitive/neuropsychologicalaspects. Statistical significance was set for p < 0.05. All estimates were adjusted for genderand age. The software STATA/MP 12.1 (StataCorp. 2011. Stata Statistical Software: Release12. College Station, TX, USA: StataCorp LP.) was used for the statistical analysis.
3. Results
3.1. Gender and Age
Mean time to perform the crunning test was 6.25 s (SD 2.416, n. = 589). Better crunningperformances were observed for males compared to females (independently from age)and for older compared to younger children (independently from gender) (Table 1). Theregression coefficient for age was −0.23 (SE 0.051, p = 0.000, n = 589).
Table 1. Differences in the crunning test performances by gender and age range.
n Mean (s) SD (s) p-Value
Tot 589 6.25 2.416
Gender 0.000 a
male 318 5.55 2.306female 271 7.06 2.289
Age range 0.000 b
6–8 162 7.2 2.9469–11 298 5.99 1.97≥12 129 5.65 2.291
SD: Standard deviation; Tot: Total number; a Estimated through paired Student’s t-test. b Estimated throughANCOVA. All estimates were adjusted for gender and age.
114

J. Funct. Morphol. Kinesiol. 2021, 6, 9
3.2. Demographic Factors
Table 2 shows the differences in the crunning movement performances by demo-graphic and SES factors. Similar characteristics across participants for each county wereobserved (Italy, 8.5 ± 1 years; 34.3 ± 9.8 kg; 135.0 ± 9.8 cm; boys, 8.4 ± 1 years; 33.9 ± 9.7 kg;135.3 ± 9.7 cm and girls, 8.6 ± 1.1 years; 34.8 ± 10.1 kg; 134.7 ± 10 cm; Germany,8.9 ± 0.8 years; 37.6 ± 9.9 kg; 137.8 ± 7.5 cm; boys, 9.0 ± 0.8 years; 37.6 ± 8.4 kg;138.6 ± 7.3 cm and girls, 8.7 ± 0.7 years; 37.4 ± 12.7 kg; 136.3 ± 7.9 cm; Portugal, boys,10.9 ± 1.7 years; 139.1 ± 15.3 cm; 39.4 ± 9.3 kg; Spain, 10.5 ± 1.0 years; 142.7 ± 20.4 cm;45.1 ± 23.1 kg; boys, 10.4 ± 0.9 years; 145.8 ± 14.1 cm; 43.2 ± 12.4 kg and girls,10.4 ± 1.0 years; 144.7 ± 13.2 cm; 40.2 ± 10.4 kg; Lithuania, 9.9 ± 1.13 years; 35.7 ± 8.0 kg;144.0 ± 9.0 cm, boys 9.9 ± 1.19 years; 36.4 ± 8.9 kg; 144.0 ± 9.0 cm and girls 10.1 ± 1.02 years;34.6 ± 5.8 kg; 142.0 ± 11.0 cm; Croatia 9.4 ± 0.5 years; 35.0 ± 8.2 kg; 138.3 ± 7.6 cm;boys, 9.7 ± 0.5 years; 36.5 ± 7.6 kg; 140.7 ± 7.4 cm and girls, 9.3 ± 0.5 years; 34.7 ± 8.3 kg;137.8 ± 7.6 cm; and Turkey, girls, 10.8 ± 1.8 years; 134.9 ± 12.7 cm; 45.3 ± 10.9 kg). Signifi-cant differences in the crunning movement were found across countries.
Table 2. Differences in crunning test performances by country and socio-economic status.
n Mean (s) SD (s) p-Value a
Country 589 6.25 2.416 0.000
Croatia 50 5.26 1.325Germany 64 5.62 3.116
Italy 164 7.69 2.501Lithuania 85 5.36 1.503Portugal 111 4.31 1.151
Spain 37 6.37 0.508Turkey 78 8.03 1.709
SD: Standard deviation; a Estimated through ANCOVA. All estimates were adjusted for gender and age.
3.3. Sport-Related Aspects
Among the sport-related aspects, the following were found to be associated to betterperformances: team sport type, with children practicing team sports performing betterthan those practicing individual sports (h/week) (Table 3).
Table 3. Differences in crunning test performances by sport-related aspects.
n Mean (s) SD (s) p-Value a
Sport type 384 6.18 2.316 0.0166Individual 104 6.64 2.321
Team 280 6.01 2.294
Sport type (n = 5 *) 384 6.18 2.316 0.1139
n. R2. SE p-value b
Sport frequency (h/week) 467 0.14 0.101 0.168
SD: Standard deviation; SE: Standard error; a Estimated through paired Student’s t-test. b Estimated throughlinear regression analysis. * Five sport categories were included, according to the American Heart Associationclassification adopted.
No differences were found across different sports, current sport frequency, sport type(based on the American Heart Association classification (impact)).
3.4. Spare Time-Related Aspects
Regarding spare time-related aspects, the following items were correlated to thecrunning performances. In general, physical activities such as attending a gym, going tothe park or going out with friends were positively associated to performance outcomes(Table 4).
115

J. Funct. Morphol. Kinesiol. 2021, 6, 9
Table 4. Differences in crunning test performances by spare time-related aspects. All estimates wereadjusted for gender and age.
Activity (Times/Week) n R2 SE p-Value a
Going to the gym 531 −0.16 0.079 0.049Going to the park 537 −0.29 0.094 0.002
Going out with friends 534 −0.25 0.078 0.002Shopping 538 −0.06 0.097 0.53
Going to the cinema/theatre/museum 532 −0.1 0.128 0.447Surfing the internet 538 −0.06 0.071 0.417
Playing electronic games 538 0.13 0.07 0.056Reading 539 −0.05 0.075 0.535
Spending more time with parents and siblings 541 −0.17 0.087 0.049SE: Standard error; a Estimated through linear regression analysis. All estimates were adjusted for genderand age.
Furthermore, spending more time with parents and siblings seems to be associatedwith better performances.
3.5. Cognitive/Neuropsychological Aspects
In general, very low regression coefficients were found. Children with lower schoolmarks had better crunning performances, such relation was present in either childrenpracticing teams and individual sports (Table 5). No significant correlations were foundbetween all the inhibitory control items and the crunning movement for children practicingteam or individual sports, with higher times needed to select congruent, incongruent andcontrol trials associated to lower times needed to perform the test. Working memory itemswere not correlated to the crunning performance.
Table 5. Associations between the crunning test performance and cognitive/neuropsychological aspects for team andindividual sport practitioners.
Team Individual
n R2 a SE p n R2 a SE p
School marksNational language 205 0.47 1.58 0.000 75 0.15 0.40 0.012
Maths 70 0.29 2.49 0.000 77 0.15 0.33 0.009Anthropology and History 65 0.19 2.49 0.000 73 0.11 0.31 0.041
Physical Activity 62 0.22 2.44 0.003 76 0.17 0.51 0.004Foreign language 66 0.28 2.27 0.000 68 0.14 0.37 0.027
Inhibitory control (CWS)Congruent trial selection (s) 150 −0.59 9.03 0.845 91 −0.39 2.15 0.735
Incongruent trial selection (s) 150 0.69 2.17 0.182 91 0.55 2.21 0.116Control trial selection (s) 150 0.39 2.18 0.004 91 0.50 2.59 0.254
Working memory (DST)Forward recall of numbers (n) 156 0.16 0.89 0.000 77 0.07 0.55 0.064
Forward recall of numbers before 2 consecutive errors (n) 156 0.20 1.38 0.000 77 0.08 0.55 0.060Backward recall of numbers (n) 156 0.15 0.129 0.000 77 0.12 0.52 0.017
Backward recall of numbers before 2 consecutive errors (n) 156 0.15 1.19 0.000 77 0.06 0.53 0.126
Shifting of attention (TMT)Errors in numbers (n) 148 0.18 1.05 0.000 79 0.06 0.44 0.138Time in numbers (s) 148 0.00 0.000 0.018 79 0.00 0.000 0.256
Errors in numbers and letters (n) 148 0.23 1.26 0.000 79 0.18 0.32 0.024Time in numbers and letters (s) 148 −0.00 0.000 0.000 79 −0.00 0.000 0.118
SE: Standard error; a Estimated through linear regression analysis. All estimates were adjusted for gender and age.
116
J. Funct. Morphol. Kinesiol. 2021, 6, 9
Items related to the shifting of attention showed positive but very low correlations tocrunning times (with higher number of errors and higher time to perform the test correlatedto lower crunning performances), with the only exception of the time to recognize numbersand letters in children engaged in team sports, which revealed significant correlation butvery low coefficients.
4. Discussion
With this investigation, we aimed to determine possible factors associated with theperformance of the crunning movement. As expected, in our population of Europeanchildren, males performed better compared to females and older children performed betterthan younger ones.
Such aspects have been reported by various authors across different motor domains.Tomkinson et al. [1] reported for a sample of over 2 million children performances, increasesacross age groups from 9 to 17 years old, with males performing better than females interms of strength, power, agility and aerobic capacity. However, the results are in favourof females regarding balance, flexibility and coordination. Similar results are reported byanother investigation in a sample of 3804 children ranging between 6 to 10 years of age.Again, boys perform better than girls regarding strength, power, speed, agility and aerobiccapacity but not flexibility, with performance increases according to age [32]. Both aspectsare consistent with growth and physical maturation [33,34].
4.1. Demographic Aspects
The results we obtained regarding the crunning movement performance show dif-ferences related to each country with better performances from the Portuguese childrenand worst performances from the Turkish children. It has to be noted that the Portuguesesample was composed only of male children, while the Turkish sample was composed onlyof female children. Such results are consistent with the general outcomes provided above.Furthermore, it is not uncommon to appreciate geographical differences when consider-ing different populations of same age ranges, for example, regarding speed in the 20 msprint between 6-year-old Greek (5.05 ± 1 s) [35] and Lithuanian boys (5.8 ± 1.2 s) [36], orfor jumping performance of 10-year-old Colombian girls [20] (110.2 cm), Australian girls(103.25 cm) [37] or South African girls (149.3 cm) [38] in the standing long jump. Differ-ences are also present between the same country when considering rural and city areas [39].The authors of this latter study indicated that these differences between areas possiblyinfluence individual habits and therefore the level of physical activity which each childrenexperiences. A review by Carlin et al. [40] also analysed the association of environmentalfactors and levels of PA. The study associated increased levels of PA in neighbourhoodswhich provided facilities, parks and public equipment, and found the opposite for thosewith fewer facilities. Therefore, environmental and cultural aspects may possibly explainthe difference reported between the test performance of each country within the presentinvestigation.
4.2. Sport and Spare Time-Related Aspects
In the previous sections, the influence of habits regarding the activity levels wasevaluated [41]. The results we obtained in this sample of European children confirm thatpositive habits and lifestyles are associated with improved performance of the crunningmovement. For instance, the better results obtained in those children engaged in gymactivities or those going out to the park in their spare time. Our results are in line with asystematic review analysing the relationship between outdoor time and PF in children [42].The authors report an overall positive effect of outdoor time on PF, however, with nospecific effect on musculoskeletal fitness. Another cross-sectional investigation aimed tounderstand how sedentary behaviours or screen time could affect motor skills in childrenaged 5–16 years [43]. Screen time in particular was associated with lower physical activity,with greater effects on adolescents compared to children and on girls compared to boys.
117
J. Funct. Morphol. Kinesiol. 2021, 6, 9
This aspect, if linked to increased sedentary behaviours, could lead to increased fat massand therefore decreased PF amongst children [44].
In addition, our results also show that children engaged in team sports performedbetter than those engaged in individual activities, independently of the activity intensity.Other investigations comparing individual and team sports have reported similar results,for example, Morano et al. [45] evaluated physical and psychological factors among chil-dren, finding that children engaged in team activities had better shuttle run results foraerobic performances compared to their peers who were engaged in individual sports, andwere also less dissatisfied with their body image. Jukic et al. [46] examined the differencesin fundamental motor skills in a sample of under-10 soccer players, indicating that greatermotor skills were positively related to gross motor quotient and locomotion skills. Schoolchildren’s enjoyment and cohesion during sport activities can predict physical improve-ments, and those engaged in team sports show significantly higher levels of enjoyment [47].Being engaged in team sports has also been associated in children with increased motorskill proficiency [48], with greater associations in boys compared to girls. When neurobio-logical integrations are analysed, it is possible to see that boys involved in team sports havethinner cortices in the frontal lobe compared to those engaged in individual activities. Thisaspect indicates a faster maturation of the frontal cortex related to an advantage of frontalareas functioning [49]. These are factors that altogether are determinant to adequatelyperform a complex skill as the crunning movement, which requires the use of upper andlower limbs simultaneously.
4.3. Cognitive and Neuropsychological Aspects
Relative to cognitive and neuropsychological aspects, two main findings have beenassociated to the performance. Firstly, academic achievement is negatively linked to theperformance results and, secondly, cognitive function is not linked to crunning performanceneither for children practicing team sports nor for those practicing individual sports. Ourfindings are generally in contrast with other investigations. Emerging literature has posi-tively linked cognitive performance and academic achievement to sport performance [50].Such associations are also seen in intervention studies where both cognitive functioning andacademic achievement are increased following a physical intervention [51–53]. However,the majority of studies have proposed aerobic activity as the main typology of physicalactivity included within their interventions [54]. These interventions are seen to act by im-proving brain structure and function [4]. However, within our study, neither a longitudinalintervention was undertaken nor the crunning movement involves aerobic metabolismactivation. It is possible that the nature of the crunning movement itself requires a differentcognitive demand compared to the cognitive and neuropsychological measures assessed.
Limitations of this study are the following: (1) The sample for each country wascollected within one school, therefore, it was not possible to evaluate specific local aspectsbut only broad geographical differences. (2) Not all countries had the availability of bothmale and female participants. (3) The classification for sport intensity was based on broadcharacteristics of sporting activities (i.e., soccer, basket, gymnastics, etc.), therefore it isnot possible to associate specific aspects related to different approaches between countries.(4) Regarding the cognitive and neuropsychological assessment, not all children andadolescents from the different countries were screened because they were not present at thetime of the evaluation. Therefore, the sample which is available for providing informationregarding results for such aspects is restricted. Indeed, a broader sample would be requiredfor greater consistency of the test. There is a need to identify the sensitivity of the test tospecific physical qualities.
Therefore, it will be important in future investigations to compare the present resultsto other populations in order to verify the applicability of the findings here provided.
The present study is the first known study to have evaluated and tried to identifyvariables associated to the crunning movement. Therefore, it will be necessary to consider
118
J. Funct. Morphol. Kinesiol. 2021, 6, 9
gender and physical activity differences among individuals if planning to include thecrunning test within a test battery.
5. Conclusions
The present investigation detected different factors associated with the performanceof the crunning movement. These are related to lifestyle and cognitive factors which mayinfluence performance of the crunning movement. These associated variables need to beconsidered when comparing the results of the crunning movement test, especially acrosspopulations. Special attention must be paid regarding gender and previously practicedphysical activity. The specificity of the crunning test still needs to be understood within thecontext of a fitness evaluation.
Author Contributions: Conceptualization, A.B.; Data curation, A.B. and F.N.S.; Formal analysis, E.T.and G.T.; Investigation, C.M.d.S., M.B., M.G.-L. and S.P.; Methodology, M.G.-L.; Project administra-tion, M.A. and A.P.; Supervision, M.B.; Visualization, A.R.; Writing—original draft, E.T. and G.T.;Writing—review & editing, A.B., Ö.G. and D.J.S. All authors have read and agreed to the publishedversion of the manuscript.
Funding: The work was conducted within the ESA (Enriched Sport Activities) Program—Agreementnumber 2016-3723/001-001, funded by the Erasmus Plus Sport Programme (2017–2019) of the Euro-pean Commission. Erasmus+ Sport Programme. EAC/A04/2015—Round 2 E+ SPORT PROJECT:579661-EPP-1-2016-2-IT-SPO-SCP. Enriched Sport Activities Program.
Institutional Review Board Statement: The study was conducted according to the guidelines of theDeclaration of Helsinki, and approved by the Lithuanian Sports University’s Institutional ReviewBoard, approval No 579661-EPP-1-2016-2-IT-SPO-SCP (2018-02-05).
Informed Consent Statement: A parent or legal representative of each child signed a declaration ofinformed consent.
Data Availability Statement: Data available on request due to restrictions eg privacy or ethical.
Conflicts of Interest: The authors declare no conflict of interest. The funders had no role in the designof the study; in the collection, analyses, or interpretation of data; in the writing of the manuscript, orin the decision to publish the results.
References
1. Tomkinson, G.R.; Carver, K.D.; Atkinson, F.; Daniell, N.D.; Lewis, L.K.; Fitzgerald, J.S.; Lang, J.J.; Ortega, F.B. European normativevalues for physical fitness in children and adolescents aged 9-17 years: Results from 2,779,165 eurofit performances representing30 countries. Br. J. Sports Med. 2017, 52. [CrossRef] [PubMed]
2. Bianco, A.; Jemni, M.; Thomas, E.; Patti, A.; Paoli, A.; Ramos Roque, J.; Palma, A.; Mammina, C.; Tabacchi, G. A systematic reviewto determine reliability and usefulness of the field-based test batteries for the assessment of physical fitness in adolescents—Theasso project. Int. J. Occup. Med. Environ. Health 2015, 28, 445–478. [CrossRef] [PubMed]
3. Ortega, F.B.; Ruiz, J.R.; Castillo, M.J.; Moreno, L.A.; Gonzalez-Gross, M.; Warnberg, J.; Gutierrez, A.; Group, A. Low level ofphysical fitness in spanish adolescents. Relevance for future cardiovascular health (avena study). Rev. Esp. Cardiol. 2005, 58,898–909. [CrossRef] [PubMed]
4. Donnelly, J.E.; Hillman, C.H.; Castelli, D.; Etnier, J.L.; Lee, S.; Tomporowski, P.; Lambourne, K.; Szabo-Reed, A.N. Physicalactivity, fitness, cognitive function, and academic achievement in children: A systematic review. Med. Sci. Sports Exerc. 2016, 48,1197–1222. [CrossRef]
5. Smith, J.J.; Eather, N.; Morgan, P.J.; Plotnikoff, R.C.; Faigenbaum, A.D.; Lubans, D.R. The health benefits of muscular fitness forchildren and adolescents: A systematic review and meta-analysis. Sports Med. 2014, 44, 1209–1223. [CrossRef]
6. Misuraca, R.; Miceli, S.; Teuscher, U. Three effective ways to nurture our brain: Physical activity, healthy nutrition, and music. Areview. Eur. Psychol. 2017, 22, 101–120. [CrossRef]
7. Seo, Y.G.; Lim, H.; Kim, Y.; Ju, Y.S.; Lee, H.J.; Jang, H.B.; Park, S.I.; Park, K.H. The effect of a multidisciplinary lifestyle interventionon obesity status, body composition, physical fitness, and cardiometabolic risk markers in children and adolescents with obesity.Nutrients 2019, 11, 137. [CrossRef]
8. Karatoprak, C.; Ekinci, I.; Batar, N.; Zorlu, M.; Cakirca, M.; Kiskac, M.; Demirtunc, R. The relationship between the frequency ofbrisk walking and weight loss and other metabolic parameters in obese individuals. Acta Med. Mediterr. 2019, 2125. [CrossRef]
9. Álvarez-Bueno, C.; Pesce, C.; Cavero-Redondo, I.; Sánchez-López, M.; Garrido-Miguel, M.; Martínez-Vizcaíno, V. Academicachievement and physical activity: A meta-analysis. Pediatrics 2017, 140, e20171498. [CrossRef]
119

J. Funct. Morphol. Kinesiol. 2021, 6, 9
10. Slawta, J.; Bentley, J.; Smith, J.; Kelly, J.; Syman-Degler, L. Promoting healthy lifestyles in children: A pilot program of be a fit kid.Health Promot. Pract. 2008, 9, 305–312. [CrossRef]
11. Condello, G.; Puggina, A.; Aleksovska, K.; Buck, C.; Burns, C.; Cardon, G.; Carlin, A.; Simon, C.; Ciarapica, D.; Coppinger, T.;et al. Behavioral determinants of physical activity across the life course: A “determinants of diet and physical activity” (dedipac)umbrella systematic literature review. Int. J. Behav. Nutr. Phys. Act. 2017, 14, 58. [CrossRef] [PubMed]
12. Tabacchi, G.; Faigenbaum, A.; Jemni, M.; Thomas, E.; Capranica, L.; Palma, A.; Breda, J.; Bianco, A. Profiles of physical fitness riskbehaviours in school adolescents from the asso project: A latent class analysis. Int. J. Environ. Res. Public Health 2018, 15, 1933.[CrossRef] [PubMed]
13. Zaqout, M.; Vyncke, K.; Moreno, L.A.; De Miguel-Etayo, P.; Lauria, F.; Molnar, D.; Lissner, L.; Hunsberger, M.; Veidebaum, T.;Tornaritis, M.; et al. Determinant factors of physical fitness in european children. Int. J. Public Health 2016, 61, 573–582. [CrossRef][PubMed]
14. Chung, J.W.; Chung, L.M.; Chen, B. The impact of lifestyle on the physical fitness of primary school children. J. Clin. Nurs. 2009,18, 1002–1009. [CrossRef]
15. Thomas, E.; Bianco, A.; Tabacchi, G.; Marques da Silva, C.; Loureiro, N.; Basile, M.; Giaccone, M.; Sturm, D.J.; Sahin, F.N.; Guler,O.; et al. Effects of a physical activity intervention on physical fitness of schoolchildren: The enriched sport activity program. Int.J. Environ. Res. Public Health 2020, 17, 1723. [CrossRef]
16. Thomas, E.; Palma, A. Physical fitness evaluation of school children in southern italy: A cross sectional evaluation. J. Funct.Morphol. Kinesiol. 2018, 3, 14. [CrossRef]
17. De Miguel-Etayo, P.; Gracia-Marco, L.; Ortega, F.B.; Intemann, T.; Foraita, R.; Lissner, L.; Oja, L.; Barba, G.; Michels, N.; Tornaritis,M.; et al. Physical fitness reference standards in european children: The idefics study. Int. J. Obes. 2014, 38 (Suppl. S2), S57–S66.[CrossRef]
18. Thomas, E.; Petrigna, L.; Tabacchi, G.; Teixeira, E.; Pajaujiene, S.; Sturm, D.J.; Nese Sahin, F.; Gómez-López, M.; Pausic, J.; Paoli,A.; et al. Percentile values of the standing broad jump in children and adolescents aged 6-18 years old. Eur. J. Transl. Myol. 2020,30, 240–246. [CrossRef]
19. Hoffmann, M.D.; Colley, R.C.; Doyon, C.Y.; Wong, S.L.; Tomkinson, G.R.; Lang, J.J. Normative-referenced percentile values forphysical fitness among canadians. Health Rep. 2019, 30, 14–22.
20. Ramos-Sepúlveda, J.A.; Ramírez-Vélez, R.; Correa-Bautista, J.E.; Izquierdo, M.; García-Hermoso, A. Physical fitness andanthropometric normative values among colombian-indian schoolchildren. BMC Public Health 2016, 16, 962. [CrossRef]
21. Vanhelst, J.; Labreuche, J.; Béghin, L.; Drumez, E.; Fardy, P.S.; Chapelot, D.; Mikulovic, J.; Ulmer, Z. Physical fitness referencestandards in french youth: The bouge program. J. Strength Cond. Res. 2017, 31, 1709–1718. [CrossRef] [PubMed]
22. Gahche, J.J.; Kit, B.K.; Fulton, J.E.; Carroll, D.D.; Rowland, T. Normative values for cardiorespiratory fitness testing among uschildren aged 6-11 years. Pediatr. Exerc. Sci. 2017, 29, 177–185. [CrossRef] [PubMed]
23. Laurson, K.R.; Saint-Maurice, P.F.; Welk, G.J.; Eisenmann, J.C. Reference curves for field tests of musculoskeletal fitness in u.S.Children and adolescents: The 2012 nhanes national youth fitness survey. J. Strength Cond. Res. 2017, 31, 2075–2082. [CrossRef][PubMed]
24. Patrick, S.K.; Noah, J.A.; Yang, J.F. Interlimb coordination in human crawling reveals similarities in development and neuralcontrol with quadrupeds. J. Neurophysiol. 2009, 101, 603–613. [CrossRef]
25. Sporiš, G.; Harasin, D.; Bok, D.; Matika, D.; Vuleta, D. Effects of a training program for special operations battalion on soldiers’fitness characteristics. J. Strength Cond. Res. 2012, 26, 2872–2882. [CrossRef]
26. Jetté, M.; Kimick, A.; Sidney, K. Evaluating the occupational physical fitness of canadian forces infantry personnel. Mil. Med.1989, 154, 318–322. [CrossRef]
27. Feka, K.; Bianco, A. Illinois test vs crunning test in children living in southern italy: An update of the esa program. In Proceedingsof the XI Congresso Nazionale SISMES, Bologna, Italy, 27–29 September 2019.
28. Leger, L.A.; Mercier, D.; Gadoury, C.; Lambert, J. The multistage 20 metre shuttle run test for aerobic fitness. J. Sports Sci. 1988, 6,93–101. [CrossRef]
29. Gentile, A.; Boca, S.; Sahin, F.N.; Güler, Ö.; Pajaujiene, S.; Indriuniene, V.; Demetriou, Y.; Sturm, D.; Gómez-López, M.; Bianco, A.;et al. The effect of an enriched sport program on children’s executive functions: The esa program. Front. Psychol. 2020, 11, 657.[CrossRef]
30. Tabacchi, G.; Lopez Sanchez, G.F.; Nese Sahin, F.; Kizilyalli, M.; Genchi, R.; Basile, M.; Kirkar, M.; Silva, C.; Loureiro, N.; Teixeira,E.; et al. Field-based tests for the assessment of physical fitness in children and adolescents practicing sport: A systematic reviewwithin the esa program. Sustainability 2019, 11, 7187. [CrossRef]
31. Levine, B.D.; Baggish, A.L.; Kovacs, R.J.; Link, M.S.; Maron, M.S.; Mitchell, J.H. Eligibility and disqualification recommendationsfor competitive athletes with cardiovascular abnormalities: Task force 1: Classification of sports: Dynamic, static, and impact:A scientific statement from the american heart association and american college of cardiology. J. Am. Coll. Cardiol. 2015, 66,2350–2355.
32. Roriz De Oliveira, M.S.; Seabra, A.; Freitas, D.; Eisenmann, J.C.; Maia, J. Physical fitness percentile charts for children aged 6–10from portugal. J. Sports Med. Phys. Fit. 2014, 54, 780–792.
120
J. Funct. Morphol. Kinesiol. 2021, 6, 9
33. Castro-Pinero, J.; Gonzalez-Montesinos, J.L.; Mora, J.; Keating, X.D.; Girela-Rejon, M.J.; Sjostrom, M.; Ruiz, J.R. Percentile valuesfor muscular strength field tests in children aged 6 to 17 years: Influence of weight status. J. Strength Cond. Res. 2009, 23,2295–2310. [CrossRef] [PubMed]
34. Marini, M.; Veicsteinas, A. The exercised skeletal muscle: A review. Eur. J. Transl. Myol.-Myol. Rev. 2013, 20, 105–120. [CrossRef]35. Koulouvaris, P.; Tsolakis, C.; Tsekouras, Y.E.; Donti, O.; Papagelopoulos, P.J. Obesity and physical fitness indices of children aged
5-12 years living on remote and isolated islands. Rural Remote Health 2018, 18, 4425. [CrossRef]36. Emeljanovas, A.; Mieziene, B.; Cesnaitiene, V.J.; Fjortoft, I.; Kjønniksen, L. Physical fitness and anthropometric values among
lithuanian primary school children: Population-based cross-sectional study. J. Strength Cond. Res. 2020, 34, 414–421. [CrossRef][PubMed]
37. Cochrane, T.; Davey, R.C.; de Castella, F.R. Anthropometric standards for australian primary school children: Towards a systemfor monitoring and supporting children’s development. J. Sci. Med. Sport 2017, 20, 284–289. [CrossRef] [PubMed]
38. Armstrong, M.E.; Lambert, E.V.; Lambert, M.I. Physical fitness of south african primary school children, 6 to 13 years of age:Discovery vitality health of the nation study. Percept. Mot. Skills 2011, 113, 999–1016. [CrossRef] [PubMed]
39. Tinazci, C.; Emiroglu, O. Physical fitness of rural children compared with urban children in north cyprus: A normative study.J. Phys. Act. Health 2009, 6, 88–92. [CrossRef]
40. Carlin, A.; Perchoux, C.; Puggina, A.; Aleksovska, K.; Buck, C.; Burns, C.; Cardon, G.; Chantal, S.; Ciarapica, D.; Condello, G.;et al. A life course examination of the physical environmental determinants of physical activity behaviour: A “determinants ofdiet and physical activity” (dedipac) umbrella systematic literature review. PLoS ONE 2017, 12, e0182083. [CrossRef]
41. Di Maio, G.; Monda, V.; Messina, A.; Polito, R.; Monda, M.; Tartaglia, N.; Ambrosio, A.; Pisanelli, D.; Asmundo, A.; Di Nunno, N.;et al. Physical activity and modification of lifestyle induce benefits on the health status. Acta Med. Mediterr. 2020, 36, 1913–1919.
42. Gray, C.; Gibbons, R.; Larouche, R.; Sandseter, E.B.; Bienenstock, A.; Brussoni, M.; Chabot, G.; Herrington, S.; Janssen, I.; Pickett,W.; et al. What is the relationship between outdoor time and physical activity, sedentary behaviour, and physical fitness inchildren? A systematic review. Int. J. Environ. Res. Public Health 2015, 12, 6455–6474. [CrossRef] [PubMed]
43. Hardy, L.L.; Ding, D.; Peralta, L.R.; Mihrshahi, S.; Merom, D. Association between sitting, screen time, fitness domains, andfundamental motor skills in children aged 5-16 years: Cross-sectional population study. J. Phys. Act. Health 2018, 15, 933–940.[CrossRef] [PubMed]
44. Carson, V.; Hunter, S.; Kuzik, N.; Gray, C.E.; Poitras, V.J.; Chaput, J.P.; Saunders, T.J.; Katzmarzyk, P.T.; Okely, A.D.; ConnorGorber, S.; et al. Systematic review of sedentary behaviour and health indicators in school-aged children and youth: An update.Appl. Physiol. Nutr. Metab. 2016, 41, S240–S265. [CrossRef] [PubMed]
45. Morano, M.; Colella, D.; Capranica, L. Body image, perceived and actual physical abilities in normal-weight and overweight boysinvolved in individual and team sports. J. Sports Sci. 2011, 29, 355–362. [CrossRef]
46. Jukic, I.; Prnjak, K.; Zoellner, A.; Tufano, J.J.; Sekulic, D.; Salaj, S. The importance of fundamental motor skills in identifyingdifferences in performance levels of u10 soccer players. Sports 2019, 7, 178. [CrossRef]
47. Elbe, A.M.; Wikman, J.M.; Zheng, M.; Larsen, M.N.; Nielsen, G.; Krustrup, P. The importance of cohesion and enjoyment forthe fitness improvement of 8-10-year-old children participating in a team and individual sport school-based physical activityintervention. Eur. J. Sport Sci. 2017, 17, 343–350. [CrossRef]
48. Field, S.; Temple, V. The relationship between fundamental motor skill proficiency and participation in organized sports andactive recreation in middle childhood. Sports 2017, 5, 43. [CrossRef]
49. Lopez-Vicente, M.; Tiemeier, H.; Wildeboer, A.; Muetzel, R.L.; Verhulst, F.C.; Jaddoe, V.W.V.; Sunyer, J.; White, T. Corticalstructures associated with sports participation in children: A population-based study. Dev. Neuropsychol. 2017, 42, 58–69.[CrossRef]
50. de Greeff, J.W.; Bosker, R.J.; Oosterlaan, J.; Visscher, C.; Hartman, E. Effects of physical activity on executive functions, attentionand academic performance in preadolescent children: A meta-analysis. J. Sci. Med. Sport 2018, 21, 501–507. [CrossRef]
51. Memarmoghaddam, M.; Torbati, H.T.; Sohrabi, M.; Mashhadi, A.; Kashi, A. Effects of a selected exercise programon executivefunction of children with attention deficit hyperactivity disorder. J. Med. Life 2016, 9, 373–379.
52. Donnelly, J.E.; Hillman, C.H.; Greene, J.L.; Hansen, D.M.; Gibson, C.A.; Sullivan, D.K.; Poggio, J.; Mayo, M.S.; Lambourne,K.; Szabo-Reed, A.N.; et al. Physical activity and academic achievement across the curriculum: Results from a 3-year cluster-randomized trial. Prev. Med. 2017, 99, 140–145. [CrossRef] [PubMed]
53. Cascone, C.; Nicotra, R.; Mangano, T.; Massimino, S.; Maugeri, A.; Petralia, M.; Attinà, A.N. Executive functions and sportclimbing in adolescence. Acta Med. Mediterr. 2013, 29, 91–94.
54. Verburgh, L.; Königs, M.; Scherder, E.J.A.; Oosterlaan, J. Physical exercise and executive functions in preadolescent children,adolescents and young adults: A meta-analysis. Br. J. Sports Med. 2014, 48, 973. [CrossRef] [PubMed]
121

Journal of
Functional Morphology and Kinesiology
Article
Four Minutes of Sprint Interval Training Had NoAcute Effect on Improving Alertness, Mood,and Memory of Female Primary School Children andSecondary School Adolescents: A RandomizedControlled Trial
Terence Chua 1, Abdul Rashid Aziz 2 and Michael Chia 1,*
1 Physical Education and Sport Science Academic Group, National Institute of Education,Nanyang Technological University, Singapore 637616, Singapore; [email protected]
2 Sport Medicine and Sport Science, Singapore Sport Institute, Singapore 397630, Singapore;[email protected]
* Correspondence: [email protected]
Received: 13 November 2020; Accepted: 10 December 2020; Published: 14 December 2020 ���������������
Abstract: We investigated whether a 4-min sprint interval training (SIT) protocol had an acute effect(15 min after) on improving alertness, mood, and memory recall in female students. Sixty-three childrenand 131 adolescents were randomly assigned to either a SIT or control (CON) group by the classPhysical Education (PE) teachers. The SIT intervention was delivered twice a week for 3 weeks.SIT participants performed three, 20-s ‘all-out’ effort sprints interspersed with 60-s intervals of walkingwhile CON group sat down and rested. PE lessons were arranged such that the first two sessions wereto familiarise participants with the SIT protocol leading to acute assessments conducted on the thirdsession. On that occasion, both groups rated their alertness and mood on a single-item hedonic scaleand underwent an adapted memory recall test. The same assessments were administered to bothgroups fifteen minutes after delivery of SIT intervention. A 4-min SIT involving three, 20 s ‘all-out’effort intensity sprints did not have an acute main effect on improving alertness, mood and, memoryrecall in female children (ηp
2 = 0.009) and adolescents (ηp2 = 0.012). Students’ exercise adherence and
feedback from PE teachers are indicatives of the potential scalability of incorporating SIT into PEprogrammes. Different work-to-rest ratios could be used in future studies.
Keywords: sprint-interval training; learning in youths; acute exercise; school; attention
1. Introduction
Emergent literature suggests that a single session of aerobic exercise has beneficial effects onmood [1] and cognition [2] in adults. Reviews and meta-analyses have found that acute and chronicexercise improves attention and memory in children and adolescents [3,4]. These two domains ofcognitive functions are essential for learning [5].
Improved cognition and enhanced mood after an acute bout of aerobic exercise may be explained bypsychological and neurophysiological mechanisms. Exercise acts as an arousal stimulus [6]. Synthesis ofbrain-derived neurotropic factors (BDNF) is up-regulated leading to the activation of a pathway thatinitiates neuroplasticity and neurogenesis of the hippocampus [7,8]. Increased blood circulation duringexercise also promotes more oxygen being delivered to the brain [9]. However, these underlyingmechanisms are said to be dependent on exercise intensity. A meta-analysis revealed that studiesutilising higher intensity exercise reported greater acute cognitive benefits [2]. The intensity of exercise
J. Funct. Morphol. Kinesiol. 2020, 5, 92; doi:10.3390/jfmk5040092 www.mdpi.com/journal/jfmk123

J. Funct. Morphol. Kinesiol. 2020, 5, 92
can also affect mood differently [10]. Therefore, higher intensity exercise may be necessary for anypotential positive effect on mood and cognition to be maximised. The acute and chronic exerciseeffects cannot be considered in isolation. It is explained that exercise training both in the short term(immediate and/or soon after) and long term (days, weeks, months, and years) increases the capacityfor exercise, thereby permitting more vigorous and/or more prolonged individual exercise sessionsand a more significant acute effect [11]. As such, an acute response to an exercise intervention refers tothe transient effects of the exercise immediately or soon after the intervention.
Mood, alertness, and memory have facilitative influences on learning. These states of learning aredifferent and but at the same time can be interdependent on each other. Young people experience arange of emotions, from positive emotions like enjoyment to negative emotions like anger, boredom,and anxiety in the process of learning. When negative emotions arise, learning may become a lessenjoyable process to them. Consequently, they may be less motivated to interact with teachers andclassmates [12,13]. The process of learning involves a continuous effort and awareness to inhibitthe shift of attention to irrelevant activities [14,15]. Otherwise, a phenomenon called attentionalbottleneck may manifest [16]. Children and adolescents spend six or more hours of their waking timein school, with much of those time spent engaging in sedentary activities due to classroom curriculumrequirements and the inactive nature of most post-curriculum school-based activities [17]. Even thougha single session of exercise is unlikely to cause impact on mood and cognition lasting throughout theschooling day, it may be opportunistic for qualified physical education teachers to enrich their students’formal learning experience by harvesting the immediate benefits of exercise.
The impact of interval training on cognition and learning in young people has generated researchinterest in recent years. Interval training can be characterized as sprint-interval training (SIT) orhigh-intensity interval training (HIIT). SIT involves very short bouts of ‘all-out’ effort sprints whileHIIT involves relatively intense but submaximal workloads corresponding to 80–100% of maximalheart rate. Both forms of interval training are interspersed with periods of lower-intensity recovery [18].Interval training resembles the sporadic patterns of physical play of free-living young people [19,20]and is generally well-tolerated [21,22]. The attractiveness of interval training is that the time invested tocomplete the exercise is only a fraction of that in traditional endurance training. This time-saving exercisemodality is shown to be effective in improving cardiorespiratory fitness and certain cardiovascularand metabolic disease biomarkers in healthy and overweight youths when implemented as an exerciseprogramme over several weeks to a few months [23–25].
Among various interval-training protocols that were studied in the literature, as little as three,20 s all-out effort cycling sprints performed thrice a week for six weeks has shown to elicit chronic skeletalmuscle adaptations linked to increased cardiorespiratory fitness as well as improved cardio-metabolichealth biomarkers in adults [26]. This protocol involves a total work duration of 1 min. It is one of theshortest SIT methods to date to demonstrate positive health-related outcomes, albeit in adults. In termsof the acute effect of interval training on cognition in children and adolescents. Previous studiesexamining the acute effect of interval training on cognition in children and adolescents had used totalwork durations which were longer than that of Gillen and his colleagues’ protocol. Some researchersused shorter intervals of exercise (10–20 s) while others used longer intervals of exercise (30 s) repeatedbetween 8 and 16 times [27–29]. A 15- to 20-s bout of ‘all-out’ intensity sprint is suggested to bemore palatable for children and adolescents rather than sprint bouts of longer durations (e.g., 30 s or40 s) [30].
Interestingly, a recent study showed that embedding interval-training within the school day hasled to increased moderate-intensity physical activity levels in adolescents [31]. Girls are oftentimesless active than boys [32–34] and hence the use of interval-training to increase physical activity haspotential implications on them. Besides, girls are an under-served group compared to boys as researchevidence in this area is scarce. Therefore, the primary objective of the study was to investigate the acuteeffect of a three, 20 s ‘all-out’ effort sprints on self-reported mood and alertness, and memory recall offemale children and adolescents when delivered within a physical education (PE) setting. A secondary
124

J. Funct. Morphol. Kinesiol. 2020, 5, 92
aim of the study was to gain perspectives from PE teachers about the feasibility of infusing SIT intophysical education classes.
2. Materials and Methods
2.1. Enrolment of Participants and Institutional Ethical Clearance
One independent all-girl primary school and secondary school were invited to take part in thestudy via convenience sampling. The heads of PE department of both schools were contacts of theprincipal investigator. The school principal gave her consent and permission for conducting theresearch in schools was granted by the Ministry of Education. The study protocol and ethics wasapproved by the Institutional Review Board of the university on 4 April 2018 (IRB-2018-02-009-4).Upon discussion with the PE departments, one Primary 5 and one Secondary 1 cohorts were selected forthe study. Written child assent and informed consent from the parents were obtained. Sixty-six femalechildren (9–10 years old) and 131 female adolescents (12–13 years old) from the selected cohorts wereenrolled in the study.
2.2. Study Design
The research employed a parallel, randomized control study design with a 1:1 allocation ratio.Participants were randomly assigned to either a SIT or control (CON) group at the individual level bythe class PE teachers. The SIT intervention commenced twice a week for 3 weeks (6 sessions) and allPE lessons were conducted in the mornings, between 8 and 10 am. Following at least two separatefamiliarization sessions, the acute effects of SIT was assessed. Of the thirteen classes involved in thestudy, a few missed 1–2 SIT sessions due to timetabling constraints as reported by the respective PEteachers (i.e., PE lesson was cancelled when it fell on a public holiday).
2.3. SIT Protocol and Familiarisation Sessions Leading to the Day of Acute Assessment
The SIT group performed a three-minute warm-up routine (light lower limb stretches) followedby three 20 s ‘all-out’ effort running shuttle-sprints interspersed with intervals of 60 s of walking.The 3 × 20 s sprint bouts adapted from Gillen and his colleagues’ work is one of the shortest SITprotocols to date. A work-to-rest ratio of 1:3 may be appropriate as a study showed that female childrenand adolescents were able to replicate the peak power generated in the first bout into subsequent boutsof the Wingate Anaerobic Test better than adult women [21]. This suggests that an active rest intervalof 60 s derived from the 1:3 ratio may be sufficient for female children and adolescents to re-generatepeak anaerobic power. The CON group did not receive the SIT intervention. Instead, they sat downand cheered on the SIT group during the shuttle sprints. Duration of the SIT protocol was four minutesand when warm-up was included, the total exercise session was less than eight minutes.
Prior to the study, the qualified PE teachers involved in the research were trained on how to deliverthe SIT intervention and acute assessments by the principal investigator and his research assistant.The first two sessions were delivered to familiarise participants what an ‘all-out’ effort entails in thelead up to the acute assessments conducted on the third session. Each SIT participant was paired witha participant from the CON group who was tasked to count the number of sprint-shuttles completedover a marked out 20-m distance by their partner (data not presented). Upon the teacher’s cue, the SITgroup sprinted as hard as they could back and forth the marked-out distance for 20 s. Immediatelyafter the 20 s sprint, participants walked to and from the marked-out distance for 60 s. With 15 s togo, participants were instructed to return to the starting position and get ready for the second bout.The process of a 20-s sprint bout followed by a 60-s walking recovery was repeated. Participants thenperformed their third and final bout of 20 s sprint and recovered right after for 60 s. Throughout theshuttle-sprints, partners of participants from the SIT group counted aloud the number of sprint shuttlescompleted and cheered the participants on to match or better the number of sprint shuttles completedin the previous bout. Most participants were able to match the number of shuttles completed in the
125
J. Funct. Morphol. Kinesiol. 2020, 5, 92
previous sprint (data not reported). Indirectly, this indicated that participants were able to provide amaximal effort throughout the three sprint bouts.
2.4. Acute Assessment of Alertness, Mood, and Memory Recall (before and 15 min after SIT)
The primary outcome measures (i.e., alertness, mood, and memory recall) were assessed duringthe 3rd PE lesson. Before the SIT intervention was delivered, participants were asked to rate their moodand alertness from 1–10 on a mood scale [35] and a self-constructed alertness scale (i.e., higher numberindicated better mood and greater alertness). The questions posed to them were: ‘How are your moodright now? Please circle a number that best represents your current mood.’ and ‘How alert, watchful orattentive are you right now? Please circle a number that best describes you.’ The scale consists of faceswith expressions from frown to smiles above the number 1, 5, and 10 in gradations that are intendedto reflect a progressive change of feelings. Hedonic scales like these are commonly administered toyoung children in consumer and food preference research. Although its psychometric properties forassessing mood and alertness are not established, another study has adapted it for the same purposeas the present study [31].
In addition, participants underwent an adapted version of the Rey Auditory Verbal Memory Recalltest (RAVRT) [36]. The RAVRT was previously administered to the same age group of participants [37].Instead of the full five trials, a single trial of recall was used in the present study. The PE teacher readout a list of 15 unrelated nouns each containing two syllables to the participants at a speed of one wordper second. After the last word was read out, participants wrote down as many words as they couldrecall (order and spelling of words were not important). The number of correct words recalled by eachparticipant was recorded. The RAVRT is commonly used in clinical research and practice and hasa robust construct validity and internal consistency (Cronbach’s alpha coefficient of 0.8) which wasfound to be closely associated with other tests of verbal learning which renders it to be a valid andreliable psychometric instrument.
Fifteen minutes after the SIT intervention was delivered, the same acute assessments wereadministered but in a different order. A different word list was used in the memory recall test ofwhich the words are what students have learnt before. The delay of 11–20 min after exercise wasreported to be the window of opportunity for observing the greatest positive effects on cognition.Positive effects may diminish beyond 20 min whereas assessing too soon after exercise may result innegative effects [2]. The study flow from enrolment of schools to data analysis of acute measures isshown in Figure 1 below.
At the end of the study, PE teachers were polled on their perceptions on the feasibility ofincorporating SIT-type activities into their PE curriculum (i) to get students fit for sports and (ii) to getstudents healthy. The PE teachers provided their ratings on a self-constructed 5-point scale, with 1 being‘I do not find it feasible’ and 5 being ‘I find it very feasible’. To measure overall exercise adherence rate,the average percentage of the number of SIT participants who completed all SIT sessions was dividedby the number of SIT participants in each class.
2.5. Statistical Analyses
SPSS Version 23 (IBM Corp., Armonk, NY, USA) was the statistical tool used. Normality of dataand homogeneity of variance within each group was assessed. Missing data was replaced by seriesmean of each group. A 2 × 2 repeated-measures analysis of variance (ANOVA) was performed toanalyse the main intervention effect. Given there were only two levels of measurements of the outcomevariables (i.e., before condition and 15 min after condition), the assumption of sphericity was notviolated. The measure of effect size was reported as partial eta square, where ηp
2 = 0.01–0.05 wasinterpreted as a small effect size, ηp
2 = 0.06–0.13 was interpreted as a medium effect size and ηp2 = 0.14
or greater was interpreted as a large effect size. The level of statistical significance was determined asp < 0.05. Descriptive statistics (mean ± SD) for all outcome variables were reported.
126

J. Funct. Morphol. Kinesiol. 2020, 5, 92
Figure 1. Flow diagram through each stage of the parallel, randomized control study design.
3. Results
3.1. Acute Changes in Self-Reported Alertness and Mood, and Memory Recall Score
Separate 2 × 2 repeated-measures ANOVAs were performed to compare the acute effect of a 4-minSIT protocol on improving alertness, mood, and memory recall with the CON group. The results of theunivariate analysis of each outcome variable is presented in Table 1 for female children and in Table 2 forfemale adolescents. Multiple Analysis of Variance (MANOVA) revealed that there was no significantmain effect of the SIT protocol on improving all three conditions of learning in female children,F(3, 59) = 0.168, p = 0.918, ηp
2 = 0.008, as well as in female adolescents, F(3, 127) = 0.528, p = 0.664,ηp
2 = 0.012. The time delay of 15 min following SIT has a significant effect on memory recall, with femalechildren performing better (F(1, 127) = 5.929, p = 0.018, ηp
2 = 0.089) while female adolescents performedpoorer (F(1, 59) = 12.801, p = 0.001, ηp
2 = 0.09) in the RAVRT after SIT. The pre-to-post-test changein self-reported alertness and mood, and memory recall scores between SIT and CON groups werenot significantly different (p > 0.05). These results indicated that a four-minute SIT bout involving acombined one minute of ‘all-out’ effort sprints had no effect on improving alertness, mood, and memoryrecall in female children and adolescents.
3.2. Exercise Adherence and Teachers’ Perceptions on Embedding SIT-Type Activities into the PE Curriculum
Most of the female participants (primary school children: 91.8± 5.0%, secondary school adolescents:93.7 ± 9.2%) completed all SIT sessions that were delivered. Common reasons for their absenteeismreported by the class PE teachers were taking sick leave (not related to the exercise) and being out ofschool for inter-school competitions on the day of PE lesson. Six PE teachers involved in the studyrated 4.2 and 4.0 (out of 5) on their beliefs in the feasibility of infusing SIT-type activities in their PEcurriculum to get (i) students fit for sport and (ii) to keep students healthy, respectively. None of theparticipants were reported to have sustained injuries resulting from the ‘all-out’ intensity sprints underthe tutelage of the qualified PE teachers.
127
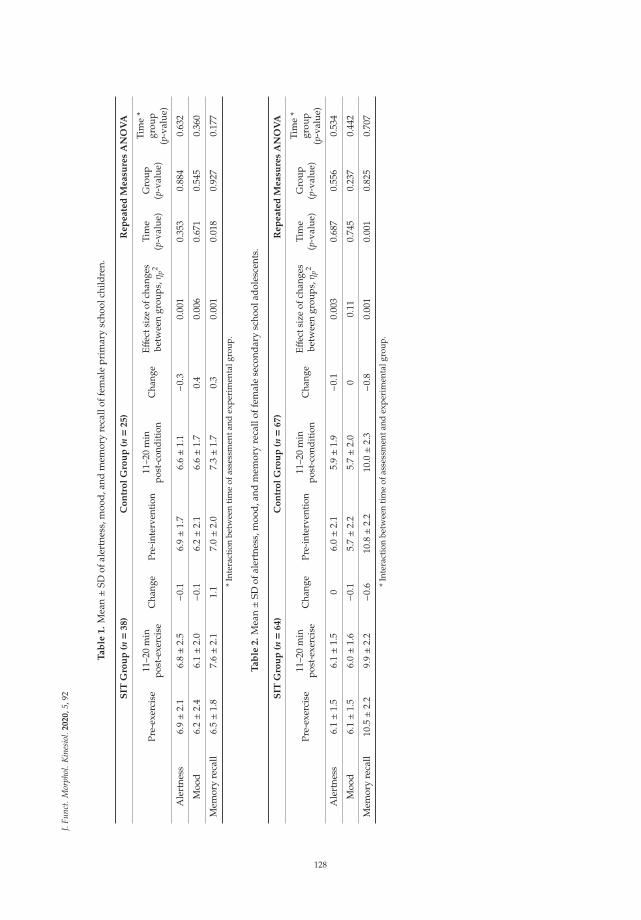
J.Fu
nct.
Mor
phol
.Kin
esio
l.2020,5
,92
Ta
ble
1.
Mea
n±S
Dof
aler
tnes
s,m
ood,
and
mem
ory
reca
llof
fem
ale
prim
ary
scho
olch
ildre
n.
SIT
Gro
up
(n=
38)
Co
ntr
ol
Gro
up
(n=
25)
Rep
eate
dM
easu
res
AN
OV
A
Pre-
exer
cise
11–2
0m
inpo
st-e
xerc
ise
Cha
nge
Pre-
inte
rven
tion
11–2
0m
inpo
st-c
ondi
tion
Cha
nge
Effec
tsiz
eof
chan
ges
betw
een
grou
ps,η
p2Ti
me
(p-v
alue
)G
roup
(p-v
alue
)
Tim
e*
grou
p(p
-val
ue)
Ale
rtne
ss6.
9±2
.16.
8±2
.5−0
.16.
9±1
.76.
6±1
.1−0
.30.
001
0.35
30.
884
0.63
2
Moo
d6.
2±2
.46.
1±2
.0−0
.16.
2±2
.16.
6±1
.70.
40.
006
0.67
10.
545
0.36
0
Mem
ory
reca
ll6.
5±1
.87.
6±2
.11.
17.
0±2
.07.
3±1
.70.
30.
001
0.01
80.
927
0.17
7
*In
tera
ctio
nbe
twee
nti
me
ofas
sess
men
tand
expe
rim
enta
lgro
up.
Ta
ble
2.
Mea
n±S
Dof
aler
tnes
s,m
ood,
and
mem
ory
reca
llof
fem
ale
seco
ndar
ysc
hool
adol
esce
nts.
SIT
Gro
up
(n=
64)
Co
ntr
ol
Gro
up
(n=
67)
Rep
eate
dM
easu
res
AN
OV
A
Pre-
exer
cise
11–2
0m
inpo
st-e
xerc
ise
Cha
nge
Pre-
inte
rven
tion
11–2
0m
inpo
st-c
ondi
tion
Cha
nge
Effec
tsiz
eof
chan
ges
betw
een
grou
ps,η
p2Ti
me
(p-v
alue
)G
roup
(p-v
alue
)
Tim
e*
grou
p(p
-val
ue)
Ale
rtne
ss6.
1±1
.56.
1±1
.50
6.0±2
.15.
9±1
.9−0
.10.
003
0.68
70.
556
0.53
4
Moo
d6.
1±1
.56.
0±1
.6−0
.15.
7±2
.25.
7±2
.00
0.11
0.74
50.
237
0.44
2
Mem
ory
reca
ll10
.5±2
.29.
9±2
.2−0
.610
.8±2
.210
.0±2
.3−0
.80.
001
0.00
10.
825
0.70
7
*In
tera
ctio
nbe
twee
nti
me
ofas
sess
men
tand
expe
rim
enta
lgro
up.
128

J. Funct. Morphol. Kinesiol. 2020, 5, 92
4. Discussion
The primary objective of the study was to examine the acute effect of a SIT protocol involvingthree, 20-s ‘all-out’ effort sprints on improving mood, alertness and memory recall in female primaryschool children and secondary school adolescents. Of interest was also the PE teachers’ perspectiveson using SIT in a lesson setting (i.e., teachers’ thoughts on infusing SIT-type activity in PE lessons asan intervention to get students fit for sports and keeping students healthy). The key findings of thepresent study were that a 4-min SIT protocol involving three-, 20 s ‘all-out’ effort sprint did not haveany acute effect on self-reported mood, alertness, and memory recall in female children and adolescents.These results did not support the authors’ hypothesis that very brief interval exercise enhances studentstates of learning. Contrary to the present results, previous studies showed that school-based intervaltraining elicited a positive impact on student alertness. A programme called FUNtervals, a six-minuteinterval exercise that involved four minutes of dynamic, whole-body exercises such as squats, jumpingjacks and running on the spot performed at high-intensity showed acute improvements in selectiveattention in 88 boys and girls aged 9–11 years [29]. In the cited study, the children made fewer errorsin the d2 test, an objective measure of one’s selective attention, following the FUNtervals sessioncompared to when they were being assigned to a no-activity break group. This was apparently theonly study that examined the effects of HIIT following a brief delay of 11–20 min, as in the presentstudy. It was previously suggested in a meta-analysis that a post-exercise delay of 11–20 min was mostlikely to elicit positive responses in cognition [2]. Interestingly, a recent study reported that the boostin selective attention in 158 adolescents lasted for an hour after a 16-min HIIT session [38]. The 12- to16-year-old adolescents in the cited study were instructed to perform 30 s of high-intensity exercise inbetween rest intervals of 30 s.
Findings in the literature on the effect of school-based interval training on mood in childrenand adolescents are scarce. The SIT protocol in the present study used only one movement task,that is sprinting, rather than a series of different body movements. By the day of acute assessment,the activity became rather mundane to the participants as commented by one of the PE teachers.This could have dampened their motivation and resulted in the lack of change in their self-reportedaffect. This view concurred with previous findings from Cooper and his colleagues who reportedthat 10 × 10 s running sprints, interspersed with 50 s of active recovery had no beneficial immediateeffect on self-reported energy, tension, and calmness in adolescents [27]. Participants in the cited studyreported a higher level of tiredness following the exercise than when they were seated in the restingtrial. It is likely that participants’ mood was in an attenuated state when the mood questionnaire wasadministered soon after exercise. These results were in contrast with findings reported by anotherstudy [28]. They reported that the mood of 21 adolescents improved significantly following aneight- to 10-min HIIT intervention. The reasons for such mixed results are not readily apparent butdifferences in interval-training protocols, participant cohorts, and the timings of the assessments areplausible explanations.
Few studies have investigated the acute effect of HIIT on memory recall in children or adolescents.Findings in the present study showed negligible effect on memory recall in both primary schoolchildren and secondary school adolescents. Similarly, no acute effect on visuo-spatial memory andpictorial memory recall in adolescents were reported in other studies [27,38]. Instead, researchersin the latter cited study showed that selective attention and concentration increased in the secondand third hour after the HIIT intervention. It is noteworthy that the HIIT protocol employed in thecited study is four times the duration (16 versus 4 min) of the SIT protocol used in the present study.The interval training protocols used in the cited studies were not identical to that used in the presentstudy. (i.e., work-to-rest ratio; total exercise time). In addition, differing qualitative characteristics ofthe movement tasks (i.e., cognitive demand and coordinative complexity) may have accounted for themixed results. It was suggested that activity that requires greater attentional and cognitive resourcesled to greater extent of improvement in cognition than activities with low cognitive engagement [39,40].The movement task used in the present study is sprinting which most children and adolescents are
129

J. Funct. Morphol. Kinesiol. 2020, 5, 92
quite accustomed to. It also does not require a greater degree of coordination compared to exercisesdescribed in other studies. Combining the results of 6 acute studies, the authors of a recent review hadfound that a single bout of HIIT produced significant yet small to moderate acute effects on executivefunction and affect in youths [41]. Therefore, whether such brief interval training interventions areuseful need to be addressed using different perspectives in different school contexts. For instance,the efficacy of SIT-type programmes that are time-saving and low volume in helping female youthsadopt a less sedentary lifestyle outside of school.
The use of a single-item hedonic scale is reported elsewhere and is also used for self-reportingpurposes in adolescents [28]. Adolescents in the cited study were asked to complete the hedonic moodscale before and after every HIIT session throughout the period of intervention (a total of 24 times).In contrast to the present findings, adolescents’ mood following HIIT significantly improved by anaverage of 0.97. Unlike other questionnaires used in the interval training literature, the single-itemhedonic mood scale is not established as a validated instrument. Notwithstanding its unestablishedvalidity, the single-item hedonic scale takes less than one minute to answer and is easily comprehensibleto children and adolescents.
The total time taken to complete the SIT protocol in the present study is a fraction of the timetaken by participants in other studies cited in the literature—i.e., 4 min in present study vs. 10 and16 min in other studies [27,38]. It is plausible that the exercise dose in the present study was too briefto have any effect on alertness, mood, and memory recall from baseline values (pre-SIT intervention).In the present study, participants reported they were relatively alert and in good mood, and theirmemory recall scores were not markedly in deficit before the acute SIT intervention. The absenceof significant difference is plausibly due to a ceiling effect for improvement [42] since PE sessionswere conducted relatively early in the morning of a schooling day where children and adolescents arereasonably rested.
4.1. Exercise Adherence and PE Teachers’ Perspective on Infusing SIT in PE Classes
The qualified PE teachers who conducted the study were specially trained by the principalinvestigator and his team. To motivate participants to perform ‘all-out’ intensity efforts, they wereencouraged to match or better the number of sprint-shuttles completed in the previous bouts. Althoughthe proportion of participants who managed to match or better their number of sprint-shuttles isnot reported in the present study, a majority had completed all SIT sessions conducted (91.8% and93.7% of the female children and adolescents, respectively). The exercise adherence in the presentstudy compares well with the exercise adherence rate of 90% among Australian adolescents reportedelsewhere [43]. The continued participation even after the third session, when acute assessmentof alertness, mood and memory recall were administered, is an indication that SIT is an appealingexercise for female children and adolescents in the context of the present study. Additionally, when PEteachers were asked for their perceptions on the feasibility in incorporating SIT-type activities in PElessons, ratings provided were very encouraging. Like the present study, several studies had situatedthe delivery of interval training as an exercise intervention during PE classes, albeit for differentpurposes [44]. On the balance of discussion, it appears that PE classes could be avenues where SIT-typeor HIIT-type activities can feature, given its flexibility in incorporating different forms of dynamicexercise movements as well as its time-saving regimen.
4.2. Strengths and Limitations of Study
A unique contribution of the present study was that it involved a cohort entirely of femaleparticipants and was one of the largest cross-sectional study that the authors are aware of. Furthermore,the high retention rate and positive ratings from PE teachers are indications of the potential scalabilityof introducing SIT-type programme in schools. A limitation of the present study was that theacute assessments for mood, alertness, and memory recall were measured on only one occasionand specifically within the period of 11–20 min (i.e., about 15 min) after the SIT. It is indeterminate
130
J. Funct. Morphol. Kinesiol. 2020, 5, 92
in the present study if the prescribed SIT protocol has any abbreviated or transient effect on theaforementioned factors that affects learning outside of the 11- to 20-min window. In addition, as thisstudy was conducted only on female participants, the effect of SIT on male participants remains tobe examined.
4.3. Future Research Directions
Future research could explore different permutations on the work-to-rest ratio of the SIT protocoland examine its acute effect on mood, alertness, and memory recall of children and adolescents in aschool-based setting. Interval-training could be embedded during the latter part of a school day whenmood, alertness and memory of students are on the wane. These brief exercise breaks should be low involume so that it does not take up much of class time and they should be curated with participantenjoyment in mind.
5. Conclusions
A 4-min SIT involving three, 20 s ‘all-out’ effort intensity sprints had no acute effect on improvingmood, alertness and memory in female children and adolescents. The high exercise adherence rate andencouraging ratings by PE teachers are suggestive of the potential scalability of incorporating SIT intoPE programme in schools. There is a need for more school-based research to explore the acute effect ofdifferent SIT permutations in the context of each school.
Author Contributions: T.C.: Research coordination, data collection & analysis, manuscript writing; A.R.A.: Studyco-conception, manuscript review and revision; M.C.: Research oversight, study conception, manuscript writing,grant owner. All authors have read and agreed to the published version of the manuscript.
Funding: This research was supported by the National Institute of Education, Singapore, under the RS-SAAinstitutional grant (reference no. RS 6/17 MC).
Acknowledgments: The authors would like to acknowledge the school principals, teachers in the physicaleducation departments and participants of both schools for their support, involvement and participation inthe study.
Conflicts of Interest: The authors declare no potential conflict of interest.
Availability of data and material: Data used in the manuscript will be deposited to the data repository ofthe corresponding author’s institution. Permission from the corresponding author before accessing the datais required.
References
1. Guszkowska, M. Effects of exercise on anxiety, depression and mood. Psychiatr. Pol. 2004, 38, 611–620.[PubMed]
2. Chang, Y.K.; Labban, J.D.; Gapin, J.I.; Etnier, J.L. The effects of acute exercise on cognitive performance:A meta-analysis. Brain Res. 2012, 1453, 87–101. [CrossRef] [PubMed]
3. de Greeff, J.W.; Bosker, R.J.; Oosterlaan, J.; Visscher, C.; Hartman, E. Effects of physical activity on executivefunctions, attention and academic performance in preadolescent children: A meta-analysis. J. Sci. Med. Sport2018, 21, 501–507. [CrossRef] [PubMed]
4. Li, J.W.; O’Connor, H.; O’Dwyer, N.; Orr, R. The effect of acute and chronic exercise on cognitive function andacademic performance in adolescents: A systematic review. J. Sci. Med. Sport 2017, 20, 841–848. [CrossRef][PubMed]
5. Ylikrekola, A.; Särelä, J.; Valpola, H. Selective attention improves learning. In Artificial Neural Networks–ICANN2009, Proceedings of the 19th International Conference, Limassol, Cyprus, 14–17 September 2009; Springer: Munich,Germany; pp. 285–294.
6. Christiansen, L.; Beck, M.M.; Bilenberg, N.; Wienecke, J.; Astrup, A.; Lundbye-Jensen, J. Effects of exercise oncognitive performance in children and adolescents with ADHD: Potential mechanisms and evidence-basedrecommendations. J. Clin. Med. 2019, 8, 841. [CrossRef]
7. Vaynman, S.; Ying, Z.; Gomez-Pinilla, F. Hippocampal BDNF mediates the efficacy of exercise on synapticplasticity and cognition. Eur. J. Neurosci. 2004, 20, 2580–2590. [CrossRef]
131

J. Funct. Morphol. Kinesiol. 2020, 5, 92
8. Wrann, C.D.; White, J.P.; Salogiannnis, J.; Laznik-Bogoslavski, D.; Wu, J.; Ma, D.; Lin, J.D.; Greenberg, M.E.;Spiegelman, B.M. Exercise induces hippocampal BDNF through a PGC-1α/FNDC5 pathway. Cell Metab.2013, 18, 649–659. [CrossRef]
9. Querido, J.S.; Sheel, A.W. Regulation of Cerebral Blood Flow During Exercise. Sports Med. 2007, 37, 765–782.[CrossRef]
10. Kennedy, M.M.; Newton, M. Effect of exercise intensity on mood in step aerobics. J. Sports Med. Phys. Fit.1997, 37, 200–204.
11. Thompson, P.D.; Crouse, S.F.; Goodpaster, B.; Kelley, D.; Moyna, N.; Pescatello, L. The acute versus thechronic response to exercise. Med. Sci. Sports Exerc. 2001, 33, S438–S453. [CrossRef]
12. Pekrun, R.; Goetz, T.; Titz, W.; Perry, R.P. Academic emotions in students’ self-regulated learning andachievement: A program of qualitative and quantitative research. Educ. Psychol. 2002, 37, 91–105. [CrossRef]
13. Trezise, K.; University of Melbourne, Melbourne, Victoria, Australia; Bourgeois, A. (The University ofQueensland, Brisbane, Queensland, Australia); Luck, C. (Curtin University, Perth, Western Australia,Australia). Personal communication, 2017. Emotions in classrooms: The need to understand how emotionsAffect and education.
14. Hobbis, M. (University College London, London, United Kingdom, England). Personal communication,2017. We should pay attention to attention.
15. Ko, L.W.; Komarov, O.; Hairston, W.D.; Jung, T.-P.; Lin, C.-T. Sustained Attention in Real Classroom Settings:An EEG Study. Front. Hum. Neurosci. 2017, 11. [CrossRef]
16. Atkinson, R.C.; Shiffrin, R.M. Human memory: A proposed system and its control processes. In ThePsychology of Learning and Motivation; Spence, K.W., Spence, J.T., Eds.; Academic Press: New York, NY, USA,1968; Volume 2, pp. 89–195.
17. Lye, J.C.T.; Mukherjee, S.; Chia, M.H.Y. Physical activity and sedentary behavior patterns of Singaporeanadolescents. J. Phys. Act. Health 2015, 12, 1213–1220.
18. Weston, K.S.; Wisløff, U.; Coombes, J.S. High-intensity interval training in patients with lifestyle-inducedcardiometabolic disease: A systematic review and meta-analysis. Br. J. Sports Med. 2014, 48, 1227–1234.[CrossRef] [PubMed]
19. Bailey, R.C.; Olson, J.O.D.I.; Pepper, S.L.; Porszasz, J.A.N.O.S.; Barstow, T.J.; Cooper, D.M. The level andtempo of children’s physical activities: An observational study. Med. Sci. Sports Exerc. 1995, 27, 1033–1041.[CrossRef] [PubMed]
20. Howe, C.A.; Freedson, P.S.; Feldman, H.A.; Osganian, S.K. Energy expenditure and enjoyment of commonchildren’s games in a simulated free-play environment. J. Pediatr. 2010, 15, 936–942. [CrossRef]
21. Chia, M. Power recovery in the Wingate Anaerobic Test in girls and women following prior sprints of a shortduration. Biol. Sport 2001, 18, 45–53.
22. De Araujo, A.C.C.; Roschel, H.; Picanço, A.R.; do Prado, D.M.L.; Villares, S.M.F.; de Sa Pinto, A.L.; Gualano, B.Similar health benefits of endurance and high-intensity interval training in obese children. PLoS ONE 2012,7, e42747. [CrossRef]
23. Cockcroft, E.J.; Bond, B.; Williams, C.A.; Harris, S.; Jackman, S.R.; Armstrong, N.; Barker, A.R. The effects oftwo weeks high-intensity interval training on fasting glucose, glucose tolerance and insulin resistance inadolescent boys: A pilot study. BMC Sports Sci. Med. Rehabil. 2019, 11, 29. [CrossRef]
24. Eddolls, W.T.; McNarry, M.A.; Stratton, G.; Winn, C.O.; Mackintosh, K.A. High-intensity interval traininginterventions in children and adolescents: A systematic review. Sports Med. 2017, 47, 2363–2374. [CrossRef]
25. Thivel, D.; Masurier, J.; Baquet, G.; Timmons, B.W.; Pereira, B.; Berthoin, S.; Duclos, M.; Aucouturier, J.High-intensity interval training in overweight and obese children and adolescents: Systematic review andmeta-analysis. J. Sports Med. Phys. Fit. 2019, 59, 310–324. [CrossRef] [PubMed]
26. Gillen, J.B.; Percival, M.E.; Skelly, L.E.; Martin, B.J.; Tan, R.B.; Tarnopolsky, M.A.; Gibala, M. Three minutesof all-out intermittent exercise per week increases skeletal muscle oxidative capacity and improvescardiometabolic health. PLoS ONE 2014, 9, e111489. [CrossRef] [PubMed]
27. Cooper, S.B.; Bandelow, S.; Nute, M.L.; Dring, K.J.; Stannard, R.L.; Morris, J.G.; Nevill, M.E. Sprint-basedexercise and cognitive function in adolescents. Prev. Med. Rep. 2016, 4, 155–161. [CrossRef] [PubMed]
28. Costigan, S.A.; Eather, N.; Plotnikoff, R.C.; Hillman, C.H.; Lubans, D.R. High-intensity interval training oncognitive and mental health in adolescents. Med. Sci. Sports Exerc. 2016, 48, 1985–1993. [CrossRef]
132

J. Funct. Morphol. Kinesiol. 2020, 5, 92
29. Ma, J.K.; Le Mare, L.; Gurd, B.J. Four minutes of in-class high-intensity interval activity improves selectiveattention in 9-to 11-year olds. Appl. Physiol. Nutr. Metab. 2014, 40, 238–244. [CrossRef]
30. Chia, M.; Armstrong, N.; Childs, D. The assessment of children’s anaerobic performance using modificationsof the Wingate anaerobic test. Pediatr. Exerc. Sci. 1997, 9, 80–89. [CrossRef]
31. Costigan, S.A.; Ridgers, N.D.; Eather, N.; Plotnikoff, R.C.; Harris, N.; Lubans, D.R. Exploring the impactof high intensity interval training on adolescents’ objectively measured physical activity: Findings from arandomized controlled trial. J. Sports Sci. 2018, 36, 1087–1094. [CrossRef]
32. Chia, M. Pedometer-assessed physical activity of Singaporean youths. Prev. Med. 2010, 50, 262–264.[CrossRef]
33. Duncan, J.S.; Schofield, G.; Duncan, E.K. Pedometer-determined physical activity and body composition inNew Zealand children. Med. Sci. Sports Exerc. 2006, 38, 1402–1409. [CrossRef]
34. Duncan, M.J.; Al-Nakeeb, Y.; Woodfield, L.; Lyons, M. Pedometer determined physical activity levels inprimary school children from Central England. Prev. Med. 2007, 44, 416–420. [CrossRef]
35. Ottawa Mood Scale. Available online: http://www.drcheng.ca/resources/Articles/mood_scales-facesforallages.pdf (accessed on 13 November 2020).
36. Rey, A. Clinical Tests in Psychology [In French]; Presses Universitaires de France: Paris, France, 1964.37. Wong, P.; Boh, G.B.T.; Wang, J.C.K.; Chia, M.Y.H. Relationship between obesity and verbal memory
performance among top academic achievers in Singapore. Asian J. Exerc. Sports Sci. 2007, 4, 47–55.38. Mezcua-Hidalgo, A.; Ruiz-Ariza, A.; Suárez-Manzano, S.; Martínez-López, E.J. 48-Hour Effects of Monitored
Cooperative High-Intensity Interval Training on Adolescent Cognitive Functioning. Percept. Mot. Ski. 2019,126, 202–222. [CrossRef] [PubMed]
39. Pesce, C. Shifting the focus from quantitative to qualitative exercise characteristics in exercise and cognitionresearch. J. Sport Exerc. Psychol. 2012, 34, 766–786. [CrossRef] [PubMed]
40. Vazou, S.; Pesce, C.; Lakes, K.; Smiley-Oyen, A. More than one road leads to Rome: A narrative review andmeta-analysis of physical activity intervention effects on cognition in youth. Int. J. Sport Exerc. Psychol. 2019,17, 153–178. [CrossRef] [PubMed]
41. Leahy, A.A.; Mavilidi, M.F.; Smith, J.J.; Hillman, C.H.; Eather, N.; Barker, D.; Lubans, D.R. Review ofHigh-Intensity Interval Training for Cognitive and Mental Health in Youth. Med. Sci. Sports Exerc. 2020,52, 2224–2234. [CrossRef] [PubMed]
42. Hessling, R.M.; Traxel, N.M.; Schmidt, T.J. Ceiling effect. In The SAGE Encyclopedia of Social Science ResearchMethods; Lewis-Beck, M.S., Bryman, A., Liao, T.F., Eds.; Sage Publications Inc.: Thousand Oaks, CA, USA, 2004.[CrossRef]
43. Leahy, A.; Hillman, C.; Shigeta, T.; Smith, J.; Eather, N.; Morgan, P.; Plotnikoff, R.; Nilsson, M.; Lonsdale, C.;Noetel, M. Teacher facilitated high-intensity interval training intervention for older adolescents: The ‘Burn 2Learn’ pilot randomised controlled trial. J. Sci. Med. Sport 2018, 21, S72. [CrossRef]
44. Zapata-Lamana, R.; Cuevas, I.C.; Fuentes, V.; Soto Espindola, C.; Romero, P.E.; Sepulveda, C.;Monsalves-Alvarez, M. HIITing Health in School: Can High Intensity Interval Training Be a Usefuland Reliable Tool for Health on a School-Based Environment? A Systematic Review. Int. J. Sch. Health 2019,6, 1–10. [CrossRef]
Publisher’s Note: MDPI stays neutral with regard to jurisdictional claims in published maps and institutionalaffiliations.
© 2020 by the authors. Licensee MDPI, Basel, Switzerland. This article is an open accessarticle distributed under the terms and conditions of the Creative Commons Attribution(CC BY) license (http://creativecommons.org/licenses/by/4.0/).
133

Journal of
Functional Morphology and Kinesiology
Article
The Prevalence of Urinary Incontinence among AdolescentFemale Athletes: A Systematic Review
Tamara Rial Rebullido 1 , Cinta Gómez-Tomás 2,*, Avery D. Faigenbaum 3 and Iván Chulvi-Medrano 4
���������������
Citation: Rebullido, T.R.;
Gómez-Tomás, C.; Faigenbaum, A.D.;
Chulvi-Medrano, I. The Prevalence of
Urinary Incontinence among
Adolescent Female Athletes: A
Systematic Review. J. Funct. Morphol.
Kinesiol. 2021, 6, 12. https://doi.org/
10.3390/jfmk6010012
Academic Editor: Cristina Cortis
Received: 5 January 2021
Accepted: 24 January 2021
Published: 28 January 2021
Publisher’s Note: MDPI stays neutral
with regard to jurisdictional claims in
published maps and institutional affil-
iations.
Copyright: © 2021 by the authors.
Licensee MDPI, Basel, Switzerland.
This article is an open access article
distributed under the terms and
conditions of the Creative Commons
Attribution (CC BY) license (https://
creativecommons.org/licenses/by/
4.0/).
1 Tamara Rial Exercise & Women’s Health, Newtown, PA 18940, USA; [email protected] Research Group Physiotherapy and Readaptation in Sport, Department of Physiotherapy, Catholic University
of Murcia (UCAM), 3010 Murcia, Spain3 Department of Health and Exercise Science, The College of New Jersey, Ewing, NJ 08628, USA;
[email protected] UIRFIDE (Sport Performance and Physical Fitness Research Group), Department of Physical and Sports
Education, Faculty of Physical Activity and Sports Sciences, University of Valencia, 46010 Valencia, Spain;[email protected]
* Correspondence: [email protected]
Abstract: This review aimed to synthesize the most up-to-date evidence regarding the prevalenceof urinary incontinence (UI) among adolescent female athletes. We conducted a systematic reviewof studies regarding UI in female athletes less than 19 years of age. This review was conducted inaccordance with the Preferred Reporting Items for Systematic Reviews and Meta-analyses (PRIMSA).The electronic databases of PubMed, Embase, Cochrane Central Register of Controlled Trials (CEN-TRAL), Scopus, and Web of Science (WOS) were searched between October and November 2020.After blinded peer evaluation, a total of 215 studies were identified and nine were included. Risk ofbias was assessed using the Strengthening the Reporting of Observational Studies in Epidemiology(STROBE) checklist. This review identified a prevalence of UI in adolescent female athletes between18% to 80% with an average of 48.58%. The most prevalent sports were trampolining followed byrope skipping. The prevalence of UI among adolescent female athletes practicing impact sports wassignificantly prevalent. There is a need for further research, education, and targeted interventions foradolescent female athletes with UI.
Keywords: pelvic floor dysfunction; women’s health; pelvic floor training; youth
1. Introduction
Urinary incontinence (UI) is defined as any complaint of involuntary loss of urine [1].Mostly prevalent in women, the broad range of UI is 5–27% [2], with an average prevalenceof 27.6% based on a review of population studies [3]. The most common type of UI isstress urinary incontinence (SUI) that is defined as any complaint of involuntary loss ofurine on effort or physical exertion [1]. Strenuous exercise has been cited as a risk factorfor developing symptoms of SUI [4]. Recently, a subcategory of athletic incontinencewas proposed as a new term for a specific SUI that occurs during sport activities orcompetition [5]. One of the most prevalent pelvic floor dysfunctions reported in femaleathletes is SUI [6–9]. For instance, a meta-analysis that included 7507 women with ageranges between 12 and 69 years, found that the prevalence of SUI was 33.69% for the femaleathletes compared to 24.40% in the control group [10].
The younger female athletes seem to display isolated symptoms of pure stress UIwhich is an uncomplicated SUI without other symptoms of urge incontinence or bladderdysfunction [11]. High-impact sports involving jumping, landing or running have shownthe highest prevalence rates of urinary loss among young female athletes [12–15]. A re-cent meta-analysis by Teixeira et al. found a 35% prevalence rate of UI in female athletes(average age of 23.8 years) practicing different sports. When compared with sedentary
J. Funct. Morphol. Kinesiol. 2021, 6, 12. https://doi.org/10.3390/jfmk6010012 https://www.mdpi.com/journal/jfmk
135
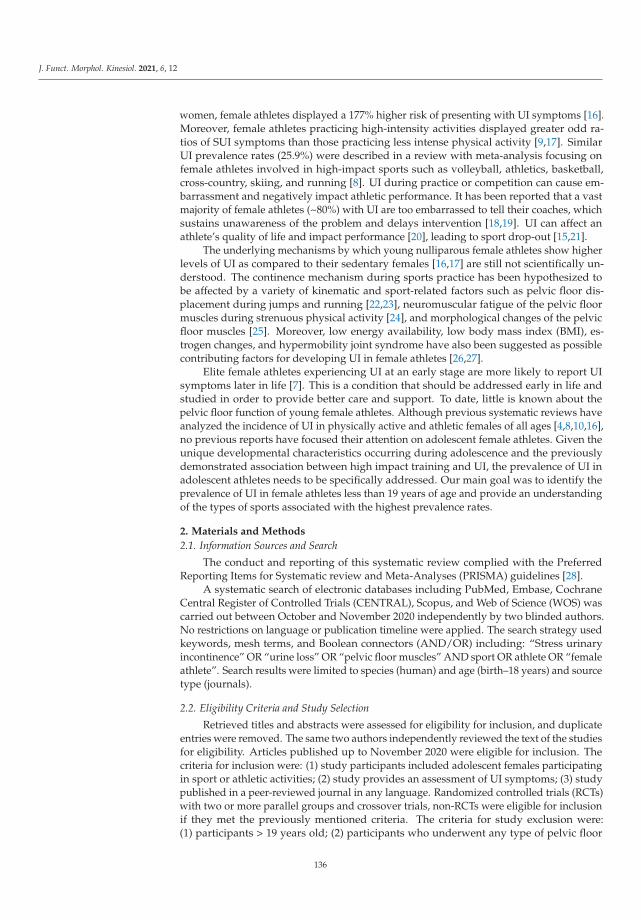
J. Funct. Morphol. Kinesiol. 2021, 6, 12
women, female athletes displayed a 177% higher risk of presenting with UI symptoms [16].Moreover, female athletes practicing high-intensity activities displayed greater odd ra-tios of SUI symptoms than those practicing less intense physical activity [9,17]. SimilarUI prevalence rates (25.9%) were described in a review with meta-analysis focusing onfemale athletes involved in high-impact sports such as volleyball, athletics, basketball,cross-country, skiing, and running [8]. UI during practice or competition can cause em-barrassment and negatively impact athletic performance. It has been reported that a vastmajority of female athletes (~80%) with UI are too embarrassed to tell their coaches, whichsustains unawareness of the problem and delays intervention [18,19]. UI can affect anathlete’s quality of life and impact performance [20], leading to sport drop-out [15,21].
The underlying mechanisms by which young nulliparous female athletes show higherlevels of UI as compared to their sedentary females [16,17] are still not scientifically un-derstood. The continence mechanism during sports practice has been hypothesized tobe affected by a variety of kinematic and sport-related factors such as pelvic floor dis-placement during jumps and running [22,23], neuromuscular fatigue of the pelvic floormuscles during strenuous physical activity [24], and morphological changes of the pelvicfloor muscles [25]. Moreover, low energy availability, low body mass index (BMI), es-trogen changes, and hypermobility joint syndrome have also been suggested as possiblecontributing factors for developing UI in female athletes [26,27].
Elite female athletes experiencing UI at an early stage are more likely to report UIsymptoms later in life [7]. This is a condition that should be addressed early in life andstudied in order to provide better care and support. To date, little is known about thepelvic floor function of young female athletes. Although previous systematic reviews haveanalyzed the incidence of UI in physically active and athletic females of all ages [4,8,10,16],no previous reports have focused their attention on adolescent female athletes. Given theunique developmental characteristics occurring during adolescence and the previouslydemonstrated association between high impact training and UI, the prevalence of UI inadolescent athletes needs to be specifically addressed. Our main goal was to identify theprevalence of UI in female athletes less than 19 years of age and provide an understandingof the types of sports associated with the highest prevalence rates.
2. Materials and Methods
2.1. Information Sources and Search
The conduct and reporting of this systematic review complied with the PreferredReporting Items for Systematic review and Meta-Analyses (PRISMA) guidelines [28].
A systematic search of electronic databases including PubMed, Embase, CochraneCentral Register of Controlled Trials (CENTRAL), Scopus, and Web of Science (WOS) wascarried out between October and November 2020 independently by two blinded authors.No restrictions on language or publication timeline were applied. The search strategy usedkeywords, mesh terms, and Boolean connectors (AND/OR) including: “Stress urinaryincontinence” OR “urine loss” OR “pelvic floor muscles” AND sport OR athlete OR “femaleathlete”. Search results were limited to species (human) and age (birth–18 years) and sourcetype (journals).
2.2. Eligibility Criteria and Study Selection
Retrieved titles and abstracts were assessed for eligibility for inclusion, and duplicateentries were removed. The same two authors independently reviewed the text of the studiesfor eligibility. Articles published up to November 2020 were eligible for inclusion. Thecriteria for inclusion were: (1) study participants included adolescent females participatingin sport or athletic activities; (2) study provides an assessment of UI symptoms; (3) studypublished in a peer-reviewed journal in any language. Randomized controlled trials (RCTs)with two or more parallel groups and crossover trials, non-RCTs were eligible for inclusionif they met the previously mentioned criteria. The criteria for study exclusion were:(1) participants > 19 years old; (2) participants who underwent any type of pelvic floor
136

J. Funct. Morphol. Kinesiol. 2021, 6, 12
surgery; (3) participants during their pregnancy and postpartum period and; (4) systematicreview, meta-analysis, or case study.
2.3. Data Collection Process and Quality Assessment
For each study, data were extracted on the characteristics of the population andintervention such as: (1) last name of the first author; (2) years of publication; (3) studydesign; (4) sample characteristics (age, sample analyzed, weight, body mass index, sportpractice, and hours of weekly training); and (5) instrument assessing symptoms of UI.Risk of bias was assessed independently by two authors using the Strengthening theReporting of Observational Studies in Epidemiology (STROBE) checklist [29]. The same tworesearchers rated the studies and discrepancies were resolved by consensus. Data reportingcompleteness was assessed by applying the STROBE cross-sectional checklist reportingclassified as “not reported or unclear”, “some information mentioned but insufficient”, or“clear and detailed information provided”.
3. Results
3.1. Study Selection
The search strategy yielded 500 potentially relevant studies. After the removal ofduplicates, 321 records were screened. Of those, 215 potential titles were selected afterthe database filter insertion. Among those, only nine studies met the criteria for inclusionand were selected for analysis in this systematic review. The study selection flow chart isshown in Figure 1.
Figure 1. Flow diagram for the study selection.
3.2. Overview of Study Characteristics
Table 1 provides an overview of the characteristics of the studies included in thisreview. Table 2 provides the participants’ characteristics of weight, body mass index (BMI),and hours of training per week.
137

J.Fu
nct.
Mor
phol
.Kin
esio
l.2021,6
,12
Ta
ble
1.
Sum
mar
yof
the
stud
ies
incl
uded
inth
isre
view
.
Au
tho
rs,
Year
Stu
dy
Sam
ple
Siz
e
Mean
Ag
e(R
an
ge
or
SD
)S
po
rtG
rad
eIm
pact
*B
ase
do
nC
rite
ria
[30]
Main
Ou
tco
me
(UI
To
ols
)%
UI
Seco
nd
ary
Ou
tco
mes
Seco
nd
ary
Ou
tco
mes
Resu
lts
Elia
sson
etal
.,20
02[3
1].
Cro
ss-
sect
iona
ln
=35
15(1
2–22
)Tr
ampo
line
3Pa
d-w
eigh
ting
test
80m
ean
leak
age
of28
gM
uscu
lar
stre
ngth
wit
hpe
rine
omet
er
23of
27di
odes
onth
epe
rine
omet
erfo
r6
san
d20
for
30s,
30cm
H2O
ofin
trav
agin
alsq
ueez
epr
essu
re
Car
lset
al.,
2007
[18]
Cro
ss-
sect
iona
ln
=86
17(1
4–21
)H
igh
impa
ctsp
orts
3
The
Bris
tol
Fem
ale
Low
erU
rina
ryTr
act
Sym
ptom
sQ
uest
ionn
aire
28Ed
ucat
iona
lpr
even
tion
and
trea
tmen
tofU
I
90%
had
neve
rhe
ard
ofpe
lvic
mus
cle
exer
cise
s(K
egel
s)
Parm
igia
noet
al.,
2014
[19]
Cro
ss-
sect
iona
ln
=14
815
(2.0
)
Socc
er,
hand
ball,
bask
etba
ll,w
rest
ling,
judo
,tra
ckan
dfie
ld,
swim
min
g,bo
2,3
Pre-
part
icip
atio
ngy
neco
logi
cal
exam
inat
ion
(PPG
E)
Tota
l=18
.2Tr
ack
and
Fiel
d=
14.3
0;Ba
sket
ball
=8.
30;
Boxi
ng=
25;
Socc
er=
11.6
0;H
andb
all=
6.40
;Ju
do=
33.3
0;Sw
imm
ing
=16
.70
Eati
ngat
titu
des
test
15%
risk
ofea
ting
diso
rder
s;89
.9%
wer
eno
tfam
iliar
wit
hth
eoc
curr
ence
ofU
Iin
athl
etes
;87
.1%
wou
ldno
tm
enti
onto
coac
h.
Fern
ande
set
al.,
2014
[32]
Cro
ss-
sect
iona
ln
=35
15.6
(12–
19)
Socc
er2
Uri
nary
Inco
ntin
ence
shor
tfor
m(I
CIQ
-UIS
F)62
.8Th
epa
dte
stan
dK
ing’
sH
ealt
hQ
uest
ionn
aire
(KH
Q)
35.2
scor
ein
the
Gen
eral
Hea
lth
dom
ain;
37.3
inth
eem
otio
nsdo
mai
n;26
.5in
the
Slee
p/En
ergy
dom
ain.
Da
Roz
aet
al.,
2015
[33]
Cro
ss-
sect
iona
ln
=22
18.1
(3.4
)Tr
ampo
line
3
Uri
nary
Inco
ntin
ence
shor
tfo
rm(I
CIQ
-UIS
F)
72.7
Am
ount
ofur
inar
ylo
ss,f
requ
ency
ofin
volu
ntar
ylo
ss
93.7
%se
lf-c
lass
ified
asm
oder
ate
amou
ntof
UI;
freq
uenc
yof
UIo
nce
aw
eek
orle
ss.
Alm
eida
etal
.,20
15[3
4]C
ross
-se
ctio
nal
n=
6718
(5)
Volle
ybal
l,ju
do,
gym
nast
ics,
tram
polin
e,sw
imm
ing
2,3
Uri
nary
Inco
ntin
ence
shor
tfo
rm(I
CIQ
-UIS
F)
Tota
l=52
.2Vo
lleyb
all=
43.5
;Tr
ampo
line
=88
.9;
Swim
min
g=
50;
Judo
=44
.4
Feca
lIn
cont
inen
ceSe
veri
tyIn
dex,
Fem
ale
Sexu
alFu
ncti
onIn
dex,
vagi
nal
sym
ptom
san
dpe
lvic
orga
npr
olap
sesy
mpt
oms
(IC
IQ-V
S)
Invo
lunt
ary
loss
ofga
s:64
.6%
athl
etes
,58.
5%no
nath
lete
s;PO
P:0%
athl
etes
,2%
nona
thle
tes;
dysp
areu
nia:
13.8
%at
hlet
es,2
1.9%
nona
thle
tes;
31.4
%at
hlet
e’s
stra
tegy
:“E
mpt
ying
the
blad
der
befo
retr
aini
ng”;
52.0
%no
nath
lete
’sst
rate
gy:“
Empt
ying
the
blad
der
befo
rele
avin
gth
eho
use”
.
138
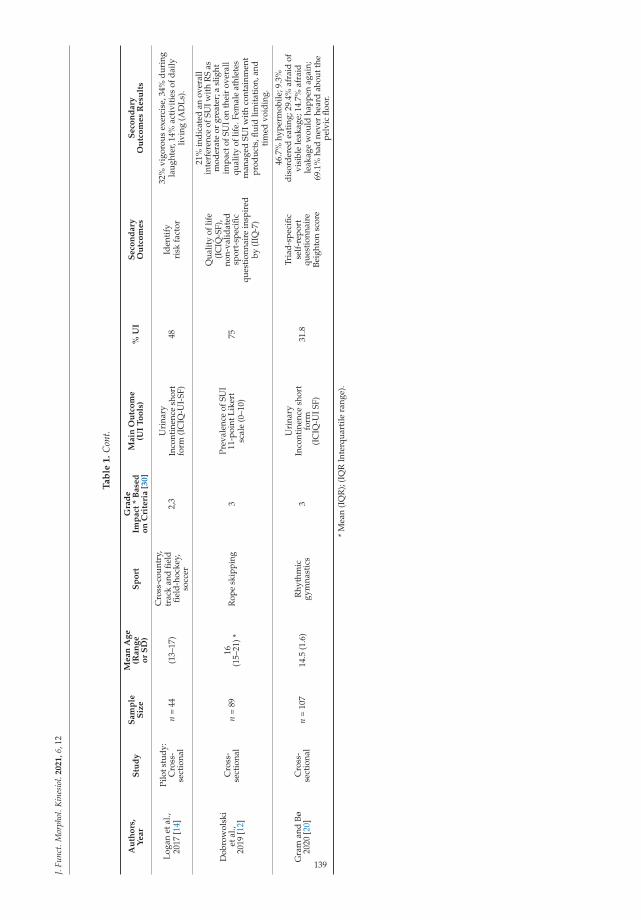
J.Fu
nct.
Mor
phol
.Kin
esio
l.2021,6
,12
Ta
ble
1.
Con
t.
Au
tho
rs,
Year
Stu
dy
Sam
ple
Siz
e
Mean
Ag
e(R
an
ge
or
SD
)S
po
rtG
rad
eIm
pact
*B
ase
do
nC
rite
ria
[30]
Main
Ou
tco
me
(UI
To
ols
)%
UI
Seco
nd
ary
Ou
tco
mes
Seco
nd
ary
Ou
tco
mes
Resu
lts
Loga
net
al.,
2017
[14]
Pilo
tstu
dy:
Cro
ss-
sect
iona
ln
=44
(13–
17)
Cro
ss-c
ount
ry,
trac
kan
dfie
ldfie
ld-h
ocke
y,so
ccer
2,3
Uri
nary
Inco
ntin
ence
shor
tfo
rm(I
CIQ
-UI-
SF)
48Id
enti
fyri
skfa
ctor
32%
vigo
rous
exer
cise
,34%
duri
ngla
ught
er,1
4%ac
tivi
ties
ofda
ilyliv
ing
(AD
Ls).
Dob
row
olsk
iet
al.,
2019
[12]
Cro
ss-
sect
iona
ln
=89
16(1
5–21
)*R
ope
skip
ping
3Pr
eval
ence
ofSU
I11
-poi
ntLi
kert
scal
e(0
–10)
75
Qua
lity
oflif
e(I
CIQ
-SF)
,no
n-va
lidat
edsp
ort-
spec
ific
ques
tion
nair
ein
spir
edby
(IIQ
-7)
21%
indi
cate
dan
over
all
inte
rfer
ence
ofSU
Iwit
hR
Sas
mod
erat
eor
grea
ter;
asl
ight
impa
ctof
SUIo
nth
eir
over
all
qual
ity
oflif
e.Fe
mal
eat
hlet
esm
anag
edSU
Iwit
hco
ntai
nmen
tpr
oduc
ts,fl
uid
limit
atio
n,an
dti
med
void
ing.
Gra
man
dBø
2020
[20]
Cro
ss-
sect
iona
ln
=10
714
.5(1
.6)
Rhy
thm
icgy
mna
stic
s3
Uri
nary
Inco
ntin
ence
shor
tfo
rm(I
CIQ
-UIS
F)
31.8
Tria
d-sp
ecifi
cse
lf-r
epor
tqu
esti
onna
ire
Beig
hton
scor
e
46.7
%hy
perm
obile
;9.3
%di
sord
ered
eati
ng;2
9.4%
afra
idof
visi
ble
leak
age;
14.7
%af
raid
leak
age
wou
ldha
ppen
agai
n;69
.1%
had
neve
rhe
ard
abou
tthe
pelv
icflo
or.
*M
ean
(IQ
R);
(IQ
RIn
terq
uart
ilera
nge)
.
139
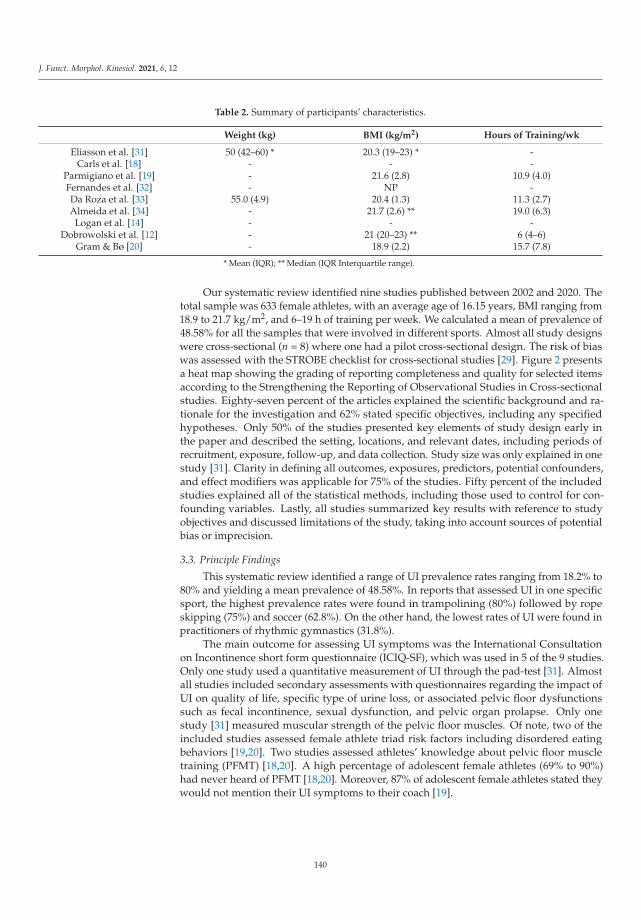
J. Funct. Morphol. Kinesiol. 2021, 6, 12
Table 2. Summary of participants’ characteristics.
Weight (kg) BMI (kg/m2) Hours of Training/wk
Eliasson et al. [31] 50 (42–60) * 20.3 (19–23) * -Carls et al. [18] - - -
Parmigiano et al. [19] - 21.6 (2.8) 10.9 (4.0)Fernandes et al. [32] - NP -Da Roza et al. [33] 55.0 (4.9) 20.4 (1.3) 11.3 (2.7)Almeida et al. [34] - 21.7 (2.6) ** 19.0 (6.3)
Logan et al. [14] - - -Dobrowolski et al. [12] - 21 (20–23) ** 6 (4–6)
Gram & Bø [20] - 18.9 (2.2) 15.7 (7.8)
* Mean (IQR); ** Median (IQR Interquartile range).
Our systematic review identified nine studies published between 2002 and 2020. Thetotal sample was 633 female athletes, with an average age of 16.15 years, BMI ranging from18.9 to 21.7 kg/m2, and 6–19 h of training per week. We calculated a mean of prevalence of48.58% for all the samples that were involved in different sports. Almost all study designswere cross-sectional (n = 8) where one had a pilot cross-sectional design. The risk of biaswas assessed with the STROBE checklist for cross-sectional studies [29]. Figure 2 presentsa heat map showing the grading of reporting completeness and quality for selected itemsaccording to the Strengthening the Reporting of Observational Studies in Cross-sectionalstudies. Eighty-seven percent of the articles explained the scientific background and ra-tionale for the investigation and 62% stated specific objectives, including any specifiedhypotheses. Only 50% of the studies presented key elements of study design early inthe paper and described the setting, locations, and relevant dates, including periods ofrecruitment, exposure, follow-up, and data collection. Study size was only explained in onestudy [31]. Clarity in defining all outcomes, exposures, predictors, potential confounders,and effect modifiers was applicable for 75% of the studies. Fifty percent of the includedstudies explained all of the statistical methods, including those used to control for con-founding variables. Lastly, all studies summarized key results with reference to studyobjectives and discussed limitations of the study, taking into account sources of potentialbias or imprecision.
3.3. Principle Findings
This systematic review identified a range of UI prevalence rates ranging from 18.2% to80% and yielding a mean prevalence of 48.58%. In reports that assessed UI in one specificsport, the highest prevalence rates were found in trampolining (80%) followed by ropeskipping (75%) and soccer (62.8%). On the other hand, the lowest rates of UI were found inpractitioners of rhythmic gymnastics (31.8%).
The main outcome for assessing UI symptoms was the International Consultationon Incontinence short form questionnaire (ICIQ-SF), which was used in 5 of the 9 studies.Only one study used a quantitative measurement of UI through the pad-test [31]. Almostall studies included secondary assessments with questionnaires regarding the impact ofUI on quality of life, specific type of urine loss, or associated pelvic floor dysfunctionssuch as fecal incontinence, sexual dysfunction, and pelvic organ prolapse. Only onestudy [31] measured muscular strength of the pelvic floor muscles. Of note, two of theincluded studies assessed female athlete triad risk factors including disordered eatingbehaviors [19,20]. Two studies assessed athletes’ knowledge about pelvic floor muscletraining (PFMT) [18,20]. A high percentage of adolescent female athletes (69% to 90%)had never heard of PFMT [18,20]. Moreover, 87% of adolescent female athletes stated theywould not mention their UI symptoms to their coach [19].
140
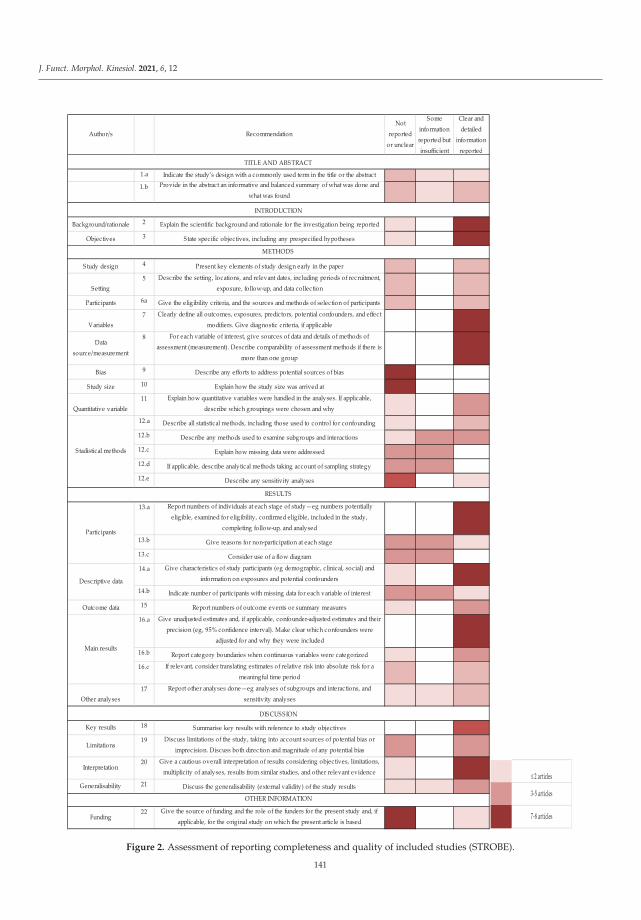
J. Funct. Morphol. Kinesiol. 2021, 6, 12
Author/s RecommendationNot
reported or unclear
Some information reported but insufficient
Clear and detailed
information reported
1.a Indicate the study’s design with a commonly used term in the title or the abstract
1.b Provide in the abstract an informative and balanced summary of what was done and what was found
Background/rationale 2 Explain the scientific background and rationale for the investigation being reported
Objectives 3 State specific objectives, including any prespecified hypotheses
Study design 4 Present key elements of study design early in the paper
Setting5 Describe the setting, locations, and relevant dates, including periods of recruitment,
exposure, follow-up, and data collection
Partic ipants 6a Give the eligibility criteria, and the sources and methods of selection of partic ipants
Variables7 Clearly define all outcomes, exposures, predictors, potential confounders, and effect
modifiers. Give diagnostic criteria, if applicable
Data source/measurement
8 For each variable of interest, give sources of data and details of methods of assessment (measurement). Describe comparability of assessment methods if there is
more than one group
Bias 9 Describe any efforts to address potential sources of bias
Study size 10 Explain how the study size was arrived at
Quantitative variable11 Explain how quantitative variables were handled in the analyses. If applicable,
describe which groupings were chosen and why
12.a Describe all statistical methods, including those used to control for confounding
12.b Describe any methods used to examine subgroups and interactions
12.c Explain how missing data were addressed
12.d If applicable, describe analytical methods taking account of sampling strategy
12.e Describe any sensitivity analyses
13.a Report numbers of individuals at each stage of study—eg numbers potentially eligible, examined for eligibility, confirmed eligible, inc luded in the study,
completing follow-up, and analysed
13.b Give reasons for non-partic ipation at each stage
13.c Consider use of a flow diagram
14.a Give characteristics of study participants (eg demographic, c linical, social) and information on exposures and potential confounders
14.b Indicate number of partic ipants with missing data for each variable of interest
Outcome data 15 Report numbers of outcome events or summary measures
16.a Give unadjusted estimates and, if applicable, confounder-adjusted estimates and their precision (eg, 95% confidence interval). Make clear which confounders were
adjusted for and why they were included
16.b Report category boundaries when continuous variables were categorized
16.c If relevant, consider translating estimates of relative risk into absolute risk for a meaningful time period
Other analyses17 Report other analyses done—eg analyses of subgroups and interactions, and
sensitivity analyses
Key results 18 Summarise key results with reference to study objectives
Limitations19 Discuss limitations of the study, taking into account sources of potential bias or
imprecision. Discuss both direction and magnitude of any potential bias
Interpretation20 Give a cautious overall interpretation of results considering objectives, limitations,
multiplic ity of analyses, results from similar studies, and other relevant evidence
Generalisability 21 Discuss the generalisability (external validity) of the study results
Funding22 Give the source of funding and the role of the funders for the present study and, if
applicable, for the original study on which the present article is based
TITLE AND ABSTRACT
DISCUSSION
OTHER INFORMATION
Stadistical methods
Partic ipants
Descriptive data
Main results
INTRODUCTION
METHODS
RESULTS
2 articles
3-5 articles
7-8 articles
Figure 2. Assessment of reporting completeness and quality of included studies (STROBE).
141
J. Funct. Morphol. Kinesiol. 2021, 6, 12
4. Discussion
The aim of the present review was to systematically review the prevalence of UIamong adolescent female athletes. Notably, we found a wide range of UI prevalence ratesamong young female athletes varying from 18% to 80%, with an average prevalence of UIsymptoms in female adolescent athletes about 50%. Our results are slightly higher thanthe meta-analytic data presented by Teixeira et al. [16] for female athletes with an averageage of 23.8 years, with a weighted average of 36% of UI prevalence. Additionally, ourfindings are significantly higher than the study by Hagovska et al. [34] who reported a UIprevalence of 14.3% in 503 adult female athletes (21.1 ± 3.6 years of age) who participatedin high-impact sports. Notably, in the aforementioned study, the authors determined theimpact of each sport activity based on metabolic intensity rather than on ground impactforces [17,35]. Along these lines, our data are in the range reported by Bø who reported aUI prevalence range between 10% and 55% in female athletes between 15 and 64 years ofage [15]. Another review involving female athletes between 12 and 45 years [10], notedaverage prevalence rates varied from 1% to 42.2%
Our review included a total sample of 633 young nulliparous female athletes practic-ing a wide range of sports. Several studies included samples of athletes practicing differentsports. We applied a classification of sport impact based on the study by Groothaussen andSiener [30] that has been specifically applied to the analysis of the impact of sports on thepelvic floor [7,10]. This impact classification is divided in 4 distinct groups: impact grade 3(>4 times body weight, e.g., jumping); impact grade 2 (2–4 times body weight, e.g., sportsinvolving sprinting activities and rotational movements), impact grade 1 (1–2 times bodyweight, e.g., such as lifting light weights); and impact grade 0 (<1 time body weight, e.g.,swimming). The highest rates of UI in our sample were of grade 3 sports, which includedjumping and landing actions (i.e., trampolining and rope skipping). Team sports graded2 such as soccer, basketball, and track and field were found to display high prevalencerates as well. Impact activities such as running, jumping, and landing have been asso-ciated with increased intra-abdominal pressure in the pelvic organs and tissues [22,23].The additional ground reaction forces placed on the continence structures may lead todisplacement or insufficient counteractive muscle activity of the pelvic floor [22]. Anotherpossible mechanism that may explain these prevalence rates is the relatively high metabolicintensity of selected sporting activities that contributes to the possible neuromuscularfatigue displayed by the pelvic floor muscles during training or competition [24]. Overall,the main characteristic of all sports performed in our sample was an impact grade between2 and 3 [30].
The benefits of sports practice early in life are well established; however, young femaleathletes are not immune to suffering sport-related injuries or illness [36]. Particularly, theyoung female athlete can suffer from pelvic floor dysfunctions such as UI as well as pelvicpain and anal incontinence [6,34]. Almeida et al. [34] reported fecal incontinence, dyspare-unia, and difficulty emptying the bladder in the female athletic group [34]. Low energyavailability in female athletes has been noted as another health impairment that can impairpelvic floor function due to a constellation of hormonal, metabolic, and neuromuscularimbalances [26]. In this sense, Whitney et al. [37] found that female adolescent athletes(aged 15 to 19 years) with low energy availability had a higher prevalence of UI whencompared with those with adequate levels of energy. Two studies included in our reviewassessed for the presence of eating disorders [19,20]. Parmigiano reported that 15% of theirsample was at risk for suffering an eating disorder and Gram and Bø noted that 9.3% ofadolescent rhythmic gymnasts were at risk for disordered eating [20]. In our review, theaverage volume of training and BMI of the sample ranged from 18.9 to 21.7 kg/m2 and 6to 19 h of training per week. Collectively, these observations suggest that the high volumeand intensity of training along with low energy availability could be potential risk factorsfor developing UI in adolescent female athletes.
142
J. Funct. Morphol. Kinesiol. 2021, 6, 12
Bø and Sundgot-Borgen described that the presence of UI early in life is a strongpredictor for UI later in life (ORR of 8.57) [7]. Moreover, leakage during sport practicehas been shown to be a barrier to sports participation for young females [15,21]. Dueto the observable health and fitness benefits of sports participation for girls and youngwomen [36,38], additional studies are needed to improve our knowledge regarding pelvicfloor dysfunction and implement effective preventative measures in active females. Thereis a lack of data targeting adolescent females investigating preventative, educational, andtreatment modalities for UI. Given the high prevalence of UI in young female athletes andthe lack of awareness of evidence-based preventative neuromuscular strategies such asPFMT and pelvic floor therapy [18,20,27], more studies are warranted. Pelvic physiother-apy has been found to be more effective in achieving continence in elite female athletesand pregnant athletes engaged in aerobic exercise compared to non-athletes [27]. Forall these reasons, we suggest early screening with specific evaluation tools such as thepre-participation gynecological evaluation of female athletes proposed by Parmiagianoet al. [19] as well as the incorporation of specific neuromuscular training programs for thepelvic floor [13]. Increased awareness and educational programs targeting coaches and allfemale athletes regarding the pelvic floor musculature and specific dysfunctions such as UIare also warranted.
Limitations of this review are the small sample size, heterogeneity, and variability ofoutcome measures as well as the lack of reliable quantitative outcome measures for UI.The selected studies used validated questionnaires to assess urinary symptoms in youngathletes. However, these questionnaires were validated in adult populations. More reliablediagnostic outcomes would improve the quality of the studies. In addition, the analysis ofco-founding factors specific to the female adolescent athlete such as menstrual cycle andnutritional status would improve the quality of the studies. We recommend the use of theSTROBE checklist for risk of bias study assessment to improve the scientific report of thesestudies and a classification of sport characteristics and impact, which would additionallyimprove their comparison and assessment. The development and validation of a specificquestionnaire for assessing UI symptoms in adolescent females is warranted.
5. Conclusions
UI during exercise and sports is a concern for young female athletes. Our findingshighlight a 48.8% prevalence rate among adolescent female athletes where practitionersof high-impact sports show the highest prevalence rates. Given the high prevalence ofUI among adolescent female athletes involving impact sports graded 2 and 3, concertedefforts are needed to provide early education and implement prevention measures beforeyoung female athletes experience the burden of UI. Future research is needed to guideour understanding of the underlying physiopathology and unique characteristics of theadolescent female athlete’s pelvic floor muscle activity during impact sports.
Author Contributions: Conceptualization, T.R.R. and I.C.-M.; methodology, C.G.-T.; software,C.G.-T.; validation, C.G.-T., I.C.-M. formal analysis, I.C.-M. and C.G.-T.; data curation, C.G.-T.;writing—original draft preparation, T.R.R.; writing—review and editing, T.R.R. and A.D.F.; supervi-sion A.D.F. All authors have read and agreed to the published version of the manuscript.
Funding: This research received no external funding.
Institutional Review Board Statement: Not applicable.
Informed Consent Statement: Not applicable.
Data Availability Statement: Not applicable.
Conflicts of Interest: The authors declare no conflict of interest.
143
J. Funct. Morphol. Kinesiol. 2021, 6, 12
References
1. Haylen, B.T.; De Ridder, D.; Freeman, R.M.; Swift, S.E.; Berghmans, B.; Lee, J.; Monga, A.; Petri, E.; Rizk, D.E.; Sand, P.K.; et al. AnInternational Urogynecological Association (IUGA)/International Continence Society (ICS) joint report on the terminology forfemale pelvic floor dysfunction. Int. Urogynecol. J. 2010, 21, 5–26. [CrossRef] [PubMed]
2. Aoki, Y.; Brown, H.W.; Brubaker, L.; Cornu, J.N.; Daly, J.O.; Cartwright, R. Urinary incontinence in women. Nat. Rev. Dis. Prim.2017, 3. [CrossRef] [PubMed]
3. Minassian, V.A.; Drutz, H.P.; Al-Badr, A. Urinary incontinence as a worldwide problem. Int. J. Gynecol. Obstet. 2003, 82, 327–338.[CrossRef]
4. Almousa, S.; Bandin Van Loon, A. The prevalence of urinary incontinence in nulliparous female sportswomen: A systematicreview. J. Sports Sci. 2019, 37, 1663–1672. [CrossRef] [PubMed]
5. De Araujo, M.P.; Sartori, M.G.F.; Girão, M.J.B.C. Incontinência de atletas: Proposta de novo termo para uma nova mulher. Rev.Bras. Ginecol. e Obstet. 2017, 39, 441–442.
6. Bø, K.; Borgen, J.S. Prevalence of stress and urge urinary incontinence in elite athletes and controls. Med. Sci. Sports Exerc. 2001,33, 1797–1802. [CrossRef]
7. Bø, K.; Sundgot-Borgen, J. Are former female elite athletes more likely to experience urinary incontinence later in life thannon-athletes? Scand. J. Med. Sci. Sports 2010, 20, 100–104. [CrossRef]
8. Pires, T.; Pires, P.; Moreira, H.; Viana, R. Prevalence of Urinary Incontinence in High-Impact Sport Athletes: A Systematic Reviewand Meta-Analysis. J. Hum. Kinet. 2020, 73, 279–288. [CrossRef]
9. Almousa, S.; Bandin van Loon, A. The prevalence of urinary incontinence in nulliparous adolescent and middle-aged womenand the associated risk factors: A systematic review. Maturitas 2018, 107, 78–83. [CrossRef]
10. de Mattos Lourenco, T.R.; Matsuoka, P.K.; Baracat, E.C.; Haddad, J.M. Urinary incontinence in female athletes: A systematicreview. Int. Urogynecol. J. 2018, 29, 1757–1763. [CrossRef]
11. Rubilotta, E.; Balzarro, M.; D’Amico, A.; Cerruto, M.A.; Bassi, S.; Bovo, C.; Iacovelli, V.; Bianchi, D.; Artibani, W.; Agrò, E.F. Purestress urinary incontinence: Analysis of prevalence, estimation of costs, and financial impact. BMC Urol. 2019, 19, 44. [CrossRef][PubMed]
12. Dobrowolski, S.L.; Pudwell, J.; Harvey, M.A. Urinary incontinence among competitive rope-skipping athletes: A cross-sectionalstudy. Int. Urogynecol. J. 2020, 31, 881–886. [CrossRef] [PubMed]
13. Rial, T.; Chulvi-Medrano, I.; Faigenbaum, A.D.; Stracciolini, A. Pelvic Floor Dysfunction in Women. Strength Cond. J. 2020, 42,82–91. [CrossRef]
14. Logan, B.L.; Foster-Johnson, L.; Zotos, E. Urinary incontinence among adolescent female athletes. J. Pediatr. Urol. 2018, 14,241.e1–241.e9. [CrossRef]
15. Bø, K. Urinary incontinence, pelvic floor dysfunction, exercise and sport. Sports Med. 2004, 34, 451–464. [CrossRef]16. Teixeira, R.V.; Colla, C.; Sbruzzi, G.; Mallmann, A.; Paiva, L.L. Prevalence of urinary incontinence in female athletes: A systematic
review with meta-analysis. Int. Urogynecol. J. 2018, 29, 1717–1725. [CrossRef]17. Hagovska, M.; Svihra, J.; Bukova, A.; Horbacz, A.; Svihrova, V. The impact of physical activity measured by the International
Physical Activity questionnaire on the prevalence of stress urinary incontinence in young women. Eur. J. Obstet. Gynecol. Reprod.Biol. 2018, 228, 308–312. [CrossRef]
18. Carls, C. The prevalence of stress urinary incontinence in high school and college-age female athletes in the midwest: Implicationsfor education and prevention. Urol. Nurs. 2007, 27, 21–24.
19. Parmigiano, T.R.; Zucchi, E.V.M.; de Araujo, M.P.; Guindalini, C.S.C.; de Aquino Castro, R.; Di Bella, Z.I.K.D.J.; Girão, M.J.B.C.;Cohen, M.; Sartori, M.G.F. Pre-participation gynecological evaluation of female athletes: A new proposal. Einstein 2014, 12,459–466. [CrossRef]
20. Gram, M.C.D.; Bø, K. High level rhythmic gymnasts and urinary incontinence: Prevalence, risk factors, and influence onperformance. Scand. J. Med. Sci. Sports 2020, 30, 159–165. [CrossRef]
21. Casey, E.K.; Temme, K. Pelvic floor muscle function and urinary incontinence in the female athlete. Phys. Sportsmed. 2017, 45,399–407. [CrossRef] [PubMed]
22. Moser, H.; Leitner, M.; Eichelberger, P.; Kuhn, A.; Baeyens, J.P.; Radlinger, L. Pelvic floor muscle displacement during jumps incontinent and incontinent women: An exploratory study. Neurourol. Urodyn. 2019, 38, 2374–2382. [CrossRef] [PubMed]
23. Leitner, M.; Moser, H.; Eichelberger, P.; Kuhn, A.; Baeyens, J.P.; Radlinger, L. Evaluation of pelvic floor kinematics in continentand incontinent women during running: An exploratory study. Neurourol. Urodyn. 2018, 37, 609–618. [CrossRef] [PubMed]
24. Ree, M.L.; Nygaard, I.; Bø, K. Muscular fatigue in the pelvic floor muscles after strenuous physical activity. Acta Obstet. Gynecol.Scand. 2007, 86, 870–876. [CrossRef]
25. Kruger, J.A.; Dietz, H.P.; Murphy, B.A. Pelvic floor function in elite nulliparous athletes. Ultrasound Obstet. Gynecol. 2007, 30,81–85. [CrossRef]
26. Rial, T.; Stracciolini, A. Pelvic floor dysfunction in female athletes: Is relative energy deficiency in sport a risk factor? Curr. SportsMed. Rep. 2019, 18, 255–257.
27. Sorrigueta-Hernández, A.; Padilla-Fernandez, B.-Y.; Marquez-Sanchez, M.-T.; Flores-Fraile, M.-C.; Flores-Fraile, J.; Moreno-Pascual, C.; Lorenzo-Gomez, A.; Garcia-Cenador, M.-B.; Lorenzo-Gomez, M.-F. Benefits of Physiotherapy on Urinary Incontinencein High-Performance Female Athletes. Meta-Analysis. J. Clin. Med. 2020, 9, 3240. [CrossRef]
144

J. Funct. Morphol. Kinesiol. 2021, 6, 12
28. Moher, D.; Liberati, A.; Tetzlaff, J.; Altman, D.G. Preferred Reporting Items for Systematic Reviews and Meta-Analyses: ThePRISMA Statement. PLoS Med. 2009, 6, e1000097. [CrossRef]
29. von Elm, E.; Altman, D.G.; Egger, M.; Pocock, S.J.; Gøtzsche, P.C.; Vandenbroucke, J.P. The Strengthening the Reporting ofObservational Studies in Epidemiology (STROBE) statement: Guidelines for reporting observational studies. Lancet 2007, 370,1453–1457. [CrossRef]
30. Groothausen, J.; Siemer, H.; Kemper, H.C.G.; Twisk, J.; Welten, D.C. Influence of peak strain on Lumbar Bone Mineral Density:An analysis of 15-year physical activity in young males and females. Pediatr. Exerc. Sci. 1997, 9, 159–173. [CrossRef]
31. Eliasson, K.; Larsson, T.; Mattsson, E. Prevalence of stress incontinence in nulliparous elite trampolinists. Scand. J. Med. Sci. Sports2002, 12, 106–110. [CrossRef] [PubMed]
32. Fernandes, A.; Fitz, F.; Silva, A.; Filoni, E.; Filho, J.M. Evaluation of the Prevalence of Urinary Incontinence Symptoms inAdolescent Female Soccer Players and their Impact on Quality of Life. Occup. Environ. Med. 2014, 71, A59–A60. [CrossRef]
33. Da Roza, T.; Brandão, S.; Mascarenhas, T.; Jorge, R.N.; Duarte, J.A. Urinary Incontinence and Levels of Regular Physical Exercisein Young Women. Int. J. Sports Med. 2015, 36, 776–780. [CrossRef] [PubMed]
34. Almeida, M.B.A.; Barra, A.A.; Saltiel, F.; Silva-Filho, A.L.; Fonseca, A.M.R.M.; Figueiredo, E.M. Urinary incontinence and otherpelvic floor dysfunctions in female athletes in Brazil: A cross-sectional study. Scand. J. Med. Sci. Sports 2016, 26, 1109–1116.[CrossRef]
35. Hagovska, M.; Švihra, J.; Buková, A.; Hrobacz, A.; Dracková, D.; Švihrová, V.; Kraus, L. Prevalence of urinary incontinence infemales performing high-impact exercises. Int. J. Sports Med. 2017, 38, 210–216. [CrossRef]
36. Carder, S.L.; Giusti, N.E.; Vopat, L.M.; Tarakemeh, A.; Baker, J.; Vopat, B.G.; Mulcahey, M.K. The Concept of Sport SamplingVersus Sport Specialization: Preventing Youth Athlete Injury: A Systematic Review and Meta-analysis. Am. J. Sports Med. 2020,48, 2850–2857. [CrossRef]
37. Whitney, K.E.; Holtzman, B.; Parziale, A.; Ackerman, K.E. Urinary incontinence is more common in adolescent female athleteswith low energy availability. Orthop. J. Sports Med. 2019, 7, 2325967119S0011. [CrossRef]
38. Eime, R.M.; Young, J.A.; Harvey, J.T.; Charity, M.J.; Payne, W.R. A systematic review of the psychological and social benefits ofparticipation in sport for children and adolescents: Informing development of a conceptual model of health through sport. Int. J.Behav. Nutr. Phys. Act. 2013, 10, 98. [CrossRef]
145

MDPISt. Alban-Anlage 66
4052 BaselSwitzerland
Tel. +41 61 683 77 34Fax +41 61 302 89 18
www.mdpi.com
Journal of Functional Morphology and Kinesiology Editorial OfficeE-mail: [email protected]
www.mdpi.com/journal/jfmk


MDPI
St. Alban-Anlage 66
4052 Basel
Switzerland
Tel: +41 61 683 77 34
Fax: +41 61 302 89 18
www.mdpi.com ISBN 978-3-0365-1196-2
Copyright © 2022 FDOKUMEN