Health of UK servicemen who served in Persian Gulf War
10
were found in all cohorts, however, they may not be unique and causally implicated in Gulf-War-related illness. A specific mechanism may link vaccination against biological warfare agents and later ill health, but the risks of illness must be considered against the necessity of protection of servicemen. Lancet 1999; 353: 169–78 Introduction From late 1990, the UK deployed 53 462 military personnel to the Persian Gulf War. In the months after the end of the war, anecdotal reports emerged in the USA of various disorders affecting Gulf War veterans. In the UK, similar observations surfaced in 1993, after a television broadcast in June. Some UK Gulf War veterans have experienced health problems since their return. Such anecdotal reports cannot, however, establish whether these complaints have any particular pattern, nor whether they are related to Gulf War service. Previous studies of the health of Gulf War veterans have had limitations. Comparisons with non-military populations may be misleading, since military recruitment involves medical screening. Clinical assessment programmes for non-randomly selected veterans with symptoms cannot provide epidemiological information or answer questions about links to active service. 1 Some of these limitations have been addressed. A large-scale study of US veterans found no substantial differences in admissions between Gulf War veterans and military controls. 2 However, only admissions to military hospitals were included, without contact with outpatients, primary- care physicians, or civilian hospitals, which may have led to bias towards sicker veterans. 3 One cohort study used complete outcome data from an unselected military population, but looked only at mortality. 4 The Centers for Disease Control and Prevention (CDC) study 5 was restricted to serving air-force personnel. Sicker veterans are more likely to have left the services because of ill health. To date, only one study has used a random sample of veterans and tried to follow up still serving and discharged personnel. 6 We investigated, among UK male Gulf War veterans from army, navy, and air force, whether there was a relation between ill health and the Gulf War. Methods We carried out a cross-sectional epidemiological survey to compare the health profiles of three randomly selected UK military cohorts. Participants The target population was male and female Gulf War veterans (n=53 462) who served in the Gulf region between Sept 1, 1990, and June 30, 1991. We excluded special forces for security Summary Background Various symptoms in military personnel in the Persian Gulf War 1990–91 have caused international speculation and concern. We investigated UK servicemen. Methods We did a cross-sectional postal survey on a random sample of Gulf War veterans (Gulf War cohort, n=4248) and, stratified for age and rank, servicemen deployed to the Bosnia conflict (Bosnia cohort, n=4250) and those serving during the Gulf War but not deployed there (Era cohort, n=4246). We asked about deployment, exposures, symptoms, and illnesses. We analysed men only. Our outcome measures were physical health, functional capacity (SF-36), the general health questionnaire, the Centers for Disease Control and Prevention (CDC) multisymptom criteria for Gulf War illness, and post- traumatic stress reactions. Findings There were 8195 (65·1%) valid responses. The Gulf War cohort reported symptoms and disorders significantly more frequently than those in the Bosnia and Era cohorts, which were similar. Perception of physical health and ability were significantly worse in the Gulf War cohort than in the other cohorts, even after adjustment for confounders. Gulf War veterans were more likely than the Bosnia cohort to have substantial fatigue (odds ratio 2·2 [95% CI 1·9–2·6]), symptoms of post-traumatic stress (2·6 [1·9–3·4]), and psychological distress (1·6 [1·4–1·8]), and were nearly twice as likely to reach the CDC case definition (2·5 [2·2–2·8]). In the Gulf War, Bosnia, and Era cohorts, respectively, 61·9%, 36·8%, and 36·4% met the CDC criteria, which fell to 25·3%, 11·8%, and 12·2% for severe symptoms. Potentially harmful exposures were reported most frequently by the Gulf War cohort. All exposures showed associations with all of the outcome measures in the three cohorts. Exposures specific to the Gulf were associated with all outcomes. Vaccination against biological warfare and multiple routine vaccinations were associated with the CDC multisymptom syndrome in the Gulf War cohort. Interpretation Service in the Gulf War was associated with various health problems over and above those associated with deployment to an unfamiliar hostile environment. Since associations of ill health with adverse events and exposures Health of UK servicemen who served in Persian Gulf War Catherine Unwin, Nick Blatchley, William Coker, Susan Ferry, Matthew Hotopf, Lisa Hull, Khalida Ismail, Ian Palmer, Anthony David, Simon Wessely ARTICLES THE LANCET • Vol 353 • January 16, 1999 169 Gulf War Illness Research Unit, Guy’s, King’s, and St Thomas’s Medical School, London SE5 8AF, UK (C Unwin MSc, S Ferry MSc, M Hotopf MRCPsych, L Hull BSc, K Ismail MRCPsych, Prof A David MD, Prof S Wessely FRCP) ; Office of National Statistics, London (N Blatchley BSc) ; Flight Medicine, United States Air Force Medical Operations Agency, Washington DC, USA (W Coker FRCP) ; and Royal Defence Medical College, UK (I Palmer MRCPsych) Correspondence to: Prof Simon Wessely (e-mail: [email protected]) Articles
-
Upload
independent -
Category
Documents
-
view
0 -
download
0
Transcript of Health of UK servicemen who served in Persian Gulf War

were found in all cohorts, however, they may not be uniqueand causally implicated in Gulf-War-related illness. Aspecific mechanism may link vaccination against biologicalwarfare agents and later ill health, but the risks of illnessmust be considered against the necessity of protection ofservicemen.
Lancet 1999; 353: 169–78
IntroductionFrom late 1990, the UK deployed 53 462 militarypersonnel to the Persian Gulf War. In the months after theend of the war, anecdotal reports emerged in the USA ofvarious disorders affecting Gulf War veterans. In the UK,similar observations surfaced in 1993, after a televisionbroadcast in June. Some UK Gulf War veterans haveexperienced health problems since their return. Suchanecdotal reports cannot, however, establish whether thesecomplaints have any particular pattern, nor whether theyare related to Gulf War service.
Previous studies of the health of Gulf War veteranshave had limitations. Comparisons with non-militarypopulations may be misleading, since military recruitmentinvolves medical screening. Clinical assessmentprogrammes for non-randomly selected veterans withsymptoms cannot provide epidemiological information oranswer questions about links to active service.1 Some ofthese limitations have been addressed. A large-scale studyof US veterans found no substantial differences inadmissions between Gulf War veterans and militarycontrols.2 However, only admissions to military hospitalswere included, without contact with outpatients, primary-care physicians, or civilian hospitals, which may have ledto bias towards sicker veterans.3 One cohort study usedcomplete outcome data from an unselected militarypopulation, but looked only at mortality.4 The Centers forDisease Control and Prevention (CDC) study 5 wasrestricted to serving air-force personnel. Sicker veteransare more likely to have left the services because of illhealth. To date, only one study has used a random sampleof veterans and tried to follow up still serving anddischarged personnel.6
We investigated, among UK male Gulf War veteransfrom army, navy, and air force, whether there was arelation between ill health and the Gulf War.
MethodsWe carried out a cross-sectional epidemiological survey tocompare the health profiles of three randomly selected UKmilitary cohorts.
ParticipantsThe target population was male and female Gulf War veterans(n=53 462) who served in the Gulf region between Sept 1, 1990,and June 30, 1991. We excluded special forces for security
Summary
Background Various symptoms in military personnel in thePersian Gulf War 1990–91 have caused internationalspeculation and concern. We investigated UK servicemen.
Methods We did a cross-sectional postal survey on arandom sample of Gulf War veterans (Gulf War cohort,n=4248) and, stratified for age and rank, servicemendeployed to the Bosnia conflict (Bosnia cohort, n=4250)and those serving during the Gulf War but not deployedthere (Era cohort, n=4246). We asked about deployment,exposures, symptoms, and illnesses. We analysed men only.Our outcome measures were physical health, functionalcapacity (SF-36), the general health questionnaire, theCenters for Disease Control and Prevention (CDC)multisymptom criteria for Gulf War illness, and post-traumatic stress reactions.
Findings There were 8195 (65·1%) valid responses. The GulfWar cohort reported symptoms and disorders significantlymore frequently than those in the Bosnia and Era cohorts,which were similar. Perception of physical health and abilitywere significantly worse in the Gulf War cohort than in theother cohorts, even after adjustment for confounders. GulfWar veterans were more likely than the Bosnia cohort tohave substantial fatigue (odds ratio 2·2 [95% CI 1·9–2·6]),symptoms of post-traumatic stress (2·6 [1·9–3·4]), andpsychological distress (1·6 [1·4–1·8]), and were nearlytwice as likely to reach the CDC case definition (2·5[2·2–2·8]). In the Gulf War, Bosnia, and Era cohorts,respectively, 61·9%, 36·8%, and 36·4% met the CDCcriteria, which fell to 25·3%, 11·8%, and 12·2% for severesymptoms. Potentially harmful exposures were reportedmost frequently by the Gulf War cohort. All exposuresshowed associations with all of the outcome measures inthe three cohorts. Exposures specific to the Gulf wereassociated with all outcomes. Vaccination againstbiological warfare and multiple routine vaccinations wereassociated with the CDC multisymptom syndrome in theGulf War cohort.
Interpretation Service in the Gulf War was associated withvarious health problems over and above those associatedwith deployment to an unfamiliar hostile environment. Sinceassociations of ill health with adverse events and exposures
Health of UK servicemen who served in Persian Gulf War
Catherine Unwin, Nick Blatchley, William Coker, Susan Ferry, Matthew Hotopf, Lisa Hull, Khalida Ismail, Ian Palmer, Anthony David, Simon Wessely
ARTICLES
THE LANCET • Vol 353 • January 16, 1999 169
Gulf War Illness Research Unit, Guy’s, King’s, and St Thomas’sMedical School, London SE5 8AF, UK (C Unwin MSc, S Ferry MSc, M Hotopf MRCPsych, L Hull BSc, K Ismail MRCPsych, Prof A David MD, Prof S Wessely FRCP); Office of National Statistics, London(N Blatchley BSc); Flight Medicine, United States Air Force MedicalOperations Agency, Washington DC, USA (W Coker FRCP); andRoyal Defence Medical College, UK (I Palmer MRCPsych)
Correspondence to: Prof Simon Wessely (e-mail: [email protected])
Articles
ARTICLES
reasons. We recruited a random stratified sample of 4250personnel into the Gulf War cohort, which would give sufficientpower to detect an expected increased relative risk of chronicfatigue syndrome (CFS) of between 1·2 and 1·3. The keyvariables for stratification were service (Royal Navy, Army, RoyalAir Force), sex, age, service status (regular or reservist), rank(officer or other), and fitness (army and air force only). Bystratified selection we aimed to represent the population whoserved in the Gulf War. We deliberately over-sampled women.
As comparison cohorts, we randomly selected, from 39 217personnel who had served in Bosnia, 4250 servicemen deployedbetween April 1, 1992, and Feb 6, 1997 (Bosnia cohort), and,from the 250 000 personnel serving in the armed forces on Jan 1,1991, who were not deployed to the Gulf War, we selected 4246(Era cohort) according to the stratification variables used forthe Gulf War cohort. For the Era cohort, we used all thestratification variables; for the Bosnia cohort we used only age,sex, and rank because only the army served in Bosnia; reserviststatus and fitness data were not available. For any serviceman whodied during follow-up, we excluded their data and recruitedanother.
We restricted our analyses to men. Although 1235 womenserved in the UK armed forces during the Gulf War, their rolesand background health complaints were not the same as those formen and results will be reported elsewhere.
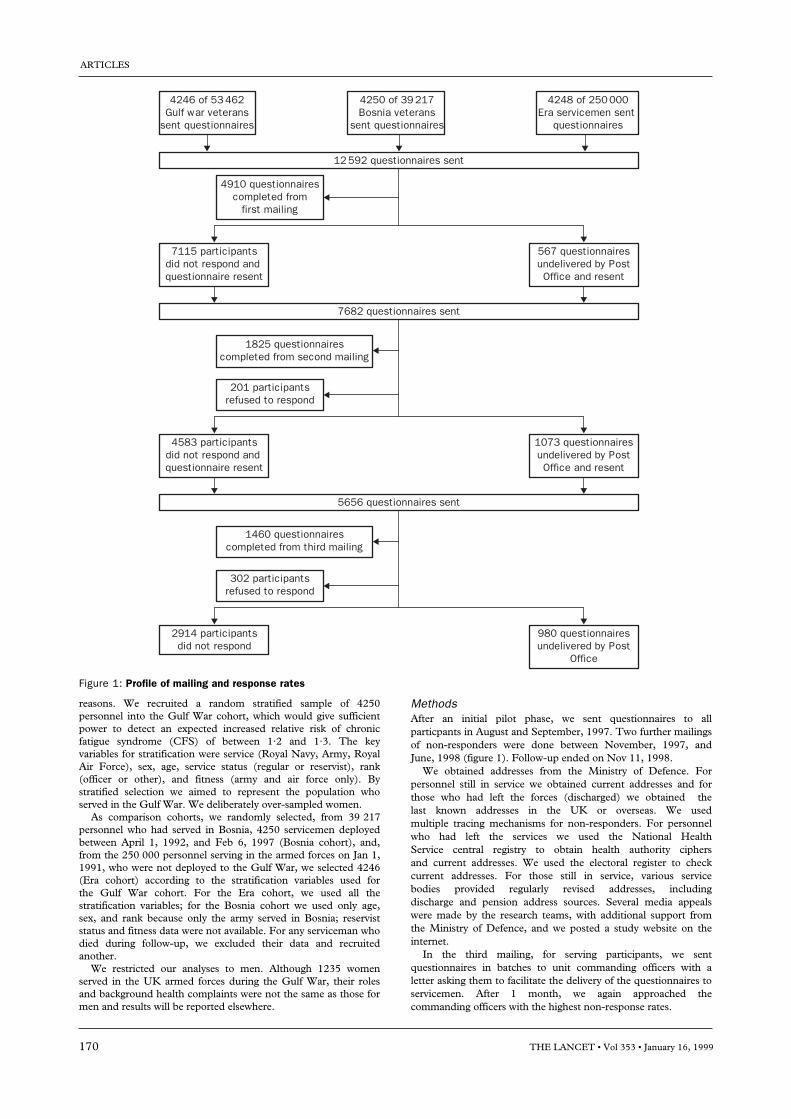
MethodsAfter an initial pilot phase, we sent questionnaires to allparticpants in August and September, 1997. Two further mailingsof non-responders were done between November, 1997, andJune, 1998 (figure 1). Follow-up ended on Nov 11, 1998.
We obtained addresses from the Ministry of Defence. Forpersonnel still in service we obtained current addresses and forthose who had left the forces (discharged) we obtained thelast known addresses in the UK or overseas. We usedmultiple tracing mechanisms for non-responders. For personnelwho had left the services we used the National HealthService central registry to obtain health authority ciphersand current addresses. We used the electoral register to checkcurrent addresses. For those still in service, various servicebodies provided regularly revised addresses, includingdischarge and pension address sources. Several media appealswere made by the research teams, with additional support fromthe Ministry of Defence, and we posted a study website on theinternet.
In the third mailing, for serving participants, we sentquestionnaires in batches to unit commanding officers with aletter asking them to facilitate the delivery of the questionnaires toservicemen. After 1 month, we again approached thecommanding officers with the highest non-response rates.
170 THE LANCET • Vol 353 • January 16, 1999
4246 of 53462Gulf war veterans
sent questionnaires
7115 participantsdid not respond and questionnaire resent
567 questionnairesundelivered by PostOffice and resent
4248 of 250000Era servicemen sent
questionnaires
4250 of 39217Bosnia veterans
sent questionnaires
4910 questionnairescompleted from
first mailing
12592 questionnaires sent
1825 questionnairescompleted from second mailing
201 participantsrefused to respond
7682 questionnaires sent
4583 participantsdid not respond and questionnaire resent
1073 questionnairesundelivered by PostOffice and resent
1460 questionnairescompleted from third mailing
302 participantsrefused to respond
5656 questionnaires sent
2914 participantsdid not respond
980 questionnairesundelivered by Post
Office
Figure 1: Profile of mailing and response rates

To assess potential response bias, we tried after two mailings totrace a randomly selected sample of 100 participants in the GulfWar cohort, 50 in the Bosnia cohort, and 50 in the Era cohortwho were non-responders and separated equally into still servingand discharged. We sent questionnaires by registered post,
contacted family physicians if we could trace them, as well as theDriving and Vehicle Licensing Agency, and did interviews bytelephone with a shortened version of the questionnaire.
The questionnaire was constructed from existing measures,questionnaires used in similar studies in the USA, and from ourinterviews with UK servicemen. We tested the questions onseveral military samples, including Gulf War veterans, and refinedthem to ensure that the questionnaire was understandable andacceptable to the intended recipients. We dropped items that wereirrelevant to UK experiences or because of length.
The questionnaire that we used in the study asked aboutdemographic details (age, sex, education, military history), alcoholintake and cigarette smoking, exposure history (29 items), medicalsymptoms (50 items), and medical disorders (39 items). Weincluded several symptoms of post-traumatic stress disorder takenfrom the Mississippi scale,7 physical health and functional capacityfrom SF-36,8 the 12-item general health questionnaire,9 ashortened measure of symptoms of possible chemical sensitivity,10
and a chronic fatigue scale.11
We asked participants in the Gulf War and Bosnia cohorts togive details of vaccinations received 2 months before and duringeach conflict. If copies of vaccination records were available, weasked participants to refer to them when completing thequestionnaire. We asked about vaccination side-effects andingestion of pyridostigmine bromide tablets.
In the absence of a valid or agreed definition of ill health arisingafter Gulf War service, we used the subjective health perceptionand the physical functioning subscales of the SF-36 as theprincipal outcome measures. These were supplemented by a-priori syndromes created from the items and scales used in thequestionnaire. We used the conventional cut-off for the fatiguequestionnaire (3/4) and general health questionnaire (2/3) todefine whether or not respondents were “cases”. We created a
ARTICLES
THE LANCET • Vol 353 • January 16, 1999 171
Characteristic Sample (%)
SexMen 3905 (92·0)Women 341 (8·0)
Age at 1 Jan, 1991 (years)<20 497 (11·7)20–24 1503 (35·4)25–29 1036 (24·4)30–34 623 (14·7)35–39 342 (8·1)>40 244 (5·7)
RankOfficer 537 (12·7)Other 3708 (87·3)
StatusRegular 3644 (96·3)Reservist 141 (3·7)
Fitness*Highest 3516 (92·9)Mid 33 (0·9)Lowest 5 (0·1)Unknown 231 (6·1)
ServiceArmy 2992 (70·5)Navy 460 (10·8)Royal Air Force 794 (18·7)
*Not available for navy.
Table 1: Sample characteristics for Gulf War cohort
Characteristic Region p Gulf vs Bosnia‡ p Gulf vs Era‡
Gulf (n=2735) Bosnia (n=2393) Era (n=2422) %
SexMale/female 2527 (92·4%)/208 (7·6%) 2184 (91·3%)/209 (8·7%) 2245 (92·7%)/177 (7·3%) 0·16 0·68
Current age>25 0 502 (21·0%) 266 (1·1%)25–29 692 (25·3%) 866 (36·2%) 518 (21·4%) <0·001 <0·00130–34 826 (30·2%) 517 (21·6%) 751 (31·0%)35–39 569 (20·8%) 299 (12·5%) 540 (22·3%)>40 648 (23·7%) 211 (8·8%) 586 (24·2%)
Marital statusMarried or living with partner 2070 (75·7%) 1453 (60·7%) 1846 (76·2%)Never married 432 (15·8%) 744 (31·1%) 339 (14·0%) <0·001 0·07Separated, divorced, widowed 232 (8·5%) 196 (8·2%) 240 (9·9%)
EducationLower than ‘O’ levels 517 (18·9%) 388 (16·2%) 448 (18·5%)‘O’ levels 1592 (58·2%) 1517 (63·4%) 1335 (55·1%) <0·001 0·01‘A’ levels and higher 626 (22·9%) 488 (20·4%) 639 (26·4%)
Currently in employment 2581 (94·4) 2333 (97·5%) 2269 (93·7%) <0·001 0·30
Alcohol intake (units per week)None 257 (9·4%) 158 (6·6%) 223 (9·2%)1–3 629 (26·5%) 479 (20·0%) 610 (25·2%)4–10 829 (30·3%) 689 (28·8%) 765 (31·6%) <0·001 0·4311–20 585 (21·4%) 589 (24·6%) 552 (22·8%)>21 336 (12·3%) 479 (20·0%) 274 (11·3%)
Smoking historyCurrently smoke 968 (35·4%) 912 (38·1%) 761 (31·4%)Ex-smoker 662 (24·2%) 498 (20·8%) 620 (25·6%) <0·001 <0·001Never smoked 1102 (40·3%) 984 (41·1%) 1041 (43·0%)
Still in service/discharged 1469 (53·7%)/ 266 (46·3%) 2120 (88·6%)/272 (11·4%) 1402 (57·9%)/1020 (42·1%) <0·001 <0·001
RankOfficer 366 (13·4%) 306 (12·8%) 310 (12·8%)Other 2368 (86·6%) 2087 (87·2%) 2076 (85·7%) 0·54 0·32
Serving status†Regular 2702 (98·8%) 2393 (100·0%) 2405 (99·3%) . . 0·08
Medically discharged† 41 (1·5%) Not known 51 (2·1%) . . 0·10
*Denominators for three groups differ slightly because of non-response on some items. †Statistic not calculated for Gulf vs Bosnia because of empty cells. ‡x2 or heterogeneity.
Table 2: Characteristics of responders

ARTICLES
variable for post-traumatic stress reaction: the experience of onesymptom in each of four classifications—intrusive thoughts,avoidance, arousal and irritability—and at least two furthersymptoms of unrefreshing sleep, fatigue, alcohol intolerance,forgetfulness, poor concentration, loss of sexual interest, anddecrease in appetite.
Although not in the original protocol, we added a furtheroutcome measure based on the multisymptom empiric syndromeidentified by the CDC study,5 which we have labelled the CDCmultisymptom syndrome. Mapped on to our questions, thisoutcome required one or more symptoms in at least twoclassifications of: fatigue, mood/cognition (depression, poorconcentration or memory, moodiness, anxiety, word-findingdifficulties, sleep difficulties), and musculoskeletal (joint pain,joint stiffness, muscle pain).
For all outcomes we used only current symptoms, defined asoccurring in the past month because evidence suggests thatquestionnaire data alone are reliable only for that length of time.12
Statistical analysisWe analysed data with SPSS (version 7.5) and STATA (version5.0). Data for SF-36 were entered on to SPSS twice. Theproportions of symptoms, disorders, and exposures werecompared between the Gulf cohort and the two comparisoncohorts by calculation of odds ratios and 95% CIs. We controlledfor potential confounders (sociodemographic factors: age, maritalstatus, rank, education, employment, still serving or discharged;lifestyle factors: smoking, alcohol consumption) by logistic-regression analysis. We assessed relations between a-priorioutcomes (fatigue, general health questionnaire score, SF-36,traumatic stress) and reported exposures, stratified bydeployment.
In the Bosnia cohort, 800 of 4250 servicemen had also beendeployed to the Gulf conflict, but we took them to be part of theGulf War cohort. The Bosnia cohort consisted of servicemen whohad served only in the Bosnia conflict.
ResultsResponsesWe received 8195 (65·1%) questionnaire replies (2961[70·4%] Gulf War cohort, 2620 [61·9%] Bosnia cohort,2614 [62·9%] Era cohort). Addresses were not availablefor 152 participants. 503 (4·0%) servicemen refused torespond. 980 (7·9%) questionnaires were returnedundelivered to the research team by the Post Office at the
end of the three mailings (figure 1). If the undeliveredquestionnaires are taken into account, the minimumeffective response rate was 70·6%. The characteristics ofthe Gulf War cohort at the start of the study are shown intable 1.
Responders did not differ from non-responders by sex,but were older (mean age: responders 34·7 years, non-responders 29·3, p<0·001) and more likely to be still inservice (66·4 vs 61·1%, p<0·001, table 2). The number ofmedical discharges among responders and non-respondersdid not differ across the entire sample (1·8 vs 2·0%,p=0·44) or by deployment (Gulf War cohort 1·5 vs 1·3%,p=0·59; Bosnia cohort, not known; Era 2·1 vs 2·6%,p=0·28). Some veterans had attended the medicalassessment programme established by the Ministry ofDefence for Gulf War veterans with symptoms, butbecause of confidentiality, we did not know whichveterans. The Ministry of Defence, however, did ananonymous record linkage on our behalf. In our Gulf Warcohort, 158 (4·0%) veterans had attended the programme.Of these veterans, 79% responded to the survey, comparedwith 67·3% of the two control groups (p<0·01).
The Bosnia responders were more likely to be still inservice, were younger, and more servicemen wereunmarried, as expected from the chronology of the conflicts.They also drank more alcohol. The Era cohort was similarto the Gulf sample, but contained more non-smokers.
We also assessed non-response by differences in thehealth of responders to the third mailing, since they wouldhave been non-responders without a third mailing. Theresponders from the first, second, and third mailings didnot differ significantly for a-priori key outcome measures.Mean SF-36 ratings of health perception were 71·3, 71·1,and 71·5, respectively (p=0·91). Ratings of physicalfunction were 92·5, 92·5, and 92·1 (p=0·64). The meantotal symptom score declined by mailing (8·1, 7·3, 7·0,p<0·001), which shows that servicemen with the mostsymptoms replied first. There was no significantinteraction between deployment, late response, and healthoutcome (p=0·42), since Gulf War late responders did notdiffer from the Bosnia or Era late responders.
200 serviceman who had not responded after twomailings were randomly chosen for intensive follow-up(table 3). 139 (69·5%) returned the questionnaire orcompleted a telephone survey, 22 (11·0%) refused toparticipate, 11 (5·5%) questionnaires were returnedundelivered, and 28 (14·0%) did not respond. Theintensive follow-up group contained more discharged
172 THE LANCET • Vol 353 • January 16, 1999
60
50
40
30
20
10
0
Most frequentPercentage
GulfBosniaEra
Least frequent
Freq
uenc
y of
sym
ptom
s (%
)
Figure 2: Symptoms by deployment
Characteristic Intensively Responders pfollowed up (n=7375)*(n=139)
Age<25 3·6% 7·0%25–29 18·7% 27·8%30–34 14·4% 27·6% <0·00135–39 31·7% 18·5%Ä40 31·7% 19·1%
Marital statusMarried or living with partner 77·8% 72·5%Never married 10·4% 18·9% 0·03Separated, divorced, widowed 11·9% 8·6%
EducationLower than ‘O’ levels 29·7% 18·7%‘O’ levels 57·8% 59·9% <0·001‘A’ levels and higher 12·5% 21·4%
Currently in employment 93·4% 95·6% 0·21
Medically discharged 0·7% 1·3% 0·56
Still in service/discharged 47·8/52·2% 67·1%/32·9% <0·001
Mean (SD) health outcomesHealth perception 66·3 (25·5) 71·3 (23·6) 0·01Physical functioning 90·3 (17·3) 92·5 (15·8) 0·11
*Denominators differ slightly because of non-response on some items.
Table 3: Characteristics of intensively followed up vs mainstudy responders

personnel than the main study (p<0·001), were more likelyto be married (p=0·03), and more likely to have lowereducational achievement (p=0·001). They were older(p<0·001, table 3) and did not differ significantly bymedical discharges, employment status, alcoholconsumption, and smoking (data available on Lancetwebsite, www.thelancet.com).
For the three cohorts combined, individuals whounderwent intensive follow-up reported slightly worsehealth perception (SF-36) than the main study responders(66·3 vs 71·3). Physical function scales did not, however,differ significantly (table 3).
SymptomsThe Gulf War cohort reported all symptoms and disorderson the questionnaires more frequently than thecomparison cohorts (figure 2). In addition to the 15 mostfrequent outcomes included in the tables, there weredifferences for other outcomes of interest, such as self-reported chronic fatigue syndrome.
We present logistic regression results for only the 15
most frequently reported symptoms and complaints (tables4 and 5), since only one symptom (vomiting) became non-significantly associated with Gulf War service afteradjustment for all confounders. Gulf War service was,however, associated with increased psychological distress,measured by the full general health questionnaire, and weentered this variable into a second model that alsocontrolled for demographic and lifestyle factors. There wasa slight general decrease in the association betweensymptoms and Gulf War service (table 4). Only unintendedweight loss of more than 10 lbs became non-significant.
Adjustment for possible confounders and psychologicaldisorders lessened the associations for symptoms in theGulf War cohort, but most remained significant (tables 4and 5). The strongest association was for self-reportedchronic fatigue syndrome, although it was infrequentlyreported in all three cohorts.
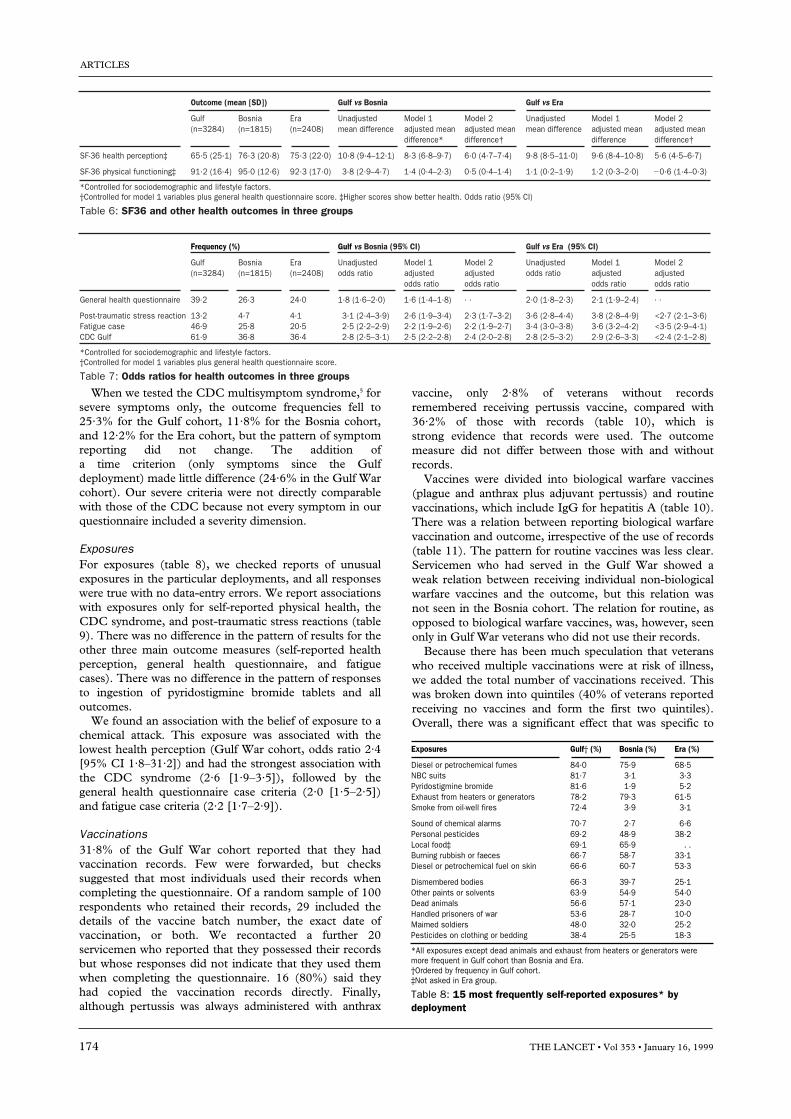
For SF-36 variables, by linear regression differences inphysical functioning between the three cohorts were non-significant, but that all other outcomes were significantlyassociated with Gulf War service (tables 6 and 7).
ARTICLES
THE LANCET • Vol 353 • January 16, 1999 173
Symptoms Frequency (%) Gulf vs Bosnia Gulf vs Era
Gulf Bosnia Era Univariate Odds ratio Odds ratio Univariate Odds ratio Odds ratio(n=3284) (n=1815) (n=2408) odds ratio model 1* model 2† odds ratio model 1* model 2†
Feeling unrefreshed after sleep 56·1 33·0 31·6 2·6 (2·3–2·9) 2·4 (2·1–2·8) 2·3 (1·9–2·7) 2·8 (2·5–3·1) 2·7 (2·4–3·1) 2·3 (2·0–2·6)Irritability or outbursts of anger 55·2 33·6 25·8 2·4 (2·2–2·7) 2·3 (2·0–2·6) 2·1 (1·8–2·4) 3·5 (3·2–4·0) 3·7 (3·3–4·2) 3·2 (2·8–3·7)Headaches 53·5 36·0 35·6 2·0 (1·8–2·3) 1·9 (1·7–2·3) 1·8 (1·6–2·1) 2·1 (1·9–2·3) 2·1 (1·9–2·3) 1·8 (1·6–2·0)Fatigue 50·7 26·3 27·7 2·9 (2·5–3·3) 2·5 (2·2–2·9) 2·4 (2·0–2·8) 2·7 (2·4–3·0) 2·7 (2·4–3·1) 2·2 (2·0–2·6)Sleeping difficulties 48·0 30·7 28·4 2·1 (1·8–2·4) 1·9 (1·6–2·2) 1·7 (1·5–2·0) 2·3 (2·1–2·6) 2·4 (2·1–2·7) 1·9 (1·7–2·2)
Forgetfulness 44·9 19·9 17·1 3·3 (2·8–3·7) 2·8 (2·4–3·2) 2·8 (2·3–3·3) 3·9 (3·5–4·5) 4·2 (3·6–4·8) 3·7 (3·2–4·4)Joint stiffness 40·0 21·8 23·5 2·4 (2·1–2·7) 2·7 (2·3–3·3) 2·6 (2·1–3·1) 2·2 (1·9–2·4) 2·8 (2·4–3·3) 2·4 (2·0–2·8)Loss of concentration 39·7 17·2 15·1 3·2 (2·8–3·7) 2·8 (2·4–3·3) 2·9 (2·4–3·5) 3·7 (3·2–4·2) 4·0 (3·4–4·6) 3·6 (3·0–4·2)Flatulence or burping 34·1 16·4 21·5 2·6 (2·3–3·0) 2·1 (1·8–2·5) 2·0 (1·7–2·4) 1·9 (1·7–2·1) 2·0 (1·8–2·3) 1·8 (1·5–2·0)Pain without swelling or redness 32·2 13·8 14·4 3·0 (2·5–3·5) 2·1 (1·8–2·4) 1·9 (1·6–2·2) 2·8 (2·5–3·2) 2·2 (2·0–2·6) 1·9 (1·7–2·2)in several joints
Feeling distant or cut off from 28·1 15·2 11·0 2·2 (1·9–2·5) 2·0 (1·7–2·4) 1·8 (1·5–2·3) 3·2 (2·7–3·7) 3·4 (2·9–4·0) 2·8 (2·3–3·3)othersAvoiding doing things or situations 26·8 13·0 10·3 2·4 (2·1–2·9) 2·0 (1·7–2·4) 1·8 (1·5–2·3) 3·2 (2·7–3·7) 3·5 (2·9–4·1) 2·8 (2·3–3·4)Chest pain 25·3 13·2 11·8 2·2 (1·9–2·6) 2·0 (1·7–2·4) 1·9 (1·6–2·3) 2·5 (2·2–2·9) 2·6 (2·2–3·0) 2·1 (1·8–2·5)Tingling in fingers and arms 24·7 8·7 11·1 3·4 (2·8–4·1) 2·7 (2·2–3·3) 2·5 (2·0–3·1) 2·6 (2·3–3·1) 2·7 (2·3–3·2) 2·3 (2·0–2·7)Night sweats 24·6 12·8 9·9 2·2 (1·9–2·6) 2·0 (1·7–2·4) 1·9 (1·5–2·2) 3·0 (2·5–3·5) 2·9 (2·5–3·5) 2·5 (2·1–2·9)
*Controlled for age (continuous variable [years]), smoking, alcohol consumption, marital status, educational attainment, officer or other ranks, employment status, and civilian ormilitary status on follow-up. †As for model 1, but adds general health questionnaire score (0–12). Odds ratio (95% CI).
Table 4: 15 most frequent self-reported symptoms by deployment
Complaints Frequency (%) Gulf vs Bosnia Gulf vs Era
Gulf Bosnia Era Unadjusted Odds ratio Odds ratio Unadjusted Odds ratio Odds ratio(n=3284) (n=1815) (n=2408) odds ratio model 1* model 2† odds ratio model 1* model 2†
Back disorders 35·7 23·9 27·6 1·8 (1·5–2·0) 1·5 (1·3–1·7) 1·4 (1·2–1·6) 1·5 (1·3–1·6) 1·5 (1·3–1·7) 1·3 (1·1–1·5)Hayfever 21·6 18·7 15·8 1·2 (1·0–1·4) 1·2 (1·0–1·5) 1·2 (1·0–1·4) 1·5 (1·3–1·7) 1·5 (1·3–1·8) 1·4 (1·2–1·6)Dermatitis 21·3 13·7 12·3 1·7 (1·5–2·0) 1·8 (1·5–2·1) 1·6 (1·3–2·0) 1·9 (1·7–2·2) 1·9 (1·6–2·2) 1·6 (1·4–1·9)Sinus disorders 19·6 11·7 12·0 1·8 (1·5–2·2) 1·6 (1·3–1·9) 1·4 (1·2–1·8) 1·8 (1·5–2·1) 1·7 (1·5–2·0) 1·5 (1·3–1·8)Migraines 18·1 10·2 9·2 1·9 (1·6–2·3) 1·7 (1·4–2·1) 1·6 (1·3–1·9) 2·2 (1·8–2·6) 2·1 (1·8–2·5) 1·7 (1·4–2·1)
Disease of hair or scalp 16·5 7·6 8·6 2·4 (2·0–2·9) 2·4 (1·9–3·0) 2·2 (1·8–2·8) 2·1 (1·8–2·5) 2·0 (1·7–2·4) 1·8 (1·5–2·1)Ear infection 12·3 7·2 8·8 1·8 (1·5–2·2) 1·5 (1·2–1·9) 1·4 (1·1–1·8) 1·5 (1·2–1·7) 1·4 (1·2–1·7) 1·2 (1·0–1·5)Loss of hearing 11·8 5·9 9·4 2·1 (1·7–2·7) 1·5 (1·1–1·9) 1·4 (1·0–1·8) 1·3 (1·1–1·5) 1·4 (1·1–1·6) 1·1 (0·9–1·4)Arthritis or rheumatism 9·7 4·1 7·9 2·5 (1·9–3·3) 1·5 (1·1–2·0) 1·3 (0·9–1·7) 1·2 (1·0–1·5) 1·4 (1·1–1·7) 1·1 (0·9–1·4)Sexual problems 9·0 3·0 3·1 3·2 (2·4–4·3) 2·2 (1·5–3·1) 1·9 (1·3–2·7) 3·0 (2·3–3·9) 3·2 (2·4–4·2) 2·2 (1·7–3·0)
High blood pressure 8·8 4·3 6·6 2·2 (1·7–2·8) 1·4 (1·0–1·9) 1·3 (1·0–1·8) 1·5 (1·1–1·7) 1·5 (1·2–1·9) 1·2 (1·0–1·6)Eczema or psoriasis 7·8 5·8 6·7 1·4 (1·1–1·8) 1·3 (1·1–1·7) 1·3 (1·0–1·6) 1·2 (1·0–1·5) 1·2 (1·0–1·5) 1·2 (0·9–1·5)Asthma 6·5 4·5 3·7 1·5 (1·1–1·9) 1·2 (0·9–1·6) 1·2 (0·8–1·6) 1·8 (1·4–2·3) 1·8 (1·4–2·4) 1·6 (1·2–2·1)Bronchitis 4·4 2·2 2·5 2·0 (1·4–2·9) 1·7 (1·1–2·5) 1·5 (1·0–2·3) 1·8 (1·3–2·5) 1·7 (1·2–2·3) 1·4 (1·0–1·9)Disease of genital organs 3·8 3·3 2·2 1·1 (0·8–1·6) 1·6 (1·1–2·4) 1·5 (1·0–2·3) 1·7 (1·2–2·4) 1·5 (1·1–2·2) 1·3 (0·9–1·8)
Chronic fatigue syndrome or 3·3 0·8 0·8 4·2 (2·4–7·4) 2·5 (1·3–4·8) 2·1 (1·1–4·0) 4·4 (2·7–7·3) 4·2 (2·5–7·2) 2·7 (1·6–4·6)myalgic encephalitisMultiple chemical sensitivity 0·8 0·4 0·3 1·9 (0·8–4·4) 1·1 (0·4–3·1) 1·0 (0·4–2·8) 2·2 (1·0–4·9) 2·2 (0·9–5·3) 1·7 (0·7–4·0)
*Controlled for sociodemographic and lifestyle variables (as for table 4). †Controlled for sociodemographic variables plus general health questionnaire.
Table 5: 15 most frequently self-reported medical disorders, plus chronic fatigue syndrome and multiple chemical sensitivity, bydeployment
vaccine, only 2·8% of veterans without recordsremembered receiving pertussis vaccine, compared with36·2% of those with records (table 10), which isstrong evidence that records were used. The outcomemeasure did not differ between those with and withoutrecords.
Vaccines were divided into biological warfare vaccines(plague and anthrax plus adjuvant pertussis) and routinevaccinations, which include IgG for hepatitis A (table 10).There was a relation between reporting biological warfarevaccination and outcome, irrespective of the use of records(table 11). The pattern for routine vaccines was less clear.Servicemen who had served in the Gulf War showed aweak relation between receiving individual non-biologicalwarfare vaccines and the outcome, but this relation wasnot seen in the Bosnia cohort. The relation for routine, asopposed to biological warfare vaccines, was, however, seenonly in Gulf War veterans who did not use their records.
Because there has been much speculation that veteranswho received multiple vaccinations were at risk of illness,we added the total number of vaccinations received. Thiswas broken down into quintiles (40% of veterans reportedreceiving no vaccines and form the first two quintiles).Overall, there was a significant effect that was specific to
ARTICLES
When we tested the CDC multisymptom syndrome,5 forsevere symptoms only, the outcome frequencies fell to25·3% for the Gulf cohort, 11·8% for the Bosnia cohort,and 12·2% for the Era cohort, but the pattern of symptomreporting did not change. The addition of a time criterion (only symptoms since the Gulfdeployment) made little difference (24·6% in the Gulf Warcohort). Our severe criteria were not directly comparablewith those of the CDC because not every symptom in ourquestionnaire included a severity dimension.
ExposuresFor exposures (table 8), we checked reports of unusualexposures in the particular deployments, and all responseswere true with no data-entry errors. We report associationswith exposures only for self-reported physical health, theCDC syndrome, and post-traumatic stress reactions (table9). There was no difference in the pattern of results for theother three main outcome measures (self-reported healthperception, general health questionnaire, and fatiguecases). There was no difference in the pattern of responsesto ingestion of pyridostigmine bromide tablets and alloutcomes.
We found an association with the belief of exposure to achemical attack. This exposure was associated with thelowest health perception (Gulf War cohort, odds ratio 2·4[95% CI 1·8–31·2]) and had the strongest association withthe CDC syndrome (2·6 [1·9–3·5]), followed by thegeneral health questionnaire case criteria (2·0 [1·5–2·5])and fatigue case criteria (2·2 [1·7–2·9]).
Vaccinations31·8% of the Gulf War cohort reported that they hadvaccination records. Few were forwarded, but checkssuggested that most individuals used their records whencompleting the questionnaire. Of a random sample of 100respondents who retained their records, 29 included thedetails of the vaccine batch number, the exact date ofvaccination, or both. We recontacted a further 20servicemen who reported that they possessed their recordsbut whose responses did not indicate that they used themwhen completing the questionnaire. 16 (80%) said theyhad copied the vaccination records directly. Finally,although pertussis was always administered with anthrax
174 THE LANCET • Vol 353 • January 16, 1999
Exposures Gulf† (%) Bosnia (%) Era (%)
Diesel or petrochemical fumes 84·0 75·9 68·5NBC suits 81·7 3·1 3·3Pyridostigmine bromide 81·6 1·9 5·2Exhaust from heaters or generators 78·2 79·3 61·5Smoke from oil-well fires 72·4 3·9 3·1
Sound of chemical alarms 70·7 2·7 6·6Personal pesticides 69·2 48·9 38·2Local food‡ 69·1 65·9 . .Burning rubbish or faeces 66·7 58·7 33·1Diesel or petrochemical fuel on skin 66·6 60·7 53·3
Dismembered bodies 66·3 39·7 25·1Other paints or solvents 63·9 54·9 54·0Dead animals 56·6 57·1 23·0Handled prisoners of war 53·6 28·7 10·0Maimed soldiers 48·0 32·0 25·2Pesticides on clothing or bedding 38·4 25·5 18·3
*All exposures except dead animals and exhaust from heaters or generators weremore frequent in Gulf cohort than Bosnia and Era. †Ordered by frequency in Gulf cohort. ‡Not asked in Era group.
Table 8: 15 most frequently self-reported exposures* bydeployment
Frequency (%) Gulf vs Bosnia (95% CI) Gulf vs Era (95% CI)
Gulf Bosnia Era Unadjusted Model 1 Model 2 Unadjusted Model 1 Model 2(n=3284) (n=1815) (n=2408) odds ratio adjusted adjusted odds ratio adjusted adjusted
odds ratio odds ratio odds ratio odds ratio
General health questionnaire 39·2 26·3 24·0 1·8 (1·6–2·0) 1·6 (1·4–1·8) · · 2·0 (1·8–2·3) 2·1 (1·9–2·4) · ·
Post-traumatic stress reaction 13·2 4·7 4·1 3·1 (2·4–3·9) 2·6 (1·9–3·4) 2·3 (1·7–3·2) 3·6 (2·8–4·4) 3·8 (2·8–4·9) <2·7 (2·1–3·6)Fatigue case 46·9 25·8 20·5 2·5 (2·2–2·9) 2·2 (1·9–2·6) 2·2 (1·9–2·7) 3·4 (3·0–3·8) 3·6 (3·2–4·2) <3·5 (2·9–4·1)CDC Gulf 61·9 36·8 36·4 2·8 (2·5–3·1) 2·5 (2·2–2·8) 2·4 (2·0–2·8) 2·8 (2·5–3·2) 2·9 (2·6–3·3) <2·4 (2·1–2·8)
*Controlled for sociodemographic and lifestyle factors. †Controlled for model 1 variables plus general health questionnaire score.
Table 7: Odds ratios for health outcomes in three groups
Outcome (mean [SD]) Gulf vs Bosnia Gulf vs Era
Gulf Bosnia Era Unadjusted Model 1 Model 2 Unadjusted Model 1 Model 2(n=3284) (n=1815) (n=2408) mean difference adjusted mean adjusted mean mean difference adjusted mean adjusted mean
difference* difference† difference difference†
SF-36 health perception‡ 65·5 (25·1) 76·3 (20·8) 75·3 (22·0) 10·8 (9·4–12·1) 8·3 (6·8–9·7) 6·0 (4·7–7·4) 9·8 (8·5–11·0) 9·6 (8·4–10·8) 5·6 (4·5–6·7)
SF-36 physical functioning‡ 91·2 (16·4) 95·0 (12·6) 92·3 (17·0) 3·8 (2·9–4·7) 1·4 (0·4–2·3) 0·5 (0·4–1·4) 1·1 (0·2–1·9) 1·2 (0·3–2·0) 20·6 (1·4–0·3)
*Controlled for sociodemographic and lifestyle factors. †Controlled for model 1 variables plus general health questionnaire score. ‡Higher scores show better health. Odds ratio (95% CI)
Table 6: SF36 and other health outcomes in three groups

the Gulf cohort, with a significant interaction term (table11). The effect persisted after control for receipt ofbiological warfare vaccines (table 12). Stratification by useof records to control for recall bias did not affect theassociation (table 13). The same analyses were repeatedfor the other five main outcomes. For each of theseoutcomes, multiple vaccinations were associated withpoorer health after control for deployment. Theinteraction term between deployment and multiplevaccinations was significant for only two of theseoutcomes—health perception and physical health. Therewas no interaction between pyridostigmine bromideingestion and multiple vaccinations (p=0·7).
We repeated the analyses to find out whether side-effects experienced at the time of vaccinations wereassociated with the outcome. Veterans who recalledexperiencing side-effects were more likely to have currentsymptoms (Gulf War cohort 2·8 [2·4–3·3]; Bosnia cohort2·2 [1·6–3·1]). Analyses including reporting side-effects inthe model, for the variables shown in table 11, showedonly one significant association between tetanusvaccination and ill health in the Gulf War cohort (1·2[1·0–1·4]). After control for reported side-effects theassociation between all vaccinations and illness wasweakened, but remained significant (table 13). The relationbetween multiple vaccinations and outcome was almostunchanged in servicemen who had vaccination records.
DiscussionUK veterans of the Gulf War report higher rates of manysymptoms and disorders and have a decreased perceptionof well being than servicemen who were not deployed tothe Gulf War, despite no evidence of increased frequenciesand no excess of objective outcomes, such as birth defects,cancers, or death.1,2,4 By contrast, we report that service-men in the Gulf were about three times more likely to fulfilcriteria for chronic fatigue, post-traumatic stress reaction,or the CDC multisymptom syndrome criteria than those inthe control cohorts, even after adjustment for confounders.These participants were at least twice as likely toexperience similar outcomes as those deployed to Bosnia.Despite these findings, disability was not severe, and there isno evidence of an increased rate of adverse outcomes suchas unemployment or marital breakdown. Nevertheless, webelieve that our data constitute firm evidence that service inthe Gulf War has affected the health of servicemen.
ARTICLES
THE LANCET • Vol 353 • January 16, 1999 175
Gulf War Bosnia Era
SF-36 physical functioningDiesel or petrochemical fumes 1·4 (1·2–1·7) 1·4 (1·0–1·8) 1·8 (1·5–2·2)NBC suits 1·5 (1·3–1·8) 1·5 (0·8–2·7) 1·4 (0·9–2·3)Pyridostigmine bromide 1·3 (1·1–1·5) 1·7 (0·8–3·5) 1·1 (0·8–1·7)Exhaust from heaters of generators 1·4 (1·2–1·7) 1·4 (1·1–1·9) 1·7 (1·4–2·0)Smoke from oil-well fires 1·2 (0·99–1·3) 0·7 (0·4–1·3) 1·2 (0·7–2·0)Hear chemical alarms sounding 1·5 (1·3–1·8) 1·5 (0·7–2·8) 1·5 (1·0–2·0)Personal pesticides 1·5 (1·3–1·8) 1·4 (1·1–1·8) 1·5 (1·2–1·8)Local food* 1·0 (0·9–1·2) 1·3 (1·0–1·7) . .
Burning rubbish or faeces 1·2 (1·0–1·4) 1·0 (0·8–1·2) 1·3 (1·1–1·6)Diesel or petrochemical fuel on skin 1·4 (1·2–1·6) 1·2 (0·9–1·5) 1·5 (1·3–1·8)Dismembered bodies 1·3 (1·2–1·5) 1·3 (1·0–1·6) 1·3 (1·0–1·5)Other paints or solvents 1·4 (1·2–1·6) 1·3 (1·0–1·7) 1·6 (1·3–1·9)Dead animals 1·2 (1·1–1·4) 1·2 (0·9–1·5) 1·2 (0·9–1·4)Handled prisoners of war 1·1 (0·9–1·3) 1·3 (1·0–1·6) 1·0 (0·7–1·3)Maimed soldiers 1·2 (1·0–1·4) 1·3 (1·0–1·6) 1·3 (1·1–1·6)Pesticides on clothing or bedding 1·4 (1·2–1·6) 1·5 (1·4–1·9) 1·6 (1·2–1·9)
Other exposures of interestChemical or nerve gas attack 2·2 (1·7–2·9) 9·5 (1·9–47·1) 1·5 (0·8–2·9)Mustard gas 1·8 (1·2–2·9) 1·2 (0·3–4·4) 1·7 (0·6–4·5)Combat-related injury 1·8 (1·4–2·4) 1·6 (1·1–2·4) 2·1 (1·5–2·9)Witness anyone dying 1·4 (1·2–1·7) 1·5 (1·2–2·0) 1·3 (1·0–1·5)SCUD missile explosion within 1·5 (1·3–1·8) 3·1 (1·0–9·7) 1·3 (0·5–3·6)1 mileCome under small-arms fire 1·1 (0·9–1·3) 1·8 (0·9–1·5) 1·3 (1·1–1·6)Artillery close by 1·4 (1·2–1·6) 1·2 (0·9–1·5) 1·2 (0·9–1·5)
CDC syndromeDiesel or petrochemical fumes 2·1 (1·7–2·5) 1·8 (1·4–2·3) 2·4 (1·9–2·9)NBC suits 2·7 (2·3–3·3) 2·7 (1·6–4·8) 2·3 (1·5–3·7)Pyridostigmine bromide 2·6 (2·2–3·1) 3·4 (1·7–6·8) 1·9 (1·4–2·8)Exhaust from heaters or generators 1·9 (1·6–2·2) 2·8 (2·1–3·7) 2·4 (1·9–2·8)Smoke from oil-well fires 1·8 (1·5–2·1) 1·4 (0·8–2·3) 1·8 (1·1–2·9)Hear chemical alarms sounding 2·2 (1·9–2·6) 2·5 (1·4–4·5) 2·3 (1·7–3·2)Personal pesticides 2·2 (1·9–2·6) 1·8 (1·5–2·2) 1·8 (1·5–2·2)Local food* 1·1 (0·9–1·3) 1·8 (1·5–2·3) . .
Burning rubbish or faeces 1·9 (1·6–2·2) 1·9 (1·6–2·3) 1·8 (1·5–2·1)Diesel or petrochemical fuel on skin 1·8 (1·5–2·1) 1·8 (1·5–2·2) 2·0 (1·7–2·4)Dismembered bodies 2·0 (1·7–2·3) 2·0 (1·6–2·4) 1·9 (1·5–2·3)Other paints or solvents 1·7 (1·5–2·0) 1·9 (1·5–2·3) 1·9 (1·6–2·3)Dead animals 1·8 (1·5–2·0) 2·4 (1·9–2·9) 2·3 (1·9–2·8)Handled prisoners of war 1·7 (1·5–1·9) 2·2 (1·8–2·7) 1·9 (1·5–2·5)Maimed soldiers 1·7 (1·5–2·0) 2·0 (1·6–2·5) 1·8 (1·5–2·2)Pesticides on clothing or bedding 1·9 (1·6–2·2) 1·7 (1·4–2·2) 1·9 (1·5–2·3)
Other exposures of interestChemical or nerve gas attack 2·6 (1·9–3·5) 6·0 (1·2–29·0) 2·2 (1·2–4·2)Mustard gas 1·9 (1·2–3·3) 7·7 (1·6–35·9) 3·2 (1·2–8·7)Combat-related injury 2·9 (2·1–4·2) 2·4 (1·7–3·6) 3·1 (2·2–4·2)Witness anyone dying 1·6 (1·4–1·9) 2·0 (1·6–2·6) 1·8 (1·4–2·1)SCUD missile explosion within 1·6 (1·4–1·9) 2·4 (0·8–7·5) 2·2 (0·8–6·0)1 mileCome under small-arms fire 1·5 (1·3–1·7) 1·7 (1·4–2·1) 1·6 (1·4–1·9)Artillery close by 1·9 (1·6–2·2) 1·8 (1·4–2·2) 1·6 (1·3–2·0)
Post-traumatic stress reactionDiesel or petrochemical fumes 2·5 (1·7–3·6) 3·2 (1·5–6·7) 1·9 (1·1–3·1)NBC suits 3·0 (2·1–4·4) 2·0 (0·8–5·3) 3·3 (1·6–6·7)Pyridostigmine bromide 3·1 (2·1–4·4) 1·9 (0·6–6·4) 2·1 (1·1–4·2)Exhaust from heaters or generators 2·3 (1·7–3·1) 4·4 (1·8–11·0) 2·6 (1·6–4·2)Smoke from oil-well fires 2·3 (1·7–2·9) 3·2 (1·6–6·8) 3·0 (1·4–6·5)Hear chemical alarms sounding 2·1 (1·6–2·8) 1·4 (0·4–4·5) 1·8 (0·9–3·5)Personal pesticides 2·3 (1·7–2·9) 1·8 (1·1–2·8) 1·8 (1·2–2·8)
Local food* 0·8 (0·6–0·9) 2·1 (1·2–3·7) . .Burning rubbish or faeces 2·0 (1·5–2·5) 3·5 (1·9–6·1) 2·8 (1·8–4·2)Diesel or petrochemical fuel on skin 2·0 (1·6–2·6) 2·1 (1·2–3·4) 2·0 (1·3–3·0)Dismembered bodies 2·7 (2·1–3·5) 3·9 (2·4–6·3) 3·7 (2·5–5·5)Other paints or solvents 1·4 (1·1–1·7) 2·2 (1·3–3·5) 3·3 (2·0–5·4)Dead animals 1·6 (1·3–1·9) 3·9 (1·9–5·9) 2·9 (1·9–4·3)Handled prisoners of war 2·3 (1·8–2·8) 4·0 (2·6–6·3) 1·5 (0·9–2·7)Maimed soldiers 2·8 (2·3–3·5) 3·8 (2·4–6·0) 3·7 (2·5–5·5)Pesticides on clothing or bedding 2·4 (1·9–2·9) 1·9 (1·2–3·0) 2·9 (1·9–4·5)
Other exposures of interestChemical or nerve gas attack 3·1 (2·3–4·1) 2·4 (0·3–19·7) 1·2 (0·3–4·9)Mustard gas† 2·1 (1·2–3·6) · · 1·4 (0·2–11·0)Combat-related injury 2·4 (1·8–3·3) 2·4 (1·3–4·6) 5·0 (3·1–8·2)Witness anyone dying 2·2 (1·8–2·7) 2·5 (1·6–3·9) 2·8 (1·9–4·2)SCUD missile explosion within 1·7 (1·4–2·1) 3·3 (0·7–14·9) 3·9 (0·9–18·3)1 mileCome under small-arms fire 2·0 (1·6–2·5) 2·9 (1·8–4·8) 3·9 (2·6–5·9)Artillery close by 2·4 (1·9–2·9) 2·3 (1·5–3·6) 3·8 (2·5–5·7)
*Not asked in Era group. †Statistic for Bosnia not calculated due to empty cell. Oddsratio (95% CI).
Table 9: Association of 15 most frequent exposures andexposures of interest with principal health outcomes
Gulf (%) Bosnia (%)
All Record No record All Record No record(n=940) (n=2242) (n=1127) (n=1718)
Biological warfarevaccineAnthrax 57·2 69·3 55·1 2·6 2·9 2·5Plague 25·7 34·1 23·3 0·2 0·4 0Pertussis 12·2 36·2 2·8 0·1 0·3 0
Any biological 58·4 69·7 56·4 2·9 3·5 2·5
Routine vaccinesHepatitis A 6·3 7·8 6·1 23·8 37·2 14·2Hepatitis B 7·2 10·6 6·1 12·3 17·8 8·6Yellow fever 14·0 15·8 13·9 13·4 19·3 9·5Typhoid 12·5 25·4 7·6 15·9 27·7 7·4Poliomyelitis 13·7 15·9 12·8 14·7 20·0 11·2Cholera 13·7 31·5 6·2 2·1 2·7 1·6Tetanus 33·8 34·3 32·3 29·3 39·5 22·2
Any routine 48·1 62·4 42·0 45·6 61·8 33·3vaccination
Table 10: Frequency of reported vaccines by theatre of warand vaccine records

ARTICLES
Study limitationsAs in similar studies, the most important factor forparticipation in the survey was our ability to find accurateaddresses.5,6,13,14 The second factor influencing responsewas demography. Young men generally change addressesfrequently and are not inclined to respond to lengthyquestionnaire surveys,15 which has been experienced inprevious studies of Gulf War veterans.
A key question is whether or not participation wasbiased towards those with health complaints. Responderswere more likely to still be in service, but did not differfrom non-responders on various relevant health outcomes,including the proportion of those given medicaldischarges. There was no suggestion that veterans withworse health outcomes were more or less likely to respondat the earliest opportunity, although those with moresymptoms responded earlier and proportionally moreresponders attended the medical assessment programme.An identical pattern of response was reported in the USstudy most comparable with our own.14 By contrast,servicemen traced by intensive follow-up, who wereassumed to represent non-responders to the main study,had worse health perception than responders. The
difference was not significant, did not differ by cohort, andwas not accompanied by a similar decline in self-reportedphysical functioning. We conclude that the pattern thatthose who had more symptoms responded earlier was inkeeping with other large surveys. A few veterans probablyhad worse health and were also non-responders, which hasbeen shown in individuals who attribute poor health toliving close to hazardous waste sites.16 We suspect that fewof the persistently non-responding veterans may feeldistrust for and alienation from “authority”, aphenomenon reported previously in soldiers returningfrom war.17,18 The most important conclusion is thatdifferential non-response between the three cohorts doesnot explain the observed results.
There has been dispute about the choice of controls inGulf War studies. Some argue that deployed veterans maybe healthier than servicemen who are not deployed, whichwould lead to a “healthy warrior” bias,3 and which couldhave obscured an increase in adverse outcomes in thosedeployed. The issue is unresolved,19 but cannot accountfor our findings. The associations between the Gulf Warand Era cohorts were only slightly more robust than thosebetween the Gulf War and Bosnia cohorts, which suggeststhat the “healthy warrior” effect was not strong. Wecontrolled for predeployment fitness, a proxy for generalhealth. Given the robust increases in ill health reported byGulf War veterans, any “healthy warrior” effect would addto the strength of our findings.
All the chosen outcomes are questionnaire-based andrelied on self-report. We have not reported the frequencyof disorders such as asthma, neuropathy, majordepression, chronic fatigue syndrome, or post-traumaticstress disorder, which require a clinical interview andexamination for diagnosis. Instead our chosen outcomesshould be interpreted as indicating that the responder wasmore likely to have a disorder but not as being diagnostic.The differential patterns between the three cohortstherefore show more than the absolute numbers for eachclassification.
We did not do physical examinations. Previous studiesof selected and randomly chosen Gulf War veterans haveshown an absence of unexpected abnormal findings.1,5,20,21
Routine surveillance of Gulf War veterans for infectiousdisease has generally been negative.5 In addition, Gulf Warveterans seem to have no increased rates of definedphysical disorders that might explain increased symptomreporting.4 Likewise, whereas Vietnam veterans complain
176 THE LANCET • Vol 353 • January 16, 1999
Total vaccinations Control for biological warfare Control for experience ofvaccines side-effects after vaccination
All Records only All Records only
0* · · · · · · · ·1–2 0·8 (0·6–1·0) 0·9 (0·6–1·5) 0·8 (0·6–1·1) 1·3 (0·7–2·2)3–6 1·0 (0·6–1·0) 1·1 (0·8–1·5) 1·0 (0·8–1·2) 1·1 (0·8–1·6)Ä7 1·5 (1·2–1·9) 1·7 (1·2–2·4) 1·3 (1·0–1·6) 1·7 (1·1–2·5)p 0·0005 0·008 0·05 0·01
*Reference.
Table 13: Associations between multiple vaccination and CDCsyndrome, controlled for experience of side-effects andbiological warfare vaccine, Gulf only
Gulf Bosnia
Odds ratio for all With records Without records Odds ratio for all With records Without recordsodds ratio odds ratio odds ratio odds ratio
Biological warfare vaccine
Anthrax 1·5 (1·3–1·7) 1·4 (1·0–1·8) 1·4 (1·2–1·7) 1·5 (0·7–2·9) 2·6 (0·9–7·4) 0·9 (0·4–2·3)Plague* 1·3 (1·1–1·6) 1·1 (0·9–1·5) 1·4 (1·1–1·7) · · · · · ·Pertussis* 1·1 (0·9–1·4) 1·3 (1·0–1·7) 0·9 (0·5–1·6) · · · · · ·
Any biological 1·5 (1·3–1·7) 1·4 (1·1–1·9) 1·5 (1·2–1·8) 1·5 (0·8–2·8) 2·5 (0·9–6·6) 0·9 (0·4–2·3)
Routine vaccinesHepatitis A 1·1 (0·8–1·5) 1·1 (0·7–1·9) 1·0 (0·7–1·5) 1·1 (0·8–1·4) 1·1 (0·7–1·5) 1·1 (0·7–1·6)Hepatitis B 1·0 (0·8–1·3) 1·0 (0·7–1·6) 0·9 (0·6–1·3) 1·2 (0·9–1·7) 1·2 (0·8–1·9) 1·2 (0·7–2·1)Yellow fever 1·3 (1·1–1·7) 1·4 (0·9–2·0) 1·3 (0·9–1·6) 1·0 (0·7–1·4) 0·8 (0·5–1·2) 1·2 (0·7–1·9)Typhoid 1·0 (0·8–1·3) 1·0 (0·7–1·4) 1·1 (0·8–1·5) 1·1 (0·8–1·5) 1·1 (0·7–1·6) 1·1 (0·7–1·9)Poliomyelitis 1·2 (0·96–1·5) 0·9 (0·8–1·4) 1·3 (1·0–1·8) 1·2 (0·9–1·7) 0·9 (0·6–1·4) 1·6 (1·1–2·5)Cholera 1·1 (0·9–1·4) 1·1 (0·8–1·4) 1·3 (0·9–1·9) 0·8 (0·3–2·1 ) 0·5 (0·1–2·3) 1·1 (0·3–4·0)Tetanus 1·3 (1·1–1·5) 1·1 (0·8–1·4) 1·3 (1·1–1·6) 1·0 (0·8–1·3) 1·0 (0·7–1·3) 1·1 (0·8–1·5)
Any routine 1·2 (1·1–1·4) 1·0 (0·7–1·3) 1·3 (1·1–1·5) 1·1 (0·9–1·3) 1·0 (0·7–1·3) 1·2 (0·9–1·6)
*Odds ratios not calculated for Bosnia because of empty cells.
Table 11: Associations between reported vaccinations and CDC syndrome, stratified by theatre of war and whether respondent hadvaccination record
Total All (Gulf Gulf Bosniavaccina- and Bosnia)
All With All Withtions
records records records records
0* · · · · · · · · · ·1–2 0·9 (0·8–1·1) 0·9 (0·7–1·2) 1·2 (0·7–2·0) 1·0 (0·8–1·3) 1·0 (0·7–1·4)3–6 1·4 (1·2–1·6) 1·2 (1·0–1·4) 1·1 (0·8–1·6) 1·1 (0·8–1·4) 0·8 (0·6–1·2)Ä7 2·6 (2·2–3·1) 1·8 (1·5–2·2) 1·9 (1·3–2·8) 1·1 (0·4–3·4) 1·2 (0·3–5·5)p <0·0001 <0·0001 0·001 0·6 0·5
Interaction term vaccinations by theatre of war x2 4·6 (p=0·03). *Reference.
Table 12: Associations between multiple vaccination and CDCsyndrome

of a range of self-reported symptoms and disorders, thesewere rarely diagnosed on physical examination orinvestigation.22 A few veterans may have undetectedphysical disease, but this possibility would not affect thepattern of our results. We intend to do further studies that include detailed physical, neurophysiological, andneuropsychological examinations of veterans who reportsymptoms and of controls.
ImplicationsThe finding that active military service has led to long-term adverse health effects is not new and has beenreported in US and Australian Vietnam veterans,22,23 andinferred after earlier conflicts.24 Furthermore, the US studyof Gulf veterans most comparable to ours reported asimilar decline in self-reported health status and higherrates of various symptoms and disorders.6
The most obvious explanation for this increase insymptoms in the Gulf War veterans is that it relates todifferent experiences of hazardous exposures. Thedifferences in many self-reported exposures between Gulfveterans and controls was not substantial. For example,although reported use of pesticides was common amongUK Gulf veterans (more so than US servicemen6), it wasalso frequently reported in the Bosnia and Era cohorts.
Three types of self-reported exposures did differsubstantially between the Gulf War veterans and thecomparison cohorts: exposure to the smoke of burning oilwells, vaccinations against biological warfare, andmeasures to protect against, and possible exposure to,chemical warfare.
All service personnel deployed abroad are routinelyvaccinated against several infective agents. Some personnelreceived booster doses of one or more of thesevaccinations before deployment. At the time of the GulfWar, two new vaccination programmes were started toprotect troops against plague and anthrax. Pertussisvaccine was administered with the anthrax vaccine as anadjuvant, to speed the immunological response.Servicemen who received vaccinations against biologicalwarfare agents were more likely to report long-termsymptoms. Those who received routine vaccinations weregenerally not at increased risk. Receipt of multiple non-biological warfare vaccinations was, however, associatedwith an increased risk of illness, but only among Gulf Warveterans, even though Bosnia veterans also receivedmultiple vaccinations. This finding was not explained bysimultaneous exposure to biological warfare vaccines. Astriking relation between retrospective recollection of side-effects of vaccines at the time and later illness seemed toexplain the association between individual vaccines andillness, but not multiple vaccines and illness.
The association between receipt of any routinevaccinations and adverse outcomes was significant only inservicemen who had not used their vaccination records,which suggests some recall bias. However, servicemen whohad used their records were more likely to report biologicalwarfare vaccination, which suggests that some hadforgotten that they had received biological warfarevaccines. Slight positive and negative recall biases were,therefore, present, but our main findings on the long-termoutcome of biological vaccines and multiple vaccines inthe Gulf War was unlikely to be because of recall bias. Theassociation persisted in servicemen who had their records,which were generally used when completing thequestionnaire.
We cannot explain the vaccine findings. Multiplevaccinations in a short period of time have been suggestedto produce a shift in the cytokine profile from Th1 toTh2.25 We hope to be able to test this hypothesis directly.Likewise, there may be an interaction between stress andresponse to vaccination,25 as has been suggested forpyridostigmine ingestion in experimental animal models.26
We found no interactions between exposures such asimmunisations and pyridostigmine bromide. Finally,psychological mechanisms should be taken into accountthat are consistent with our data; for example, symptomsexperienced acutely after vaccination could generate healthanxiety and prime recipients to detect similar generalisedsymptoms occurring later. Given the results of ouraccompanying paper (pages 179–82), multiple orbiological warfare vaccination may be a further non-specific trigger for later symptoms.
The third factor specific to the Gulf conflict was therealistic threat of chemical warfare. Nearly 70% of USpersonnel surveyed just before the active conflict reportedthat anticipation of attack by chemical weapons, biologicalweapons, or both was their most common fear.27 7 yearslater we found that nearly all Gulf veterans rememberwearing nuclear-biological-chemical suits and hearingchemical alerts, 26% reported a SCUD missile explosionnearby, and 9% believed that they had been exposed tochemical attack.
Gulf and Bosnia veterans differed in their experience ofneeding to protect themselves against chemical attack,their perception that such attack might be imminent, andthe belief that such an attack had taken place. Whether ornot such attack occurred is uncertain, although anaccidental discharge of chemical agents did take place afterthe war (the Khamisiyah incident28). Irrespective ofwhether actual exposure took place, the threat of suchexposure was real to the servicemen and may be a riskfactor for development of the adverse outcomes we report.
Previous attempts to give at least a part explanation ofthe health difficulties of US veterans have drawn specificanalogies with combat stress and subsequent post-traumatic stress disorder. Classic traumatic events, such asseeing dismembered bodies, maimed soldiers, orwitnessing death were associated with Gulf War service,but were not unique to that deployment. Combat-relatedinjury, one of the most robust associations of post-traumatic stress,29 was one of the strongest associations ofall the outcomes, but did not differ between the cohorts.Adjustment for psychological distress did not alter thepattern of results. Although clinically diagnosed post-traumatic stress disorder has been associated withincreased experience of physical symptoms,30,31 narrowlydefined post-traumatic stress pathways can only partlyexplain the pattern of results. Likewise, war trauma,although important, is not by itself sufficient explanationfor our findings. We prefer to broaden the definition ofstress to include environmental as well as direct battletraumas, as noted in the Vietnam War32 and in civilianlife.33
Our findings suggest that general mechanisms linkadversity and health outcomes. These mechanisms includethe general effect of conflict on self-reported health andthe general association between all potentially adverseexposures and health.6 Therefore, although some of theexposures were unique to the Gulf War, the mechanismslinking them to ill health might not be specific. Onepathway could involve perceived risk and later ill health.
ARTICLES
THE LANCET • Vol 353 • January 16, 1999 177

ARTICLES
We suspect that the threat of chemical attack was one suchexposure, analogous to previous observations that link self-reported exposure to herbicide (“Agent Orange”) andvarious similar outcomes.34 Recall bias in whichservicemen with more symptoms recall more exposuresmay be a further general link, as seen in assessment ofpossible toxic hazards several years after exposure.35 Theincrease in symptoms, for whatever reason, leads to lowerhealth perception, and an increased probability ofendorsing any specified medical disorder.
Finally, we cannot exclude possible unique biologicalmechanisms that link Gulf War service and later ill health.We have shown an adverse effect of multiple vaccinationspecific to the Gulf War and aim to confirm this finding infurther studies. We cannot make recommendations aboutthe medical preparation for future military conflicts fromour findings.
A fuller understanding of why service in the PersianGulf War was associated with a definite decline in generalwell-being will come from assessment of the effects of trueand perceived exposure to physical and psychologicaladversity, and the interaction between the two.
ContributorsCatherine Unwin coordinated the study, and was involved in analysis andthe writing of the paper. Nick Blatchley gave statistical support and createdthe study cohorts. William Coker and Ian Palmer are grant holders, andprovided military advice and liaison. Lisa Hull traced veterans andcoordinated the study and follow-up. Khalida Ismail did the follow-upstudy, and was involved in the analysis and the writing of the paper.Susan Ferry was the initial study coordinator. Matthew Hotopf gaveepidemiological advice and was involved in the analysis and the writing ofthe paper. Anthony David and Simon Wessely were the principalinvestigators and planned, designed, and supervised the study, as well asdrafting the paper.
AcknowledgmentsThis study was funded by the US Department of Defence. Neither the USDepartment of Defence nor the UK Ministry of Defence has had any inputinto the design, analysis, and reporting of the study. The views expressedhere are ours and not those of any US or UK governmental organisation.We thank the Ministry of Defence for assistance in identifying and tracingthe participants. NB was seconded to the Ministry of Defence from theOffice of National Statistics. We thank Terry English, Royal British Legion,and his staff, the Gulf veterans’ organisations, and the veterans who gaveadvice and encouragement and who continue to serve on our advisoryboard. We thank our colleagues in the other research teams at the LondonSchool of Hygiene and Tropical Medicine and the University ofManchester for their cooperation, and Margo Pellerin for providingsupportive counselling to distressed veterans or their relatives.
References1 Joseph S. A comprehensive clinical evaluation of 20,000 Persian Gulf
War veterans. Milit Med 1997; 162: 149–56.2 Gray G, Coate B, Anderson C, et al. The postwar hospitalization
experience of U.S. veterans of the Persian Gulf War. N Engl J Med1996; 335: 1505–13.
3 Haley R. Point: bias from the “healthy warrior effect” and unequalfollow up in three government studies of health effects of the Gulf War.Am J Epidemol 1998; 148: 315–23.
4 Kang H, Bullman T. Mortality among U.S. veterans of the Persian GulfWar. N Engl J Med 1996; 335: 1498–504.
5 Fukuda K, Nisenbaum R, Stewart G, et al. Chronic multisymptomillness affecting air force veterans of the gulf war. JAMA 1998; 280:981–88.
6 The Iowa Persian Gulf Study Group. Self-reported illness and healthstatus among Persian Gulf War veterans: a population-based study.JAMA 1997; 277: 238–45.
7 Keane T, Caddell J, Taylor K. Mississippi Scale for combat-relatedposttraumatic stress disorder: three studies in reliability and validity. J Consult Clin Psychol 1988; 56: 85–90.
8 Ware J Jr, Sherbourne C. The MOS 36-item short-form health survey(SF–36): conceptual framework and item selection. Med Care 1992; 30:473–83.
9 Goldberg D. The detection of psychiatric illness by questionnaire.London: Oxford University Press, 1972.
10 Kipen H, Hallman W, Kelly-McNeil K, Fielder N. Measuring chemicalsensitivity prevalence: a questionnaire for population studies. Am JPublic Health 1995; 85: 574–77.
11 Chalder T, Berelowitz G, Pawlikowska T, et al. Development of afatigue scale. J Psychosom Res 1993; 37: 147–53.
12 Simon G, Von Korff M. Recall of psychiatric history in cross-sectionalsurveys: implications for epidemiologic research. Epidemiol Rev 1995;17: 221–27.
13 O’Toole B, Marshall R, Grayson D, et al. The Australian Vietnamveterans health study, I: study design and response bias. Int J Epidemiol1996; 25: 307–18.
14 The National Survey Research Team. National Health Survey of GulfWar Era veterans and Their Families. Conference on FederallySponsored Gulf War Veterans’ Illness Research, June 17–19 1998,Washington DC.
15 Eaker S, Bergstron R, Bergstrom A, Adami H, Nyren O. Response rateto mailed epidemiologic questionnaires: a population-based randomizedtrial of variations in design and mailing routines. Am J Epidemiol 1998;147: 74–82.
16 Whiteman D, Dunne M, Burnett P. Psychological and social correlatesof attrition in a longitudinal study of hazardous waste exposure. ArchEnviron Health 1995; 50: 281–86.
17 Leed E. No man’s land: combat and identity in World War One.Cambridge: Cambridge University Press, 1979.
18 Hynes S. A war imagined: the First World War and English culture.London: Bodley Head, 1992.
19 Gray G, Knoke J, Berg W, Wignall S, Barrett-Connor E. Counterpoint:responding to suppositions and misunderstanding. Am J Epidemiol1998; 148: 328–33.
20 Coker W. A review of Gulf War illness. J R Navy Med Serv 1996; 82:141–46.
21 Wynn M, Johnston W, McCauley L, Spencer P, Redmond D,Bourdette D. Assessment of veterans with Persian Gulf Warunexplained illnesses: initial results of a population based study.Neurology 1997; 48: 2044.
22 Centers for Disease Control Vietnam Experience Study. Health status of Vietnam veterans II: physical health. JAMA 1988; 259:2708–14.
23 O’Toole B, Marshall R, Grayson D, et al. The Australian Vietnamveterans health study, II: self-reported health of veterans compared withthe Australian population. Int J Epidemiol 1996; 25: 319–30.
24 Hyams K, Wignall F, Roswell R. War syndromes and their evaluation:from the US Civil War to the Persian Gulf War. Ann Intern Med 1996;125: 398–405.
25 Rook G, Zumla A. Gulf War syndrome: is it due to a systemic shift incytokine balance towards a Th2 profile? Lancet 1997; 349: 1831–33.
26 Friedman A, Kaufer D, Shemer J, Hendler I, Soreq H, Tur-Kaspa I.Pyridostigmine brain penetration under stress enhances neuronalexcitability and induces early immediate transcriptional response. Nat Med 1996; 2: 1382–85.
27 Wright K, Marlowe D, Martin J, Gifford R, Belenky G, Manning F.Operation Desert Shield/Desert Storm. Washington DC: Walter ReedInstitute of Research, 1995.
28 Presidential Advisory Committee on Gulf War Veterans’ Illnesses: finalreport. Washington, DC: US Government Printing Office, 1997.
29 Pitman R, Altman B, Macklin M. The prevalence of posttraumaticstress disorder in wounded Vietnam veterans. Am J Psychiatr 1989; 146:667–69.
30 Baker D, Mendenhall C, Simbartl L, Magan L, Steinberg J.Relationship between posttraumatic stress disorder and self reportedphysical symptoms in Persian Gulf war veterans. Arch Intern Med 1997;157: 2076–78.
31 Andreski P, Chilcoat H, Breslau N. Post-traumatic stress disorder andsomatization symptoms: a prospective study. Psychiatry Res 1998; 79:131–38.
32 Korgeski GP, Leon GR. Correlates of self-reported and objectivelydetermined exposure to Agent Orange. Am J Psychiatr 1983; 140:1443–49.
33 Davidson L, Baum A. Chronic stress and post traumatic stress disorder.J Consult Clin Psychol 1986; 54: 303–08.
34 Decoufle P, Holmgreen P, Boyle C, Stroup N. Self-reported healthstatus of Vietnam veterans in relation to perceived exposure toherbicides and combat. Am J Epidemiol 1992; 135: 312–23.
35 Hopwood D, Guidotti T. Recall bias in exposed subjects following a toxic exposure incident. Arch Environ Health 1988; 43:234–37.
178 THE LANCET • Vol 353 • January 16, 1999