Federated States of Micronesia: - Public Expenditure Analysis.
Upload
khangminh22Category
view
1download
0
Clinical Epidemiology and Global Health 15 (2022) 101053
Available online 2 May 20222213-3984/© 2022 The Author(s). Published by Elsevier B.V. on behalf of INDIACLEN. This is an open access article under the CC BY license(http://creativecommons.org/licenses/by/4.0/).
Original article
Health care utilization and expenditure inequities in India: Benefit incidence analysis
Jeetendra Yadav a,*, Savita Devi b, Mahesh Nath Singh c, Navneet Manchanda d, Moradhawaj d
a ICMR-National Institute of Medical Statistics, Department of Health Research, Ansari Nagar, New Delhi, 110029, India b Free Lance Consultant, 578/237 Raj Kamal Vihar, Hydle Colony Road, Sarojani Nagar, Lucknow, 226008, India c State Institute of Health and Family Welfare Lucknow, 226016, India d Jawaharlal Nehru University, New Mehrauli Road, JNU Ring Rd, New Delhi, Delhi, 110067, India
A R T I C L E I N F O
Keywords: Inequality Out-of-Pocket expenditure Concentration index Benefit incidence analysis (BIA)
A B S T R A C T
Background: The transition from Millennium Development Goals to Sustainable Development Goals 2030 has yet again emphasized on the unfinished agenda of achieving efficient and equitable health systems and universal health coverage. With trifling public spending on healthcare and insignificant insurance coverage, India has recorded 55 million people descending below the poverty line in one year due to healthcare payments. Not only are these health-related payments impoverishing but also the burden of seeking care is disproportionately skewed towards deprived population groups. Against this backdrop, the present paper examines the inequality in health status, utilization of health care services, and financial risk protection. The study is further complemented by assessing who benefits from public subsidies across different economic quintiles and as per epidemiological transition level (ETL) of states. Methods: This study used data nationwide National Sample Survey 75th round data. We perform the Benefit Incidence Analysis (BIA) using concentration indices, concentration curve, and poor-rich equity ratio to measure horizontal and vertical inequity and analyze the redistribution dimension to understand which population segment benefits more from public subsidies. Results: Findings suggest that high out of pocket (OOP) spending on inpatient care, especially in the private sector resulted in lower utilization of health care services especially among marginalized communities. Seeking care for marginalized sub-groups is dilapidating in two major ways-, on one hand, it exhausts all their income/savings for the treatment. On the other, as a result of incapacitation, families lose their daily income. The present analysis finds a higher unmet need for treatment in the poor, and the reasons commonly reported were pertaining to affordability, availability and accessibility. The results also showed that low ETL states faced a higher percentage of catastrophic expenditure vis-a-vis other states, thereby; stressing health system reforms beyond the “one-size- fits-all” strategy. Conclusions: It is imperative that both Central and State Governments should work together to strengthen the public healthcare system to ensure accessibility and quality of care. Central Government’s Pradhan Mantri Jan Arogya Yojana (PM-JAY) health insurance program is a positive step forward to address the healthcare needs of deprived population subgroups.
1. Introduction
In the health sector, equity in access and utilization has been central to the development agenda; while it is integral to the pursuance of Universal Health Coverage, it is not a natural upshot of it.1Health sys-tems often contribute to inequity in the distribution of health benefits
due to demand and supply factors. Health care in India is provided by a vast network of public, private-for-profit, charitable and NGO facilities.2
Typically, people who seek treatment in the public healthcare in-stitutions bear, a smaller out-of-pocket (OOP) expenditure for using the facilities against those who rely on the private sector. Consequently, private providers are either not accessible for economically and socially
* Corresponding author. ICMR-National Institute of Medical Statistics, India. E-mail addresses: [email protected] (J. Yadav), [email protected] (S. Devi), [email protected] (M.N. Singh), navneetmanchanda02@gmail.
com (N. Manchanda), [email protected] (Moradhawaj).
Contents lists available at ScienceDirect
Clinical Epidemiology and Global Health
journal homepage: www.elsevier.com/locate/cegh
https://doi.org/10.1016/j.cegh.2022.101053 Received 15 February 2022; Received in revised form 15 April 2022; Accepted 25 April 2022
Clinical Epidemiology and Global Health 15 (2022) 101053
2
disadvantaged groups or the utilization of private medical care results in ‘impoverishment’ due to enormous healthcare costs.3,4 This existence of provider-mix and a fragmented healthcare system creates myriad supply-side factors that often exacerbate inequality.2,5 On the demand side, health-seeking behaviour varies immensely across socioeconomic groups. This can be attributed primarily to varying “health ideals” due to differences in level of literacy and health awareness and gets further compounded by geographical and financial constraints in the accessi-bility of healthcare. Furthermore, there is substantial regional inequality in the economic development and variation in time and the speed of health and demographic transition across states in the country.6–8 Since India’s demographic and epidemiological transition is characterized by the heterogeneous progress across the region, it is vital to be accounted for while designing healthcare reforms.9–12
Access to quality healthcare facilities is a basic human right that should be cherished irrespective of the ability to pay, social or economic class. However, health systems across the globe are highly inequitable.13
Thus, understanding equity and equality dimensions are imperative while analyzing the availability and utilization of care services to all. The terms ’equity’ and ‘equality’ are used interchangeably, but they have different meanings. Equality refers to equal distribution or division of the entity to be distributed (distribuend), while equity means how fair is the distribution of the distribuend.14 In literature, two critical di-mensions cited for examining health inequities include horizontal and vertical inequality. Another measurement of ‘redistribution’ is added to this two-fold typology, which determines who gets the benefits of sub-sidy and to what extent. Benefit Incidence Analysis (BIA) is a well-known technique to measure inequality in health status, utilization of health care services, and health care expenditure across different economic classes.15–17 Besides, the distribution of health care utilization and heath care expenditure, benefit incidence analysis also examines how well the benefits accrue to the poorest populations vis-a-vis rich and which socioeconomic strata bear extreme financial burden of house-holds’ expenditure on health. Given the above background, our study examines the magnitude of horizontal inequity in health status and utilization of health care service across economic classes; vertical inequity in financial risk protection to identify the impact of out-of-pocket expenditure on households by economic status; and also examine the public subsidy targeting to know that who gets benefits of public subsidies by economic status giving an indicator of redistribution.
2. Data and methodology
2.1. Data sources, sample size, sampling design and geographical coverage
This study used unit-level data records from the recent nationwide National Sample Survey (NSS) 75th round which was based theme ‘Social consumption: Health’ conducted during July 2017–June 2018. NSS 75th round data covered a sample of 14258 village/urban blocks (8077 rural villages and 6181 urban blocks), 1,13,823 households (64,552 rural and 49,271 urban) and 5,55,115 individuals (3,25,883 rural and 2,29,232 urban). Detailed information was collected on direct medical and non-medical expenditure for each episode of hospitaliza-tion for the last 365 days preceding the survey and a recall period of 15 days for outpatient care. The NSS survey adopted a stratified multi-stage sampling design. In rural areas, sample villages and in the urban areas urban blocks were chosen with Probability Proportional to Size with Replacement (PPSWR) as the first stage. The Sample households were chosen by Systematic Random Sampling without Replacement (SRSWOR) as the second stage. The details of the survey methodology are described in the NSS report.13 The survey covered all Indian states and union territories of India.18
2.2. Study indicators for equity
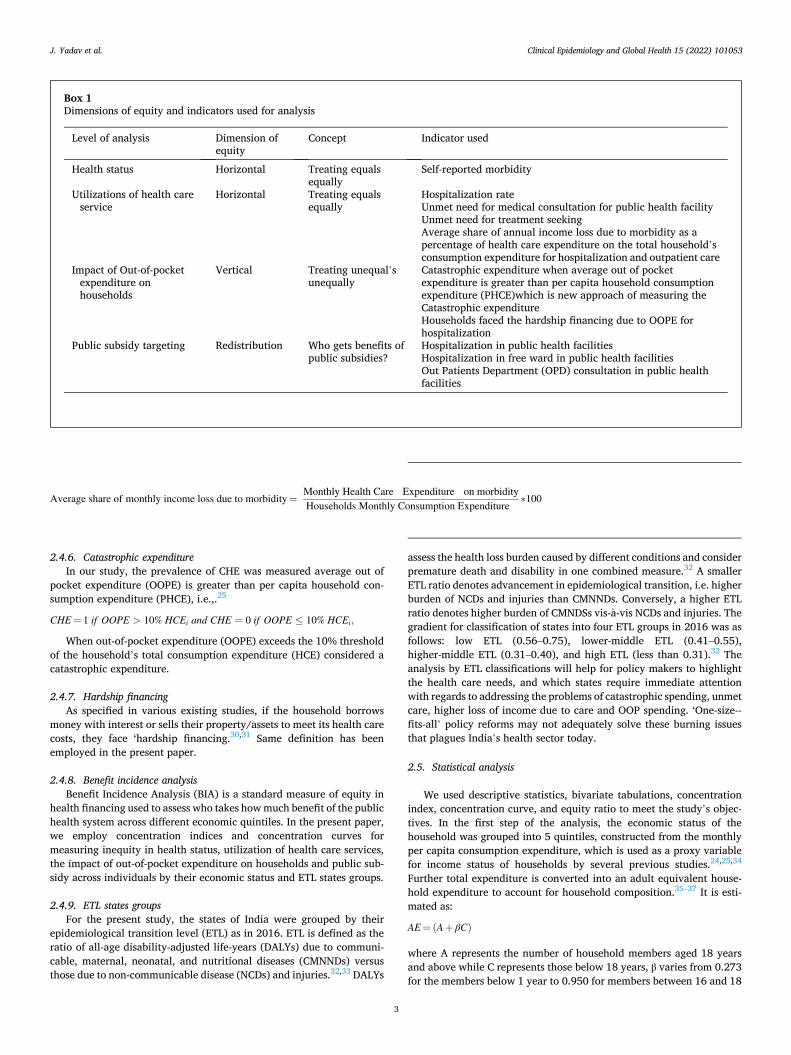
To understand the magnitude of horizontal and vertical inequity to assess the beneficiaries of public spending, we have used indicators pertaining to health status, utilization of health facilities and impact of Out-of-pocket expenditure on households which has been described in detail in box 1 below.
2.3. Horizontal equity
Horizontal equity principle says that all people with equal health needs should get equal treatment.
2.4. Vertical equity
Vertical equity rule assumes that individuals with unequal health needs should receive appropriately different levels of care.
2.4.1. Health status To assess the health status of a person, we have used self-reported
morbidity. In India and other developing countries, self-reported morbidity is a widely used indicator in extensive national surveys to measure the health status of a population.19–22 NSS 75th round collects information on self-morbidity data for each hospitalization episode in the reference period of 365 days and ailment treated as outpatient in 15 days preceding the survey.18
2.4.2. Unmet need for public health facilities Unmet need for public health facility was determined as the number
of persons who suffered/suffering from any disease and did not access public health facility because of the following reasons: required specific services were not available, or if services were available quality was not satisfactory/doctors not available, quality satisfactory but facility too far, quality satisfactory but involves long waiting, financial constraint and preference for a trusted doctor/hospital and ‘other’ reasons.18
2.4.3. Unmet need for treatment seeking Unmet need for treatment seeking was determined as the number of
persons who did not seek treatment at all either from any private or public health facility who suffered from a any disease, due to - no medical facility available in the neighbourhood, facility too expensive, cannot afford to wait long due to domestic/economic engagement or any other reason. However, the present analysis excludes cases where people did not seek care because the ailment was not considered serious enough for treatment.18,23
2.4.4. Out-of-pocket expenditure Out of pocket considered both direct medical costs (i.e., hospital
stay, consultation, treatment medicines and procedures, laboratory and other investigation charges), and direct non-medical costs (i.e., trans-portation, meals, lodging: for patients and care givers) Our study has considered net out-of-pocket health expenditure; therefore, insurance reimbursements have been subtracted from households’ reported health expenditure.3,23–25 Like self-reported morbidity, the hospitalization expenditure has been captured for last 365 days and OPD care expenses for 15 days preceding the survey. Since the expenditure for hospitali-zation and OPD care were collected for different recall periods, we have converted all the expenditures into monthly values used by previous studies.26
2.4.5. Average share of monthly income loss due to treatment care We have examined the average share of monthly income loss due to
morbidity as a percentage of health care expenditure on the total households consumption expenditure.27,28,29
J. Yadav et al.
Clinical Epidemiology and Global Health 15 (2022) 101053
3
2.4.6. Catastrophic expenditure In our study, the prevalence of CHE was measured average out of
pocket expenditure (OOPE) is greater than per capita household con-sumption expenditure (PHCE), i.e.,.25
CHE = 1 if OOPE > 10% HCEi and CHE = 0 if OOPE ≤ 10% HCEi,
When out-of-pocket expenditure (OOPE) exceeds the 10% threshold of the household’s total consumption expenditure (HCE) considered a catastrophic expenditure.
2.4.7. Hardship financing As specified in various existing studies, if the household borrows
money with interest or sells their property/assets to meet its health care costs, they face ‘hardship financing.30,31 Same definition has been employed in the present paper.
2.4.8. Benefit incidence analysis Benefit Incidence Analysis (BIA) is a standard measure of equity in
health financing used to assess who takes how much benefit of the public health system across different economic quintiles. In the present paper, we employ concentration indices and concentration curves for measuring inequity in health status, utilization of health care services, the impact of out-of-pocket expenditure on households and public sub-sidy across individuals by their economic status and ETL states groups.
2.4.9. ETL states groups For the present study, the states of India were grouped by their
epidemiological transition level (ETL) as in 2016. ETL is defined as the ratio of all-age disability-adjusted life-years (DALYs) due to communi-cable, maternal, neonatal, and nutritional diseases (CMNNDs) versus those due to non-communicable disease (NCDs) and injuries.32,33 DALYs
assess the health loss burden caused by different conditions and consider premature death and disability in one combined measure.32 A smaller ETL ratio denotes advancement in epidemiological transition, i.e. higher burden of NCDs and injuries than CMNNDs. Conversely, a higher ETL ratio denotes higher burden of CMNDSs vis-a-vis NCDs and injuries. The gradient for classification of states into four ETL groups in 2016 was as follows: low ETL (0.56–0.75), lower-middle ETL (0.41–0.55), higher-middle ETL (0.31–0.40), and high ETL (less than 0.31).32 The analysis by ETL classifications will help for policy makers to highlight the health care needs, and which states require immediate attention with regards to addressing the problems of catastrophic spending, unmet care, higher loss of income due to care and OOP spending. ‘One-size--fits-all’ policy reforms may not adequately solve these burning issues that plagues India’s health sector today.
2.5. Statistical analysis
We used descriptive statistics, bivariate tabulations, concentration index, concentration curve, and equity ratio to meet the study’s objec-tives. In the first step of the analysis, the economic status of the household was grouped into 5 quintiles, constructed from the monthly per capita consumption expenditure, which is used as a proxy variable for income status of households by several previous studies.24,25,34
Further total expenditure is converted into an adult equivalent house-hold expenditure to account for household composition.35–37 It is esti-mated as:
AE=(A+ βC)
where A represents the number of household members aged 18 years and above while C represents those below 18 years, β varies from 0.273 for the members below 1 year to 0.950 for members between 16 and 18
Box 1 Dimensions of equity and indicators used for analysis
Level of analysis Dimension of equity
Concept Indicator used
Health status Horizontal Treating equals equally
Self-reported morbidity
Utilizations of health care service
Horizontal Treating equals equally
Hospitalization rate Unmet need for medical consultation for public health facility Unmet need for treatment seeking Average share of annual income loss due to morbidity as a percentage of health care expenditure on the total household’s consumption expenditure for hospitalization and outpatient care
Impact of Out-of-pocket expenditure on households
Vertical Treating unequal’s unequally
Catastrophic expenditure when average out of pocket expenditure is greater than per capita household consumption expenditure (PHCE)which is new approach of measuring the Catastrophic expenditure Households faced the hardship financing due to OOPE for hospitalization
Public subsidy targeting Redistribution Who gets benefits of public subsidies?
Hospitalization in public health facilities Hospitalization in free ward in public health facilities Out Patients Department (OPD) consultation in public health facilities
Average share of monthly income loss due to morbidity=Monthly Health Care Expenditure on morbidityHouseholds Monthly Consumption Expenditure
∗100
J. Yadav et al.
Clinical Epidemiology and Global Health 15 (2022) 101053
4
years.37
In the second part of analysis, we carried out the descriptive statistics to know the variation in mean values for all indicators across ETL state groups by expenditure quintiles. Mean out-of-pocket expenditure was estimated for hospitalization and OPD care separately by quintiles. The Chi-square test is used to classify the association between outcome in-dicators and consumption expenditure quintiles.
In the third step of the analysis, the rich-poor ratio, defined as the richest to the poorest economic quintile ratio, is used to measure the gap in health care benefits across outcome indicators.
In the fourth step, we carried out the Benefit Incidence Analysis for health service utilization. Concentration indices and concentration curves were computed for each indicator to provide a composite mea-sure of inequities. The concentration index estimates the extent of inequality in all the outcome indicators among ETL state groups in India. The concentration index lies in the interval (− 1, 1).1,23,32,38 If concen-tration index is 0 there is no inequality in healthcare benefits and pos-itive value indicates that a variable is more concentrated among the richest and vice-versa. Concentration index was calculated as twice the weighted covariance of the health care indicators and household’s relative rank in terms of wealth quintile (adult equivalent MPCE with household composition is the rank variable in present study) divided by the mean of households with outcome indicators.
C=2μ Cov w (y i, Ri )
Where, C represents concentration index, yi is the binary variable health care indicators occurred in the ith household, μ is the mean of outcome variables, and Ri is the fractional rank of the ith household in the eco-nomic status.
3. Results
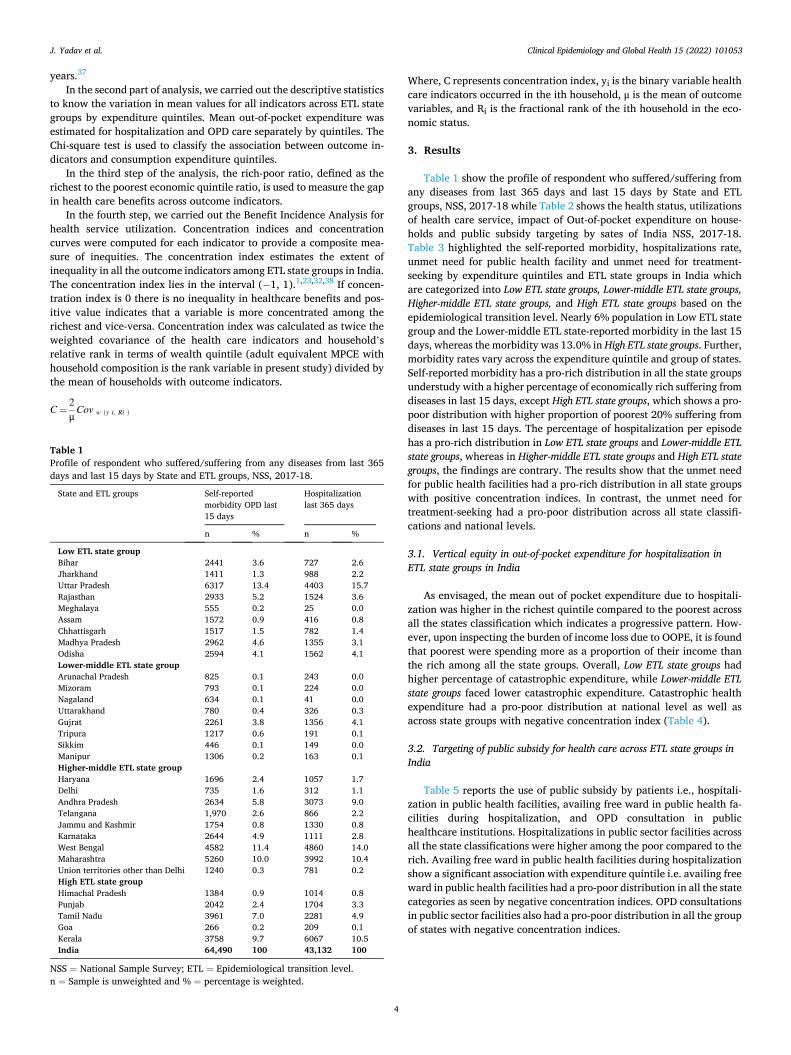
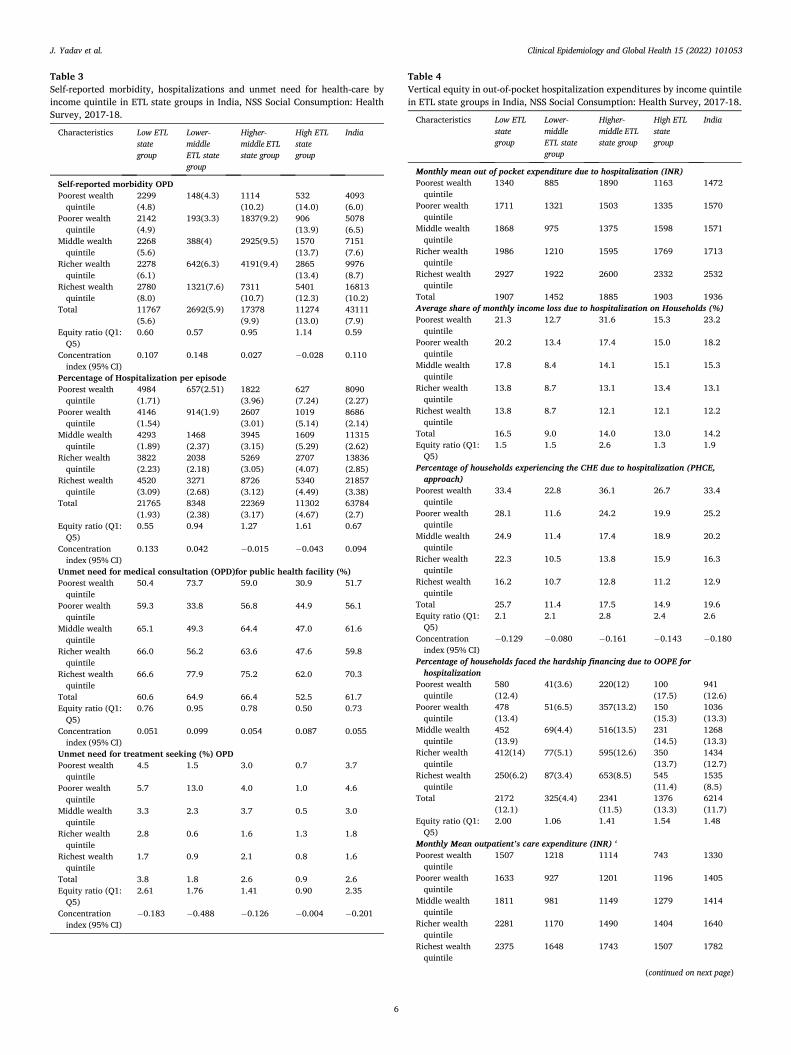
Table 1 show the profile of respondent who suffered/suffering from any diseases from last 365 days and last 15 days by State and ETL groups, NSS, 2017-18 while Table 2 shows the health status, utilizations of health care service, impact of Out-of-pocket expenditure on house-holds and public subsidy targeting by sates of India NSS, 2017-18. Table 3 highlighted the self-reported morbidity, hospitalizations rate, unmet need for public health facility and unmet need for treatment- seeking by expenditure quintiles and ETL state groups in India which are categorized into Low ETL state groups, Lower-middle ETL state groups, Higher-middle ETL state groups, and High ETL state groups based on the epidemiological transition level. Nearly 6% population in Low ETL state group and the Lower-middle ETL state-reported morbidity in the last 15 days, whereas the morbidity was 13.0% in High ETL state groups. Further, morbidity rates vary across the expenditure quintile and group of states. Self-reported morbidity has a pro-rich distribution in all the state groups understudy with a higher percentage of economically rich suffering from diseases in last 15 days, except High ETL state groups, which shows a pro- poor distribution with higher proportion of poorest 20% suffering from diseases in last 15 days. The percentage of hospitalization per episode has a pro-rich distribution in Low ETL state groups and Lower-middle ETL state groups, whereas in Higher-middle ETL state groups and High ETL state groups, the findings are contrary. The results show that the unmet need for public health facilities had a pro-rich distribution in all state groups with positive concentration indices. In contrast, the unmet need for treatment-seeking had a pro-poor distribution across all state classifi-cations and national levels.
3.1. Vertical equity in out-of-pocket expenditure for hospitalization in ETL state groups in India
As envisaged, the mean out of pocket expenditure due to hospitali-zation was higher in the richest quintile compared to the poorest across all the states classification which indicates a progressive pattern. How-ever, upon inspecting the burden of income loss due to OOPE, it is found that poorest were spending more as a proportion of their income than the rich among all the state groups. Overall, Low ETL state groups had higher percentage of catastrophic expenditure, while Lower-middle ETL state groups faced lower catastrophic expenditure. Catastrophic health expenditure had a pro-poor distribution at national level as well as across state groups with negative concentration index (Table 4).
3.2. Targeting of public subsidy for health care across ETL state groups in India
Table 5 reports the use of public subsidy by patients i.e., hospitali-zation in public health facilities, availing free ward in public health fa-cilities during hospitalization, and OPD consultation in public healthcare institutions. Hospitalizations in public sector facilities across all the state classifications were higher among the poor compared to the rich. Availing free ward in public health facilities during hospitalization show a significant association with expenditure quintile i.e. availing free ward in public health facilities had a pro-poor distribution in all the state categories as seen by negative concentration indices. OPD consultations in public sector facilities also had a pro-poor distribution in all the group of states with negative concentration indices.
Table 1 Profile of respondent who suffered/suffering from any diseases from last 365 days and last 15 days by State and ETL groups, NSS, 2017-18.
State and ETL groups Self-reported morbidity OPD last 15 days
Hospitalization last 365 days
n % n %
Low ETL state group Bihar 2441 3.6 727 2.6 Jharkhand 1411 1.3 988 2.2 Uttar Pradesh 6317 13.4 4403 15.7 Rajasthan 2933 5.2 1524 3.6 Meghalaya 555 0.2 25 0.0 Assam 1572 0.9 416 0.8 Chhattisgarh 1517 1.5 782 1.4 Madhya Pradesh 2962 4.6 1355 3.1 Odisha 2594 4.1 1562 4.1 Lower-middle ETL state group Arunachal Pradesh 825 0.1 243 0.0 Mizoram 793 0.1 224 0.0 Nagaland 634 0.1 41 0.0 Uttarakhand 780 0.4 326 0.3 Gujrat 2261 3.8 1356 4.1 Tripura 1217 0.6 191 0.1 Sikkim 446 0.1 149 0.0 Manipur 1306 0.2 163 0.1 Higher-middle ETL state group Haryana 1696 2.4 1057 1.7 Delhi 735 1.6 312 1.1 Andhra Pradesh 2634 5.8 3073 9.0 Telangana 1,970 2.6 866 2.2 Jammu and Kashmir 1754 0.8 1330 0.8 Karnataka 2644 4.9 1111 2.8 West Bengal 4582 11.4 4860 14.0 Maharashtra 5260 10.0 3992 10.4 Union territories other than Delhi 1240 0.3 781 0.2 High ETL state group Himachal Pradesh 1384 0.9 1014 0.8 Punjab 2042 2.4 1704 3.3 Tamil Nadu 3961 7.0 2281 4.9 Goa 266 0.2 209 0.1 Kerala 3758 9.7 6067 10.5 India 64,490 100 43,132 100
NSS = National Sample Survey; ETL = Epidemiological transition level. n = Sample is unweighted and % = percentage is weighted.
J. Yadav et al.
Clinical Epidemiology and Global Health 15 (2022) 101053
5
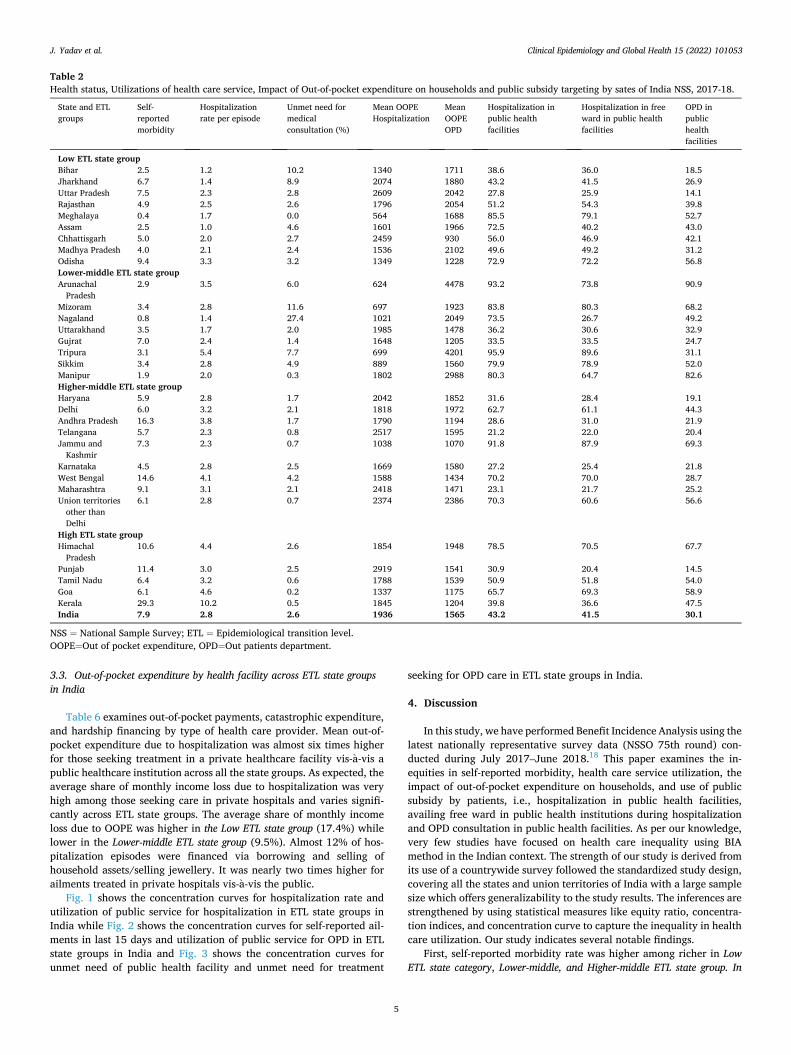
3.3. Out-of-pocket expenditure by health facility across ETL state groups in India
Table 6 examines out-of-pocket payments, catastrophic expenditure, and hardship financing by type of health care provider. Mean out-of- pocket expenditure due to hospitalization was almost six times higher for those seeking treatment in a private healthcare facility vis-a-vis a public healthcare institution across all the state groups. As expected, the average share of monthly income loss due to hospitalization was very high among those seeking care in private hospitals and varies signifi-cantly across ETL state groups. The average share of monthly income loss due to OOPE was higher in the Low ETL state group (17.4%) while lower in the Lower-middle ETL state group (9.5%). Almost 12% of hos-pitalization episodes were financed via borrowing and selling of household assets/selling jewellery. It was nearly two times higher for ailments treated in private hospitals vis-a-vis the public.
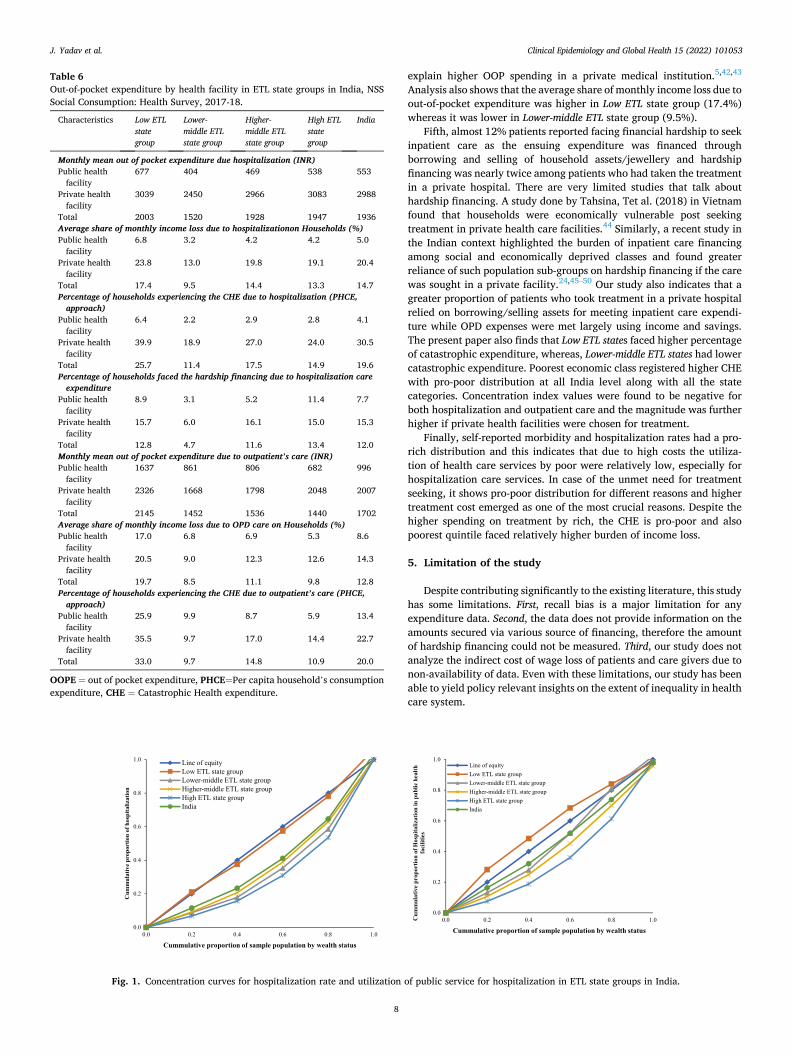
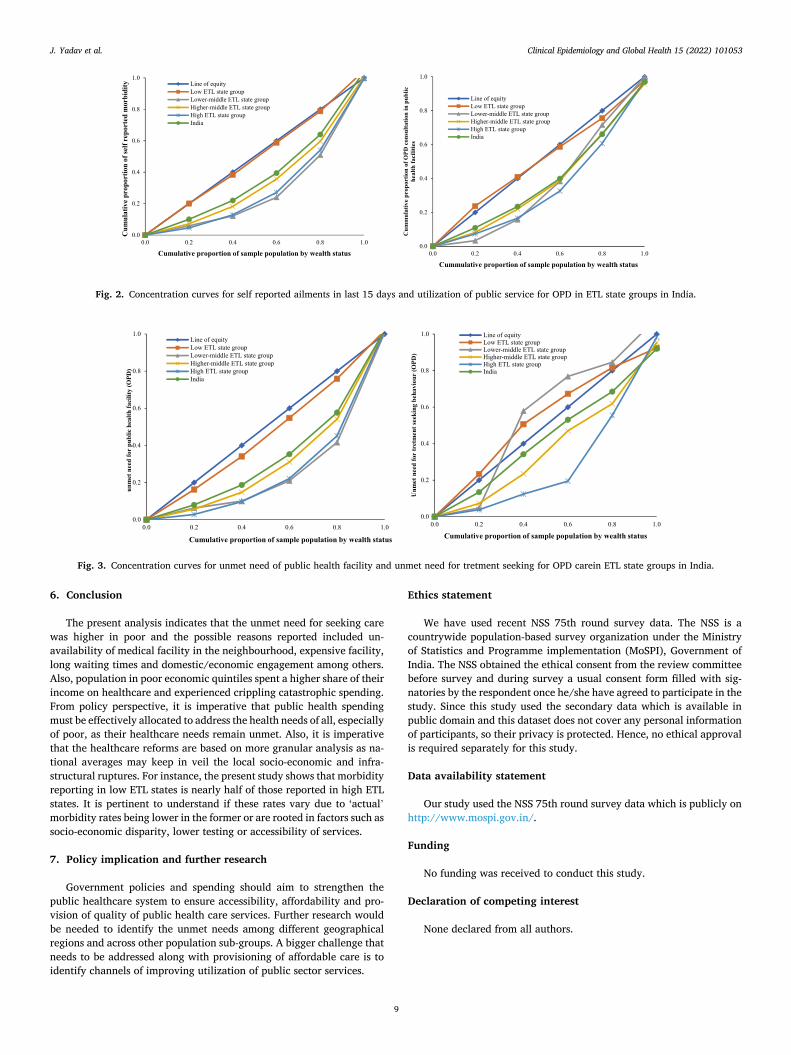
Fig. 1 shows the concentration curves for hospitalization rate and utilization of public service for hospitalization in ETL state groups in India while Fig. 2 shows the concentration curves for self-reported ail-ments in last 15 days and utilization of public service for OPD in ETL state groups in India and Fig. 3 shows the concentration curves for unmet need of public health facility and unmet need for treatment
seeking for OPD care in ETL state groups in India.
4. Discussion
In this study, we have performed Benefit Incidence Analysis using the latest nationally representative survey data (NSSO 75th round) con-ducted during July 2017–June 2018.18 This paper examines the in-equities in self-reported morbidity, health care service utilization, the impact of out-of-pocket expenditure on households, and use of public subsidy by patients, i.e., hospitalization in public health facilities, availing free ward in public health institutions during hospitalization and OPD consultation in public health facilities. As per our knowledge, very few studies have focused on health care inequality using BIA method in the Indian context. The strength of our study is derived from its use of a countrywide survey followed the standardized study design, covering all the states and union territories of India with a large sample size which offers generalizability to the study results. The inferences are strengthened by using statistical measures like equity ratio, concentra-tion indices, and concentration curve to capture the inequality in health care utilization. Our study indicates several notable findings.
First, self-reported morbidity rate was higher among richer in Low ETL state category, Lower-middle, and Higher-middle ETL state group. In
Table 2 Health status, Utilizations of health care service, Impact of Out-of-pocket expenditure on households and public subsidy targeting by sates of India NSS, 2017-18.
State and ETL groups
Self- reported morbidity
Hospitalization rate per episode
Unmet need for medical consultation (%)
Mean OOPE Hospitalization
Mean OOPE OPD
Hospitalization in public health facilities
Hospitalization in free ward in public health facilities
OPD in public health facilities
Low ETL state group Bihar 2.5 1.2 10.2 1340 1711 38.6 36.0 18.5 Jharkhand 6.7 1.4 8.9 2074 1880 43.2 41.5 26.9 Uttar Pradesh 7.5 2.3 2.8 2609 2042 27.8 25.9 14.1 Rajasthan 4.9 2.5 2.6 1796 2054 51.2 54.3 39.8 Meghalaya 0.4 1.7 0.0 564 1688 85.5 79.1 52.7 Assam 2.5 1.0 4.6 1601 1966 72.5 40.2 43.0 Chhattisgarh 5.0 2.0 2.7 2459 930 56.0 46.9 42.1 Madhya Pradesh 4.0 2.1 2.4 1536 2102 49.6 49.2 31.2 Odisha 9.4 3.3 3.2 1349 1228 72.9 72.2 56.8 Lower-middle ETL state group Arunachal
Pradesh 2.9 3.5 6.0 624 4478 93.2 73.8 90.9
Mizoram 3.4 2.8 11.6 697 1923 83.8 80.3 68.2 Nagaland 0.8 1.4 27.4 1021 2049 73.5 26.7 49.2 Uttarakhand 3.5 1.7 2.0 1985 1478 36.2 30.6 32.9 Gujrat 7.0 2.4 1.4 1648 1205 33.5 33.5 24.7 Tripura 3.1 5.4 7.7 699 4201 95.9 89.6 31.1 Sikkim 3.4 2.8 4.9 889 1560 79.9 78.9 52.0 Manipur 1.9 2.0 0.3 1802 2988 80.3 64.7 82.6 Higher-middle ETL state group Haryana 5.9 2.8 1.7 2042 1852 31.6 28.4 19.1 Delhi 6.0 3.2 2.1 1818 1972 62.7 61.1 44.3 Andhra Pradesh 16.3 3.8 1.7 1790 1194 28.6 31.0 21.9 Telangana 5.7 2.3 0.8 2517 1595 21.2 22.0 20.4 Jammu and
Kashmir 7.3 2.3 0.7 1038 1070 91.8 87.9 69.3
Karnataka 4.5 2.8 2.5 1669 1580 27.2 25.4 21.8 West Bengal 14.6 4.1 4.2 1588 1434 70.2 70.0 28.7 Maharashtra 9.1 3.1 2.1 2418 1471 23.1 21.7 25.2 Union territories
other than Delhi
6.1 2.8 0.7 2374 2386 70.3 60.6 56.6
High ETL state group Himachal
Pradesh 10.6 4.4 2.6 1854 1948 78.5 70.5 67.7
Punjab 11.4 3.0 2.5 2919 1541 30.9 20.4 14.5 Tamil Nadu 6.4 3.2 0.6 1788 1539 50.9 51.8 54.0 Goa 6.1 4.6 0.2 1337 1175 65.7 69.3 58.9 Kerala 29.3 10.2 0.5 1845 1204 39.8 36.6 47.5 India 7.9 2.8 2.6 1936 1565 43.2 41.5 30.1
NSS = National Sample Survey; ETL = Epidemiological transition level. OOPE=Out of pocket expenditure, OPD=Out patients department.
J. Yadav et al.
Clinical Epidemiology and Global Health 15 (2022) 101053
6
Table 3 Self-reported morbidity, hospitalizations and unmet need for health-care by income quintile in ETL state groups in India, NSS Social Consumption: Health Survey, 2017-18.
Characteristics Low ETL state group
Lower- middle ETL state group
Higher- middle ETL state group
High ETL state group
India
Self-reported morbidity OPD Poorest wealth
quintile 2299 (4.8)
148(4.3) 1114 (10.2)
532 (14.0)
4093 (6.0)
Poorer wealth quintile
2142 (4.9)
193(3.3) 1837(9.2) 906 (13.9)
5078 (6.5)
Middle wealth quintile
2268 (5.6)
388(4) 2925(9.5) 1570 (13.7)
7151 (7.6)
Richer wealth quintile
2278 (6.1)
642(6.3) 4191(9.4) 2865 (13.4)
9976 (8.7)
Richest wealth quintile
2780 (8.0)
1321(7.6) 7311 (10.7)
5401 (12.3)
16813 (10.2)
Total 11767 (5.6)
2692(5.9) 17378 (9.9)
11274 (13.0)
43111 (7.9)
Equity ratio (Q1: Q5)
0.60 0.57 0.95 1.14 0.59
Concentration index (95% CI)
0.107 0.148 0.027 − 0.028 0.110
Percentage of Hospitalization per episode Poorest wealth
quintile 4984 (1.71)
657(2.51) 1822 (3.96)
627 (7.24)
8090 (2.27)
Poorer wealth quintile
4146 (1.54)
914(1.9) 2607 (3.01)
1019 (5.14)
8686 (2.14)
Middle wealth quintile
4293 (1.89)
1468 (2.37)
3945 (3.15)
1609 (5.29)
11315 (2.62)
Richer wealth quintile
3822 (2.23)
2038 (2.18)
5269 (3.05)
2707 (4.07)
13836 (2.85)
Richest wealth quintile
4520 (3.09)
3271 (2.68)
8726 (3.12)
5340 (4.49)
21857 (3.38)
Total 21765 (1.93)
8348 (2.38)
22369 (3.17)
11302 (4.67)
63784 (2.7)
Equity ratio (Q1: Q5)
0.55 0.94 1.27 1.61 0.67
Concentration index (95% CI)
0.133 0.042 − 0.015 − 0.043 0.094
Unmet need for medical consultation (OPD)for public health facility (%) Poorest wealth
quintile 50.4 73.7 59.0 30.9 51.7
Poorer wealth quintile
59.3 33.8 56.8 44.9 56.1
Middle wealth quintile
65.1 49.3 64.4 47.0 61.6
Richer wealth quintile
66.0 56.2 63.6 47.6 59.8
Richest wealth quintile
66.6 77.9 75.2 62.0 70.3
Total 60.6 64.9 66.4 52.5 61.7 Equity ratio (Q1:
Q5) 0.76 0.95 0.78 0.50 0.73
Concentration index (95% CI)
0.051 0.099 0.054 0.087 0.055
Unmet need for treatment seeking (%) OPD Poorest wealth
quintile 4.5 1.5 3.0 0.7 3.7
Poorer wealth quintile
5.7 13.0 4.0 1.0 4.6
Middle wealth quintile
3.3 2.3 3.7 0.5 3.0
Richer wealth quintile
2.8 0.6 1.6 1.3 1.8
Richest wealth quintile
1.7 0.9 2.1 0.8 1.6
Total 3.8 1.8 2.6 0.9 2.6 Equity ratio (Q1:
Q5) 2.61 1.76 1.41 0.90 2.35
Concentration index (95% CI)
− 0.183 − 0.488 − 0.126 − 0.004 − 0.201
Table 4 Vertical equity in out-of-pocket hospitalization expenditures by income quintile in ETL state groups in India, NSS Social Consumption: Health Survey, 2017-18.
Characteristics Low ETL state group
Lower- middle ETL state group
Higher- middle ETL state group
High ETL state group
India
Monthly mean out of pocket expenditure due to hospitalization (INR) Poorest wealth
quintile 1340 885 1890 1163 1472
Poorer wealth quintile
1711 1321 1503 1335 1570
Middle wealth quintile
1868 975 1375 1598 1571
Richer wealth quintile
1986 1210 1595 1769 1713
Richest wealth quintile
2927 1922 2600 2332 2532
Total 1907 1452 1885 1903 1936 Average share of monthly income loss due to hospitalization on Households (%) Poorest wealth
quintile 21.3 12.7 31.6 15.3 23.2
Poorer wealth quintile
20.2 13.4 17.4 15.0 18.2
Middle wealth quintile
17.8 8.4 14.1 15.1 15.3
Richer wealth quintile
13.8 8.7 13.1 13.4 13.1
Richest wealth quintile
13.8 8.7 12.1 12.1 12.2
Total 16.5 9.0 14.0 13.0 14.2 Equity ratio (Q1:
Q5) 1.5 1.5 2.6 1.3 1.9
Percentage of households experiencing the CHE due to hospitalization (PHCE, approach)
Poorest wealth quintile
33.4 22.8 36.1 26.7 33.4
Poorer wealth quintile
28.1 11.6 24.2 19.9 25.2
Middle wealth quintile
24.9 11.4 17.4 18.9 20.2
Richer wealth quintile
22.3 10.5 13.8 15.9 16.3
Richest wealth quintile
16.2 10.7 12.8 11.2 12.9
Total 25.7 11.4 17.5 14.9 19.6 Equity ratio (Q1:
Q5) 2.1 2.1 2.8 2.4 2.6
Concentration index (95% CI)
− 0.129 − 0.080 − 0.161 − 0.143 − 0.180
Percentage of households faced the hardship financing due to OOPE for hospitalization
Poorest wealth quintile
580 (12.4)
41(3.6) 220(12) 100 (17.5)
941 (12.6)
Poorer wealth quintile
478 (13.4)
51(6.5) 357(13.2) 150 (15.3)
1036 (13.3)
Middle wealth quintile
452 (13.9)
69(4.4) 516(13.5) 231 (14.5)
1268 (13.3)
Richer wealth quintile
412(14) 77(5.1) 595(12.6) 350 (13.7)
1434 (12.7)
Richest wealth quintile
250(6.2) 87(3.4) 653(8.5) 545 (11.4)
1535 (8.5)
Total 2172 (12.1)
325(4.4) 2341 (11.5)
1376 (13.3)
6214 (11.7)
Equity ratio (Q1: Q5)
2.00 1.06 1.41 1.54 1.48
Monthly Mean outpatient’s care expenditure (INR) ‘ Poorest wealth
quintile 1507 1218 1114 743 1330
Poorer wealth quintile
1633 927 1201 1196 1405
Middle wealth quintile
1811 981 1149 1279 1414
Richer wealth quintile
2281 1170 1490 1404 1640
Richest wealth quintile
2375 1648 1743 1507 1782
(continued on next page)
J. Yadav et al.
Clinical Epidemiology and Global Health 15 (2022) 101053
7
contrast, High ETL state classification (CI = − 0.028) registered higher morbidity rates among the economically poor in last 15 days. Hospi-talization admissions were higher among the richer economic group in Low and Lower-middle ETL state groups while hospitalization rate is estimated to be higher for poor in Higher-middle and High ETL state classification. Findings show that unmet need for treatment seeking was more among poor population at national level as well as for all state categories for different reasons. The results of our study were found to be in consensus with an earlier study in the Indian context which found that the utilization of hospitals were more by richer population in three states, namely Haryana, Punjab and Chandigarh and poor faced higher unmet needs for health care seeking as compared to richer population.33
Second, besides the health care expenditure being higher among richest economic quintile, the poorest 20%faced a greater burden of income loss due to OOP spending, which indicates that poorest popu-lation were spending more as a proportion of their income across all the states groups. Due to higher out of pocket expenditure, households- especially those in poorest two quintiles-are in greater need of finan-cial risk protection. Finding suggests that the Low ETL states have higher CHE, while Lower-middle ETL states have lower CHE. As anticipated, CHE was found to be concentrated among the bottom 20% as exhibited from negative concentration indices for all the state classifications. Higher burden of income loss due to health care utilization, particularly, high cost of hospitalization poses financial barricades for the poor economic groups; the implications of which are often inter-generational.39,40
Third, the hospitalizations in public health facilities were higher among the poor and negative concentration indices exhibit a pro-poor distribution of benefits of public health facilities. As expected, results also confirm that admission in free ward in public health facilities during hospitalization has significant association with economic status, thereby showing that subsidies were used in higher proportion by poor expen-diture quintile population across all the state groups as the
concentration index values were negative. Poor benefited more from public health facilities, probably because they have constrained eco-nomic resources to afford care in a private healthcare institu-tion.4,23Furthermore, OPD consultations in public health facilities also had pro-poor distribution across all state categories as well as at all India level.
Fourth, in this study, we found that out of pocket expenditure due to the hospitalization was almost 6 times higher in private health facilities compared with public health institutions for all ETL state classifications. Existing literature shows similar results with mean out of pocket expenditure being 3–5 times higher in private health facilities.3,4,24,41
Not only OOP spending but also the average income loss due to hospi-talization was higher among those who sought care in a private facility and it varies across ETL state groups. Studies note higher cost of diag-nosis, medicine and comfort services for bed and other infrastructure
Table 4 (continued )
Characteristics Low ETL state group
Lower- middle ETL state group
Higher- middle ETL state group
High ETL state group
India
Total 1863 1357 1438 1375 1564 Average share of monthly income loss due to OPD care on Households (%) Poorest wealth
quintile 25.5 17.8 21.3 11.0 23.0
Poorer wealth quintile
19.7 8.4 15.5 12.6 16.9
Middle wealth quintile
17.5 8.7 12.4 12.0 14.2
Richer wealth quintile
18.2 8.9 12.0 11.0 13.1
Richest wealth quintile
12.2 7.7 8.2 7.7 8.7
Total 17.6 8.3 10.6 9.3 12.1 Percentage of households experiencing the CHE due to outpatient’s care (PHCE,
approach) Poorest wealth
quintile 37.8 28.8 26.1 20.1 33.8
Poorer wealth quintile
32.5 14.0 19.1 21.1 26.1
Middle wealth quintile
27.2 17.2 14.3 14.4 19.7
Richer wealth quintile
24.8 11.6 13.9 10.4 15.8
Richest wealth quintile
14.9 4.0 7.6 6.6 8.4
Total 28.9 9.5 13.5 10.5 18.4 Equity ratio (Q1:
Q5) 2.5 7.2 3.4 3.0 4.0
Concentration index (95% CI)
− 0.154 − 0.368 − 0.199 − 0.217 − 0.242
OOPE = out of pocket expenditure, PHCE=Per capita household’s consumption expenditure, CHE = Catastrophic Health expenditure.
Table 5 Targeting of public subsidy for health care in ETL state groups in India, NSS Social Consumption: Health Survey, 2017-18.
Characteristics Low ETL state group
Lower- middle ETL state group
Higher- middle ETL state group
High ETL state group
India
Hospitalization in public health facilities Poorest wealth
quintile 2798 (53.6)
541(75) 955(54.4) 355 (60.4)
4649 (55)
Poorer wealth quintile
2047 (46.2)
706(60.1) 1378 (50.1)
548(56) 4679 (49.4)
Middle wealth quintile
1990 (43.9)
1085 (61.7)
1865 (47.1)
870(54) 5810 (47.7)
Richer wealth quintile
1599 (38.8)
1359 (53.7)
2316 (43.1)
1360 (47.1)
6634 (43.6)
Richest wealth quintile
1494 (29.9)
1609(25) 2666 (27.3)
1805 (34.9)
7574 (30)
Total 9928 (43.5)
5300 (45.5)
9180 (41.2)
4938 (44.6)
29346 (42.9)
Equity ratio (Q1: Q5)
1.79 3.00 1.99 1.73 1.83
Concentration index (95% CI)
− 0.104 − 0.209 − 0.133 − 0.110 − 0.117
Hospitalization in free ward in public health facilities Poorest wealth
quintile 2594 (50.6)
477(69.5) 931(53.6) 324 (55.9)
4326 (52.4)
Poorer wealth quintile
1855 (45.3)
596(53.9) 1334 (49.5)
514 (54.1)
4299 (48.3)
Middle wealth quintile
1785 (41.5)
938(57.6) 1810 (46.2)
825(53) 5358 (46.1)
Richer wealth quintile
1470 (37.0)
1174 (51.4)
2264 (42.8)
1250 (43.9)
6158 (42.1)
Richest wealth quintile
1370 (28.8)
1423 (23.6)
2526 (26.8)
1676 (32.3)
6995 (28.6)
Total 9074 (41.6)
4608 (42.7)
8865 (40.6)
4589 (42)
27136 (41.3)
Equity ratio (Q1: Q5)
1.76 2.94 2.00 1.73 1.83
Concentration index (95% CI)
− 0.103 − 0.207 − 0.134 − 0.115 − 0.118
OPD consultation in public health facilities Poorest wealth
quintile 710 (33.8)
82(18.7) 379(34.4) 313 (68.2)
1484 (36.9)
Poorer wealth quintile
575 (25.8)
112(49.2) 595(35) 409 (52.1)
1691 (33.3)
Middle wealth quintile
559 (24.1)
166(42.7) 899(27.1) 736 (51.4)
2360 (30.4)
Richer wealth quintile
524 (22.4)
244(36.8) 1204 (30.3)
1270 (49.3)
3242 (33.8)
Richest wealth quintile
588 (23.5)
342(15.1) 1512(18) 1703 (34.1)
4145 (23.2)
Total 2956 (26.3)
946(26.8) 4589 (26.4)
4431 (44.5)
12922 (30.1)
Equity ratio (Q1: Q5)
1.44 1.23 1.91 2.00 1.59
Concentration index (95% CI)
− 0.069 − 0.217 − 0.128 − 0.113 − 0.084
J. Yadav et al.
Clinical Epidemiology and Global Health 15 (2022) 101053
8
explain higher OOP spending in a private medical institution.5,42,43
Analysis also shows that the average share of monthly income loss due to out-of-pocket expenditure was higher in Low ETL state group (17.4%) whereas it was lower in Lower-middle ETL state group (9.5%).
Fifth, almost 12% patients reported facing financial hardship to seek inpatient care as the ensuing expenditure was financed through borrowing and selling of household assets/jewellery and hardship financing was nearly twice among patients who had taken the treatment in a private hospital. There are very limited studies that talk about hardship financing. A study done by Tahsina, Tet al. (2018) in Vietnam found that households were economically vulnerable post seeking treatment in private health care facilities.44 Similarly, a recent study in the Indian context highlighted the burden of inpatient care financing among social and economically deprived classes and found greater reliance of such population sub-groups on hardship financing if the care was sought in a private facility.24,45–50 Our study also indicates that a greater proportion of patients who took treatment in a private hospital relied on borrowing/selling assets for meeting inpatient care expendi-ture while OPD expenses were met largely using income and savings. The present paper also finds that Low ETL states faced higher percentage of catastrophic expenditure, whereas, Lower-middle ETL states had lower catastrophic expenditure. Poorest economic class registered higher CHE with pro-poor distribution at all India level along with all the state categories. Concentration index values were found to be negative for both hospitalization and outpatient care and the magnitude was further higher if private health facilities were chosen for treatment.
Finally, self-reported morbidity and hospitalization rates had a pro- rich distribution and this indicates that due to high costs the utiliza-tion of health care services by poor were relatively low, especially for hospitalization care services. In case of the unmet need for treatment seeking, it shows pro-poor distribution for different reasons and higher treatment cost emerged as one of the most crucial reasons. Despite the higher spending on treatment by rich, the CHE is pro-poor and also poorest quintile faced relatively higher burden of income loss.
5. Limitation of the study
Despite contributing significantly to the existing literature, this study has some limitations. First, recall bias is a major limitation for any expenditure data. Second, the data does not provide information on the amounts secured via various source of financing, therefore the amount of hardship financing could not be measured. Third, our study does not analyze the indirect cost of wage loss of patients and care givers due to non-availability of data. Even with these limitations, our study has been able to yield policy relevant insights on the extent of inequality in health care system.
Table 6 Out-of-pocket expenditure by health facility in ETL state groups in India, NSS Social Consumption: Health Survey, 2017-18.
Characteristics Low ETL state group
Lower- middle ETL state group
Higher- middle ETL state group
High ETL state group
India
Monthly mean out of pocket expenditure due hospitalization (INR) Public health
facility 677 404 469 538 553
Private health facility
3039 2450 2966 3083 2988
Total 2003 1520 1928 1947 1936 Average share of monthly income loss due to hospitalizationon Households (%) Public health
facility 6.8 3.2 4.2 4.2 5.0
Private health facility
23.8 13.0 19.8 19.1 20.4
Total 17.4 9.5 14.4 13.3 14.7 Percentage of households experiencing the CHE due to hospitalization (PHCE,
approach) Public health
facility 6.4 2.2 2.9 2.8 4.1
Private health facility
39.9 18.9 27.0 24.0 30.5
Total 25.7 11.4 17.5 14.9 19.6 Percentage of households faced the hardship financing due to hospitalization care
expenditure Public health
facility 8.9 3.1 5.2 11.4 7.7
Private health facility
15.7 6.0 16.1 15.0 15.3
Total 12.8 4.7 11.6 13.4 12.0 Monthly mean out of pocket expenditure due to outpatient’s care (INR) Public health
facility 1637 861 806 682 996
Private health facility
2326 1668 1798 2048 2007
Total 2145 1452 1536 1440 1702 Average share of monthly income loss due to OPD care on Households (%) Public health
facility 17.0 6.8 6.9 5.3 8.6
Private health facility
20.5 9.0 12.3 12.6 14.3
Total 19.7 8.5 11.1 9.8 12.8 Percentage of households experiencing the CHE due to outpatient’s care (PHCE,
approach) Public health
facility 25.9 9.9 8.7 5.9 13.4
Private health facility
35.5 9.7 17.0 14.4 22.7
Total 33.0 9.7 14.8 10.9 20.0
OOPE = out of pocket expenditure, PHCE=Per capita household’s consumption expenditure, CHE = Catastrophic Health expenditure.
Fig. 1. Concentration curves for hospitalization rate and utilization of public service for hospitalization in ETL state groups in India.
J. Yadav et al.
Clinical Epidemiology and Global Health 15 (2022) 101053
9
6. Conclusion
The present analysis indicates that the unmet need for seeking care was higher in poor and the possible reasons reported included un-availability of medical facility in the neighbourhood, expensive facility, long waiting times and domestic/economic engagement among others. Also, population in poor economic quintiles spent a higher share of their income on healthcare and experienced crippling catastrophic spending. From policy perspective, it is imperative that public health spending must be effectively allocated to address the health needs of all, especially of poor, as their healthcare needs remain unmet. Also, it is imperative that the healthcare reforms are based on more granular analysis as na-tional averages may keep in veil the local socio-economic and infra-structural ruptures. For instance, the present study shows that morbidity reporting in low ETL states is nearly half of those reported in high ETL states. It is pertinent to understand if these rates vary due to ‘actual’ morbidity rates being lower in the former or are rooted in factors such as socio-economic disparity, lower testing or accessibility of services.
7. Policy implication and further research
Government policies and spending should aim to strengthen the public healthcare system to ensure accessibility, affordability and pro-vision of quality of public health care services. Further research would be needed to identify the unmet needs among different geographical regions and across other population sub-groups. A bigger challenge that needs to be addressed along with provisioning of affordable care is to identify channels of improving utilization of public sector services.
Ethics statement
We have used recent NSS 75th round survey data. The NSS is a countrywide population-based survey organization under the Ministry of Statistics and Programme implementation (MoSPI), Government of India. The NSS obtained the ethical consent from the review committee before survey and during survey a usual consent form filled with sig-natories by the respondent once he/she have agreed to participate in the study. Since this study used the secondary data which is available in public domain and this dataset does not cover any personal information of participants, so their privacy is protected. Hence, no ethical approval is required separately for this study.
Data availability statement
Our study used the NSS 75th round survey data which is publicly on http://www.mospi.gov.in/.
Funding
No funding was received to conduct this study.
Declaration of competing interest
None declared from all authors.
Fig. 2. Concentration curves for self reported ailments in last 15 days and utilization of public service for OPD in ETL state groups in India.
Fig. 3. Concentration curves for unmet need of public health facility and unmet need for tretment seeking for OPD carein ETL state groups in India.
J. Yadav et al.
Clinical Epidemiology and Global Health 15 (2022) 101053
10
Acknowledgment
The present study used National Sample Survey (NSS 75th round) data. The authors thankfully acknowledge members of the study field team and also acknowledge all the respondent for their active partici-pation in this study.
References
1 O’Donnell O, van Doorslaer E, Wagstaff A, Lindelow M. Analyzing Health Equity Using Household Survey Data. The World Bank; 2007.
2 Khan JAM, Ahmed S, MacLennan M, Sarker AR, Sultana M, Rahman H. Benefit incidence analysis of healthcare in Bangladesh - equity matters for universal health coverage. Health Pol Plann. 2017;32:359–365. https://doi.org/10.1093/heapol/ czw131.
3 Yadav J, John D, Menon G. Out of pocket expenditure on tuberculosis in India: do households face hardship financing? Indian J Tubercul. 2019;66:448–460. https:// doi.org/10.1016/j.ijtb.2019.02.016.
4 Kumar K, Singh A, Kumar S, et al. Socio-economic differentials in impoverishment effects of out-of-pocket health expenditure in China and India: evidence from WHO SAGE. PLoS One. 2015;10:1–19. https://doi.org/10.1371/journal.pone.0135051.
5 Tripathy JP, Prasad BM, Shewade HD, et al. Cost of hospitalisation for non- communicable diseases in India: are we pro-poor? Trop Med Int Health. 2016;21: 1019–1028. https://doi.org/10.1111/tmi.12732.
6 Saikia N, Jasilionis D, Ram F, Shkolnikov VM. Trends and geographic differentials in mortality under age 60 in India. https://doi.org/10.1080/00324728.2010.534642; 2011, 65,73-89.
7 Goli S, Arokiasamy P. Trends in health and health inequalities among major states of India: assessing progress through convergence models. Health Econ Pol Law. 2014;9: 143–168. https://doi.org/10.1017/S1744133113000042.
8 Sethi SP. An Uncertain Glory: India and its Contradictions, by Jean Dreze and Amartya Sen. Princeton, NJ: Princeton University Press; 2013:448. https://doi.org/10.1017/ BEQ.2015.5. ISBN 978-0691160795. Bus Ethics Q. 25, 275–278 (2015).
9 Yadav S, Arokiasamy P. Understanding epidemiological transition in India. Glob Health Action. 2014;7. https://doi.org/10.3402/GHA.V7.23248.
10 James KS. India’s demographic change: opportunities and challenges. Science (80-). 2011;333:576–580. https://doi.org/10.1126/SCIENCE.1207969.
11 Saurman E. Improving access: modifying penchansky and thomas’s theory of access. J Health Serv Res Pol. 2016;21:36–39. https://doi.org/10.1177/1355819615600001.
12 Pannarunothai S, Mills A. The poor pay more: health-related inequality in Thailand. Soc Sci Med. 1997;44:1781–1790. https://doi.org/10.1016/S0277-9536(96)00287- 0.
13 Mooney GH. Equity in health care: confronting the confusion. Effect Health Care. 1983;1:179–185.
14 Culyer AJ, Wagstaff A. Equity and equality in health and health care. J Health Econ. 1993;12:431–457. https://doi.org/10.1016/0167-6296(93)90004-X.
15 Asante A, Price J, Hayen A, Jan S, Wiseman V. Equity in Health care financing in low- and middle-income countries: a systematic review of evidence from studies using benefit and financing incidence analyses. PLoS One. 2016;11. https://doi.org/ 10.1371/journal.pone.0152866.
16 Malik SM, Ashraf N. Equity in the use of public services for mother and newborn child health care in Pakistan: a utilization incidence analysis. Int J Equity Health. 2016;15:120. https://doi.org/10.1186/s12939-016-0405-x.
17 Bowser D, Patenaude B, Bhawalkar M, Duran D, Berman P. Benefit incidence analysis in public health facilities in India: utilization and benefits at the national and state levels. Int J Equity Health. 2019;18:13. https://doi.org/10.1186/s12939-019-0921-6.
18 Government of India. Key indicators of social consumption in India: Health. Natl Sample Surv Organ. 2019;1–99.
19 International Institute for Population Sciences and Macro International. National Family Health Survey (NFHS-3). 2005-06. India).
20 International Institute for Population Sciences and Macro International. National Family Health Survey (NFHS-4). 2015-2016. India.
21 Dilip TR. Age-specific Analysis of Reported Morbidity in Kerala, India. vol. 9. World Health Popul; 2007:98–108. https://doi.org/10.12927/whp.2007.19527.
22 Gumber A, Berman P. Measurement and pattern of morbidity and the utilization of health services: some emerging issues from recent health interview surveys in India. J Health Popul Dev Ctries. 1997;1:16–43. https://doi.org/10.12927/whp..17484.
23 Prinja S, Kanavos P, Kumar R. Health care inequities in north India: role of public sector in universalizing health care. Indian J Med Res. 2012;136:421–431.
24 Kastor A, Mohanty SK. Disease-specific out-of-pocket and catastrophic health expenditure on hospitalization in India: do Indian households face distress health financing? PLoS One. 2018;13. https://doi.org/10.1371/journal.pone.0196106.
25 Joe W, Rajpal S. Unravelling the socioeconomic gradient in the incidence of catastrophic health care expenditure: a comment. Health Pol Plann. 2018;33: 699–701. https://doi.org/10.1093/heapol/czy026.
26 Yadav J, Menon GR, John D. Disease-specific out-of-pocket payments, catastrophic health expenditure and impoverishment effects in India: an analysis of national health survey data. Appl Health Econ Health Pol. 2021. https://doi.org/10.1007/ s40258-021-00641-9.
27 Mitra S, Findley PA, Rd EF, Hall D. Department of Economics Discussion Paper Series Healthcare Expenditures of Living with a Disability : Total Expenditures , Out of Pocket Expenses and Burden , 1996-2004 Discussion Paper No : 2008-18 September 2008 (Updated : February 2009) Fordham Unive. 2008. 2009.
28 Sahoo AK, Madheswaran S. Socio-economic disparities in health care seeking behaviour, health expenditure and its source of financing in Orissa. J Health Manag. 2014;16:397–414. https://doi.org/10.1177/0972063414539614.
29 Ghatak A, Madheswaran S. Burden of Income Loss Due to Ailment in India : Evidence from NSS Data. 2011.
30 Yadav J, John D, Menon G. Out of pocket expenditure on tuberculosis in India: do households face hardship financing? Indian J Tubercul. 2019;66:448–460. https:// doi.org/10.1016/j.ijtb.2019.02.016.
31 John D, Kumar V. Exposure to hardship financing for healthcare among rural poor in Chhattisgarh, India. J Health Manag. 2017;19:387–400. https://doi.org/10.1177/ 0972063417717879.
32 Pandey A, Anil Kumar G, Dandona R, Dandona L. Variations in catastrophic health expenditure across the states of India: 2004 to 2014. PLoS One. 2018;13:1–15. https://doi.org/10.1371/journal.pone.0205510.
33 Dandona L, et al. Nations within a nation: variations in epidemiological transition across the states of India, 1990–2016 in the Global Burden of Disease Study. Lancet. 2017;390:2437–2460. https://doi.org/10.1016/S0140-6736(17)32804-0.
34 Sangar S, Dutt V, Thakur R. Comparative assessment of economic burden of disease in relation to out of pocket expenditure. Front Public Health. 2019;7:9. https://doi. org/10.3389/fpubh.2019.00009.
35 Appleton S, Emwanu T, Kagugube J, Muwonge J. Changes in Poverty in Uganda, 1992- 1997. CSAE Work Pap Ser; 1999.
36 Levine S. Exploring differences in national and international poverty estimates: is Uganda on track to Halve poverty by 2015? Soc Indicat Res. 2012;107:331–349. https://doi.org/10.1007/s11205-011-9851-4.
37 Kwesiga B, Zikusooka CM, Ataguba JE. Assessing catastrophic and impoverishing effects of health care payments in Uganda. BMC Health Serv Res. 2015;15:30. https:// doi.org/10.1186/s12913-015-0682-x.
38 Wagstaff A, Paci P, van Doorslaer E. On the measurement of inequalities in health. Soc Sci Med. 1991;33:545–557. https://doi.org/10.1016/0277-9536(91)90212-U.
39 Purohit BC. Inter-state disparities in health care and financial burden on the poor in India. J Health Soc Pol. 2004;18:37–60. https://doi.org/10.1300/J045v18n03_03.
40 Pillai RK, Williams SV, Glick HA, Polsky D, Berlin JA, Lowe RA. Factors affecting decisions to seek treatment for sick children in Kerala, India. Soc Sci Med. 2003;57: 783–790. https://doi.org/10.1016/S0277-9536(02)00448-3.
41 Saikia N, Moradhvaj, Bora JK. Gender difference in health-care expenditure: evidence from India human development survey. PLoS One. 2016;11:1–15. https:// doi.org/10.1371/journal.pone.0158332.
42 Reddy US, Yadav J. Socioeconomic disparities in hospitalization rate and treatment seeking behavior of major morbidity in India (evidence from a nationally representative panel survey). Demogr India. 2016;45(1 and 2). January-December 2016.
43 Moradhvaj, Saikia N. Gender disparities in health care expenditures and financing strategies (HCFS) for inpatient care in India. SSM - Popul Heal. 2019;9, 100372. https://doi.org/10.1016/j.ssmph.2019.100372.
44 Tahsina T, Ali NB, Siddique MAB, et al. Determinants of hardship financing in coping with out of pocket payment for care seeking of under five children in selected rural areas of Bangladesh. PLoS One. 2018;13, e0196237. https://doi.org/10.1371/ journal.pone.0196237.
45 Manchanda N, Rahut DB. Inpatient healthcare financing strategies: evidence from India. Eur J Dev Res. 2020;1–39. https://doi.org/10.1057/S41287-020-00312-W, 2020.
46 Yadav J, John D, Menon GR, Allarakha S. Out-of-Pocket payments for delivery care in India: do households face hardship financing? J Health Manag. 2021;23:197–225. https://doi.org/10.1177/09720634211011552.
47 Yadav J, Allarakha S, Menon GR, John D, Nair S. Socioeconomic impact of hospitalization expenditure for treatment of noncommunicable diseases in India: a repeated cross-sectional analysis of national sample survey data, 2004 to 2018. Value Heal Reg Issues. 2021;24:199–213. https://doi.org/10.1016/j.vhri.2020.12.010.
48 Yadav J, John D, Menon G. Out of pocket expenditure on tuberculosis in India: do households face hardship financing? Indian J Tubercul. 2019;66:448–460. https:// doi.org/10.1016/j.ijtb.2019.02.016.
49 Kumar K, Singh A, Kumar S, et al. Socio-economic differentials in impoverishment effects of out-of-pocket health expenditure in China and India: evidence from WHO SAGE. PLoS One. 2015;10, e0135051. https://doi.org/10.1371/journal. pone.0135051.
50 Kwesiga B, Zikusooka CM, Ataguba JE. Assessing catastrophic and impoverishing effects of health care payments in Uganda. BMC Health Serv Res. 2015;15:30. https:// doi.org/10.1186/s12913-015-0682-x.
J. Yadav et al.
Copyright © 2022 FDOKUMEN