Has the COVID-19 Pandemic Affected Mathematics ... - MDPI
23
Citation: Žnidaršiˇ c, A.; Brezavšˇ cek, A.; Rus, G.; Jerebic, J. Has the COVID-19 Pandemic Affected Mathematics Achievement? A Case Study of University Students in Social Sciences. Mathematics 2022, 10, 2314. https://doi.org/10.3390/ math10132314 Academic Editor: Jay Jahangiri Received: 21 April 2022 Accepted: 29 June 2022 Published: 1 July 2022 Publisher’s Note: MDPI stays neutral with regard to jurisdictional claims in published maps and institutional affil- iations. Copyright: © 2022 by the authors. Licensee MDPI, Basel, Switzerland. This article is an open access article distributed under the terms and conditions of the Creative Commons Attribution (CC BY) license (https:// creativecommons.org/licenses/by/ 4.0/). mathematics Article Has the COVID-19 Pandemic Affected Mathematics Achievement? A Case Study of University Students in Social Sciences Anja Žnidaršiˇ c 1 , Alenka Brezavšˇ cek 1 , Gregor Rus 1,2 and Janja Jerebic 1,3, * 1 Faculty of Organizational Sciences, University of Maribor, SI-4000 Kranj, Slovenia; [email protected] (A.Ž.); [email protected] (A.B.); [email protected] (G.R.) 2 Institute of Mathematics, Physics and Mechanics, SI-1000 Ljubljana, Slovenia 3 Faculty of Natural Sciences and Mathematics, University of Maribor, SI-2000 Maribor, Slovenia * Correspondence: [email protected] Abstract: This study examines the effects of COVID-19-related measures on the mathematics achieve- ment of university students in social sciences in Slovenia. Our particular concern was to compare two student populations (pre-pandemic and pandemic) in terms of factors affecting student perfor- mance in mathematics courses. Data were collected over nine consecutive academic years (from 2013–2014 to 2020–2021) and analyzed using two-stage structural equation modelling (SEM). The analyses confirmed that the conceptual model developed before the pandemic was applicable during the pandemic period. For both populations (pre-pandemic and pandemic), mathematics confidence, perceived level of math anxiety, background knowledge from secondary school, and self-engagement in mathematics courses at university were confirmed as factors influencing mathematics achievement. Moreover, both populations perceived the effects of the factors in the same way, and the magnitude of the effects is comparable. The rather high values of determination coefficient for mathematics achieve- ment (greater than 0.66 for both student populations) indicate that the variables “Perceived Level of Math Anxiety” and “Self-Engagement in Mathematics Course at University” together explain a significant proportion of the total variance before and during the pandemic. Consequently, the results of our case study indicated that pandemic measures did not have a significant impact on our students’ mathematics achievement. Although a more in-depth study of a broader sample of academic courses would be needed to confirm our findings, our experience indicates that mathematics courses at the tertiary level of education can be successfully delivered online. Keywords: COVID-19; mathematics achievement; university students; social sciences; pre-pandemic population; pandemic population; comparison; multi-group structural equation modeling (MG-SEM) MSC: 97D60 1. Introduction Since the spring of 2020, the literature addressing adjustments to and consequences of COVID-19-related school closures at different educational levels has expanded rapidly. The sudden transition to distance learning and the period of its implementation affected all aspects of students’ lives. They faced social, psychological, and educational challenges [1–5]. In this paper, we will look at the impact of the COVID-19 pandemic on educational outcomes, or, more specifically, student achievement in mathematics. A review by Hammer- stein et al. [6] provides a selection of studies at the primary and secondary education levels with comparative analyses of student achievement before and after COVID-19-related school closures. Among numerous studies published up to the end of April 2021, the authors chose only those (11 studies) that included applied statistical analyses rather than solely reporting percentages and analyzed them in detail. Most of these studies revealed Mathematics 2022, 10, 2314. https://doi.org/10.3390/math10132314 https://www.mdpi.com/journal/mathematics
-
Upload
khangminh22 -
Category
Documents
-
view
0 -
download
0
Transcript of Has the COVID-19 Pandemic Affected Mathematics ... - MDPI
Citation: Žnidaršic, A.; Brezavšcek,
A.; Rus, G.; Jerebic, J. Has the
COVID-19 Pandemic Affected
Mathematics Achievement? A Case
Study of University Students in
Social Sciences. Mathematics 2022, 10,
2314. https://doi.org/10.3390/
math10132314
Academic Editor: Jay Jahangiri
Received: 21 April 2022
Accepted: 29 June 2022
Published: 1 July 2022
Publisher’s Note: MDPI stays neutral
with regard to jurisdictional claims in
published maps and institutional affil-
iations.
Copyright: © 2022 by the authors.
Licensee MDPI, Basel, Switzerland.
This article is an open access article
distributed under the terms and
conditions of the Creative Commons
Attribution (CC BY) license (https://
creativecommons.org/licenses/by/
4.0/).
mathematics
Article
Has the COVID-19 Pandemic Affected MathematicsAchievement? A Case Study of University Students inSocial SciencesAnja Žnidaršic 1 , Alenka Brezavšcek 1 , Gregor Rus 1,2 and Janja Jerebic 1,3,*
1 Faculty of Organizational Sciences, University of Maribor, SI-4000 Kranj, Slovenia;[email protected] (A.Ž.); [email protected] (A.B.); [email protected] (G.R.)
2 Institute of Mathematics, Physics and Mechanics, SI-1000 Ljubljana, Slovenia3 Faculty of Natural Sciences and Mathematics, University of Maribor, SI-2000 Maribor, Slovenia* Correspondence: [email protected]
Abstract: This study examines the effects of COVID-19-related measures on the mathematics achieve-ment of university students in social sciences in Slovenia. Our particular concern was to comparetwo student populations (pre-pandemic and pandemic) in terms of factors affecting student perfor-mance in mathematics courses. Data were collected over nine consecutive academic years (from2013–2014 to 2020–2021) and analyzed using two-stage structural equation modelling (SEM). Theanalyses confirmed that the conceptual model developed before the pandemic was applicable duringthe pandemic period. For both populations (pre-pandemic and pandemic), mathematics confidence,perceived level of math anxiety, background knowledge from secondary school, and self-engagementin mathematics courses at university were confirmed as factors influencing mathematics achievement.Moreover, both populations perceived the effects of the factors in the same way, and the magnitude ofthe effects is comparable. The rather high values of determination coefficient for mathematics achieve-ment (greater than 0.66 for both student populations) indicate that the variables “Perceived Levelof Math Anxiety” and “Self-Engagement in Mathematics Course at University” together explain asignificant proportion of the total variance before and during the pandemic. Consequently, the resultsof our case study indicated that pandemic measures did not have a significant impact on our students’mathematics achievement. Although a more in-depth study of a broader sample of academic courseswould be needed to confirm our findings, our experience indicates that mathematics courses at thetertiary level of education can be successfully delivered online.
Keywords: COVID-19; mathematics achievement; university students; social sciences; pre-pandemicpopulation; pandemic population; comparison; multi-group structural equation modeling (MG-SEM)
MSC: 97D60
1. Introduction
Since the spring of 2020, the literature addressing adjustments to and consequences ofCOVID-19-related school closures at different educational levels has expanded rapidly. Thesudden transition to distance learning and the period of its implementation affected all aspectsof students’ lives. They faced social, psychological, and educational challenges [1–5].
In this paper, we will look at the impact of the COVID-19 pandemic on educationaloutcomes, or, more specifically, student achievement in mathematics. A review by Hammer-stein et al. [6] provides a selection of studies at the primary and secondary education levelswith comparative analyses of student achievement before and after COVID-19-relatedschool closures. Among numerous studies published up to the end of April 2021, theauthors chose only those (11 studies) that included applied statistical analyses rather thansolely reporting percentages and analyzed them in detail. Most of these studies revealed
Mathematics 2022, 10, 2314. https://doi.org/10.3390/math10132314 https://www.mdpi.com/journal/mathematics
Mathematics 2022, 10, 2314 2 of 23
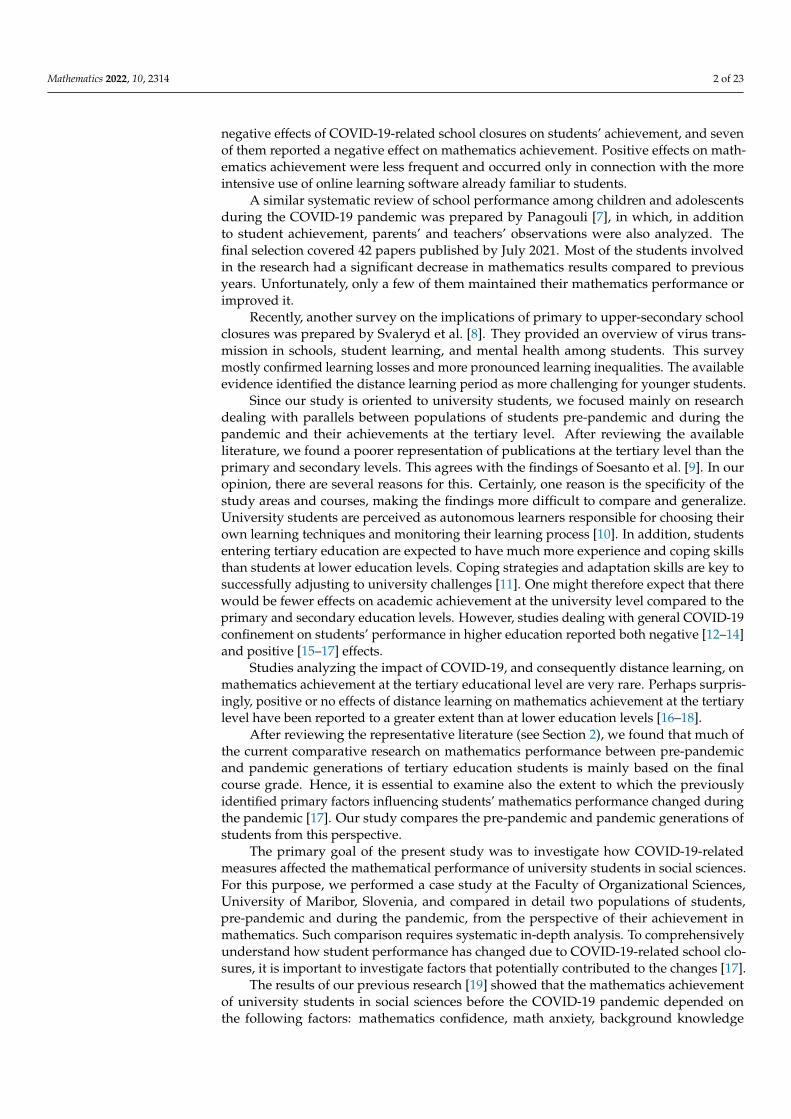
negative effects of COVID-19-related school closures on students’ achievement, and sevenof them reported a negative effect on mathematics achievement. Positive effects on math-ematics achievement were less frequent and occurred only in connection with the moreintensive use of online learning software already familiar to students.
A similar systematic review of school performance among children and adolescentsduring the COVID-19 pandemic was prepared by Panagouli [7], in which, in additionto student achievement, parents’ and teachers’ observations were also analyzed. Thefinal selection covered 42 papers published by July 2021. Most of the students involvedin the research had a significant decrease in mathematics results compared to previousyears. Unfortunately, only a few of them maintained their mathematics performance orimproved it.
Recently, another survey on the implications of primary to upper-secondary schoolclosures was prepared by Svaleryd et al. [8]. They provided an overview of virus trans-mission in schools, student learning, and mental health among students. This surveymostly confirmed learning losses and more pronounced learning inequalities. The availableevidence identified the distance learning period as more challenging for younger students.
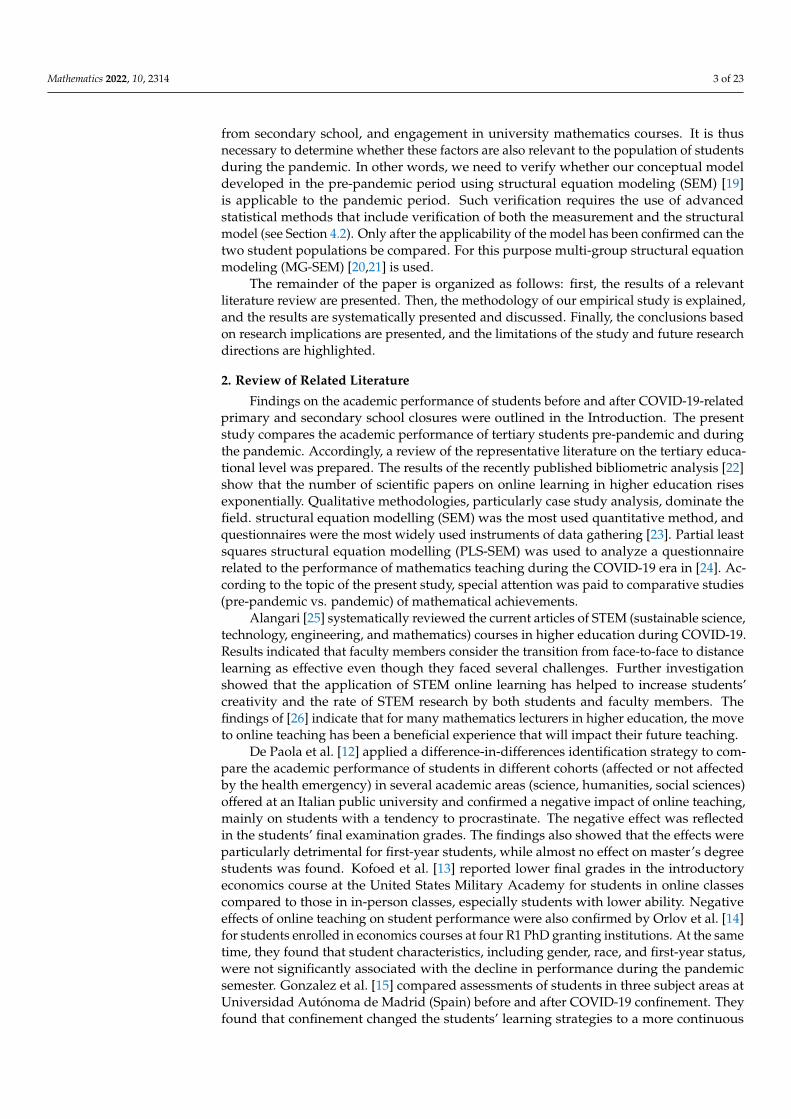
Since our study is oriented to university students, we focused mainly on researchdealing with parallels between populations of students pre-pandemic and during thepandemic and their achievements at the tertiary level. After reviewing the availableliterature, we found a poorer representation of publications at the tertiary level than theprimary and secondary levels. This agrees with the findings of Soesanto et al. [9]. In ouropinion, there are several reasons for this. Certainly, one reason is the specificity of thestudy areas and courses, making the findings more difficult to compare and generalize.University students are perceived as autonomous learners responsible for choosing theirown learning techniques and monitoring their learning process [10]. In addition, studentsentering tertiary education are expected to have much more experience and coping skillsthan students at lower education levels. Coping strategies and adaptation skills are key tosuccessfully adjusting to university challenges [11]. One might therefore expect that therewould be fewer effects on academic achievement at the university level compared to theprimary and secondary education levels. However, studies dealing with general COVID-19confinement on students’ performance in higher education reported both negative [12–14]and positive [15–17] effects.
Studies analyzing the impact of COVID-19, and consequently distance learning, onmathematics achievement at the tertiary educational level are very rare. Perhaps surpris-ingly, positive or no effects of distance learning on mathematics achievement at the tertiarylevel have been reported to a greater extent than at lower education levels [16–18].
After reviewing the representative literature (see Section 2), we found that much ofthe current comparative research on mathematics performance between pre-pandemicand pandemic generations of tertiary education students is mainly based on the finalcourse grade. Hence, it is essential to examine also the extent to which the previouslyidentified primary factors influencing students’ mathematics performance changed duringthe pandemic [17]. Our study compares the pre-pandemic and pandemic generations ofstudents from this perspective.
The primary goal of the present study was to investigate how COVID-19-relatedmeasures affected the mathematical performance of university students in social sciences.For this purpose, we performed a case study at the Faculty of Organizational Sciences,University of Maribor, Slovenia, and compared in detail two populations of students,pre-pandemic and during the pandemic, from the perspective of their achievement inmathematics. Such comparison requires systematic in-depth analysis. To comprehensivelyunderstand how student performance has changed due to COVID-19-related school clo-sures, it is important to investigate factors that potentially contributed to the changes [17].
The results of our previous research [19] showed that the mathematics achievementof university students in social sciences before the COVID-19 pandemic depended onthe following factors: mathematics confidence, math anxiety, background knowledge
Mathematics 2022, 10, 2314 3 of 23
from secondary school, and engagement in university mathematics courses. It is thusnecessary to determine whether these factors are also relevant to the population of studentsduring the pandemic. In other words, we need to verify whether our conceptual modeldeveloped in the pre-pandemic period using structural equation modeling (SEM) [19]is applicable to the pandemic period. Such verification requires the use of advancedstatistical methods that include verification of both the measurement and the structuralmodel (see Section 4.2). Only after the applicability of the model has been confirmed can thetwo student populations be compared. For this purpose multi-group structural equationmodeling (MG-SEM) [20,21] is used.
The remainder of the paper is organized as follows: first, the results of a relevantliterature review are presented. Then, the methodology of our empirical study is explained,and the results are systematically presented and discussed. Finally, the conclusions basedon research implications are presented, and the limitations of the study and future researchdirections are highlighted.
2. Review of Related Literature
Findings on the academic performance of students before and after COVID-19-relatedprimary and secondary school closures were outlined in the Introduction. The presentstudy compares the academic performance of tertiary students pre-pandemic and duringthe pandemic. Accordingly, a review of the representative literature on the tertiary educa-tional level was prepared. The results of the recently published bibliometric analysis [22]show that the number of scientific papers on online learning in higher education risesexponentially. Qualitative methodologies, particularly case study analysis, dominate thefield. structural equation modelling (SEM) was the most used quantitative method, andquestionnaires were the most widely used instruments of data gathering [23]. Partial leastsquares structural equation modelling (PLS-SEM) was used to analyze a questionnairerelated to the performance of mathematics teaching during the COVID-19 era in [24]. Ac-cording to the topic of the present study, special attention was paid to comparative studies(pre-pandemic vs. pandemic) of mathematical achievements.
Alangari [25] systematically reviewed the current articles of STEM (sustainable science,technology, engineering, and mathematics) courses in higher education during COVID-19.Results indicated that faculty members consider the transition from face-to-face to distancelearning as effective even though they faced several challenges. Further investigationshowed that the application of STEM online learning has helped to increase students’creativity and the rate of STEM research by both students and faculty members. Thefindings of [26] indicate that for many mathematics lecturers in higher education, the moveto online teaching has been a beneficial experience that will impact their future teaching.
De Paola et al. [12] applied a difference-in-differences identification strategy to com-pare the academic performance of students in different cohorts (affected or not affectedby the health emergency) in several academic areas (science, humanities, social sciences)offered at an Italian public university and confirmed a negative impact of online teaching,mainly on students with a tendency to procrastinate. The negative effect was reflectedin the students’ final examination grades. The findings also showed that the effects wereparticularly detrimental for first-year students, while almost no effect on master’s degreestudents was found. Kofoed et al. [13] reported lower final grades in the introductoryeconomics course at the United States Military Academy for students in online classescompared to those in in-person classes, especially students with lower ability. Negativeeffects of online teaching on student performance were also confirmed by Orlov et al. [14]for students enrolled in economics courses at four R1 PhD granting institutions. At the sametime, they found that student characteristics, including gender, race, and first-year status,were not significantly associated with the decline in performance during the pandemicsemester. Gonzalez et al. [15] compared assessments of students in three subject areas atUniversidad Autónoma de Madrid (Spain) before and after COVID-19 confinement. Theyfound that confinement changed the students’ learning strategies to a more continuous
Mathematics 2022, 10, 2314 4 of 23
habit, improving their efficiency. Therefore, the significant positive effect of COVID-19confinement on student performance was not surprising.
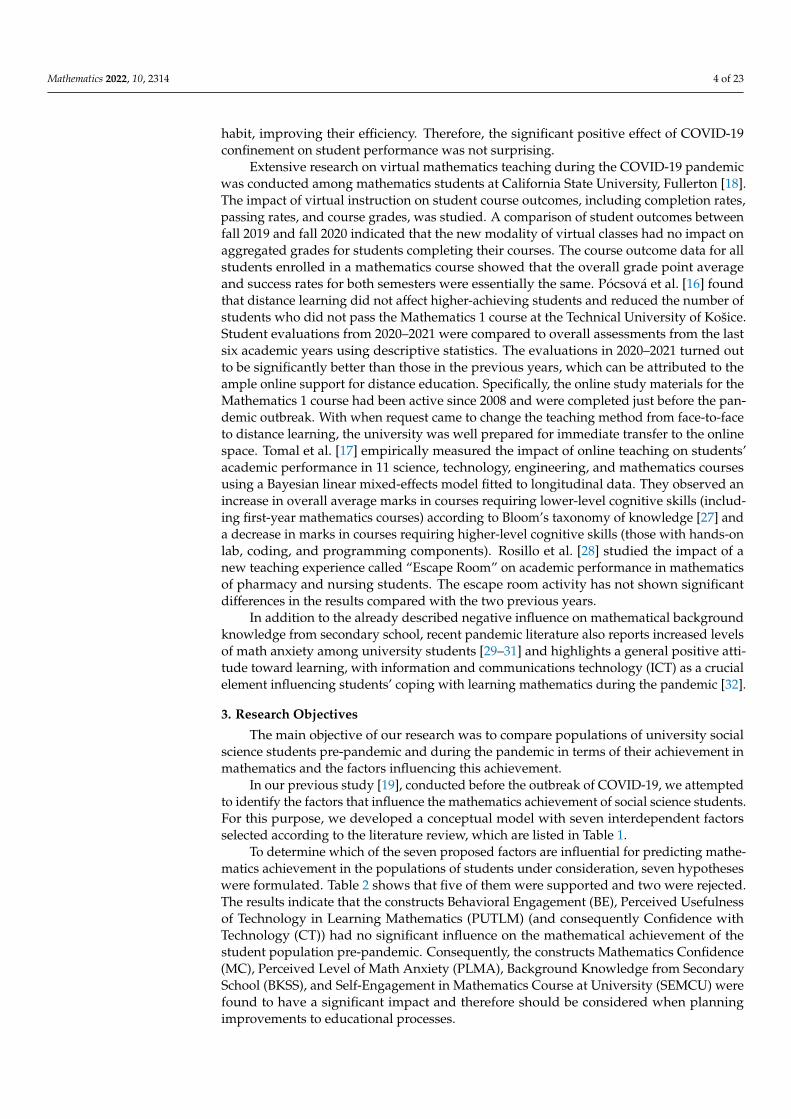
Extensive research on virtual mathematics teaching during the COVID-19 pandemicwas conducted among mathematics students at California State University, Fullerton [18].The impact of virtual instruction on student course outcomes, including completion rates,passing rates, and course grades, was studied. A comparison of student outcomes betweenfall 2019 and fall 2020 indicated that the new modality of virtual classes had no impact onaggregated grades for students completing their courses. The course outcome data for allstudents enrolled in a mathematics course showed that the overall grade point averageand success rates for both semesters were essentially the same. Pócsová et al. [16] foundthat distance learning did not affect higher-achieving students and reduced the number ofstudents who did not pass the Mathematics 1 course at the Technical University of Košice.Student evaluations from 2020–2021 were compared to overall assessments from the lastsix academic years using descriptive statistics. The evaluations in 2020–2021 turned outto be significantly better than those in the previous years, which can be attributed to theample online support for distance education. Specifically, the online study materials for theMathematics 1 course had been active since 2008 and were completed just before the pan-demic outbreak. With when request came to change the teaching method from face-to-faceto distance learning, the university was well prepared for immediate transfer to the onlinespace. Tomal et al. [17] empirically measured the impact of online teaching on students’academic performance in 11 science, technology, engineering, and mathematics coursesusing a Bayesian linear mixed-effects model fitted to longitudinal data. They observed anincrease in overall average marks in courses requiring lower-level cognitive skills (includ-ing first-year mathematics courses) according to Bloom’s taxonomy of knowledge [27] anda decrease in marks in courses requiring higher-level cognitive skills (those with hands-onlab, coding, and programming components). Rosillo et al. [28] studied the impact of anew teaching experience called “Escape Room” on academic performance in mathematicsof pharmacy and nursing students. The escape room activity has not shown significantdifferences in the results compared with the two previous years.
In addition to the already described negative influence on mathematical backgroundknowledge from secondary school, recent pandemic literature also reports increased levelsof math anxiety among university students [29–31] and highlights a general positive atti-tude toward learning, with information and communications technology (ICT) as a crucialelement influencing students’ coping with learning mathematics during the pandemic [32].
3. Research Objectives
The main objective of our research was to compare populations of university socialscience students pre-pandemic and during the pandemic in terms of their achievement inmathematics and the factors influencing this achievement.
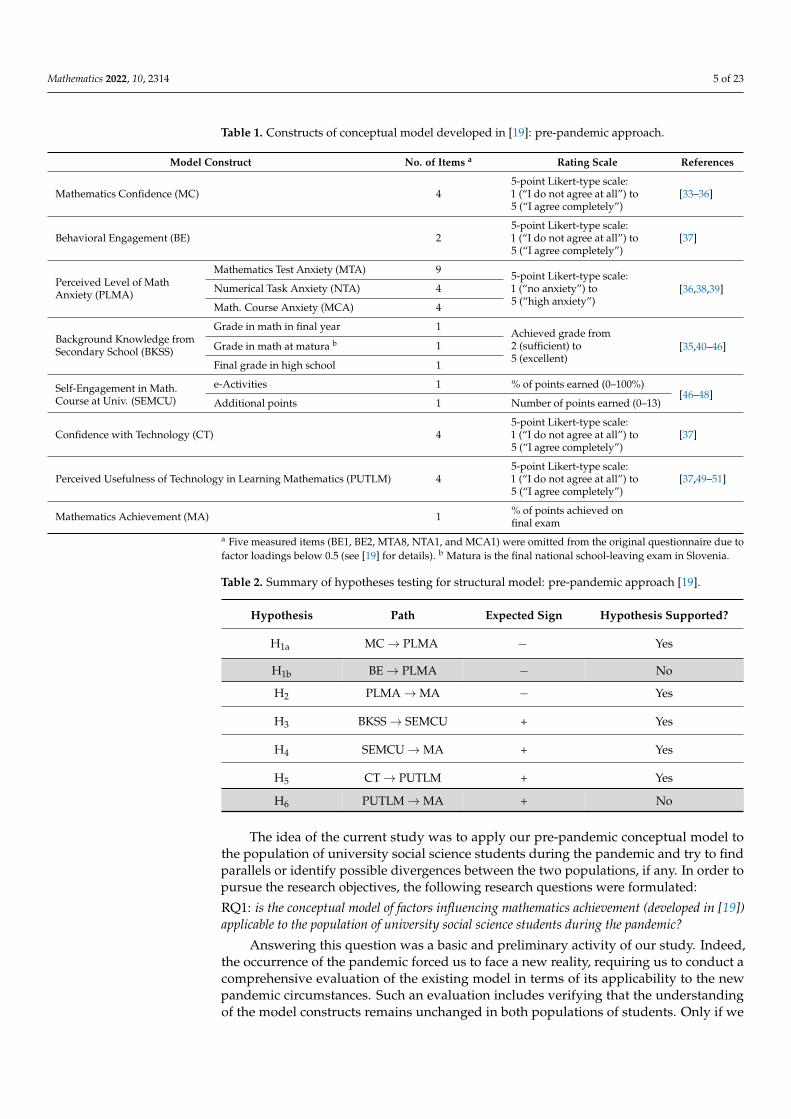
In our previous study [19], conducted before the outbreak of COVID-19, we attemptedto identify the factors that influence the mathematics achievement of social science students.For this purpose, we developed a conceptual model with seven interdependent factorsselected according to the literature review, which are listed in Table 1.
To determine which of the seven proposed factors are influential for predicting mathe-matics achievement in the populations of students under consideration, seven hypotheseswere formulated. Table 2 shows that five of them were supported and two were rejected.The results indicate that the constructs Behavioral Engagement (BE), Perceived Usefulnessof Technology in Learning Mathematics (PUTLM) (and consequently Confidence withTechnology (CT)) had no significant influence on the mathematical achievement of thestudent population pre-pandemic. Consequently, the constructs Mathematics Confidence(MC), Perceived Level of Math Anxiety (PLMA), Background Knowledge from SecondarySchool (BKSS), and Self-Engagement in Mathematics Course at University (SEMCU) werefound to have a significant impact and therefore should be considered when planningimprovements to educational processes.
Mathematics 2022, 10, 2314 5 of 23
Table 1. Constructs of conceptual model developed in [19]: pre-pandemic approach.
Model Construct No. of Items a Rating Scale References
Mathematics Confidence (MC) 45-point Likert-type scale:1 (“I do not agree at all”) to5 (“I agree completely”)
[33–36]
Behavioral Engagement (BE) 25-point Likert-type scale:1 (“I do not agree at all”) to5 (“I agree completely”)
[37]
Perceived Level of MathAnxiety (PLMA)
Mathematics Test Anxiety (MTA) 9 5-point Likert-type scale:1 (“no anxiety”) to5 (“high anxiety”)
[36,38,39]Numerical Task Anxiety (NTA) 4
Math. Course Anxiety (MCA) 4
Background Knowledge fromSecondary School (BKSS)
Grade in math in final year 1Achieved grade from2 (sufficient) to5 (excellent)
[35,40–46]Grade in math at matura b 1
Final grade in high school 1
Self-Engagement in Math.Course at Univ. (SEMCU)
e-Activities 1 % of points earned (0–100%)[46–48]
Additional points 1 Number of points earned (0–13)
Confidence with Technology (CT) 45-point Likert-type scale:1 (“I do not agree at all”) to5 (“I agree completely”)
[37]
Perceived Usefulness of Technology in Learning Mathematics (PUTLM) 45-point Likert-type scale:1 (“I do not agree at all”) to5 (“I agree completely”)
[37,49–51]
Mathematics Achievement (MA) 1 % of points achieved onfinal exam
a Five measured items (BE1, BE2, MTA8, NTA1, and MCA1) were omitted from the original questionnaire due tofactor loadings below 0.5 (see [19] for details). b Matura is the final national school-leaving exam in Slovenia.
Table 2. Summary of hypotheses testing for structural model: pre-pandemic approach [19].
Hypothesis Path Expected Sign Hypothesis Supported?
H1a MC→ PLMA − Yes
H1b BE→ PLMA − No
H2 PLMA→MA − Yes
H3 BKSS→ SEMCU + Yes
H4 SEMCU→MA + Yes
H5 CT→ PUTLM + Yes
H6 PUTLM→MA + No
The idea of the current study was to apply our pre-pandemic conceptual model tothe population of university social science students during the pandemic and try to findparallels or identify possible divergences between the two populations, if any. In order topursue the research objectives, the following research questions were formulated:
RQ1: is the conceptual model of factors influencing mathematics achievement (developed in [19])applicable to the population of university social science students during the pandemic?
Answering this question was a basic and preliminary activity of our study. Indeed,the occurrence of the pandemic forced us to face a new reality, requiring us to conduct acomprehensive evaluation of the existing model in terms of its applicability to the newpandemic circumstances. Such an evaluation includes verifying that the understandingof the model constructs remains unchanged in both populations of students. Only if we
Mathematics 2022, 10, 2314 6 of 23
determine that the model is applicable to the population of students during the pandemiccan we proceed with further research questions, such as:
RQ2: which factors of mathematics achievement considered in our pre-pandemic research [19] areimportant for the population of students during the pandemic, and how strong is their influence?Are there parallels/divergences between the two populations?
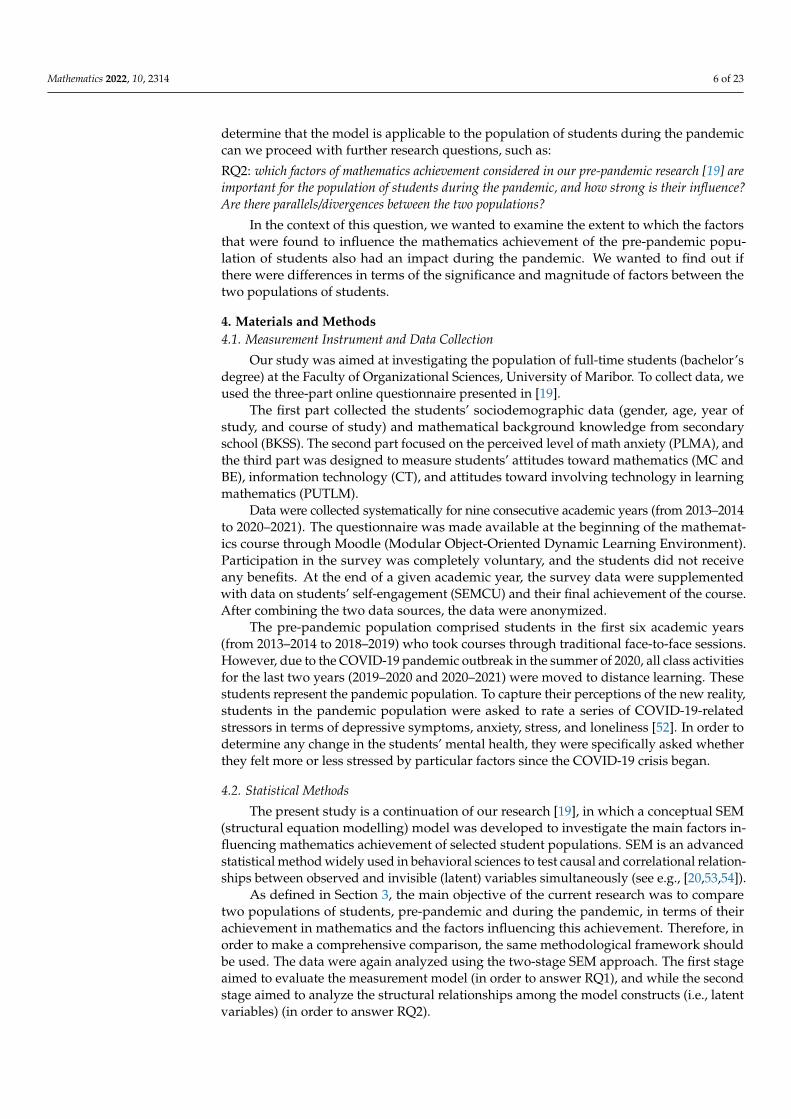
In the context of this question, we wanted to examine the extent to which the factorsthat were found to influence the mathematics achievement of the pre-pandemic popu-lation of students also had an impact during the pandemic. We wanted to find out ifthere were differences in terms of the significance and magnitude of factors between thetwo populations of students.
4. Materials and Methods4.1. Measurement Instrument and Data Collection
Our study was aimed at investigating the population of full-time students (bachelor’sdegree) at the Faculty of Organizational Sciences, University of Maribor. To collect data, weused the three-part online questionnaire presented in [19].
The first part collected the students’ sociodemographic data (gender, age, year ofstudy, and course of study) and mathematical background knowledge from secondaryschool (BKSS). The second part focused on the perceived level of math anxiety (PLMA), andthe third part was designed to measure students’ attitudes toward mathematics (MC andBE), information technology (CT), and attitudes toward involving technology in learningmathematics (PUTLM).
Data were collected systematically for nine consecutive academic years (from 2013–2014to 2020–2021). The questionnaire was made available at the beginning of the mathemat-ics course through Moodle (Modular Object-Oriented Dynamic Learning Environment).Participation in the survey was completely voluntary, and the students did not receiveany benefits. At the end of a given academic year, the survey data were supplementedwith data on students’ self-engagement (SEMCU) and their final achievement of the course.After combining the two data sources, the data were anonymized.
The pre-pandemic population comprised students in the first six academic years(from 2013–2014 to 2018–2019) who took courses through traditional face-to-face sessions.However, due to the COVID-19 pandemic outbreak in the summer of 2020, all class activitiesfor the last two years (2019–2020 and 2020–2021) were moved to distance learning. Thesestudents represent the pandemic population. To capture their perceptions of the new reality,students in the pandemic population were asked to rate a series of COVID-19-relatedstressors in terms of depressive symptoms, anxiety, stress, and loneliness [52]. In order todetermine any change in the students’ mental health, they were specifically asked whetherthey felt more or less stressed by particular factors since the COVID-19 crisis began.
4.2. Statistical Methods
The present study is a continuation of our research [19], in which a conceptual SEM(structural equation modelling) model was developed to investigate the main factors in-fluencing mathematics achievement of selected student populations. SEM is an advancedstatistical method widely used in behavioral sciences to test causal and correlational relation-ships between observed and invisible (latent) variables simultaneously (see e.g., [20,53,54]).
As defined in Section 3, the main objective of the current research was to comparetwo populations of students, pre-pandemic and during the pandemic, in terms of theirachievement in mathematics and the factors influencing this achievement. Therefore, inorder to make a comprehensive comparison, the same methodological framework shouldbe used. The data were again analyzed using the two-stage SEM approach. The first stageaimed to evaluate the measurement model (in order to answer RQ1), and while the secondstage aimed to analyze the structural relationships among the model constructs (i.e., latentvariables) (in order to answer RQ2).
Mathematics 2022, 10, 2314 7 of 23
4.2.1. Measurement Model Evaluation
The basis for the analyses was the conceptual model developed in [19] and describedin Table 1. In order to answer RQ1, we needed to perform the comprehensive applicabilityof the research model for the purpose of the current study. This was a relatively complextask that involved the following consecutive steps:
• Step 1: model overall fit evaluation,• Step 2: confirmatory factor analysis,• Step 3: multi-group confirmatory factor analysis.
The implementation of a particular step is described in the following subsections. Ateach step, certain conditions must be met. Otherwise, the research cannot continue, whichmeans that the predefined research goal cannot be achieved.
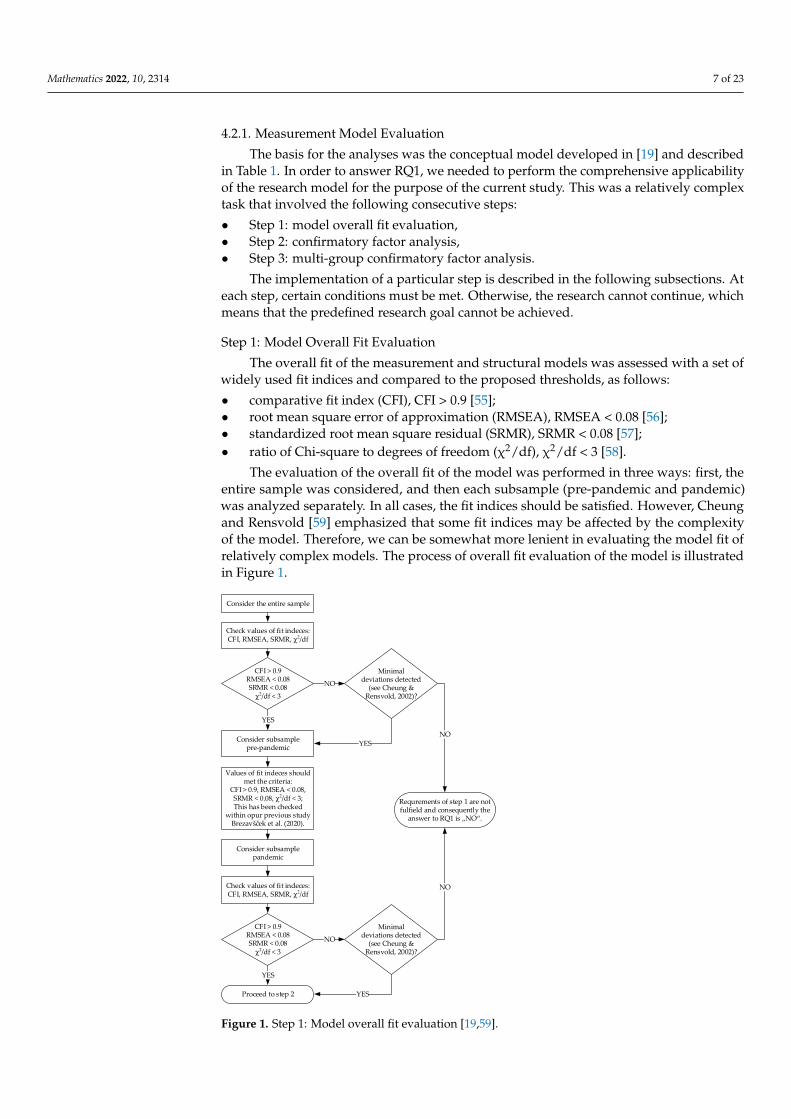
Step 1: Model Overall Fit Evaluation
The overall fit of the measurement and structural models was assessed with a set ofwidely used fit indices and compared to the proposed thresholds, as follows:
• comparative fit index (CFI), CFI > 0.9 [55];• root mean square error of approximation (RMSEA), RMSEA < 0.08 [56];• standardized root mean square residual (SRMR), SRMR < 0.08 [57];• ratio of Chi-square to degrees of freedom (χ2/df), χ2/df < 3 [58].
The evaluation of the overall fit of the model was performed in three ways: first, theentire sample was considered, and then each subsample (pre-pandemic and pandemic)was analyzed separately. In all cases, the fit indices should be satisfied. However, Cheungand Rensvold [59] emphasized that some fit indices may be affected by the complexityof the model. Therefore, we can be somewhat more lenient in evaluating the model fit ofrelatively complex models. The process of overall fit evaluation of the model is illustratedin Figure 1.
Mathematics 2022, 10, 2314 8 of 25
Figure 1. Step 1: Model overall fit evaluation [19,59].
Step 2: Confirmatory Factor Analysis Within this step, the measurement model should be validated on the entire sample
of data for convergent and discriminant validity. For this purpose, confirmatory factor analysis (CFA) can be used by checking the following indices and their threshold requirements [55,60]: • convergent validity:
o standardized factor loadings (SFL), SFL > 0.5 for all questionnaire items; • discriminant validity:
o composite reliability (CR), CR > 0.7 o average variance extracted (AVE), AVE > 0.5 for all latent variables (i.e., model
constructs). The process of performing CFA is illustrated in Figure 2.
Consider the entire sample
Check values of fit indeces: CFI, RMSEA, SRMR, χ2/df
CFI > 0.9RMSEA < 0.08SRMR < 0.08
χ2/df < 3
Consider subsample pre-pandemic
Values of fit indeces should met the criteria:
CFI > 0.9, RMSEA < 0.08, SRMR < 0.08, χ2/df < 3;This has been checked
within opur previous study Brezavšček et al. (2020).
Consider subsample pandemic
Check values of fit indeces: CFI, RMSEA, SRMR, χ2/df
CFI > 0.9RMSEA < 0.08SRMR < 0.08
χ2/df < 3
NO
YES
YES
YESNO
Minimal deviations detected
(see Cheung & Rensvold, 2002)?
NO
NO
YESProceed to step 2
Requrements of step 1 are not fulfield and consequently the
answer to RQ1 is „NO“.
Minimal deviations detected
(see Cheung & Rensvold, 2002)?
Figure 1. Step 1: Model overall fit evaluation [19,59].
Mathematics 2022, 10, 2314 8 of 23
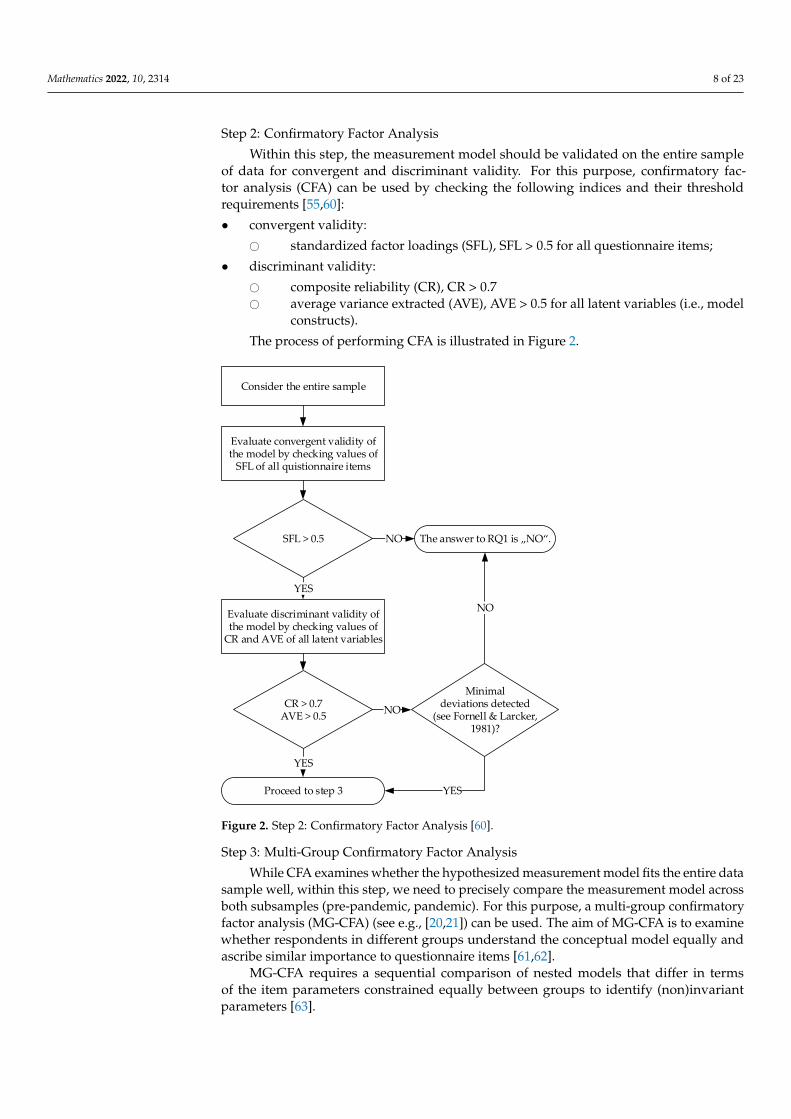
Step 2: Confirmatory Factor Analysis
Within this step, the measurement model should be validated on the entire sampleof data for convergent and discriminant validity. For this purpose, confirmatory fac-tor analysis (CFA) can be used by checking the following indices and their thresholdrequirements [55,60]:
• convergent validity:
# standardized factor loadings (SFL), SFL > 0.5 for all questionnaire items;
• discriminant validity:
# composite reliability (CR), CR > 0.7# average variance extracted (AVE), AVE > 0.5 for all latent variables (i.e., model
constructs).
The process of performing CFA is illustrated in Figure 2.Mathematics 2022, 10, 2314 9 of 25
Figure 2. Step 2: Confirmatory Factor Analysis [60].
Step 3: Multi-Group Confirmatory Factor Analysis While CFA examines whether the hypothesized measurement model fits the entire
data sample well, within this step, we need to precisely compare the measurement model across both subsamples (pre-pandemic, pandemic). For this purpose, a multi-group confirmatory factor analysis (MG-CFA) (see e.g., [20,21]) can be used. The aim of MG-CFA is to examine whether respondents in different groups understand the conceptual model equally and ascribe similar importance to questionnaire items [61,62].
MG-CFA requires a sequential comparison of nested models that differ in terms of the item parameters constrained equally between groups to identify (non)invariant parameters [63].
In order to assess the psychometric equivalence of a construct between the groups [64], we performed the measurement invariance (MInv) test [65]. MInv is accepted if the difference in model parameters between groups is so small that it is attributable to chance. If the model is statistically invariant between groups, then it can be argued that any differences in factor scores are attributable to characteristics of the groups rather than to any deficiencies of the statistical model or inventory [66], while non-invariance in the measurement indicates that a construct has different structures and/or meanings for respondents in different groups.
MInv is typically tested in the following order: configural, weak, and strong invariance, sometimes followed by strict invariance [21].
Since χ2 tends to be oversensitive to small, unimportant deviations from a perfect model in large samples [59,67], the results for each invariance test can be explained by the change in several alternative fit indices (AFI). Therefore, changes in CFI (ΔCFI), SRMR (ΔSRMR), and RMSEA (ΔRMSEA) should be examined. In [67], the author suggested that
Consider the entire sample
Evaluate discriminant validity of the model by checking values of
CR and AVE of all latent variables
CR > 0.7AVE > 0.5
Minimal deviations detected
(see Fornell & Larcker, 1981)?
NO
YES
YES
NO
Evaluate convergent validity of the model by checking values of
SFL of all quistionnaire items
SFL > 0.5 NO
YES
The answer to RQ1 is „NO“.
Proceed to step 3
Figure 2. Step 2: Confirmatory Factor Analysis [60].
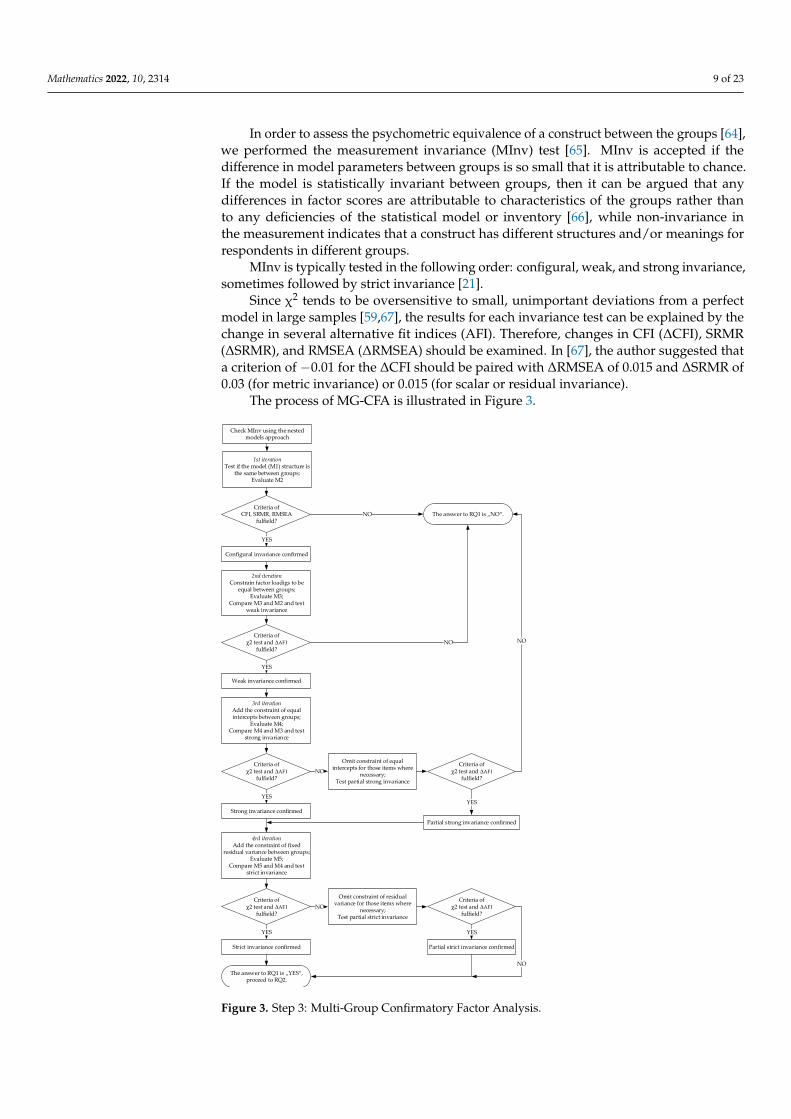
Step 3: Multi-Group Confirmatory Factor Analysis
While CFA examines whether the hypothesized measurement model fits the entire datasample well, within this step, we need to precisely compare the measurement model acrossboth subsamples (pre-pandemic, pandemic). For this purpose, a multi-group confirmatoryfactor analysis (MG-CFA) (see e.g., [20,21]) can be used. The aim of MG-CFA is to examinewhether respondents in different groups understand the conceptual model equally andascribe similar importance to questionnaire items [61,62].
MG-CFA requires a sequential comparison of nested models that differ in termsof the item parameters constrained equally between groups to identify (non)invariantparameters [63].
Mathematics 2022, 10, 2314 9 of 23
In order to assess the psychometric equivalence of a construct between the groups [64],we performed the measurement invariance (MInv) test [65]. MInv is accepted if thedifference in model parameters between groups is so small that it is attributable to chance.If the model is statistically invariant between groups, then it can be argued that anydifferences in factor scores are attributable to characteristics of the groups rather thanto any deficiencies of the statistical model or inventory [66], while non-invariance inthe measurement indicates that a construct has different structures and/or meanings forrespondents in different groups.
MInv is typically tested in the following order: configural, weak, and strong invariance,sometimes followed by strict invariance [21].
Since χ2 tends to be oversensitive to small, unimportant deviations from a perfectmodel in large samples [59,67], the results for each invariance test can be explained by thechange in several alternative fit indices (AFI). Therefore, changes in CFI (∆CFI), SRMR(∆SRMR), and RMSEA (∆RMSEA) should be examined. In [67], the author suggested thata criterion of −0.01 for the ∆CFI should be paired with ∆RMSEA of 0.015 and ∆SRMR of0.03 (for metric invariance) or 0.015 (for scalar or residual invariance).
The process of MG-CFA is illustrated in Figure 3.
Mathematics 2022, 10, 2314 10 of 25
a criterion of −0.01 for the ΔCFI should be paired with ΔRMSEA of 0.015 and ΔSRMR of 0.03 (for metric invariance) or 0.015 (for scalar or residual invariance).
The process of MG-CFA is illustrated in Figure 3.
Figure 3. Step 3: Multi-Group Confirmatory Factor Analysis.
2nd iterationConstrain factor loadigs to be
equal between groups;Evaluate M3;
Compare M3 and M2 and test weak invariance
NO
YES
1st iteration Test if the model (M1) structure is
the same between groups;Evaluate M2
NO
The answer to RQ1 is „YES“,proceed to RQ2.
The answer to RQ1 is „NO“.Criteria of
CFI, SRMR, RMSEA fulfield?
YES
Configural invariance confirmed
Criteria of χ2 test and ΔAFI
fulfield?
Weak invariance confirmed
3rd iterationAdd the constraint of equal intercepts between groups;
Evaluate M4; Compare M4 and M3 and test
strong invariance
Criteria of χ2 test and ΔAFI
fulfield?
Strong invariance confirmed
4rd iterationAdd the constraint of fixed
residual variance between groups;Evaluate M5;
Compare M5 and M4 and test strict invariance
YES
Criteria of χ2 test and ΔAFI
fulfield?
YES
Strict invariance confirmed
Omit constraint of equal intercepts for those items where
necessary; Test partial strong invariance
NOCriteria of
χ2 test and ΔAFI fulfield?
YES
Partial strong invariance confirmed
NO
NO
Omit constraint of residual variance for those items where
necessary; Test partial strict invariance
Criteria of χ2 test and ΔAFI
fulfield?
Partial strict invariance confirmed
Check MInv using the nested models approach
NO
YES
Figure 3. Step 3: Multi-Group Confirmatory Factor Analysis.
Mathematics 2022, 10, 2314 10 of 23
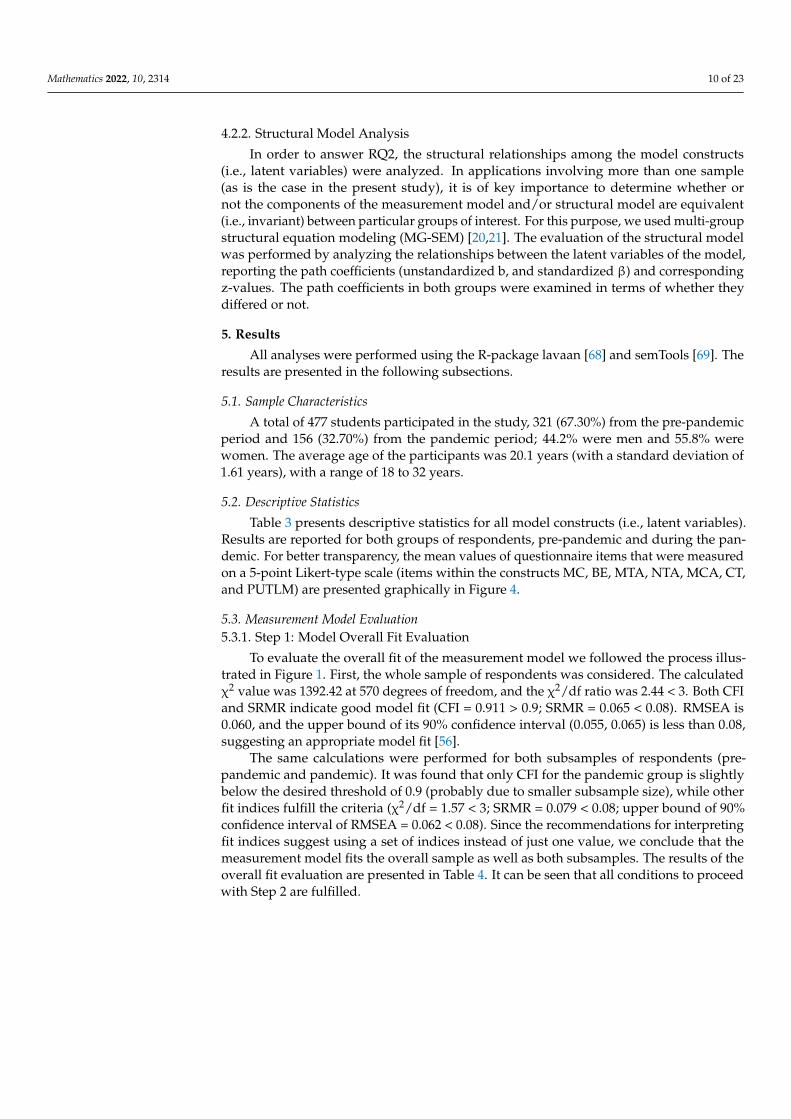
4.2.2. Structural Model Analysis
In order to answer RQ2, the structural relationships among the model constructs(i.e., latent variables) were analyzed. In applications involving more than one sample(as is the case in the present study), it is of key importance to determine whether ornot the components of the measurement model and/or structural model are equivalent(i.e., invariant) between particular groups of interest. For this purpose, we used multi-groupstructural equation modeling (MG-SEM) [20,21]. The evaluation of the structural modelwas performed by analyzing the relationships between the latent variables of the model,reporting the path coefficients (unstandardized b, and standardized β) and correspondingz-values. The path coefficients in both groups were examined in terms of whether theydiffered or not.
5. Results
All analyses were performed using the R-package lavaan [68] and semTools [69]. Theresults are presented in the following subsections.
5.1. Sample Characteristics
A total of 477 students participated in the study, 321 (67.30%) from the pre-pandemicperiod and 156 (32.70%) from the pandemic period; 44.2% were men and 55.8% werewomen. The average age of the participants was 20.1 years (with a standard deviation of1.61 years), with a range of 18 to 32 years.
5.2. Descriptive Statistics
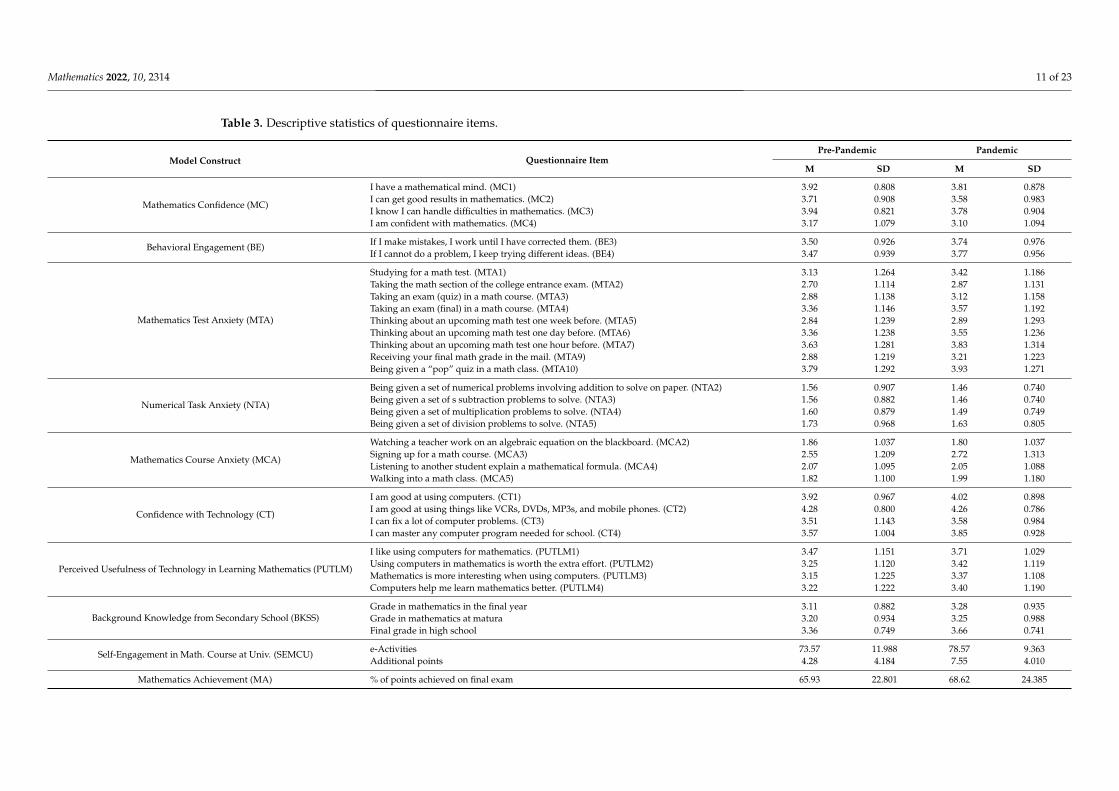
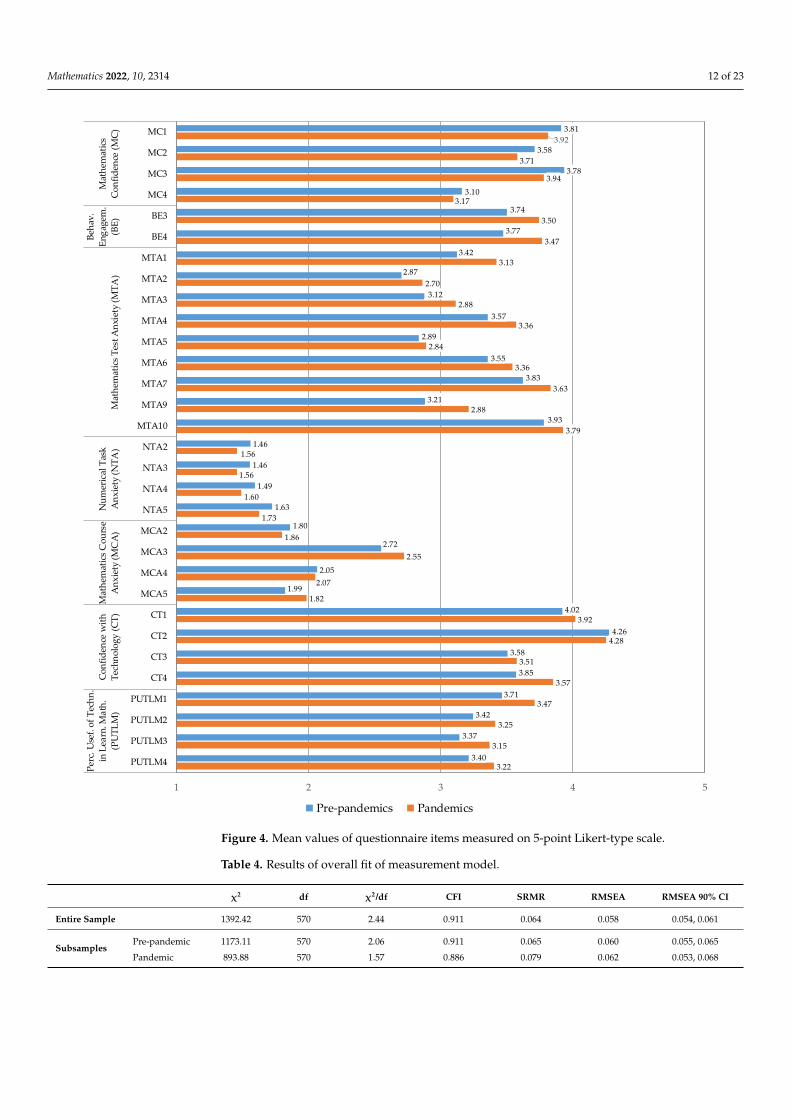
Table 3 presents descriptive statistics for all model constructs (i.e., latent variables).Results are reported for both groups of respondents, pre-pandemic and during the pan-demic. For better transparency, the mean values of questionnaire items that were measuredon a 5-point Likert-type scale (items within the constructs MC, BE, MTA, NTA, MCA, CT,and PUTLM) are presented graphically in Figure 4.
5.3. Measurement Model Evaluation5.3.1. Step 1: Model Overall Fit Evaluation
To evaluate the overall fit of the measurement model we followed the process illus-trated in Figure 1. First, the whole sample of respondents was considered. The calculatedχ2 value was 1392.42 at 570 degrees of freedom, and the χ2/df ratio was 2.44 < 3. Both CFIand SRMR indicate good model fit (CFI = 0.911 > 0.9; SRMR = 0.065 < 0.08). RMSEA is0.060, and the upper bound of its 90% confidence interval (0.055, 0.065) is less than 0.08,suggesting an appropriate model fit [56].
The same calculations were performed for both subsamples of respondents (pre-pandemic and pandemic). It was found that only CFI for the pandemic group is slightlybelow the desired threshold of 0.9 (probably due to smaller subsample size), while otherfit indices fulfill the criteria (χ2/df = 1.57 < 3; SRMR = 0.079 < 0.08; upper bound of 90%confidence interval of RMSEA = 0.062 < 0.08). Since the recommendations for interpretingfit indices suggest using a set of indices instead of just one value, we conclude that themeasurement model fits the overall sample as well as both subsamples. The results of theoverall fit evaluation are presented in Table 4. It can be seen that all conditions to proceedwith Step 2 are fulfilled.
Mathematics 2022, 10, 2314 11 of 23
Table 3. Descriptive statistics of questionnaire items.
Model Construct Questionnaire ItemPre-Pandemic Pandemic
M SD M SD
Mathematics Confidence (MC)
I have a mathematical mind. (MC1) 3.92 0.808 3.81 0.878I can get good results in mathematics. (MC2) 3.71 0.908 3.58 0.983I know I can handle difficulties in mathematics. (MC3) 3.94 0.821 3.78 0.904I am confident with mathematics. (MC4) 3.17 1.079 3.10 1.094
Behavioral Engagement (BE) If I make mistakes, I work until I have corrected them. (BE3) 3.50 0.926 3.74 0.976If I cannot do a problem, I keep trying different ideas. (BE4) 3.47 0.939 3.77 0.956
Mathematics Test Anxiety (MTA)
Studying for a math test. (MTA1) 3.13 1.264 3.42 1.186Taking the math section of the college entrance exam. (MTA2) 2.70 1.114 2.87 1.131Taking an exam (quiz) in a math course. (MTA3) 2.88 1.138 3.12 1.158Taking an exam (final) in a math course. (MTA4) 3.36 1.146 3.57 1.192Thinking about an upcoming math test one week before. (MTA5) 2.84 1.239 2.89 1.293Thinking about an upcoming math test one day before. (MTA6) 3.36 1.238 3.55 1.236Thinking about an upcoming math test one hour before. (MTA7) 3.63 1.281 3.83 1.314Receiving your final math grade in the mail. (MTA9) 2.88 1.219 3.21 1.223Being given a “pop” quiz in a math class. (MTA10) 3.79 1.292 3.93 1.271
Numerical Task Anxiety (NTA)
Being given a set of numerical problems involving addition to solve on paper. (NTA2) 1.56 0.907 1.46 0.740Being given a set of s subtraction problems to solve. (NTA3) 1.56 0.882 1.46 0.740Being given a set of multiplication problems to solve. (NTA4) 1.60 0.879 1.49 0.749Being given a set of division problems to solve. (NTA5) 1.73 0.968 1.63 0.805
Mathematics Course Anxiety (MCA)
Watching a teacher work on an algebraic equation on the blackboard. (MCA2) 1.86 1.037 1.80 1.037Signing up for a math course. (MCA3) 2.55 1.209 2.72 1.313Listening to another student explain a mathematical formula. (MCA4) 2.07 1.095 2.05 1.088Walking into a math class. (MCA5) 1.82 1.100 1.99 1.180
Confidence with Technology (CT)
I am good at using computers. (CT1) 3.92 0.967 4.02 0.898I am good at using things like VCRs, DVDs, MP3s, and mobile phones. (CT2) 4.28 0.800 4.26 0.786I can fix a lot of computer problems. (CT3) 3.51 1.143 3.58 0.984I can master any computer program needed for school. (CT4) 3.57 1.004 3.85 0.928
Perceived Usefulness of Technology in Learning Mathematics (PUTLM)
I like using computers for mathematics. (PUTLM1) 3.47 1.151 3.71 1.029Using computers in mathematics is worth the extra effort. (PUTLM2) 3.25 1.120 3.42 1.119Mathematics is more interesting when using computers. (PUTLM3) 3.15 1.225 3.37 1.108Computers help me learn mathematics better. (PUTLM4) 3.22 1.222 3.40 1.190
Background Knowledge from Secondary School (BKSS)Grade in mathematics in the final year 3.11 0.882 3.28 0.935Grade in mathematics at matura 3.20 0.934 3.25 0.988Final grade in high school 3.36 0.749 3.66 0.741
Self-Engagement in Math. Course at Univ. (SEMCU) e-Activities 73.57 11.988 78.57 9.363Additional points 4.28 4.184 7.55 4.010
Mathematics Achievement (MA) % of points achieved on final exam 65.93 22.801 68.62 24.385
Mathematics 2022, 10, 2314 12 of 23Mathematics 2022, 10, 2314 13 of 25
Figure 4. Mean values of questionnaire items measured on 5-point Likert-type scale.
5.3. Measurement Model Evaluation 5.3.1. Step 1: Model Overall Fit Evaluation
To evaluate the overall fit of the measurement model we followed the process illustrated in Figure 1. First, the whole sample of respondents was considered. The calculated χ2 value was 1392.42 at 570 degrees of freedom, and the χ2/df ratio was 2.44 < 3. Both CFI and SRMR indicate good model fit (CFI = 0.911 > 0.9; SRMR = 0.065 < 0.08). RMSEA is 0.060, and the upper bound of its 90% confidence interval (0.055, 0.065) is less than 0.08, suggesting an appropriate model fit [56].
The same calculations were performed for both subsamples of respondents (pre-pandemic and pandemic). It was found that only CFI for the pandemic group is slightly below the desired threshold of 0.9 (probably due to smaller subsample size), while other fit indices fulfill the criteria (χ2/df = 1.57 < 3; SRMR = 0.079 < 0.08; upper bound of 90% confidence interval of RMSEA = 0.062 < 0.08). Since the recommendations for interpreting fit indices suggest using a set of indices instead of just one value, we conclude that the
3.22
3.15
3.25
3.47
3.57
3.51
4.28
3.92
1.82
2.07
2.55
1.86
1.73
1.60
1.56
1.56
3.79
2.88
3.63
3.36
2.84
3.36
2.88
2.70
3.13
3.47
3.50
3.17
3.94
3.71
3.92
3.40
3.37
3.42
3.71
3.85
3.58
4.26
4.02
1.99
2.05
2.72
1.80
1.63
1.49
1.46
1.46
3.93
3.21
3.83
3.55
2.89
3.57
3.12
2.87
3.42
3.77
3.74
3.10
3.78
3.58
3.81
1 2 3 4 5
PUTLM4
PUTLM3
PUTLM2
PUTLM1
CT4
CT3
CT2
CT1
MCA5
MCA4
MCA3
MCA2
NTA5
NTA4
NTA3
NTA2
MTA10
MTA9
MTA7
MTA6
MTA5
MTA4
MTA3
MTA2
MTA1
BE4
BE3
MC4
MC3
MC2
MC1
Perc
. Use
f. of
Tec
hn.
in L
earn
. Mat
h.(P
UTL
M)
Conf
iden
ce w
ithTe
chno
logy
(CT)
Mat
hem
atics
Cou
rse
Anx
iety
(MC
A)
Num
eric
al T
ask
Anx
iety
(NTA
)M
athe
mat
ics T
est A
nxie
ty (M
TA)
Beha
v.En
gage
m.
(BE)
Mat
hem
atics
Conf
iden
ce (M
C)
Pre-pandemics Pandemics
Figure 4. Mean values of questionnaire items measured on 5-point Likert-type scale.
Table 4. Results of overall fit of measurement model.
χ2 df χ2/df CFI SRMR RMSEA RMSEA 90% CI
Entire Sample 1392.42 570 2.44 0.911 0.064 0.058 0.054, 0.061
SubsamplesPre-pandemic 1173.11 570 2.06 0.911 0.065 0.060 0.055, 0.065
Pandemic 893.88 570 1.57 0.886 0.079 0.062 0.053, 0.068
Mathematics 2022, 10, 2314 13 of 23
5.3.2. Step 2: Confirmatory Factor Analysis
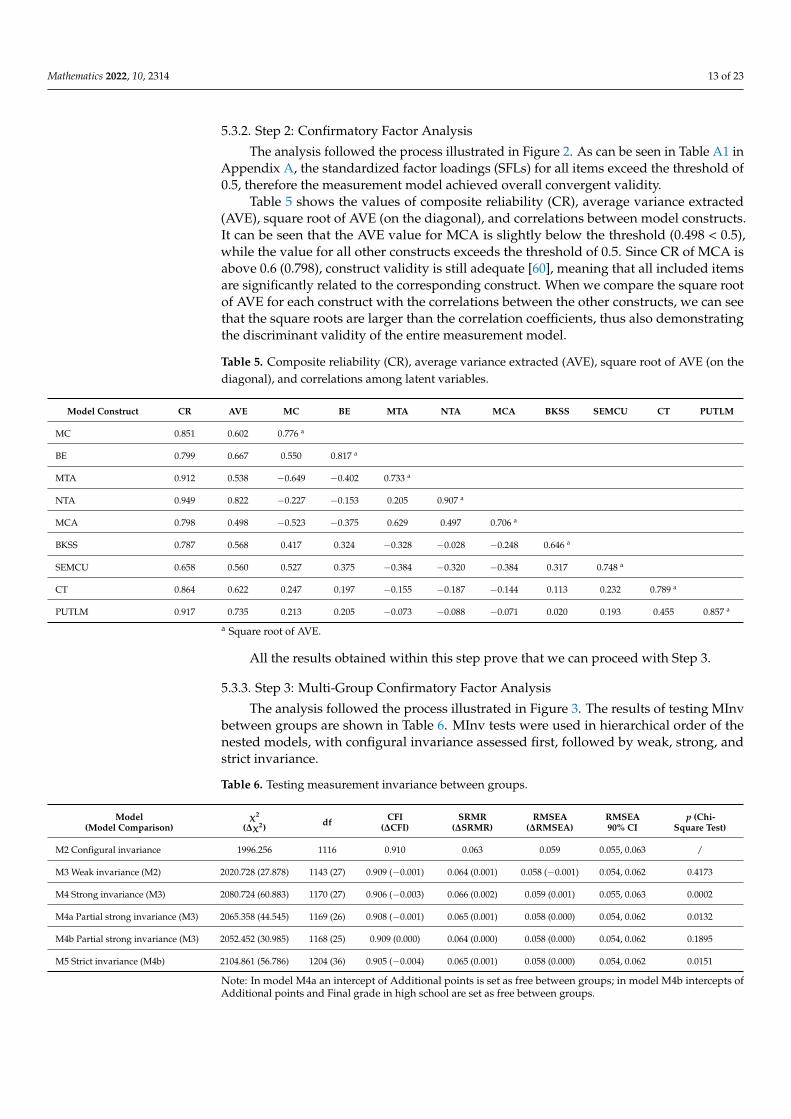
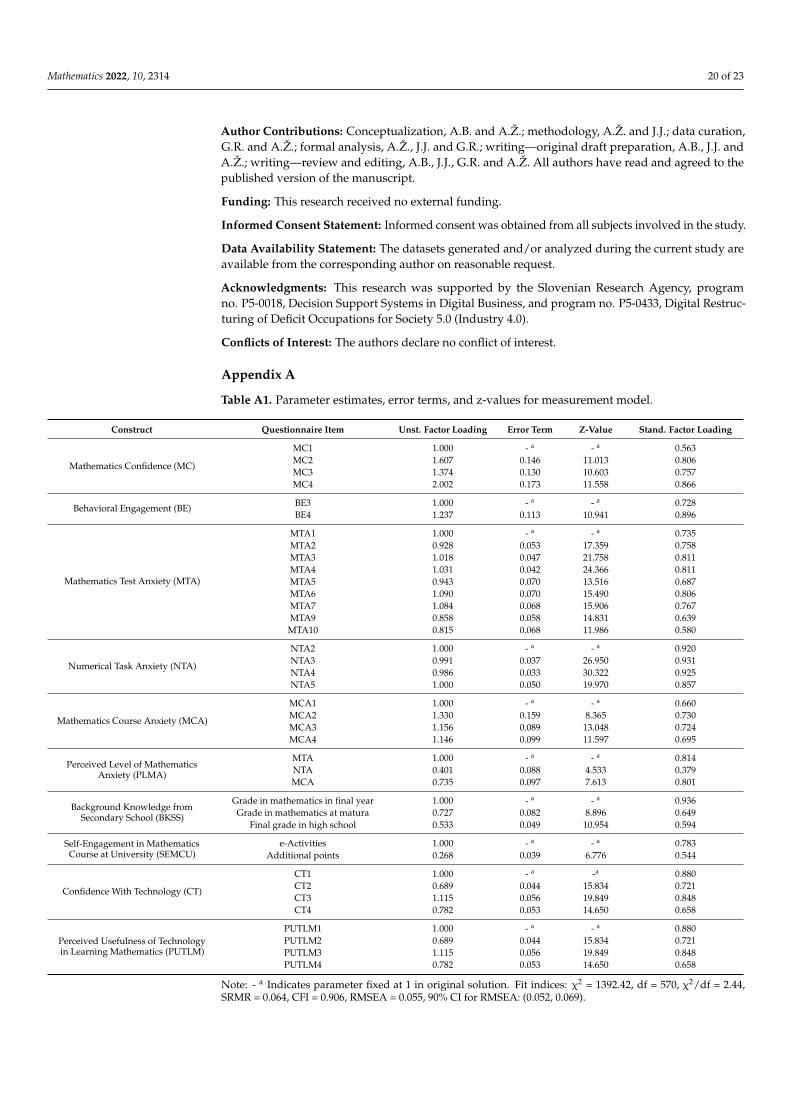
The analysis followed the process illustrated in Figure 2. As can be seen in Table A1 inAppendix A, the standardized factor loadings (SFLs) for all items exceed the threshold of0.5, therefore the measurement model achieved overall convergent validity.
Table 5 shows the values of composite reliability (CR), average variance extracted(AVE), square root of AVE (on the diagonal), and correlations between model constructs.It can be seen that the AVE value for MCA is slightly below the threshold (0.498 < 0.5),while the value for all other constructs exceeds the threshold of 0.5. Since CR of MCA isabove 0.6 (0.798), construct validity is still adequate [60], meaning that all included itemsare significantly related to the corresponding construct. When we compare the square rootof AVE for each construct with the correlations between the other constructs, we can seethat the square roots are larger than the correlation coefficients, thus also demonstratingthe discriminant validity of the entire measurement model.
Table 5. Composite reliability (CR), average variance extracted (AVE), square root of AVE (on thediagonal), and correlations among latent variables.
Model Construct CR AVE MC BE MTA NTA MCA BKSS SEMCU CT PUTLM
MC 0.851 0.602 0.776 a
BE 0.799 0.667 0.550 0.817 a
MTA 0.912 0.538 −0.649 −0.402 0.733 a
NTA 0.949 0.822 −0.227 −0.153 0.205 0.907 a
MCA 0.798 0.498 −0.523 −0.375 0.629 0.497 0.706 a
BKSS 0.787 0.568 0.417 0.324 −0.328 −0.028 −0.248 0.646 a
SEMCU 0.658 0.560 0.527 0.375 −0.384 −0.320 −0.384 0.317 0.748 a
CT 0.864 0.622 0.247 0.197 −0.155 −0.187 −0.144 0.113 0.232 0.789 a
PUTLM 0.917 0.735 0.213 0.205 −0.073 −0.088 −0.071 0.020 0.193 0.455 0.857 a
a Square root of AVE.
All the results obtained within this step prove that we can proceed with Step 3.
5.3.3. Step 3: Multi-Group Confirmatory Factor Analysis
The analysis followed the process illustrated in Figure 3. The results of testing MInvbetween groups are shown in Table 6. MInv tests were used in hierarchical order of thenested models, with configural invariance assessed first, followed by weak, strong, andstrict invariance.
Table 6. Testing measurement invariance between groups.
Model(Model Comparison)
χ2
(∆χ2) df CFI(∆CFI)
SRMR(∆SRMR)
RMSEA(∆RMSEA)
RMSEA90% CI
p (Chi-Square Test)
M2 Configural invariance 1996.256 1116 0.910 0.063 0.059 0.055, 0.063 /
M3 Weak invariance (M2) 2020.728 (27.878) 1143 (27) 0.909 (−0.001) 0.064 (0.001) 0.058 (−0.001) 0.054, 0.062 0.4173
M4 Strong invariance (M3) 2080.724 (60.883) 1170 (27) 0.906 (−0.003) 0.066 (0.002) 0.059 (0.001) 0.055, 0.063 0.0002
M4a Partial strong invariance (M3) 2065.358 (44.545) 1169 (26) 0.908 (−0.001) 0.065 (0.001) 0.058 (0.000) 0.054, 0.062 0.0132
M4b Partial strong invariance (M3) 2052.452 (30.985) 1168 (25) 0.909 (0.000) 0.064 (0.000) 0.058 (0.000) 0.054, 0.062 0.1895
M5 Strict invariance (M4b) 2104.861 (56.786) 1204 (36) 0.905 (−0.004) 0.065 (0.001) 0.058 (0.000) 0.054, 0.062 0.0151
Note: In model M4a an intercept of Additional points is set as free between groups; in model M4b intercepts ofAdditional points and Final grade in high school are set as free between groups.
Mathematics 2022, 10, 2314 14 of 23
It can be seen from Table 6 that the first iteration (M2) indicates good model fit(CFI = 0.910 > 0.9; SRMR = 0.063 < 0.08; RMSEA = 0.059 < 0.08), suggesting that the structureof the constructs is the same between the two groups, thus supporting configural invariance.
In the next iteration, we performed a test for weak invariance, and the factor loadingswere constrained to be equal between the groups. Comparing models M3 and M2, we cansee that the p-value of the Chi-square test is not significant at the 5% level (p = 0.4173 > 0.05),indicating that weak invariance is supported. In addition, the differences in alternativefit indices (∆AFI) between the configural and weak models are small (∆CFI = −0.0031;∆REMSA = −0.001; ∆SRMR = 0.001), supporting weak invariance.
In testing strong invariance, in addition to factor loadings, the intercepts were alsoconstrained to be equal between the groups. Comparing M4 and M3, we can see that thep-value of the Chi-square test is significant at the 5% level (p = 0.0132 < 0.05), indicatingthat strong invariance is not supported. Therefore, intercepts are not completely invariantbetween the two considered groups.
In the next two sequential steps (models M4a and M4b), intercepts of measured itemsadditional points and final grade in high school were freely estimated between the groups,and partial strong variance (M4b) was established since the p-value of the Chi-square testbetween M4b and M3 is not significant at the 5% level (p = 0.1895 > 0.05).
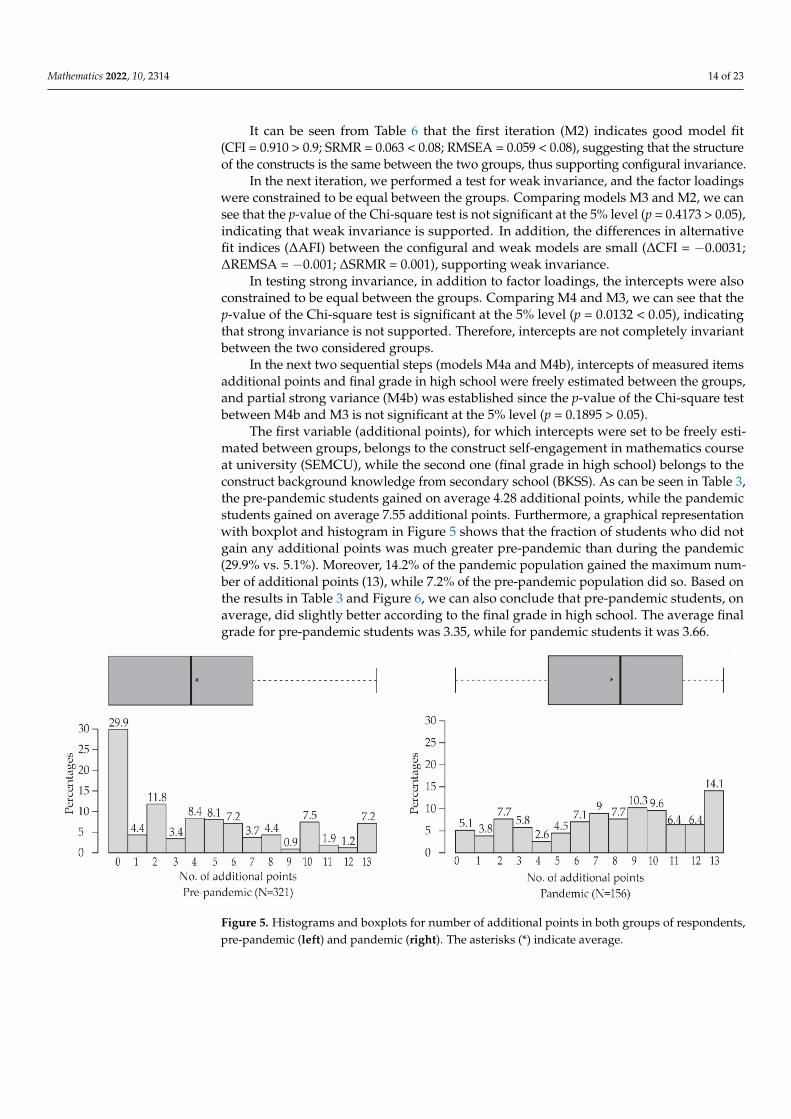
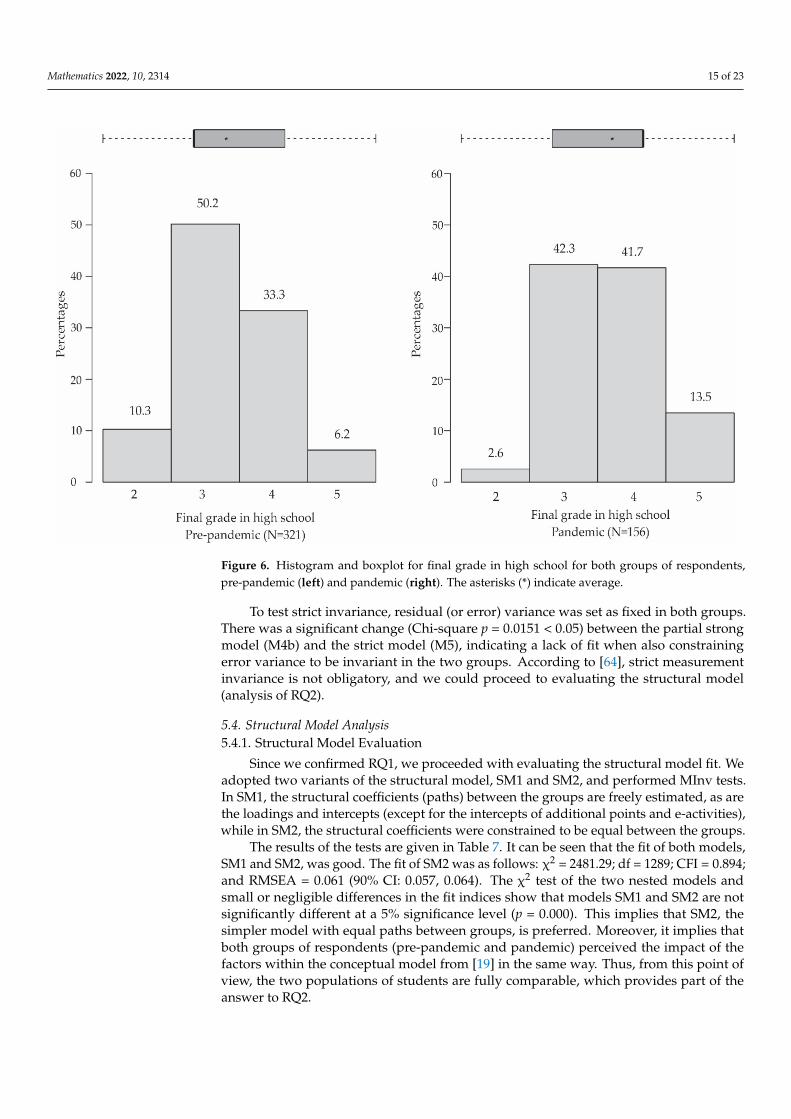
The first variable (additional points), for which intercepts were set to be freely esti-mated between groups, belongs to the construct self-engagement in mathematics courseat university (SEMCU), while the second one (final grade in high school) belongs to theconstruct background knowledge from secondary school (BKSS). As can be seen in Table 3,the pre-pandemic students gained on average 4.28 additional points, while the pandemicstudents gained on average 7.55 additional points. Furthermore, a graphical representationwith boxplot and histogram in Figure 5 shows that the fraction of students who did notgain any additional points was much greater pre-pandemic than during the pandemic(29.9% vs. 5.1%). Moreover, 14.2% of the pandemic population gained the maximum num-ber of additional points (13), while 7.2% of the pre-pandemic population did so. Based onthe results in Table 3 and Figure 6, we can also conclude that pre-pandemic students, onaverage, did slightly better according to the final grade in high school. The average finalgrade for pre-pandemic students was 3.35, while for pandemic students it was 3.66.
Mathematics 2022, 10, 2314 16 of 25
To test strict invariance, residual (or error) variance was set as fixed in both groups. There was a significant change (Chi-square p = 0.0151 < 0.05) between the partial strong model (M4b) and the strict model (M5), indicating a lack of fit when also constraining error variance to be invariant in the two groups. According to [64], strict measurement invariance is not obligatory, and we could proceed to evaluating the structural model (analysis of RQ2).
Figure 5. Histograms and boxplots for number of additional points in both groups of respondents, pre-pandemic (left) and pandemic (right). The asterisks (*) indicate average.
Figure 6. Histogram and boxplot for final grade in high school for both groups of respondents, pre-pandemic (left) and pandemic (right). The asterisks (*) indicate average.
Figure 5. Histograms and boxplots for number of additional points in both groups of respondents,pre-pandemic (left) and pandemic (right). The asterisks (*) indicate average.
Mathematics 2022, 10, 2314 15 of 23
Mathematics 2022, 10, 2314 16 of 25
To test strict invariance, residual (or error) variance was set as fixed in both groups. There was a significant change (Chi-square p = 0.0151 < 0.05) between the partial strong model (M4b) and the strict model (M5), indicating a lack of fit when also constraining error variance to be invariant in the two groups. According to [64], strict measurement invariance is not obligatory, and we could proceed to evaluating the structural model (analysis of RQ2).
Figure 5. Histograms and boxplots for number of additional points in both groups of respondents, pre-pandemic (left) and pandemic (right). The asterisks (*) indicate average.
Figure 6. Histogram and boxplot for final grade in high school for both groups of respondents, pre-pandemic (left) and pandemic (right). The asterisks (*) indicate average.
Figure 6. Histogram and boxplot for final grade in high school for both groups of respondents,pre-pandemic (left) and pandemic (right). The asterisks (*) indicate average.
To test strict invariance, residual (or error) variance was set as fixed in both groups.There was a significant change (Chi-square p = 0.0151 < 0.05) between the partial strongmodel (M4b) and the strict model (M5), indicating a lack of fit when also constrainingerror variance to be invariant in the two groups. According to [64], strict measurementinvariance is not obligatory, and we could proceed to evaluating the structural model(analysis of RQ2).
5.4. Structural Model Analysis5.4.1. Structural Model Evaluation
Since we confirmed RQ1, we proceeded with evaluating the structural model fit. Weadopted two variants of the structural model, SM1 and SM2, and performed MInv tests.In SM1, the structural coefficients (paths) between the groups are freely estimated, as arethe loadings and intercepts (except for the intercepts of additional points and e-activities),while in SM2, the structural coefficients were constrained to be equal between the groups.
The results of the tests are given in Table 7. It can be seen that the fit of both models,SM1 and SM2, was good. The fit of SM2 was as follows: χ2 = 2481.29; df = 1289; CFI = 0.894;and RMSEA = 0.061 (90% CI: 0.057, 0.064). The χ2 test of the two nested models andsmall or negligible differences in the fit indices show that models SM1 and SM2 are notsignificantly different at a 5% significance level (p = 0.000). This implies that SM2, thesimpler model with equal paths between groups, is preferred. Moreover, it implies thatboth groups of respondents (pre-pandemic and pandemic) perceived the impact of thefactors within the conceptual model from [19] in the same way. Thus, from this point ofview, the two populations of students are fully comparable, which provides part of theanswer to RQ2.
Mathematics 2022, 10, 2314 16 of 23
Table 7. Testing measurement invariance of structural coefficients.
Structural Model (SM) χ2 df p CFI SRMR RMSEA RMSEA
(Model Comparison) (∆χ2) (∆df) (∆CFI) (∆SRMR) (∆RMSEA) 90% CI
SM1 Partial strong invariance 2472.28 1282 / 0.894 0.090 0.061 0.057, 0.065
SM2 Structural coefficients 2365.56 12890.2976
0.894 0.094 0.0610.057, 0.064
(SM1) −106.72 7 0 0.004 0
5.4.2. Hypotheses Testing
The next step is to evaluate the structural paths and test the hypotheses from Table 2.The results are given in Table 8. The unstandardized coefficient (b) and the standardizedcoefficient (β), which reflect the relationships among the model constructs (i.e., latentvariables) in terms of magnitude and statistical significance, are listed for both groups(pre-pandemic and pandemic). Corresponding z-values and p-values are also provided.
Table 8. Summary of research hypotheses testing.
Hypothesis/Path Group b β z p Hypothesis Supported?
H1a: MC→ PLMA Pre-pandemic−1.088
−0.678 ***−6.909 0.000 Yes
Expected sign: − Pandemic −0.698 ***
H1b: BE→ PLMA Pre-pandemic −0.107 *
Expected sign: − Pandemic−0.120
−0.116 *−1.812 0.070 No
H2: PLMA→MA Pre-pandemic−6.379
−0.221 ***−4.134 0.000 Yes
Expected sign: − Pandemic −0.199 ***
H3: BKSS→ SEMCU Pre-pandemic2.936
0.331 ***3.789 0.000 Yes
Expected sign: + Pandemic 0.375 ***
H4: SEMC→MA Pre-pandemic2.766
0.875 ***9.700 0.000 Yes
Expected sign: + Pandemic 0.758 ***
H5: CT→ PUTLM Pre-pandemic0.512
0.460 ***8.939 0.000 Yes
Expected sign: + Pandemic 0.452 ***
H6: PUTLM→MA Pre-pandemic −0.011 *
Expected sign: + Pandemic−0.253
−0.009 *−0.320 0.749 No
Note: Structural coefficient invariance was confirmed, which means unstandardized coefficients and z-values arethe same between groups, while there may be small changes in standardized coefficients. *** p < 0.001, * p < 0.05.
As can be seen in Table 8, five out of seven hypotheses were confirmed, and two (H1band H6) were rejected at the 5% significance level.
5.4.3. Final Model
To find the most parsimonious final model, the nested models approach was applied,in which insignificant paths were iteratively eliminated from the model.
In the first step, the non-significant path PUTLM→MA (H6) was eliminated. The newmodel was compared to SM2, and a non-significant Chi-squared difference (∆χ2 = 0.892;∆df = 1; p = 0.3448) justified the elimination. Consequently, the path CT→ PUTLM (H5)was also eliminated, implying that the constructs CT and PUTLM could be decoupled fromthe rest of the model.
In the next step, the non-significant path BE→ PLMA (H1b) was eliminated. A non-significant Chi-squared difference (∆χ2 = 2.708; ∆df = 1; p = 0.0998) again justified theelimination and indicated acceptance of the simpler model.
Mathematics 2022, 10, 2314 17 of 23
Finally, four significant paths (H1a, H2, H3, and H4) remained in the final structuralmodel. The fit of the final model was good, with index values as follows: χ2 = 1584.16,df = 678, CFI = 0.874, and RMSEA = 0.078 (90% CI: 0.073, 0.083).
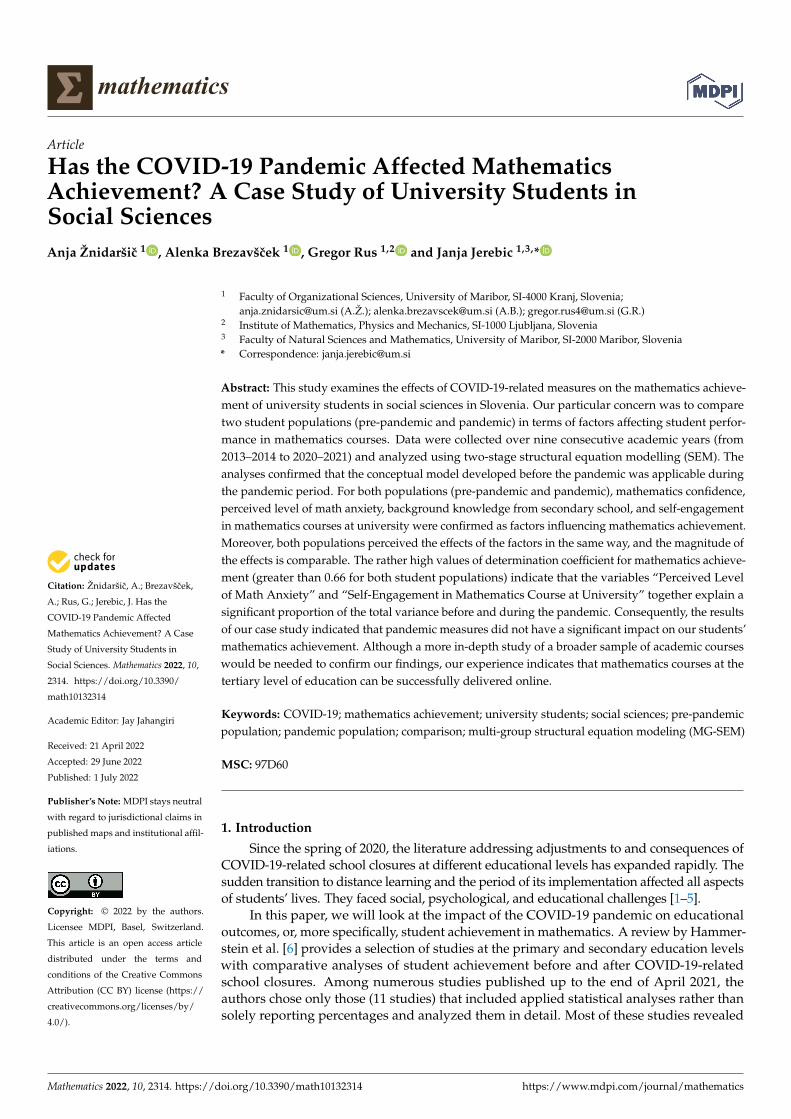
The structural paths of the final model were than evaluated, and the results arepresented in Figure 7.
Mathematics 2022, 10, 2314 18 of 25
Note: Structural coefficient invariance was confirmed, which means unstandardized coefficients and z-values are the same between groups, while there may be small changes in standardized coefficients. *** p < 0.001, * p < 0.05.
As can be seen in Table 8, five out of seven hypotheses were confirmed, and two (H1b and H6) were rejected at the 5% significance level.
5.4.3. Final Model To find the most parsimonious final model, the nested models approach was applied,
in which insignificant paths were iteratively eliminated from the model. In the first step, the non-significant path PUTLM → MA (H6) was eliminated. The
new model was compared to SM2, and a non-significant Chi-squared difference (Δχ2 = 0.892; Δdf = 1; p = 0.3448) justified the elimination. Consequently, the path CT → PUTLM (H5) was also eliminated, implying that the constructs CT and PUTLM could be decoupled from the rest of the model.
In the next step, the non-significant path BE → PLMA (H1b) was eliminated. A non-significant Chi-squared difference (Δχ2 = 2.708; ∆df = 1; p = 0.0998) again justified the elimination and indicated acceptance of the simpler model.
Finally, four significant paths (H1a, H2, H3, and H4) remained in the final structural model. The fit of the final model was good, with index values as follows: χ2 = 1584.16, df = 678, CFI = 0.874, and RMSEA = 0.078 (90% CI: 0.073, 0.083).
The structural paths of the final model were than evaluated, and the results are presented in Figure 7.
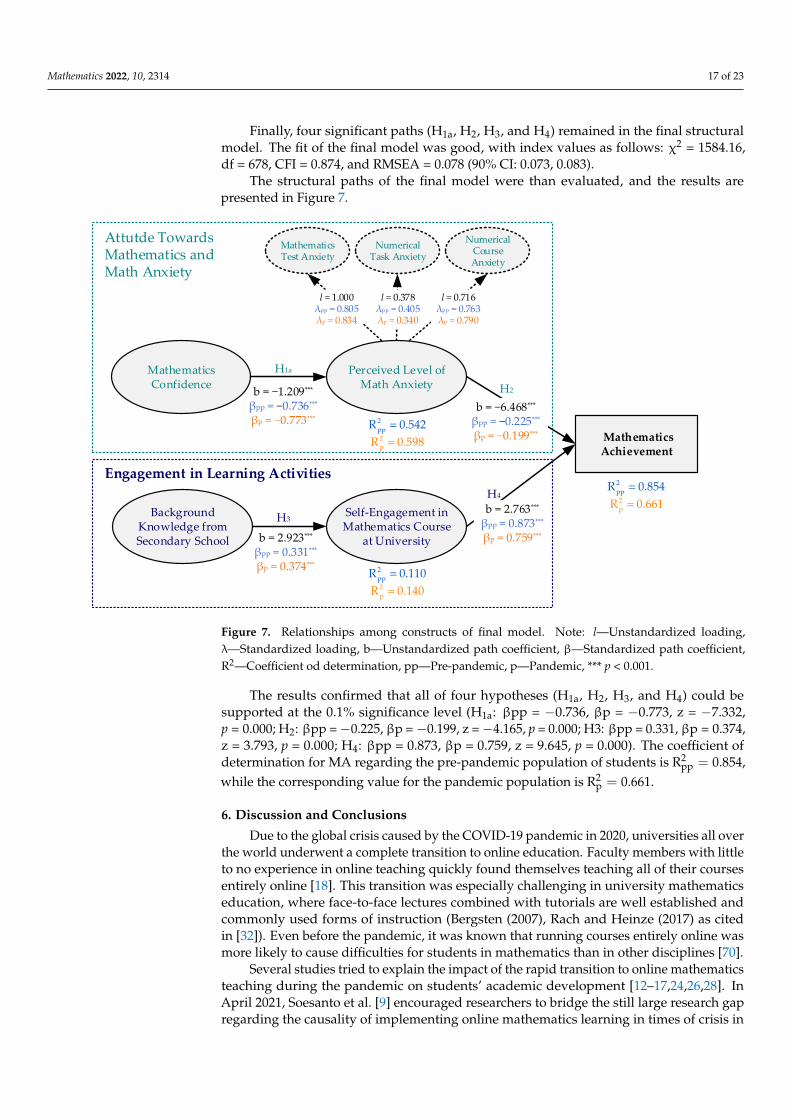
Figure 7. Relationships among constructs of final model. Note: l—Unstandardized loading, λ—Standardized loading, b—Unstandardized path coefficient, β—Standardized path coefficient, R2—Coefficient od determination, pp—Pre-pandemic, p—Pandemic, *** p < 0.001.
The results confirmed that all of four hypotheses (H1a, H2, H3, and H4) could be supported at the 0.1% significance level (H1a: βpp = −0.736, βp = −0.773, z = −7.332, p = 0.000; H2: βpp = −0.225, βp = −0.199, z = −4.165, p = 0.000; H3: βpp = 0.331, βp = 0.374, z = 3.793, p
H1a
Mathematics Test Anxiety
Numerical Task Anxiety
Numerical Course Anxiety
MathematicsAchievement
Mathematics Confidence
Background Knowledge from Secondary School
Self-Engagement in Mathematics Course
at University
H3
H4
b = −1.209***
βpp = −0.736***
βp = −0.773***
Attutde Towards Mathematics and Math Anxiety
Engagement in Learning Activities
b = 2.923***
βpp = 0.331***
βp = 0.374***
b = 2.763***
βpp = 0.873***
βp = 0.759***
H2
==
p
2pp2 8
R 2R 0
0.5.59
4
==
p
2pp2 0
R 0R 0
0.1.14
1
==
p
2pp2 1
R 4R 0
0.8.66
5
b = −6.468***
βpp = −0.225***
βp = −0.199***
l = 0.378λpp = 0.405λp = 0.340
l = 0.716λpp = 0.763λp = 0.790
l = 1.000λpp = 0.805λp = 0.834
Perceived Level of Math Anxiety
Figure 7. Relationships among constructs of final model. Note: l—Unstandardized loading,λ—Standardized loading, b—Unstandardized path coefficient, β—Standardized path coefficient,R2—Coefficient od determination, pp—Pre-pandemic, p—Pandemic, *** p < 0.001.
The results confirmed that all of four hypotheses (H1a, H2, H3, and H4) could besupported at the 0.1% significance level (H1a: βpp = −0.736, βp = −0.773, z = −7.332,p = 0.000; H2: βpp =−0.225, βp =−0.199, z =−4.165, p = 0.000; H3: βpp = 0.331, βp = 0.374,z = 3.793, p = 0.000; H4: βpp = 0.873, βp = 0.759, z = 9.645, p = 0.000). The coefficient ofdetermination for MA regarding the pre-pandemic population of students is R2
pp = 0.854,while the corresponding value for the pandemic population is R2
p = 0.661.
6. Discussion and Conclusions
Due to the global crisis caused by the COVID-19 pandemic in 2020, universities all overthe world underwent a complete transition to online education. Faculty members with littleto no experience in online teaching quickly found themselves teaching all of their coursesentirely online [18]. This transition was especially challenging in university mathematicseducation, where face-to-face lectures combined with tutorials are well established andcommonly used forms of instruction (Bergsten (2007), Rach and Heinze (2017) as citedin [32]). Even before the pandemic, it was known that running courses entirely online wasmore likely to cause difficulties for students in mathematics than in other disciplines [70].
Several studies tried to explain the impact of the rapid transition to online mathematicsteaching during the pandemic on students’ academic development [12–17,24,26,28]. InApril 2021, Soesanto et al. [9] encouraged researchers to bridge the still large research gapregarding the causality of implementing online mathematics learning in times of crisis in
Mathematics 2022, 10, 2314 18 of 23
order to contribute to developing pedagogical strategies to improve university students’mathematics performance and attitudes.
In order to provide complementary evidence of the impact of online mathematicsteaching at the tertiary level of education, the present research compares populationsof university students in social sciences in Slovenia between pre-pandemic and duringthe pandemic in terms of their mathematics achievement and the factors influencingtheir achievement. The results of two-stage structural equation modeling confirm that theconceptual model developed in our previous study [19] was also applicable to the pandemicpopulation of students (RQ1). The same factors relevant to mathematics achievement inthe pre-pandemic population (mathematics confidence, perceived level of math anxiety,background knowledge from secondary school, and self-engagement in mathematicscourses at university) proved to be relevant also for the pandemic population (RQ2).Moreover, both populations perceived the impact of the factors within the conceptualmodel in the same way, and the magnitude of the effects of given factors is comparable.The structural paths of the final model are listed below:
H1a: Mathematics confidence negatively affects the perceived level of math anxiety.
H2: Perceived level of math anxiety negatively affects the achievement in mathematics.
H3: Background knowledge from secondary school positively affects the self-engagement and moti-vation to fulfil obligations during mathematics course at university.
H4: Self-engagement in mathematics course at university positively affects the achievementin mathematics.
The nested models approach confirmed that all four hypotheses (H1a, H2, H3, and H4)could be supported at the 0.1% significance level (see Section 5.4.3). Advanced statisticalanalysis showed that causal and correlational relationships between mathematical achieve-ment factors remained unchanged. From this point of view, no statistically significantdifferences between the populations were confirmed. For both populations (pre-pandemicand pandemic), mathematics confidence, perceived level of math anxiety, backgroundknowledge from secondary school, and self-engagement in mathematics courses at univer-sity were confirmed as influential. Similar values of standardized path coefficient β provethat the magnitude of the effects of a particular factor are also comparable. Our resultstherefore proved that no increased negative impact on achievement in mathematics wasfound for any of the factors. These results support previous studies reporting only minoror no negative effects of distance learning on mathematics achievement [16–18].
In addition, the results showed a fairly high value of the coefficient of determination formathematics achievement for both groups of students (0.854 and 0.661), suggesting that thevariables “Perceived Level of Math Anxiety” and “Self-Engagement in Mathematics Courseat University” together explain a substantial proportion of the total variance. However,given that the proportion of unexplained influences for the “pandemic” students is 33.9%,this likely indicates that their learning outcomes are also influenced by other factors thatwere not considered in the present model. We intend to focus on identifying these factorsin our future research.
Given the general belief in society and commonly expressed assumptions about thenegative effects of COVID-19-related measures on learning outcomes, we were quitesurprised to find no significant differences in mathematics achievement between thetwo groups. The following is a reflection on the possible reasons for such an outcome.We believe that the results reflect students’ and teachers’ extraordinary efforts to success-fully implement online mathematics teaching. For the pandemic population, all courseswere redesigned for distance education using the Moodle e-learning environment and theMS Teams video conferencing system. We see the most important reasons for successfuloutcomes of the online learning process in:
Mathematics 2022, 10, 2314 19 of 23
• familiarity with the Moodle learning platform. Even before the pandemic, partsof some courses at our faculty were conducted online via Moodle. Therefore, theprofessors had at least basic knowledge of and some experience with preparing lessons,quizzes, and other e-activities available in this environment;
• well-adjusted study materials. We strived to construct an authentic and engagingonline learning experience. A number of online study materials were made available,including recorded classes and tutorials. In the regular annual student survey atthe end of the course, these recordings were highlighted as extremely helpful andimportant in enriching the learning experience. This is consistent with the findings ofBusto et al. [71]. Similarly, in [18], recordings were reported as a useful resource forre-watching portions of a lecture, especially in mathematics courses, where lessons areoften broken down by concepts using specific examples;
• a positive attitude of students. We agree with Takács et al. [11], who found thatstudents were capable of effectively adapting to the virtual teaching modality. Theyrecently explored the characteristics and changes in coping skills of university studentsin three age groups. They found that students pre-pandemic and during the pandemicdid not differ with regard to coping skills, but confirmed changes over the past 20 years.The younger students were found to be fast at processing information and less sociallyefficient compared to older students. Students of generation Z (born between 1995and 2012) generally see new situations as a positive challenge and deal with themcreatively. Vergara [72] also found that students had a positive attitude toward learningmathematics and strong persistence despite the challenges they encountered;
• accessibility and responsiveness of professors. The lack of communication betweenstudents (most of the first-year students did not know each other) led to an increasedvolume of messages and questions addressed directly to the professors. Although itwas very time-consuming, we tried to respond in a timely manner. Timely feedbackon student work is highly encouraged so that they will maintain a positive outlook interms of their capabilities [73].
In summary, the results of our research show that with proper planning, mathematicslectures and tutorials can be successfully conducted online. At the same time, we areaware that it is impossible to ensure the same conditions for all students, especially inproviding adequate study space, sufficient technical accessories, and a reliable internetconnection [16,73]. In addition, COVID-19 despair and the social, psychological, and emo-tional stress that comes with it can significantly determine poor student performance [31].The impact of the pandemic on stress, mental health, and coping behavior for universitystudents has been well-documented from various perspectives [31,52,74–76]. In our case,students’ responses to COVID-19-related stressors as described in [52] show that studentsduring the pandemic felt more socially isolated, felt as if they were missing something,and were more worried about their future career, family, and friends compared to thepre-pandemic time. In order to expand the mathematics achievement model with social,psychological, and emotional stressors, other established psychological scales could beused in future research to more accurately assess the impact of the pandemic on students’mental health and its correlation with mathematics achievement.
There are also some limitations to our study that should be noted. First, all datawere collected from a single faculty of a Slovenian university. Consequently, the extentto which the results presented here are applicable to other types of institutions is unclear.Our sampling technique relied on voluntary participation, which increases selection bias.In addition, student achievement in mathematics could be linked to a modified format ofassessment tools or cheating on online exams during the pandemic. However, it shouldbe emphasized that only a small portion of the assessment (around 20%) was undertakenremotely. In this sense, we believe that these aspects are likely to have played a minor rolein our setting.
Mathematics 2022, 10, 2314 20 of 23
Author Contributions: Conceptualization, A.B. and A.Ž.; methodology, A.Ž. and J.J.; data curation,G.R. and A.Ž.; formal analysis, A.Ž., J.J. and G.R.; writing—original draft preparation, A.B., J.J. andA.Ž.; writing—review and editing, A.B., J.J., G.R. and A.Ž. All authors have read and agreed to thepublished version of the manuscript.
Funding: This research received no external funding.
Informed Consent Statement: Informed consent was obtained from all subjects involved in the study.
Data Availability Statement: The datasets generated and/or analyzed during the current study areavailable from the corresponding author on reasonable request.
Acknowledgments: This research was supported by the Slovenian Research Agency, programno. P5-0018, Decision Support Systems in Digital Business, and program no. P5-0433, Digital Restruc-turing of Deficit Occupations for Society 5.0 (Industry 4.0).
Conflicts of Interest: The authors declare no conflict of interest.
Appendix A
Table A1. Parameter estimates, error terms, and z-values for measurement model.
Construct Questionnaire Item Unst. Factor Loading Error Term Z-Value Stand. Factor Loading
Mathematics Confidence (MC)
MC1 1.000 - a - a 0.563MC2 1.607 0.146 11.013 0.806MC3 1.374 0.130 10.603 0.757MC4 2.002 0.173 11.558 0.866
Behavioral Engagement (BE) BE3 1.000 - a - a 0.728BE4 1.237 0.113 10.941 0.896
Mathematics Test Anxiety (MTA)
MTA1 1.000 - a - a 0.735MTA2 0.928 0.053 17.359 0.758MTA3 1.018 0.047 21.758 0.811MTA4 1.031 0.042 24.366 0.811MTA5 0.943 0.070 13.516 0.687MTA6 1.090 0.070 15.490 0.806MTA7 1.084 0.068 15.906 0.767MTA9 0.858 0.058 14.831 0.639MTA10 0.815 0.068 11.986 0.580
Numerical Task Anxiety (NTA)
NTA2 1.000 - a - a 0.920NTA3 0.991 0.037 26.950 0.931NTA4 0.986 0.033 30.322 0.925NTA5 1.000 0.050 19.970 0.857
Mathematics Course Anxiety (MCA)
MCA1 1.000 - a - a 0.660MCA2 1.330 0.159 8.365 0.730MCA3 1.156 0.089 13.048 0.724MCA4 1.146 0.099 11.597 0.695
Perceived Level of MathematicsAnxiety (PLMA)
MTA 1.000 - a - a 0.814NTA 0.401 0.088 4.533 0.379MCA 0.735 0.097 7.613 0.801
Background Knowledge fromSecondary School (BKSS)
Grade in mathematics in final year 1.000 - a - a 0.936Grade in mathematics at matura 0.727 0.082 8.896 0.649
Final grade in high school 0.533 0.049 10.954 0.594
Self-Engagement in MathematicsCourse at University (SEMCU)
e-Activities 1.000 - a - a 0.783Additional points 0.268 0.039 6.776 0.544
Confidence With Technology (CT)
CT1 1.000 - a -a 0.880CT2 0.689 0.044 15.834 0.721CT3 1.115 0.056 19.849 0.848CT4 0.782 0.053 14.650 0.658
Perceived Usefulness of Technologyin Learning Mathematics (PUTLM)
PUTLM1 1.000 - a - a 0.880PUTLM2 0.689 0.044 15.834 0.721PUTLM3 1.115 0.056 19.849 0.848PUTLM4 0.782 0.053 14.650 0.658
Note: - a Indicates parameter fixed at 1 in original solution. Fit indices: χ2 = 1392.42, df = 570, χ2/df = 2.44,SRMR = 0.064, CFI = 0.906, RMSEA = 0.055, 90% CI for RMSEA: (0.052, 0.069).
Mathematics 2022, 10, 2314 21 of 23
References1. Chaturvedi, K.; Vishwakarma, D.K.; Singh, N. COVID-19 and its impact on education, social life and mental health of students: A
survey. Child. Youth Serv. Rev. 2021, 121, 105866. [CrossRef] [PubMed]2. Al-Maskari, A.; Al-Riyami, T.; Kunjumuhammed, S.K. Students academic and social concerns during COVID-19 Pandemic.
Educ. Inf. Technol. 2022, 27, 1–21. [CrossRef] [PubMed]3. Pokhrel, S.; Chhetri, R. A literature review on impact of COVID-19 pandemic on teaching and learning. High. Educ. Future 2021, 8,
133–141. [CrossRef]4. Clark, A.E.; Nong, H.; Zhu, H.; Zhu, R. Compensating for academic loss: Online learning and student performance during the
COVID-19 pandemic. China Econ. Rev. 2021, 68, 101629. [CrossRef]5. Camacho-Zuñiga, C.; Pego, L.; Escamilla, J.; Hosseini, S. The impact of the COVID-19 pandemic on students’ feelings at high
school, undergraduate, and postgraduate levels. Heliyon 2021, 7, e06465. [CrossRef]6. Hammerstein, S.; König, C.; Dreisörner, T.; Frey, A. Effects of COVID-19-related school closures on student achievement—A
systematic review. Front. Psychol. 2021, 12, 746289. [CrossRef]7. Panagouli, E.; Stavridou, A.; Savvidi, C.; Kourti, A.; Sergentanis, T.; Tsitsika, A. School performance among children and
adolescents during COVID-19 pandemic: A Systematic review. Children 2021, 8, 1134. [CrossRef]8. Svaleryd, H.; Vlachos, J. COVID-19 and School Closures; GLO Discussion Paper Series; Global Labor Organization (GLO): Geneva,
Switzerland, 2022.9. Soesanto, R.H.; Dirgantoro, K.P.S. Commemorating one-year of the COVID-19 pandemic: Indonesian and international issues of
secondary and tertiary mathematics learning. Int. J. Stud. Educ. Sci. 2021, 2, 18–35. [CrossRef]10. Al Ghazali, F. Challenges and opportunities of fostering learner autonomy and self-access learning during the COVID-19
pandemic. Stud. Self-Access Learn. J. 2020, 11, 114–127. [CrossRef]11. Takács, R.; Takács, S.; Kárász, J.T.; Horváth, Z.; Oláh, A. Exploring coping strategies of different generations of students starting
university. Front. Psychol. 2021, 12, 740569. [CrossRef]12. De Paola, M.; Gioia, F.; Scoppa, V. Online Teaching, Procrastination and Students’ Achievement: Evidence from COVID-19 Induced
Remote Learning; IZA Discussion Papers; Institute of Labor Economics (IZA): Bonn, Germany, 2022.13. Kofoed, M.S.; Gebhart, L.; Gilmore, D.; Moschitto, R. Zooming to Class?: Experimental Evidence on College Students’ Online Learning
during COVID-19; IZA Discussion Papers; Institute of Labor Economics (IZA): Bonn, Germany, 2021.14. Orlov, G.; McKee, D.; Berry, J.; Boyle, A.; DiCiccio, T.; Ransom, T.; Rees-Jones, A.; Stoye, J. Learning during the COVID-19
Pandemic: It is not who you teach, but how you teach. Econ. Lett. 2021, 202, 109812. [CrossRef]15. Gonzalez, T.; De la Rubia, M.A.; Hincz, K.P.; Comas-Lopez, M.; Subirats, L.; Fort, S.; Sacha, G.M. Influence of COVID-19
confinement on students’ performance in higher education. PLoS ONE 2020, 15, e0239490. [CrossRef] [PubMed]16. Pócsová, J.; Mojžišová, A.; Takác, M.; Klein, D. The impact of the COVID-19 pandemic on teaching mathematics and students’
knowledge, skills, and grades. Educ. Sci. 2021, 11, 225. [CrossRef]17. Tomal, J.; Rahmati, S.; Boroushaki, S.; Jin, L.; Ahmed, E. The impact of COVID-19 on students’ marks: A Bayesian hierarchical
modeling approach. METRON 2021, 79, 57–91. [CrossRef] [PubMed]18. Bonsangue, M.V.; Clinkenbeard, J.E. A Comparison of American student and faculty experiences in mathematics courses during
the COVID-19 pandemic. Int. J. Educ. Res. Open 2021, 2, 100075. [CrossRef]19. Brezavšcek, A.; Jerebic, J.; Rus, G.; Žnidaršic, A. Factors influencing mathematics achievement of university students of social
sciences. Mathematics 2020, 8, 2134. [CrossRef]20. Kline, R.B. Convergence of Structural Equation Modeling and Multilevel Modeling. In The SAGE Handbook of Innovation in Social
Research Methods; SAGE Publications Ltd.: London, UK, 2011; pp. 562–589.21. Beaujean, A.A. Latent Variable Modeling Using R: A Step-by-Step Guide; Routledge: New York, NY, USA, 2014.22. Gao, Y.; Wong, S.L.; Khambari, M.N.; Noordin, N. A Bibliometric analysis of the scientific production of e-learning in higher
education (1998–2020). Int. J. Inf. Educ. Technol. 2022, 12, 390–399. [CrossRef]23. Paiva, J.; Abreu, A.; Costa, E. Distance learning in higher education during the COVID-19 pandemic: A systematic literature
review. Res. Bull. Cad. Investig. Master E-Bus. 2021, 1, 1–12.24. Del Carmen Valls Martínez, M.; Martín-Cervantes, P.A.; Sánchez Pérez, A.M.; del Carmen Martínez Victoria, M. Learning
mathematics of financial operations during the COVID-19 Era: An assessment with partial least squares structural equationmodeling. Mathematics 2021, 9, 2120. [CrossRef]
25. Alangari, T.S. Online STEM education during COVID-19 period: A systematic review of perceptions in higher education.Eurasia J. Math. Sci. Technol. Educ. 2022, 18, em2105. [CrossRef]
26. Ní Fhloinn, E.; Fitzmaurice, O. Challenges and opportunities: Experiences of mathematics lecturers engaged in emergency remoteteaching during the COVID-19 pandemic. Mathematics 2021, 9, 2303. [CrossRef]
27. Bloom, B.S.; Englehart, M.D.; Furst, E.J.; Hill, W.H.; Krathwohl, D.R. Taxonomy of Educational Objectives, Handbook I: The CognitiveDomain; David McKay Co. Inc.: New York, NY, USA, 1956.
28. Rosillo, N.; Montes, N. Escape room dual mode approach to teach maths during the COVID-19 era. Mathematics 2021, 9, 2602.[CrossRef]
29. Mendoza Velazco, D.; Cejas, M.; Rivas, G.; Varguillas, C. Anxiety as a prevailing factor of performance of university mathematicsstudents during the COVID-19 pandemic. Educ. Sci. J. 2021, 23, 94–113. [CrossRef]
Mathematics 2022, 10, 2314 22 of 23
30. Lanius, M.; Jones, T.F.; Kao, S.; Lazarus, T.; Farrell, A. Unmotivated, depressed, anxious: Impact of the COVID-19 emergencytransition to remote learning on undergraduates’ math anxiety. J. Humanist Math. 2022, 12, 148–171. [CrossRef]
31. Ludwig, J. Poor performance in undergraduate math: Can we blame it on COVID-19 Despair? Int. J. Innov. Sci. Math. 2021, 9,31–40.
32. Reinhold, F.; Schons, C.; Scheuerer, S.; Gritzmann, P.; Richter-Gebert, J.; Reiss, K. Students’ coping with the self-regulatorydemand of crisis-driven digitalization in university mathematics instruction: Do motivational and emotional orientations make adifference? Comput. Hum. Behav. 2021, 120, 106732. [CrossRef]
33. Kargar, M.; Tarmizi, R.A.; Bayat, S. Relationship between mathematical thinking, mathematics anxiety and mathematics attitudesamong university students. Procedia—Soc. Behav. Sci. 2010, 8, 537–542. [CrossRef]
34. Enu, J.; Agyman, O.K.; Nkum, D. Factors influencing students’ mathematics performance in some selected colleges of educationin Ghana. Int. J. Educ. Learn. Dev. 2015, 3, 68–74.
35. Khedhiri, S. The determinants of mathematics and statistics achievement in higher education. Mod. Appl. Sci. 2016, 10, 60.[CrossRef]
36. Nunez-Pena, M.I.; Suarez-Pellicioni, M.; Bono, R. Effects of math anxiety on student success in higher education. Int. J. Educ. Res.2013, 58, 36–43. [CrossRef]
37. Pierce, R.; Stacey, K.; Barkatsas, A. A scale for monitoring students’ attitudes to learning mathematics with technology.Comput. Educ. 2007, 48, 285–300. [CrossRef]
38. Alexander, L.; Martray, C.R. The development of an abbreviated version of the mathematics anxiety rating scale. Meas. Eval.Couns. Dev. 1989, 22, 143–150. [CrossRef]
39. Baloglu, M.; Zelhart, P.F. Psychometric properties of the revised mathematics anxiety rating scale. Psychol. Rec. 2007, 57, 593–611.[CrossRef]
40. Eng, T.H.; Li, V.L.; Julaihi, N.H. The relationships between students’ underachievement in mathematics courses and influencingfactors. Procedia—Soc. Behav. Sci. 2010, 8, 134–141. [CrossRef]
41. Nicholas, J.; Poladian, L.; Mack, J.; Wilson, R. Mathematics preparation for university: Entry, pathways and impact on performancein first year science and mathematics subjects. Int. J. Innov. Sci. Math. Educ. 2015, 23, 37–51.
42. Joyce, C.; Hine, G.; Anderton, R. The association between secondary mathematics and first year university performance in healthsciences. Issues Educ. Res. 2017, 27, 770–783.
43. Anderton, R.; Hine, G.; Joyce, C. Secondary school mathematics and science matters: Predicting academic success for secondarystudents transitioning into university allied health and science courses. Int. J. Innov. Sci. Math. Educ. 2017, 25, 34–47.
44. McMillan, J.; Edwards, D. Performance in first year mathematics and science subjects in Australian universities: Does seniorsecondary mathematics background matter? Final Report. High. Educ. Res. 2019.
45. Hailikari, T.; Nevgi, A.; Komulainen, E. Academic self-beliefs and prior knowledge as predictors of student achievement inmathematics: A structural model. Educ. Psychol. 2008, 28, 59–71. [CrossRef]
46. Faulkner, F.; Hannigan, A.; Fitzmaurice, O. The role of prior mathematical experience in predicting mathematics performance inhigher education. Int. J. Math. Educ. Sci. Technol. 2014, 45, 648–667. [CrossRef]
47. Warwick, J. Mathematical self-efficacy and student engagement in the mathematics classroom. MSOR Connect. 2008, 8, 31–37.[CrossRef]
48. Linnenbrink, E.A.; Pintrich, P.R. The role of self-efficacy beliefs instudent engagement and learning intheclassroom. Read. Writ. Q.2003, 19, 119–137. [CrossRef]
49. Li, Q.; Ma, X. A Meta-analysis of the effects of computer technology on school students’ mathematics learning. Educ. Psychol. Rev.2010, 22, 215–243. [CrossRef]
50. Attard, C.; Holmes, K. “It Gives You That Sense of Hope”: An exploration of technology use to mediate student engagement withmathematics. Heliyon 2020, 6, e02945. [CrossRef]
51. Cheung, A.C.; Slavin, R.E. The effectiveness of educational technology applications for enhancing mathematics achievement inK-12 classrooms: A meta-analysis. Educ. Res. Rev. 2013, 9, 88–113. [CrossRef]
52. Elmer, T.; Mepham, K.; Stadtfeld, C. Students under lockdown: Comparisons of students’ social networks and mental healthbefore and during the COVID-19 Crisis in Switzerland. PLoS ONE 2020, 15, e0236337. [CrossRef]
53. Schumacker, E.; Lomax, G. A Beginner’s Guide to Structural Equation Modelling, 4th ed.; Routledge: London, UK, 2016.54. Kline, R.B. Principles and Practice of Structural Equation Modeling; Guilford Publications: New York, NY, USA, 2015.55. Koufteros, X.A. Testing a model of pull production: A paradigm for manufacturing research using structural equation modeling.
J. Oper. Manag. 1999, 17, 467–488. [CrossRef]56. MacCallum, R.; Browne, M.; Sugawara, H.M. Power analysis and determination of sample size for covariance structure modeling.
Psychol. Methods 1996, 1, 130–149. [CrossRef]57. Hu, L.; Bentler, P.M. Cutoff criteria for fit indexes in covariance structure analysis: Conventional criteria versus new alternatives.
Struct. Equ. Model. 1999, 6, 1–55. [CrossRef]58. Teo, T.; Zhou, M. Explaining the intention to use technology among university students: A structural equation modeling approach.
J. Comput. High. Educ. 2014, 26, 124–142. [CrossRef]59. Cheung, G.W.; Rensvold, R.B. Evaluating goodness-of-fit indexes for testing measurement invariance. Struct. Equ. Model. 2002, 9,
233–255. [CrossRef]
Mathematics 2022, 10, 2314 23 of 23
60. Fornell, C.; Larcker, D.F. Evaluating structural equation models with unobservable variables and measurement error. J. Mark. Res.1981, 18, 39–50. [CrossRef]
61. Cheung, G.W.; Lau, R.S. A direct comparison approach for testing measurement invariance. Organ. Res. Methods 2012, 15, 167–198.[CrossRef]
62. Tracey, T.J.; Xu, H. Use of multi-group confirmatory factor analysis in examining measurement invariance in counselingpsychology research. Eur. J. Couns. Psychol. 2017, 6, 75–82. [CrossRef]
63. Immekus, J.C. Multigroup CFA and alignment approaches for testing measurement invariance and factor score estimation:Illustration with the schoolwork-related anxiety survey across countries and gender. Methodology 2021, 17, 22–38. [CrossRef]
64. Putnick, D.L.; Bornstein, M.H. Measurement invariance conventions and reporting: The state of the art and future directions forpsychological research. Dev. Rev. 2016, 41, 71–90. [CrossRef]
65. Miceli, G.N.; Barbaranelli, C. Structural Equations Modeling: Theory and Applications in Strategic Management. In ResearchMethods for Strategic Management; Routledge: London, UK, 2015.
66. Brown, G.T.L.; Harris, L.R.; O’Quin, C.; Lane, K.E. Using multi-group confirmatory factor analysis to evaluate cross-culturalresearch: Identifying and understanding non-invariance. Int. J. Res. Method Educ. 2017, 40, 66–90. [CrossRef]
67. Chen, F.F. Sensitivity of goodness of fit indexes to lack of measurement invariance. Struct. Equ. Model. 2007, 14, 464–504.[CrossRef]
68. Rosseel, Y.; Jorgensen, T.D.; Rockwood, N.; Oberski, D.; Byrnes, J.; Vanbrabant, L.; Savalei, V.; Merkle, E.; Hallquist, M.; Rhemtulla,M.; et al. Lavaan: Latent Variable Analysis. [R package]. 2022. Available online: https://cran.r-project.org/web/packages/lavaan/index.html (accessed on 15 February 2022).
69. Jorgensen, T.D.; Pornprasertmanit, S.; Schoemann, A.M.; Rosseel, Y.; Miller, P.; Quick, C.; Garnier-Villarreal, M.; Selig, J.; Boulton,A.; Preacher, K.; et al. SemTools: Useful Tools for Structural Equation Modeling. [Computer Software]. 2022. Available online:https://CRAN.R-project.org/package=semTools (accessed on 15 February 2022).
70. Trenholm, S.; Peschke, J.; Chinnappan, M. A review of fully online undergraduate mathematics instruction through the lens oflarge-scale research (2000–2015). PRIMUS 2019, 29, 1080–1100. [CrossRef]
71. Busto, S.; Dumbser, M.; Gaburro, E. A Simple but efficient concept of blended teaching of mathematics for engineering studentsduring the COVID-19 pandemic. Educ. Sci. 2021, 11, 56. [CrossRef]
72. Vergara, C.R. Mathematics resilience and achievement goals: Exploring the role of non-cognitive factors to mathematicsperformance of university students amidst of Pandemic. Open Access Libr. J. 2021, 8, 1–10. [CrossRef]
73. Bringula, R.; Reguyal, J.J.; Tan, D.D.; Ulfa, S. Mathematics self-concept and challenges of learners in an online learning environmentduring COVID-19 pandemic. Smart Learn. Environ. 2021, 8, 22. [CrossRef]
74. Baltà-Salvador, R.; Olmedo-Torre, N.; Peña, M.; Renta-Davids, A.I. Academic and emotional effects of online learning during theCOVID-19 pandemic on engineering students. Educ. Inf. Technol. 2021, 26, 7407–7434. [CrossRef] [PubMed]
75. Brooks, S.K.; Webster, R.K.; Smith, L.E.; Woodland, L.; Wessely, S.; Greenberg, N.; Rubin, G.J. The psychological impact ofquarantine and how to reduce it: Rapid review of the evidence. Lancet 2020, 395, 912–920. [CrossRef]
76. Voltmer, E.; Köslich-Strumann, S.; Walther, A.; Kasem, M.; Obst, K.; Kötter, T. The Impact of the COVID-19 pandemic on stress,mental health and coping behavior in German university students—A longitudinal study before and after the onset of thepandemic. BMC Public Health 2021, 21, 1385. [CrossRef]