Breastfeeding experiences during the COVID-19 pandemic in ...
Upload
khangminh22Category
view
1download
0
Finance and Economics Discussion SeriesDivisions of Research & Statistics and Monetary Affairs
Federal Reserve Board, Washington, D.C.
Business Exit During the COVID-19 Pandemic: Non-TraditionalMeasures in Historical Context
Leland D. Crane, Ryan A. Decker, Aaron Flaaen, AdrianHamins-Puertolas, and Christopher Kurz
2020-089
Please cite this paper as:Crane, Leland D., Ryan A. Decker, Aaron Flaaen, Adrian Hamins-Puertolas, andChristopher Kurz (2021). “Business Exit During the COVID-19 Pandemic: Non-Traditional Measures in Historical Context,” Finance and Economics Discussion Se-ries 2020-089r1. Washington: Board of Governors of the Federal Reserve System,https://doi.org/10.17016/FEDS.2020.089r1.
NOTE: Staff working papers in the Finance and Economics Discussion Series (FEDS) are preliminarymaterials circulated to stimulate discussion and critical comment. The analysis and conclusions set forthare those of the authors and do not indicate concurrence by other members of the research staff or theBoard of Governors. References in publications to the Finance and Economics Discussion Series (other thanacknowledgement) should be cleared with the author(s) to protect the tentative character of these papers.

Business Exit During the COVID-19 Pandemic:Non-Traditional Measures in Historical Context
Leland D. Crane Ryan A. Decker Aaron FlaaenAdrian Hamins-Puertolas Christopher Kurz
April 2021
Abstract
Lags in official data releases have forced economists and policymakers to leverage “alter-native” or “non-traditional” data to measure business exit resulting from the COVID-19 pandemic. We first review official data on business exit in recent decades to placethe alternative measures of exit within historical context. For the U.S., business exitis countercyclical and fairly common, with about 7.5 percent of firms exiting annuallyin recent years. Both the high level and the cyclicality of exit are driven by very smallfirms and establishments. We then explore a range of alternative measures of businessexit, including novel measures based on paycheck issuance and phone-tracking data,which indicate exit was elevated in certain sectors during the first year of the pandemic.The evidence is mixed, however; many industries have likely seen lower-than-usual exitrates, and exiting businesses do not appear to represent a large share of U.S. employ-ment. Actual exit is likely to have been lower than widespread expectations from earlyin the pandemic. Moreover, businesses have recently exhibited notable optimism abouttheir survival prospects.
JEL codes: D22, E32, C55, C81
All authors are from the Federal Reserve Board. First draft: October 2020. Tomaz Cajner providedcritical support and feedback for this project. We thank Tim Dore, Nathan Goldschlag, John Haltiwanger,Traci Mach, Brendan Price, John Stevens, and seminar participants at the 2020 Banca d’Italia and FRBJoint Conference, the CAED 2020 seminar series, the Federal Reserve Board, the Boston Fed, and theInternational Monetary Fund for helpful discussions. We thank Anbar Aizenman and Betsy Vrankovich fortechnical assistance and Rosemary Rhodes, Ashley Sexton, and Jacob Williams for research assistance. Wethank Ray Sandza, Adam Liem, and Homebase for providing Homebase data and technical support. Wethank SafeGraph for providing access to their data and Ryan Fox Squire in particular for answering questionsrelated to the data. We thank ADP and Matt Levin, Ahu Yildirmaz, and Sinem Buber for access to andhelp with their payroll microdata. The analysis and conclusions set forth are those of the authors and donot indicate concurrence by other members of the research staff or the Board of Governors of the FederalReserve System.

1 Introduction
Widespread business exit—death—resulting from the Pandemic Recession would have long-lasting consequences for the U.S. economy. Unfortunately, actual business exit is difficult tomeasure in real time since official statistics on business dynamics are released with substantiallags: Bureau of Labor Statistics (BLS) data on establishment deaths during mid-2020 willbecome available in late 2021, and Census Bureau data on firm deaths will likely not bepublic until 2023. As a result, economic commentators and policymakers have been relyingon “alternative” or “non-traditional” data to measure business exit. For example, Figure1 shows several popular indicators of business distress. Business electricity accounts showlittle imprint of the recent economic stress while vacancy rates for office and retail arereaching levels last seen during the Great Recession. Similarly, defaults have jumped, butboth “going out of business” search queries from Google and 30-day defaults have returnedto trend after brief elevation.1 While the many indicators made available by private firmshave improved understanding of recent economic developments, it is critical to be aware ofhistorical patterns of business shutdown and how popular alternative indicators compare.
In this paper we review official data on business closures and deaths before the pandemic,providing a set of stylized facts that are necessary for evaluation of alternative indicatorsof business shutdown. We then evaluate a range of alternative indicators—including severalnew measures of exit we formulate—and discuss what they suggest about business exitsduring the first year of the COVID-19 pandemic.
Official measures of business exit provide valuable historical context in which to evaluatealternative indicators. These statistics reveal business death to be a common occurrence,with about 7.5 percent of firms and 8.5 percent of establishments exiting annually in recentyears. Various measures of business closure—temporary and permanent—have been coun-tercyclical in the past and rose notably during the Great Recession. Levels and cyclicalityof business death are driven primarily by extremely small firms and establishments—thosewith fewer than 5 employees—though larger firms often permanently close individual estab-lishments (locations) as part of geographic or industry restructuring. The facts we documentare interesting independent of COVID-19 considerations.
Alternative indicators of exit during the pandemic’s first year, on balance, suggest thatexit has been elevated at least among small firms and establishments and particularly in thesectors most exposed to social distancing, though this elevated exit was partially offset byreduced exit in pandemic-friendly industries. A rough estimate is that the most troubledsector, other services (NAICS 81, which includes barber shops and nail salons), saw thepermanent exit of more than 100,000 establishments above and beyond historically normal
1Monthly electricity account data available from the EIA Electricity Data Browser athttps://www.eia.gov/electricity/data/browser/; we thank Josh Blonz for this idea and Jacob Williams fordata assistance. Commercial real estate daily vacancy rates are a simple average across Chicago, Dallas,New York, Los Angeles, and San Francisco from Costar, a provider of real estate analytics; see CostarGroup, Inc. (2020)). Google Trends monthly data taken from https://trends.google.com/trends/ with thesearch term “going out of business.” Small business delinquency rates are from Paynet, a provider of lendingand banking analytics; see Paynet, Inc. (2020) and http://sbinsights.paynetonline.com/loan-performance/.
2
600
650
700
750
800
850
900
950
1000
Indu
stria
l
17
17.5
18
18.5
19C
omm
erci
al
2008
2010
2012
2014
2016
2018
2020
2022
Commercial (left)Industrial (right)
Source: EIA through January 2021.
Business electricity accounts
3
4
5
6
7
8
9
10
11
Ret
ail,
Indu
stria
l
8
9
10
11
12
13
14
15
16
Offi
ce
2006
2008
2010
2012
2014
2016
2018
2020
2022
Office (left)Retail (right)Industrial (right)
Source: Costar Group, Inc. data through February 2021.
Commercial real estate vacancy rates
0
10
20
30
40
50
60
70
80
90
100
0
10
20
30
40
50
60
70
80
90
100
Inde
x
2006
2008
2010
2012
2014
2016
2018
2020
2022
Source: Google Trends through February 2021
Google trends: Going out of business
0
1
2
3
4
5
6
7
0
1
2
3
4
5
6
7R
ate
(%)
2006
2008
2010
2012
2014
2016
2018
2020
2022
30-day90-dayDefaults
Source: Paynet, Inc. (2020) data through January 2021.
Small business delinquency rates
Figure 1: High-frequency indicators of business distress
exit levels during the 12 months of March 2020 through February 2021. Results for othersectors may have been more mixed; for example, within the leisure and hospitality sector,some businesses—like full-service restaurants—saw significantly elevated exit, while otherbusinesses—such as those focused on outdoor recreation—saw exit rates similar to, or evenbelow, those of previous years such that exit was not dramatically elevated in the sectoroverall. The retail trade sector appears similar in that some industries—such as clothingstores—saw elevated exit, while others—such as grocery stores—saw below-normal exit, sothe sector overall likely saw only modestly elevated exit on net. Importantly, our best non-traditional measures are more indicative of establishment than firm exit, though we do have
3

some firm-based indicators with useful insights.Taken together along with some prudent guesswork, our sector-level results suggest econ-
omywide excess establishment exit—that is, exit above and beyond pre-pandemic rates—waslikely below 200,000 establishments during the first year of the pandemic, implying an exitrate about one-quarter to one-third above normal. This is roughly consistent with what wefind from rough calculations on official BED data through the second quarter of 2020, whichsuggest fewer than 150,000 excess establishment deaths during the first half of that year.We have less insight into firm exit, though given historical patterns 200,000 excess establish-ment exits would imply roughly 130,000 excess firm exits. Several sectors never saw elevatedexit expectations, at least among small businesses, and as of March 2021 forward-lookingfirm exit expectations were actually below historical exit rates in most sectors. Relativeto popular discussion, then, our results may represent an optimistic update to views aboutpandemic-related business failure. Throughout the paper, though, we emphasize the limita-tions of our non-traditional data, which may lead us substantially to understate or overstateexit. Moreover, even as the pandemic ebbs, business exit risk may remain material as busi-ness owners face overdue credit bills, deferred rent, and other expenses that may have beendelayed but not eliminated by pandemic norms and policies (see, e.g., Simon and Haddon,2021; Gournichas et al., 2021).
We draw these inferences from a number of timely, high-frequency business exit indicators,some of which have been used in existing literature. Two key contributions in this respect,however, are the construction of employment-weighted exit indicators from ADP payrolldata and a permanent business exit measure based on SafeGraph cell phone geolocationdata. We also review more commonly used data on small business operations (from Womplyand Homebase) as well as Census Bureau survey data on business exit expectations.2 Aswe show, these alternative measures are most useful in the context of historical patterns ofbusiness exit.
A key challenge is distinguishing between temporary shutdown and permanent shutdown(death). U.S. statistical agencies provide data on business deaths, but identifying deaths ismore difficult in alternative data sources.3 Typically what can be measured is whether abusiness is engaged in normal activities—e.g., receiving customer traffic, completing trans-actions, or paying workers. We use the term “shutdown” to refer broadly to businesses notengaged in normal activities, whether temporarily or permanently, and we attempt (loosely)to make guesses about actual exits based on how long businesses have been inactive. Weuse the terms “death” and “exit” interchangeably to refer to likely permanent shutdown.We note, however, that the line between temporary and permanent shutdown may be blurryat times, as even temporary shutdown may have significant economic implications if it isprolonged or results in substantial business restructuring before reopening.
A handful of papers study business closure early in the pandemic. Bartik et al. (2020b)
2We also provide brief discussion of more well-known private sector business registers like Yelp and Dun& Bradstreet.
3Permanent business death can be difficult to define and measure even in official data; for example,Sadeghi (2008) shows that establishment death numbers depend materially on how long an establishmentmust be inactive to count as a death (see Charts 10 and 11 therein).
4

surveyed firms in late March and early April and found temporary closure rates around40 percent with permanent closure rates around 2 percent. Fairlie (Forthcoming) exploitsCurrent Population Survey (CPS) data on self-employment and finds that the number ofoperating businesses in June was down 8 percent since March (note that we limit our focusto employer businesses). Bartlett and Morse (2020) study business survival through Aprilin the City of Oakland using survey data and other sources. Wang et al. (2020) report that2020 bankruptcy filings by small businesses through August were significantly lower thanin prior years, a topic also explored by Greenwood et al. (2020). Bartik et al. (2020a) andKurmann et al. (2020) measure early business closures in Homebase data, and Chetty etal. (2020) measure early closures in Womply data. Hamilton (2020) uses Womply and Yelpdata to estimate that as of July 2020, roughly 400,000 businesses had permanently closedduring the pandemic; this number has been widely cited but is likely to be an overestimatein light of official and non-traditional data we review here, which were not available at thetime Hamilton (2020) was written.4 A particular challenge with earlier estimates is that alarge number of early business closures may have been temporary, which is shown by Cajneret al. (2020) and corroborated in the data we describe below.
Dalton et al. (2020a) and Dalton et al. (2020b) are the only papers studying businessclosure in official business data; the authors use establishment microdata from the Cur-rent Employment Statistics (CES)—the data behind the widely followed U.S. monthly jobsreport—along with firm information housed in internal BLS databases to study businessclosure through November 2020 by firm size and establishment industry. The authors findcorroboration for the view that a large share of establishment closures during April and Maywere temporary, though they note that closure appears to have stabilized by July. Theyalso find that establishment closure was far more elevated among small firms than amonglarge firms (and more elevated among large multi-establishment firms than large single-establishment firms). As we argue below, the results in Dalton et al. (2020b) suggest thatthe share of employment associated with cumulative establishment closures through Novem-ber 2020 was not dramatically above that of previous years, consistent with our findings.Interestingly, the authors find that about a quarter of job losses among restaurants are dueto establishment closure, while the closure share is closer to half among drinking places.
We first provide general background on the importance of business exit, drawing fromliterature and the unique aspects of the COVID-19 pandemic (Section 2). We explore his-torical patterns of business exit, summarizing them as a list of stylized facts, in Section 3.We review a range of official and non-traditional measures of business shutdown during 2020in Section 4, then we survey data on small business expectations in Section 5. We take stockand conclude in Section 6.
4The 400,000 figure has been cited not only by high-level government officials but also in academicliterature, e.g., Wang et al. (2020). Data from the BED (reviewed below) suggest that, at most, 350,000establishments—and even fewer firms—closed permanently during the second quarter of 2020.
5

2 Background on business exit
Business exit is a natural phenomenon in healthy market economies, and while the closureof weak businesses can be productivity enhancing, business exit imposes profound costs on,workers, owners, and communities. Existing literature shows that death, as part of a broaderset of business dynamics patterns, enhances aggregate productivity as lower-productivityexiting businesses are replaced by higher-productivity entrants.5 These patterns also releaseresources, both employment and capital, to be used more efficiently elsewhere. Some businessexits occur as large firms restructure their activities across industry and geography, closingsome establishments while opening others to better meet demand or to adjust to changingglobal supply chains (e.g., Davis et al., 2014; Fort et al., 2018).
The pandemic-induced recession raises concerns about whether exit can be as productiv-ity enhancing as it has been in the past. In the current environment, patterns of businessexit may be driven by the geographic, industrial, and temporal onset of severe infection out-breaks and lockdowns rather than business productivity. As a result, many high-productivitybusinesses might fail during the COVID-19 episode, potentially implying negative effects onaggregate productivity. In a broader sense, exit selection—–the relationship between businessproductivity and exit–—has been weakening for decades (Decker et al., 2020), and patternsof business exit were less productivity enhancing during the Great Recession than in previousrecessions (Foster et al., 2016). For these reasons, we might expect exit selection to be lesshealthy during the pandemic than in the past.6 Moreover, to the extent that the industryrestructuring witnessed in 2020 (e.g., the decline in leisure & hospitality employment withgains in pandemic-friendly industries) is temporary, business exits that occur in decliningindustries may be especially wasteful.
Business exit implies permanent job destruction, potentially detaching workers from thelabor market and limiting the speed of the employment recovery.7 While the costs of exit-induced layoffs may be manageable during periods of strong labor markets, releasing workersonto labor markets at a time of high unemployment—such as the pandemic period—is moreconcerning. Relatedly, business exit destroys the match-specific capital formed by a firm’srelationship with its workers. As documented in Fujita and Moscarini (2017), a large shareof workers return to their former employers after being separated (“recall hires”). Businessexit eliminates this recall option and, potentially, implies longer unemployment spells for
5For theoretical considerations around the role of exit in aggregate productivity see, e.g., Hopenhayn(1992) and Hopenhayn and Rogerson (1993). For empirical explorations see, e.g., Bartelsman et al. (2013),Decker et al. (2017), Decker et al. (2020), Foster et al. (2001), Foster et al. (2006), Foster et al. (2016),and Syverson (2011). Exit, and firm turnover more generally, have been linked to industry cost structuresince industries with lower sunk costs exhibit higher firm turnover (both theoretically and empirically); seeGschwandtner and Lambson (2012) and citations therein.
6Additionally, policies designed to save businesses and jobs may have saved businesses that would haveexited had the pandemic never occurred, a source of potential misallocation that may result in additionalexit in the near future; for example, see Gournichas et al. (2021).
7Exit is a significant contributor to overall job destruction. In Census Bureau Business Dynamics Statisticsdata for 2015-2018, establishment exit accounted for 32 percent of annual gross job destruction, while firmexit accounted for 17 percent.
6

workers that must form new employment relationships.Business exit, particularly when it involves entire firms rather than single locations, also
means the destruction of firm-specific forms of intangible capital—brand value and tacitknowledge about production or distribution—and costly reallocation of physical capital (seeCooper and Haltiwanger, 2007). From the perspective of business owners, the exit of a firmmeans not only the loss of a job and career disruption but also potentially the destruction ofhousehold wealth. And from the perspective of local economies, widespread business deathsmay permanently alter the economic geography of neighborhoods and communities.
3 Historical patterns of business closure and death
Both the Bureau of Labor Statistics (BLS) and the Census Bureau publish official statis-tics on business closure and death. The BLS publishes establishment closure and deathdata through the quarterly Business Employment Dynamics (BED) product.8 These dataare based on the state and federal unemployment insurance data underlying the QuarterlyCensus of Employment and Wages (QCEW) product, cover the near-universe of U.S. pri-vate nonfarm business establishments with formal employees, and start in the early 1990s.9
The BLS provides two measures of business shutdown: establishment “closures” are estab-lishments that had positive employment in the third month of the previous quarter butzero employment (or no reported employment) in the third month of the current quarter,and establishment “deaths” are establishments that have been closed for four consecutivequarters.
Separately, the Census Bureau publishes both firm and establishment exit data throughthe annual Business Dynamics Statistics (BDS) product.10 Firms and establishments withpositive employment in March of the previous year but no employment in March of thecurrent year are counted as deaths. While the BDS only provides annual data, rather thanquarterly as in the BED, the BDS has advantages of a longer time series (starting in thelate 1970s, though we focus on post-1983 data) and ability to distinguish between firm andestablishment deaths.
3.1 Levels and cyclicality
Figure 2 reports official data on business closures and deaths in recent decades. The toppanel reports annual firm and establishment death rates from the BDS through 2018, with un-
8An “establishment” is a single business operating location (with few exceptions). A “firm” is a collectionof one or more establishments under common ownership or operational control.
9The main omissions are railroads and some nonprofits that do not participate in state unemploymentinsurance systems.
10We use the current BDS redesign vintage introduced in September 2020. In the appendix we reportdifferences between the 2020 BDS vintage and the legacy vintage; our broad conclusions about historicalexit patterns are apparent in both vintages. BDS data are based on the Census Bureau’s Business Register,which covers nearly the universe of private nonfarm business establishments with employees (the mainexceptions are railroads and certain financial entities).
7

weighted death rates (deaths as a share of establishments) on the left panel and employment-weighted death rates (employment at deaths as a share of employment) on the right panel.The bottom panel reports quarterly establishment closure and death rates from the BED(seasonally adjusted) through 2019, again with unweighted rates on the left and weightedrates on the right.11
6
8
10
12
14
6
8
10
12
14
Ann
ual r
ate
(%)
1982
1986
1990
1994
1998
2002
2006
2010
2014
2018
Establishment deathsFirm deaths
BDS - Unweighted
1
2
3
4
5
6
7
1
2
3
4
5
6
7
Ann
ual r
ate
(%)
1982
1986
1990
1994
1998
2002
2006
2010
2014
2018
BDS - Employment weighted
2
3
4
5
6
7
8
2
3
4
5
6
7
8
Qua
rter
ly r
ate
(%)
1992
1996
2000
2004
2008
2012
2016
2020
Establishment deathsEstablishment closures
BED - Unweighted
0
.5
1
1.5
2
0
.5
1
1.5
2
Qua
rter
ly r
ate
(%)
1992
1996
2000
2004
2008
2012
2016
2020
BED - Employment weighted
Note: DHS denominators. BDS data are noisy around Economic Census years (2's and 7's).Establishments are single operating business locations.Firms are collections of one or more establishments under common ownership or operational control.Source: BLS Business Employment Dynamics (BED), Census Bureau Business Dynamics Statistics (BDS).
Figure 2: Historical patterns of business shutdown
11In all panels we use Davis et al. (1996) (DHS) denominators, where the current and previous quarters’ oryears’ values are averaged (using longitudinally precise lag values where possible). In the appendix, we repeatthe correlation and regression calculations that follow using the lag (i.e., initial) values only as denominators.Our main stylized facts are unaffected by this specification choice.
8

Figure 2 shows that business shutdown and death are common occurrences. In recentyears (2015-2018), annual firm death rates have been around 7.5 percent of firms (about400,000 per year), while establishment death rates have been around 8.5 percent at the annualfrequency (about 600,000 per year) or just over 2.5 percent at the quarterly frequency.12 Acomparison of the left and right panels reveals that business death comprises a much smallershare of employment than of firms or establishments, implying that exit is concentratedamong smaller businesses (as we will explore further below).13 Figure 2 also suggests thatmost measures of business shutdown are countercyclical, with particularly notable increasesduring the Great Recession (when firm exit rates rose by roughly 1.5 percentage pointsfrom the previous expansion low). Finally, a comparison of quarterly deaths and quarterlyclosures in BED data indicates that temporary closure is common, affecting roughly 2 percentof establishments or about 0.5 percent of employment each quarter (the difference betweenthe red and blue lines); this likely reflects some combination of typical seasonal businesssuspensions and temporary periods of business distress.
We can more clearly observe the countercyclicality of business shutdown with some sim-ple correlations, reported on Table 1. We compare our firm and establishment shutdownmeasures—detrended with linear trends—with the change in the unemployment rate andreal GDP growth (at quarterly frequency for comparisons with BED measures and annualfrequency for comparisons with BDS measures).14
Table 1: Business cycle correlations
Unemployment GDPUnweighted Weighted Unweighted Weighted
BED: Establishment closures (BLS) .34 .23 -.40 -.13BED: Establishment deaths (BLS) .36 .31 -.44 -.21BDS: Establishment deaths (Census) .64 .37 -.46 -.16BDS: Firm deaths (Census) .41 .31 -.32 -.18
Note: Exit rates detrended linearly. BED correlated with quarterly change in unemploy-ment rate or change in log real GDP. BDS correlated with annual change in unemploymentrate or change in log real GDP on BDS annual timing (April-March). BED data cover1992q3-2019q1 (deaths) or 1992q3-2019q4 (closures). BDS data cover 1984-2018 (trendsestimated on full 1978-2018 sample).
12Quarterly rates need not aggregate to annual rates due to short-lived establishments or potential dis-crepancies between BDS and BED data.
13The BLS BED program also publishes quarterly employment-weighted firm closure rates, not shown onFigure 2, which have averaged about 0.7 percent per quarter in recent years. The BLS defines a firm basedon tax identifiers, while the Census Bureau definition is based on overall ownership or control.
14We first take the average of the unemployment rate for the period; that is, we calculate the quarterlyaverage of monthly data for BED comparisons, and we calculate the annual average of monthly data forBDS comparisons (where the BDS year t is defined as April t − 1 through March t). We then take thedifference in these quarterly or annual averages. Correlations with the level of unemployment rates (ratherthan the change) would be difficult to interpret given persistence of unemployment rates in the aftermathof recessions. For GDP correlations, we calculate the change in the log of real GDP at quarterly frequencyfor BED comparisons or the change in the log of annual GDP (on BDS timing) for BDS comparisons, whereannual GDP is the average of the quarterly GDP level for the year.
9

Simple correlations are consistent with countercyclical shutdown and exit (i.e., positivecorrelations with the change in unemployment and negative correlations with GDP growth).Employment-weighted establishment shutdowns are less countercyclical than unweighted es-tablishment shutdowns (again suggesting that smaller units drive exit cyclicality), and firmdeath is less countercyclical than establishment death.15 The specifications in Table 1 showconsistent countercyclicality of both establishments and firms; in unreported results we findthat these are somewhat sensitive to inclusion of the 1980-1983 period, a volatile period forexit measures in which firm exit is less countercyclical.16
In appendix Table A1 we detrend exit measures with the method of Hamilton (2018) andfind broadly similar results, though firm exit correlations with GDP are weaker under thisalternative detrending approach. In appendix Table A2 we report results specifying the GDPcomponent of the correlations using detrending methods of Hamilton (2018) and Hodrickand Prescott (1997), in which countercyclical exit is still evident though the results for firmsversus establishments and weighted versus unweighted exit are less clear cut. In appendixTable A12 we report correlations of exit with industrial production, another business cycleconcept, and find that exit is countercyclical with respect to this indicator as well.
The time series correlations above are suggestive but limited. We can gain more businesscycle variation using state-level data. Here we simplify by focusing on annual BDS dataduring the post-2002 period, thereby avoiding the need to detrend the exit series (and alsoavoiding the potentially problematic 2002 observation, discussed more in the appendix).Table 2 reports results from regressions of exit rates on the annual change in unemploymentwith state fixed effects (such that we study within-state business cycle fluctuations).
Business cycle correlations are substantial within states, with unweighted exit rates beingmore cyclical than weighted rates for both establishments and firms (i.e., smaller units drivethe cyclicality) and firm exit being less cyclical than establishment exit.17 For example,the interpretation of the first coefficient is that a one percentage point rise in the stateunemployment rate is associated with a 0.56 percentage point increase in the establishmentexit rate. Taken together with Table 1, the data consistently show that exit is countercyclical,particularly in recent years.18
15Correlations of the level of establishment deaths or firm deaths (rather than death rates) with the changein unemployment also indicate countercyclical exit, as we show in appendix Table A3. Separately, as can beseen from Figure 2, BDS data show notable spikes in exit in 2002 and other years ending in 2 or 7, suggestingthere may be data challenges created by semi-decadal Economic Censuses. The previous vintage of BDSdata displayed somewhat different patterns; see the appendix for analysis of Census year and vintage issues.
16We intentionally begin the BDS-based sample in 1984 for Table 1 and all other results unless otherwisenoted. Firm countercyclicality is highly sensitive to specific years included in the 1980-1983 period. Inthe appendix Table A8 we report correlations for the entire 1978-2018 period covered by the current BDSvintage, in which firm exit countercyclicality is nevertheless apparent.
17The 2003-2018 period included in the Table 2 estimates includes three Economic Census years (2007,2012, and 2017), but the coefficients are little changed if Census years are omitted (see appendix Table A7).Separately, coefficients are similar in regressions without state fixed effects or with both state and year fixedeffects (see appendix Table A9).
18See Clementi and Palazzo (2016) for a model-based exploration of exit countercyclicality. Lee andMukoyama (2015) document the relative cyclicality of entry and exit of manufacturing plants.
10

Table 2: Business cycle comovement: States
Establishment death Firm deathUnweighted Weighted Unweighted Weighted
Change in unemp 0.56*** 0.22*** 0.37*** 0.11***(0.03) (0.02) (0.02) (0.01)
Observations 816 816 816 816State FE Yes Yes Yes YesYear FE No No No No
Note: Regression of annual exit rates on annual change in unemploy-ment rates, 2003-2018. Unemployment rate changes timed to corre-spond with BDS annual timing (April-March).***denotes statistical significance with p < 0.01.Source: Author calculations from Business Dynamics Statistics andBLS unemployment data.
3.2 Exit by firm and establishment size
As noted above, the differences between unweighted and weighted exit rates suggest thatbusiness exit is concentrated among smaller units, in terms of both overall exit rates and thecyclicality of exit. This is made clear by Figure 3, which plots annual establishment deathrates (left panels) and firm death rates (right panel), reported by both firm (top panels) andestablishment (bottom panel) size categories.
The smallest firms—those with fewer than 5 employees—have the highest exit rates, withtypical rates markedly above any other firm size classes.19 Firm death rates decline mono-tonically with firm size. Establishment death rates are likewise highest among the smallestfirms, but the largest firms—–those with 500 or more employees–—have the second-highestestablishment death rates; intuitively, large multi-unit firms may close many establishmentsper year (and potentially open many others) as part of geographic or industrial restructur-ing.20
The bottom panel shows that establishment death rates decline monotonically in estab-lishment size, with the smallest establishments exiting at rates well above other size classes.More broadly, Figure 3 makes apparent that the rise in business death during the GreatRecession was driven in large part by small firms and establishments.
19Among firms with fewer than 5 employees, death rates are highest among firms that entered during theprevious year. In many years, death rates among these new, extremely small firms exceed 30 percent. Yeteven among firms at least 10 years old, death rates in this size category are around 10 percent. This may inpart reflect gradual downsizing of previously large firms that enter this small size category during their finalyear.
20Decker et al. (2016) find that, on net, multi-unit firms open establishments during expansions and closeestablishments during recessions, which the authors rationalize using a model in which firms adjust productor market in response to aggregate shocks; this can help explain the countercyclicality of firm volatility.
11

0
4
8
12
16
20
0
4
8
12
16
20
Per
cent
of e
stab
lishm
ents
1982
1986
1990
1994
1998
2002
2006
2010
2014
2018
Establishment death by firm size
0
4
8
12
16
20
0
4
8
12
16
20
Per
cent
of f
irms
1982
1986
1990
1994
1998
2002
2006
2010
2014
2018
Firm death by firm size
0
4
8
12
16
20
0
4
8
12
16
20
Per
cent
of b
otto
mle
ft
1982
1986
1990
1994
1998
2002
2006
2010
2014
2018
Establishment death by establishment size
Note: Unweighted exit rates with DHS denominators. BDS data are noisy in Economic Census years (2's and 7's).Source: Census Bureau Business Dynamics Statistics (BDS).
1-4 employees 5-9 employees 10-19 employees
20-99 employees 100-499 employees 500+ employees
Figure 3: Business death rates by firm and establishment size
12

3.3 Stylized facts about business shutdown
The above data suggest a set of stylized facts that must be kept in mind as alternativemeasures of business shutdown are examined:
• Annual firm exit rates have averaged around 7.5 percent in recent years—roughly400,000 firms—or 2 percent of employment.
• Annual establishment exit rates have averaged around 8.5 percent in recent years—roughly 600,000 establishments—or 3.5 percent of employment.
• Quarterly establishment death rates have averaged about 2.5 percent, or about 0.5percent of employment.
• Business exit is countercyclical; in particular, firm exit rates rose by about 1.5 percent-age points in the Great Recession.
• The overall rate of business exit and the countercyclicality of exit are driven primarilyby very small firms and establishments.
• Temporary business closure is common, affecting about 2 percent of establishmentsper quarter.
4 Has COVID-19 sparked a surge in business exit?
Official data on business exit are released with a lag: BED data on establishment closuresare currently available for the second quarter of 2020, but BED deaths for that quarter willnot be available until fall of 2021. BDS data on firm deaths during 2020 will (presumably)not be available until 2023, as currently available data extend only through March of 2018.21
In the meantime, we must rely on some guesswork along with non-traditional measures ofbusiness activity to assess the magnitude of business exit during 2020. We now describeseveral such measures.
21BED data are released with a lag of about two quarters, but deaths, by definition, are not observeduntil three quarters later. The BDS reports business activity as of March 12 of each year and is typicallyreleased with a lag of about two years (similar to the County Business Patterns product). Since much of theeconomic fallout from COVID-19 occurred after March 12, 2020, most pandemic-related exit will be observedin the BDS data for 2021. Statistical agencies face significant challenges when measuring business exit (andentry), and this paper is in no way a criticism of the agencies for the lags with which these data are released.Administrative source data are complicated and require careful processing, particularly when longitudinalaspects are important (as is the case for business exit). Moreover, in the past business exit has not typicallyreceived the intense research, policy, and media focus that has characterized the pandemic period; in recentdecades, exit has been less volatile than entry, and the latter tends to receive more focus given its relationshipto entrepreneurship. Therefore it is not surprising that exit is not measured and published in real time, evenin proxy form. The Census Bureau publishes proxy indicators of business entry—in the form of business taxapplication data—in near real time as part of the Business Formation Statistics product.
13

4.1 Business Employment Dynamics data
While official data on firm and establishment deaths are not yet available, we can observeBLS data on establishment closures—which include potentially temporary closures—duringthe first and second quarters of 2020 in the BED. These data, which measure establishmentspaying no employees in the third month of a given quarter (but with positive employmentin the third month of the previous quarter), provide a view into establishment shutdownsduring the first half of the year from high-quality administrative data.22 Figure 4 showsestablishment closure rates (left panel) and numbers of establishments and jobs associatedwith closures (right panel).
0
2
4
6
8
10
0
2
4
6
8
10
Qua
rter
ly r
ate
2019
q1
2019
q2
2019
q3
2019
q4
2020
q1
2020
q2
UnweightedEmployment weighted
Rates
0
250
500
750
1000
1250
1500
1750
2000
2250
2500
2750
3000
Em
ploy
men
t (th
ousa
nds)
0
100
200
300
400
500
600
700
800
Est
ablis
hmen
ts (
thou
sand
s)
2019
q1
2019
q2
2019
q3
2019
q4
2020
q1
2020
q2
Establishments (left)Employment (right)
Levels
Note: Includes potentially temporary closures.Source: Census Bureau Business Dynamics Statistics (BDS).
Figure 4: Establishment closure rates, 2019-2020
Focusing on the left panel of Figure 4, the quarterly share of establishments closing rosefrom just above 5 percent during 2019 to 6 percent during the first quarter of 2020 and nearly9 percent during the second quarter. Second-quarter closures accounted for nearly 2.5 percentof private sector employment.23 The right panel shows that 500,000 establishments closedduring the first quarter followed by more than 700,000 establishments in the second quarter;the second-quarter pace exceeded the 2019 average pace by nearly 300,000 establishments.Those establishments that closed in the second quarter were associated with nearly 2.9million jobs.
Historically, roughly half of establishment closures result in permanent deaths.24 If thishistorical share held during the first quarter of 2020 it would imply about 250,000 estab-lishment deaths, roughly 25,000 above the 2019 quarterly average. For the second quarter,
22The BLS has noted that data collection for the BED (and the related QCEW product) may havebeen affected by the pandemic; see https://www.bls.gov/covid19/effects-of-covid-19-pandemic-on-business-employment-dynamics.htm.
23The BED quarterly employment-weighted firm closure rate, not shown on Figure 4, rose from an averagerate of 0.7 percent in 2019 to 0.8 percent in 2020q1 and 1.8 percent in 2020q2.
24This share averaged 53 percent during the 2018q1-2019q3 period.
14

the historical share would imply about 350,000 total establishment deaths, about 125,000above the 2019 quarterly average. But we expect that establishment closures during theearly months of the pandemic are more likely than normal to have been temporary (Cajneret al., 2020) such that 600,000 total establishment deaths and 150,000 excess establishmentdeaths are extreme upper bound estimates for actual deaths during the entire first half of2020. Firm deaths (and excess deaths) would be lower still, historically equalling abouttwo-thirds of establishment deaths. Moreover, as we argue in section 4.1 above, Dalton et al.(2020b) estimates from BLS microdata suggest that cumulative establishment closures—atleast on an employment-weighted basis—were roughly back on historical patterns by late2020. For these reasons, the Womply-based estimate of Hamilton (2020)—constructed wellbefore BED data were available—that 400,000 firms closed permanently between March andearly July is probably somewhat too high.
The elevated establishment closure patterns of 2020 varied widely across sectors. Figure5 shows closure rates (top panel) and employment-weighted closure rates (bottom panel)during the second quarter (in blue) compared with the average of 2015-2019 (red) andthe maximum quarterly closure rate seen during the Great Recession of 2007-2009. Everysector saw higher rates in the second quarter than the 2015-2019 average. Most sectorsalso saw higher closure rates than the peaks of the Great Recession; the exceptions areconstruction, financial activities, and (in employment-weighted terms) natural resources &mining and manufacturing. While all sectors saw high closure rates, other services andleisure & hospitality saw extremely high rates, exceeding 13 percent of establishments and6.5 percent of private sector employment.
The closure rates seen in Figures 4 and 5 are instructive about the early pandemic period,but two caveats are notable. First, to count as closed, an establishment must have no paidemployment for the third month of the quarter; establishments with paid workers in Junebut none in April or May do not count as closed. Second, existing literature and datawe discuss below find that a large share of businesses that closed in the early months ofthe pandemic reopened thereafter; our rough permanent death calculations above are onlysuggestive upper bounds.
Here it is also useful to note that Dalton et al. (2020b), using BLS microdata but notactual BED data, find that about 2.3 percent of February 2020 employment at small firmsand roughly 0.5 percent of February 2020 employment at large firms was associated withestablishments that were closed three quarters later in November 2020, for a rough overallemployment-weighted closure rate of about 1.4 percent for that period (calculated as theweighted average of small and large firm rates using 2019 BED firm size weights; see Bureauof Labor Statistics, 2020b, for BED firm size data). Roughly speaking (and ignoring sea-sonality), this implies an annualized employment-weighted closure rate of 1.9 percent. Thisis close to the typical annual employment-weighted establishment death rate seen in BDSdata for recent years (top-right panel of Figure 2) and actually well below typical annualemployment-weighted establishment closure rates reported in BED data, consistent with thenotion that business death has not accounted for a dramatically elevated share of job de-
15

0 2 4 6 8 10 12 14Percent of establishments
Financial Activities
Nat. Resources & Mining
Information
Prof & Business Svcs
Wholesale Trade
Education & Health
Manufacturing
Construction
Economywide
Transp. & Warehous.
Retail Trade
Leisure & Hospitality
Other Services
Unweighted
2020q2
2015-2019 average
2007-2009 max
0 1 2 3 4 5 6 7 8Percent of employment
Manufacturing
Financial Activities
Nat. Resources & Mining
Wholesale Trade
Construction
Prof & Business Svcs
Education & Health
Transp. & Warehous.
Retail Trade
Information
Economywide
Other Services
Leisure & Hospitality
Employment weighted
Note: Quarterly rates (seasonally adjusted). Bars ordered by difference between 2020q2 and2015-2019 average. Includes temporary closures.Source: BLS Business Employment Dynamics.
Figure 5: Establishment closure rates, 2020q2 versus history
16

struction during the pandemic.25 Based on these data, we might expect BED closure ratesto come down in the third quarter reading (to be released in late April 2021).
4.2 ADP
The best non-traditional measures of business closure come from business databases in whichdata are generated automatically from actual business activity such as revenue transactions,payroll events, or customer traffic. We first describe business closure measures based onmicrodata from ADP, a provider of payroll processing services for businesses comprisingabout one-fifth of total private sector employment.26 Key advantages of ADP data aretheir comprehensive coverage across business size and industry cells as well as the ability toobserve both unweighted and employment-weighted business closure measures. A challengeof these data is that some ADP clients may process payroll at the establishment level,while others may process at the firm level or something in between; we follow Cajner etal. (2018) in treating ADP units as establishments. Another challenge—in the context ofbusiness shutdown—is that true shutdown cannot be distinguished from ADP client turnover,a limitation present in many non-traditional business microdata sources.
In the ADP data, we observe paycheck issuance events at the business level. Pay fre-quency varies by business—weekly, biweekly, or monthly—so we measure business shutdownbased on the length of time a business goes without issuing pay. Since we have a long historyof ADP data, we focus on comparing the 2020-2021 experience to the average experiencefrom recent years (2015-2019); this allows us to abstract from typical patterns of ADP clientturnover and determine the extent to which business shutdown has been elevated in thepandemic relative to normal. We begin in mid-February 2020 and, for each week thereafter,we tally up the share of businesses that were operating in February 2020 but are in the midstof a shutdown period. We compare this share to the same-week average for the 2015-2019period (i.e., the average for February cohorts of businesses starting in each of 2015-2019).27
In all cases, we apply sampling weights to ADP payroll units from the QCEW (with weightsin terms of NAICS sector and establishment size as of March of 2020).28
25In addition to quarterly data, the BLS BED program publishes year-over-year establishment closuredata timed to March of each year; see Bureau of Labor Statistics (2020a). Annual employment-weightedestablishment closure rates in BED data average 2.8 percent during 2015-2019.
26Cajner et al. (2018) describe ADP microdata in detail and document representativeness across businesssize and industry. Cajner et al. (2020) use ADP data to explore various dimensions of the early pandemicrecession including business shutdowns and reopenings, temporary versus permanent job losses, and wagedynamics.
27For example, the 2019 cohort data extend from February 2019 through February 2020.28We also take the 2-week trailing moving average of all series to smooth through volatility associated with
varying pay frequencies across businesses. Importantly, in this and subsequent sections our exit measurediffers slightly from the DHS-based measure from BDS and BED data to which we make comparisons. Innon-traditional sources we will generally calculate exit rates as the share of firms operating at the beginningof the pandemic that are not operating at some later date. This is necessary so that we do not have to makeassumptions about firm entry in the intervening period, which would be required for calculating the DHSdenominator. As we show in the appendix, in BDS data the choice of denominator is not quantitativelycritical for the types of exit measures we study, so we prefer to view this conceptual discrepancy as a
17

The top-left panel of Figure 6 shows the results for various shutdown durations. Theblue line shows the share of businesses that are in a shutdown spell of at least 25 days, in2020 relative to the 2015-2019 average for a given week. By late April of 2020, the share ofbusinesses in a 25-day (or more) shutdown spell was nearly 12 percentage points higher thanit was at the same time in past years. After that time, however, closed businesses reopenedsuch that the share of businesses that were shut down returned to the historical pace by lateAugust.
Importantly, businesses that issue paychecks at a monthly frequency routinely count asshutdowns according to the blue line, as they typically issue paychecks more than 25 daysapart. Staying in the top-left panel of Figure 6, the red line uses a more stringent criteria formeasuring shutdowns, reporting the share of businesses that were in shutdown spells of atleast 36 days (relative to the same measure in previous years). This ensures that businessesthat pay on any pay frequency—weekly, biweekly, or monthly—do not count as spuriousshutdowns. The red line indicates that by late April 2020, the share of businesses that werein shutdown spells of at least 36 days exceeded historical patterns by more than 6 percentagepoints. The black line focuses on shutdown spells of 70 days or more; if permanent shutdownwere elevated among ADP businesses, we would expect to see it in this line at least. Whilethe share of businesses shut down for 70 days or more exceeded historical averages by about2 percentage points in early May, it has since returned to normal.
In short, while business shutdown, including shutdown spells of more than two months,was elevated in the late Spring of 2020, by the end of August we observe no evidence ofexcessive, ongoing business inactivity; in fact, shutdown was well below normal by late 2020.We even do not see evidence of a shutdown surge during the latest wave of Covid cases ofNovember-February. The historically low pace of shutdowns in late 2020 likely reflects, inlarge part, increased client retention during 2020, which has been noted in ADP earningscalls. This makes the data difficult to interpret; still, though, if permanent death wereextremely elevated in 2020, it would likely be reflected in this large dataset.29 So the data,while not dispositive, are at least suggestive.
The top-right panel of Figure 6 shows the same concepts in an employment-weighted form.To calculate employment-weighted shutdowns in any given week, we identify businesses thatmeet a given shutdown criteria (25 days, 36 days, or 70 days) then calculate their employmentshare based on their February 15 employment as a share of total February 15 employment.Hence, the top-right panel of Figure 6 shows the share of February’s employment that isassociated with businesses that shut down in some weeks thereafter, in 2020 compared with
source of measurement error with magnitude that is small relative to other sources of error inherent in ournon-traditional measures.
29ADP’s fiscal Q4 2020 earnings report (ADP, 2020b), which covered the calendar quarter ending June30, 2020, noted an overall decline in client retention in that quarter. But retention rebounded, apparently;the fiscal Q2 2021 report (ADP, 2020a), which covered the calendar quarter ending December 31, 2020,noted ”an all-time high retention level” and ”record client retention.” In the associated earnings call, ADPexecutives noted that retention has been trending higher in recent years generally and that compositionshifts from older to newer ADP products naturally raise retention. Higher-than-historical retention helpsexplain why relative shutdown measures shown on Figure 6 moved below zero after the summer surge.
18

-4
-2
0
2
4
6
8
10
12
-4
-2
0
2
4
6
8
10
12
Per
cent
age
poin
ts,
2020
vs.
201
5-20
19 a
vera
ge
Febru
ary
May
Augus
t
Novem
ber
Febru
ary
At least 25 daysAt least 36 daysAt least 70 days
Note: Share of Feb. 15, 2020 businesses issuing nopaychecks, current minus same-week 2015-2019average.Source: ADP. Weekly data through Feb. 27, 2021.
Share of businesses closed by duration,difference from historical share
-4
-2
0
2
4
6
-4
-2
0
2
4
6
Per
cent
age
poin
ts,
2020
vs.
201
5-20
19 a
vera
geFeb
ruar
yM
ay
Augus
t
Novem
ber
Febru
ary
At least 25 daysAt least 36 daysAt least 70 days
Note: Share of Feb. 15, 2020 employment at businessesissuing no paychecks, current minus same-week2015-2019 average.Source: ADP. Weekly data through Feb. 27, 2021.
Share of employment closed by duration,difference from historical share
-3
-2
-1
0
1
2
-3
-2
-1
0
1
2
Per
cent
age
poin
ts,
2020
vs.
201
5-20
19 a
vera
ge
Febru
ary
May
Augus
t
Novem
ber
Febru
ary
1-49 employees50-499 employees500+ employees
Note: Share of Feb. 15, 2020 businesses issuing nopaychecks for 70+ days, current minus same-week2015-2019 average.Source: ADP. Weekly data through Feb. 27, 2021.
Share of businesses closed by initial size,difference from historical share
-4
-2
0
2
4
6
-4
-2
0
2
4
6
Per
cent
age
poin
ts,
2020
vs.
201
5-20
19 a
vera
ge
Febru
ary
May
Augus
t
Novem
ber
Febru
ary
ManufacturingTrade/Transportation/UtilitiesProfessional & Business ServicesEducation & Health ServicesLeisure & Hospitality
Note: Share of Feb. 15, 2020 businesses issuing nopaychecks for 70+ days, current minus same-week2015-2019 average.Source: ADP. Weekly data through Feb. 27, 2021.
Share of businesses closed by supersector,difference from historical share
Figure 6: Measures of business closure from ADP payroll data (2020-2021 relative to 2015-2019 average)
19

the 2015-2019 average for that week. Employment-weighted shutdown also peaked in lateApril/early May 2020, when businesses inactive for at least 25 weeks accounted for a share ofFebruary employment that exceeded past years by about 5 percentage points. In employmentterms, extremely long shutdown spells of 70 days or more were barely more common in mid-2020 than in past years; and by late August the share of employment attached to closedbusinesses was lower than average. As we argue in section 4.1, BLS data studied by Daltonet al. (2020b) are also consistent with the notion that employment-weighted shutdown wasnot markedly above historical norms by the third quarter of 2020.
The differences between the top-left and the top-right panels of Figure 6 suggest that theelevated shutdown in spring 2020 relative to past years was driven largely by smaller units.We can see this more clearly in the bottom-left panel of Figure 6, which shows (unweighted)shutdown rates in 2020 relative to 2015-2019 averages, separated by business size (we focusedon shutdown spells of at least 70 days). The black line shows that shutdown rates amongthe largest units—those with at least 500 employees—were similar to the pace of previousyears for much of 2020 then dipped even lower by the end of the year. Smaller units sawsignificantly elevated shutdown rates in late April/early May 2020, but by August all businesssizes saw shutdown rates well below historical patterns.
Shutdown patterns do vary some across sectors. The bottom-right panel of Figure 6shows unweighted 70-day shutdown rates for selected supersectors. The leisure & hospitalitysupersector (NAICS 71-72) had historically high shutdown rates during spring and summer2020, with shutdown rates exceeding past patterns by more than 5 percentage points in earlyMay. By late August, however, shutdown among leisure & hospitality businesses was onlymodestly elevated relative to previous years, and by late-2020 the sector had joined othersectors in seeing historically low shutdown activity. Indeed, the cross-sector convergence isstriking.
Taken at face value, the ADP data suggest that business shutdown was elevated duringthe middle of the year, but on net these excess shutdowns were all temporary; since then,shutdown has moved well below historical rates, even among small units. This is a strikingresult, since the ADP data are reasonably comprehensive in terms of coverage across sectorsand establishment size classes and allow us to study how shutdown activity is affectingemployment; the measures we will review below are more limited in at least some of thesedimensions. As such, the ADP data provide some good news, suggesting that permanentshutdown has not been materially elevated since the pandemic began and that the industrieshit hardest in the spring also saw relatively large recoveries.
If permanent business shutdown were accounting for a sizeable share of businesses andemployment, we would expect to see evidence of it in the large sample of ADP clients. Weagain emphasize, however, that ADP data can be affected by patterns of client turnoverin addition to true business shutdown, and elevated customer retention is readily appar-ent during the second half of the pandemic. Moreover, ADP data, like other client-baseddatabases, are subject to unobservable selection around which businesses choose to engageADP for payroll services. For these reasons, it is critical that we add other data sources to
20

our study.30
4.3 Small business trackers
We next turn to popular measures of small business activity, shown on Figure 7. The leftpanel reports daily data from Womply, a credit card transaction processor, on the share offirms that have ceased processing point-of-sale transactions since mid-February.31 The rightpanel reports weekly data from Homebase, a provider of clock-in/clock-out tracking software,showing the share of firms that have stopped reporting clock events since mid-February (and,conveniently, we can observe 2019 data for Homebase as well).32 In both cases, the sampleof businesses is restricted to those that were operating in February 2020 (or February 2019for the 2019 Homebase line), abstracting from entry into the sample (consistent with ourADP-based exercises above). Importantly, presence in these datasets may be less costlythan for ADP data; for example, many Homebase clients use a free tier of the service, whichimplies different selection dynamics than may be present in ADP data.
These measures, which are focused on small firms in customer-facing industries, suggestthat business shutdown rose sharply in March and April, but many closed businesses re-opened in May and June. Still, the recent observations indicate that shutdown was indeedelevated during the first year of the pandemic. Homebase data suggest that, as of the endof February 2021, shutdown in well-covered industries was elevated by roughly 3 percentagepoints relative to the same time a year earlier.
Importantly, a limitation that is common to ADP, Womply, and Homebase data is thepossibility that exit patterns are driven by client attrition rather than business shutdown.Our comparisons to past-year patterns in ADP and Homebase data are designed to provideperspective on this; roughly speaking, the question is not whether we observe exit in thesedata but, rather, whether we see excess exit relative to historical patterns. This makes theWomply data particularly difficult to interpret; and, indeed, exit appears far more elevated
30Additionally, as noted above, some ADP payroll units are closer to firms than establishments. As such,we would expect relatively low exit rates in ADP data relative to pure establishment-based measures.
31Womply is a credit card analytics firm that aggregates data on card transactions. Data reported byWomply reflect card transactions (or lack thereof) among small businesses as defined by the Small Busi-ness Administration (see Chetty et al. (2020) or or https://www.womply.com/blog/data-dashboard-how-coronavirus-covid-19-is-impacting-local-business-revenue-across-the-u-s/). We follow Chetty et al. (2020) intreating Womply businesses as firms, though it is unclear from Womply documentation whether this isaccurate.
32Homebase provides clock-in/clock-out software for small businesses and can therefore observe employ-ment activity in close to real time. Homebase data were a good predictor of official CES monthly jobgains during the initial late-spring recovery; see Reinicke (2020). As of early 2020, Homebase data in-cluded over 60,000 establishments with about 500,000 (hourly) employees. Coverage is concentrated amongvery small establishments (mostly those with fewer than 20 employees) in retail and service industries thathappened to be particularly affected by social distancing (coverage is best in accommodation and foodservices—NAICS 72—where Homebase has almost 2.5 percent of all U.S. establishments with fewer than50 employees). We aggregate Homebase establishment data to the firm level using their (anonymized) com-pany identifier. See Kurmann et al. (2020) for extensive detail on Homebase representativeness, and seehttp://joinhomebase.com/data for more details on Homebase data.
21

0
20
40
60
0
20
40
60P
erce
nt o
f bus
ines
ses
Febru
ary
May
Augus
t
Novem
ber
Febru
ary
AllEducation & HealthLeisure & HospitalityRetail & Transportation
Note: Share of Feb. 15, 2020 firms with no transactions.Daily data through Feb. 28, 2021.Source: Womply data fromhttps://www.tracktherecovery.org and Chetty et al. (2020).
Womply
0
10
20
30
40
50
0
10
20
30
40
50
Per
cent
of b
usin
esse
s
Febru
ary
May
Augus
t
Novem
ber
Febru
ary
20192020
Note: Share of Feb. 15, 2020 firms with no clock-ins.Weekly data through week ending Feb. 27, 2021.Source: Homebase.
Homebase
Figure 7: Small consumer business closures
in Womply than in our other sources, suggesting that normal attrition may be higher inWomply data.33 The Homebase data provide better context and are suggestive of, thoughnot unambiguous confirmation of, elevated exits during the pandemic. We next turn to ameasure that is not subject to the particular limitation of client attrition.
4.4 SafeGraph
We construct a final direct measure of business shutdown based on information from Safe-Graph, a data company that aggregates anonymized location data from numerous mobiledevice applications to provide insights about physical places.34 The company has temporar-ily made their micro-level data available to researchers and government agencies studyingthe impact of COVID-19. The location data from roughly 45 million mobile devices is linkedto a registry of around 6 million points of interest nationwide to record, at a daily frequency,individual visits to these points of interest.35
33As noted on the Womply website, businesses that change their method of accepting payment will appearas closures in Womply data; for example, restaurants that close on-site dining and do business via third-party delivery services will appear as closed. This may be partly responsible for the particularly high andpersistent closure rate in leisure & hospitality.
34To enhance privacy, SafeGraph excludes census block group information if fewer than five devices visitedan establishment in a month from a given census block group.
35While the exact universe of businesses covered by SafeGraph data is difficult to define, with 6 millionpoints of interest it is likely that a large share of U.S. establishments are covered. The BLS QCEW data forMarch 2019 show about 10 million establishments in the U.S., which may be an overstatement of employerbusinesses since Census Bureau BDS data for 2018 show about 7 million establishments. While there arecertain industry scope differences between the BLS and Census business registers, a discrepancy exists evenwhen the two sources are restricted to common scope (see Barnatchez et al. (2017)).
22

In the appendix we describe a methodology that translates patterns of visits to businesslocations into indicators of temporary closure and likely permanent establishment exit (theseindicators are best thought of as establishment, not firm, indicators since they are basedon business operating locations). This is a customer and worker traffic-based measure ofbusiness operation, as opposed to the payroll- or revenue-based measures of ADP, Womply,and Homebase described above. Importantly, traffic-based measures of business shutdown aremore useful in some industries than in others; for example, in construction, traffic patternsmay not be useful as workers may report to various construction sites each day. Similarly,such measures applied to industries like landscaping services or food trucks would also beproblematic. Generally speaking this methodology is appropriate for industries that rely onconsumer (and worker) visits to businesses at a stationary location, a situation that appliesto many retail and service businesses. It is convenient, though, that industries likely to bemost sensitive to social distancing concerns are also those for which our traffic-based closuremeasure may be most appropriate.
We first illustrate these measures for full-service (“sit-down”) restaurants (NAICS 722511),an industry that is well-suited to this methodology, has good coverage in SafeGraph data,and is sensitive to social distancing concerns and restrictions; note that this industry ex-cludes fast food and takeout establishments (NAICS 722513).36 Figure 8 shows estimatesof restaurants that were closed—–at least temporarily—during each month of 2020 and intoearly 2021, based on severe drops in consumer visits relative to normal patterns for that es-tablishment. This fraction was low, around 3-4 percent in the months before the pandemic,but then jumped to over 50 percent in the months of March and April as social distancingpolicies were put in place. The overall contour of the remaining months fits the pattern ofimpacts of COVID-19: some declines in temporary closure in the summer months followedby increases in November, 2020 to January, 2021 before declining once again. The significantshare of closures identified after the initial March-April surge could be comprised of restau-rants responding to renewed social distancing policies, restaurants that have permanentlyclosed, or restaurants that are in fact open but operating at extremely low levels of activity.
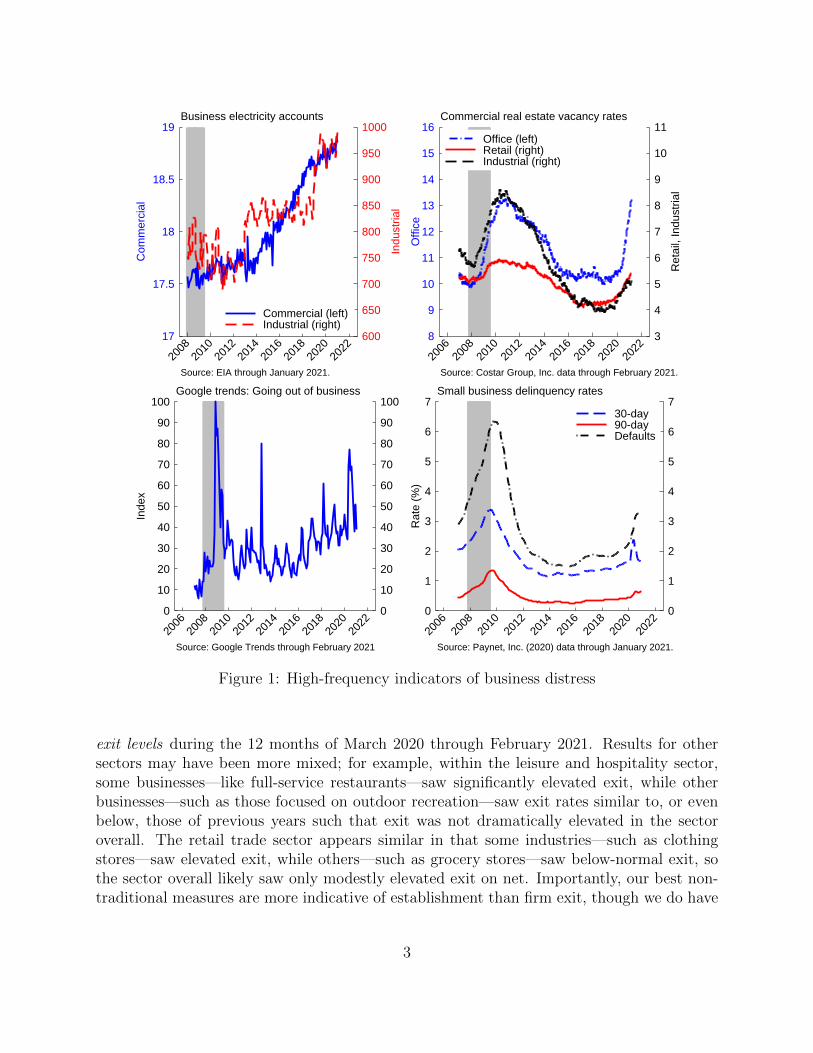
Estimates of the flow of restaurants that may have permanently closed each month areshown by the red bars in Figure 9; these are restaurants that closed during the indicatedmonth and had still not reopened by February, 2021. The monthly estimates for the shortbenchmark period of January-February of 2020 (0.1 to 0.2 percent) are below the averagemonthly rate of exit for restaurants from BDS data (0.7 percent), so our SafeGraph measuremight understate exit somewhat in other periods.37 The monthly exit rate jumps in March
36Importantly, our measure is reasonably robust to the notable shift of restaurants to carry-out service,which is evident in the SafeGraph data based on changes in the duration of consumer visits (see AppendixFigure B1). Carry-out or delivery service still requires a visit to the business address, which is the basis ofthe concept of SafeGraph visits.
37BDS data for NAICS 7225 indicate recent (2015-2018) annual establishment death rates of 8.1 percent,implying monthly rates of a bit under 0.7 percent. This suggests that SafeGraph closure rates may be a bittoo low, though it is difficult to tell since seasonality may play a large role in monthly patterns. Perhapsmore importantly, exit rates for the narrow full-service restaurant industry are not available in public data.The overall rate for NAICS 7225 may understate exit rates for full-service restaurants if, for example, fastfood establishments (in NAICS 722513) have lower exit rates.
23

3.3% 3.6%
58%
62%
35%
20% 21%18% 17% 19%
25%28% 28%
22%
0
20
40
60
0
20
40
60
Janu
ary
Febru
ary
March
April
MayJu
ne July
Augus
t
Septem
ber
Octobe
r
Novem
ber
Decem
ber
Janu
ary
Febru
ary
Source: Author calculations from SafeGraph microdata.Note: Temporary closure defined in Appendix.
Percent of Restaurants Temporarily Closed
Figure 8: Temporary restaurant closures inferred from weekly visits
to around 1.5 percent of restaurants and then increases again in July and August. Thecumulative 12-month exit rate of restaurants, from March 2020 to February 2021, basedon this measure (the black line in Figure 9) is 13.5 percent, about 70 percent above ratesseen in official data in recent years (around 8 percent). The data therefore suggest thatestablishment exit has been substantially elevated in the full-service restaurant industry.
4.4.1 Case study of New York City and Oklahoma
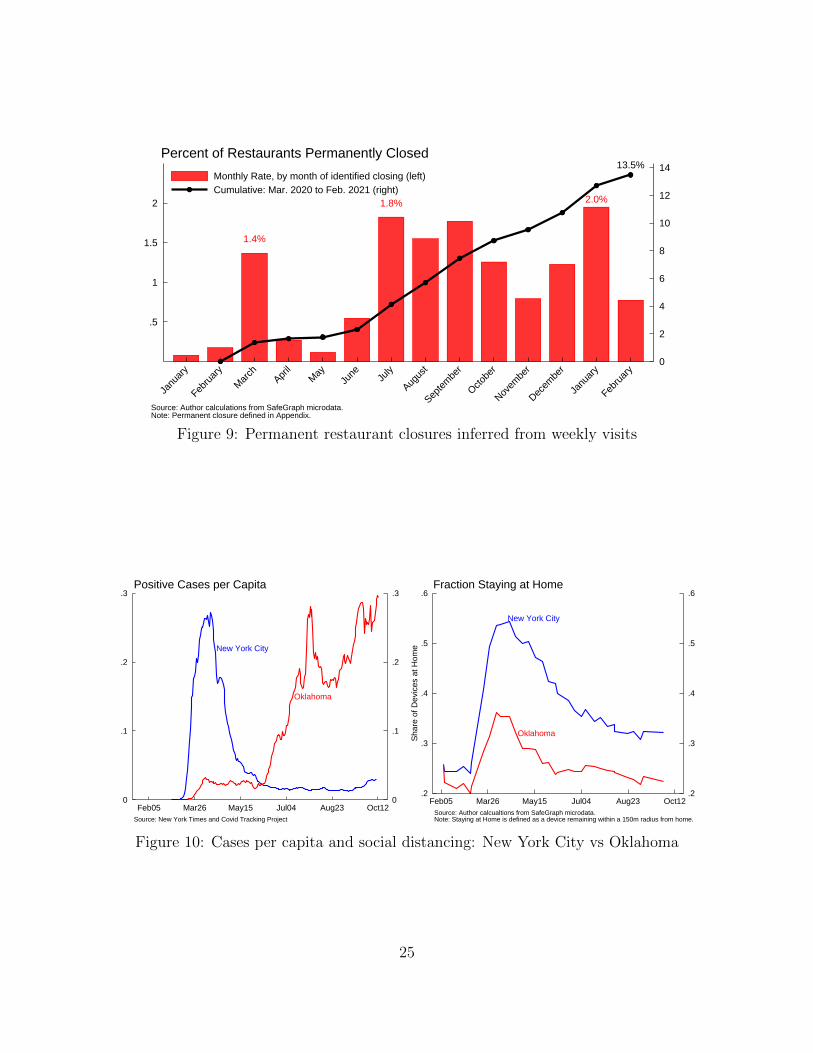
A concrete way to evaluate the validity of the signal from this measure is to study variation inbusiness closure across two geographies with significant differences in the contour of COVID-19 cases and social distancing policies: New York City and the state of Oklahoma.38 PanelA of Figure 10 shows the early spike in cases in New York City as well as the much laterjump beginning in July in the state of Oklahoma. Panel B of Figure 10 shows one measureof social distancing—also derived from SafeGraph data—which identifies the share of mobiledevices remaining close to home in a given day. This figure shows much larger and morepervasive changes in behavior regarding social distancing practices in New York City thanin Oklahoma.39
The left panel of Figure 11 shows, perhaps unsurprisingly, that the relative magnitudes
38It is worth noting that identified visits in dense urban locations such as New York City may be subjectto greater measurement error. SafeGraph uses a variety of tools to separate out visits from dense POIs;however, occasionally a POI will be excluded from data on visits due to being completely enclosed withinanother POI.
39These social distancing practices are, of course, also influenced by official regulations in each geography.For example, inside dining was not allowed in New York City through the end of September, whereasrestrictions on dining for Oklahoma were minimal.
24
1.4%
1.8% 2.0%
13.5%
0
2
4
6
8
10
12
14
.5
1
1.5
2
Janu
ary
Febru
ary
March
April
MayJu
ne July
Augus
t
Septem
ber
Octobe
r
Novem
ber
Decem
ber
Janu
ary
Febru
ary
Monthly Rate, by month of identified closing (left)Cumulative: Mar. 2020 to Feb. 2021 (right)
Source: Author calculations from SafeGraph microdata.Note: Permanent closure defined in Appendix.
Percent of Restaurants Permanently Closed
Figure 9: Permanent restaurant closures inferred from weekly visits
Oklahoma
New York City
0
.1
.2
.3
0
.1
.2
.3
Feb05 Mar26 May15 Jul04 Aug23 Oct12Source: New York Times and Covid Tracking Project
Positive Cases per Capita
Oklahoma
New York City
.2
.3
.4
.5
.6
.2
.3
.4
.5
.6
Sha
re o
f Dev
ices
at H
ome
Feb05 Mar26 May15 Jul04 Aug23 Oct12Source: Author calcualtions from SafeGraph microdata.Note: Staying at Home is defined as a device remaining within a 150m radius from home.
Fraction Staying at Home
Figure 10: Cases per capita and social distancing: New York City vs Oklahoma
25

of temporary restaurant closure for New York City and Oklahoma align with the experienceof cases and social distancing practices. Over 80 percent of restaurants appeared to betemporarily closed in New York City during the months of March and April, whereas thisfigure was significantly below the national average in Oklahoma. The right panel of Figure 11plots the cumulative share of restaurants that are permanently closed. The blue line indicatesthat over 30 percent of sit-down restaurants in New York City could have permanently closedduring the 12-month period following the start of the pandemic.40 This cumulative share isconsiderably lower in Oklahoma, and indeed appears to be lower than the (national) rate ofclosure in a typical year.
0
20
40
60
80
100
0
20
40
60
80
100
Janu
ary
Febru
ary
March
April
MayJu
ne July
Augus
t
Septem
ber
Octobe
r
Novem
ber
Decem
ber
Janu
ary
Febru
ary
New York CityOklahoma
Source: Author calculations from SafeGraph microdata.Note: Temporary closure defined in Appendix.
Percent Temporarily Closed
0
5
10
15
20
25
30
35
0
5
10
15
20
25
30
35
Janu
ary
Febru
ary
March
April
MayJu
ne July
Augus
t
Septem
ber
Octobe
r
Novem
ber
Decem
ber
Janu
ary
Febru
ary
New York CityOklahoma
Source: Author calculations from SafeGraph microdata.Note: Permanent closure defined in Appendix.
Cumulative Percent Permanently Closed
Figure 11: Restaurant closures: New York City vs Oklahoma
4.4.2 Industry analysis
Finally, we calculate cumulative (March 2020 to February 2021) permanent closure ratesusing this SafeGraph-based measure for a number of other industries and compare the ex-perience of the first 12 months of the COVID-19 pandemic to historical exit rates. Theindustry-level variation in excess business closure largely aligns with expectations, as shownin Figure 12. The top panel shows these comparisons for select 2-digit NAICS sectors, whilethe bottom panel shows select 4-digit industry-group detail. The highest rates of excess clo-sure are in industries relying heavily on in-person contact (other services, such as personalcare services), experiencing COVID-related reductions in demand (automotive repair), orclose substitutes with e-commerce (clothing stores). Some industries with lower-than-typical
40While New York City was uniquely impacted by the pandemic, with dramatic declines in the number ofpeople commuting into the city on a regular basis, there are some reasons to treat these numbers with evengreater caution. Allocating a given GPS signal to a particular establishment is inherently more difficult withmulti-storey buildings as is the case in urban areas such as New York City.
26

closure rates include grocery stores and electronics and appliance stores, two industries thathave seen increased demand during the pandemic.
A few other industry results are worth discussing. The excess closure rate for accommo-dation and food services (and traveler accommodation in particular) is lower than expectedgiven the large drops in travel and restaurant dining induced by the pandemic (and the ele-vated exit we observe among full-service restaurants on Figure 9). This sector saw dramaticemployment declines and is still (as of March 2021) well below its pre-pandemic employ-ment level. That said, anecdotes suggest that certain areas of this sector have been resilientto the pandemic; indeed, the aggregated industry group of restaurants and other eatingplaces (NAICS 7225) saw exit rates only modestly above historical averages, suggestingthat the high rate we document for full-service restaurants was partially offset by low exitrates among limited-service restaurants like pizza delivery, fast food, and takeout that likelybenefited from shifts toward more at-home eating. More broadly, the Paycheck ProtectionProgram (PPP) targeted the accommodation and food services sector for special treatment,allowing virtually the entire sector to qualify rather than just small businesses, potentiallyfacilitating continued operation despite large declines in revenue.41
The low excess closure rate for “arts, entertainment, and recreation” is also surprising,though this industry is a mix between establishments that specialize in pandemic-friendlyoutdoor recreation (i.e., golf courses, skiing facilities) and those that specialize in riskierindoor recreation (i.e., museums, fitness centers, and bowling alleys). The retail trade sec-tor likely saw considerable heterogeneity in exit rates, combining high-exit industries likeclothing stores with low-exit industries like grocery stores and (likely) nonstore retail. Weexpect exit rates to have been lower in the broad sectors not reported here (based on BEDand ADP data reviewed above, Census Bureau survey data reviewed below, and anecdotaldiscussions), with the possible exceptions of mining (due to oil market developments) and,perhaps, education. Regardless, we again emphasize that our SafeGraph-based measuresdepend on traffic, and industries vary in how accurately traffic tracks business operationalstatus; therefore, aggregated sector-level data as shown on the top of Figure 12 may nothave a straightforward interpretation.
We report the implications of our SafeGraph-based estimates on Table 3. For each of thesectors and industries we show on Figure 12, we report the establishment count from thefirst quarter of 2019 from BLS QCEW data, the average 2015-2018 establishment exit ratefrom the BDS, the SafeGraph-based exit rate for March 2020-February 2021, the impliedexcess exit rate, and the implied count of establishment deaths in excess of historical norms.Our SafeGraph-based estimates suggest excess exit of about 123,000 establishments in otherservices, with negligible figures in other sectors. Since we expect other sectors that are lesswell measured by SafeGraph to have fared better than the social distance-sensitive sectorswe report here, excess exit for the economy as a whole was likely not far off from the figurefor the worst-off sector of other services. That is, these data suggest that excess exit was
41While the PPP was generally only available to small firms, for the accommodation and food servicessector the size qualification was based on establishment size. Decker et al. (2021) find that more than 99percent of establishments in that sector met the size qualification.
27

0 2 4 6 8 10 12 14 16 18 20 22 24Percent of firms
Arts, Entertainment, and Recreation
Retail Trade
Accommodation and Food Services
Other Services (except Public Administration)
SafeGraph, Mar 2020-Feb 2021
2015-2018 average
Great Recession
0 2 4 6 8 10 12 14 16 18 20 22 24Percent of firms
Electronics and Appliance Stores
Grocery Stores
Other Amusement and Recreation Industries
Building Material and Supplies Dealers
Restaurants and Other Eating Places
Traveler Accommodation
Museums, Historical Sites, and Similar Institutions
Furniture Stores
Home Furnishings Stores
Clothing Stores
Automotive Repair and Maintenance
Personal Care Services
SafeGraph, Mar 2020-Feb 2021
2015-2018 average
Great Recession
Note: Bars ordered by difference between SafeGraph 2020-2021 rate and BDS 2015-2018 average. Great Recession rate is average of years spanningApril 2008-March 2010.Source: Author calculations from SafeGraph microdata and Business Dynamics Statistics.
Figure 12: Cumulative permanent closures for selected industries, SafeGraph
28

likely below (say) 200,000 establishments during the first year of the pandemic—broadlyconsistent with our BED-based estimate described above, which suggested excess deathsbelow 150,000 during the first half of 2020. Of course, this is a guess in which we assumethat sectors other than other services saw relatively low excess exit; if our guess is reasonable,it would imply that overall exit has been elevated by about one-third, as the average numberof establishment exits during 2015-2018 was about 600,000 in BDS data.42
Table 3: Excess exit estimates for selected industries, SafeGraph
Initialestablishments Historical Pandemic Excess Excess exits
Industry (NAICS) (QCEW, 1000s) rate (BDS) rate rate (1000s)
Broad sectorsRetail trade 1,048 7.6 8.6 1.0 11Arts, Entertainment, & recreation 165 10.1 7.6 -2.5 -4Accommodation & food services 737 8.5 9.7 1.2 9Other services 875 6.0 20.1 14.1 123
Four-digit industriesFurniture stores 22 7.2 10.2 3.0 1Home furnishings stores 25 7.2 11.4 4.3 1Electronics & appliance stores 44 14.1 12.1 -2.0 -1Building material & supplies dealers 53 4.7 5.3 0.6 0Grocery stores 90 8.4 7.2 -1.2 -1Clothing stores 82 8.6 16.0 7.3 6Museums, historical sites, etc. 9 3.8 6.1 2.4 0Other amusement & recreation 85 9.3 8.3 -1.0 -1Traveler accommodation 64 7.5 8.8 1.3 1Restaurants & other eating places 578 8.1 9.3 1.2 7Automotive repair & maintenance 165 7.8 16.7 8.9 15Personal care services 135 10.4 22.7 12.3 17
Note: Industries listed in NAICS order. Initial establishment counts from QCEW, 2020q1. Historical rateis average establishment exit rate for 2015-2018 from BDS. Pandemic rate is SafeGraph-based exit rateestimate for the 12 months of March 2020-February 2021. Excess rate is difference between pandemic andhistorical rates. Excess deaths are equal to excess rate multiplied by establishment count.
In summary, the measure inferred from mobile device location data—which is not subjectto the customer attrition concerns of our previously described data sources but does face
42Our mixing of BLS and Census Bureau data on Table 3 is not without consequence and is its own sourceof uncertainty around our estimates. As noted elsewhere, establishment counts in BLS and Census Bureausources have diverged in recent years, with higher levels in BLS sources. This is particularly driven bydivergence among the smallest establishments—which tend to have the highest exit rates. In 2018, BLS datareported about 35 percent more private sector establishments than Census Bureau data. Our estimate offewer than 200,000 excess establishments is based on the BLS establishment count, while our suggestion thatthis number is about one-third above normal is based on Census Bureau annual death data (whereas the BLSdoes not, to our knowledge, publish annual establishment death figures). If we scale down the establishmentcounts from Table 3 using the 1.35 ratio just mentioned, we might suggest an upper bound estimate of150,000 excess establishment exits, which would imply overall exit was elevated by about one-fourth.
29

other measurement limitations—appears to show elevated exit rates for restaurants and otherindustries that align with the effects from COVID-19. However, this unconventional measureof business exit should be treated with caution as there remain several unique features ofour measurement that may not align with true business exit. Perhaps most importantly,we do not know how well our SafeGraph measure would have performed in past years—theJanuary and February 2020 data might suggest some understatement—so the comparisonson which we based our excess death estimates should be treated with caution.
4.5 Other private sector business registers
As noted above, an advantage of SafeGraph over the other non-traditional measures westudy is that it is designed to capture the near universe of business establishments, andthere are no customer attrition concerns. Certain other private sector business registersshare these qualities; however, we see them as significantly limited for tracking business exit.In particular, business registers that do not have near-real-time sources of information onactual business activity—such as revenue transactions, payroll events, or customer traffic—for all businesses in the register are likely to poorly capture exit at high frequency, sincebusiness shutdown can typically be identified only with analyst effort.
One such business register is maintained by Yelp, the online platform for rating businesses.The company occasionally provides shutdown data including permanent shutdown estimates,but we find these difficult to interpret in their current form (see Yelp: Local EconomicImpact Report (2020)). For example, Yelp reports the highest permanent closure rates amongrestaurants selling burgers and sandwiches, where estimated permanent closure rates fromMarch through August were around 3.5 percent. On an annualized basis, this would implyexit rates around 7 percent, still below recent restaurant exit rates of around 8 percent.Other industries reported by Yelp show exit rates that are even lower relative to historicalpatterns. These results are not necessarily implausible, but still we find them difficult tointerpret. In particular, we assume that Yelp underestimates exit because the companycannot directly verify business activity in real time but instead can only observe exit if websiteusers contribute information or if analysts engage in significant effort. That said, Yelp datamay be useful for studying differences across industries. For example, Yelp indicates thelowest exit rates among lawyers, architects, and accountants, consistent with ADP data onthe relative success of professional and business services industries early in the pandemic.
The most prominent private sector business register is that of Dun & Bradstreet (D&B)—or its derivative, the National Establishment Time Series (NETS) of Walls & Associates.D&B uses many sources to maintain their business list, including yellow pages and surveysby analysts. Such business lists have many uses, but we expect them to be poorly suitedfor measuring recent exits. D&B-like business registers do not automatically update whenbusiness activity drops, in contrast to measures based on automated observation of businessstatus. Instead, analysts must somehow identify business shutdown, an enormous task par-ticularly for the millions of small businesses with high exit rates (and one for which evenYelp is likely better suited, given its access to effectively crowdsourced information). Indeed,Crane and Decker (2020) find that D&B/NETS data capture business dynamics poorly.
30

5 Business death expectations
Many currently operating businesses are concerned about exit risk going forward, thoughthese expectations have fluctuated throughout the pandemic. The Census Bureau has con-ducted surveys of small businesses (those with one establishment and fewer than 500 em-ployees) at weekly frequency through several phases since the pandemic began.43 Amongother questions, businesses are asked about their expectations for the six months followingthe survey; the left panel of Figure 13 reports the share of businesses expecting permanentlyto close within six months of the survey week; the red dashed line shows the historical actualexit rate for firms with fewer than 500 employees from BDS data for 2015-2018.44 The rightpanel reports the share of businesses expecting to need to obtain financial assistance or creditover the same period.
Historical rate
2
3
4
5
6
2
3
4
5
6
Per
cent
of f
irms
Augus
t
Octobe
r
Decem
ber
Febru
ary
April
Close permanently
15
20
25
30
35
15
20
25
30
35
Per
cent
of f
irms
Augus
t
Octobe
r
Decem
ber
Febru
ary
April
Obtain finance
Note: Six month expectations. Data correspond to end of survey week. Gaps indicate between-survey periods. Historical rate is 2015-2018 actual small business death rate.Source: Census Bureau Business Dynamics Statistics and Small Business Pulse Survey; data through March 29 - April 4 2021.
Figure 13: Small firms’ expected needs over next six months
Death expectations rose in November and December of 2020 corresponding with risingCovid case counts in the U.S.; this pessimism declined some through December and Januarythen dropped substantially by mid-February, possibly related to the late-December passageof an additional round of Paycheck Protection Program loans and other fiscal support.45
During most of the pandemic death expectations have been well above the level consistent
43See https://www.census.gov/data/experimental-data-products/small-business-pulse-survey.html for sur-vey data, including time series views; for methodological details see Buffington et al. (2020).
44We estimate the historical six-month exit rate by taking half of the historical annual exit rate. This isonly approximate—actual six-month exit rates can be higher due to firms that enter and exit within a year.
45The Pulse survey also asks questions about past closures; these are more difficult to interpret giventhe possibility that non-response to the survey is correlated with business death. Even the forward-lookingmeasure we report may suffer from selection bias among respondents, and it is possible that industriesshowing relatively low expectations of exit have already seen many exits. That said, the Pulse surveyis constructed using the Census Bureau’s Business Register as a sampling frame, and the Census Bureauapplies appropriate sampling weights to responses, so the survey is of high scientific quality. Importantly,the sample is limited to small employer businesses with only one establishment.
31

with actual death rates from recent years (the dashed red line), though we do not know howwell these death expectations would predict actual death in normal times.
Importantly, the expected exit rates vary widely by sector, and expected exit rates relativeto historical averages vary widely as well. Figure 14 shows Pulse Survey expected exit asof early April 2021, in blue, compared with average six-month actual death rates amongsmall firms (fewer than 500 employees) from BDS data from 2015-2018, in red, and from theGreat Recession, in black.46 In some sectors, recent expected death rates do indeed implyhistorically elevated rates (i.e., the blue bars are longer than the red and black bars). This ismost notable in mining, other services, and education.47 Some of these sectors have alreadyseen considerable exit such that these expectations, if realized, would result in materialpermanent impacts; for example, consider the possibility that the other services sector hasalready seen exit rates at more than three times the normal rate over the past year (assuggested by our SafeGraph analysis) and then experiences exit rates at nearly double theusual pace over the next six months.
On the other hand, some sectors have recent exit expectations close to, or even below,historical averages. The most notable of these are accommodation and food services andarts, entertainment, and recreation—that is, the leisure and hospitality supersector. This isa notable development.
Some of the sectors with low exit expectations in recent surveys had much higher expec-tations earlier in the pandemic. Figure 15 reports excess exit expectations—that is, expectedexit rates minus historical actual exit rates among firms with fewer than 500 employees—bysector (top panel) and by state (bottom panel). The green bars show expectations as oflate November, when overall exit expectations were highest; the orange bars show expecta-tions in the latest data from early April 2021. Sectors and states are listed in order of theirimprovement; the most improved sector is accommodation and food services, where excessdeath expectations once exceeded historical death rates by about six percentage points butare now below historical rates. Arts, entertainment, and recreation has also improved sub-stantially. Notably, several sectors did not see dramatically elevated death expectations evenduring the November peak. Data on states also show wide heterogeneity in improvement—and in peak exit expectations.48
46BDS exit rates are divided by two to approximate 6-month exit rates comparable to Pulse expectations.Sector-level historical actual exit rates are approximate; in particular, the lagged firm count in the DHSexit rate denominator is constructed with the previous-year total firm count (firmst−1) rather than withlongitudinally precise lagged firm count (firmst− entrantst +deathst) because publicly available BDS dataare not tabulated at the sector-by-age-by-size level, and age is necessary for constructing the longitudinalmeasure. The resulting error is likely negligible.
47The education sector includes not only K-12 schools and colleges/universities but also trade trainingprograms such as cosmetology schools, flight training, and technical programs as well as sports and recreationtraining, exam preparation programs, and driving schools.
48The Census Bureau suppresses data for some states; all states with reported data in both time periodsare shown on Figure 14. State historical actual exit rates are approximate (see footnote 46).
32

0 2 4 6 8Percent of firms
Real Estate
Prof., Sci., & Tech.
Construction
Arts, Ent., & Rec
Health Care
Finance & Insurance
Admin. & Waste
Retail Trade
Transp. & Warehous.
Accomm. & Food
Manufacturing
Wholesale Trade
Information
Education
Other Services
Mining
Note: Bars ordered by difference between expected rate and 2015-2018 average. Firms with fewer than 500 employees. Great Recessionrate is average of years spanning April 2008-March 2010.Source: Census Bureau Small Business Pulse Survey, Mar. 29-Apr. 4 2021 and Business Dynamics Statistics.
Expected rate
2015-2018 average
Great Recession
Figure 14: Exit expectations versus historical rates
6 Taking stock
Our analysis suggests that business exit likely was elevated during the first year of the pan-demic. We find direct evidence of increased establishment deaths among full-service restau-rants, personal care services, automotive repair, and certain retailers (apparent in SafeGraphdata) and suggestive direct evidence for elevated deaths among small firms in related in-dustries generally (apparent in Womply and Homebase data). But within sectors, variationacross industries appears to be partially or fully offsetting, such that most sectors likely havenot seen dramatically elevated exit; the primary exception is other services, where we esti-mate that establishment exits exceed prior years’ pace by about 120,000. From this figure,and considering our relatively modest estimates for other sectors, we judgmentally estimatethat excess establishment exits were below 200,000 during the first year of the pandemic.Separately, our ADP data suggest that any rise in business exits has not reached largerbusiness units or even enough smaller units to account for a material share of employment,which would be consistent with past patterns of employment-weighted exit cyclicality. Thisview appears to be roughly corroborated in BLS data studied by Dalton et al. (2020b) (seesection 4.1 above).
Excess establishment exits below 200,000 during the first year of the pandemic—and ex-cess firm exits below 150,000, if historical shares continued—with little associated excess job
33

-2 0 2 4 6Expected excess death rate (percentage points)
Finance & InsuranceManufacturing
Retail TradeWholesale Trade
Health CareProf., Sci., & Tech.
InformationAdmin. & Waste
MiningConstruction
Other ServicesReal Estate
Transp. & Warehous.Education
Arts, Ent., & RecAccomm. & Food
Source: Census Bureau Small Business Pulse Survey and Business Dynamics Statistics (BDS).Expected excess death rate is expected rate (over six months) minus half the sector average firm exit rate among firmswith <500 employees, 2015-2018. Sectors ordered by change in excess death rate.
Sectors
November 23-29, 2020
March 29 - April 4, 2021
-2 -1 0 1 2 3 4Expected excess death rate (percentage points)
FLGAVAOHTXMNWAMI
MDCONYCAIL
OKNJLAPANCOR
Source: Census Bureau Small Business Pulse Survey and Business Dynamics Statistics (BDS).Expected excess death rate is expected rate (over six months) minus half the state average firm exit rate among firmswith <500 employees, 2015-2018. States ordered by change in excess death rate.
Reported states
Figure 15: Excess exit expectations, peak versus early March 2021
34

destruction would likely be a positive outcome relative to widespread expectations from earlyin the pandemic.49 Some of the detrimental consequences of elevated exit—permanent jobdislocation, potential productivity impacts if selection works adversely, and the destructionof intangible and physical capital—may be modest in aggregate if exit does not reach largefirms or a greater number of small firms. Other detrimental consequences—loss of job andwealth for business owners and abrupt changes to local economic geography—have welfareimplications even if exit is not substantial on an activity-weighted basis.
Given various dataset-specific caveats mentioned in the main text, we view our evidenceas suggestive, not conclusive. Whether the patterns we document will continue is difficultto tell; for example, a continued economic recovery could reduce exit rates, and if somedeaths apparent in existing data were “pulled forward” from later this year then annualizedexit rates could even be subdued in coming months. Exit expectations remain elevated ina handful of sectors and states but have generally improved dramatically since November2020 and are significantly below normal in several sectors. Early and ongoing policy actionsmay have helped businesses in the relatively optimistic sectors to survive the worst of thepandemic and sustainably reopen.50
Alternatively, it may be that our imperfect indicators understate the magnitude of thesurge in exit. Anecdotes of business failure certainly abound. Moreover, the situation coulddeteriorate further from here. Considerable uncertainty about the virus and its variousstrains remains. Business owners who have managed to stay open this long may face overduefinancial obligations that will prove unmanageable, and liquidity contraction or distortionsresulting from 2020 policies could leave many firms at high risk (Gournichas et al., 2021).Cross-industry demand reallocation associated with a transition out of the pandemic couldbe significant. Large firms may have been taking time to implement restructuring plans thatcould result in waves of establishment exits or the failure of smaller suppliers. Ultimately, wewill not have certainty about business exit during 2020-2021 until the pandemic is behindus and high-quality official data are published. In this respect, our work highlights theimportance of timely data production and reminds us of the value of official data producers.
49Separately, early evidence suggests business entry may have surged during the first year of the pandemic(Dinlersoz et al., 2021). Combined with our evidence of lower-than-expected exit, it may be that the effectof the pandemic on the net change in establishment or firm numbers will turn out to be modest.
50Autor et al. (2020) estimate that the Paycheck Protection Program (PPP) had a material effect, boostingJune payroll employment by about 2.3 million. Given the particular vulnerability of the smallest businesses,even a small number of jobs saved could correspond with a large number of businesses; moreover, the Autoret al. (2020) identification strategies may understate effects on the smallest, most exit-prone businesses. Wealso note that the dramatic improvement in exit expectations shown in the Pulse survey coincided with thelate-December refunding of the PPP program alongside other fiscal measures.
35

References
ADP, “ADP Reports First Quarter Fiscal 2021 Results,” Earnings release, October 2020.
, “ADP Reports Fourth Quarter Fiscal 2020 Results; Provides Fiscal 2021 Outlook,”Earnings release, July 2020.
Autor, David, David Cho, Leland D. Crane, Mita Goldar, Byron Lutz,Joshua Montes, William B. Peterman, David Ratner, Daniel Villar, and AhuYildirmaz, “An Evaluation of the Paycheck Protection Program Using AdministrativePayroll Microdata,” Working paper 2020.
Barnatchez, Keith, Leland D. Crane, and Ryan A. Decker, “An Assessment of theNational Establishment Time Series (NETS) Database,” Finance and Economics Discus-sion Series 2017-110, Federal Reserve Board 2017.
Bartelsman, Eric, John Haltiwanger, and Stefano Scarpetta, “Cross-Country Differ-ences in Productivity: The Role of Allocation and Selection,” American Economic Review,2013, 103 (1), 305–334.
Bartik, Alexander W., Marianne Bertrand, Feng Lin, Jesse Rothstein, and MattUnrath, “Measuring the Labor Market at the Onset of the COVID-19 Crisis,” BPEAConference Draft, Summer, 2020.
Bartik, Alexander W, Marianne Bertrand, Zoe B Cullen, Edward L Glaeser,Michael Luca, and Christopher T Stanton, “The Impact of COVID-19 on SmallBusiness Outcomes and Expectations,” Proceedings of the National Academy of Sciences,2020, 117 (30), 17656–17666.
Bartlett, Robert P. and Adair Morse, “Small Business Survival Capabilities and PolicyEffectiveness: Evidence from Oakland,” NBER Working Papers 27629, National Bureauof Economic Research 2020.
Buffington, Catherine, Carrie Dennis, Emin Dinlersoz, Lucia Foster, and ShawnKlimek, “Measuring the Effect of COVID-19 on U.S. Small Businesses: The Small Busi-ness Pulse Survey,” CES Working Paper CES-20-16, U.S. Census Bureau: Center forEconomic Studies 2020.
Bureau of Labor Statistics, “Annual Business Employment Dynamics Data,” website2020.
, “National Business Employment Dynamics Data by Firm Size Class,” website 2020.
Cajner, Tomaz, Leland Crane, Ryan A. Decker, Adrian Hamins-Puertolas,Christopher Kurz, and Tyler Radler, “Using Payroll Processor Microdata to MeasureAggregate Labor Market Activity,” FEDS Working Paper 2018-005, Board of Governorsof the Federal Reserve System (U.S.) January 2018.
36

, Leland D. Crane, Ryan A. Decker, John Grigsby, Adrian Hamins-Puertolas,Erik Hurst, Christopher Kurz, and Ahu Yildirmaz, “The U.S. Labor Market duringthe Beginning of the Pandemic Recession,” BPEA Conference Draft, Summer, 2020.
Chetty, Raj, John N. Friedman, Nathaniel Hendren, Michael Stepner, and theOpportunity Insights Team, “How Did COVID-19 and Stabilization Policies AffectSpending and Employment? A New Real Time Economic Tracker Based on Private SectorData,” Working Paper June 2020.
Clementi, Gian Luca and Berardino Palazzo, “Entry, Exit, Firm Dynamics, and Ag-gregate Fluctuations,” American Economic Journal: Macroeconomics, 2016, 8 (3), 1–41.
Cooper, Russell W. and John C. Haltiwanger, “On the Nature of Capital AdjustmentCosts,” The Review of Economic Studies, 2007, 73 (3), 611–633.
Costar Group, Inc., “Costar Suite (US),” http://www.costar.com September 2020.
Crane, Leland and Ryan Decker, “Research with Private Sector Business Microdata:The Case of NETS/D&B,” Working paper 2020.
Dalton, Michael, Elizabeth Weber Handwerker, and Mark A. Loewenstein, “Em-ployment Changes by Employer Size Using the Current Employment Statistics SurveyMicrodata during the COVID-19 Panedmic,” Covid Economics, September 2020, 1 (46),123–136.
, , and , “An Update on Employment Changes by Employer Size during the COVID-19 Pandemic: A Look at the Current Employment Statistics Microdata,” BLS WorkingPapers, December 2020, (532).
Davis, Steven J, John C Haltiwanger, and Scott Schuh, Job Creation and Destruc-tion, The MIT Press, 1996.
Davis, Steven J., John Haltiwanger, Kyle Handley, Ron Jarmin, Josh Lerner,and Javier Miranda, “Private Equity, Jobs, and Productivity,” American EconomicAssociation, 2014, 104 (12), 2956–3990.
Decker, Ryan A., John Haltiwanger, Ron S. Jarmin, and Jarmin Miranda, “De-clining Dynamism, Allocative Efficiency, and the Productivity Slowdown,” American Eco-nomic Review: Papers & Proceedings, 2017, 107 (5), 322–326.
, , , and Javier Miranda, “Changing Business Dynamism and Productivity: Shocksversus Responsiveness,” American Economic Review, 2020, 110 (12), 835–850.
, Pablo N. D’erasmo, and Hernan Moscoso Boedo, “Market Exposure and Endoge-nous Firm Volatility over the Business Cycle,” American Economic Journal: Macroeco-nomics, 2016, 8 (1), 148–198.
37

Decker, Ryan, Robert Kurtzman, Byron Lutz, and Christopher Nekarda, “Acrossthe Universe: Policy Support for Employment and Revenue in the Pandemic Recession,”American Economic Association: Papers and Proceedings, May 2021.
Dinlersoz, Emin, Timothy Dunne, John Haltiwanger, and Veronika Penciakova,“Business Formation: A Tale of Two Recessions,” American Economic Association: Pa-pers and Proceedings, May 2021.
Fairlie, Robert, “The Impact of COVID-19 on Small Business Owners: The First ThreeMonths after Social-Distancing Restrictions,” Journal of Economics & Management Strat-egy, Forthcoming.
Fort, Teresa C., Justin R. Pierce, and Peter K. Schott, “New Perspectives on theDecline in US Manufacturing Employment,” Journal of Economic Perspectives, 2018, 32(2), 47–72.
Foster, Lucia, Cheryl Grim, and John Haltiwanger, “Reallocation in the Great Re-cession: Cleansing or Not?,” Journal of Labor Economics, 2016, 34 (S1), S293–S331.
, John C. Haltiwanger, and C. J. Krizan, “Aggregate Productivity Growth: Lessonsfrom Microeconomic Evidence,” in “New Developments in Productivity Analysis,” Uni-versity of Chicago Press, January 2001, pp. 303–372.
, John Haltiwanger, and C. J. Krizan, “Market Selection, Reallocation, and Re-structuring in the U.S. Retail Trade Sector in the 1990s,” The Review of Economics andStatistics, 2006, 88 (4), 748–758.
Fujita, Shigeru and Giuseppe Moscarini, “Recall and Unemployment,” American Eco-nomic Review, December 2017, 107 (12), 3875–3916.
Gournichas, Pierre Olivier, Sebnem Kalemli-Ozcan, Veronika Penciakova, andNick Sander, “COVID-19 and SMEs: A 2021 “Time Bomb”?,” American EconomicAssociation: Papers and Proceedings, May 2021.
Greenwood, Robin, Ben Iverson, and David Thesmar, “Sizing Up Corporate Re-structuring in the COVID Crisis,” BPEA Conference Draft, Fall, 2020.
Gschwandtner, Adelina and Val E. Lambson, “Sunk Costs, Depreciation, and IndustryDynamics,” Review of Economics and Statistics, 2012, 94 (4), 1059–1065.
Hamilton, James, “Why You Shoud Never Use the Hodrick-Prescott Filter,” Review ofEconomics and Statistics, December 2018, 100, 831–843.
Hamilton, Steven, “From Survival to Revival: How to Help Small Businesses through theCOVID-19 Crisis,” The Hamilton Project Policy Proposal, 2020, (2020-14).
38

Hodrick, Robert J. and Edward C. Prescott, “Postwar U.S. Business Cycles: AnEmpirical Investigation,” Journal of Money, Credit, and Banking, 1997, 29 (1), 1–16.
Hopenhayn, Hugo A., “Exit, Selection, and the Value of Firms,” Journal of EconomicDynamics and Control, 1992, 16 (3-4), 621–653.
and Richard Rogerson, “Job Turnover and Policy Evaluation: A General EquilibriumAnalysis,” Journal of Political Economy, 1993, 101 (5), 915–938.
Kurmann, Andre, Etienne Lale, and Lien Ta, “The Impact of COVID-19 on U.S.Employment and Hours: Real-Time Estimates with Homebase Data,” mimeo 2020.
Lee, Yoonsoo and Toshihiko Mukoyama, “Entry and Exit of Manufacturing Plantsover the Business Cycle,” European Economic Review, 2015, 77, 20–27.
Paynet, Inc., “Small Business Credit Conditions Report,” http://www.paynetonline.
com/ September 2020. Accessed: October 7, 2020.
Reinicke, Carmen, “How a Small-Business Software Company Became One of the MostAccurate Forecasters of the Pandemic Recession,” Business Insider, August 23 2020.
Sadeghi, Akbar, “The Births and Deaths of Business Establishments in the United States,”Monthly Labor Review, December 2008, pp. 3–18.
Simon, Ruth and Heather Haddon, “Small-Business Owners Feel Weight of PersonalDebt Guarantees,” The Wall Street Journal, Apr 2021.
Syverson, Chad, “What Determines Productivity?,” Journal of Economic Literature, 2011,49 (2), 326–365.
Wang, Jialan, Jeyul Yang, Benjamin Iverson, and Raymond Kluender,“Bankruptcy and the COVID-19 Crisis,” Working Paper, University of Illinois at Urbana-Champaign 2020.Yelp: Local Economic Impact Report
Yelp: Local Economic Impact Report, https: // www. yelpeconomicaverage. com/business-closures-update-sep-2020 September 2020. Accessed: October 5, 2020.
39

A Appendix for historical results
A.1 Alternative detrending specifications
In our main results for nationwide business cycle correlations, we detrend BED and BDSshutdown measures using simple linear trends. Table A1 repeats the results of Table 1 usingthe detrending methodology of Hamilton (2018) instead; since the Hamilton (2018) methodloses the first three years of data from the detrended series, we also report correlations basedon linear trends covering the same periods. The results are largely unaffected by detrendingmethodology, though we observe some differences for firm-based measures.
Table A1: Business cycle correlations: Hamilton (2018) detrending
Unemployment GDPUnweighted Weighted Unweighted Weighted
Hamilton (2018) method:BED: Establishment closures (BLS) .39 .18 -.35 -.14BED: Establishment deaths (BLS) .36 .22 -.33 -.24BDS: Establishment deaths (Census) .41 .13 -.19 -.02BDS: Firm deaths (Census) .16 .09 -.05 -.05
Linear method:BED: Establishment closures (BLS) .37 .20 -.41 -.11BED: Establishment deaths (BLS) .37 .27 -.46 -.19BDS: Establishment deaths (Census) .64 .37 -.46 -.16BDS: Firm deaths (Census) .41 .31 -.32 -.18
Note: BED correlated with quarterly change in unemployment rate or change in log realGDP. BDS correlated with annual change in unemployment rate or change in log realGDP on BDS annual timing (April-March). BED trends estimated on data for 1992q3-2019q1 (deaths) or 1992q3-2019q4 (closures); BED correlations omit first three quartersof data consistent with Hamilton (2018) methodology (and therefore do not match Table1 exactly). BDS trends estimated on data for 1978-2018; BDS correlations based on datafor 1984-2018.
Separately, our main specifications use the annual or quarterly change in the log of realGDP for GDP-based correlations. An alternative approach to specifying GDP is to extractthe cyclical component using a detrending method. Table A2 reports our main correlationsin which GDP is expressed as the cyclical component of real GDP from the Hamilton (2018)method (left panel) and the HP filter of Hodrick and Prescott (1997) parameterized as iscommon in the literature (right panel); exit rates are detrended linearly as in the main text.
The finding that establishment exit is more countercyclical than firm exit and unweightedexit rates are more countercyclical than employment-weighted exit rates still hold under theHamilton (2018) method for GDP detrending. The HP filter results are more puzzling;Hamilton (2018) recommends against using the HP filter, and we show it here only forreader convenience.
40

Table A2: Business cycle correlations: Alternative GDP specifications
Hamilton (2018) Hodrick and Prescott (1997)Unweighted Weighted Unweighted Weighted
BED: Establishment closures (BED) -.57 -.04 -.15 -.14BED: Establishment deaths (BED) -.44 .04 -.07 -.08BDS: Establishment deaths (BDS) -.29 .02 -.27 -.22BDS: Firm deaths (BDS) -.17 .00 -.08 -.22
Note: Exit rates detrended linearly. BED correlated with quarterly change in unemploymentrate or growth of GDP. BDS correlated with annual change in unemployment rate or detrendedreal GDP on BDS annual timing (April-March). HP filter parameter set at 6.25 for annual data(BDS correlations) and 1600 for quarterly data (BED correlations. BED data cover 1992q3-2019q1 (deaths) or 1992q3-2019q4 (closures). BDS data cover 1984-2018 (trends estimated on1978-2018 data).
A.2 Exit levels
In the main text we focus on rates of establishment and firm exit. The behavior of estab-lishment firm exit levels (in terms of number of firms or establishments and their associatedemployment) behave in a broadly similar manner over the business cycle, though some in-teresting different trends are apparent. Figure A1 replicates Figure 2 using levels instead ofrates.
The cyclicality of exit levels, particularly in recent years, is apparent in Figure A1.Interestingly, the number of exiting firms and establishments rose during the 1990s and2000s (as the number of firms and establishments in the U.S. grew), but the number of exitsdeclined after the Great Recession.
Table A3 reports business cycle correlations of exit level measures; that is, we correlatethe (detrended) number of establishment closures and deaths and firm deaths with the changein the unemployment rate and the change in log real GDP. We report exit level measuresdetrended linearly (top) and using the Hamilton (2018) method (bottom).
The countercyclicality of establishment exit is apparent in levels, as is the weaker coun-tercyclicality of employment-weighted quantities relative to unweighted quantities (with oneexception of firm deaths under the Hamilton (2018) method). The countercyclicality of firmdeath is, as in other results, weaker than establishment countercyclicality.
A.3 Exit rate denominators
In the main text, we calculate exit rates as the number of establishments (or firms) divided bythe average aggregate number of establishments (or firms) in the two periods (the so-called“DHS denominator” after Davis et al. (1996)). Likewise, we calculate employment-weightedexit rates as the jobs destroyed by exiting establishments (or firms) divided by averageaggregate employment in the two periods. This convention follows the business dynamicsliterature generally and is consistent with how the BLS and the Census Bureau provide pre-calculated exit rates. But the denominators in these calculations are endogenous to exit andmay be unintuitive to some readers, and our non-traditional measures use only initial values
41

250
350
450
550
650
750
850
250
350
450
550
650
750
850
Tho
usan
ds (
annu
al)
1982
1986
1990
1994
1998
2002
2006
2010
2014
2018
Establishment deathsFirm deaths
BDS - Establishments and firms
1500
2500
3500
4500
5500
6500
7500
1500
2500
3500
4500
5500
6500
7500
Tho
usan
ds (
annu
al)
1982
1986
1990
1994
1998
2002
2006
2010
2014
2018
BDS - Employment
100
200
300
400
500
100
200
300
400
500
Tho
usan
ds (
quar
terly
)
1992
1996
2000
2004
2008
2012
2016
2020
Establishment deathsEstablishment closures
BED - Establishments and firms
500
750
1000
1250
1500
1750
2000
500
750
1000
1250
1500
1750
2000
Tho
usan
ds (
quar
terly
)
1992
1996
2000
2004
2008
2012
2016
2020
BED - Employment
Note: BDS data are noisy around Economic Census years (2's and 7's). Establishments are single operating business locations.Firms are collections of one or more establishments under common ownership or operational control.Source: BLS Business Employment Dynamics (BED), Census Bureau Business Dynamics Statistics (BDS).
Figure A1: Historical patterns of business shutdown levels
42

Table A3: Business cycle correlations: Exit levels
Unemployment GDPUnweighted Weighted Unweighted Weighted
Linear method:BED: Establishment closures (BLS) .35 .21 -.40 -.10BED: Establishment deaths (BLS) .36 .23 -.45 -.13BDS: Establishment deaths (Census) .57 .34 -.29 -.05BDS: Firm deaths (Census) .39 .32 -.16 -.10
Hamilton (2018) method:BED: Establishment closures (BLS) .29 .10 -.35 -.09BED: Establishment deaths (BLS) .29 .10 -.49 -.09BDS: Establishment deaths (Census) .32 .10 -.26 -.06BDS: Firm deaths (Census) .08 .13 -.13 -.12
Note: BED correlated with quarterly change in unemployment rate or change in log realGDP. BDS correlated with annual change in unemployment rate or change in log real GDPon BDS annual timing (April-March). BED trends estimated on data for 1992q3-2019q1(deaths) or 1992q3-2019q4 (closures). BDS trends estimated on data for 1978-2018 butcorrelations estimated on data for 1984-2018.
in denominators, so we examine the robustness of our main results to using the lagged (i.e.,initial) establishment (or firm) count as the denominator for unweighted exit rates and usinglagged aggregate employment as the denominator for weighted exit rates. Importantly, ourmain results about recent average exit rates (described in our stylized facts bullets in themain text) are not affected, to rounding, by this alternative denominator.
We study the sensitivity to denominator choice on Table A4 where we repeat our maincorrelations from Table 1 instead using the lag denominator. For simplicity, we focus onBDS data only, and we repeat the main results for ease of comparison (shown in the lineswith the “(DHS)” parenthetical).
Table A4: Business cycle correlations: Different denominator
Unemployment GDPUnweighted Weighted Unweighted Weighted
Establishment deaths (DHS) .64 .37 -.46 -.16Establishment deaths (lag denominator) .60 .31 -.40 -.07Firm deaths (DHS) .41 .31 -.32 -.18Firm deaths (lag denominator) .35 .25 -.25 -.12
Note: Exit rates detrended linearly. BDS exit rates correlated with annual change in unem-ployment rate or change in log real GDP on BDS annual timing (April-March). BDS trendsestimated on data for 1978-2018 but correlations estimated on data for 1984-2018. “DHS”refers to the Davis et al. (1996) two-period averaged denominator.
Business cycle correlations for unweighted exit rates are somewhat weaker—but stillapparent—under the lag denominator, though employment-weighted exit rates are clearlyless cyclical. We repeat our state-level regressions (from Table 1) with the lag denominatoron Table A5; these are similar to the results with DHS denominators.
43

Table A5: Business cycle comovement: States (different de-nominator)
Establishment death Firm deathUnweighted Weighted Unweighted Weighted
Change in unemp 0.52*** 0.19*** 0.33*** 0.10***(0.03) (0.02) (0.02) (0.01)
Observations 816 816 816 816State FE Yes Yes Yes YesYear FE No No No No
Note: Regression of annual exit rates on annual change in unemploy-ment rates, 2003-2018. Exit rates use lag denominator. Unemploy-ment rate changes timed to correspond with BDS annual timing (April-March). Compare to Table 2.***denotes statistical significance with p < 0.01.Source: Author calculations from Business Dynamics Statistics andBLS unemployment data.
A.4 Using different sample periods
In the main text we explore official measures of business shutdown from two sources, BED(from the BLS) and BDS (from the Census Bureau). While BDS data have key advantagesin terms of time coverage and firm identification, BDS data do face some limitations aroundyears in which the Economic Census is conducted (those ending in 2 or 7) arising fromdifficulties with longitudinal linkages; these appear most significant in 2002, which was also ayear in which the underlying Business Register (formerly Standard Statistical EstablishmentList) source data were reorganized. In this section we briefly explore these limitations of theBDS.
We recreate the business cycle correlations in Table 1 omitting the year 2002 and, sep-arately, omitting all Economic Census years; these can be found on Table A6. For ease ofcomparison, we repeat the correlations from 1 (calculated on all years in the data) and alsoshow correlations in which specified years are omitted. Excluding 2002 or all Census yearshas little effect on the business cycle correlations of unweighted exit rates, but weightedrates are sensitive to these exclusions. Importantly, omitting these years is not necessarilythe best practice, as they are likely to reflect real data in addition to potential noise.
Table A7 repeats the state-level panel regressions shown on Table 2 with the omission ofEconomic Census years.
Economic Census years do not substantially alter the result that exit rates are counter-cyclical, correlating positively with the change in unemployment rates and negatively withGDP growth, and that this cyclicality is driven by smaller units.
Our main results for BDS data use the years 1984-2018. BDS data are available for 1978-2018, but we omit the early period because correlations are heavily sensitive to the omissionor inclusion of certain specific years during 1978-1983 (and particularly 1980-1983). Thismay be because the early 1980s recession years did not see elevated business exit in BDS
44

Table A6: Business cycle correlations: Census year robustness
Unemployment GDPUnweighted Weighted Unweighted Weighted
Establishment deaths (all years) .64 .37 -.46 -.16Establishment deaths (ex. 2002) .61 .29 -.42 -.03Establishment deaths (ex. EC years) .67 .34 -.52 -.11
Firm deaths (all years) .41 .31 -.32 -.18Firm deaths (ex. 2002) .41 .22 -.32 -.09Firm deaths (ex. EC years) .44 .21 -.43 -.16
Note: Exit rates detrended linearly. BDS correlated with annual change in unemploymentrate or change in log real GDP on BDS annual timing (April-March). “EC” is EconomicCensus (years ending in 2 or 7). BDS trends estimated on data for 1978-2018 but corre-lations estimated on data for 1984-2018.Source: Author calculations from Business Dynamics Statistics, BLS (unemploymentrates), and BEA (GDP).
Table A7: Business cycle comovement: States (excluding Cen-sus years)
Establishment death Firm deathUnweighted Weighted Unweighted Weighted
Change in unemp 0.57*** 0.23*** 0.36*** 0.11***(0.03) (0.02) (0.03) (0.01)
Observations 663 663 663 663State FE Yes Yes Yes YesYear FE No No No No
Note: Regression of state annual exit rates on annual change in unem-ployment rates, 2003-2018 excluding Economic Census years. Unem-ployment rate changes timed to correspond with BDS annual timing(April-March). Compare to Table 2.***denotes statistical significance with p < 0.01.Source: Author calculations from Business Dynamics Statistics andBLS unemployment data.
45

data. That said, the inclusion of the entire 1978-1983 period does not qualitatively matterfor our main results, as can be seen on Table A8.
Table A8: Business cycle correlations: Additional BDS years
Unemployment GDPUnweighted Weighted Unweighted Weighted
1978-2018:BDS: Establishment deaths (Census) .39 .16 -.28 -.01BDS: Firm deaths (Census) .16 .06 -.15 -.02
1984-2018:BDS: Establishment deaths (Census) .64 .37 -.46 -.16BDS: Firm deaths (Census) .41 .31 -.32 -.18
Note: Exit rates detrended linearly and correlated with annual change in unemploymentrate or change in log real GDP on BDS annual timing (April-March). Trends estimatedon full 1978-2018 sample.
A.5 Additional state results
Table 2 reports panel regressions relating state-level exit rates and changes in unemploymentrates with state fixed effects. Table A9 reports the same regressions without state fixedeffects (top panel) or with both state and year fixed effects (bottom panel). The fixed effectsspecification makes little difference. Moreover, in unreported results we find little effect ofomitting Economic Census years from these regressions.
A.6 2020 BDS redesign
Our main results feature the most recent vintage of the BDS, released in September 2020after a substantial redesign. Relative to the previous BDS vintage, the redesigned productfeatures extensive industry detail under consistent NAICS classification along with narrowertabulations across geography. The redesign also introduced expanded source data and im-proved longitudinal linking processes. The documentation released with the BDS redesignexplores these issues and highlights ongoing challenges.51 Importantly, overall patterns ofbusiness exit, and patterns around Economic Census years in particular, were slightly differ-ent in the previous vintage of BDS data. Figure A2 shows establishment (top panels) andfirm (bottom panels) exit rates, unweighted (left panels) and employment weighted (rightpanels).
These vintage differences also introduce differences in our business cycle correlations.Table A10 reports business cycle correlations for both the legacy BDS vintage and thecurrent (2020) vintage, where we omit the years 2017 and 2018 from the latter (includingthe detrending estimation) to have the same time coverage as the legacy vintage.
51See https://www.census.gov/programs-surveys/bds/news-updates/updates/2018-bds-release.html.
46

Table A9: Business cycle comovement: Alternative controls
Establishment death Firm deathUnweighted Weighted Unweighted Weighted
Change in unemp 0.55*** 0.22*** 0.36*** 0.11***(0.04) (0.03) (0.04) (0.01)
Observations 816 816 816 816State FE No No No NoYear FE No No No No
Change in unemp 0.46*** 0.18*** 0.40*** 0.10***(0.03) (0.03) (0.03) (0.02)
Observations 816 816 816 816State FE Yes Yes Yes YesYear FE Yes Yes Yes Yes
Note: Regression of state annual exit rates on annual change in un-employment rates, 2003-2018. Unemployment rate changes timed tocorrespond with BDS annual timing (April-March). Compare to Table2.***denotes statistical significance with p < 0.01.Source: Author calculations from Business Dynamics Statistics andBLS data.
Table A10: Business cycle correlations: Vintage comparisons
Unemployment GDPUnweighted Weighted Unweighted Weighted
Establishment deaths (2020 vintage) .63 .36 -.46 -.15Establishment deaths (legacy vintage) .40 .19 -.34 -.03
Firm deaths (2020 vintage) .43 .30 -.34 -.19Firm deaths (legacy vintage) .39 .29 -.36 -.22
Note: Exit rates detrended linearly. BDS correlated with annual change in unemploymentrate or growth of GDP on BDS annual timing (April-March). BDS trends estimated ondata for 1978-2018 but correlations estimated on data for 1984-2018.
47

8
10
12
14
8
10
12
14
Ann
ual r
ate
(%)
1982
1986
1990
1994
1998
2002
2006
2010
2014
2018
2020 vintageLegacy vintage
Establishment death - Unweighted
3
4
5
6
7
3
4
5
6
7
Ann
ual r
ate
(%)
1982
1986
1990
1994
1998
2002
2006
2010
2014
2018
Establishment death - Employment weighted
7
8
9
10
11
7
8
9
10
11
Ann
ual r
ate
(%)
1982
1986
1990
1994
1998
2002
2006
2010
2014
2018
2020 vintageLegacy vintage
Firm death - Unweighted
1
2
3
4
1
2
3
4
Ann
ual r
ate
(%)
1982
1986
1990
1994
1998
2002
2006
2010
2014
2018
Firm death - Employment weighted
Note: DHS denominators. Establishments are single operating business locations.Firms are collections of one or more establishments under common ownership or operational control.Source: Census Bureau Business Dynamics Statistics (BDS).
Figure A2: Vintage differences in BDS data
48

Differences between vintages are material for our quantitative estimates. On Table A11,we repeat our state-level regressions for vintage comparisons; our legacy vintage state-leveldata ended in 2014 so we first show regressions on the 2020 redesign data ending in 2014.We then show regressions on the legacy vintage data for the same years.
Table A11: Business cycle comovement: States, BDS vintages
Establishment death Firm deathUnweighted Weighted Unweighted Weighted
2020 vintage, 2003-2014 dataChange in unemp 0.43*** 0.13*** 0.32*** 0.09***
(0.03) (0.02) (0.03) (0.01)
Observations 612 612 612 612State FE Yes Yes Yes YesYear FE No No No No
Legacy vintage, 2003-2014 dataChange in unemp 0.30*** 0.04* 0.30*** 0.05***
(0.02) (0.02) (0.02) (0.01)Observations 612 612 612State FE Yes Yes Yes YesYear FE No No No No
Note: Regression of annual exit rates on annual change in unemployment rates, 2003-2014. Unemployment rate changes timed to correspond with BDS annual timing(April-March).***denotes statistical significance with p < 0.01.** denotes statistical significance with p < 0.05.* denotes statistical significance with p < 0.10.Source: Author calculations from Business Dynamics Statistics and BLS unemploy-ment data.
In the 2020 vintage, business cycle comovements with data for 2003-2014 are somewhatweaker than the comovements with data for 2003-2018 shown on Table 2. Within the 2003-2014 period, the legacy BDS vintage has notably weaker cyclicality in all categories than doesthe 2020 BDS vintage. That said, the countercyclicality of unweighted exit rates is confirmedin the older vintage, and there still exists modest countercyclicality even of weighted exit.
A.7 Industrial production
Our main business cycle correlations related exit rates with unemployment and GDP. TableA12 reports correlations using the growth rate of industrial production (IP) at quarterlyfrequency for BED correlations and annual frequency for BDS correlations. The left panelreports correlations with manufacturing IP, while the right panel reports correlations withtotal IP (which consists of manufacturing, mining, and utilities). Overall, exit measuresare consistently countercyclical with respect to IP. Manufacturing IP correlations follow the
49
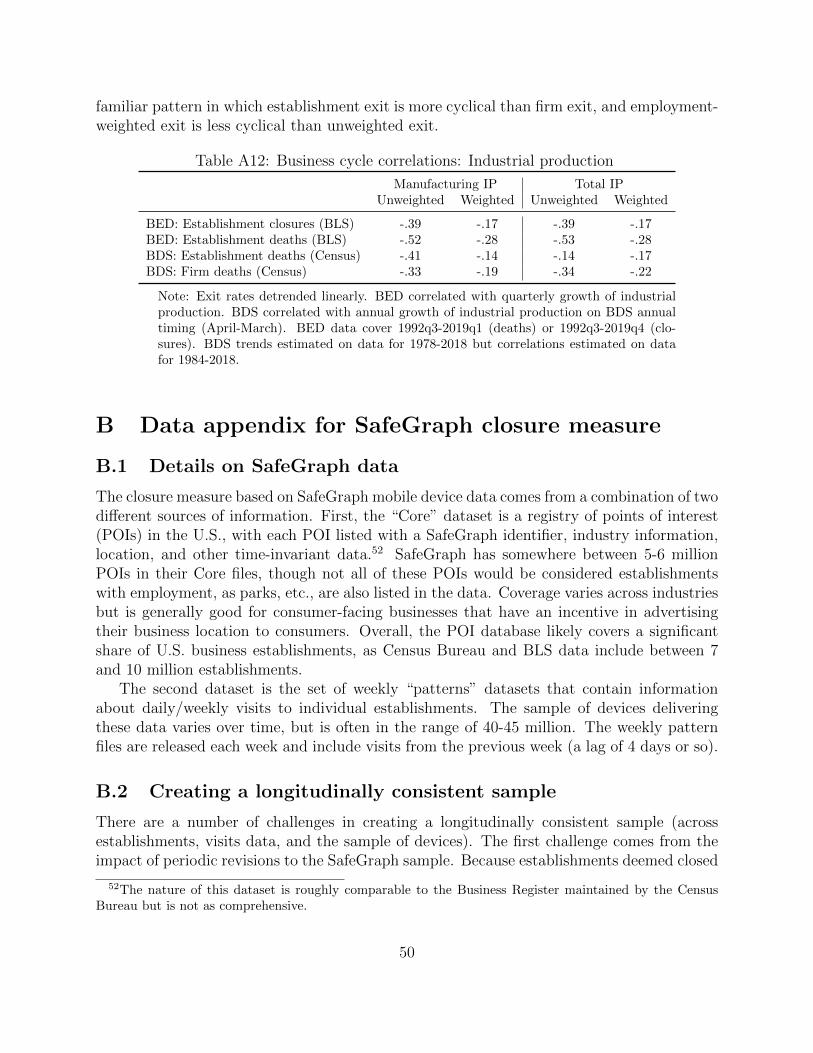
familiar pattern in which establishment exit is more cyclical than firm exit, and employment-weighted exit is less cyclical than unweighted exit.
Table A12: Business cycle correlations: Industrial production
Manufacturing IP Total IPUnweighted Weighted Unweighted Weighted
BED: Establishment closures (BLS) -.39 -.17 -.39 -.17BED: Establishment deaths (BLS) -.52 -.28 -.53 -.28BDS: Establishment deaths (Census) -.41 -.14 -.14 -.17BDS: Firm deaths (Census) -.33 -.19 -.34 -.22
Note: Exit rates detrended linearly. BED correlated with quarterly growth of industrialproduction. BDS correlated with annual growth of industrial production on BDS annualtiming (April-March). BED data cover 1992q3-2019q1 (deaths) or 1992q3-2019q4 (clo-sures). BDS trends estimated on data for 1978-2018 but correlations estimated on datafor 1984-2018.
B Data appendix for SafeGraph closure measure
B.1 Details on SafeGraph data
The closure measure based on SafeGraph mobile device data comes from a combination of twodifferent sources of information. First, the “Core” dataset is a registry of points of interest(POIs) in the U.S., with each POI listed with a SafeGraph identifier, industry information,location, and other time-invariant data.52 SafeGraph has somewhere between 5-6 millionPOIs in their Core files, though not all of these POIs would be considered establishmentswith employment, as parks, etc., are also listed in the data. Coverage varies across industriesbut is generally good for consumer-facing businesses that have an incentive in advertisingtheir business location to consumers. Overall, the POI database likely covers a significantshare of U.S. business establishments, as Census Bureau and BLS data include between 7and 10 million establishments.
The second dataset is the set of weekly “patterns” datasets that contain informationabout daily/weekly visits to individual establishments. The sample of devices deliveringthese data varies over time, but is often in the range of 40-45 million. The weekly patternfiles are released each week and include visits from the previous week (a lag of 4 days or so).
B.2 Creating a longitudinally consistent sample
There are a number of challenges in creating a longitudinally consistent sample (acrossestablishments, visits data, and the sample of devices). The first challenge comes from theimpact of periodic revisions to the SafeGraph sample. Because establishments deemed closed
52The nature of this dataset is roughly comparable to the Business Register maintained by the CensusBureau but is not as comprehensive.
50

are removed from the Core files, one must integrate historical Core snapshots in creating theuniverse of potential businesses. The earliest of these is from March 2020; hence, successfullyidentifying businesses during the process of closure becomes more challenging the furtherback one moves from March 2020.53 Practically speaking, this feature limits the ability tocompare measures of business exit between 2020 and equivalent months from earlier years.
A second challenge comes from revisions to the periodic patterns datasets that containinformation on visits. These revisions often remove the historical visits from businessesdeemed closed as of the time of the revision, a feature which could obviously bias estimatesof business closure. The latest of these revisions to the weekly data that extend back to early2019 occurred in May, 2020. To correct for this potential bias in months prior to May, 2020,we utilize an earlier dataset from the monthly version of the patterns information dated fromMarch 2020. These monthly snapshots that extend to early 2019 contain the daily detail toconstruct equivalent weekly estimates of visits. We use this supplementary information tofill out the sample with any POIs that could have been removed from the weekly patternsfiles.54
Finally, we adjust the weekly visits measure based on natural fluctuations in the un-derlying sample of mobile devices that are used to generate the data. This is particularlyimportant during the peak of social distancing in March and April, as the sample of devicesfell significantly during this time.55 Using the SafeGraph-provided summary data on mobiledevices recorded in given locations, we gross up the visits by the share of devices in a givenlocation population, and use this variable for all of our longitudinal comparisons.
B.3 Sample selection
Sit-down restaurants (NAICS 722511) is a good fit for the SafeGraph data for several reasons.First, this industry has particularly good coverage in the SafeGraph data. When aggregatingup to the four-digit NAICS category (7225) which includes limited service restaurants, thesample of SafeGraph establishments is reasonably close to official statistics (520 thousand vs580 thousand according to the BLS QCEW). Second, unlike some industries where expendi-ture switching to e-commerce can translate to sales without physical movement, restaurantsrequire movement to the geographic location of some form.56 While there has clearly beena migration from in-person dining to carry-out service at these establishments in recent
53This ability declines gradually, as it typically takes some time for SafeGraph to identify a business asclosed using their traditional methods.
54Because the monthly patterns files use different criteria for identifying the sample of devices for measuringvisits, we construct an establishment-specific scalar to adjust the visits derived from the monthly files basedon overlap between the monthly-based and weekly-based estimates of visits. Those establishments lackingan overlap are adjusted using the overall sample adjustment ratio.
55This was due, at least in part, to the fact that mobile devices are not counted when there is no locationdata being recorded, a feature that occurs more often when devices are stationary.
56In reality, it is actually unclear whether COVID-induced switch to e-commerce would mitigate the impacton business closure. To the extent a greater reliance on internet-based shopping translates to direct deliveryof merchandise, retail locations may be increasingly dispensable, with obvious implications for employment,at least at a spatial level.
51

months, the carry-out transactions still require a visit that would be picked up by cellphonetracking data (and this is true whether it be a delivery service or picked up by the ultimateconsumer). Figure B1 shows the shift in the distribution of visits toward carry-out, plottingthe median duration of a visit to restaurants in the sample. The median duration of a visitbefore the onset of COVID-19 of just under 40 minutes indicates that casual dining andsome form of carry-out service was likely a feature for these establishments even before thepandemic. Finally, sit-down restaurants have been particularly hard hit by the COVID-19recession and have thus received substantial attention in the popular press in the context ofclosure.
15
20
25
30
35
40
Med
ian
num
ber
of m
inut
es p
er v
isit
Jan01 Apr01 Jul01 Oct01Source: Author calculations from SafeGraph microdata.
Figure B1: Median duration of restaurant visits
We merge the Core datasets for all restaurant establishments to the weekly patterns filesthat encompass January 2019 to August 2020, retaining establishment data whether or notvisits are recorded. From there we create a balanced panel of weekly observations for eachestablishment, filling in visits as zero if no data were recorded in the patterns files. We imposea number of sample restrictions such as removing restaurants that record implausibly highnumbers of visits in a given week. The resulting dataset identifies 335 thousand restaurantsand covers around 85 weeks (≈28.5 million observations).
B.4 Defining temporary and permanent closures
The approach taken here is to infer the likelihood of temporary and permanent businessclosure based on the degree and duration of declines in customer visits. Although one mightexpect business closure to be associated with zero visits from customers, there are severalreasons that a non-zero threshold is appropriate. First, SafeGraph visits are based on asample of devices that is not universal. Second, even a closed business would likely continueto record some visits due to periodic trips to the establishment by owners, management,
52

or employees. Even after a prolonged or permanent closure, visits could be recorded ifcontractors or landlords continue to maintain the property. A third reason for a non-zerothreshold to record closures is due to data error: while cellphone tracking from GPS signals isreasonably precise, there is some noise in where SafeGraph identifies a given visit, particularlyif establishments are located close together.
For each case of temporary and permanent closures, we rely on additional data providedby SafeGraph to discipline the definitions based on visits data.
For temporary closures, we utilize an additional ad-hoc SafeGraph dataset resulting froman experimental analysis using machine-learning techniques to infer the operating status ofPOIs for the week of April 5th. The SafeGraph team trained a logistic model based onsome POIs with known operating status, using a series of visit attributes during this weekrelative to a baseline week in early March. The resulting dataset released to researchers hasa set of POIs with the predicted operational status from this model along with a confidencevalue.57 Working backward, we retain only those POIs with high confidence values and usethese data to identify simple rules in our sample of restaurants that most accurately alignwith temporary closure status. In addition to the year-over-year percent decline in visits, weconsider lower and upper bounds of the absolute value of visits associated with not operatingand operating status, respectively, as well as various forms of weekly smoothing (3-week vs5-week moving averages) for visit declines.
-.8
-.6
-.4
-.2
0
.2
Yea
r-ov
er-y
ear
perc
ent c
hang
e
Jan01 Apr01 Jul01 Sep30
OperatingNot operating
Source: Author's calculations using SafeGraph microdata.
Figure B2: Year-over-year percent change in visits, by operational statusWeek of April 5-11
Figure B2 shows the year-over-year percent change in visits based on operational statusfor the week of April 5th (identified by the dashed line in the chart). As expected, restaurantsidentified as closed had considerably lower average visits (78 percent declines) versus those
57Further information on this dataset is available at https://docs.safegraph.com/docs/operatingnot-operating-poi.
53

remaining open (31 percent decline). Narrowing in on the heterogeneity in visit declinesspecifically for the week of April 5th, Figure B3 plots the densities of the year-over-yearchange in visits, separately for those identified as operational and not operational. Whilethe overlap of the densities in Figure B3 indicates that any rule based on visit declines willbe imperfect, there is significant separation such that visit patterns are highly informativefor closure.
0
1
2
3
Den
sity
-1 -.5 0 .5 13-week moving average of year-over-year percent change in visits (for week of April 5-11)
OperatingNot operating
Source: Author's calcualtions using SafeGraph microdata.
Figure B3: Density of year-over-year percent changes in visits, by operational statusWeek of April 5-11
More formally, we calculate false positive (identifying closed establishments that are iden-tified as operational) and false negative (identifying open establishments that are identifiedas not operational) rates across a wide variety of parameter values.58 Ultimately, the bestcombination of parameters was a threshold of a 65 percent year-over-year decline in visits(using a 3-week moving average), a lower bound of 4 visits and an upper bound of 50 vis-its. This value of y/y declines is identified by the dashed line in Figure B3. For a formaldefinition of temporary closure, a business i is temporarily closed in week n if vti,n = 1:
vti,n =
1 if 1
3
∑n+1j=n−1
(vi,j−vi,j−52
vi,j−52
)< −0.65 and vi,n < 50
1 if vi,n ≤ 4
0 if 13
∑n+1j=n−1
(vi,j−vi,j−52
vi,j−52
)> −0.65 and vi,n > 4
0 if vi,n ≥ 50
(B1)
To guide definitions of permanent closures, we rely on recent additions to the “Core” datathat identify the opening and closing dates of POIs. These data are not directly applicable for
58This terminology is somewhat misleading as the “true” data from SafeGraph are themselves estimatessubject to error.
54

purposes of closure due to poor coverage; however, the patterns evident for POIs identifiedas permanently closed are nevertheless useful for constructing a universal definition basedon observable characteristics. To verify these closures identified by SafeGraph, we groupall restaurants according to closure date (including a category for those remaining open)and plot their average weekly visits over the sample period. Figure B4 plots the year-over-year percent change in weekly visits for some select closure dates. Overall, there issome evidence that the pattern of visits align with closure: visits drop in February forthose restaurants identified as closing in that month, though the average visits of theseestablishments do not fall immediately to zero. The closures occurring during or after theCOVID-19 pandemic show a similar pattern, with average visits remaining well below thosethat are identified as remaining open. The numbers corresponding to each line representthe number of establishment comprising the average visits—highlighting the lack of coveragefor these indicators. The large jump in closures in July, 2020, could be due at least in partto increased surveillance of closures by SafeGraph. It is also somewhat puzzling that thecontour of visits for the average of restaurants identified as closing in this month is onlyslightly below those identified as open.
328,830
104
109
4,546
-1
-.5
0
.5
Yea
r-ov
er-Y
ear
Per
cent
Cha
nge
in W
eekl
y V
isits
)
Jan01 Apr01 Jul01 Sep30
OpenClosed Feb.2020Closed May.2020Closed Jul.2020
Source: Author calculations from SafeGraph microdata. Numbers correspond to national number of restaurants in each group.
Figure B4: Weekly visits by identified closure Status
Figure B4 illustrates how the timing of a permanent closure is made difficult by thewidespread temporary closures in March and April of 2020. Moreover, even for the closuresidentified as before the lockdowns resulting from COVID-19 (for example, the February2020 closures shown by the red line), the weekly visits do not immediately drop to zero insubsequent weeks. Hence, the patterns in Figure B4 demonstrate that a threshold rule islikely also necessary for identifying a permanent closure. For simplicity, we therefore definea closure to be permanent if subsequent visits never rise above the visits threshold identifiedfor temporary closure. Formally, an establishment i is identified as permanently closed inweek n (vpi,n) if:
vpi,n = 1 if vti,n = 1 and ∀m > n vti,m = 1 (B2)
55

We translate these measures to a monthly frequency t such that vti,t equals one if any weeksn ∈ t are equal to one; for permanent closures all subsequent (smoothed) weeks must bebelow the threshold to be recorded as closed in the month.
Using prior contour of revisions to refine estimate of closures
Unlike temporary closures, an important feature of the definition of permanent closures isthat it is subject to revision as additional data become available. The set of permanentlyclosed establishments in a month t can only decline as additional weeks of data outside ofthat month become available. Hence the initial estimate of permanent closures for a givenmonth is an upper bound and will decline over time. One method of accounting for potentialfuture revisions in real time is to calculate the equivalent revision schedule from prior months’data and apply that forecasted revision to the appropriate vintage of more recent data. Asan example, Figure B5 illustrates the monthly closure rates for several months in our samplebased on the number of weeks following the end of the respective month. As is clear fromPanel A of Figure B5, the revisions are initially significant and then quickly decline. PanelB translates these estimates into a ratio relative to the initial estimate, and shows how onecan apply the revision schedule from prior months to arrive at a forecast estimate for asubsequent vintage of a more recent estimate.59
B.5 Alternate threshold
Figures B6 and B7 show measures of temporary and potentially permanent closures whenusing a threshold of 80 percent y/y visit declines (versus 65 percent as in our main specifi-cations); these figures can be compared to Figures 8 and 9. This more stringent thresholdnaturally leads to lower closure rates, with a cumulative death rate estimate of 9.3 percent(versus 13.5 percent in our main specification).
59Thanks to Brendan Price for helpful conversations on this methodology.
56

Figure B5: Revisions by month of identified permanent closure(a) Panel A: Monthly estimate by week
0
2
4
6
8
Per
cent
of e
stab
lishm
ents
0 5 10 15Weeks since end of month
MayJuneJuly
Source: Author calculations using SafeGraph microdata.
Revisions to Monthly Permanent Closure Rate
(b) Panel B: Revisions contour relative to initial reading
.2
.4
.6
.8
1
Fra
ctio
n of
initi
al v
alue
0 5 10 15Weeks since end of month
MayJuneJuly
Source: Author calculations using SafeGraph microdata. Dashed line extrapolate from prior months.
Revisions to Monthly Permanent Closure Rate
57

Figure B6: Temporary closures: 80 percent threshold
2% 3%
38%
43%
22%
12% 12% 11% 12% 13%
16%19% 19%
16%
0
20
40
0
10
20
30
40
Janu
ary
Febru
ary
March
April
MayJu
ne July
Augus
t
Septem
ber
Octobe
r
Novem
ber
Decem
ber
Janu
ary
Febru
ary
Source: Author calculations from SafeGraph microdata.Note: Temporary closure defined in Appendix.
Percent of Restaurants Temporarily Closed (80% Threshold)
Figure B7: Potentially permanent closures: 80 percent threshold
.8%
1.6%
9.3%
0
2
4
6
8
10
0
.5
1
1.5
Janu
ary
Febru
ary
March
April
MayJu
ne July
Augus
t
Septem
ber
Octobe
r
Novem
ber
Decem
ber
Janu
ary
Febru
ary
Monthly Rate, by month of identified closing (left)Cumulative for 2020 (right)
Source: Author calculations using SafeGraph microdata.Note: Permanent closure defined in Appendix. Last 3 months are preliminary and may revise.
Percent of Restaurants Permanently Closed (80% Threshold)
58
Copyright © 2022 FDOKUMEN