Harrold, F., B. Ellwood, P. Thacker, and S. Benoist (2003) Magnetic susceptibility analysis of...
17
TRABALHOS DE ARQUEOLOGIA 33 João Zilhão, Francesco d’Errico, eds. Proceedings of Symposium 6.1 of the XIV th Congress of the UISPP (University of Liège, Belgium, September 2-8, 2001) The Chronology of the Aurignacian and of the Transitional Technocomplexes Dating, Stratigraphies, Cultural Implications
Transcript of Harrold, F., B. Ellwood, P. Thacker, and S. Benoist (2003) Magnetic susceptibility analysis of...
T R A B A L H O S D E A R Q U E O L O G I A 3 3
J o ã o Z i l h ã o , F r a n c e s c o d ’ E r r i c o , e d s .
Proceedings of Symposium 6.1 of the XIVth Congress of the UISPP(University of Liège, Belgium, September 2-8, 2001)
The Chronology of the Aurignacian and of the TransitionalTechnocomplexesDating, Stratigraphies, Cultural Implications

TRABALHOS DE ARQUEOLOGIA; 33
COORDENAÇÃO EDITORIALAntónio Marques de Faria
DESIGN GRÁFICOwww.tvmdesigners.pt
PRÉ-IMPRESSÃO E IMPRESSÃOFacsimile, Lda.
TIRAGEM500 exemplares
Depósito Legal158769/00
ISSN 0871-2581ISBN 972-8662-15-7
Instituto Português de ArqueologiaLISBOA2003
O Instituto Português de Arqueologia respeita os originais dos textos quelhe são enviados pelos autores, não sendo, assim, responsável pelasopiniões expressas nos mesmos, bem como por eventuais plágios, cópias,ou quaisquer outros elementos que de alguma forma possam prejudicarterceiros.
CONTENTS
Preface 7
❚ E. d’Errico ❚ João Zilhão
“The Aurignacian”? Some thoughts 11
❚ L. G. Straus
Constitution of the Aurignacian through Eurasia 19
❚ M. Otte ❚ J. Kozlowski
Europe during the early Upper Palaeolithic 29
(40 000-30 000 BP): a synthesis❚ F. Djindjian ❚ J. Kozlowski ❚ F. Bazile
“Standardization” in Upper Paleolithic ornaments 49
at the coastal sites of Riparo Mochi and Üçagızlı cave❚ M. C. Stiner
In what sense is the Levantine Initial Upper Paleolithic 61
a “transitional” industry?❚ S. L. Kuhn
The chronological and industrial variability of the Middle 71
to Upper Paleolithic transition in eastern Europe❚ V. Chabai
The most ancient sites of Kostenki in the context 89
of the Initial Upper Paleolithic of northern Eurasia❚ A. Sinitsyn
Mamontovaya Kurya: an enigmatic, nearly 40 000 years 109
old Paleolithic site in the Russian Arctic❚ J. I. Svendsen ❚ P. Pavlov
The Bohunician and the Aurignacian 123
❚ J. Svoboda
(
The early Upper Paleolithic occupations of Willendorf II 133
(Lower Austria): a contribution to the chronostratigraphic and cultural context of the beginning of the Upper Paleolithic in Central Europe❚ P. Haesaerts ❚ N. Teyssandier
The cultural context of the Aurignacian of the Swabian Jura 153
❚ M. Bolus
Chronostratigraphy and Archeological Context 165
of the Aurignacian Deposits at Geißenklösterle❚ N. J. Conard ❚ G. Dippon ❚ P. Goldberg
Defining the earliest Aurignacian in the Swabian Alp: 179
the relevance of the technological study of the Geissenklösterle (Baden-Württemberg, Germany) lithic and organic productions❚ N. Teyssandier ❚ D. Liolios
Patterns of subsistence and settlement during the Aurignacian 199
of the Swabian Jura, Germany❚ L. Niven
New evidence for the chronology of the Aurignacian 213
and the question of Pleniglacial settlement in western central Europe❚ T. Terberger ❚ M. Street
Lithic taphonomy of the Châtelperronian/Aurignacian 223
interstratifications in Roc de Combe and Le Piage (Lot, France)❚ J.-G. Bordes
Many awls in our argument. Bone tool manufacture and 247
use in the Châtelperronian and Aurignacian levels of the Grotte du Renne at Arcy-sur-Cure❚ F. d’Errico ❚ M. Julien ❚ D. Liolios ❚ M. Vanhaeren ❚ D. Baffier
Did they meet or not? Observations on Châtelperronian 273
and Aurignacian settlement patterns in eastern France❚ H. Floss
The Châtelperronian of Grotte XVI, Cénac-et-Saint-Julien 289
(Dordogne, France)❚ G. Lucas ❚ J.-Ph. Rigaud ❚ J. Simek ❚ M. Soressi
Magnetic Susceptibility analysis of sediments at the Middle-Upper 301
Paleolithic transition for two cave sites in northern Spain❚ F. Harrold ❚ B. Ellwood ❚ P. Thacker ❚ S. Benoist
The chronology of the Aurignacian and Transitional 313
technocomplexes. Where do we stand?❚ J. Zilhão ❚ F. d’Errico
List of Contributors 351


Magnetic Susceptibility analysis of sedimentsat the Middle-Upper Paleolithic transition for two cave sites in northern Spain
❚ FRANCIS B. HARROLD ❚ BROOKS B. ELLWOOD ❚ PAUL T. THACKER ❚ STEPHEN L. BENOIST
Introduction
A major issue in understanding the Middle-Upper Paleolithic transition is the natureof the many assemblages, ranging geographically from southwestern Asia to westernEurope, that are commonly grouped together as “Aurignacian.” What is the relationship ofthe Aurignacian to the Mousterian? To so-called “transitional” industries of the early UpperPaleolithic such as the Châtelperronian and Uluzzian? To what extent is the “Aurignacian”meaningful as a culture-stratigraphic unit? Clearly, the answers to these much-debatedquestions are in no small measure dependent on the reliable ordering in time — chrono-metrically or, at least, relatively — of assemblages from archeological sites.
Our ability to date the archeological assemblages crucial to these questions has improvedover what it was a generation ago, and yet still inadequate to allow general agreement on theanswers. We now have hundreds of radiocarbon dates (including AMS dates) from the lateMiddle and early Upper Paleolithic of western Eurasia. However, the period in question,extending beyond 40 000 years BP, is at the extreme range of the method, which at this ageis susceptible to contamination and without an agreed-upon calibration method. Several otherchronometric methods, such as thermoluminescence and uranium series dating, have beenapplied to a number of sites. But so far, dates are few, with rather large error ranges, and havenot generally been directly calibrated to radiocarbon dates. Climatostratigraphic frameworksbased on pollen or cave sedimentology have been proposed for a number of regions. How-ever, problems of adequate sampling, of unrecognized stratigraphic lacunae, and of reliableintersite and interregional correlation have reduced the confidence of many workers in theability of these schemes to reliably correlate sites and their contents. The effect of these prob-lems is illustrated by the new “battle of the Aurignacian” (Zilhão and d’Errico, 2000) whichhas witnessed a fundamental disagreement over the chronology of the Aurignacian andChâtelperronian in Western Europe, the best-known province of Paleolithic Eurasia.
301MAGNETIC SUSCEPTIBILITY ANALYSIS OF SEDIMENTS AT THE MIDDLE-UPPER PALEOLITHIC TRANSITION FOR TWO CAVE SITES IN NORTHERN SPAIN
ABSTRACT We have used the magnetosusceptibilityevent and cyclostratigraphy (MSEC) method tocompare two cave excavations in northern Spain,at El Castillo and L’Arbreda caves, which havesedimentary sequences that span the interval forthe Middle-Upper Paleolithic transition. Bothcaves contain Aurignacian cultural deposits with
very early radiocarbon dates. Our interpretation of the results indicates that the Aurignacianoccupations in these caves began at essentially thesame time, and in both caves the Aurignacianoccupations correspond to a warm MSEC zonewhich we equate with the Hengelo warm climatezone, identified palynologically ca. 40-38 ka BP.
Here we discuss a relatively new method for tracing paleoclimate and effecting intersitecorrelations, and its applicability to the chronology of the Middle to Upper Paleolithic transition(Ellwood et al. 2001). We believe that it can be added to our armamentarium of methods as anindependent line of evidence that can help resolve some dating uncertainties in the period underdiscussion. We will here briefly discuss the essentials of this method, and then will briefly illus-trate its application at two key sites relevant to the chronology of the early Aurignacian.
The method
Magnetic susceptibility (MS) is a property of sediments, including cave sediments, thatcan be measured and, under the proper circumstances, is indicative of paleoclimate. MS isnot to be confused with remanent magnetism, the intrinsic magnetization that accounts forthe magnetic polarity record contained in some materials. This method is instead based onthe fact that all materials become magnetic when placed in a magnetic field; MS is an indi-cator of the strength of the induced magnetism within a sample.
In a geoarcheological context, MS is considered to be an indicator of iron mineral con-centration and can be quickly and easily measured on small, unoriented samples. MSworks as a proxy for climate in many cave sediments because climate controls this magneticproperty of the sediments deposited in the cave, primarily as the result of pedogenesis out-side the cave. Pedogenetic processes produce abundant magnetic minerals such asmaghemite and magnetite, and it is primarily their abundance that determines the magneticsusceptibility of soils. These sediments are then eroded, deposited and preserved in caves.The measurement of the sediments’ MS and its change over time through a cave’s strati-graphic profile allows inference of climatic change, opening the door to correlation betweenthe stratigraphic sequences of multiple sites in which MS measurements have been made.
Application of the method involves sampling sediments in 2 cm3 plastic boxes in a con-tinuous vertical series from stratigraphic profiles at each site. Each sample thus measuresMS in a 2-cm-thick accumulation of sediment. Sampling is performed in close coordinationwith site excavators so that the stratigraphic provenience of MS samples is known and canbe related to that of isotopic dates and artifactual and ecofactual materials from each site.Each sample is sieved and the <1 mm fraction is measured three times using the suscepti-bility bridge in the Rock Magnetism Laboratory at Louisiana State University.
Other effects on magnetic susceptibility
As already noted, the predominant explanation for the MS trends observed in cave sed-iments is the production of magnetic minerals in open-air soils by pedogenesis, erosion ofsoils and their transportation into caves, and finally the deposition and preservation of thesediment. Under certain circumstances, other factors may modify MS levels in such sedi-ments, potentially disrupting the climatic signal. However, we believe that with due carethese sources of error can be avoided or allowed for. Some of these include sedimentsources other than soils, gaps in the sedimentary record due to nondeposition and/or ero-sion, post-depositional alteration and sediment mixing. Many of these problems can beavoided by careful, high-density, continuous sampling, sample treatment before measure-ment (such as screening out the coarse fraction), and careful evaluation of sedimentary sec-tions being sampled, avoiding problem areas where possible.
302THE CHRONOLOGY OF THE AURIGNACIAN AND OF THE TRANSITIONAL TECHNOCOMPLEXES. DATING, STRATIGRAPHIES, CULTURAL IMPLICATIONS
While the effect of hearths burning within sites can affect the MS signal of immedi-ately adjacent sediments, our work (Ellwood et al., 1995, 1996) has shown that this effectis relatively small compared to the overall MS variation observed. Finally, because pedoge-nesis occurring in sediments has a major effect on MS, it is important to sample cave sed-iments sufficiently protected from outside processes so that within-site pedogenesis has nottaken place, or is minimal. It is also important to look for and to isolate zones of alterationwithin sampled sequences, and when identified these anomalous sediments should not beused in building a CRS composite.
MSEC
Using the method of graphic correlation (see Shaw, 1964), an MSEC composite refer-ence section can be built and then expanded, as data from more sites are gradually addedand correlated with the existing CRS (Ellwood et al., 2001). The compositing process beginswith the construction of time/depth graphs based on 14C ages. One of these is initially cho-sen as the reference standard (i.e. that section into which data from the other sections willbe graphically compiled), which, by convention, is placed on the x-axis.
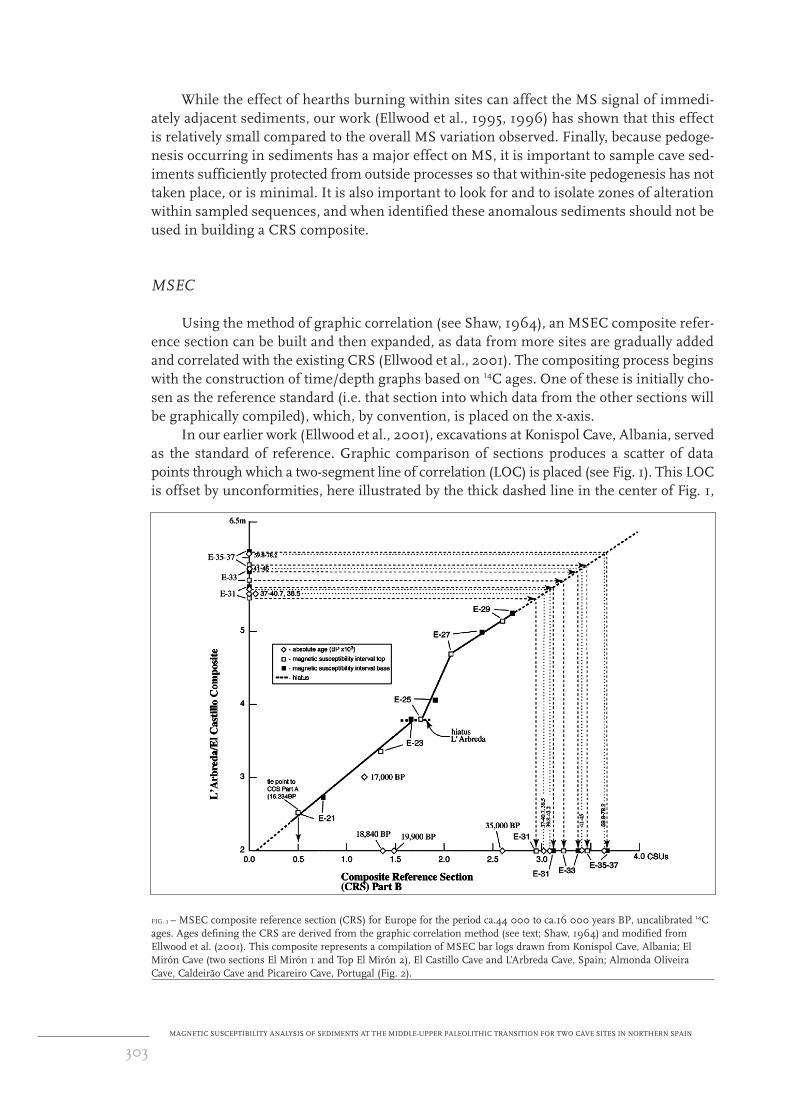
In our earlier work (Ellwood et al., 2001), excavations at Konispol Cave, Albania, servedas the standard of reference. Graphic comparison of sections produces a scatter of datapoints through which a two-segment line of correlation (LOC) is placed (see Fig. 1). This LOCis offset by unconformities, here illustrated by the thick dashed line in the center of Fig. 1,
303MAGNETIC SUSCEPTIBILITY ANALYSIS OF SEDIMENTS AT THE MIDDLE-UPPER PALEOLITHIC TRANSITION FOR TWO CAVE SITES IN NORTHERN SPAIN
FIG. 1 – MSEC composite reference section (CRS) for Europe for the period ca.44 000 to ca.16 000 years BP, uncalibrated 14Cages. Ages defining the CRS are derived from the graphic correlation method (see text; Shaw, 1964) and modified fromEllwood et al. (2001). This composite represents a compilation of MSEC bar logs drawn from Konispol Cave, Albania; ElMirón Cave (two sections El Mirón 1 and Top El Mirón 2), El Castillo Cave and L’Arbreda Cave, Spain; Almonda OliveiraCave, Caldeirão Cave and Picareiro Cave, Portugal (Fig. 2).
labeled ‘hiatus L’Arbreda.’ Data points unique to any new cave section (y-axis) enter the stan-dard section by projecting these points horizontally into the LOC and then vertically down intothe x-axis; the standard section at this point becomes the Composite Reference Standard (CRSPart B: In part B we have connected CRS Part B to CRS Part A using the Caldeirão Cave [Por-tugal] section by projecting the Caldeirão data set into the top of MSEC Zone E-21). In Fig. 1we are using as the y-axis a composite of both L’Arbreda and El Castillo (developed later in thispaper). By projecting the LOC backward in time, it is possible to extend data past the physi-cal limits of the initially chosen reference section. This process is illustrated by the projectionof MSEC intervals E-31 to 37 in Fig. 1 (dashed arrows). Therefore, the CRS is a graphic con-struct that grows and becomes better defined with the addition of each new data set. Thismethod is explained in greater detail than is possible here, in Ellwood et al. (2001).
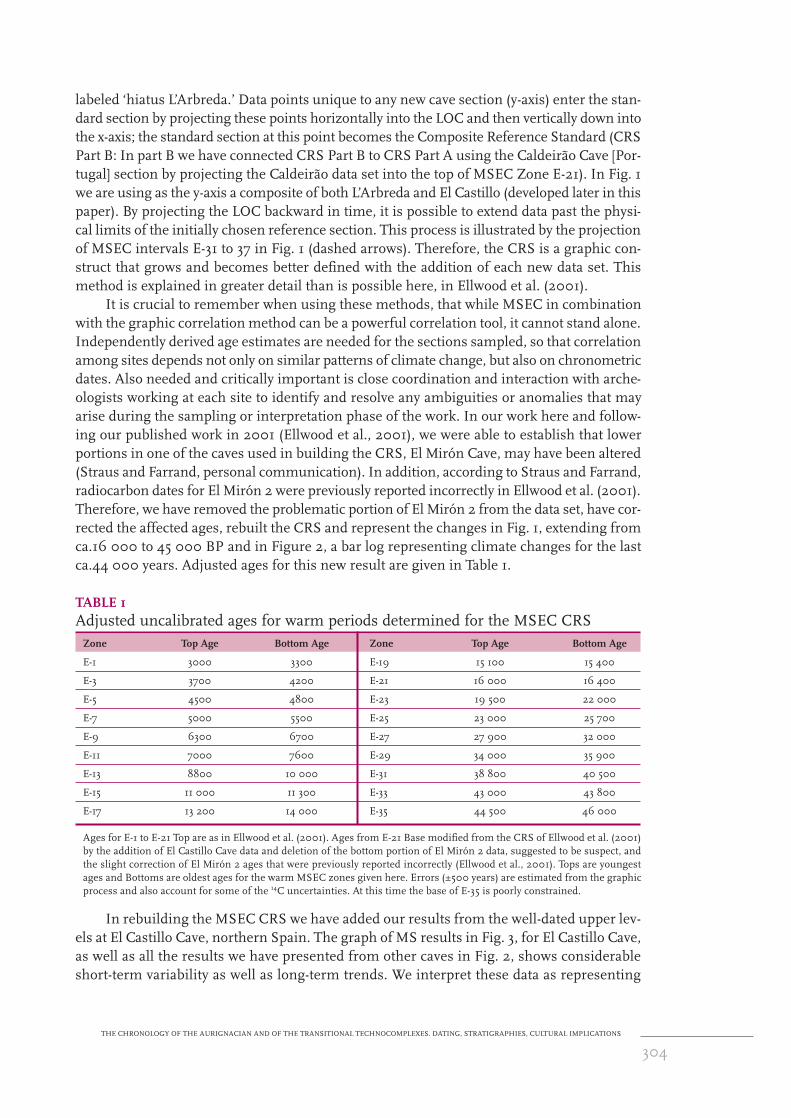
It is crucial to remember when using these methods, that while MSEC in combinationwith the graphic correlation method can be a powerful correlation tool, it cannot stand alone.Independently derived age estimates are needed for the sections sampled, so that correlationamong sites depends not only on similar patterns of climate change, but also on chronometricdates. Also needed and critically important is close coordination and interaction with arche-ologists working at each site to identify and resolve any ambiguities or anomalies that mayarise during the sampling or interpretation phase of the work. In our work here and follow-ing our published work in 2001 (Ellwood et al., 2001), we were able to establish that lowerportions in one of the caves used in building the CRS, El Mirón Cave, may have been altered(Straus and Farrand, personal communication). In addition, according to Straus and Farrand,radiocarbon dates for El Mirón 2 were previously reported incorrectly in Ellwood et al. (2001).Therefore, we have removed the problematic portion of El Mirón 2 from the data set, have cor-rected the affected ages, rebuilt the CRS and represent the changes in Fig. 1, extending fromca.16 000 to 45 000 BP and in Figure 2, a bar log representing climate changes for the lastca.44 000 years. Adjusted ages for this new result are given in Table 1.
TABLE 1Adjusted uncalibrated ages for warm periods determined for the MSEC CRS
Zone Top Age Bottom Age Zone Top Age Bottom Age
E-1 3000 3300 E-19 15 100 15 400
E-3 3700 4200 E-21 16 000 16 400
E-5 4500 4800 E-23 19 500 22 000
E-7 5000 5500 E-25 23 000 25 700
E-9 6300 6700 E-27 27 900 32 000
E-11 7000 7600 E-29 34 000 35 900
E-13 8800 10 000 E-31 38 800 40 500
E-15 11 000 11 300 E-33 43 000 43 800
E-17 13 200 14 000 E-35 44 500 46 000
Ages for E-1 to E-21 Top are as in Ellwood et al. (2001). Ages from E-21 Base modified from the CRS of Ellwood et al. (2001) by the addition of El Castillo Cave data and deletion of the bottom portion of El Mirón 2 data, suggested to be suspect, andthe slight correction of El Mirón 2 ages that were previously reported incorrectly (Ellwood et al., 2001). Tops are youngestages and Bottoms are oldest ages for the warm MSEC zones given here. Errors (±500 years) are estimated from the graphicprocess and also account for some of the 14C uncertainties. At this time the base of E-35 is poorly constrained.
In rebuilding the MSEC CRS we have added our results from the well-dated upper lev-els at El Castillo Cave, northern Spain. The graph of MS results in Fig. 3, for El Castillo Cave,as well as all the results we have presented from other caves in Fig. 2, shows considerableshort-term variability as well as long-term trends. We interpret these data as representing
304THE CHRONOLOGY OF THE AURIGNACIAN AND OF THE TRANSITIONAL TECHNOCOMPLEXES. DATING, STRATIGRAPHIES, CULTURAL IMPLICATIONS
changes between generally warmer (and usually wetter) periods with more pedogenesis,resulting in higher MS levels, and cooler (and usually drier) periods, with less pedogene-sis, and correspondingly lower MS levels. For purposes of climatic interpretation and cor-relation, the bar logs in Figs. 2 and 3 simplify the presentation of MSEC results into zonesof relative high and low MS values, much as the continuous curves of δ18O values of the oxy-gen-isotope SPECMAP are divided into numbered stages (Imbrie et al., 1984). The hatchedareas represent higher MS and warmer temperatures, while open areas represent lower MSand cooler conditions. The graphic display of results (Fig. 1) incorporates the location ofchronometric dates, and the raw MS data and bar logs as presented for El Castillo Cave inFig. 3 allow presentation of cultural attributions of associated archeological remains.
Results and discussion
Our updated Composite Reference Standard (CRS; Fig. 2) is derived from data fromeight sites in Europe (Spain, Portugal, and Albania) and proposed for the period fromroughly 3000 to 44 000 BP, thus including the span of the Upper Paleolithic and the late
305MAGNETIC SUSCEPTIBILITY ANALYSIS OF SEDIMENTS AT THE MIDDLE-UPPER PALEOLITHIC TRANSITION FOR TWO CAVE SITES IN NORTHERN SPAIN
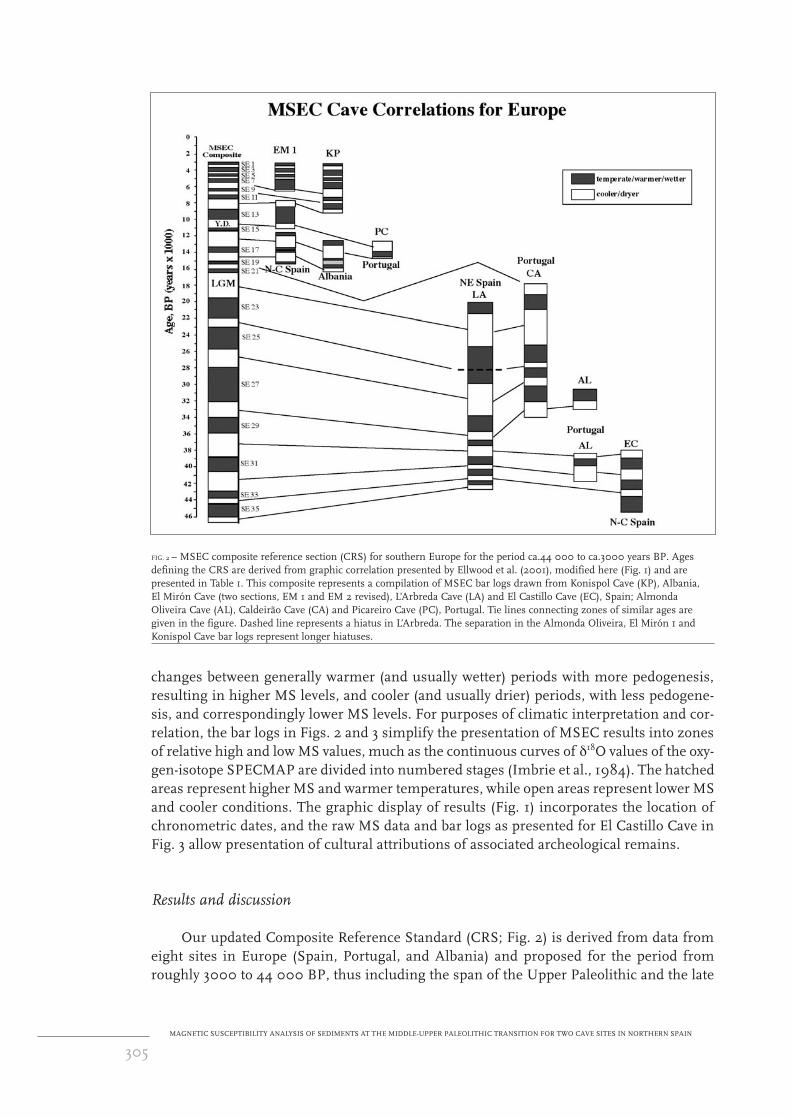
FIG. 2 – MSEC composite reference section (CRS) for southern Europe for the period ca.44 000 to ca.3000 years BP. Agesdefining the CRS are derived from graphic correlation presented by Ellwood et al. (2001), modified here (Fig. 1) and arepresented in Table 1. This composite represents a compilation of MSEC bar logs drawn from Konispol Cave (KP), Albania, El Mirón Cave (two sections, EM 1 and EM 2 revised), L’Arbreda Cave (LA) and El Castillo Cave (EC), Spain; AlmondaOliveira Cave (AL), Caldeirão Cave (CA) and Picareiro Cave (PC), Portugal. Tie lines connecting zones of similar ages aregiven in the figure. Dashed line represents a hiatus in L’Arbreda. The separation in the Almonda Oliveira, El Mirón 1 andKonispol Cave bar logs represent longer hiatuses.
Middle Paleolithic. The timeline for the CRS is in uncalibrated radiocarbon years. TheCRS identifies the MSEC stages, or zones (bar logs in Fig. 2, numbered from E-1 back to E-35), that have been identified, and notes the zones that have been correlated with the LastGlacial Maximum and Younger Dryas. It also shows how hiatuses in the profiles at somesites, due to nondeposition and/or erosion, are compensated for by sections of thesequences at other sites. Continued incorporation of more sites into the CRS will improveits accuracy and precision, but already the main lines of late Pleistocene climatic changehave emerged, and these generally agree well with other lines of evidence, such as pollendata and harmonic studies that show a ca.2500 year Neo-glacial climate cyclicity (Ellwoodet al., 1996, for Konispol Cave, Albania; Ellwood et al., 1998, for Caldeirão Cave, Portugal;for El Mirón Cave, Spain, unpublished data) known for the Holocene (Mitchell, 1976) andlate Pleistocene (O’Brien et al., 1995).
In the time period of interest here, the climatic fluctuations associated with later por-tions of oxygen-isotope Stage 3 are well reflected, but, because our CRS is preliminary andneeds additional data points, the error estimates for CRS dates with increasing age becomelarger, creating some age uncertainties. In addition, this is compounded by the age uncer-tainties associated with 14C dates. However, we are able to correlate the well-known Hengelowarm phase, characterized palynologically (ca.40-38 ka) and often identified with the WürmII-III interstadial, with our warm zone E-31 (40 500 to 38 800 [±500] BP). This associationis important when considering the two sites of significance to us in this paper, El CastilloCave and L’Arbreda Cave (see discussion below).
306THE CHRONOLOGY OF THE AURIGNACIAN AND OF THE TRANSITIONAL TECHNOCOMPLEXES. DATING, STRATIGRAPHIES, CULTURAL IMPLICATIONS
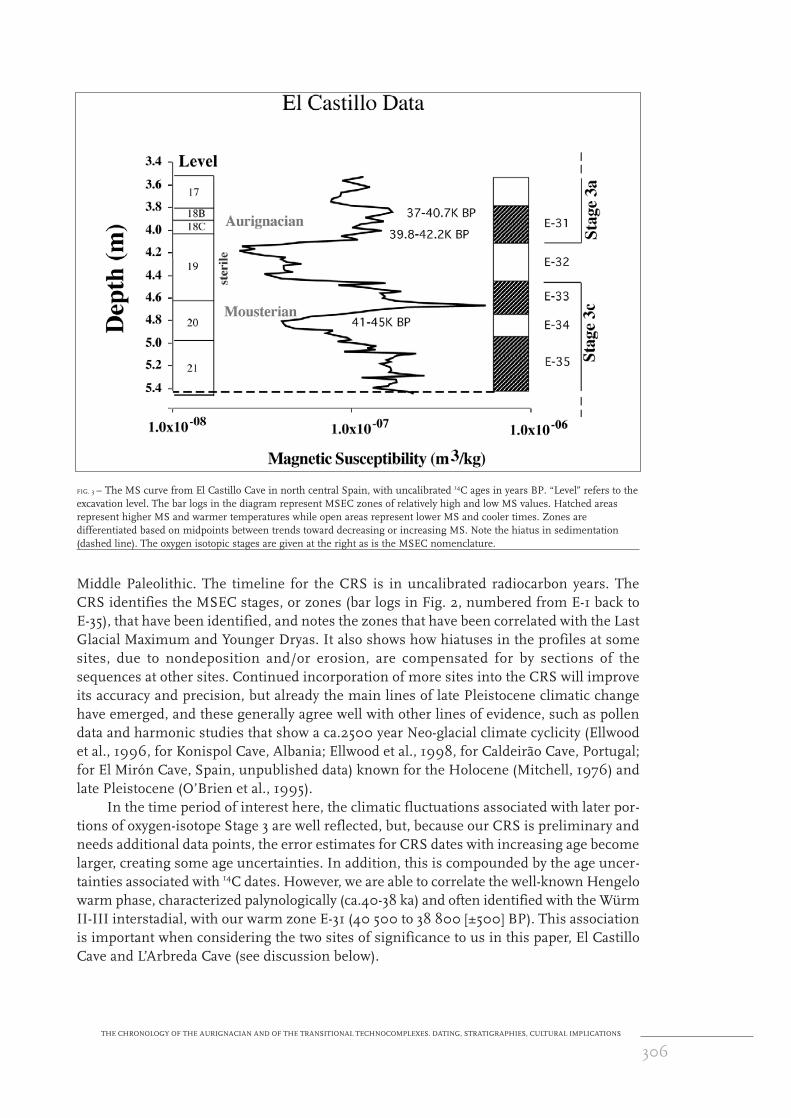
FIG. 3 – The MS curve from El Castillo Cave in north central Spain, with uncalibrated 14C ages in years BP. “Level” refers to theexcavation level. The bar logs in the diagram represent MSEC zones of relatively high and low MS values. Hatched areasrepresent higher MS and warmer temperatures while open areas represent lower MS and cooler times. Zones aredifferentiated based on midpoints between trends toward decreasing or increasing MS. Note the hiatus in sedimentation(dashed line). The oxygen isotopic stages are given at the right as is the MSEC nomenclature.
Aurignacian of Northern Spain
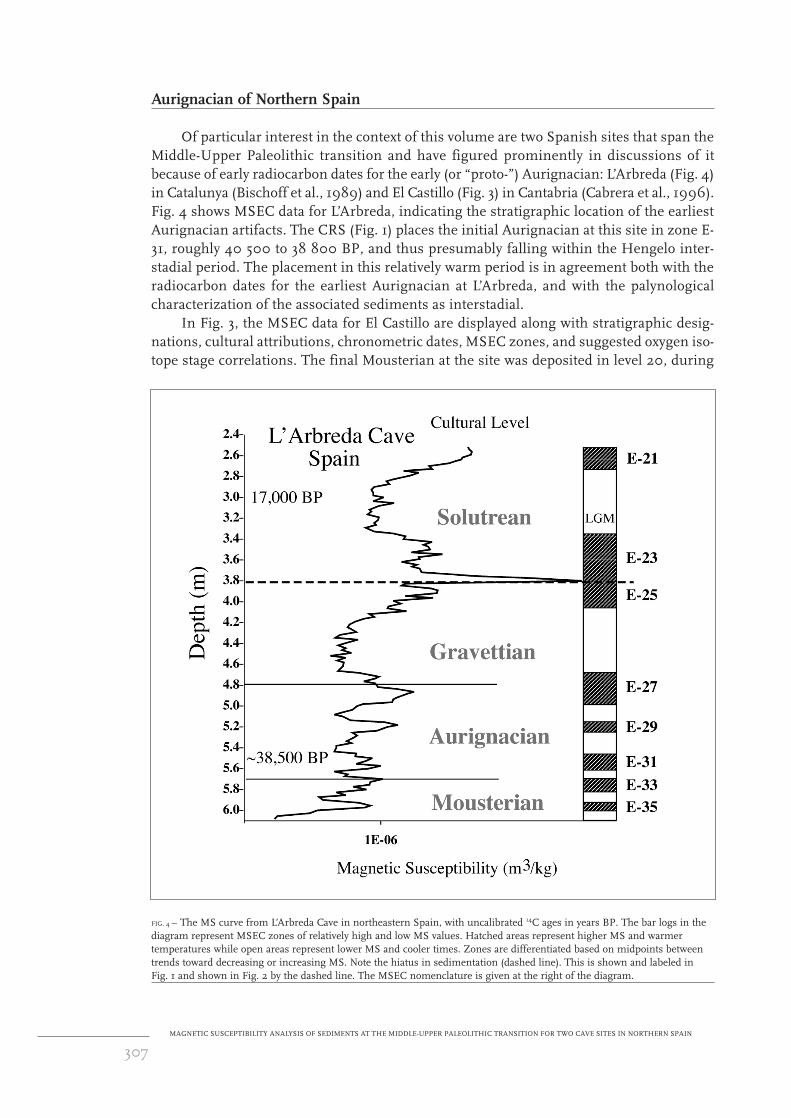
Of particular interest in the context of this volume are two Spanish sites that span theMiddle-Upper Paleolithic transition and have figured prominently in discussions of itbecause of early radiocarbon dates for the early (or “proto-”) Aurignacian: L’Arbreda (Fig. 4)in Catalunya (Bischoff et al., 1989) and El Castillo (Fig. 3) in Cantabria (Cabrera et al., 1996).Fig. 4 shows MSEC data for L’Arbreda, indicating the stratigraphic location of the earliestAurignacian artifacts. The CRS (Fig. 1) places the initial Aurignacian at this site in zone E-31, roughly 40 500 to 38 800 BP, and thus presumably falling within the Hengelo inter-stadial period. The placement in this relatively warm period is in agreement both with theradiocarbon dates for the earliest Aurignacian at L’Arbreda, and with the palynologicalcharacterization of the associated sediments as interstadial.
In Fig. 3, the MSEC data for El Castillo are displayed along with stratigraphic desig-nations, cultural attributions, chronometric dates, MSEC zones, and suggested oxygen iso-tope stage correlations. The final Mousterian at the site was deposited in level 20, during
307MAGNETIC SUSCEPTIBILITY ANALYSIS OF SEDIMENTS AT THE MIDDLE-UPPER PALEOLITHIC TRANSITION FOR TWO CAVE SITES IN NORTHERN SPAIN
FIG. 4 – The MS curve from L’Arbreda Cave in northeastern Spain, with uncalibrated 14C ages in years BP. The bar logs in thediagram represent MSEC zones of relatively high and low MS values. Hatched areas represent higher MS and warmertemperatures while open areas represent lower MS and cooler times. Zones are differentiated based on midpoints betweentrends toward decreasing or increasing MS. Note the hiatus in sedimentation (dashed line). This is shown and labeled in Fig. 1 and shown in Fig. 2 by the dashed line. The MSEC nomenclature is given at the right of the diagram.
our zone E-34 (and perhaps the beginning of zone E-33). Zone E-34 is a cold period, and sed-imentological evidence also indicates cold conditions during deposition of level 20 (Cabreraet al., 1996). Level 19, now characterized as archeologically sterile (Cabrera et al., 2001), wasdeposited during warm zone E-33 and cold zone E-32 times. The earliest Aurignacian artifactscome from level 18C, identified by the CRS with warm E-31, and hence representing the Hen-gelo interstadial period. This is again consistent with site sedimentology and faunal evidence,according to which level 18 is climatically mild. Given the uncertainties in ages, this attri-bution is consistent with the radiocarbon dates from level 18 (Fig. 3).
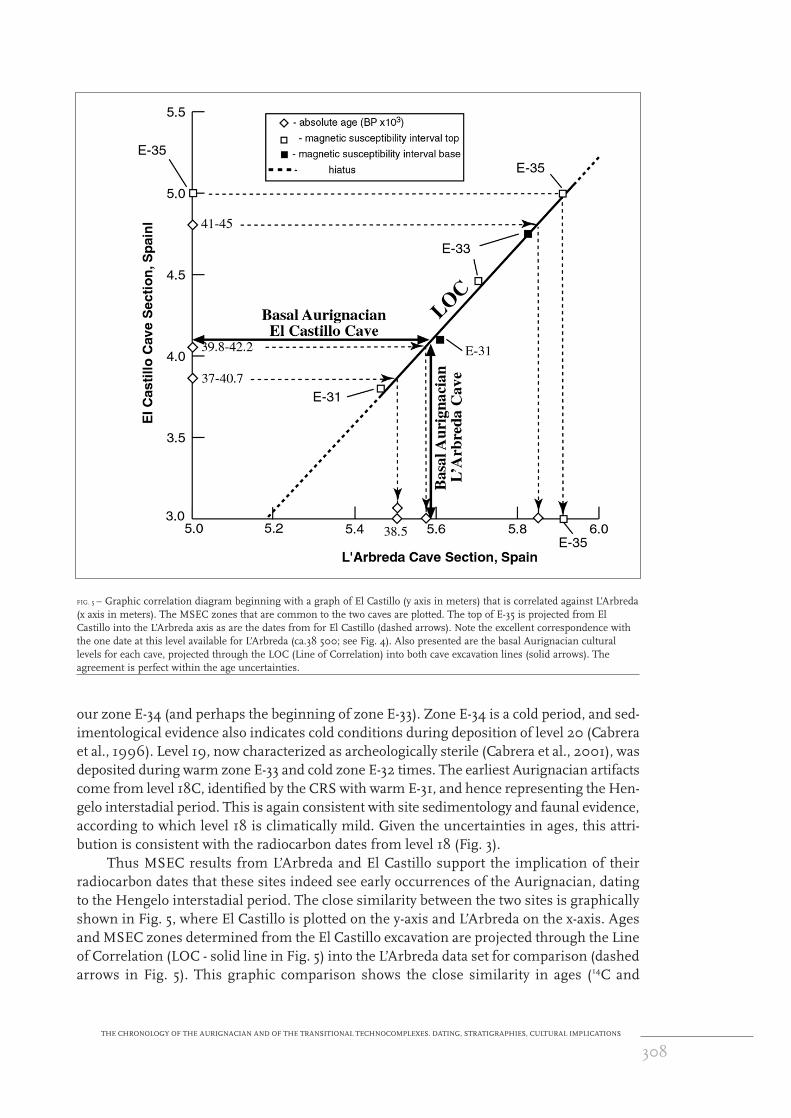
Thus MSEC results from L’Arbreda and El Castillo support the implication of theirradiocarbon dates that these sites indeed see early occurrences of the Aurignacian, datingto the Hengelo interstadial period. The close similarity between the two sites is graphicallyshown in Fig. 5, where El Castillo is plotted on the y-axis and L’Arbreda on the x-axis. Agesand MSEC zones determined from the El Castillo excavation are projected through the Lineof Correlation (LOC - solid line in Fig. 5) into the L’Arbreda data set for comparison (dashedarrows in Fig. 5). This graphic comparison shows the close similarity in ages (14C and
308THE CHRONOLOGY OF THE AURIGNACIAN AND OF THE TRANSITIONAL TECHNOCOMPLEXES. DATING, STRATIGRAPHIES, CULTURAL IMPLICATIONS
FIG. 5 – Graphic correlation diagram beginning with a graph of El Castillo (y axis in meters) that is correlated against L’Arbreda(x axis in meters). The MSEC zones that are common to the two caves are plotted. The top of E-35 is projected from ElCastillo into the L’Arbreda axis as are the dates from for El Castillo (dashed arrows). Note the excellent correspondence withthe one date at this level available for L’Arbreda (ca.38 500; see Fig. 4). Also presented are the basal Aurignacian culturallevels for each cave, projected through the LOC (Line of Correlation) into both cave excavation lines (solid arrows). Theagreement is perfect within the age uncertainties.
MSEC zone boundaries) and climatic (MSEC zone) character, and illustrates the closeagreement between the two caves. In fact, when the basal Aurignacian excavation level fromL’Arbreda is graphically compared with the corresponding level at El Castillo (bold solidarrows in Fig. 5), it is clear that, within the age uncertainties, the basal Aurignacian is iden-tical in age between the two sites. Therefore, we interpret our data to indicate that the ElCastillo Aurignacian and the L’Arbreda Aurignacian, both assigned to MSEC zone 31, areprobably equivalent in age and in climatic phase. Whether the Aurignacian is an intrusive(Zilhão and d’Errico, 2000) or an autochthonous (Cabrera et al., 2001) phenomenon inSpain, this inference supports the case that the earliest appearance of the Aurignacian innorthern Spain is contemporary with the late Mousterian, rather than subsequent to it.
Acknowledgments
Support for MSEC research was provided by Grant BCS9903172 from the National Sci-ence Foundation. We thank the following colleagues for permission to sample sites and forproductive discussions of the results: J. Zilhão, N. Soler, J. Maroto, V. Cabrera Valdés, F. Bernaldo de Quirós, N. Bicho, V. Villaverde, L. Straus, M. González Morales, M. Otte, andD. Bonjean.
REFERENCES
BISCHOFF, J.; SOLER, N.; MAROTO, J.; JULIÀ, R. (1989) - Abrupt Mousterian/Aurignacian boundary at c. 40 ka bp:Accelerator dates from L’Arbreda Cave (Catalunya, Spain). Journal of Archaeological Science. London. 16, p. 563-576.
BURJACHS I CASAS, F. (1993) - Paleopalinología del Paleolítico Superior de la Cova de l’Arbreda (Serinyà, Catalunya). InFUMANAL, M. P.; BERNABEU, J., eds. - Estudios sobre cuaternario: medios sedimentarios, cambios ambientales, habitat.Valencia: Asociación Española para el Estudio del Cuaternario, p. 149-157.
CABRERA, V.; MAILLO, J. M.; LLORET, M.; BERNALDO DE QUIRÓS, F. (2001) - La transition vers le Paléolithique supérieurdans la grotte du Castillo (Cantabrie, Espagne): la couche 18. L’Anthropologie. Paris. 105, p. 505-532.
CABRERA VALDÉS, V.; VALLADAS, H.; BERNALDO DE QUIRÓS, F.; HOYOS GÓMEZ, F. (1996) - La transitionPaléolithique moyen-Paléolithique supérieur à El Castillo (Cantabrie): Nouvelles datations par le carbone-14. Comptes-rendus de l’Académie des Sciences. Paris. Série IIa, 322, p. 1093-1098.
ELLWOOD, B. B.; HARROLD, F. B.; PETRUSO, K. M. (1996) - The utility of magnetic susceptibility for detecting paleoclimatictrends and as a stratigraphic correlation tool: An example from Konispol Cave sediments, SW Albania. Journal of Field
Archaeology. Boston. 23, p. 263-271.
ELLWOOD, B. B.; HARROLD, F. B.; BENOIST, S. L.; STRAUS, L. G.; GONZÁLEZ MORALES, M.; PETRUSO, K. M.; BICHO,N.; ZILHÃO, J.; SOLER, N. (2001) - Paleoclimate and intersite correlation from Late Pleistocene/Holocene cave sites:Results from Southern Europe. Geoarchaeology. Boston. 16, p. 433-463.
ELLWOOD, B. B.; PETER, D. E.; BALSAM, W.; SCHIEBER, J. (1995) - Magnetic and geochemical variations as indicators ofpaleoclimate and archaeological site evolution: Examples from 41TR68, Fort Worth, Texas. Journal of Archaeological Science.London. 22, p. 409-415.
ELLWOOD, B. B.; ZILHÃO, J.; HARROLD, F. B.; BALSAM, W.; BURKART, B.; LONG, G. J.; DEBÉNATH, A.;BOUZOUGGAR, A. (1998) - Identification of the Last Glacial Maximum in the Upper Paleolithic of Portugal usingmagnetic susceptibility measurements of Caldeirão Cave sediments. Geoarchaeology. Boston. 13, p. 55-71.
IMBRIE, J.; HAYS, J. D.; MARTINSON, D. G.; MCINTYRE, A.; MIX, A. C.; MORLEY, J. J.; PISIAS, N. G.; PRELL, W. L.;SHACKLETON, N. J. (1984) - The orbital theory of Pleistocene climate change: Support from a revised chronology of themarine delta 18O record. In BERGER, A.; IMBRIE, J.; HAYS, J.; KUKLA, J.; SALTZMAN, B., eds.- Milankovitch and Climate
(Part I). Boston: Reidel, p. 269-305.
309MAGNETIC SUSCEPTIBILITY ANALYSIS OF SEDIMENTS AT THE MIDDLE-UPPER PALEOLITHIC TRANSITION FOR TWO CAVE SITES IN NORTHERN SPAIN

MITCHELL Jr., J. M. (1976) - An overview of climatic variability and its causal mechanisms. Quaternary Research. London. 6, p. 481-493.
O’BRIEN, S. R.; MAYEWSKI, P. A.; MEEKER, L. D.; MEESE, D. A.; TWICKLER, M. S.; WHITLOW, S. I. (1995) - Complexityof Holocene climate as reconstructed from a Greenland ice core. Science. Washington. 270, p. 1962-1964.
OTTE, M.; STRAUS, L. S., eds. (1995) - Le Trou Magrite: Fouilles 1991-92. Liège: Université (Etudes et RecherchesArchéologiques de l’Université de Liège; 69).
SHAW, A. D. (1964) - Time in Stratigraphy. New York: McGraw-Hill.
ZILHÃO, J.; D’ERRICO, F. (2000) - La nouvelle “bataille aurignacienne:” Une révision critique de la chronologie duChâtelperronien et de l’Aurignacien ancien. L’Anthropologie. Paris. 104, p. 17-50.
310THE CHRONOLOGY OF THE AURIGNACIAN AND OF THE TRANSITIONAL TECHNOCOMPLEXES. DATING, STRATIGRAPHIES, CULTURAL IMPLICATIONS