harmony 2003 - Annual Report
159
THIS YEAR’S ANNUAL REPORT CONVEYS EXACTLY WHO WE ARE, WHAT WE HAVE DONE, WHAT WE ARE DOING AND WHERE WE ARE GOING. NO FUSS, NO FRILLS. HARMONY 2003
-
Upload
khangminh22 -
Category
Documents
-
view
2 -
download
0
Transcript of harmony 2003 - Annual Report

THIS YEAR’SANNUAL REPORTCONVEYS EXACTLYWHO WE ARE, WHATWE HAVE DONE,WHAT WE AREDOING AND WHEREWE ARE GOING.
NO FUSS, NO FRILLS.
HARMONY2003
1997 1998 1999 2000 2001 2002 20030
10
20
30
40
50
60
70
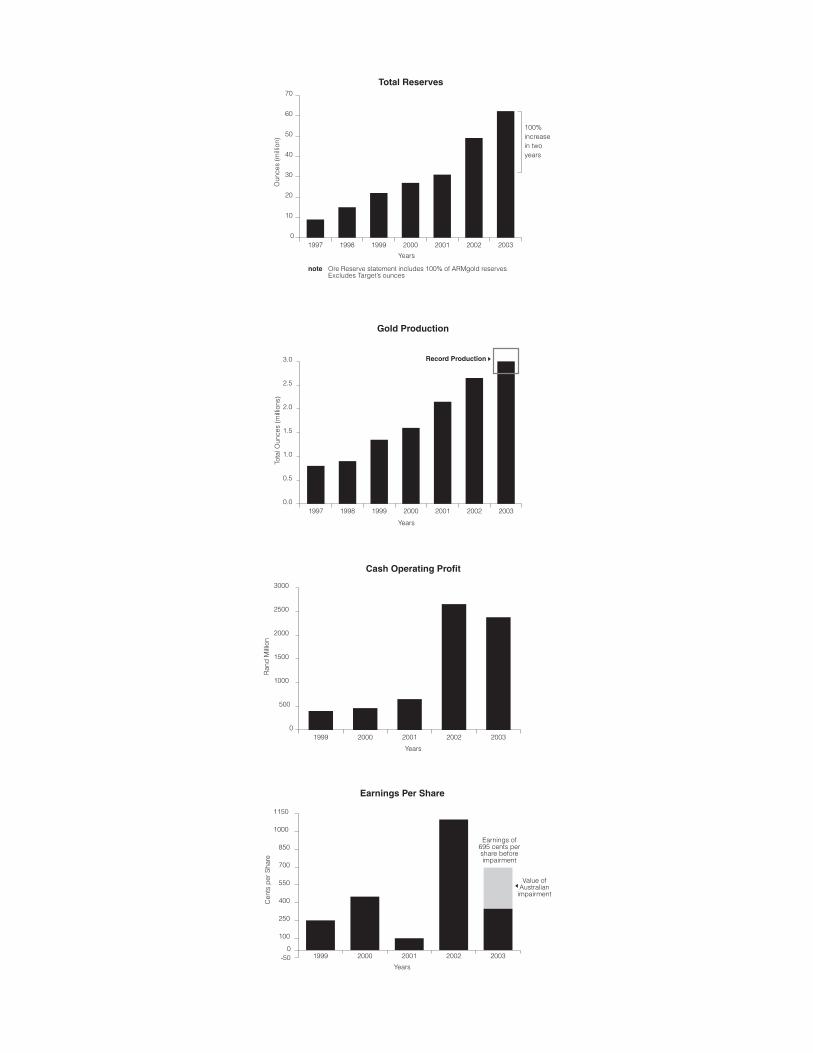
Total Reserves
Oun
ces
(mill
ion)
100%increasein twoyears
note Ore Reserve statement includes 100% of ARMgold reservesExcludes Target’s ounces
Years
1997 1998 1999 2000 2001 2002 20030.0
0.5
1.0
1.5
2.0
2.5
3.0 Record Production
Tota
l Oun
ces
(mill
ions
)
Years
Gold Production
1999 2000 2001 2002 20030
500
1000
1500
2000
2500
3000
Cash Operating Profit
Ran
d M
illio
n
Years
1999 2000 2001 2002 2003-50
100
250
400
550
700
850
1000
1150
Earnings Per Share
Cen
ts p
er S
hare
Value ofAustralian
impairment
0
Earnings of695 cents pershare beforeimpairment
Years

Harmony Annual Report 2003 004
ANNUALHIGHLIGHTS� BECOMING SOUTH AFRICA'S LARGEST GOLD
PRODUCER FOLLOWING THE MERGER BETWEENHARMONY AND ARMGOLD
� BECOMING THE FIFTH LARGEST GOLD PRODUCERIN THE WORLD IN 2004
� ACHIEVING AN INCREASE OF 12% IN PRODUCTIONFROM 2.7 MILLION OUNCES TO A RECORD3.0 MILLION OUNCES
� RETURNING RECORD CASH OPERATING PROFIT OFUS$260 MILLION
� OWNING THE WORLD’S LARGEST GOLD RESOURCEOF 410 MILLION OUNCES OF WHICH 62 MILLIONOUNCES ARE IN THE RESERVE CATEGORY
� ENSURING THAT HARMONY WILL BE MINING INSOUTH AFRICA WELL INTO THE FUTURE WITH THEAPPROVAL OF ORGANIC GROWTH PROJECTS
� MAKING SIGNIFICANT PROGRESS INCORPORATINGTHE FREE GOLD AND HILL 50 ASSETS
� ACQUIRING A 34.5% STRATEGIC STAKE IN AVMINAND AN EFFECTIVE 26.1% STAKE IN AVGOLD
� MAKING HARMONY ONE OF THE MOST TRADEDGOLD STOCKS GLOBALLY, INCREASING LIQUIDITYFROM 410% TO 448%
� HAVING MORE THAN 50% OF HARMONY'S STOCKTRADED ON THE NEW YORK STOCK EXCHANGE

SECTION 1
CHAIRMAN’SOVERVIEW

Harmony Annual Report 2003 006
SECTION 1
CHAIRMAN’SOVERVIEWThrough the merger with ARMgold we created South Africa’s largest gold producer. We believe that the mergedcompany will be a role model in the SouthAfrican environment where transformationhas become a significant factor.
Over the past year, the benefits of a strongUS Dollar gold price were largely negatedby the strengthening South African Randand rising costs.
Although our short-term focus is onincreasing profit margins and containingcosts, we continue to invest in the long-term sustainability of Harmony.
IN OTHER WORDS

During 2002/03 Harmony established itselfas a major gold producer, both in SouthAfrica and internationally. This wasachieved during a time when ouroperational environment was significantlyinfluenced by a host of internal andexternal factors.
The most important event in thehistory of the company, both in terms ofsignificance and size, was the mergerbetween Harmony and ARMgold. Not onlydid the merger create South Africa’slargest gold producer, it also created aglobally competitive company which isrecognised as a role model in the SouthAfrican mining industry. We believe thatHarmony is now representative of the newSouth Africa and from a legal perspectivecomplies with the equity requirements ofthe Broad-Based Socio-EconomicEmpowerment Bill. We are committed tothose initiatives which are aimed atmaking South Africa a competitive andattractive destination for mining relatedinvestors.
Merging the two companies was animportant strategic step in the growthplans of both Harmony and ARMgold. Weshared one of the industry’s best goldassets in Free Gold and from a cultural,operational and strategic perspective, thefit seemed natural.
As the fifth-largest gold producer inthe world, the company is nowinternationally more competitive and willcontinue to look for value-addingopportunities in the major gold-producingregions of the world.
The most significant external factor thisyear was the continued strength of the USDollar price of gold. The current goldmarket, which has been in a bull trendsince 2000 continued to rise, with anactual average gold price of US$329/ozrealised for the year, compared to theUS$287/oz in the previous financial year.The main drivers of the increase in goldprice have undeniably been the continuedweakness of the US Dollar, the globaleconomic downturn and the political
uncertainty associated with the variousconflict situations in the world.
The gold price was also supported bythe dramatic reduction in hedging by goldproducers. During the 2002 calendar year,producer hedging decreased byapproximately 600 tonnes and this trend isexpected to continue until the end of 2003.During 2002, non-hedgers’ share pricesincreased some 154%, whilst hedgedproducers’ share prices increased by only63%. Even at a gold price of US$252/oz in1999 we remained unhedged. As astrategy it proved to be correct and ourshareholders saw the company’s shareprice increase by 158% during 2002. Thistrend was, however, reversed in the first halfof 2003, when South African gold stocksshowed weakness on the back of astrengthening Rand. Harmony will continueto be an unhedged gold producer, with thebulk of its production coming from SouthAfrica.
The South African Rand depreciateddramatically in November 2001. Since early
250
270
290
310
330
350
370
390
Share Price Premium to NAV - Senior Producers
NA Senior Average
South African Average
Australians Average
-60%
-40%
-20%
0%
20%
40%
60%
80%
100%
Gold Price
May
01
Jun
01
Jul 0
1
Aug
01
Sep
01
Oct
01
Nov
01
Dec
01
Jan
02
Feb
02
Mar
02
Apr
02
May
02
Jun
02
Jul 0
2
Aug
02
Sep
02
Oct
02
Nov
02
Dec
02
Jan
03
Feb
03
Mar
03
Apr
03
May
03
Jun
03
source BMO Nesbitt Burns
Pre
miu
m
Gol
d pr
ice
(US
$/O
z)
graph 1
Major Gold Producers
Newmont
AngloGold
Barrick
Gold Fields
Harmony
Placer Dome
Kinross
Ashanti
0 1 2 3 4 5 6 7 8 9
source HSBC Senior Gold Book
Forecasted Annual Production Ounces (Millions)
graph 2
SECTION 1CHAIRMAN’S REVIEW
007

Harmony Annual Report 2003 008
2002 the Rand has reversed this trend andthe stronger Rand had a detrimental effecton the cash generating potential of thecompany.
The relatively higher cash operatingprofit margins which were achieved overthe past two years, resulted in SouthAfrican producers’ valuation, relative totheir Net Asset Value (NAV), increasingfrom a discount of approximately 26% toan average premium of 37%. NorthAmerican gold producers’ premium to NAVdecreased from a high of 60% to 44% overthe same period. Achieving such a re-rating, or reduction in the so-called SouthAfrican discount, during a period ofuncertainty with regards to the MiningCharter, bodes well for a South Africancompany like Harmony. see graph 1
The gold industry saw only marginalincreases in exploration expenditure and weexpect the need to find replacement ouncesto drive the continued consolidation of theindustry. Following our own as well as theproposed AngloGold/Ashanti merger, the goldproducers’ table is showing the second tier
gold producers more distinctly. see graph 2The consolidation of gold companies
into a few major producers could result infurther corporate activity. Harmony, as oneof the six major producers, is in a strongerposition than ever to fund our growthstrategies.
An increase in exploration expenditurewill result in future discoveries, however,we believe that the pipeline for major goldprojects has been all but depleted and it isunlikely that exploration expenditure willreturn to the levels achieved during the1990’s. see graph 3
Our company has built up significantexposure to some of the most exciting newprojects left in the world.
Gold producers have over the past twoyears been under increasing pressure toreport on the total costs of producing gold,compared to the emphasis on cash costsduring the time of lower US Dollar goldprices. The industry should now endeavourto deliver solid financial returns forshareholders, i.e. earnings, dividends andcapital growth on the shares, instead ofreporting on how they ensured survival
through low cash costs during the bearmarket.
The danger of exclusively focusing oncash costs, lies in the fact that producersare prone to overcapitalising orebodies andare tempted to high grade their reserves,instead of focusing on the optimalexploitation of their orebodies. This impactsadversely on both shareholder returns aswell as on the long-term viability of theirreserves. On average, during 2002, globalgold producers reported a 7% increase incash costs, from US$168/oz to US$177/oz.Included in the 7% increase is the effect ofthe strengthening of most currenciesagainst the Dollar. The South AfricanRand’s strength impacted adversely on theDollar cost of local producers.
On a total cost basis, the goldindustry’s costs increased from US$302/ozto US$335/oz in 2002. This illustrates thatthe industry requires a significantly highergold price than the US$329/oz achieved inorder to generate decent returns on newprojects. see graph 4
1996 1997 1998 1999 2000 2001 20020.0
0.5
1.0
1.5
2.0
2.5
3.0
3.5
4.0
4.5
200
220
240
260
280
300
320
340
360
380
400
Global Exploration Expenditure
US
Dol
lar
(Bill
ions
)
Global Exploration Expenditure
Gold Price (US$/Oz)
source BMO Nesbitt Burns
Years
Gol
d P
rice
(US
$/O
z)
graph 3
Rand/kg price
70000
75000
80000
85000
90000
95000
100000
105000
110000
115000
Rand/kg Gold price versus US Dollar Gold price/oz
250
270
290
310
330
350
370
390
Jul 02 Aug 02 Sep 02 Oct 02 Nov 02 Dec 02 Feb 03 Mar 03 Apr 03 May03 Jun 03
US$ gold price/oz source HSBC Senior Gold Book
Gol
d P
rice
(R/K
g)
Gol
d P
rice
(US
$/O
z)
graph 4
Despite the impact of the Mining Charter and theproposed Royalty Bill, weare comfortable with havingthe bulk of our operations in South Africa.

009
Presently the supply demand fundamentalsseem to be in a healthier position with worldproduction edging lower. In addition, thelarge-scale buy-back of hedging ounces byproducers has underpinned the currentstrength of the US Dollar price of gold. seetable 1
The South African mines probably havethe highest leveraged exposure to acombined depreciation of the South AfricanRand and a rising US Dollar gold price.However, increased production from SouthAfrican producers did not materialiseduring the past year and we don’t expectthis to happen in future. Our focus will beon increasing profitability in the short term,whilst making investments in the futuregrowth projects of the company.
Official Sector Sales continued atsteady levels. The Washington Accord,which limited central bank sales to 400tonnes per annum as from 1999, is due forrenewal by September 2004. We anticipatethat this agreement will be renewed for afurther period of five years, although thequantum of central bank sales could bedifferent. During periods of rising US Dollar
gold prices, bar hoarding and jewellerydemand decreases in line with the amountof disposable income available for thepurchasing of gold products. The past twoyears have seen lower levels of economicgrowth further impacting negatively onindividuals’ gold purchases.
Initiatives by the World Gold Council topresent investors with a gold productwhich will enable direct investment in goldbullion are currently under way. Theproduct is already listed on the AustralianStock Exchange, and similar products areplanned for the New York Stock Exchangeand JSE Securities Exchange. Harmonycurrently markets its physical goldinvestment products, manufactured indemarcations of 1/4 ounce, 1/2 ounce, one ounce and 10-tola bars to itsshareholder base and other investors.
The current economic, social andpolitical environment creates opportunitiesin which Harmony, as an unhedged goldcompany, will continue to delivershareholder value. The company isextremely excited about its future in anindustry which, from an investment
perspective, is healthier than ever before.Corporate Governance has been a
special focus area following the uncertaintycreated among investors by recentinternational corporate accountingscandals. The company has over the pastyear been exposed to changes in theregulations from the Securities andExchange Commission, the New York StockExchange and the JSE SecuritiesExchange in Johannesburg.
Our board is committed to the higheststandard of corporate governance, and ouractions support this. We recognise theimportance of an independent board, thatnot only focuses on maximisingshareholder value but, in doing so,recognises the needs and requirements ofall our stakeholders. Following the mergerof the two companies, the board nowconsists of competent non-executive andexecutive directors from both companies.
South Africa is in a phase oftransformation to a free-market economy ina sustainable democracy, serving all itspeople. These changes take time and arenot always well understood by the
Supply 2001 2002 2003*
Mine Supply 2 540 2 480 2 450
Official Sector Sales 677 560 530
Scrap Sales 720 845 880
Total Supply 3 937 3 885 3 860
Demand
Fabrication Jewellery 1 407 1 324 1 340
Investment Jewellery 1 875 1 475 1 600
Investment - Other 430 520 420
Net Producer Hedging 225 566 500
Implied Net Investment 211 361 370
Total Demand 4 148 4 246 4 230
Surplus Demand (211) (361) (370)
source Virtual Metals Research and Consulting *Annualised
GOLD SUPPLY AND DEMAND BALANCE (TONNES)
table 1

Harmony Annual Report 2003 010
investment community. We, as individualsand as a company, are committed to thefuture of our country and will activelyparticipate in this process of transformation,thereby ensuring a better future for all.
Although our safety statistics continueto compare favourably with the averages ofSouth African gold mining, I regret to informyou that a total of 26 employees andcontractors lost their lives at our operationsduring the year. I express my personal andthe company’s condolences with thefamilies, friends and colleagues affected.
Following the merger, I havesucceeded Adam Fleming as non-executive chairman. I want to thank himand the other retiring directors from bothboards for the contribution they made tothe success of the companies, especiallyduring a time when the challenges ofgrowth were real. Our best wishesaccompany all of them in their futurebusiness endeavours.
Patrice Motsepe
The industry focus will be on findingreplacement ounces. Our pipeline of organicgrowth projects willensure oursustainability andfuture growth.

SECTION 2
CHIEF EXECUTIVE’SOVERVIEW2.1 PAGES 13-14
OVERVIEW OF THE YEAR2.2 PAGE 15
THE WORLD IS NOTICING2.3 PAGES 16-20
ORGANIC GROWTH2.4 PAGES 21-22
OUR CHANGING ENVIRONMENT2.5 PAGES 23-26
STRATEGIC INVESTMENTS2.6 PAGES 27-36
OPERATIONAL REVIEW
CONTENT

Harmony Annual Report 2003 012
SECTION 2
CHIEF EXECUTIVE’SOVERVIEWOperationally, it was a tough year. The inclusion of a full year’s results fromFree Gold resulted in a steady overall performance.
We embarked on significant organicgrowth projects. We have formulated avery clear battle plan which includes theimplementation of continuous operations at some of our mines.
IN OTHER WORDS

The highlightof the year was theconclusion of an agreementto merge ARMgold andHarmony.
SECTION 2CHIEF EXECUTIVE’S OVERVIEW
013
The past financial year was a watershedyear in Harmony’s history. Although nolarge acquisition was concluded in thefinancial reporting period, significantprogress was made when we incorporatedFree Gold and the Hill 50 assets. Post year-end, we concluded the merger withARMgold.
We have generated solid cashoperating profits (a record US$260 million)and invested these funds well in futuremining opportunities in South Africa,Russia, Australia and Papua New Guinea(PNG). In South Africa we approved arange of organic growth projects which willensure that Harmony will be mining inSouth Africa well into the future. We willbecome the largest producer of gold fromSouth Africa in 2003/04, producing some30% of the country’s gold. This is anexcellent achievement considering the factthat some eight years ago the companywas producing 580 000 marginal ouncesper annum or 3% from a single mine in theFree State province of South Africa.
As a responsible company operatingin South Africa, we have madeconsiderable progress in dealing with thecountry’s changing socio-politicalenvironment. The investments made in our
people and their communities and theparticipation of Black EconomicEmpowerment companies in past dealsconcluded, have positioned us well forfuture growth.
Probably the highlight of the year wasthe conclusion of an agreement to mergeARMgold and Harmony. Although thetransaction had been successfullyconcluded by the end of September 2003,the economic benefits will only be evidentin the last three quarters of the 2003/04financial year. This transaction positionsHarmony as the fifth-largest gold producerin the world, with the added benefit ofhaving the bulk of its production comingfrom South Africa. Together the companieshad acquired strategic stakes in bothAvmin and Avgold, before the conclusionof the merger agreement. The benefitsfrom these two investments will becomeevident as we participate in the next phaseof unlocking value in the South Africanmining industry.
Our management team has grown thecompany over the past eight years, from amarginal, lease-bound operation in theFree State to an international goldcompany which can claim to havedelivered value to all our stakeholders.
During this time we have relied on ouremployees to convert mature, loss-makingor marginal operations into profitable long-life mines. By remaining unhedged wenever tampered with shareholders’exposure to the volatility of the SouthAfrican Rand and the US Dollar price ofgold. This is a recipe which has served ourshareholders well and we will be looking totake advantage of further opportunities inthis respect.
Mainly due to the inclusion of a fullyear of production from our Free Gold JointVenture we achieved an increase of 12% inproduction, increasing from 2.7 millionounces to a record 3.0 million ounces. Thisalso was a period in which no additionalsignificant acquisitions were made andduring which continuous improvementssustained operational performance.
Continued economic and politicaluncertainty over the past year, as well as aweakening US Dollar, have seen a steadyrecovery in the US Dollar price of gold.
On average we realised a price ofUS$329/oz for the financial year, a 15%improvement over the US$287/oz reportedpreviously. The rising Dollar gold price isgreat news as it reflects interest frominvestors and speculators in gold as an
2.1 OVERVIEW OF THE YEARRecord cash operating profitfrom record production

3.03.54.04.55.05.56.06.57.07.58.08.59.09.5
10.010.511.011.512.012.5
3.03.54.04.55.05.56.06.57.07.58.08.59.09.510.010.511.011.512.012.5
Rand/US Dollar Exchange Rate1 January 1993 to September 2003
1993 1994 1995 1996 1997 1998 1999 2000 2001 2002 2003
source I-Net Bridge; Deutsche Securities
Ran
d /
US
Dol
lar
exch
ang
e ra
te
Rand weakness allowed for stronggrowth in cash operating profits
Rand strength impacted oncash generating potential
Years
Harmony Annual Report 2003 014
graph 1
Year on Year Comparison
Production - kg 93 054 82 971 10 083 12
Production - oz 2 991 734 2 667 572 324 162 12
Revenue - R/kg 96 663 94 080 2 583 3
Revenue - US$/oz 329 287 42 15
Working costs - R/kg 71 146 62 848 (8 298) (13)
Working costs - US$/oz 242 192 (50) (26)
Cash operating
profit - R/m 2 374 2 591 (217) (8)
Cash operating
profit - US$/m 260 254 6 2
Earnings per share before
impairment (SA cents) 695 1 330 (635) (48)
Earnings per share after
impairment (SA cents) 359 1 094 (735) (67)
Average exchange
rate -R/US$ R9.13 R10.20 (R1.07) (10)
%VARIANCE
30 JUNE 2003
30 JUNE2002
ACTUAL VARIANCE
Our Five Year Scorecard
Gold produced - Kg 93 054 82 971 66 563 50 572 39 997
Gold produced - oz 2 991 734 2 667 572 2 140 043 1 625 925 1 285 931
Underground
recovery grade g/t 5.33 5.37 4.88 5.08 5.27
Cash operating profit
SA Rand - R’m 2 374 2 591 673 461 386
US$ - million 260 254 88 73 64
Cash operating cost
R/kg 71 146 62 848 57 416 50 121 46 759
Cash operating cost
R/tonne 234 227 224 213 240
Cash operating cost
US$/oz 242 192 234 246 240
JUN ‘03 JUN ‘02 JUN ‘01 JUN ‘00 JUN ‘99
table 1
table 2
alternative investment, hedging themselvesagainst the current uncertainty in worldmarkets. The price was also supported bythe current Dollar weakness, which hasalways been good for the gold price, andproducer de-hedging, which made someproducers net-consumers of gold. De-hedging is probably not sustainablebeyond the next few quarters. Thereafterthe main drivers of the price may be theUS Dollar and declining world production.
For Harmony the benefits from theincrease in the US Dollar gold price havebeen eroded by the strengthening of thevolatile South African Rand. During the2002 calender year it strengthened bysome 30% and was the strongest currencyin the world when measured against theDollar. see graph 1
The strong Rand adversely impactedon our working costs in US Dollar/ounceterms, which increased by 26% year onyear. However, our ability to control workingcosts is evident in Rand/tonne terms withcosts increasing by only 4% over theperiod. Although the Rand hasstrengthened to levels of R7.51 to theDollar by year-end, it is our expectationthat it will tend to depreciate towards theend of the new financial year.
Year on Year Comparisonsee table 1Whilst revenues increased by only 3% inR/kg terms, inflationary cost pressures andthe full incorporation of the higher costacquisitions of St Helena in South Africaand Hill 50 in Australia, eroded our margins.In Dollar terms we continued to generaterecord cash operating profits of US$260million compared to US$254 million for theprevious year. Higher interest paid andhigher amortisation charges resulted in lowerearnings before impairment at US$136million, compared to US$199 million for theprevious reporting period.
One of the main costs (±50%)associated with mining in South Africa islabour. During July 2003 we reached anagreement with our unions for a period of twoyears. For the first year a wage increase of10% was agreed to and for the second yearthe increase will be 2% above inflation (CPIX)with a guaranteed minimum of 7%.
The agreement also allows for a verynecessary re-grading of some of theemployee categories - e.g. operators whichcould result in additional cost increases. Theagreement has also removed some of thelast historically discriminatory practices withregards to leave and provision for retirement
benefits. The issue of housing foremployees, as provided for in the MiningCharter, was also captured in a bi-lateralagreement. The non-wage issues will add anadditional 2% to the wage bill of Harmony.
Our Five-Year Scorecard see table 2Harmony has over the past five yearscreated value through a strategy ofacquiring and subsequently turning aroundhigher-cost, lower-margin operations. Thebulk of these 23 acquisitions were madeduring a declining Dollar gold priceenvironment.
Despite these adverse conditions, ourshareholders have been rewarded with theappreciation of their investment, both interms of capital growth and cash dividends.
The difference made through theimplementation of the “Harmony Way” is asignificant and sustainable reduction in theworking cost structures of the acquiredmines. This typically results in an immediateincrease in profit margin and operatingprofits. Our challenge remains to keepworking cost increases lower than that of ourpeer group and below the South Africaninflation rate, thereby sustaining ourcompetitive advantage.

Shareholder Distribution by Country
36%
45%
8%
4%7%
36% South Africa and unknown
45% North America
8% United Kingdom
4% Switzerland
7% Rest of Europe
Year on year the liquidity of our stockincreased from 410% to 448%, making itone of the most traded gold stocks globally.The average issued share capital of thecompany increased from 153.5 millionshares to 178.0 million shares over thesame period.
The company’s presence in NorthAmerica continues to grow with more than51% of our stock trading on the New YorkStock Exchange.
Only 39% of the company’s stocktrades on the JSE Securities Exchange inSouth Africa, whilst the remainder is tradedon various exchanges in Europe. Moredetailed information on the company’sliquidity is available in the Investor Relationssection on page 150 of this report.
Inclusion in MSCI Emerging Markets IndexOn 30 May 2003, the MSCI announced thefirst annual review of its indices. TheEmerging Market Index includes 160companies from 27 countries.
Only 17 companies from South Africaare included, of which Harmony comprises0.4% of the index. We have been included in the fund on the basis of ourmarket capitalisation and in recognition ofour offshore liquidity, both of which make the stock attractive to tracker fundinvestors.
Harmony makes the top ten againand again and againHarmony was rated in 7th position in theFinancial Mail’s Top Companies Awards2003. We were the only company in SouthAfrica to be ranked amongst the Top TenCompanies over a one-year, five-year andten-year period in the annual Sunday TimesTop Companies ranking.
During the year we received theBusiness Map Foundation EmpowermentAward and our Investor Relations teamreceived the Investment Analyst Society’stop award in the mining and resourcescategory.
015
Through theacquisition of34.5% of Avminand 11.5% ofAvgold, wehave increasedyour exposureto leveragedSA goldproduction.
2.2 THE WORLD IS NOTICINGThe world’s most liquid gold stock
chart 1

Harmony Annual Report 2003 016
Being anunhedgedproducer, wecannot influencethe price wereceive for ourgold. Thereforeour ability tomanage workingcost remains ourcompetitiveadvantage.
2.3 ORGANIC GROWTH
A range of capital projects was approvedand embarked upon during the year.Organic growth opportunities also existwithin our current operations which do notrequire any capital expenditure. Some ofthem are:� exploiting the potential of our greatest
asset, our employees. Harmony hasconsistently achieved productivity andefficiency improvements over the pastfew years. The process of empoweringour people has further potential toimpact positively on our performance.Through continued productivityimprovements, we can afford to givereal wage increases to our workforceand achieve a reduction in the unitcost of labour in real terms. In thisannual report we give you a feel forsome of the exciting transformationalissues we are dealing with through theeyes of ten of our employees.
We are doing pioneering work interms of communication with ourpeople. The objective of internal
communication within Harmony is tokeep all employees informed of thecompany’s direction, createunderstanding about where we’reheading strategically and show whereeach employee fits into the bigpicture. By providing information andcreating understanding, internalcommunication functions as a vehicleto improve motivation levels andultimately productivity. Everyemployee should understand how andwhere he could make a difference.
We segment our internal market ofemployees and develop appropriatemessages and media channels toappeal to each segment’s motivationaltriggers. We use a variety of differentchannels to reach different audiencesegments effectively.
The Harmony Way Manual (a cartoonhandbook which captures the essenceof the Harmony Way), which wassuccessfully targeted at our South
African supervisors and technicalmanagement last year, was followed upwith a route map of Harmony’s historyand the strategic direction goingforward. This route map is a cartoonvisual, which is debated and discussedin small groups throughout the technicalmanagement and supervisory levels.
Woza Nazo, our full-time communicationgroup drawn from within our workforce,has continued its successful trajectory.Research conducted among theworkforce has shown that 72% agreethat Woza Nazo helps them betterunderstand Harmony and provideinformation that helps them to do abetter job.
The internal roadshow whereby I meetwith all shaft and plant teams everyquarter has become, and will continueto be, a vital ingredient of thecommunication mix.

017
Looking ahead, we will take theconcept of internal marketing furtherthan ever before by appointing clientsegment champions. Each internalsegment (i.e. business managementlevel; technical management level;supervisory level and workforce) willhave a dedicated member or membersof the executive who will beresponsible for “marketing” thecompany to it – i.e. understanding theissues of that segment and integratingand making sense of companyinitiatives specific to that segment. An essential component of creating anenabling environment where all ourteams can perform at world-classlevels, is to develop a world-classservice culture – one which can servicethe teams at the face. This is what wecall “Service the Harmony Way”. Inorder to facilitate this we haveanalysed, simplified and reconstructedall pivotal service delivery mechanisms.We have separated service from controlfunctions and worked at creating aservice attitude and culture which iscloser to a retail model of serviceexcellence than the military style whichhas prevailed in the mining industry forthe past hundred years.
� “sweating our assets” includes allactivities related to optimising ourcurrent operations. ContinuousOperations (CONOPS) could see theproductivity of the capital assets onsome of the operations increasesignificantly. With CONOPS weincrease the number of productionshifts by as much as 25%. We hope toextend the agreements we reachedwith the unions at the Free Gold andARMgold shafts on CONOPS to ourother operations. Implementedcorrectly, CONOPS could result in anincrease in volume, a marginalreduction in cost, significant jobcreation and higher profits.
� remaining “cost obsessed”: throughinitiatives like the “Cost Marathon”, wewere able to restrict our costincreases, measured in R/kg terms, toonly 13% compared to the previousfinancial year. This occurred despitethe impact of a high inflationenvironment and the adverse effect ofacquiring and incorporating high-cost,low-margin operations in South Africaand Australia. Cost focus and costefficiency have always been ourstrengths. When measured inRand/tonne terms, working costs
increased by a mere 3% from R227per tonne to R234 per tonne.
� extending the application of theHarmony Value Creation Model, thebusiness model on which oursuccessful acquisition strategy hasbeen built, provides us withalternatives once the assets are fullyvalued. The investment environment inthe past year has allowed us toproceed with a range of organicgrowth projects which will add valueto our assets for years to come. see diagram 1
Whilst other producers in the industry facethe challenge of finding adequatereserves to replace the ounces mined, wehave, through a range of investments,ensured that we have sufficient high-quality replacement ounces, therebysecuring our long-term future.
Let us reflect on how successful ouracquisition and turnaround strategy hasbeen. see table 3
The progress on Free Gold onlyincludes the 50% attributable as at 30 June2003. Following the completion of themerger at the end of September 2003, itwas 100% owned by Harmony. Weanticipate complete payback of our
diagram 1
St Helena
Free Gold
Elandskraal
Masimong
Randfontein
Evander
Orkney
Free State
ValueCreationthroughmarginincreases
Win-windealmaking
Time in quarters
1 4 9
Restructurefor optimalreturn phase
Full valuephase –continuedimprovements
Restruct-uringphase
High impactinitial trans-formationphase
Harmony Value Creation Curve
InitialValue
PurchasePrice
Full value alternativesExpansionFurther operationalimprovementsOwn as an annuitySell and re-invest

Harmony Annual Report 2003 018
Return on Investments as at June 2003
Evander - June '98 R 415 R 1 274 10 quarters
Randfontein - Jan '00 R 750 R 1 735 8 quarters
Elandskraal - Apr '01 R 988 R 662 Building a
new mine
Free Gold (50%) - Dec '01 R 1 350 R 1 157 +/-8 quarters
PROJECT/OPERATION ACQUISITIONCOST (R'm)
CASH OPERATINGPROFIT TO DATE
(R'm)
PAYBACKACHIEVED
Our Assets
Harmony Evander Masimong Tshepong Morobe/Wafi
North
Joel Kalgold Elandskraal Phakisa Poplar
Rest of Free Gold Randfontein Tshepong Doornkop Rolspruit
St Helena Highland Bambanani Target Kalplats
Gold (31%) * (26%) *
Australian Operations Bendigo
(32%) *
Orkney Shafts 9.8% of
Aurion
(onsold)
* As with all our strategic investments our continued involvement with these projects will dependon our assessment of whether we can add additional value to such an investment
MARGINALOUNCES
QUALITYOUNCES
LONG LIFEQUALITYOUNCES
PROJECTGROWTHOUNCES
POTENTIALPROJECTS
table 4
table 3
investment in Free Gold by December2003, making it one of the most successfulacquisitions to date.
The progress of the company fromsurvival in 1995/96, the subsequentgrowth through acquisitions and currentfocus on long-life, quality, low-costproduction ounces in 2002/03 hasresulted in a spectacular portfolio ofassets. see table 4
Capital ProjectsDuring the past few quarters we approvedthe organic growth projects atRandfontein (Doornkop South ReefProject) and Free Gold (Tshepong NorthDecline Project and the development ofPhakisa Shaft). Questions have been putto us as to whether our growth strategy,which has so successfully built thecompany to the fifth largest in the worldtoday, has changed? Have we stoppedacquiring assets and are we now focusingon building mines?
The answer is that our strategy hasnever been an either/or approach. Webelieve that there will be furtherturnaround opportunities for acquisition inSouth Africa, which will deliver similarvalue upliftment to what we haveexperienced in the past. We do, however,
also own most of the next generation ofmines to be built in South Africa. We havethe skills and balance sheet to buildmines and we believe in the future of goldas a product and South Africa as aninvestment destination.
Included in the acquisition ofRandfontein in January 2000, Elandskraalin April 2001 and Free Gold in December2001, was a number of highly prospectiveprojects at zero cost. On acquisition ofthese assets our focus was to achieve anoperational turnaround as quickly aspossible. During the low gold pricescenario and with high working costs atthe time of acquisition, the project areas,although financially evaluated, providedinsufficient returns on the requiredinvestment.
After successfully restructuring theacquired operations for profitability andunder a current higher gold pricescenario, the projects were revisited.When compared to other availableacquisition opportunities or other growthprojects in the company, the approvedprojects delivered greater returns to allstakeholders and in each case a decisionwas taken to proceed.
The capital projects currently underway in Harmony are all brownfield projects.
This results in relatively low capitalrequirements which have been structuredtax-efficiently as part of the existingoperations. The geological and technicalrisks are also well understood.
All the projects depicted are discussedin detail under the relevant operations inthe operational overview section. seegraph 3
Ten years into the future Harmony willbe the owner and operator of many of thelarger mining projects still around in SouthAfrica. We do not anticipate relinquishing,in the near future, the position of beingSouth Africa’s largest gold producer, whichwe will became during the first half of the2004 financial year.
We foresee underground recoverygrade to increase incrementally from 5.33 g/t for the 2002/03 financial year to inexcess of 6.0 g/t by 2009 under a givenset of gold price and currencyassumptions. Whilst there will be moreacquisition opportunities in South Africa,especially if the Rand remains strong, thelong-term future of Harmony in South Africahas been secured through thedevelopment of these long-life, qualityproduction ounces.
Harmony Project Production Profile
18001600140012001000800600400200
0
2003
2004
2005
2006
2007
2008
2009
2010
2011
2012
2013
2014
2015
2016
2017
2018
2019
2020
2021
2022
Tshepong North Decline (-66 level)
Doornkop South Reef
Nyala
Masimong Expansion
Elandsrand
Phakisa Shaft
Recovery grade will incrementally increase from 5.3 g/t to above 6.0 g/t by 2009
Oun
ces
(mill
ions
)
Years
graph 3

019
Merging ARMgold and Harmony tocreate South Africa’s largest goldproducerOn 2 May 2003, the two companiesannounced details of a proposal to createa world-class unhedged gold producer,with the bulk of its production from SouthAfrica.
The merger creates the fifth largestgold producer in the world, producingapproximately 4.0 million ounces perannum. The transaction was effected bythe issue of two Harmony shares for everythree ARMgold shares held.Approximately 63.67 million Harmonyshares were issued after year-end, whichincreased the company’s outstandingshares to 257.8 million.
Post-merger, the aggregate number ofHarmony shares issued to ARMgoldrepresented 26% of the enlarged issuedshare capital of the merged company.African Rainbow Minerals and Exploration
Investments (Pty) Ltd (ARMI), representedby Patrice Motsepe, Harmony’s new non-executive chairman, became our largestshareholder, holding approximately 14% ofthe company at the time.
We are excited and look forward toincorporating the assets into the newHarmony. This transaction has as its focusnot only BEE compliance or short-termoperational synergies, but also creates along-term value proposition to ourshareholders.
Operational synergies at thecombined Free State operations, will addsome R10.0 million per month to thebottom line. see map 1
In addition, the growth projects atFree Gold, i.e. Tshepong North Declineand Phakisa Shaft, will optimise our futurecash-generating ability.
Our risk profile has diminishedsignificantly as the company now hasoperating mines in all the major gold-
producing regions in South Africa. Thishas the added benefit that we are wellpositioned to increase our production fromfurther acquisitions, as we have anestablished foothold in these gold-producing regions. see chart 2
Acquiring a 34.5% stake in AvminOn 2 May 2003, Harmony and ARMgoldannounced details of our 50/50 jointacquisition of a 34.5% stake in AnglovaalMining Limited (Avmin). Based on R43.50per share, the transaction was valued atR1 687 million and was paid for in cash.
Avmin, which has a marketcapitalisation of approximately R4.9 billion(at a share price of R43.50), holds sharesin and manages the following companies:� Gold - Avgold Limited - 42.7%� Manganese and Iron Ore - Assmang
Limited - 50.3% and Assore - 9.3%� Nickel - Nkomati Mine - 75.0%� Platinum - Two Rivers Project - 55%
map 1
New Harmony
Avgold (Harmony 26,1%)
President Steyn
Gold Fields
Various Mineral rights
The Free State Goldfields
South Africa
Target North
Unisel
Oryx
Beatrix
Joel
Harmony
Bambanani
St. Helena
Brand ShaftsPresident SteynMasimong
Welkom Operations
Matjhabeng
Tshepong
President Steyn
Jeanette
Target

Forecast Gold Production2003/2004
18%
30%
10%
12%
10%
9%
2%
9%
18% Free State
30% Free Gold
10% Evander
12% Randfontein
10% Elandskraal
9% Offshore
2% Kalgold
9% Orkney
Harmony Annual Report 2003 020
chart 2
table 5
Gold price per kg R93 000 R95 000 (2)
Total resources including project ounces (Moz) 410.2 295.9 39
Reserve base (Moz) 61.9 49.1 26
%VARIANCE
ORE RESERVESAS AT:
30 JUNE2003
30 JUNE2002
The rationale for the acquisition wasthat the merged Harmony would own aneffective strategic investment of 14.6% inAvgold which operates the new Target goldmine. Target holds 3.9 million ounces ofreserves and an extensive unexploited goldresource totalling some 75 million ounces inthe Northern Free State.
The acquisition of the stake in Avmingave us exposure to this resource andallowed us to participate in unlocking valuein both Avmin and Avgold.
On 15 July 2003, we announced thatwe had acquired an 11.5% stake in Avgold(at R7.91 per share) from Anglo South AfricaCapital (Pty) Ltd, thereby raising oureffective exposure to 26.1%. The companyissued 6 960 964 new ordinary shares,comprising 3.8% of the issued share capitalof Harmony, as consideration.
Target is different to typical labour-intensive mining companies in South Africaas it makes use of a high degree ofmechanisation in the exploitation of the
massive orebody. At full production, themine will produce approximately 350 000ounces of gold per annum at a cash cost ofbelow US$180 per ounce. The Target minehas a life of approximately 18 years.
Immediately adjacent to Target, Avgoldhas been busy with an extensive explorationprogramme on an area known as TargetNorth. This project is in pre-feasibility stageand current estimates show indicatedresources of 24.5 million ounces and anadditional inferred resource of 35.1 millionounces. The area has one of the world’slargest unmined deposits. It contains aseries of gold-enriched depositional fans atan average depth of 2 500m below surfaceand roughly 2 - 3km apart.
Harmony ore reserves increase by 26%Despite using a marginally lower gold priceof R93 000/kg, the company has seengrowth of 26% in its ore reserves followingthe merger. Total resources have increasedby 39% to 410.2 million ounces. For a year
on year comparison of reserves andresources see table 5.
The main difference is the inclusion ofthe other 50% of the Free Gold reserves andthe remainder of ARMgold’s reserves.Excluding ARMgold, our reserves haveincreased by 1 million ounces or 2%,indicating that we more than replaced the 3 million ounces mined in the past year. Thisis despite using a lower gold price in R/kgterms for this declaration. Although thecompany’s resource base in Australiaremains at 11 million ounces, reserves havedecreased from 2.34 million ounces to 1.5 million ounces, necessitating a write-down in the carry value of the assets byA$155 million to A$623 million.
The merged Harmony now owns thelargest gold resource base in the world,allowing it flexibility and even more leverageor optionality to the US Dollar gold price.
Includes 100% of ARMgold and Free Gold

021
The long awaited and much debated MiningCharter for the South African industry wasreleased on 9 October 2002. We believethat whilst the Charter prescribes some verydemanding conditions, the company is wellpositioned to meet them well ahead of thetargeted date in five years’ time.
The Charter has the following broadobjectives:� to expand opportunities for Historically
Disadvantaged South Africans (HDSAs)to enter the mining and mineralsindustry or benefit from the exploitationof the country’s mineral resources;
� to ensure that the relevant skills whichare required for entry into the miningsector by HDSAs, are transferred; and
� to ensure progress in employmentequity in the mining industry.
In addition, the Charter includes thefollowing specific objectives which will bemeasured using a scorecard system:� about 15% or R100 billion
(US$10 billion) worth of assets will beowned by Black companies within fiveyears, with an additional 11% beingachieved in the following five years;
� industry has undertaken to assist HDSAsin securing finance to fund participation,i.e. an amount of R100 billion within thefirst five years only;
� a baseline of 40% in respect ofemployment equity in junior and seniormanagement levels of the industry;
� companies undertake to offer everyemployee the opportunity to become
functionally literate and numerate by2005;
� stakeholders undertake to give HDSAspreferred supplier status;
� mining companies agree to identify theircurrent levels of beneficiation andindicate to what extent they intend togrow the baseline.
The measuring of success of ownershipwould be determined by:� attributable units of South African
production controlled by HDSA’s;� an allowance to be built in to allow for
credit offsets to allow for flexibility;� previous empowerment deals to be
included in calculating credits; and� government are considering special
incentives to encourage HDSA’s toretain newly acquired equity for areasonable period.
Companies undertake to report on anannual basis their progress towardsachieving their commitments through theirannual reports, to be verified by externalauditors.
We have dealt with our progress onsome of these issues in the SustainabilityReport, page 53-62.
Finalising the Charter through aprocess of negotiations which includedrepresentatives from the mining industry,government and the unions, has removedmost of the uncertainty which followed theleaking of a draft document in July 2002.
Harmony has demonstrated that the
ownership requirements of the Charter areachievable through our involvement in foursuccessful empowerment deals. In allinstances, the deals did not result in adilution of value to shareholders, but ratherfacilitated our continued growth during thattime.
Our most recent deal was theDoornkop South Reef Project atRandfontein. Effective 15 August 2003,Africa Vanguard Resources (AVR), a BlackEconomic Empowerment company,acquired 26% of the project for R250 million. In terms of the saleagreement, AVR acquired 26% of theDoornkop mineral rights, and paymentamounted to R140 million in cash andR110 million in call options on 290 000ounces of gold. (The 290 000 ounces ofgold being equal to 16% of gold producedat Doornkop during the first 10 years).
The project will be managed as a jointventure in which Randfontein will fund allthe project capital. The proceeds from theproject will be shared in a proportion of84% to Randfontein and 16% to AfricaVanguard Resources.
We are, in consultation with theNational Department of Minerals andEnergy, currently in the process of devel-oping a sophisticated approach to settingtargets and measure performance in BEEand transformation initiatives withinHarmony. We refer to this initiative as the“Harmony Transformation Scorecard” andwe shall describe the methodology in moredetail in the 2004 Annual Report.
2.4 OUR CHANGING ENVIRONMENTThe release of the Broad Based Socio-Economic Empowerment Charter for theSouth African Mining Industry
We have completedfour successfulempowermenttransactions to date. We believe that we are compliant with the equity ownershipcomponent of theMining Charter.

Harmony Annual Report 2003 022
In essence, it will provide clarity on the“measures” of empowerment and transfor-mation contained in the Mining Charter,but, at the same time, will enable Harmonyto set targets, plan initiatives and measureprogress on an integrated strategy fortransformation within the company over thenext ten years.
The “Harmony TransformationScorecard” will seek to address all transfor-mation initiatives (including initiatives suchas job creation and HIV/AIDS programsthat are not necessarily included in theCharter), and will seek to evaluateprogress on the three fundamental objec-tives underlying transformation:� developing people - skills develop-
ment, training and job opportunities;� stimulating economic participation –
job creation, equity ownership, jointventures, procurement opportunities,beneficiation opportunities; and
� positively impacting society and peo-ple’s welfare – living standards, ruraland community development, housing,migrant labour, environmental sustain-ability, health (including HIV), safety.
These three transformation objectivesare consistent with leading internationalthinking on development, and will applyboth to the way we address the “internal”or operational facets of the business (e.g.developing and empowering employees)and the manner in which we positively ben-efit our “external” environment (e.g. adja-cent communities).
The “Harmony Transformation
Scorecard” will enable key headline meas-ures of progress to be reported to share-holders and other stakeholders, while moredetailed internal targets and measures willbe used by management to ensure con-stant progress in transformation. It willensure consistency and compliance withthe scoring approach to be used byGovernment in assessing mineral rights’conversions in terms of the new Mineraland Petroleum Resources DevelopmentAct.
For example, we report progress onthe second key objective of transformation,namely “Stimulating EconomicParticipation”, on the basis of “equivalentempowered gold ounces of production”.Table 6 provides an illustrative calculationfor Harmony’s four past BEE transactions,indicating that transformation has alreadybeen achieved for 24% of production, thisbeing well in excess of the Charter’srequirement of 15% within five years. (Notethat table 6 excludes the positive impact ofprocurement, beneficiation, job creationand other related initiatives.)
It is in the understanding of the interde-pendence of these activities that we canidentify cost-effective opportunities toensure compliance. The successful trans-formation of the South African society andour mining industry will have significantlypositive benefits for Harmony.
In short, broader economic participa-tion will assist in normalising our society,increasing the country’s economic baseand, over time, reducing the country’s riskrating. Developing our people is already
paying spectacular dividends in higher pro-ductivity and the availability of adequateskills to sustain our growth.
Mineral and Petroleum Royalty BillOn 20 March 2003, the South AfricanGovernment released the draft Mineral andPetroleum Royalty Bill.
The Royalty Bill proposes to impose aquarterly royalty charge of 3% on revenue.The Bill’s underlying principle is that thecountry is entitled to a consideration/royaltyfor the extraction of its non-renewablemineral resources.
We are of the opinion that any royaltyimposed at revenue level will impactconsiderably on our financial results and thecost of mining in South Africa. By increasingour cost structure millions of tonnes of orewill be sterilised.
The Bill was submitted for publiccomment until 30 April 2003, whereafter itwas referred back to parliament. We madea submission to the treasury departmentand currently await government’s revisedposition.
The uncertainty caused by these andother regulatory changes highlights theneed for us to proactively engagegovernment on all legal, fiscal andenvironmental issues.
Harmony’s progress on Transformation: Empowered ounces ofproduction
Sale of 10% of Elandskraal to 36 000 10% of 360 000oz produced by
Khuma Bathong Elandskraal in 2003
Simane purchase of equity in 194 000 6.4% (original holding of Simane)
Harmony of Harmony’s total ounces of
production for 2003 )
Sale of 26% of mineral rights at 85 000 26% (AVR’s share) multiplied by
Doornkop to AVR the 330 000oz Doornkop is
expected to produce at full
production
Harmony/ARMgold merger 560 000 14% (shares in the merged
Harmony entity which will be held
by ARM Investments)
Total “equivalent empowered 875 000 Note that “equivalent empowered
gold ounces of production” ounces” reflects historical
transactions and not only current
BEE holdings
Total ounces of South African 3 600 000 Total South African production of
gold production of the merged Harmony for 2004
Harmony
Equivalent BEE Ounces as a % 24%
EQUIVALENTEMPOWERED
GOLD OUNCES OFPRODUCTION
CALCULATION NOTESBEE TRANSACTION
table 6

023
Abelle Limited – Exploration success On 26 February 2003 we made an offer tosubscribe for new shares as well as apublic offer for the ordinary shares andoptions in Abelle. The offer closed on 26 March 2003. We now own 87% of theshares and 68% of the listed options inAbelle. The total consideration payablewas A$151 million or US$98 million. On 30 June 2003, at a share price of A$1.10 pershare, our investment was valued at US$127million.
Through this and other investments overthe past few years, we have establishedaccess and exposure to world-classdeposits. Our bid values Morobe and Wafi,which are two of the largest undevelopedgold deposits in the world, at US$8.00 perresource ounce.
Identified Mineral Resources (IMR)estimates of the Morobe Project total 73.9million tonnes at 2.2 g/t gold and 30 g/t silverfor a combined 5.2 million ounces of goldand 71 million ounces of silver. The project isnow 100% owned by Abelle.
The Morobe ore is free milling and cashoperating costs were estimated at US$175per ounce. A feasibility study completed byLycopodium of Australia in October 2002,envisaged a single open pit mine containing2.8 million ounces of gold and 48 millionounces of silver.
Morobe is capable of producing 300 000 ounces of gold and 4.5 millionounces of silver per annum from a 5 milliontonne per annum processing plant for aperiod of approximately eight years.
A new feasibility study, which envisagesmining lower tonnage at higher grades withsubstantially reduced capital and operationalcosts, is currently being undertaken and willbe presented to the Abelle board byDecember 2003.
Abelle also owns the Wafi Projectsituated 60 km from Morobe. The project is inan advanced exploration stage, with a furtherphase of 5 000m of diamond drilling underway. Wafi consists of two large orebodies,approximately 1 km apart. One is asubstantial porphyry copper-gold deposit(“Golpu”) with a total identified IMR estimate
of 100 million tonnes at 1.3% copper and0.6 g/t gold. A pre-feasibility on the Golpuporphyry copper-gold project (inferredresources 2.3 million ounces gold; 1.27million tonnes copper) has commenced.
The other is a potentially world-classgold discovery which is known as the LinkZone orebody. The drilling programme atWafi which commenced in February 2003 isfocused on infill drilling (from 100m by 50mgrid down to 50m grid) and on extendingthe higher grade Link Zone orebody. For thefirst phase of the drilling programme 12holes have been planned of which fourholes have been completed.
The holes from which assay resultshave been received include the followingintersections:
Borehole No.WR177 159m @ 6.53 g/t from 275mWR178 71m @ 8.42 g/t from 316m
17m @ 5.25 g/t from 410m15m @ 9.34g/t from 454m
WR179 174m @ 4.03 g/t from 192m
Messrs Grobicki, Abbott and myselfhave been nominated to the board withmyself taking over the chairmanship.
The acquisition of Abelle Limited is inline with our strategy of creating asignificant gold business in Australasia. Inaddition to our current producing assets,we now have significant interests in threehigh-quality, prospective growth projects inBendigo, Morobe and Wafi.
Bendigo – decision timeThe 32% stake which Harmony acquiredon 14 December 2001, at a cost of A$50 million, was valued at A$55 million on30 June 2003.
The major activities during the 2002/03evaluation programme included thedevelopment of a production size declineto access several orebodies that hadpreviously been defined by drilling, and tomine and process approximately 60 000tonnes of ore. The objective was toestablish orebody shapes, grades andmining methods to determine metallurgical
processing parameters.In a briefing by the company earlier in
the year, it was indicated that the SwanDecline had reached a depth of 770mbelow surface, and had accessed the firstfour reefs in the 12.3 million ounce potentialresource. A further five reefs were evaluatedby August 2003. The current on-reefdevelopment and bulk sampling programmeis designed to convert the previouslyidentified Inferred Resources into Reserves.
Bendigo’s management is refining aconceptual plan which indicates a three-stage build-up to full production over four tofive years. Subject to the successfulestablishment of reserves during the bulksampling and evaluation programme, theplan envisages the following stages: � Stage 1 – 300 000 tonnes per annum to
produce approximately 100 000 ouncesper annum. Capital of A$50 to A$60million is estimated to be required tostart up the mine plan;
� Stage 2 – after a two to three-yearperiod, production is anticipated toincrease to 250 000 ounces for twoyears;
� Stage 3 – production increasing to over400 000 ounces per annum.
The biggest uncertainty remaining iswhether the planned tonnages could beachieved and then scaled up withoutsignificantly reducing the recovery grades.
The development, drilling andevaluation programme to access the 17previously identified orebodies in theSheepshead and Deborah reefs progressedwell during the June 2003 quarter.
The study to determine costs toconstruct the mine, mill and associatedinfrastructure is well advanced.
The combination of sampling andmining studies have to date provided aresource of 130 000 ounces and have atarget to prove in excess of 200 000ounces of reserves by the December 2003quarter. It is envisaged that the Bendigoboard will soon consider its options withregard to the construction of a mine.
2.5 STRATEGIC INVESTMENTS

Harmony Annual Report 2003 024
High River Gold –exposure to RussiaWe own approximately 17% of High RiverGold (TSA:HRG), a Toronto-basedcompany with gold interests in Russia,Canada and West Africa.
The total purchase considerationamounted to R141 million (US$14.5million) which represented a 16% discounton the weighted average share price forthe 30-day trading period prior to theexecution of the agreement. Following asignificant rise in the High River shareprice, our investment was valued atapproximately US$22 million on 30 June2003.
The principle assets of High RiverGold are:� a 56% equity interest in OJSC
Buryatzoloto, the fifth-largest goldproducer in Russia, with twooperating mines producingapproximately 150 000 ounces peryear;
� a 100% interest in the BerezitovoyeProject which is a deposit amenableto low-cost open-pit mining;
� a 50% interest and joint operatorshipof the New Britannia gold minesituated in Manitoba Canada,producing approximately 110 000ounces per year; and
� an 80% interest in the Taparko goldproject in Burkino Faso which has agold resource of approximately 1 million ounces.
Highland Gold Limited –production ounces from RussiaOn 18 December 2002, Highland GoldLimited successfully listed on AIM(“Alternative Investment Market of LondonStock Exchange plc”).
Highland Gold is the owner ofMnogovershinoe (“MNV”), Russia’s fourth-largest producing gold mine in 2001, aswell as two development projects –Darasun and Novoshirokinskoye – whichtogether comprise four gold deposits.
In 2002 MNV had proven andprobable reserves of 2.3 million ounces.
Measured, indicated and inferredresources total 3.0 million ounces of gold.Of the above 31.7% is for our account.
Highland Gold believes that theabundance of natural resources and therecent positive developments in theRussian gold industry will provide anopportunity for the company to establish aportfolio of Russian gold projects.
The acquisition of a 32.5% stake atUS$18.9m in Highland Gold on 31 May 2002 and a subsequentinvestment of US$7.5 million, allowed for apromising entry point for Harmony into there-emerging Russian gold sector. Our totalinvestment of US$26.6 million was valuedat approximately US$128 million on 30 June 2003.
For the 2002 calendar year, HighlandGold produced 178 000 ounces at cashand total costs of US$145/oz andUS$179/oz respectively. For the next sixmonths ending June 2003, the companyproduced 90 133 ounces at cash andtotal costs of US$174/oz and US$221/ozrespectively.
Unless we can increase our exposureat asset, company or board level to that ofsignificant influence or control, in both thecases of High River Gold and HighlandGold Limited, we may be required by theSouth African exchange control rules todispose of this stake during the comingyear.
Kalplats – our platinum discovery Work on our platinum discovery continuedwith some R45 million so far being spenton exploration, the excavation of theKalplats box-cut, bulk sample collectionand pilot plant flotation tests. The box-cutinvolved excavating 1.5 million tonnes ofwaste rock. A 500 tonne ore sample wascollected at a depth of approximately 45mbelow surface with sampling of the variousreefs under different weathering conditionsas the pit advanced.
Using a US$450/oz basket for PGM’sand R8.00 to the US Dollar, and using atwo-stage mill with float concentrator, weanticipate the following results:
Tonnes milled 150 000 tonnesCapex R260 millionPlant costs R45/tonneRecovery 75%Recovered value R215/tonne
Recoveries of 73% – 75% andconcentrate grade above 100 g/t PGMwere achieved with a two-stage floatconcentrator. Laboratory scale testwork atMintek on the recovered core samplescontinues. Based on the outcome of thesetests we will take a decision on the miningof the orebody and whether any furtheractivities will be undertaken to enhance ourunderstanding and valuation of the fivedemarcated orebodies.
Expenditure is focused on thecompletion of the drilling programme toupdate ore resource calculations andorebody models on the Crater and Orionorebodies. Work on preliminary minedesigns and on pit optimisation continues.It is anticipated that the work will becompleted by the end of September 2003.Phase 2, which will culminate in thecompletion of a full feasibility study, isexpected to be completed six monthsthereafter.
Making good money out of a strategic investmentThe company’s acquisition during February2000 of a 21% stake in Goldfields Limitedof Australia at a cost of R165 million, is agood example of making excellent returnsfrom strategic investments. South Africanexchange rate constraints at the timeresulted in the cost and funding ofacquiring 100% of Goldfields Limited ofAustralia being beyond Harmony’s reach.The additional R60 million investment byHarmony, and subsequent merger ofGoldfields with Delta and its acquisition byPlacer Dome, saw the value of our initialR225 million investment increase toR855 million. During the year the companyannounced that it had disposed of thisasset, realising approximately US$85million.

When I think of where we came from andwhere we’re heading to, the change hasbeen remarkable.”
“

Is the lid important on an automatic kettle? It can’t make the kettleboil – the element will. But take the lid off and the kettle will boil out.Engineering is the lid – it’s a service. I was involved in redesigningthe bridge of change – to create ownership. Now I’m running theengineering side of the changes.
Providing quality service means separating service and control.But the old mining culture of control means it’s difficult to make thatchange. People have to understand that the ultimate client on themine is the team at the face. But that doesn’t mean your role is notas important.
Gold mining is all about people. Attitude plays a bigger role thanskill and knowledge itself. I’ve seen people who I thought wouldnever change. Then they tasted it. And now there’s no stopping them.Change touches the comfort zones – but change brings opportunities.
Some ask when it will stop. They still see change as an event. It’snot. It’s like the baton in a relay: the race doesn’t stop when you handit over. If we take a step back people see it as failure. It’s not. It’s aprocess – and sometimes it’s necessary to realign, put systems inplace – and move forward.
When I think of where we came from and where we’re heading to,the change has been remarkable. We’re doing all the right things,but still not doing all things right. My day would be empty if therewasn’t a challenge. I’d like to stay part of the change.
NameJohan HennopTime at Harmony25 yearsWorks atFree StateStarted asElectricalApprenticePosition todayEngineer,Coordinator ETHW(Engineering TheHarmony Way)
TEN PEOPLE. ONE STORTEN PEOPLE. ONE STORYY..

027
SafetyOn behalf of the board, we would like toextend our sincere condolences to thefamilies, friends and colleagues of the 26employees who lost their lives at ouroperations during the past year.
The lost time injury frequency rate(LTIFR) showed a regression of 3.5% and thefatal injury frequency rate (FIFR) per millionman-hours worked improved by 19%. Ourtarget for LTIFR for the financial year ending30 June 2003 was 20 and for FIFR a rate ofzero. We continue to aim for these targets inthe coming year. see table 1
Total Injury / Accident
Frequent Rate (TIAFR) - 54.72 59.29 7.71
Lost Time Injury
Frequency Rate* (LTIFR) 20.00 24.61 23.78 (3.49)
Shifts Lost Frequency
Rate* (SLFR) 340 421.33 430 2.09
Fall of Ground Incident
Frequency Rate* (FOGIFR) 6.00 7.79 8.86 12.08
Fatality Injury Frequency
Rate* (FIFR) 0.00 0.30 0.37 18.92
* Measured in per million man-hours worked
%CHANGE
OBJECTIVE 2002 /2003
2001 /2002
INDICATOR
Operations June 2003 June 2002 Variance
Free State 364 478 (114)
Evander 272 468 (196)
Randfontein 525 615 (90)
Elandskraal 186 415 (229)
Kalgold 74 49 25
Australian Operations 284 79 205
Sub-total 1 705 2 104 (399)
Free Gold (50%) 669 487 182
Total 2 374 2 591 (217)
TOTAL CASH OPERATING PROFIT (R’MILLION)
table 1
The main areas of incident severityremain fall of ground (50%) and trucks andtramways (15%). Since safetytransformation has been introduced therehas been an improvement in fall of groundsafety awareness. Increased training andcommunication have also improved theidentification and assessment of risk. Webelieve that our rates compare favourablywith the rest of the underground miningindustry.
We produced 22% of South Africa’sgold and incurred 14.5% of the fatalaccidents in the gold mining industry.
For the year 2003/04 our emphasis willremain on safe production. Safety is afocus during the planning phase and at sitemeetings. There is self-regulation throughthe Harmony Risk Management System,regular audits of compliance and constantcommunication. We are convinced that thisteam effort will enhance safety at all ouroperations.� Kalgold achieved 750 000 fatality free
shifts on 19 July 2002
� Evander 8 Shaft achieved 500 000fatality free shifts on 9 October 2002
� Merriespruit 1 achieved 750 000fatality-free shifts on 6 January 2003
� Masimong mine achieved 500 000fatality-free shifts on 5 June 2003
� Mt Magnet Gold Mill, Admin andGeology departments achieved over1 100 days LTI free during the quarter
� Merriespruit 3 Shaft ended the Junequarter on 1.3 million fatality-freeshifts. This mine has been fatality-freefor five years
� Brand 3 achieved 500 000 fatality-freeshifts on 28 June 2003
� St Helena and Evander 8 Shaft bothachieved a million fatality-free shiftsstatus subsequent to year-end
� Free Gold had a fatality-free quarterfor the first time in its history
OperationsA year on year analysis of the cashoperating profit for the various operationsfollows. see table 2
Safety. Better, but not yet good enough.
2.6 OPERATIONAL REVIEW
table 2

Harmony Annual Report 2003 028
Excellentorganic growthopportunities.
Free Gold In line with similar previous acquisitions,these operations were restructured andaligned to the best practices in bothARMgold and Harmony. This involvesmining the orebody to its optimum grade,thereby eliminating high grading whilstfocusing on recapitalising the orebody toallow for more mining flexibility in future.
Underground tonnage was higher at 2 348 000 tonnes. At a 10% lower recoverygrade of 7.07 g/t compared to the 7.82g/tfor the previous reporting period,attributable gold production was up 115%to 16 587 kg. This year’s results includetwelve months whereas the previous year’sresults included only six months.
Underground working costs whenmeasured in R/kg increased by 16% andfrom R50 867/kg to R58 809/kg and inR/tonne terms by only 5% fromR398/tonne to R416/tonne.
Tonnes milled (000's) tonnes 2 348 988 138
Recovery grade g/t 7.07 7.82 (10)
Gold produced Kg 16 587 7 731 115
Oz 533 282 248 556 115
Working cost R/t 416 398 (5)
R/Kg 58 809 50 867 (16)
Capital Expenditure
(000's) ZAR 125 434 19 500 (543)
UNDERGROUND 2003 2002* VARIANCE %
* Results for six months only
Tonnes milled (000's) tonnes 2 333 1 198 95
Recovery grade g/t 0.59 0.79 (25)
Gold produced Kg 1 382 950 45
Oz 44 432 30 545 45
Working cost R/t 37 32 (16)
R/Kg 63 117 40 382 (56)
Capital Expenditure
(000's) ZAR 6 668 12 223 45
SURFACE 2003 2002* VARIANCE %
* Results for six months only
Capital expenditure of R82.5 millionwas incurred as part of therecapitalisation phase to increase theoperational flexibility at these operations.Capital expenditure, including new projectcapital, totalled R132.1 million.
Tonnages from surface were similar involume but at a lower recovery grade. Atotal of 2 333 000 tonnes at a recoverygrade of 0.59 g/t were treated, resulting ina gold recovery of 1 382kg.
The Free Gold operations will remainan important contributor to our company’sbottom line. The re-establishment offlexibility and the implementation ofcontinuous operations (CONOPS), willassist in achieving payback quicker thanany of our other spectacular acquisitions.
Whilst Joel continues to deliverimproved operational performance,encouraging development results arebeing achieved in the North Shaft area.
This bodes well for the shaft’s futureproduction programme as an increase inore reserves could result in either anextension of mining operations orincreased production in the medium term.
St Helena, whose assets wereacquired from Gold Fields Limited on29 October 2002, is marginal and has notyet contributed to the Free GoldOperations. Although profitable by June2003, a higher gold price is required tofully exploit the potential of this orereserve.
The Free Gold operations are nowwell balanced in terms of operationalefficiency and optimisation of theorebody. The successes achieved at FreeGold by first lowering the working coststructure and then by mining to theoptimum grade of the orebody, havepositioned these operations for furtherproduction growth. A number of projectshave been announced and are currentlyunder way.

029
Phakisa Shaft Project
Project DescriptionPhakisa Shaft, a surface shaft, was sunk toaccess the ore reserve to a depth of 2 421m below surface. It is estimated thatthe area will yield 18 million tonnes,recovering 136 tonnes of gold over aproject life of 20 years. Project completionrequires sinking (178m), equipping andcommissioning of the shaft with accessdevelopment and stoping to maximumproduction build-up at a capital cost ofR550 million. The project will, at fullproduction in 2010, achieve rates of 280000 ounces per annum. Based on a long-term gold price of R93 000/kg and a realdiscount rate of 8%, the project returns aNPV of R900 million and an IRR of 32%.
General GeologyThe ore is mined from the higher gradeBasal Reef.
Reserves/Resourcessee table 3
Project StatusSite establishment has taken place andtender documents have been issued forshaft sinking and related activities.
Nyala Shaft Project
Project DescriptionThe project, which involves the extractionof a shaft pillar and mining of previouslyabandoned areas, recently commenced ata capital cost of R67.4 million.It is planned to mine the shaft pillarconcurrently with the remaining reserveblocks. Mill tonnage is placed at51 600 tonnes at a recovered grade ofapproximately 5.0g/t per month. A total of15 950kg (513 000 ounces) will berecovered over a seven-year period.
General GeologyThe economically viable reefs are theBasal, Leader and A Reefs.
Project StatusThe project commenced in March 2003and we expect production tonnage toreport to the plant during the September2003 quarter. Approximately 1 570 jobs willbe created.
Reserves 18.6 7.68 142.7 4.6
Resources 72.4 9.83 712.2 22.9
RESOURCES TONNES GRADE GOLD OUNCES(mil) (g/t) (tonnes) (million)
Phakisa Shaft Project Reserves/Resources
Reserves 6.5 9.00 58.5 1.9
Resources 8.3 11.20 93.4 3.0
Tshepong North Decline Project Reserves
RESOURCES TONNES GRADE GOLD OUNCES(mil) (g/t) (tonnes) (million)
table 3
table 4
Tshepong North Decline Project
Project DescriptionThe Sub 66 Level Decline Project extendsbelow the lowest current working level ofTshepong North Shaft. The Project willconvert the high-grade resource toreserves and increase production fromTshepong North Shaft.
General Geology The planned Sub 66 Level Decline willaccess the UF1 and UF2 reefs.
Reserves/Resourcesee table 4
Project StatusThe project, which was approved duringthe December 2002 quarter, involves thesinking of a decline at a cost of R280 million. The area will be mined at arate of 49 000 tonnes per month and, at agrade of 8.77 g/t per tonne, will add 167 000 ounces per annum to the FreeGold production profile. The project isexpected to reach full production by July2007.
Opportunities� Extension of the known payshoot� Low risk geology structure� Potential for expansion� Earlier gold from Phakisa Shaft
resource

Harmony Annual Report 2003 030
ElandskraalThe Elandskraal operations experienced adifficult year due to a lack of miningflexibility and problems associated with theinfrastructure at the old Elandsrand mine.The development and construction ofinfrastructure for the new mine receivedpriority and progressed well. The newfinancial year will see tonnage from the newhigher grade mine starting to report to theplant.
Underground tonnage was 15% lowerat 1 874 000 compared to 2 194 000 tonnesreported previously. As indicated before,flexibility at the old Elandsrand mine willremain tight until more stopes becomeavailable in the new mine, accessing thehigher grade payshoot.
Underground recovery grades were 8%lower at 5.76 g/t, whilst gold produced was22% lower at 10 802 kg compared to the 13 770 kg for the previous financial year.
The lower tonnage, recovery grade andinflationary cost pressures impactedadversely on working costs in both R/kgand R/tonne terms. When measured in R/kgterms, working costs increased by 24%from R65 507/kg to R81 095/kg. Whenmeasured in R/tonne terms, working costsincreased by 14% from R411 per tonne toR467 per tonne.
Elandskraal incurred R136.8 million incapital expenditure of which R106.1 millionwas spent on the New Mine Project which ison track and within budget.
The principal reason for theunderperformance at Elandskraal can beattributed to problems experienced with theorepass system at Elandsrand. The oldshaft orepass system comprises two reeforepasses and one waste orepass from 73to 98 levels. These orepasses werepreviously never lined but, as a result of thedepth, they have scaled considerably withtime.
The reef orepasses started to hang upregularly in mid-2000 due to scaling andthis was temporarily rectified. SinceOctober 2002 more serious delays startedto manifest themselves and a decision wastaken to rehabilitate one of the orepasses.For the duration of the process only onereef orepass was available. Therehabilitation of the orepass was completedduring August 2003. During this periodElandsrand experienced severe dilution ofgrade as waste tonnages were unavoidablymixed with reef tonnages. Although the oldElandsrand mine suffers from a lack offlexibility it can continue to produceprofitably at 6 g/t until the new mine kicks inover the next three years.
Deelkraal, which has been sufferingfrom the lack of face availability during thelatter half of the year, has holed two raisesin the March quarter, and has two moreplanned for the September 2003 quarter.The increased flexibility will improvetonnages and grade from this operation.
Tonnes milled (000's) tonnes 1 874 2 194 (15)
Recovery grade g/t 5.76 6.28 (8)
Gold produced Kg 10 802 13 770 (22)
Oz 347 291 442 714 (22)
Working cost R/t 467 411 (14)
R/Kg 81 095 65 507 (24)
Capital Expenditure
(000's) ZAR 135 376 128 076 (6)
UNDERGROUND 2003 2002 VARIANCE %
Tonnes milled (000's) tonnes 1 115 1 085 3
Recovery grade g/t 0.54 0.96 (44)
Gold produced Kg 601 1 037 (42)
Oz 19 323 33 340 (42)
Working cost R/t 37 45 17
R/Kg 68 631 46 669 (47)
Capital Expenditure
(000's) ZAR 1 473 715 (106)
SURFACE 2003 2002 VARIANCE %
Reserves 24.4 8.44 205.8 6.6
Resources 43.8 8.82 386.5 12.4
RESOURCES TONNES GRADE GOLD OUNCES(mil) (g/t) (tonnes) (million)
Elandsrand New Mine Project Reserves/Resources
Elandsrand newmine project startsto deliver gold.
Elandsrand New Mine Project
Project DescriptionThe project, initiated by AngloGold in1991, was intended to increase the life ofmine by exploiting the southern portion ofthe lease area between 3 000m and 3600m below surface. This was to beachieved by deepening the sub-verticaland ventilation shafts. Developing to reefis under way on 102., 105, 109 and 113levels to access the higher gradepayshoot which was mined on theshallower levels of the old mine.
General GeologyThe deepening consists of the down dipextension of the VCR ore body below 98level. The VCR is a robust quartz-richpebble conglomerate.
Reserves/Resources see table 5
Project Status� 102 level on reef in May 2002. 102-34
reef raise holed and the first stope wasavailable for mining in June 2003
� 105 level on reef by December 2003� 109 level on reef by June 2005� 113 level on reef by June 2007� First production month from the project
will be on the 102-34 line in September2003
� Life of mine of 17 years
table 5

Tonnes milled (000's) tonnes 2 866 3 270 (12)
Recovery grade g/t 4.94 5.06 (2)
Gold produced Kg 14 150 16 534 (14)
Oz 454 932 531 578 (14)
Working cost R/t 306 292 (5)
R/Kg 62 065 57 721 (8)
Capital Expenditure
(000's) ZAR 17 047 6 655 (156)
UNDERGROUND 2003 2002 VARIANCE %
Tonnes milled (000's) tonnes 2 007 1 529 31
Recovery grade g/t 0.57 0.61 (7)
Gold produced Kg 1 150 935 23
Oz 36 973 30 060 23
Working cost R/t 36 40 10
R/Kg 63 476 65 103 3
Capital Expenditure
(000's) ZAR 15 478 7 646 (102)
SURFACE 2003 2002 VARIANCE %
031
Randfontein OperationsUnderground tonnage milled decreased by12% from 3 270 000 tonnes to 2 866 000tonnes. At a lower recovery grade of 4.94 g/tcompared to the 5.06 g/t reportedpreviously, underground gold recoverydecreased by 14% to 14 150 kg or 454 932ounces.
Excellent cost control assisted incontaining unit working cost increases toonly 5%, from R292 per tonne to R306 pertonne. When measured in R/kg terms,underground working costs increased by 8%from R57 721/kg to R62 065/kg, mainly dueto the lower recovery grades.
Expenditure on the recently announcedDoornkop South Reef Project started withcommitments to date totalling R32.4 millionof which an amount of R13.2 million wasspent by June 2003.
Doornkop South Reef Project gets go ahead.
Doornkop South Reef Project
Project DescriptionThe project, at a capital cost of R1 270million (July 2002 base), was announced on22 January 2003 and allows for significantgrowth in production at Randfontein.Currently the Kimberley Reef is mined on theupper levels of the Doornkop Shaft. TheSouth Reef on the lower levels is the targetof the proposed shaft-deepening project.
The project is essentially a shaftcompletion project with simultaneousdevelopment towards the identified miningareas. It is estimated that 117 tonnes or 3.75million ounces of gold will be recovered fromthe resource at a recovery grade of 6.37 g/t.
The deepening of the main shaft will becompleted by mid-2005 with thedevelopment programme finishing in 2007.The production build-up from the South Reefwill take place from the beginning of 2006and will peak by 2012 at 135 000 tonnes permonth. The main shaft is currently at a depthof 1 340m below surface and the sub-vertical ventilation shaft at a final depth of 1 949m below surface. To access the SouthReef resource the main shaft will bedeepened to 217 level or a depth of 2 034mand the spillage incline shaft extended from222 level to 227 level or a depth of 2 082mbelow surface.
The project has a life of 18 years and
gold production of 280kg (9 000 ounces) inyear one, building up to 1 306kg (42 000ounces) in year four. After year four, goldproduction will build up rapidly to 10 264 kg(330 000 ounces) where it will remain up toyear 14 when gold production will startdeclining to the end of the project. Theproject will create a total of 2 798employment opportunities.
General GeologyThe South Reef lies between 1 650m and 2 000m below surface and at 900m belowthe Kimberley Reef, dipping at 5 to 10degrees to the southeast. It is a very thinseam, typically 1 to 10 cm thick.
Reserves/Resources see table 6
Project StatusThe project team’s focus to date hasincluded contractor mobilisation, projectplanning, detailed engineering and theexecution of preliminary work.
Work is also taking place in the mainshaft. The surface kibble winder has beenre-commissioned and the new slipe, line andequipping stage will be delivered early inJuly 2003. The sinking kibble winder hasbeen delivered and the hoist chamber is inthe process of being prepared.
Drilling of the main shaft will commencein February 2004 and according to theprogramme, the shaft will be commissionedto 222 level (2 032m below collar) by mid-2005.
OpportunitiesThe mining plan is being reviewed toestablish the optimum development strategyon the levels, once developmentrecommences in October 2003. The originalplan will be modified to incorporate thepossibility of exploiting the reef above 192level and the areas closest to the shaft on197 and 202 levels.
Reserves 2.3 6.68 15.2 0.5
Resources 38.7 6.64 257.2 8.3
RESOURCES TONNES GRADE GOLD OUNCES(mil) (g/t) (tonnes) (million)
Doornkop South Reef Project Reserves/Resources
table 6

Harmony Annual Report 2003 032
establishing costs at 8 Shaft impacted onworking costs in both R/kg and R/tonneterms. When measured in R/kg terms,working costs increased by 27% from R56 085/kg to R71 062/kg and in R/tonneterms from R340/tonne to R405/tonne.
The operational performance ofEvander 8 Shaft continues to improve.Underground tonnage is returning back tolevels of 55 000 tonnes per month whilst thegrade is showing similar improvement torecovery grades of 6.0 g/t. With Evander 8Shaft performing at these levels, the overallproduction results from Evander returned topre-seismic event levels of production andrecovery grade during the June 2003quarter.
Capital expenditure at Evander isexpected to remain at approximately R90 million per annum. The bulk of thecapital is for extending the declines at No. 7and 8 Shafts.
Evander OperationsA seismic event which registered 4.1 on theRichter scale took place on 12 July 2002 atEvander No. 8 Shaft and adverselyimpacted on the performance of theseoperations over the past year. Cashoperating profits decreased by 42% fromR468 million to R272 million. The maincontributing factor was a 8% decrease inunderground tonnage, down from 2 107 000 tonnes to 1 945 000 tonnes forthe period under review. The fact that 8Shaft is the highest grade operation atEvander, resulted in overall gold recoverygrade and production being significantlyaffected. Although the shaft was back inoperation four weeks after the event, the re-establishment of higher grade mining areastook longer than anticipated.
The impact of lower tonnages andrecovery grade as well as the re-
Tonnes milled (000's) tonnes 182 245 (26)
Recovery grade g/t 0.7 0.67 4
Gold produced Kg 128 164 (22)
Oz 4 115 5 273 (22)
Working cost R/t 46 30 (53)
R/Kg 65 107 45 330 (43)
Capital Expenditure
(000's) ZAR 10 786 7 255 (49)
SURFACE 2003 2002 VARIANCE %
Tonnes milled (000's) tonnes 1 945 2 107 (8)
Recovery grade g/t 5.69 6.05 (6)
Gold produced Kg 11 075 12 756 (13)
Oz 356 069 410 113 (13)
Working cost R/t 405 340 (19)
R/Kg 71 062 56 085 (27)
Capital Expenditure
(000's) ZAR 87 888 90 622 3
UNDERGROUND 2003 2002 VARIANCE %
Back on track following the seismicevent in July 2002.
Evander - further growth project
Two well-known projects, Poplar andRolspruit, were included in the acquisition ofEvander in 1998 at zero cost.The Poplar Project is a brownfields areawhich contains 10.8 million ounces of gold.A feasibility study which evaluates theexploration of this prospective orebody,through a twin shaft system from surface to adepth of 1 200m below surface, has beencompleted.
The resource from the Rolspruit Projectwhich is contiguous to Evander 8 Shaft issituated between 1 535m to 2 515m belowsurface. Various options are currently beingevaluated to exploit this geological resourceof 17.4 million ounces of gold.
The Poplar and Rolspruit Projects, whichcould grow and extend the life of theseoperations by some 15 years, need highergold prices to proceed. Should the goldprice reach levels of above R100 000/kg, theviability of the two projects will be revisited.

033
Free State OperationsThe Free State Operations reported a 24%decrease in cash operating profits fromR478 million to R364 million. The lower goldprice towards the end of the financial yearresulted in a higher cut-off which restrictedvolumes. Underground tonnage milleddecreased from 4 305 000 tonnes to 4 281 000 tonnes. The decreased tonnageat a lower recovery grade of 4.26 g/tcompared to the 4.32 g/t reportedpreviously resulted in a net 2% decrease inoverall gold recovered, down from 18 620kgs to 18 255 kgs.
Good cost control assisted inunderground unit costs increasing by 10%from R311/t to R341/t and in R/kg termsincreasing by 11% to R79 894/kg. This isthe section of the company which has themost gearing to the gold price. It comprisesoperational teams who also understandwhat it takes to mine profitably atunderground recovery grades of just above4.2 g/t.
The Masimong Expansion Project in theFree State performed well during the yearand continues to build up production.
Most leveraged to the gold price.
Masimong Expansion Project
Project DescriptionMasimong Mine is located approximately280km south-west of Johannesburg, and10km from Virginia. The complex comprisesthree shafts: Masimong 4 and 5 Shafts andSaaiplaas.
The Masimong Expansion Project wasprimarily a development project with themajor emphasis at No. 5 Shaft. From thedevelopment would follow a gradualproduction build-up from 27 800m2/month(130 000t @ 4.92g/t) to production levels of44 000m2 (191 000t @ 5.17g/t), yielding inexcess of 900kg of gold per month by2005. This project has a life in excess of 15years.
General GeologyThe reefs mined at Masimong are the BasalReef, B Reef and A Reef. The Basal Reef ismined at all three shafts whilst the A Reef ismined at Masimong 4 Shaft and the B Reefis mined at Masimong 5 Shaft.
Grade within these reefs are highlyvariable, whilst channel width is alsovariable and ranges from a few centimetresto approximately 1.8m.
Reserves/Resources see table 7
Project StatusDuring the 2003 financial year an averageof 850m of capital development wascompleted per month. This has creatednew raise lines for production build-up.Production in 2003 increased fromapproximately 22 000m2 (90 000 tonnesproducing 421kg) to 25 800m2 per month(124 000 tonnes producing 621kg). Furtherorganic growth will be achieved on theback of the capital development completedduring 2003 as well as the additional capitaldevelopment planned for 2004.
OpportunitiesOther mining opportunities at Masimonginclude:� The area above 1 650 level at
Masimong 5 Shaft, which would requirean incline shaft to be developed abovethe existing top mining level in order toaccess the high-grade Basal Reefpayshoot towards the northern part ofthe mine;
� The B Reef at Saaiplaas Shaft;� The North-West block at Saaiplaas
Shaft which will be equipped anddeveloped and should extend the life ofthe shaft by approximately five years.
Tonnes milled (000's) tonnes 4 281 4 305 (1)
Recovery grade g/t 4.26 4.32 (1)
Gold produced Kg 18 255 18 620 (2)
Oz 586 909 598 644 (2)
Working cost R/t 341 311 (10)
R/Kg 79 894 71 933 (11)
Capital Expenditure
(000's) ZAR 86 691 69 706 (24)
UNDERGROUND 2003 2002 VARIANCE %
Tonnes milled (000's) tonnes 1 056 231 (357)
Recovery grade g/t 0.71 1.79 (10)
Gold produced Kg 753 414 82
Oz 24 209 13 310 82
Working cost R/t 57 27 (111)
R/Kg 79 420 14 834 (435)
Capital Expenditure
(000's) ZAR 39 841 37 178 (7)
SURFACE 2003 2002 VARIANCE %
Reserves 16.2 4.87 78.7 2.5
Resources 426.4 3.55 14.6 48.6
RESOURCES TONNES GRADE GOLD OUNCES(mil) (g/t) (tonnes) (million)
Masimong Expansion Project Reserves
table 7

Harmony Annual Report 2003 034
KalgoldKalgold had a good year, reporting cashoperating profits of R74 million. Totaltonnage milled of 1 084 000 tonnes at arecovery grade of 2.14 g/t resulted in goldrecovery of 2 320 kg.
Working costs decreased by 3% to
Tonnes milled (000's) tonnes 1 084 961 13
Recovery grade g/t 2.14 2.01 6
Gold produced Kg 2 320 1 934 20
Oz 74 590 62 179 20
Working cost R/t 139 135 (3)
R/Kg 65 142 66 945 3
Capital Expenditure
(000's) ZAR 38 941 752 (5 078)
OPENCAST 2003 2002 VARIANCE %
R65 142/kg leaving Kalgold with a healthycash operating profit margin of 32%. Theincrease in capital expenditure was due tothe installation of an additional mill.
The project to increase the millingcapacity at Kalgold by 50 000 tonnes permonth to 130 000 tonnes, was completed
Third mill will allow for production growth.
with the installation of a third mill. Lowergrade tonnage, available from a 1.1 milliontonne stockpile, will be treated resulting inan increased gold recovery. The plannedaverage overall feed grade to the plant is,however, expected to decrease from 2.5 g/tto 2.2 g/t.

035
Australian OperationsThe Australian Operations increased goldproduction by over 100% as a result of theinclusion of the results of Hill 50. Averagerecovered grades and average workingcosts per tonne increased as theproportion of underground ore beingtreated increased.
The mining of gold which isunprofitable on a total cost basis, hasbeen phased out. One of the
consequences of this decision was thecessation of production from the westernleases at Big Bell and the closure of theBig Bell mill.
Production from our AustralianOperations is planned to decrease to alevel of 340 000 ounces per annum. Thehedge book for the remainder of 2003 hasbeen closed out, thereby exposing theoperations to the spot gold price. Allmining that could not cover total costs atthe spot price has been stopped. We will
Tonnes milled (000's) tonnes 7 148 4 782 49
Recovery grade g/t 2.22 1.65 35
Gold produced Kg 15 852 7 869 101
Oz 509 654 252 993 101
Working cost R/t 171 127 (35)
R/Kg 77 151 77 159 -
Capital Expenditure
(000's) ZAR 242 118 233 000 (4)
TOTAL OPERATIONS 2003 2002 VARIANCE %
continue to restructure the remaininghedge book, bringing the operations inline with the company’s philosophy ofbeing unhedged. Production from Australiais dependent on the management teams’ability to discover sufficient qualityresources to replace tonnage currentlymined.
Capital expenditure increased fromR69.4 million to R242.1 million for the2002/03 financial year.
Restructured for profitability.
The stronger Rand impactedadversely on all South Africanproducers’ profit margins.These are circumstancessimilar to those in which wegrew from 580 000 ounces perannum in 1995 to a record 3 million ounces by 2003.

Harmony Annual Report 2003 036
The year aheadStronger currencies in the countries in whichwe operate, relatively high inflationarypressure in South Africa and the challengeto all gold producers of replacing minedreserves, await us in the next 12 months.
Tough times call for tough measuresand experienced leadership. Your team atHarmony has delivered consistent growthduring previous periods of hardship. Wehave implemented a battle plan which Ibelieve will see us through this period,placing us in a stronger position to continueour growth story. The main components are:� Australian operations restructured for
profitability;� continued exploration success in
Papua New Guinea (PNG);� one of the industry’s most affordable
growth project pipelines;
� increased exposure to better qualityounces through the inclusion of theother 50% of Free Gold;
� the first of many agreements withunions to increase production shifts to354 shifts per year;
� continued emphasis on our “CostMarathon”;
� increased potential for assetacquisitions in South Africa due toindustry shrinking profit margins;
� exposure to real growth opportunitiesthrough our strategic investments inAvmin, Avgold, High River Gold,Highland Gold Limited and Bendigo.
None of these will be achievablewithout the combined dedication andsupport of the rest of my team,management, workers and the unions alike.
Bernard Swanepoel

First they whistled at us. Now they likeus! We’ve earned their respect.”
“

I’ve done all the jobs at the face. Underground is not so scaryas long as you’re following safety rules and procedures. Men liketo say that a woman can’t blast but when they see us working theysay, “Wow, this lady is strong, she can even drill!” They say we’reearning the same money so we must lift things ourselves. It’s betterfor you to do it yourself, but even men help each other. They arelearning to accept that we are part of the team. First they whistledat us. Now they like us! We’ve earned their respect.
My dream was to be a lawyer but my mother couldn’t afford it. SoI decided to do nursing and got my standard ten but I ended up incosmetics as a shelf-packer for five years with no chance of promotion.
In Kagiso I used to hear about everything that happens in a mine.I saw opportunities for myself. But a lot of women said we womencan’t do it. Men said women are too weak. It was a challenge to showthat I could make my life better and that women can do any job inthe mine.
I see myself as a manager one day. The Harmony Way is aboutupgrading people – and women especially. You used to stay as aloco driver or generalist for a long time. Now you can move faster.We already have women on shaft management teams. I want to learnhard and get more experience.
TEN PEOPLE. ONE STORTEN PEOPLE. ONE STORYY..NameMamsy MoyoTime at Harmony2.5 yearsWorks atCooke 3Started asLoco driverPosition todayLearner Miner

SECTION 3
ORE RESERVESTATEMENT3.1 PAGE 41
REPORTING CODE3.2 PAGE 41
MINERAL RESERVES SCHEDULE – METRIC3.3 PAGE 41
MINERAL RESERVES SCHEDULE – IMPERIAL3.4 PAGE 42
MINERAL RESOURCES3.5 PAGE 45
SAMREC CODE3.6 PAGE 46
MINERAL RIGHTS3.7 PAGE 46
GEOLOGICAL MODELLING3.8 PAGE 47
GRADE AND TONNAGE ESTIMATION3.9 PAGE 48
DILUTING MATERIALS3.10 PAGE 48
RESERVE CUT-OFF GRADE
CONTENT
SECTION 3
ORE RESERVESTATEMENT The future of a gold mining company isdependant on the quality of its assets, i.e.its ore reserves.
Our reserve base increased by 26% from49 million ounces to 62 million ounces overthe last year. We continue to invest in ourore bodies in order to upgrade resourceounces to the reserve category throughon-mine and brownfield projects.
Our unique ore reserve management system enables us to optimise the extraction of the orebodies we own.
IN OTHER WORDS

041
Harmony’s declaration complies with theSouth African Code for reporting of MineralResources and Mineral Reserves (theSAMREC Code), which sets out theinternationally recognised procedures andstandards for reporting mineral resourcesand reserves in South Africa. The codewas prepared under the auspices of theSouth African Institute of Mining andMetallurgy (SAIMM). It is modelled on theJORC code of the Australasian Institute ofMining and Metallurgy (AusIMM). OurAustralian reserves and resources arecompliant with the Australian code.
SECTION 3ORE RESERVE STATEMENT
Balance as at June 2002 273 1 527 49.1
Less mined (Attribute to Harmony) (28) (96) (3.0)
Added through ARMgold merger - Orkney 13 70 2.2
- Free Gold 55 393 12.6
- Replacement 65 32 1.0
Balance as at June 2003 378 1 926 61.9
Mt Au(t) Moz
ORE RESERVES RECONCILIATION 2002/2003
The following tables summarise theinventory of Harmony’s mineral resourcesand mineral (ore) reserves, including100% of ARMgold and Free Gold. Themineral resources are quoted as in situgrams and ounces, above a cut-off andover an estimated stoping width. Themineral reserves are quoted inclusive ofdiluting material as tonnes and gradedelivered to the mill. The final recoverygrade will be lower than the declaredgrade as the recovery factor of the variousplants is applied
Proved Probable Total Reserve
Region Tonnes Grade Gold Tonnes Grade Gold Tonnes Grade Gold
(million) (oz/t) (oz million) (million) (oz/t) (oz million) (million) (oz/t) (oz million)
Free State 29.01 0.13 3.90 24.08 0.13 3.22 53.09 0.13 7.12
Evander 11.54 0.19 2.21 66.25 0.21 13.65 77.79 0.20 15.85
Randfontein 18.87 0.14 2.71 10.21 0.15 1.48 29.09 0.14 4.20
Elandskraal 18.58 0.22 4.04 25.40 0.24 6.09 43.98 0.23 10.14
Kalgold 8.34 0.06 0.50 0.13 0.04 0.01 8.47 0.06 0.50
Australia 6.34 0.06 0.37 9.91 0.12 1.16 16.25 0.09 1.54
Free Gold 26.53 0.23 6.11 64.18 0.20 13.06 90.71 0.21 19.17
ARMgold 9.50 0.17 1.59 5.09 0.13 0.65 14.59 0.15 2.24
SA Surface Sources 53.85 0.01 0.75 28.51 0.02 0.44 82.36 0.01 1.18
Total 183 0.12 22.2 234 0.17 39.8 416 0.15 61.9
Proved Probable Total Reserve
Region Tonnes Grade Gold Tonnes Grade Gold Tonnes Grade Gold
(million) (g/t) (tonnes) (million) (g/t) (tonnes) (million) (g/t) (tonnes)
Free State 26.3 4.6 121.3 21.8 4.6 100.2 48.2 4.6 221.5
Evander 10.5 6.6 68.7 60.1 7.1 424.4 70.6 7.0 493.1
Randfontein 17.1 4.9 84.4 9.3 5.0 46.1 26.4 4.9 130.6
Elandskraal 16.9 7.5 125.7 23.0 8.2 189.5 39.9 7.9 315.2
Kalgold 7.6 2.0 15.5 0.1 1.4 0.2 7.7 2.0 15.6
Australia 5.8 2.0 11.6 9.0 4.0 36.1 14.7 3.2 47.7
Free Gold 24.1 7.9 190.0 58.2 7.0 406.1 82.3 7.2 596.1
ARMgold 8.6 5.7 49.3 4.6 4.4 20.2 13.2 5.3 69.6
SA Surface Sources 48.9 0.5 23.2 25.9 0.5 13.5 74.7 0.5 36.7
Total 165.6 4.2 689.8 212.1 5.8 1236.4 377.7 5.1 1926.2
3.1 REPORTING CODE
3.3 MINERAL RESERVES SCHEDULE – IMPERIAL
3.2 MINERAL RESERVES SCHEDULE – METRIC

Harmony Annual Report 2003 042
Mineral Resources are inclusive of the reserve figures.
Metric Imperial
Category Tonnes Grade Gold Tonnes Grade Gold
(million) (g/t) (tonnes) (million) (oz/t) (oz million)
Total Company
Measured 371 5.14 1.908 409 0.15 61.3
Indicated 1.023 3.47 3.545 1.127 0.10 114.0
Inferred 2.609 2.80 7.304 2.876 0.08 234.8
Total 4.003 3.19 12.757 4.412 0.09 410.2
Free State
Measured 66 5.03 332 73 0.15 10.7
Indicated 51 4.46 227 56 0.13 7.3
Inferred 592 3.30 1.952 653 0.10 62.8
Total 709 3.54 2.511 781 0.10 80.7
Evander
Measured 26 6.27 164 29 0.18 5.3
Indicated 143 6.80 973 158 0.20 31.3
Inferred 214 5.26 1.129 236 0.15 36.3
Total 384 5.91 2.265 423 0.17 72.8
Randfontein
Measured 48 4.93 236 53 0.14 7.6
Indicated 46 4.64 214 51 0.14 6.9
Inferred 478 3.25 1.552 526 0.09 49.9
Total 572 3.50 2.003 630 0.10 64.4
Elandskraal
Measured 26 8.08 213 29 0.24 6.8
Indicated 27 9.13 247 30 0.27 7.9
Inferred 55 6.12 338 61 0.18 10.9
Total 109 7.34 798 120 0.21 25.7
Kalgold
Measured 26 1.66 43 28 0.05 1.4
Indicated 3 2.04 7 4 0.06 0.2
Inferred 15 1.78 26 16 0.05 0.8
Total 44 1.73 76 48 0.05 2.4
Canada (Bissett)
Measured 0 8.41 4 1 0.25 0.1
Indicated 1 9.14 6 1 0.27 0.2
Inferred 1 10.04 7 1 0.29 0.2
Total 2 9.30 18 2 0.27 0.6
Australia
Measured 14 2.49 35 15 0.07 1.1
Indicated 66 2.42 160 73 0.07 5.2
Inferred 70 2.10 147 77 0.06 4.7
Total 150 2.27 342 166 0.07 11.0
Free Gold
Measured 53 8.60 452 58 0.25 14.5
Indicated 104 7.56 786 115 0.22 25.3
Inferred 375 4.99 1.874 414 0.15 60.3
Total 532 5.85 3.113 586 0.17 100.1
ARMgold
Measured 63 6.45 406 69 0.19 13.1
Indicated 206 3.79 781 227 0.11 25.1
Inferred 22 3.08 67 24 0.09 2.1
Total 291 4.31 1.254 320 0.13 40.3
Surface Sources
Measured 49 0.49 24 54 0.01 0.8
Indicated 375 0.38 143 413 0.01 4.6
Inferred 787 0.27 211 867 0.01 6.8
Total 1.211 0.31 379 1.335 0.01 12.2
Mineral Resources are declared using a cut-off of approximately 250 cmg/t for theunderground mines (approximately 2g/t),0.8g/t for open pits.
3.4 MINERAL RESOURCES
*Cautionary note to US Investors. The United States Securities and Exchange Commission(the "SEC") permits mining companies, in their filings with the SEC, to disclose only thosemineral deposits that a company can economically and legally extract or produce. We use certain terms in this annual report, such as "resources", that the SEC guidelines strictly pro-hibit us from including in our filings with the SEC.

When I could write my name my fathersaid, ‘You’ve finished your education’.”
“

When I could write my name my father said, ‘You’ve finished youreducation’.” I was expected to look after his cattle. But life wasdifficult.
I joined the industry in 1976 doing nearly every underground job– all the while educating myself. While queueing for the cage I wasreading.
The old system was dictatorial and violent. I would have left butthe challenge to be part of NUM was stronger. After the 21 day strikein 1987 the militants were all sent home, but some of us returned tobuild NUM structures. The industry was hostile. NUM adopted policieslike worker control.
Then the industry realised it needed trade unions. Everythingbecame agreements and companies sent people to learn industrialrelations. I became one of the first full-time shop stewards and Istarted to understand the industry more. In 1996, in agreement withNUM, I was appointed to management as senior personnel officerfor public affairs. Getting labour to understand the benefits of aconvergence of interests is a challenge. Illiteracy makes it a big job.
Then I joined ARMgold and was excited by being exposed to thebusiness aspects of mining. I also found that there were managersprepared to fight for change in the industry as much as we hadfought for freedom. No subject was taboo.
The values and norms of Harmony are almost the same as ARMgold.Harmony’s social plan deals well with life beyond mining. With themerger, I predict growth with the current philosophy and credibility.
TEN PEOPLE. ONE STORTEN PEOPLE. ONE STORYY..NameBethuel XunguTime at ARMgold5 YearsWorks atOrkneyStarted asDriverPosition todayHuman RelationsLeader

0
1
2
3
4
Measured Mineral ResourcesGrade-tonnage – Harmony
1
1 2 3 4 5 6 7 8 9 10 11 12 13 14 15 16 17 18 19 20 21 22 23 24 25 26
Mill
ion
Tonn
es (
x100
)
Oun
ces
(mill
ion)
& A
vera
ge
gra
de
(g/t)
Classes (g/t) Cutoff
Tonnes
Avg g/t
kg
0
10
20
30
40
50
60
70
045
DefinitionsA mineral resource is a concentration (oroccurrence) of material of economicinterest in or on the Earth’s crust in suchform, quality and quantity that there arereasonable and realistic prospects foreventual economic extraction. The location,quantity, grade, continuity and othergeological characteristics of a mineralresource are estimated from specificgeological evidence and knowledge, orinterpreted from a well-constrained andportrayed geological model. MineralResources are subdivided, in order ofincreasing confidence in respect ofgeoscientific evidence, into Measured,Indicated and Inferred categories.
The Measured mineral resource isthat part of a mineral resource for whichtonnage, densities, shape, physicalcharacteristics, grade and mineral contentcan be estimated with a high level ofconfidence. It is based on detailed andreliable exploration, sampling and testinginformation gathered through appropriatetechniques from locations such asworkings and drill holes. The locations arespaced closely enough to confirmgeological and grade continuity.
The Indicated mineral resource is thatpart of a mineral resource for whichtonnage, densities, shape, physicalcharacteristics, grade and mineral contentcan be estimated with a reasonable levelof confidence. It is based on exploration,sampling and testing information gatheredthrough appropriate techniques fromlocations such as workings and drill holes.The locations are too widely orinappropriately spaced to confirmgeological and/or grade continuity but arespaced closely enough for continuity tobe assumed.
The Inferred mineral resource is thatpart of a mineral resource for whichtonnage, grade and mineral content canbe estimated with a low level ofconfidence. It is inferred from geologicalevidence and assumed but not verifiedgeological and/or grade continuity. It isbased on information gathered throughappropriate techniques from locationssuch as workings and drill holes that maybe limited or of uncertain quality andreliability.
A Mineral Reserve is the economicallymineable material derived from aMeasured and/or Indicated mineralresource. It is inclusive of dilutingmaterials and allows for losses that mayoccur when the material is mined. TheMineral Reserves are sub-divided in orderof increasing confidence into ProbableMineral Reserves and Proved MineralReserves.
The Probable Mineral Reserve is theeconomically mineable material derivedfrom the Indicated mineral resource. It isestimated with a lower level of confidencethan a Proved Mineral Reserve, is inclusiveof diluting materials and allows for lossesthat may occur when the material is mined.
The Proved Mineral Reserve is theeconomically mineable material derivedfrom the Measured mineral resource and isestimated with a high level of confidence.It is inclusive of diluting materials andallows for losses that may occur when thematerial is mined.
The Measured and Indicated MineralResources are inclusive of those MineralResources converted to the MineralReserves.
ExplorationResults
MineralResources
MineralReserves
Probable
Proved
Incr
easi
ng le
vel o
f geo
scie
ntifi
c kn
owle
dg
e an
d c
onfid
ence
Reported as in situmineralisation estimates
Consideration of mining, metallurgical, economic, marketing, legal,environmental, social and governmental factors (the 'modifying factors')
Reported as mineableproduction estimates
Inferred
Indicated
Measured
3.5 SAMREC CODE

All Harmony’s mineral resources and mineralreserves are located within applied for Areasof Mining Authorisation at each of our mines.
Applications are being prepared tohave all our “old order” Areas of MiningAuthorisation converted to “new order”Mining Rights in line with the requirementsof the new Mineral and PetroleumResources Development Act.
A great deal of work has been, and isbeing put into assessing Harmony’s “oldorder” Mineral Rights lying outside of theapplied for Areas of Mining Authorisation inall mining regions.
To facilitate this mineral rightsconversion process in order to comply withthe new Mineral and Petroleum ResourcesDevelopment Act, Harmony has retained theservices of a consulting geologist. He willassist the Harmony geological personnel inreviewing all of Harmony’s Mineral Rightsprior to an executive decision being madeon what to do with these “old order” Rights.
3.7 GEOLOGICAL MODELLING
Harmony’s foundational philosophy formanaging its operations has always been“let the orebody dictate”. In spite of thefact that the Free State mining complex,Free Gold, Elandskraal, Evander andRandfontein are all mature miningoperations where the geology is generallywell understood, it was decided tochallenge the geological modelscontinuously. In order to do so thegeologists in the operational regions wererequested to review their geologicalmodels. Geological Forums wereestablished in each region to facilitate thisreview. Each region presented its review ofits regional models to senior companygeological staff. From each review
Harmony Annual Report 2003 046
presentation shortcomings in the modelswere identified and further programmesdevised. The geologists continue to meeton a regular basis to discuss/workshopaspects of their regional geological models.
The result of the work done in theGeological Forums has helped to ensurethat the “Geo” in Geostatistics remainsparamount. Consequently, the latestdeclaration of mineral resources was basedon a more thorough understanding andinterpretation of the geology, resulting inmore accurate estimates than in previousyears.
For the purposes of geologicalinterpretation, and to define areas ofreasonable similarity for geostatisticalanalysis, each mine section is subdividedinto coherent geozones. Typically, eachmine section may have five to tengeozones bounded by major faults, distinctchanges in sedimentological faces andless distinct boundaries defining areaswhere there is a noticeable regionalchange in the general grade of the reef.
Each mine’s mineral resources arecategorised, blocked out and ascribed anestimated value. Typically, measured andindicated resource blocks are aligned inthe direction of mining. The blockscomprise the length of a mining panel (20to 30m) and extend beyond the mineworkings to a distance that is equivalent tothree months’ mining.
Consequently, these blocks aretypically 30m long and 30m wide, althoughat Evander there are some substantiallylarger blocks defined along pay channels.Beyond the indicated blocks, large inferredblocks are defined up to the mineboundary.
Classes (g/t) Cutoff
0
1
2
3
4
5
6
7
8
9
10
Indicated Mineral ResourcesGrade-tonnage – Harmony
1 2 3 4 5 6 7 8 9 10 11 12 13 14 15 16 17 18 19 20 21 22 23 24 25 26
Mill
ion
Tonn
es (
x100
)
Oun
ces
(mill
ion)
& A
vera
ge
gra
de
(g/t)
Tonnes
Avg g/t
Kg
0
20
40
60
80
100
120
140
Classes (g/t) Cutoff
0
5
10
15
20
25
30
Inferred Mineral ResourcesGrade-tonnage – Harmony
1 2 3 4 5 6 7 8 9 10 11 12 13 14 15 16 17 18 19 20 21 22 23 24 25 26
Mill
ion
Tonn
es (
x100
)
Oun
ces
(mill
ion)
& A
vera
ge
gra
de
(g/t)
Tonnes
Avg g/t
kg
0
50
100
150
200
250
300
3.6 MINERAL RIGHTS

047
Resource estimation techniques at themining operations follow the same basicprinciples however, different computersoftware packages are employed by thedifferent regions.
Harmony and Joel use a newlyestablished computerised system, utilising a3D mining software package allowing thecompletion of all blocking, statistics,geostatistics and grade and tonnageestimation in a fully integrated evaluationsystem. This system is currently beingdeveloped and managed centrally withspecialised support staff.
Bambanani, West, Tshepong andPhakisa use more established 2D CADcomputer systems, that have beendeveloped to suit the tabular nature of theWitwatersrand gold deposits.
At these operations all survey data andsampling information is captured digitallyand stored in an electronic database. At allof the ARMgold operations, Kudu and Sable,Nyala, Eland and St. Helena data captureand estimation is paper-based.
Statistics: Where data is captureddigitally each mine uses its definedgeozones to subdivide the Reef data intodiscrete data populations that have distinctgrade distribution characteristics. Statisticalanalyses of the metal accumulation valuesare undertaken so as to substantiate thedifferent grade populations in each domain.The data will often be log transformed toallow a lognormal or compound lognormalmodel to be applied. In some cases, otherparameters - such as channel width andstope width - will be analysed to look fortrends that could be investigated further withgeostatistics and interpolated.
Data is checked and validated and anyextreme values investigated to ensure thereare no transcription errors. Harmonyemploys despiking and grade cuttingtechniques on some of the Secondary Reefdata to assist with further statistical and
geostatistical studies.Geostatistics: “Point” variograms are
constructed from underground channelsamples logged metal accumulation values -and borehole data in the case of Harmony -for each domain. The data generallyprovides well-structured, two componentspherical variograms with high nuggeteffects (50% to 80%) and ranges of 10m to20m and 60m to 90m. These variograms areusually isotropic. This indicates a highrandom variability in sample grades and anunderlying spatial control on sample gradeswhose zone of influence extends for up to90m in all directions.
Further variography is carried out ondata to be used in the macro krigingprocess. These data are used to constructvariograms comprised of regularised channelsample data, diamond drillhole intersectionsand underground drillhole intersections.
The variograms from these datasetsprovide a larger scale control on block gradeestimation. The large-block regularised datatends to give excellent structure with little orno nugget effect and produces largerranges, which can exceed 1 500m.
Kriging: At Tshepong, Phakisa,Bambanani and West Mine, kriging isundertaken separately for eachgeostatistical domain. Channel sample datais used to estimate grade into 10m x 10mblocks using ordinary kriging based on thepoint variograms and a search radiusequivalent to the short range in thevariograms. Only those blocks with a highstatistical confidence (regression slopegreater than 0.6) are evaluated by thismethod.
Next, 30m x 30m blocks are used tohouse values generated by a simple krigingprocess. This incorporates the local areamean (based on the ordinary kriged values)into the estimate and therefore smoothesdata more than the ordinary kriging. Moreconfidence is given to the kriged values in
those blocks which were not estimated bythe ordinary kriging process. The searchradius used is approximately 30m andtherefore restricts the 30m x 30m blockestimates to the vicinity of well-sampledareas. Again, only those blocks with a highstatistical confidence within a 3 by 3neighbourhood search range are evaluatedby this method.
A third method is used to extrapolategrades much further using the large-blockregularised channel sample data andincorporating the diamond drillholeintersection data which is more dispersed.This kriging is based on large square blockswith 250m long sides and a large searchradius. The data is then co-kriged. Theblocks from each of the three block modelsare combined which results in highconfidence estimates in the vicinity of thechannel sampling. 10m x 10m and 30m x30m blocks are used which contribute to themeasured resource, and well-founded long-range estimates, which contribute to theindicated and inferred resource.
The Kriging technique utilised byHarmony and Joel differs to that statedabove. Three prototype block models arecreated prior to grade estimation, a 15 x 15mmeasured model, a 30m x 30m Indicatedmodel and a 60m x 60m Inferred model. Thekriged estimates of the Measured model arerestricted by the range of the semi-variogramand include a minimum of 15 sample pointswithin the search radius. The krigedestimates of the Indicated model arerestricted by twice the range with a minimumof two sample points. In general, the Sitchel-testimate technique and application ofcalculated additive constants are used forestimation of the Inferred model. The threegrade models are then combined to formone overall grade model. Channel widths arealso estimated using the same technique.
0
5
10
15
20
25
30
35
40
45
Total Mineral ResourcesGrade-tonnage – Harmony
1
1 2 3 4 5 6 7 8 9 10 11 12 13 14 15 16 17 18 19 20 21 22 23 24 25 26
0
50
100
150
200
250
300
350
400
450
500
Tonnes
Avg g/t
Moz
Classes (g/t) Cutoff
Mill
ion
Tonn
es (
x100
)
Oun
ces
(mill
ion)
& A
vera
ge
gra
de
(g/t)
3.8 GRADE AND TONNAGE ESTIMATION

Harmony Annual Report 2003 048
The SAMREC code requires that reportedmineral reserves are "inclusive of dilutingmaterials and allow for losses that mayoccur when the material is mined".Guidelines to the code state that "mineralreserves are reported inclusive of marginallyeconomic material and diluting materialdelivered for treatment or dispatched fromthe mine without treatment".
Harmony has adjusted the In situmineral reserve, which is calculated over ananticipated stoping width, to account forthose gold losses and other contributingdiluting materials. Diluting or additionalmaterials include sundries (tonnes ascribedto gully cuts, faults and waste), on-reefdevelopment tonnes (a wider cut withconsequential diluting material), reclamation(tonnes from vamping operations in old mineareas), and shortfall (tonnes not called for bythe survey department and ascribed nograde).
Each of these items has been ascribeda value based on current mining experienceand has typically been calculated over 12 to20-month periods. Where recent history hasshown unusual or exceptional results, thesehave been adjusted to reflect more typicalmining expectations.
Competent persons declarationThe competent persons responsible for thepreparation of the company’s reserves andresources are Graham Briggs (PrSciNat) forSouth Africa and Ted Grobicki (PrSciNat) forAustralia.
R46.500
Gold Price SensitivityHarmony Group Total Mineral Reserves (2003)
Oun
ces
(mill
ions
)
9
8
7
6
5
4
3
2
1
0
90
80
70
60
50
40
30
20
10
0
Gold Price (R/kg)
R69.750 R93.000 R116.250 R139.500 R186.000
Ounces (millions)
g/t
g/t
3.9 DILUTING MATERIALS 3.10 RESERVE CUT-OFF GRADE
Reserve cut-off gradeIn order to define that portion of a measuredand indicated mineral resource that can beclassified as a proven and probable mineralreserve, Harmony applies the concept of acut-off grade. The cut-off grade isdetermined using the company’s Optimisercomputer program which requires thefollowing as inputs:� the database of measured and
indicated resource blocks (per shaftsection);
� an assumed gold price which, for thisore reserve statement, was taken as R93 000 per kilogram;
� planned production rates;� planned working costs (Rands per
tonne); and� the mine recovery factor (MRF) which is
equivalent to the mine call factormultiplied by the plant recovery factor.
Resource cut-off gradeIn order to meet SAMREC’s requirementsthat the material reported as a mineralresource should have "reasonable andrealistic prospects for eventual economicextraction", we have determined anappropriate cut-off grade which has beenapplied to the quantified mineralised body,according to a process incorporating thefollowing parameters:� a ten-year view; and� the gold price (in Rand per kilogram) for
ten years.
Applying this process as input intoHarmony’s Optimiser program to determinethe cut-off grades, the average value of 250cmg/t (approximately 2g/t) is used todetermine that portion of the mineralisedbody that is reported as a mineral resource.

Gold doesn’t saywhich colour youhave to be tomine it.”
“

Previously the shift-boss was the only one that did the thinking.The others followed. There were no questions, no challenges. Noweveryone must think for himself. Gold doesn’t say which colour youhave to be to mine it, and the crew’s involvement in planning is real.They notice the small things. Even the manager can learn from guysin the team. They understand it’s a business – they do their ownbudgets – order their own material.
If there’s any company you can improve yourself in, it’s Harmony.You can stand out. This is what I get my guys to understand. Mygreatest achievement is that a guy I coached 5 years ago still phonestoday to tell me of his success.
I’m a believer. Not only in the company but in the good Lord –therefore I must bring out the best in myself. Harmony gives me theopportunity to do that. And my contribution is valued.
It was difficult to accept the changes. Harmony took away thelittle things like cooldrink in the change-house. The only thing thatcounted was gold. But we’re much better off now than we were.And I’ve realised that, yes, it is about the gold. It’s not about comfort,it’s about the company. If it wasn’t for the company I’d be lookingfor a job.
We were brought up to believe other people would do the thinkingfor us. And for a white guy change was difficult. But the changesare amazing. I believe a lot of people can learn from us.
TEN PEOPLE. ONE STORTEN PEOPLE. ONE STORYY..NameFrik VenterTime at Harmony8 YearsWorks atUniselStarted asShiftbossPosition todayProduction coach
SECTION 4
SUSTAINABILITYREPORT4.1 PAGE 53
COMPLIANCE WITH KING II4.2 PAGE 53
ETHICS AND INTEGRITY4.3 PAGES 54-57
OUR EMPLOYEES’ HEALTH AND SAFETY4.4 PAGES 57-58
HUMAN CAPITAL4.5 PAGE 61
OUR IMPACT ON THE COMMUNITY4.6 PAGES 61-62
OUR IMPACT ON SOCIETY4.7 PAGES 63-64
ENVIRONMENTAL SUSTAINABILITY
CONTENT

SECTION 4
SUSTAINABILITYREPORTIN OTHER WORDSSustainability is about minimising the impactof our mining activities on people and theenvironment.
The people affected are our own employees:their safety, health and development, the communities we function in, and society ofwhich we form part.
The environment is not only water, air and the habitat, but also the availability of theseresources for use by future generations.

053
The overall reporting requirement of King IIis that “every company should report atleast annually on the nature and extent of itssocial, transformational, ethical, safety,health and environmental managementpolicies and practices. The board mustdetermine what is relevant for disclosure,having regard to the company’s particularcircumstances”. We therefore are not onlyproviding you with financial information, butalso our economic, social andenvironmental achievements - our “triplebottom line”. This report should be read inconjunction with the financial informationprovided, to enable stakeholders to assesswhat our long-term prosperity incomparison to our short-term profits andgains will be.
SECTION 4SUSTAINABILITY REPORT
4.1 COMPLIANCE WITH KING II 4.2 ETHICS AND INTEGRITY
Harmony is committed to integrity and fairdealing in the conduct of its business. Thiscommitment, which is actively endorsed bythe board of directors, is based on afundamental belief that business should beconducted honestly, fairly and legally. Weexpect all our employees to share ourcommitment to high moral, ethical and legalstandards. Our commitment toorganisational integrity has beenincorporated into a Code of Ethics, whichapplies equally to all employees. The term“employees” is used in the broadest senseand encompasses all staff with whom aservice contract exists, including directors,contractors, consultants and temporarystaff.
If employees become aware of, orsuspect, a contravention of the Code theyare encouraged to advise their linemanager or Internal Audit. Should they wishto remain anonymous, they can also makeuse of our toll-free line to report the matterwhich will then be investigated and dealtwith according to “Harmony’s DisciplinaryCode”.
Employees must comply with all theapplicable laws and regulations whichrelate to their activities for and on behalf ofHarmony. We do not condone any violationof the law or unethical business dealings byany employee, including any payment for,or other participation in an illegal act, suchas bribery.
We believe that our employees performtheir duties conscientiously, honestly and inaccordance with the best interests ofHarmony, thereby optimising our businessobjectives.
The Mining Charteralso focuses onissues such as thedevelopment of ourpeople and thesustainability of thecommunities aroundour mines.

Harmony Annual Report 2003 054
4.3 OUR EMPLOYEES’ HEALTH AND SAFETY
Our Health, Safety and EnvironmentalAudit Committee Our Health, Safety and Environmental AuditCommittee (also refer to board committees,page 80-81) was formed to supplement,support, advise and provide guidance onthe effectiveness of management’s efforts inthe HSE arena. Its main duties are:� to develop the framework, policies and
guidelines for safety, health andenvironmental management;
� to review the policies and performanceof the company, its divisions and itsmanaged subsidiaries and theprogressive implementation of itssafety, health and environmentalpolicies;
� to encourage independently managedsubsidiaries, associates and significantinvestments to develop policies,guidelines and practices congruentwith our safety, health andenvironmental policies;
� to monitor key indicators on accidentsand incidents and, where appropriate,ensure that they are communicated toother companies managed by orassociated with the company;
� to consider material national andinternational regulatory and technicaldevelopments in the fields of safety,health and environmental management;and
� to facilitate participation, co-operationand consultation on safety, health andenvironmental matters withgovernment, industry, national andinternational organisations and safety,health and environmental institutions.
We believe that the appointment of theHSE audit committee has had a positiveeffect on the management and monitoringof HSE matters. Continued improvementsare being made to ensure that HSE iseffectively managed and that the businessremains sustainable.
Our responsibility to our workers - safetyand health South Africa’s Mine Health and Safety Actprescribes general and specific duties foremployers and others, determines penaltiesand a system of administrative fines, andprovides for employee participation byrequiring the appointment of health andsafety representatives, as well as throughthe establishment of health and safetycommittees. It also entrenches the right ofemployees to refuse dangerous work.Finally, it describes the powers andfunctions of a mine health and safetyinspectorate and the process ofenforcement.
We believe that these Safe ProductionProgrammes are sustainable and willimpact positively by reducing substandardacts. We have developed a RiskManagement System (RMS) using the MineHealth and Safety Act and other applicableregulatory requirements as the foundation.It consists of 15 modules, which includes allactivities and disciplines on the mine. Thesystem is geared towards proactivelyeliminating, mitigating or controlling risk atsource.
The RMS is also integrated into our“Laduma” team-building concept, wherebyindividuals are encouraged to work as ateam to achieve their set objectives.Linked with Laduma is the “Nyakaza”campaign, focusing on stopping unsafeacts and conditions before they occur andrectifying them immediately. The RMSprovides each supervisor and employeewith a risk assessment tool for continuousrisk assessments in his/her working place.It is regularly revised and refined.
Our Healthy Living CampaignDuring the course of the year Harmonyembarked on its Healthy Living for Lifecampaign which aims to ensure the well-being of our workforce. We provide qualityhealth care, equivalent to private hospitalstandards, to all employees. The facilitiesrange from 24-hour emergency care andintensive care units to world-class surgicaltheatres and outpatient facilities.
Education in all health matters, as wellas continuing medical surveillance, is thebedrock of our approach. During the periodunder review 45 780 medical surveillanceexaminations were performed on anestimated population of 42 320. Wherethere was a need for a special examination,some workers may have had more than oneexamination per year.

055
HIV/AIDSHarmony has declared war on HIV/AIDS!The HIV/AIDS infection rate among ourSouth African workforce is currentlyestimated at approximately 28%, a figurewe believe is consistent with the overallinfection rate in the country.
In order to minimise the effect ofHIV/AIDS on our people and our businesswe actively pursue HIV/AIDS awarenesscampaigns with our South Africanworkforce. Medical assistance andcompassionate separation packages foremployees who decide to leave their placeof work and return home for care areprovided to HIV-positive employees.
On 19 September 2002, Harmony, theNational Union of Mineworkers (NUM) andthe United Association of South Africa(UASA) entered into an historical agreementwhereby the stakeholders undertook todevelop and maintain programmes toreverse the impact of HIV/AIDS.
Our objectives are:� to reduce the number of infections
among employees and consequentlytheir families and communities;
� to ensure that the rights of employeesliving with HIV/AIDS are upheld andcomply with existing legislation;
� to create a conducive environment inthe workplace for dealing with theepidemic constructively; and
� to implement HIV/AIDS programmes.
The activities on which we havesubsequently embarked are:� focusing on prevention;� ongoing counselling; � appointment of a group HIV/AIDS
co-ordinator; and� access to medical facilities and
adequate medical care.
Progress is monitored and reviewed ona monthly basis. The objectives set outabove form part of our strategic plan tofight HIV/AIDS and financial provision hasbeen made to achieve these goals. Weestimate that it will cost Harmonyapproximately R1 000 per mineworker permonth for its anti-retroviral treatmentprogramme (ART) or an estimated R600 000 a month in total. We currentlyspend R3.8 million per month on AIDS-related illnesses, which results in a cost of$2 per ounce produced. We believe thatthis amount will decrease marginally withthe introduction of the ART programme. Inaddition to HIV/AIDS treatment, Phakamisa,a company developed and sponsoredmultivitamin tablet is available to ourworkforce.
HIV/AIDS structures have been formedat shaft operational and corporate level tofacilitate participation. Our community-based interventions are world-class andworld-renowned. The Lesedi Project hasproduced two publications in scientificresearch journals and we are activelyinvolved with organisations such asUNAIDS/USAID, the SAIMR and the WestRand HIV/AIDS Council. Voluntarycounselling sessions and testingprogrammes are publicised and promotedby way of induction programs, medicalstaff, peer group educators and healthcampaigns. Our HIV/AIDS policy iscommunicated through management andunion communication systems to ensureawareness amongst our employees.
We have declared war against HIV/AIDS!

Harmony Annual Report 2003 056
Occupational HealthTuberculosis and silicosisLong-term exposure to silica dustunderground is known to cause silicosis.Silica dust is also known to play a major rolein the development of pulmonarytuberculosis, which promotes thedevelopment of other diseases that occurless frequently. Occupational HealthCentres at all our operations have medicalsurveillance programmes that are dedicatedto detect and treat pulmonary tuberculosisand silicosis at an early stage of thediseases.
All our underground workers undergoannual examinations to ensure that thediseases are diagnosed at an early stage. If diagnosed with either tuberculosis orsilicosis, or a combination of the two, theworker’s details are submitted to the MedicalBureau for Occupational Diseases (MBOD)in Johannesburg. The MBOD is thenresponsible for certification andcompensation of these workers under theOccupational Diseases in Mines and WorksAct, 1973. Affected workers may decidewhether to continue underground work or beremoved to surface work, thus avoidingfurther exposure to the silica dust. Thedecision would be dependent on the degreeof the disease and the degree of physicalimpairment sustained by the worker.
The number of occupational lungdiseases certified by the MBOD in respectof our workers during the year declined from1 133 to 698 cases. This lowered theincidence rate in our workforce from 2 838per 100 000 workers to 1 940 per 100 000.We are pleased to report that the number ofsilicosis cases has been reducedsubstantially. This year only 111 cases werereported in comparison to the 228 cases inthe previous year. The total number of alloccupational lung disease cases submittedby Harmony to the MBOD for certificationand compensation, also declined from1 492 cases in the previous year to 1 106during this year.
However, the current HIV/AIDSepidemic had a negative impact on the totalnumber of cases of tuberculosis diagnosedat our hospitals, increasing to 1 199 casesfrom 1 126 cases.
Noise-Induced Hearing Losses (NIHL)Noise-induced hearing loss remains one ofour most serious occupational hazards. Atotal of 667 claims were submitted to theRand Mutual Assurance Company on behalfof affected employees. This is less than the745 claims for the previous year, with 429employees being compensated comparedto the 338 of the previous year.
The office of the CompensationCommissioner introduced new legislationconcerning hearing loss calculation in 2001.This will enable employers to calculate thehearing loss that the individual suffers whilstin his employ and make the employer onlyliable for the compensation for that portionof any hearing loss suffered. We are well onthe way to assigning a baseline value bymeans of an audiogram for each employeeexposed to noise. This baseline value willbe used to calculate compensation for anyfuture claims.
Radiation ExposureRadiation exposure measurements in themining industry in South Africa only becamemandatory 13 years ago. All shafts thatwere in existence before 1990 were notdesigned to cater specifically for radiationexposures. Radiation in our mines isassociated with the mining of uranium-bearing orebodies. Ionising radiation occursfrom the radioactive disintegrationsassociated with the decay of the primaryelements uranium and thorium. Hazard andRisk Assessments have shown that thepredominant radiation exposure pathway isinhalation of radon progeny.
The National Nuclear Regulator (NNR)has issued nuclear licenses to all Harmony’soperations. Exposure to the public iscontrolled in accordance with the license
conditions. Public Hazard Assessmentshave been completed and an ongoingprogramme for dust, radon and water is inplace at all our operations.
Adequate ventilation is critical to thecontrol of radon in underground workplacesas it is the only practical means of limitingthe build-up of radon gas and radonprogeny. At Harmony radiation exposure ismonitored in terms of a Radiation ProtectionProgramme as required by the mine-specific Nuclear Authorisation, issued bythe National Nuclear Regulator.
Radiation exposures in our mines varyfrom region to region, due to the mininginfrastructure constraints and the uraniumcontent or ore being mined. Generally,radiation exposures are below the doselimit, except at our Randfontein operations,where in some isolated workings, the annualdose limit is being exceeded. To ensure thatthe problem is resolved, a RadiationWorking group has been established. Inaddition to the implementation of regulatoryradiation protection programs, they focus onthe remediation of potential over-exposures.
Cyanide exposureWe have compiled and implemented aCode of Practice for the Safe Handling ofCyanide at all of our operations’metallurgical plants. The Code of Practicewas compiled in accordance with theChamber of Mines guideline, prepared by amulti-stakeholder committee consisting ofrepresentatives of the mining industry,government departments, NGOs, labourand cyanide suppliers. The said guideline,and hence our Code of Practice, wasdesigned around best practice principlesand includes the latest operational expertiseand application of technology for themanagement of cyanide. It includesguidelines for the management of theimpact on the environment. All ouroperations are audited annually forcompliance in terms of ISO14000. On-siteprovision of emergency equipment,

057
medicine and First Aid training are providedat each metallurgical site. Medical staff whoare stationed at our hospital emergencydepartments have also been trained in thetreatment of victims of cyanide exposure.No serious incidents were reported duringthe year.
In conclusionOur Healthy Workforce Committee’sobjective is to deliver services andinterventions that directly affect the qualityof life of our workforce which in turn willensure productivity at Harmony. Significantinterventions include peer educationprogrammes at the shafts, education atinduction and awareness centres, graffitiwalls, heath advice via e-mail, communitypreventative programmes, condom
promotion and supply, home-based care,TB interventions and the Anti-RetroviralTreatment (ART) programme.
4.4 HUMAN CAPITAL
Employment equityHarmony supports employment equity inthe workplace which seeks to identify,develop and promote each employee whodemonstrates the qualities of individualinitiative, enterprise, hard work and loyaltyin their job.
Our employees have the right to workin an environment which is free from anyform of discrimination, directly or indirectlyon any arbitrary ground, including, but notlimited to race, gender, sex, ethnic or socialorigin, HIV/AIDS status, colour, sexualorientation, age, disability, religion,conscience, belief, political opinion, culture,language, marital status or familyresponsibility.
We believe that employment equity isnot merely about meeting targets, but abouthow we optimally engage employees in ourchanging business environment. Flatterstructures, with appropriate decision-making empowerment, are in placethroughout the company. The majority of ourminers are historically disadvantaged andgood progress is being made withadvancing this group into line managementpositions.
The “Scorecard for the Broad BasedSocio-Economic Empowerment Charter forthe South African Mining Industry” (MiningCharter) sets specific targets with regardsto the employment of HistoricallyDisadvantaged Individuals (HDIs).Harmony has in place a number of trainingprogrammes, career development plansand employment equity initiatives to reachthese targets.
It is our business objective to have 45%previously disadvantaged individuals (PDIs)in management positions by 2007 and 10%women in mining by the same date. We are
Company Total
Board 19 9 3 47
Executive 30 12 5 40
Managers 101 17 2 17
Technical Professional 3 017 1 462 391 48
Supervisory 5 165 4 875 53 94
Clerical 862 845 322 98
Operator 14 115 13 786 131 98
Elementary 10 192 10 170 283 99
Total 33 485 31 166 1 188 90
% of Total 100 90 4% 631
* PDI - Previously Disadvantaged Individuals
%OF PDI
TOTAL * PDIEMPLOYEES
PDIWOMEN
LEVEL
Snapshot of mining
Mine managers 31 5 1 16%
Mine overseers 170 47 0 28%
Coaches 513 129 0 25%
Miners 1 217 945 0 78%
%OF PDI
TOTALEMPLOYEES
DESIGNATEDEMPLOYEES
WOMENLEVEL
table 1
table 2

Harmony Annual Report 2003 058
We have to consider the legacy we leavebehind when we closedown an operation. We need to move thecommunity beyond itsdependency on themine.
aiming to reach these targets within fouryears. We intend to demonstrate to both ourshareholders and our stakeholders that weare committed to surpassing the objectivesset by the Department of Minerals andEnergy, and we are well on our way toachieving this goal. The challenge is toensure that our affirmative actionprogrammes result in sustainableemployment equity in a company that istruly South African and internationallycompetitive.
For the past financial year, employmentequity figures for the total company are asfollows: see table 1 and 2.
Training and DevelopmentSustained value creation is synonymouswith continuous improvement where peoplelive up to their potential and aspire toachieve their dreams within the Harmonycontext. Training and people developmenthas been integrated into our core businessprocesses which focuses on providing skillsand proficiency designed to reinforceemployee performance. Management iscommitted to creating an enabled workingenvironment where individuals andproduction teams are empowered. To thisend training and people development hasbecome a core competence andresponsibility of our line managers.
Our leadership and teamworkdevelopment interventions have beendesigned and implemented to reinforce thebuilding of organisational behaviour wheretechnically skilled employees, who thinkpro-actively, will excel. We have focused oncoaching, team development andcommunication skills. A Business LeaderDevelopment Programme is beingdeveloped for senior management inpartnership with one of the leading SouthAfrican universities, to empower ourmanagers to lead the drive for value creation.
We are implementing a PerformanceManagement System that focuses on theleader’s role to develop people to their full
potential. This system complements ourdrive to have self-motivated people whotake ownership of their results and growthpaths. In addition, transformation of ourorganisational culture is enhanced and ourtalent management programmes are bettersupported.
Our Adult Basic Education Training(ABET) Programmes are a prerequisite forattendance at our mining school. MinersSkills Training is aimed at ensuring thatteam leaders and high-potential stopingand development workers can obtain ablasting certificate. This is the entry levelcourse into junior management. TheAdvanced Miner Course is aimed atproviding miners with more advancedmining and management skills. CoachDevelopment and Mine OverseerDevelopment Programmes have also beenintroduced and have proven to be verysuccessful in assisting with the culturechange under way in Harmony.
Our Bridging School and BursaryScheme is establishing a sound base forcore business-related tertiary studies. Weassist less privileged students, as well asour employees, who show promise withbursaries to study full-time at tertiaryinstitutions.
All our training and developmentprogrammes are integrated into our talentmanagement process, ensuring that thetalent identified is sponsored, coached andmentored with the aim of developing asound skills base for our successionstrategy.
HousingOur social investment creates affordablequality housing for our employees and thewider community. This is the outcome of apartnership between Harmony, the NationalUnion of Mineworkers (NUM) and theprovincial government of the Free StateProvince.

Harmony is the best bucket to pick upwater if you want to drink.”
“

Harmony is the best bucket to pick up water if you want to drink.Previously – before Harmony – the mine was running down and therewere retrenchments. Harmony came with a reserve tank and we wereback on the road. Harmony took us to a full tank. We can take thedistance now.
My chief safety officer certificate is from Harmony’s hand. If I’ma good performer I know there can be more opportunity. I’m gaininggood experience for the rest of my life.
People blame others for what they don’t have – their parents – thecompany. Rather stand up – do something – come with somethingin your hand.
I need to perform – to push myself – to push my child to have abetter life in the future. I forced myself to get educated. To say I havea matric is nothing, but it shows people that I have drive. I’m the onewho did this – it comes from the inside.
I started as a sweeper – today I’m a mine overseer. I feel proudabout what I’ve achieved.
The old management system was shouting – not about asking youwhat you think we can do. There was no communication. As teamleaders we said, “let them shout, they pass.” And then we carriedon working to our own plans. The thing that wasn’t good was that wewere not sure what we were doing. But because of our coachingmethods today, I know how to manage people softly and get themto give their best.
TEN PEOPLE. ONE STORTEN PEOPLE. ONE STORYY..NameFernando CossaTime at Harmony29 yearsWorks atEvander 5 ShaftStarted asGeneral TeamAttendantPosition todayProbation MineOverseer

061
Social PlanThe Social Plan forms part of the Mineralsand Petroleum Resources Development Act,2002. The Social Plan, which emphasisesthe tripartite relationship betweengovernment, the company and therespective unions, calls for stakeholders tobe proactive in devising strategies to dealwith skills development of currentemployees, retraining of employees to beretrenched, and the redeployment ofemployees to their communities in a mannerthat achieves social upliftment. Mininglicences will not be renewed or granted tomining companies that do not adhere to therequirements of the said Act. The socialplan addresses the reality that all mines arefinite in life and leave an impact, positive ornegative, long after they cease operations.
We see the implementation of a well-designed Social Plan as an opportunity tocontribute to the alleviation of the social andeconomic impact on individuals and theeconomies of the regions in which weoperate. In addition, we will re-align ourprocurement activities to allow for broaderparticipation of new entrants into theeconomy. We further promote and supporteconomic activities in and around miningcommunities that will ensure sustainability ofthose regional economies beyond mineclosure.
On 19 March 2003, Harmony and theNational Union of Mineworkers (NUM)signed an agreement on the company'sSocial Plan Framework. We are the firstSouth African mining company to sign anagreement of this nature. As soon aslegislation is finalised, the company willestablish a Social Plan Fund with an initialcontribution of R15 million, and anundertaking to contribute a furtherR35 million over a 10-year period.
The agreement calls for theestablishment of Future Forums at all ouroperations. The forums will liaise with bothlocal and national government to formulateand implement integrated development
plans for the communities surrounding ouroperations. Areas from which our labour issourced will be included in the plans.
We have also pledged our commitmentto the development of our workforce and tothe necessary skills transfer processes, asper the Social Plan requirements. We alsoactively participate in a management/labourpartnership which incorporates strongcommunity involvement.
In the Free State we have utilised someof our redundant hostel facilities andconverted them into a newly establishedHarmony National Sports Academy earlierthis year. The purpose of the Academy is tobenefit young talented athletes from mainlyhistorically disadvantaged communities inthe area. Regional and national sportsbodies, the Sports Trust, as well as thegovernment are involved in this project.
Harmony has a number of runningclubs in seven of the road-running regionsof South Africa which now have over 1 000members. Road-running is seen as a sportthrough which we can build relationshipsbetween individuals and communities inSouth Africa. The aim is to encourage,motivate and train young, upcoming athletesfrom all walks of life.
Harmony has been an official sponsorof the Comrades Marathon since April 2000.All the medals and statuettes have beenmasterly designed and manufactured byHarmony, in South Africa. The range ofinvestment bars and coins to commemoratethe running of the Comrades Marathon in aparticular year is also showcased at theevent.
During May 2003, ARMgold andHarmony hosted King Letsie III of Lesotho,at the company’s flagship operations, FreeGold. The event was graced by dignitariessuch as the Minister of Minerals and Energy,Ms Phumzile Mlambo-Ngcuka, the Premierof Free State Province, Ms Winkie Direkoand various executive mayors. At the event,ARMgold and Harmony announced a grantof R1 million towards education in Lesotho
through the Royal Education Fund. The Ikaheng Development Centre is a
small Black Economic Empowermentbusiness that supplies chicken to ourhostels. We provided half of the land to theproject and assisted with water reticulationand a low interest loan of R50 000. We alsoassisted in drawing up the Centre’sbusiness plan and have committedourselves to provide ongoing businesssupport. We believe that this project couldlead to the establishment of similarcommunity business centres beingestablished at all the mines.
4.6 OUR IMPACT ON SOCIETY
Black Economic EmpowermentHarmony is committed to the economicdevelopment of South Africa and its people.We continually strive to facilitateparticipation by historically disadvantagedSouth Africans in the mining industry.
Whilst the Mining Charter has itsprimary focus on creating opportunities fornew entrants in the mining sector, it alsorequires mining companies to determinemechanisms to assist with alleviatingpoverty in the regions in which they operate.
After the merger with ARMgold we nowcomfortably comply with the five-yearrequirement of 15% of our company beingowned by Historically Disadvantaged SouthAfricans.
We have re-assessed our policyregarding preferential procurement fromempowered suppliers. We have introducedand implemented a Black EconomicEmpowerment Policy to promoteentrepreneurship in local communities andgive emerging businesses access tomainstream business opportunities in themining industry. We concentrate ourempowerment efforts on suppliers of goodsand services in the manufacturing,construction and mining/extraction sectorsof the economy as well as on professionalconsulting services. Currently, 12% of our
4.5 OUR IMPACT ON THE COMMUNITY

Harmony Annual Report 2003 062
suppliers are empowered companies and22% of our service agreements are BEE-compliant. We will continue to increase thisduring the next year.
Application of BEE initiatives andbeneficiation
BeneficiationThe Mining Charter also requires miningcompanies to beneficiate the commoditiesthey produce and to allow for broaderparticipation by previously disadvantagedindividuals in these activities.
Musuku Beneficiation Project - based atHarmony’s Virginia RefineryThe project has been made possible byHarmony and mineral and metallurgyspecialist Mintek. We have been workingwith BAE Systems for more than three yearsto develop and implement a goldbeneficiation strategy to add value to theraw gold in South Africa while creating jobsand developing skills. The strategy is partof positioning Harmony as an innovativegold producer in the global precious metalsindustry and fulfiling its obligation in termsof the Mining Charter. We are the onlySouth African gold producer to refine andmarket our own gold. Our Virginia refinerycan produce in excess of 100 tonnes ofrefined gold per annum. A 20% equityshare of the project has been reserved foran empowerment partner and discussionswith a potential associate are currentlyunder way with an interested party.
Matjhabeng ProjectMatjhabeng, situated in the Free StateProvince, is one of government’s identifiedpoverty nodes. Following significant down-scaling of mining in the Free Stategoldfields, there is an urgent need for theregeneration of the economy and theMinerals and Petroleum ResourcesDevelopment Act establishes a frameworkfor meaningful participation by Harmony.
We have elected to play an anchor role toensure that the Free State goldfieldsbecome a major beneficiation centre. BothHarmony and the government arecommitted to enabling the establishment ofa beneficiation hub in Matjhabeng whichwill result in sustainable job creation, skillsdevelopment and transfer, empowerment oflocal communities and poverty alleviation.
South African Royal Manufacturers (SARM)During March 2003 a R20 million gold ropechain production facility was inaugurated inthe Free State. The South African RoyalManufacturers (SARM) plant is a joint effortinvolving Harmony, BAE Systems-Saab,South Africa’s Industrial DevelopmentCorporation (IDC), and the Department ofTrade and Industry (DTI). We provide goldwire and strip produced at our refinery andthe beneficiation facility to the factory, aswell as the building and housing in supportof the new business. The factory employs700 people and is an anchor project in theintegrated approach of government, thegold-mining sector and other stakeholders.
Harmony Jewellery SchoolIn addition to the RSAM project, we haveutilised foreign expertise and a localtraining programme to establish a range ofprofitable and pioneering jewelleryventures. These have created new jobs in aregion where job losses were the norm.
The Harmony Jewellery School hasbeen operating successfully sinceSeptember 2000. Emthuthwini JewelleryManufacturer uses local African designartists with little formal training to producejewellery for the export market.

063
Harmony endeavours to minimise theimmediate longer-term impact its operationshave on the environment. We areendeavouring to act responsibly as far asremediation of the environmental impactresulting from mining activities isconcerned. In order to implement ourpolicy, we commit to the following:� to conduct environmental impact
assessments when establishing newoperations;
� to monitor and audit environmentalprogress;
� to adopt the best affordable technologyto limit the impact on the environmentand minimise waste;
� to interact with all relevant authoritiesand all interested and affected parties;and
� to conform to environmental, health andsafety legislation.
We have integrated pollution control,waste management and rehabilitationactivities into our operating procedures.Each of our regions has a persondedicated to environmental matters who, inaddition to overseeing the implementationof the environmental managementprogrammes, monitors the impact of themining activities on the environment.
Based on current environmental andregulatory requirements, we accrue for theestimated rehabilitation expense whenmining commences and then amortisethese environmental rehabilitation costsover the operating life of a mine. We alsomake annual contributions to environmentaltrust funds created in accordance withSouth African statutory requirements, toprovide for the estimated cost of pollutioncontrol and rehabilitation during and at theend of the life of a mine. Estimates of theultimate rehabilitation liability are subject tochange as a result of future changes inregulations or cost estimates as well as tochanges to the estimated life of mine.
Environmental Management ProgrammeReports (EMPR)Pursuant to South African law, mineproperties must be rehabilitated uponclosure. We are required by law to submitEnvironmental Management ProgrammeReports, or EMPRs, to the Department ofMinerals and Energy. EMPRs identifyspecific rehabilitation issues for a mineand must also be approved by other SouthAfrican government departmentsincluding, but not restricted to, theDepartment of Water Affairs and Forestry.
South African OperationsEMPRs have been prepared andsubmitted for all of Harmony’s SouthAfrican operations that have permanentmining authorisations. With the exceptionof the Kalgold EMPR, these EMPRs havebeen approved. The Kalgold EMPR is inthe process of being approved. Theprocess of preparing and submittingEMPRs has strengthened the mutual co-operation and information sharing betweenus and the relevant governmentdepartments. We have, and will continueto meet, with the relevant governmentdepartments on a regular basis tocontinue the process and to ensure thatthe environmental impact of Harmony’smining operations are managed andmonitored in accordance with applicableregulatory requirements and industrystandards.
Bissett OperationsHarmony’s Bissett operations in Canadaoperate pursuant to a mining lease and anenvironmental licence. While the licencehas no term, it may be revoked,temporarily or permanently, should Bissettfail to comply with the terms of the licence,which include maintaining the facility. Wedo comply with the terms of the licence.The lease, however, has a term of 21 years,commencing 1 April 1992.
4.7 ENVIRONMENTAL SUSTAINABILITY

Harmony Annual Report 2003 064
Australian OperationsOur Australian operations must complywith mining lease tenement conditions setby the Department of Minerals and Energy,the Mining Act (1978), the Department ofEnvironmental Protection’s operatinglicences, and water abstraction licensesissued by the Water and Rivers commissionfor each of its sites. The operations mustalso comply with numerous environmentalacts and bills. As a result, we must makeprovisions for mining rehabilitationwhenever mining commences at a new sitein Australia. While we believe that ourcurrent provision for compliance with suchrequirements is reasonable, any futurechanges and development in Australianenvironmental laws and regulations mayaffect our Australian operations.
In Western Australia, under the MiningAct (1978), all tenements are covered byenvironmental performance bonds thatcannot be relinquished or completedwithout the approval of the AustralianDepartment of Mineral Resources. Theseare re-assessed on an annual basisfollowing the issuing of an annualenvironmental report and generally areaudited by the regional inspector. As areasare successfully rehabilitated and approvalis obtained, the bond requirement isreduced, and as greater areas aredisturbed, the bond requirement increases.Any new aspects of the operation are alsoassessed and the bond is established priorto approval and subsequent commencementof operations.
Audits are generally conducted on a bi-annual basis by the Australian Departmentof Environmental Protection to determinecompliance with the relevant operatinglicence(s). There are no outstanding majornon-compliance issues, neither against New Hampton’s licence nor Hill 50’s.
Bendigo operates tenements grantedunder the Victorian Mineral ResourcesDevelopment Act (1990), administered bythe Department of Natural Resources and
Environment. Operations that involve adeliberate discharge to the environment aresubject to the Victorian EnvironmentProtection Authority. Conditions attached toapprovals include requirements forenvironmental management, monitoring andprotection. While Bendigo has madeallowances for the expected costs ofcomplying with these conditions, any futurechanges and development in Australianenvironmental laws and regulations mayaffect these costs.
Water pollutionThe primary environmental focus at most ofour operations is water management withthe objective to ensure that it is of a qualityfit for use by downstream users.
All water uses are now being licenced,and we have submitted water-useregistrations as required by the NationalWater Act of 1998. We have also developedwater management plans for all of ourSouth African operations.
Air pollutionAn environmental surveillance system hasbeen implemented at slimes dams at ouroperations to monitor dust generation andfall-out in residential and other areas. Thiswill assist in future dust suppression andthe design and measurement ofrehabilitation programmes.

SECTION 5
CORPORATE GOVERNANCE5.1 PAGES 67-72
DIRECTORATE5.2 PAGES 73-75
EXECUTIVE MANAGEMENT5.3 PAGE 76
INTRODUCTION5.4 PAGES 76-80
BOARD OF DIRECTORS5.5 PAGES 80-81
BOARD COMMITTEES5.6 PAGES 81-82
RISK MANAGEMENT5.7 PAGES 82-91
POTENTIAL RISKS ASSOCIATED WITH INVESTING IN HARMONY5.8 PAGE 91
CODE OF ETHICS5.9 PAGE 91
CODE OF CONDUCT5.10 PAGE 91
RESTRICTIONS ON SHARE DEALINGS5.11 PAGES 91-92
INTERNAL CONTROL AND INTERNAL AUDIT5.12 PAGE 92
WORKER PARTICIPATION5.13 PAGE 92
INFORMATION MANAGEMENT5.14 PAGE 92
SECTION 302 OF THE SARBANES-OXLEY ACT OF 20025.15 PAGE 95
DIRECTOR’S RESPONSIBILITY STATEMENT5.16 PAGE 95
INDEPENDENT AUDITORS’ REPORT5.17 PAGES 96-98
DIRECTORS’ REPORT
CONTENT

SECTION 5
CORPORATE GOVERNANCEIN OTHER WORDSIn as much as the worldwide move towardsstricter governance and more transparency islaudable, it can never substitute for honesty,fairness and responsibility in how we do ourbusiness. We have a strong independentboard and a very good mix of experience andyouth at executive level.
We endeavour to comply, not only with the letter of governance guidelines, but also withthe spirit they contain.
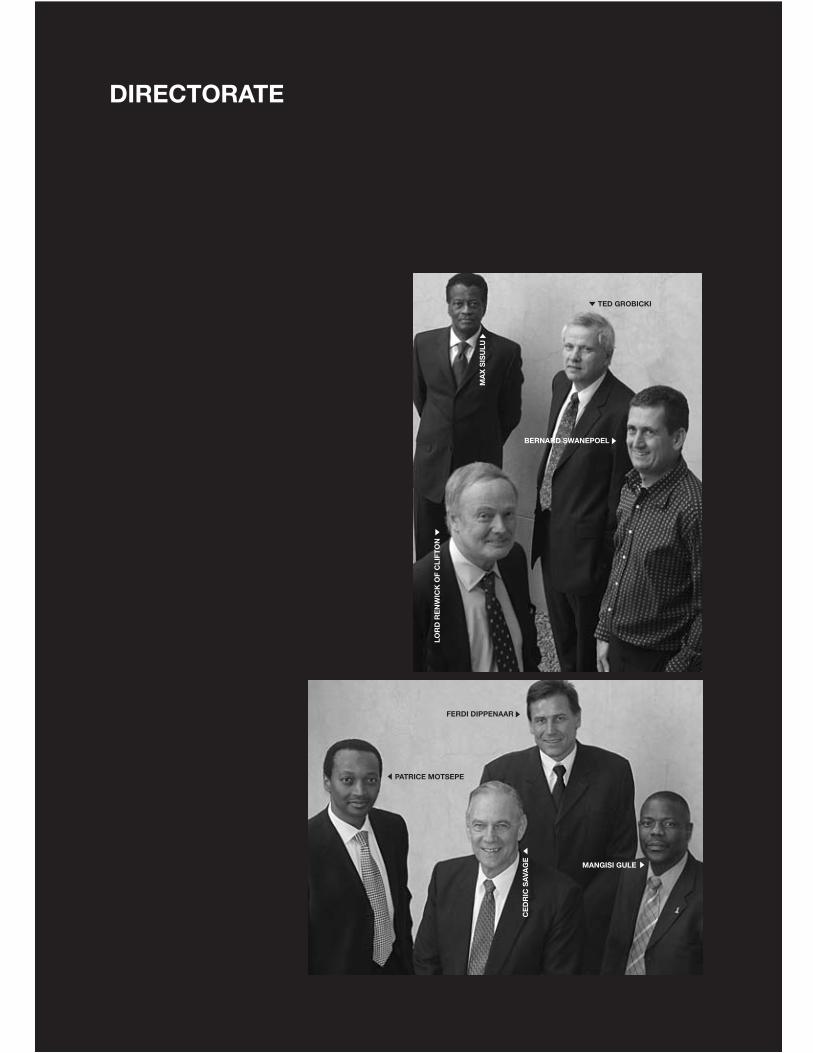
DIRECTORATE
MA
X S
ISU
LU
LOR
D R
EN
WIC
K O
F C
LIFT
ON
TED GROBICKI
BERNARD SWANEPOEL
FERDI DIPPENAAR
PATRICE MOTSEPE
CE
DR
IC S
AVA
GE
MANGISI GULE

DAN SIMELANE
AN
DR
É W
ILK
EN
S
PIETER TALJAARD
FRA
NK
AB
BO
TT
MIKE PLEMINGS
IMO
LU
SH
AB
A
NOLITHA FAKUDE
MICHAEL KING
RE
JOIC
E S
IME
LAN
E
MA
NA
NA
BA
KA
NE
-TU
OA
NE
SIBUSISO SIBISI

Board of Directors
PATRICE MOTSEPE (41)Non-executive ChairmanBA - Legal, LLBPatrice Motsepe was a partner specialisingin mining and business law at BowmanGilfillan Inc, a South African law firm. Healso spent approximately ten months withMcGuire Woods LLP, a law firm inRichmond, Virginia, USA and thereafter, hewas employed as their legal consultant inSouth Africa. In 1994, he founded FutureMining (Proprietary) Limited which grewrapidly to become a competitive contractmining company. He was senior vice-president of the Chamber of Mines and is a“Global Leader of Tomorrow” asdesignated by the World Economic Forum(WEF) and is a member of NEDLAC.
BERNARD SWANEPOEL (42)Chief Executive BSc - Mining Engineering, BCom (Hons)Bernard Swanepoel started his career ingold mining at Grootvlei in 1983. He spenttime on various Gengold operationsincluding Kinross (Evander) and Barberton.He then moved into senior managementwith the Gengold group, culminating in hisappointment as general manager and adirector of Beatrix Mines in 1993. He joinedRandgold in 1995 as managing director ofHarmony and has led the team responsiblefor making the company the fifth largestindependent gold producer in the world.
DR. MANANA BAKANE-TUOANE (55)Non-executive Director PhD, BA, MADr. Bakane-Tuoane has extensiveexperience in the economic disciplines aslecturer and professor at the University ofFort Hare, Eastern Cape. She has heldvarious senior management positions in thepublic service and currently holds the postof director general in the North-WestProvincial Government. Dr. Bakane-Tuoanewas appointed to the Advisory board of theAfrican Economic Research Consortium,Nairobi, Kenya, in 2000.
NOLITHA FAKUDE (39)Non-executive Director BA, BA (Hons) Nolitha Fakude is the managing director ofthe Black Management Forum (BMF). Herrole involves stakeholder management,policy formulation and advocacy work onissues of Black Economic Empowermentand organisational transformation.
Nolitha was a group human resourcesmanager for retail at Woolworths, as well ashead of corporate affairs, which included,amongst others, Communication andCommunity Affairs. She serves on variousboards including, BMF InvestmentCompany, Harmony, The People’s Bank,Business Partners as well as the WheatTrust. Nolitha was recently appointed by theGauteng MEC for Economic Affairs as oneof the Rainmakers for the Blue IQ project.
MICHAEL KING (66)Non-executive DirectorCA (SA), FCAMichael King served articles with Deloitte,Plender, Griffiths, Annan & Co. (nowDeloitte & Touche) and qualified as aChartered Accountant (SA). He laterbecame a Fellow of the Institute ofChartered Accountants in England andWales (FCA).
He joined Anglo American Corporation ofSouth Africa as a manager in the financedivision. In 1979, he became director ofAnglo American Corporation and in 1980an executive director and head of itsfinance division. In 1997, he was appointedexecutive deputy chairman of AngloAmerican Corporation. He was theexecutive vice-chairman of AngloAmerican plc, in May 1999, until hisretirement in May 2001.
SIMO LUSHABA (37)Non-executive Director BSc (Hons), MBASimo Lushaba started his career at theUniversity of Zululand in 1988 as aresearch technician. In 1990 he joinedSouth African Breweries and two yearslater National Sorghum Breweries where heserved as divisional executive. In 1995Simo was appointed by Spoornet. Heserved the company for the next sevenyears in various managerial positions andultimately as the general manager for Railand Terminal Services.
069
5.1 HARMONY DIRECTORATE

In April 2002, Simo was brought into RandWater as chief executive drive bothbusiness and social transformation in theorganisation which included internalrestructuring, focusing on creating acustomer driven organisation, as well asnew business opportunities both in SouthAfrica and internationally. Simo also servesas non-executive chairman of PIKITUPJohannesburg (Pty) Ltd and as a non-executive director of Trans-Caledon TunnelAgency (TCTA).
MIKE PLEMING (67) Non-executive DirectorPr Eng FIMMMike Pleming started his career in miningengineering on the Zambian Copperbelt.He joined Trans Natal (now Ingwe) in 1975as general manager, Optimum Collieriesand was later appointed project managerand consulting engineer. He joined LibertyAsset Management in 1982 where he wasresponsible for mining investmentresearch. He retired in 1995 and has sincethen undertaken a series of mininginvestment related assignments. FollowingHarmony’s acquisition of Evander in 1998,he joined the company as a non-executivedirector. He is also a director ImpalaPlatinum Holdings Limited. Mike alsoserves as a non-executive director ofHighland Gold Limited.
LORD RENWICK OF CLIFTON KCMG (65)Non-executive Director Having formerly served as BritishAmbassador to South Africa and theUnited States, Lord Renwick is vice-
chairman, Investment Banking ofJPMorgan plc. He is also chairman of FluorLtd and serves on the boards of a numberof other public companies including BritishAirways, SABMiller plc and Richemont.
CEDRIC SAVAGE (64)Non-executive DirectorBSc Eng, MBA, ISMPCedric Savage commenced his career inthe United Kingdom in 1960 as a graduateengineer with Fairey Aviation and in 1963returned to South Africa where he workedin the oil (Mobil), textile (Felt & Textiles) andthe chicken (Rainbow Chickens Limited)industries. In 1993/1994, he was appointedpresident of the South African Chamber ofBusiness. He has also served as chairmanof the board of Governors on the NatalUniversity Development Foundation and asa member of Council of the University ofNatal. He joined the Tongaat-Hulett groupin 1977 as managing director of TongaatFoods and thereafter progressed toexecutive chairman of the BuildingMaterials Division, chief executive officer ofThe Tongaat-Hulett group Limited in 1991and in May 2000, he assumed the dualroles of chief executive officer andexecutive chairman.
DR. SIBUSISO SIBISI (48)Non-executive DirectorBSc (Hons), PhDDr. Sibisi’s working career commenced in1983 in the software development industrywith MEDC Limited, Cambridge, UK. Hiscareer developed to that of SystemsEngineer at IBM (SA), lecturer and senior
lecturer (Wits) and deputy vice-chancellorfor research (University of Cape Town). Hespent 1988 as a Fulbright Fellow at theCalifornia Institute of Technology where hecollaborated with eminent researchers incomputational chemistry and thedevelopment of associated medicaldiagnosis tools. In 1989, he took up aresearch position at Cambridge where heconsolidated his academic research inmathematical modelling and computationalsimulations to environmental, geophysicaland biomedical problems to developsolutions. This evolved to the formation of astart-up company dedicated to providingconsulting services to Glaxo, Welcome,Fisons, Shell and Mobil. He entered thecorporate world in 1997 as executivedirector of Plessey (SA). As chairperson ofthe National Advisory Council onInnovations, he is involved in makingrecommendations on research andinnovation policy to the government.
DR. REJOICE SIMELANE (51)Non-executive DirectorBCom, MCom, PhDDr. Simelane’s career commenced as alecturer at the University of Swazilandwhere she lectured from 1978 to 1997. Shethen joined the Department of Trade andIndustry as a macro-economist and laterjoined the National Treasury as a micro-economist before joining the PremiersOffice in the Mpumalanga Province as anEconomic Advisor.
Harmony Annual Report 2003 070

071
MAX SISULU (58)Non-executive Director MPA, MSc Max Sisulu is the current deputy chiefexecutive officer at Denel, a post he hasheld since November 1998. From 2001 to2003 he was the chairperson of the SouthAfrican Aerospace, Maritime and DefenceIndustries. He is also a council member ofthe Human Sciences Research Counciland a member of the Premier of the FreeState’s Economic Advisory Council.
From 1977 to 1981 Max served as the ANCrepresentative in Hungary. In January 1995he was elected to the National ExecutiveCommittee and National Working Committeeof the ANC. From 1986, he helped establishthe ANC economics department and wasinstrumental in developing the ANC’seconomic policy. In 1990 he spearheadedthe drafting of the ANC’s first policystatement on the environment.
From 1992 to 1993 Max completed aMasters degree in Public Administration atthe Kennedy School of Government atHarvard University in the United States. InSeptember 1993 he took up the post ofdirector of the National Institute ofEconomic Policy until he became amember of parliament in 1994.
FRANK ABBOTT (48) Executive Director BCom, CA (SA), MBLFrank Abbott joined the Rand Mines/BarlowRand group in 1981, where he obtainedbroad financial management experience at
operational level. He was appointed asfinancial controller to the newly formedRandgold in 1992 and was promoted tofinancial director of that group in October1994. Until 1997, he was also a director ofthe gold mining companies Blyvooruitzicht,Buffelsfontein, Durban Roodepoort Deepand East Rand Proprietary Mines and anon-executive director of Harmony, whichculminated in his appointment as financialdirector of Harmony in the same year.
FERDI DIPPENAAR (42)Executive Director BProc, BCom, MBAFerdi Dippenaar started his career atBuffelsfontein gold mine in 1983 and tookhis degrees through part-time study whileemployed in various financial andadministrative capacities at Gengoldmines. In 1996 he became managingdirector of Grootvlei and of East RandProprietary Mines. Following Harmony’sacquisition of Grootvlei and Cons Modder,he was appointed marketing director ofHarmony in 1997. He oversees Harmony’srefinery and direct marketing activities, aswell as the company’s investor relationsprogramme.
TED GROBICKI (54) Executive Director BSc (Hons), MSc, PrSciNat, FIMMAfter fulfiling various roles within miningand exploration companies in South Africa,Namibia and Zimbabwe, Ted Grobicki wasappointed chief executive of Texas Gulf IncSouth Africa in 1979. He has since servedat a senior executive level in a wide range
of public and private companies in themining sector, and was appointed as non-executive director of Harmony in 1994.With Harmony’s merger with Kalgold andWest Rand Cons. in 1999, he wasappointed as executive director focusingon new business. Ted has 30 years’experience in all aspects of the miningindustry, including exploration, evaluation,development, mine management andfinancial and corporate management. Heoversees Harmony’s Australian operations.
MANGISI GULE (51)Executive Director BA, BA (Hons)Mangisi Gule has 23 years’ experience intraining and human resources and is amember of the Association of Mine HumanResource Practitioners. He oversees thecompany’s human resources andcommunication activities.
DAN SIMELANE (40)Executive Director BA, LLB, LLM Dan Simelane has seven years’ legalexperience and acted as legal advisor toAvmin Limited and the SwazilandElectricity board. He has extensive taxexperience and was a senior tax consultantwith Arthur Andersen.
PIETER TALJAARD (54)Executive Director BCom, B Lur, ACMAPieter Taljaard has 33 years’ experience incommerce, 25 of which have been in themining industry. His mining career

Harmony Annual Report 2003 072
commenced in 1977 with Gencor Limited(“Gencor”), where he worked as a seniormanager in the finance department. Hewas subsequently appointed as adirector/alternate director to a number ofcompanies controlled by Gencor. He wasinstrumental in creating the tax structurebetween Buffelsfontein and Beatrix andformed part of a team that investigatedand recommended future managementinformation systems at Gengold Limited,subsidiary of Gencor. Pieter also chairedthe committee responsible forimplementing systems at Gengold. Hejoined ARMgold in 1997 as financialdirector.
ANDRÈ WILKENS (54)Executive Director RM, IIA, MDPAndrè Wilkens has 33 years’ mining experi-ence. He commenced his career in 1969 asa trainee miner. He was then promoted tomine manager at the Vaal Reefs West minein 1994 and appointed mine manager ofthe Vaal Reefs South mine in 1996. Beforejoining ARMgold in 1998, he served asmanager of North Operations (Vaal Reefs)and the managing director of Naledi MiningServices, then a wholly-owned subsidiary ofVaal Reefs. André has a successful miningand management track record of turningaround marginal mines into profitable units.He also played a leading role in determin-ing new operating methods for SouthAfrican mines. André was appointed chiefexecutive officer of African RainbowMinerals Gold in 1998, a position he hasheld until the merger with Harmony.

EXECUTIVE MANAGEMENT
FERDI DIPPENAAR
AN
DR
EW
MA
TU
BE
KHETIWE McCLAIN
MA
NG
ISI G
ULE
DA
WIE
MO
ST
ER
T
ABRE VAN VUUREN
BO
ET
IE S
WA
NE
PO
EL
FRANK ABBOTT
TRACEY JONKHEID
BE
RN
AR
D S
WA
NE
PO
EL
LEW
IES
FO
UR
IE

PIE
TE
R T
ALJ
AA
RD
DAN SIMELANE
FLE
UR
PLI
MM
ER
AMANDA MATTHEE
AN
DR
É W
ILK
EN
S
PHILIP KOTZE
YU
SU
F JA
RD
IEN
PE
TE
R M
cKE
NN
A
VAUGHAN ARMSTRONG
FRA
NK
SU
LLIV
AN
PETER STEENKAMP
GR
AH
AM
BR
IGG
S
SE
MB
IE D
AN
AN
A
JACKIE MATHEBULA
KHOSI NDLOVU
PINE PIENAAR
MOHAMED MADHI
ABSENT BOB ATKINSON AND TED GROBICKI

075
Name Portfolio Age QualificationsFrank Abbott Financial Director 48 BCom, CA (SA), MBLVaughan Armstrong Exploration 49 BSc (Hons), PhDBob Atkinson Business Coaching 51 NHD, Mine Managers CertificateGraham Briggs Organic Growth 50 BSc (Hons), PrSciNatSembie Danana Safety Transformation 45 B. Journalism, BA (Hons), MBAFerdi Dippenaar Marketing and Investor Relations 42 BProc, BCom, MBALewies Fourie Business Engineering 54 NHD, Mine Managers Certificate, MDPTed Grobicki Australia 54 BSc (Hons), MSc, PrSciNat, FIMMMangisi Gule External Liaison 51 BA (Hons)Yusuf Jardien Information Technology 39 ICSA, PMDTracey Jonkheid Internal Strategy 33 BA Communication (Hons), MBAPhilip Kotze Business Coaching 43 NHD, GDE, MDP, DPLRMohamed Madhi Corporate Strategy 38 B.Eng, MSC.Eng, MBAJackie Mathebula Employee Relations 34 B Admin (Hons), MBAAndrew Matube Legal 57 BA, LLB Amanda Matthee Finance 44 BCompt, BCom (Hons),CA(SA), AEPKhetiwe McClain Beneficiation and the Social Plan 39 BA Fine ArtsPeter McKenna International New Business 52 BSc (Hons), PrSciNatDawie Mostert Human Resources Manager 34 PDM, PCM, MDP, DPLRKhosi Ndlovu Corporate Affairs - Government 44 BAFleur Plimmer Transformation Management 34 BA (Hons)Pine Pienaar SA New Business 39 BCom, BCompt, (Hons), CA (SA) Dan Simelane Business Development 40 BA, LLB, LLM Peter Steenkamp Business Coaching 43 BSc (Eng), Mine Managers CertificateFrank Sullivan HIV/AIDS and Health 47 MCom, EMPBernard Swanepoel Chief Executive 42 BSc (Eng), BCom (Hons)Boetie Swanepoel Operational Finance 42 BCompt (Hons), CA (SA)Pieter Taljaard Executive Director, Finance 54 B Com, B Lur, ACMAAbré van Vuuren Human Resources Processes 42 BCom, MDP, DPLRAndré Wilkens Chief Operating Officer 53 RM, IIA, MDP
5.2 HARMONY EXECUTIVE MANAGEMENT

Harmony Annual Report 2003 076
The King II Report (King II) becameoperative in March 2002 and goes beyondfinancial and regulatory aspects ofcorporate governance in that it advocatesan integrated approach by includingprinciples of sound social, ethical andenvironmental practice. This includes a shiftin focus from the "single bottom line" i.e.financial, towards the "triple bottom line"approach, namely economic, social andenvironmental reporting. Furthermore, KingII places major emphasis on enterprise riskmanagement as the cornerstone of internalcontrols and, in directing its focus thereon,states that risk goes to the very essence ofan organisation’s ability to meet itsobjectives and sustain its existence.
The Harmony board of directors (“theboard”) are aware of all the onerous duties,responsibilities and personal liabilities whichare imposed on them as directors underboth common and statutory law, not only inSouth Africa, but also in the US, Australiaand the UK, due to its operations in thesecountries and its listings in South Africa,London, Paris, Brussels, Berlin and NewYork. In addition to King II, the SarbanesOxley Act of 2002 (“SOx”), applicable tonon-US companies which trade securities inthe US, imposse additional prohibitions andresponsibilities on all directors withinHarmony.
To ensure compliance with thenumerous legal requirements and to showour commitment to Corporate Governance,we have adopted formal charters for theboard and each of its committees to giveclear guidance to all our board membersand employees on how governance shouldbe put into practice. These charters werecompiled in a way which enables us toachieve a balance between performanceand conformance of Corporate Governanceprinciples. We aim to adhere to theprovisions and recommendations of theKing Report and therefore these charterswill be reviewed, updated and maintainedon an on-going basis.
In addition to acting in good faith andwith due diligence and care, our boardsupervises and monitors management toensure that good Corporate Governance ispart of doing business the Harmony Way!
Board StructureHarmony has a unitary board structure,comprising 19 directors, with a balancebetween executive and non-executivedirectors. We have ten independent non-executive directors, which includes ourchairman. We have nine executive directorsand no shadow directors. The non-executive and independent directors are ofsufficient calibre and number for their viewsto carry significant weight in the board’sdecisions. In considering new appointmentsto the board, we have taken cognisance ofthe gender and racial mix and we believethat we have achieved an acceptablebalance of members on our board.
The details of our directorate are set outon pages 69 to 72.
Chairman and Chief ExecutiveThe roles of chairman and chief executiveare not vested in the same person and theirperformances are subject to review by theRemuneration Committee at least once ayear.
Board CharterThe board’s fiduciary duties areincorporated in Harmony’s Board Charter,which sets out the purpose and role of theboard, its responsibilities, its authority,composition, meetings and self-assessment.The Board Charter stipulates that Harmonydirectors have to exercise leadership,enterprise, integrity and judgement basedon fairness, accountability, responsibilityand transparency.
The responsibility to ensure that wecomply with all the relevant laws, regulationsand codes of best business practice vestsin our board. For this purpose the board hasdirect access to the advice and services ofthe company secretary and they are alsoentitled to seek independent professionallegal advice about Harmony’s affairs at thecompany’s expense.
The board is also responsible foridentifying the principal risks and keyperformance indicators of Harmony’sbusinesses and ensuring theimplementation and regular evaluation ofsystems to manage those risks through theAudit Committee. Strategies are developed
SECTION 5CORPORATE GOVERNANCE
5.3 INTRODUCTION 5.4 BOARD OF DIRECTORS

One day I’m talking strategy with the execand the next day I’m sitting withmineworkers discussing their sex issues.”
“

The residual problem with HIV/AIDS is that it’s about things notnormally discussed: sex issues. But it’s a controllable chronic diseaseand that’s what brings us to the Healthy Living campaign which isall about personal responsibility. I tell guys that the company cangive you houses and a 5-star meal but at the end of the day we’reall faced with choices. The laws of sex are not determined by thecompany.
If Harmony wasn't doing the right thing about HIV/AIDS I wouldn'tbe here. It’s trailblazing stuff. And what makes it work is the accessibilityand support of people who matter. As for me, there’s ample opportunityto reach my full potential. But it’s young days yet.
My job is the most important in the company! Well, it's certainlythe most exciting. One day I’m talking strategy with the exec and thenext day I’m sitting with mineworkers discussing their sex issues. Ibring stakeholders together – people with different agendas. Wewouldn’t be able to move without their buy-in.
A regular doctor wouldn't get to do the things I do. Everything Icould have wanted has come together in this job – it’s the perfectexample of multi-skilling.
It's a job with huge responsibility. But it's not about me. It's aboutthe HIV positive people who let you into their lives. Without theseinsights we wouldn't know what to prioritise. A doctor’s responsibilityis to find out what the patient expects – treatment is a mind-game– help is not help until it is perceived as such.
TEN PEOPLE. ONE STORTEN PEOPLE. ONE STORYY..NameZandile MokgatleTime at Harmony2 yearsWorks atSt. Albert HospitalStarted asDoctorPosition todayMedical OfficerHIV Projects

079
Meetings
A R Fleming (Chairman) P P P A
Z B Swanepoel P P P P
F Abbott P P P P
F Dippenaar P P P P
T S A Grobicki P P P P
T A Mokhobo P A P P
Lord Renwick of
Clifton KCMG P P P P
M F Pleming P P P P
J G Smithies P P P P
V N Fakude* - P P P
D S Lushaba* - P P P**
APRIL2003
AUGUST2002
OCTOBER2002
JANUARY2003
P Present
A Apology received
* Newly appointed on 14 October 2002
** Meeting chaired by DS Lushaba
DIRECTOR
in such a way that our purpose is achieved,our values implemented and ourshareholders and other stakeholders aresatisfied. The board also acceptsresponsibility for monitoring and supervisingexecutive management and the induction ofnew or inexperienced directors. Our non-executive directors also have access tomanagement should they wish to discussany matter separate from the executivedirectors. An induction programme waspresented for non-executive directors inearly December 2002. We are dedicated toensure that our directors are familiar withHarmony’s operations, its businessenvironment and their fiduciary duties andresponsibilities.
Internal controlThe board is ultimately responsible forensuring that Harmony remains a goingconcern and that it thrives. The boardretains full and effective control overHarmony by monitoring and supervising itsexecutive management, being involved inall material decisions affecting Harmonyand ensuring that adequate systems offinancial and operational internal controlsare monitored. The procedures and systemswhich act as checks and balances on theinformation are reviewed by the board fromtime to time. An adequate budgeting andplanning process exists and performanceis monitored against these budgets andplans.
Self-assessmentThe board conducts a self-assessment orself-evaluation annually. The chairmanassesses the performance of the individualboard members and the members evaluatethe chairman, based on several factors,which include expertise, inquiring attitude,objectivity and independence, judgement,understanding of Harmony’s business,understanding and commitment to theboard’s duties and responsibilities,willingness to devote the time needed toprepare for and participate in committeedeliberations, timely responses andattendance at meetings.
In keeping with good corporategovernance, the board has agreed that aNomination Committee should assist in the
evaluation of the board members. Nomembers have been appointed to theNomination Committee as yet, butnominations will be submitted to the boardonce the new Harmony board has beenelected.
MeetingsThe board meets at least four times a year.The number of meetings held during aperiod is sufficient to ensure that the boardmeets its objectives, and all members arerequired to attend all meetings. Dates ofmeeting are planned annually in advance.
Table 1 gives an indication of ourdirectors’ commitment to attend boardmeetings.
Directors’ terms of employmentExecutive DirectorsOur executive directors have standardemployee service agreements, and none ofour executive directors may give notice ofless than one month. Their employmentletters also do not make provision for pre-determining compensation on terminationof an amount which equals or exceeds oneyear’s salary and benefits in kind. Theexecutive directors have waived theirrights to directors’ fees. Executivedirectors participate in the company’sshare scheme and a discretionaryExecutive Profit Share Scheme, providedthat in respect of the latter, certain profittargets (set by the RemunerationCommittee) are achieved. The executivedirectors also benefit from pensioncontributions, life insurance and medicalaid, the value of which is included underthe remuneration details on pages 97 to 98or under “Directors’ Report”.
The number of share options held bythe executive directors during the financialyear are detailed in the Director’s Reporton pages 97 to 98.
Non-executive DirectorsNone of the non-executive directors haveservice contracts with Harmony. The non-executive directors are entitled to fees asagreed at Harmony’s annual generalmeeting, reimbursement of out-of-pocketexpenses incurred on the company’sbehalf, and remuneration for other
table 1

Harmony Annual Report 2003 080
services, such as serving on committees.Currently, each non-executive director isentitled to R25 000 per quarter.
To our knowledge, none of thecompany’s directors, or their families, hadany interest, direct or indirect, in anytransaction during the last financial year orin any proposed transaction with anycompany in the Harmony group which hasaffected or will materially affect thecompany or its investment interests orsubsidiaries.
RotationThe Articles of Association of Harmonyprovide that the longest serving one-thirdof directors retire from office at eachannual general meeting. Retiring directorsmaking themselves available for re-electionare re-elected at the annual generalmeeting at which they retire.
5.5 BOARD COMMITTEES
To enable the board to properly dischargeits onerous responsibilities and duties,certain responsibilities have beendelegated to board committees. Thecreation of committees does not, however,reduce our board’s overall responsibilityand therefore all committees must reportand make recommendations to the board.All our board committees are chaired by anindependent non-executive director.
The various board committees are asfollow:
Audit CommitteeHarmony’s Audit Committee providesadditional assurance to the boardregarding the quality and reliability offinancial information used by the boardand the financial statement issued by thecompany. The committee assists the boardin the discharge of its responsibilities withregard to safeguarding our assets,maintenance of accounting records andmaintenance of an effective system ofcontrol. An Audit Committee Charter hasbeen established which sets out the role,responsibilities, duties, authority,membership and meetings of the AuditCommittee. All non-audit services
provided by our external auditors must be,and are, pre-approved by the AuditCommittee.
The Audit Committee meetsperiodically with Harmony’s external andindependent internal auditors andexecutive management to reviewaccounting, auditing and financialreporting matters so as to ensure that aneffective control environment ismaintained. The committee also monitorsproposed changes in accounting policy,reviews the internal audit function anddiscusses the accounting implications ofmajor transactions. In terms of SOx theAudit Committee is directly responsible forthe appointment, compensation andoversight of any auditor employed by thecompany.
All members of the committee areknowledgeable about company affairs andhave a working familiarity with finance andaccounting practices. Certain members ofmanagement also attend the AuditCommittee meetings to answer anyquestions posed by members. The AuditCommittee always has at least onefinancial expert present during meetings.
The members of the Audit Committeefrom 1 July 2002 to 25 January 2003 were:AR Fleming (chairman)*MF Pleming*JG Smithies**Independent non-executive
These members attended the threemeetings held in the first three quarters ofthe year. It was decided that Mr AR Fleming,in his capacity as chairman, effectivelyserved on all board committees and that heshould not hold a formal seat on any of thecommittees. Mr AR Fleming resigned aschairman of the Audit Committee on 25January 2003 and Mr DS Lushabaaccepted membership of the committee.
The members of the committee from 26 January 2003 to 30 June 2003 whoattended the meeting that was held on 24 April 2003 are:MF Pleming (chairman)*DS Lushaba *JG Smithies**Independent non-executive
Nomination CommitteeIn terms of the requirements of King II, aNomination Committee is required to ensurethat the procedures for appointments to theboard are formal and transparent, bymaking recommendations to the board onall new appointments. A Nomination Charterhas already been drafted and will bereviewed and finalised once the members ofthe committee have been appointed. Thecommittee will consist of at least threemembers, of which the majority will be non-executive. The Nomination CommitteeCharter which sets out the role andresponsibilities of the NominationCommittee, has already been approved bythe board, but will only be implemented inthe next financial year.
Remuneration CommitteeThe Remuneration Committee meets at leastonce a year and comprises threeindependent non-executive directors. Theprimary purposes of the RemunerationCommittee are to ensure that the group’sdirectors and senior executives are fairlyrewarded for their individual contributions toHarmony’s overall performance, todemonstrate to all stakeholders that theremuneration of senior executive membersare set by a committee of board memberswho have no personal interest in theoutcomes of their decisions, and who willgive due regard to the interests of theshareholders as well as the financial andcommercial health of Harmony. TheRemuneration Committee’s primaryobjectives are to serve as a party to monitorand strengthen the objectivity and credibilityof Harmony directors’ and senior executives’remuneration system and to makerecommendations to the board onremuneration packages and policiesapplicable to directors.
The committee meets whenever it isnecessary to make recommendationsrelating to the remuneration of seniorexecutives and executive directors. Onlyone meeting was held during the firstquarter of the 2003 financial year, duringwhich all the members were present. ARemuneration Committee Charter has beenadopted which sets out the objectives, role,responsibilities, authority, membership and

081
meeting requirements of the committee.The members of the committee are:AR Fleming (chairman)*JG Smithies*MF Pleming**Independent non-executive
Health, Safety and the EnvironmentalAudit CommitteeThe Health, Safety and Environmental AuditCommittee (HSE) monitors health, safetyand environmental performance andmakes recommendations to the boardwhere it deems particular attention isrequired. The committee operates inaccordance with specific terms ofreference confirmed by the board. Thecommittee meets periodically andcomprises three independent non-executive directors.
The members from 1 July 2002 to24 January 2003 were:MF Pleming (chairman)*AR Fleming*JG Smithies**Independent non-executive
All the members attended the threemeetings held in the first three quarters ofthe year. It was decided that Mr AR Fleming, in his capacity aschairman of Harmony, effectively served onall board committees and that he shouldnot hold a formal seat on any of thecommittees. Mr AR Fleming resigned fromthe HSE Committee on 25 January 2003and Ms VN Fakude accepted membershipof the committee.
The members from 26 January 2003 to30 June 2003 who attended the fourthmeeting held on 24 April 2003 were:JG Smithies (chairman)*MF Pleming*VN Fakude**Independent non-executive
Company SecretaryHarmony’s company secretary plays apivotal role in the achievement of goodcorporate governance and the board hasempowered her accordingly. The companysecretary supports the chairman inensuring the effective functioning of theboard, provides guidance to the chairman
and the board and the directors ofHarmony’s subsidiaries on theirresponsibilities and duties within theprevailing regulatory and statutoryenvironment, provides the board withguidance as to how they can, in the bestinterest of the company, discharge theseresponsibilities and duties, and isexpected to and does raise matters thatmay warrant the attention of the board.
Mr FW Baker, who served as companysecretary of Harmony since 1997, retiredfrom his position on 29 November 2002and Ms MP van der Walt was subsequentlyappointed on 3 February 2003.
Executive CommitteeThe members of Harmony’s executivemanagement are set out in the sectionmarked “Harmony ExecutiveManagement”, page 75.
The executive consists of the followingteams, which meet once a month.
Internal Transformation - Any internalimprovement initiative (such as:performance management, productivity,employment equity) forms part of thisagenda.
Operational Trendspotting - This teamidentifies and monitors shaft issues thatrequire specific attention.
External Transformation - The focus is onsustainable development, the legalframework and the Mining Charter.
Organic Growth - Opportunities withinHarmony, such as the shaft projects andcapital projects, are discussed at thisforum. The life-of-mine plans are alsomonitored by this team.
New Business Growth - New businessopportunities and new business strategiesare discussed at these meetings.
5.6 RISK MANAGEMENT
The focus of risk management is toidentify, assess manage and monitor allknown forms of risk across all businessunits. We endeavour to minimise operating

Harmony Annual Report 2003 082
risk by ensuring that the appropriateinfrastructure, control systems and peopleare in place throughout the company.
Harmony’s operations are subject tothe provisions of numerous South AfricanActs and the regulations promulgatedthereunder, the principal acts being theMinerals Bill and the Mine Health andSafety Act. The provisions of these actsand regulations require that extensive andwell-managed risk control initiatives are anintegral part of our operations.
The objective of our risk managementprogramme is to minimise our business riskby safeguarding our assets and revenue,as well as procure insurance for thoseevents beyond the control of management.A Risk Register has been implemented todetermine the material risks to whichHarmony may be exposed. Monitoringprocesses are currently being revised toensure that these risks are prioritised, todirect the audit effort and to determine theskills required to manage these risks.
Action plans have been developedand prioritised to minimise the risks to anacceptable level. For example, a toll-freeline for whistle-blowing was introducedand open communication betweenemployees and management isencouraged. The monitoring and reportingof this process also forms an integral partof risk management.
We have a succession plan in place,should circumstances exist that may havea substantial influence on our managementstructure.
5.7 POTENTIAL RISKS ASSOCIATEDWITH INVESTING IN HARMONY
Although not required, we have detailedadditional risk factors which could impacton our business. These risks and otherfactors are normally included in thecompany’s Annual Report on Form 20Fwhich is filed with the company’s otherSecurity and Exchange Commission filings.The list is not complete but indicative of therisks associated with mining.
The following risk factors exist:Because most of Harmony’s productioncosts are in Rand, and gold is generally
sold in US dollars, our financialcondition could be materially harmed byan appreciation in the value of the Rand.
Gold is generally sold throughout the worldin US dollars, but most of Harmony’soperating costs are incurred in Rand. As aresult, any significant and sustainedappreciation of the Rand against the USdollar will serve materially to reduce ourRand revenues and overall net income as aresult of higher working costs in US dollarterms.
The profitability of Harmony’s operations,and the cash flows generated by thoseoperations, are affected by changes inthe market price for gold, which in thepast has fluctuated widely.
A substantial portion all of our revenuescome from the sale of gold. Historically, themarket price for gold has fluctuated widelyand has been affected by numerous factorsover which we have no control, including: � the demand for gold for industrial uses
and for use in jewellery;� international or regional political and
economic trends;� the relative strength of the US dollar
(the currency in which gold pricesgenerally are quoted) and of othercurrencies;
� financial market expectations regardingthe rate of inflation;
� interest rates;� speculative activities;� actual or expected purchases and
sales of gold bullion holdings by centralbanks or other large gold bullionholders or dealers;
� forward sales by gold producers; and� the production and cost levels for gold
in major gold-producing nations, suchas South Africa.
In addition, the current demand for andsupply of gold affects the price of gold, butnot necessarily in the same manner ascurrent demand and supply affect theprices of other commodities. Historically,gold has tended to retain its value in relativeterms against basic goods in times ofinflation and monetary crisis.
As a result, central banks, financialinstitutions and individuals hold largeamounts of gold as a store of value, andproduction in any given year constitutes avery small portion of the total potentialsupply of gold. Since the potential supply ofgold is large relative to mine production inany given year, normal variations in currentproduction will not necessarily have asignificant effect on the supply of gold or itsprice.
The price of gold remains volatile, forexample, on 28 June 2003, the afternoonfixing price of gold on the London BullionMarket was $318.50 per ounce as opposedto $346 per ounce (afternoon fixing price ofgold on the London Bullion Market) on 30June 2003
While the aggregate effect of thesefactors is impossible for Harmony to predict,if gold prices should fall below the cost ofproduction and remain at such levels forany sustained period, we may experiencelosses and may be forced to curtail orsuspend some or all of our workplaces. Inaddition, we would also have to assess theeconomic impact of low gold prices on itsability to recover any losses it may incurduring that period and on its ability tomaintain adequate reserves.
Our average cash cost of productionper ounce of gold sold was approximatelyUS$196 in fiscal 2002, US$234 in fiscal2001 and US$245 in fiscal 2003. Productionin any given year constitutes a very smallportion of the total potential supply of gold.Thus, normal variations in currentproduction will not necessarily have asignificant effect on the supply or its price.
Actual or expected sales of gold bycentral banks have had a significantimpact on the price of gold.
Over the past several years, one of the mostimportant factors influencing the gold pricehas been actual or expected sales of goldreserves by central banks. Since 1997, anumber of central banks, including thecentral banks of Australia, Switzerland andthe United Kingdom, have announced plansto sell significant gold reserves, and, morerecently, the International Monetary Fundhas discussed selling significant gold

083
reserves to fund international debt relief.The gold price has declined following eachsuch announcement and sale, culminatingin a drop in the gold price to its lowest levelin at least 20 years in July 1999, after theBank of England completed the first part ofits announced sale of more than half of itsgold reserves. In September 1999, thecentral banks of 15 European countriesagreed to limit sales of gold reserves forthe next five years to sales announced atthat time and to limit gold lending andderivative operations for five years. Theannouncement of this agreement led to animmediate increase in the price of gold,although the gold price was subsequentlysubjected to downward pressure aroundthe time of the periodic auctions held bythe Bank of England. The agreement by thecentral banks is voluntary and is due forrenewal in September 2004.
Because Harmony does not usecommodity or derivative instruments toprotect against low gold prices withrespect to most of its production, we areexposed to the impact of any significantdrop in the gold price.
As a general rule Harmony sells its goldproduction at market prices. Recently, therehave been two instances in which we havemade use of gold price hedges: ourforward sale of a portion of the productionat Bissett at a set gold price, and inFebruary 2001, put options relating to 1million ounces of our production atElandskraal. Both of these hedges wereaffected by Harmony in order to secureloan facilities and have since been closedout. A significant proportion of theproduction at Randfontein was alreadyhedged when acquired by Harmony, andthese hedges have since been closed out.In addition, a substantial proportion of theproduction at each of New Hampton andHill 50 was already hedged when acquiredand although a significant amount hasbeen closed out, a portion remainshedged.
Harmony generally does not enter intoforward sales, derivatives or other hedgingarrangements to establish a price inadvance for the sale of its future gold
production. In general, hedging in thismanner reduces the risk of exposure tovolatility in the gold price. Such hedgingalso enables a gold producer to fix a futureprice for hedged gold that generally ishigher than the then current spot price.Because Harmony does not generallyestablish a future price for our gold, we canrealise the positive impact of any increasein the gold price. However, this also meansthat we are not protected againstdecreases in the gold price and if the goldprice decreases significantly we run the riskof reduced revenues in respect of goldproduction that is not hedged.
Harmony’s gold reserve figures areestimated based on a number ofassumptions, including assumptions asto mining and recovery factors, futureproduction costs and the price of gold,and may yield less gold under actualproduction conditions than currentlyestimated.
The ore reserve estimates contained in thisannual report are estimates of the mill-delivered quantity and grade of gold in ourdeposits and stockpiles. They represent theamount of gold that we believe can bemined, processed and sold at pricessufficient to recover our estimated futuretotal costs of production, remaininginvestment and anticipated additionalcapital expenditures. Our ore reserves areestimated based upon many factors, whichhave been stated under the Ore Reservesection of this report.
The ore reserve estimates contained inthis annual report are calculated based onestimates of future production costs, futuregold prices and, because our gold salesare primarily in US dollars and we incurmost of its production costs in Rand, theexchange rate between the Rand and theUS dollar and, in the case of Harmony’sAustralian operations, the Australian dollar.As a result, the reserve estimates containedin this annual report should not beinterpreted as assurances of the economiclife of our gold deposits or the profitabilityof the future operations.
Since ore reserves are only estimatesthat we makes based on the above factors,

Harmony Annual Report 2003 084
in the future we may need to revise ourestimates. In particular, if our productioncosts increase (whether in Rand terms, inAustralian dollar terms, or in relative termsdue to appreciation of the Rand or theAustralian dollar against the US dollar) or ifgold prices decrease, a portion of our orereserves may become uneconomical torecover. This will force Harmony to lower itsestimated reserves.
Harmony’s strategy depends on itsability to make additional acquisitions.
In order to increase Harmony’s goldproduction and to acquire additionalreserves so that we can maintain and growour gold production beyond the life of ourcurrent ore reserves, we are exploringopportunities to expand by acquiringselected gold producers and miningoperations. However, we cannot guaranteethat:� we will be able to identify appropriate
acquisition candidates or negotiateacquisitions on favourable terms;
� we will be able to obtain the financingnecessary to complete futureacquisitions; or
� the issuance of Harmony’s ordinaryshares or other securities in connectionwith any future acquisition will not resultin a substantial dilution in ownershipinterests of holders of ordinary shares.
As at 30 June 2003, our mining operationsreported total proven and probablereserves of approximately 61,9 millionounces, which includes Elandskraal, NewHampton, Hill 50 and Free Gold. If thecompany is unable to acquire additionalgold producers or generate additionalproved and probable reserves at itsexisting operations or through itsexploration activities, Harmony cannot becertain that it will be able to expand orreplace its current production with newreserves in an amount sufficient to sustainthe life of its mining operations beyond thecurrent life of its reserves.
To maintain gold production beyond theexpected lives of Harmony’s existingmines or to increase production
materially above projected levels,Harmony will need to access additionalreserves through development ordiscovery.
Harmony’s Australian operations havelimited proved and probable reserves.Exploration and discovery will be necessaryto maintain current gold production levels atthese operations in the future. Explorationfor gold and other precious metals isspeculative in nature, is frequentlyunsuccessful and involves many risks,including risks related to:� locating ore bodies;� identifying the metallurgical properties
of ore bodies; � estimating the economic feasibility of
mining ore bodies;� developing appropriate metallurgical
processes; � obtaining necessary governmental
permits; and � constructing mining and processing
facilities at any site chosen for mining.
Our exploration efforts might not resultin the discovery of mineralisation and anymineralisation discovered might not result inan increase in our proved and probablereserves.
To access additional reserves in SouthAfrica, we will need to successfullycomplete development projects, includingextending existing mines and, possibly,developing new mines. Developmentprojects would also be necessary to accessthe platinum and palladium mineralisationidentified at the Kalplats platinum groupmetals project and any mineralisationdiscovered through exploration in Australiaor elsewhere.
Typically we use feasibility studies todetermine whether or not to undertakesignificant development projects. Feasibilitystudies include estimates of expected oranticipated economic returns, which arebased on assumptions about:� future gold and other metal prices;� anticipated tonnage, grades and
metallurgical characteristics of ore tobe mined and processed;
� anticipated recovery rates of gold andother metals from the ore; and
� anticipated total costs of the project,including capital expenditure and cashoperating costs.
Actual costs, production and economicreturns may differ significantly from thoseanticipated by the feasibility studies.Moreover, it can take a number of yearsfrom the initial feasibility studies untildevelopment is completed. During that time,the economic feasibility of production maychange. In addition, there are a number ofuncertainties inherent in the developmentand construction of an extension to anexisting mine or any new mine, including:� the availability and timing of necessary
environmental and other governmentalpermits;
� the timing and cost necessary toconstruct mining and processingfacilities, which can be considerable;
� the availability and cost of skilledlabour, power, water and othermaterials;
� the accessibility of transportation andother infrastructure, particularly inremote locations;
� the availability and cost of smelting andrefining arrangements; and
� the availability of funds to financeconstruction and developmentactivities.
Accordingly, there is no assurance that anyfuture development projects will extend thelife of our existing mining operations orresult in any new commercial miningoperations.
Harmony may experience problems inmanaging new acquisitions andintegrating them with its existingoperations.
Acquiring new gold mining operationsinvolves a number of risks including:� difficulties in assimilating the operations
of the acquired business;� difficulties in maintaining the financial
and strategic focus while integrating theacquired business;
� problems in implementing uniformstandards, controls, procedures andpolicies;

085
� increasing pressures on existingmanagement to oversee a rapidlyexpanding company; and
� to the extent Harmony acquires miningoperations outside South Africa,encountering difficulties relating tooperating in countries in which we havenot previously operated.
Any difficulties or time delays in achievingsuccessful integration of new acquisitionscould have a material adverse effect on ourbusiness, operating results, financialcondition and stock price. For example,following the acquisition of New Hampton,we have encountered higher than expectedcosts and disappointing results from the BigBell operations. We may encounter similardifficulties or new problems in integratingother acquisitions.
Due to the nature of mining and the typeof gold mines we operate, we face amaterial risk of liability, delays andincreased production costs fromenvironmental and industrial accidentsand pollution.
The business of gold mining by its natureinvolves significant risks and hazards,including environmental hazards andindustrial accidents. In particular, hazardsassociated with underground mininginclude:� rock bursts;� seismic events;� underground fires;� cave-ins or falls of ground;� discharges of gases and toxic
chemicals;� release of radioactive hazards;� flooding;� accidents; and� other conditions resulting from drilling,
blasting and removing and processingmaterial from a deep-level mine.
Hazards associated with open-cast mining(also known as open pit mining) include:� flooding of the open pit;� collapse of the open pit walls;� accidents associated with the operation
of large open pit mining and rocktransportation equipment; and
� accidents associated with thepreparation and ignition of large-scaleopen pit blasting operations.
Hazards associated with waste rockmining include:� accidents associated with operating a
waste dump and rock transportation;and
� production disruptions due to weather.
We are at risk of experiencing any andall of these environmental or other industrialhazards. The occurrence of any of thesehazards could delay production, increaseproduction costs and result in liability.
Harmony’s insurance coverage mayprove inadequate to satisfy future claimsagainst it.
We have third-party liability coverage formost potential liabilities, includingenvironmental liabilities. We believe that ourcurrent insurance coverage for the hazardsdescribed above is adequate andconsistent with industry practice.
However, we may become subject toliability for pollution or other hazards againstwhich we have not insured or cannot insure,including those in respect of past miningactivities. Further, we maintain and intendto continue to maintain, property and liabilityinsurance consistent with industry practice,but such insurance contains exclusions andlimitations on coverage.
In addition, there can be no assurancethat insurance will continue to be availableat economically acceptable premiums. As aresult, future insurance coverage may notcover the extent of claims against us forenvironmental or industrial accidents orpollution.
Political or economic instability in SouthAfrica or regionally may have an adverseeffect on our operations and profits.
We are incorporated and own significantoperations in South Africa. As a result,there are important political and economicrisks relating to South Africa, which couldaffect an investment in Harmony.
South Africa has been transformed into

Harmony Annual Report 2003 086
a democracy since 1994, with a successfulsecond round of democratic elections heldduring 1999. While Harmony believes thatthe South African government is stable,government policies aimed at redressingthe disadvantages suffered by the majorityof citizens under previous governmentsmay impact on our operations and profits.
In addition to political issues, SouthAfrica faces many challenges inovercoming substantial differences inlevels of economic development among itspeople. While South Africa features highlydeveloped, sophisticated first worldbusiness sectors and infrastructure at thecore of its economy, large parts of thepopulation do not have access toadequate education, health care, housingand other services, including water andelectricity.
Furthermore, in recent years, SouthAfrica has experienced high levels of crimeand unemployment. These problems havebeen among the factors that impeded fixedinward investment into South Africa andprompted emigration of skilled workers.
Although the South AfricanGovernment has indicated on numerousoccasions that it is committed to creating astable, democratic free-market economy,including the phasing out of exchangecontrols, it is difficult to predict the futurepolitical, social and economic direction ofSouth Africa or how the government will tryto address South Africa’s problems. It isalso difficult to predict the effect on ourbusiness of these problems or of thegovernment’s efforts to solve them.
Further, there has been regional politicaland economic instability in countries northof South Africa. As discussed above, anyresulting political or economic instability inSouth Africa could have a negative impacton our ability to manage and operate ourSouth African mines.
The results of Harmony’s South Africanoperations may be negatively impactedby inflation.
In the late 1980s and early 1990s, inflationin South Africa reached record highs. Thisincrease in inflation resulted in considerableyear on year increases in operational costs.
By calendar 2001, the inflation rate haddecreased to single-digit figures. However,the recent depreciation of the Rand hascreated inflationary pressure.
While our operations have not in recentyears been materially affected by inflation, aperiod of significant inflation in South Africa,without a concurrent devaluation of theRand or an increase in the price of gold,could have a material adverse effect on ourprofits and financial condition.
Harmony’s financial flexibility could bematerially constrained by South Africancurrency restrictions.
South Africa’s exchange control regulationsprovide for restrictions on exporting capitalfrom South Africa, the Republic of Namibia,and the Kingdoms of Lesotho andSwaziland, known collectively as theCommon Monetary Area.
Transactions between South Africanresidents (including corporations) and non-residents of the Common Monetary Area aresubject to these exchange controlregulations that are enforced by the SouthAfrican Reserve Bank (SARB). As a result,Harmony’s ability to raise and deploy capitaloutside the Common Monetary Area isrestricted. In particular, we:� are generally not permitted to export
capital from South Africa or to holdforeign currency without the approval ofthe South African exchange controlauthorities;
� are generally required to repatriate toSouth Africa profits of foreignoperations; and
� are limited in our ability to utilise profitsof one foreign business to financeoperations of a different foreignbusiness.
These restrictions could hinderHarmony’s normal corporate functioning.While exchange controls have been relaxedin recent years and are continuing to berelaxed, it is difficult to predict whether orhow the South African Government willfurther relax the exchange controlregulations in the future.
Since Harmony’s South African labourforce has substantial trade unionparticipation, Harmony faces the risk ofdisruption from labour disputes and newSouth African labour laws.
Due to the number of its South Africanemployees who belong to unions, Harmonyis at risk of having its production stoppedfor indefinite periods due to strikes andother labour disputes. Significant labourdisruptions may have a material adverseeffect on our operations and financialcondition. We are not able to predictwhether we will experience significantlabour disputes in the future.
Our production may also be materiallyaffected by labour laws. Since 1995, SouthAfrican laws relating to labour havechanged significantly in ways that affectour operations. In particular, laws enactedsince then that regulate work time, providefor mandatory compensation in the event oftermination of employment for operationalreasons, and impose large monetarypenalties for non-compliance withadministrative and reporting requirements inrespect of affirmative action policies, couldall result in significant costs.
In addition, future South African legislationand regulations relating to labour may furtherincrease our costs or alter our relationshipwith our employees. There may continue tobe significant changes in labour law in SouthAfrica over the next several years.
HIV/AIDS poses risks to Harmony interms of productivity and costs.
The incidence of HIV/AIDS in South Africa,which is forecast to increase over the nextdecade, poses risks to us in terms ofpotentially reduced productivity andincreased medical and other costs. Weexpect that significant increases in theincidence of HIV/AIDS infection andHIV/AIDS -related diseases among ourworkforce over the next several years mayadversely impact on our operations andfinancial condition. This expectation,however, is based on assumptions about,among other things, infection rates andtreatment costs, which are subject tomaterial risks and uncertainties beyond our

All that reporting! What has it got to dowith getting the stuff out of the ground?”
“

TEN PEOPLE. ONE STORTEN PEOPLE. ONE STORYY..
It’s a challenge to me to teach the responsibilities that go withthe job. I consciously try to continue mentoring. We need to fast-track people intensively – give people as much skills and opportunitiesas we can – push each guy faster to know what Harmony expectsof him.
If I had to go back to the old reporting structure - how they report- what they report… all that reporting! What has it got to do withgetting the stuff out of the ground? It would stifle me.
When Harmony first made the changes I locked myself in the officefor 3 days just absorbing it. A mine overseer, that’s what I wanted tobe – it’s where I felt comfortable.You get set in your ways, you see.I've been at Randfontein for 16 years.
In the old days if you made a mistake I’d just say you were wrong.I used to say, “You blasted out those sticks, now somebody's goingto have to put them back in.” Now you bring the whole team togetherand look at how it inconvenienced them all.
We used to say, “If you want the manager to get into trouble, justdo what he tells you to do.” Now I’m in the hot seat I must do what’sright. Previously you told people what their problems were. Now youadmit you don’t know everything and ask for participation. But I feelthat if we say equal opportunities we must say equal responsibilitiesas well.
NameJohan SchonfeldtTime at Harmony16 yearsWorks atCooke 3Started asShiftbossPosition todayMine Overseer

089
control as a result, actual results may differfrom the current expectation.
Mineral rights ownership.On 3 October 2002 the Mineral andPetroleum Resources Development Act, (theAct) was signed into law by the President ofSouth Africa. The principal objectives setout in the Act are: � to recognise the internationally
accepted right of the state of SouthAfrica to exercise full and permanentsovereignty over all the mineral andpetroleum resources within South Africa;
� to give effect to the principle of theState’s custodianship of the nation’smineral and petroleum resources;
� to promote equitable access to SouthAfrica’s mineral and petroleumresources to all the people of SouthAfrica and redress the impact of pastdiscrimination;
� to substantially and meaningfullyexpand opportunities for historicallydisadvantaged persons, includingwomen, to enter the mineral andpetroleum industry and to benefit fromthe exploitation of South Africa’s mineraland petroleum resources;
� to promote economic growth andmineral and petroleum resourcesdevelopment in South Africa;
� to promote employment and advancethe social and economic welfare of allSouth Africans;
� to provide security of tenure in respectof prospecting, exploration, mining andproduction operations;
� to give effect to Section 24 of the SouthAfrican Constitution by ensuring thatSouth Africa’s mineral and petroleumresources are developed in an orderlyand ecologically sustainable mannerwhile promoting justifiable social andeconomic development;
� to follow the principle that miningcompanies keep and use their mineralrights, with no expropriation and withguaranteed compensation for mineralrights; and
� to ensure that holders of mining andproduction rights contribute towardssocio-economic development of theareas in which they are operating.
Under the Act, tenure licences overestablished operations will be secure for 30years (and renewable for 30 yearsthereafter), provided that mining companiesobtain new licenses over existing operationswithin five years of the date of enactment ofthe Act and fulfil requirements specified in abroad-based socio-economicempowerment charter for the South Africanmining industry, or the Mining Charter.
The principles contained in the MiningCharter relate to the transfer, over a 10-yearperiod, of 26% of South Africa’s miningassets to historically disadvantaged SouthAfricans, as defined in the Mining Charter.Under the Mining Charter, the South Africanmining industry has committed to securingfinancing to fund participation of historicallydisadvantaged South Africans in an amountof R100 billion within the first five years ofthe Mining Charter’s tenure. The MiningCharter provides for the review of theparticipation process after five years todetermine what further steps, if any, areneeded to achieve the 26% targetparticipation. The Mining Charter requiresprogrammes for black economicempowerment and the promotion of value-added production, such as jewellery-making and other gold fabrication, in SouthAfrica. The Mining Charter also sets outtargets for broad-based black economicempowerment in the areas of humanresources, skills development, employmentequality, procurement and beneficiation. Inaddition, the Mining Charter addressesother socio-economic issues, such asmigrant labour, housing and livingconditions.
We actively carry out mining andexploration activities in all of our materialmineral rights areas. Accordingly, we will beeligible to apply for new licences over ourexisting operations, provided that wecomply with the Mining Charter. We havetaken steps to comply with the expectedprovisions of the Mining Charter, such aspromoting value-added production,exploring black empowerment initiativesand increasing worker participation. OurSustainability Report carries more detail onthese initiatives. We are currently evaluatingthe impact that the Mining Charter mayhave with regard to its operations and no

Harmony Annual Report 2003 090
assurance can be given as to when theMining Charter will be finalised or what thefinal form of the Mining Charter will contain.We expect that there will be costs involvedin complying with the Mining Charter, whichmay have an adverse impact on the profitsgenerated by our operations in South Africa.
The Act also makes reference toroyalties being payable to the state in termsof an Act of Parliament known as the MoneyBill, which was made available for publiccomment earlier this year. The introductionof the Money Bill as law may have anadverse impact on the profits generated byHarmony’s operations in South Africa.Harmony is currently evaluating this impact.No assurance can be given as to whether orwhen the proposed Money Bill will beenacted.
In Australia, most mineral rights belongto the government, and mining companiesmust pay royalties to the government basedon production. There are, however, limitedareas where the government has grantedfreehold estates without reserving mineralrights. Harmony’s subsidiary, New Hampton,has freehold ownership of its Jubilee miningareas, but the other mineral rights inHarmony’s Australian operations belong tothe Australian Government and are subjectto royalty payments. In addition, currentAustralian law generally requires native titleapproval to be obtained before a mininglicence can be granted and miningoperations can commence. New Hamptonand Hill 50 have approved mining leases formost of their reserves, including all reservesthat are currently being mined, and Bendigohas an approved mining licence for itscurrent development area. If New Hampton,Hill 50 or Bendigo desired to expandoperations into additional areas underexploration, these operations would need toconvert the relevant exploration licencesprior to commencing mining, and thatprocess could require native title approval.There can be no assurance that anyapproval would be received.
Harmony is subject to extensiveenvironmental regulations.
As a gold mining company, we are subjectto extensive environmental regulation. We
have experienced and expect to continue toexperience increased costs of productionarising from compliance with South Africanenvironmental laws and regulations. TheMinerals Act, the regulations promulgatedunder the Minerals Act, certain otherenvironmental legislation and theadministrative policies of the South AfricanGovernment all regulate the impact of ourprospecting and mining operations on theenvironment.
Pursuant to these regulations, upon thesuspension, cancellation, termination orlapsing of a prospecting permit or miningauthorisation in South Africa, we will remainliable for compliance with the provisions ofthe Minerals Act, including any rehabilitationobligations. This liability will continue untilsuch time as the South African Departmentof Minerals and Energy certifies that wehave complied with the provisions of theMinerals Act.
In future, we may incur significant costsassociated with complying with morestringent requirements imposed under newlegislation and regulations. This may includethe need to increase and accelerateexpenditure on environmental rehabilitation,and alter provisions for this expenditure,which could have a material adverse effecton our results and financial condition.
The South African Government iscurrently reviewing requirements imposedupon mining companies to ensureenvironmental restitution. For example, withthe introduction of an environmental rightsclause in South Africa’s constitution, anumber of environmental legislative reformprocesses have been initiated. Legislationpassed as a result of these initiatives hastended to be materially more onerous thanlaws previously applied in South Africa.Examples of such legislation include theNational Water Act 36 of 1998 and theNational Environmental Management Act107 of 1998, both of which include stringent“polluter-pays” provisions. The adoption ofthese or additional or more comprehensiveand stringent requirements, in particularwith regard to the management ofhazardous wastes, the pollution of groundand groundwater systems, and the duty torehabilitate closed mines, may result inadditional costs and liabilities.
Because the principal non-United Statestrading market for Harmony’s ordinaryshares is the JSE Securities ExchangeSouth Africa, investors face liquidity riskin the market for Harmony’s ordinaryshares.
The principal non-United States tradingmarket for Harmony’s ordinary shares is theJSE Securities Exchange South Africa, orthe JSE Securities Exchange. Historically,trading volumes and liquidity of shareslisted on the JSE Securities Exchange havebeen low in comparison with other majormarkets. The ability of a holder to sell asubstantial number of our ordinary shareson the JSE Securities Exchange in a timelymanner, especially with regard to a largeblock trade, may be restricted by the limitedliquidity of shares listed on the JSESecurities Exchange.
Harmony may not pay cash dividends toits shareholders in the future.
It is the current policy of Harmony’s board todeclare and pay cash dividends if profitsand funds are available for that purpose.Whether funds are available depends on avariety of factors, including the amount ofcash available and our capital expendituresand other cash requirements existing at thetime. Under South African law, cashdividends may only be paid out of theprofits. No assurance can be given thatcash dividends will be paid in the future.
Harmony’s non-South Africanshareholders face additional investmentrisk from currency exchange ratefluctuations since any dividends will bepaid in Rand.
Dividends or distributions with respect toHarmony’s ordinary shares have historicallybeen paid in Rand. The US dollar equivalentof any dividends or distributions withrespect to our ordinary shares will beadversely affected by potential futurereductions in the value of the Rand againstthe US dollar. In fiscal 2002, the value of theRand relative to the US dollar decreased byan average of 34%.

091
Harmony has a share option scheme andtherefore its ordinary shares are subjectto dilution.
On 30 June 2003 Harmony had anaggregate of 250 000 000 ordinary sharesauthorised to be issued and at that date anaggregate of 184 854 115 ordinary shareswere issued and outstanding. In addition, 2351 113 warrants were exercised whereby atotal of 2 351 113 ordinary shares werepurchased at an exercise price of R43.00per share or the US dollar on or before 29June, 2003. The warrants expired on 29June 2003.
Harmony also has an employee shareoption plan. The employee share optionplan in effect prior to 16 November 2001permitted the granting of options in anamount up to an aggregate of 10% of thenumber of Harmony ordinary sharesoutstanding as of the date of the grant. Witheffect from 16 November 2001, this planwas replaced by a plan authorising thegranting of options to purchase up to anaggregate of 8 000 000 ordinary shares (inaddition to any previously granted optionsthat remain outstanding under the previousplan). At 30 June 2003, options topurchase a total of 7 26 900 ordinaryshares were outstanding, 6 200 500 ofwhich were granted under the current planand 1 065 400 of which were granted underthe previous plan. The exercise prices ofthese options vary between R11.70 andR93.00.
As a result, shareholders’ equityinterests in Harmony are subject to dilutionto the extent of the future exercises of theoptions.
5.8 CODE OF ETHICS
Harmony is committed to promoting thehighest standards of behaviour andcompliance with laws and regulations. OurCode of Ethics, which was published andhas been in force since 1995, is a clearguide as to the expected behaviour of allemployees in their dealings with ourstakeholders. These include the directors,managers, employees, customers,suppliers, competitors, investors,shareholders and society at large. We
require our employees to maintain thehighest ethical standards in ensuring thatwe conduct our business practices in a waywhich is above reproach.
5.9 CODE OF CONDUCT
The Harmony Code of Conduct has beendeveloped to respond to the challenge ofethical conduct in the businessenvironment. All our employees wereinvolved in the development of the Code,and therefore all employees are expected tocomply with its contents. Our Code ofConduct provides guidelines to ensure thateach employee is unequivocal about ourvalues and the way in which these valueshave to find expression in our dailybehaviour. This Code goes beyond our legaland institutional responsibilities byformalising our values within the company. Itis possible, however, that an employee maybe confronted with difficult situations wherehe/she may not be sure of how to react. Insuch a case, the employee has directaccess to either our chief executive orcompany secretary.
5.10 RESTRICTIONS ON SHAREDEALINGS
Our employees and directors are prohibitedfrom dealing in Harmony shares duringprice-sensitive periods. Our companysecretary regularly distributes writtennotices, via e-mail, to advise employeesand directors of restricted periods. Eachemployee is obliged in terms of regulatoryand governance requirements to discloseany dealings in Harmony shares by them ortheir concert parties to the companysecretary. In view of the amendments to theJSE Securities Exchange ListingRequirements we will implement a formalclearance procedure in respect of directorsdealing in Harmony shares.
5.11 INTERNAL CONTROLAND INTERNAL AUDIT
We have established an internal auditfunction, which has been outsourced toKPMG Management Assurance Services.Internal Audit is an independent appraisal

Harmony Annual Report 2003 092
function established by the board toevaluate the adequacy and effectiveness ofcontrols, disciplines, systems andprocedures within the company, in order toreduce business risks to an acceptablelevel in a cost-effective manner. To achieveits independent organisational status, theInternal Audit Function reports to the AuditCommittee. The relationship between theAudit Committee and the Internal AuditFunction encompasses reporting andoversight relationships.
Audits are conducted in accordancewith the Code of Ethics and Standards ofthe Professional Practice of Internal Auditingas laid down by the Institute of InternalAuditors, Inc. Although the role of InternalAudit is to review internal controls, systems,procedures, risks and management andultimately the board retains full responsibilityto ensure that the company maintains anappropriate framework of controls to reducebusiness risks to an acceptable level.Except for minor matters, the board issatisfied that our internal controls are morethan adequate in safeguarding our assets,preventing and detecting errors and fraud,ensuring the accuracy and completeness ofaccounting records and preparing reliablefinancial statements.
5.12 WORKER PARTICIPATION
We have participation structures to deal withissues that affect good employer / employeerelations through encouraging opencommunication, consultation and theidentification and resolution of conflictsthrough a system of workplace forums.These structures embrace goals relating toproductivity, career security, legitimacy andidentification with the company. Adesignated group programme forms part ofthe company’s training programme andbusiness plan. Positive rapport ismaintained with unions and associations.
5.13 INFORMATION MANAGEMENT
Record keepingAccurate and reliable records of many kindsare necessary to meet our legal andfinancial obligations and to managecompany affairs. Harmony’s books and
records reflect all business transactions inan accurate and timely manner.Undisclosed or unrecorded revenues,expenses, assets or liabilities are notpermissible, and the employees responsiblefor accounting and record-keeping functionsare expected to be diligent in enforcingproper practices.
Information necessary for Harmony’sbusiness is reliable, accurate and itsconfidentiality is maintained. Only reputableand reliable sources are used tosupplement this information. Information isretained for as long as it is needed or asrequired by law, and every employeerealises his/her responsibility to ensure thatsuch information is physically secured andprotected.
Information TechnologyAn external assessment of all our ITsystems was conducted during the year.Ethical hacking tests were also performedby an independent company. Therecommendations made were followed andwe believe that all our systems are now safeand up to standard.
Promotion of Access to Information ActHarmony complies with the Access toInformation Act, 2 of 2000 and thecompany’s shareholders and stakeholdershave access to the Information Manual viaour website.
5.14 SECTION 302 OF THE SARBANES OXLEY ACT OF 2002
In terms of section 302 of SOx our chiefexecutive and chief financial officer arerequired to certify that:� he or she has reviewed the annual
report;� based on his/her knowledge, the report
contains no material misstatements oromissions;
� based on his/her knowledge, thefinancial statements and other financialinformation included in the annualreport, fairly presents in all materialrespects the financial condition, resultsof operations and cash flows of theissuer (being Harmony) for the periodspresented in this report;
� the certifying officers are responsible forestablishing and maintaining disclosurecontrols and procedures and haveproperly designed and evaluated them;
� the certifying officers have disclosed allsignificant deficiencies to the auditorsand Audit Committee, and
� the certifying officers have indicatedany significant changes in internalcontrols in the report.
Although this is a much publicised and newrequirement in the USA, Harmony hasalways subscribed to honest, transparentand timeous reporting.

I started in the years when women didn’tbelong in the mining industry.”
“

I started in the years when women didn’t belong in the miningindustry. I never said no to work and promotions took me to the topof the range for ladies, which was a very low level. Three of us starteddeveloping ourselves together – broadening our experience inmanagement accounting. But further promotions were difficult. Therewas discrimination when it came to salaries and benefits. Progresswas slow.
The big change came when I was involved in the negotiationphase between AngloGold and ARMgold. ARMgold needed a financialmanager and took me onto their team. I knew what the possibilitieswere for ARMgold – they were people I knew and had worked with.
The difference in ARMgold was that we were always involved. Itwas an open culture. Suggestions were heard. People took initiative.
I had the freedom to put into practice what I know – and to makedecisions about implementation.
In ARMgold management accounting plays a big role.Understanding the financial and business side of mining is takenthrough the ranks to mine overseer and shift-boss levels – lookingat how declining ore reserves and the gold price affect productiondecisions. Problem-sharing is team-building.
The Harmony merger opens new horizons of opportunity. We havecompatible philosophies and compatible approaches to mining.
I’d like to be involved in decision-making around systems andsynergies. Also around implementing change and helping peopleto cope with it – showing people the benefits of doing things differently.
TEN PEOPLE. ONE STORTEN PEOPLE. ONE STORYY..NameAnnetjie de BeerTime at ARMgold5 yearsWorks atOrkneyStarted asClerkPosition todayFinancial Leader

095
5.16 INDEPENDENT AUDITORS’ REPORT
We have audited the annual Group and Company financial statements of Harmony GoldMining Company Limited for the year ended 30 June 2003 set out on pages 96 to 140.These financial statements are the responsibility of the directors of the Company. Ourresponsibility is to express an opinion on these financial statements based on our audit.
ScopeWe conducted our audit in accordance with statements of South African Auditing Standards,and in accordance with International Standards on Auditing issued by the InternationalFederation of Accountants. Those standards require that we plan and perform the audit toobtain reasonable assurance that the financial statements are free of material misstatement.An audit includes:� An examination, on a test basis, of evidence supporting the amounts and disclosures in
the financial statements;� An assessment of the accounting principles used and significant estimates made by
management; and� An evaluation of the overall presentation of financial statements.
We believe that our audit provides a reasonable basis for our opinion.
Audit opinionIn our opinion, the financial statements fairly represent, in all material respects, the financialposition of the Company and the Group as at 30 June 2003, and the results of theiroperations, changes in equity and cash flows for the year then ended, in accordance withSouth African Statements of Generally Accepted Accounting Practice, International FinancialReporting Standards and in the manner required by the South African Companies’ Act.
PricewaterhouseCoopers Inc.Chartered Accountants (SA)Registered Accountants and Auditors
Johannesburg23 September 2003
5.15 DIRECTORS’ RESPONSIBILITY STATEMENT
The directors are responsible for preparation, integrity and fair representation of the financialstatements of the Group and the Company. The financial statements, presented on page 96to 140 of this report, were prepared in accordance with South African Statements ofGenerally Accepted Accounting Practice and International Financial Reporting Standardsand include amounts based on judgements and estimates made by management. Thedirectors also prepared other information included in this annual report and are responsiblefor both its accuracy and consistency with the financial statements.
During the preparation of the financial statements, we adopted the going concern basis.Based on forecasts and available resources, the directors have no reason to believe that theCompany will not be a going concern in the foreseeable future. The financial statementssupport the Company’s viability.
The independent firm, PricewaterhouseCoopers Inc., audited the financial statements.Unrestricted access was given to all financial records and related data, including minutes ofall shareholders’, Board of directors’ and Board committee meetings. The directors believethat all representations made to the independent auditors during their audit were valid andappropriate.
These financial statements were approved by the Board of directors on 23 September 2003and signed on its behalf by:
ZB Swanepoel F AbbottChief Executive Financial Director
Virginia23 September 2003

Harmony Annual Report 2003 096
The Company and its subsidiariesHarmony, its subsidiaries and associatesare involved in gold mining, explorationand related activities mainly in SouthAfrica, Australasia, the Russian Federationand Peru. The company does not have amajor controlling shareholder and ismanaged by its directors for and on behalfof its stakeholders.
Financial statements and resultsThe directors have pleasure in submittingthe financial statements of the company,together with those of the group, for theyear ended 30 June 2003. These appearon pages 103 to 142 of this report. Thesefinancial statements have been preparedusing appropriate accounting policies,conforming to statements of South AfricanGenerally Accepted Accounting Practiceand International Financial ReportingStandards, supported by reasonable andprudent judgements and estimates whererequired.
Going concernThe directors believe that Harmony hassufficient resources and expected cashflows to continue operating as a goingconcern.
Corporate governanceFull details of Harmony’s commitment tocorporate governance can be found onpages 76 to 92.
CapitalFull detail of the issued share capital of thecompany as at 30 June 2003 is set out inthe statements of shareholders’ equity onpage 105 of this report.
Year-on-year the issued share capitalof the company increased by R7 803 383to R92 427 057.50, which is equal to15 606 766 million newly-issued ordinaryshares of 50 SA cents each. The increasedamount is mainly due to the issue of8 million shares for cash in January 2003,the exercise of warrants and the exerciseof share options under the company’sshare incentive schemes.
The control over the unissued sharesof the company is vested in the directors inspecific terms as regards allotments interms of the Harmony (1994) and (2001)Share Option Schemes ("the option
schemes”) and the allotment of shares forcash and in general terms as regards allother allotments.
The authorities granted to directors inrespect of control over the unissued sharesexpire on the date of the annual generalmeeting of members to be held on14 November 2003. Members, therefore,will be requested to consider resolutions atthe forthcoming annual general meeting,placing under the control of the directorsthe then remaining unissued ordinaryshares not required for purposes of theshare option schemes.
Members will furthermore berequested to furnish general approval forthe acquisition by the company of itsissued shares in terms of Section 85 of theCompanies Act, 1973 and subject to thelisting requirements of the JSE SecuritiesExchange.
The full text of the proposedresolutions is contained in the notice of theannual general meeting (enclosed).
InvestmentsA schedule of investments in subsidiaries,associates and listed and unlistedinvestments, appears on pages 138 to 140of this report
AcquisitionsDuring the year under review, the followingacquisitions were made:� The Free Gold Joint Venture took
control of the St Helena assets on29 October 2002. In terms of theagreement concluded on 24 May2002, the venture acquired theseassets for a gross sale consideration ofR120 million. In addition, a royalty of1% is payable for a period of 48months from the effective date.
� On 21 November 2002 Harmonycompleted the acquisition of 17 074 861 ordinary shares, or a 16%interest, of High River Gold. High RiverGold (TSA:HRG) is a Toronto-basedcompany with gold interests in Russia,Canada and West Africa. The totalpurchase consideration amounted toR141 million (US$14.5 million) whichrepresented a 16% discount on theweighted average share price for the30-day trading period prior to theexecution of the agreement.
� On 26 February 2003 Harmonyannounced that it had agreed tosubscribe for new shares and intendedto make a public takeover offer forAustralian-listed gold producer AbelleLimited. The offer closed on 26 March2003 and Harmony now owns 87% ofthe shares and 65% of the listedoptions in Abelle. The totalconsideration payable was A$151 million or US$98 million. On30 June 2003, at a share price ofA$1010 per share, our investment wasvalued at US$127 million.
� On 2 May 2003, Harmony andARMgold announced details of their50/50 joint acquisition of a 34,5% stakein Anglovaal Mining Limited (Avmin).Based on a value of R43.50 per share,the transaction is valued atR1 687 billion and was paid for incash.
PropertyFull detail of the property, mineral andparticipation rights of the company and thegroup are available on request.
DividendsInterim dividend No 76 of 125 cents pershare and final dividend No 77 of 150cents were declared payable on 3 March2003 and 8 September 2003 respectively,in respect of the financial year ended 30 June 2003, thus resulting in a totaldividend of 275 cents per share for theyear.
Share incentivesHarmony share options are granted tomanagers as an incentive, in addition tosalaries. The exercise of each optiongranted is set at the closing market priceof Harmony’s ordinary shares on the JSEon the day before the date of grant. Eachoption remains open for acceptance for 10years after the date of grant, subject to theterms of the relevant option scheme. Thecompany has two share option schemes,namely the 1994 Share Option Schemeand the 2001 Share Option Scheme, withsimilar rules.
Options in terms of the 1994 ShareOption Scheme may only be exercisedover three years in three equal parts. Interms of the 2001 Share Options Scheme,
DIRECTORS’ REPORT
5.17 DIRECTOR’S REPORT

097
the options may only be exercised overfive years in five equal parts. The 1994 and2001 Share Option Schemes may beamended from time to time (whetherretrospectively or otherwise) by the boardin any respect (except for certain specificclauses that may only be amended throughapproval in a general meeting), providedthat no such amendment shall operate toalter the terms and conditions of any optiongranted to a participant prior thereto,without the written consent of thatparticipant and provided that the priorwritten approval of the JSE SecuritiesExchange has been obtained.
No share options were re-pricedduring the financial year.
Harmony adopted a share purchasescheme in which 1994 and 2001 ShareOption Scheme participants respectivelymay participate. The Share PurchaseScheme provides for a share purchasetrust controlled by Harmony. Recourseloans are provided by the trust to theemployees to enable them to acquireshares or exercise their options under the1994 and the 2001 Share Option Scheme.However, in terms of a trustees resolutionpassed on 27 March 2003, Share OptionScheme participants are no longer allowedto place their shares in the share purchasetrust. The share purchase trust is fundedby a loan from Harmony, which it repaysonce it receives repayment of the recourseloans granted to employees. Twoindependent non-executive directors,Mr M F Pleming and Mr A R Fleming,currently serve as trustees. The trusteesare not eligible to receive loans from thetrust.
Activity under the various ShareIncentive Schemes for the year underreview is set out in table 1.
DirectorateThe following directors were appointed tothe Harmony board:
Executive DirectorsAJ Wilkens***P Taljaard***WM Gule***DV Simelane***
Non-executive DirectorsPT Motsepe (new chairman)***Dr MMMM Bakane-Tuoane***MW King***CML Savage***Dr RV Simelane***Dr SP Sibisi***MV Sisulu**VN Fakude*DS Lushaba*
* Appointed on 18 October 2002** Appointed on 1 August 2003*** Appointed on 23 September 2003
Abridged CVs of all the new directorsappear on pages 69 to 72 of this report.All directors made themselves available forelection to the board at the upcominggeneral meeting of members.
Mr P T Motsepe has been appointedas non-executive chairman of the newHarmony board.
In terms of the company's Articles ofAssociation, Messrs Z B Swanepoel, T S A Grobicki and M F Pleming qualify for
retirement by rotation at the forthcomingannual general meeting. The retiringdirectors are eligible and have madethemselves available for re-election to theboard. Ms T A Mokhobo, who representedSimane Security Investments (Pty) Ltd,resigned as director of the board on 3 July2003. Messrs J G Smithies andA R Fleming have also tendered theirresignations as non-executive directorseffective 22 September 2003, and have notmade themselves available for re-election.
Directors' interestsDisclosure by directors indicate that, at thedate of this report, their individualshareholdings and those of their immediatefamilies and associates, do not exceed oneper cent of the company's issued sharecapital, save for Mr A R Fleming, whoindirectly holds 4 685 747 shares or 1,84%of the issued share capital of the companyas at 30 June 2003.
The directors' interests and dealings inshares acquired, other than through shareincentive schemes, for the year underreview and up to 30 June 2003, are set outin table 2.
Directors' emolumentsHarmony’s Remuneration Committee (seepages 80 to 81 for details) ensures thatdirectors and senior executives are fairlyrewarded for their individual contributionsto our overall performance.
Directors' emoluments for the year ended30 June 2003 are set out in table 3, inconformity with the requirements of the JSESecurities Exchange South Africa.
F Abbott 160 000 42.82 86 600 100.77 - - - 73 400 49.60
F Dippenaar 160 000 42.82 66 600 94.09 - - - 93 400 46.56
T S A Grobicki 289 000 37.60 181 600 102.72 - - - 107 400 44.63
Z B Swanepoel 263 000 43.76 121 150 101.46 - - - 141 850 48.27
Management (All) 8 205 000 42.55 1 787 350 118.30 1 311 000 91.60 481 800 7 682 900 52.70
BALANCE30 JUNE 2003
EXERCISED ANDSOLD DURING THE
YEAR
ALLOCATEDDURING THE YEAR
LAPSEDBALANCE ASAT 1 JULY 2002
Numberof
options
Numberof
options
Averageprice per
share
Averageprice per
share
Averageprice per
share
Averageprice per
share
Numberof
options
Numberof
options
The lapsed options in the amount of 481 800 represent accrued options of employeeswho have been retrenched, who have retired or who have resigned. The prices per sharerange between R11.70 and R93.00.The last date on which an option may be exercisedis 27 March 2013.
ExecutiveDirectors
A R Fleming 5 258 868 - 573 121 4 685 747
T S A Grobicki* 160 800 - 131 412 29 388
R W Renwick 5 105 - - 5 105
BALANCE30 JUNE 2003
BALANCE30 JUNE 2002
ACQUIRED DISPOSEDNAME
* All holdings are beneficial, other than 29 388 held by T S A Grobicki on behalf
of a trust of which he is a trustee, but not a beneficiary
** None of the other directors hold shares in Harmony
table 1
table 2

The profit in terms of share incentiveschemes is set out in table 4.
Executives participate in an ExecutiveBonus Scheme and bonuses aredetermined for a financial year by theRemuneration Committee based on a 10%share of profits in excess of apredetermined benchmark. Thebenchmark profit is calculated by usingthe call deposit rate + 2% applied to thetotal shareholders’ equity. Individualperformance criteria, as well as a relativeloading further influence the financialbonus payable to an executive.
The bonus is paid in three equalyearly instalments at the end of thecompany's financial year. If an employeeleaves the employment of the company, heforfeits any outstanding bonus. The bonuspayment included during the 2003financial year represents the second yearlyinstallment of the bonus awarded for the2002 financial year. No bonus wasawarded to any of the executive directorsduring the 2003 financial year.
ShareholdersInformation on shareholder spread, rangeof shareholdings and public shareholders,as well as major shareholders, is presentedon page 149 of this report.
Post year-end events� The Harmony/ARMgold merger will be
effected on 22 September 2003 by theissue of two Harmony shares for everythree ARMgold shares held, subject toshareholders approval. It is anticipatedthat approximately 63.67 million shareswill be issued, increasing the
companies’ outstanding shares to257.8 million. At a price of R90 pershare, the new company will have amarket capitalisation of R23.2 billion(US$3.1 billion at R7.50 to the USDollar). Post-merger, the aggregatenumber of Harmony shares issued toARMgold shareholders will represent25% of the enlarged issued sharecapital of the merged company. Ourlargest shareholder, holdingapproximately 14% of the newcompany will be African RainbowMineral and Exploration Investments(Pty) Ltd (ARMI), represented byMr PT Motsepe.
� On 15 July 2003 we announced theacquisition of 77 540 830 ordinaryshares (11.5%) in Avgold Limited fromAnglo South Africa Capital(Proprietary) Limited in exchange forthe issue to Anglo South Africa of arenounceable letter of allocation(“RLA”) representing the right to theallotment and issue of 6 960 964 newordinary shares in Harmony,comprising 3.8% of the company’sissued share capital. Avgold operatesthe Target Mine in the Free State whichat full production is expected toproduce 350 000 ounces per annum,at a cash cost below US$180 perounce. An extensive explorationprogramme in an area known as TargetNorth, which has a resource base ofapproximately 80 million ounces iscurrently underway.
Herewith a brief summary of the Doornkoptransaction- "Randfontein Estates Limited("Randfontein"), a wholly owned subsidiaryof the company, entered into an agreementwith Africa Vanguard Resources(Proprietary) Limited ("Africa Vanguard") on21 January 2003, in terms of whichRandfontein sold 26% of its mineral rightsin respect of the Doornkop Mining Area toAfrica Vanguard for a purchaseconsideration of R250 000 000.00 plus VAT.Randfontein and Africa Vanguard also entered into a Joint Venture Agreement onthe same day, in terms of which theyagreed to jointly conduct a miningoperation in respect of the DoornkopMining Area. The Agreements weresubject to the fulfilment of certainconditions precedent, the last of which was fulfiled on 12 August 2003. TheAgreements were implemented, and the purchase price paid on 15 August 2003."
Special resolutionsHarmony Gold Mining Company Limitedpassed a special resolution on 15 November 2002 - see table 5.
SecretaryThe secretary of the company is Ms MPvan der Walt. Her business and postaladdresses appear on page 151 of thisreport.
The secretary has, in terms of section268G(d) of the Companies Act, 1973,certified that: "All such returns as arerequired of a public company in terms ofthe Act has been made and are true,correct and up to date".
Non - Executive
A R Fleming 100 - - - 100
T A Mokhobo 100 - - - 100
M F Pleming 100 - - - 100
R W Renwick 100 - - - 100
J G Smithies - - - - -
V N Fakude 75 - - - 75
D S Lushaba 75 - - - 75
Executive**
F Abbott - 1 001 110 2 000 3 111
F Dippenaar - 927 119 2 000 3 046
T S A Grobicki* - 1 770 121 2 000 3 891
Z B Swanepoel - 1 640 196 3 000 4 836
Total 550 - 546 9 000 -
TOTAL(R’000)
SALARIES ANDBENEFITS
(R’000)
RETIREMENTCONTRIBUTIONS
(R’000)
BONUSES PAIDDURING THEYEAR (R’000)
NAME
* TSA Grobicki was seconded to Australia at the end of February 2003. His emolumentsinclude his salary received in Australian dollars
**Directors’ fees waived
DIRECTORS’FEES
(R’000)
Harmony Annual Report 2003 098
table 3
F Abbott 86 600 37.07 100.77 5 516
F Dippenaar 66 600 37.57 94.09 3 764
T S A Grobicki 161 600 33.20 102.72 11 234
Z B Swanepoel 121 150 38.47 101.46 7 631
GROSS PROFIT(R’000)
NO OFSHARES
SOLD
AVERAGECOST
PER OPTION
AVERAGEPRICE PER
SHAREREALISED
NAME
table 4
15 November 2002 Approval of acquisition of company’s own
shares, subject to the requirements of any
stock exchange upon which the company’s
shares may be quoted
RESOLUTIONEFFECTIVE DATE
table 5

Client relations isan important partof Harmony’sservice culture.”
“

TEN PEOPLE. ONE STORTEN PEOPLE. ONE STORYY..
Some people are surprised that I work for a mine. They shouldn’tbe. I went to Harmony High School. Then the Harmony BridgingSchool. That’s where I decided to go into finance instead ofengineering. I want to get onto the management level as a shaftaccountant. I’m on my way there.
After Bridging School I did a B-Com at Wits. Then I joined theHarmony finance department at Randfontein. Then made a moveto marketing.
Finance is you and accounts – in marketing you have clients andtheir queries to deal with. You have to satisfy client needs – you haveto please everybody – dealing with people from all over the world.I love the challenge. Client relations is a very important thing to learnbecause it’s an important part of Harmony’s service culture.
Each day you have to know the gold price of the day – then it’sonto E-commerce – confirmation from banks – it’s a long procedure– dealing with customer queries – and at the end of the day you shipout products. You have to be accurate in terms of pricing becausecome month-end and it’s balancing your books. The risk is the excitingpart.
It helps when you get a problem to talk to the person next to you.I speak to my manager and get input at times when I’m struggling.They’re always prepared to help, as long as the effort comes fromyou. I’ve grown working for Harmony. They give you responsibilityand allow you to make decisions.
NameElizabeth MamolapoTime at Harmony2 yearsWorks atRandfonteinStarted asStudent at HarmonyBridging SchoolPosition todaySales Person

SECTION 6
FINANCIALSTATEMENTS6.1 PAGE 103
INCOME STATEMENT6.2 PAGE 104
BALANCE SHEET6.3 PAGE 105
STATEMENT OF SHAREHOLDERS’ EQUITY6.4 PAGE 106
CASH FLOW STATEMENT6.5 PAGE 107-140
NOTES TO THE FINANCIAL STATEMENTS6.6 PAGE 141
INCOME STATEMENT (US$/IMPERIAL)6.7 PAGE 142
BALANCE SHEET (US$/IMPERIAL)
CONTENT

SECTION 6
FINANCIALSTATEMENTSIN OTHER WORDSWe have a strong balance sheet, ideally positioning us to survive profit margin pressurein the short-term, as well as enabling us to fundour long-term growth projects.
We achieved record operating profits in US Dollar terms although the stronger Randresulted in lower profits in South African Randterms. We saw our operations generating cashof R 1 767 million for the year. Shareholderswere rewarded with a total dividend of R 2.75 per share.

103
Harmony Gold Mining Company LimitedConsolidated Income StatementFor the year ended 30 June 2003
Company Group2002 2003 2003 2002
R million R million Notes R million R million
1 829 1 882 Revenue 8 995 7 806 (1 351) (1 518) Cash operating costs 2 (6 621) (5 215)
478 364 Cash operating profit 2 374 2 591
468 1 036 Interest and dividends 273 138 7 (131) Other (expenses)/income – net 4 (173) 94
(16) (14) Employment termination and restructuring costs 5 (47) (83)(54) (29) Corporate, administration and other expenditure (72) (78)
- - Exploration expenditure (75) (61)- - Marketing and new business expenditure (72) (89)- - (Loss)/profit on sale of listed investments 6 (54) 46
(187) (247) Interest paid (321) (230)696 979 Cash profit 1 833 2 328
(82) (98) Depreciation and amortisation (582) (308)(16) 10 (Provision)/reversal of provision for rehabilitation costs (5) (20)
10 - Gain on financial instruments 440 48 - - (Loss)/profit on mark-to-market of listed investments 7 (9) 595
(13) - Impairment of assets 8 (812) (362)- - Income from associates 15 57 - 1 (2) Provision for former employees' post retirement benefits (5) (2)
596 889 Income before tax 3 917 2 279 (75) (21) Taxation expense 9 (274) (583)521 868 Net income before minority interests 643 1 696
- - Minority interests 10 (4) (16)521 868 Net income 639 1 680
Basic earnings per share (cents) 11 359 1 094
Fully diluted earnings per share (cents) 11 359 1 017
Basic headline earnings per share (cents) 11 661 1 316
Fully diluted headline earnings per share (cents) 11 660 1 223
Interim dividends per share (cents) 12 125 75
Proposed final dividends per share (cents) 12 150 425
Total dividends per share (cents) 12 275 500

Harmony Annual Report 2003 104
Harmony Gold Mining Company LimitedConsolidated Balance Sheet
At 30 June 2003
Company Group2002 2003 2003 2002
R million R million Notes R million R million
AssetsNon-current assets
1 298 1 332 Property, plant and equipment 13 9 969 9 433 315 290 Investments 14 868 1 778
- 256 Investment in associates 15 1 398 291 6 219 7 511 Investments in subsidiaries 15 - -
- - Deferred taxation asset 9 37 243 49 1 Deferred finanical asset 23 1 49
7 881 9 390 Total non-current assets 12 273 11 794Current assets
211 210 Inventories 17 454 448 159 364 Receivables 18 771 685 669 1 078 Cash and cash equivalents 1 687 1 441
1 039 1 652 Total current assets 2 912 2 574 8 920 11 042 Total assets 15 185 14 368
Equity and liabilitiesShare capital and reserves
85 92 Share capital 19 92 85 5 462 6 782 Share premium 19 6 782 5 462
46 23 Fair value and other reserves 21 (242) 88 835 732 Retained earnings 1 996 2 328
6 428 7 629 Total shareholders’ equity 8 628 7 963 Minority Interest
- - Minority interest 10 120 -- - Total Minority interest 120 -
Non-current liabilities1 570 2 251 Long term borrowings 22 2 415 1 771
147 165 Deferred taxation liabilities 9 1 571 1 013 23 30 Deferred financial liabilities 23 284 1 020
134 120 Provision for environmental rehabilitation 24 624 711 5 5 Provision for post-retirement benefits 25 9 9
1 879 2 571 Total non-current liabilities 4 903 4 524 Current liabilities
587 855 Accounts payable and accrued liabilities 26 1 376 1 648 25 (18) Income and mining taxes 150 228 1 5 Shareholders for dividends 8 5
613 842 Total current liabilities 1 534 1 881 8 920 11 042 Total equity and liabilities 15 185 14 368

105
Harmony Gold Mining Company LimitedConsolidated Statement of Shareholders’ Equity
For the years ended 30 June 2003
Harmonylisted Fair value
Number of Number of Share Share options Retained and other ordinary options capital premium issued earnings reserves Total
shares issued issued R million R million R million R million R million R millionNotes 19 19 20 21
GroupBalance - 30 June 2001 144 553 291 16 607 400 72 3 727 69 672 54 4 594 Net income - - - - - 1 680 - 1 680 Dividends declared - - - - - (119) - (119)Issue of shares- Public offerings 222 300 - - 8 - - - 8 - International private placement 8 500 000 - 4 1 139 - - - 1 143
Exercise of employee share options 3 998 800 - 2 132 - - - 134 Conversion of preference shares 10 958 904 - 6 455 - - - 461 Share issue expenses - - - (42) - - - (42)Conversion of warrants 1 014 054 (1 014 054) 1 43 - - - 44 Listed options expired - (7 579 900) - - (69) 95 (26) - Foreign exchange translation - - - - - - 83 83 Mark-to-market of listed and other investments - - - - - - (87) (87)Mark-to-market of hedging instruments - - - - - - 64 64 Balance - 30 June 2002 169 247 349 8 013 446 85 5 462 - 2 328 88 7 963 Net income - - - - - 639 - 639 Dividends declared - - - - - (971) - (971)Issue of shares- Public offerings 8 000 000 - 3 1 059 - - - 1 062 - Correction of Randfontein offer 114 750 - - 4 - - - 4 Exercise of employee share options 1 846 600 - 1 64 - - - 65 Share issue expenses - - - (47) - - - (47)Conversion of warrants 5 645 416 (5 645 416) 3 240 - - - 243 Foreign exchange translation - - - - - - (325) (325)Mark-to-market of listed and other investments - - - - - - 41 41 Mark-to-market of hedging instruments - - - - - - (46) (46)Balance - 30 June 2003 184 854 115 2 368 030 92 6 782 - 1 996 (242) 8 628
CompanyBalance - 30 June 2001 144 553 291 16 607 400 72 3 727 69 364 - 4 232 Net income - - - - - 521 - 521 Dividends declared - - - - - (119) - (119)Issue of shares - Public offerings 222 300 - - 8 - - - 8 - International private placement 8 500 000 - 4 1 139 - - - 1 143 Exercise of employee share options 3 998 800 - 2 132 - - - 134 Conversion of preference shares 10 958 904 - 6 455 - - - 461 Share issue expenses - - - (42) - - - (42)Conversion of warrants 1 014 054 (1 014 054) 1 43 - - - 44 Listed options expired - (7 579 900) - - (69) 69 - - Mark-to-market of hedging instruments - - - - - - 46 46 Balance - 30 June 2002 169 247 349 8 013 446 85 5 462 - 835 46 6 428 Net income - - - - - 868 - 868 Dividends declared - - - - - (971) - (971)Issue of shares - Public offerings 8 000 000 - 3 1 059 - - - 1 062 - Correction of Randfontein offer 114 750 - - 4 - - - 4 Exercise of employee share options 1 846 600 - 1 64 - - - 65 Share issue expenses - - - (47) - - - (47)Conversion of warrants 5 645 416 (5 645 416) 3 240 - - - 243 Mark-to-market of listed and other investments - - - - - - 23 23 Mark-to-market of hedging instruments - - - - - - (46) (46)Balance - 30 June 2003 184 854 115 2 368 030 92 6 782 - 732 23 7 629

Harmony Annual Report 2003 106
Harmony Gold Mining Company LimitedConsolidated Statement of Cash Flows
For the year ended 30 June 2003
Company Group2002 2003 2003 2002
R million R million Notes R million R million
Cash flow from operations
525 (615) Cash generated from/(utilised in) operations 30 1 767 2 436 309 286 Interest received 270 125 159 750 Dividends received 3 13
(187) (247) Interest paid (321) (230)(13) (46) Income and mining taxes paid (402) (88)793 128 Net cash provided by operations 1 317 2 256
Cash flow from investing activities
(27) (25) Net increase in amounts invested in environmental trusts (34) (61)- - Cash held by subsidiaries on acquisition 31 79 154 - - Cash paid for Elandskraal Mines 31 - (210)
(17) - Cash paid for Free Gold Mines 31 - (900)- - Cash paid for Hill 50 Mines 31 - (1 419)- - Cash paid for St. Helena Mines 31 (60) - - - Cash paid for Abelle Mines 31 (769) - - (5) Cash paid for Clidet 454 (Pty) Ltd 31 - - - - Investment in Bendigo Mining NL 15 - (292)
(188) - Investment in Highland Gold acquired 15 (68) (188)- - Loan repaid by minority interest party - 90 - - Cash cost to close out hedge positions (74) (250)- - Proceeds on disposal of listed investments 876 158
(1 897) 259 (Increase)/decrease in other investments (20) (156)12 5 Proceeds on disposal of mining assets 56 34
(179) (126) Additions to property, plant and equipment (991) (733)(2 296) 108 Net cash utilised in investing activities (1 005) (3 773)
Cash flows from financing activities
375 (135) Long-term borrowings raised – net (477) 335 1 622 1 322 Ordinary shares issued 1 322 1 622
(42) (47) Shares issue expenses (47) (42)(221) (967) Dividends paid (968) (221)1 734 173 Net cash generated by financing activities (170) 1 694
- - Foreign currency translation adjustments 104 105
231 409 Net increase in cash and cash equivalents 246 282 438 669 Cash and equivalents - 1 July 2002 1 441 1 159 669 1 078 Cash and equivalents - 30 June 2003 1 687 1 441

107
Harmony Gold Mining Company LimitedNotes to the Consolidated Financial Statements
For the year ended 30 June 2003
1 ACCOUNTING POLICIES
(a) BASIS OF PREPARATION: The annual financial statements are prepared on the historical cost basis except for certain financialinstruments and equity accounted investments, which are carried at fair value. The accounting policies as set out below have beenconsistently applied, and comply with the accounting standards issued by the International Financial Reporting Standards Board, SouthAfrican Statements of Generally Accepted Accounting Practice and the South African Companies Act.
(b) USE OF ESTIMATES: The preparation of the financial statements in conformity with South African Statements of Generally AcceptedAccounting Practice and International Financial Reporting Standards requires the Company’s management to make estimates andassumptions that affect the reported amounts of assets and liabilities and disclosure of contingent assets and liabilities at the date of thefinancial statements, and the reported amounts of revenues and expenses during the reporting period. Significant estimates used bymanagement include the valuation and amortisation of mining assets and investment in associates, the valuation of other investments, as wellas estimates of exposure and liabilities with regard to rehabilitation costs, employee benefit liabilities, taxation and hedging and financialderivatives. Actual results could differ from those estimates.
(c) GROUP ACCOUNTING: The consolidated financial information includes the financial statements of the Company, its subsidiaries, itsproportionate interest in joint ventures and its interests in associates.(i) Subsidiaries, which are those entities (including special purpose entities) in which the Group has an interest of more than one half of thevoting rights or otherwise has power to govern the financial and operating policies, are consolidated. Subsidiaries are consolidated from thedate control is acquired and is no longer consolidated when control ceases. The purchase method of accounting is used to account for theacquisition of subsidiaries. The cost of an acquisition is measured as the fair value of the assets given up, shares issued or liabilitiesundertaken at the date of acquisition plus costs directly attributable to the acquisition.
Intercompany transactions, balances and unrealised gains on transactions between group companies are eliminated. Unrealised losses arealso eliminated unless cost cannot be recovered. Where necessary, accounting policies of subsidiaries have been changed to ensureconsistency with the policies adopted by the Group.
(ii) Investments in associates: An associate is an entity, other than a subsidiary, in which the Group has a material long term interest and inrespect of which the Group exercises significant influence over operational and financial policies, normally owning between 20% and 50% ofthe voting equity, but which it does not control.
Investments in associates are accounted for by using the equity method of accounting based on the most recent audited financialstatements or unaudited interim financial statements. Equity accounting involves recognising in the income statement the Group's share ofthe associate’s profit or loss for the period. The Group's interest in the associate is carried in the balance sheet at an amount that reflects thecost of the investment, the share of post acquisition earnings and other movement in reserves. The carrying value of an associate isreviewed on a regular basis and, if an impairment in the carrying value has occurred, it is written off in the period in which such permanentimpairment is identified.
Unrealised gains on transactions between the Group and its associates are eliminated to the extent of the Group's interest in the associates.Unrealised losses are also eliminated unless the transaction provides evidence of an impairment of the assets transferred. The Group'sinvestment in associates includes goodwill on acquisition, net of accumulated depreciation. When the Group's share of losses in anassociate equals or exceeds its interest in the associate, the Group does not recognise further losses, unless the Group has incurredobligations or made payments on behalf of the associates.
(iii) Investment in joint ventures: A joint venture is an entity in which the Group holds a long term interest and which is jointly controlled bythe Group and one or more venturers under a contractual arrangement. The Group's interest in jointly controlled entities is accounted for byproportionate consolidation. Under this method the Group includes its share of the joint venture's individual income and expenses, assetsand liabilities and cash flows on a line by line basis with similar items in the Group's financial statements.
The Group recognises the portion of gains or losses on the sale of assets by the Group to the joint venture that is attributable to the otherventurers. The Group does not recognise its share of profits or losses from the joint venture that result from the purchase of assets by theGroup from the joint venture until it resells the assets to an independent party. However, if a loss on the transaction provides evidence of areduction in the net realisable value of current assets or an impairment loss, the loss is recognised immediately.

Harmony Annual Report 2003 108
(iv) Goodwill represents the excess of the cost of an acquisition over the fair value of the Group's share of the net assets of the acquiredsubsidiary, associate, joint venture or business at the date of acquisition. Goodwill on acquisition of subsidiaries, joint venture and businessesis included in intangible assets. Goodwill on acquisition of associates is included in investments in associates.
Goodwill is amortised using the straight-line method over the estimated life of the underlying asset. Management determines the estimateduseful life of goodwill based on its evaluation of the respective companies at the time of the acquisition, considering factors such as potentialgrowth and other factors inherent in the acquired companies.
At each balance sheet date the Group assesses whether there is any indication of impairment. If such indications exist, an analysis isperformed to assess whether the carrying amount of goodwill is fully recoverable. A write down is made if the carrying amount exceeds therecoverable amount.
The gain or loss on disposal of an entity includes the carrying amount of goodwill relating to the entity sold.
(d) FOREIGN CURRENCIES:(i) Foreign entities: For self sustaining foreign entities, assets and liabilities are translated using the closing rates at year end, andincome statements and cash flows are translated at the average rates for the year. Differences arising on translation are taken directly toshareholders' equity, until the foreign entity is sold or otherwise disposed of, when the translation differences are recognised in theincome statement as part of the gain or loss on sale.
Goodwill and fair value adjustments arising on the acquisition of the foreign entities are treated as assets and liabilities of the foreignentity and translated at the closing rate.
(ii) Foreign currency transactions: The South African Rand is the functional currency of the Group.
Transactions in foreign currencies are converted at the rates of exchange ruling at the date of these transactions. Monetary assets andliabilities denominated in foreign currencies are translated at rates of exchange ruling at balance sheet date. Gains and losses and costsassociated with foreign currency transactions are recognised in the income statement in the period to which they relate. Thesetransactions are included in the determination of other income - net.
(iii) Convenience translations: The consolidated income statement and the consolidated balance sheet have been expressed in UnitedStates Dollars for information purposes.
For this purpose, the consolidated income statement was translated at the average rate for the year and the consolidated balance sheetat the exchange rate ruling at the balance sheet date.
(e) FINANCIAL INSTRUMENTS are initially measured at cost, including transaction costs. Subsequent to initial recognition theseinstruments are measured as set out below. Financial instruments carried on the balance sheet include cash and bank balances, moneymarket instruments, investments, receivables, trade creditors and borrowings.
(f) CASH AND CASH EQUIVALENTS are defined as cash on hand, deposits held at call with banks and short term highly liquidinvestments with insignificant interest rate risk and original maturities of three months or less. Cash and cash equivalents are measured atfair value, based on the relevant exchange rates at balance sheet date.
(g) INVESTMENTS:(i) Listed investments: Investments in listed companies, other than investments in subsidiaries, joint ventures and associates, are carriedat market value. Market value is calculated by reference to stock exchange quoted selling prices at the close of business on the balancesheet date. Changes in the carrying amount of strategic investments are credited to shareholders' equity. Movement in the carryingamount of trading securities are charged to the income statement. On disposal of an investment, the difference between the net disposalproceeds and the carrying amount is charged to the income statement. On disposal of strategic investments, amounts in the revaluationand other reserves relating to that security are transferred to the income statement.
Notes to the Consolidated Financial Statements - continued

109
(ii) Unlisted investments are reflected at fair value, or cost where fair value cannot reliably be measured. Fair value is based ondirectors' valuation. If the directors are of the opinion that that there has been a permanent impairment in the value of these investments,they are written down and recognised as an expense in the period in which the impairment is recognised. Changes in the carryingamount of strategic investments are credited to shareholders' equity.
(h) INVENTORIES which include gold in process and supplies, are stated at the lower of cost or net realisable value after appropriateallowances for redundant and slow moving items.
Stores and materials consist of consumable stores and are valued at average cost after appropriate provision for redundant and slowmoving items.
Bullion on hand and gold in process represent production on hand after the smelting process for the Group’s underground operations,predominantly located in South Africa. Due to the different nature of the Group’s open pit operations, predominantly located in Australia,gold in process represents either production in broken ore form or production from the time of placement on heap leach pads. It is valuedusing the weighted average cost method. Cost includes average production costs at the relevant stage of production.
The Group assesses the gold content of broken ore or ore placed on heap leach pads by reference to the historical recovery factorobtained for the type of broken ore and ore added to the heap leach pad.
Net realisable value is the estimated selling price in the ordinary course of business less the estimated cost of completion and theestimated cost necessary to make the sale.
(i) RECEIVABLES: Accounts receivable are stated at the gross invoice value adjusted for payments received less impairment of thesereceivables, where appropriate, to reflect the fair value of the anticipated realisable value. Bad debts are written off during the period inwhich they are identified.
(j) ACCOUNTS PAYABLE are stated at cost adjusted for payments made to reflect the value of the anticipated economic outflow ofresources.
(k) HEDGING: All derivative financial instruments are recognised on the balance sheet at their fair value, unless they meet the criteria fornormal purchase, normal sales exemption.
On the date a derivative contract is entered into, the Group designates for accounting purposes as either: a) a hedge of the fair value of a recognised asset or liability (fair value hedge);b) a hedge of a forecasted transaction (cash flow hedge);c) a hedge of a net investment in a foreign entity; ord) a derivative to be marked to market.
Certain derivative transactions, however while providing effective economic hedges under the Group’s risk management policies, do notqualify for hedge accounting.
Changes in the fair value of a derivative that is highly effective, and that is designated and qualifies as a fair value hedge, are recorded inthe income statement, along with the change in fair value of the hedged asset or liability that is attributable to the hedged risk.
Changes in the fair value of a derivative that is highly effective, and that is designated and qualifies as a cash flow hedge, are recogniseddirectly in equity. Amounts deferred in equity are included in the income statement in the same period during which the hedged firmcommitment or forecasted transaction affects net profit or loss.
Hedges of net investment in foreign entities are accounted for similarly to cash flow hedges.
Recognition of derivatives which meet the criteria for the normal purchases, normal sales exemption under the Accounting Standards arenot recognised until settlement. Under these contracts the Group must physically deliver a specified quantity of gold at a future date at aspecified price and to the contracted counter party.
Changes in the fair value of derivatives which are not designated as hedges, and do not qualify for hedge accounting are recognised inthe income statement.
Notes to the Consolidated Financial Statements - continued

Harmony Annual Report 2003 110
(l) BORROWINGS are recognised at amortised cost, comprising original debt less principal payments and amortisations, using theeffective yield method.
(m) EXPLORATION COSTS are expensed as incurred. When a decision is taken that a mining property is capable of commercialproduction, all further pre-production expenditure, including evaluation costs, are capitalised. Costs related to property acquisitions andmineral and surface rights are capitalised. Where the directors consider that there is little likelihood of the properties or rights beingexploited or the value of the exploration rights have diminished below cost, a write down is effected against exploration expenditure.
(n) PROPERTY, PLANT AND EQUIPMENT(i) Mining assets including mine development costs and mine plant facilities are initially recorded at cost, whereafter it is recorded atcost less accumulated amortisation and impairment. Costs include pre-production expenditure incurred in the development of the mineand the present value of future decommissioning costs. Interest on borrowings to specifically finance the establishment of mining assetsis capitalised until commercial levels of production are achieved. Development costs incurred to evaluate and develop new orebodies, todefine mineralisation in existing orebodies to establish or expand productive capacity are capitalised. Mine development costs in theordinary course of business to maintain production are expensed as incurred. Initial development and pre-production costs relating to a neworebody are capitalised until the orebody achieves commercial levels of production at which time the costs are amortised as set out below.
Stripping costs incurred during the production phase to remove waste ore are deferred and charged to operating costs on the basis of theaverage life of mine stripping ratio. The average stripping ratio is calculated as the number of tonnes waste material removed per tonne ofore mined. The average life of mine ratio is revised annually in the light of additional knowledge and change in estimates. The cost of "excessstripping" is capitalised as mine development costs when the actual stripping ratio exceeds the average life of mine stripping ratio.
(ii) Mining operations placed on care and maintenance: The net assets of operations placed on care and maintenance are written down tonet realisable value. Expenditure on the care and maintenance of these operations is charged against income, as incurred.
(iii) Non-mining fixed assets: Land is shown at cost and not depreciated.Buildings and other non-mining fixed assets are shown at costless accumulated depreciation.
(iv) Depreciation and amortisation of mining assets: Depreciation and amortisation of mineral property interests, mineral and surfacerights, mine development costs and mine plant facilities are computed principally by the units of production method based on estimatedproved and probable reserves. Proved and probable ore reserves reflect estimated quantities of economically recoverable reserves whichcan be recovered in future from known mineral deposits. Amortisation is first charged on mining ventures from the date on which the miningventures reach commercial production quantities.
(v) Depreciation and amortisation of non-mining fixed assets: Other non-mining fixed assets are depreciated on a straight line basis overtheir estimated useful lives as follows:- Vehicles at 20% per year;- Computer equipment at 33.3% per year;- Computer software at 50% per year; and- Furniture and equipment at 16.67% per year.
(vi) Impairment: The recoverability of the carrying value of the long-term assets of the Group, which include development costs are annuallycompared to the recoverable amount of the assets, or whenever events or changes in circumstances indicate that the net book value maynot be recoverable. The recoverable amount is the higher of value in use and net selling price.
In assessing the value in use, the expected future cash flows from the asset is determined by applying a discount rate to the anticipatedpre-tax future cash flows. The discount rate used is the Group's weighted average cost of capital as determined by the capital assetpricing model. An impairment is recognised in the income statement whenever the carrying amount of the asset exceeds its recoverableamount, to the extent that the carrying amount exceeds the asset’s recoverable amount. The revised carrying amount is amortised in linewith Group accounting policies.
A previously recognised impairment loss is reversed if the recoverable amount increases as a result of a change in the estimates used todetermine the recoverable amount. This reversal is recognised in the income statement and is limited to the carrying amount that wouldhave been determined, net of depreciation, had no impairment loss been recognised in prior years.
Notes to the Consolidated Financial Statements - continued

111
The estimates of future discounted cash flows are subject to risks and uncertainties, including the future gold price and exchange rates. Itis therefore reasonably possible that changes could occur which may affect the recoverability of mining assets.
(o) ENVIRONMENTAL OBLIGATIONS: Estimated long-term environmental obligations, comprising pollution control, rehabilitation andmine closure, are based on the Group's environmental management plans in compliance with current technological, environmental andregulatory requirements.
The net present value of future rehabilitation cost estimates are recognised and provided for in full in the financial statements. Theestimates are reviewed annually and are discounted using rates that reflect the time value of money.
Annual changes in the provision consist of finance cost relating to the change in the present value of the provision and inflationaryincreases in the provision estimate, as well as changes in estimates. The present value of environmental disturbances created arecapitalised to mining assets against an increase in the rehabilitation provision. The rehabilitation asset is amortised as noted in theGroup's accounting policy. Rehabilitation projects undertaken included in the estimates are charged to the provision as incurred. The costof ongoing current programmes to prevent and control pollution is charged against income as incurred.
(p) ENVIRONMENTAL TRUST FUNDS: Annual contributions are made to the Group's trust funds, created in accordance with statutoryrequirements, to fund the estimated cost of pollution control, rehabilitation and mine closure at the end of the life of the Group's mines.Contributions are determined on the basis of the estimated environmental obligation over the life of the mine. Income earned on moniespaid to environmental trust funds is accounted for as investment income. The funds contributed to the trusts plus growth in the trust fundsare included under investments on the balance sheet.
(q) PROVISIONS are recognised when the Group has a present legal or constructive obligation as a result of past events, where it isprobable that an outflow of resources embodying economic benefits will be required to settle the obligation, and a reliable estimate of theamount of the obligation can be made.
(r) DEFERRED TAXATION: The Group follows the comprehensive liability method of accounting for deferred tax using the balance sheetapproach. Under this method deferred income and mining taxes are recognised for the tax consequences of temporary differences byapplying expected tax rates to the differences between the tax base of certain assets or liabilities and its balance sheet carrying amount.Deferred tax is charged to the income statement except to the extent that it relates to a transaction that is recognised directly in equity, ora business combination that is an acquisition. The effect on deferred tax of any changes in tax rates is recognised in the incomestatement, except to the extent that it relates to items previously charged or credited directly to equity.
The principal temporary differences arise from amortisation and depreciation on property, plant and equipment, provisions, postretirement benefits, tax losses and/or unutilised capital allowances carried forward. Deferred tax assets relating to the carry forward ofunutilised tax losses and/or unutilised capital allowances are recognised to the extent that it is probable that future taxable profit will beavailable against which the unused tax losses and/or unutilised capital allowances can be utilised.
(s) PENSION PLANS AND OTHER EMPLOYEE BENEFITS:(i) Pension plans are funded through annual contributions. The Group's contributions to the defined contribution pension plans arecharged to the income statement in the year to which they relate. The Group's liability is limited to its annually determined contributions.
(ii) Medical plans: The Group provides medical cover to current employees and certain retirees through multiple funds. The medicalaccounting costs for the defined benefit plan are assessed using the projected unit credit method. The health care obligation ismeasured as the present value of the estimated future cash outflows using market yields consistent with the term and risks of theobligation. Actuarial gains and losses as a result of these valuations are recognised in the income statement at revaluation date. Nocontributions are made for employees retiring after 30 June 1996. A liability for retirees and their dependants prior to this date is accruedin full, based on actuarial valuations prepared every three years.
(iii) Equity compensation benefits: The Group grants share options to certain employees under an employee share plan. Costs incurredin administering the scheme are expensed as incurred. No compensation cost is recognised in these financial statements for options orshares granted to employees from employee share plans.
Notes to the Consolidated Financial Statements - continued

Harmony Annual Report 2003 112
(t) REVENUE RECOGNITION:(i) Revenue represents gold sales and is recognised when the risks and rewards of ownership has passed to the buyer with delivery fromthe refinery. Sales revenue excludes value added tax but includes the net profit and losses arising from financial derivatives that meet thedefinition of normal sale to the extent that they relate to that metal and have been matched at the date of the financial statements.
(ii) Interest income: Interest is recognised on a time proportion basis, taking into account the principal outstanding and the effective rateover the period to maturity, when it is determined that such income will accrue to the Group.
(iii) Dividend income is recognised when the shareholder's right to receive payment is established at the last date of registration.
(u) DIVIDENDS DECLARED: Dividends proposed and the related transactions thereon are recognised when declared by the Board ofdirectors. The dividends paid therefore relate to those declared in the current financial year. Dividends are payable in South AfricanRands.
Dividends declared which are payable to foreign shareholders are subject to approval by the South African Reserve Bank in terms ofSouth African foreign exchange control regulations. In practice, dividends are freely transferable to foreign shareholders.
(v) SEGMENTAL REPORTING: The primary reporting format of the Group is by business segment. As there is only one businesssegment, being mining, extraction and production of gold, the relevant disclosures have been given in the financial statements. Thesecondary reporting format is by geographical analysis by origin. The accounting policies of the segments are the same as thosedescribed in the other accounting policy notes.
(w) COMPARATIVES: Where necessary comparative figures have been adjusted to conform with changes in presentation in the currentyear.
Notes to the Consolidated Financial Statements- continued

113
2 CASH OPERATING COSTS
Company Group2002 2003 2003 2002
R million R million R million R million
Cash operating costs include mine production, transport and refinery costs, general and administrative costs, movement in inventories and ore stockpiles as well as transfers to and from deferred stripping. These costs, analysed by nature, consist of the following:
658 921 Labour costs, including contractors 3 515 2 458 261 345 Stores and materials 1 597 1 101 142 177 Water and electricity 762 47522 23 Hospital costs 89 73 (8) 25 Changes in inventory 2 (23)
276 27 Other 656 1 131 1 351 1 518 6 621 5 215
3 INCOME BEFORE TAX
Company Group2002 2003 2003 2002
R million R million R million R million
The following have been included in income before tax:6 7 Professional fees 27 32
1 2 Auditors' remuneration 5 5 1 1 Fees - current year 4 2 - 1 Fees - other services 1 3
4 OTHER (EXPENSES)/INCOME - NET
Company Group2002 2003 2003 2002
R million R million R million R million
9 4 Profit on sale of property, plant and equipment 39 21 4 (131) Foreign exchange (losses)/gains (192) 99
(6) (4) Other (expenditure)/income - net (20) (26)7 (131) (173) 94
Notes to the Consolidated Financial Statements - continued

Harmony Annual Report 2003 114
5 EMPLOYMENT TERMINATION AND RESTRUCTURING COSTS
Company Group2002 2003 2003 2002
R million R million R million R million
16 14 Free State 14 16 - - Randfontein and Elandskraal 17 36 - - Evander 11 2 - - Australian operations 5 32 - - Bissett mine - (3)
16 14 47 83
The continued process of restructuring at the Free State, Randfontein, Elandskraal and Evander operations as a result of the declining Randper kilogram gold price, has resulted in excess labour, which could not be accommodated on other shafts, becoming redundant. In May2003 Harmony announced that the Big Bell Gold Operations had exhausted all economically viable resources at prevailing or immediatelyforseeable Australian Dollar gold prices and would cease production in July 2003. A provision was raised to cover the estimated cost ofterminating the employment of 57 employees.
During the year ended 30 June 2002, the closure of Virginia 2 shaft and Harmony 4 shaft in the Free State resulted in certain excess labour,which could not be accommodated on other shafts, becoming surplus and made redundant. Elandskraal continued the process ofrestructuring, which was started in the 2001 year, which led to certain positions becoming redundant. The acquisition of Hill 50 in Australiaresulted in the merger of the New Hampton and Hill 50 operations, which led to certain restructuring and employment termination costsbeing incurred. The Bissett mine was placed on care and maintenance on 30 June 2001 due to the mining operations being uneconomic atgold prices at that time. As restructuring has been completed, over-provisions on restructuring have been reversed.
6 (LOSS)/PROFIT ON SALE OF LISTED INVESTMENTS
Company Group2002 2003 2003 2002
R million R million R million R million
- - (Loss)/profit on sale of listed investments (54) 46
During the 2003 financial year the Placer Dome shares, acquired at a total cost of R244 million, were disposed of. This investment waspreviously marked to market by R595 million, resulting in a loss of R54 million on disposal.
As part of the initial public offering of ArmGold Ltd, Harmony subscribed to 2 860 000 shares at R38,67 per share. These shares weredisposed of during the year ended 30 June 2002.
7 (LOSS)/PROFIT ON MARK-TO-MARKET OF LISTED INVESTMENTS
Company Group2002 2003 2003 2002
R million R million R million R million
- - Mark-to-market of shares in listed companies - 595- - Mark-to-market of options in listed companies (9) - - - (Loss)/profit on mark-to-market of listed investments (9) 595
With the purchase of Harmony's 31.8% interest in Bendigo Mining NL, the Company has also been granted options to acquire 360 millionshares in Bendigo any time before 31 December 2003 at Australian $0.30 per share. These options were valued at R3 million as at 30 June2003, resulting in a loss on the mark-to-market of these options of R9 million.
On 30 June 2002, a gain was recorded on the mark-to-market of listed investments of R595 million. These shares, which were purchased atAustralian $ 1.29 per share, were revalued at Australian $ 3.93 per share at year end.
Notes to the Consolidated Financial Statements - continued

115
8 (IMPAIRMENT)/REVERSAL OF IMPAIRMENT OF ASSETS
Company Group2002 2003 2003 2002
R million R million R million R million
(13) - Free State operations - 63 - - Randfontein operations - 12 - - Australian operations (812) (437)
(13) - (812) (362)
The Australian operations have reduced their reserve base from 2.3 million ounces in 2002 to 1.5 million ounces due to the currentstrength of the Australian Dollar compared to the US Dollar. This has resulted in a significant impairment to the carrying value of theseassets in Harmony's balance sheet.
The higher Rand gold price as at the end of June 2002, had resulted in significantly more economically mineable reserves beingavailable at some of the other shafts, which has extended the life of several shafts and made them more profitable. Therefore some of theimpairments of prior years have been reversed during the 2002 financial year.
Harmony completed the redevelopment programme at New Hampton's Big Bell underground mine during the year ended 30 June 2002.Production indicated however that the grade was significantly less than expected. Therefore it had been deemed prudent to reduce thegrade estimates for future production, which gave rise to a severe cut in the underground reserves at this mine. This resulted in asignificant impairment to the carrying value of this asset in Harmony's balance sheet.
9 TAXATION EXPENSE
The components of the taxation expense are the following:
Company Group2002 2003 2003 2002
R million R million R million R million
South African taxation- (3) Mining tax (158) (198)
(42) - Non-mining tax (26) (62)(33) (18) Deferred tax (292) (223)
Foreign taxation- - Current tax (155) (5)- - Prior year adjustment 45 -- - Deferred tax - normal 98 (95)- - Deferred tax - impairment of assets 214 -
(75) (21) Total taxation expense (274) (583)
Mining tax on mining income is determined on a formula basis which takes into account the profit and revenue from mining operationsduring the year. Non-mining income is taxed at a standard rate. Mining and non-mining income of Australian operations are taxed at astandard tax rate. Deferred tax is provided at the estimated expected future mining tax rate for temporary differences. Major itemscausing the Company’s income tax provision to differ from the mining statutory tax rate of 46% (2002: 46%) were:
Company Group2002 2003 2003 2002
R million R million R million R million
(274) (409) Tax on net income at statutory mining tax rate (422) (1 041)- - Valuation allowance raised against deferred tax assets 16 53
93 322 Non-taxable income / additional deductions 58 (50)42 22 Rate adjustment to reflect estimated effective mining tax rate (85) 32442 44 South African mining formula tax rate adjustment 94 98
Difference between non-mining tax rate and mining 22 - statutory rate on non-mining income 65 33
(75) (21) Income and mining tax expense (274) (583)
13% 2% Effective income and mining tax rate 30% 26%
Notes to the Consolidated Financial Statements - continued

Harmony Annual Report 2003 116
Deferred income and mining tax liabilities and assets on the balance sheet as of 30 June 2003 and 30 June 2002, relate to the following:
Company Group2002 2003 2003 2002
R million R million R million R million
Deferred income and mining tax liabilities168 176 Depreciation and amortisation 1 337 1 257 14 9 Product inventory not taxed 31 33
- - Other (mainly Australian Operations) 650 198 182 185 Gross deferred income and mining tax liability 2 018 1 488 (35) (20) Net deferred income and mining tax assets (484) (718)
- - Deferred financial liability (5) (238)- - Unredeemed capital expenditure (273) (416)
(35) (20) Provisions, including rehabilitation accruals (151) (34)- - Tax losses (55) (30)
147 165 1 534 770
The Group's net deferrred tax liability is made up as follows:
Group2003 2002
R million R million
Deferred tax assets (37) (243)Deferred tax liabilities 1 571 1 013
1 534 770
The movement in the net deferred tax liability recognised in the balance sheet is as follows:
Company Group2002 2003 2003 2002
R million R million R million R million
114 147 At the beginning of the year 770 368Acquired through the purchase of subsidiaries and businesses and the
- - finalisation of purchase prices of subsidiaries and businesses 702 9433 18 Total charge per income statement (20) 318
- - Foreign currency translation adjustments 82 (10)147 165 At the end of the year 1 534 770
As at 30 June 2003 the Group has unredeemed capital expenditure of R1 450 million (2002: R1 573 million) and tax losses carried forward ofR64 million (2002: R93 million) available for deduction against future mining income. These future deductions are utilisable against miningincome generated only from the Group’s current mining operations and does not expire unless the Group ceases to trade for a period longerthan one year.
10 MINORITY INTERESTS
The Company initiated a takeover of Abelle Limited on 26 February 2003. The offer closed on 30 April 2003. At 30 June 2003 Harmony helda controlling interest of 87%, with three members appointed to the board of Abelle on 5 May 2003. The remaining 13% shareholders aretreated as a minority interest since this date.
With effect from 1 April 2002, Harmony re-acquired the 10% participation interest in the Elandskraal Mine that it had sold to a subsidiary ofKhuma Bathong, a Black Economic Empowerment Company (BEE). This has allowed Khuma Bathong to realise its investment and pursueother opportunities in the South African mining industry. The aggregate consideration paid by Harmony to Khuma Bathong was R210 million.This was netted off against the remaining R91 million due to Harmony under its original loan of 24 April 2001 to Khuma Bathong. This 10%participation interest in Elandskraal had been disposed of in the 2001 financial year, and minority interest had been seperately accounted forduring the year ended 30 June 2002.
Notes to the Consolidated Financial Statements - continued

117
11 EARNINGS PER SHARE
Group2003 2002
R million R million
Basic earnings per shareBasic earnings per share is calculated by dividing the net income attributable to shareholders by the weighted number of ordinary sharesin issue during the year.
Net income attributable to shareholders 639 1 680
Weighted average number of ordinary shares in issue 177 954 245 153 509 862
Basic earnings per share (cents) 359 1 094
Fully diluted earnings per shareFor the diluted earnings per share, the weighted average number of ordinary shares in issue is adjusted to assume conversion of allshare options granted and warrants in issue. The average number of options used in the calculation of diluted earnings per share iscalculated by taking the average number of ordinary options allocated in terms of the share option scheme multiplied by the weightedaverage option price divided by the average price of the ordinary shares on the Johannesburg Securities Exchange of South Africa.
Weighted average number of ordinary shares in issue 177 954 245 153 509 862 Adjustments for share options (1 212 837) 7 346 070 Adjustments for warrants in issue 1 570 214 4 361 156 Weighted average number of ordinary shares for fully diluted earnings per share 178 311 622 165 217 088
Fully diluted earnings per share (cents) 359 1 017
Headline earnings per shareThe calculation of headline earnings per share is based on the basic earnings per share calculation adjusted for the following items:
Net income attributable to shareholders 639 1 680 Profit on sale of assets (61) (21)Net impairment of assets 598 362 Headline earnings 1 176 2 021
Basic headline earnings per share (cents) 661 1 316 Fully diluted headline earnings per share (cents) 660 1 223
12 DIVIDENDS DECLARED
Group2003 2002
R million R million
Interim dividend no. 76 of 125 cents per share (2002: dividend no. 74 of 75 cents) 230 119 Final dividend no. 75 for 2002 of 425 cents per share 741 -
971 119
The dividends proposed are as follows: Group
2003 2002R million R million
Dividends proposedFinal dividend no. 77 proposed of 150 cents per share (2002: dividend no. 75 proposed of 425 cents) 291 741
Dividend cover based on total declared and proposed (times)Based on attributable income 1.2 2.0 Based on headline earnings 2.3 2.4
Notes to the consolidated Financial Statements - continued

Harmony Annual Report 2003 118
The final dividend in respect of the 2003 financial year was approved on 1 August 2003. These financial statements do not reflect thefinal dividend proposed. It will be accounted for in the 2004 financial year.
The final dividend in respect of the 2002 financial year was approved on 2 August 2002. The 2002 financial statements did not reflect thefinal dividend proposed. It was accounted for in the 2003 financial year.
13 PROPERTY, PLANT AND EQUIPMENT
Company Group2002 2003 2003 2002
R million R million R million R million
1 297 1 331 Mining properties, mine development costs and mine plant facilities 9 831 9 285 1 1 Other non-mining assets 138 148
1 298 1 332 9 969 9 433
Mining properties, mine development costs and mine plant facilities
Company Group2002 2003 2003 2002
R million R million R million R million
2 267 2 361 Cost at beginning of year 14 387 8 771 - - Acquired through the purchase of subsidiaries 1 394 3 843 - - Acquired through the purchase of businesses 72 -
95 126 Additions 857 735 (1) - Disposals (20) (22)
- - Foreign currency translation adjustments (540) 1 060 2 361 2 487 16 150 14 387
1 057 1 064 Accumulated depreciation and amortisation at beginning of period 5 102 3 498- - Acquired through the purchase of subsidiaries - 515
(70) - Impairment of fixed assets 812 355 - - Disposals (6) (8)- - Foreign currency translation adjustments (158) 447
77 92 Charge for the period 569 295 1 064 1 156 6 319 5 102 1 297 1 331 Net book value 9 831 9 285
Other non-mining assets
Company Group2002 2003 2003 2002
R million R million R million R million
28 28 Cost at beginning of year 193 189 - - Additions 1 6 - - Disposals (3) (3)- - Foreign currency translation adjustments (1) 1
28 28 190 193 27 27 Accumulated depreciation and amortisation at beginning of period 45 38
- - Disposals - (3)- - Foreign currency translation adjustments (1) 2 - - Charge for the period 8 8
27 27 52 45 1 1 Net book value 138 148
1 298 1 332 Total net book value 9 969 9 433
Other non-mining assets consist of mineral subscription and participation rights, freehold land, computer equipment and motor vehicles.
Notes to the consolidated Financial Statements - continued

119
14 INVESTMENTS
Company Group2002 2003 2003 2002
R million R million R million R million
Listed investments- - Investment in Placer Dome Asia Pacific Limited (a) - 988 - 164 Investment in High River Gold Mines Limited (b) 164 - - - Investment in Midas Resources Limited (c) 5 - - 164 Total listed investments 169 988
Other investments188 - Investment in Highland Gold Limited (d) - 188
3 3 Unlisted investments and loans (e) 41 26 44 72 Amounts contributed to environmental trust funds (f) 606 487 80 51 Loan to Harmony Share Trust (g) 52 89
315 126 699 790
315 290 Total investments 868 1 778
(a) The investment consisted of 43 350 992 shares in Aurion Gold Limited (previously Goldfields Australia Limited) valued at R22.78 pershare. The shares are listed on the Australian Stock Exchange. The market value of these shares at the close of business on 30 June2002 by reference to stock exchange quoted prices and closing exchange rates was R988 million. On 29 July 2002, this investment wasdisposed of to Placer Dome Asia Pacific Limited for a total consideration of R764 million. R83 million was paid in cash and R681 millionby way of exchange for shares in Placer Dome. This investment was subsequently disposed of at a total loss of R54 million. No dividendswere received during the year from Placer Dome (2002: R11 million).
(b) On 22 November 2002, the Company purchased 17 074 861 shares in High River Gold Mines Limited for R141 million. High RiverGold Mines Limited is a company subject to the laws of Ontario, Canada, that is listed on the Toronto Stock Exchange and holds goldmining assets in Russia, Canada and West Africa. This 21% investment was acquired at a discount of 16% ($0.85 cents per share) fromthe 30 day weighted average share price for the 30 day period prior to the execution of the agreement with Jipangu, a Japeneseinvestment house. Share issues subsequent to acquisition has effectively diluted the Company's shareholding to 16%. The market valueof the investment was R164 million on 30 June 2003, resulting in an increase of R23 million since acquisition, which is reflected as equityreserves. Refer to note 21 for more detail.
(c) In February 2003 Aurora Gold WA (Pty) Ltd, a subsidiary of Abelle Limited, sold its Lake Carey tenements to Midas ResourcesLimited. The consideration received was A$ 3 million plus 10 000 000 ordinary shares, fully paid, issued at A$ 0.20 per share. As at 30June 2003 the market value of the shares in Midas Resources was R5 million (A$ 0.10 per share). Midas Resources Limited is a goldexploration company, which is listed on the Australian Stock Exchange.
(d) The company acquired a strategic 32.5% shareholding in Highland Gold Limited on 31 May 2002 for US$18 million. Highland GoldLimited is a Jersey based company which holds Russian gold assets, comprising a producing gold mine together with projects andpotential projects at various stages of development. The investment has been accounted for as an investment in an associate in July 2002, when the Company appointed a director on the board of Highland Gold Limited.
(e) Unlisted investments comprise various industry related investments and loans, which have been valued by the directors. The directorsof the Company perform independent valuations of the investments on an annual basis to ensure that no permanent impairment in thevalue of the investments has occurred. No dividends were received from these investments during the current financial year (2002: R2 million).
(f) The environmental trust funds are irrevocable trusts under the Group’s control. The monies in the trusts are invested primarily in interestbearing short-term and other investments and approximate their fair value. These investments provide for the estimated cost ofrehabilitation during and at the end of the life of the Group’s mines. Income earned on monies paid to the trusts is accounted for asinvestment income. The funds contributed to the trusts are included under held to maturity investments. These investments are restrictedin use and may only be used to fund the Group’s approved rehabilitation costs.
(g) A loan of R52 million (2002: R89 million) was made to the Harmony Share Trust to acquire 1 382 842 shares (2002: 2 716 600 shares)for employees participating in the Harmony Share Option Scheme. Refer to note 28 for detail on the share option scheme.
Notes to the consolidated Financial Statements - continued

Harmony Annual Report 2003 120
15 INVESTMENT IN ASSOCIATES AND SUBSIDIARIES
Listed investment in associates
Company Group2002 2003 2003 2002
R million R million R million R million
- - Opening carrying amount (a) 291 - - 256 Shares acquired at cost (b and c) 1 102 306 - - Mark-to-market of listed options (9) - - - Share of results after tax 57 (14)- 256 1 441 292 - - Exchange differences (43) (1)- 256 Closing carrying amount 1 398 291
(a) As at 30 June 2003 the Group held 294 222 437 shares in Bendigo Mining NL, a company incorporated in Australia. The investmentrepresents 31.8% interest in a single project gold company, listed on the Australian Stock Exchange. The company is developing virginunderground orebodies which have been proved to exist beneath old workings which made up this gold field, which closed in the early1950's after 100 years of continious production. During the year ended 30 June 2002, all pre-production costs were capitalised. Themarket value of this investment as determined by closing prices on the Australian Stock Exchange at the close of business and closingexchange rates amounted to R276 million (2002: R503 million). Harmony has also been granted options to acquire 360 million shares inBendigo any time before 31 December 2003 at Australian $0.30 per share. Included in the income statement is an amount of R9 millionrelating to a loss on the mark-to-market of these listed options. Refer to note 7 for more detail.
The Group's interest of 31.8% in the summarised balance sheet of Bendigo Mining NL is as follows:
2003 2002R million R million
Capital and reserves 36 79 Non-current liabilities 3 2
39 81
Fixed assets 8 6 Net current assets 31 75
39 81
(b) The Company acquired a strategic shareholding of 32 500 000 shares in Highland Gold Limited on 31 May 2002, for R188 million. Onlisting on the Alternative Investment Market of the London Stock Exchange in December 2002, Highland Gold issued additional shares.This diluted the Company's initial investment of 32.5% to 31.7% after an additional 2 511 947 shares were purchased for R68 million.Highland Gold is a Jersey based company which holds Russian gold assets, comprising a producing gold mine together with projectsand potential projects at various stages of development. Highland Gold’s financial year ended at 31 December 2002. For the remainder ofthe Group’s accounting period, unaudited management accounts were used to compile the Group’s results. The market value of thisinvestment as determined by closing prices on the Alternative Investment Market of the London Stock Exchange at the close of businessand closing exchange rates amounted to R963 million.
The Group's interest of 31.7% in the summarised balance sheet of Highland Gold Limited as at 30 June 2003 is as follows:
2003 2002R million R million
Capital and reserves 229 - Non-current liabilities 38 -
267 -
Fixed assets 126 - Other non-current assets 41 - Net current assets 100 -
267 -
Notes to the consolidated Financial Statements - continued

121
(c) The Group has acquired a 17.25% interest in Anglovaal Mining Ltd (Avmin) through its 50% interest in a joint venture with ARMgoldLimited, Clidet 454 (Pty) Ltd. (Refer to note 16(b)). The joint venture company purchased 27 786 362 shares in Avmin from AngloAmerican Plc for R1 209 million on 8 May 2003 and a further 11 003 399 shares for R478 million on 14 May 2003, giving a combinedinterest of 34.5% in the issued share capital of Avmin. Avmin is listed on the Johannesburg Securities Exchange and has interests inoperating gold, manganese, iron, chrome, platinum, and nickel mines in South Africa, as well as cobalt and copper mines in Zambia. Asat 30 June 2003, Clidet's 34.5% investment in Avmin was valued at R1 552 million by reference to the stock exchange quoted price ofR40.00 per share.
The Group's interest of 17.25% in the summarised balance sheet of Anglovaal Mining Limited is as follows:
2003 2002R million R million
Capital and reserves 1 038 - Non-current liabilities 232 -
1 270 -
Fixed assets 1 133 - Other non-current assets 46 - Net current assets 91 -
1 270 -
Unlisted investments in subsidiaries
Company2002 2003
R million R million
3 282 5 146 Shares at fair value (refer Annexure A)2 937 2 365 Loans to subsidiaries (refer Annexure A)6 219 7 511 Total investment in subsidiaries
16 INTEREST IN JOINT VENTURES
(a) Interest in ArmGold/Harmony Freegold Joint Venture Company (Pty) Ltd
The Group has a 50% interest in a joint venture with ARMgold Limited, the ArmGold/Harmony Freegold Joint Venture Company (Pty) Ltd,which operates as a gold mining company in the Welkom area of the Free State goldfields. The joint venture company purchased the FreeGold and Joel assets from AngloGold Limited for R2 881 million and took operational control of these assets on 3 January 2002. Thefollowing amounts represent the Group's share of the assets and liabilities and revenue and expenses of the joint venture and areincluded in the consolidated balance sheet and income statement and cash flow statement:
Group2003 2002
R million R million
Property, plant and equipment 1 415 1 079 Investments 278 229 Current assets 390 571
2 083 1 879 Non-current interest-bearing borrowings 164 517 Non-current intergroup borrowings 719 907 Deferred income and mining taxes 312 (213)Provision for environmental rehabilitation 160 200 Provision for post-retirement benefits 1 1 Current liabilities 145 181
1 501 1 593 Net assets 582 286
Income 1 861 938Expenses (1 401) (516)Profit before tax 460 422 Taxation (164) (136)Profit after tax 296 286
Notes to the consolidated Financial Statements - continued

Harmony Annual Report 2003 122
Operating cash flows 556 525 Investing cash flows (105) (922)Financing cash flows (687) 900 Total cash flows (236) 503
Proportionate interest in joint venture commitments 426 14
There are no contingencies relating to the Group's interest in the joint venture. The number of employees in the joint venture was 17 146(2002: 13 734) at year end.
(b) Interest in Clidet 454 (Pty) Ltd
The Group has a 50% interest in a joint venture with ARMgold Limited, Clidet 454 (Pty) Ltd. The joint venture company purchased a24.7% interest in Anglovaal Mining Limited from Anglo American Plc for R1 209 million on 8 May 2003 and a 9.8% interest for R478 millionon 14 May 2003. The following amounts represent the Group's share of the assets and liabilities and revenue and expenses of the jointventure and are included in the consolidated balance sheet and income statement and cash flow statement:
Group2003 2002
R million R million
Investment in associate 867 - 867 -
Non-current intergroup borrowings 846 - 846 -
Net assets 21 -
Equity accounted income 21 -
Group2003 2002
R million R million
Operating cash flows - - Investing cash flows (846) - Financing cash flows 846 - Total cash flows - -
Proportionate interest in joint venture commitments - -
There are no contingencies relating to the Group's interest in the joint venture.
17 INVENTORIES
Company Group2002 2003 2003 2002
R million R million R million R million
100 75 Gold in-process and bullion on hand 278 286 111 135 Stores and materials at average cost 176 162 211 210 454 448
Harmony’s and Elandskraal’s gold in-process and bullion on hand are valued at net realisable value to the amount of R75 million and R20million respectively. All the other operations’ gold in-process are valued at cost.
Notes to the consolidated Financial Statements - continued

123
18 RECEIVABLES
Company Group2002 2003 2003 2002
R million R million R million R million
25 23 Value added tax 68 92 23 32 Trade receivables 147 103
114 259 Gold receivables 355 194 (3) 50 Interest and other 201 296
159 364 771 685
19 SHARE CAPITAL AND SHARE PREMIUM
Share capitalAuthorised250 000 000 (2002: 250 000 000) ordinary shares of 50 cents each
10 958 904 (2002: 10 958 904) redeemable convertible preference shares of 50 cents each
Issued184 854 115 (2002: 169 247 349) ordinary shares of 50 cents each
Company Group2002 2003 2003 2002
R million R million R million R million
72 85 Ordinary shares of 50 cents each at 1 July 2002 85 72 2 1 Issued in terms of the share option scheme 1 2 4 3 Issued for cash 3 4 6 - Conversion of preference shares - 6 1 3 Warrants converted 3 1
85 92 Balance as at 30 June 2003 92 85
5 462 6 782 Share premium 6 782 5 462
The unissued shares are under the control of the Directors until the forthcoming Annual General Meeting. The directors’ report and note28 set out details in respect of the share option scheme.
The Company has a general authority to purchase its shares up to a maximum of 20% of the issued share capital in any one financialyear. This is in terms of the annual general meeting of shareholders on 15 November 2002. The general authority is subject to the ListingsRequirements of the Johannesburg Securities Exchange South Africa and the Companies Act no 61 of 1973 of South Africa, as amended.
20 HARMONY LISTED OPTIONS AND WARRANTS
In terms of a transaction dated 29 June 2001, 27 082 500 ordinary shares and 9 027 500 options to purchase 9 027 500 additionalordinary shares were issued. Ordinary shares were purchased in integral multiples of three and investors received one option for everythree shares purchased. Each option entitled its holder to purchase, on any business day on or before 28 June 2003, one ordinary shareat South African Rand 43.00. As at 30 June 2003, 6 659 470 (2002: 1 013 554) options were exercised, leaving a balance of 2 368 030(2002: 8 013 946) options that will be issued in the 2004 financial year. These warrants were traded on the JSE Securities Exchange.
Options were also exercisable at a price of South African Rand 60.00, at which time they could have been converted into ordinary sharesof the Company, on or before 31 July 2001. None of the options were exercised and they lapsed during the 2002 financial year.
Notes to the consolidated Financial Statements - continued

Harmony Annual Report 2003 124
21 FAIR VALUE AND OTHER RESERVES
Company Group2002 2003 2003 2002
R million R million R million R million
- - Foreign exchange translation reserve (261) 64 - 23 Mark-to-market of listed investments 41 -
46 - Mark-to-market of financial instruments - 46 - - Other (22) (22)
46 23 (242) 88
The balance of the foreign exchange translation reserve represents the cumulative translation effect of the Company's off shoreoperations.
On 22 November 2002, the company purchased 17,1 million shares in High River Gold Mines Limited, a Toronto listed company, for atotal consideration of R141 million. The market value of the investment as at 30 June 2003 was R164 million, resulting in an increase ofR23 million since acquisition. On 3 June 2003 Abelle Limited completed the acquisition of the remaining 50% of the Morobe Gold Projectfrom CDC Financial Services Limited and Kula Fund Limited. In consideration Abelle paid US$ 10 million cash plus 12 million issuedoptions, expiring on 30 June 2007 and exercisable at A$ 1.00 per option. As at 30 June 2003, the options were valued at R18 million.
The mark-to-market of financial instruments as at 30 June 2002, related to the currency hedge taken out in Harmony. Refer to note 29 fordetail on financial instruments.
The different categories of fair value and other reserves are made up as follows:
Company Group2002 2003 2003 2002
R million R million R million R million
Foreign exchange translation reserve- - At the beginning of the year 64 (19)- - Current year's foreign exchange movement (325) 83 - - At the end of the year (261) 64
Mark-to-market of listed investments- - At the beginning of the year - 87 - - Reclassification of mark-to-market on Aurion Gold - (87)- - Mark-to-market of Abelle's options 18 - - 23 Mark-to-market of High River Gold investment 23 - - 23 At the end of the year 41 -
Mark-to-market of financial instruments- 46 At the beginning of the year 46 (18)
46 (46) Mark-to-market of currency hedge (46) 64 46 - At the end of the year - 46
Other reserves- - At the beginning of the year (22) 4 - - Listed options expired - (26)- - At the end of the year (22) (22)
Notes to the consolidated Financial Statements - continued

125
22 BORROWINGS
Long term borrowings
Company Group2002 2003 2003 2002
R million R million R million R million
Unsecured1 200 1 200 Senior unsecured fixed rate bonds (a) 1 200 1 200
(21) (30) Fair value adjustment (30) (21)(20) (15) Less: amortised discount and bond issue costs (15) (20)
1 159 1 155 Total unsecured long term borrowings 1 155 1 159
Secured36 68 BAE Systems Plc (b) 68 36
- (68) Less: short term portion (68) - 36 - - 36
500 375 BOE loan (c) 375 500 (125) (125) Less: short term portion (125) (125)
375 250 250 375
- - AngloGold Ltd (d) 161 517 - - Less: short term portion - (316)- - 161 201
- - Gold Fields Ltd (e) 4 - - - Less: short term portion (1) - - - 3 -
- 850 Nedbank (f) 850 - - (4) Less: amortised issue costs (4) - - 846 846 -
411 1 096 Total secured long term borrowings 1 260 612
1 570 2 251 Total long term borrowings 2 415 1 771
(a) On 16 June 2001, Harmony launched and priced an issue of senior unsecured fixed rate bonds in an aggregate principal amount ofR1 200 million, with semi-annual interest payable at a rate of 13% per annum. These bonds will be repayable on 14 June 2006, subject toearly redemption at Harmony's option. The bonds are listed on the Bond Exchange of South Africa. The bonds were issued to settleexisting debt and fund the purchase of Elandskraal and New Hampton. As long as the bonds are outstanding, Harmony will not permitencumbrances on its present or future assets or revenues to secure indebtness for borrowed money, without securing the outstandingbonds equally and ratably with such indebtedness, except for certain specified permitted encumbrances. Including in the amortisationcharge as per the income statement is R5 million (2002: R5 million) for amortisation of the bond issue costs.
(b) The loan from BAE Systems Plc is a US Dollar denominated term loan of R68 million ($9.0 million) (2002: R36 million ($3.5 million)) forfinancing the design, development and construction of a facility for the manufacture and sale of value added gold products at Harmony'spremises in the Free State. The loan is secured by a notarial covering bond over certain gold proceeds and other assets and is repayablein full on 30 April 2004. The loan bears interest at Libor plus 2% which is accrued daily from the drawdown date and interest is repayableon a quarterly basis.
(c) On 18 April 2002, Harmony entered into a term loan facility of R500 million with BOE Bank Limited for the purpose of partially fundingHarmony's acquisition of shares in the ArmGold/Harmony Freegold Joint Venture Company (Pty) Limited and loans made by Harmony tothe Free Gold company in connection with the acquisition of mining assets. The facility is collateralised by a pledge of Harmony's sharesin the Freegold Joint Venture Company and is guaranteed by Randfontein, Evander, Kalgold and Lydex. The loan is repayable in full on23 April 2006 by way of eight semi-annual capital installments which are due beginning 23 October 2002. The loan bears interest at arate equal to the JIBAR rate for deposits in Rand plus 1.5% plus specified costs, which is accrued daily from the drawdown date and ispayable quarterly in arrears commencing 23 July 2002. The following restrictive covenants apply:(i) A consolidated net worth must be more than R4 600 million;(ii) The total debt to EBITDA ratio not to exceed 1.5; and(iii) EBITDA to total debt service ratio should not be less than 3.5.
Notes to the consolidated Financial Statements - continued

Harmony Annual Report 2003 126
(d) On 24 December 2001, Free Gold entered into an agreement with AngloGold Limited to purchase its Free Gold assets for R2 881 million.R1 800 million was payable on 1 January 2002 at the call rate from this date untill the 10th business day after the date of fulfilment of thelast of the conditions precedent. R 400 million is payable on 1 January 2005 at no interest charge. The balance of the consideration waspayable five business days before AngloGold was obliged to pay recoupment tax, capital gains tax and any other income tax on thedisposal of the assets at no interest charge. Harmony's 50% portion of the outstanding loan balance at 30 June 2003 was R161 million(2002: R517 million), which was proportionately consolidated.
(e) On 1 July 2002, Free Gold entered into an agreement with St Helena Gold Mines Limited, a fully owned subsidiary of Gold Fields Limited,to purchase its St Helena assets for R129 million. R120 million was payable on 29 October 2002, being the effective date after thefulfilment of all the conditions precedent. The balance of R9 million is payable by way of a 1% royalty on turnover, monthly in arrears, for aperiod of 48 months, commencing on the 10th of the month following the effective date. Harmony's 50% portion of the outstanding loanbalance as at 30 June 2003 was R4 million, which was proportionately consolidated.
(f) On 8 May 2003, Harmony Gold entered into a term loan agreement with Nedbank Limited for R850 million. The purpose of this term loanagreement was to fund the acquisition of 17.25% of Anglovaal Mining Limited. This term loan was paid out in two tranches, the firsttranche of R611 million was paid on 8 May 2003 and the second tranche of R239 million was paid on 13 May 2003. The loan is securedwith guarantees provided by Evander Gold Mines Limited, Randfontein Estates Limited, Kalahari Goldridge Mining Company Limited andLydenburg Exploration Limited and is repayable in full on 8 November 2004. The loan bears interest at the 3 month JIBAR rate, plus amargin of 1.5% as well as stamp duties, liquid and reserving costs all converted to a nacq (nominal annual compounded quarterly inarrears) rate. Interest is repayable on a quarterly basis. Including in the amortisation charge as per the income statement is R0.5 million(2002: R nil) for amortisation of the loan costs.
Other borrowingsThe level of the Company's borrowing powers, as determined by its Articles of Association, is such that, taking into account theobligations as at 30 June 2003, the Company will have unrestricted access to loan financing for its reasonably foreseeable requirements.At year end, total borrowings amounted to R2 609 million (2002: R2 212 million).
23 DEFERRED FINANCIAL LIABILITY/(ASSET)
Company Group2002 2003 2003 2002
R million R million R million R million
- 29 Mark-to-market of speculative financial instruments at year end 283 84 (26) - Mark-to-market of hedging financial instruments at year end - 887 (26) 29 283 971
The Group’s net financial liability/(asset) is made up as follows: (49) (1) Deferred financial assets (1) (49)
23 30 Deferred financial liabilities 284 1 020 (26) 29 283 971
During this financial year, a significant portion of the inherited hedge books of both New Hampton and Hill 50, were closed out at a costof R69 million (US$8 million). The outstanding contracts are now treated as speculative and the marked to market movement will bereflected in the income statement.
During the previous financial year, the inherited Randfontein hedge book, which had been treated as speculative, was closed out at acost of R135 million after tax. The hedge contracts of both New Hampton and Hill 50 were restructured towards the end of the 2002financial year, to normal purchase, normal sale agreements by which Harmony was obliged to physically deliver specified quantities ofgold at future dates, subject to the pricing arrangements described below. Due to the closure of the hedge agreements as mentionedabove, these contracts are now treated as speculative.
Refer to note 29 for more detail on the outstanding financial instruments.
Notes to the consolidated Financial Statements - continued

127
24 PROVISION FOR ENVIRONMENTAL REHABILITATION
Company Group2002 2003 2003 2002
R million R million R million R million
Provision raised for future rehabilitation120 134 Opening balance 711 427
- - Acquisition of subsidiaries 30 264 - - Finalisation of purchase price of subsidiary (66) -
14 (14) (Reversal of provision)/charge to income statement (25) 20 - - Exchange differences (26) -
134 120 Closing balance 624 711
While the ultimate amount of rehabilitation costs to be incurred in the future is uncertain, the Group has estimated that based on currentenvironmental and regulatory requirements, the total cost for the mines, in current monetary terms, will be R969 million (2002: R1 085million).
Included in the charge to the income statement is an amount of R51 million (2002: R40 million) relating to the time value of money.
The movements in the investments in the Group Environmental Trust Funds, were as follows:
16 44 Opening balance 487 193 - - Transferred from other trust funds 17 222 3 6 Interest accrued 69 23
27 25 Contributions made 36 50 (2) (3) Reimbursement of costs incurred (3) (1)44 72 Closing balance 606 487
230 241 Ultimate estimated rehabilitation cost 969 1 085(44) (72) Amounts invested in Environmental Trust Funds (606) (487)186 169 Future net obligations 363 598
The Group intends to finance the ultimate rehabilitation costs from the money invested with the environmental trust funds, ongoingcontributions, as well as the proceeds on sale of assets and gold from plant clean-up at the time of mine closure.
25 POST-RETIREMENT BENEFITS
(a) PENSION AND PROVIDENT FUNDS: The Group contributes to several pension and provident funds governed by the Pension FundsAct 1946, for the employees of its South African subsidiaries. The pension funds are multi-employer industry plans. The Group’s liability islimited to its annually determined contributions.
The provident funds are funded on the ‘‘money accumulative basis’’ with the member’s and employer’s contributions having been fixed inthe constitution of the funds.
The Australian group companies make contributions to each employee's Superannuation (pension) fund in accordance with theSuperannuation Guarantee Scheme (SGS). The SGS is a Federal Government initiative enforced by law which compels employers tomake regular payments to regulated funds providing for each employee on their retirement. The Superannuation Guarantee Contributionswere set at a minimum of 9% of gross salary and wages for the 2003 year (2002: 8%).
Substantially all the Group’s employees are covered by the above mentioned retirement benefit plans. Funds contributed by the Group forfiscal 2003 amounted to R187 million (2002 : R191 million).
(b) POST-RETIREMENT BENEFITS OTHER THAN PENSIONS: Skilled workers in South Africa participate in the Minemed medicalscheme, as well as other medical schemes. The Group contributes to these schemes on behalf of current employees and retiredemployees who retired prior to 31 December 1996 (Minemed scheme). The annual contributions for these retired employees are fixed.The Group’s contributions to these schemes on behalf of current employees amounted to R40 million for both 2003 and 2002.
No post-retirement benefits are available to other workers. No liability exists for employees who were members of these schemes whoretired after the date noted above. The medical schemes pay certain medical expenses for both current and retired employees and theirdependents. Current and retired employees pay an annual fixed contribution to these schemes.
An updated actuarial valuation was carried out during the 2002 fiscal year on the Minemed medical scheme following the last actuarialvaluation in fiscal 2000.
Assumptions used to determine the liability relating to the Minemed medical scheme included investment returns of 12%, no increases inemployer subsidies (in terms of the agreement) and mortality rates according to the SA ‘‘a mf’’ tables and a medical inflation rate of 0% to 7%.
Notes to the consolidated Financial Statements - continued

Harmony Annual Report 2003 128
The provision for former employees’ post retirement benefits comprise medical benefits for former employees who retired. The amountswere based on an actuarial valuation conducted during the year ended 30 June 2002.
Company Group2002 2003 2003 2002
R million R million R million R million
The amounts recognised in the balance sheet are as follows:5 5 Present value of unfunded obligation 9 9
The amounts recognised in the income statement are as follows:1 - Interest cost - 2 - - Additional liability raised - Elandskraal - 1 - 2 Benefits paid 5 3
(2) - Net actuarial gains - (5)(1) 2 5 1
The movement in the liability recognised in the balance sheet is as follows:6 5 At the beginning of the year 9 8
(1) - Total expenses - 1 5 5 At the end of the year 9 9
The principal actuarial assumptions used for accounting purposes were:12% 12% Discount rate 4%-12% 4%-12%0% 0% Assumed medical subsidy inflation 0%-7% 0%-7%
26 ACCOUNTS PAYABLE AND ACCRUED LIABILITIES
Company Group2002 2003 2003 2002
R million R million R million R million
216 330 Trade payables 410 263 125 193 Short term portion of long term borrowings 194 441
- - Short term borrowings 17 36 149 155 Payroll and leave liabilities 374 408 72 58 Accruals 298 32525 119 Other liabilities 83 175
587 855 1 376 1 648
Leave liabilityEmployee entitlements to annual leave are recognised on an ongoing basis. A provision is made for the estimated liability for annual leaveas a result of services rendered by employees up to the balance sheet date. The movement in the liability recognised in the balancesheet is as follows:
37 40 At the beginning of the year 138 100 - - Acquired through the purchase of subsidiaries 1 18- - Acquired through the purchase of businesses 3 -
(40) (49) Benefits paid (156) (119)43 55 Total expenses per income statement 150 13940 46 At the end of the year 136 138
Notes to the consolidated Financial Statements - continued

27 EMPLOYEE BENEFITS
Group2003 2002
NUMBER OF PERMANENT EMPLOYEES:Harmony Free State 12 317 12 644 Evander 6 770 7 384 Kalgold 229 222 Randfontein 7 154 7 455 Elandskraal 6 611 7 559 Australian Operations 255 309 Bissett 6 6 Exploration 12 20
33 354 35 599 Freegold Joint Venture (50%) 8 573 6 867 Total 41 927 42 466
Group2003 2002
R million R million
AGGREGATE EARNINGS:The aggregate earnings of employees including directors were:Salaries and wages and other benefits 2 502 1 780 Retirement benefit costs 187 191 Medical aid contributions 40 40
2 729 2 011
The aggregate earnings for the 2003 financial year include the earnings of Free Gold and Hill 50 for the full 12 month period. Theearnings of the 2002 financial year only included the earnings of Free Gold for 6 months and Hill 50 for 3 months.
Directors' remuneration is fully disclosed in the directors’ report.
28 SHARE OPTION SCHEMES
The Company has an Employee Share Option Scheme (‘‘Harmony Share Option Scheme’’) hereunder referred to as the HSOS schemeunder which certain qualifying employees may be granted options to purchase shares in the Company’s authorised but unissued ordinaryshares. Of the total of 8 000 000 ordinary shares under the specific authority of the directors in terms of the Harmony (2001) Share OptionScheme, 7 528 100 shares have been offered to participants leaving a balance of 471 900. In addition a total of 1 065 400 shares werestill outstanding under the Harmony (1994) Share Option Scheme. In terms of the rules of the HSOS scheme, the exercise price of theoptions granted is equal to fair market value of the shares at the date of the grant.
Options currently expire no later than 10 years from the grant date and annually from the grant date, a third of the total options grantedare exercisable. Proceeds received by the Company from the exercise are credited to share capital and share premium.
Share option activity was as follows:Number Averageof share exerciseoptions price granted per share
SA Rand
Balance as at 30 June 2001 5 791 700 - Share options granted during the year 5 968 200 - Share options exercised during the year (2 682 900) 26.88 Balance as at 30 June 2002 9 077 000 - Share options granted during the year 1 311 000 - Share options lapsed (461 800)Share options exercised during the year (2 243 300) 37.04 Balance as at 30 June 2003 7 682 900 -
The details pertaining to share options issued and exercised by directors during the year are disclosed in the directors' report.
The number of shares held by the Harmony Share Trust at year end amounted to 1 219 500 (2002: 2 185 200).
Notes to the consolidated Financial Statements - continued
129

Harmony Annual Report 2003 130
The following table summarises the status of share options oustanding at 30 June 2003:
Grant Number Option price date of options (Rand)
2 December 1997 13 750 11.70 21 September 1999 146 100 22.90 23 February 1999 7 000 25.75 15 November 2000 334 000 27.20 13 January 2000 248 050 35.40 24 April 2001 316 500 36.50 20 November 2001 5 276 500 49.60 2 February 2002 30 000 93.00 27 March 2003 1 311 000 91.60
7 682 900
29 DERIVATIVE FINANCIAL INSTRUMENTS AND FAIR VALUE AND CREDIT RISK OF FINANCIAL INSTRUMENTS
Harmony is exposed to market risks, including credit risk, foreign currency, commodity price, interest rate and liquidity risk associatedwith underlying assets, liabilities and anticipated transactions. Following periodic evaluation of these exposures, Harmony may enter intoderivative financial instruments to manage these exposures. Harmony does not issue derivative financial instruments for trading orspeculative purposes.
Commodity price sensitivityAs a general rule, Harmony sells its gold production at market prices. Harmony, generally, does not enter into forward sales, derivativesor other hedging arrangements to establish a price in advance for the sale of its future gold production. A significant proportion ofRandfontein Estate’s, New Hampton's and Hill 50’s production was however already hedged when they were acquired by Harmony.
During this financial year, a significant portion of the inherited hedge books of both New Hampton and Hill 50, were closed out at a costof R69 million (US$8 million). The outstanding contracts are now treated as speculative and the marked-to-market movement will bereflected in the income statement.
During the previous financial year, the inherited Randfontein hedge book, which had been treated as speculative, was closed out at acost of R250 million (US$22 million). The contracts of both New Hampton and Hill 50 were restructured towards the end of the 2002financial year, to normal purchase, normal sale agreements by which Harmony was obliged to physically deliver specified quantities ofgold at future dates, subject to the pricing arrangements described below. Due to the closure of the hedge agreements as mentionedabove, these contracts are now treated as speculative.
Maturity schedule of the Harmony Group’s commodity contracts by type as at 30 June 2003
30 June 30 June 30 June 30 June 30 June 30 June2004 2005 2006 2007 2008 2009 Total
Forward Sales AgreementsOunces 100 000 175 000 108 000 147 000 100 000 100 000 730 000 A$ / ounce 513 513 510 515 518 518 514
Calls Contracts SoldOunces 95 000 130 000 40 000 - - - 265 000 A$ / ounce 540 512 552 - - - 528
195 000 305 000 148 000 147 000 100 000 100 000 995 000
These contracts are classified as speculative and the marked-to-market movement is reflected in the income statement.
The mark-to-market of these contracts was a negative value of R254 million (US$34 million) as at 30 June 2003. These values were basedon a gold price of US$ 346 (A$ 514) per ounce, exchange rates of US$ / R7.51 and A$ / US$ 0.67 and prevailing market interest rates atthe time. These valuations were provided by independent risk and treasury management experts.
Notes to the consolidated Financial Statements - continued

Maturity schedule of the 26% direct and indirect interest in the commodity contracts of Avgold as at 30 June 2003:
30 June 30 June 30 June2004 2005 2006 Total
Forward Sales AgreementsOunces 76 591 76 378 36 802 189 771 US$ / ounce 313 316 323 316
After the merger with ARMgold, the Group will have 26% direct and indirect interest in Avgold, including the 11.5% interest acquireddirectly by Harmony on 15 July 2003. The mark-to-market of Harmony's interest in these contracts was a negative value of R50 million (US$7 million).
Maturity schedule of the Harmony Group’s commodity contracts by type as at 30 June 2002:
30 June 30 June 30 June 30 June 30 June 30 June 30 June2003 2004 2005 2006 2007 2008 2009 Total
Forward Sales AgreementsOunces 425 792 229 000 205 000 187 500 125 000 100 000 100 000 1 372 292 A$ / ounce 514 522 524 523 514 518 518 519
Calls Contracts SoldOunces 62 425 175 500 130 000 40 000 - - - 407 925 A$ / ounce 545 544 512 552 - - - 535
Put Contracts BoughtOunces 33 000 - - - - - - 33 000 A$ / ounce 500 - - - - - - 500
521 217 404 500 335 000 227 500 125 000 100 000 100 000 1 813 217
The contracts were treated as normal purchase, normal sales contracts.
The mark-to-market of these contracts was a negative value of R913 million (US$88 million) as at 30 June 2002. These values were based ona gold price of US$316 (A$557) per ounce, exchange rates of R/US$10.39 and US$/A$ 0.57 and prevailing market interest rates andvolatilities at the time. These valuations were provided by independent risk and treasury management experts.
Foreign currency sensitivityIn the ordinary course of business, Harmony enters into transactions denominated in foreign currency (primarily US Dollars). In addition, theGroup has investments and liabilities in Canadian, Australian and US Dollars. As a result Harmony is subject to transaction and translationexposure from fluctuations in foreign currency exchange rates. Harmony does not generally hedge its exposure to foreign currencyexchange rates, however during the 2002 financial year, Harmony entered into monthly forward sales agreements amounting to US$180million, of which US$90 million matured in the previous financial year and US$ 90 million matured over the period July 2002 to December2002, at an average exchange rate of R/US$ 11.76. These contracts were entered into to preserve the revenue streams for the Free Stateoperations.
These contracts were accounted for as cash flow hedges and were recorded in each period in reserves and subsequently reclassified torevenue on the contract expiry date. The marked-to-market value of these forward sales agreements on 30 June 2003 was R nil, as all theagreements matured before year end.
The marked-to-market value of the transactions making up the positions on 30 June 2002 was a positive R47 million (US$5 million), thevaluation was based on an exchange rates of R/$10.42 and the prevailing interest rates and volatilities at the time.
Concentration of credit riskFinancial instruments, which subject the Company to significant concentrations of credit risk, consist predominantly of cash and cashequivalents, short-term investments and various derivative financial instruments. The Group’s financial instruments do not represent aconcentration of credit risk as the Group deals with and maintains cash and cash equivalents, short-term investments and derivative financialinstruments with a variety of well established financial institutions of high quality and credit standing. The credit exposure to any one counterparty is managed by setting exposure limits, which are reviewed regularly. The Group’s debtors and loans are regularly monitored andassessed. An adequate level of provision is maintained.
Interest rates and liquidity riskFluctuations in interest rates and gold lease rates impact on the value of short-term cash and financing activities.
Notes to the consolidated Financial Statements - continued
131
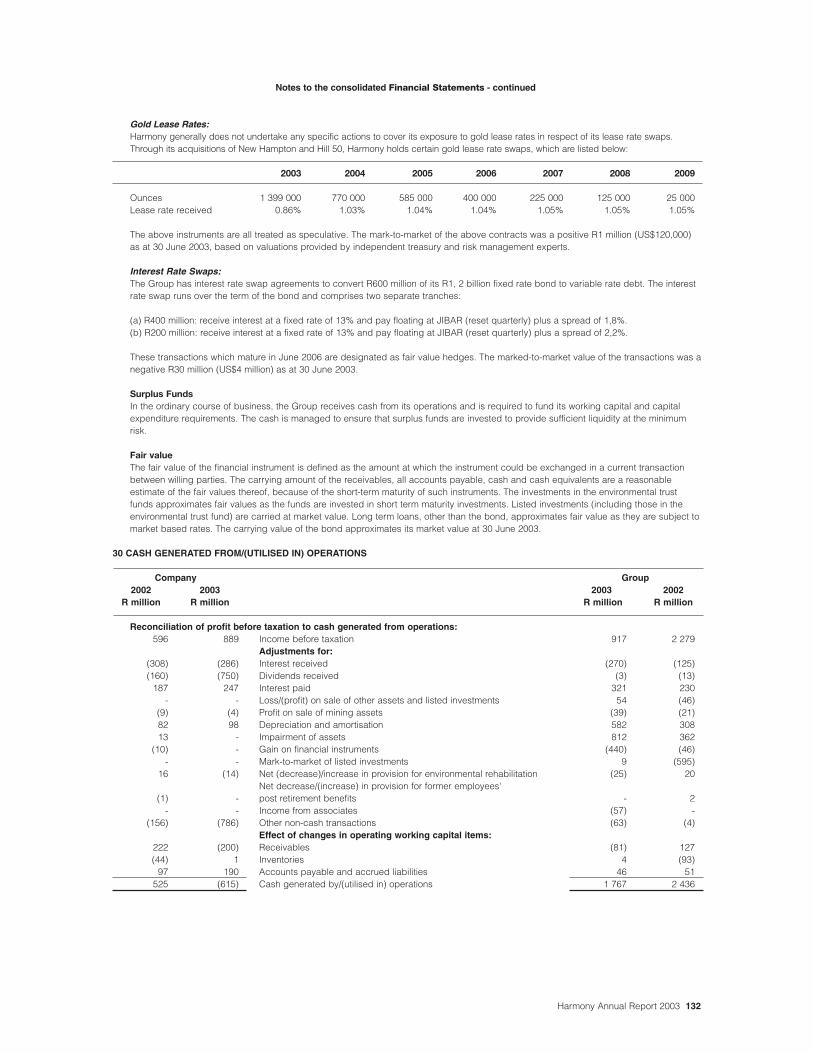
Gold Lease Rates:Harmony generally does not undertake any specific actions to cover its exposure to gold lease rates in respect of its lease rate swaps.Through its acquisitions of New Hampton and Hill 50, Harmony holds certain gold lease rate swaps, which are listed below:
2003 2004 2005 2006 2007 2008 2009
Ounces 1 399 000 770 000 585 000 400 000 225 000 125 000 25 000 Lease rate received 0.86% 1.03% 1.04% 1.04% 1.05% 1.05% 1.05%
The above instruments are all treated as speculative. The mark-to-market of the above contracts was a positive R1 million (US$120,000)as at 30 June 2003, based on valuations provided by independent treasury and risk management experts.
Interest Rate Swaps:The Group has interest rate swap agreements to convert R600 million of its R1, 2 billion fixed rate bond to variable rate debt. The interestrate swap runs over the term of the bond and comprises two separate tranches:
(a) R400 million: receive interest at a fixed rate of 13% and pay floating at JIBAR (reset quarterly) plus a spread of 1,8%. (b) R200 million: receive interest at a fixed rate of 13% and pay floating at JIBAR (reset quarterly) plus a spread of 2,2%.
These transactions which mature in June 2006 are designated as fair value hedges. The marked-to-market value of the transactions was anegative R30 million (US$4 million) as at 30 June 2003.
Surplus FundsIn the ordinary course of business, the Group receives cash from its operations and is required to fund its working capital and capitalexpenditure requirements. The cash is managed to ensure that surplus funds are invested to provide sufficient liquidity at the minimumrisk.
Fair valueThe fair value of the financial instrument is defined as the amount at which the instrument could be exchanged in a current transactionbetween willing parties. The carrying amount of the receivables, all accounts payable, cash and cash equivalents are a reasonableestimate of the fair values thereof, because of the short-term maturity of such instruments. The investments in the environmental trustfunds approximates fair values as the funds are invested in short term maturity investments. Listed investments (including those in theenvironmental trust fund) are carried at market value. Long term loans, other than the bond, approximates fair value as they are subject tomarket based rates. The carrying value of the bond approximates its market value at 30 June 2003.
30 CASH GENERATED FROM/(UTILISED IN) OPERATIONS
Company Group2002 2003 2003 2002
R million R million R million R million
Reconciliation of profit before taxation to cash generated from operations:596 889 Income before taxation 917 2 279
Adjustments for:(308) (286) Interest received (270) (125)(160) (750) Dividends received (3) (13)
187 247 Interest paid 321 230 - - Loss/(profit) on sale of other assets and listed investments 54 (46)
(9) (4) Profit on sale of mining assets (39) (21)82 98 Depreciation and amortisation 582 308 13 - Impairment of assets 812 362
(10) - Gain on financial instruments (440) (46)- - Mark-to-market of listed investments 9 (595)
16 (14) Net (decrease)/increase in provision for environmental rehabilitation (25) 20 Net decrease/(increase) in provision for former employees'
(1) - post retirement benefits - 2 - - Income from associates (57) -
(156) (786) Other non-cash transactions (63) (4)Effect of changes in operating working capital items:
222 (200) Receivables (81) 127 (44) 1 Inventories 4 (93)
97 190 Accounts payable and accrued liabilities 46 51 525 (615) Cash generated by/(utilised in) operations 1 767 2 436
Notes to the consolidated Financial Statements - continued
Harmony Annual Report 2003 132

31 ADDITIONAL CASH FLOW INFORMATION
The income and mining taxes paid in the statement of cash flow represents actual cash paid.
a) Non cash-itemsExcluded from the statements of consolidated cash flows are the following:
(i) For the year ended June 2003The minorities' share in the profits of Abelle.
(ii) For the year ended June 2002The minorities' share in the profits of Elandskraal.
b) Acquisitions of Subsidiaries / Businesses
(i) For the year ended June 2003
a) With effect from October 29, 2002, the Group acquired a 50% interest in the assets of St. Helena Mines, through its 50% shareholdingin the ARMgold/Harmony Freegold Joint Venture Company (Proprietary) Limited, from St Helena Gold Mines Limited, a fully ownedsubsidiary of Gold Fields Limited. The aggregate fair value of the assets acquired and liabilities assumed were as follows:
2003R million
Inventories 1Property, plant and equipment 72 Environmental Trust Fund 17 Long-term liabilities (5)Deferred tax (5)Provision for environmental rehabilitation (20)Total purchase price 60 Paid for by cash (60)
b) With effect from 1 May 2003, the Company had acquired a majority shareholding in Abelle Limited and during the period to 30 June2003 increased its shareholding such that as at 30 June 2003, the Company had acquired 87% of the issued share capital of Abelle Ltd.The aggregate fair value of the assets acquired and liabilities assumed were as follows:
2003R million
Inventories 9Accounts receivable 4 Investments 5Property, plant and equipment 1 124 Accounts payable and accrued liabilities (17)Provision for environmental rehabilitation (10)Deferred tax (316)Minority interest (109)Total purchase price 690 Paid for by cash (769)Cash and cash equivalents at acquisition (79)
(c) With effect from 8 May 2003, the Company had acquired a 50% shareholding in the Clidet 454 (Proprietary) Limited Joint Venture. The aggregate fair value of the assets acquired and the liabilities assumed were as follows:
2003R million
Investment in associate 846 Total purchase price 846 Paid for by way of borrowings (846)
Notes to the consolidated Financial Statements - continued
133

ii) For the year ended June 2002
(a) With effect from 3 January 2002, the Company had acquired a 50% shareholding in the ARMgold/Harmony Freegold Joint VentureCompany (Proprietary) Limited. The aggregate fair value of the assets acquired and the liabilities assumed were as follows:
2002R million
Environmental Trust Fund 222Property, plant and equipment 1 090 Accounts payable and accrued liabilities (53)Long-term liabilities (190)Deferred tax 347Total purchase price 1 416 Paid for by way of borrowings (516)Paid for by cash (900)Cash and cash equivalents at acquisition -
(b) With effect from 1 April 2002, Harmony acquired the remaining 10% interest in Elandskraal from Khuma Bathong. The fair value ofassets acquired were as follows:
2002R million
Property, plant and equipment 110Net minority interest in Elandskraal 100 Total purchase price 210Paid for by cash (210)
(c) With effect from 1 April 2002, Harmony acquired the entire share capital of Hill 50 Gold NL and its subsidiaries. The aggregate fairvalue of the assets acquired and the liabilities assumed were as follows:
2002R million
Inventories 54Accounts receivable 29Property, plant and equipment 2 754 Accounts payable and accrued liabilities (134)Long-term liabilities (52)Deferred financial liability (944)Deferred tax (442)Total purchase price 1 265 Paid for by cash (1 419)Cash and cash equivalents at acquisition (154)
32 COMMITMENTS AND CONTINGENCIES
Company Group2002 2003 2003 2002
R million R million R million R million
Capital expenditure commitments7 5 Contracts for capital expenditure 34 33
49 27 Authorised by the directors but not contracted for 2 156 267 56 32 2 190 300
This expenditure will be financed from existing cash resources.
Company Group2002 2003 2003 2002
R million R million R million R million
Contingent liabilities
Guarantees and suretyships 15 5 Environmental guarantees 75 82
90 87
Notes to the consolidated Financial Statements - continued
Harmony Annual Report 2003 134

33 RELATED PARTY TRANSACTIONS
Ms. Mokhobo, a non-executive director of Harmony, is the chairman of Simane and as such has an interest in all transactions betweenHarmony and Simane, including the subscription agreement under which Harmony shares were issued to Simane in January andFebruary 2002, prior to Ms. Mokhobo's appointment as a director of Harmony.
A.R. Flemming and Lord Renwick of Clifton KCMG each owns, directly and indirectly, shares in Highland Gold. As such, each of them hasan interest in Harmony's investment in Highland Gold.
None of the directors or major shareholders of Harmony or, to the knowledge of Harmony, their families, had any interest, direct orindirect, in any transaction concluded in the 2003 and 2002 financial years, or in any proposed transaction that has affected or willmaterially affect Harmony or its investment interests or subsidiaries, other than stated above.
None of the directors or members of senior management of Harmony or any associate of such director or member of senior managementis currectly or has been at any time during the past two financial years indebted to Harmony.
34 SUBSEQUENT EVENTS AFTER BALANCE SHEET DATE
(a) On 15 July 2003, Harmony announced the acquisition of 11.5% or 77 540 830 shares in Avgold Limited from Anglo South Africa Capital(Proprietary) Limited for a consideration of R7.91 per Avgold share. The acquisition is subject to the fulfillment of suspensive conditionsincluding the unconditional approval of the board of Anglo American Plc. The consideration will be discharged by the issue of arenounceable letter of allocation to Anglo South Africa Capital representing the rights to 6 960 964 new Harmony shares, comprising 3.8%of the issued share capital of Harmony.
(b) On 2 May 2003, Harmony and ARMgold Limited announced details on a proposed merger of their operations. The transaction will beeffected by the issue of two Harmony shares for every three ARMgold shares held. Approximately 63,67 million Harmony shares will beissued. The ratio was calculated with reference to the 30-day volume weighted average traded price of Harmony and ARMgold sharesprior to the final negotiation of the terms of the merger. In addition, ARMgold will pay a special dividend of R6.00 per ARMgold share priorto the implementation of the merger. The transaction will be treated as a take over by Harmony for accounting purposes and is planned tobe completed on 23 September 2003 with the final court approval of the scheme of arrangements.
(c) Randfontein Estates Limited, a wholly owned subsidiary of the Company, entered into an agreement with Africa Vanguard Resources(Proprietary) Limited on 21 January 2003, in terms of which Randfontein sold 26% of its mineral rights in respect of the Doornkop MiningArea to Africa Vanguard for a purchase consideration of R250 million. Randfontein and Africa Vanguard also entered into a joint ventureagreement on the same day, in terms of which they agreed to jointly conduct a mining operation in respect of the Doornkop Mining Area.The agreements were subject to the fulfilment of certain conditions precedent, the last of which was fulfilled on 12 August 2003. Theagreements were implemented, and the purchase price paid on 15 August 2003.
Notes to the consolidated Financial Statements - continued
135

35 GEOGRAPHICAL AND SEGMENT INFORMATION
The primary reporting format of the company is by business segment. As there is only one business segment, being mining, extractionand production of gold, the relevant disclosures have been given in the financial statements. The secondary reporting format is bygeographical analysis by origin. The accounting policies of the segments are the same as those described in the accounting policynotes.
The results of Abelle have been included from 1 May 2003.
Segmental information includes the results of operations of the Freegold Joint Venture and Hill 50 from date of acquisition with effect from 3 January 2002 and 1 April 2002 respectively. Gold operations are internally reported based on the following geographic areas: FreeState, Evander, Kalgold, Randfontein, Elandskraal, New Hampton, Hill 50, Abelle and Free Gold. The Free State, Randfontein, Kalgold,Evander, Elandskraal and Free Gold are specific gold producing regions within South Africa. New Hampton, Hill 50 and Abelle mines arelocated primarily in Western Australia. The Company also has exploration interests in Southern Africa and Australia which are included inOther. Selling, administrative, general charges and corporate costs are allocated between segments based on the size of activities basedon production results.
The segmental split on a geographical basis is:
Year ended 30 June 2003
Freegold
Free Joint
State Evander Kalgold Randfontein Elandskraal Venture New
(South (South (South (South (South (South Hampton Hill 50 Abelle
Africa) Africa) Africa) Africa) Africa) Africa) (Australia) (Australia) (Australia) Other Total
R million R million R million R million R million R million R million R million R million R million R million
Profit and loss
Revenue 1 882 1 067 224 1 476 1 104 1 732 434 1 044 32 - 8 995
Production costs (1 518) (795) (151) (952) (917) (1 063) (376) (828) (21) - (6 621)
Cash operating profit 364 272 73 524 187 669 58 216 11 - 2 374
Non-cash items:
- Depreciation and amortisation (98) (41) (12) (64) (34) (70) (46) (214) - (3) (582)
- Impairment - - - - - - (162) (650) - - (812)
- Mark-to-market of
listed investment - - - - - - - - - (9) (9)
- Financial instruments - - - - - - 76 364 - - 440
Profit/(loss) before tax 141 210 53 440 (20) 610 (78) (507) 2 66 917
Taxation expense (21) (52) (9) (150) (77) (164) 124 118 6 (49 ) (274)
Net profit/(loss) for the period
before minority interest 120 158 44 290 (97) 446 46 (389) 8 17 643
Kilograms gold (*) 19 009 11 203 2 320 15 300 11 403 17 969 4 138 11 355 359 - 93 056
Tonnes milled (*) ('000) 5 338 2 127 1 084 4 873 2 989 4 681 1 945 5 144 58 - 28 239
Capital expenditure 127 99 70 37 141 341 8 275 1 152 2 2 252
Total assets 6 101 1 117 423 2 165 351 1 381 (23) 461 520 2 689 15 185
Total liabilities 3 334 294 25 557 187 782 2 730 498 147 6 556
(*) Production statistics are unaudited.
Notes to the consolidated Financial Statements - continued
Harmony Annual Report 2003 136

Year ended 30 June 2002
Freegold
Free Joint
State Evander Kalgold Randfontein Elandskraal Venture New
(South (South (South (South (South (South Hampton Hill 50 (*)
Africa) Africa) Africa) Africa) Africa) Africa) (Australia) (Australia) Other Total
R million R million R million R million R million R million R million R million R million R million
Profit and loss
Revenue 1 829 1 191 179 1 628 1 365 918 493 185 18 7 806
Production costs (1 351) (723) (130) (1 013) (950) (431) (474) (134) (9) (5 215)
Cash operating profit 478 468 49 615 415 487 19 51 9 2 591
Non-cash items:
- Depreciation and amortisation (82) (26) (11) (53) (36) (30) (25) (44) (1) (308)
- Impairment 63 - - 12 - - (437) - - (362)
- Mark-to-market of
listed investment - - - - - - - - 595 595
- Financial instruments 10 - - (121) - - 46 113 - 48
Profit/(loss) before tax 513 441 36 355 291 422 (380) 126 475 2 279
Taxation expense (75) (150) 43 (140) (15) (136) - (5) (105) (583)
Net profit/(loss) for the period
before minority interest 438 291 79 215 276 286 (380) 121 370 1 696
Kilograms gold (**) 19 034 12 920 1 934 17 469 14 807 8 681 5 957 1 912 257 82 971
Tonnes milled (**) ('000) 4 536 2 352 961 4 799 3 279 2 186 3 833 949 39 22 934
Capital expenditure 95 98 25 15 247 32 233 - (10) 735
Total assets 5 801 1 222 332 2 233 393 981 1 488 1 496 130 14 076
Total liabilities 2 443 372 (23) 504 133 608 656 1 373 47 6 113
(*)The Bissett mine in Canada was placed on care and maintenance at the end of the previous financial year, and clean-up results amounting to R18 million revenue (257kg)
and R9 million production costs were reflected under "other" for 2002.
(**)Production statistics are unaudited.
Notes to the consolidated Financial Statements - continued
137

ANNEXURE A:STATEMENT OF SUBSIDIARY COMPANIES
Issued Effective group Cost of investment Loans from/share interest by holding company (to) holding company
capital 2003 2002 2003 2002 2003 2002Company and description R'000 % % R million R million R million R million
DIRECT SUBSIDIARIES:
Dormant companies:Harmony Gold (Management Services)(Pty) Ltd (a) 1 100 100 - - - - Virginia Salvage (Pty) Ltd (a) 2 90 90 - - - - Unisel Gold Mines Ltd (a) 23 136 100 100 89 89 (92) (92)
Exploration company:Lydenburg Exploration Ltd (a) 42 792 100 100 204 204 (29) (42)
Gold mining companies:Evander Gold Mines Ltd (a) 39 272 100 100 545 545 (162) (320)Harmony Gold Canada Inc. (b) 25 000 100 100 28 28 16 10 Randfontein Estates Ltd (a) 19 882 100 100 1 311 1 307 672 496
Investment holding companies:Harmony Gold Australia (Pty) Ltd (c) 2 630 398 100 100 2 630 771 245 1 843 West Rand Consolidated Ltd (a) 17 967 100 100 321 321 18 5
Marketing companies:Authentic Beverage (Pty) Ltd (a) # 100 100 - - - -Harmony Gold (Marketing) (Pty) Ltd (a) # 100 100 - - 53 46 Harmony Precious Metal Services SAS (d) 62 60 60 - - 79 76
Property holding companies:La Riviera (Pty) Ltd (a) # 100 100 - - - -
INDIRECT SUBSIDIARIES:
Dormant companies:Arai Liki Offshore (Pty) Ltd (c) 293 87 - - - - -Bracken Mines Ltd (a) # 100 100 - - - - Garden Gully (Pty) Ltd (c) # 100 100 - - - - Garnkirk (Pty) Ltd (c) # 100 100 - - - - Jubilee Minerals (Pty) Ltd (c) 2 100 100 - - - -Leslie Gold Mines Ltd (a) # 100 100 - - - - Muro Baru (Pty) Ltd (c) # 87 - - - - -NHG Investments (Pty) Ltd (c) # 100 100 - - - - Selcast Nickel (Pty) Ltd (c) # 100 100 - - - - Swaziland Gold (Pty) Ltd (e) # 100 100 - - - - Winkelhaak Mines Ltd (a) # 100 100 - - - -
Exploration company:Harmony Gold (Exploration) (Pty) Ltd (a) 10 100 100 - - - -
Gold mining companies:Abelle Ltd (c) 488 062 87 - - - - -Big Bell Gold Operations (Pty) Ltd (c) # 100 100 - - - - Buffalo Creek Mines (Pty) Ltd (c) # 100 100 - - - - Harmony Gold Operations Ltd (c) 405 054 100 100 - - - - Kalahari Goldridge Mining Company Ltd (a) 1 275 100 100 - - - - Mt Magnet Gold NL (c) 79 710 100 100 - - - - New Hampton Goldfields Ltd (c) 196 248 100 100 - - - - South Kal Mines (Pty) Ltd (c) 6 100 100 - - - -
Notes to the consolidated Financial Statements - continued
Harmony Annual Report 2003 138

Issued Effective group Cost of investment Loans from/share interest by holding company (to) holding company
capital 2003 2002 2003 2002 2003 2002Company and description R'000 % % R million R million R million R million
Investment holding companies:Aurora Gold Ltd (c) 685 006 87 - - - - -Aurora Gold Australia (Pty) Ltd (c) 58 87 - - - - -Aurora Gold Finance Ltd (c) # 87 - - - - -Aurora Gold Services (Pty) Ltd (c) # 87 - - - - -Aurora Gold (WA) (Pty) Ltd (c) 163 115 87 - - - - -Aurora Gold (PNG) (Pty) Ltd (c) # 87 - - - - -Aurora Gold (Wafi) (Pty) Ltd (c) # 87 - - - - -Aurora Gold Administration (Pty) Ltd (c) 293 87 - - - - -Evander Stone Holdings (Pty) Ltd (a) # 100 100 - - - - Harmony Gold (Isle of Man) Ltd (f) 550 100 100 - - - - Harmony Gold Investments (Pty) Ltd (c) # 100 100 - - - - Harmony Gold Securities (Pty) Ltd (c) # 100 100 - - - - Harmony Gold WA (Pty) Ltd (c) # 100 100 - - - - Harmony Victoria (Pty) Ltd (c) # 100 100 - - - - Potchefstroom Gold Areas Ltd (a) 8 407 100 100 - - - - Vadessa (Pty) Ltd (c) # 100 100 - - - -
Marketing company:Harmony Precision Casting (Pty) Ltd (a) 357 70 70 - - - -
Mineral right holding companies:Australian Ores & Minerals (Pty) ltd (c) 8 766 87 - - - - -Carr Boyd Minerals (Pty) Ltd (c) 402 414 87 - - - - -Cogent (Pty) Ltd (a) # 100 100 - - - -Hampton Gold Mining Areas Ltd (g) 299 680 100 100 - - - - Kwa Zulu Gold Mining Company (Pty) Ltd (a) # 100 100 - - - -Morobe Consolidated Goldfields Ltd (h) # 87 - - - - -Portions 1 and 3 Wildebeesfontein (Pty) Ltd (a) 2 100 100 - - - - Potchefstroom Gold Holdings (Pty) Ltd (a) 2 100 100 - - - -Remaining Extent and Portion 15 Wildebeesfontein (Pty) Ltd (a) 1 90 90 - - - - The Kunana Mining Company (Pty) Ltd (a) # 100 100 - - - - Trodex Platinum (Pty) Ltd (a) 4 100 100 - - - - Venda Gold Mining Company (Pty) Ltd (a) # 100 100 - - - -Wafi Mining Ltd (h) # 87 - - - - -
Property holding companies:Evander Township Ltd (a) 1 340 100 100 - - - - Evander Township Development Ltd (a) 3 100 100 - - - - Quarrytown Ltd (a) # 100 100 - - - -Salt Holdings Ltd (a) 60 100 100 - - - -
JOINT VENTURE COMPANIES - DIRECT:Gold mining company:
ARMgold/Harmony Freegold Joint Venture Company (Pty) Ltd (a) 20 50 50 17 17 719 915
Investment holding company:Clidet 454 (Pty) Ltd (a) # 50 - 1 - 846 -
JOINT VENTURE COMPANY - INDIRECT:Dormant company:
Jeanette Gold Mines Ltd (a) # 50 50 - - - -
The Group's interest in jointly controlled entities is accounted for by proportionate consolidation. Under this method the Group includes itsshare of the joint venture's individual income and expenses, assets and liabilities in the relevent components of the financial statementson a line by line basis.
Notes to the consolidated Financial Statements - continued
139

Issued Effective group Cost of investment Loans from/share interest by holding company (to) holding company
capital 2003 2002 2003 2002 2003 2002Company and description R'000 % % R million R million R million R million
ASSOCIATE COMPANY - DIRECT:Gold mining company:
Highland Gold Limited (i) 1 432 32 33 - - - -
ASSOCIATE COMPANIES - INDIRECT:Gold mining company:
Bendigo Mining NL (c) 708 067 32 32 - - - - Investment holding company:
Anglovaal Mining Ltd (a) 5 630 17 - - - - -
Investments in associates are accounted for by using the equity method of accounting. Equity accounting involves recognising in theincome statement the Group's share of the associates' profit or loss for the period. The Group's interest in the associate is carried on thebalance sheet at an amount that reflects the cost of the investment, the share of post acquisition earnings and other movement in thereserves.
Total 5 146 3 282 2 365 2 937 Total investments 7 511 6 219
# Indicates issued share capital of less than R1 000(a) Incorporated in the Republic of South Africa(b) Incorporated in the Yukon Territory, Canada(c) Incorporated in Australia(d) Incorporated in France(e) Incorporated in Swaziland(f) Incorporated in the Isle of Man(g) Incorporated in the United Kingdom(h) Incorporated in the Papua New Guinea(i) Incorporated in Jersey, USA
The above investments are valued by the directors at book value.
The interest of Harmony Gold Mining Company Ltd in the aggregate amount of the after tax losses of its subsidiaries, joint venture companiesand associates is R229 million (2002: profits of R1 159 million).
Notes to the consolidated Financial Statements - continued
Harmony Annual Report 2003 140

Harmony Gold Mining Company LimitedFinancial Statements (US$/Imperial)
Consolidated Income StatementFor the year ended 30 June 2003
(Convenience translation)
Group2003 2002
Notes US$ million US$ million
Revenue 985 765 Cash operating costs (725) (511)Cash operating profit 260 254
Interest and dividends 30 14 Other (expenses)/ income – net (19) 9 Employment termination and restructuring costs (5) (8)Corporate, administration and other expenditure (8) (9)Exploration expenditure (8) (5)Marketing and new business expenditure (8) (9)(Loss)/profit on sale of listed investments (6) 5 Interest paid (35) (23)Cash profit 201 228
Depreciation and amortisation (64) (30)Provision for rehabilitation costs (1) (2)Gain on financial instruments 48 4 (Loss)/profit on listed investments (1) 58 Impairment of assets (88) (35)Income from associates 6 - Provision for former employees' post retirement benefits (1) -Income before tax 100 223 Taxation expense (30) (57)Net income before minority interests 70 166 Minority interests - (2)Net income 70 164
Basic earnings per share (cents) 39 107
Fully diluted earnings per share (cents) 39 100
Basic headline earnings per share (cents) 72 129
Diluted headline earnings per share (cents) 72 120
Interim dividends per share (cents) 14 7
Final/proposed final dividends per share (cents) 16 42
Total dividends per share (cents) 30 49
Convenience translation based on average rates of US$/R9.13 (2002: US$/R10.20)
141

Harmony Gold Mining Company LimitedFinancial Statements (US$/Imperial)
Consolidated Balance SheetAt 30 June 2003
(Convenience translation)
Group2003 2002
Notes US$ million US$ million
AssetsNon-current assetsProperty, plant and equipment 1 327 908 Investments 116 171 Investment in associates 186 28 Investments in subsidiaries - - Deferred taxation assets 5 23Deferred financial assets - 5Total non-current assets 1 634 1 135 Current assetsInventories 60 43 Receivables 103 66 Cash and equivalents 225 139 Total current assets 388 248 Total assets 2 022 1 383
Equity and liabilitiesShare capital and reservesShare capital 12 8 Share premium 903 526 Fair value and other reserves (32) 9 Retained earnings 266 224 Total shareholders’ equity 1 149 767Minority interestMinority interest 16 -Total Minority interest 16 -Non-current liabilitiesLong term borrowings 322 170 Deferred taxation 209 97 Deferred financial liability 38 98 Provision for environmental rehabilitation 83 68 Provision for post-retirement benefits 1 1 Total non-current liabilities 653 434 Current liabilitiesAccounts payable and accrued liabilities 183 159 Income and mining taxes 20 22 Shareholders for dividends 1 1 Total current liabilities 204 182 Total equity and liabilities 2 022 1 383
Convenience translation based on closing rates of US$/R7.51 (2002: US$/R10.39)
Harmony Annual Report 2003 142

SECTION 7
INVESTORRELATIONS7.1 PAGE 145
CONTACTS7.2 PAGES 145-146
STOCK EXCHANGE LISTINGS AND CONTACTS7.3 PAGE 147
SHAREHOLDER INFORMATION7.4 PAGE 147
DIVIDENDS7.5 PAGE 148
SHAREHOLDERS’ CALENDER7.6 PAGES 148-150
SHAREHOLDER ANALYSIS7.7 PAGE 150
SHARE LIQUIDITY7.8 PAGE 151
PRODUCTION PROFILE7.9 PAGES 151-152
CORPORATE INFORMATION7.10 PAGES 155-156
GLOSSARY AND ABBREVIATIONS
CONTENT

SECTION 7
INVESTORRELATIONSIN OTHER WORDSDuring the last few years, we have significantly increased our shareholder base.
The US is now our key shareholder market in terms of shares held as well as liquidity.Over the last year, our overall liquidity was atan all-time high of 448%. We have an openshare register with a 100% free-float.

145
HARJSE Securities Exchange South Africa
South African Share Transfer SecretariesUltra Registrars (Pty) LtdPO Box 4844Johannesburg, 2001South AfricaTel +27 11 832 2652Fax +27 11 834 4398E-mail [email protected]
STRATEShare Transactions Totally Electronic(STRATE) is an electronic settlementsystem for transactions on the JSESecurities Exchange and off-markettrades. STRATE has brought South Africain line with international practice andenhances the security of settlement in theequities market. The STRATE initiativeenables dematerialisation of equity scrip ina Central Securities Depository (CSD). Thisdematerialisation will facilitate settlementand the transfer of ownership by electronicbook entry.
Tel +27 11 520 7700Fax +27 11 520 8600E-mail [email protected] www.strate.co.za
HMYNew York Stock Exchange
ADR DepositaryThe Bank of New YorkShareholder Relations Department101 Barclay StreetNew York, NY 10286United States of AmericaTel 1888-BNY ADRSFax +1 212 571 3050E-mail www.stockbny.com/contactus.asp
Global BuyDIRECTThe Bank of New York maintains a directshare purchase and dividend reinvestmentplan for Harmony. Global BuyDIRECT, adirect and sale/dividend reinvestment plansponsored and administered by the Bankof New York, offers investors theopportunity to purchase depositaryreceipts at commissions that are typicallyless than a retail broker. For additional information, please visit theBank of New York’s web site atwww.globalbuydirect.com or callShareholder Relations at 1-888-BNY-ADRSor write toThe Bank of New YorkAmerican Depositary ReceiptsShareholder Relations Department101 Barclay Street, 22nd FloorNew York, NY 10286United States of America
The ratio of Harmony ADRs to ordinaryshares is 1 ADR : 1 Ord.
SECTION 7INVESTOR RELATIONS
7.1 CONTACTS
Ferdi DippenaarMarketing DirectorTel +27 11 684 0140Fax +27 11 684 0188Mobile +27(0) 82 807 3684E-mail [email protected]
Corné BobbertInvestor Relations OfficerTel +27 11 684 0146Fax +27 11 684 0188Mobile +27(0) 83 380 6614E-mail [email protected]
7.2 STOCK EXCHANGE LISTINGS AND CONTACTS
The primary listing of the company’s ordinary shares is on the JSE Securities Exchange SouthAfrica. Its ordinary shares are also listed on stock exchanges in London, Paris and Berlin, aswell as being quoted in Brussels in the form of International Depositary Receipts (IDRs) and onthe New York Stock Exchange in the form of American Depositary Receipts (ADRs).

Harmony Annual Report 2003 146
HRMLondon Stock Exchange
United Kingdom SecretariesSt James’s Corporate Services Limited6 St James’s PlaceLondon SW1A 1NPUnited KingdomTel +44 207 499 3916Fax +44 207 491 1989E-mail [email protected]
United Kingdom RegistrarsCapita RegistrarsThe Registry34 Beckenham RoadBeckenhamKent BR3 4TUUnited KingdomTel +44 870 162 3100Fax +44 208 639 2342E-mail [email protected]
HGEuronext Paris
French AgentsEuro Emetteurs Finance48 Boulevard des Batignolles75850 Paris Cedex 17FranceTel +33 1 5530 5900Fax +33 1 5530 5910E-mail [email protected]
HMYEuronext Brussels
Belgian AgentsSoges-Fiducem SAContact: Francis Adriaenssens 24 Avenue Marnix1000 BrusselsBelgiumTel +32 2 547 27 25Fax +32 2 547 20 89E-mail [email protected]
HAM1Berlin Stock Exchange
HMYPhiladelphia Gold and Silver Index
HARJ.JReuters
HARSJBloomberg

147
Australian Dollar 5.07 5.80
Euro 8.60 10.17
UK Pound 12.37 15.80
US Dollar 7.51 10.39
20022003
7.3 SHAREHOLDER INFORMATION
Sector Resources
Sub-sector Gold
Nature of Business Harmony Gold Mining Company Limitedand its subsidiaries are engaged inunderground and open pit gold mining,exploration and related activities in SouthAfrica, Australasia, Russia and Peru.
Issued share capital as at 30 June 2003 184 854 115 million
Market CapitalisationAt 30 June 2003 (R million) 18 155At 30 June 2003 (US$ million) 2 499US $ per production ounce per annum 833.33US $ per reserve ounce 40.00US $ per resource ounce 6.04
Share Price12 Month High (July 2002 – June 2003) $ 28.5012 Month High (July 2002 – June 2003) R 181.5012 Month Low (July 2002 – June 2003) $ 10.1412 Month High (July 2002 – June 2003) R 71.00
Number of employees (including Free Gold) 50 718
7.4 DIVIDENDS
Period ended Dividend per share (SA cents)
Interim Dividend No. 70 31 December 1999 50Final Dividend No. 71 30 June 2000 70Interim Dividend No. 72 31 December 2000 50Final Dividend No. 73 30 June 2001 70Interim Dividend No. 74 31 December 2001 75Final Dividend No. 75 30 June 2002 425Interim Dividend No. 76 31 December 2002 125Final Dividend No. 77 30 June 2003 150
Currency conversion guide - at 30 June 2003 one SA Rand was equal to:

Harmony Annual Report 2003 148
7.5 SHAREHOLDERS’ CALENDAR
Financial year-end 30 June
Annual financial statements issued 1 October 2003
Annual General Meeting 14 November 2003
Quarterly results announcements
Quarter ended 30 September 2003 27 October 2003Quarter ended 31 December 2003 26 January 2004 Quarter ended 31 March 2004 26 April 2004Quarter ended 30 June 2004 2 August 2004
7.6 SHAREHOLDERS’ ANALYSIS AS AT 30 JUNE 2003
Institutions and bodies corporate 280 129 405 677 70.0%
Shareholders below threshold* 33 097 55 468 438 30.0%
Total 33 377 184 854 115 100%
PERCENTAGE OFISSUED SHARES
NUMBER OFSHAREHOLDERS
NUMBER OFSHARES HELD
HOLDERS
* Shareholders below threshold comprises the ADR and ordinary shareholdingsof private individuals, Harmony’s ESOP and other unclassified investors.
1 - 10 000 42 - 200 154 0.1%
10 001 -
100 000 104 - 4 220 069 2.3%
100 001 -
1 000 000 102 - 33 941 716 18.4%
1 000 001 -
and more 32 - 91 043 738 49.2%
Institutions
and bodies
corporate 280 1.0 129 405 677 70.0%
Shareholders
below
threshold 33 097 99.0 55 468 438 30.0%
Total 33 377 100.0% 184 854 115 100.0%
NUMBER OFSHARES HELD
NUMBER OFSHAREHOLDERS
NUMBER OFSHAREHOLDERS
AS APERCENTAGE
SHARES PERCENTAGE OFISSUED SHARES
HELD

149
Largest institutional shareholders as at 30 June 2003
Holding 5% and more:
Investec Asset Management (Cape Town) 5.9%
Holding less than 5%
Fidelity Management and Research 4.4%
Deutsche Asset Management Americas 3.7%
Public Investment Commission 3.2%
Old Mutual Asset Management 2.7%
Mawenzi Asset Managements 2.2%
Sanlam Investment Management 2.1%
Merrill Lynch Investment Managers (U.K.) 1.8%
Liberty Group 1.7%
Capital Research and Management 1.6%
Strong Capital Management, Inc. 1.4%
Morgan Stanley investment Management 1.1%
Allan Gray Ltd. 1.1%
American Century Investment Mgmt. (NY) 1.1%
Deutsche Asset Management Group Ltd. 1.1%
PERCENTAGE OFISSUED SHARES
3% International
Shareholder Characteristics – Style Breakdown
5%
15%
11%
2%
12%22%
6%
2%1%
9%
3%
12%
1% Income Value
9% Index
11% Core Value
12% Miscellaneous
22% GARP
6% Growth
2% Hedge Fund
12% Emerging Markets
15% Core Growth
5% Broker Dealer
2% Deep Value

Harmony Annual Report 2003 150
7.7 SHARE LIQUIDITY
July 2002 – June 2003
Weighted average issued share capital for 12 months177 954 245 million
Liquidity of shares per annum2003 2002 2001448% 372% 141%
Ordinary share performance on the JSE Securities Exchange
Market price per share (Rand)
- 30 June 98.50 142.00 46.90 37.50 28.40 24.50
- high 181.50 187.30 50.00 46.10 36.10 30.00
- low 71.00 38.50 26.50 22.00 20.60 9.00
Number of ordinary shares issued (’000) 184 854 169 247 144 553 97 310 69 460 53 927
Number of deals recorded 112 163 77 752 20 087 18 604 10 638 5 952
Volumes of shares traded (’000) 310 765 206 171 55 967 63 086 38 239 23 263
Volume of shares traded as a percentage of total
issued shares 168.4 121.8 38.7 65.0 55.1 43.1
2003 2002 2001 2000 1999 1998
Ordinary share performance on the JSE Securities Exchange
July 02 32 404 342 65 433 157 11 709 753 524 500 409 421 171 698 571 110 481 173
Aug 02 15 174 230 37 575 113 5 026 934 148 900 130 373 174 342 253 58 055 550
Sept 02 30 455 563 53 297 809 7 106 886 281 150 215 391 174 428 453 91 356 799
Oct 02 20 341 047 43 581 276 8 509 658 227 950 252 898 174 428 453 72 912 829
Nov 02 15 492 925 31 867 011 3 690 395 208 600 191 017 174 428 453 51 449 948
Dec 02 25 396 845 29 513 500 9 154 948 479 350 398 762 174 644 553 63 943 205
Jan 03 24 945 829 23 313 500 5 093 389 352 000 327 632 175 902 300 54 032 350
Feb 03 23 470 805 25 184 100 4 965 451 160 000 181 909 184 130 100 53 962 365
March 03 20 429 856 31 439 800 4 282 577 253 600 186 748 184 163 265 52 310 004
April 03 19 952 328 22 813 600 5 819 239 187 900 262 896 184 214 265 49 035 963
May 03 62 252 589 25 056 400 7 845 218 123 900 196 570 184 277 105 95 671 185
June 03 20 252 589 18 695 100 4 782 617 112 500 121 789 184 854 115 43 964 595
TOTAL 310 765 456 407 770 166 72 704 488 3 030 450 2 875 406 184 854 115 797 175 966
JSESECURITIESEXCHANGE
TRADINGVOLUME
NYSEADR
TRADINGVOLUME
LONDONSTOCK
EXCHANGETRADINGVOLUME
EURONEXTBRUSSELS
IDRTRADINGVOLUME
EURONEXTPARIS
TRADINGVOLUME
ISSUEDSHARE
CAPITAL(MILLIONS)
TOTALVOLUMES

151
7.9 CORPORATE INFORMATION
Harmony Gold Mining Company LimitedRegistration No 1950/038232/06Incorporated in the Republic of South AfricaISIN ZAE000015228
OfficesRegistered Harmony Main OfficesRemaining Extent of Portion 3 of the farmHarmony Farm 222, Private Road, GlenHarmonyVirginia, Free StateRepublic of South Africa
CorporateSuite No. 1Private Bag X1Melrose Arch, 2076South Africa
First Floor4 The High StreetMelrose Arch, 2196JohannesburgSouth AfricaTel +27 11 684 0140Fax +27 11 684 0188Website www.harmony.co.za
Company SecretaryMarian van der Walt
AddressPO Box 2Randfontein, 1706South AfricaTel +27 11 411 2037Fax +27 11 692 3879E-mail [email protected]
AustraliaPO Box 1547West Perth, WA 6872Australia
Level 1, 10 Ord StreetWest Perth, WA 6005AustraliaTel +61 8 9211 3100Fax +61 8 9485 0074 E-mail [email protected]
AttorneysCliffe Dekker Fuller Moore
BankersABSA Bank Limited
Independent auditorsPricewaterhouseCoopers Incorporated
This report is available in printed format fromHarmony’s Investor Relations department or inelectronic format on the Internet atwww.harmony.co.za
In addition, Harmony has produced the Form20-F (a report required by the Securities andExchange Commission in the United States),copies of which are available free of charge onEDGAR at www.sec.gov or from our web site.
Interest 100% 100% 100% 100% 100% 100% 100% 100%
Number of
production units 10 6 10 4 1 2 3 11
Number of
gold plants 3 2 4 2 1 2 4 2
Annualised
production (kg) 22 239 12 130 38 413 15 365 2 644 13 219 11 228 11 477
Annualised
production (oz) 715 000 390 000 1 235 000 495 000 85 000 425 000 360 000 370 000
ELANDSKRAALOPERATIONS
AUSTRALIANOPERATIONS
ORKNEYOPERATIONS
KALGOLDOPERATIONS
RANDFONTEINOPERATIONS
FREE GOLDOPERATIONS
EVANDEROPERATIONS
FREE STATEOPERATIONS
7.8 PRODUCTION PROFILE

Harmony Annual Report 2003 152
Disclaimer on certain forward-looking statements
Certain statements in this document contain "forward-looking statements" within the meaning of Section 27A of the Securities Act of 1933, asamended, and 21E of the Securities Exchange Act of 1934, as amended, that are intended to be covered by the safe harbor created by suchsections. All statements other than those of historical facts included in this presentation are forward-looking statements including, withoutlimitation, (i) estimates of future earnings, and the sensitivity of earnings to the gold and other metals prices; (ii) estimates of future gold andother metals production and sales, (iii) estimates of future cash costs; (iv) estimates of future cash flows, and the sensitivity of cash flows tothe gold and other metals prices; (v) statements regarding future debt repayments; (vi) estimates of future capital expenditures; (vii) estimatesof reserves, and statements regarding future exploration results and the replacement of reserves; and (viii) statements regarding modificationsto the company's hedge position. Where the company expresses or implies an expectation or belief as to future events or results, suchexpectation or belief is expressed in good faith and believed to have a reasonable basis. However, forward-looking statements are subject torisks, uncertainties and other factors, which could cause actual results to differ materially from future results expressed, projected or impliedby such forward-looking statements. Such risks include, but are not limited to, gold and other metals price volatility, currency fluctuations,increased production costs and variances in ore grade or recovery rates from those assumed in mining plans, as well as political andoperational risks in the countries in which we operate and governmental regulation and judicial outcomes. For a more detailed discussion ofsuch risks and other factors, see the company's Annual Report on Form 20-F for the year ended June 30, 2002, which is on file with theSecurities and Exchange Commission, as well as the company's other SEC filings. The company does not undertake any obligation to releasepublicly any revisions to any "forward-looking statement" to reflect events or circumstances after the date of this presentation, or to reflect theoccurrence of unanticipated events, except as may be required under applicable securities laws.

I asked an old man who spoke so well:‘Where did you get your weapon?’”
“

We should not accept sub-standard practices and conditions inmining. You have to have a vigilant. New systems can be an issuebut any system will work if it’s supported. You need to communicateproperly – outline the advantages. Disadvantages mustn’t beoverlooked. Identify real issues that impact on production and subjectthem to honest evaluation. Ideas must be exchanged, tested – ifthey work, implement them.
I have an enquiring mind. As a youngster I asked an old man whospoke so well: “Where did you get your weapon?” His reply: “Youmust read extensively.” That’s what I do.
When I grew up I had no choices. I did part time jobs while atschool. Matriculated in ’91. In ’92 a job in mining was my firstopportunity.
I had good exposure to a number of tasks, interacting with adiversity of people. It was personal capacity building. Then the minewas threatened with closure. The Harmony takeover saved our jobs.
The Harmony Way is totally different. A positive contribution to theindustry – cost conscious – more primarily focused on developingpeople. I achieved my miner’s certificate and moved to shaft sinkingto broaden my experience and advance my career.
The concept of Harmony is openness, allowing freedom to ask –and if you ask, people give you the time. Team participation inplanning is a reality. We define objectives and how to implementthem. Our first priority is safe production. Communication is key –giving the bigger picture – building your team’s capacity.
TEN PEOPLE. ONE STORTEN PEOPLE. ONE STORYY..NameReginald TyophoTime at Harmony11 yearsWorks atElandsrandStarted asStope GeneralPosition todayPanel Miner

Brownfield project:
A potential mining site with known mineral resources
Call Option:
A contract that permits the owner to purchase an asset at
a specified price on or before a specified date
Capital Expenditure:
Total capital expenditure on mining assets to both maintain
and expand operations
Development:
Activities (including shaft sinking and on-reef and off-reef
tunneling) required to prepare for mining activities and
maintain a planned production level and those costs to
enable the conversion of mineralised material to reserves
Exploration:
Activities associated with ascertaining the existence, loca-
tion, extent or quality of mineralised material, including
economic and technical evaluations of mineralised material
Gold assets:
The after-tax net asset value of the company’s gold assets
including gold exploration properties and hedging gains
or losses.
Grade:
The average amount of gold contained in a tonne of gold
bearing ore expressed in gram per tonne of ore
Life of mine:
Number of years that the operation is planning to mine
and treat ore, taken from the current mine plan
Measures:
Conversion factors from metric units to US units are pro-
vided below:
Measures Metric unit US Equivalent
1 tonne = 1 t = 1.10231 short tons
1 gram = 1 g = 0.03215 ounces
1 gram per tonne 1 g/t = 0.02917 ounces pe
short ton
1 kilogram per tonne 1 kg/t = 29.16642 ounces per
short ton
Mineral Resource:
A mineral resource is a concentration or occurrence of
material of economic interest in or on the earths crust in
such from, quality and quantity that there are reasonable
and realistic prospects for eventual economic extraction.
The location, quantity, grade, continuity and other geologi-
cal characteristics of a mineral resource are known, esti-
mated from specific geological evidence and knowledge,
or interpreted from a well-constrained and portrayed geo-
logical model. Mineral resources are subdivided, in order
of increasing geological confidence, into inferred, indicat-
ed and measured categories. The mineral resources are
inclusive of those resources which have been modified to
produce ore reserves.
Open Pit:
Mining in which the ore is extracted from a pit. The geom-
etry of the pit may vary with the characteristics of the ore-
body.
Ore Reserve:
That part of mineralised material, which at the time of the
reserve determination could be economically and legally
extracted or produced. Ore reserves are reported as gen-
eral indicators of the life of mineralised materials. Changes
in reserves generally reflect: development of additional
reserves; depletion of existing reserves through produc-
tion; actual mining experience; and price forecasts.
Ore:
A mixture of mineralised material from which at least one
of the contained minerals can be mined and processed at
an economic profit
Orebody:
A well defined mass of mineralised material of sufficient
mineral content to make extraction economically viable.
Ounces (oz/troy):
Used in imperial statistics. A kilogram is equal to 32.1507
ounces.
Price to Earnings:
The current share price divided by adjusted earnings per
share.
Recovery grade:
The actual grade of ore realised after the mining and treat-
ment process
Reef:
A gold-baring sedimentary horizon, normally a conglomer-
ate band that may contain economic levels of gold
Refining:
The final stage of metal production in which impurities are
removed from the molten metal by introducing air and flux-
es. The impurities are removes as gases of slag.
Rehabilitation:
The process of restoring mined land to a condition
approximating its original state
Sampling:
Taking small pieces of rock at intervals along exposed
mineralisation for assay (to determine the mineral content)
Shaft:
A shaft provides principal access to the underground
workings for transporting personnel, equipment, supplies,
ore and waste. A shaft is also used for ventilation and as
an auxiliary exit. It is equipped with a surface hoist system
that lowers and raises conveyances for men, materials
and ore in the shat. A shaft generally has more than one
conveyancing compartment.
Tonnage:
Quantities where the tonne or ton is an appropriate unit of
measure. Typically used to measure reserves of gold-bar-
ing material in situ or quantities of ore and waste materaila
mined, transported or milled.
Tonne:
One tonne is equal to 1 000 kilograms (also known as a
"metric" ton)
155
GLOSSARY OF TERMS

Harmony Annual Report 2003 156
ABET Adult Basic Education Training
ADR American Depository Receipts
A$ Australian Dollar
AIM Alternative Investment Market of London
Stock Exchange plc
ARMI African Rainbow Minerals and
Exploration Investments (Pty) Ltd
ART Anti-Retroviral Treatment Programme
Avmin Anglovaal Mining Limited
AVR Africa Vanguard Resources
BEE Black Economic Empowerment
Bn Billion
CONOPS Continuous operations
CPIX Consumer Price Index excluding interest
on mortgage bonds
cmg/t Centimeter gram per tonne
DME Department of Minerals and Energy
DTI Department of Trade and Industry
EMPR Environmental Management Programme
Reports
FIFR Fatal Injury Frequency Rate
FOGIFR Fall of Ground Injury Frequency Rate
g/t Gram per tonne
HDSAs Historically Disadvantaged South
Africans
HGL Highland Gold Limited
HRG High River Gold
HSE Health Safety and Environment
IDC Industrial Development Corporation
IDR International Depository Receipts
IMF International Monetary Fund
IMR Identified Mineral Resources
IRR Internal Rate of Return
JORC Australian Code for Reporting Mineral
Resources and Mineral Reserves
kg Kilogram
LTI Lost Time Injury
LTIFR Lost Time Injury Frequency Rate
MBOD Medical Bureau for Occupational
Diseases
MNV Mnogovershinoe Mine, Russia
MSCI Emerging Markets Index
NGO Non Government Organisation
NIHL Noise Induced Hearing Losses
NNR Nuclear Regulator
NUM National Union of Mineworkers
Oz Ounces (Troy)
PDI Previously Disadvantaged Individuals
PNG Papua New Guinea
R/kg South African Rand per kilogram
RMS Risk Management System
SAIMR South African Institute of Mining and
Metallurgy
SAMREC South African Code for Reporting of
Mineral Resources and Mineral Reserves
SARM South African Royal Manufacturers
SLFR Shift Lost Frequency Rate
SOx Sarbanes-Oxley Act of 2002
t Tonnes Metric
TIAFR Total Injury Accident Frequency Rate
tpm Tonnes per month
TPM Total Precious Metals
TSE Toronto Stock Exchange
US$ United States Dollar
US$/oz United States Dollars per Ounce
UASA United Association of South Africa
VCR Ventersdorp Contact Reef
ABBREVIATIONS

THIS IS IT.

The Red ArrowThis is the mark of Harmony. It shows our passion forcontinuous improvement. A place where ordinaryindividuals deliver extraordinary performance – are gutsy,passionate and energetic. A place where nothing isimpossible and every person can make a difference.
The Rainbow ArchThis is the rainbow of colours, attitudes and dreamsthat binds us, defines us, drives us and makes usstronger. It shows that not one of us alone canachieve more than what we can do together.