Hand and Tool Movement Variability using a simple Hand-tool: A Pilot Investigation
43
The University of Birmingham MRes/TDP program Research Placement 1 HAND AND TOOL MOVEMENT VARIABILITY USING A SIMPLE HAND-TOOL: HAND AND TOOL MOVEMENT VARIABILITY USING A SIMPLE HAND-TOOL: A PILOT INVESTIGATION A PILOT INVESTIGATION ALEXANDROS KARAIOSIF Student ID No: 668800 Supervisor: Prof. Chris Miall
Transcript of Hand and Tool Movement Variability using a simple Hand-tool: A Pilot Investigation

The University of Birmingham
MRes/TDP program
Research Placement 1
HAND AND TOOL MOVEMENT VARIABILITY USING A SIMPLE HAND-TOOL:HAND AND TOOL MOVEMENT VARIABILITY USING A SIMPLE HAND-TOOL:
A PILOT INVESTIGATIONA PILOT INVESTIGATION
ALEXANDROS KARAIOSIF
Student ID No: 668800
Supervisor: Prof. Chris Miall
BIRMINGHAM 2005
INTRODUCTION
Movement variability is a critical factor for coordinated
arm or hand movements especially when someone has to do
reach to grasp movements or pointing to target movements.
Many studies in the past examined the movement variability
in attempt to identify the existence of motor learning after
a series of trials. What happens with the movement
variability when using a hand-tool after a series of
learning movements?
The aim of this study was to examine the hand and the
tool movement variability using a simple hand tool and to
test the differences between one very common grip and one
more unusual grip without vision, but with visual feedback
before and after each trial and between the baseline and the
post-learning phase.
Tool-use results in an extension of the neural
representation of visuotactile peripersonal space (e.g.
2

Holmes, 2004). As peripersonal space we can define the space
immediately surrounding our bodies. If peripersonal space
extends along the axis of a tool during tool-use, then the
typical properties of visuotactile peripersonal space should
also extend along the tools held in each hand (Holmes et al,
2004). This suggestion tells us that when using a tool with
our hands, our peripersonal space becomes bigger and we can
therefore approach the reached workspace in the same way as
if we used only our hands without the tool. On the other
hand, the use of tools to reach objects or to point to
targets, may not simply ‘extend’ our peripersonal space, but
rather that only the grips of the tool become behaviorally
relevant to visuotactile interactions associated with the
hand that holds the tool (Vindra, P. & Viviani, P., 2005).
If we have a target in front of us, then we are able to
detect, locate, orient to, and reach it. All these
operations can be distinguished according to the sector of
space in which they occur and to the action needed for
accomplishing the task (Colby, C.L., & Duhamel, J.R., 1996).
For instance, if the target of interest is located in the
3

immediate surroundings of the body (peripersonal space),
manual reaching and grasping an object, as well as pointing
a target can be achieved without locomotion. On the
contrary, if the target of interest is placed outside a
direct manual reaching (extrapersonal space-the space that
the tool cannot reach), locomotion is needed for subsequent
action to the object. Alternatively, we can use a tool to
reach and grasp far objects and to point some far targets.
In any case, we need to encode the position of the objects
or the targets with respect to the position of the body and
body parts (Berti, A., Frassinetti, F., 2000). An
interesting suggestion of Obayashi et al (2003), after their
experiments using hand-tools tell us that tool-use skill
would produce a ‘motor engram’ specific for the learned hand
and would be stored as procedural memory. Another suggestion
of Harris & Wolpert (1998), is that while we make goal-
directed arm or hand movements, such us reach to grasp or
pointing to a target movements, there is an infinite number
of possible trajectories that the hand could take to reach
the target. However humans show highly stereotyped
4
trajectories in which the velocity profiles are smooth and
symmetric for brief movements. How a reference trajectory
can be used to guide limb movements can be explained from
the equilibrium point hypothesis but this hypothesis does
not tells us how such trajectories might be computed in
tasks more complex than pointing. In the same direction the
dynamical systems view emphasizes that the composite neuro-
musculo-skeletal system is a nonlinear dynamical system that
can show interesting phenomena such as bifurcations, but
does not predict what nonlinear dynamics we should observe
in a task we don’t know very well, like a new task (Todorov,
E., 2004).
Often visual feedback is needed to make or perform
movements towards to a target. These movements are amongst
the most frequently performed movements of our movement
repertoire. These movements are most accurate when the hand
is visible throughout the movement towards a visible target
(Desmurget, Rossetti, Prablanc, Stelmach, & Jeannerod,
1995), but they become less accurate when the hand is not
visible during movement execution (Carrozzo, McIntyre, Zago,
5

& Lacquaniti, 1999) and are least accurate when the target
is no longer visible as movement unfolds (Lemay & Proteau,
2001). Studies investigating the role of visual information
in aiming movements towards remembered targets commonly use
one of three types of methodologies. The target was
presented and then: a) the lights of the experimental room
were turned off, b)spectacles worn by the participants
turned from transparent to translucent, or c) the
participants were asked to close their eyes, prior to
movement initiation. In the present study, the methodology
was used was very close to second type described above, as
the participants had visual feedback before the movement
initiation, but with the raising of the tool to point the
target, their visual field was interrupted from the special
goggles they had putted on their eyes. Regardless of the
methodology used, the authors concluded that the increase in
error noted when pointing to remembered targets in
comparison to visible targets was caused by the withdrawal
of visual information about target location (Lemay &
Proteau, 2001). Therefore, it is possible that the absence
6

of a visual background during movement execution may have
negatively affected the endpoint accuracy of a pointing
movement to a remembered target. In this regard, recent
evidence suggests that surrounding the target with a
structured visual background facilitates evaluation of the
distance (but not of the direction) between the starting
position of the hand and the target location when the
elements composing that background are located between the
starting base and the target location (Lemay, M., Gagnon, S.
& Proteau, L. 2004). The scientists recently reported
evidence that visual feedback from the hand contributes to
on-line control of reaching throughout the full extent of
the movement. A number of control strategies could be based
solely on feedback about hand position. A visual feedback
controller might steer to maintain a predetermined visual
path, making corrective adjustments whenever sensory
feedback indicates that the position of the hand has
deviated from the desired trajectory. Adaptation studies
provide evidence that the motor system does attempt to
maintain preferred kinematic trajectories, such as straight-
7

line paths (Shadmehr and Mussa-Ivaldi, 1994). Paillard
(1996), has argued that both position and motion feedback
contribute to controlling hand movements, but in different
movement phases: a fast homing-type strategy based on visual
motion is used during the initial part of movements, and a
slower position-based strategy is used for final end-phase
adjustments. The two-phase proposal is based on the
intuition that motion acuity remains high in the periphery,
whereas position acuity decreases sharply with retinal
eccentricity. A far target can become near if we can reach
it, no matter what means we use, the hand or a tool
(Saunders, J.A. & Knill, D.A., 2004). Yu & Buchanan (2004),
tell us that movement amplitude is a non specific control
parameter and the visual information for such movements is
used in the adjustment of antagonist activity (Van der
Meulen, J.H. et al, 1990).
The purpose of this study was to investigate the changes
in hand variability and the changes in tool-grip
variability, using a simple, but rather unusual, hand-tool
before and after the learning phase in comparison between a
8

very common and easy tool-grip and an unusual hold of the
tool, while vision is interrupted during the hand movement.
With this study we wanted to see the changes in hand and
tool movement accuracy and variability of target-pointing
movements after repeated movements to access accuracy and
variability before and after training.
We didn’t expect any changes in the hand movement or tool
movement variability after the learning phase, either for
the common grip or the unusual grip of the movement in all
the testing conditions (NH). We hypothesized that training
would reduce the tool variability but not necessary the hand
movement variability. In addition we expect to find that the
hand movement variability will increase after the training
phase. The hypothesis for this is that the subjects will be
focused to the target-pointing than the appropriate hand
movement, and may increased variability of the hand to
ensure accurate positioning of the tool.
METHODS
9

Participants: 15 volunteer subjects were used for the purpose of
the study (11 male-4 female, 13 right-handed-2 left handed,
age 28,53±7,87 years), and they were separated randomly in
three experimental groups (Table 1).
Table 1: Testing details for the participants.
Age Hand SexGroup Averag
eSTDEV Right Left Male Female
Handle-hold 29,4 11,61 4 1 3 2Distant-hold 29,4 5,94 5 0 4 1Backward-
hold26,8 6,42 4 1 4 1
Total 28,53 7,87 13 2 11 4Materials: A simple, but unusual hand-tool was used. The tool
was very easy to use for the participants (Fig.1). Two
sensors (Polhemus System) were attached in the middle of the
metacarpus of the dominant hand and on the tool,
respectively. Each sensor measured six variables: The X, Y
and Z direction and the azimuth, the elevation and the roll
of the sensor after each movement. For the purpose of this
study, only the X and Y direction were used. The X direction
was the anterior-posterior direction to the participants’
body and the Y direction was the lateral direction to the
10

participants’ body. During the experimental phase, each
participant had to wear a pair of goggles (Plato Goggles),
which didn’t allow vision during the movement. The Plato
Goggles were linked to the starting position button so that
raising the tool from the starting position interrupted
automatically the visual field. In other words, the
participants didn’t have vision during pointing to the
target movement, but only before the initiation and after
the end of the movement. At the end of the movement, the
experimenter pushed an other button linked with the Plato
Goggles, which opened the visual field to the participants
and allowed them to get feedback about their movement.
HH- BH PH DHFigure1: The hand-tool
Procedure: Each participant was seated as comfortably as
possible in a chair in front of a desk. On the desk, there
was a white cardboard (60X50 cm) with a button used for the
11
starting position (SP) in the middle of the cardboard very
near to the body of the participant (Fig. 1A in the
Appendix). On the cardboard, there were also three big red
dots serving as targets at a distance of 15 cm away from the
SP. The three targets made a semicircle and the right (RT),
middle (MT) and left target (LT) were positioned at a 45˚
from each other. First, each participant performed the
movement from the SP to each target 30 times, in sequence
starting from the RT and finished to the LT (10 timesX3
targets) with the common grip (Pen-hold) and after that with
the unusual grip (Testing-hold). This procedure was the
baseline phase. After the baseline phase, the participants
did the learning phase in which they were trained only in
the testing condition without measurement for 40 times to
each target (3X40 times). The difference between the
baseline and the learning phase was that in the learning
phase the participants did 40 times the pointing movement to
each target and then went to the next target. In addition
the participants wore the Plato Goggles during the learning
phase but vision was allowed throughout practice. Finally,
12

after the learning phase the participants were tested using
the same procedure as the baseline but in this phase (Post-
Learning phase) the order of the trials was changed; they
did first the Testing-hold condition (10 times X3 targets)
and after that the Pen-hold condition (10 times X3 targets).
The participants were asked to do the pointing movements, as
accurate as possible, but not as fast as possible, because
the duration of the movements were not taken in to account.
Design: In the present study, we examined three experimental
groups with five subjects each. Each experimental group was
trained and examined in one testing condition but all three
groups were examined in the Pen-hold condition. Participants
were randomly assigned to one of the three training
conditions (Distant-hold, Handle-hold and Backward-hold
conditions) and each group was named from the training
condition. Thus we had the Distant-hold group (n=5), the
Handle-hold group (n=5) and the Backward-hold group (n=5).
The conditions were the Distant Condition (DC), in which the
participant hold the tool like a pen from the distant point
(DH in Fig.1), the Handle Condition (HC), in which the
13

participant hold the tool from the handle (HH in Fig.1) and
finally the Backward Condition (BC), in which the
participants hold the tool from the handle, but with the tip
of the tool under their elbow (BH in Fig.1). We measured the
hand-variability using the Standard Deviation (SD) of the
distance between the hand and the three targets (n=30
trials) and the tool variability defined as the SD of the
distance between the tool and the three targets (n=30
trials) and the mean tool absolute error (n=30 trials).
Absolute error was defined as the distance between the
sensor of the tool and the target, using the equation:
Error=
All three variables were analyzed using a 2X3 ANOVA with
repeated measures on Training (pre, post). The dependent
variables were the hand and tool variability, which were
calculated from the SD of the distance between the two
sensors and the target, and the absolute tool error, which
was calculated from the distance between the tool and the
targets. The independent variables were the two testing
14

phases (baseline and post-learning phases) and the three
experimental conditions (Distant-hold, Handle-hold,
Backward-hold). In addition we examined if there were any
differences in the Pen-hold condition between the baseline
(pre-training) phase and the post-learning phase, and among
the three experimental groups. Finally the pre-training
phase for the Pen-hold condition was compared for the tool
variability. The variance between subjects was compared with
the variance within each subject. In other words the SD for
subjects and the SD between the subjects means was
calculated (within and between subjects factor).
Data Analysis & Statistical Analysis: Before each measurement the
sensors were calibrated putting the sensor 1 (sensor on the
tool) first at the SP and after in each target. After the
data collection from the Polhemus System, the data were
transferred and transformed in Microsoft Excel files with
Matlab 7.0 for Microsoft Windows. The Polhemus System
collected six variables from each sensor (X, Y, Z direction
and azimuth, elevation and roll) and in addition the time
between each movement. With a special program of Matab 7.0
15

we took only the X and Y direction of each sensor. For the
absolute error, the distance between the tool and the target
was calculated using the Matlab 7.0 program. The data from
each participant were analyzed using the Microsoft Excel
program. Finally the statistical analysis was done using the
SPSS 10.0 for Windows statistical package.
RESULTS
In the present study, the differences in the pre- and
post-learning phase between the three testing conditions, as
well as the differences between the three testing conditions
in comparison with the pen-hold condition, were measured.
The differences looked for were the hand and the tool
variability, defined from the SD of the distance between
hand, tool and target in the forward and the lateral axes (X
and Y direction) and the absolute error between the tool and
the target for the three testing conditions .In addition the
differences in the Pen-hold condition, before and after the
learning phase in each testing condition as well as the
comparison with all subjects and the three experimental
16

conditions separated for the baseline phase of the Pen-hold
condition was examined.
Hand and Tool Variability
Tool variability-X direction: No significant differences between the
pre and post-learning phase in the tool variability were
found in the forward axis in comparison among the three
testing conditions (p>0.05). From the data (Table 2), we can
see that in the Handle-hold condition the variability was
increased while in the Distant-hold and Backward-hold there
were no differences before and after the learning phase.
Tool variability-Y direction: No significant differences between the
pre and post-learning phase in the tool variability were
found in the lateral axis (Y direction) in comparison among
the three testing conditions (p>0.05). After the learning
phase, the variability in the Handle-hold condition
decreased and increased in the Backward-hold condition while
no changes were observed in the Distant-hold condition
(Table 2).
17
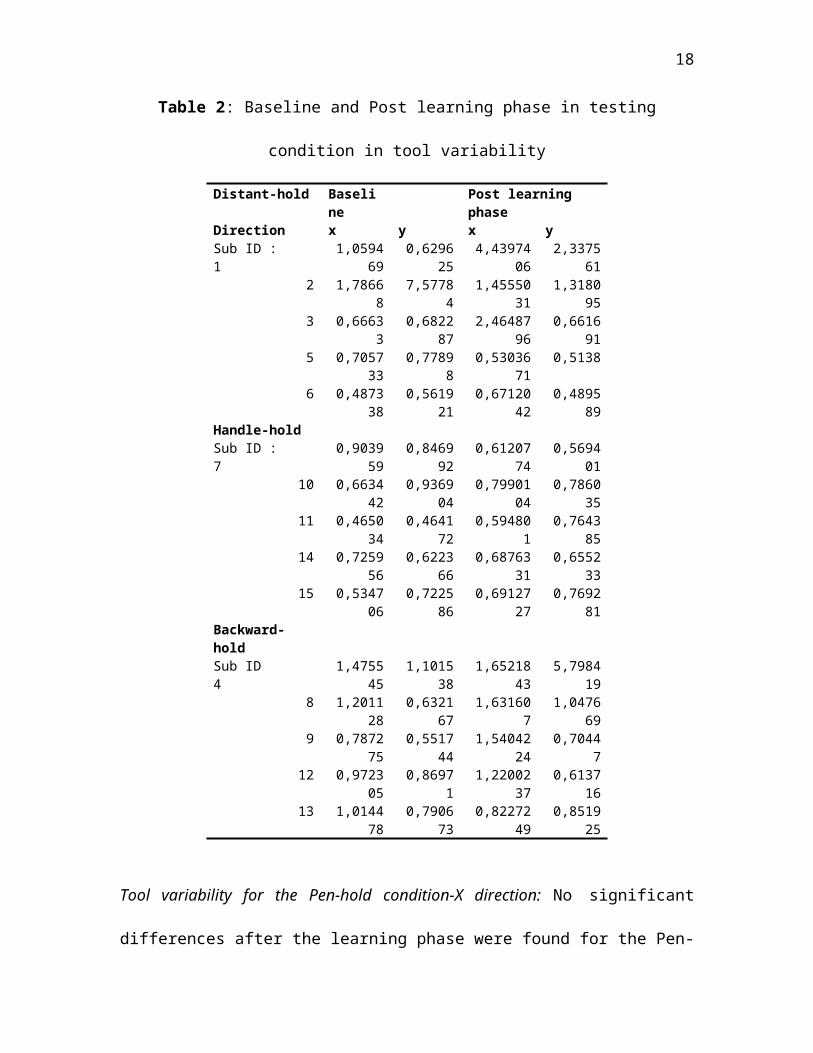
Table 2: Baseline and Post learning phase in testing
condition in tool variability
Distant-hold Baseline
Post learning phase
Direction x y x ySub ID : 1
1,059469
0,629625
4,4397406
2,337561
2 1,78668
7,57784
1,4555031
1,318095
3 0,66633
0,682287
2,4648796
0,661691
5 0,705733
0,77898
0,5303671
0,5138
6 0,487338
0,561921
0,6712042
0,489589
Handle-holdSub ID : 7
0,903959
0,846992
0,6120774
0,569401
10 0,663442
0,936904
0,7990104
0,786035
11 0,465034
0,464172
0,594801
0,764385
14 0,725956
0,622366
0,6876331
0,655233
15 0,534706
0,722586
0,6912727
0,769281
Backward-holdSub ID 4
1,475545
1,101538
1,6521843
5,798419
8 1,201128
0,632167
1,631607
1,047669
9 0,787275
0,551744
1,5404224
0,70447
12 0,972305
0,86971
1,2200237
0,613716
13 1,014478
0,790673
0,8227249
0,851925
Tool variability for the Pen-hold condition-X direction: No significant
differences after the learning phase were found for the Pen-
18
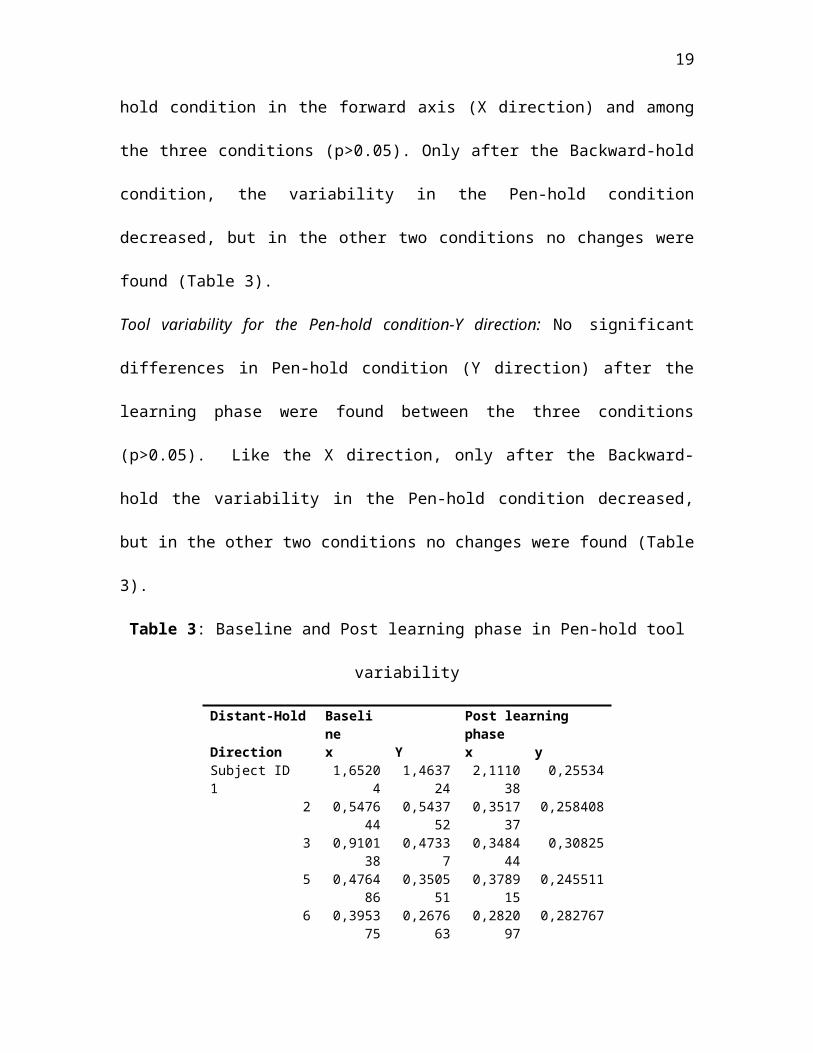
hold condition in the forward axis (X direction) and among
the three conditions (p>0.05). Only after the Backward-hold
condition, the variability in the Pen-hold condition
decreased, but in the other two conditions no changes were
found (Table 3).
Tool variability for the Pen-hold condition-Y direction: No significant
differences in Pen-hold condition (Y direction) after the
learning phase were found between the three conditions
(p>0.05). Like the X direction, only after the Backward-
hold the variability in the Pen-hold condition decreased,
but in the other two conditions no changes were found (Table
3).
Table 3: Baseline and Post learning phase in Pen-hold tool
variability
Distant-Hold Baseline
Post learning phase
Direction x Y x ySubject ID 1
1,65204
1,463724
2,111038
0,25534
2 0,547644
0,543752
0,351737
0,258408
3 0,910138
0,47337
0,348444
0,30825
5 0,476486
0,350551
0,378915
0,245511
6 0,395375
0,267663
0,282097
0,282767
19

Handle-hold7 0,4912
780,3667
440,6141
620,466647
10 0,681211
0,57396
0,965486
0,487795
11 0,424484
0,571845
0,387061
0,415336
14 0,643539
0,531257
0,57267
0,613552
15 0,515668
0,416812
0,738473
0,497489
Backward-hold
4 4,72362
8,745338
0,614162
0,466647
8 0,53344
0,574467
0,965486
0,487795
9 0,475685
0,632329
0,387061
0,415336
12 0,606672
0,414809
0,57267
0,613552
13 0,600696
0,548116
0,738473
0,497489
.
Hand variability-X direction: No significant differences were found
(p>0.05) in the comparison between the three testing
conditions, before and after the learning phase in the
forward axis (X direction). No changes were found in any
testing condition after the learning phase (Table 4).
Hand variability-Y direction: No significant differences were found
(p>0.05), also in the comparison between the three testing
conditions before and after the learning phase in the
20

lateral axis (Y direction). Like the vertical axis, no
changes in any testing condition were found (Table 4).
Table 4: Baseline and Post learning phase in testing
condition in hand variability.
Distant-hold Pre Post learning phase
Direction X y x ySub ID : 1
0,902534 1,130585
3,935467
2,320299
2
4,521559 4,896958
1,38383
0,87573
3 0,817564 0,700154
2,488164
0,945122
5 0,754459 0,791846
0,530367
0,5138
6 0,487338 0,561921
0,671204
0,489589
Handle-holdSub ID : 7
1,075425 2,170135
0,677855
0,921668
10 0,597356 1,774718
0,517599
0,89504
11 0,507711 0,519823
0,523253
0,596489
14 0,799451 1,041686
0,855322
0,905514
15 1,152314 1,8663 0,770844
0,723158
Backward-holdSub ID 4
4,200499 2,397459
2,813842
9,95163
8 1,23402 3,150227
1,511697
1,820551
9 1,224126 5,902264
1,945542
1,865922
12 1,07618 1,406727
1,002427
1,778659
13 1,03964 1,739993
1,027234
2,306269
.
21
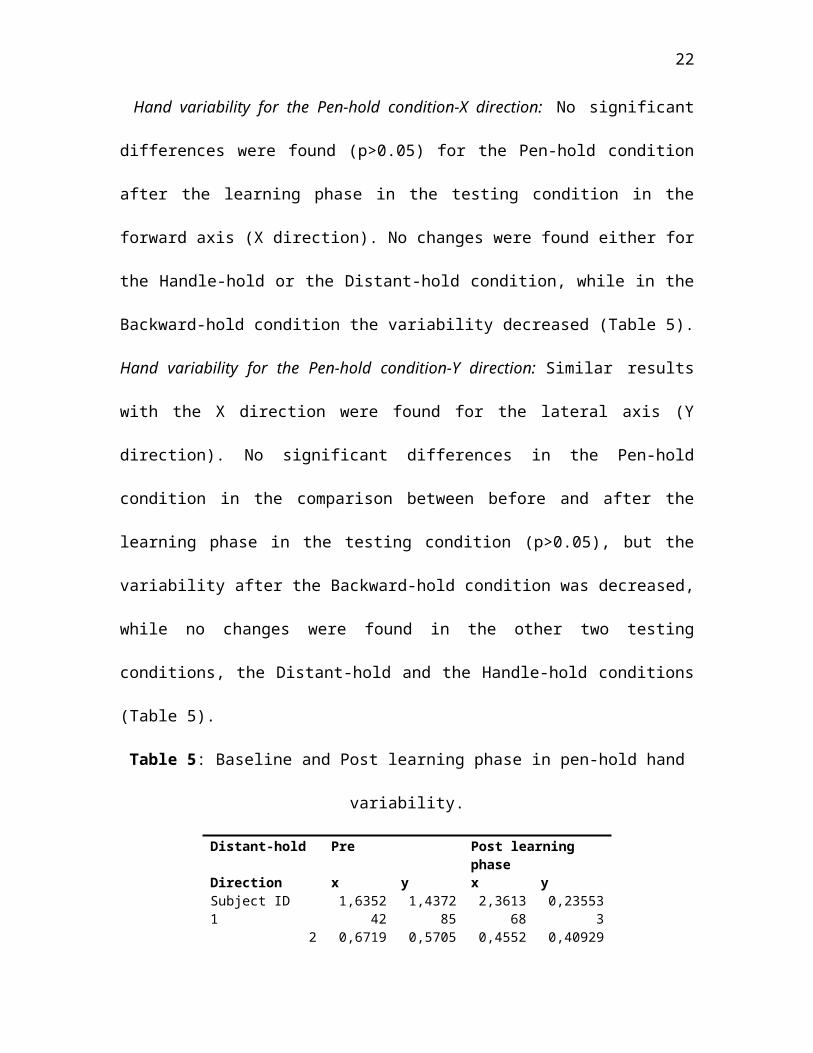
Hand variability for the Pen-hold condition-X direction: No significant
differences were found (p>0.05) for the Pen-hold condition
after the learning phase in the testing condition in the
forward axis (X direction). No changes were found either for
the Handle-hold or the Distant-hold condition, while in the
Backward-hold condition the variability decreased (Table 5).
Hand variability for the Pen-hold condition-Y direction: Similar results
with the X direction were found for the lateral axis (Y
direction). No significant differences in the Pen-hold
condition in the comparison between before and after the
learning phase in the testing condition (p>0.05), but the
variability after the Backward-hold condition was decreased,
while no changes were found in the other two testing
conditions, the Distant-hold and the Handle-hold conditions
(Table 5).
Table 5: Baseline and Post learning phase in pen-hold hand
variability.
Distant-hold Pre Post learning phase
Direction x y x ySubject ID 1
1,635242
1,437285
2,361368
0,235533
2 0,6719 0,5705 0,4552 0,40929
22

06 79 1 73 1,7703
090,6016
840,7677
890,41252
45 0,4064
190,3973
580,3789
150,24551
16 0,3953
750,2676
630,2820
970,28276
7Handle-hold
7 0,574858
0,44618
0,777288
0,533507
10 0,657299
0,643891
0,943692
0,509214
11 0,321767
0,582538
0,405174
0,434408
14 0,877131
0,650831
0,736115
0,738609
15 0,774204
0,490139
0,659938
0,584481
Backward-hold4 5,1407
227,8188
160,7772
880,53350
78 0,7942
760,6167
060,9436
920,50921
49 0,5473
240,6549
850,4051
740,43440
812 0,6876
920,4065
310,7361
150,73860
913 0,6542
660,6184
770,6599
380,58448
1
Absolute Error for the tool
No significant differences were found between the
baseline and the post-learning phase in both the forward and
the lateral axes (X and Y direction), for the comparison
between the three experimental conditions and the Pen-hold
condition for the absolute error of the movement (p>0.05).
Because of these results, no t-tests or post-hoc tests were
23

made for the differences between the three experimental
conditions.
Absolute error in the forward axis (X direction) for the trained conditions:
Almost significant differences were found in the comparison
between the baseline and the post-learning phase for the
three testing conditions in the forward axis (F(2,12)=3.194,
p= 0.077). The absolute error decreased in the Handle-hold
condition and increased in the Distant-hold condition. No
changes were found for the Backward-hold condition (Fig. 2).
24
Figure 2: Absolute error in comparison between the Baseline
and the Post learning phase in the X direction for the
testing conditions.
Absolute error in the lateral axis (Y direction) for the trained conditions: No
significant differences (p>0.05) were found for the
comparison between the baseline and the post-learning phase
for the three testing conditions in the lateral axis (Y
direction). Despite the absence of significant difference in
the absolute error in the Backward-hold condition, after the
learning phase, error was decreased, but for the Handle-hold
and the Distant-hold no changes were found (Fig.3).
25
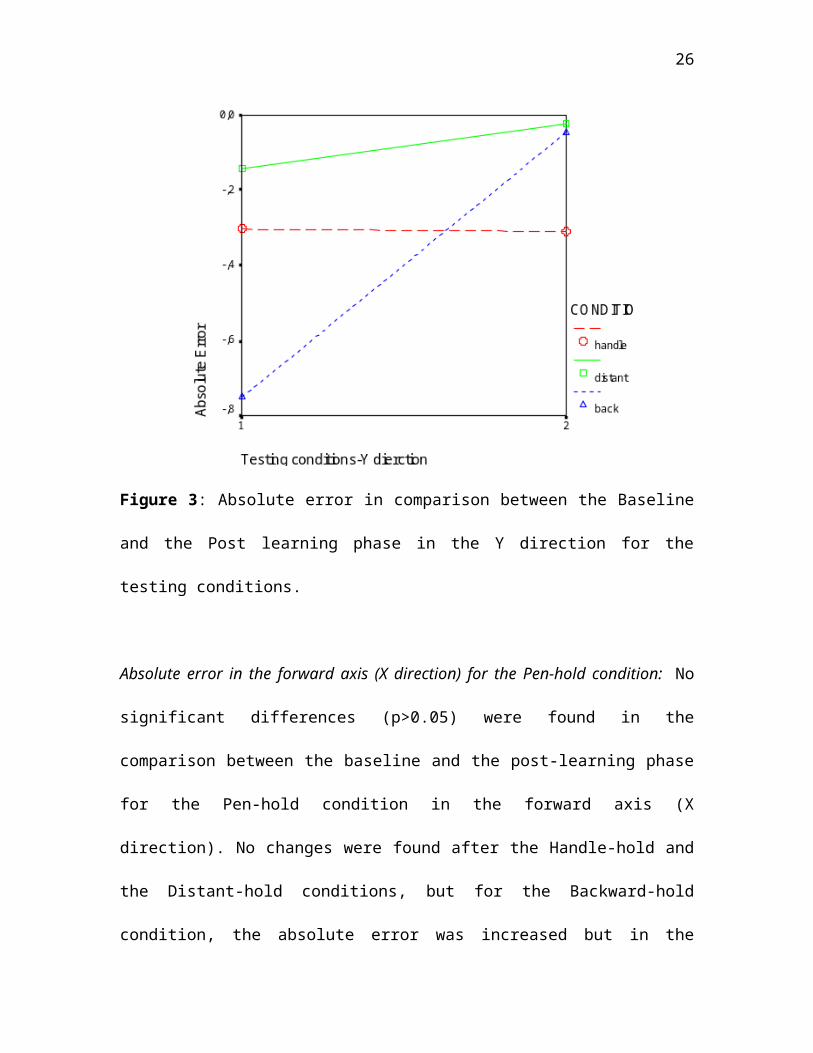
Figure 3: Absolute error in comparison between the Baseline
and the Post learning phase in the Y direction for the
testing conditions.
Absolute error in the forward axis (X direction) for the Pen-hold condition: No
significant differences (p>0.05) were found in the
comparison between the baseline and the post-learning phase
for the Pen-hold condition in the forward axis (X
direction). No changes were found after the Handle-hold and
the Distant-hold conditions, but for the Backward-hold
condition, the absolute error was increased but in the
26

different direction: before the learning phase in the
testing condition, the participants tend to overshoot the
target with the tip of the tool, while after the learning
phase tend not to overshoot to the target (Fig.4)
Figure 4: Absolute error in for the Pen-hold condition (pre-
post-learning phase-Y direction).
Absolute error in the lateral (Y direction) axis for the Pen-hold condition:
Almost significant differences were found in the comparison
between the baseline and the post-learning phase for the
Pen-hold condition in the Y direction (F(2,12)=3.165,
27

p=0.079). The absolute error increased after the Distant-
hold training, but after the Handle-hold and the Backward-
hold conditions, no changes were found (Fig. 5).
Figure 5: Absolute error in for the Pen-hold condition (pre-
post-learning phase-Y direction).
Comparison in the Pen-hold performance for all the subjects
and the testing conditions:
The comparison of tool movement variability in the
baseline phase for the Pen-hold condition between all the
28

subjects together and the subjects in their testing group
separately showed that the variance within subjects factor
was larger than variance between each subject (Graph1). It’s
clear that the tool variability is bigger only in the
baseline of the Backward-hold condition but in total the
variability is bigger for all the subjects (Graph 2).
Tool variability in baseline betw een subjects and the testing conditions
0
0,5
1
1,5
1 2X-Y Direction
SD
SD for all subjects
SD for the testingconditions
Graph 1: Comparison between all subjects and the three
testing conditions in Pen-hold Baseline phase.
29

Tool variability in baseline betw een subjects and the three conditions separetely
00,51
1,5
1 2 3 4All subjects-Distant/Handle/Backw ard-hold
SD
X DirectionY Direction
Graph 2: Comparison between all subjects and the three
testing conditions separately in Pen-hold Baseline phase.
DISCUSSION
In the present study, no significant differences were
found between the baseline and the phase after the training
condition for each one of the three testing conditions or
the Pen-hold condition. A possible explanation for this
finding maybe is the fact that the learning phase was
designed in such way that it was totally different from the
30
testing phase. In the testing phase the sequence of the
movements was repeated after the end of the movements in the
three targets (10 timesX3 targets), but in the learning
phase the participants made 40 times the same movement to
the target before they go to the next target (3 targetsX40
times). There is a possibility that the sequence of the
movement and the mode of motor execution affect the learning
of the new motor activity. Another possibility is the fact
that negative motor transfer could exist for different motor
stimulus (Obayashi et al, 2004). Maybe the way that the
participants did the pointing movements affects strongly the
learning ability of them, in such way that when they did the
movement in different way in the post-learning phase, the
different motor program affects the hand movement. In
addition the interrupted visual field of the participants
during the pointing movements seemed not to affect the
movement execution because no differences were found in any
testing condition.
This experiment was done with participants, individuals
without any mental or motor problem. It would be interesting
31

to repeat this experiment in future studies, with
participants, people with motor movement coordination
problems and mainly in children with Developmental
Coordination Disorder or with autism and in generally
children with developmental problems or problems in the
cerebellum, in an attempt to find any differences after the
learning phase of this kind of experiments.
A very interesting finding is the fact that in the Pen-
hold condition for both forward and lateral axes (X and Y
direction), in the comparison between before and after the
learning phase only after the Backward-hold condition, the
hand and the tool variability were decreased very much, but
not significantly. Maybe there is a possibility that the
training phase in different tool grips affects the Pen-hold
performance with a great effect after the Backward-hold
condition. A possible explanation for this finding is that
the Backward-hold condition was very difficult to be
performed because the tip of the tool was under the
participants elbow and the participants made the pointing
movements more by chance rather than by purpose and because
32

of that, the Pen-hold condition for the post-learning phase
seemed very ‘easy’ for the participants so they performed
better.
Another interesting finding of this study is the fact
that despite the absence of significant differences, it’s
clear from the tables of the results (Tables 2, 3, 4 & 5)
that there were big individual differences between the
participants’ performance for all the testing conditions and
between the two directions. In general, the data analysis
showed no significant differences and we can say that these
findings are random and were created from the big
individuals differences between the participants.
In addition we tried to find if the between subjects
factor was bigger than the within subjects factor. For this
attempt the baseline phase for the Pen-hold condition was
examined. The tool variability in the target pointing for
all the subjects defined as the within subjects factor (SD)
and the tool variability in the target pointing in
comparison between the three testing conditions defined as
the between subjects factor. If within subjects factor was
33
bigger, more participants in each group needed for the
future studies to find significant differences. On the other
hand, if between subjects factor was bigger, more trials for
each participant in each experimental condition were needed.
The results didn’t show any statistical difference between
the two factors, but from graphs 1 and Graph 2 it’s clear
that the tool variability was bigger for all the subjects
(within subjects’ factor). From this finding we can say that
more participants are needed for each experimental group to
have more accurate and reliable results.
In the present study the Experimental Hypothesis did not
verified because we didn’t find any statistical significant
differences in the measurement of the Depended Variables and
on the other hand we must confirm the Null Hypothesis. Any
differences were found in the comparison between the pre-
learning phase (Baseline) and the post-learning phase for
all the measurements and any almost significant differences
maybe were made by chance and not as result of motor
learning for the pointing movements.
34

In conclusion we can say that more accurate and well
designed experiments will be done to have more reliable
results and the effects of motor learning in the hand
movement performance to be showed.
REFERENCES
Berti, A. & Frassinetti, F. (2000). When far becomes near:
Remapping of space by tool-use. Journal of Cognitive Neuroscience,
12:3, 415-420.
Carrozzo, M., McIntyre, J., Zago, M., & Lacquaniti, F.
(1999). Viewer-centered and body-centered frames of
35

reference in direct visuomotor transformations. Experimental
Brain Research, 129, 201–210.
Colby, C.L. & Duhamel, J.R. (1996). Spatial representation
for action in parietal cortex. Cognitive Brain Research, 5, 105-
115.
Desmurget, M., Rossetti, Y., Prablanc, C., Stelmach, G. E. &
Jeannerod, M. (1995). Representation of hand position prior
to movement and motor variability. Canadian Journal of Physiology
and Pharmacology, 73, 262–272.
Harris, C.M. & Wolpert, M.D. (1998). Signal-depented noise
determines motor planning. Nature, 394, 780-784.
Holmes, N.P., Calvert, G.A. & Spence, C. (2004). Extending
or projecting peripersonal space with tools? Multisensory
interactions highlight only the distal and proximal ends of
tools. Neuroscience Letters, 372, 62-67.
Lemay, M. Gagnon, S. & Proteau, L. (2004). Manual pointing
to remembered targets. . .
but also in a remembered visual context. Acta Psychologica,
117, 139–153.
36

Lemay, M. & Proteau, L. (2001). A distance effect in a
manual aiming task to remembered targets: a test of three
hypotheses. Experimental Brain Research, 140, 357–368.
Obayashi, S., Suhara, T., Kawabe, K., Okauchi, T., Maeda,
J., Nagai, Y. & Iriki, A. (2003). Fronto-parieto-cerebellar
interaction associated with intermanual transfer of monkey
tool-use learning. Neuroscience Letters, 339, 123-126.
Obayashi, S., Suhara, T., Nagai, Y., Okauchi, T., Maeda, J.
& Iriki, A. (2004). Monkey brain areas underlying remote-
controlled operation. European Journal of Neuroscience, 19, 1397-
1407.
Pailard, J. (1996). Fast and slow feedback loops for the
visual correction of spatial errors in a pointing task: a
reappraisal. Canadian Journal of Physiology & Pharmacology, 74, 401-
417.
Shadmehr, R. & Mussa-Ivaldi, F.A. (1994). Adaptive
representation of dynamics during learning of a motor task.
Journal of Neuroscience, 14, 3208-3224.
Todorov, E. (2004). Optimality principles in sensorimotor
control. Nature Neuroscience, 7:9, 907-915.
37

Van der Meulen, J.H., Gooskens, R.H., Denier van der Gon,
J.J., Gielen, C.C. & Wilhelm, K. (1990). Mechanisms
underlying accuracy in fast goal-directed arm movements in
man. Journal of Motor Behavior, 22(1), 67-84.
Vindras, P. & Viviani, P. (2005). Planning short pointing
sequences. Experimental Brain Research, 160(2), 141-153.
Yu, R. & Buchanan, J.J. (2004). Amplitude scaling in a
bimanual circle-drawing task: pattern switching and end-
effector variability. Journal of Motor Behavior, 36(3), 265-279.
APPENDIX
LT MT RT+ + +
SP ( )
Figure 1A: The targets on the cardboard.
38

Table 1A: Sample of Data Analysis (Microsoft Excel file).
Condition Target X direction
Y direction
Variability
Pen-Baseline
1 33,28449 -15,56722
48,85172
1 33,73643 -14,2744
48,01083
1 33,42084 16,728951
16,69189
1 32,54439 14,648546
17,89585
1 34,22188 13,786425
20,43546
1 33,72903 15,286512
18,44252
1 43,9045 4,00138 39,903122 25,89432 -
0,552346
26,44666
2 27,5935 0,5614819
27,03202
2 34,77428 -12,8337
0
47,60798
2 33,76354 -15,1071
8
48,87072
2 34,96653 -13,2939
5
48,26048
2 32,69515 -13,4134
3
46,10859
2 34,17489 -14,2769
9
48,45188
3 34,05006 16,152907
17,89715
3 28,58162 0,5933991
27,98822
3 28,16681 - 28,61277
39

0,445959
3 28,17609 0,2232948
27,9528
3 47,53833 -0,39648
3
47,93481
3 26,90479 0,0201715
26,88461
3 27,49983 -0,17675
5
27,67659
Test-Baseline
1 34,48636 15,837245
18,64912
1 34,04907 13,485299
20,56377
1 30,33386 12,691483
17,64238
1 29,92792 14,814522
15,1134
1 29,76784 12,594606
17,17323
1 28,05754 13,747579
14,30997
1 32,01244 14,014135
17,99831
1 30,3935 14,150015
16,24348
1 32,41052 14,49556
17,91496
1 28,12239 15,998617
12,12378
2 35,53282 -14,9025
1
50,43533
2 34,50259 -16,6823
1
51,18491
2 35,43769 -12,2626
8
47,70037
2 34,78015 -13,8178
1
48,59797
2 35,67748 -12,2303
8
47,90786
40

2 34,35573 -12,8683
6
47,22409
2 35,18735 -13,6333
3
48,82068
2 36,02712 -12,0247
7
48,05189
2 36,16554 -12,4695
1
48,63506
2 36,61262 -12,2818
1
48,89443
3 30,53613 -2,76465
33,30079
3 26,64792 -1,59041
1
28,23833
3 27,57796 -1,07029
8
28,64826
3 28,15766 -1,68301
8
29,84068
3 25,97632 -1,75553
1
27,73186
3 27,36675 -0,41592
5
27,78268
3 27,82526 -1,33562
4
29,16089
3 25,39134 -0,58775
5
25,9791
3 27,09937 -1,28915
7
28,38853
3 28,81702 -1,36608
4
30,1831
41

Table 2A: Sample of Data Analysis for the variability pre-post training
Distant-Hold M1 M2baseline ALL x y x ySub ID : 1
1,059469
0,629625
0,902534 1,130585
2 1,78668
7,57784
4,521559 4,896958
3 0,66633
0,682287
0,817564 0,700154
5 0,705733
0,77898
0,754459 0,791846
6 0,487338
0,561921
0,487338 0,561921
Handle-Hold M1 M2baseline ALL x y x ySub ID : 7
0,903959
0,846992
1,075425 2,170135
10 0,663442
0,936904
0,597356 1,774718
11 0,465034
0,464172
0,507711 0,519823
14 0,725956
0,622366
0,799451 1,041686
15 0,534706
0,722586
1,152314 1,8663
Backward-Hold
M1 M2
baseline ALL x y x ySub ID 4
1,475545
1,101538
4,200499 2,397459
8 1,201128
0,632167
1,23402 3,150227
9 0,787275
0,551744
1,224126 5,902264
12 0,972305
0,86971
1,07618 1,406727
13 1,014478
0,790673
1,03964 1,739993
42

Distant-Hold M1 M2testing ALL x y x ySub ID : 1
4,439741
2,337561
3,935467 2,320299
2 1,455503
1,318095
1,38383 0,87573
3 2,46488
0,661691
2,488164 0,945122
5 0,530367
0,5138 0,530367 0,5138
6 0,671204
0,489589
0,671204 0,489589
Handle-Hold M1 M2testing ALL x y x ySub ID : 7
0,612077
0,569401
0,677855 0,921668
10 0,79901
0,786035
0,517599 0,89504
11 0,594801
0,764385
0,523253 0,596489
14 0,687633
0,655233
0,855322 0,905514
15 0,691273
0,769281
0,770844 0,723158
Backward-Hold
M1 M2
testing ALL x y x ySub ID 4
1,652184
5,798419
2,813842 9,95163
8 1,631607
1,047669
1,511697 1,820551
9 1,540422
0,70447
1,945542 1,865922
12 1,220024
0,613716
1,002427 1,778659
13 0,822725
0,851925
1,027234 2,306269
43