Surplus Assets to Ongoing Operations at Nevada Mining Firm ...
Upload
independentCategory
view
0download
0
Available online at www.sciencedirect.com
www.elsevier.com/locate/gca
Geochimica et Cosmochimica Acta 83 (2012) 292–323
Halogens and trace metal emissions from the ongoing2008 summit eruption of K�ılauea volcano, Hawai�i
T.A. Mather a,⇑, M.L.I. Witt a, D.M. Pyle a, B.M. Quayle a, A. Aiuppa b,c, E. Bagnato b,R.S. Martin d,e,f, K.W.W. Sims g, M. Edmonds d, A.J. Sutton h, E. Ilyinskaya f,i
a Department of Earth Sciences, University of Oxford, South Parks Road, Oxford OX1 3AN, UKb Dipartimento DiSTeM, Universita di Palermo, Via archirafi 36, 90123 Palermo, Italy
c Istituto Nazionale di Geofisica e Vulcanologia-Sezione di Palermo, Via la malfa 153, Palermo, Italyd Department of Earth Sciences, University of Cambridge, Downing Street, Cambridge CB2 3EQ, UK
e School of Biological and Chemical Sciences, Queen Mary, University of London, London E1 4NS, UKf Department of Geography, University of Cambridge, Downing Place, Cambridge CB2 3EN, UK
g Department of Geology and Geophysics, University of Wyoming, Laramie, WY 82071-2000, USAh Hawaiian Volcano Observatory, U.S. Geological Survey, 51 Crater Rim Drive, Hawai�i National Park, HI 96718, USA
i Icelandic Meteorological Office, Bustadavegur 9, IS-150 Reykjavik, Iceland
Received 8 June 2011; accepted in revised form 15 November 2011; available online 25 November 2011
Abstract
Volcanic plume samples taken in 2008 and 2009 from the Halema�uma�u eruption at K�ılauea provide new insights intoK�ılauea’s degassing behaviour. The Cl, F and S gas systematics are consistent with syn-eruptive East Rift Zone measurementssuggesting that the new Halema�uma�u activity is fed by a convecting magma reservoir shallower than the main summit stor-age area. Comparison with degassing models suggests that plume halogen and S composition is controlled by very shallow(<3 m depth) decompression degassing and progressive loss of volatiles at the surface. Compared to most other global vol-canoes, K�ılauea’s gases are depleted in Cl with respect to S. Similarly, our Br/S and I/S ratio measurements in Hal-ema�uma�u’s plume are lower than those measured at arc volcanoes, consistent with contributions from the subductingslab accounting for a significant proportion of the heavier halogens in arc emissions. Analyses of Hg in Halema�uma�u’splume were inconclusive but suggest a flux of at least 0.6 kg day�1 from this new vent, predominantly (>77%) as gaseous ele-mental mercury at the point of emission. Sulphate is an important aerosol component (modal particle diameter �0.44 lm).Aerosol halide ion concentrations are low compared to other systems, consistent with the lower proportion of gaseous hydro-gen halides. Plume concentrations of many metallic elements (Rb, Cs, Be, B, Cr, Ni, Cu, Mo, Cd, W, Re, Ge, As, In, Sn, Sb,Te, Tl, Pb, Mg, Sr, Sc, Ti, V, Mn, Fe, Co, Y, Zr, Hf, Ta, Al, P, Ga, Th, U, La, Ce, Pr, Nd, Sm, Eu, Gd, Tb, Dy, Er, Tm) areelevated above background air. There is considerable variability in metal to SO2 ratios but our ratios (generally at the lowerend of the range previously measured at K�ılauea) support assertions that K�ılauea’s emissions are metal-poor compared toother volcanic settings. Our aerosol Re and Cd measurements are complementary to degassing trends observed in Hawaiianrock suites although measured aerosol metal/S ratios are about an order of magnitude lower than those calculated fromdegassing trends determined from glass chemistry. Plume enrichment factors with respect to Hawaiian lavas are in broadagreement with those from previous studies allowing similar element classification schemes to be followed (i.e., lithophile ele-ments having lower volatility and chalcophile elements having higher volatility). The proportion of metal associated with thelargest particle size mode collected (>2.5 lm) and that bound to silicate is significantly higher for lithophiles than chalcophiles.Many metals show higher solubility in pH 7 buffer solution than deionised water suggesting that acidity is not the sole driverin terms of solubility. Nonetheless, many metals are largely water soluble when compared with the other sequential leachates
0016-7037/$ - see front matter � 2011 Elsevier Ltd. All rights reserved.
doi:10.1016/j.gca.2011.11.029
⇑ Corresponding author. Tel.: +44 (0) 1865 282125; fax: +44 (0) 1865 272072.E-mail address: [email protected] (T.A. Mather).

Halogens and trace metal emissions from K�ılauea volcano 293
suggesting that they are delivered to the environment in a bioavailable form. Preliminary analyses of environmental samplesshow that concentrations of metals are elevated in rainwater affected by the volcanic plume and even more so in fog. However,metal levels in grass samples showed no clear enrichment downwind of the active vents.� 2011 Elsevier Ltd. All rights reserved.
1. INTRODUCTION
Understanding the composition of volcanic emissions isof interest both in terms of their impact on Earth’s atmo-sphere (e.g., Robock and Oppenheimer, 2003) and environ-ment (Delmelle, 2003), and in terms of chemical exchangebetween various parts of the Earth system (e.g., Wallace,2005). Characterising the composition of emissions fromK�ılauea volcano, Hawai�i, is important for understandingthe broader context of volcanic emissions for a number ofreasons. Firstly, degassing from K�ılauea releases prodigiousquantities of gas to an otherwise relatively pristine environ-ment. For example, the 1979–1997 average of SO2 emis-sions from Pu�u�O�o was about 1260 tonnes day�1
(Sutton et al., 2001), making it one of the major globalpoint sources of continuous volcanic emissions (c.f. Andresand Kasgnoc, 1998). Secondly, due to the low altitude andrelatively low explosivity of K�ılauea’s current activity, gasand aerosol are emitted into the lower troposphere andtherefore may have some impact on the local environmentor health of residents (Longo et al., 2008). Further, K�ılau-ea’s intraplate tectonic setting makes its emissions of greatinterest in comparison to the emissions from other tectonicsettings (e.g., arc volcanism). This may hold particularlytrue in terms of understanding halogen systematics. In hisreview of basaltic volcanism Aiuppa (2009) discusses thecharacteristically low Cl content of both Hawaiian mag-mas, and their gas emissions, when compared to arc volca-nism. Fluorine contents of non-arc magmas and emissionssuch as those from K�ılauea are, however, comparable tothose associated with arc volcanism, and reflect a lowercontribution from a subduction-related slab component toF in arc magmas compared to Cl. Measurements of Brand I in volcanic plumes and magmas are in their infancy,but initial calculations suggest that subduction-related slabcomponents are likely to play a significant role in terms ofthe contribution of Br and I to arc magmas (Pyle andMather, 2009). Data on the heavier halogen emissions fromvolcanoes are sparse, and measurements at non-arc volca-noes such as K�ılauea are vital to understand these processesfurther.
As magmas erupted in ocean island settings are alsonoteworthy for their relatively low H2O contents comparedto magmas in arc settings (e.g., Wallace, 2005), studying thehalogen degassing behaviour at K�ılauea is also importantto advance our understanding of the co-dependence of therelease of magmatic H2O and halogens. The H2O contentof parental melts at K�ılauea is estimated to be �0.4–0.7 wt.%, based on the analysis of H2O in submarine glasses(Dixon et al., 1991) and melt inclusions (Wallace andAnderson, 1998; Hauri, 2002). The low H2O content ofthe magma has implications for the efficiency of halogendegassing, since melt–vapour partition coefficients for the
halogens are heavily dependent on the H2O fugacity inthe vapour (Villemant and Boudon, 1999; Webster et al.,1999; Edmonds et al., 2002, 2009). H2O degassing fromK�ılauean melts takes place at very low pressures(<10 MPa; Gerlach, 1986) compared to typical scenariosin arc settings, where water-saturated magmas exist atmuch deeper levels in the crust. This low pressure of degas-sing raises the possibility that kinetics may limit halogenpartitioning at K�ılauea, particularly during explosive activ-ity with associated high magma ascent rates.
Contrasting patterns of halogen emission in differenttectonic settings may also lead to differences in volcanictrace-metal emissions, as halogens are thought to play animportant, if poorly understood, role in metal degassing(Murata, 1960; Symonds et al., 1987, 1992; Ammannet al., 1993; Aiuppa et al., 2009). Therefore, understandingtrace-metal behaviour in K�ılauea’s plumes may provideimportant insights into the factors that control volcanictrace-metal degassing. For this reason, as well as the rela-tive ease of access and persistently high degassing fluxesfrom K�ılauea since 1983, this volcano has been the locationfor many pioneering studies into trace-metal behaviour involcanic plumes. Important studies of metal emission bud-gets at quiescently degassing volcanoes (Hinkley et al.,1999), gas/particle partitioning of trace metals in volcanicplumes (Hinkley, 1991) and the first systematic investiga-tions of the volatility of Re and platinum group elementsat magmatic temperatures (e.g., Zoller et al., 1983; Croweet al., 1987) all resulted from work carried out on K�ılauea.
Since the start of K�ılauea’s most recent eruptive phase in1983, there have been concerns about the impacts of theplume on the environment and human health. Most ofthese concerns have centred around the effects of SO2 gas(known to exceed EPA standards in some local residentialareas under certain conditions) and the volcanic sulphateaerosol smog (known as ‘vog’) resulting from SO2 oxida-tion, which may reduce visibility for local air traffic, triggerrespiratory complaints for local people (Sutton and Elias,1993; Hollingshead et al., 2003 and references therein;Michaud et al., 2005) and result in acid rain (State ofHawaii, Department of Health, 1989). There has been lessemphasis on the dispersion and deposition of other chemi-cal species such as fluorine (D’Alessandro, 2006) or metals(Martin et al., 2009a) around the volcano and their poten-tial environmental effects.
In this study, we characterise the gas chemistry in terms ofSO2 and halogens (HF, HCl, HBr and HI) in the 2008–2009plume from Halema�uma�u crater and compare these datawith data from other emissions from K�ılauea and from volca-noes in other tectonic settings. We also characterise theplume chemistry in terms of emissions of environmentallyimportant metals. Sampling was undertaken close to thesource, but in a plume that had already been diluted and

294 T.A. Mather et al. / Geochimica et Cosmochimica Acta 83 (2012) 292–323
cooled to approximately ambient temperatures. Under theseconditions, Hinkley (1991) showed that most metals are pres-ent in the plume’s particle (or aerosol) phase. Mercury is anotable exception to this. Therefore, we measured metals inboth the size-segregated aerosol (important for determiningatmospheric lifetime and potential speciation) and in thegas phase (for both elemental and reactive forms of Hg).To complement this, we also measured environmental sam-ples (grasses, rainwater and fog) to investigate the plume’simpact on the local environment, and to highlight future ave-nues for research into the environmental consequences ofK�ılauea’s volcanic emissions.
1.1. Recent activity at K��lauea
K�ılauea (summit: 19.421�N, 155.287�W, 1222 m a.s.l.) isthe youngest and most south-easterly volcano on Big
5 kmN
30 km
MaunaKea
MaunaLoa
Kohala
Hual-lai
ā
K laueaī
N
V11
11
V12
Volcano
K laueaCraterī
Halema uma u` `
V7
In plumesampling site
includingHI_TM06
V13
Sout
hW
est R
iftZon
e
V2
V1
Ka ū Desert`
HI_TM07
Hg and filter packbackground
5000
6000
3000
2000
1000
Fig. 1. Map showing the area in which samples were taken around K�ılau(see Section 1.1). Filter pack, mercury and impactor locations are shown abe found in Table 1 for the in-plume samples). Rain and fog sample locTable 3 for more details). Vegetation samples are shown as blue crosses ware marked as black dashed lines. Contours are shown labelled in feet in 1left inset shows Hawai‘i Island, Hawai‘i and its constituent volcanoes. Trepresents the directions the wind blew from for March–August 2008 (datend of the HVO building, data courtesy of the U.S. National Park Servicespeeds of >5–7.5 ms�1, yellow bars indicate wind speeds of >7.5–10 ms�1
the references to colour in this figure legend, the reader is referred to the
Island, Hawai�i (Fig. 1). The current eruption began on 3rdJanuary 1983 in the east rift zone (ERZ). The initial breakoutwas from a fissure in Napau crater but over the next four daysfissures extended to the northeast and effusive activity thenlocalised in the area around Pu�u�O�o and Pu�u Halulu. Thisis where the majority of the activity at K�ılauea has been fo-cussed until recently (Heliker and Mattox, 2003).
The most recent cycle of activity is thought to havestarted on 17th June 2007 with earthquake swarms andrapid deflation in the upper ERZ (Poland et al., 2008,2009a). A new 50-m long lava flow from a 200-m long fissurewas identified NE of Kane Nui o Hamo, 6 km west ofPu�u�O�o (Fig. 1). On 21st July 2007, a new eruption initi-ated along a set of fissures extending 1.7 km ENE fromPu�u�O�o feeding lava into channels producing ‘a’a flows.Throughout August to November 2007 this fissure eruptioncontinued. On 21st November 2007, lava began to bypass
Pu u` ` `Ō ō
East Rift Zone
V10
Kane NuiO Hamo
17 June 2007Event
th
21 July fissure,TEB system and
rootless shield complex
st
V9
V8V5
V3 V6
V4
Volcano Guesthouse:HI_TM01 to 03 andimpactor background
HI_TM04 to 05
Napau Crater
Pu u Halulu`
90
0
270
N
ea, Hawai‘i. Sites of recent notable volcanic activity are also showns blue rectangles (sample names are too numerous to include but canations are shown as blue circles with sample names indicated (see
ith sample names indicated. Roads are shown in red. The trails used000 ft increments, but the 4000 ft contour is omitted for clarity. Thehe box locates the detail shown in the main figure. The right inseta acquired from instruments installed on a 10 m tower at the north). Blue bars indicate wind speeds 65 ms�1, green bars indicate wind, red bars indicate wind speeds of >10 ms�1. (For interpretation ofweb version of this article.)

Halogens and trace metal emissions from K�ılauea volcano 295
the 21st July channel and erupt directly from the channelflank. This became known as the Thanksgiving EveBreakout (TEB) tube, with a shield formed directly overthe breakout point (Fig. 1). Subsequent shields traced thelava tube downslope and were considered ‘rootless’ due tothe lack of a deep magma source. Rupture of the mostsouth-easterly shield caused lava flows to travel into theRoyal Gardens subdivision in January and early February,followed by a multi-fingered pahoehoe flow from the endof the rootless shield complex in late February, finally enter-ing the ocean at Waikupanaha on 5th March 2008, for thefirst time since June 2007.
Since the onset of the current eruption in 1983, SO2 hasbeen released from K�ılauea’s summit at typical rates of150–200 tonnes day�1. This is the first stage of a fractionaldegassing process that allows most of the magma’s initialsulphur content of around 1500 ppm (Dixon et al., 1991;Wallace and Anderson, 1998), to be degassed at low pressureat the eruption site downrift (Gerlach and Graeber, 1985).However, in late December 2007, the emission rate increasedto nearly 300 tonnes day�1 (Poland et al., 2009a). This ratecontinued to rise into early 2008, and by mid-February itwas fluctuating between 600 and 1000 tonnes day�1. On12th March, the rate jumped abruptly to 1500 tonnes day�1.The following day, SO2 emission rates reached the highestrecorded at K�ılauea’s summit (1800–2000 tonnes day�1)since measurements began in 1979 (Poland et al., 2009a).Around this time a prominent new gas vent broke throughthe lower east wall of Halema�uma�u accompanied on19th March 2008 by a small explosion; the first explosiveevent in the summit crater since 1924 (Wilson et al., 2008).The explosion scattered debris over an area of about0.4 km2, covering a portion of Crater Rim Drive and damag-ing the Halema�uma�u overlook. No lava was erupted aspart of the explosion, suggesting that the activity was drivenby hydrothermal or gas sources. The explosion formed asmall (35 m diameter) crater along the east wall of Hal-ema�uma�u. On 23rd March juvenile ejecta began to be ob-served in the plume (Wilson et al., 2008). During oursampling period (2008–2009), this new vent at K�ılauea’ssummit emitted a predominantly white plume, punctuatedby more explosive events during which the plume was moreash-laden and browner in colour. A lava lake was observedwithin the vent using thermal imaging. In October 2008, twoexplosive eruptions ejected fragments of frothy lava as wellas ash onto the crater rim above the vent, and rock falls peri-odically filled in the vent (http://hvo.wr.usgs.gov). Through-out 2008 the Halema�uma�u plume remained onshore, asduring previous years, and was generally blown to the south-west through the Ka��u desert, directly affecting downwindcommunities. The east rift plume was generally blown outto sea by tradewinds, dispersed and diluted before being car-ried back onshore to impact downwind communities (Longoet al., 2010).
2. SAMPLING STRATEGY AND ANALYSIS
Fieldwork was undertaken in the Volcanoes NationalPark, Hawai�i Island, Hawai�i in July 2008 and April2009. Plume samples were collected on the caldera rim near
the new Halema�uma�u vent, and environmental samples(grasses, rain and fog) were collected from the surroundingarea.
2.1. In-plume sampling
Plume sampling (detailed in Table 1) was undertaken onthe crater rim overlooking the Halema�uma�u vent (Fig. 1).Filter packs were used to collect bulk particles and acid gassamples. Gold traps were used to collect total gaseous mer-cury (TGM), a KCl denuder to sample reactive gaseous mer-cury (RGM) and quartz particle traps were used to collectparticulate mercury (Hgp). A high-volume impactor wasused to collect size-segregated aerosol. Background samples,assumed to be away from the main influence of the plume,were taken on the road up the flank of Mauna Loa and inVolcano village (Fig. 1). Subsequent analyses determinedthat samples from the flank of Mauna Loa (site V7) didnot appear to be completely representative of the back-ground atmosphere and in fact were influenced to some de-gree by the volcano (see Electronic annex EA-1-1), mostlikely due to the complex wind field around Mauna Loa.However, studies such as that of Benitez-Nelson et al.(2003) suggest that atmospheric air in the Hawai�i VolcanoesNational Park is relatively pristine, apart from the influenceof the volcano.
2.1.1. Filter packs
Air was pumped at a known flow rate (from 10 to25 L min�1) through filter packs containing four filters inseries for 37–114 min. The first filter collected solid and li-quid particles and the subsequent three filters were impreg-nated with alkali to trap acidic gaseous volatiles (Ferm andSvanberg, 1998). SO2, HCl, HBr, and HI collected on thefilters was measured according to the methodology detailedby Aiuppa et al. (2005) and Witt et al. (2008). Br and I wereanalysed by inductively coupled plasma mass spectrometry(ICP-MS), while S, Cl and F were analysed by high-perfor-mance liquid chromatography (HPLC) in 2008, and ionchromatography (IC) in 2009. The Br and I measurementswere bracketed every 12 samples with measurements of5 ppb solutions of the AAS standard. These showed a rela-tive standard deviation of 10%. The IC samples were brack-eted every five samples with multi-element standards, whichshowed a relative standard deviation of 2–3%. Based ontriplicate analyses of samples, the uncertainties in theICP-MS measurements for Br and I are ±11%, and±19%, respectively. Errors in the determination of S, Cland F are estimated as approximately ±10%. Blank filtersand field blanks (i.e., filters from filter packs transportedinto the field and back in an identical manner to samplesbut not attached to a pump) were also analysed and foundto be negligible compared to the measured values.
2.1.2. Mercury measurements
Gold-coated sand traps were used to collect total gas-eous mercury (TGM). Air was drawn through the gold trapat a rate of 0.4–0.6 L min�1 for sampling periods of 36–72 min. An inline filter pack containing a filter impregnatedwith 1 M NaHCO3 was used in series with the gold traps to

Table 1Samples taken in the plume at the crater rim just above the new Halema‘uma‘u vent (�50–100 m distance).
Sample code Sample type Date Mean flow rate (L min�1) Sample duration (hh:mm)
2008 Samples:21-HIMDI-04 Impactor 21 July 85 03:4421-HIFP-05 Filter pack 20 01:1121-HITGM-06 Au trap 0.45 01:0221-HIHg(p)-07 Particle trap 5 01:1021-HIFP-08 Filter pack 21 01:2121-HITGM-09 Au trap 0.55 00:4321-HIHg(p)-11 Particle trap 4.5 01:4021-HIFP-12 Filter pack 17.5 01:0621-HITGM-13 Au trap 0.45 00:3621-HIFP-14 Filter pack 25 01:1821-HITGM-15 Au trap 0.55 01:0821-HIHg(p)-16 Particle trap 4.5 01:0824-HIMDI-17 Impactor 24 July 105 05:1524-HIFP-18 Filter pack 25 01:0024-HIHg(p)-19 Particle trap 4.4 00:5624-HITGM-20 Au trap 0.5 00:5624-HIFP-21 Filter pack 20 01:5424-HIRGM-22 Denuder 9 01:1424-HIHg(p)-23 Particle trap 4.5 01:1224-HITGM-24 Au trap 0.5 01:1224-HIFP-25 Filter pack 18 01:1424-HIHg(p)-26 Particle trap 4.4 01:1624-HITGM-27 Au trap 0.5 00:4025-HIFP-28 Filter pack 25 July 18 00:5825-HIMDI-29 Impactor 91 04:0325-HIFP-30 Filter pack 16.5 00:3925-HITGM-31 Au trap 0.5 00:3725-HIHg(p)-32 Particle trap 4.4 01:2125-HIFP-33 Filter pack 22 00:4325-HITGM-34 Au trap 0.6 01:0025-HIHg(p)-35 Particle trap 4.3 01:0025-HIRGM-36 Denuder 9 01:0025-HITGM-37 Au trap 0.5 00:4225-HIHg(p)-38 Particle trap 4.2 01:0525-HIFP-39 Filter pack 26.5 01:04
2009 Samples:HI09-1/1a Filter pack 15 April 22 00:51HI09-1/1b Filter pack 22 00:51HI09-1/3 Filter pack 22 00:52HI09-1/4 Filter pack 22 00:50HI09-1/5 Filter pack 22 00:49HI09-2/1 Filter pack 17 April 22 00:56HI09-2/2 Filter pack 22 00:50HI09-3/1 Filter pack 20 April 22 00:57HI09-3/2 Filter pack 22 00:53HI09-3/3a Filter pack 22 00:44HI09-3/4 Filter pack 22 00:37HI09-3/3b Filter pack 22 00:44HI09-3/5 Filter pack 22 00:59HI09-4/1 Filter pack 21 April 22 00:51HI09-4/2 Filter pack 22 00:58HI09-4/3 Filter pack 22 01:01HI09-4/4 Filter pack 22 00:42HI09-5/5 Filter pack 22 April 22 00:59HI09-5/6 Filter pack 10 01:02
A portable weather station used during sampling recorded 38–70% relative humidity (RH), 21–30 �C in 2008, and 77–92 RH %, 18–23 �C in2009. In 2008 a filter pack, particle trap and Au trap were also taken part way up the flank of Mauna Loa (V7 in Fig. 3). In 2009 filter packswere also taken in Volcano Village and on the Chain of Craters Road.
296 T.A. Mather et al. / Geochimica et Cosmochimica Acta 83 (2012) 292–323

Halogens and trace metal emissions from K�ılauea volcano 297
measure the corresponding SO2 concentration in the gassampled. Sample handling, analysis, blank values, repro-ducibility and analytical uncertainty were as described inWitt et al. (2008) and Bagnato et al. (2007).
Reactive gaseous mercury (RGM) was collected usingan annular denuder treated with KCl as described by Lan-dis et al. (2002). Gases were drawn through the denuders ata rate of 9 L min�1. A filter pack containing four filters,treated with 1 M NaHCO3 to determine the correspondingSO2 concentration in the gas sampled was placed after thedenuder. The sampling set up and analysis methodologyare as described in Witt et al. (2008). The overall uncer-tainty in this method is 615% (Landis et al., 2002).
A 7-mm diameter quartz microfiber filter minitrap sup-ported on a nickel grid in a glass tube was used to measureparticulate Hg in a number of samples. The air was drawnthrough the tube for 1–2 h at a flow rate of 4.25–5 L min�1.Sample handling, analysis and uncertainties are as de-scribed in Witt et al. (2008) and Bagnato et al. (2007).
2.1.3. Impactor measurements
A high-flow cascade impactor with five stages (MSPCorporation, Minneapolis, Minnesota, USA) was used todetermine the size-segregated distribution of trace metalsin ambient air. Five impactor plates, each loaded with a sin-gle PTFE filter (Whatman 0.2 lm pore size, 76 mm diame-ter, acid washed prior to use in 10% HNO3 baths) divide thecascade impactor. A pump, driven by two 12 V car batteriesin series, pulls the surrounding air through the impactor.To obtain cut-off diameters of 2.5, 1.4, 0.77, 0.44 and0.26 lm a flow rate of 100 L min�1 is required. A TSI4040 series flow meter was used to monitor the inlet flowrate, and a control valve was used to optimise the flow rateduring sampling. A plastic hood provided weather coverduring sampling. Following exposure, each filter was placedin a polystyrene petri dish, which was sealed and stored,double bagged, in a freezer until analysis back in the UKin a class 100 clean lab. Background samples, assumed tobe away from the main influence of the plume (confirmedby air mass forward trajectory modelling using HYSPLIT;Draxler and Rolph, 2003) were taken at the Volcano GuestHouse in Volcano village (Fig. 1).
A three-stage sequential leaching scheme was employedto assess the solubility of metals in the aerosols (Chesteret al., 1989; Hlavay et al., 1996). The filters were cut intoquarters using ceramic scissors. The impactor is configuredsuch that it deposits particles on the plates in a symmetricalpattern of spots and the filters were cut in order to capturean equal number of deposit spots on each quarter. Onequarter of each filter was cut into small pieces and trans-ferred to an acid-cleaned centrifuge tube. The first stageinvestigated the environmentally labile fraction, 15 ml ofultraclean water (>18 MO Milli-Q) was added to the tubeswhich were then sonicated for 15 min at room temperature.The suspensions were then centrifuged at 3000 rpm for15 min. The supernatant was removed with a pipette andstored for analysis. The moderately environmentally-labilematerial (assumed in Chester et al., 1989, and Hlavayet al., 1996, to be bound to carbonates and oxides) wasdetermined with the addition of 10 ml 1-M hydroxylamine
hydrochloride in 25% acetic acid to the residues from step1. This solution was prepared with specified laboratory re-agent grade H3NO.HCl and 99+ % SpeciFied glacial aceticacid. The material was extracted for 6 h at room tempera-ture before centrifuging at 3000 rpm for 15 min with thesupernatant removed for analysis. The environmentalimmobile fraction (bound to silicates) was then found; theresidue was transferred to clean PTFE pots and 5 ml con-centrated quartz-distilled HNO3 was added to each sample.Samples were slowly heated to dryness and 1 ml of concen-trated quartz-distilled HF was added and again heated todryness. Finally, 1 ml of concentrated HNO3 was addedto each sample, and again gently dried. The material wasthen re-dissolved in 0.1 M HNO3 and transferred to centri-fuge tubes for analysis. An exposure blank, set up in theimpactor on Hawai�i at the background site but withoutthe pump being switched on, was analysed in the same man-ner as the samples.
For each stage of each impactor run a separate filterquarter was extracted with 15 ml of pH 7 buffer ammoniumacetate (prepared from Aristar concentrated ammonia solu-tion and 99+ % SpeciFied glacial acetic acid) and analysedin the same manner as for the ultra-pure water in order toassess the effects of co-deposited acidic aerosol species onmetal solubility.
Following extraction, samples were analysed for metalsusing a Thermo-Finnigan Element2 magnetic-sector ICP-MS. The pH 7 and 25% acetic acid solutions were evapo-rated to dryness and re-dissolved in 0.1 M HNO3 for anal-ysis by ICP-MS. Samples were spiked with 2 ppb Rh as aninternal standard. External calibration was performed usingdilutions of ICP-MS-68A multi-element standard (Highpurity standards, Inc.) and AAS standards for S and highfield strength elements which were prepared in trace HF.Unused, cleaned filters were extracted in the same manneras samples, and the concentrations in these solutions wereused as blanks to correct the measurements of aerosol con-centrations (blank values and detection limits for each me-tal and extraction step are provided in Electronic annexEA-1-2). A high-resolution analysis mode was used for ele-ments such as As to avoid problems with overlapping sig-nals (e.g., from ArCl). Uncertainties were calculatedbased on replicate analyses of the same aerosol sample (Ta-ble 2). Concentrations of Cl�, F� and SO2�
4 in the Milli-Qextracts of the aerosol samples were measured by ion chro-matography (Table 2).
2.2. Downwind samples
2.2.1. Rain and fog
Rain samples were collected at various locations aroundK�ılauea (Table 3, Fig. 1) into HDPE and FEP bottles,which had been pre-cleaned by sequential washing withHCl and HNO3 (Witt and Jickells, 2005), using funnels con-structed from the top of drinking water bottles. The funnelswere not cleaned as for trace metal work, however as rainonly spends a short period of time in contact with the fun-nel it should pose a low contamination risk. The blank con-tribution was also assessed by passing Milli-Q through usedfunnels and bottles, these values are reported in Table 4.

Table 2Concentrations in ng m�3 (except � lg m�3 and * in pg m�3), mass ratios with SO2 and fluxes (in kg day�1 except for those elements markedwith * which are in g day�1) of species measured in K�ılauea volcanic and background aerosols with gaseous SO2 levels for comparison.
Concentration Mean X/SO2b Fluxc
Backgrounda 21-Jul 24-Jul 25-Jul
�Cl� 3.7 16 2.4 12 6.4 � 10�4 110–911± (0.9) (3.9) (0.6) (3.1) (4.8 � 10�4)
�F� 1.7 0.04 2.6 0.03 6.9 � 10�5 0.73–161± (0.8) (0.02) (1.2) (0.01) (12 � 10�5)
�SO2�4 1.4 120 200 160 1.1 � 10�2 4660–12,400
± (0.8) (68) (115) (94) (0.4 � 10�2)�SO2 21d 13 600d 13 000d 21 000d
Alkali metals
Li 2.1 2.3 4.9 14.3 4.1 � 10�7 0.10–0.5± (0.2) (0.5) (0.8) (3.2) (2.6 � 10�7)
Na 711 3017 917 432 1.0 � 10�4 12–178± (274) (993) (324) (138) (1.1 � 10�7)
K 923 1772 688 1597 8.7 � 10�5 32–104± (99) (251) (69) (200) (4.0 � 10�5)
Rb 0.19 2.2 1.6 2.7 1.4 � 10�7 0.076–0.13± (0.04) (0.3) (0.6) (0.7) (0.2 � 10�7)
*Cs 3.0 138 102 219 9.5 � 10�9 4.7–8.3± (0.7) (30) (22) (49) (1.5 � 10�9)
Chalcophile elementse
Be <bl 2.48 0.18 0.61 7.5 � 10�8 0.01–0.15± (0.06) (0.02) (0.02) (9.3 � 10�8)
B 22 1675 1126 1148 8.8 � 10�5 33–99± (4) (229) (165) (206) (3.4 � 10�5)
Cr 27 80 399 111 1.4 � 10�5 3.2–25± (1) (3) (15) (4) (1.5 � 10�5)
Ni 49 1555 230 66 4.5 � 10�5 1.9–92± (3) (64) (10) (3) (6.1 � 10�5)
Cu 4.1 147 44 25 5.1 � 10�6 0.72–8.6± (0.4) (9) (3) (2) (5.0 � 10�6)
Zn 238 1503 349 416 5.2 � 10�5 12–89± (61) (170) (80) (41) (5.1 � 10�5)
Mo 0.7 4.7 5.4 2.4 2.3 � 10�7 0.07–0.28± (0.1) (0.5) (0.7) (0.3) (1.7 � 10�7)
Cd 6.3 103 75 52 5.3 � 10�6 1.5–6.1± (3.6) (12) (8) (6) (2.6 � 10�6)
*W <bl 146 354 258 1.7 � 10�8 6.4–22± (26) (57) (31) (0.9 � 10�8)
*Re 8.7 2822 1531 1515 1.3 � 10�7 43–166± (3.0) (260) (138) (138) (0.7 � 10�7)
Ge 0.31 5.9 19.4 3.6 7.0 � 10�7 0.10–1.2± (0.02) (1.5) (7.7) (0.9) (7.0 � 10�7)
As 0.7 27.3 13.1 9.7 1.2 � 10�6 0.28–1.6± (0.2) (2.0) (1.0) (0.8) (0.8 � 10�6)
Se 361 1490 395 2814 9.1 � 10�5 18–107± (38) (145) (40) (290) (5.4 � 10�5)
In 0.3 1.0 2.5 0.9 1.0 � 10�7 0.02–0.15± (0.1) (0.1) (0.2) (0.1) (0.8 � 10�7)
Sn 9 51 112 76 5.3 � 10�6 2.2–6.9± (2) (9) (29) (19) (2.9 � 10�6)
Sb 0.5 2.5 1.6 0.9 1.2 � 10�7 0.02–0.15± (0.1) (0.4) (0.2) (0.2) (0.7 � 10�7)
Te 1.4 134 77 64 6.3 � 10�6 1.8–7.9± (0.8) (15) (9) (7) (3.4 � 10�6)
Tl 0.08 2.8 3.3 2.4 1.9 � 10�7 0.07–0.20± (0.01) (0.4) (0.4) (0.3) (0.7 � 10�7)
Pb 3.8 40 90 26 3.7 � 10�6 0.75–5.5± (0.6) (3) (7) (2) (2.9 � 10�6)
Bi 8.7 4.3 4.6 4.9 3.0 � 10�7 0.14–0.28± (4.0) (1.9) (1.9) (1.7) (0.6 � 10�7)
298 T.A. Mather et al. / Geochimica et Cosmochimica Acta 83 (2012) 292–323

Table 2 (continued)
Concentration Mean X/SO2b Fluxc
Backgrounda 21-Jul 24-Jul 25-Jul
Lithophile elementse
Mg 83 392 357 299 2.4 � 10�5 8.5–23± (6) (26) (15) (12) (0.8 � 10�5)
Ca 1180 3600 1575 926 1.4 � 10�4 26–212± (142) (467) (243) (119) (1.1 � 10�4)
Sr 2.0 5.6 6.7 6.1 4.1 � 10�7 0.17–0.42± (0.1) (0.6) (0.4) (0.5) (1.2 � 10�7)
Ba 4.1 5.4 10.9 11.0 5.9 � 10�7 0.24–0.67± (0.5) (0.9) (2.3) (3.3) (2.3 � 10�7)
*Sc 4.9 112 146 151 8.9 � 10�9 4.3–9.0± (0.4) (13) (18) (17) (2.1 � 10�9)
Ti 1.0 29 53 119 4.0 � 10�6 1.3–4.5± (0.1) (8) (16) (38) (1.8 � 10�6)
V 0.52 5.6 4.1 2.1 2.8 � 10�7 0.06–0.33± (0.01) (0.4) (0.8) (0.5) (1.6 � 10�7)
Mn 5.3 20.2 26.2 12.9 1.4 � 10�6 0.37–1.6± (0.2) (1.3) (2.8) (2.1) (0.7 � 10�6)
Fe 388 767 1830 716 7.7 � 10�5 20–113± (18) (53) (289) (123) (5.6 � 10�5)
Co 0.10 4.7 1.7 1.5 1.8 � 10�7 0.04–0.28± (0.02) (0.5) (0.4) (0.2) (1.4 � 10�7)
*Y 12 519 752 412 3.9 � 10�8 12–46± (3) (25) (32) (21) (1.9 � 10�8)
*Zr 507 6525 7701 5568 4.5 � 10�7 159–475± (43) (622) (565) (699) (1.7 � 10�7)
*Nb 232 32 315 741 2.1 � 10�8 1.4–28± (43) (7) (68) (165) (1.7 � 10�8)
*Hf 8.7 106 136 103 7.7 � 10�9 3.0–8.4± (0.4) (12) (10) (16) (2.8 � 10�9)
*Ta <bl 359 6.8 6.6 9.1 � 10�9 0.19–21± (71) (1.2) (1.1) (15 � 10�9)
Al 76 1974 3983 1114 1.7 � 10�4 32–246± (6) (211) (420) (349) (1.3 � 10�4)
P 19 144 26 38 4.8 � 10�6 1.1–8.5± (2) (16) (3) (4) (5.0 � 10�6)
*Ga 27 776 1931 468 7.6 � 10�8 13–119± (5) (122) (461) (111) (6.5 � 10�8)
*Th <bl 21 26 114 3.0 � 10�9 0.95–4.3± (2) (3) (15) (2.1 � 10�9)
*U 0.27 36 35 68 2.9 � 10�9 1.6–2.6± (0.03) (5) (4) (10) (0.3 � 10�9)
Lanthanoids*La 44 267 378 1076 3.3 � 10�8 12–41
± (3) (20) (15) (93) (1.6 � 10�8)*Ce <bl 473 250 1009 3.4 � 10�8 12–38
± (90) (67) (244) (1.4 � 10�8)*Pr 9.4 31 39 106 3.4 � 10�9 1.4–4.0
± (1.1) (2) (3) (8) (1.4 � 10�9)*Nd <bl 45 138 386 1.1 � 10�8 2.0–15
± (7) (24) (68) (0.8 � 10�8)*Sm 0.9 15 30 63 2.1 � 10�9 0.67–2.4
± (0.4) (4) (5) (6) (1.0 � 10�9)*Eu 1.2 14 11 14 8.6 � 10�10 0.41–0.84
± (0.1) (2) (1) (1) (1.9 � 10�10)*Gd <bl 16 30 43 1.8 � 10�9 0.73–1.8
± (4) (4) (2) (0.6 � 10�9)*Tb 0.14 2.1 5.0 6.9 2.9 � 10�10 0.09–0.31
± (0.03) (0.3) (0.5) (0.6) (1.2 � 10�10)*Dy 0.5 13 27 42 1.7 � 10�9 0.56–1.7
± (0.1) (1) (3) (5) (0.6 � 10�9)(continued on next page)
Halogens and trace metal emissions from K�ılauea volcano 299

Table 3Rain, fog and dust sample locations and dates.
Sample name Type ofsample
Location description Location coordinates Start dateand time
Stop dateand time
Masssample (g)
HI TM01 Rain Volcano Guest House 19�25.480N 155�12.420W 1046 m 23/07/2008 07:00 23/07/2008 18:00 77HI TM02 Rain Volcano Guest House 19�25.480N 155�12.420W 1046 m 23/07/2008 19:00 24/07/2008 06:15 24HI TM03 Rain Volcano Guest House 19�25.480N 155�12.420W 1046 m 24/07/2008 07:00 27/07/2008 07:30 46HI TM04 Rain Chain of Craters Rd. 19�19.1430N 155�09.8310W 643 m 23/07/2008 12:30 24/07/2008 17:00 15HI TM05 Fog Chain of Craters Rd. 19�19.1590N 155�09.8200W 645 m 23/07/2008 12:20 24/07/2008 17:00 35HI TM06 Dust Halema‘uma‘u Crater Edge 19� 24.0130N 155�16.880W 1112 m 24/07/2008 06:30 25/07/2008 13:00 10a
HI TM07 Dust Highway 11 19�18.8010N 155�24.5730W 767 m 24/07/2008 14:20 27/07/2008 13:00 10a
a 10 ml of Milli-Q added to empty bottle.
Table 2 (continued)
Concentration Mean X/SO2b Fluxc
Backgrounda 21-Jul 24-Jul 25-Jul
*Ho 5.3 2.7 5.3 11.3 3.8 � 10�10 0.12–0.43± (1.1) (0.3) (0.4) (0.6) (1.7 � 10�10)
*Er 0.08 9.7 14.2 29.0 1.1 � 10�9 0.43–1.1± (0.01) (1.2) (1.8) (4.0) (0.3 � 10�9)
*Tm 1.1 1.5 2.3 5.4 1.8 � 10�10 0.07–0.20± (0.1) (0.1) (0.3) (0.7) (0.7 � 10�10)
*Yb 29 10 15 55 1.5 � 10�9 0.45–2.1± (15) (3) (3) (9) (0.9 � 10�9)
*Lu 10 1.6 2.0 12 2.9 � 10�10 0.07–0.47± (2) (0.2) (0.2) (1) (2.6 � 10�10)
Notes:<bl = below blank level.Uncertainties in the concentrations are calculated using the average relative standard deviation of replicate analyses of samples (triplicateanalysis were carried out for three or four samples for each of the different extraction methods or steps) for each extraction proceduremultiplied by the concentrations in each sample (in g m�3). For the metal samples the uncertainties from the sequential extraction procedurewere combined thus: Sample error = [(Average RSD of replicate analyses of a size fraction in MQ � bulk metal concentration soluble in MQin g m�3)2 + (Average RSD of replicate analyses of a size fraction in 25% acetic acid � bulk metal concentration soluble in 25% acetic acid ing m�3)2 + (Average RSD of replicate analyses of a size fraction in HF solution � bulk metal concentration soluble in HF in g m�3)2]1/2.
a Background sample collected at Volcano village �7 km upwind from the summit plume (Fig. 1). For details of other samples see Table 1.b X/SO2 mass ratios are given relative to SO2 concentrations in treated filters for the same day, uncertainty stated as standard deviation of
the X/SO2 ratio for the three volcanic samples collected.c Flux ranges are calculated using the lowest and highest X/SO2 ratios multiplied by the lower and upper estimate of the daily SO2 flux (600
and 800 Mg day�1, see Table 5) respectively.d Mean SO2 values are taken from alkali treated filters collected on same day as aerosol samples (see data in Electronic annex EA-1-1).e For discussion of how we have classified elements as chalcophile versus lithophile in this context see Section 3.3.4 in the text.
300 T.A. Mather et al. / Geochimica et Cosmochimica Acta 83 (2012) 292–323
We also collected one fog sample using a passive stringcollector at a site near Chain of Craters Road under theplume of Pu�u�O�o at an elevation of 640 m. The amountof fog collected was dependent upon the wind speed anddroplet size. Samples were filtered through a pre-cleaned0.2 lm filter unit and acidified with nitric acid followedby analysis for their dissolved trace metal content withICP-MS.
There was no rain in the collectors for samplesHI_TM06 and HI_TM07, but since the bottles containeddust from the area this was investigated back in the UK.Ten millilitres of double distilled water (Milli-Q, >18 MX)was added to the empty bottles (HI_TM06 and HI_TM07),which were then shaken well and analysed as the rest of therain and fog samples.
2.2.2. Vegetation samples
On 19th, 20th, 23rd and 24th July 2008, grasses weresampled from the flanks of K�ılauea near the Chain of Cra-
ters Road and Highway 11 (Fig. 1 and Electronic annexEA-1-3). Samples were collected approximately 100 m backfrom the roadside in order to avoid contamination by roaddust (Caselles, 1998). Factors such as varying elevation,volcanic activity and strong precipitation gradients resultin vegetation species varying over relatively short spatialscales in this area, leading to some difficulties samplingthe same or similar species. At least three different speciesof grass were collected; identification was difficult but theylikely included Pennisetum clandestinum, Sporobolus indi-
cus, and Paspalum urvillei (Morden and Caraway, 2000).Grasses that looked dry were chosen and placed in ziplockbags. These were transferred to absorbent paper and aweight placed on top to dry the samples out. Grass was in-spected and the healthiest blades selected, ensuring dam-aged pieces were removed. A brush was used to removesurface contamination and blades were washed using de-ionised water if necessary. All samples were oven driedfor 20 h at 90 �C.

Table 4Metal concentrations (ppb by mass) in the rain, fog and dust samples (n.d.=none detected).
Na K Mg Ca Sr Mo
Rain samplesBlank n.d. 23 7 100 n.d. 0.005
HI TM01 Volcano Guest House 213 116 21 132 0.01 0.007HI TM02 Volcano Guest House 1044 70 62 150 0.07 0.008HI TM03 Volcano Guest House 864 702 184 224 0.40 0.008HI TM04 Chain of Craters Rd. 3276 435 355 627 2.6 0.057
Fog sampleHI TM05 Chain of Craters Rd. 70,456 13,011 11,120 29,602 154.6 0.69
Dust samplesHI TM06 Halema‘uma‘u 2302 614 1030 4335 11.8 0.074HI TM07 Highway 11 1097 236 135 436 1.5 0.005
Al V Cr Mn Fe Co Ba Pb Ni Zn As Cu Cd
Rain samplesBlank 3.9 0.04 0.11 0.14 2.4 0.015 0.21 0.35 0.58 19.2 0.01 0.46 0.04
HI TM01 V. Guest House 3.5 0.1 0.1 0.3 2.4 0.032 0.23 0.36 0.46 14.3 0.01 0.51 0.02HI TM02 V. Guest House 2.4 0.2 0.1 0.2 2.0 0.042 0.18 0.23 0.38 13.9 0.01 0.27 0.01HI TM03 V. Guest House 4.6 0.1 0.1 12.1 2.3 0.014 0.35 0.64 0.31 13.9 0.01 0.22 0.03HI TM04 Chain of Craters Rd. 168.3 1.0 0.8 4.1 159.8 0.258 1.19 2.15 2.77 40.3 0.29 6.86 6.20
Fog sampleHI TM05 Chain of Craters Rd. 1685.5 7.7 10.8 215.6 2839.7 2.999 22.32 49.72 23.32 587.3 0.95 405.79 29.36
Dust samplesHI TM06 Halema‘uma‘u 751.3 2.7 3.0 31.1 494.6 0.845 4.15 9.11 6.72 407.9 0.18 11.53 16.68HI TM07 Highway 11 32.8 0.2 0.3 4.9 23.0 0.192 0.79 2.19 0.88 48.5 0.02 1.44 2.59
Halogens and trace metal emissions from K�ılauea volcano 301
Ceramic scissors were used to cut the grasses into<1 mm pieces. Scissors were cleaned before and after eachsample using deionised water. This material was furthersieved to retain a fine powder with particle sizes of less than1 mm. The powder was transferred to a glass vial andplaced in a desiccator for 4–5 days to remove any residualwater.
The fine plant material and three plant reference stan-dards (peach leaf – NIST 1547, tomato leaf – NIST 1573aand rye grass – BCR CRM 281) were digested and analysedby ICP-MS (Thermo-Finnegan Element 2 HR-ICP-MS)according to methodology described previously (Quayleet al., 2010). Uncertainties quoted as the coefficient of vari-ation for triplicate analysis of sample V5 are as follows: Al(9%), As (22%), B (3%), Ba (8%), Ca (2%), Cd (3%), Co(22%), Cu (4%), Fe (7%), K (9%), Mg (2%), Mo (12%),Mn (11%), Rb (11%), Sr (8%), Tl (12%), Zn (2%). There willbe an additional uncertainty due to the digestion process,which although formally unquantified for this study, hasbeen shown to be 10–15% (Quayle et al., 2010). The concen-trations of all reported elements were significantly greater inthe samples than in the procedural blanks (with all concen-trations reported corrected for these blanks). Concentra-tions in the solutions analysed were sufficiently high toenable the ICP-MS to be used at high resolution for elementssuch as As, Fe and K where there were potential interfer-ences from species such as argon oxide and chloride.
The total mercury content of grass samples was investi-gated with pyrolysis. Between 30 and 60 mg (weighed to
0.1 mg) of dried, sieved grasses were placed in a quartz sam-ple boat and heated to around 500 �C with a PYRO 915+two chamber catalyst atomizer (Lumex, Russia). The mer-cury released by the sample was then detected with a Lumex915+ portable mercury vapour analyser via Zeeman atomicabsorption spectrometry (AAS) using high-frequency mod-ulation of light polarisation. The system was calibratedusing certified standards (NIST 2782 Industrial sludge,NIST-2587 Soil containing lead from paint).
3. RESULTS AND DISCUSSION
3.1. Gas-phase sulphur and halogen emissions
The filter pack-derived plume concentrations of SO2,HCl, and HF were used to derive HX/SO2 molar ratios(Table 5 and Electronic annex EA-1-1). There is notablevariability in both the HCl/SO2 and HF/SO2 molar ratios,with mean values of 0.038 ± 0.03 and 0.035 ± 0.03, respec-tively, in 2008 (ranges, 0.015–0.122 and 0.013–0.106) and0.054 ± 0.04 and 0.041 ± 0.07, respectively, in 2009 (ranges,0.013–0.180 and 0.004–0.292). In contrast, calculated HF/HCl ratios appear to be more stable especially in 2008(mean 0.9 ± 0.2, range 0.6–1.3 in 2008; mean 0.6 ± 0.5,range 0.3–2.2 in 2009), a feature that is typical of most vol-canoes worldwide (Aiuppa, 2009; Pyle and Mather, 2009).Large (from < 0.5 to >4) and fast (timescales of secondsto minutes) variations of HCl/HF ratios have recently beenidentified at K�ılauea’s Pu�u�O�o vent from high-resolution

Table 5Mean measured concentrations of gaseous SO2, HCl, HF, HBr, and HI at the crater rim, ratios HX/SO2 (HX = Halogen halide), and halogenfluxes in the plume from Halema‘uma‘u.
SO2 ± HCl ± HF ± HBr ± HI ±
2008Concentration (lg m�3) 16,100 8000 330 270 160 130 0.50 0.35 0.044 0.035Ratio (HX/SO2)
Mass – 0.021 0.017 0.011 0.009 3.6 � 10�5 3.1 � 10�5 3.0 � 10�6 1.7 � 10�6
Molar – 0.038 0.030 0.035 0.028 2.9 � 10�5 2.5 � 10�5 1.5 � 10�6 0.9 � 10�6
Flux (Mg d�1)a 600–800 12–16 6–8 0.02–0.03 0.0018–0.0024
2009Concentration (lg m�3) 111,000 62,000 3200 2900 870 880 2.10 1.57 0.197 0.188Ratio (HX/SO2)
Mass – 0.031 0.025 0.013 0.020 3.2 � 10�5 5.2 � 10�5 2.7 � 10�6 3.9 � 10�6
Molar – 0.054 0.043 0.041 0.066 2.5 � 10�5 4.1 � 10�5 1.4 � 10�6 2.0 � 10�6
Flux (Mg d�1)b 700 22 9 0.02 0.0019
Errors are quoted as one standard deviation.a The 2008 SO2 flux is taken as between 600 and 800 tonnes day�1, based on HVO measurements 16–26 July 2008.b The 2009 SO2 flux is taken as 700 tonnes day�1, based on HVO measurements 15 April 2009. These measurements are reported in the
Hawaiian Volcano Observatory daily updates (http://hvo.wr.usgs.gov).
302 T.A. Mather et al. / Geochimica et Cosmochimica Acta 83 (2012) 292–323
FTIR measurements (Edmonds et al., 2009). Such fluctua-tions were interpreted as resulting from variations in shal-low processes of exsolution and gas bubble-meltseparation. We find no evidence in our dataset of these ra-pid inter-halogen fluctuations but we would not expect thatour time-integrated (sampling times 36–114 min, Table 1)filter pack measurements would capture them, especially ifthey exerted a relatively minor influence in terms of long-term average (hourly or daily) degassing compositions.
Most previous measurements of halogen to sulphur ra-tios at K�ılauea have been made in the East Rift Zone(ERZ). Our filter pack results from Halema�uma�u are setin the context of these previous ERZ measurements inFig. 2a. Our measurements show that the gases emittedby the new Halema�uma�u vent are consistent in composi-tion with previous syn-eruptive measurements at the erup-tion site on the ERZ, which are generally characterised bymolar HX/SO2 of < 1. This similarity between the gas com-position at Halema�uma�u and that at the ERZ is unusualin terms of the longer-term pattern of 2-stage gas releasecharacteristic of K�ılauea. Previous models of the magmasystem at K�ılauea suggest that magma ascends and is storedbeneath the summit caldera (at high enough pressure to re-tain the majority of its halogens but to lose some S and al-most all of its C) before migrating to the ERZ where at leastsome of it is erupted through the Pu�u�O�o vent system(e.g., Gerlach and Graeber, 1985; Gerlach et al., 2002). Thishas resulted in characteristic C- and S-rich ‘Type I’ degas-sing at K�ılauea’s summit (for comparison, the molar Cl/Sfor the 1918–1919 summit lava lake gases were mean0.01, range 0–0.02; Gerlach, 1993) and H-, S- and halo-gen-rich degassing in the ERZ (Gerlach and Graeber,1985). We suggest that our new observations of summitgas compositions can be explained by the new eruption atHalema�uma�u being fed by a convecting magma reservoirthat is shallower than the main summit magma storagearea. The existence of this shallow reservoir is further sup-ported by: gravity surveys between 1975 and 2008 that
indicate addition of mass below the southeast rim of Hal-ema�uma�u Crater at no more than 1 km depth (Johnsonet al., 2010); modelling of deflation at the summit measuredby InSAR showing a fit to the data with a point source cen-tred just east of the Halema�uma�u crater at 1.2–1.8 kmdepth (Poland et al., 2009a); and tilt measurements ofshort-lived deformation events during 2000–2010 (Cervelliand Miklius, 2003; Poland et al., 2009b) that indicate a per-sistent shallow magma source at 1–2 km depth beneath thesummit, distinct from the deeper magma reservoir.
Detailed examination of Fig. 2a shows that our HX/SO2
ratios are in reasonable agreement (although more variable,particularly in terms of HCl/SO2 ratios) with the most-re-cent (2004–2005) FTIR measurements of persistent contin-uous degassing at Pu�u�O�o (Edmonds and Gerlach, 2007;Edmonds et al., 2009). When compared with older measure-ments, our derived compositions for Halema�uma�u aresimilar (but slightly depleted in SO2) compared to composi-tions of high-temperature volcanic gases sampled at thetime of the Pu�u�O�o episode 1 in January 1983 (Greenland,1984; Gerlach, 1993). However, they are generally charac-terised by lower HX/SO2 ratios relative to inter-eruptivegases measured from cooling vents in between laterPu�u�O�o eruptive episodes from April 1983 to March1984 (Olmez et al., 1986; Crowe et al., 1987). These higherHX/SO2 ratios, however, are not representative of at-ventdegassing; rather it represents degassing associated withcooling and crystallisation of stagnant magma or non-ac-tive vents. Degassing associated with gas pistoning (Ed-monds and Gerlach, 2007) also displays higher HX/SO2
ratios (see later discussion).High time-resolution FTIR measurements are desirable
to understand the relationship between HX/SO2 ratios atthe new Halema�uma�u vent and Pu�u�O�o better. Halogenand S release from magmas is a complex process, controlledby, amongst other factors, the source magma compositionand the physical (e.g., diffusion), chemical (e.g., crystallisa-tion) and dynamic (e.g., ascent rate) processes governing

0.99
0.07
0.0005
0.001
0.01
0.1
1
10
0.001 0.01 0.1 1 10
Molar HCl/SO2
MolarHF/SO2
This study, 2008 samples This study, 2009 samplesEdmonds et al., 2009 Edmonds and Gerlach, 2007Greenland et al., 1985 Crowe et al., 1987Olmez et al., 1986 Finnegan et al., 1989Gerlach, 1993 Greenland, 1984Model line (Aiuppa, 2009) Model line (Edmonds et al., 2009)
gas pistoning
0.001
spatter
cooling vents
between spatter
PCD
after pistoning
0.000
0.005
0.010
0.015
0.020
0.025
0.030
0.035
0.040
0.045
0.050
0.000 0.005 0.010 0.015 0.020 0.025 0.030 0.035 0.040
Molar HCl/SO2
MolarHF/SO2
0.02
0.07
0.2
0.99
0.30.05
a
b
Fig. 2. (a) A plot of molar HF/SO2 versus HCl/SO2 ratios for plume gases for our new Halema‘uma‘u data in the context of previousmeasurements from the East Rift Zone (mainly from Pu‘u‘O‘o). The ratios predicted by the degassing models detailed in Edmonds et al.(2009) (open system) and Aiuppa (2009) for K�ılauea are also plotted. Values for R, the residual fraction of sulphur in the melt are shown inbold italics (see E1 and E2) next to the Aiuppa (2009) model line. Values for the pressure above atmospheric (MPa) are shown in normalitalics next to the Edmonds et al. (2009) model line. PCD = persistent continuous degassing. (b) Detail of the area where the 2 model linesoverlap. Symbols and annotations as in Fig. 2(a). Note the linear scales. Note that the Crowe et al., 1987 data are corrected for a typographicerror in their Table 1 whereby the S, Cl and F values were quoted with negative rather than positive exponents. This error was confirmed bycomparison of the data with their text Figs. 2 and 4. Errors in the ratios are �14% based on 10% errors in SO2, HF and HCl determination(Section 2.1.1) and error propagation calculations. (See above-mentioned references for further information.)
Halogens and trace metal emissions from K�ılauea volcano 303
the exsolution and escape of the various volatile species.Similarities between the gas compositions at the two erup-tion sites at the summit and in the ERZ are consistent withthe hypothesis that they are tapping magmas with similarinitial volatile compositions and behaviour (as discussedabove), and that the ratios are controlled by degassing pro-cesses common to both situations. Rigorous quantitativemodelling of volcanic gas compositions requires knowledgeof volatile solubilities, vapour–melt partition coefficients,and diffusivities over the range of P–T–X conditions experi-enced by magmas upon their ascent, storage, and eruption.
In spite of recent work, such quantitative information isstill largely lacking for halogens, particularly for mafic com-positions (Aiuppa, 2009 and references therein). However,two quantitative models (Aiuppa, 2009; Edmonds et al.,2009) have been developed to account for halogen degas-sing behaviour at Pu�u�O�o. Fig. 2a shows that our newgas plume measurements at Halema�uma�u are reasonablyconsistent with the results from these models. There areimportant differences in the ways in which the models treatdegassing and these two models have been designed to fitdifferent parts of the halogen-degassing process. These dif-

304 T.A. Mather et al. / Geochimica et Cosmochimica Acta 83 (2012) 292–323
ferences and their fit to the data presented in Fig. 2 are dis-cussed below.
Aiuppa (2009) responded to the limited availability ofexperimentally-derived degassing parameters for the halo-gens by using an empirical model of halogen degassing thatdescribes quantitatively the evolution of the magmatic gasphase (in the SO2–HCl–HF system) that is exsolved withincreasing extents of degassing of a basaltic magma. It isbased on the assumption that a Rayleigh-type open-systemdegassing model (Aiuppa et al., 2002) with constant S, Cland F melt–vapour partition coefficients is appropriate tosimulate the relatively shallow exsolution of halogens frombasaltic magmas (Metrich et al., 2001; Spilliaert et al., 2006;Edmonds et al., 2009). In its application to K�ılauea, themodel calculates HCl/SO2 and HF/SO2 ratios in K�ılaueavolcanic gases as a function of R (the residual fraction ofsulphur in the melt; ranging from 1 at the onset of degas-sing to 0 as S is totally exhausted from the melt), basedon estimates of: (i) the original S/Cl and S/F molar ratiosin the parental (un-degassed) melt (estimated as 17 and 2,respectively, from volatile abundances of primary Hawaiianmagmas based on melt inclusion data from Gerlach andGraeber, 1985 and Hauri, 2002); and (ii) the ratio betweenvapour–melt distribution coefficients DS/DCl and DS/DF,taken as 9 and 76 for the water-poor basaltic melts typicalof intra-plate tectonic settings (calculated from the best-fitto gas data from Erebus and K�ılauea; Aiuppa, 2009). Notefor comparison that Aiuppa (2009) estimated DS/DCl andDS/DF of 9 and 36 to be representative for more water-richbasaltic volcanism, but it is only the ratios between the par-tition coefficients DS, DCl and DF that can be derived by fit-ting to the data within this model. In other words DS/DCl,or both DS/DCl and DS/DF, could be varied to fit the Erebusand K�ılauea data. To get absolute values, the D for at leastone element needs to be known. With these data, the equa-tions in Aiuppa (2009) take the form:
HCl
SO2
� �gas
¼ 1
17� 9� Rð1�19Þ
ðE1Þ
HF
SO2
� �gas
¼ 1
2� 76� Rð1�1
76ÞðE2Þ
Solutions of Eqs. (E1) and (E2) are shown in Fig. 2 as ablack solid line, for R from 0.99 to 0.001. Chlorine solubil-ity in melts, and vapour–melt partitioning both depend sig-nificantly on pressure and melt composition (e.g., Websteret al., 1999; Signorelli and Carroll, 2000; Webster and DeVivo, 2002; Alletti et al., 2009). Therefore, while the Aiuppa(2009) model is a significant simplification of halogendegassing, it might be expected to be a good fit to the datafor degassing at constant pressure (e.g., magmas degassingnear or at atmospheric pressure).
The model of Edmonds et al. (2009) is based instead ona quantitative analysis of the pressure-dependent evolutionof S and halogen contents in K�ılauea melt inclusions andmatrix glasses. Using the observed glass data in tandemwith an open-system degassing model, they suggest thathalogen exsolution from K�ılauea magmas occurs only atvery shallow pressures (<1 MPa or �30 m depth) and de-rive the composition of the gas phase exsolved along the
near-surface magma decompression path, showing thatlarge changes in HX/SO2 ratios occur in response to evensmall changes in gas–melt equilibration (separation) pres-sure. They conclude that changes in surface gas dischargecompositions likely reflect different depths of gas–melt sep-aration in the upper conduit system. The P-dependent mod-elled gas compositions derived by Edmonds et al. (2009)(for the range 0.0005–0.07 MPa above atmospheric pres-sure, reflecting the pressure range of F degassing), areshown in Fig. 2 as a dashed line. The Edmonds et al.(2009) model is designed to describe halogen degassingassociated with the rise of magma erupted in the ERZ. Ituses the S, Cl and F concentrations in matrix glass ofquenched bombs as its end-point and so, while it providesinsight into the expected variation of gas compositions re-leased from different depths (and allows for the variationof partition coefficient with pressure), it does not attemptto model the more halogen-rich gas compositions associ-ated with progressive degassing at constant pressure cap-tured by the Aiuppa (2009) model.
The two quantitative models described above are intrin-sically different in their parameterization. In the formermodel (Aiuppa, 2009), the solubility contrasts (e.g., ratiosbetween vapour–melt distribution coefficients) betweenHCl, HF and SO2 are assumed to be constant, and the ex-tent of sulphur degassing is the key control on gas compo-sition. Whilst being an over-simplified representation of thereal (and undoubtedly more complex) degassing regime, itdescribes both degassing during decompression (withinthe approximation of constant partition coefficients andthe use of melt S fraction as a proxy for pressure) anddegassing at constant pressure, for example, post-eruptivedegassing at cooling vents (Fig. 2a) and attempts to unifyour understanding of halogen degassing from basaltic vol-canism in general (Aiuppa, 2009). The approach of Ed-monds et al. (2009) is implicitly more accurate inmodelling the specificity of the syn-eruptive high-tempera-ture degassing processes that occur at K�ılauea (which fallat the halogen-poor end of the data range shown inFig. 2a). The key difference in terms of halogen degassingat K�ılauea and indeed all ocean island settings comparedto other tectonic settings is the H2O-poor nature of themagmas which leads to comparatively poor efficiency ofhalogen degassing. The Edmonds et al. (2009) model takesthis into account, as well as the pressure and composition-dependent changes in solubility, and the effects of crystalli-zation on degassing, and has gas–melt separation pressureas the master variable. It does not attempt to model theprogressive degassing during cooling of lava at constantpressure at the surface captured by the Aiuppa (2009)model.
In Fig. 2a, the two model lines cross where most of ourgas samples plot. Fig. 2b shows this area in detail. The com-parison between modelled and measured compositions of-fers a quantitative framework to explore some aspects ofmagmatic halogen degassing at Halema�uma�u and atK�ılauea in general. Based on Fig. 2b, we propose that ourlower measured HX/SO2 ratios (Cl/S 0.01–0.02) are reason-ably consistent with both gas compositions predicted by theAiuppa (2009) model for gases in equilibrium with K�ılauea

Halogens and trace metal emissions from K�ılauea volcano 305
melts retaining 50–30% (R = 0.5–0.3) of their original Scontent in solution or with gas compositions predicted fordegassing between 0.07 and 0.05 MPa above atmosphericpressure (or approximately 2–3 m below the magma-airinterface) by the Edmonds et al. (2009) model. There is con-siderable scatter in the data in Fig. 2b, with neither modelproducing a conclusively better fit for samples with Cl/S < 0.04. The Edmonds et al. (2009) model seems to fit bet-ter both their more F-rich (F/S up to 0.047) measurementsfrom the ERZ, and our more F-poor (F/S down to 0.004)measurements from Halema�uma�u. The Aiuppa (2009)model however seems to fit better the higher HX/SO2 ratios(Cl/S >0.02) presented in this and previous studies (Fig. 2aand b). From Aiuppa’s (2009) model, these higher HX/SO2
ratios values are consistent with compositions of gases inequilibrium with K�ılauea melts retaining less than 30%(R < 0.3) of their original S content in solution.
The better fit of the Aiuppa (2009) model at Cl/S >0.02is to be expected from the way in which the models areparameterised. A Cl/S ratio of �0.027 is predicted by theequilibrium degassing model of Edmonds et al. (2009) forgas loss occurring at approximately atmospheric pressure.Once magma is at atmospheric pressure the emitted gascomposition can no longer be governed by pressure varia-tions but rather by the release of progressively depletingresidual volatile species from the melt with disequilibriumprocesses playing a greater role. The Edmonds et al.(2009) model is not designed to capture this type of degas-sing behaviour. The Aiuppa (2009) model, on the otherhand is, and is in reasonable agreement with the higher hal-ogen to sulphur ratios from Halema�uma�u presented inthis study as well as many of the more halogen-rich mea-surements at cooling or seeping vents in the ERZ fromApril 1983 to March 1984 (Olmez et al., 1986; Croweet al., 1987; Finnegan et al., 1989). Once magma is seepingfrom a vent or cooling on a surface it is likely to have al-ready lost most of its dissolved S. However the greater sol-ubility of Cl and F mean that these species will continue todegas as the lava cools and crystallises. In the case of theHalema�uma�u emissions, our measurement of higher halo-gen to sulphur ratios (up to Cl/S of 0.18) may result fromprocesses relating to the dynamics of the lava lake mag-ma-air interface, for example, lower rates of overturn allow-ing a crust to cool on the lava surface, or emplacement oflava in the upper conduit following drain back of the lavacolumn. High time-resolution measurements of thermalimagery in conjunction with halogen to sulphur ratioswould help to illuminate these processes.
Some of the complexities of gas composition data atK�ılauea are highlighted in Fig. 2a by examination of thehalogen-sulphur composition of the plume from Pu�u�O�oassociated with gas pistoning events (where the top of themagma column slowly rises and overflows, a gas slug burstsand the pooled lava drains back into the fissure) as mea-sured by Edmonds and Gerlach (2007). The gases in theminute before the slug arrives and during slug bursting(times 12:20–12:21 and 12:21 in Table 1, Edmonds and Ger-lach, 2007) are enriched in halogens compared to S (Cl/S = 1.1 and 1.8, respectively). At first glance, the high hal-ogen contents of these gases are perhaps surprising as the
high CO2 content of these emissions suggests a deep source.However, this is likely due to the gas slug ‘cutting off’ otherdeep bubbles from reaching the surface. This means thatthe degassing composition is dominated by halogen lossat the surface from S-depleted magma in and around the fis-sure and the deep C-rich composition of the bubble. In the7 min following the slug bursting the composition returnsto typical persistent continuous degassing (PCD) values(Cl/S �0.04). In contrast during lava spattering (ejectionof gas and blobs of lava), the bubbles rising up throughthe magma column are not large enough to separate thedeep and shallow degassing regimes. Thus, the greater gasflux through the magma column during these events pro-duces a gas composition with a deeper signature in termsof S, Cl and F (with F depleted compared to Cl, and Cl de-pleted compared to S with respect to shallower degassing,Edmonds and Gerlach, 2007).
In summary, as observed previously at K�ılauea’s ERZ,our results are consistent with the halogen composition ofHalema�uma�u’s plume being controlled by very shallow( < 3 m) decompression degassing and surface loss of mag-matic volatiles at constant pressure. However, there is stillmuch to be done to understand the detailed relationship be-tween gas halogen compositions and the specifics of subsur-face magma dynamics. While illuminating time-averagedfilter pack measurements are not ideal for studying theseprocesses and high time-resolution FTIR data from Hal-ema�uma�u are desirable.
Our new Cl/S data confirm that K�ılauea’s gases are de-pleted in Cl with respect to S compared both to other intra-plate volcanoes, as well as to arc volcanoes, and are at thelow end of the global range in terms of HF/SO2 (Pyle andMather, 2009). Previous measurements of heavier halogensfrom K�ılauea include fumarole condensate samples (molarBr/Cl of 5–7 � 10�4 at Halema�uma�u and Pu�u�O�o; Goffand McMurty, 2000); on base-treated filter samples (molarBr/Cl of 8.6 � 10�4 at Pu�u�O�o vent in 1985; Miller et al.,1990); from three cooling vents (mean molar Br/S of2 � 10�3 in May 1983; Olmez et al., 1986); and from a mix-ture of cooling and active vents and in the eruptive plumesfrom Mauna Loa and K�ılauea in 1983–1984 (mean molarBr/S of 4 � 10�5; Crowe et al., 1987). We measured Brand I in the bulk plume emanating from Halema�uma�uand obtain mean molar Br/Cl ratios of 7.6 � 10�4 and4.6 � 10�4 and mean molar Br/S ratios of 2.9 � 10�5 and2.5 � 10�5 in 2008 and 2009, respectively (Table 5). Theseratios are consistent with the previous measurements atK�ılauea, other than the Olmez et al. (1986) data, whichwere from cooling vents where halogen emissions are typi-cally enriched compared to sulphur (see above). Our mea-surements also allow us to calculate HX/SO2 ratios andfluxes (Table 5 and Electronic annex EA-1-1). To ourknowledge, these are the first HI/SO2 measurements inK�ılauea’s plume. These Br and I to S ratios are consider-ably lower than those from volcanoes where a subductioncomponent is involved in magmagenesis (molar 1–7 � 10�4 and 0.4–6 � 10�5 for Br/S and I/S, respectivelyin plumes from Etna, Masaya, Telica and Villarrica,Aiuppa et al., 2005; Witt et al., 2008; Martin et al.,2010a; Sawyer et al., 2011). This is consistent with the

306 T.A. Mather et al. / Geochimica et Cosmochimica Acta 83 (2012) 292–323
suggestion that a large component of the Br, Cl and I involcanic emissions originates from the subducting slab(Pyle and Mather, 2009 and references therein).
3.2. Mercury measurements
Atmospheric mercury exists predominantly as gaseouselemental mercury (GEM, Hg(0)), which is a relativelyunreactive gas with low solubility leading to an atmosphericlifetime of �0.5–2 years (Slemr et al., 1985). A fraction ofatmospheric mercury may exist as reactive gaseous mercury(RGM, Hg(II), Hg2+) species, including HgCl2, Hg(OH)2
and other mercury halides, which are more water solublethan GEM leading to an atmospheric lifetime of days toweeks (Lindberg and Stratton, 1998). Atmospheric Hg alsoexists in the particulate phase (Hgp), which derives fromadsorption of vapour phase Hg onto or into aerosols. Oncedeposited to waters, biological processes convert relativelyinert elemental Hg into toxic methylated forms (Ullrichet al., 2001) which can bioaccumulate in the food chain(Morel et al., 1998).
Details of our new mercury data are presented in Elec-tronic annex EA-1-4. Similar techniques have been usedpreviously on other volcanoes (Bagnato et al., 2007; Wittet al., 2008) but sampling at K�ılauea proved to be challeng-ing for the following reasons:
(i) Background measurements were attempted at site V7for TGM (total gaseous mercury) and Hg(p) andfound to be 35 ng m�3 and 0.6 ng m�3, respectively.These ‘background’ concentrations are elevated com-pared to mercury concentrations measured in otherremote locations (TGM 1–2 ng m�3; Hg(p) 0.03–0.3 ng m�3, e.g., Slemr et al. (2008) and Swartzendr-uber et al. (2006)) suggesting that V7 samples pickedup some volcanic plume contamination or, morelikely in the case of TGM given the low TGM/SO2
ratio at V7, localised degassing (e.g., fumarolic or soildegassing).
(ii) Two sets (24-HI-TGM-24 and 25-HI-TGM-34) ofAu-traps were sampled in series in the plume and ineach case Hg was collected on the second as well asthe first trap. This suggests that our measuredTGM concentration values and TGM/SO2 ratiosshould be treated as minimum values as the concen-trated plume at the sampling site appears to haveresulted in incomplete uptake of TGM from the gasstream by the samplers. This is likely due to exposureto very high concentrations of plume gases duringparticularly strong puffs of plume advected to thesampling area. Very high TGM concentrations inthe gas stream or passivation of the samplers byother plume components would both have the poten-tial to reduce the efficiency of the samplers.
(iii) Additional fluorescent compounds were found to bepresent when the Hg(p) measurements were made.This is again likely due to exposure to particularlydense plume. Most of the values in EA-1-4 musttherefore only be considered as rough estimates ofthe maximum plume particulate mercury content as
fluorescence peaks appearing with the same retentiontime as Hg(0) may or may not be entirely due to mer-cury species.
These difficulties limit our interpretation of the Hg data.The RGM values appear reliable and yield a RGM/SO2 ra-tio of �2 � 10�7. Our most reliable (i.e., with no interfer-ence noted) Hg(p) measurement (21-HI-Hg(p)-07) yields aratio of �4 � 10�8 (also the minimum Hg(p)/SO2 ratio mea-sured). The two samples where Au traps were used in seriesyield a mean TGM/SO2 ratio of �1 � 10�6 but this muststill be treated as a minimum value, as we cannot be certainthat even with two traps all the TGM was captured. As theHg(p) values presented are maximum values and the RGMvalues are reliable, this suggests that a minimum of 77% ofHg from the Halema�uma�u vent of K�ılauea is in the formof gaseous elemental mercury (GEM) at the point of emis-sion. This is in qualitative agreement with measurementsfrom other open-vent volcanoes (Aiuppa et al., 2007; Bag-nato et al., 2007; Witt et al., 2008). Taking an SO2 flux in2008 of 600–800 tonnes day�1 (see Table 5), our data sug-gest a Hg flux of at least 0.6 kg day�1 from the Hal-ema�uma�u vent of K�ılauea. Given the difficultiesassociated with our data we cannot make meaningful com-parisons with the exceptionally high (compared to otherglobal measurements, Pyle and Mather, 2003) ratio ofHg/SO2 of �5 � 10�4 by mass reported by (Siegel and Sie-gel, 1984) for quiescent degassing from Halema�uma�u be-tween 1971 and 1980 and their consequently reported fluxof �700 kg day�1.
3.3. Aerosol measurements
Volcanoes play an important role in the chemical cyclingof many elements between the solid Earth and the atmo-sphere. Many of these elements will be carried predomi-nantly in the aerosol phase of volcanic plumes (Matheret al., 2003a). Understanding the degassing budgets of theseelements from magmas is important, but the effect of anaerosol trace element on the environment will also bestrongly dependent on the elemental species in the plume,and its size distribution in the aerosol. Aerosol size distribu-tion strongly influences deposition rates, atmospheric resi-dence time, transport and inhalation processes. Fineaerosols have a longer atmospheric lifetime, and hencecan be transported greater distances, than particles of largersizes. Particles less than 1–2.5 lm in size also deposit in thealveolar region of the human lungs where potential dissolu-tion and uptake of trace metals into the body is most effi-cient (Smichowski et al., 2005). Our aerosol results arediscussed with reference to these issues in the followingsections.
The concentrations of different metals in the volcanicaerosol as well as our background sample are given in Ta-ble 2 (the stage by stage breakdown of the data is given inElectronic annex EA-1-5). Given the high volcanic emissionfluxes from K�ılauea it is likely that there is some volcanicinfluence on our background sample, even though it was lo-cated away, and upwind from, the emissions source at thetime of sampling. Crustal ([element X]/[Al] in sample)/([ele-

0
10
20
30
40
50
60
70
80
0 0.5 1 1.5 2 2.5 3
Cut off diameter (µm)
Con
cent
rati
on (
µg m
-3)
21 July run24 July run25 July run
SO42-
0
2
4
6
8
10
12
0 0.5 1 1.5 2 2.5 3
Cut off diameter (µm)
Con
cent
rati
on (
µg m
-3)
21 July run24 July run25 July run
Cl-
Fig. 3. Size-resolved concentrations of chloride and sulphate in the near-vent aerosol emitted from the Halema‘uma‘u vent as measured byion-chromatography of the impactor stages. The cut off diameters are the aerosol size for which particles are collected with 50% efficiency.Errors in the concentrations of SO2�
4 and Cl� on each individual stage will be �10%.
Halogens and trace metal emissions from K�ılauea volcano 307
ment X]/[Al] in crustal rock) and oceanic ([element X]/[Na]in sample)/([element X]/[Na] in seawater) enrichment fac-tors (Bruland, 1983; Wedepohl, 1995; Chester, 2000) sug-gest that dust and sea-spray are the other main sourcesfor elements that are enriched in the background aerosols.
3.3.1. Major anions
As at many other volcanoes, sulphate dominates the aer-osol composition compared to the chloride and fluoride(Table 2). The concentrations of sulphate in the plume aer-osol are comparable to similar near-vent samples at otherbasaltic volcanoes (e.g., Masaya volcano, Nicaragua;Mather et al., 2003b) and comprise about 1% by mass ofthe SO2 concentrations measured simultaneously in theplume (Mather et al., 2006). In fact, halide ion concentra-tions are not conclusively above background levels in someof the impactor runs (Table 2). This is in contrast to mea-surements from other volcanic plumes where the halide ions
are clearly elevated above background levels (e.g., Masaya,Nicaragua; Mather et al., 2003b) and in some cases chloridehas been observed to dominate sulphate in the aerosolphase (Mt. Erebus, Antarctica; Ilyinskaya et al., 2010). Thisis likely related, at least in part, to the chlorine-poor gasemissions from K�ılauea (see Section 3.1 and Pyle andMather, 2009). Fig. 3 shows the variation of sulphate andchloride with aerosol size. The results from both the 24thand 25th July show a peak in the sulphate concentrationon the impactor stage with a cut off diameter of 0.44 lm.The chloride distribution is flat through the aerosol size dis-tribution on these days. The results from 21st July lack aclear peak in the sulphate size distribution, but show a peakin the chloride in the coarser (>1 lm) aerosol. The 24th and25th July size distributions for the sulphate aerosol aremore comparable to those seen in other near-source plumesalthough the peak sulphate size fraction observed in theseresults is smaller than that seen at some other volcanoes

308 T.A. Mather et al. / Geochimica et Cosmochimica Acta 83 (2012) 292–323
(e.g., Masaya, Nicaragua and Lascar and Villarrica inChile; Mather et al., 2003b, 2004).
3.3.2. Cationic/metallic measurements
Table 2 shows the concentrations of cations in the bulkbackground and in-plume aerosol. Previous measurementsat K�ılauea have shown that most emitted metals are pre-dominantly in the particulate phase of the plume shortlyafter emission (Hinkley, 1991). For a large number of ele-ments (Rb, Cs, Be, B, Cr, Ni, Cu, Mo, Cd, W, Re, Ge,As, In, Sn, Sb, Te, Tl, Pb, Mg, Sr, Sc, Ti, V, Mn, Fe, Co,Y, Zr, Hf, Ta, Al, P, Ga, Th, U, La, Ce, Pr, Nd, Sm, Eu,Gd, Tb, Dy, Er, Tm) the in-plume aerosol is elevated abovethe background levels for all runs (once the uncertainties inall measurements have been taken into account), suggestingthat the Halema�uma�u plume is an important source ofthese elements. For a number of other elements (Li, Na,K, Zn, Se, Ca, Ba, Nb, Ho, Yb), some runs are elevatedabove background, while others are not, leading to someambiguity in the interpretation of these results (especiallyas it was not possible to characterise simultaneously airpackets upwind of Halema�uma�u as well as in the plume).It is however likely that the volcano is a source of at leastsome of these elements.
3.3.3. Fluxes
Table 2 shows the X/SO2 ratios and metal fluxes calcu-lated from the impactor results and the simultaneously-col-lected acid gas filter values for SO2 scaled up using the SO2
flux measurements reported for the Halema�uma�u ventduring our sampling period (600–800 tonnes day�1, basedon HVO measurements 16–26 July 2008). There was con-siderable variability in the metal to SO2 ratios for manyof the metals studied (average r.s.d. of the ratio on the threedays sampled is 59%). A large variability in the chemicalcomposition of aerosols of Etna’s plume has also been re-ported (Aiuppa et al., 2003). Such variations are attributedto factors such as wind speed and direction, relative humid-ity and changes in the erosive and volatile output at the cra-ters. In our case further variability may be introduced sincethe sampling set up meant that we were not able to makeSO2 concentration measurements in the gas stream thatpassed through the impactor or for exactly the same period.The filter packs were located in close proximity to theimpactor and were all taken during the same sampling per-iod (Table 1) but small-scale plume heterogeneities maylead to some discrepancies. Although the variability andhence uncertainties in our measured ratios are significant,our ratios are generally about an order of magnitude lowerthan those measured by Hinkley et al. (1999) and Olmezet al. (1986) at Pu�u�O�o (Table 6). They are more similarto those measured by Crowe et al. (1987). Hinkley et al.(1999) did not report simultaneous Cl/S or F/S gas ratios,but one possible explanation may be that the Pu�u�O�oplume was richer in halogens relative to S at the time ofthe Hinkley et al. (1999) measurements compared to ourmeasurements at Halema�uma�u. This is supported by thesimilarity between the Hinkley et al. (1999) and Olmezet al. (1986) data, given that the Olmez et al. (1986) dataare also enriched in halogens compared to both our data
and the plume measurements of Crowe et al. (1987)(Fig. 2). These differences are consistent with the proposedrole of halogens in terms of metal volatilisation and trans-portation in volcanic plumes (Murata, 1960; Symondset al., 1987, 1992; Ammann et al., 1993).
Although data for metal to SO2 ratios in volcanicplumes are still sparse, our new data support the assertionof Hinkley et al. (1999) that K�ılauea’s emissions are me-tal-poor compared to other volcanic systems. Hinkleyet al. (1999) suggested that this may be characteristic ofemissions from basaltic magmas when compared to thosefrom more silicic systems. However, recent measurements(made using similar analytical techniques) by Mouneet al. (2010) from Masaya volcano, Nicaragua, anotherbasaltic system, yielded metal/sulphur ratios that were atleast an order of magnitude larger for all elements mea-sured, compared to those reported here. Studies based onlimited measurements (e.g., spectroscopic measurementsof CuCl(g) in K�ılauea’s plume by Murata, 1960), labora-tory experiments (Ammann et al., 1993) and thermody-namic modelling (Symonds et al., 1987, 1992) suggest thatmany metals are primarily volatilised from the magma aschloride species. Moune et al. (2010) did not report simul-taneous measurements of gas phase halogen halides in Ma-saya’s plume but HCl/SO2 ratios tend to be an order ofmagnitude higher at Masaya than at K�ılauea (e.g., Pyleand Mather, 2009) consistent with the suggestion that lowhalogen levels are responsible for the relatively metal-poornature of the emissions from Hawai�i.
In contrast, the ratios of As, Cd, Cu, In, Te, Tl and Znto Pb in our aerosols collected at the crater edge were of asimilar magnitude to those observed in 1991 and 1996 atK�ılauea’s Pu�u�O�o vent (Hinkley et al., 1999), althoughsome variability was observed in the ratios of metals toPb between the sample days (for example Cu/Pb was 0.5–3.7, Zn/Pb 3.9–37.6), most likely due to variable ash con-tents. Vallelonga and Mather (2003) also reported a Pb/SO2 of 6.5 � 10�6 at Masaya, measured by TIMS, whichis the same order of magnitude as our K�ılaueameasurements.
3.3.4. Enrichment factors
In order to make a broad comparison of the behaviourand volatility of the elements measured in the volcanic aer-osol, enrichment factors (EF) were calculated as follows:
EF ¼ ðX plume=Y plumeÞðX magma=Y magmaÞ
ðE3Þ
where X represents the concentration of the element ofinterest and Y represents the concentration of a referenceelement. As in previous studies (e.g., Crowe et al., 1987),we took BHVO-1 values (Basalt, Hawaiian Volcanic Obser-vatory, Gladney and Goode, 1981) as representative of themagmatic concentrations. Aluminium was used as a refer-ence element due to its high concentration in BHVO andaerosol (Table 2) and relatively low volatility (Gladneyand Goode, 1981; Rubin, 1997). This choice of referenceis consistent with previous work (e.g., Vie le Sage, 1983).Crowe et al. (1987) suggest that there may be advantagesto using volatile elements such as Br for this normalisation

Table 6A comparison of our mean metal/S ratios with those from previous studies on K�ılauea.
Metal, X X/S (by mass)
Olmez et al. (1986)a Crowe et al. (1987)b Hinkley et al. (1999)c This studyd
Ag 2.1 � 10�6 4.4 � 10�7 2 � 10�6
As 2.5 � 10�4 4.1 � 10�5 3 � 10�5 2.4 � 10�6
Au 1.5 � 10�6 1.2 � 10�7
Bi 2.6 � 10�4 6.0 � 10�7
Cd 8.0 � 10�5 9.8 � 10�6 9 � 10�5 1.1 � 10�5
Cs 2.2 � 10�7 1.9 � 10�8
Cu 2.6 � 10�4 1.5 � 10�5 1.0 � 10�4 1.0 � 10�5
In 9.1 � 10�6 5.6 � 10�7 3 � 10�6 2.0 � 10�7
Ir 2.1 � 10�7 5.9 � 10�9
K 1.8 � 10�3 1.9 � 10�4 1.7 � 10�4
Mo 1.3 � 10�5 4.6 � 10�7
Na 3.4 � 10�3 3.8 � 10�4 2.0 � 10�4
Ni 2.5 � 10�4 9.0 � 10�5
Pb 3.3 � 10�5 7.4 � 10�6
Rb 9.0 � 10�6 2.8 � 10�7
Re 5.8 � 10�7 2.6 � 10�7
Sb 1.0 � 10�6 7.5 � 10�7 1 � 10�6 2.4 � 10�7
Se 5.5 � 10�3 2.8 � 10�4 6.4 � 10�5 1.8 � 10�4
Sn 2.2 � 10�3 1.3 � 10�4 7 � 10�5 1.1 � 10�5
Te 6 � 10�5 1.3 � 10�5
Tl 2.5 � 10�5 3.8 � 10�7
W 4.1 � 10�7 2.8 � 10�6 3.4 � 10�8
Zn 1.1 � 10�4 2.5 � 10�5 2.2 � 10�4 1.0 � 10�4
a Measurements made at cooling vents in 1983. Teflon particle filter followed by four base-treated filters. Elements determined by INAAexcept for S (by IC).
b Measurements made in 1983–1984 at a mixture of cooling and active vents and in the eruptive plumes from Mauna Loa and K�ılauea.Particle filter followed by base-treated filters. Elements determined by INAA. The data are corrected for a typographic error in the tablewhereby S values were given negative rather than positive exponents.
c Samples collected at the ground by main vent of Pu‘u‘O‘o and at some other points such as skylights along the course of active lava tubes.Samples were captured using paper/membrane particle filters followed by base-treated filters. In 1991 metals analysed by INAA and ICP-MSin 1996. IC for acidic species.
d Values taken from Table 2 and adjusted to be X/S rather than X/SO2. Please note that our S values were averages from filter packs made inclose proximity and during the same period as the impactor rather than measurements from the same air stream as the metal particles.Uncertainties are not discussed in detail in the other cited references.
Halogens and trace metal emissions from K�ılauea volcano 309
(e.g., limiting the variability in EF due to variable ash col-lected on the filters), but we suggest that there might benumerous drawbacks. For example, in our study Br (likeother volatile species such as Hg) was mainly found in thegas phase and hence its concentration was determined ona different set of filters to the majority of the other elementsand the low and variable levels of Br in most lavas also poseanalytical challenges.
Enrichment factors relative to Al are shown in Fig. 4.Our values are in broad agreement with the order of Croweet al. (1987) from previous studies on K�ılauea and with thegroupings of Aiuppa et al. (2003) in Etna’s aerosol andthose of Moune et al. (2010) for Masaya’s aerosol. In ourstudy, we refer to the group of elements including the lan-thanoids and other elements with EFBHVO �1 (up to U inFig. 5) as lithophile elements and to the more volatilegroup, with EFBHVO of �10 or above, as chalcophileelements.
In their previous study at K�ılauea, Crowe et al. (1987)considered that lithophile elements were carried largely inthe ash fraction based on their low (�1) EFBHVO values.Volatile elements are characterised by high enrichment
relative to basalt and at Halema�uma�u these metals in-clude Se, Te, Cd, B, and S which all had EFBHVO valuesover 1000. Crowe et al. (1987) found alkali metals weretransported as both volatiles (i.e., emitted as vapours whichthen condense into the plume’s particle phase) and withinthe ash components at K�ılauea. The alkali metals in ourcrater edge aerosols had a range of EFBHVO values, from�1 to several hundred. Previous studies suggest that vola-tility of alkali metals increases with atomic number (Hink-ley et al., 1994; Africano et al., 2002), but this does notappear to be the case in our aerosols. Generally the EFBH-
VO values appeared to be greatest for the samples from 25thJuly and lowest for the 24th July sample. The extent of ashand other fine silicate phase contributions is likely to bevariable over time and this may account for some of thevariation in composition, solubility and size distributionobserved between samples. Our data suggest that the sili-cate contribution to the aerosol was the greatest on 24thJuly and the lowest on 25th July (choosing a low volatilityreference element means that EF values decrease if theplume ash content increases). Simultaneous examinationsof the filters using SEM and high time-resolution measure-

0.01
0.1
1
10
100
1000
10000
100000
1000000
10000000
Sc Ti
Mg Fe V
Mn Sr Y Ca
Nb Al
Hf
Zr
Ga
Co P Ba
Th Ta U Re In Cu
Cr W Be
Mo
Ge Ni
Zn Sb Pb As
Sn Tl
Bi B C
d Te Se
EF
BH
VO
21-Jul
24-Jul
25-Jul
Lithophile elements Chalcophile elements
0.01
0.1
1
10
100
1000
10000
100000
SO42
-
Cl-
F- K
Li
Na
Rb Cs
La
Ce
Pr
Nd
Sm
Eu
Gd
Tb
Dy
Ho
Er
Tm
Yb
Lu
EF
BH
VO
21-Jul
24-Jul
25-Jul
Alkali metals Lanthanoids
SO4
2-
Cl-
F-
Fig. 4. Enrichment factors (EF) in K�ılauea’s aerosols, relative to Al as the reference element and Hawaiian basalt BHVO-1 for the differentspecies measured in the particle phase. The first chart shows the major anions, the alkali metals and the lanthanoids ordered by atomicnumber. The second chart shows the other elements measured ordered in increasing EF.
310 T.A. Mather et al. / Geochimica et Cosmochimica Acta 83 (2012) 292–323
ments of the aerosol components of the plume would aidfurther investigation of the balance between these compo-nents in the future.
3.3.5. Metal degassing from Haiwaiian lavas
Previous studies of the geochemistry of Hawaiian lavashave evaluated the volatility of chalcophile elements suchas Re, Cd and Bi (Bennett et al., 2000; Norman et al.,2004). Bennett et al. (2000) observed that some subaerialtholeiites, including samples from K�ılauea, have anoma-lously low Re abundances and high Cu/Re ratios, possiblyreflecting Re loss upon eruption or during degassing ofshallow magma chambers. Norman et al. (2004) made mea-surements of submarine tholeiitic glasses collected by sub-mersible at Ko�olau and Moloka�i volcanoes and foundcorrelated variations in the Re, Cd, and S contents, consis-
tent with loss of these elements as volatile species duringmagmatic outgassing. The S content of the glasses wereconsistent with substantial magma degassing in shallowchambers or at the surface. Bismuth also showed a goodcorrelation with S in the Ko�olau glasses, but undegassedglasses from Moloka�i had unexpectedly low Bi contents.Rhenium appeared to be more volatile than either Cd orBi in these magmas. In contrast, Cu, Zn, Pb, and Pt concen-trations in these glasses were not related to S contents, indi-cating limited depletion of these elements during degassingof these samples. This led these previous studies to concludethat the low Re contents of some Hawaiian lavas are mostlikely a secondary feature related to near-surface degassingrather than a primary, source-related feature. This high-lights the importance of understanding metal degassingtrends when interpreting the Re contents of ocean island

y = 3E-06x + 0.0002R2 = 0.5757
0.0000
0.0002
0.0004
0.0006
0.0008
0.0010
0.0012
0.0014
0.0016
0.0018
0 200 400 600 800 1000 1200
Concentration of S (ppm) in glass
Con
cent
ratio
n of
Re
(ppm
) in
glas
s
y = 0.0002x + 0.0865R2 = 0.6238
0.08
0.09
0.10
0.11
0.12
0.13
0.14
0.15
0.16
0 200 400 600 800 1000 1200
Concentration of S (ppm) in glass
Con
cent
ratio
n of
Cd
(ppm
) in
glas
s
Fig. 5. Plots of Re and Cd concentration variations compared to S in Ko‘olau glass samples (data from Norman et al., 2004). The decrease ofboth metals with decreasing S is interpreted as a result of degassing. The dotted lines show the results from the open-system degassing modelof Edmonds et al. (2009) adapted for Re and Cd. In each case, the maximum concentration of the metal measured in the glasses is taken as theinitial concentration. DRe
fluid–melt and DCdfluid–melt values are estimated by approximate fit to the data as 1.2 and 1.05, respectively. The minimum
pressure considered in the model is 0.02 MPa above atmospheric. The degassing of most of the lower-S population of points shown on thegraphs is below this pressure and the degassing trend of this group is approximated by a straight line (equation shown).
Halogens and trace metal emissions from K�ılauea volcano 311
and continental flood basalts in general. These rock data al-low us to estimate that up to about 80% and 35% of the Reand Cd, respectively, have degassed in order to account forthe observed compositional range.
Norman et al. (2004) cite the enrichments of chalcophileelements such as Re, Cd and Se in K�ılauea’s plume in pre-vious studies (Crowe et al., 1987; Miller et al., 1990; Hink-ley et al., 1999) as support for their degassing interpretationof the variation of these elements in some Hawaiian lavasrather than a primary, source-related feature. Our measure-ments of elevated levels of Re and Cd in the Halema�uma�uplume aerosol (Table 2) add further supporting evidence.Our plume aerosol Bi measurements were not conclusivelyabove background. Closer examination of the degassingtrends presented in Norman et al. (2004) allow quantitativecomparison of Re and Cd behaviour during degassing ofthese glasses and our and previous aerosol measurements.Their S, Re and Cd data for Ko�olau glasses, which showedthe clearest degassing trends, are plotted in Fig. 5. The Svalues form two clusters with three measurements with S>880 ppm and the rest with S <200 ppm. Although thereare subtle differences in composition and hence predictedvolatile behaviour between K�ılauea and Ko�olau samples,the highest S value (1227 ppm) is consistent with the in-ferred parental S value for K�ılauea melts (1300 ppm, Ger-lach and Graeber, 1985). The lower S values areconsistent with shallow degassing (see, for example, the ma-trix glass S contents of Pele’s tears from Pu�u�O�o presentedin Edmonds et al., 2009). For the higher-S samples there isno clear metal degassing trend but for the lower S samplesboth Re and Cd concentrations clearly decrease as theamount of S in the samples decreases. The lack of sampleswith S between 880 and 200 ppm makes it difficult to com-ment on the exact nature of the relationship between Re,Cd and S loss in this range, but Fig. 5 shows that the gen-eral trend can be described using an open system degassingmodel similar to that described for the halogens (c.f. Ed-monds et al., 2009) with DRe
fluid–melt and DCdfluid–melt estimated
by approximate fit to the data as 1.2 and 1.05, respectively.
These partition coefficients are likely to vary with pressureand melt and fluid composition, but in the absence of moredata with S between 880 and 200 ppm we use the simplestmodel possible. The minimum pressure considered in themodel is 0.02 MPa above atmospheric and the degassingof most of the lower-S population of points shown on thegraphs is below this pressure so we have fitted a model-independent degassing trend to the data with S<200 ppm. Linear trends were found to have the best fitin this range and these lines are meant purely to representa fit to the data rather than implying a physical model ofthe degassing process. If we extrapolate these trends backto the mean metal value in the higher S group of samplesthen we can estimate that degassing of Re commenced fromsamples with S � 400 ppm and Cd degassing commencedfrom samples with S � 250 ppm. If sample S content is ta-ken as a proxy for pressure then this suggests that Re beginsto partition into the gas phase at higher pressures than Cd.For comparison Edmonds et al. (2009) estimated that Cl ex-solved from K�ılauea’s magma from pressures of �1 MPaabove atmospheric and lower, characterised by melts with�500 ppm S and F exsolved from pressures of �0.1 MPaabove atmospheric and lower, characterised by melts with�250 ppm S.
The gradients of these degassing trend lines are indica-tive of the metal/S ratio (by mass) that would be character-istic of the escaping gas. This suggests that degassing ofthese samples would release a gas phase with Re/S mass ra-tio �3 � 10�6 and Cd/S mass ratio �2 � 10�4. From Ta-ble 6 we can see that measured plume values of Re/Srange from 2.6 to 5.8 � 10�7 and Cd/S from 9.8 � 10�6
to 9 � 10�5 so in both cases about an order of magnitudelower than that calculated from the glass-degassing trends.Metal degassing from magmas is still poorly understood, soeven this level of agreement is encouraging. The Cl/S andF/S ratios discussed above (Section 3.1) suggest that whileS is exsolving from the magma at greater depth, the halogento S composition of the plume is still controlled by shallowre-equilibration of the rising bubbles with the surrounding
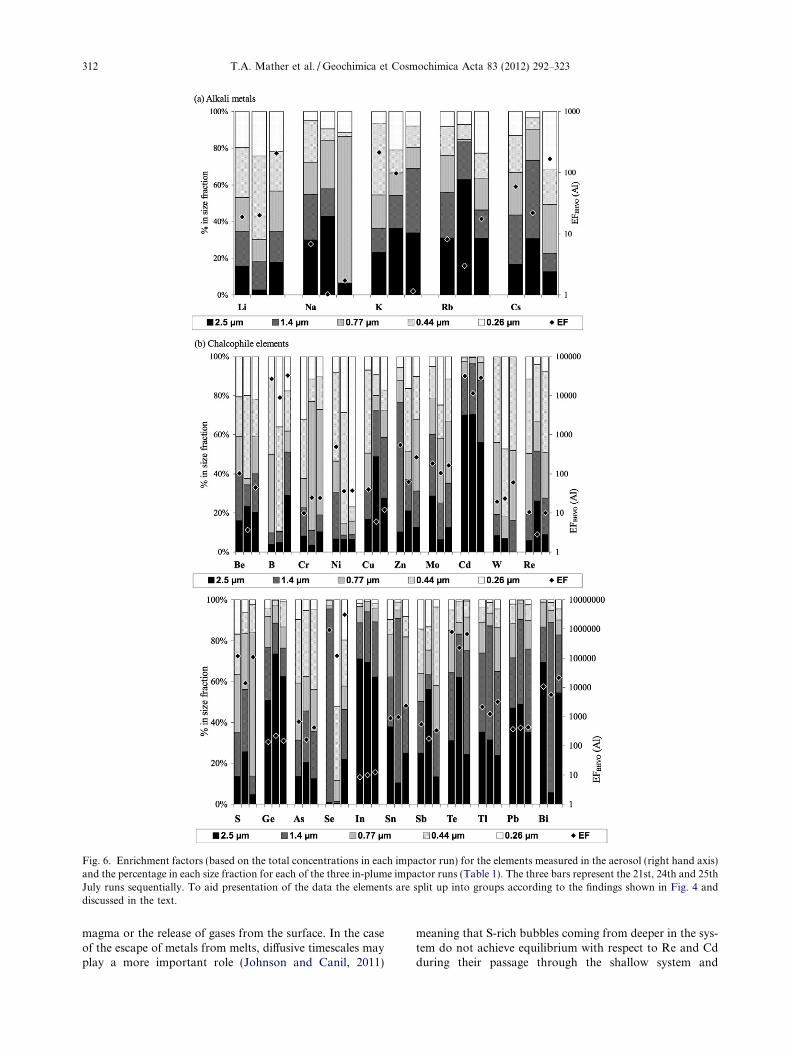
Fig. 6. Enrichment factors (based on the total concentrations in each impactor run) for the elements measured in the aerosol (right hand axis)and the percentage in each size fraction for each of the three in-plume impactor runs (Table 1). The three bars represent the 21st, 24th and 25thJuly runs sequentially. To aid presentation of the data the elements are split up into groups according to the findings shown in Fig. 4 anddiscussed in the text.
312 T.A. Mather et al. / Geochimica et Cosmochimica Acta 83 (2012) 292–323
magma or the release of gases from the surface. In the caseof the escape of metals from melts, diffusive timescales mayplay a more important role (Johnson and Canil, 2011)
meaning that S-rich bubbles coming from deeper in the sys-tem do not achieve equilibrium with respect to Re and Cdduring their passage through the shallow system and

Fig 6. (continued)
Halogens and trace metal emissions from K�ılauea volcano 313
correlation between the Re, Cd and S contents of magmasis achieved only once they have been retained at shallow orsurface levels for a prolonged period of time. Our lack of
understanding of trace-metal degassing is further high-lighted by the lack of Cu, Zn or Pb degassing trends ob-served in the glass samples (Norman et al., 2004) despite

314 T.A. Mather et al. / Geochimica et Cosmochimica Acta 83 (2012) 292–323
their apparent volatility in our and previous aerosol mea-surements (Table 6, Fig. 4).
3.3.6. Size distribution
Fig. 6 shows the EFBHVO values for the elements mea-sured in the aerosol and the percentage in each size fraction.For many of these species these are the first size-resolveddata for aerosols in a near-source volcanic plume. Althoughdefinitive differences between the size distributions for thedifferent groups of elements are hard to pick out, perhapsreflecting the complexity of processes occurring in theplume, the proportion of metal associated with the largestsize mode collected (>2.5 lm) is significantly higher forthe lithophile elements than the chalcophile elements (t-test,p < 0.05). For the lithophile elements the fraction found infine mode aerosols ( < 1 lm) increased with increasingEFBHVO value. This likely reflects the dependency of EFBH-
VO on ash content described above. Increasing EFBHVO im-plies a smaller silicate content in the plume suggesting agreater fractional contribution from the volatile contribu-tion to the aerosol, which might be expected to be in a finerfraction than the silicate particles. This suggests that themore-volatile material preferentially condenses onto the fi-ner particles as expected for high temperature processes.The fraction of elements found in coarse mode aerosol alsoshows a positive correlation with the fraction of elementpresent as silicate (see below).
0
1
2
3
4
5
6
7
8
9
10
K Cs Rb Na Cu Cr W Be Li Ni Ge Sb As Sn B
[Met
al in
pH
7]/[
Met
al in
MQ
]
422 1036 48
0
1
2
3
4
5
6
7
8
9
10
Ta Co P U Ba Th Ga Zr Al Hf Ca Nb Y Mn Sr Fe V M
[Met
al in
pH
7]/[
Met
al in
MQ
]
118 11 45 41
Fig. 7. A comparison of the solubilities of different species in the Milli-solution. The calculations were done by using the total concentrations frothe range of values given by the three runs. Numbers off the scale are showerrors) suggest greater solubility in the pH 7 solution are shown in dacategorically suggest greater solubility in the MQ are shown in white. Ele
3.3.7. Availability of metals in the volcanic plume to the
environment
Fig. 7 compares the concentrations of different metalsextracted into ultrapure Milli-Q water and pH 7 buffer solu-tion. For some metals there was no significant difference(within error) in their solubility between the two solutions.For the majority of elements studied, their solubility washigher in the pH 7 buffer, and for a small number of metals(Be, Sb, Zn, Cd, Th, La, Ce, Pr, and Nd) solubility washigher in Milli-Q. While the lower pH observed in theMilli-Q after addition of volcanic aerosols (pH 3–4) mayenhance solubility, the complexing ability of acetate canprevent re-adsorption or precipitation of metal ions (Fil-gueiras et al., 2002). The varied response of different metalsto these solutions reflects their differing chemical interac-tions with the other species present in a volcanic aerosoland shows that while important, pH is not the sole factorcontrolling solubility for all metals. As the conditions sim-ulated with the addition of Milli-Q water are likely to bemore closely analogous than addition of the pH 7 buffersolution to those found in the volcanic environment whererain droplets scavenging aerosols are likely to be acidified,we focus on these results in terms of comparison with theother leaching stages. However, Fig. 7 highlights the com-plexity of the likely interactions between volcanogenic met-als and the environment as they are transported downwindand deposited.
Re In Mo Zn Pb Tl Bi Cd Te Se
25
g Sc Ti La Ce Pr Nd Sm Eu Gd Tb Dy Ho Er Tm Yb Lu
Q ultra pure water (MQ) and the ammonium acetate pH 7 bufferm all the stages of the three impactor runs. The error bars representn above the bars. Elements for which the results categorically (givenrk grey with diagonal black lines. Elements for which the resultsments for which the results are ambiguous are shown in light grey.

0%
20%
40%
60%
80%
100%
Li Na K Rb Cs
% in
fra
ctio
n
1
10
100
1000
EF
BH
VO
(Al)
Water soluble Moderately labile Silicate EF
(a) Alkali metals
0%
20%
40%
60%
80%
100%
Be B Cr Ni
Cu
Zn
Mo
Cd W Re
Ge As Se In Sn Sb Te Tl
Pb Bi
% in
frac
tion
1
10
100
1000
10000
100000
1000000
10000000
EF B
HV
O (A
l)
Water soluble Moderately labile Silicate EF
(b) Chalcophile elements
Fig. 8. The enrichment factor (EF) values for the elements measured in the aerosol and the percentage in each solubility fraction for each ofthe three in-plume impactor runs (Table 1). The three bars represent the 21st, 24th and 25th July runs sequentially. To aid presentation of thedata the elements are split up into groups according to the findings shown in Fig. 4 and discussed in the text.
Halogens and trace metal emissions from K�ılauea volcano 315
The metal concentrations in the crater edge aerosolswere highly elevated above concentrations found in aero-sols collected at the Mauna Loa baseline station, and atother remote locations in the Pacific (Arimoto et al.,1985, 1987; Zieman et al., 1995; Perry et al., 1999). Asshown in Fig. 8, many metals are largely water solubleand although the solubility of metals is likely to be en-hanced in the volcanic aerosols by the presence of high lev-els of SO2 (and other acidic species) via acid mobilisationpathways (Meskhidze et al., 2003), the comparison withthe pH 7 buffer discussed above suggests that this is notthe only important factor post-deposition. The high solubil-ity suggests these metals are more likely to be delivered tothe surrounding oceans in a bioavailable form. However,some of the metal soluble in water may form strong com-plexes with organic matter prior to deposition (Okochiand Brimblecombe, 2002; Witt and Jickells, 2005). In addi-tion, the presence of strong organic ligands in surface
waters will limit the toxic/fertilising impacts (Hirose,2006; Yang and van den Berg, 2009). A number of metals(85% > Bi > Se >> Mo > B > Ca > La > Fe > Sr > Sb > W >Zr > Hf > Sn > Lu > K > In > 20%) had an important frac-tion present in the moderately environmentally labile mate-rial (assumed in Chester et al., 1989, and Hlavay et al., 1996to be bound to carbonates and oxides). This fraction couldpotentially be important as the surfaces of componentssuch as carbonates and oxides can act as metal scavengersonce aerosols have been deposited at the sea surface (Ches-ter et al., 1989). Metals bound to carbonates can becomemore soluble at lower pH, and the mobilisation of metalsbound to oxides can be affected by changes in redox condi-tions in the environment (Smichowski et al., 2005). How-ever further analysis is required to confirm the speciationof these elements.
As might be expected, the amount of metal bound to sil-icate was significantly higher for the lithophilic metals than

0%
20%
40%
60%
80%
100%
Mg
Ca Sr Ba Sc Ti V
Mn Fe Co Y Zr
Nb Hf
Ta Al P
Ga
Th U
% in
frac
tion
0
2
4
6
8
10
12
14
EF B
HV
O (A
l)
Water soluble Moderately labile Silicate EF
(c) Lithophile elements
0%
20%
40%
60%
80%
100%
La Ce Pr Nd Sm Eu Gd Tb Dy Ho ErTm Yb Lu
% in
frac
tion
0
0.5
1
1.5
2
2.5
3
3.5
4
4.5
EF B
HV
O (A
l)
Water soluble Moderately labile Silicate EF
(d) Lanthanoids
Fig 8. (continued)
316 T.A. Mather et al. / Geochimica et Cosmochimica Acta 83 (2012) 292–323
the chalcophiles (t-test, p < 0.001). While this suggests high-er volatility leads to greater solubility, there was not a cor-relation between fractional solubility (defined as watersoluble %) and EFBHVO (r2 < 0.02 for lithophiles and chal-cophiles). This lack of correlation may reflect the contribu-tion of material on or from the surface of the silicatecomponent to the water-soluble fraction.
There is some variation in the proportion of metals inthe various size fractions and in the amount of metal asso-ciated with silicates or the moderately labile fraction be-tween the different sampling days. For example, on the25th July a large proportion of the REE were associatedwith the moderately labile fraction, whereas in the two ear-lier samples this fraction was not as important. The weatherconditions varied between the different sampling periods.On the 21st and 24th July it rained during sampling,whereas no rain fell on the 25th July at the crater edge dur-ing sample collection. Differences in atmospheric water lev-els may have affected the distribution of metals in theplume. Water molecules can dissociate on the surface of
compounds such as carbonates and oxides under ambienttemperature and pressure leading to their adsorption tothe surface layer. The coverage of this water layer varieswith humidity and has an important effect on surface reac-tivity of the carbonates/oxides (Cwiertny et al., 2008). Lay-ers can also form on the surface of particles via othermechanisms such as deliquescence or the aggregation of sol-uble and insoluble particles and these processes can also beaffected by humidity. This could also be associated with thedifferent balances between silicate and volatile contribu-tions to the volcanic aerosol between different samplingdays as discussed above. This is the first study to investigatethe fractional solubility of near-source volcanic aerosol.
3.4. Downwind samples
3.4.1. Rain and fog
The concentration results for the metals present in therain and fog samples are detailed in Table 4. The blank con-centrations for the metals were generally similar to concen-

Table 7Concentration of metals (ppb by mass) in the volcano affected rain sample (HI TM04) from Hawai‘i in comparison to a selection of rainstudies from the literature.
Metal HITM-04 Chainof Craters Rd.1
Mt. Etnarainwater2
Japan –Suburban(volcanicinfluence)3
Russia–Urban4
Jordan –Rural/industrial5
Brazil –Urban6
Korea –Mountain7
USA –Mountain8
Drinkingwaterstandards
Pb 2.1 1.23 <0.1–3.3
66 0.19 1.84 0.54 15c
Ni 2.8 0.40 <0.05–8.2
3.5 0.39 2.65 0.44 70d
Cu 6.86 11 2.12 0.1–70 73 0.44 3.22 0.67 1300a
Zn 40.3 640 16.4 2.0–368
210 9.4 4.01 5000b
As 0.29 0.12 0.17–3.0
1.72 0.11 10e
Cd 6.20 0.11 0.01–1.6
52 0.08 0.05 3d
Al 168 41 <1–138 324 50–200b
V 1.0 0.38 0.05–6.2
0.35
Cr 0.8 0.11 <0.1–2.88
3.1 0.12 1.33 100a
Mn 4.1 45 1.52 0.8–29.7
2.38 1.53 50b
Fe 160 320 31.9 <0.2–28
430 3.14 300b
Co 0.3 0.04 <0.05–0.2
0.16
Ba 1.2 1.24 0.3–335
20 2000a
Na 3280 280 620K 435 4500 37 760Mg 355 1400 44 270 22Ca 627 3800 112 2710Sr 2.67 0.52 0.80–
3210 0.40
Mo 0.057 0.08 0.01–87
0.34 0.03 70d
1This study; 2Cimino and Toscano (1998); 3Shimamura et al. (2007); 4Chudaeva et al. (2006); 5Al-Khashman (2009); 6Teixeira et al. (2008);7Jeon and Nakano (2001); 8Malcolm et al. (2003); aEPA Maximum Contaminant Level Goal; bEPA National Secondary Drinking WaterRegulations; cEPA action level for public supplies; dWHO guidelines.
Halogens and trace metal emissions from K�ılauea volcano 317
trations observed at Volcano Guest House. This rain wasassociated with tropical storm Elida and its low concentra-tions for many trace metals suggests that this rain likelyrepresents relatively clean marine rain. Heavy rain had beenfalling on the area for several days prior to collection ofthese background samples.
Rain sample HI TM04 was collected close to Chain ofCraters Road on the Naulu trail where it was evident fromvisual observations and the smell that the Pu�u�O�o plumewas occasionally present at ground level. This sample con-tained elevated concentrations of the majority of metalsstudied; the most dramatic difference was in the Cd concen-tration which was over 300 times higher in the volcanic rainsample. The metal concentrations of HI TM04 lie betweenthose observed in rain collected at a suburban site in Japanwhich had some volcanic influence and rain collected closeto Mount Etna during volcanic degassing, although directcomparisons are difficult as concentrations are not volumeweighted (Table 7, Cimino and Toscano, 1998; Shimamuraet al., 2007). With the exception of Cd, the element concen-trations in the rainwater are well below drinking water
guideline levels (Table 7). Cd exceeds the drinking waterguideline level by about a factor of 2 but it should beremembered that this was a rainwater sample that had fall-en through the concentrated Pu�u�O�o plume close tosource.
The levels measured in the fog sample collected at theChain of Craters Road were generally 1–2 orders of magni-tude higher than the rainwater collected at nearly the samelocation (Table 4). The concentration of metals in fog pre-sented here was elevated well above concentrations ob-served during studies of cloudwater at relativelyunpolluted mountain tops (Table 8). During a study ofcloudwater at K�ılauea at Thurston lava tube Benitez-Nel-son et al. (2003) found volcanically-influenced sampleshad lower Al/Fe ratios than “cleaner” samples. Our rainsample (HI TM04) collected under the Pu�u�O�o plumehad an Al/Fe molar ratio of 2.2, the fog sample was lowerstill at 1.2. These values are close to the Al/Fe ratio ob-served in Hawaiian basalts (1.8) and Pu�u�O�o lava oceanentry plume aerosols (1.2) (De Carlo and Spencer, 1995;Sansone et al., 2002).

Fig. 9. Volatile and non-volatile scores for vegetation samplestaken from the flanks of K�ılauea in July 2008. For an explanationof how the volatile and non-volatile scores are defined andcalculated see Section 3.4.2. Errors for volatile score and non-volatile score are maximum 17% and 1%, respectively, reducing asthe contribution from each individual component decreases.
Table 8Concentration of metals (ppb) in volcano affected Hawaiian fog sample (HI TM05) with examples of cloudwater at other locations.
Metal Hawaiianvolcanic fogsample1
Rain: Mt.Mansfield NEUSA2 1200 m
Cloud: Mt.Mansfield NEUSA2 1200 m
Cloud Mt.BrockenGermany3
1142 m
CloudCoastalVenezuela4
2000 m
(Volcanic fog)K�ılauea,Thurston lavatube5
(Non volcanic fog)K�ılauea, ThurstonLava tube5
Pb 49.7 0.54 5.45 11 40Ni 23.3 0.44 1.84 1 10Cd 29.4 0.05 0.28 0.28 2Cu 406 0.67 3.42 5.7 10Zn 587 4.01 31.1 37.2 75As 0.95 0.11 1.11 0.4Na 72,200 140 535 4235K 13,000 320 80 690Mg 11,100 22 203 115 935Ca 29,600 280 385 3705Sr 155 0.4 2.33Mo 0.690 0.03 0.12 0.28Al 1690 85 135 25 ± 90 6 ± 21Fe 2840 134 30 12 ± 100 1 ± 15Cr 10.8 0.3Mn 216 1.53 7.51 7.8 33.5V 7.70 0.35 4.15 1.8Co 3.00 0.08Ba 22.3 3.2
1This study; 2Malcolm et al. (2003); 3Plessow et al. (2001); 4Gordon et al. (1994); 5Benitez-Nelson et al. (2003).
318 T.A. Mather et al. / Geochimica et Cosmochimica Acta 83 (2012) 292–323
The molar Al/Fe ratios observed in Halema�uma�uaerosols (4.2–5.5) differed from those found in the rain(2.2) and fog (1.2) Pu�u�O�o samples. The ratios in the vol-canic aerosols are closer to the average crustal abundance(5.2) (Wedepohl, 1995), and to that seen in aerosol collectedat Mauna Loa Observatory, Hawai�i (3.5–4.8) (Perry et al.,1999). However, the ratio of Al/Fe from the aerosol extractassociated with the silicate fraction (1.1–3.8) is closer to thePu�u�O�o rainfall sample and to that observed in Hawaiianbasalts (1.8).
3.4.2. Vegetation samples
The full results from AAS (for Hg) and ICP-MS (for asuite of elements) analyses of vegetation are given in Elec-tronic annex EA-1-3. The results are ambiguous (poten-tially due to the complex topography, multiple emissionsources and strong rainfall gradients across the study area),so here we summarise to highlight only the clearest trends.Concentrations (in ppm) were scaled linearly between theminimum and maximum concentration for the element,and the scaled values (ranging between 0 and 1) weresummed for four of the most volatile chalcophiles (Hg,As, Cd, Tl) and for four relatively non-volatile lithophiles(Mg, Ca, Sr, Ba). Classifications were made in both casesaccording to Zoller et al. (1983) and Aiuppa et al. (2003).This approach yielded a volatile and non-volatile “score”
(ranging from 0 to 4) for each sample (Fig. 9). The cluster-ing of high volatile scores proximal to and downwind ofHalema�uma�u (V10-V13) suggests that the eruption in-creased volatile deposition into the local environment. Thisinterpretation is supported by the low volatile scores for themore southerly samples (V1-2), arguing against any ambi-
ent East–West trend in element concentrations. With theexception of V10, all samples collected on the Chain of Cra-ters Road had low volatile scores, particularly V8 and V6.

Halogens and trace metal emissions from K�ılauea volcano 319
This result is perhaps consistent with the increased eleva-tion of the Pu�u�O�o vent (relative to its surroundings) com-pared to Halema�uma�u where grounding of the plumelikely to be more common due to the crater and downwindaltitude and topography. As found at Etna (e.g., Martinet al., 2009a; Quayle et al., 2010), the lithophiles are lessvariable and do not show systematic differences betweenlocations downwind of the two vents. However, it is worthyof note that the sample collected close to the Hal-ema�uma�u vent (V13) had markedly lower concentrationsof lithophile elements. While clear conclusions cannot bedrawn from a single sample, this result may indicate verylocalised leaching of lithophiles from soils in the summitarea due to deposition of acidic species (e.g., Delfosseet al., 2005; Martin et al., 2010b). Although there is a sug-gestion of a general trend in terms of enhanced volatiles inthe samples downwind of the Halema�uma�u vent, thesetrends are not as pronounced as in previous studies of veg-etation associated with active volcanism (e.g., Martin et al.,2009a,b). As suggested above, this is potentially due to thecomplex topography, multiple emission sources and strongrainfall gradients across the study area.
4. CONCLUSIONS
New data from the recent Halema�uma�u eruption ofK�ılauea allow us to draw a number of conclusions aboutthe nature of this activity, K�ılauea’s degassing behaviourand its implications. In terms of the Cl, F and S systematicsof the Halema�uma�u gases, they are compositionally simi-lar to previous syn-eruptive measurements from the EastRift Zone (ERZ) of K�ılauea. This suggests that recent sum-mit activity represents a slight departure from previousmodels of the magma system whereby magma ascends fromdepth, is stored and partially degasses beneath the summitbefore migrating to the ERZ. Instead our observations ofgas compositions at the summit can be explained by thenew eruption at Halema�uma�u being fed by a convectingmagma reservoir that is shallower than the main summitmagma storage reservoir. This is supported by gravity sur-veys and deformation measurements and modelling (Cer-velli and Miklius, 2003; Poland et al., 2009a,b; Johnsonet al., 2010).
Broadly, both our new measurements and literature dataare well captured by a combination of the equilibrium mod-el of decompression degassing of Edmonds et al. (2009) andthe Rayleigh-type open-system degassing model of Aiuppa(2009), both of which have previously been used to describeK�ılauea’s degassing. These models suggest that the halogenversus S composition of the plume is controlled by gas bub-bles that separate from the magma at very shallow depths( < 3 m) and that the higher end of our range of halogen/S ratios suggests that progressive degassing at atmosphericpressure plays some role in controlling the gas compositionsat Halema�uma�u. Higher time resolution FTIR measure-ments of halogen/S ratios from the new summit activitywould illuminate these processes further.
Our new Cl/S data confirm the conclusions of Pyle andMather (2009) that K�ılauea’s gases are depleted in Cl withrespect to S compared to arc volcanoes worldwide and in
fact compared to most other global volcanoes and are atthe low end in terms of their F/S ratio on the global scalealso. We report Br/S and I/S ratios for K�ılauea. Theseare lower than those measured at arc volcanoes, consistentwith contributions from the subducting slab accounting fora significant proportion of these heavier halogens.
Our mercury data for the Halema�uma�u plume areinconclusive but suggest a flux of at least 0.6 kg d�1 ofHg from this new vent, predominantly (>77%) in the formof gaseous elemental mercury (GEM) at the point of emis-sion. We measured a minimum Hg/SO2 mass ratio of�10�6
. There were some collection and analytical issueswith our data due to the concentrated nature of the plumeat the sampling site and so we are unable to make anymeaningful comparisons between our measurements andthe ratio of Hg/SO2 of �5 � 10�4 by mass reported by (Sie-gel and Siegel, 1984) from Halema�uma�u between 1971and 1980 and the consequently reported flux of�700 kg day�1.
Our results show that, as at many other volcanoes, sul-phate is an important component of the near-source aerosolwith the majority of impactor runs suggesting a pro-nounced peak in the sulphate concentrations on the0.44 lm diameter cut-off impactor stage. Halide ions suchas chloride seem unusually low in the aerosol, in keepingwith the lower level of gaseous hydrogen halides in theplume. The concentrations of many metallic species are ele-vated above background in the plume (Rb, Cs, Be, B, Cr,Ni, Cu, Mo, Cd, W, Re, Ge, As, In, Sn, Sb, Te, Tl, Pb,Mg, Sr, Sc, Ti, V, Mn, Fe, Co, Y, Zr, Hf, Ta, Al, P, Ga,Th, U, La, Ce, Pr, Nd, Sm, Eu, Gd, Tb, Dy, Er, Tm).For many of the other species some runs are elevated abovebackground and others are not leading to some ambiguityin the interpretation of these results (especially as it wasnot possible to characterise an air packet upwind of theHalema�uma�u vent simultaneously to the in-plume mea-surements and as there was likely some volcanic influencein the background sample). It is however likely that the vol-cano is a source of at least some of these other species.
As observed at other volcanoes, there was considerablevariability in the metal to SO2 ratios of many of the metalsstudied. Our ratios are generally about an order of magni-tude lower than those measured by Hinkley et al. (1999)and Olmez et al. (1986) at Pu�u�O�o (Table 6). They aremore similar to those measured by Crowe et al. (1987).One possible explanation is the potential role of halogensin terms of metal volatilisation and transportation in volca-nic plumes. The range of Cl/S and F/S ratios measured byCrowe et al. (1987) overlaps with the ratios measured in thisstudy, while the Olmez et al. (1986) measurements were en-riched in halogens compared to our measurements andHinkley et al. (1999) did not report plume halogen compo-sitions. If plume halogen concentrations exert some sort ofcontrol over the behaviour of metals in the plume, thenmeasurements made during periods with similar halogento sulphur ratios may also result in similar metal to sulphurratios. Although data for metal to SO2 ratios in volcanicplumes are still sparse, our new data support earlier asser-tions that K�ılauea’s emissions are metal-poor comparedto many other volcanic systems.

320 T.A. Mather et al. / Geochimica et Cosmochimica Acta 83 (2012) 292–323
Although there was variation between the sampling runsin terms of the enrichment factors (EF) calculated (likelydue to differences between the erosive versus volatile contri-butions to the plume aerosol), the values were in broadagreement with those from previous studies on K�ılaueaand data from Etna’s aerosol allowing similar element clas-sification schemes to be followed (i.e., lithophiles being low-er volatility and chalcophiles being higher volatility). Ourmeasured aerosol composition with respect to Re and Cdis broadly consistent with the degassing trends observedpreviously in Hawaiian lavas (Norman et al., 2004),although measured aerosol metal/S ratios are about an or-der of magnitude lower than those calculated from theglass-degassing trends.
Although overall definitive differences between the sizedistributions for the different groups of elements were hardto pick out, perhaps reflecting the complexity of processesoccurring in the plume, the proportion of metal associatedwith the largest size mode collected (>2.5 lm) is signifi-cantly higher in the lithophiles than the chalcophiles. Thisis also true for the amount of metal bound to silicate, whichwas significantly higher for the lithophilic metals than thechalcophiles. While this suggests higher volatility leads togreater solubility, there was not a correlation between frac-tional solubility (defined as water soluble %) and EF. Thislack of correlation may reflect the contribution of the sili-cate component to the water-soluble fraction.
Many metals showed higher solubility in the pH 7 buffersolution than the Milli-Q suggesting that acidity is not thesole driver in terms of metal solubility. Nonetheless manymetals were largely water soluble when compared withthe other sequential leachates suggesting that they are likelyto be delivered to the surrounding environment in a bio-available form. A number of metals (85% > Bi > Se>>Mo > B > Ca > La > Fe > Sr > Sb > W > Zr > Hf > Sn >Lu > K > In > 20%) had an important fraction present inthe moderately environmentally labile material (assumedin Chester et al., 1989 and Hlavay et al., 1996 to be boundto carbonates and oxides). However, further analysis is re-quired to confirm the speciation of these elements.
Our preliminary environmental samples show that met-als are elevated in rain samples collected downwind of thePu�u�O�o vent and hence affected by the volcanic plumecompared to upwind rain samples, with the most dramaticelevation for Cd. Metal concentrations in a fog sample col-lected downwind of the Pu�u�O�o vent were generally 1–2orders of magnitude higher than the rainwater. The metallevels found in the grass samples did not show the sameunambiguous trends as downwind of other volcanoes pos-sibly due to the complex topography, multiple emissionssources and strong rainfall gradients across the study area.There is however some suggestion of increased volatiledeposition downwind of the Halema�uma�u vent. Furtherinvestigations are required to illuminate the environmentalimpacts of degassing at K�ılauea.
ACKNOWLEDGEMENTS
The authors thank Jim Kauahikaua and the other staff at HVOand NPS who helped with the field campaign as well as the follow-
ing field collaborators: John Catto, Matt Watson, Tjarda Robertsand Adam Durant and of course Maura Hanning and Mairin Sims.We thank Sergio Calabrese (Palermo) for help drafting figures.This work was funded by the NERC NCEO and grants NE/C511180/1/, NE/G001219/1 and NE/G001537/1. T.A.M. acknowl-edges further financial support from the Royal Society and a UNE-SCO/L’Oreal UK and Ireland Women in Science Award.K.W.W.S. acknowledges NSF-EAR, 063824101. The helpful re-views of Cindy Werner and Geoff Plumlee during USGS internalreview and Christoph Kern, Jim Webster and an anonymous re-viewer during the GCA reviewing process are also gratefullyacknowledged.
APPENDIX A. SUPPLEMENTARY DATA
Supplementary data associated with this article can befound, in the online version, at doi:10.1016/j.gca.2011.11.029.
REFERENCES
Africano F., Van Rompaey G., Bernard A. and Le Guern F. (2002)Deposition of trace elements from high temperature gases ofSatsuma-Iwojima volcano. Earth Planets Space 54, 275–286.
Aiuppa A. (2009) Degassing of halogens from basaltic volcanism:insights from volcanic gas observations. Chem. Geol. 263, 99–
109.
Aiuppa A., Federico C., Paonita A., Pecoraino G. and Valenza M.(2002) S, Cl and F degassing as an indicator of volcanicdynamics: the 2001 eruption of Mount Etna. Geophys. Res.
Lett. 29, 1559.
Aiuppa A., Dongarra G., Valenza M., Federico C. and PecorainoG. (2003) Degassing of trace volatile metals during the 2001eruption of Etna. In Volcanism and the Earth’s Atmosphere (eds.A. Robock and C. Oppenheimer). Geophysical Monograph139, American Geophysical Union Washington, DC, pp. 41–54.
Aiuppa A., Federico C., Franco A., Giudice G., Gurrieri S.,Inguaggiato S., Liuzzo M., McGonigle A. J. S. and Valenza M.(2005) Emission of bromine and iodine from Mount Etnavolcano. Geochem. Geophys. Geosyst. 6, Q08008.
Aiuppa A., Bagnato E., Witt M. L. I., Mather T. A., Parello F.,Pyle D. M. and Martin R. S. (2007) Real-time simultaneousdetection of volcanic Hg and SO2 at La Fossa Crater, Vulcano(Aeolian Islands, Sicily). Geophys. Res. Lett. 34, L21307.
Aiuppa A., Baker D. R. and Webster J. D. (2009) Halogens involcanic systems. Chem. Geol. 263, 1–18.
Al-Khashman O. A. (2009) Chemical characteristics of rainwatercollected at a western site of Jordan. Atmos. Res. 91, 53–61.
Alletti M., Baker D. R., Scaillet B., Aiuppa A., Moretti R. andOttolini L. (2009) Chlorine partitioning between a basalticmelt and H2O–CO2 fluids at Mount Etna. Chem. Geol. 263,
37–50.
Ammann M., Hauert R., Burtscher H. and Siegmann H. C. (1993)Photoelectric charging of ultrafine volcanic aerosols: detectionof Cu(I) as a tracer of chlorides in magmatic gases. J. Geophys.
Res. 98, 551–556.
Andres R. J. and Kasgnoc A. D. (1998) A time-averaged inventoryof subaerial volcanic sulfur emissions. J. Geophys. Res. 103,
25,251–25,261.
Arimoto R., Duce R. A., Ray B. J. and Unni C. K. (1985)Atmospheric trace-elements at Enewetak Atoll. 2. Transport tothe ocean by wet and dry deposition. J. Geophys. Res. 90, 2391–
2408.

Halogens and trace metal emissions from K�ılauea volcano 321
Arimoto R., Duce R. A., Ray B. J., Hewitt A. D. and Williams J.(1987) Trace elements in the atmosphere of American Samoa:concentrations and deposition to the tropical south pacific. J.
Geophys. Res. 92, 8465–8479.
Bagnato E., Aiuppa A., Parello F., Calabrese S., D’Alessandro W.,Mather T. A., McGonigle A. J. S., Pyle D. M. and Wangberg I.(2007) Degassing of gaseous (elemental and reactive) andparticulate mercury from Mount Etna volcano (Southern Italy).Atmos. Environ. 41, 7377–7388.
Benitez-Nelson C. R., Vink S. M., Carrillo J. H. and Huebert B. J.(2003) Volcanically influenced iron and aluminium cloud waterdeposition to Hawaii. Atmos. Environ. 37, 535–544.
Bennett V. C., Norman M. D. and Garcia M. O. (2000) Rheniumand platinum group element abundances correlated with mantlesource components in Hawaiian picrites: sulphides in theplume. Earth Planet. Sci. Lett. 183, 513–526.
Bruland K. W. (1983) Trace elements in seawater. In Chemical
Oceanography, vol. 8 (eds. J. P. Riley and R. Chester).Academic Press, New York, pp. 157–220.
Caselles J. (1998) Levels of lead and other metals in citrus alongsidea motor road. Water Air Soil Poll. 105, 593–602.
Cervelli P. F. and Miklius A. (2003) The shallow magmatic systemof K�ılauea volcano. In The Pu’u O’o-Kupaianaha Eruption of
Kilauea Volcano, Hawai’i: the First 20years (eds. C. Heliker, D.A. Swanson and T. J. Takahashi). USGS Professional Paper
1676, pp. 149–164.
Chester R. (2000) Marine Geochemistry. Blackwell Science, Oxford.Chester R., Lin F. J. and Murphy K. J. T. (1989) A three stage
sequential leaching scheme for the characterisation of thesources and environmental mobility of trace metals in themarine aerosol. Environ. Technol. 10, 887–900.
Chudaeva V. A., Urchenko S. G., Chudaev O. V., Sugimory K.,Matsuo M. and Kuno A. (2006) Chemistry of rainwaters in thesouth Pacific area of Russia. J. Geochem. Explor. 88, 101–105.
Cimino G. and Toscano G. (1998) Dissolution of trace metals fromlava ash: influence on the composition of rainwater in theMount Etna volcanic area. Environ. Pollut. 99, 389–393.
Crowe B. M., Finnegan D. L., Zoller W. H. and Boynton W. V.(1987) Trace element geochemistry of volcanic gases andparticles from 1983–1984 eruption episodes of Kilauea volcano.J. Geophys. Res. 92, 13,708–13,714.
Cwiertny D. M., Young M. A. and Grassian V. H. (2008)Chemistry and photochemistry of mineral dust aerosol. Annu.
Rev. Phys. Chem. 59, 27–51.
D’Alessandro W. (2006) Human fluorosis related to volcanicactivity: a review. In Environmental Toxicology (eds. A.Kungolos, C. A. Brebbia, C. P. Samaras and V. Popov). WIT
press, Southampton, pp. 21–30.
De Carlo E. H. and Spencer K. J. (1995) Records of lead and otherheavy metal inputs to sediments of the Ala Wai Canal, Oahu,Hawaii. Pac. Sci. 49, 471–491.
Delfosse T., Elsass F. and Delvaux B. (2005) Direct evidence ofbasic aluminum sulphate minerals in an S-impacted Andosol.Eur. J. Soil Sci. 56, 281–286.
Delmelle P. (2003) Environmental impacts of tropospheric volcanicgas plumes. In Volcanic Degassing (eds. C. Oppenheimer, D. M.Pyle and J. Barclay). Geological Society, London, Special
Publications 213, pp. 381–399.
Dixon J. E., Clague D. A. and Stolper E. M. (1991) Degassinghistory of water, sulfur, and carbon in submarine lavas fromK�ılauea Volcano, Hawaii. J. Geol. 99, 371–395.
Draxler R. R. and Rolph G. D. (2003) HYSPLIT (HYbrid Single-Particle Lagrangian Integrated Trajectory) Model access viaNOAA ARL READY Website (http://www.arl.noaa.gov/HYSPLIT.php NOAA Air Resources Laboratory, SilverSpring, MD.).
Edmonds M. and Gerlach T. M. (2007) Vapor segregation and lossin basaltic melts. Geology 35, 751–754.
Edmonds M., Pyle D. M. and Oppenheimer C. (2002) HClemissions at Soufriere Hills Volcano, Montserrat, West Indies,during a second phase of dome building, November 1999 toSeptember 2000. Bull. Volcanol. 64, 21–30.
Edmonds M., Gerlach T. M. and Herd R. A. (2009) Halogendegassing during ascent and eruption of water-poor basalticmagma. Chem. Geol. 263, 122–130.
Ferm M. and Svanberg P.-A. (1998) Cost-efficient techniques forurban- and background measurements of SO2 and NO2. Atmos.
Environ. 32, 1377–1381.
Filgueiras A. V., Lavilla I. and Bendicho C. (2002) Chemicalsequential extraction for metal partitioning in environmentalsolid samples. J. Environ. Monitor. 4, 823–857.
Finnegan D. L., Kotra J. P., Hermann D. M. and Zoeller W. H.(1989) The use of 7LiOH-impregnated filters for the collectionof acidic gases and analysis by instrumental neutron activationanalysis. Bull. Volcanol. 51, 83–87.
Gladney E. S. and Goode W. E. (1981) Elemental concentrations ineight new United States geological survey rock standards: areview. Geostandard. Newslett. 5, 31–64.
Gerlach T. M. (1986) Exsolution of H2O, CO2 and S duringeruptive episodes at Kilauea volcano, Hawaii. J. Geophys. Res.
91, 2177–2185.
Gerlach T. M. (1993) Oxygen buffering of Kilauea volcanic gasesand the oxygen fugacity of Kilauea basalt. Geochim. Cosmo-
chim. Acta 57, 795–814.
Gerlach T. M. and Graeber E. J. (1985) Volatile budget of Kilaueavolcano. Nature 313, 273–277.
Gerlach T. M., McGee K. A., Elias T., Sutton A. J. and DoukasM. P. (2002) Carbon dioxide emission rate of Kilauea Volcano:Implications for primary magma and the summit reservoir. J.
Geophys. Res. 107, 2189, doi:10.1029/2001JB000407.
Goff F. and McMurty G. M. (2000) Tritium and stable isotopes ofmagmatic waters. J. Volcanol. Geotherm. Res. 97, 347–396.
Gordon C. A., Herrera R. and Hutchinson T. C. (1994) Studies offog events at two cloud forests near Caracas, Venezuela – II.Chemistry of fog. Atmos. Environ. 28, 323–337.
Greenland L. P. (1984) Gas composition of the January 1983eruption of Kilauea volcano, Hawaii. Geochim. Cosmochim.
Acta 48, 193–195.
Greenland L. P., Rose W. I. and Stokes J. B. (1985) An estimate ofgas emissions and magmatic gas content from Kilauea volcano.Geochim. Cosmochim. Acta 49, 125–129.
Hauri E. H. (2002) SIMS investigations of volatiles in silicateglasses 2: abundances and isotopes in Hawaiian melt inclusions.Chem. Geol. 183, 115–141.
Heliker C. and Mattox T. N. (2003) The first two decades of thePu�u�O�o-Kupaianaha eruption: chronology and selected bib-liography. In The Pu’u O’o-Kupaianaha eruption of Kilauea
volcano, Hawai’i: the first 20years (eds. C. Heliker, D. A.Swanson and T. J. Takahashi). USGS Professional Paper 1676,
pp. 1–27.
Hinkley T. K. (1991) Distribution of metals between particulateand gaseous forms in a volcanic plume. Bull. Volcanol. 53, 395–
400.
Hinkley T. K., Le Cloarec M.-F. and Lambert G. (1994)Fractionation of families of major, minor, and trace metalsacross the melt–vapor interface in volcanic exhalations. Geo-
chim. Cosmochim. Acta 58, 3255–3263.
Hinkley T. K., Lamothe P. J., Wilson S. A., Finnegan D. L. andGerlach T. M. (1999) Metal emissions from Kilauea, and asuggested revision of the estimated worldwide metal output byquiescent degassing of volcanoes. Earth Planet. Sci. Lett. 170,
315–325.

322 T.A. Mather et al. / Geochimica et Cosmochimica Acta 83 (2012) 292–323
Hirose K. (2006) Chemical speciation of trace metals in seawater: areview. Anal. Sci. 22, 1055–1063.
Hlavay J., Polyak K., Bodog I., Molnar A. and Meszaros E. (1996)Distribution of trace elements in filter-collected aerosol sam-ples. Fresenius. J. Anal. Chem. 354, 227–232.
Hollingshead A. T., Businger S., Draxler R., Porter J. and StevensD. (2003) Dispersion modeling of the Kilauea plume. Boundary
Layer Meteorol. 108, 121–144.
Ilyinskaya E., Oppenheimer C., Mather T. A., Martin R. S. andKyle P. R. (2010) Size-resolved chemical composition of aerosolemitted by Erebus volcano, Antarctica. Geochem. Geophys.
Geosyst. 11, Q03017.
Jeon S. R. and Nakano T. (2001) Geochemical comparison ofstream water, rain water, and watershed geology in CentralKorea. Water Air Soil Pollut. 130, 739–744.
Johnson A. and Canil D. (2011) The degassing behaviour of Au,Tl, As, Pb, Re, Cd and Bi from silicate liquids: experiments andapplications. Geochim. Cosmochim. Acta 75, 1773–1784.
Johnson D. J., Eggers A. A., Bagnardi M., Battaglia M., PolandM. P. and Miklius A. (2010) Shallow magma accumulation atK�ılauea volcano, Hawai�i, revealed by microgravity surveys.Geology 38, 1139–1142.
Landis M. S., Stevens R. K., Schaedlich F. and Prestbo E. M.(2002) Development and characterization of an annular denu-der methodology for the measurement of divalent inorganicreactive gaseous mercury in ambient air. Environ. Sci. Technol.
36, 3000–3009.
Lindberg S. E. and Stratton W. J. (1998) Atmospheric mercuryspeciation: concentrations and behavior of reactive gaseousmercury in ambient air. Environ. Sci. Technol. 32, 49–57.
Longo B. M., Rossignol A. and Green J. B. (2008) Cardiorespi-ratory health effects associated with sulphurous volcanic airpollution. Public Health 122, 809–820.
Longo B. M., Yang W., Green J. B., Crosby F. L. and Crosby V. L.(2010) Acute health effects associated with exposure to volcanicair pollution (vog) from increased activity at Kilauea volcano in2008. J. Toxicol. Environ. Health A 73, 1370–1381.
Malcolm E. G., Keeler G. J., Lawson S. T. and Sherbatskoy T. D.(2003) Mercury and trace elements in cloud water andprecipitation collected on Mt. Mansfield, Vermont. J. Environ.
Monit. 5, 584–590.
Martin R. S., Mather T. A., Pyle D. M., Watt S. F. L., Day J.A., Collins S. J., Wright T. E., Aiuppa A. and Calabrese S.(2009a) Sweet chestnut (Castanea sativa) leaves as a bio-indicator of volcanic gas, aerosol and ash deposition onto theflanks of Mt. Etna in 2005–2007. J. Volcanol. Geotherm. Res.
179, 107–119.
Martin R. S., Watt S. F. L., Pyle D. M., Mather T. A., MatthewsN. E., Georg B., Day J. A., Fairhead T., Witt M. L. I. andQuayle B. M. (2009b) Environmental effects of ashfall inArgentina from the 2008 Chaiten volcanic eruption. J. Volca-
nol. Geotherm. Res. 184, 462–472.
Martin R. S., Sawyer G. M., Spampinato L., Salerno G. G.,Ramirez C., Ilyinskaya E., Witt M. L. I., Mather T. A., WatsonI. M., Phillips J. C. and Oppenheimer C. (2010a) A total volatileinventory for Masaya volcano, Nicaragua. J. Geophys. Res.
115, B09215.
Martin R. S., Mather T. A., Pyle D. M., Day J. A., Witt M. L. I.,Collins S. J. and Hilton R. G. (2010b) Major and trace elementdistributions around active volcanic vents determined byanalyses of grasses: implications for element cycling andbiomonitoring. Bull. Volcanol. 72, 1009–1020.
Mather T. A., Pyle D. M. and Oppenheimer C. (2003a) Tropo-spheric Volcanic Aerosol. In Volcanism and the Earth’s Atmo-
sphere (eds. A. Robock and C. Oppenheimer) Geophysical
Monograph 139, Am. Geophys. Union, Washington, DC. pp.189–212.
Mather T. A., Allen A. G., Oppenheimer C., Pyle D. M. andMcGonigle A. J. S. (2003b) Size-resolved characterisation ofsoluble ions in the particles in the tropospheric plume ofMasaya volcano, Nicaragua: origins and plume processing. J.
Atmos. Chem. 46, 207–237.
Mather T. A., Tsanev V. I., Pyle D. M., McGonigle A. J. S.,Oppenheimer C. and Allen A. G. (2004) Characterization andevolution of tropospheric plumes from Lascar and Villarricavolcanoes, Chile. J. Geophys. Res. 109, D21303.
Mather T. A., McCabe J. R., Rai V. K., Thiemens M. H., PyleD. M., Heaton T. H. E., Sloane H. J. and Fern G. (2006)The oxygen and sulfur isotopic composition of volcanicsulfate aerosol at the point of emission. J. Geophys. Res. 111,
D18205.
Meskhidze N., Chameides W. L., Nenes A. and Chen G. (2003)Iron mobilization in mineral dust: Can anthropogenic SO2
emissions affect ocean productivity? Geophys. Res. Lett. 30,
2085.
Metrich N., Bertagnini A., Landi P. and Rosi M. (2001) Crystal-lization driven by decompression and water loss at Strombolivolcano (Aeolian Islands, Italy). J. Petrol. 42, 1471–1490.
Michaud J. P., Krupitsky D., Grove J. S. and Anderson B. S.(2005) Volcano related atmospheric toxicants in Hilo andHawaii Volcanoes National Park: implications for humanhealth. Neurotoxicology 26, 555–563.
Miller T. L., Zoller W. H., Crowe B. M. and Finnegan D. L. (1990)Variations in trace metal and halogen ratios in magmatic gasesthrough an eruptive cycle of the Pu’u O’o Vent, Kilauea,Hawaii: July–August 1985. J. Geophys. Res. 95, 12607–12615.
Morden C. W. and Caraway V. (2000) Vegetative key to thecommon grasses of Hawai’i. In: Newsletter of the Hawaiian
Botanical Society 39, Numbers 1–2, April–June 2000.Morel F. M. M., Kraepiel A. M. L. and Amyot M. (1998) The
chemical cycle and bioaccumulation of mercury. Annu. Rev.
Ecol. Syst. 29, 543–566.
Moune S., Gauthier P.-J. and Delmelle P. (2010) Trace elements inthe particulate phase of the plume of Masaya volcano,Nicaragua. J. Volcanol. Geotherm. Res. 193, 232–244.
Murata K. (1960) Occurrence of CuCl emission in volcanic flames.Am. J. Sci. 258, 769–782.
Norman M. D., Garcia M. O. and Bennett V. C. (2004) Rheniumand chalcophile elements in basaltic glasses from Ko’olau andMoloka’i volcanoes: magmatic outgassing and composition ofthe Hawaiian plume. Geochim. Cosmochim. Acta 68, 3761–3777.
Okochi H. and Brimblecombe P. (2002) Potential trace metal–organic complexation in the atmosphere. Sci. World 2, 767–786.
Olmez I., Finnegan D. L. and Zoller W. H. (1986) Iridiumemissions from Kilauea volcano. J. Geophys. Res. 91, 653–662.
Perry K. D., Cahill T. A., Schnell R. C. and Harris J. M. (1999)Long-range transport of anthropogenic aerosols to theNational Oceanic and Atmospheric Administration baselinestation at Mauna Loa Observatory, Hawaii. J. Geophys. Res.
104, 18521–18533.
Plessow K., Acker K., Heinrichs H. and Moller D. (2001) Timestudy of trace elements and major ions during two cloud eventsat the Mt. Brocken. Atmos. Environ. 35, 367–378.
Poland M. P., Miklius A., Orr T., Sutton A. J., Thornber C. R. andWilson D. (2008) New episodes of volcanism at Kilaueavolcano, Hawaii. EOS Trans. AGU 89, 37–38.
Poland M. P., Sutton A. J. and Gerlach T. M. (2009a) Magmadegassing triggered by static decompression at K�ılauea Vol-cano, Hawai�i. Geophys. Res. Lett. 36, L16306.
Poland M. P., Huth, T. E. and Miklius, A. (2009b) Sourceprocesses of short-term, transient tilt events at Kilauea

Halogens and trace metal emissions from K�ılauea volcano 323
Volcano, Hawaii. American Geophysical Union, Fall Meeting2009, V43G-2331.
Pyle D. M. and Mather T. A. (2003) The importance of volcanicemissions in the global atmospheric mercury cycle. Atmos.
Environ. 37, 5115–5124.
Pyle D. M. and Mather T. A. (2009) Halogens in igneous processesand their fluxes to the atmosphere and oceans from volcanicactivity: a review. Chem. Geol. 263, 110–121.
Quayle B. M., Mather T. A., Witt M. L. I., Maher B. A., MitchellR., Martin R. S. and Calabrese S. (2010) Application andevaluation of biomagnetic and biochemical monitoring of thedispersion and deposition of volcanically-derived particles atMt. Etna, Italy. J. Volcanol. Geotherm. Res. 191, 107–116.
Robock A. and Oppenheimer C. (eds.), 2003. Volcanism and theEarth’s Atmosphere, vol. 139, Geophysical Monograph, Amer-ican Geophysical Union.
Rubin K. (1997) Degassing of metals and metalloids from eruptingseamount and mid-ocean ridge volcanoes: observations andpredictions. Geochim. Cosmochim. Acta 61, 3525–3542.
Sansone F. J., Benitez-Nelson C. R., Resing J. A., DeCarlo E. H.,Vink S. M., Heath J. A. and Huebert B. J. (2002) Geochemistryof atmospheric aerosols generated from lava–seawater interac-tions. Geophys. Res. Lett. 29, 1335.
Sawyer G. M., Salerno G. G., Le Blond J. S., Martin R. S.,Spampinato L., Roberts T. J., Mather T. A., Witt M. L. I.,Tsanev V. I. and Oppenheimer C. (2011) Gas and aerosolemissions from Villarrica volcano, Chile. J. Volcanol. Geotherm.
Res. 203, 62–75.
Shimamura T., Iwashita M., Iijima S., Shintani M. and Takaku Y.(2007) Major to ultra trace elements in rainfall collected insuburban Tokyo. Atmos. Environ. 41, 6999–7010.
Siegel S. M. and Siegel B. Z. (1984) First estimate of annualmercury flux at the Kilauea main vent. Nature 309, 146–147.
Signorelli S. and Carroll M. R. (2000) Solubility and fluid–meltpartitioning of Cl in hydrous phonolitic melts. Geochim.
Cosmochim. Acta 64, 2851–2862.
Slemr F., Schuster G. and Seiler W. (1985) Distribution, speciation,and budget of atmospheric mercury. J. Atmos. Chem. 3, 407–
434.
Slemr F., Brunke E. G., Labuschagne C. and Ebinghaus R. (2008)Total gaseous mercury concentrations at the Cape Point GAWstation and their seasonality. Geophys. Res. Lett. 35, L11807.
Smichowski P., Polla G. and Gomez D. (2005) Metal fractionationof atmospheric aerosols via sequential chemical extraction: areview. Anal. Bioanal. Chem. 381, 302–316.
Spilliaert N., Metrich N. and Allard P. (2006) S–Cl–F degassingpattern of water rich alkali basalt: modelling and relationshipwith eruption styles of Mount Etna volcano. Earth Planet. Sci.
Lett. 248, 772–786.
State of Hawaii, Department of Health, Env. Mgmt. Div. SafeDrinking Water Branch, 1989: Extended Abstract. In 4thInternational Conference on Water Cistern Systems, MakatiMetro, Philippines.
Sutton A. J. and Elias T. (1993) Volcanic gases create air pollutionon the Island of Hawai�i. U.S. Geol. Surv. Earthquakes
Volcanoes 24, 178–196.
Sutton A. J., Elias T., Gerlach T. M. and Stokes J. B. (2001)Implications for eruptive processes as indicated by sulfurdioxide emissions from K�ılauea Volcano, Hawai�i, 1979–1997.J. Volcanol. Geotherm. Res. 108, 283–302.
Swartzendruber P. C., Jaffe D. A., Prestbo E. M., Weiss-Penzias P.,Selin N. E., Park R., Jacob D. J., Strode S. and Jaegle L. (2006)Observations of reactive gaseous mercury in the free tropo-sphere at the Mount Bachelor Observatory. J. Geophys. Res.
111, D24302.
Symonds R. B., Rose W. I., Reed M. H., Lichte F. E. and FinneganD. L. (1987) Volatilization, transport and sublimation ofmetallic and non-metallic elements in high temperature gasesat Merapi Volcano, Indonesia. Geochim. Cosmochim. Acta 51,
2083–2101.
Symonds R. B., Reed M. H. and Rose W. I. (1992) Origin,speciation, and fluxes of trace-element gases at Augustinevolcano, Alaska: insights into magma degassing and fumarolicprocesses. Geochim. Cosmochim. Acta 56, 633–657.
Teixeira E. C., Migliavacca D., Filho S. P., Machado A. C. M. andDallarosa J. B. (2008) Study of wet precipitation and itschemical composition in South of Brazil. An. Acad. Bras. Cienc.
80, 381–395.
Ullrich S. M., Tanton T. W. and Abdrashitova S. A. (2001)Mercury in the aquatic environment: a review of factorsaffecting methylation. Crit. Rev. Environ. Sci. Technol. 31,
241–293.
Vallelonga P. and Mather T. A. (2003) Lead (Pb) fluxes and Pbisotopic compositions from Masaya volcano, Nicaragua.Atmos. Environ. 37, 4453–4460.
Vie le Sage R. (1983) Chemistry of the volcanic aerosol. InForecasting Volcanic Events (eds. H. Tazieff and J.-C. Sabroux).Elsevier, Amsterdam, New York, pp. 445–474.
Villemant B. and Boudon G. (1999) H2O and halogen (F, Cl, Br)behavior during shallow level magma degassing processes.Earth Planet. Sci. Lett. 168, 271–286.
Wallace P. J. (2005) Volatiles in subduction zone magmas:concentrations and fluxes based on melt inclusion and volcanicgas data. J. Volcanol. Geotherm. Res. 140, 217–240.
Wallace P. J. and Anderson, Jr., A. T. (1998) Effects of eruptionand lava drainback on the H2O contents of basaltic magmas atK�ılauea Volcano. Bull. Volcanol. 59, 327–344.
Webster J. D. and De Vivo B. (2002) Experimental and modeledsolubilities of chlorine in alumosilicate melts, consequences ofmagma evolution, and implications for the exsolution ofhydrous chloride melt at Mt. Somma–Vesuvius. Am. Mineral.
87, 1046–1061.
Webster J. D., Kinzler R. J. and Mathez A. (1999) Chloride andwater solubility in basalt and andesite melts and implicationsfor magmatic degassing. Geochim. Cosmochim. Acta 63, 729–
738.
Wedepohl K. H. (1995) The composition of the continental crust.Geochim. Cosmochim. Acta 59, 1217–1232.
Wilson D., Elias T., Orr T., Patrick M., Sutton J. and Swanson D.(2008) Small explosion from new vent at Kilauea’s summit. Eos
Trans. AGU 89, 203.
Witt M. and Jickells T. D. (2005) Copper complexation in marineand terrestrial rain water. Atmos. Environ. 37, 7657–7666.
Witt M. L. I., Mather T. A., Pyle D. M., Aiuppa A., Bagnato E.and Tsanev V. I. (2008) Mercury and halogen emissions fromMasaya and Telica volcanoes, Nicaragua. J. Geophys. Res. 113,
B06203.
Yang R. and van den Berg C. M. G. (2009) Metal complexation byhumic substances in seawater. Environ. Sci. Technol. 43, 7192–
7197.
Zieman J. J., Holmes J. L., Connor D., Jensen C. R., Zoller W. H.,Hermann D. M., Parrington J. R. and Gordon G. E. (1995)Atmospheric aerosol trace element chemistry at Mauna LoaObservatory 1. 1979–1985. J. Geophys. Res. 100, 25979–25994.
Zoller W. H., Parrington J. R. and Phelan Kotra J. M. (1983)Iridium enrichment in airborne particles from Kilauea volcano– January 1983. Science 222, 1118–1121.
Associate editor: Michael Toplis
Copyright © 2022 FDOKUMEN