Hale, Gordon A. - ERIC
228
DOCUMENT RESUME ED 255 544 TM 850 135 AUTHOR Hale, Gordon A.; And Others TITLE Summaries of Studies Involving the Test of English as a Foregn Language, 1963-1982. INSTITUTION Educational Testing Service, Princeton, N.J. REPORT NO ETS-RR-84-3; TOEFL-RR-16 PUB DATE Feb 84 NOTE 228p. PUB TYPE Reference Materials Bibliographies (131) EDRS PRICE MF01/PC10 Plus Postage. DESCRIPTORS Abstl:acts; Academic Achievement; Aptitude Tests; *College Entrance Examinations; *English (Second Language); Higher Education; *Language Proficiency; *Language Tests; Research; Statistical Studies; Student Characteristics IDENTIFIERS Test of English as a Foreign Language ABSTRACT This set of 82 summaries is based on papers written between 1963 and 1982 concerning the Test of English as a Foreign Language (TOEFL). TOEFL is currently required by more than 2,500 colleges and universities in the United States and Canada to determine the English proficiency of applicants whose native language is not English. It is also required by various agencies and hoards that accredit and license professionals trained abroad. While a few descriptive papers are included to provide historical background, the summarized rapers are primarily research reports. Studies focussing on other instruments which provide data that relate performance on those instruments to TOEFL are also included. The summaries are indexed by nine major categories: (1) TOEFL's relationship to similar, standardized objective English language proficiency tests; (2) TOEFL's relationship to other measures of English language proficiency; (3) TOZFL's relationship to tests of intelligence, academic aptitude, and achievement; (4) TOEFL's relationship to later academic performance; (5) simple relation of TOEFL to student characteristics; (6) complex relations involving student characteristics (7) statistical analysis involving TOEFL; (8) miscellaneous research isst.?s; and (9) general descriptive papers. Papers are also indexed in 33 subcategories by types of TOEFL results reported. (BS) ********************************************************************** Reproductions supplied by EDRS are the best that can be made from the original document. ****************************************************************,******
-
Upload
khangminh22 -
Category
Documents
-
view
0 -
download
0
Transcript of Hale, Gordon A. - ERIC

DOCUMENT RESUME
ED 255 544 TM 850 135
AUTHOR Hale, Gordon A.; And OthersTITLE Summaries of Studies Involving the Test of English as
a Foregn Language, 1963-1982.INSTITUTION Educational Testing Service, Princeton, N.J.REPORT NO ETS-RR-84-3; TOEFL-RR-16PUB DATE Feb 84NOTE 228p.PUB TYPE Reference Materials Bibliographies (131)
EDRS PRICE MF01/PC10 Plus Postage.DESCRIPTORS Abstl:acts; Academic Achievement; Aptitude Tests;
*College Entrance Examinations; *English (SecondLanguage); Higher Education; *Language Proficiency;*Language Tests; Research; Statistical Studies;Student Characteristics
IDENTIFIERS Test of English as a Foreign Language
ABSTRACTThis set of 82 summaries is based on papers written
between 1963 and 1982 concerning the Test of English as a ForeignLanguage (TOEFL). TOEFL is currently required by more than 2,500colleges and universities in the United States and Canada todetermine the English proficiency of applicants whose native languageis not English. It is also required by various agencies and hoardsthat accredit and license professionals trained abroad. While a fewdescriptive papers are included to provide historical background, thesummarized rapers are primarily research reports. Studies focussingon other instruments which provide data that relate performance onthose instruments to TOEFL are also included. The summaries areindexed by nine major categories: (1) TOEFL's relationship tosimilar, standardized objective English language proficiency tests;(2) TOEFL's relationship to other measures of English languageproficiency; (3) TOZFL's relationship to tests of intelligence,academic aptitude, and achievement; (4) TOEFL's relationship to lateracademic performance; (5) simple relation of TOEFL to studentcharacteristics; (6) complex relations involving studentcharacteristics (7) statistical analysis involving TOEFL; (8)miscellaneous research isst.?s; and (9) general descriptive papers.Papers are also indexed in 33 subcategories by types of TOEFL resultsreported. (BS)
**********************************************************************Reproductions supplied by EDRS are the best that can be made
from the original document.****************************************************************,******

frAdrA111111.alowII II
RETORT 163.y c - _;. c FFP,1qUARY 1984
0
r
Sumffiaties of StudiesInvolving the Test ofEnglish as p ForeignLanguage; 1963-1982
Gordon A: HaleCWarles X11. Stansfiuld
..sRichardtP. Duran
F
E pwric, S Hvi
The Test of English as a Foreign Language (TOEFL) was developed in 1963 bya National Council on the Testing of English as a Foreign Language. whichwas formed through the cooperative effort of over thirty organizations, publicand private, that were concerned with testing the English proficiency of non-native speakers of the language applying for admission to institutions in theUnited States. In 1965. Educational Testing Service (ETS) and the CollegeBoard assumed joint responsibility for the program and in 1973 a cooperativearrangement for the operation of the program was entered into by ETS. theCollege Board, and the Graduate Record Examinations (GRE) Boatel. Themembership of the College Board is composed of schools. colleges, schoolsystems, and educational associations; GRE Board members are associatedwith graduate education.
ETS administers the TOEFL program under the general direction of a PolicyCouncil that was established by, and is affiliated with, the sponsoring organi-zations. Members of the Policy Council represent the College Board and theGRE Board and such institutions and agencies as graduate schools ofbusiness, junior and community colleges, nonprofit educational exchangeagencies, and agencies of the United States government.
A continuing program of research related to TOEFL is carried out under thedirection of the TOEFL Research Committee. Its six members include repre-sentatives of the Policy Council, the TOEFL Committee of Examiners, anddistinguished English-as-a-second-language specialists from the academiccommunity. Currently the committee meets twice yearly to review and ap-prove proposals for test-related research and to set guidelines for the entirescope of the TOEFL research program. Members of the riesearch Committeeserve three-year terms at the invitation of the Policy Council; the chair of thecommittee serves on the Policy Council,
Because the studies are specific to the test and the testing program. most ofthe actual research is conducted by ETS staff rather than by outside researchers. However, many projects require the cooperation of other institu-tions. particularly those with programs in the teaching of English as a foreignor second language. Representatives of such programs who are interested inparticipating in or conducting TOEFL :plated research are invited to contactthe TOEFL program office. Local soearch may sometimes require access toTOEFL data. In such cases, the program may provide this data followingapproval by the Research Committee. All TOEFL research projects mustu--?rgo appropriate ETS review to ascertain that the confidentiality of datawill be protected.
Current (1982.83) members of the TOEFL Research Committee include the fol-lowing:
G. Richard Tucker (chair) Center for Applied Linguisticsd' Anglejan-Chatillon University of Montreal
LoLis A. Arena University of DelawareH. Douglas Brown San Francisco State UniversityFrances B. Hinofotis University of California at Los AngelesHenri, F. Holtzclaw, Jr. University of Nebraska
3

Summaries of Studies Involving the Test of Englishas a Foreign Languages 1963-1982
Gordon A. Hale, Charles W. Stansfield,
and Richard P. Duran
Educational Testing ServicePrinceton, New Jersey
RR 84-3

Copyright ®c by Educational Testing Service. All rights reserved.
rnauthorized Leproduction in whole or in part is prohibited.
TOEFL is a trademark registered by Educational Testing Service in the
United States and in many other countries.

Abstract
This set of 82 summaries is based on papers written between 1963 and1982 concerning TOEFL. The papers summarized consist primarily of reportsof research involving TOEFL. Also included are a few descriptive papers,which are summarized here to provide a perspective on the history anddevelopment of the test. The methods and criteria by which papers wereidentified for inclusion, as well as a scheme for classification of thepapers, are presented in the Introduction.
6

INTRODUCTION
Background
The Test of English as a Foreign Language (TOEFL) is currentlyrequired by more than 2,500 colleges and universities in the United Statesand Canada to determine the English proficiency of applicants where nativelanguage is not English. It is also required by various agencies andboards in the United States and Canada concerned with the accreditationand licensure of professionals trained abroad. Because of its prominencein the field of second language testing, TOE". has been the subject ofcontinual research since its development in 1963.
Many different issues have been addressed in this research. Studiescorrelating TOEFL with other standardized tests of English languageproficiency have addressed the issue of TOEFL's concurrent validity.Also relevant to concurrent validity are studies correlating TOEFL withperformance on cloze tests, dictation measures, oral interviews, writingsamples, instructors' ratings, and other direct and indirect indices ofEnglish language proficiency. TOEFL's role as a predictor of academicperformance has been examined through studies correlating TOEFL withstudents' grade-point averages. Still other correlational studies haveexamined the test's relation to measures of aptitude, intelligence, andachievement.
Another general. group of studies !las been concerned with the perform-ance of different groups of examinees on TOEFL. Within this category arestudies of various language or culture groups, studies of special popula-tions, and comparisons of native English speakers' performance on TOEFLwith that of nonnative speakers. Still other studies have been concernedwith statistical analysis of TOEFL or have addressed such issues aseffects of instruction on TOEFL, characteristics of TOEFL candidates,effects of living environment, and others.
In light of the large amount of research that has now been conductedinvolving T07.71., the authors, with support provided by the TOEFL ResearchCommittee, have collected information regarding this research. Thepresent document consists of summaries of studies involving TOEFL thathave been conducted from its initial development in 1963 through 1982.The studies summarized here include not only those that focus specificallyon TOEFL but also studies that focus primarily on other instruments whileproviding data that relate performance on those instruments to TOEFL.Also, the 1973 and 1981 versions of the TOEFL manuals are summarized herebecause they present statistical data gathered over teveral large-scaleadministrations of the test. The 1973 version presents data for thefive-part test (which was in use before 1976; see below), and the 1981
version presents data for the current three-part test. (A 1983 version ofthe manual is now available but is not summarized here, as it was notavailable at the time these summaries were compiled.) Also included are a

-2-
few published papers that present analyses of TOEFL or describe itshistory, in order to provide some perspective on the basis for, andprocedures followed in, development of the test. This collection has been
prepared for use by researchers, test developers, foreign student coun-selors, admissions officers, teachers of English as a second language, and
others who use TOEFL and thus might have an interest in summaries of
reports relating to the test.
The collection is a result of a larger effort to identify all papersrelated to TOEFL that have been written in English, which has resulted in
a comprehensive bibliography. This bibliography is to be published in theModern Langualr Journal, Volume 67, No. 4, Spring 1984, under the title "A
comprehensive TOEFL bibliography, 1963-1982." In developing this bibliog-raphy, the authors have identified relevant papers through the following
means:
1. A computerized literature search was conducted in December 1981
and updated in January 1983. Data bases for this search included theEducational Resources Information Center (ERIC) system, PsychologicalAbstracts, Dissertation Abstracts International, Language and LanguageBehavior Abstracts, Social Science Citation Index, the Modern LanguageAssociation International Bibliography on Lan ua es and Lin uistics, andTIFIZTPL Annual Biblio ra-h of Books and t c es on e a o in ores :n
Languages, Vol. 1 1968 -Vol. 8 (1975-76).
2. In April 1982 a letter inquiring abOUt local studies or other
research involving TOEFL was sent to all directors of ESL teacher-trainingprograms listed in C. Blatchford (Ed.), Directory of TeacherPreparationPrograms in TESOL and Bilingual Education 1978-1981 3Rashington, b.C.:
TESOL, 1979).
3. In May 1982 a letter of inquiry was sent to 350 specialists insecond language testing. This list included all recipients of LanguageTesting Notes, the newsletter of the Testing Commission of the Inter-natfonal Association of Applied Linguistics (AMA).
4. Development of the bibliography was announced at the LanguageTesting Research Colloquium held at the sixteenth annual TESOL conventionin March 1982, with a request for assistance in identifying all relevantstudies.
5. During 1982 a call for information regarding relevant studiesappeared in the notes and news sections of several professional journals.
6. A draft bibliography was sent in March 1983 for inspection tosome 70 specialists in language testing listed on the Language TestingResearch Colloquium mailing list with a request for information regardingany missing entries.
In addition, all papers identified in the search were examined forreference to other papers that might be appropriate.

-3-
Among the papers that have been identified through this process,research papers falling into the following categories have been includedin the present collection: (a) published papers (i.e., journal articles,papers in edited volumes or published proceedings, and so forth); 0)doctoral or master's theses; (c) papers included in institutional techni-cal report series; and (d) papers presented at professional meetings.Although many other unpublished reports have also been identified throughthe search and are included in the published bibliography, the researchpapers in the present collection are limited to those falling into one ofthe four categories listed above. There are undoubtedly other unpublishedstudies that also deserve consideration, but space and resource limita-tions dictated that this collection be restricted. It was decided thatthe selection of studies to be included in this collection should be basedon objective criteria as opposed to a subjective assessment of quality bythe three researchers who compiled this report. It was reasoned that thepapers included here are more likely to have been subjected to some formof review, by peers and other professionals, and this review was viewed asexercising a form of quality control similar to that which might beexercised in a subjective selection process. Peer review and evaluativefeedback is common in the preparation of articles for publication inprofessional journals, and other media, and is also obtained in theprocess of delivering a paper at a professional meeting. Similarly, thewriting of a thesis or dissertation also involves receiving and actingupon evaluative feedback. On the whole, the application of the above-mentioned criteria is believed to have provided a reasonably effective wayof selecting appropriate research papers.
Because the primary focus of this collection is upon research, only afew nonresearch papers are summarized. Selected from a larger set ofpublished descriptive or analytic papers about TOEFL, these are papersthat aepeared to provide the most extensive discussion about the history,development, or use of TOEFL.
In a few instances, two different papers dealing with data from agiven study were identified--for example, a thesis as well as a bookchapter based on the thesis. In such cases, only one of the two papers issummarized in this collection.
TOEFL
From 1963 to 1976, TOEFL consisted of five subtests: (a) ListeningComprehension, (b) English Structure, (d) Vocabulary, (d) Reading Compre-hension, end (e) Writing Ability. Since the Seember 1976 Internationaladministration and since the 1977 Institutional administrations (seedefinitions below), TOEFL has consisted of three sections: (a) ListeningComprehension, (b) Structure and Written Expression, and (c) ReadingComprehension and Vocabulary. The two forms of the test are described indetail below.

The Five-Part TOEFL
The five-part TOEFL consisted of 200 total item (questions) and
required 2 hours and 20 minutes of administration time. ''' The five parts
of the test were as follows:
Listening Comprehension (50 items, 40 minutes) measured the exam-inee's ability to understand spoken English. The oral information was
presented via tape recorder. This section consisted of three parts. In
the first part (20 items) the examinee heard short questions or state-
ments, then responded by indicating which of four printed alternatives
best answered the questioir4or paraphrased the statement heard. In the
second part (15 items), the examinee heard a short dialogue followed by a
question about the dialogue and marked the printed statement that best
answered the question. In the third part (15 items), the examinee heard asimulated university lecture eight minutes in length and was allowed totake notes. Terms that were used in the lecture were printed on a sepa-rate page that was provided for note taking. The lecture was followed by
several questions and, after hearing each question, the examinee selected
the best answer to the question from four printed alternatives.
En lish Structure (40 items, 20 minutes) measured the examinee'smastery of mportant structural and grammatical points in spoken English.
In each item, a short printed conversation between two speakers, part of
which had been omitted, was presented. The examinee chose, from fourprinted alternatives, the word or phrase that correctly completed the
conversation.
Vocabulary (40 items, 15 minutes) measured knowledge of word mean-
ings. This section contained two types of items. For each item of the
first type (15 items), a sencence was presented in which one word had beenomitted, and the examinee selected, from the four alternatives provided,
the one word that best completed the sentence. In each item of the second
type (25 items), a phrase was presented and the examinee selected, fromfour options, the word or phrase with most nearly the same meaning as the
given word or phrase.
Reading Comprehension (30 items, 40 minutes) measured the examinee'sability to read and understand English prose, including the ability tomake inferences and draw conclusions. Several passages were presented,and the examinee answered several four-option multiple-choice questions
based on each passage.
Writing, Ability (40 items, 25 minutes) tested the examinee's abilityto recognise effective style and appropriate usage and diction in written
am101041.0.
1 In certain test administrations, additional items were included asexperimental items for purposes of test equating. These added items werenot part of the basic test, however, and were not counted in deriving theexaminee's score.
10

English. This section contained two types of items. For each item ofthe first type (25 items), the examinee read a sentence in which four
different words or phrases had been underlined, each marked with a differ-
ent letter from A to D. The examinee selected the letter correspondingwith the word or phrase that would not be accepted in standard writtenEnglish. In each item of the second type (15 items), the examinee read asentence containing a blank where a word or phrase had been deleted. Theexaminee chose, from four alternative words or phrases, the one that best
completed the sentence.
The Three-Part TOEFL
This form of TOEFL, which is currently in use, consists of 150 itemsand requires 1 hour and 45 minutes of actual testing time. (As with the
five-part TOEFL, these figures apply to the basic test; additional itemsare included in certain administrations for purposes of test equating.)
The three-part TOEFL is similar to the five-part test, except thatcertain sections have been combined, and certain types of items withinsections have been deleted or revised. (See Summary No. 62, Pike, 1979,
for discussion of the empirical basis for revision of the test.)
Listening Comprehension (50 items, 35 minutes) measures the ability
to underStand English as it is spoken in the United States. This sectioncontains three parts, with the oral material presented via tape recorderin each part. For each item in the first part (20 items total), theexaminee hears a short statement and then chooses the printed sentence(of four) that is closest in meaning to the one heard. For each item in
the second part (15 items total), the examinee hears a short conversationbetween two speakers, which is followed by a *elation asked by a thirdvoice. The examinee must choose, from four printed phrases, the one that
best answers the question heard. For each item in the third part (15items total), the examinee hears a short talk, conversation or presenta-tion, such as a simulated news broadcast, short lecture, or public an-nouncement. The speech segment is followed by several orally presentedquestions and, for each question, the examinee must choose, from fourprinted phrases, the best answer to the question.
Structure and Written Expression (40 items, 25 minutes) measuresmaste17711mportant structural and grammatical points in standard written
English. The language used in this section is more formal than that ofthe Listening Comprehension section, and the topics are of a generalacademic nature. This section consists of two parts. For each item in
the first part (15 items total), the exapinee reads a sentence from whicha word or phrase has been deleted. The examinee must choose, from four
words or phrases, the one that best completes the sentence. For each item
in the second part (25 items total), the examinee reads a sentence inwhich four words or phrases are underlined, marked A, B, C, and D. Theexaminee must identify the one underlined word or phrase that would not beaccepted in standard written English.
11

-6-
Reading Comprehension and Vocabulary (60 items, 45 minutes) measuresthe ability Eo understand the meanings and uses of words as well as theability to understand a variety of general reading materials. For each
item in the vocabulary part (30 items total), the examinee reads a sen-tence in which one word or phrase is underlined. The examinee must then
select, from four words or phrases, the one that best preserves themeaning of the sentence if substituted for the underlined word or phrase.In the reading comprehension part (30 items total), the examinee reads avariety of short passages, each of which is followed by questions aboutthe meaning of the passage. For each question, the examinee must choosethe printed word or phrase that best answers the question.
The Testing Programs
TOEFL is administered under four separate testing programs: theInternational Testing Program, the Special Center Testing Program, theInstitutional Testing Program, and the Overseas Institutional TestingProgram. Under the International Testing Program, TOEFL is given at testcenters around the world on six regularly scheduled Saturday test dates ayear. Most applicants who need TOEFL scores for application to study inthe United States or Canada take the test under this program. Interna-tional test administrations are provided both at overseas testing centers(i.e., those outside the United States and Canada) and at domestic testingcenters (those within the United States and Canada).
TOEFL is offered under the Special Center Testing Program six timesa year, on regularly scheduled Friday test dates, in those months in whichInternational Testing Program administrations are not offered. Like
International administrations, Special Center administrations are offeredat both overseas testing centers and domestic testing centers.
In the Institutional Testing Program, test forms previously used inthe International and Special Center testing programs are made availableto institutions. The institutions administer the test to their students,primarily for the purpose of placing the students at appropriate levels f
an English language program or for determining the students' need foradditional work in English. This service is provided in the United Statesand Canada. In other countries a similar service is provided through theOverseas Institutional Testing Program.
Nature of the Summaries
The preceding sections provide background relating to the administra-tion of TOEFL that is necessary for understanding the methodology of thestudies summarized in this collection. We now turn to a description of
the summaries, with a brief overview of their structure and content.
12

.7-
In each of the summaries, we have sought to present a reasonablyaccurate recapitulation of the points made in the original paper.
The reader is apprised that these summaries are not intended to be evalua-
tive. Each summary has been written from the perspective of the author orauthors, with the details of method, results, and conclusions summarized
as presented by the author. Thus, all statements of interpretation orconclusion presented here are those of the author. It is left for the
rea er to raw s or er own cone us one as to the quality of each
individual study. Because we are employed by the organization thatpublishes TOEFL, we felt that it might be inappropriate to evaluatecritically the studies contained herein. However, we have occasionallyinterjected comments; where we have done so, we have enclosed them insquare brackets to differentiate them from the summary of the author's
statements. These observations are generally not of an evaluative nature,however, but are merely designed to note aspects of each study--usuallymethodological details--that may be unclear or missing from the report.
It would be useful for the reader to keep in mind, in examining thesesummaries. that some studies may be more thorough than others. Thus,
whether a given study's results lend themselves to firm conclusions maydepend on a number of aspects of the methodology employed in the study.
For each study summarized here we have attempted to provide detail that
might aid the reader in this regard, including the size of the sample, the
nature of the sample, the circu2stances of test administration, and so
forth. But it must be reemphasized that this collection is not intendedto serve the function of a critical review. Rather, its objeetive is to
call to the reader's attention the studies that have been done involving
TOEFL (as well as some background papers), and to give a general overviewof each study's method and results. The reader who wishes to look further
into these studies is encouraged to read the original papers; the classi-fication scheme offered here should be of help in identifying studies ofparticular interest.
Many of the studies summarized here focus specifically on TOEFL. In
some of the studies, however, TOEFL has played only a minor role. In the
latter cases, we have focused principally on aspects involving TOEFL andhave provided a relatively brief discussion of other aspects. Somestudies, particularly theses, have presented extensive introductorymaterial and reviews of the literature; in such cases, we have generallyfocused on the empirical aspect of the papers, condensing the introductorymaterial into short statements of background.
In almost every summary, we indicate which version of TOEFL wasused, the five-part or the three-part. In some of the reports summarized,however, the author did not indicate which version was used and, in these
instances, we have indicated in brackets our assumption as to which was
used, usually based on the note of testing. Also, where relevant informa-
tion vies available, we report the type of administration that served as
the source of TOEFL scores reported--i.e., (a) International, (b) Special
Center, (c) Institutional, (d) Overseas Institutional, or (e) experi-
mental administration. Where the source was not presented and the report

-8-
simply indicated that TOEFL scores were available (for students nowenrolled in a U.S. college or university), we indicate in brackets our
assumption that the TOEFL scores were derived from International or (after
1977) Special Center administrations prior to matriculation, since suchadministrations are the principal sources of TOEFL scores in institutionalrecords.
Where information was provided about tests or other instrumentsused, this information has been summarized. In some reports a test was
not described, but a description of the test often could be found inanother report. In such cases, the reader is referred to the summary ofthe latter report for a test description.
In a few instances the format of a test may have changed over time.Wherever a test description is provided in a summary here, it is intended
to summarize the author's description of the test at the time the descrip-tion was written. Also, the names of some tests mentioned in reportssummarized here may have changed since the reports were written. Wherever
this is true, the name in use at the time the report was written is usedhere. A notable example is the Graduate Record Examinations AptitudeTest, which, in 1982, was renamed the Graduate Record Examinations General
Test. The original name is retained throughout this collection, as it wasthe name in use when the studies employing the test were conducted.
One measure that has been used frequently throughout these summariesis grade-point average (CPA). This measure has not been explicitlydefined in many reports, perhaps bec(Tse common conventions are used incomputing GPA and authors have not thought it necessary to provide ex-planation. Typically, students in U.S. colleges and universities aregiven letter grades A, B, C, D and F, which are assigned numbers 4, 3, 2,
1, and 0, respectively. A student's GPA for a given period of time (e.g.,semester, year) is a weighted average of all grades assigned in that timeperiod, where the weight for a given grade is the number of credit hoursassociated with that grade. Although there are variations to this system(e.g., pluses and minuses attached to the letter grades are taken intoaccount; certain courses are not counted), the basic concept of the GFA is
assumed to be the same in all studies in which CPA is used as a variable.
Each summary begins with the bibliographic reference to the report on
which the summary was based. The style of the bibliographic referencefollows that recommended in American Psychological Association (1983),Publication Manual of the American Pa cholo ical Association (3rd ed.).Washington, DC: Author. The headings used in the summaries were devisedfor use in this collection and follow the style typically used in research
papers. Headings used for empirical papers here are Purpose, Method,Results, and Conclusions (or Results and Conclusions as a single section).An additional sectiou,'entitria7045773iMded in cases, such astheses, in which the report includes extensive introductory material.Other headings are also used in a few other instances. In the case ofdescriptive papers and the two versions of the TOEFL manual, a shortPurpose section is followed by a single section entitled Discussion.
14

-9-
In some summaries, one or more papers are cited in the text. Biblio-
graphic references for the cited papers are provided in footnotes. If no
bibliographic reference is provided, the paper is among those summarized
in this collection, and the reader can turn to the appropriate summary for
the bibliographic reference.
We believe this collection to be a nearly complete set of summaries
of reports written prior to 1983 that fit the above mentioned criteria.
The TOEFL program is interested in studies relating to TOEFL that may be
conducted in the future and would like to request the author of any such
study to send a copy of his or her article to the Research Coordinator,
TOEFL Program Office,' Educational Testing Service, Princeton, NJ, 08541-
0001, USA.
Classification of Reports
General Categories
The reports summarized here fall into logical groups, such as (a)
studies of TOEFL's relation to similar, standardized tests of Englishproficiency; (b) its relation to other indices of language proficiency;(c) its relation to later academic performance, and so forth. Presented
below is a classification scheme that lists the principal categories into
which the summaries can tt placed. Below each category name are several
numbers, which refer to reports summarized in this collection. The
numbers under a given category name indicate the reports in which the
principal issue under study relates to that category. In the case of a
few reports, two or sometimes three issues comprise the principal focus of
the report, and in these cases the report is listed under both or all
three categories. Each general category is described below by a phrase
with a few examples. For more comprehensive definitions of the categories
the reader is referred to the snbsequent section, "Index to Reported
Results."
A The relation of TOEFL to similar, standardized objective tests ofEnglish language proficiency (e.g., ALI/GU, CELT, MTELP--see list ofabbreviations below)
Reports: 24, 36, 42, 51, 58, 59, 68, 81
B The relation of TOEFL to other measures of English language profic-iency (e.g., cloze test, interview, essay)
Reports: 19, 20, 23, 25, 29, 30, 32, 38, 39, 44, 47, 48, 49, 52, 53,54, 62, 63, 67, 74
C The relation of TOEFL to tests of intelligence, academic aptitude,and achievement (e.g., common admissions tests such as ACT and SAT;reading achievement tests)
Reports: 2, 6, 8, 24, 29, 61, 64, 65, 68, 69
15

-1 0-
D The relation of TOEFL to later academic performance (e.gi, correlatiorcf TOEFL with college grade-point average, or CPA; combination ofTOEFL with other variables in predicting GPA)
Reports: 1, 4, 5, 11, 11, 15, 17, 33, 35, 36, 37, 50, 55, 59, 66, 68,70, 71, 72, 75, 77, 78
E Simple relation of TOEFL to student characteristics (e.g., nativelanguage, cc entry, or region; se::; educational level)
Reports: 6, 9, 12, 1E 18, 41, 43, 46, 79, 80
F Complex relations involving student characteristics- -i.e., differencesin patterns. of results involving TOEFL as a function of studentcharar 'ristics (e.g., native language, country, or region; sex;educat' evel)
Reports: yJ, 26, 51, 76, 80
G Statistical analysis involving TOEFL (1..g., correlations among t%zTOEFL subtexts; factor analysis involving TOEFL)
Reports: 3. 21, 22, 26, 27, 3, 33, 42, 56, 76
Miscellam:ous research isr.u4 s (e.g., effets of liv:4114 environment onTOEFL performance; relation of TOEFL to admiss!nns t.c,isions)
Reports: 14, 31, 34, 73
I General descriptive papers (e.g., history and development of TOEFL;TOEFL manuals)
Reports: 7, 27, 28, 40, 45, 57, 60, 82
Index to Reported Results
The above classificati n scheme lists each paper according to thecategory that comprises the principal focus of that paper, as it relatesto TOEFL. In many of the reports summarized, however, TOEFL-relatedresults that are secondary or incidental to the main focus are alsopresented. The following listing identifies all instances in whichresults pertaining to TOEFL are presented, whether or not they bear on theprincipal Josue under study. For this purpose, a detailed subclassifica-tion scheme has been developed. Under each general ce:;egory heading, alist of subcategories is presented, each of which is designated by aletter-number combination. Following each subcategory name (or followingeach example where there are two or more examples within a subcategory)
are listed the numbers assigned to reports whose summaries contain datarelevant to that subcategory. This listing thus serves as an index toreported results involving TOEFL. As a further aid to the reader, each
16

individual summary contains (in the upper-right corner of the summary's
first page) the letter-number combinations pertaining to ali relevant
subcategories of results presented in that summary.
The relation of TOEFL to similar, standardized objective tests of
'English language proficiency
Al commonly used tests: ALA /GU (4); CELT (42); MTELP (1, 24, 59,
68)
A2 miscel:aneous tests: experimental objective tes;s (62); Ledotests (17); SC/GCE (58); TOEIC (81); UCB/EFL (51); WAIS -R Vocabu-
lary test (36)
B The relation of TOEFL co other measures of English language pro-ficiency
81 cloze test ;23, 25, 29, 39, 44, 54, 62, 65, 66, 67)
B2 intervieo (1, 19, 20, 32, 38, 52, 62) and TSE (19, 20)
B3 essay tests (58, 62, 63)
B4 grades in ESL classes (37, 42, 43); teachers' or other facultymembers' ratings of English proficiency (24, 47, 68, 77)
PI dictation test (44); noise test (32, 74)
B6 rewriting task (30, 62)
B7 miscellaneous measures: article usage indices (49); editing test(53); experimental oral listening comprehension test (48); Holtz-man Stress-unstress test (38); IMOP (38); oral cloze test (74);placement in ESL courses (42)
C The relation of TOEFL to tests of intelligence, academic aptitude,and achievement
CI common admissions tests: ACT (9, 24, 46); GMAT (64, 80); GRE (6,8, 11, 70, 71, 80); LSAT (68); SAT (2, 8)
C2 reading tests: Informal Reading Inventory (65); Iowa test (61);McGraw-Hill test (29, 61); Nelson -Denny test (61); Perkins-Yorio
test (29)
C3 miscellaneous tests: ITED 159); Raven's Progressive Metrics Test
(29); SC/GCE achievement tests (58); TSWE (8)
17

-12-
D The relation of TOEFL to later academic performance
DI simple 'correlation of TOEFL with grade-point average (GPA)(1, 4, 5; 11, 13, 15, 17, 23, 33, 35, 36, 37, 40, 43, 50, 51, 55,66, 68, 70, 71, 72, 75, 78)
D2 combination of TOEFL with other variables in predicting GPA(5, 11, 15, 33, 68, 70, 72, 75, 78)
D3 miscellaneous: relation of TOEFL to instructors' ratings ofperformance (77); relation of TOEFL to self-reported GPA (64)
E Simple relation of TOEFL to student characteristics
El native language, country, or region (3, 26, 41, 47, 62, 75, 76)
E2 sex (12, 41, 43, 47, 55, 79)
E3 educational level (1, 8, 12, 69, 79)
E4 major area of study (43)
E5 native American vs. foreign (9, 46); performance of native Ameri-can students (6, 18)
E6 miscellaneous characteristics: age (1); currently U.S. citizenvs. non-U.S. citizen (80); deaf vs. hearing parents, of deafexaminees (16); English as primary vs. second language (80);ethnic group (12, 55); occupation in home country (77); parents'education (55); planned degree (47); previous grades (1); reportedvs. did not report TOEFL scores to institutions (79); socialadjustment (69); TOEFL repeater vs. nonrepeater (79); TOEFL takenin foreign vs. domestic center (79); type of secondary schoolattended (55)
F Complex relations involving student characteristics- -i.e., differencesin patterns of results involving TOEFL as a function of studentcharacteristics
Fl native language, country, or region (3, 4, 10, 26, 51, 59, 62,64, 76)
F2 sex (43, 47, 51, 78)
F3 educational level (4, 35, 51, 75, 78)
F4 major area of study (35, 43, 51, 70, 78)
F5 miscellaneous characteristics: English as primary vs. secondlanguage (80); planned degree (47); sponsored vs. nonsponsored(17)
18

-13-
G Statistical analysis involving TOEFL
Cl correlatioits among TOEFL subtests62, 63, 74)
G2 factor analysis involving TOEFL76)
G3 test equating (21, 22)
G4 item comparisons (3, 9)
(1, 20, 27, 28, 33, 42, 48, 58,
(26, 33, 42, 56, 58, 69, 74,
H Miscellaneous research issues: characteristics of TOEFL candidates(79); effects of instruction on TOEFL (33, 41, 52, 68, 77); effects ofitem disclosure on TOEFL (34); effects of living environment on TOEFLperformance (46, 73); relation of actual TOEFL scores to self-reportedTOEFL scores (64); relation of TOEFL to admissions decisions (14, 31);relation of TOEFL to self-evaluation of English proficiency (4)
General descriptive papers
Il history and development of 10EFL (7, 45, 57, 60)
12 TOEFL manuals (27, 28)
13 the role of TOEFL in admissions decisions (40, 82)

-14-
Abbreviations Used
Throughout this collection, certain abbreviations are used. Some ofthese abbreviations, such as letters representing statistical terms, areso common that they are presented without definition wherever they are
used. Most other abbreviations used here are acronyms of tests. Theseabbreviations are defined at the beginning of any summary in whichthey appear. However, it is useful also to present a list defining allabbreviations and acronyms, so that the reader may refer to this list asa reminder when necessary. The following list presents the full namesassociated with all abbreviations and acronyms used in t1e summaries.
Statistical symbols and terms
F F test, generally from analysis of variance
-- general factor
KR-20 -- Kuder-Richardson reliability, formula 20
KR-21 -- Kuder-Richardson reliability, formula 21
N -- number of subjects (If presented in parentheses after astatistic, this indicates the number of subjects on whichthe statistic was based.)
ns -- not significant
-- probability level, or significance level
r -- Pearson product-moment correlation
R -- multiple correlation
SD -- standard deviation
-- Student's t, generally used as test of difference between
means
General Terms and Organizational Acronyms
AACRAO -- American Association of Collegiate Registrars and AdmissionsOfficers
AID -- Agency for International Development of the U.S. Department
of State
20

CAL -- Center for Applied Linguistics
CEEB -- College Entrance Examination Board (now the College Board)
EFL -- Engli Li as a foreign language
ESL -- tglish as a second language
ETS Educational Testing Service
(A% -- grade-point-average
GREB -- Graduate Record Examinations Board
IRT -- item response theory
JAN -- Judgment Analysis Technique
Acronyms for Tests and Other Measures
ACT -- American College Test
ALI/GU -- Test of the American Language Institute at Georgetown University
CELT -- Comprehensive English Language Test for Speakers of English asa Second Language
CESL -- Test of the Center for English as a Second(SIU) Language at Southern Illinois University
ELSA -- English Language Skills Assessment in a Reading Context
EPE -- English Placement Examination
ESLAT -- English as a Second Language Achievement Test
FSI -- Foreign Service Institute; used here in reference to the FSIinterview, which is currently referred to as the InteragencyLanguage Roundtable (ILR) interview
GMAT -- Graduate Management Admission Test
GRE Graduate Record Examinations
IMOP -- Indirect Measure of Oral Output
ITED -- Iowa Test of Educational Development
LCPT Listening Comprehension Picture Test
LSAT -- Law School Admission Test

-16-
MTELP Michigan Test of English Language Proficiency
PAA Prueba de Aptitud AtadiMica
SAT -- Scholastic Aptitude Test of the College Board
SC/GCE -- Examination for the School Certificate and General Certificate
of Education of the West African Examinations Council
SLEP -- Secondary Level English Proficiency Test
STEL -- Structure Tests for English Language
TOEFL -- Test of English as a Foreign Language
TOEIC -- Test of English for International Communication
TSC Tennessee Self-Concept Scale
TSE -- Test of Spoken English
TSWE -- Test of Standard Written English
UCB/EFL-- University of California, Berkeley, Test of English as a
Foreign Language
WAIS-R -- Wechsler Adult Intelligence Scale, Form R
22

-17-
SUMMARIES Al, B2, D1, E3, E6, G1
1. Abadzi, J. (1976). Evaluation of foreign students (sic] admissionprocedures used at the University of Alabama (Doctoral disserta-tion, University of Alabama, 1975). Dissertation AbstractsInternational, 36, 7754A. (University Microfilms No. 76 -13,
884)
Purpose
As part of an examination of the admissions process for foreignstudents at the University of Alabama, this study investigated the rela-tion between academic performance at the university and several variables,including the score on TOEFL and on other measures of English proficiency.Also examined were effects of such background variables as age, country oforigin, undergraduate vs. graduate status, and major field. Of many
analyses, those pertaining specifically to TOEFL are emphasized in this
summary.
Background
Previous research has suggested a relationship between some of theabove-mentioned variables and academic success. The few studies locatedrelating academic performance to tests of English proficiency showedgenerally low correlations. Studies relating foreign students' academicsuccess to their performance on American admissions tests also showedrelatively low. correlations. Research using TOEFL as a moderator variablealong with admissions tests has often yielded inconclusive results.
Method
The subjects were 70 foreign students (60 males and 10 females) whoentered the University of Alabama in fall 1974 (N 37) or spring 1975(N 33). Fifty-three were undergraduates and 17 were graduate students.The subjects ranged in age from 17 to 36 years and represented 28 differ-ent countries. Several different major fields were represented, with themodal number of subjects majoring in engineering (N am 34). The mean total
TOEFL score of the sample was 548, with mean subtest scores ranging from52 to 57.
Individual interviews were conducted during the week precedingregistration with the 31 subjects who had just arrived in the UnitedStates. (The others had been in the United States for several months oryears.) These subjects were asked some general questions then listened to
23

-18-
a simulated lecture of approximately 180 words and recalled what theyunderstood of it. Approximately two months later a second interview wasconducted with these 31 subjects, and the same simulated lecture was used.The subjects were rated by two judges on three five-point scales: fluency(F), pronunciation (P), and comprehension (C) (i.e., recall of thepassage). Agreement between judges was high, as the coefficients ofcorrespondence ranged from .93 to .99 for the six scores (i.e., threescales for each of two administrations).
All but eight of the 70 subjects took the Michigan Test of EnglishLanguage Proficiency (MTELP) on arrival at the university. The eightsubjects who did not take the MTELP were assigned the mean scores fortheir countries on this test for purposes of data analysis. A compositescore based on the three subtests was used in the data analyses.
The MTELP is a multiple-choice test consisting of three sections:Grammar, Vocabulary, and Reading Comprehension. In the Grammar section,
each item consists of a statement with a deleted word or short phrase, andthe examinee must choose, from four alternatives, the missing word orphrase. In the Vocabulary section, each item is either a sentence with adeleted word or a sentence with an underlined word, and the examinee mustidentify, from four choices, the deleted word or a synonym for the under-lined word. The Reading Comprehension section consists of several readingpassages, and each passage is followed by several multiple-choice ques-tions testing factual understanding or inference. [description para-phrased from a recent publication related to the MTELP)
Data from the five-part TOEFL [presumably from International adminis-trations] were available for 25 of the subjects (TOEFL scores were gener-ally not available for students who had previously attended institutionsin the United States or Britain or for certain other students).
The grade-point average (GPA) and number of credit hours taken inthe first semester were tabulated for each of the 70 subjects. The GPAand credit hours in the second semester were tabulated for each of the 33subjects who entered in fall 1974. For all 70 subjects, an estimation ofprevious academic performance [presumably performance in the institutionthe student had just attended, whether in the United States or othercountry) was obtained by transforming the subject's grade into a number ona six-point scale equivalent to the U.S. grades A, B +, B, C+, C, and D.Also, for the 19 subjects who had transferred to the university from ajunior college, the average junior college grade was calculated.
All of the above-mentioned variables were submitted to correlationalanalysis, along with two other variables: age and undergraduate vs.graduate status.
24

_19-
Results
S.
Correlations of the various measures used in the study with the TOEFLsubscores, TOEFL total score, and MTELP score are presented in Table 1;only those correlations exceeding .30 are reported. Note that the TOEFLsubtests, abbreviated in the table, are Listening Comprehension (LC),English Structure (ES), Vocabulary (V), Reading Comprehension (RC), andWriting Ability (WA).
In additioik analyses were conducted to determine the of ects ofgeographic area, major field, and classification (undergraduate, graduate,transfer from abroad, transfer from junior college) (N 70 in each case).These analyses revealed differences as a function of the variables listed,particularly with regard to first-semester GPA. Graduate students had thehighest mean GPA (2.46) and junior college transfers the lowest mean GPA(1.12). Among major field groups, science majors had the highest mean GPA(2.21), perhaps because most science majors were graduate students. Amongthe countries representee, subjects from Taiwan had a relatively high meanGPA (2.42), perhaps because they were almost all graduate students.
Multiple regression analyses were performed involving several vari-ables; those involving TOEFL will be briefly mentioned. Prediction of theTOEFL score from the MTELP score and the interview ratings yielded asignificant multiple R of .82. [The N for this analysis is unclear.]Prediction of the MTELP score from the TOEFL subscores and total scoreyielded a significant multiple R of .85 (N 25), with each subscorecontributing substantially to the prediction. Prediction of first-semester GPA from the TOEFL subscores and total score yielded a multiple Rof .67, which was not significant, probably because of the low N (25).
For the 31 subjects interviewed, there was an improvement in ratingsover the approximately two-month period between interviews. For the 33subjects who had both first- and second-semester GPA scores, a t testshowed the latter to be significantly higher than the former; also, thenumber of credit hours carried increased significantly from first tosecond semester for these subjects.
Conclusions
Conclusions from this study must be regarded as tentative due to thesmall number of subjects involved. First-semester GPA correlated moder-ately highly with the total TOEFL score; also, the correlation betweenfirst-semester GPA and the MTELP score, although only .29 (and thus notappearing in Table I), was significant. These data suggest that thereis some relationship between English proficiency and initial academicperformance. Correlations involving second-semester GPA were generally
25

-20-
Table I
Correlations Involving TOEFL and the MTEIwith Absolute Values of .30 or Greater
Variable NTOEFL Subtest TOEFL
Total MTELPLC ES V Ito WA
Age a -.73 -.32 -.30
Grad. (0) vs. U'grad. (1) a -.54
Semester 1 GPA a .45 .32 .50 .52 .43
Semester 1 No. hours a .53 .35 .32 .40
Semester 2 GPA b .34
Semester 2 No. hours b -.38
Previous average grade 25 -.36 -.38
Average grade-Jr. Coil. b .75 .86 .66 .85
Interview-F (admin. 1) b -.40 -.59
Interview --P (admin. 1) b -.42 -.65
Interview-C (admin. 1) b -.52 -.64
Interview-F (admin. 2) b -.47 -.30 -.30 -.70
Interview-P (admin. 2) -.60
Interview-C (admin. 2) -.49 -.30 -.68
TOEFL LC 25 .35 .33 .46 .62 .49
TOEFL ES 25 .69 .67 .81 .64
TOEFL V 25 .69 .67 .81 .71
TOEFL RC 25 .73 .89 .72
TOEFL WA 25 .80 .65
TOEFL Total 25 .79
'Ns are 25 for correlations involving TOEFL and 70 for correlationsinvolving the MTELP.
b[ Not reported are the numbers of subjects taking TOEFL amongstudents for whom second-semester GPA data are available; among transfers
from junior colleges; or among students who were interviewed.)
26

-21-
lower than those involving first-semester GPA (even though the GPAs of thetwo semesters were relatively highly correlated with each other--r .76).
For correlations involving TOEFL this difference can be seen in Table 1;for the MTELP, the correlation dropped from a significant .29 to .00.These results suggest that, while foreign students' initial grades arerelated to their English proficiency, their grades become increasinglyindependent of their initial level of proficiency.
The intercorrelations among TOEFL subsccres and TOEFL total rangedfrom .20 to .88 [note, however, that the maximum r shown in Table 1 is.89], suggesting that TOEFL is a well-structured test, with the subtestsshowing some relationship to each other but, at the same time, measuringsomewhat different aspects of English knowledge. The correlation of .79between the MTELP and TOEFL scores is consistent with earlier researchshowing a relatively strong relationship between these two measures ofEnglish proficiency.

2. Alderman, D. L. (1982). Language proficiency as a moderato variable
in testing academic aptitude. Journal of Educational Po,74, 580-587. (Also TOEFL Research Rep. No. 10, 1981; ETS Re-
search Rep. No. 81-411. Princeton, NJ: Educational Testing
Service.
Purpose
This study examined the role of language proficiency in testing
academic aptitude and, specifically, ti,g' Ni the hypothesis that proficien-
cy in a second language acts as t motierator variable in accounting for
verbal aptitude scores on tests given in that language.
Method
A total of 361 nonnative English-speaking students at three public
and three private secondary schools in San Juan, Puerto Rico, participated
in the study. In exchange for a fee waiver on the tests and a nominal
stipend, in November 1980 each student took the College-11Gard Scholastic
Aptitude Test (SAT), the Prueba de Aptitud Acaddmica (PAA), and the
three-part TOEFL.
The SAT is a multiple-choice test written for applicants to U.S.
colleges and universities. It consists of verbal and mathematical apti-
tude sections and the Test of Standard Written English (TSWE). The SAT
verbal section includes analogies, antonyms, reading comprehension, and
sentence completion items; the mathematical section measures ability to
solve problems involving arithmetic reasoning, algebra, and geometry. The
TSWE is a test for native speakers of English that assesses knowledge of
Ole conventions of standard written English; it contains questions involv-
ing the correction of sentences and questions involving English usage in
an error recognition format. The PAA contains verbal and mathematical
aptitude sections parallel to those found in the SAT and a test entitled
the English as a Second Language Achievement Test (ESLAT). The ESLAT is
written for nonnative speakers of English and contains questions on
grammar and reading comprehension.
A regression analysis of SAT scores on PAA and TOEFL scores was
performed to determine the significance of the interaction between the PAA
and TOEFL in accounting for scores on the SAT. A significant increase in
explained variance with the addition of a product term representing this
interaction would confirm the expectation that student proficiency in a
second language moderates performance on the SAT.
28

-23-
Results and Conclusions
Table 1 displays the regressions of aptitude test scores obtained ina second language (SAT) on aptitude test scores obtained in a firstlanguage (PAA) and measures of second language proficiency (TOEFL, ESLAT,TSWE). The two left-most columns of values show an increase in themultiple correlation (R) and explained variance (114) as each independentvariable is entered into the regression. The regression coefficientsgiven in the table are the raw (b) and standardized (B) weights for thethree independent variables. The final column indicates whether theinclusion of the dependent variable produced a significant increase in theamount of explained variance for the dependent variable.
It is apparent that both TOEFL and the ESLAT accounted for signifi-cant increases in the variance in SAT scores beyond that explained byparallel aptitude tests in the examinee's native language. TOEFL aloneexplained an additional 30 percent of the total variance on tne SAT-V andabout 10 percent of the total variance on the SAT-M. This finding sup-ports the hypothesis that proficiency in a second language plays a signi-ficant role in scores on aptitude tests administered in the second lan-guage. Thus, when taking aptitude tests in English, students apparentlyneed a fairly high level of proficiency in English to adequately demon-strate their aptitude. Scores on language proficiency tests such as TOEFLshould be taken into consideration as institutions make foreign-studentadmission and placement decisions based on academic aptitude tests givenin English.

-24.-
Table 1
Regressions of Aptitude Test Scores in Second Language (SAT) on
Aptitude Test Scores in First Language (PAA) and Measuresof Second Language Proficiency
DependentVariable
MultipleCorrelationR R'
independentVariables
Resreseion Coefficientsb' 8 rep
Statistical Test ofModerator_gffect
SAT-V .6655 .4429 PM -V -.8303 -.97 .10
.8568 .7341 TOUt -.8329 -.94 .14
.8934 .7982 TO PL x PM -V .0025 2.57 .00 F (1,357) a, 113.39*
(constant) 490.8048
SAT-V .6655 .4429 PAA-V -.7913 -.92 .09
.8022 .6436 ESLAT -.7916 -1.21 .10
.8615 .7423 ESLATK PAA-V .0021 2.75 .00 F. (1,357) 136.70*
(constant) 508.1330
SAT-V .6655 .4429 PAA -V .0952 .11 .08.8790 .7727 TSWE 2.2814 .23 2.26
.8805 .7754 ME* PM -V .0071 .58 .00 F (1,357) 4.216
(constant) 68.4927
SAT -M .7955 .6328 PM-M -.6207 -.70 .11
.8514 .7248 Tom, -1.2147 -1.17 .16
.8871 .7870 70811. PM -M .0026 2.56 .00 F (1,357) 104.26*
(constant) 338.7010
SAT -M .7955 .6328 PAA-M -.5502 -.62 .10
.8259 .6821 ESLAT -1.0354 -1.39 .11
.8777 .7703 ESL Tic PM-Ml .0022 2.66 .00 F (1,357) 0 137.16*
(constant) 540.7829
SAT -M .7955 .6328 PM -M .0664 .07 .09
.8615 .7422 TS1JE -9.0486 -.77 2.69
.8718 .7601 TSWE PM -M .0230 1.51 .00 F (1,357) 26.69*
(constant) 236.5503
p C .01
30

-25- El, Fl, G4
3. Alderman, D. L., 6 Holland, P. W. (1981). Itemperformance acrossnative language Eroups on tLe Test of Eliglislt as a ForeignLanguage. (TOEFL Research Rep. No. 9; ETS Research Rep. No.81-16.) Princeton, NJ: Educational Testing Service. (ERICDJcument Reproduction Service No. ED 218 922)
Purpose
A special chi-square statistic was used to determine the sensitivityof TOEFL items to differences in native languages of examinees. Differ-ences among six language groups were assessed for every item on each oftwo TOEFL forms.
Method
The subjects were 12,379 examinees from six language groups: African,Arabic, Chinese, Germanic, Japanese, and Spanish. The African group
combined four languages: Efik, Fanti, Ibo, and Yoruba; the Germanic groupcombined Danish, Dutch, German, and Swedish. The data for analysis were
based on two International administrations of the three-part TOEFL, one in
November 1976 and the other in November 1979.
In the principal analysis, data for each test were submitted tochi-square analysis to determine each item's sensitivity to languagedifferences. In addition, specialists in English as a second language(ESL) were asked to examine the results of the analysis based on the firstof the two test administrations and (a) to suggest explanations for itemswith high sensitivity to language differences and (b) to identify itemsfrom the second test administration that they believed would be mostsensitive to differences among the language groups.
Results and Conclusions
Approximately seven-eighths of the items in each TOEFL form showed asignificant degree of sensitivity to language differences according to thechi-square analysis.. The items that were most sensitive were those in theReading Comprehension and Vocabulary section, particularly in the firsttest administration. It is suggested that knowledge of specific words in
single sentences and reading passages may be more susceptible to linguis-tic contrasts than are either aural skills or syntactic rules.
Subjects in each language group were placed into 10 strata accordingto their overall TOEFL scores. Analyses showed that the relative advan-tages and disadvantages for different language groups e relativelystable across strata.
31

-26-
Analysis of overall test scores showed that the two language groups
with the htghe_ rest scores were the Germanic and Spanish groups, the two
with the clo.sesL affinity to the English language. The rank order of
language groups varied somewhat by test section, however; the two highestranking groups for Listening Comprehension and for Reading Comprehension
and Vocabulary were the Germanic an? Spanish groups, whereas the highest
ranking groups for Structure and Written Expression were the Germanic andAfrican groups.
The ESL specialists, when asked to identify reasons for certainitems' sensitivity to language differences, found this task very diffi-cult, as they could only offer comments involving languages with whichthey were familiar. Further, when asked to predict which items in thesecond test form would be most sensitive to language differences, thereviewers were generally unsuccessful. Prz.diction was only at a chance
level for Listening Comprehension and Structure and Written Expression;for Reading Comprehension and Vocabulary the success rate was somewhathigher but was still considered not reliable enough for practical applica-
tion. An a priori contrastive analysis of this type appears to be quitespeculative.
The study demonstrates a statistical procedure that can help deter-mine tile sensitivity of TOEFL items to language differences. It is
cautioned, however, that results that are significant by this method donot provide a sufficient basis for excluding an item from the test; even arelatively small difference can yield a significant chi - square, and somedegree of variation is to be expected, based on known contrasts with theEnglish language. However, the method is useful in identifying items thatyield exaggerated or unexpected deviations from expected item performanceacross language groups.
32

4. American Association of Collegiate Registrars and Admissions Officers.(1971) . A....g________p_________________IRAO-AIDParticiantSelectionandPlacementStud.
Report to the Office of International Training, Agency forInternational Development, U.S. Department of State. Washington,DC: Author.
Purpose
The U.S. Agency for International Development (AID) annually sponsorsa program in which foreign nationals attend U.S. colleges and universitiesto prepare them to assist in the economic and social development of theirhome countries. Several aspects of these students' selection and place-ment were examined. This summary focuses primarily on data dealing withprediction of academic performance, in which TOEFL played a role.
Method
The subjects were 1,004 AID program participants, including the firstregularattending arriving in 1967 and 1968 and 100 Vietnamese partici-pants a six-month intensive English language program. Partici-pants were selected by AID, with home-government approval, partly on thebasis of maturity and experience, and they were placed in U.S. collegesand universities by AID or another U.S. federal agency.
Nearly three-fourths of the subjects were from the Far East or Africa(vs. one-Laird of the total foreign student population in the UnitedStates). Sixty percent of the subjects specialized in education, socialscience, or agriculture (vs. 21 percent of all foreign students). Thesubjects' median age was 28, 58 perce.t had been out of school at leastthree years, and the vast majority held professional positions in theirhome countries. Thus, these subjects were different from the generalpopulation of foreign students in the United States. Nevertheless, themean TOEFL score of the subjects (483) was nearly identical to the meanscore of A611 foreign applicants to U.S. institutions between February1964 and April 1967 (484). The sample was 81 percent male (vs. 75 percentfor all foreign students).
Each subject completed a questionnaire indicating (a) year of birth,(b) number of years since last school attended, and (c) rank in class (top10 percent, top 25 percent, top 50 percent, bottom 50 percent). Eachsubject was also administered at least one of the following tests: TOEFL,the English proficiency test of the American.Languege Institute at George-town University (ALI/GU), and the College Board Scholaltie Aptitude Teat(SAT) for undergraduates, or the Graduate Recor4 Examinations (GRE)Aptitude Test for graduate students.
33

11.
-28.-
The ALI/GU is a battery consisting of four tests: English Usage,
Vocabulary and Reading, Listening (all multiple-choice), and Oral Rating
(interview). In the English Usage teat, each item is a sentence with a
word or phrase deleted, and the examinee must choose, from three alter-
natives, the word or phrase that best completes the sentence. In the
Vocabulary and Reading test, each vocabulary item is either a sentence
with a deleted word or a sentence with an underlined word, and the exam-
inee must choose, from four alternatives, the correct deleted word or a
synonym for the underlined word. In the reading part of this test, the
examinee reads several short passages and, for each passage, answers
several multiple-choice questions. For each item of the Listening test,
the examinee hears a short question or a short statement and must choose,
from four printed alternatives, the correct answer to the question or a
correct paraphrase of the statement. [description paraphrased from a
recent publication concerning the ALI/GU test] Only these three tests
were administered to the subjects in the present study on their arrival in
the United States, and the ALI/GU score reported here is a composite of
scores on these three tests.
The SAT is a multiple-choice test of verbal and mathematical aptitude
for applicants to U.S. colleges and universities [see Summary No. 2,
Alderman, 1982]. The GRE Aptitude Test [recently renamed the GRE General
Test] is a multiple-choice test designed for applicants to U.S. graduate
schools and measures verbal and quantitative aptitude. The verbal ability
section tests the abilities to discern, comprehend, and analyze relation-
ships among words or groups of words within sentences and written pass-
ages. The quantitative section measures basic mathematical skills,
understanding of elementary mathematical concepts, and ability to reason
quantitatively and solve quantitative problems. [description paraphrased
from a recent GRE publication]
Three ratings of each subject's quality of academic performance in
his or her home country were made, based on the subject's transcript: (a)
quality in relation to home-country standards, as judged on a five-point
scale by credentials analysts from the American Association of Collegiate
Registrars and Admissions Officers; (b) competitiveness of institution for
which the subject was suited, as judged on a four-point scale by thecredentials analysts; and (c) quality in relation to standards at the
subject's assigned institution, as judged on a five-point scale by receiv-
ing admissions officers. The above-mentioned factors all served aspredictor variables in the analyses to be presented.
The following indices, computed during the subjects' first year at a
U.S. college or university, served as criterion variables in thwanalyses:
(a) grade-point average (GPA), on a four-point scale, for first semester,
second semester, and total first year; (b) credits earned during the first
year; and (c) first-semester and first-year "achievement index," defined
as GPA squared times number of credits earned. Graduate students were
also rated by their advisers on a five-point scale (a) relative to other
foreign students in the discipline and (b) relative to all other students
in the discipline.
34

-29-
Results and Conclusions
Two initial results involving TOEFL are worth noting. First, thecorrelation between scores on TOEFL and the ALI/GU was .84, indicating aconsiderable amount of similarity in these two tests. Second, when thesubjects were asked if their English proficiency was adequate for full-time study, 74 percent of those who said "yes" had TOEFL scores of 450 andabove; 68 percent of those who said "no" had TOEFL scores below 450.Thus, the subjects' TOEFL scores tended to correspond with their percep-tions of their English proficiency.
Prediction of Academic Performance--Undergraduates
Correlations of predictor and criterion variables were significantbut generally low. (Ns ranged from 260 to 413, as different data wereavailable for different subjects.) Of the correlations between thepredictors and the three CPA scores--first-semester, second-semester, andfull-year GPA--those involving the full-year GPA were the highest inalmost every case. In the results presented below, the term "CPA" refersto first-year GPA. The best predictors of GPA were the mathematic110section of the SAT (r .55), admissions officers' ratings of past aca-demic record (.37), and birth year (.36), the last result reflectingbetter performance for younger subjects.
Grade-point average was not predicted very well by either TOEFL(.25) or the ALI/GU (.23). The first-year achievement index, whichcombines GPA and credits received, correlated somewhat more highly withthese tests (TOEFL: .36; ALI/GU: .32), perhaps because those subjectswith low English test scores take more remedial courses and thus receivefewer regular credits.
It might be assumed that the low correlations were due to matching inquality of subjects and institutions. However, no clear relation wasfound between admissions officers' ratings of subjects' prior academicperformance and the selectivity of the subjects' assigned institutions.
The correlations could also have been reduced by the pooling ofsubjects from many countries. Correlations were computed separately fortwo major sending areas, Africa and Vietnam. For the Vietnamese subjects,
---rtrrre13t1'binrtiDEFE-iand-Wfh the ALUGU-were both XY werebetween 127 and 227.); however, for the African subjects, the correlationof GPA with TOEFL was only .17 and with the ALI/GU was nonsignificant (andthus not reported). (Ns were between 116 and 121.) Although the basisfor the difference between regions is not clear, apparently the value ofthese tests for predicting performance cannot be maid to be the same forall geographic areas.

Prediction of Academic Performance for Graduate Students
For the graduate-students, GPA showed a correlation of .19 with TOEFL
and .14 with the ALI/GU; correlations with first-year achievement index
were slightly higher (.33 and .30, respectively). Separate correlations
were computed for four geographic subgroups, three curricular subgroups,
two levels of English proficiency, and for subjects out of school fordifferent lengths of time; none of these groupings resulted in improved
prediction of GPA.
It is concluded that English proficiency scores did not have strong
predictive value in this study. They appear to have been of greater value
in indicating how heavy an academic workload a student should take.
36

-3 1- DI, D2
5. Andalib, A. A. (1976). The academic success of undergraduate Iranianstudents in selected Texas universities (Doctoral dissertation,East Texas State University, 1975). Dissertation AbstractsInternational, 36, 4881A. (University Microfilms No. 76-4618)
Purpose
This study assessed the degree to which the academic success ofIranian students in selected Texas universities was predicted by TOEFL aswell as by five other variables: (a) American College Test (ACT) scores,
ba(h) College Board Scholastic Aptitude Test (SAT) scores, (c) high schoolscholastic average, (d) age, and (e) years out of school.
Background
Examination of previous studies suggests that students' academicperformance in high school is related to their college performance. Onestudy (American Association of Collegiate Registrars and AdillssionsOfficers, 1971) suggests that TOEFL is of limited value as a predictor, asis the verbal SAT score, but that undergraduate grades are related to themathematics score on the SAT and negatively related to age and years outof school.
Method
The subjects were Iranian undergraduates at several Texas univer-sities. Of 336 students considered, 126 (117 males and 9 females) haddata for three predictor variables: high school scholastic average, age,and years out of school; these students comprised the stud" sample. In
addition to data for the above three variables, 42 of the subjects had ACTscores (these subjects are called Group 1), 26 had SAT scores (Group 2),and 16 subjects had TOEFL scores (Group 3) [all presumably obtained viapreadmission testing; i.e., International administrations, in the case ofthe TOEFLI. The total sample of 126 students is called, Group 4. [Namesand number of universities participating are not specified, nor are theclass standings of the subjects.) The criterion variable to be predictedby the above-mentioned factors was the subject.' undergraduate grade-pointaverage (GPA), defined according to the stariard five-point scale (i.e., A"4, B 3, C. 2, D 0 1, P 0 0).
High school average was computed on a 20-point scale, based on thesubjects' performance in grades 10-12. For the approximately 5 percent ofthe subjects who had attended high school in the United States, gradeswere transformed to the 20-point scale according to common guidelines.

$
-32-
The ACT is a multiple-choice text in four parts. The English Usage
subtest measures knowledge of punctuation, style, and other aspects of
writing. Mathematics Usage assesses mathematical reasoning ability.
Social Studies Reading and Natural Science Reading measure reading and
reasoning skills in these two subject areas.
The SAT contains two parts, the verbal (SAT-V) and mathematics
(SAT-M) sections. These two parts test understanding of verbal material
and mathematics reasoning ability, respectively.
TOEFL data were available from the five-part test [presumably
obtained via International administrations].
Results
For Group 1, correlations between ACT subtest scores and GPA ranged
from -.11 to .05 (N 42). For Group 2, correlations between SAT and GPA
were SAT-V: SAT-M: .32 (N 26). For Group 3, the correlation
between TOEFL and GPA was .05 (N 16).
For the other variables, the most reliable correlations with GPA are
based on the full sample of 126 students (Group 4). These correlations
were high school average: .15; age -.17; and years out of school: -.01.
Only the correlation involving age was significant at the .05 level.
Multiple regression analyses produced many results, the most salient
of which are summarized here. For Group 1, the multiple correlation
involving all predictors with GPA was .47 (ns), and the multiple correla-
tion with the best set of predictors (ACT English, ACT Natural Science,high school average, and age) was .46 (ns) . The best predictor, high
school average, correlated significantly with GPA (r 0 .33), but the
addition of other predictors via stepwise multiple regression resulted in
nonsignificant multiple correlations.
For Group 2, the multiple correlation involving all variables was a
nonsignificant .59, and the multiple correlation with the best set of
predictors (SAT-V, SAT-M, age, and years out of school) was a nonsignifi-
cant .58. The multiple correlation for the best two predictors (SAT-V and
SAT-M) was a significant .49; addition of other predictors via stepwise
multiple.regreSSioA_Aelded_noneignificaut correlations.
For Group 3, the multiple correlation involving all variables was a
nonsignificant ..64. The most effective prediction equation was that
involving age only (r -.60). Stepwise regression shoved that themultiple R for the two-best predictors (age and years out of school) was a
significant .63; correlations involving additional variables were not
significant.
38

-33-
For Group 4, the full sample, the multiple correlation involving allthree variables --high school average, age, and years out of school--was asignificant .28. The best prediction equation was that involving all ofthese variables.
Conclusions
This study provides data that nay be useful to admissions officers.For the full sample of 126 subjects, undergraduate CFA was predicted bythe combination of high school avPrage, age, and years out of school.However, the relationship was low enough to suggest that use of equationsinvolving these scores may have only minimal value for making admissionsdecisions. The TOEFL, SAT, and ACT were not good predictors of under-graduate CPA for these Iranian students, and it is recommended that thesetests not be used in making admissions decisions for such students.
Suggestions for further research include use of a larger sample andincluilon of students from a wider geographic area and a wider variety ofcolleges. A departmental test in Feral, the Iranian students' nativelanguage, a5 well as teats in English, could be of value in assessingIranian students' knowledge as part of the admissions process.

-34- Cl, ES
6. Angelis, P. J. (1977). Language testing and intelligence testing:Friends or foes? In J. E. Reddon (Ed.), Proceedings of the FirstInternational Conference on Frontiers in Language Proficiencyand Dolinance Testing. Occasional Papers on Linguistics, No. 1.
Carbondale, IL: Southern Illinois University. (ERIC Document
Reproduction Service No. ED 145 677)
Purpose
This paper reviews data and issues pertaining to relationshipsbetween language proficiency and intelligence. Attention is given to therequirements of verbal proficiency test items and the degree tb which such
items tap intelligence rather than language skills alone for nonnative
English speakers. Special attention is given to TOEFL section scores andpatterns of performance on these sections.
Discussion
The work of Angoff and Sharon (1971) suggests that native Englishspeakers have little difficulty with TOEFL. However, an unpublished study
with 88 native English-speaking high school students shows that, while thesubjects had little difficulty with TOEFL overall, the Structure and
Written Expression and the Reading Comprehension and Vocabulary sectionswere found to contain items that were more difficult than would be expect-
ed for native speakers. In the case of each of these subtests, one-fourth
to one-fifth of the items were answered incorrectly-by at least 80 percent
of the subjects. Lack of grammatical skills influenced the difficulty ofthe Structure and Written Expression section. The difficulty of the
vocabulary items was affected by abstractness and frequency of vocabulary.The difficulty of the reading comprehension items 'Afil influenced by the
need to make complicated judgments and inferences. The occurrence of
unexpectedly difficult items for native English speakers complicates theinterpretation of performance on such items.
Another unpublished study involved analysis of data from TOEFL(presumably the five-part version) and the Graduate Record Examinations(GRE) Aptitude Test given to 91 foreign students applying for admission to
Texas A 6 M University. [See Summary No. 4, American Association...,1971, for a brief description of the ra Aptitude Test.) The correlationbetween TOEFL score and GRE total stare was found to be .53 (12 < .0001),
which was slightly lower than the correlation of .55 (2 < .001) between
the TOEFL score and the GRE verbal subscore. A lower correlation of .31< .01) was observed between the TOEFL score and the GRE quantitative
score. The correlation between the GRE verbal score and the GRE quantita-
tive score was only .13 (ns).
40

-35-
When the subjects were divided into those who scored high and thosewho scored low on the GRE verbal section and on TOEFL, 87 of the 91subjects scored low on the GRE verbal section, and these subjects wereabout equally divided between those with low and high TOEFL scores.However, when a similar subdivision of subjects was made using GRE total'score in place of GRE verbal score, the high GRE category was found tocontain 36 subjects and the low GRE category, 55 subjects; within both thelow GRE and high GRE groups, there were about equal numbers of lowand high TOEFL scorers. Thus, addition of the GRE quantitative scoreapparently produced a more balanced array of scores.
Comparison of the content of TOEFL and GRE items shows that GREverbal items stress more difficult vocabulary, longer passages of text,and more complicated and abstract inference requirements. The GRE verbaltest makes great demands on nonnative English speakers because of thecombined intellectual and language skills needed to comprehend and workitems. It is concluded that the GRE verbal test should not be interpretedas testing language proficiency, a purpose that is better fulfilled byTOEFL.
Research done in Sweden found that scores on measures of inductiveand logical reasoning in Swedish appeared to be associated with Englishreading rest scores. Also, the score on a measure of intellectual delib-erateness showed a negative correlation with the score on an Englishlanguage test. These various results suggest the need for more researchon the relation between language and intelligence.

-36-
7. Angelis, P. J. (1979). TOEFL 1% recent years. In B. Spolsky (Ed.),
Some ma or tests. i,f1..ances in language testing series: 1.
Papers in applied linguistics. Arlington, VA: Center for
Applied Linguistics. (Edited volume available as ERIC DocumentReproduction Service No. ED 183 004)
Purpose
This is a descriptive paper dealing with developments in TOEFL since
1973. [It complements the papers by Jameson & Malcolm (1973), 011er &
Spolsky (1979), and Palmer (1965), summarized in this collection, which
describe the history of TOEFL prior to that time.)
Discussion
Before 1973, the College Entrance Examination Board (CEEB) and
Educational Testing Service (ETS) held joint responsibility for the TOEFL
-program. In July 1973, a new arrangement was formed, whereby responsibil-
ity for the direction of the program was assumed by both CEEB and the
Graduate Record Examinations Board (GREB), with ETS continuing to manage
Lhe program's operation. This change reflected the increase in the number
of graduate applicants taking TOEFL.
One oui.come of this change was the replacement of the NationalAdvisory Council on TOEFL with the TOEFL Policy Council as the policy-
making body for the test. Whereas the earlier council was a general group
representing sever-1 different constituencies, the new Policy Coun.;11 had
a more strictly defined structure. It consisted of three members appointed
by CEEB and three members appointed by GREB--who formed the six-member
Executive Committee--along with nine other members representing foreign
student advisers, admissions officers, government agencies, and teachers
of English as a second language.
The Committee of Examiners, which had existed since 1966, was nos'
made a standing committee of the Policy Council. Its role was enlarged to
include regular review of test items and contribution of general advice on
test content. A second standing committee, established in 1976, was the
TOEFL Research Committee, a five-member panel formed to review research
proposals and monitor research projects.
The ,TOEFL program has continued to grow. As of 1977, there were five
annual administrations of TOEFL, -nd the number of special centers offer-ing the test monthly had grown to c.bout 15. The number of TOEFL examinees
had risen to nearly 150,000 in the year 1976-77.
The test was revised as a result of data obtained in a study by Pike
(1979). The English Structure and Writing ability subtexts were combined,
00
42

-37-
partly because of the high correlation found between them; the ReadingComprehension and Vocabulary subtests were combined for similar reasons.The new test thus consists of three sections rather than five, and thechange in format resulted in a reduction in number of items and testingtime as well as in changes in item types. [See Introduction for descrip-
tions of the three-section and five-section tests.) Since the equatingsystem and score scale remain the same, total scores on the three-parttest can be interpreted in the same way as total scores on the old five-part test (although section scores cannot be compared). Since ListeningComprehension now contributes one-third of the score, rather than one-fifth as before, some shift in the role of listening may occur, andfurther data are needed to determine the nature and extent of such ashift.
Certain assumptions remain the same as they were in 1963, when thetest was first developed. Notably, a normative scale is still used,whereby an examinee's proficiency is expressed in relation to that of all
others who have taken the test. -
Regarding the use and interpretation of TOEFL scores, surveys haveindicated that most institutions use section scores, particularly theListening Comprehension score, in making admissions decisions. Alsoregarding score interpretation, it has repeatedly been stressed that TOEFLscores are not appropriate predictors of future grades. Admissionsdecisions presumably should be made by first examining a student's pastacademic record and then using TOEFL scores to help determine whether thestudent has the necessary English proficiency to do the required academicwork. Yet TOEFL does provide predictive information of a sort. If therole of English proficiency in different programs of study were to bedetermined, guidelines could be established concerning the meaning ofTOEFL scores for students at different levels and programs of study.
Since the formal program of TOEFL research began in 1976 under thegovernance of the TOEFL Research Committee, several projects have beeninitiated. [The studies mentioned are now completed and are among thefirst reports published in the TOEFL Research Report series, which aresummarized in this collection.)
A new version of the TOEFL manual, due to appear shortly as of thetime of this writing, provides data on the three-part test. [The 1981manual, which postdates the 1976 version to which Angelis refers, issummarized in the present collection, with data presented for the revisedtest.)
An invitational conference in October 1977 was attended by 10 speci-
alists in English as a second language. Discussions among these special-ists, the TOEFL Committee of Examiners, and ETS staff led to suggestionsfor further shifts in emphasis in the TOEFL-- principally, to use moreextended contexts and more realistic situations, and to 'place more stresson academic contexts, since the test is used primarily for college anduniversity admissions decisions.

-14
-38-
As continued input is provided by the various TOEFL committees andother specialists in the field, and as research indicates new areas forinvestigation, it is appropriate that the TOEFL program'be responsive tosuggestions for further change.
44

-39- Cl, C3, E3
8. Angelis, P. J., Swinton, S. S., & Cowell, W. R. (1979). The perfor-
"""""n"ives'ea1'sofE11:l"h"T°EFLa"ve"alitatEudeleita(TOEFLResearc----Rep.No.3;ETSResearchRep.No.79-7). Princeton, NJ: Educational Testing Service. (ERICDocument Reproduction Service No. ED 205 607)
Purpose
This study sought to determine the relationship between performanceon TOEFL and performance on two commonly used measures of verbal aptitude:
the verbal section of the Graduate Record Examinations Aptitude Test(GRE-V), taken by prospective graduate students, and the verbal section ofthe College Board Scholastic Aptitude Test (SAT-V), taken by prospective
undergraduates. -Because SAT examinees also take the Test of StandardWritten English (TSWE), which is often used to place native Englishspeaking students in freshman English courses, scores on the TSWE werecompared with scores on the TOEFL also.
Method
A telephone survey of 50 large universities was first conducted,which showed that the TOEFL, the SAT, and the GRE are the most commonly
required tests of foreign applicants to undergraduate and graduate pro-grams. Subeequently, the experimental sample for the present study wasselected, which consisted of 396 volunteers. The subjects, wto included
210 undergraduate applicants and 186 graduate applicants, took ei.her theGRE-V or the SAT-V and the TSWE after a regularly scheduled normingadministration of the three-section TOEFL. [The SAT and TSWE are brieflydescribed in Summary No. 2, Aldermau 1982; the GRE Aptitude Test isbriefly described in Summary No. 4, American Association..., 1971]. All
testing was carried out at 13 domestic test centers. Background data
indicated that the group was typical of the TOEFL population. Thirty-fivedifferent native languages were listed by the graduate students and 30 bythe undergraduates.
Mean scores produced by the sample were compared with mean scores forrepresentative comparison groups of about 1,500 examinees each: (a)
examinees ratdomly selected from the total population of examinees whowere administered the same form of TOM, (b) native speakers who took thesame form of the GRE-V, and (c) native speakers administered the same
forms of the SAT-V and TSWE. Performance on TOEFL was then correlatedwith, and compared to, performance on one of the other tests.
Results and Conclusions
Table 1 depicts basic descriptive statistics on the four measuresincluded in this study for the experimental and comparison 'groups. The

-40-
mean score of 269 on the SAT-V achieved by the nonnative undergradustesshows that this group found the test very difficult. The mean score of274 achieved by graduate nonnatives on the GRE -V was also well below themean score for native speakers, even though the mean TOEFL score ofgraduates included in this sample (523) was above the mean for all gradu-ate examinees on TOEFL (506). Although scores on the SAT-V and GRE-V forboth nonnative groups were attenuated, the undergraduates were not as far(1.5 SD) below their native speaking counterparts as were the graduates (2SD). It should also be noted that the reliability of both verbal aptitudemeasures was considerably lower for nonnatives than for natives.
Table 1
Descriptive Statistics on Four Verbal Measuresfor Experimental and Comparison Groups
Test and subgroup N Mean SD Reliability
TOEFL (undergraduates) 210 502 63 .94
(graduates) 186 523 69 .95
(comparison group) 1,540 493 75 .95
SAT-V (nonnative.) 210 269 67 .77
(natives) 1,765 425 106 .91
TSWE (nonnatives) 210 28 8.8 .84
(natives) 1,765 42 11.1 .89
GRE-V (nonnatives) 186 274 67 .78(natives) 1,495 514 128 .94
The native-nonnative performance differential on the TSWE was slight-ly less (1.4 SD) than was observed for the SAT-V, and the reliability ofthe TSWE was similar for both groups.
It is concluded that the SAT-V, TSWE, and GEE -V are all difficult fornonnatives. Because their scores cluster in the lower extreme of eachtest scale, interpretation of scores of nonnatives on these tests can becomplicated.
The correlations among these measures are depicted in Table 2. Thecorrelation of .65 between TOEFL total and GRE-V indicates that these twoscores are related, although the skills being measured are not identical.The Listening Comprehension section of TOEFL showed the lowest correlationwith GRE-V, which is to be expected, since listening skill is not measured
46

-41-
with the ORE-V. The other two TOEFL sections exhibited stronger andnearly equal correlations with the GRE-V. The same pattern occurred with
the SAT-V. The TSWE correlated more strongly with the TOEFL than dideither of the other two tests, with the weakest relationship between theTSWE and any specific TOEFL section involving Listening Comprehension
(.51) and the strongest relationship involving Structure and Written
Expression (.71). The latter finding offers support for the constructvalidity of the Structure and Written Expression section of TOEFL,
since it is similar in format to the TSWE.
Table 2
Correlations between Scores on TOEFL and Scoreson Three Common Admissions Tests
TOEFL SectionListening Structure and Reading Comp. Total
Comprehension Written Expression and Vocabulary TOEFL
GRE-V (N 186) .52 .61 .62 .65
SAT-V .m 210) .45 .64 .68 .68
TSWE (N 210) .51 .71 .66 .72

3
-42- Cl, ES, G4
9. Angoff, W. H., & Sharon, A. T. (1971). A comparison of scores earnedon the Test of English as a Foreign Language by native Americancollege students and foreign applicants to U.S. colleges. TESOLquarterly, 5: 129-136.
Purpose
This study compared performance of native American students andforeign students in performance on TOEFL.
Method
The native American subjects consisted of 71 entering freshmen at awestern state university who averaged at the 29th percentile on theEnglish subacore of the American College Test (ACT). The ACT Englishsubtest is part of a battery of tests for American students applying toU.S. colleges and universities and measures knowledge of English usage.The subjects were administered the five-part TOEFL in February 1969. Thesample of foreign students consisted of all candidates given an operation-al [presumably International] TOEFL over a three-year period from 1964 to1967' (N 34,774).
Results and Conclusions
The average score of the native Americans was about two standarddeviations higher than that of the foreign students on Listening Compre-hension, English Structure, and Vocabulary and about one standard devia-tion higher on Reading Comprehension and Writing Ability. Furthermore,the American students' score distribution was narrower than that of theforeign students and was highly skewed in the negative direction, with ahigher proportion of students earning maximum or near-maximum scores.These results show that the test was extremely easy for the native Ameri-can students.
The correlation between ACT English and TOEFL score for the nativeAmerican subjects was a relatively low .64, which cannot be attributed tounreliability of the tests (reliabilities of ACT English and TOEFL arereported by the tests' publishers to,be .88 and .97, respectively). Thus,
TOEFL appears to measure somewhat different language skills from thosemeasured by the ACT English subtest.
Analysis of item difficulties showed that only 17 of 130 items weremore difficult for the native American than for the foreign students.(This analysis excluded those items for which 11 values, or propi,k:tions ofthe groups answering the items correctly, exceeded .95, since statistics
48

-43-
on such items toad to be unreliable). This result further attests to theease of TOEFL for native American students. Of these 17 items, 13 were
from the Writing Ability section, which taps examinees' knowledge ofgrammatical forms. The relatively large number of such items may reflectthe fact that Americans are frequently exposed to incorrect grammaticalforms in colloquial English.
Listening Comprehension items were uniformly easier for the Americanthan for the foreign students; this finding may result from the fact thatEnglish is transmitted in spoken form more often for the former studentsthan for the latter. English Structure items were also uniformly easierfor the American students, which could be due to the fact that thissection is intended to identify the types of language errors character-istic of foreign speakers of English. .
In general, the relative ease of TOEFL for the American students andthe narrowness and skewedness of the score distribution for these studentsindicate that TOEFL is not an appropriate test of English for nativeAmerican students.

10. Angoff, W. H., & Sharon, A. T. (1974). The evaluation of differencesin test performance of two or more groups. Educational andPsychological Measurement, 34, 807-816.
Purpose
This study sought to determine whether there are differences amonglanguage groups in the relative difficulties of various vocabulary itemson TOEFL. It also served to demonstrate statistical procedures by whichto address this question and identify items that are particularly easy orparticularly difficult for a given language group.
Method
The subjects were examinees takineihe five-part TOEFL at a regular[presumably International] test administration in October 1969. All testcandidates (a total of 6,120) in six native language groups were included:German, Spanish, Arabic, Chinese, Japanese, and Gujarati. The study alsoincluded a sample of 1,000 cases drawn at random from the general popula-tion of examinees at the same test administration. Performance on the 40items in the Vocabulary section was examined.
Results and Conclusions
An analysis of variance was conducted with two factors: languagegroup and specific vocabulary item. A significant interaction betweenitems and groups showed that the patterns of performance on the 40 vocabu-lary items were different for the six language groups. Thus, the rankorder of item difficulties tended to vary with the native language of theexaminee.
In additional analyses, the difficulty level of each of the 40 itemsfor a given language group was plotted against the difficulty level forthe general sample of 1,000 examinees. This was done for each of the sixlanguage groups, thus defining six elliptical scatterplotp. For eachlanguage group, items falling outside this ellipse were identified asitems that were particularly easy or particularly difficult for thatgroup. Although the specific items so identified are not indicated in thereport, distrii,utions of deviation are presented as a means of demonstrat-ing the value of the statistical procedure.
The study makes no attempt to assess item differences in terms oflinguistic considerations. It does suggest, however, that the itemsmeasure sufficiently different aspects of English vocabulary that they arenot consistently more difficult for one group than another. The study
50

-45-
also demonstrates a statistical procedure that can be used to identifythose items that are unusually easy or unusually difficult for a givenlanguage group.

-46- Cl, Dle D2
11. Ayers, J. B., & Patin's, R. N. (1977). Predictive validity of theTest of English as a Foreign Language for Asian graduate stu-dents in engineering, chemistry, or mathematics. Educational
and Psychological Measurement, 37, 461-463.
Purese
The relationships among college grades, Graduate Record Examinations(GRE) Aptitude Test scores, and TOEFL scores were examined for 50 Asianstudents who had completed master's level programs in engineering,chemistry, or mathematics.
Method
The subjects were 50 male foreign students enrolled at TennesseeTechnological University. The subjects' countries of origin were Asian
[identified simply as "Republic of China, India, Thailand, etc."). Allsubjects had taken TOEFL prior to admission to the university. Fifteen of
the 50 students had completed the GRE Aptitude Test, which yielded averbal score (GRE-V) and a quantitative score (GRE-Q). [The GRE isbriefly described in Summary No. 4, American Association..., 1971.)Overall grade-point average (GPA) for each subject was obtained fromuniversity records.
Results
Table 1 presents the principal data of the study. A stepwiseregression analysis was used to predict GPA from TOEFL and GRE-V scores.The resulting equation was GPA m 0.004 TOEFL - 0.002 GRE-V + 2.38. Themultiple R for the equation was .71.(g < .05, df a, 12). Addition of GRE-Q
to the equation failed to increase the multiple R.
Table 1
Descriptive Statistics and Intercorrelations among Variables
N Mean SD Correlations
GPA TOEFL GRE-V
GPA 50 3.61 0.31TOEFL 50 491 51.30 .40**
GRE-V 15 286 73.50 .22 .76**GRE-Q 15 645 63.70 .55* .64** .47
*Significant at the**Signiacant at the
.05 level.
.01 level.
52

Conclusions
The results suggest that TOEFL may be a useful predictor of Asianstudents' performance in master's level programs in engineering, chemis-try, or mathematics. A combination of TOEFL and GRE -V scores appeared tobe a reasonable predictor of success. While it may not be possible togeneralize to other academic areas or to other simples of graduate stu-dents, the results suggest the predictive value of TOEFL in selectedareas.

-48- E2, E3, E6
12. Blanchard, J. D., & Reedy, R. (1970, September). The relationship ofa test of English as a second language to measures of acbieve-
ment and self-concept in a sample of American Indian students.
Research and Evaluation Report Series No. 58. Bureau of Indian
Affairs, U.S. Department of Interior. (Reprinted 1917). Paper
presented at the meeting of the American Psychological Associa-tion, Miami Beach, FL. (ERIC Document Reproduction Service No.ED 147 090)
Purpose
The objective of this study was to understand factors contributing tothe poor achievement levels of American Indian students. The studyexamined interrelationships among scores on tests of English languageproficiency (including TOEFL), edOcational achievement, and self-concept.
One hypothesis was that primary language and self-identity may-be closely
connected for American Indian students.
Method
The 99 subjects consisted of 49 males and 50 females in the eleventhand twelfth grades at the Albuquerque Indian School, an off-reservationboarding school managed by the Bureau of Indian Affairs. Six Indian
language families, or tribal groups, were represented. Navajos comprisedthe largest group of students at the school (80 percent) and in the sample
(N 69 of 99).
The teats administered included the five-part TOEFL, the Iowa Test ofEducational Development (ITED), the Tennessee Self-Concept Scale (TSC),and the Southwestern Indian Adolescent Self-Concept Scale (Q-sort). The
ITED is an achievement test consisting of eight subtests: (a) understand-
ing basic social concepts, (b) general background in the natural sciences,(c) correctness and appropriateness of expression, (d) ability to doquantitative thinking, (e) ability to interpret reading materials in thesocial studies, (f) ability to inte pret'reading materials in the naturalsciences, (g) ability to interpret literary materials, and (h) generalvocabulary. The TSC consists of self-descriptive statements the subjectuses to portray himself or herself. Scores are derived on eight scales:(a) personal self, (b) family self, (c) social self, (d) total P score(i.e., sense of selfworth), (e) defensiveness, (f) general maladjustment,(g) personality disorder, and (h) personality integration. The Q-sorttest measures how adolescents feel toward themselves. All tests exceptone were administered under classroom-like conditions by teachers,with some aid from a school psychologist.
54

-49-
Results and Conclusions
One-way analysis of variance was used to determine whether tribe,sex, and grade were associated with differences in individual test scores.Four of the five TOEFL subscores and the total score were found to besignificantly higher for Apaches than for other tribes. Scores on twosubtests of the ITED (understanding of basic social concepts and generalbackground in the natural sciences) were significantly higher for twelfthgraders than for eleventh graders. TOEFL subscores did not differ signi-ficantly across grades, except that scores on the Writing Ability subtestwere higher for twelfth graders. Only one significant difference betweengrades was found for scales on the TSC and Q-sort test. Sex and tribe did
not have significant effects on scores on the ITED test, Q-sort test, orthe TSC test.
Multiple correlations were computed to investigate the associationof all scores on the four instruments to grade, sex, age, and tribeseparately. The results showed significant multiple Rs in every case.When the original zero-order correlations were examined, the followingwere significant. Grade correlated positively with ITED subtests in basicsocial concepts, background in the natural sciences, and interpretingmaterials in the natural sciences. Sex correlated positively with ITEDcorrectness and appropriateness of expression and TOEFL English Structure,and negatively with Q-sort. Age correlated positively with ITED under-standing of basic social concepts and with TSC family self and generalmaladjustment. Tribe correlated negatively with TSE family self score.
Inspection of TOEFL subtest and total scores revealed that thesubjects had average scores falling in the range 300-449 on the Vocabu-lary, Reading Comprehension, and Writing Ability subtests. ListeningComprehension and English Structure scores were higher, more closelyapproximating the mean for foreign students as a whole, but the mean totalTOEFL score of these Indian students was far below that of foreign stu-dents as a whole.
The average ITED scores of subjects in this sample as well as stu-dents in the tenth grade at the Albuquerque Indian School were all belowthe 10th percentile nationally. The results for TOEFL and the ITEDindicate that the subjects were not prepared for an English-speakingacademic environment. Scores on a scale of the TSC that reflected sub-jects' self-image indicated that the subjects manifested low overallself-esteem in relation to the published norms for this scale. TheseIndian students also scored low relative to published norms on two otherscales of the TSC test--the general maladjustment scale and the person-ality disorder scale. Scores on the Q-sort test, however, did not suggestpathological adjustment of Indians. The fact that the constructs undermeasurement by the TSC test were not normed or developed for AmericanIndians must be considered in interpreting these findings.
The results of the study demonstrated that the American Indians underinvestigation showed low skills in English as a second language. These

-50-
individuals scored lower than natilnal norms on all of the tests used inthis study. Perhaps American Indisn students' cultural and linguisticbackgrounds are at odds with the type of education provided in mainstreamU.S. classrooms.
56

13. Bostic, M. L. (1981). A correlational study of academic achievementand the Test of English as a Second [sic] Language (TOEFL)(Doctoral dissertation, East Texas State University, 1981).Dissertation Abstracts International, 43, 468A. (University
Microfilms No 8116851
Purpose
This research investigated the predictive validity of TOEFL forfreshman foreign students enrolled at Southeastern Oklahoma State Univer-sity.
Background
Among the goals of the study was to determine the roles played byeach of two admissions policies for foreign students. Under one policy,
foreign students were admitted upon completion of a series of ESL classes.under a second ,admissions policy, foreign students were admitted ifthey scored at or above 460 on TOEFL. The study had four hypotheses.Hypothesis 1 was that there would be no difference in grade-point average(GPA) as a function of admissions policy. Hypothesis 2 was that therewould not be a significant positive correlation between TOEFL score andGPA. Hypotheses 3 and 4 were the same as Hypothesis 2 except that GPA innonverbal courses and GPA in verbal courses, respectively, were used asthe criterion variables. Nonverbal courses were defined as those coursesin which much of the subject matter could be understood without Englishlanguage skills. Courses meeting this criterion included all courses inmathematics, physical sciences, computer science, drafting, engineering,electronics, chemistry, art, music, and physical education. Verbalcourses were defined as courses that placed an emphasis on communicationof material through language. Such courses included offerings in thefields of languages, humanities, social sciences, business, biology, andconservation.
Method
The 154 students studied represented 19 countries of origin. Allsubjects were enrolled as freshmen during the periods 1978-79 or 1979-80.One hundred fifteen of the students for whom TOEFL scores were not avail-able were admitted to academic study through completion of prescribedcourses in English as a second language (ESL); 30 students were admittedby achieving scores of 460 or better on the three-part TOEFL [presumablyobtained via International or Special Center administrations]; and ninestudents who scored below 460 on the TOEFL were admitted after coy. Meting

-52-
required ESL courses. Students admitted in fall 1978 and spring 1919 werenot required to present TOEFL scores. These students were required to
have earned passing grades in 12 hours of ESL courses before they couldenroll freely in non-ESL courses. Students admitted in fall 1979 andspring 1980 had to present TOEFL scores of 500 or above to gain admission.
In the 1979-80 school year, it was not possible to apply this TOEFLcriterion uniformly; some students who had applied earlier fell under the
1978-79 admissions policy, while other students scored below 500 but were
admitted nonetheless.
In the case of Hypothesisthe mean first-year collegedifferent admissions policies.1978-79 policy was 2.81 versusthe 1979-80 admissions policy.
Results
1, a t -test revealed no differences betweenGPAs of subjects admitted under the twoThe mean GPA for those admitted under the
a mean CPA of 2.67 for those admitted under
Relevant to Hypothesis 2, a correlation of .17 (N - 39) was foundbetween TOEFL score and freshman GPA; this correlation was not statisti-cally significant from zero. Hypothesis 3 was rejected, as a statisti-cally significant correlation of .50 (2. < .05, N - 39) was found betweenTOEFL score and GPA in nonverbal courses. Hypothesis 4 was not rejected,as a nonsignificant correlation of -.08 (N - 39) was found between TOEFL
score and GPA in verbal courses. Hypotheses 2, 3, and 4 were re-examinedusing only those persons who scored at or above 460 on TOEFL. Re-examina-tion of Hypothesis 2 led to its rejection; a correlation of .33 (2. < .05,N * 30) was found between TOEFL score and freshman GPA. Consistent with
the original findings, Hypothesis 3 was rejected and Hypothesis 4 was notrejected among subjects scoring at or above 460 on TOEFL (i.e., there wasa significant correlation between TOEFL and GPA in nonvext but not
verbal courses).
Conclusions
The findings support the conclusion that the two admissions cri-teria--completion of ESL course work and demonstration of a certain TOEFLscore--were associated with the same level of freshman GPA achievement of
foreign students. The analyses relevant to Hypothesis 3 show that TOEFLscores might be helpful in predicting foreign students' academic ashieve-
ment in areas of study that do not emphasize verbal skills. Failure to
find a significant relationship between TOEFL score and GPA in verbalcourses was inconsistent with findings of previous research. In general,
it is concluded that TOEFL scores are a convenient and desirable method
for screening foreign students for admission.
5s
14. Campos-Arcia, M., & McVay, J. (1978, October). Graduate foreignstudent admissions decision-makinu An application orthe JANTechnique. Paper presented at the meeting of the SouthernAssociation for Institutional Research, Nashville, TN. (ERICDocument Reproduction Service No. ED 163 883)
Purpose
In determining whether to admit a foreign student to graduate school,several factors may be considered, such as undergraduate grades, standard-ized test scores, and so forth. The present study sought to determinethe degree of commonality among faculty members with regard to factorsused in admissions decisions for foreign graduate applicants.
Method
First, interviews were conducted with graduate administrators ordepartment heads in academic departments at North Carolina State Univer-sity (NCSU) that had enrollments of 10 or more foreign graduate students.Based on these interviews, four variables were selected as most importantin admission of foreign graduate students: undergraduate academic record,TOEFL score [presumably obtained via International or Special Centeradministrations], Graduate Record Examinations Aptitude Test quantitativescore (GRE-Q), and letters of recommendation. [The GRE Aptitude Test isbriefly described in Summary No. 4, American Association..., 1971.]
Profiles were then constructed that simulated 40 aypothetical foreigngraduate applicants, using various values on each of the four variables.Sets of these 40 profiles were sent to each of 85 faculty members who wereasked to rate each hypothetical applicant on a five-point scale from"pooh" to "superior." The raters were persons who had responsibility foradmissions decisions and represented 16 graduate departments at NCSU thathad enrollments of 10 or more graduate foreign students. Usable data wereobtained from 52 respondents.
The data were analyzed by means of the Judgment Analysis Technique(JAN), which uses a multiple linear regression approach to describe therating policy used by each one of a group of judges. A judge's policy canbe described by the following type of multiple regression equation
Y Bo +B1 X1 B2 X2 Bm Xm E
Where Y is the judge's rating, the Xs are the variables on which therating is based and the Bs are the beta weights, which indicate therelative imp.rtance of each of the M variables in the judge's decision.

-54-
'B is a constant, and E is an error term. By analyzing a judge's ratingsf8r the 40 hypothetical applicants, it is possible to determine the betaweights, or importance, ascribed to each of the four variables by eachrater.
Results and Conclusions
The data show a considerable amount of difference among judges inrating policies. At one extreme, one judge assigned substantial weight to
only one variable (GRE-Q), whereas at the other extreme, some judges
assigned substantial weights to all four variables. The many differentrating policies used seemed generally to comprise seven different models,
representing different combinations of the four variables: (a) GRE-Q
only, (b) GPA and GRE-Q, (c) GRE-Q and letter of recommendation, (d) GPA
and letter, (e) GPA, GRE-Q, and letter, (f) GPA, GRE-Q, and TOEFL, and (g)
all four variables. (Within these seven models, variation among judges in
relative importance of variables was also apparent.)
Different rating policies among judges within departments were alsoapparent, as shown in analyses of data from the 13 departments that wererepresented by two or more judges. Similarly, when judges were grouped
according to years of experience in making admissions decisions forforeign graduate applicants (0-3 years, 4 to 9 years, 10 or more years),differences in rating policies were found within these subgroups. In
general, then, no single policy regarding admission of foreign graduate
students was found, even within departments or within subgroups of judgeswith similar amounts of experience.
6'

-55- Dl, D2
15. Chai, S. H., & Woehlke, P. L. (1979, September). The predictiveability of standardized tests of English as a foreign language.In R. Silverstein (Ed.), Proceedings of the Third InternationalConference on Frontiers in Lan us e Proficiency and DominanceTestin . 'ccasiona apers on ngu st es, r n e,L: southern Illinois University. (ERIC Document Reproduction
Service No. ED 186 476)
Purpose
This review paper considers issues and evidence regarding the useof tests of English as a foreign language as predictors of foreign stu-dents' academic achievement.
Discussion
An important consideration in the use of a standardized test oflanguage proficiency is its validitycontent validity, construct valid-ity, and predictive or criterion validity. Also important is the reli-ability of a test. While English language proficiency tests are nottypically constructed to reflect an English language learning theory, theynonetheless are expected to inform college admissions decisions forforeign students.
The central issue in the admissions context is how useful proficiencytest scores are in aiding admissions decisions. Relevant to this issue isthe ability of proficiency test scores to predict certain academic criter-ia--principally grade-point average (GPA). A review of selected studiesaids in evaluating the utility of various English proficiency tests aspredictors of college grades.
Five studies evaluating TOEFL alone as a predictor of college gradesand college final term sating are cited. Validity coefficients in thesestudies ranged from .17 to .43, indicating that, at most, 18.5 percent ofthe variation in academic performance measures was predictable from TOEFLscores. When several predictors were used, such as combinations of TOEFLtotal and subtest scores or TOEFL scores and oral interview ratings,multiple correlation coefficients ranging from .49 to .64 were observed.Three studies are cited that used TOEFL and the Graduate Record Examina-tions (GRE) Aptitude Test as predictors of GPA. [See Summary No. 4,American Association..., 1971, for a brief description of the GRE AptitudeTest). These studies found a moderate level of predictability, as corre-lations ranged from .32 to .71.
Three studies are mentioned that examined the predictive validityof the Michigan Test of English Language Proficiency (MTELP). [SeeSummary No. 1, Abadzi, 1976, for a brief description of the MTELP.] The

-5b-
criterion measures in these studies were GPA or grades in selected course
areas. Sample sizes ranged from less than 10 to 213. Validity coeffi-
cients ranged from .28 to .52. The largest proportion of MTELP variance
accounted for was 27 percent.
Four studies reviewed used a combination of TOEPL, the MTELP, and
other tests of English proficiency to predict college grades. Validity
coefficients ranged from -.05 to .70 in these studies, with sample sizes
ranging froo 17 to 402. The largest validity coefficients tended to occur
for studies involving the fewest subjects.
Three other studies involved prediction of college grades, college
transcript ratings, earned credits, or an unspecified criterion of aca-
demic success. These studies utilized locally developed proficiency tests
or other measures of verbal skills or verbal proficiency as predictor
variables. Validity coefficients in these studies ranged from .02 to
.84.
It is concluded that scores of teats of English as a foreign language
(EFL) do not show a consistent and substantial relationship to academic
achievement. Various factors might have attenuated the relationships
reported. Unreliability is probably not a significant factor for the most
prominently used tests. Variation in grading standards is a factor that
may limit prediction of academic achievement. Also, the fact that the
samples in these studies consisted of students who were admitted, and thus
had a restricted range of English proficiency scores, could be a factor.
Finally, there is the possibility that EFL tests are not measuring lan-
guage and communication skills that are important for academic function-
ing.
College entrance examination test scores have shown higher relation-ships to college grades for native speakers of English than have English
proficiency test scores for foreign students. Academic achievement in the
student's native language and mathematical aptitude may need furtherinvestigation as predictors of a foreign student's academic achievement.
6,2

16. Charrow, V. R., & Fletcher, J. D. (1974). English as the secondlanguage of deaf children. Developmental Psychology, 10,463470.
Purpose
It was theorized that deaf children of deaf parents learn English asif it were a second language, since such children usually learn signlanguage first whereas deaf children of hearing parents do not. Threederivative hypotheses were tested: (a) deaf children of deaf parentsshould perform better than deaf children of hearing parents on any test oflanguage skills, (b) performance of foreign students on a test of Englishas a second language should resemble that of deaf children of deaf parentsmore than that of deaf children of hearing parents, and (c) the relationbetween a standard test of English skills and a test of English as asecond language should be lower for deaf children of deaf parents than fordeaf children of hearing parents.
Method
Twenty-six 'adolescents in a state school for e deaf served assubjects; these included 13 deaf children of dea rents and 13 deafchildren of hearing parents. All were togenitally deaf except threechildren of hearing parents, who were deaf by 18 months of age. The meanage of the subjects with hearing parents (18.3 years) was significantlyhigher than that of the subjects with deaf parents (17.2 years). Thegroups were similar in socio-economic status. TOEFL scores of a sample of495 hearing foreign students were also available [the source of thesestudents is not specified].
The five-part TOEFL was administered, with the Listening Comprehen-sion section omitted. All references to English as a foreign languagewere deleted. The test instructions were given in Signed English, andsample questions were written on a blackboard, signed, and fingerspelled.
Grade placement scores from the Paragraph Meaning and Languagesubtests of the Stanford Achievement Test were also available for the 26deaf subjects. The Paragraph Meaning subtest measures the subject'sability to comprehend and draw inferences from written discourse, and theLanguage subtest taps the subject's proficiency in usage, punctuation,capitalization, dictionary skills, and sentence sense.
Results and Conclusions
The scores of deaf subjects with deaf parents were significantlyhigher than the scores of those with hearing parents for each of the four

TOEFL subtests (except Reading Comprehension), as well as for the total of
the four subtests and for both of the Stanford subtests. Correlation and
regression analyses also showed a relation between parentage (as a dichot-
omous variable) and test scores. These results support the first hypoth-
esis, that deaf children of deaf parents outperform those with hearing
parents.
To test the second hypothesis, the number of persons answering each
item correctly was determined for each of three groups: foreign students,
dear subjects with hearing parents, and deaf subjects with deaf parents.
(Data were also obtained for the combination of the two deaf groups.)
Correlations were computed between pairs of groups, with individual items
as the units of analysis; this was done separately for each of the four
subtests of TOEFL. Correlations between the foreign-student group and
each of the two deaf groups were of particular interest. These correla-
tions were higher for subjects with deaf parents than for those with
hearing parents, for each of the TOEFL subtests. This result tends to
support the second hypothesis in showing that, of the two groups of deaf
subjects, those with deaf parents performed more similarly to foreign
students on a test of English as a second language. (Similar results were
obtained in a second correlitional analysis, in which the dependentvariable was the number of responses to the most likely wrong answer,
rather than number of correct answers.)
The second hypothesis, however, would also predict that correlations
between the two deaf groups should be lower than the correlation between
foreign students and subjects with deaf parents. Such a pattern was
obtained for the English Structure and Writing Ability subtests but not
for the Vocabulary and Reading Comprehension subtests. Thus, evidence for
the second hypothesis was mixed.
The third hypothesis was that the correlations between TOEFL and the
Stanford tests would be higher for deaf subjects with hearing parents than
for those with deaf parents. Evidence for this hypothesis was equivocal,
as correlations of the TOEFL subscores with the Stanford Language subtest
were generally in the predicted direction, while correlations with the
Stanford Paragraph Meaning subtext were not.
In light of the mixed results for the second and third hypotheses, it
is possible that deaf children learn only some aspects of English as if it
were a second language. In any case, however, the superior performance of
the deaf children of deaf parents may result from having learned sign
language at an early age.
64

17. Chase? C. I., 6 Stallings, W. M. (1966). Tests of English lansuageas predictors of success for foreign students. Indiana Studiesin Prediction No. I. Monograph of the Bureau of EducationalStudies and Testing. Bloomington, IN: Bureau of EducationalStudies and Testing, Indiana University.
Purpose
This study assessed the relation of students' grade-point average(GPA) to TOEFL and other tests of English language proficiency for asample of foreign students at Indiana University. The few studies doneprior to this study suggest a low relation between English teat scores andGPA, possibly because such tests measure differences in class culturerather than intellectual ability.
Method
The subjects were foreign graduate, undergraduate, and nondegreestudents attending Indiana University.
The five-part TOEFL was one of three English tests used. (Scorespresumably were available from International administrations.) There were37 students for whom both a TOEFL score and a GPA were available. Reli-abilities (KR-20) of the TOEFL subtests are reported to range from .84 to.94. (These figures, presented in the Method section, appear to bereliabilities obtained from previous publications; reliabilities for theother tests used in this study are not reported.)
Also administered were two eubtests of a test developed by RobertLado at the University of Michigan. Lado Test B is a teat of auralcomprehension. Lado Test C consists of three parts: (a) Structure, amultiple-choice test requiring interpretation of English sentences; (b)Pronunciation, requiring distinction of letter sounds and knowledge ofcorrect syllable stress patterns; and (c) Vocabulary, requiring selectionof the words or phrases most like those underlined in a series of sen-tences. Lado test scores and GPA were available for 343 subjects; bothLado test scores and TOEFL scores were available for 50 subjects.
A third test, termed the Pennstate test, was developed at Pennsyl-vania State University and has six parts: (a) in Sound Discrimination,the subject sees a pair of words and circles the word that corresponds tothe word being read; (b) in Incomplete Sentences, the subject completes asentence; (c) in Word Fluency, the subject lists as many words as possiblebeginning with a certain letter; (d) in Reading Comprehension, the subjectindicates the meaning of a paragraph via multiple-choice responses; (e) inthe Scrambled Test, the subject constructs a sentence from words out of
65

-60-
order; and (f) in the Vocabulary Synonyms test, the subject selects the
word most like a given stimulus word. This test was administered to 52
subjects.
Result,, and Conclusions
The two Lado tests correlated .67 with each other, suggesting amoderately high degree of overlap in skills measured by them. Correla-
tions with first- and second-semester GPA, respectively, were: for Lado
Test B, .28 and .22; for Lado Test C, .20 and .23. These correlations
were all significant at the .01 level (N 343).
When students were grouped according to various categories, such as
sex, sponsored vs. nonsponsored, and GPA above vs. GPA below a certain
level, the correlations between Lado tests and GPA generally did not
differ between groups. Exceptions were significantly higher correlations
between Lado Test B and second-semester GPA for undergraduates than for
(a) graduates and (b) contract (nondegree) students, perhaps because of
the homogeneity of ability of the latter two groups. Analyses by lan-
guage/culture groups and by major-field groups showed only a few cases inwhich correlations between the Lado tests and either first- or second-
semester GPA were significant at the .05 level. These involved theromance languages and Chinese of 12 language/culture groups, and education
aad the humanities of five major-field groups.
The five TOEFL subtests--Listening Comprehension, English Structure,
Vocabulary, Reading Comprehension, and Writing Ability--correlated .22,
.26, .23, -.07, and .14, respectively, with GPA [whether first-semester,
second-semester, or combined GPA is not indicated). The correlation offirst-semester GPA and Lado Test B was compared statistically with the
correlation of GPA and TOEFL Listening Comprehension, since these two
tests were comparable in format; for similar reasons the correlation offirst-semester GPA with Lado Test C was compared with the correlation of
GPA with TOEFL English Structure. These differences were not significant.
The two Lado tests correlated significantly with each of the TOEFL
subtests. Although correlations with the Lado tests were somewhat lower
for TOEFL Listening Comprehension and Reading Comprehension (r's m. .45 to
.59) than for the other TOEFL subtests (.58 to .87), in general there
appeared to be substantial commonality in skills measured by these tests.
The Pennstate tests failed to correlate significantly with GPA
(r's -.15 to +.13).
In general, while the Lado tests correlated significantly with GPA,
based on an N of 343, these correlations were of approximately the samemagnitude as the nonsignificant correlations between TOEFL and CPA, based
on an N of 37. Given these results, and given the moderate to highcorrelations between the Lado tests and TOEFL, it appears that the Lado
tests and TOEFL measure quite similar characteristics.
66'

-61-
None of the tests used here appeared to be very successful in pre-dicting students' academic performance. Interpretation of this result isrendered difficult by the fact that GPA may be less reliable for foreignstudents than for domestic students; also, subjects who took TOEFL and thePennstate test may have been less representative of the total foreignstudent population at Indiana University than the larger sample who tookthe Ledo tests. Nevertheless, the data suggest that better prediction ofacademic success for foreign students may be achieved by examining vari-ables other than English language ability.

-62- E5
18. Clark, J. L. D. (1977). The performance of native speakers ofEnglish on the Test of English as a Foreign Language (TOEFL
Research Rep. No. 1). Princeton, NJ: Educational Testing
Service.
Purpose
This study examined the performance of native English speakers on
TOEFL and sought to identify characteristics of items that are difficult
for these examinees.
Method
The subjects were 88 college-bound seniors from two New Jersey high
schools, who were paid for their voluntary participation. All participants
were native speakers of English and had had little or no exposure to
languages other than English except in school foreign language courses.
The three-part TOEFL we); administered one week prior to graduation in
each of the two schools. Two alternate forms of the test were adminis-tered, each randomly assigned to approximately half the students per
school. The test was described only as an experimental English achieve -
ment test. The instructions were very similar to those used in the
administration of an operational TOEFL. In addition, however, the in-
structions urged the subjects to "make special note of any individual
questions which seem substantially more difficult than the others." For
the Structure and Written Expression section and the Reading Comprehension
and Vocabulary section, the test administrator sought to provide suf-
ficient but not excessive time. The times acttally Ellotted in these
sections were about 80 percent of those allotted in operational test
administrations with foreign students, and this amount of time proved to
be adequate for these native English speakers.
After completion of the test, each subject completed a short ques-
tionnaire asking for judgments as to the relative difficulty of each
section and subsection of the test.
Results and Conclusions
The subjects scored high on the test, with mean scores of 134.42 (SD
10.19) and 134.91 (SD 11.44) of a possible 150 on the two forms. The
range of scores was very restricted and the distribution was highly skewed
in the negative direction. These results contrast with considerably lower
scores, and wider, nonskewed score distributions for the foreign-student
group on which these forms were initially scaled. These results indicate
that the test would not be appropriate as an instrument for differentiat-
ing among native English-speaking students.

-63-
To compare the different test sections, a "percent-fail" rate wascomputed for each test section; this was the percentage of subjectsincorrectly answering or omitting an item, averaged across items in asection. .These rates were 4.4, 14.6, and 12.1 for the three sections,respectively, showing that the Listening Comprehension section was easierthan the other two sections. The subjects were also asked to rank orderthe sections in difficulty. The subjects gave lower average rankings tothe Listening Comprehension section than to the other two, showing t.atthey perceived this section as the least difficult.
Percent -fail rates and difficulty ratings were also obtained for eachpart of each section. Within Listening Comprehension, subjective diffi-culty ratings indicated that the subjects found the third part, listeningto passages, more difficult than either of the other parts, listening toshort statements or dialogues, perhaps because the passages require moreconcentrated attention. Nevertheless, performance nn all three parts, ofListeninv n zion was relatively high.
.,1ructure and Written Expression section, percent-failrates showed error recognition items were considerably more difficultthan sentence completion items, although the subjects' difficulty ratingsdid not show a difference in perceived difficulty between these two itemtypes.
Within the Reading Comprehension and Vocabulary section, percent-failrates showed the vocabulary items to be considerably easier than thereading passages, a difference that was also reflected in the subjects'difficulty judgments.
In an analysis of individual items, those items with percent-failrates above 20 percent were noted. Taking both test forms together, therewere only three such items in the Listening Comprehension section, but 22in Structure and Written Expression and 22 in Reading Comprehension andVocabulary. Most of the difficult items for Structure and Written Expres-sion involved structural aspects with which college-bound native Englishspeakers should be familiar; thus, the data do not indicate the presenceof an appreciable number of "faulty" grammar items. For the eight diffi-cult vocabulary items, a clear relationship to lexical rarity or otherobvious factors could not be discerned. The 14 difficult Reading Compre-hension items were primarily ones requiring the subject to summarize orinterpret the point of a passage; however, some factual questions werealso answered incorrectly.
In general, the data suggest that TT'FI '- not an appropriateinstrument for differentiating among native Ehglish speakers with respectto English pr(ficiency. Assessment of native English speakers' perform-ance might be useful in development of future tests. However, elimina-
tion of all items found difficult for this population would not be appro-priate, because such a procedure would exclude items that test importantcomponents of English proficiency.

-64- B2
19. Clark, J. L. D., & Swinton, S. S. (1979). An exploration of speakingproficiency measures in the TOEFL context (Tan, iisearch Rep.
No. 4; ETS Research Rep. No. 79-8). Princeton, NJ: Educational
Testing Service. (ERIC Document Reproduction Service No. ED 201641)
Purpose
The purpose of this study was to develop and field test a semi-directmeasure of oral English skills that could be administered within thecontext of the TOEFL program.
Method
The main sample contained a total of 155 foreign students enrolled inEnglish as a second language classes at the University of Florida or atthe University of Pennsylvania during the fall of 1978.
Eleven experimental item types were selected for inclusion in anexperimental test of oral English skills that was administered on tapewith the aid of a picture booklet. The item types included (a) autobio-graphical questions, (b) use of a pictured noun in a sentence, (c) use ofa pictured verb in a sentence, (d) reading aloud, (e) sentence repetition,(f) dehydrated sentences, (g) fill-in-the-blank, (h) telling a story basedon a sequence of pictures, (i) answering multiple questions based on a
single picture, (j) a simulated telephone conversation with a voice on atape, and (k) persuasive speech based on a sequence of pictures.
Parallel forms of the experimental test were given to 12 examinees,along with a long and short Foreign Service Institute (FSI) type oralproficiency interview and the three-part TOEFL. Based on the results, two
item types, persuasive speech and use of a pictured verb in a sentence,were eliminated and a new item type, sentence completion, was added to a
developmental edition of the test. Two forms of the test were constructed,each containing 97 items, and both forms were administered to the mainsample of 155 students. The subjects also took an FSI-type interview and
the three-part TOEFL. FSI raters indicated which of five ratings the
examinees received on the five basic criteria: pronounciation, grammar,
vocabulary, fluency, and comprehension. Items on the developmentaledition of the speaking test were scored for pronounciation, fluency, and
grammar.
A covariance matrix was developed relating all of the above vari-ables. This matrix was examined to determine (a) the correlation betweenthe total score on each form of the developmental edition of the speakingtest and the total score on the FSI and TOEFL, (b) the correlation betweeneach item type and the PSI and TOEFL part and total scores, and (c) the
?()

-65-
correlation between each item and the FSI and TOEFL part and total scores.A special item analysis program, SCALAR, iaentified the 48 items from eachform having the highest correlations with the total FSI score; also, acomparable analysis was performed using the total of TOEFL Section II(Structure and Written Expression) and Section III (Reading Comprehensionand Vocabulary) in place of the total score, since TOEFL Section I (Lis-tening Comprehension) was expected to correlate highly with speakingproficiency.
Results
Based on the correlational analyses, four item formats were selectedto form a 20-item prototype Test of Spoken English (TSE), which showed aninternal consistency reliability of .91. The item formats and scoringcriteria selected were (a) reading aloud (pronunciation and fluency); (b)sentence completion; (c) telling a story based on a picture sequence(pronunciation, grammar, and fluency); and (d) multiple questions based ona single picture (grammar and fluency). The prototype TSE had equalcorrelations (.68) with FSI ratings and with TOEFL Structure and WrittenExpression and TOEFL Reading Comprehension and Vocabulary. While onemight expect such a test to show higher correlations with the FSI inter-view than with TOEFL, the lower reliability (.74) of the FSI ratings mayhave helped reduce the correlation between the TSE and the FSI. Theaddition of the prototype TSE to the TOEFL scores caused the multiplecorrelation with FSI to increase to .73, thus increasing the predictableFSI variance by about 8 percent.
Conclusions
The final prototype T3E was presented to be considered for eventualoperational use in the TOEFL program. Subsequently, a modified version ofthe TSE form developed in this study was pilot-tested under actual opera-tional conditions at representative TOEFL test centers.

20. Clark, J. L. D., & Swinton, S. S. (1980). The Test of Spoken English
as a measure of communicative ability in Englishmedium instruc-
tional settings. (TOEFL Research Rep. No. 7; ETS Research Rep.
No. 80-33), Princeton, NJ: Educational Testing Service. (ERIC
Document Reproduction Service No. ED 218 960)
Purpose
The two principal objectives of this study were (a) to determine the
concurrent validity of the Test of Spoken English (TSE) in relation to the
Foreign Service Institute (FSI) oral proficiency interview, and (b) to
obtain criterion-related validity data on the relationship between TSE
scores and actual communicative effectiveness in classroom settings.
Method
For the concurrent validation analysis, the TSE and the FSI interview
were administered to 134 foreign teaching assistants at nine state univer-
sities. Relevant background data, such as length of residence in English-speaking countries and years of English study prior to and subsequent toarrival in the U.S., were collected. Scores on the three-part TOEFL,obtained within the preceding 12 months [presumably via International orSpecial Center administrations!, were available for 31 of these students.
The TSE yielded scores in four areas: pronunciation, grammar, fluency,
and overall comprehensibility. [The TSE is further defined in Summary No.
19, Clark & Swinton, 1979.] Correlations were computed among the TOEFLand TSE part and total scores and the FSI total score.
In the criterion-related validation phase, FSI and TSE scores of 60
foreign teaching assistants served as predictor variables in multipleregression analyses. Criterion variables were student ratings on a spe-cially designed questionnaire of the instructor's use of language in the
classroom and in other instructional contexts, and a standardized instruc-tor/course evaluation instrument completed by the students.
Results
For the original group of 134 subjects the correlation between theTSE and FSI total scores was .79. For the subset of 31 cases for which
TOEFL scores were available, the intercorrelations were as shown in Table
1.

-67 -
Table 1
TOEFL, TSE, and FSI Intercorrelations(N 31)
TOEFLLC
TOEFLS&WE
TOEFLRC&V
TOEFLTotal
TSEPron.
TSEGram.
TSEFlu.
TSEComp.
TOEFL LC8TOEFL SisWE8TOEFL RC&V8TOEFL TotalTSE Pron.TSE Gram.TSE Flu.TSE Comp.
FSI Total
.77
.67
.92
.68
.76
.65
.69
.71
.64
.91
.42
.54
.52
.46
.57
.85
.38
.56
.43
.36
.62
.56
.70
.60
.57
.71
.86
.92
.95
.77
.89
.88
.73
.93
.74 .76
aTOEFL LC Listening Comprehension; TOEFL S&WE Structure andWritten Expression; TOEFL RC6V ReadiLg Comprehension and Vocabulary.
The TSE scores correlated more highly with the FSI rating Oan withthe TOEFL scores. The TSE grammar score correlated more strongly with theTOEFL total (.70) than did the other TSE scores. The highest correlationsinvolving any individual TOEFL section were those among TOEFL ListeningComprehension, the four TSE scores, and the FSI total score. Thus, theTOEFL Listening Comprehension score showed a greater relationship to oralEnglish skills than did the other two section scores. The TSE scoresshowed higher correlations with the FSI total than did any TOEFL score.
The multiple regression analysis showed that both the TSE and the FSIscores served as good predictors of communicative proficiency as deter-mined by student ratings on the special questionnaire; these test scoresalso predicted more general aspects of teaching performance. The TSEscore correlated with proficiency in delivering classroom lectures (.60),understanding student questions (.52), answering questions (.53), andcommunication during office appointments (.54). The TSE score alsocorrelated (.68) with the degree to which the instructor's pronounciationinterfered with student understanding. To a lesser extent the TSE scorecorrelated with the instructor'r "overall teaching effectiveness" (r.29), and with other nonlinguistic variables, such as organization andplanning, interpersonal relations, assignments and workload, and evalua-tion procedures. While FSI scores slightly exceeded TSE scores as predic-tors, both the TSE ant: FSI scores showed appreciably higher correlationswith communicative effectiveness than did the background variables.

-68-
Conclusions
The high correlation between TSE and FSI scores indicates that the
TSE may be considered a reasonable alternative to the FSI interview when
it is not possible to carry out face-to-face testing. While the TSE
grammar score is closely associated with TOEFL scores, the TSE pronuncia-
tion and fluency scores appear to measure somewhat different aspects of
language proficiency thin those measured by TOEFL or by the TSE grammar
score.
71

21. Cowell, W. R. (1981, April). Applicability of a simplified three-parameter logistic model for equating tests. Paper presented at
the meeting of the American Educational Research Association,Los Angeles.
Purpose
This study examined differences in TOEFL scaled scores produced by
various methods used for equating TOEFL forms. The traditional linear
equating method was compared with three different equating methods based
on item response theory (IRT). For each model, equating was done based onboth large samples and small samples to determine the importance of sample
size in equating. Although data from the Secondary Level English Profi-ciency, or SLEP, test were also examined, this summary focuses on analysis
of the TOEFL data only.
Background
Each TOEFL is equated to previous tests, to ensure that a givenscaled score on one test is equivalent to the same scaled score on an-other. Until September 1978, TOEFL forms were equated by means of alinear equating model. Each test contained items from pretesting sections
of previous tests, and these common items formed a babis for transforming
scores on a given test to the scale used for previous tests. According to
this model, a linear relationship was assumed to exist between the number
correct and the scaled score. Since September 1978, equating methodsbased on the three-parameter model of IRT have been used as outlined byLord.' This model assumes that, for each item on a test, the probabil-ity that an examinee with a given ability level will answer the itemcorrectly is mathematically related to three parameters: (a) a measure ofitem discrimination, (b) a measure of item difficulty, and (c) the prob-ability that a very low ability examinee will answer that item correctly.Statistics for the entire test are a composite of statistics for the itemsmaking up that test.
A second possible equating model is the simplified IRT model, whichis the same as the three-parameter model, except that parameters "a" and"c" above are assigned constant values across all items, and only theitem-difficulty parameter is assumed to vary. A third possible model isthe Rasch one-parameter model, in which constant values are again assignedto parameters "a" and "c" (although not the same constants as in thesimplified IRT model), and only the item-difficulty parameter is assumedto vary.
'Lord, F. M. (1980). Applications of item response theory to practi-
cal testing problems. Hillsdale, NJ: Lawrence Erlbaum Associates.

-70 -
Method
The subjects were subsets of examinees who took TOEFL at an Inter-national or Special Center administration in September 1976, September
1977, and August 1978. Numbers of subjects in the large sample analysisranged from 2,069 to 3,172 examinees per test; Ns in the small sample
analysis ranged from 292 to 317 examinees per test.
Item calibration (i.e., derivation of IRT parameters for each item)and test equating were done separately for each of the three test sec-tions. Each section of the 1977 test form and the 1978 test form wereequated to the 1976 form, for both the large sample and the small sample,using each of four different methods: (a) the linear method, (b) thethree-parameter IRT method, (c) the simplified IRT method, and (d) theRasch one-parameter IRT method. The resulting scaled scores were thenexamined, for each item in the test, to determine the degree of corre-spondence in results obtained according to the different equating methods.
Results and Conclusions
The differences in results obtained according to the linear equatingand IRT equating models were relatively small over most of the score rangefor all three of the IRT equating models and for both the small and large
sample sizes. On the average, the scaled score for a given raw scorederived by these various methods differed by less than one point on theTOEFL scale. Thus, all of these equating methods evidently worked reason-ably well and produced comparable results.
The simplified IRT model and the Rasch one-parameter IRT modelproduced results more closely approximating those produced by the linearmodel than did the three-parameter model. This is due to the fact thatthe three-parameter model resulted in a somewhat more curvilinear functionrelating raw and scaled scores: raw scores below a certain amount yieldedslightly higher scaled scores, and raw scores above a certain amountyielded slightly lower scaled scores, than would be predicted by a linearrelationship. As a result, the standard deviations of scaled scores basedon the three-parameter model were about 6 percent smaller than those basedon the linear model.
Comparison between pairs of IRT models yielded differences aboutone-half the magnitude of the differences between the linear mode/ andeach of the IRT models. Also, differences due to variation in model wereabout twice as large as differences due to variation in sample size.Estimation of costs required to equate tests according to each modelshowed that a more substantial reduction in cost would be achieved by adecrease in sample size than by a change from the three-parameter to theone-parameter model.
,./
IC,

-71-
In conclusion, if the large-sample, three-parameter IRT approach now
in use were to be replaced in order to simplify the task of test equating,
the data suggest that it would be better to focus on reducing the samples;.le than on reducing the number of parameters in the model.

22. Cowell, W. R. (1982). Item-response-theory pre-equating in the TOEFLtesting program. In P. W. Holland & D. B. Rubin (Eds.), Test
equating (pp. 149-161). New York: Academic Press.
Purpose
This chapter describes the historical background of TOEFL testequating, the initial conversion to item-response-theory (IRT) equating,and the principal advantages of the use of IRT in determining scores ondifferent forms of TOEFL.
Background
A new form of TOEFL is given each month at test centers in 135countries. To ensure equivalent scores for persons of equal ability,regardless of the level of difficulty of the particular form of the testthey were administered or the level of English proficiency of those withwhom they took the test, each new form of TOEFL is equated to previousforms. A score is reported for each section on a scale ranging from 2r to
80. The total score equals ten-thirds times the sum of the scaled scoresfor the three sections. Prior to September 1978, equating was done byincluding in each new form a set of items from a previously equated form.Because the equating items had been used in a previous test, there was adanger that they might appear in commercial coaching materials or thatthey might be seen by test repeaters. In order to improve test securityand thus the accuracy of the equating process, it was decided to switch toIRT equating methods.
Method
In July 1977 a feasibility study was initiated. The first phaseinvolved the IRT equating of all TOEFL forms administered between Septem-ber 1976 and May 1977, plus three experimental forms. The items in theseforms and the items in several pretests were all calibrated to a commonscale using a three-parameter model of item performance. In the secondphase, new forms administered between September 1977 and August 1978 wereequated by both conventional (linear) and IRT methodology.
Results
Score conversion tables show that IRT equating produced scores thatwere nearly identical to those obtained by linear equating. The largestdifferences were typically about two points per section, except at the
75

-73--
chance-score range, where differences as large as four points may haveappeared. These differences cannot be considered error for either method,since there is no way to judge the superiority of one method over another.Differences were particularly small in the mid-scale range.
Conclusions
The fact that scores were nearly identical and that differences weresmallest in the mid-scale range, which is usually where the criticaldecision-making point is located, means that item-response-theory can beemployed operationally for TOEFL equating. The theory offers severaladvantages that make it attractive for this purpose. IRT equating infor-
mation can be obtained from different pretests that can be given torelatively small samples (1,000 to 2,000) located at the most secure testcenters. For tests consisting entirely of precalibrated items, equatingcan be done before the operational form of the test is administered,thereby reducing the number of operations to be performed during theperiod between test administration and score reporting. Finally, unlike
linear equating, IRT equating produces measurement error that is notcumulative over forms.

23. Darnell, D. K. (1970). Clozentropy: A procedure for testing Englishlanguage proficiency of foreign students. Speech Monographs,37, 36-46. Also printed as "The development of an Englishlanguage proficiency tcst of foreign students, using a clozen-tropy procedure." Final Report, U.S. Office of EducationProject No. 7-H-010, 1968. (ERIC Document Reproduction ServiceNo. ED 024 039)
Purpose
A procedure for obtaining scores on a cloze test was examined.Entitled "clozentropy," the procedure, in effect, measures the comparabil-ity of a foreign student's English with that of native speakers ofEnglish. For graduate and undergraduate students separately, clozentropyscores were compared with scores on. TOEFL, which served as a criterionmeasure of English proficiency.
Method
The subjects were 48 foreign students at the University of Colorado- -21 undergraduates, and 27 graduate students. Approximately half thesubjects in each group were engineering majors and half were nonengineer-ing majors. Also, 200 native speakers of English at the same universitywere given the clozentropy test (half undergraduate and half graduate and,within each group, half engineering majors and half nonengineering ma-jors). The samples were chosen at random, with supplementation fromvolunteer subjects.
The foreign-student sample was administered the five-part TOEFL in aspecial testing session at the University of Colorado. Within a monthafter the TOEFL administration, all subjects were administered the clozen-tropy test (all but four of the foreign students took the clozentropy testwithin a week after TOEFL, in one of two special group administrations).
The clozentropy procedure can be described as follows. As in thetypical cloze test, subjects (in both the foreign student sample and thenative speaker sample) read a passage from which words were systematicallyreplaced with blank spaces, and they sought to identify the words that hadbeen deleted. For the native English speakers, the frequencies of differ-ent responses to each blank were computed and, for each blank, an "H"value ("entropy") was computed, which essentially varied with the numberof alternative responses to that blank. Then, for every student, an "I"value was computed for each response, which reflected the rarity of thatresponse in the native speaker sample (i.e., a high I value indicated thatthe response was rare; a low value showed that the response was common).Finally, for each subject, a deviation score, H minus I, was computed foreach blank. The sum of a subject's deviation scores for all blanks

-75-
constituted that subject's clozentropy score. In effect, then, the higher
a subject's clozentropy score, the more the subject's responses conformed
with those of the native English speakers.
Four test passages were used in the study, each 500 words in length:
an easy and a difficult passage from engineering texts, and an easy and a
difficult passage from liberal arts texts. For each subject, a clozentropy
score was obtained for each of these four passages as well as a total
clozentropy score.
In addition to the clozentropy scores and scores on TOEFL (five part
scores and total), each subject's grade-point average (GPA) was obtained.
Results
Reliability coefficients for the foreign student sample, computed bya method based on analysis of variance, were .86 for both the clozentropy
test and TOEFL. Intercorrelations among scores for the four differentclozentropy passages ranged from .53 to .65, providing additional evidence
for the reliability of the clozentropy test.
Intercorrelations were computed among clozentropy scores, TOEFL
scores, and GPA for the foreign students. A relatively high correlation
of .84 was obtained between total clozentropy score and total TOEFL score
(.88 for graduate students alone, .78 for undergraduates alone). Correla-
tions between total clozentropy and the TOEFL subtests were all signifi-
cant (all above .61). Interestingly, the Listening Comprehension subtextof TOEFL correlated about as highly with the clozentropy score (.74) as it
did with the total TOEFL score (.75). GPA failed to correlate signifi-cantly with the clozentropy test or with any of the TOEFL subtests or
total TOEFL score.
Analyses of variance assessing main effects and interactions involv-ing seven different factors on the clozentropy scores were also computed.Because this portion of the study does not bear on TOEFL, results of theseanalyses will not be enumerated here, except to note that many variables,including the subject's level of English proficiency, the subject's majorfield, the context of the passage, and the difficulty of the passage, hada main effect or interaction effect on the clozentropy scores. It appearsto be Importaat, therefore, to consider the specialized needs of individu-
al students in testing language proficiency.
Conclusions
The relatively high reliability coefficients for both TOEFL and theclozentropy score provide support for the reliability of the clozentropy
score. The clozentropy battery took only half as long to administeras TOEFL, and further increases in reliability might be achieved byincreasing its length.

24. Dizney, H. (1965). Concurrent validity of the Test of English as aForeign Language for a group of foreign students at an American
university. Educational and Psychological Measurement, 25,1129-1131.
Purpose
This study was an early attempt to investigate the correlationalvalidity of TOEFL. At the time of the study, published information aboutTOEFL validity included only correlations with instructors' ratings oflanguage proficiency.
Method
The sample of students included 20 foreign students at Kent StateUniversity (19 males and one female) representing 15 countries. At thetime of testing, 13 subjects had been in the United States for less thanone month. Their ages ranged from 19 to 38, with a median of 23.5 years.
In September 1964 the subjects took the five-part TOEFL, the three-part Michigan Test of English Language Proficiency (MTELP), and theEnglish subtest of the American College Test (ACT). The MTELP is a testof English proficiency consisting of three sections: Grammar, Vocabulary,
and Reading Comprehension. [See Summary No. 1, Abadzi, 1976, for afurther description of the test.] The ACT English subtest is part of abattery of tests for American students applying to U.S. colleges anduniversities and taps knowledge of English usage. In recent research it
has shown a reliability of .84 and a correlation of .57 with grades infreshman English courses. In addition, the subjects were rank orderedwith respect to English language proficiency by the foreign studentadviser; this was done six weeks after the start of the fall quarter.
Results
The means and standard deviations for the tests were TOEFL: 538 and
106; MTELP (raw score): 79 and 18; ACT English (raw score): 31 and 14.Correlations among these tests were MTELP-TOEFL: .97; MTELP-ACT English:.65; TOEFL-ACT-English: .74. Rank-order correlations between Englishlanguage proficiency ratings and ranks on each standardized test wereas follows: MTELP: .78, TOEFL: .75, and ACT English: .62.
Conclusions
For this sample TOEFL and the MTELP were highly correlated (r w .97).Thus, use of both tests to assess English proficiency may be redundant.TOEFL accounted for almost 13 percent more variance on the ACT Englishsubtest than did the MTELP. The difference between TOEFL and MTELPcorrelations with the foreign student adviser's rankings of Englishlanguage proficiency was negligible.
82

77- B 1
25. Doherty, C., & Ilyin, D. (1981). Technical manual for ELSA: English
language skills assessment in a rrsding context. Rowley, MA:
Newbury House.
Purpose
This manual describes the development of a set of tests entitled.::.nglish Language Skills Assessment in a Reading Context (ELSA) and pro-vides statistics from several samples showing the reliabilities of the
testa ana correlatioes with other measures of English language profi-
t ciency, including TOEFL. The ELSA tests were designed to meet a placementneed for the more than :'.0,000 adults who enroll annually in English as asecond language (ESL) classes in adult schools in San Francisco.
Method
Data are reported for several different testing samples, drawn fromadult ESL programs in San Francisco and from intensive English programs atthe University of San Francisco and San Francisco State University.
The ELSA tests use a multiple-choice doze format. Five different
ELSA tests were constructed: two beginuleg tests, two intermediate tests,and oae advanced tes For the beginning and intermediate levels, onetest used a passage w h a conversation format (tests W.: and IC), andanother test used a passage with a narrative format (BN and IN). The
advanced test used only a narrative format (AN).
Esc', test was constructed by writing passages in which every seventhword elicited a specific aspict of structure or semantics; deletion ofthese words produced 3? bla.xs. Testing with several hundred studentsled to selection of the best 25 items (such that no more than 14 wordsappeared between blanks) as well as identification of frequent errors,which then served as diatractors in the final tests. The final versionof each test consisted of 25 items alid required about 30 minutes toadminister.
The ELSA tes - e compered with several other tests of Englishproficiency. One s test was laEFL [presumably the three-part version]administered through tne Internationa1/3peciel Center erograms. Another
was thr Comprehensive English Language Test for Speakers of English as asecond 4anguage (CELT). Two subtests of the CELT were used. The Structuresubtest consists of 75 multiple-choice Items in a reading format. The
Listening subtrst contains 50 items; for each !Am the subject listens toa script and responds to one of several printed alternatives. [For a
further description of the CELT, see Summary No. 41, Hosley & Meredith,
1976.] The Listening Comprehension Picture Test (RCPT) is a multiple-choice listening test in which the subject listens to orally presentedinformation, then hears a question and identifies the one picture of fivethat depicts the correct answer. The Michigan Test of talglish. Language
S3

-78-
Proficiency (MTELP) (Forms A, B and C) tests grammar, vocabulary, and
reading comprehension. [For a fuller description see Summary No. 1,
Abadzi, 1976.] In the Structure Tests for English Language (STEL) (inter-mediate forms), students read and respond to 50 multiple-choice items.
Data were collected on different occasions from approximately 10different samples of subjects between the fall of 1978 and the summer of
1980, for a total of several hundred subjects.
Results
The first results of interest concern reliabilities of the ELSA tests(KR-20 formula was used for beginning tests and KR-21 for other tests).The two beginning tests (BC and BN), for which data from over 600 subjectswere available, yielded reliabilities in the low 80s. The combination ofthe two beginning tests yielded a reliability of .92. Of the two inter-mediate tests, test IN yielded reliabilities of .79 and .80 in two sepa-rate samples (Ns 73 and 158, respectively). Test IC yielded reliabili-ties of .76, .80, and .82 in three separate samples (Ns 73, 212, and
115, respectively). Combination of the two intermediate tests yielded areliability of .88 in each of two samples (Ns 73 and 105, respectively).
The advanced test showed reliabilities of .80 and .83, respectively, whengiven to (a) a combination of adult center and intensive English classes(N 250), and (b) to a later sample of intensive English classes (N115). Reliabilities computed separately for each level of English lan-guage study tended to be somewhat lower, due to restriction of range.Combinations of tests generally yielded higher reliabilities than didsingle tests.
Correlations between the LCPT (25-item version) and the two ELSAbeginning tests were significant and moaerately high, ranging from .58to .61 (N over 400 students). The correlation between the two beginningELSA tests (BC and BN) was .82 (N 664).
Correlations between the ELSA intermediate tests and scores on theLCPT (33-item version) were significant and ranged from .53. to .58;correlations between the ELSA intermediate tests and the STEL were .79 to.82 (N 73 for both sets of correlations). The ELSA IC test correlated.73 with the MTELP and .83 with TOEFL (N 113). [The relations betweentest IN and the other tests are not reported.] The correlation betweenthe two intermediate ELSA tests (IC and IN) was .84. IN not Indicated.]
The advanced ELSA test (AN) correlated .80 with CEL1-Structure (N77), .56 with CELT-Listening (N 75), and .82 with the MTELP (N 113).
Correlations between the ELSA advanced test and TOEFL in two separatesamples were .73 and .84 (Ns 77 and 29, respectively).
8 4

-79-
Conclusions
Correlations between the ELSA tests and other tests of Englishproficiency were relatively high, attesting to the validity of the ELSAteats. The relatively high correlations between forms of the beginningtest suggest that these tests can be substituted for each other. The sameis true for the two forms of the intermediate test. Also, the correla-tions between the intermediate tests and the STEL (.79 and .82) were highenough to suggest that the intermediate ELSA tests, which are shorter,could be used in place of the STEL if testing time were limited. The
advanced test correlated highly enough with CELT-Structure (.80) tosubstitute for this measure; the same was not true, however, of CELT-Listening.
The correlations between the advanced test and TOEFL (.73 and .84 fortwo samples) are suggestive. Conclusions about the magnitude of relation-ship between these tests, however, must await research with largersamples.

-80- El, Fl, G2
26. Dunbar, S. B. (1982). Construct validity and the internal structure
of a foreqp language test for fT2Tulmq,22,212EuiltEaaa.Paper presented at the annual meeting of the American Education-
al Research Association, New York.
Purpose
Confirmatory factor analysis was used to examine the factor structure
of TOEFL for each of seven language groups. The objectives were todetermine (a) whether performance on TOEFL reflects the content specifica-
tions of the test, as shown in the test's factor structure, and (b)
whether there are differences among language groups in this respect.
Method
The subjects were examinees taking the September 1976 administration
of the three-part TOEFL. There were approximately 600 to 1,000 subjects
from each of the following language groups: African, Arabic, Chinese
(non-Taiwanese), Farsi, Germanic, Japanese, and Spanish. The African
languages consisted of Efik, Fanti, Ibo, and Yoruba; the Germanic consist-'
ed of Danish, Dutch, German, and Swedish. (The sample was the same as that
used in the study by Swinton and Powers, 1980.) A reference sample of
close to 1,000 subjects drawn from all language groups in the test admin-
istration sample was also included in the study.
For the present analyses the test was scored in the following manner:
for Listening Comprehension, seven different composite scores werederived, two or three composite scores for each of the three different
subtypes of items used in this section, according to TOEFL item specifica-tions; for Structure and Written Expression, four different composite
scores were computed, one for each of the four item subtypes; and forReading Comprehension and Vocabulary, seven composite scores, three or
four fn: eiU of the two item subtypes.
Results and Conclusions
The language groups differed from each other in total TOEFL scores,
with the Germanic group differing most dramatically from the rest, showing
the highest mean score and lowest variability in scores.
Confirmatory factor analyses were conducted. Estimates of factor
loadings were obtained for three hypothetical models: (a) a null model,
assuming complete independence of subscores; (b) a model with one general
factor; and (c) a model with four factors--a general factor (Yactor
I) plus one factor corresponding to each of the three TOEFL subtests

-8I-
(Factors II, III, and IV). Goodness of fit analyses showed that the modelwith one general factor accounted for the subjects' performance much moreaccurately than did the null model, and that the four-factor model provid-ed an even better fit to the data. (Note that the issue regarding thetotal number of factors needed to account for the data is not addressed
with confirmatory factor anaysis.)
In the analysis involving four factors, intercorrelations among thefour factors were examined for each of the language groups. For theAfrican group, intercorrelations among Factors II, III, and IV wererelatively high, particularly the correlation of Factor IV with Factor II(.83) and Factor III (.92). For the Arabic, Chinese, and Germanic groups,Factor III showed moderate to high correlations (.48 to .82) with FactorsII and IV. These data suggest that, for different language groups,different numbers of factors may be required to account for the data.
The issue of language group differences in factor structure wasaddressed in other analyses as well. Targeted rotations of factor patternmatrices were derived to allow comparison of the factor structure for eachlanguage group with that for the reference sample. The resulting "con-gruence coefficients" in comparisons with the reference sample wereuniformly high for Factor I, the general factor (coefficients ranged from.991 to .998, wich 1.000 as the maximum possible coefficient), and forFactor II, the factor corresponding to the Listening Comprehension section(coefficients ranging from .969 to .998). Flr Factor III (which corre-sponded to the Structure and Written Expression section), congruencecoefficients were high for three language groups, Arabic, Chinese andGermanic (.959 to .995), but not nearly so high for the Japanese (.615),African (.859), Spanish (.881), and Farsi (.906) groups. This result
calls intc question the assumption of equivalence of Factor III acrosslanguag'. groups.
For Factor IV (which corresponded to the Reading Comprehension andVocabulary section), all congruence coefficients were above .985 exceptthose for the Spanish group (.870) and the African group (.932). Thus,
for Factor IV, congruence with the reference sample seemed generally high,although sole language differences involving this factor were evident.
Further analyses helped to determine the role and interpretation ofthe various factors. The general factor dominated the factor structtcefor all language groups. After the general factor was partialed out, theListening Comprehension items supported a relatively large factor (FactorII); the seven different. composite scores (types of content) in theListening Comprehension section appeared to be about equal to each otherin their degree of loading on this factor. Factor III was a much lessprominent factor, as loadings of the composite scores on this factor wereas small as one-eighth the size of their loading on the general factor; aswith Listening Comprehension, the different composite scores in thestructure and Written Expression section appeared to be about equal intheir degree of loading on Factor III. For Factor IV, the largest load-ings were for vocabulary item types, as the loadings of reading comprehen-sion item types were very small (the reading item types, instead, loaded

-82-
heavily on the general factor). Thus, Factor IV appeared to be basically
a vocabulary factor.
In general, the data show the dominance of the general factor and, at
the same time, show the importance of factors associated with different
sections of the test. Tte data also provide moderate support for the
notion that the factor structure of TOEFL is similar across languagegroups. This similarity appears to be due primarily to the general factorand, to a lesser extent, Factors II and IV. Although there were somelanguage group differences involving Factor III, this factor itself wasquite small in relation to the general factor, thus tending to lessen the
impact of any group differences. Despite these observations, evidence ofat least some differences among language groups in number and nature of
factors suggests the possibility, wLich deserves further investigation,that TOEFL subteet scores may have differential validity for differentlanguage groups.

-83- G2, 12
27. Educational Testing Service. (1973). Manual for TOEFL score recipi-
ents. Princeton, NJ: Author.
Purpose
This document is an earlier version of the TOEFL Test and ScoreManual (Educational Testing Service, 1981) summarized elsewhere in thiscollection. This 1973 edition is the most recent manual that deals withthe five-part TOEFL and is summarized here primarily to present statisti-cal data for that version of the test. In most other respects the twoeditions of the manual are similar, so the narrative in this edition issummarized only where it differs from that presented in the 1981 version.
Discussion
In 1973 TOEFL could be taken at International, Institutional, and"walk-in" administrations. In the International Testing Program, TOEFLwas administered on four test dates per year. The Institutional TestingProgram was offered only within the United States and Canada. "Walk-in"
test centers were established at six locations in the United States atwhich TOEFL was administered, usually on a weekly basis, as a service toinstitutions with an immediate need for TOEFL scores of applicantscurrently in the United States.
Statistical characteristics of the test were examined for all formsof TOEFL administered from October 1966 through June 1971. Mean KR-20reliabilities for the five sections and total were Listening Comprehen-sion, .90; English Structure, .86; Vocabulary, .89; Reading Comprehension,.84; Writing Ability, .86; and total score, .97. Mean standard errors ofmeasurement for he five sections and total, respectively, were 3.0, 2.9,2.8, 3.3, 2.9, and 14.77. This last figure indicates that any two exam-inees' TOEFL scores should not be interpreted to represent differentlevels of proficiency unless the difference between their scores wasgreater than about 30 points [see Summary No. 28, Educational TestingService, 1981, for explanation].
Intercorrelations among subtexts, averaged over the forms mentionedabove, were as shown in Table 1.

-84-
Table 1
Intercorrelations among TOEFL Subtests
TOEFL Subtest LC ES V RC
Listening Comprehension (LC)English Structure (ES) .64
. Vocabulary (V) .56 .72
Reading Comprehension (RC) .65 .67 .69
Writing Ability (WA) .60 .78 .74 .72
Tables are also presented in the manual showing the percentile ranks
corresponding to various TOEFL scores, broken down by intended major
field. The data are based on the 215,486 'xaminees seeking admission to
U.S. colleges and universities who took AJEFL from October 1966 through
June 1971. The data are tabulated separately for (a) graduate candidates,
(b) undergraduate ( .ndidates, and (c) all candidate-a, for total TOEFL
score and for each section. Also, TOEFL score means are presented for
each native language and each native country represented.
The use of TlEFL scores is discussed, and a table is presented
showing data from a 1969 survey of institutions regar,!ing the role of
TOEFL in their admissions practices. Presented separately for institu-
tions with and without special ESL courses, and separately for undergradu-
ate and graduate applicants, are the numbers of institutions for whom the
lowest acceptable score ranges for admission of candidates were (a) below
400, (b) between 400 and 449, and so forth. Also, a composite of the
admissions policies of two U.S. universities with large numbers of foreign
students is provided, which shows the kinds of decisions associated with
each of several ranges of total TOEFL scores. Decision possibilities
include admission with or without restrictions depending on the students'
patterns of TOEFL section scores, their educational levels, and, forgraduate students, their intended major fields.
In other respects, the information presented in the manual is gener-
ally similar to that presented in the 1901 version, including a b'ief
overview cf TOEFL's early history, a description of the test, illustration
of the score report, and a discussion of guidelines for proper use of
TOEFL scores.
90

-85- G1, 12
28. Educational Testing Service. (1981). TOEFL test and score manual.Princeton, NJ: Author.
Purpose
This manual presents a description of TOEFL, explains the operationof the TOEFL program, and provides information and statistics relevant tointerpretation of TOEFL scores.
Discussion
An overview of the TOEFL program is offered first, with a briefaccount of the history of TOEFL, beginning with its initial developmentin 1963. The three subtexts (sections) of the current TOEFL are de-scribed, and the process of constructing test questions is briefly dis-cussed. The procedures for reporting test results are outlined with anillustration of the TOEFL score report and an explanation of the methodsfor deriving section scores and combining section scores into totalscores. [See Introduction for a description of the three-part TOEFL andfor reference to summaries detailing TOEFL's history.]
The four major TOEFL testing programs are described. These includethe International and Special Center testing programs, each of whichprovides test administrations (typically every other month) for personsseeking admission to institutions In the United States or Canada orseeking professional certification. Also included are the InstitutionalTesting Program and the Overseas Institutional Testing Program, whichprovide previously used TOEFL forms to institutions for testing their ownstudents, principally for placement in English courses or determining theneed for additional English study.
In a discussion of the use of TOEFL scores, the following guidelinesare presented: (a) base the evaluation of an applicant on all availablerelevant information; (b) do not use rigid "cut-off" scores in assessingan applicant's TOEFL performance; (c) consider scores on the three testsections as well as the total scores; (d) consider the kinds and levels ofEnglish proficiency required in different fields and levels of study andthe admitting institution's capacity to provide English language training;(e) consider TOEFL scores in interpreting an applicant's performance onother standardized tests; (f) do not use TOEFL scores for predictingacademic performance; and (e) gather information about the validity ofTOFFL score requirements at the admitting institution.
Results of a'1980 survey of institutions regarding their use of TOEFLscores in admissions decisions are provided. Data from 386 respondents(principally four-year undergraduate institutions and graduate andprofessional schools) show the kinds of TOEFL score ranges considered
91

-86-
acceptable for making various decisions, including (a) admit with no
restrictions, (b) admit on part-time basis with supplementary English
instruction, and (c) refer to full-time English program.
Data for a reference group (N - 473,944) of examinees taking TOEFL
between September 1978 and August l980 are presented. Mean scores were
Listening Comprehension, 51.5 (SD = 6.9); Structure and Written Expres-
sion, 48.6 (SD = 7.8); Reading Comprehension and Vocabulary, 49.4 (SD =
7.2); and total score, 499 (SD - 67). Percentiles corresponding to
various scores are provided, and breakdowns are given by planned level of
study (or licensure) and by examinees' native language and native country
or region.
Statistical characteristics of the test are provided for the seven
forms of the test administered between February 1980 and August 1980. [N
not indicated.) The data show the difficulty levels of these forms to be
appropriate, as the average raw score per section ranged from 54 to 69
percent correct (62.5 percent provides the best measurement). (Note that
differences among forms are corrected in computing the scaled scores
reported to students and institutions.) Speed was apparently not a major
factor, as the data met the conditions used by Educational Testing Service
to determine adequacy of time allowed, namely, (a) 80 percent of examinees
should finish nearly every question in each section, and (b) three-fourths
of the questi.ns in a section should be completed by nearly all examinees.
Reliabilities (KR-20) for the seven forms ranged from .86 to .89 for
Listening Comprehension, .81 to .87 for Structure and Written Expression,
.86 to .90 for Reading Comprehension and Vocabulary, and .93 to .95 for
total score. Standard errors of measurement, averaged across forms, were
2.2 for Listening Comprehension, 2.9 for Structure and Written Expression,
2.5 for Reading Comprehension and Vocabulary, and 14.6 for total score.
The last figure shows that an examinee's "true score" (i.e., hypothetical
score that would be achieved if there were no errors of measurement) is
within 14.6 points of the observed score for two-thirds of the examinees,
and double this figure, or about 29 points, for 95 percent of the examin-
ees. Thus, two examinees' scores cannot be regarded as representing
different levels of proficiency unless there is a difference of at least
29 points between them.
Averaged over the seven forms, Listening Comprehension correlated .70
with Structure and Written Expression and .68 with Reading Comprehension
and Vocabulary; the latter two subtests correlated .77 with each other.
Thus, there appears to be a reasonably strong relationship among skills
tapped by the different sections, but the section scores still provide
some unique information.
The question of validity is considered, with reference to several
studies summarized in this collection as well as some unpublished data.
In general, the studies examined suggest that (a) TOEFL correlates rela-
tively highly with other standardized measures of English proficiency; (b)
relevant sections of TOEFL correlate reasonably highly with direct mea-
sures of writing ability; (c) TOEFL discriminates effectively among
92

-87--
foreign students but not among native speakers of English; and (d) thediscrimination power of standardized aptitude tests is greatest forstudents who do not have low TOEFL scores.
Brief additional sections of the manual discuss procedures at TOEFLtest centers, describe other tests developed by the TOEFL program, andlist various TOEFL publications, order forms, and research reports.

-88- Bi, C2, C3
29. Flahive, D. E. (1980). Separating the 5. factor from reading compre-
hension. In J. W. Oiler, Jr., & K. Perkins (Eds.), Research in
language testing. Rowley, MA: Newbury House.
Purpose
Two questions of interest in this study were: What is the role of
intelligence in language comprehension? and, To what extent is reading
comprehension associated with intelligence? Information relevant to these
questions was obtained by examining the interrelationships among a nonver-
bal IQ test, TOEFL, and three reading tests.
Method
The subjects were 20 students, representing seven different native
languages, in a semi-!.tensive English class. The subjects' TOEFL scores
averaged 509 and range. from 437 to 568.
Five tests were administered within a one-week period. The Raven's
Progressive Matrices Test (Standard Form), a measure of nonverbal intelli-
gence, requires the subject to examine a pattern that has a portionmissing and to choose, from among eight alternatives, the one that best
completes the pattern. The five-part TOEFL was administered; only the
total score was used in this study. The first of three reading tests was
the McGraw-Hill Basic Skills System Reading Test. It consists Gx 10
passages, five of approximately 250 words each, and five of approximately75 words each, followed by 30 multiple-choice questions. This test
measures the subject's ability to make inferences, to identify main ideas
and supporting points, and to discover organizational patterns. The
second reading test, the Perkins-Yorio test, contains 50 items; in each
item the subject reads a sentence and then chooses, from among four
alternatives, the sentence that best paraphrases the target sentence. The
third reading task was a cloze test that contains a passage of approxi-
mately 400 words from an introductory economics text. Every seventh
word has been deleted, to yield a total of 50 blanks, and, for each blank,
the subject is required to determine the missing word. The appropriate-
word scoring method was used; i.e., suitable substitutes for each deleted
word were accepted as correct.
Results and Conclusions
The mean score on the Raven's test was just above the 75th percentile
of the norming group for this test, suggesting that the subjects were
above average in nonverbal intelligence. Performance on the McGraw-Hill
94

-89-
test ranged from the 9th to the 85th percentile compared to a referencegroup of college freshmen and sophomores, indicating a wide range ofproficiency; consistent with this is the wide range of TOEFL scoresreported above. Perkin-Yorio scores were only slightly lower than thoseof a reference group of college freshmen.
Table 1 presents the intercorrelations among measures.
Table 1
Intercorrelations among Tests Used in the Study
Raven'sTest TOEFL
McGraw-Hill Perkins -YorioTest Test
Raven's TestTOEFL
McGraw-Hill TestPerkins-Yorio TestCloze Test
.61
.84
.68
.61
.59
.84
.75
.67
.65 .62
The relatively high correlations among most of these tests are notsurprising, since most of the tests measure reading and/or languageproficiency. However, the high correlation between the Raven's andMcGraw-Hill tests is unexpected, since the former Is a measure of nonver-bal intelligence and would not be expected to be a strong predictor of
,reading performance. Single- and multiple-regression analyses showed thatadding TOEFL to the Raven's teat significantly improved prediction ofscores on the Perkins-Yorio and cloze tests but not scores on the McGraw -Hill test; this result again reflects the strong relationship between theRaven's test and the McGraw-Hill multiplechoice reading test.
In general, the high correlations among tests observed here suggeststhat intelligence is a major component of performance on reading subtestsin widely used measures of nonnative language skills.

-90- B6
30. Gaies, S. J. (1976, May). Sentence-combinin : A techni ue forassessing proficiency !n a secon language. Paper presents at
the Conference on Perspectives on Language, University of
Louisville, Louisville, KY. (ERIC Document Reproduction Service
No. ED 130 512)
Purpose
Indirect measures such as those included in TOUL measure theability to recognize but not produce syntactically correct sentences, and
written compositions directly measure a combination of many aspects of
writing. The present study assessed the effectiveness of a rewriting task
as a direct measure of a specific component of students' writing ability:
syntactic control. Performance on the rewriting task was examined in
relation to performance on selected TOEFL subtests for learners of English
as a second language.
Method
The study included a total of 41 subjects--16 native speakers of
English in graduate school at Indiana University, five highly proficient
nonnative speakers in graduate school, and, in the principal sample, 20
nonnative speakers of English in intensive English language classes.
The subjec,s were give the rewriting task developed by O'Donnell and
described by Hunt (1970).A The subjects were given a passage consistingof many very short sentences, and they were asked to rewrite the passage
by combining sentences, changing word order, and eliminating redundancy.
Three scores were derived from this task, reflecting syntactic
maturity of the subjects' rewritten passages: (a) words per clause, (b)
clauses per T-unit, and (c) words per T-unit (which combines the first two
scores). The T-unit is defined as "one main clause plus any subordinate
clause or nonclausal structure that is attached to or embedded in it"
(Hunt, 1970, p. 4). The subjects' scores on the five-part TOEFL were also
available iprt3umably from International administratir'nsj.
Results and Conclusions
The native speakers in this study performed similarly to the Called
adults in Hunt's study, and the five proficient nonnative speakers here
'Hunt, K. W. (1970). Syntactic maturity in school children and
adults. Monographs of the Society for Research in Child Development, 35,
(Serial No.7Tir."-
96

-91-
performed at an evv.. higher level. The targft sample of 20 nonnativespeakers, however, showed an average level of syntactic complexity compa-rable to that of the seventh graders in Hunt's study (although a. widerange of scores was observed here). The average number of nerds perclause for these nonnative speakers was 6.25 (range: 4.59 to 8.57);clauses per T-unit, 1.27 (range: 1.00 to 1.67); and words per T-unit, 7.96(range: 4.59 to 12.2?).
Spearman rank correlations for the. 20 nonnative speakers were comput-ed among the three rewriting scores, TOEFL total, and two TOEFL subtesta,English Structure and Writing Ability. Low correlations were observedbetween TOEFL English Structure and rewriting scores (ranging from .01 to.32). This result suggests that the ability to recognize correct gram-matical structure is not always accompanied by proficiency in writing, andthat active and passive skills in grammar are not necessarily related.Correlations involving TOEFL Writing Ability were .49 to .57, and correla-tions involving TOEFL total were .23'to .55.
Definitive judgments of the rewriting task's effectiveness cannotbe made from this study, and later research should (a) look into refine-ments in the scoring method, (b) examine performance with additionalstimulus materials, and (c) examine the degree to which the rewriting taskcorrelates with free writing samples.

31. Gharavi, E. (1977). Admission of foreign graduate students: An
analysis of judgments by selected faculty and administrators at
North Texas State University (Doctoral dissertation, North
Texas State University, 1977). Dissertation Abstracts Inter-
nationpl, 38, 1148A. (University Microfilms No. 77-19, 668)
Purpose
This study sought to determine,,by use of the Judgment Analysis (JAN)
technique, the admissions policies of faculty and administrators at North
Texas State University for foreign graduate students.
Method
The subjects were h4 male Iranian graduate students randomly selected
from among all 123 Iranian graduate students enrolled at North Texas State
University during the spring semester of 1976. For each subject, data on
the following variables were obtained from the graduate admissions office:
age, marital status, school last attended, degrees held, years of English
study, grade - point average (GPA) in English courses, score on the five-
part TOEFL [presumably obtained In an International administration],monthly income, Graduate Record Fxaminations (GRE) Aptitude Te-t verbal
score (GRE-V), GRE quantitative sc,..)re (GRE-01), GRE total score, credit
hours attempted during the first semester of enrollment, credit hours
completed, cumulative first-semester CPA, and major field. [The GRE
Aptitude Test is described briefly in Summary No. 4, American Association
..., 1971.] A profil! data sheet was constructed for each subject that
included information on all of the above variables.
Twenty-eight judges (eight members of the central administration and
20 departmental graduate advisers) examined the profile data sheets and
rated each subject on a five-point scale: 1 poor, 2 below average, 3
average, 4 above average, and 5 s outstanding. Each judge usedwhatevr information in the profile he or she thought most useful to judge
the quality of the studevt, essentially simulating the type of rating that
might be made in rendering an admissions decision [except that certain
information used here, such as first-semester GPA, typically would not be
available at the time of an admissions decision]. These ratings were
analyzed using JAN, with the objective of determining which variables were
commonly used by the judges, and how the variables were weighted, to
assign ratings. In easerce, JAN analyzes the predictor equation used by
each judge--i.e., the equation predicting the rating from the variables
listed above--and then examines the consistency of the predictor equations
across judges. A stepwise multiple regression analysis was also conducted
to determine the effect of each predictor variable on the ftedictiveefficiency of the full regression model used in the JAN procedure.
98

-93-
Results
Statistical analysis of the different policies (i.e., predictionequations) used by the 28 judges showed that the policies of 20 of thejudges could be classified into seven different types of policy, with eachof the remaining eight judges .using a policy unique to the individual.Thus, although there was some consistency in the manner in which thejudges made their ratings, the judges did not use a single policy forjudging the subjects' qualifications. The strongest predictor variables(TC:XL, GRE-V, GRE-Q, GRE total, and first-semester GPA) showed highpositive correlations with the judges' ratings. [Correlations withindividual policies are given. However, correlations between the predictorvariables and the ratings assigned by the entire group of 28 judges arenot.] Monthly income in U.S. dollars was negatively correlated with thejudges' ratings. The most frequently considered variable was the TOEFLscore, which contributed significantly to the prediction equation for eachof the seven types of policy mentioned above (i.e., those associated withmore than one judge each).
JAN was found to be reliable in identifying and analyzing ratingadmission policies. Also,. JAN showed that by attempting to group alljudges into one judgmental policy, the predictive efficiency of the systemdropped dramatically from .76 to .32, a 44 percent loss in predictiveefficiency.
Conclusions
It appears that, for the sample studied, (a) there was no singleadmissions policy for foreign graduate students; (b) while individualjudges were reliable in their ratings, policies varied across judges andgroups of judges; and (c) the most salient variables considered in theadmissions process for foreign graduate applicants were the TOEFL score,GRE-V, GREQ, GRE total, and first-semester GRA. It is suggested that infuture studies judges be restricted to rating only applicants to their owndepartments, rather than all applicants.

32. Gradman, H. L., & Spolsky, B. (1975). Reduced redundancy testing: Aprogress report. In R. L. Jones & B. Spolsky (Eds.),language proficiency. Washington, DC: Center for AppliedLinguistics.
Purpose
This paper summarizes the results of several studies involving thenoise test, a form of dictation test in which white noise is added to thestimulus message. Of the research discussed in the paper, an experimentexamining the relation of the noise test to TOEFL is emphasized in thissummary.
Background
The rationale underlying the noise test Is that a decrease in redun-dancy of the message in a dictation test, such as that produced by back-ground noise, should result in a greater increase in the difficulty of thedictation test for a nonnative English speaker than for a native Englishspeaker. Thus, differences between these groups should be accentuated,allowing greater precision of measurement.
The original work with the noise test consipted of several experi-ments designed to develop the most effective test. The effects producedby varying the specific sentences used, the signal to noise ratio, andother factors were examined. The final ver,,ton of the test correlated .66with both an aural zomprehension test and an objective paper-and-penciltest, and .51 with an essay test. Other investigators have observedcorrelations in the .50s between the noise test and other [unspecified]measures of English proficiency.
Method
*
In the experiment involving TOEFL, the subjects were 26 SaudiArabian students in a special English training program at Indiana Univer-sity. The students were all given the noise test, the f;ve-part TOEFL,the Ilyin Oral Interview, and the Grabal Oral Interview.
1 Spolsky, B., Sigurd, B., Sako, M., Walker, E., & Artetburn, C.(1968). Preliminary studies in the development of techniques for testing
overall second language proficiency. Language Learning, 18, Special IssueNo. 3, 79-101.
10

-95-
The noise test used here was a multiple-choice version in which thesubjects were given five alternatives and told to choose the one that moatclosely approximated the sentence that was presented on tape with accom-panying white noise. The 50 sentences developed in the original workcited above were used. In the Ilyin Oral Interview, the subject is shownpictures and asked specific qUestions about them. The Grabal Oral Inter-view is a test of free conversation; the subject's responses are rated ona nine-point scale for 10 categories by two separate judges.
Results and Conclusions
The noise test correlated .75 with total TOEFL score, which washigher than its correlation with any other test or any TOEFL subtest. Allcorrelations involving the noise test were above .60, except the correla-tions with English Structure (.44) and Writing Ability (.33). Unexpect-edly, the noise test correlated .73 with TOEFL Vocabulary and .68 withReading Comprehension.
The Grabal Oral Interview correlated .73 with TOEFL total. Ofcorrelations reported between this measure and the TOEFL subtests, thecorrelation with Vocabulary was .71, but that with Writing Ability wasonly .17, and that with Reading Comprehension was .38. The correlationbetween the Ilyin Oral Interview and TOEFL was .54.
Other reported results include a correlation of between the noisetest and the Ilyin Oral Interview and a correlati., of .59 between theIlyin and Grabal Oral Interviews. [Note that, as an integrative paper,this report is not designed to present all possible correlations.]
The data indicate that the noise test was somewhat more highlyrelated to a discrete item test, TOEFL, than to either of the oral inter-views, which are presumably more functionally oriented. This may be duepartly to the fact that the noise test used here was a multiple-choicetype, so that it was, in effect, a cross between a functional test and adiscrete item test. In general, the results suggest that the noise restfunctioned well, providing a type of data that was not provided by thesomewhat lese structured interviews.
The data from this experiment are generally in line with the resultsobtained in another study involving 25 Saudi Arabian students administeredthe noise test, the Grabal Oral Interview, and the TOEFL. In that studythe noise test correlated .66 with TOEFL total, .75 with TOEFL ListeningComprehension, and..79 with the Gtabal Oral Interview.
Additional Discussion
Results from subsequent research on the noise test not involvingTOEFL are also discussed. In one study, both the multiple-choice and
101.

-96-
original dictation version of the noise test were administered to 17
native speakers of English and 17 nonnative speakers. For each test, the
top scores were earned by native speakers and the bottom scores by nonna-tive speakers, showing that the test effectively discriminates betweenthese two groups. The two forms of the tzt correlated .89 for thenonnative speakers, indicating that both forms tend to measure the samething. In an additionsl study with 71 nonnative rnglish speakers, the
standard (non-multiple-choice) form of the test correlated .56 with the
Indiana University placement examination, a test of English proficiency
with several subtests.
In general, the data show that the noise test clearly separatesnative from nonnative speakers; it correlates relatively well with othermeasures of language proficiency; and it discriminates well between weak
and strong nonnative English speakers. Among the test's advantages is itsease of administration and scoring.
102

33. Gue, L. R., & Roldaway, E. A. (1973). English proficiency tests aspredictors of success in graduate studies in education. Langurage Learning, 23, 89-103.
Purpose
This research studied the validity of TOEFL scores and interviews aspredictors of grade-point average (GPA) among a group of Thai graduatestudents in education. Gain in TOEFL scores as a result of participationin an intensive English language program was also assessed.
Method
The subjects were 123 Thai educators participating in 1967 through1970 as graduate students in a one-year program in education at theUniversity of Alberta. The areas of the subjects' specialization wereadministration, supervision, academic curriculum, industrial arts, andguidance and counseling. The subjects ranged in age from 25 to 56 years;79 were males and 44 were females.
The subjects were administered the five-part TOEFL twice. Thefirst administration was in late June or early July after arrival at theUniversity of Alberta; this administration is here termed the "summerTOEFL." Three months later the subjects were administered TOEFL again;this administration is termed the "fall TOEFL." In the interveningperiod, the subjects participated in an intensive English language pro-gram. For each subject, the GPA wus computed at the end of the one-yeareducational program. Interview scores were also collected by Canadianinterviewers in Thailand prior to selection of the students for admissionto the program in 1967 and 1968. The 1967 panel ratings were given as oneglobal score, while 1968 panel ratings were subdivided into scores labeled"language fluency" and "potential for the Alberta program."
Results
Intercorrelations among TOEFL subtext scores were computed, withsubjects pooled across years. Correlations among subscores ranged from.62 to .82; all of these correlations were significant at the .01 level.The correlations within each of the years showed more variation, theextremes ranging from .37 to .89. For data from each of the separateyears, the highest correlations were between English Structure and WritingAbility (r > .70) and between Vocabulary and Writing Ability (r > .65). A
103
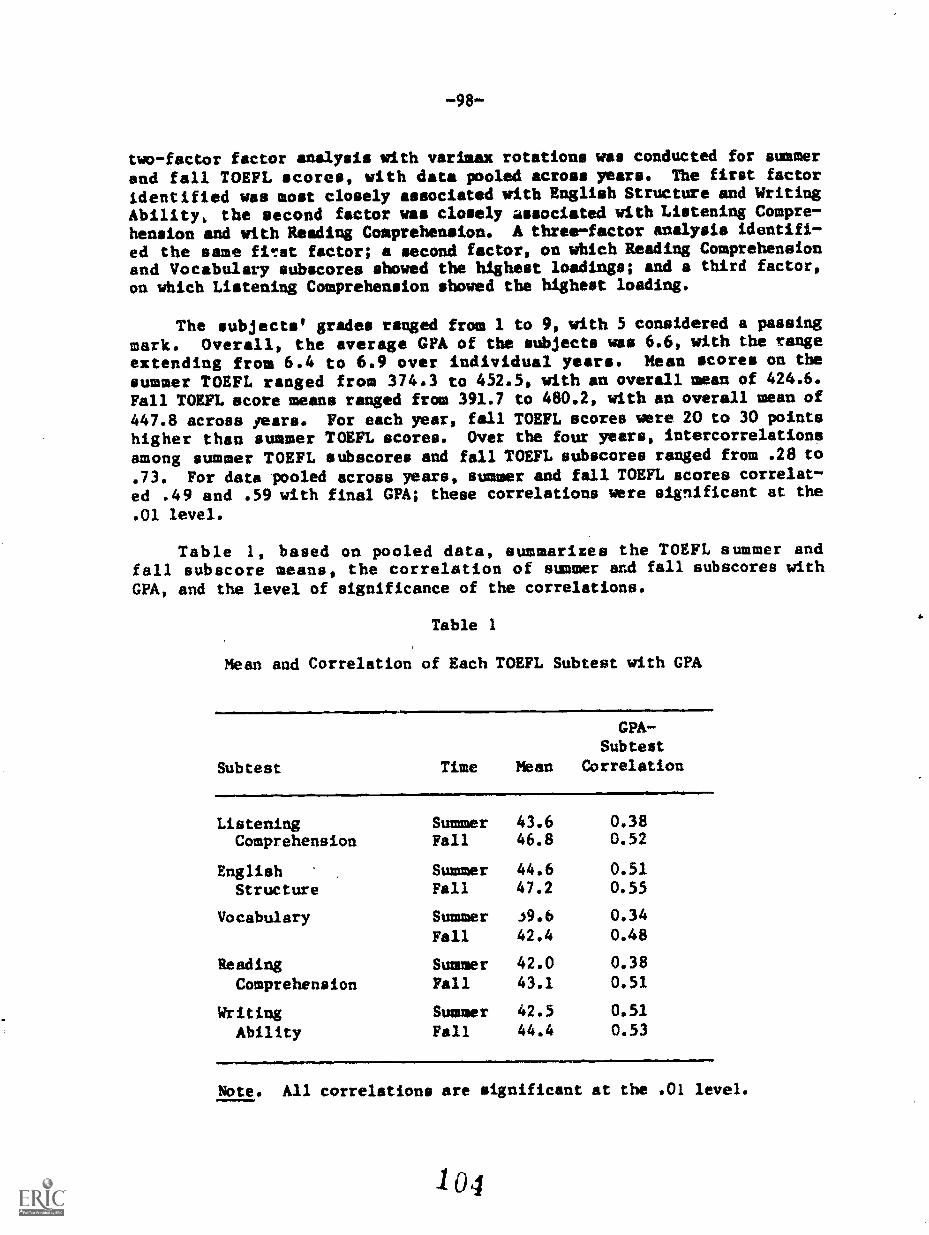
-98-
two-factor factor analysis with varlaax rotations was conducted for summerand fall TOEFL scores, with data pooled across years. The first factor
identified was most closely associated with English Structure and WritingAbility, the second factor was closely associated with Listening Compre-hension and with Reading Comprehension. A three-factor analysis identifi-
ed the same first factor; a second factor, on which Reading Comprehensionand Vocabulary subscores showed the highest loadings; and a third factor,on which Listening Comprehension showed the highest loading.
The subjects' grades ranged from 1 to 9, with 5 considered a passingmark. Overall, the average GPA of the subjects was 6.6, with the rangeextending from 6.4 to 6.9 over individual years. Mean scores on thesummer TOEFL ranged from 374.3 to 452.5, with an overall mean of 424.6.
Fall TOEFL score means ranged from 391.7 to 480.2, with an overall mean of
447.8 across fears. For each year, fall TOEFL scores were 20 to 30 pointshigher than summer TOEFL scores. Over the four years, intercorrelationsamong summer TOEFL subscores and fall TOEFL subscores ranged from .28 to
.73. For data pooled across years, summer and fall TOEFL scores correlat-
ed .49 and .59 with final GPA; these correlations were significant at the
.01 level.
Table 1, based on pooled data, summarizes the TOEFL summer andfall subscore means, the correlation of sunnier and fall subscores withGPA, and the level of significance of the correlations.
Table 1
Mean and Correlation of Each TOEFL Subtest with GPA
Subtest Time Mean
CPA-Subtest
Correlation
Listening Summer 43.6 0.38Comprehension Fall 46.8 0.52
English Summer 44.6 0.51
Structure Fall 47.2 0.55
Vocabulary Summer 39.6 0.34
Fall 42.4 0.48
Reading Sumner 42.0 0.38
Comprehension Fall 43.1 0.51
Writing Sumner 42.5 0.51
Ability Fall 44.4 0.53
Note. All correlations are significant at the .01 level.
104

-99-
Stepwise multiple regression analysis was used to predict GPAfrom summer TOEFL subscores for each program year and for program yearscombined. The results did not consistently identify any single TOEFLsubscore as more important than any other subscore in predicting GPA. Theaddition of interview panel ratings as predictor variables in regressionanalyses for 1967 and 1968 students led to contrasting results. The 1967interview panel rating did not add significantly to prediction of CPA. Incontrast, the language fluency rating obtained in the 1968 interview byitself accounted for 41.5 percent of final GPA variance; this rating wasfar more important in predicting final GPA than were the summer TOEFLsubscores.
Conclusions
The high intercorrelations among TOEFL subscores were consistent withthe results of previous studies. The clustering of Vocabulary, EnglishStructure, and Writing Ability into one factor suggested that TOEFL couldbe reduced in length without loss of predictive power.
The contents of some Listening Comprehension items might be criti-cized, as the use of narratives concerning disasters and unhappiness couldaffect examinees' responsiveness. In addition, the TOEFL scores obtainedin the present study might have been affected by the organizationalclimate of test taking: the examinees were aware that their TOEFL scoreswould not be used for their selection into a program, and this awarenessmay have had an indeterminate effect on their performance.
Gains in TOEFL scores across summer and fall administrations wereencouraging and were greatest for those students who needed the summerlanguage program the most. Nineteen other students; however, earned lowerTOEFL 'mores in the fall than in the summer. Reasons for these declineswere not apparent.
A number of factors may constrain the generalizability of the resultsobtained, including differences in Thai student cohorts participating inthe study and the grading standards of the University of Alberta. Use ofinterview panel ratings of English proficiency as adjuncts to TOEFLdeserves further examination.

34. A., Angelis, P. J., 6 Thibodeau, L. A. (1980). Effects ofdisclosure on TOEFL performance (TOEFL Research iii7137grResearch Rep. No. 80-34.) Princeton, NJ: Educational
Hale, G.itemETSTesting Service.
Purpose
Following several TOEFL administrations each year, the test formsused at those administrations are disclosed, or made public. Items fromnondisclosed tests are reused in the Institutional Testing Program, and ifreuse of disclosed items for this program were also to be considered, itwould be important to know how TOEFL performance would be affected ifcandidates were to have access to some of the items before a test adminis-tration.
To address this issue experimentally, specially constructed TOEFLforms, called "disclosed forms," were made available to foreign studentsin intensive English language programs. Later the students were adminis-tered a special TOEFL consisting of items from those forms and a 10EFLwith all new items. Superior performance on the former test would indi-cate a disclosure effect.
If students must cover a large number of disclosed forms in order tobe exposed to all items that will appear on a later TOEFL, they should beless likely to benefit from having the disclosed forms available than ifthey need only cover a small number of forms. To test this hypothesis,items to appear on the special TOEFL were spread through six disclosedforms for students in some institutions, and through 12 forms for studentsin other institutions.
It was assumed that, in reality, disclosed TOEFL tests are used inTOEFL preparation courses. Thus, to simulate a test-preparation situa-tion, the students discussed a portion of the disclosed forms in class.
Method
The subjects were foreign students in intensive English languageprograms at 20 U.S. universities; the final sample consisted of 668subjects who took all tests.
Two three-part TOEFLs constructed from retired operational itemscomprised the "posttests" given at the end of the study. The posttestswere administered one week apart at most institutions. A TOEFL "pretest"was also given at the out set of the study, to be used as a covariate forstatistical control. Tests were administered by the participating insti-tutions according to ETS guidelines for Institutional administrations.
1 0 6

-101-
The "disclosed forms" made available during the study were alsoconstructed from retired operational items and were similar to operationalTOEFLs except that each correct answer was starred. Interspersed throughthe disclosed forma were items that would appear on one of the posttests,termed the "disclosed posttest"; the "undisclosed posttest," in contrast,contained all new items.
The disclosed forms were distributed to students in 16 institutions,and the subjects were told of the upcoming special TOEFL, in which theywould encounter items from the disclosed forms. The subjects were in-formed that their test scores would have no bearing on their academistanding or their admissions status.
Subjects in eight institutions were given six forms, and in eightother institutions, 12 forms. The forms were available for a median of 29days. Within each of these groups, subjects in four institutions receivedthe "disclosed posttest" first, and subjects in four other institutionsreceived the "undisclosed posttest" first. Tapes of the audio portions ofthe Listening Comprehension sections of these forms could be obtained froma central facility for listening to at that facility or at home.
Subjects in four additional control institutions were given only thepretest and two posttests, to check on the relative difficulty of thesetests. [The data showed only a small difference between posttests, andthe counterbalancing in order of tests weld expected to correct for thisdifference; results for these four control institutions are not presentedhere.]
The items from the disclosed forms that were discussed in classcomprised the equivalent of one fur, TOEFL, although not all items weretaken from the same form, and approximately five hours was devoted to theclass discussion.
Results and Conclusions
A significant disclosure effect was observed, as scores were 4.6percentage points higher on the disclosed posttest (55.9 percent correct)than on the undisclosed posttest (51.3 percent). (Scaled scores cannot beprovided for these specially constructed tests.) Analysis of covariance,
with the pretest as a covariate, showed that this effect could not beattributed to group differences in English proficiency. It appears, then,that when TOEFL items were made available for a few weeks before theadministration of a test containing those items, the subjects tended tostudy and recall many of those specific items.
For items discussed in class, the disclosure effect, examined onlyfor the condition involving six disclosed forms, was a full 11.8 percent-
age points. Yet an effect was shown for items not discussed in class as

-102-
well--4.4 percentage points for students given six disclosed forms, and2.0 points for those given 12 forms; all of these effects were signifi-cant. To some extent, then, the students studied the disclosed forms ontheir own initiative. This conclusion is reinforced by data from aquestionnaire, in which the subjects reported averaging between three andfour hours of listening to the tapes and between five and six hours ofreading the disclosed forms. Thus, it appears that students are motivatedto study disclosed items that will be encountered on a later TOEFL, even anonoperational test.
The disclosure effect was greater when the items to appear on theposttest were spread through six disclosed forms (6.3 percentage points)rather than 12 forms (2.9 percentage points). The data thus support thehypothesis stated above: If students must cover a relatively large numberof disclosed forms in order to be exposed to all items that will appear ona later test, they are less likely to benefit from the opportunity tostudy disclosed forms than if they need cover a smaller number of forms.This result has important implications regarding possible reuse of dis-closed items in Institutional TOEFLs. As the pool of disclosed TOEFLforms increases over time, there should be a decrease in the proportion ofitems in the pool that students can study and remember and, thus, adecrease in the effect due to disclosure.
108

-103- D2, F3, F4
35. Harvey, M. J. (1979). Academic achievement as redicted by the Test
of English as a Foreign Langua(e. Unp ishe master s t esis,
Portland State University, Portland, OR.
Purpose
This study evaluated TOEFL as a predictor of foreign students'academic achievement during their first two terms at Portland StateUniversity, with attention given to the influence of graduate versus
undergraduate status and college of enrollment within the university. The
initial sections of the thesis review measurement and other problems in
devising prediction schemes for foreign students' achievement on the basis
of language proficiency information and academic aptitude information.
Various studies involving the relation of TOEFL to other proficiency tests
and to college grades are reviewed.
Method
The subjects were 78 foreign otadents at Portland State University
who met the criteria specified below. Scores on the three-part TOEFL
[presumably earned in International or Special Center administrations] and
grades were obtained from administrative offices at Portland State Univer-
sity. From the total population available, students were eliminated on
the following bases, to yield the final sample of 78 subjects: (a) a time
span of more than six months between test date and enrollment; (b) TOEFL
score based on the earlier five-part examination; (c) TOEFL score below
500 [note, however, that analyses reported below involve subjects with
TOEFL scores below 500); (d) concurrent enrollment in an intensive English
course during the first two terms at Portland State University; (e)
enrollment in less than eight hours of academic work at the beginning of
the first or second term of study; and (f) transfer of previous coursework
from another American school to Portland State University.
Results
TOEFL total scores correlated .18 with grade point-average (GPA) for
these foreign students (2, < .05). Correlations of GPA with the Listening
Comprehension section and with the Reading Comprehension and Vocabulary
section of TOEFL were both .15; the correlation of CPA with the Structure
and Written Expression section was .03. Graduate students who scored
below 500 on TOEFL or between 500 and 550 earned higher average grades
than did undergraduates in the same TOM score ranges. Undergraduates
earned a higher mean GPA than did graduates in the TOEFL score range 550
and above.
109

-104-
Examination of relationibips between TOEFL scores and grades withincollege of enrollment was based on tabulation of average grades in thethree TOEFL score ranges: below 500, 500-550, and above 550. The collegesinvestigated were arts and letters, science, social science, health LAphysical education, and business administration. Interpretation of theresulting data was inconclui0 s4 with trends going in ,ipposite directionsfor the lowest two TOEFL score levels. GPA was higher for students withTOEFL scores above 550 than for students with TOEFL scores in the 500-550range. This relationship was evidenced for four of the five colleges. Incontrast to this pattern, students in business administration earned lowergrades if they scored above 550 on TOEFL.
Conclusions
The present data demonstrated that TOEFL scores were of limited valuein predicting CPA, Nention is made of a lack of consistent correlationbetween TOEFL total and TOEFL part scores according to college of enroll-ment; however, the relevant correlation coefficients are not presented inthe thesis.] A redesign of TOEFL might be considered, with the variousTOEFL test sections bearing a more natural relation to everyday academictasks than is currently the case. A measure of writing is needed and, ingeneral, the importance of productive skills in assessing English profi-ciency must be considered. It is suggested, however, that revision ofTOEFL might not necessarily lead to its improvement as a predictor ofcollege grades, since the importance of English language proficiency toacademic achievement may have been exaggerated in the literature.
1 u

,1
-105- A2, Dl
36. I. (1982). The correlation between performance on theVocabulary subtext and the tOEFL. master's
Washington University, St. Louis, MO.
Hassan, K.WAIS-Rthesis,
Purpose
This study compared interrelationships in performance on the five-
pert TOEFL, the Vocabulary subtest of the Wechsler Adult IntelligenceScale-Revised (WAIS-R), and college grade-point average (GPA) among 30
male Arabic students at Washington University in Missouri. Three hypo-
theses are set forth: (a) There is a significant relationship betweenTOEFL score and the score on the Vocabulary subtest of the WAIS-R; (b)
There is a significant correlation between TOEFL score and semestergrade-point average (GPA); and (c) There is a significant crrrelation
between the score on the Vocabulary subtest of the WAIS-R and semester
grade-point average (GPA) .
Method
The 30 subjects under study were enrolled as full-time undergradu,testudents at Washington University; all were male and had Arabic as the
native language. Subjects ranged in age from 18 to 29 years with a median
age of 21.5 years. Student records indicated that they had studiedEnglish for a period ranging from three to six years. The tests used in
the study were the five-part TOEFL and the Vocabulary subtest of the
WAIS-R. In the WAIS-R Vocabulary subtext there are 35 words to be definc',
arranged in order of increasing difficulty. For each word the subject
to state what the word means. This test was administered to the subjects
in the spring semester of 1982. TOEFL scores and semester GPA werecompiled for the subjects; the subjects had taken TOEFL prior to thestudy (presumably in International or Special Center administrations).
Pearson product-moment correlations were computed for pairs of measures.Multiple regression analysis was used to predict semester GPA from TOEFL
scores and from WAIS-R Vocabulary scores.
Results and Conclusions
The means and SDs for the three measures were WAIS-R Vocabulary(6.66, 1.68); TOEFL-1459.10, 58.08); and GPA (2.45, .35). The WAIS-RVocabulary score correlated .25 with TOEFL total score; this relationship
was not statistically significant. The TOEYL score correlated .45 with
semester CPA; this relationship was significant at the .01 level. The
WAIS-R Vocabulary subtest score correlated .27 with semester GPA; this
relationship was not statistically significant.
111

-106-
The regression analyses yielded the following prediction equations:CPA - .056 (Vocabulary) + 2.08, with standard error of estimate m .34; andGPA - .0027 (TOEFL) + 1.211, with standard error of estimate m .80. rno
regression analysis is reported including both TOEFL score and Vocabularyscore as predictors of CPA.)
The findings are treed on a small sample of students, and caution is,;rged in attempting to generalize findings to other universities.Further research involving non-Arabic speaking foreign studeaty is sug-gested.
112

-107- B4, D1
37. Heil, D. K., 6 Aleamoni, L. M. (1974). Assessment of the proficiency
in the use and understanding of English by foreign students as
measured by the Test of English as a Foreign Languaje (Report
No. RR-3505. Urbana, IL: University of Illinois. (ERICDocument Reproduction Service No. ED 093 948).
Purpose
This study investigated the prediction of foreign graduate students'
academic achievement using scores on tests of English language proficien-
cy. The specific ob....ctives of the study were:
(a) to determine the predictive validity of TOEFL, with first- orsecond-semester graduate grade-point average (GPA) serving as the
criterion;
(b) to examine the predictive validity of the English PlacementExamination (EPE) developed at the University of Illinois atUrbana-Champaign tUII/CL 11014g_ first- and second-semester gradu-ate GPA as the criterion;
(c) to exeralae the concurrent validity of TOEFL and the EPE;
(d) to determine the predictive validity of TOEFL and the EPE, usinggrade in a remedial English course as the criterion; and
(e) to estimate the degree of change in total TOEFL score resulting
from living in an English-speaking country and taking a remedial
English course for one semester.
Method
The subjects were 148 incoming graduate foreign students accepted foradmission to UIUC in the fall of 1970. Scores on the five-part TOEFL,
[presumably administered in the Institutional Testing Program] wereobtained from admissions office records. A second set of TOEFL scores wasalso obtained, based on an administration of TOEFL upon the subjects'arrival At the university in September 1970. Students scoring in therange of 480-569 on the preadmission TOEFL were required to take the EPEtest administered by the Division of English as a Second Language (ESL).
The EPE consists of four parts. The Structure section tests recognitionof English grammar and sentence structure in writing. The Aural Cympre-hension section tests understanding of spoken English at normal speed.
The Original Composition section tests ability to write on an assigned butfamiliar topic for which an outline has been provided. The Pronunciation
section tests ability to understand and be understood orally.
113

-108-
The results of these examinations were used tc; ?lace students in oneof five levels of ESL courses. Those scoring soove 569 on TOEFL wereplaced in one of the two highest-level ESL courses. Students scoringbelow 480 usually were not admitted to the university. The numbers ofsubjects entering into different analyses in the study varied; 89 of theoriginal 148 subjects were enrolled and completed coursework in the ESLclasses.
Results
Total GPA in either the first or second semester of study was foundto correlate significantly with TOEFL scores obtained before and uponarrival at the university; correlations for part and total TOEFL scoresranged from .16 to .39. Higher correlations with TOEFL scores wereobserved for second-semester GPA than for first-semester GPA. TOEFLscores obtained prior to admission correlated slightly higher with GPAthan did TOEFL scores obtained at the time of admission.
Correlations between (a) EPE part and total scores and (b) first- andsecond-semester -OP were much- lower-theet the corresponding -correletiona-between TOEFL and GPA; the former correlations ranged in value from -,04to .12.
TOEFL score (based on postodmission testing) was not significantlycorrelated with the subjects' grades in their ESL classes, and EPE scoresalso generally failed to correlate significantly with ESL grades. Of
grades received in the three most heavily attended ESL classes, the gradein the lowest class was significantly correlated with GPA earned in thesecond but not the first semester; the reverse was true for the nexthigher level. For the third most heavily attended ESL class (the secondhighest level in the sequence), ESL grade was significantly associatedwith both first- and second-semester CPA.
Results of a regression analysis indicated that the grade in each ofthe two lowest ESL awes was significantly predicted by combined EPE andTOEFL scores. In the case of one of these classes, the second-level ESLclass, EPE score significantly improved prediction of ESL grade when addedto TOEFL as a predictor variable in regression analysis.
Conclusions
The predictive validity of TOEFL for foreign students appears to besimilar to the predictive validity of admissions test scores for nativeAmericans. This result suggests that academic success may be no morepredictable for foreign students than for native Americans. Correlationsbetween TOEFL part scores and GPA night be improved if part scores moreadequately reflected skills required in college work.
114

-109- B2, B7
38. Hillman, R. E. (1973). A correlational study of selected vocal-verbal behaviors and the Test of English as a Second !sic)Language (TOEFL) (Doctoral dissertation, Pennsylvania StateUniversity, 1972). Dissertation Abstracts International, 34,1397A. (University Microfilms No. 73-20, 090)
Purpose
This study attempted to validate TOEFL as a measure of the abilityto encode oral English by using vocal-verbal behaviors as criterionmeasures. It also attempted to test the hypothesis that nonnative Englishspeakers exhibit more proficiency when speaking about experiences in theirhome countries than when speaking about experiences in the United States.
Method
The subjects for the study were 124 undergraduate and graduatestudents enrolled at the University of Wisconsin during the fall semester-o-U1971. Diiiii-oittrition and teEhniCiidiffiiiiIties, data are presentedfor only 47 students. A 1968 fora of the five-section TOEFL was adminis-tered as part of the study. Also, the five vocal-verbal behaviors de-scribed below were elicited during a structured oral interview. The
interview included questions about life in the student's home country andlife in the United States. Each interview was recorded on audio tape andtranscribed. The subject's first 100 words regarding life in the homecountry and first 100 words regarding life in the United States werescored separately for each behavior.
The five behaviors chosen were (a) amount of silent pause time(including any pause greater than .25 seconds as determined by a recorder,which transmitted speech onto continuous graph paper); (b) number ofverbalized pauses, such as "uh" and "well," as counted by five judges; (c)type/token ratio (the number of different words divided by the totalnumber of words); (d) average number of words five judges were unable toidentify; and (e) average overall English language proficiency (ELP)rating as assigned by 10 judges on a seven-point bipolar scale, withnative and "nonnative" serving as the poles.
In addition, two indirect measures of English proficiency wereadministered to the subjects. These were the Indirect Measure of OralOutput (IMOP) and the Holtzman Stress-unstress test. The IMOP is a20-minute listening test in which the examinee classifies speakers aseither native or nonnative. The Holtzman Stress - unstress test requires
examinees to read aloud a list of 31 words; each response is scored forcorrect placement of stress.
Intercorrelations were computed among TOEFL scores, the five vocal-verbal criteria corresponding to the home country and U.S. portions of
115

-110-
the oral interview, and the two additional measures. In addition, ananalysis of variance was performed to determine if the scores from thehome country and U.S. sections of the interview could be merged. Inter-
rater reliabilities were determined where appropriate.
Results
The mean TOEFL score for the group was 475, which is slightly belowthe average of all examinees taking TOEFL in International and SpecialCenter administrations. The standard deviation, 83, was five pointsgreater than-average. As noted above, the three variables that employedmore than one judge were verbalized pauses, unidentified words, andoverall English language proficiency. Reliabilities of the ratings forverbalized pauses (.87) and for English language proficiency (.90) wereregarded as acceptable, as both were greater than .80. However, thereliability of unidentified word counts (.29) was not acceptable.
The analysis of variance showed that the means of scores on the fivevocal-verbal criteria for the home-country context did not differ signifi-cantly from the means for the U.S. context. However, analysis of theintercorrelations between the five vocal-verbal behaviors and two indirectmeasures showed that some 'significant relationships did exist between homecountry and U.S. speech behavior. Verbalized pauses, unidentified words,and English language .proficiency each yielded correlations above .60between the two speech contexts. Verbalized pause counts and unidentifiedwords yielded the highest correlations with English language ratings.
The correlations between TOEFL total score and the five direct andtwo indirect criterion measures are presented in Table 1. It was hypothe-
sized that the TOEFL score would show a negative correlation betweennumber of silent pauses, verbalized pauses, and unidentified words.Similarly, it was hypothesized that TOEFL score would correlate positivelywith EL? ratings and type/token ratio. It was also hypothesized thatTOEFL score would show a positive correlation with the two additionalmeasures.

T-'ale 1
Correlations between TOEFL and Seven Language Measures
V iableHome Country
ContextU.S.
rontext
Silent pause .07 -.23Verbalized pause -.51* -.29Type/Token ratio .14 -.42*Unidentified words .27 -.13ELP ratings .56* .36
'MOP .52*
Stress-unstress test .35
*Significant at the .01 level.
As indicated in the table, few correlations significant at the .01level were obtained with this sample. TOEFL correlated significantly with(a) verbalized pauses in the home-country context, (b) type/token ratio inthe U.S. context, (c) English language proficiency in the home-countrycontext, and (d) the IMP test of ability to recognize the pronunciationof a native speaker. Thus, only four of the 12 comparisons yieldedstatistically significant correlations. For each of the five directmeasures, the difference between correlations in the home-country contextand the U.S. context was examined statistically; the difference wassignificant for three of the direct measures. However, the generaldirection of the differences favored a stronger relationship between TOEFLscores and the ability to use English when speaking about home-countryexperiences.
Conclusions
Foreign students with high TOEFL scores may exhibit fewer verbalizedpauses and greater English language proficiency when talking about whatthey have experienced in their home countries than when talking about whatthey have experienced in the United States. Thus, the ability of TOEFL topredict vocal-verbal behaviors may depend on the context of those behav-iors.
It is possible that the generally superior relationship between TOEFLscores and ability to encode in the home-country context is due to greaterfamiliarity with the home-country context. The learners, being familiarwith what is an appropriate response to questions in that context, may be

-112-
able to utilize their language proficiency to monitor their output. Lackof familiarity with the nature of expected responses in the U.S. context
may result in the monitor either not being invoked or being underused.Thus, a reduced correlation between verbal output and TOEFL score would be
expected. While the data do not provide strong support for a relationshipbetween TOEFL score and real language use, the precise relationship may be
impossible to establish until research yields more information on thevocal-verbal behavior of nonnative speakers of English. The absence of acorrelation between pause-time and ELP ratings suggests that appropriatepause-time parameters for nonnative speakers need further investigation.The same may be true of other variables included in this study.

39. Hinofotis, F. B. (1980). Close as an alternative method of ESLplacement and proficiency testing. In J. W. Oiler, Jr., & K.Perkins (Eds.), Research in language testing. Rowley, MA:Newbury Rouse.
Purpose
This article, based on the author'. dissertation, addressed two basicquestions relating to close testing: (a) Can a close test serve as asurrogate measure of English language skills without significant loss ofinformation and (b) Should close tests be scored by accepting only theexact word deleted, or should other grammatical and contextually suitablesubstitutes be accepted as well?
Method
Incoming foreign students representing a variety of native languagebackgrounds served as subjects. All were enrolled at the Center forEnglish as a Second Language (CESL) at Southern Illinois University. Atotal of 107 subjects took both a close test and the CESL Placement Testat the beginning of two consecutive six-week terms during the summer of1976. (The CESL Placement Test is a three-part test yielding a totalscore and subscores for listening comprehension, structure, and reading.Scores are grouped within six proficiency levels.) In addition, 52 ofthe subjects, who scored at level three (of six) or above on the CESLPlacement Test, also took the five-part TOEFL at the university testingservice.
The close test employed a 427-word passage, adapted from an inter-mediate level text in English as a second language, that described differ-ent means of transportation used for long distance travel. Every seventhword was deleted from the passage to yield a total. of 50 blanks. Thesubjects were given 30 minutes to complete the close passage. First,scores were obtained by accepting as correct only the exact word that hadbeen deleted (close-exact method). Then, the papers were reecored bycounting as correct responses that were grammatically and contextuallyacceptable (close-acceptable method). Correlations were then obtainedbetween section and total scores on the two tests of English languageproficiency and scores on the close test as computed by the two methods.
Results
As shown in Table 1, total scores on the CESL Placement Test andTOEFL were highly correlated with scores on the close test obtained underboth scoring methods. Also, reading scores on both tests correlated more

-114-
highly with the cloze teat than did scores on any other subtest. (The
correlations were all significant beyond the .005 probability level.)However, the correlations may have been attenuated due to the lack ofreliability of the cloze passage (.61 for cloze-exact score and .85 forcloze-acceptable score), which was found to be very hard for this group ofstudents.
Cloze-exact and cloze-acceptable scores did not show significantlydifferent correlations with the CESL Placement Test (.80 and .84) but didshow significantly different correlations with TOEFL (.71 and .79).Still, the correlation between these two scores was .97.
Table 1
Correlations of Cloze Test Scores with Total andSubtest Scores on the Criterion Measures
Cloze-exactScore
Cloze-acceptableScore
Total CESL Placement Test .80 .84 107
CESL Listening Comprehension .71 .73 107
CESL Structure .63 .69 107
CESL Reading .80 .80 107
Total TOEFL .71 .79 52
TOEFL Listening Comprehension .47 .51 52
TOEFL English Structure .51 .58 52
TOEFL Vocabulary .59 .62 52
TOEFL Reading Comprehension .68 .77 52
TOEFL Writing Ability .55 .64 52
Conclusions
The high correlations obtained in this study warrant the cautioususe of the cloze test as a measure of English language proficiency.Although the two scoring methods apparently cause subjects to rank orderin the same manner, the cloze-acceptable method shows much greater vari-ance and greater reliability. The cloze-exact method is less time consum-ing, but the cloze-acceptable method is more reliable and thereforepreferable.
12

-115- DI, 13
40. Homburg, T. J. (1979). TOEFL and CPA: An analysis of correlations.In R. Silverstein (Ed.), Proceedings of the Third InternationalConference on Frontiers in Language Proficiency and DominanceTesting. Occasional Papers on Linguistics, No. 6. Carbondale,IL: Southern IllinoleUniversity.
Purpose
This paper discusses advice rendered the advisory board of the Officeof International Education at Southern Illinois University (SIU) on use ofTOEFL. r* 1979, SIU required a minimum TOEFL score of 550 for foreignapplicants to graduate programs and a minimum TOEFL score of 525 forforeign applicants to undergraduate programs. At SIU there were contrast-ing views regarding use of cutoff scores in admissions. Some expressedconcern that the cutoff scores used for admission, particularly graduateadmission, were set too high for students with good credentials. Othersexpressed concern that minimal TOEFL score requirements were not adequateindicators of linguistic ability to perform in certain programs of gradu-ate study. In considering possible changes in the use of TOEFL scores ingraduate admissions, three questions were addressed: (1) How are TOEFLscores used? (2) What are some of the problems with this process?(3) What should be done to improve the current system?
Discussion
The 1978 TOEFL manual' recommends that use of TOEFL in admissionsshould not include the prediction of scores on academic achievementindices, such as grade-point average (GPA). TOEFL is a test of profi-ciency in English as a second language and not an achievement test. Thereis no systematic or intentional connection between TOEFL test demands andacademic materials that foreign students may have mastered earlier.
The TOEFL manual also warns against using cutoff scores on TOEFL.This recommendation is supported by two factors. First, TOEFL scores arelegitimate indicators of the relative standing of examinees with regard toEnglish language skills; these scores are not intended to convey informa-tion about candidates' English language skills in particular situations atparticular institutions. Second, because there is some degree of error inmeasurement, use of cutoff scores in admilosions can lead to mistakes inapplication of a TOEFL cutoff score in admissions decisions.
The inappropriateness of TOEFL score as a predictor of achievement isdemonstrated in a study at SIU that investigated the correlation betweenTOEFL score and CPA in each of two groups of foreign graduate students(Ns 134 and 54). [The source of TOEFL scores, and whether they werederived from the three-part or five-part TOEFL, are not indicated.)
IEducational Testing Service (1978). TOEFL test and score manual.
Princeton, NJ: Author.
121

-116
The first group had completed their program of studies While the secondgroup had not. The correlations between TOFFL scores and GPAs for the twogroups were -.07 and .22, respectively. For both groups combined, thecorrelation between TOEFL score mad CPA was .11. Rest %a of a regressionanalysis indicated that there was mot a significant di..'erence in GPA forthe two groups; both groups demonstrated high mean Glits, of 3.58 and 3.39,respectively. It is concluded that numerous factors could affect achieve-ment that might not be reflected in admissions test scores.
Guidelines for using TOEFL scores cited in ..e TOEFL manual arediscussed. [These are essentially the guidelines that are listed in thesummary of the 1981 manual (Summary No. 28, Educational Testing Service,1981) summarized elsewhere in this collection.]
122

-117- El, E2, H
41. Bosley, D. (1978) . Performance differences of foreign students onthe TOEFL. TESOL Quarterly, 12, 99-100.
Purpose
Among foreign students in an intensive English Language program,differences in TOEFL4scores as a function of such variables as country oforigin end sex were examined.
Me thod
The subjects were 147 foreign students in the Center for English as a.Second Language (CESL) at the University of Arizona. The subjects in thesample comprised.28 percent of the total number of students in the CESLprogram and were drawn from 19 different countries. For data analysis,the subjects were 1:J/iced into six groups: Mexico, Saudi Arabia, Libya,Venezuela, and Japan (the five most common countries of origin), andothers. Scores on the five-part TOEFL were available [presumably obtainedthrough International test administrations.]
Results and Conclusions
Analysis of variance of the TOEFL scores showed the effect of countryto be significant, with scores of Mexicen subjects being the highest andsignificantly different (via post-hoc tests) from those of Saudi Arabianand Libyan subjects, which were the lowest.
Differences among the TOEFL subtests were also significant, with themean score on the Writing Ability subtext higher than scores on the othersubtests. The interaction between subtests and country of origin was alsosignificant, with a post-hoc test showing that the Listening Comprehensionand Vocabulary sections contributed most to the superior performance ofthe Mexican subjects.
A comparison between 58 students who had been in the CESL program and89 new students showed that TOEFL scores were significantly higher for thenew students. The difference between males and females was not signifi-cant. These data should help to identify variables that can affect TOEFLperformance and provide hypotheses for further study.

-118- Al, B4, B7, Cl, C2
42. Mosley, D., & Meredith, K. (1979). Inter- and intra-test correlates
of the TOEFL. TESOL Quarterly, 13, 209-217.
Purpose
The constructs measured by TOEFL and the nature of language profi-
ciency were examined using data obtained from students enrolled in an
intensive English program.
Method
One hundred sixty-nine students enrolled at the Center for English as
a Second Language at the University of Arizona had scores on the five-
section TOEFL [presumably administered via International or Special Center
programs ] and the Comprehensive English Language Test for Speakers of
English as a Second Language (CELT). The CELT consists of three sections:
Listening, Vocabulary, and Structure. The Listening section contains
three parts. In the first part, the examinee hears a short question and
then selects, from four alternatives, the correct answer to the question.
In the second part, the examinee hears a statement and chooses, from fourprinted statements, the one closest in meaning to the one heard. In the
third part, the examinee hears a short dialogue between two speakers and a
question posed by a third speaker and must select, from four printed
alternatives, the correct answer to the question. The Vocabulary section
contains two parts. For each item in the first part, the examinee sees a
sentence with a deleted word and must select, from four alternatives, the
deleted word. For each item in the second part, the examinee reads a
short phrase and then selects, .from four alternatives, the word described
by the phrase. For each item in the Structure section, the examinee reads
a short conversation between two persons, with a word or phrase deleted
from the last sentence; the examinee must select, from four alternatives,
the deleted word or phrase. [description paraphrased from a recent CELT
manual]
Correlations between the five TOEFL sections were determined and a
factor analysis was performed. The subjects were also divided into threeproficiency groups on the basis of CEI.T scores and teacher recommenda-
tions. The correlation between TOEFL score and group placement was then
determined, as were the correlations between subtest scores on both tests
and between TOM scores and grades in courses in English as a second
language.
Results
Mean TOEFL scores we v about two-thirds of a standard deviation below
published norms (cf., Educational Testing Service, 1973). The highest
124

-119-
correlations between TOEFL sections were found between Reading Comprehen-sion and Vocabulary (.73) and between English Stv.ucture and WritingAbility (.67). Factor analysis indicated that all TOEFL section scoresloaded on a single factor. Scores from the Reading Comprehension andWriting Ability subtexts loaded more heavily on this factor than didscores from the other three subtexts. Intercorrelations and factorloadings are indicated in Table 1.
Table 1
TOEFL Subtest Intercorrelations and Factor Loadings
TOEFL SubtestTOEFL Subtest Loadings on
Main FactorLC ES V RC WA
Listening Comprehension (LC) .75English Structure (ES) .57 .73Vocabulary (V) .50 .45 .70Reading Comprehension (RC) .66 .60 .73 .89Writing Ability (WA) .62 .67 .52 .67 .80Total TOEFL .82 .78 .80 .89 .83
Correlations between CELT and TOEFL subtests ranged from .36 to .79.The correlation between total scores on the two tests was .64. Theintercorrelations between CELT and TOEFL subtexts are depicted in Table 2.
Table 2
Intercorrelations between CELT and TOEFL Subtests
CELT SubtestTOEFL Subtest
LC ES V RC WA
Structure .79 .58 .36 .51 .63Listening Comprehension .53 .52 .72 .74 .65Vocabulary .59 .77 .41 .63 .71Total .52 .52 .39 .43 .50
The pairs of sub texts that correlated the highest were not those withthe same labels (".g.,vocabulary, listening comprehension, and structure).
125

-120-
Correlations between TOEFL scores and class grades were low and generally
nonsignificant. However, there was a high correlation (.63) between TOEFLscore and group placement.
Conclusions
A single factor accounts for most of the variance on the TOEFLsubtests. The existence of this factor is also supported by the interre-lated nature of the TOEFL subtests and the moderate to strong correlationswith CELT subtests. Grades in an intensive English program apparently arenot predicted by TOEFL score.
126

-121- B4, D1, E2, E4, F2, F4
43. Hwang, K. Y., & Disney, H. F. (1970). Predictive validity of theTest of English as a Foreign Language for Chinese graduatestudents at an American university. Educational and Psychologi-cal Measurement, 30, 475-477.
Purpose
This paper, based on the first author's doctoral dissertation, wasconcerned with the validity of TOEFL as a predictor of grades in a coursein English as a second language (ESL) and as a predictor of first termgrade-point average (GPA) in graduate courses for Chinese students at theUniversity of Oregon.
Method
Sixty-three stIdects (32 male and 31 female) were chosen for studyfrom the 120 Chinese graduate students who enrolled at the University ofOregon between fall 1966 and fall 196C. All of the subjects had taken thefive-part TOEFL prior to admission to the university 'presumably via theInternational Testing Program]. The subjects had received from seven to13 years of instruction in English before arriving in the United States.The age of the subjects ranged from 22 to 36 years, with a median of 29years. The subjects majored in education (ED), social and professionalservices (SPS), natural sciences (NE), social sciences (SS), and architec-ture (ARCH). Twenty of the 63 subjects enrolled in an ESL course duringtheir first term of graduate study.
Results and Conclusions
Table 1 reports means and standard deviations of TOEFL scores andCPAs for subjects in various subgroups.

-122-
Table 1
Descriptive Statistics for TOM. and GPA
Sex or MajorArea of Study N
TOEFL GPASD MEAN SD
Male 32 504 32.7 3.13 .45
Female 31 505 42.5 2.97 .51
ED 21 479 22.3 2.93 .48
SPS 16 527 38.5 2.88 .47
NS 11 522 37.5 3.26 .29
SS 9 513 21.1 2.89 .49
ARCH 6 489 25.4 2.98 .52
Entire Group 63 505 38.8 3.03 .37
Total TOEFL score correlated .66 with ESL course grade for the 20
subjects who had taken the ESL course in the first year of graduate work.
This correlation was significant at the .05 level. Correlations between
TOEFL score and first-term GPA in various study areas are shown in Table
2; none of these correlations attained statistical significance.
Table 2
Correlations between TOEFL Score and GPA
Sex or MajorArea of Study N
Correlation ofTOEFL with GPA
Male 32 .17
Female 31 .18
ED 21 .21
SPS 16 .05
NS 11 .22
SS -.32
ARCH 6 .69
Entire Group 63 .19
The results of the study indicated that TOEFL was a relatively good
predictor of ESL course grades for Chinese graduate students at the
University of Oregon but not a very good predictor of graduate course
grades. Further studies involving Chinese students in other universities
and collegek: are needed, as well as studies focusing on other groups of
foreign students.128

-123- B1, B5
44. Irvine, F., Atai, P., S 011er, J. W., Jr. (1974). Close, dictationand the Teat of English as a Foreign Language. Language Learn -ing., 24, 245-252.
Purpose
This study investigated the performance of foreign students on aclose test, a dictation test, and the five-part TOEFL. One objective wasto determine whether TOEFL scores would correlate with the other measuresin a way consistent with integrative proficiency testing theory. A secondobjective was to verify that performance on the close test and dictationtest, both presented in English, would correlate with each other for agroup of examinees based in a foreign country.
Method
The subjects were 159 native Farsi speakers located in Tehran, Iran.[No other details are given on the characteristics of the subjects.] Thefive-part TOEFL was administered by trained staff according to standardprocedures. After the test, voluntary participation to take the close anddictation tests the next day was requested.
The dictation test employed two separate passages. The easierpassage was taken from a college-level text on community health; the moredifficult passage came from Scientific American. The passages were readby a native English speaker and reqUired about 20 minutes to read. Thetotal dl-tation score was the total number of words written by the subjectin origL.al sequence for the two passages combined. The close test wasbased on a 394-word passage taken from an English text. Every seventhword in the passage was deleted, except for the first 43 words, whichremained intact. Two :71oze test scores were derived. The exact closescore was the total number of verbatim reproductions of the deleted words.The acceptable close score was the total number of words that were accept-able substitutes, as judged by a native speaker of English.
Results
The exact close score correlated .94 with the acceptable close occxe,and the two close scores correlated in a very similar fashion with othermeasures. The acceptable close score correlated .75 with the totaldictation score, a correlation that was higher than the correlation of anyTOEFL section with any other TOEFL section. The acceptable and exactclose test scores correlated more highly with the TOEFL Listening Compre-hension subscore than with any other TOEFL subscorP.

-124-
Correlations were computed between each individual TOEFL sectionand the combination of all remaining sections; the cloze and dictationtest were also correlated with these combined scores. With one exception,
cloze test scores proved to be better predictors of the combination. ofTOEFL section scores, excluding a given section, than did the score on theexcluded section or the dictation test score. Correlations of clozescores with the various combinations of four (or all five) TOEFL sectionsranged from .74 to .81.
Conclusions
The pattern of correlations obtained is judged to support the pre-vious claim that dictation and cloze tests represent integrative languageproficiency skills. For example, there was a moderately high correlationof .69 between the dictation score and the TOEFL Listening Comprehensionscore. This finding bolsters the contention that separate tests, empha-sizing different language tasks, measure the same underlying range ofintegrated language skills.
It is concluded that the TOEFL total score provides little interpret-able information beyond that provided by the cloze test, the dictationtest, and the TOEFL Listening Comprehension gamest. It is also concludedthat the patterns of intercorrelations among scores do not support thenotion that the separate TOEFL subscores measure highly differentiatedlanguage skills.

-125-
45. Jameson, S. C., & Malcolm, D. J. (1973). TOEFL--The developingyears. International Educational and Cultural Exchange, 8,57-62.
Purpose
This descriptive paper provides an account of the events in the earlyhistory of TOEFL. [See also Palmer, 1965; 011er & Spolsky, 1979. Notethat this summary, as well as summaries of other papers, directly reflectsstatements made by the authors. Thus, the summary is written in thepresent tense and refers to groups and organizations by their titles atthe time of writing, even though some of those organizations have sincechanged their names.)
Discussion
At a 1961 conference on testing, the need was expressed for a system-atic method of assessing the English proficiency of foreign applicants toU.S. colleges and universities. As a result, the National Council.on theTesting of English as a Foreign Language was established, ingladingrepresentatives of approximately 30 organizations. With support from theFord and Danforth Foundations, the Council began the groundwork towarddevelopment of the Teat of English as a Foreign Language, and actual testdevelopment was well underway by the summer of 1963. The teat, whichconsisted of five parts, was first administered in February 1964 to 920examinees in 34 countries.
The council soon recognized that a well-established organizationwould be needed to sponsor the TOEFL program. In July 1965, the CollegeEntrance Examination Board (CEEB) and Educational Testing Service (ETS)assumed cooperative responsibility for the program. CEEB assumed respon-sibility for promoting use of the program by colleges and universities andto ensure that the program would be responsive to the needs of thoseinstitutions and of the examinees. ETS assumed responsibility for opera-tion of the program, including preparation of test forms, examinee regis-tration, establishment of test centers, test scoring and score reporting,statistical analysis, research, and other functions.
The TOEFL program's growth is seen in marked increases from the year1964-65 to the year 1971-72 in number of examinees tested (from approxi-mately 2,400 to 64,000), average number of test centers per administration(from 80 to 400), and other statistics.
The large majority of colleges and universities in the United Statesnow require, or strongly recommend, that foreign applicants take TOEFL.Also, the test is used by many government agencies, businesses, andfoundations, and it is required by many organizations as a basis for
131

-126-
licensure or accreditation of professionals educated outside the United
States. TOEFL's advantages include the security of the test, the value of
the test scores for admission and placement, and the fact that the test is
offered in so many locations abroad.
In 1966, CEEB and ETS appointed a six-member Examiner Committee,
comprised of specialists in linguistics, psycholinguistics, and the
teaching of English as a foreign language. The Examiner Committee reviews
new test forms, provides advice regarding research, and brings to bear
knowledge of new developments in the field. The National Advisory Council
on TOEFL, which evolved from the original TOEFL Council, serves to advise
CEEB and ETS on matters of general policy regarding the test. The Council
consists of representatives of undergraduate institutions, graduate and
professional schools, teachers of English as a foreign language, admis-
sions officers, and various agencies.
Several procedural changes have been made over the years. Scores are
now given directly to examinees as well as to institutions; the adminis-
tration of test centers and of the registration process have been decen-
tralized in many places; four International administrations rather than
three are now offered each year; and a totally new teat form is used at
each International administration. Also, an Institutional Testing Program
has been established, through which TOEFL forms are provided to institu-
tions for administration to their own students. Further, walk-in test
centers were established, whereby students could take TOEFL at times other
than the International administrations teat dates.
The program has benefited from cooperation between government
agencies and institutions of higher education. Prom the outset, support
has come from the Bureau of Educational and Cultural Affairs of theDepartment of State, and the Agency for International Development.
Encouragement has also come from the Institute of International Education,
the American Friends of the Middle East, and the Latin American Scholar-
ship Program of the American University. The widespread use of TOEFL has
also been due, in part, to strong recommendations by the American Associa-
tion of Collegiate Registrars and Admissions Officers and the National
Association for Foreign Student Affair" that U.S. institutions require
foreign applicants to take TOEFL.
With the growth of the TOEFL program, vakiLik, ,-olications relating
to the test have been prepared, including interpretive umit-ri_ s for TOEFL
users as well as a guide for students. A technical manual is planned that
will summarize research on TOEFL and present detailed information about
its psychometric characteristics.
As TOEFL continues to be used, it is important that scores ire
properly interpreted by those who use them. TOEFL should not be regarded
as an aptitude test or as a predictor of academic success, and cutoff
scores should not be used. Research should be conducted by institutions
that use the test so they can establish norms by which to make proper
decisions at the local level.
132

-127- Cl, ES, H
46. Johnson, D. C. (1977). The TOEFL and domestic students: Conclusive-ly inappropriate. TESOL Quarterly, 11, 79-86.
Purpose
This study examined the performance of native English speakers onTOEFL, partly to determine the appropriateness of cutoff scores on thetest used by the University of Tennessee for admission of foreign stu-dents.
Method
The subjects were 173 American freshmen and sophomores enrolled in apsychology course at the University of Tennessee. Of the 173 subjects,152 were from Tennessee, 96 from urban areas, and 56 from rural areas(towns with populations of less than 30,000). Scores on the AmericanCollege Test (ACT) indizated that this sample was representative of thestudent body at the university. [The ACT is described briefly in SummaryNo. 5, Andalib, 1976.)
Participation in the study was voluntary and resulted in research-participation credit and an opportunity to win prize money. The five-partTOEFL was administered to the subjects as part of the study.
Results and Conclusions
Mean scores on the five parts of the test were Listening Comprehen-sion, 69.9 (of a possible 73); English Structure, 64.3 (of 66); Vocabu-lary, 65.2 (of 69); Reading Comprehension, 56.6 (of 66); and WritingAbility, 58.0 (of 65), for a total score of 628. Thus, consistent with asimilar study conducted at a western state university (Ang -'ff & Sharon,1971), the scores were relatively high, and the lowest subscores obtainedwere those for Reading Comprehension and Writing Ability, with the levelsof performance on the other subtests also generally similar to those ofthe earlier study. The relatively high scores of this native-English-speaking sample suggests that the minimal TOEFL score of 475 establishedfor admission to the University of Tennessee is not unreasonably strin-gent.
Subjects from urban and rural areas were compared with respect totheir Listening Comprehension scores. The difference between them wasslight and nonsignificant, indicating that speaking of regional dialectshas little relationship to ability to perform this listening task, perhapsbecause of the subjects' exposure to radio and television.
133

-128-
The correlation between total TOEFL score and ACT English score was.67 (compared with .64 in the Angoff & Sharon study). That this correla-tion was not higher is attributed to the difference in difficulty of thetwo tests and the fact that they are intended for use with different
populations.
Scores for this sample were compared with those available for the215,486 foreign candidates who took TOEFL worldwide between October1966 and June 1971. The mean of the present sample, 628, is considerablyhigher than the mean of 490 for the foreign candidates. Also, the stand-ard deviation of this sample, 35.1, is considerably lower than the 80.0
observed for the foreign candidates.
In general, the results demonstrate that TOEFL is inappropriatefor use with domestic students. The relatively high mean score of thepresent sample and the narrow distribution of scores reflect the fact that
the test was not developed to discriminate among native speakers of
English.
13.E

-129- B4, El, E2, E6, F2, F5
47. Komvichayungyuen, N. (1978). Test of English as a Foreign Languageas a predictor of actual English proficiency (Doctoral disser-tation, Florida State University, 1977). Dissertation AbstractsInternational, 38, 6666A. (University Microfilms No. 7804978)
Purpose
Previous validity studies have usually assessed TOEFL's relation toother testa of English proficiency or have examined TOEFL's ability topredict academic success. This study, in contrast, examined the relationbetween TOEFL scores and teachers' ratings of students' English profi-ciency.
Method
The subjects were 57 students who had taken TOEFL and were selectedfrom 108 foreign graduate students enrolled in 15 different programs inthe College of Education at Florida State University between 1974 and1977. The sample consisted of 32 males and 25 females; 40 were Ph.D.students. Their ages ranged froi 22 to 46, with a mean of 30.8 years.They were drawn from 22 countries, representing the following regions:Far East Asia (N 8), Southeast Asia (N 14), Middle East Asia (N 15),South America (N - 11), and others (N a. 9).
The five-part TOEFL had been administered to the subjects prior toadmission to the university [presumably via International or SpecialCenter administrations!.
Each subject's English proficiency was rated in four areas: writing,reading and vocabulary, aural comprehension, and speaking. The ratingscale had five levels: elementary proficiency, intermediate proficiency,minimal academic proficiency, partial academic proficiency, and fullacademic proficiency. Each subject was rated by one or more facultymembers; only faculty members who knew a subject well provided ratings forthat subject. A subject's ratings were averaged across judges and summedover all four areas to yield a total rating of English proficiency.
Results and Conclusions
Reliabilitie.s of the ratings were determined by a special proceduredescribed by Ebel' since different subjects were rated by different
1
Ebel, R. L. (1951). Estimation of the reliability of ratings.Psychometrika, 16, 407-424.

-130-
numbers of faculty members. The obtained reliabilities, which were based
on three ratings for each subject, were writing, .29; reading and vocabu-
lary, .32; aural comprehension, .39; speaking, .28; and total of the
ratings, .71. The reader is referred to overall data reported in Educa-
tional Testing Service (1973) for the reliabilities of the TOEFL subtests.
The subjects in this sample averaged 520.75 for total TOEFL score,
which is more than one-half of a standard deviation above the mean of all
foreign candidates in the field of education. Mean part scores on the
TOEFL Listening Comprehension, English Structure, Vocabulary, Reading
Comprehension and Writing Ability sections, respectively, were 47.43,
50.80, 55.09, 55.39, and 51.02.
Mean English proficiency ratings for writing, reading and vocabulary,
aural comprehension, and speaking, respectively, were 3.98, 4.33, 4.04,
and 3.80, for a mean total score of 16.16.
Visual inspection of the data shows that the highest TOEFL scores and
ratings were earned by subjects from Southeast Asia; women earned higher
TOEFL scores and ratings than did men; and master's students earned higher
TOEFL scores but lower ratings than &A doctoral students.
High intercorrelations among ratings in the four different areas of
proficiency were observed (.84 to .91), probably due to a halo effect in
the ratings--that is, the tendency for a rater to be influenced by percep-
tion of a subject's skill in one area in judging his or her skill in
another.
The correlation between total TOEFL score and total rating was .53, a
moderate but highly significant relationship. Correlations between total
TOEFL score and rating for each of the four areas of rated proficiency did
not differ greatly, ranging from .45 to .55. It appears that TOEFL is a
moderately good predictor of English proficiency as determined by the
rating procedures used in this study. Separate correlations were computed
between TOEFL and proficiency ratings for each sex and planned degree, and
no significant differences in correlations were iaund as a function of
these variables. Thus, TOEFLIs ability to predict rated English profi-
ciency does not appear to depend on the sex or planned degree of the
subject.
Tables are presented indicating the kinds of rated proficiency levels
associated with each of several ranges of TOEFL scores. It is concluded
that more data need to be gathered for subjects with TOEFL scores below
500 in order to derive a more reliable content-referenced scale.
136

-131- B7, GI
48. Ku, E. J., & Frisbie, D. A. (1979, April). An examination of theconfoundin in measures of forei las,.uaWe listening com rehenzsion. Paper presented at the meeting of the National Council or
Measurement in Education, San Francisco.
Purpose
The moderate to high relationship between measures of reading compre-hension and listening comprehension on TOEFL and similar tests may be dueto the structure of the typical test of listening comprehension, as itrequires the subject to read the response alternatives. To address thisissue, this study examined the correlation between TOEFL Reading Compre-hension and each of two measures of listening comprehension: (a) theTOEFL Listening Comprehension subtest, and (b) a completely oral modifica-tion of that subtest.
Method
The subjects were 150 foreign students from Hong Kong and Taiwan,undergraduate and graduate student volunteers at the University of Illi-nois at Urbana-Champaign. Of these 150 subjects, 30 comprised the samplefor a pilot study, and 120 formed the main sample. In the pilot study,all 30 subjects were administered the Reading Comprehension subtest; 15were also administered the traditional Listening Comprehension subtest and15 the experimental listening test. In the main study, 120 subjects wereadministered the traditional Reading Comprehension subtest; 60 were alsoadministered the traditional Listening Comprehension subtest and 60 theexperimental listening test (with presentation or .!r counterbalanced toeliminate possible order effects).
The traditional Listening Comprehension and Reading Comprehensionsubtests of the five-part TOEFL were administered as described in theIntroduction to the summaries. Fifty items were used in the ListeningComprehension test. The experimental (oral) listening test used atrue-false format and included 64 items (to ensure that testing time wouldbe equal to that for the traditional Listening Comprehension subtest).For example, in one part of the test the subject heard "When did Tom comehome?" "By taxi"; the subject was then asked to indicate whether theresponse heard made sense in relation to the question. The measures usedin the pilot study and in the main study were basically the same exceptthat eight of the 64 items in the experimental listening measure wererevised in preparation for the main study to improve the test's discrimi-nation power.

Results
In the pilot study, KR-21 resiability of the experimental listening
test was found to be lower (.65) than that of the traditional Listening
Comprehension subtest (.81). Attenuated correlations between ReadingComprehension and listening scores were .90 for the traditional Listening
Comprehension subtest and .47 for the experimental listening test.
In the main study, KR-20 reliability of the experimental listening
test was .73 and of the traditional Listening Comprehension subtest, .86.
In contrast with results for the pilot sample, the data showed nearly
identical correlations between the Reading Comprehension and the tradi-
tional Listening Comprehension subtests (.59) and between the Reading
Comprehension subtest and the experimental listening test (.57); correla-
tions corrected for attenuatiml were .78 and .77.
Conclusions
Despite a suggestion to the contrary from the pilot data, the TOEFL
Reading Comprehension subtest did not correlate more highly with thetraditional Listening Comprehension subtest than with the experimental
listening test. The rationale for expecting a higher correlation in the
first case than the second still seems logical, however, since the tradi-
tional TOEFL Listening Comprehension subtest requires the reading of
response alternatives. Perhaps both the reading and traditional listening
tests used here were too easy for these subjects (high means and low
standard deviations of scores suggests that this may have been the case)
and that a more diverse sample might well show the expected difference in
correlations. ,ftlso, the quality and reliability of the experimental
listening measure could be further improved. In general, conclusions
should not be dr ,wn until the study can be repeated on a larger scale,
with a more diverse group of subjects and a revised experimental list,f.ning
test.
13 s

-1 3 3- B7
49. Little, B. G. (1980). Acquisition of determiner functions. Unpub-
lished master's thesis, University of California--Los Angeles.
Purpose
This study examined Japanese students' knowledge of whe'n to use
definite, indefinite, and zero articles in English, a particular problemfor Japanese students because their language lacks a comparable articlesystem. Questions under investigation were: (a) Are there clear differ-ences in article usage between high and low proficiency students? (b) Do
measures of article usage correlate with scores on TOM and the MichiganPlacement Test? and (c) Are there patterns showing the relative difficultyof different functions served by the different articles? This summaryfocuses primarily on the relation to TOEFL and the Michigan test; thevarious functional patterns are treated only briefly.
Method
The subjects for the study were 27 Japanese students, 10 female and17 male, in the intensive English program at the University of Californiaat Riverside. Two proficiency groups were defined according to scores onthe Michigan Placement Test (high group: 64 to 95; low group: 28 to 54).The 27 subjects were those (among 94 total Japanese students in theprogram) who (a) were present for the duration of the study, (b) were in awriting class, (c) completed both parts of the Article Survey describedbel:4, and (d) had Michigan test scores in the ranges indicated above.
Two measures of article usage were used: (a) the Survey of theEnglish Determiner System, or "Article Survey" developed by the author,and (b) article usage in a written composition. The Article Survey was atwo-part test. The first part consisted of 50 multiple-choice items. For
each item, a sentence containing a blank space was presented and thesubject was to indicate which of the following choices correctly filledthe space: "a," "an," "the," "no determiner," or "optional." The second
part was a modified cloze test, with 35 blanks to be completed using the
correct article (or zero article). The text was edited from a story in a
fourth-grade science book. In earlier research with 40 nonnative adultESL students, KR-20 reliability of the Article Survey was found to be .89;the correlation between parts was .75. Although a second study of 30advanced English students given Part I showed a reliability of only .49,this was probably due to restriction in range. Part I reliability for thetwo samples combined was .78.
In the present study the composition was written during a regularlyscheduled writing class, with 50 minutes allowed for its completion. The

-134-
topic for the composition was "A typical American cowboy," and 30 relevantvocabulary words were provided. Article usage was analyzed in the follow-ing manner. The presence or absence of the required article was deter-mined for each obligatory context. The number, of errors was subtractedfrom the number of obligatory contexts, and the difference was divided bythe number of obligatory contexts to yield the subject's score.
Scores were available on TOEFL [presumably the three-part version,administered via the International or Special Center program]. TheMichigan Placement Test was administered to all subjects at the outset ofthe academic quarter, a few weeks before the beginning of this study.[The structure of this test is not described.]
Results and Conclusions
Scores on the Article Survey were significantly higher for the highthan the low proficiency group. Separate analyses for each of the twoarticles, "a" and "the," and for the zero article (i.e., the absence of anarticle) also showed the two groups to differ significantly in all threecases. Analyses according to specifiC function of each article were alsoperformed (four functions of the indefinite article, five of the definitearticle, and two of the zero article; e.g., functions of the indefinitearticle include (a) the number one, (b) one undifferentiated specimen in aclass, etc.). In these analyses the group differences were generally toosmall to be sigaificant. For the written composition, the trend was inthe direction of a difference between proficiency groups in correctarticle usage, but the group difference in this case was not significant
.10).
The Article Survey correlated .71 with the Michigan Placement Teatand .58 with TOEFL (both correlations were significant). Thus, theMichigan test appears to be a moderately good predictor of overall per-formance on the test of article usage, and TOEFL also a moderately good,though a slightly less valid, predictor. Separate scotea for the variousarticle functions did not correlate well with TOEFL and the Michigan test,as the only significant correlations were those involving the general use
of the zero article (TOEFL: r .65; Michigan: r - .74) .
Article usage scores derived from the composition correlated .47 withTOEFL and .37 with the Michigan test. While both of these correlationswere significant, apparently the scores on these tests do not provide very
accurate prediction of correct article usage in writing Overall the
results involving correlation with TOEFL and the Michigan test indicatethat scores on these tests do not strongly reflect the subject's abilityto use the English article system correctly. Scores on these tests do
not, therefore, bear directly on development of strategies for teachingarticle functions.
0

-135-
Other results of interest include the following: (a) Various func-tions of the articles showed roughly the same rank ordering of difficultyfor both the low and high proficiency groups. (b) When the data for theArticle Survey and the composition were combined, article omission consti-tuted 51 percent of all errors; incorrect ure of the indefinite article,25 percent of errors; and incorrect use of the definite article, 24percent of errors. (c) In the compositions, more than half of the lowproficiency group failed to produce situations involving seven of the 11functions, and more than half of the high proficiency group failed toproduce situations involving throe of the same seven functions. This lastresult supports earlier claims that second language learners tend to avoidcertain situations in which they are unsure of correct article usage.
Both the low and high proficiency groups had the greatest difficultywith the definite article followed by the indefinitesarticle, then thezero article. This observed order of difficulty differs from that foundin two other studies cited--one involving Japanese subjects only, theother involving 29 different language groups--in which the order ofdifficulty from highest to lowest was indefinite, definite, and zeroarticle; Reasons for the difference among studies remain to be deter-mined. Perhaps the difference is due to the different degrees of profi-ciency of the subjects in the various studies or differences in theinstruments used.

-136- D1
50. Martin, C. M. (1971). A model liar the cultural and statisticalanalysis of academic achievement of foreign graduate students atthe University of North Carolina at Chapel Hill (Doctoraldissertation, University of North Carolina at Chapel Hill,1971). Disse-tation Abstracts International, 32, 2311A.(University Microfilms No. 71-30, 578)
Purpose
This study addressed four sets of questions regarding academicperformance of foreign graduate students at the University of NorthCarolina: (a) Do students who have taken TOEFL and been admitted withsatisfactory scores differ from those who have been admitted withouthaving taken TOEFL? (b) Does the difference between the above-mentionedtwo groups vary as a function of the students' geographic origin or majorfield of study? (c) Are there differences in academic performance amongstudents from different geographic regions or among students enrolled indifferent major fields? (d) For those who have taken TOEFL, what is therelation between academic success and scores on each of the TOEFL sub-tests?
Background
For the past five years (1964-1969), the University of North Carolinaat Chapel Hill has begun to require TOEFL of all foreign applicants.However, the requirement has not been strictly enforced, and only about 25percent of enrolled students have taken TOEFL and received the minimumscore required by the university (see below). For others, English profi-ciency has been determined on the basis of (a) certification b3va U.S.government official or local English professor, (b) interview with auniversity representative, (c) school record, or (d) the student's self-evaluation or correspondence in English.
Method
The subjects were 144 male foreign graduate students who had beguntheir studie at the Universi*y of North Carolina at Chapel Hill betweenfall 1964 and 311 1969. (Too few females were available for inclusion inthe sample.) total of 72 subjects had taken the five-part TOEFL andreceived the required minimum score. (At the time of the study, theuniversity's required minimum was a total score of 500 and a score of 50
on each subtest; however, previous scores had not met these criteria inevery case.) These subjects were matched, with respect to geographicorigin and major field, with 72 other students who had not taken TOEFL.
142

-137-
Forty countries were represented. For statistical analysis, subjects weregrouped according to three major geographic regions: Europe and SouthAmerica (including Cyprus, the Dominican Republic, and Puerto Rico; N44); Middle East (N 0 42); and Asia (N so, 58). A total of 35 major fieldswere represented; for analysis, these have been subdivided into fourgroups: the humanities (N 141 22); the social sciences (including philos-ophy and political science) (N 40); the sciences (natural sciences andmathematics) (N ow 32); and professional schools (N 48). [Major fieldsfor two students are not reported.]
Data from the five-part TOEFL were available from the subjects'records [presumably based on administrations of the test in the Interna-tional Testing Program].
Grade-point averages (GPAs) were 'calculated by the investigator.Although the University of North Carolina has no grade-point system assuch, the following grades are given in each course: H (highest), P, L, Fand Incomplete. The investigator assigned the following numbers to eachgrade: H 3, P 2, L 1, F 0, and Incomplete O. An average wasthen calculated, with the grade for each course weighted by the number ofcredit hours for that course.
Results and Conclusions
T tests were used to test for differences among various subgroups.It is noted that, because of the large number of t tests computed, somemay have been significant by chance.
The first analyses of interest were comparisons of students who hadtaken TOEFL with those who had not. T tests showed the TOEFL takers tohave significantly higher GPAs for both the first semester (2.20 vs 1.85)and the second semester (2.13 vs 1.67). A breakdown by geographic areashows the difference between TOEFL takers and non-TOEFL takers to besignificant for all three major groups: Europeans and South Americans,Asians, and Middle Eastern subjects. A breakdown by major field showsthat TOEFL takers had significantly higher first-semester grades thannon-TOEFL takers for the sciences and the professions and significantlyhigher second-semester grades for the sciences, professions, and socialsciences.
Analyses were also performed comparing the grades of the majorgeographic groups, separately for TOEFL takers and non-TOEFL takers. Only
two of 12 possible differences were significant, both involving first-semester grades: (a) Middle Eastern subjects outperformed Asians amongthose not taking TOEFL, and (b) Middle Eastern subjects outperformedEuropeans and South Americans among those taking TOEFL.
Comparisons among major-field groups showed eight of 24 differencesto be significant. For TOEFL takers, first-semester grades were higher
143

-138-
for the sciences than for (a) the humanities, (b) the social sciences,and (c) the professions; second-semester grades were lower for the humani-ties than for (a) the social sciences, (b) the sciences, and (c) theprofessions. For non - TOEFL takers, second-semester grades for the sciencesexceeded those for the social sciences and for the professions.
Correlations were computed between GPA and each of the TOEFL sub-scores for the 72 subjects who had TOEFL scores; correlations of CPAs(first- and second-semester) with TOEFL subscores ranged from -.17 to -.09(all nonsignificant).
In general, subjects who took TOEFL and received scores satisfactoryfor admission perfrrmed better in both semesters than did those who hadnot taken TOEFL, and this was true for subjects from all three geographicgroups. Thus, TOEFL appears to be a factor in the academic achievement offoreign male graduate students, at least those in the present sample.
For those admitted on the basis of satisfactory TOEFL scores, thelack of a significant correlation with GPA for any of the subtests indi-cates that, for these students, a relationship between TOEFL and academicperformance cannot be inferred and no one TOEFL subtest is a betterpredictor than another.
14 4

-139- A2, DI, FI, F2, F3, F4
51. Maxwell, A. (1966). A comparison of TOEFL and the UCB/EFL test.Unpublished master's thesis, Sacramento State College, CA.
Purpose
This study investigated the validity of the University of California,Berkeley, Test of English as a Foreign Language (UCB/EFL) by correlatingit with TOEFL. The study also examined the predictive validity of bothmeasures as reflected by correlations with students' overall grade-pointaverage (GPA).
Method
The five-part TOEFL and the UCB/EFL were administered to 238 foreignstudents enrolled at the University of California, Berkeley, during thefall of 1964. The UCB/EFL consists of five parts. Part 1 consists of 55multiple-choice items covering grammatical points included in a book onEnglish sentence patterns. Part 2 consists of 20 multiple-choice itemsbased on everyday vocabulary. Part 3 contains 10 multiple-choice itemstesting punctuation points for which there are firm rules. Part 4 consistsof 20 low-frequency words that must be spelled by the subject. This partemphasizes major spelling patterns and the ability to discriminate Englishsounds ("r" vs. "1", etc.). Part 5 is a 100-150 word dictatio.4 test.
Student GPA for the 1964-65 academic year was based on contentsubject areas only. Thus, grades in physical education and remedialspeech were deleted from the data. Separate correlations were calculatedfor separate subject areas.
Results
The correlation between TOEFL and the UCB /EPL was .87. The subjectsshowed a mean TOEFL score of 525 with a standard deviation of 79. Corre-lations with GPA for groups larger than 20 are depicted in Table I.
145

-140-
Table 1
Correlations of TOEFL and UCB/EFL with GPAfor Various Groups of Subjects
Correlationwith GPA
Subject Group N TOEFL UCB/EFL
All subjects 238 .17 .11
Undergraduates 191 .58 .53
Graduate students 47 .02 -.01
Economies/business majors 39 .45 .37
Engineering majors 101 .24 .20
Languagstiperature majors 21 .16 .07
Nature science majors 27 .38 .16
Subjects from Europe 105 .07 .01
Subjects from the Middle East.10
27 .50 .49
Subjects from the Far East 61 .24 .15
Males 202 .15 .12
Females 36 .33 .15
SignificanceLevels
TOEFL UCB/EFL
.01 ns
.01 Jyr
ns ns.01 .05
.05 .05
nona
ns RE.01 .01
ns
ii ns
.05 na
Conclusions
The high TOEFL-UCB/EFL torrelation indicates that both tests aremeasuring similar characteristics. Both are valid predictors of GPA at
the undergraduate bevel, while neither is a valid predictor at the gradu-
ate level. Considering the number of cases in which each test was signi-ficant, it would appear that TOEFL is the better predictive measureoverall.
1 4 6

-141- B2, H
52. Mullen, K. A. (1978). Determining the effect of uncontrolled sourcesof error in a direct test of oral proficiency and the capabilityof the procedure to detect improvement following classroominstruction. In J. L. D. Clark (Ed.), Direct testing of !peak-ing proficiency: Theory and application. Princeton, NJ:Educational Testing Service.
Purpose
This study sought to determine the reliability of an oral interviewprocedure and to determine the effects of classroom instruction in Englishas a second language (ESL) on the amount of improvement in both oralinterview and TOEFL scores and on correlations between TOEFL and interviewscores.
Method
The main sample consisted of 107 students in the ESL program at theUniversity of Iowa who were given an oral interview both before and aftera period of instruction. For 15 of these subjects, the five-part TOEFLwas administ.red both before and after instruction; three additionalsubjects were given the Listening Comprehension subtest of the TOEFL atboth times.
Each oral riterview was conducted by two experienced ESL instructorsand lasted 15 t 20 minutes. One interviewer took the lead in the inter-view, while the )ther listened and occasionally interjected questions tofacilitate the conversation. After a general discussion to put thesubject at ease, the subject was asked about a topic on which he or shecould speak with authority for some time--e.g., regarding his or hipfamily, education, academic interests, goals, opinions, impressions, orattitudes. After eacl, interview the two interviewers rated the subject onfive scales: listening comprehension, pronunciation, fluency, grammar,and overall proficiency. For each scale, five rating categories wereused: poor, fair, good, above average, and excellent; interviewers wereallowed to give ratings midway between any two categories, thus producinga nine-point rating system.
The subjects were interviewed twice, once when first evaluated forplacement, and again after a semester of instruction. Instructors inter-viewed students who had not been in their classes, and some new studentswere interviewed during the second session to ensure that interviewerscould not distinguish old and new students.

-142-
Results and Conclusions
Interview reliabilities obtained for the first and second sessionswere not significantly different from each other for any of the fivescales, and the mean reliabilities.for these five scales ranged from .78to .89. (Note that mean ratings provided by the two interviewers for eachsubject did not differ significantly, and, in ill analyses, a subject'sinterview score was the average of the two Interviewers' ratings. Thesereliabilities were based on 115 subjects interviewed in the first sessionand 152 subjects in the second.)
T tests for the main sample of 107 subjects showed that there wassignificant improvement from the first (pre-instruction) session to thesecond (post-instruction) session on all five interview scales. For thesubsasple of 15 subjects for whom TOEFL scores were available (18 subjectsfor Listening Comprehension), significant improvement was evident on fourof the five interview scales (all but grammar) as well as the overallscore and cn three of the five TOEFL subtexts (Listening Comprehension,English Structure, and Writing Ability) as well as the total score.
Of the TOEFL subtests, Listening Comprehension is most relevant tothe topic of this paper, assessment of oral proficiency. Since thissubtest requires some reading as well as listening, it is possible thatimprovement on this subtest could be at least partly due to improvement inreading proficiency. However, since the mean score on the Reading Compre-hension subtext did not also show a significant improvement from the firstto the second testing session, the performance change in Listening Compre-hension appears to be due to a change in actual aural proficiency. Thisis consistent with the observed improvement in scores on the listeningcomprehension scale of the interview, as well as with the improvement inthe other oral skills shown in the interview: pronunciation and fluency.
The TOEFL English Structure subtest might be regarded as a measure ofpassive control over English, since this test allows contemplation ofpossible choices, whereas the interview might be regarded as a measure ofactive control. If this'is true, and if passive control is greater thanactive control. it would be expected that TOEFL and interview scores wouldnot be highly correlated in the first testing period; however, as thesubjects receive instruction and experience in English, they shoulddevelop active control as well as passive control, and thus the correla-tion between the interview and TOEFL scores should be higher for thesecond testing period. This was indeed the case. None of the correla-tions between TOEFL subtests and the interview was significant in thefirst session (r's ranged up to .37), whereas. several correlations weresignificant in the second session, particularly for two TOEFL subtests:TOEFL Listening Comprehension correlated significantly with interviewscores in listening (.45), grammar (.43), and overall score (.54); andTOEFL Vocabulary correlated significantly with interview scores in listen-ing (.46), pronunciation (.70), grammar (.46), and overall score (.44).
S

-143-
In general, the results demonstrate a reasonably reliable interviewprocedure for testing subjects' speaking proficiency. Low correlationsbetween TOEFI, and interview scores in the first session suggest that,initially, proficiency is low end passive control exceeds active control.However, the increase in correlation between TOM and interview scoresas the student receives language instruction suggest a diminution in thedifference between active and passive control of English.

-144- B7
53. Mullen, K. A. (1979). An alternative to the doze test. In C. A. 0
Yorio, K. Perkins, 6 J. Schacter (Eds.), On TESOL '79, The
learner in focus (pp. 187-192). Washington, DC: Teachers of
English to Speakers of Other Languages.
Purpose
This study compared performance on an editing test with performance
on a doze test and two direct tests of English proficiency. The two
direct tests were en oral interview and a writing task. Relationships of
these measures with TOEFL were also investigated for subjects with TOEFL
test scores.
Method
The subjects were 54 foreign candidates for admission to the Univer-
sity of Louisville, including some who were seeking to transfer from
community colleges. The subjects, who varied in their exposure to English
language programs, were administered four proficiency tests: an editing
test, a cloze test, a writing task, and an oral interview. Scores on
the three-part TOEFL were available for 22 of the subjects [presumably
obtained in International or Special Center administrations].
The editing test, based on a passage written at a seventh-gradereading level, required that the subjects cross out 50 words that did not
belong in the passage. The 50 words in question had been taken from the
original passage and had been subsequently inserted at random into that
passage. Two performance scores were obtained for this task. The mis-
identification score was the number of words that belonged but were
crossed out. The nonidentification score was the number of words that did
not belong but were not crossed out.
The doze test was also based on a passage written at a seventh-grade
reading level. Every tenth word was deleted from the target passage and
replaced by a blank, for a total of 50 deletions. The subjects were asked
to fill in each blank with a word, consistent with the grammar and meaning
of the surrounding text. The doze -exact score was based on the subject's
reproduction of the exact words deleted. The doze- acceptable score wasbased on the subject's generation of words that were semantically and
syntactically acceptable in the context.
In the writing task the subjects wrote an essay on a topic selected
from a number of possible topics. No time limit was imposed. Four
readers evaluated each composition, and each reader assigned a score from
I (poor) to 9 (excellent) on each of four dimensions: structure, organi-
zation, quantity, and vocabulary. The final score was the percent of
total possible points a subject had earned, combined across all dimensions
and readers.
150

-145--
Forty-three of the 54 subjects were administered the interview teat.The scoring procedures were similar to those used for the writing task,except that the four rating dimensions were comprehension, fluency,control over structure, and pronunciation.
Results and Conclusions
Table 1 displays the mean score, standard deviation, and sample sizefor each measure.
Table 1
Mean Scores and Standard Deviations for Editing Test, Cloze Test,TOEFL, and Composition and Interview Evaluations
Measure Me an SD N
Editing --Nonidentification ( 0 wrong) 19.44 13.62 54Editing --- Misidentifications ( 0 wrong) 17.98 14.20 54Cloze- Acceptable ( 0 right) 21.50 10.45 54Cloze-Exact ( 0 right) 14.90 8.27 54TOEFL Listening Comprehension 47.27 5.56 18TOEFL Structure and Writtten Expression 46.78 7.35 14TOEFL Reading Comprehension and Vocabulary 48.21 7.06 14TOEFL Total 468.40 51.66 22Composition - -% of possible points 54.50 21.98 54Interview--% of possible points 62.41 22.30 43
Table 2 displays the correlations among the various measures. Thesecorrelations indicate thmt the nonidentification score on the editing testtended to correlate higher with the other measures than did the misidenti-fication measure or a composite of the nonidentification and misideniifi-cation measures.

-146 -
Table 2
Pearson Product-Moment Correlatione of Scores on the Editing Test with the
Cloze Test, TOEFL, and the Compcsition and Interview Evaluations
Measure
./Nw.....411
Score on Editing .ec...
Misident. Nonident .Misidente+Nonident.
Cloze-Exact -.25* -.73*** -.58*** 54
Cloze-Acceptable -.39** -.85*** -.74*** 54
TOEFL Listening Comprehension -.32 -.60** -.53* 18
TOEFL Struc. & Written Express. -.55** -.60** ,, -.64** 14
TOEFL Rdg. Comp. & Voc. -.05 . .16 .n7 14
TOEFL Total -.25 -.43* -.43* 22
Composition -.39** -.82*** -.71*** 54
Interview -.15 -.74*** -.53*** 43
< .05 0,41 < .01 ***2 < .001
Interestingly, the number of insertions correctly identified on the
editing test (i.e., the complement of the nonidentification score) corre-
lated higher with the composition score (.82) and with the interview score
(.74) than did the doze- acceptable score. (Corresponding correlations
for the doze- acceptable score were .77 and .67.) An inspection of item
facility and discrimination indices showed that the two scores on the
editing test had more desirable item characteristics than did the two
scores on the doze test. The interitem reliability of the number of
insertions correctly identified on the editing test (.96) was higher than
the corresponding reliability of the doze- acceptable score (.92).
In summary, the data suggest that the nonidentification score on the
editing test was superior to the misidentification score or the combina-
tion of the two, and was superior to the doze- acceptable score, asmeasured by correlations with the direct indices of English proficiency.

-147-- Bl
54. Mullen, le E.. (1979). More on cloze tests as tests of proficiency inEng1101 as a second language. In E. J. Briere & F. B. Hinofotis(Eds.), Concepts in language testing: Some recent studies(pp. 21-32). Washington, DC: Teachers of English to Speakersof Other Languages.
Purpose
This study investigated performance on a cloze reading test as afunction of cloze passage difficulty and method of scoring. It alsoinvestigated the criterion validity of cloze test performance in relationto performance on an oral interview, TOEFL, and a composition task.
Method
There were 154 subjects in the study, all of whom were administeredan oral interview, a writing proficiency (i.e., composition) test, and acloze test. TOEFL scores were available for 80 of the 154 subjects [thesource of the subjects and whether the three- or five-part TOEFL was usedare not indicated].
The oral interview was 15 minutes in length, and 15 pairs of inter-viewers were involved. Interviewers first asked general questions relatedto the subject's background and future plans, then asked more specificquestions. The two interviewers judged the subject's speaking proficiencyon four scales: listening comprehension, pronunciation, fluency, andgrammar. Scores ranged from one to nine on each scale.
The cloze test was administered following the oral interview. Thistest consisted of two passages, one classified as easy, the other asdifficult, drawn from reading instruction material. The easy passage wasidentified as a seventh-grade level text, and the difficult passage, atwelfth-grade level text. The cloze versions of the passages were con-structed by deleting ev7-. tenth word after the first paragraph, for atotal of 50 deletions. Order of presentation of the easy and difficultcloze passages was counterbalanced across subjects. One hour was allottedfor completion of the entire test.
The composition test was administered after the cloze test. Thesubjects were given a booklet and were allowed one hour to write on anunspecified topic; they were told that their compositions would be evalu-ated on the basis of accurate sentence construction, appropriate use ofvocabulary, organization of ideas, and quantity of writing. Compositionswere scored by pairs of judges randomly selected from among eight pairs.Scores consisted of ordinal ratings on control over English structure,organization of ideas, quantity of writing, and appropriateness of vocabu-lary.
153

-148-
The data for analysis consisted of the interview score, the composi-tion score, and the TOEFL score. Performance on the cloze test wasdescribed in terms of four measures: easy/exact score, easy/ac-eptablescore, difficult/ exact score, and difficult/acceptable score. Theseterms referred to the difficulty level of the passage and whether thesubject was scored according to reproduction of the original word deleted(exact score) or a semantically acceptable response (acceptable method).
Results and Conclusions
Analysis of variance indicated that cloze test performance was mostaffected by individual differences among subjects and, to a much lesserdegree, by method of cloze scoring, passage difficulty, and the order inwhich the passages were presented. Method of cloze passage scoringaccounted for more variance in scores than did level of passage diffi-culty, despite the fact that the easy passage was rated at the seventh-grade level and the other passage was rated at the twelfth-grade level.
The correlation between exact-word cloze score and oral interviewscore was not significantly different from the correlation between accept-able-word cloze score and oral interview score. This was true for both
easy and difficult cloze passages. The highest of these four correlationswas that involving the acceptable-word score for the easy passage (r
.57).
The correlation of exact-word cloze score with TOEFL score was notsignificantly different from the correlation of acceptable-word clozescore with TOEFL score. This finding applied regardless of cloze passagedifficulty level. The highest of these correlations was between theacceptable-word cloze score for the easy passage and TOEFL score (r.69), which accounted for 47.8 percent of the variance in TOEFL scores.
The pattern of correlations involving the compositions wrl somewhatdifferetit. For the difficult (but not the easy) cloze passage, LAe accept-able-word cloze score correlated significantly higher with compositionscore than did exact-word score. Acceptable-word scoring of the easy
cloze passage produced the highest correlation with composition test score(.76), predicting 58 percent of the variance in composition scores. In
summary, the easy cloze passage score was the best predictor of scores onall three criterion measures, and this effect was most prominent foracceptable-word scores.
Inspection of the reliability coefficients for the various measuresindicated that the correlation between a given cloze measure and a givenproficiency test score was always less than the reliability of the testscores involved in the correlation. The reliability data indicated thateach criterion score measured some aspect of second language proficiencythat was not measured by the cloze test scores. This is shown by the fact
13.1

-149-
that the percentage of reliable variance in the interview that was notpredicted by the clone test ranged from 58 percent for easy/acceptablescore to 69 percent for difficult/exact score; analogous percentages forTOEFL ranged from 45 percent to 62 percent and, for the composition, from32 percent to 53 percent.
In general, it appears that the predictive ability of various clonetest scores was dependent on whether speaking or writing was the criterionmeasure.

-150- D1, E2, E6
55. Odunze, O. J. (1982). Test of Englich as a Foreign Language and
first year CPA of Nigerian students (Doctoral dissertation,
University of Missouri--Columbia, 1980). Dissertation Abstracts
International, 42, 3419A-3420A. (University Microfilms No.
8202657)
Purpose
The objective of this study was to determine the relationship between
TOEFL and the academic performance of Nigerian students in four U.S.
universities. The study also sought to determine whether TOEFL scores
differ as a function of various background variables.
Method
Questionnaires soliciting participation were sent to 289 Nigerian
students in four Missouri universities, and questionnaires were returned
by 260 students. A total of 220 respondents were undergraduates, and 118
of them had taken either the three-part or the five-part TOEFL between
fall 1975 and winter 1980 [presumably via International or Special Center
administrations! (none of the graduate students had taken TOEFL). These
118 students comprised the sample for the study. Three of the four major
ethnic groups of Nigeria were represented: Ibo (40 subjects), Yoruba
(40), and Efik (38); no Hausa students had taken TOEFL.
Grade-point averages (GPAs) were available for all subjects, sepa-
rately for the first semester and the second semester at their U.S.
universities.
Background information was also obtained from the students' question-
naires, including (a) ethnic group, (b) type of secondary school attended,
(c) performance on the West African School Certificate examinations, (d)
sex, and (e) parents' education.
Results and Conclusions
Correlational analyses showed no significant relationship between
TOEFL scores and either first-semester GPA (r .05) or second-semester
CPA (r .00). Several analyses of variance were also computed, to
determine whether TOEFL scores differed as a function of various back-
ground variables. These analyses revealed no significant differences in
TOEFL scores (a) among the three ethnic groups; (b) between subjects
passing the West African School Certificate examination in division II and
those passing in division III; (c) between males and females; (d) between
students from government and private secondary schools; (e) between
15G

-151-
students from Catholic and Anglican private schools; or (f) betweenstudents whose level of parental education was elementary, high school,university, or none.
Analyses of variance also showed that students from Catholic, Angli-can, and government secondary schools did not differ in first-semester GPA[analysis of second-semester GPA is not reported] and that neither first-nor second-semester GPA varied as a function of ethnic group.
Analyses were also conducted involving TOEFL Listening Comprehensionand English Structure subscores. [ "English Structure," for those takingthe three-part TOEFL, is assumed to mean the Structure and WrittenExpression section. Analyses involving a "Vocabulary" score are alsoreported, but a separate vocabulary score cannot have been available forstudents taking the three-part TOEFL, so these analyses are not summarizedhere as their meaning is not clear.] The correlation between ListeningComprehension and first-semester GPA was significant (r .26). EnglishStructure was not significantly correlated with first-semester GPA (r.04). [Comparable analyses for second-semester GPA are not reported.]
It is concluded that TOEFL is not a good indicator of academicsuccess in college. Although there was a small, significant relationbetween Listening Comprehension and academic performance, the replica-bility of this result needs to be determined.

-152- G2
56. Oiler, J. W., Jr., b Rinofotis, F. B. (1980). Two mutually exclusive
hypotheses about second language ability: Indivisible orpartially divisible competence. In J. W. Oiler, Jr., 8 K.Perkins (Eds.) , Research in language testing (pp. 13-23).
Rowley, MA: NewbiwyRouse. (Set Document Reproduction Service
No. ED 139 267).
Purpose
To gather evidence that would support either a unitary or a divisible
competence hypothesis about the nature of second language proficiency,
interrelationships among measures were explored.
Method
Test data were gathered from two groups. The first group was com-
posed of 159 students at the University of Tehran in Iran. With the help
of the university and the American Field Service, all of these subjects
were administered the five-section TOEFL plus a doze test and a dictation
test during 1972 and 1973. The seven measures were intercorrelated and a
factor analysis was performed on the data.
The second group was composed of 106 students at the Center for
English as a Second Language (CESL) at Southern Illinois University (SIU).
All of these subjects took a doze test, the three-part (Listening Compre-
hension, Structure, and Reading) CESL Placement Examination, and the
Foreign Service Institute (FSI) oral proficiency interview, which produced
five scores: accent, grammar, vocabulary, fluency, and comprehension. A
subgroup of these students (N - 51) took the five-section TOEFL; these
students generally fell into the top half of the sample with respect to
English proficiency. [The nature of the test administration is notindicated.] Intercorrelations mere computed among the nine measures for
the larger group (and among the 14 measures for those taking TOEFL);
principal components factor analyses were also performed.
Results
The analysis for the Iranian students indicated that a single factor
accounted for 100 percent of the total variance in the matrix. The
product of the loadings of each pair of tests on the first or general (1)
factor was almost identical to the correlation between the testa. This
indicates that the general factor accounted for the correlation between
each pair of measures.
158

-153-
Factor analysis for the SIU students identified two factors thataccounted for 100 percent of trte total variance. The first factor ac-counted for 87 percent of the variance and received no loading less than69 percent on any single measure. Thus, about 13 percent of the totalvariance was not accounted for by the" factor. Examination of the factorsolution suggests the existence of a separate oral factor that explainsthe loading on the FSI interview.
Among the subgroups that took TOEFL, there was considerably lessvariance on the CESL and FSI measures. In this case, thel factor ac-counted for only 65 percent of the total variance on the three batteriesof tests. Analysis of data for the subjects who took TOEFL indicated thepossible existence of a third factor (listening), since heavy loadings onthis factor were observed for both the TOEFL and CESL Listening Comprehen-sion sections.
Conclusions
Considering the results of all three sets of data, there is nosupport for the notion of separate components of structure, vocabulary,and phonology. There is some evidence for a speaking factor associatedwith performance on the FSI interview. Overall, the evidence points tothe existence of a general proficiency factor that accounts for 65 percentor more of the total variance in the several tests investigated.
159

57. Oiler, J. W., Jr., & Spolsky, B. (1979). The Test of English as a
Foreign Language. In B. Spolsky (Ed.), Some major tests.
Advances in language testing series: 1. Papers in applied
linguistics (pp. 92-100). Arlington, VA: Center for Applied
Linguistics. (Edited volume available as ERIC Document Repro-
duction Service No. ED 183 004)
Purpose
This descriptive/analytic paper deals with the history of TOEFL's
development, assumptions underlying the test, its use and interpretation,
and future directions. (See also summaries of Jameson & Malcolm, 1973,
and Palmer, 1965, for details on the early history of TOEFL.]
Discussion
History of TOEFL
At a 1961 conference on English language testing, the need was
expressed for a systematic method of assessing the English proficiency of
foreign applicants to U.S. colleges; this need was made further apparent
by a 1962 survey of U.S. colleges, showing that several methods for
evaluating applicants' English proficiency were in use at the time. On
the basis of suggestions made at the 1961 conference, the National Council
on the Testing of English as a Foreign Language was formed, representing
30 organizations. With foundation support, the National Council estab-
lished a staff to develop a test, to be named the Test of English as a
Foreign Language, or TOEFL. The test was developed in 1963 and first
administered in 1964. This objective test consisted of five parts [as
described in the Introduction to this collection.]
Various procedural changes have taken place over the years. Until
1969, all new questions were specially pretested with foreign students at
American institutions; thereafter, all regular administrations in domestic
test centers included experimental items to be included in later opera-
tional tests. Also, local agents have taken over administrative functions
where possible. Further, a new equating system was developed that would
not require the reuse of items and thus jeopardize test security. Despite
such procedural changes, however, the basic format of the test had not
changed substantially at the time of this writing.
Assumptions
The following principles were set down to guide TOEFL development:
(a) contrastive analysis should not serve as a basis for test construc-
tion, (b) testing of reading comprehension should not involve diffiCult
160

-155-
vocabulary, and (c) language should be presented in a realistic context.In addition, test development also appeared to involve two implicitassumptions: (a) the test should be standardized in relation to a largepopulation of nonnative speakers, and (b) various skills should be tested,with the test containing both discrete-item sections (English Structure,Vocabulary, and Writing Ability) and more integrative sections (Listeningand Reading Comprehension).
From a linguistic standpoint, these last two assumptions might bequestioned. Regarding the first assumption, one could argue that the testshould be standardized in reference to native rather than nonnativespeakers, particularly if the test is to be used to estimate readiness tostudy in the U.S. Angoff and Sharon (1971) found that, in the WritingAbility section of a certain TOEFL form, nonnative speakers outperformednative speakers on a full 21 percent of the items. This would suggestthat all TOEFL sections have not always focused on tasks that nativespeakers do well.
Regarding the second assumption, there is much research to suggestthat the subscores on TOEFL or any other language proficiency test tend tobe highly intercorrelated. Although the TOEFL manual (Educational TestingService, 1973) reports low correlations between Listening Comprehensionand other parts of the test, for most nonnative speakers the ability tolisten with comprehension is highly related to reading and writing skills,as shown in research with the cloze test, dictation, and other measures.Perhaps the low correlations between TOEFL subscores reflect low validityof one or more sections. Of course, the notion of testing separatesubskills predated much of the current research, and it is hoped thatfuture test development will take account of this and later research.
Use and Interpretation of TOEFL
An issue of debate concerns prediction of a foreign student's academ-ic success on the basis of scores on TOEFL (or other English proficiencytests). Some scholars have argued that grade-point average (GPA) is not arelevant criterion for validating TOEFL, while others maintain that GPAshould be predicted by TOEFL. The 1968 TOEFL manual' referred to severalstudies claiming to relate TOEFL to GPA as a criterion for validation.However, the 1973 manual (Educational Testing Service, 1973) noted thatsuch studies have generally yielded positive correlations... but...usually so low as to be of little practical usefulness in the admissionprocess." The manual notes that this result is to be expected if TOEFLscores are used appropriately. If only those students with high Englishproficiency are admitted, or if course loads and English training areadjusted to meet the student's needs, English proficiency should notbe a major factor in determining academic success.
1
Educational Testing Service (1968). Test 2LInglish as a ForeignLanguage: Interpretive information. Princeton, NJ: Author.

-156-
Another issue often raised is that TOEFL scores should not be inter-
preted in an absolute manner and that a TOEFL score should be regarded as
falling within a certain range of proficiency. The TOEFL interpretive
manuals have sought to discourage absolute interpretations and the use of
cutoff scores. The 1968 manual urged institutions to conduct their own
studies; at the same time, however, it did provide guidelines for admis-
sions decisions based on various TOEFL score ranges, as suggested by some
colleges' experiences. The later, 1973 manual, was more cautious, as it
did not provide guidelines but, rather, presented the results of a 1969
survey showing the TOEFL score ranges associated with various decisions at
a number of institutions. It also stressed several principles for ace
proper interpretation of TOEFL scores [see Summary No. 27, Educational
Testing Service, 1973).
Future Directions for the TOEFL
At the time of writing of this paper [probably ca. 1974), changes in
the TOEFL are under consideration, based partly on data from the study by
Pike (1979), and partly on input from specialists. It has been difficult
to say exactly what the five sections of TOEFL are measuring, and data
from studies such as that of Pike will be helpful in addressing this
issue. The Pike data show that, surprisingly, Listening Comprehension
correlated better with an essay than with an interview score, and Writing
Ability correlated no better with the essay test than with the interview
and a cloze test. In general, Pike's data suggest that all the TOEFL
subtests may be highly interrelated, so there appears to be little basis
for concluding that the various test sections are measuring different
skills. This view coincides, in part, with the recommendation from the
Pike study that the number of test sections be reduced, with consolidation
of those that are particularly highly correlated.
It is hoped that the changes under consideration will help improve
the test's effectiveness as a measure of English proficiency, just as
recent changes have improved the efficiency of TOEFL's administration.
162

-157- A2, B3, C3, GI, G2
58. Osaryinbi, J. A. (1975). A concurrent validity study of the WestAfrican School Certificate and General Certificate of EducationEnglish Language Examination, using Educational Testing Ser-vice's Test of English as a Foreign Language as the criterionmeasure (Doctoral dissertation, University of Wisconsin, 1974).Dissertation Abstracts International, 35, 5130A-5131A. (Univer-sity Microfilms No. /1=777-my-----
Purpose
This study determined the relationships among TOEFL and the part andtotal scores on the West African Examinations Council School Certificateand General Certificate of Education (SC/GCE) English Language Examinationfor a sample of the November 1972 SC/GCE candidate population in Nigeria.The SC/GCE English part and total scores were treated as predictor vari-ables, to be correlated with a set of criterion measures, TOEFL and theSC/GCE aggregate score (defined below). The objective was to obtaininformation that could be used to improve the validity of the SC/GCEEnglish test.
Method
The subjects were 217 male and female graduating high school studentsin Nigeria in the fall of 1972. All students enrolled in five highschools randomly selected from 30 high schools located near a TOEFL testcenter in the state of Lagos served as subjects. The subjects wereadministered the SC/GCE general achievement and English language teststhrough standard operational testing procedures. They were also adminis-tered the five-part TOEFL in a special experimental session. One-hundred-sixty students also took the optional Oral English Test of the SC/GCE testbattery.
The SC/GCE English test consists of four subtests: two compositiontasks, a test of reading comprehension and summary writing, and a test ofvocabulary and syntax. The first subtest, labeled IA, is a 45-minuteanalytically scored essay written on a common topic, about which substan-tial information is provided. Subtest 2A is an additional measure ofwriting lasting 45 minutes. Usually four essay topics are given inSubtest 2A, with much less information provided for the examinee's usethan on the first essay; any one of the four topics may be attempted.Subtest 18 is a 75-minute test of reading comprehension and summarywriting that requires the examinee to read three prose passages and thenwrite a precis on one passage and give written answers to questions on theother two. Subtest 28 is a 100-item multiple-choice test of vocabularyand syntax; the 50-item vocabulary index is entitled Lexis (28 -L), and the50-item syntax index is called Structure (2B-S). The battery also includesan optional Oral English Test that consists of a 150-word passage to be
163

-158-
read aloud; a listening comprehension measure in which the examinee is
required to identify significant English stress, intonation, and phonemic
contrasts in words and sentences; and an oral composition measure in which
the examinee speaks for two minutes on a single topic chosen from a list
of five topics.
The SC/GCE examinations also include separate achievement tests
selected by the student in 54 subject areas; the SC/GCE aggregate score is
the sum of the six beat scores on the SC/GCE subject tests.
Results
The mean TOEFL score of the subjects was 54% indicating that the
group was above average in comparison with the general population of
examinees taking TOEFL. The KR-20 reliability of TOEFL for this group was
.973, which compares favorably with the average reliability of .965 cited
in the 1973 TOEFL manual (Educational Testing Service, 1073). The inter-
correlations between the two test batteries are presented in Table 1.
Table 1
TOEFL - SC/GCE Intercorrelations
Variable
Variable
1 2 3 4 6 7 8 9 10 11 12 13 14 15
1 SC/GCE 1A2 SC/GCE ZA3 SC/GCE lA & 2A4 SC/GCE 1B5 SC/GCE 2B-L6 SC/GCE 2B-S7 SC/GCE 2B-L+2B-S8 SC/GCE Eng. tot.9 SC/GCE Oral Eng.10 SC/GCE Aggregate11 TOEFL LC12 TOEFL ES13 TOEFL V14 TOEFL RC15 TOEFL WA16 TOEFL Total
57
854221
5336662842325335304644
91
4725503972234539523732
5048
5026
584278284941594135
55
52
436154783053536155565965
6091682660625673656574
87854663668473
62
81
83
84386772768273
8087
4170708376688186
2255584229
3754
515863626267
7569626788
7861
7090
757690
6181 86
Note: The decimal point has been omitted from each of these correlationsto save space.

(
-159-
A principal components factor analysis was applied to the Intercorxe-lations shown above. This analysis identified three factors that accountedfor 76.4 percent of the variance. A general language ability factoraccounted for 38.9 percent of the variance on both tests. The TOEFLscores showed heavier loadings on this factor than did the SC/GCE scores.An "essay" factor accounted for 21.5 percent of the variance. The SC/GCEscores loaded more heavily on this factor than did any of the TOEFLscores. Only the TOEFL English Structure and Writing Ability sectionsshowed a moderate correlation with the essay factor. An oral Englishfactor accounted for an additional 6 percent of the total variance,although only the SC/GCE Oral English test showed a strong relationship(.93) to this factor. Among the TOEFL sections, Listening Comprehensionshowed the highest relationship (.56) with the oral English factor.English Structure was the only section to' load significantly on all threefactors, which probably explains why it was the best predictor of overallproficiency as measured by SC/GCE English total (see correlational dataabove). The Vocabulary section loaded heavily on the general factor andonly slightly on the oral English factor; the Reading Comprehensionsection 1 n the general factor only. die Writing Ability sectionloaded t ty on the general language ability factor than on theessay 3 . presenting only alight evidence of its constructvalidity :ogate direct measure of essay writing skill.
Conclusions
The two SC/GCE essay subtests did not correlate well with TOEFLWriting Ability. They showed low correlations with overall ESL competenceand only a moderate correlation with each other, which is probably aresult of their lack of reliability. Thus, their replacement by a multi-ple-choice measure of writing ability should be considered. The subtestmeasuring reading comprehension and summary w_ting should be replaced bya single multiple-choice measure of reading comprehension. Because thissubtest confuses receptive and productive skills,. it does not predictTOEFL Reading Comprehension and shows its highest correlations with TOEFLEnglish Structure and Writing A'Ality. The Lexis and Structure subtestwas found to be a valid measur,t. The Lexie score from this subtestcorrelated highest with TOEFL Vocabulary, while the Structure scorecorrelated highest with TOEFL English-Structure. The relationship ofEnglish language test scored (TOEFL and SC/GCE) to the SC/GCE aggregatescore shows the extent to which achievement in other subjects in WestAfrican high schools is related to English proficiency.

59. Ppck, A. C. (1972). Ascores and studentcompleting a college
-160 -- Al, Fl
comparison between TOEFL and Michigan teatsuccess in (1) freshman English and (2)program. TESL Reporter, 5, 1-7, 9.
Purpose
This study examined (a) the relationship between the Michigan test
and TOEFL, (b) the relationship between these tests for different language
groups, and (c) the predictive validity of the tests for students at the
Church College of Hawaii.
Method
A search was conducted of the records of students who attended the
college between September 1960 and February 1972. Scores on the five-part
TOEFL [presumably obtained via International administrations], the Michi-
gan test, and freshman English grades were available for 402 students.
The Michigan test was the battery of tests including the Test of Aural
Comprehension and the three-part Michigan Test of English Language Profi-
ciency (MTELP), which tests grammar, vocabulary and reading comprehension.
[For a more complete description of the MTELP, see Summary No. 1, Abadzi,
1976.] For the total group the mean TOEFL score was 435 while the mean
score on the MTELP was 67. Twenty-three members of this group graduated
during this period.
Results
Correlations between TOEFL and the Michigan test were obtained. The
correlations between equivalent sections on both tests were Aural or
Listening Comprehension, .45; Structure-Grammar, .52;, Vocabulary, .62;Reading Comprehension, .49; and total test score, .66. [Note that the
total score for the Michigan test used here is the total on the MTELP,
which excludes the aural test.] Correlations were also obtained between
total scores on these two tests for subjects from seven native countries.
The correlations were Samoa, .55; Tonga, .69; Japan, .21; Taiwan, .66;
Fiji, .80; Korea, .39; and Tahiti, .97. [Ns are not indicated.]
Each test showed a significant positive correlation (2. < .001) with
first-semester English grade. The test scores were not related to the
probability that an examinee would graduate. [The obtained correlations
and Ns are not given; also, the way in which probability of graduation was
examined is not indicated.]
166

-161-
Conclueions
The correlation between TOEFL and the Michigan test was only moder-ate. Thus, these two tests are not interchangeable. While TOEFL andMichigan test scores are significantly related to the grade obtained inthe first English course taken, they are not related to grhdeltained insubsequent English courses nor are they related to the probabil ty that anexaminee will graduate.

60. Palmer, L. A. (1965). TOEFL: Testing of English as a ForeignLanguage. Bulletin of the National Catholic Education Associa-tion, 62, 235-23ä,
Purpose
This is a descriptive paper that details the background and earlydevelopment of TOEFL [see also summaries of 011er & Spolsky, 1979, andJameson & Malcolm, 1973].
Discussion
In May 1961, a conference on testing was held, sponsored by theNational Association for Foreign Student Affairs, the Institute of Inter-national Education, and the Center for Applied Linguistics. Participating
in the conference were members of the sponsoring organizations, governmentagencies, and professional associations involved with admission of foreignstudents, as well as organizations concerned with the testing of Englishas a foreign language. The purpose of the conference was to consider howto evaluate the English proficiency of foreign applicants to U.S. collegesand universities.
Despite the growing number of foreign applicants, English-languagetraining facilities were inadequate at most institutions in which foreignstudents were enrolled. Furthermore, methods of determining these appli-cants' English competence prior to admission were quite varied. A U.S.Department of State survey of 950 institutions of higher education thatenrolled foreign students revealed four types of criteria in use: (a)
English test score (approximately 25 percent of institutions); (b) certi-fication by a local official or English teacher, or an interview with arepresentative of the U.S. college or university (about 35 percent); (c)the applicant's school record (about 15 percent); and (d) the applicant'sself-evaluation or correspondence in English (10 percent). More than 100institutions indicated that they required no evidence of English profi-ciency.
Since the second of the above-mentioned categories, certification bya government offical, often involved testing, the majority of applicantswere likely given some type of test. Still, there were serious problems
with the tests and testing practices in use Test security was a major
problem, as tests were being used repeatedly under nonstandard conditions,so that test results could not be interpreted with confidence. Even less
confidence could be placed in students' self-evaluations, or in schooltranscripts, which provide no direct evidence of English proficiency.Also, interviews tended to be unreliable, as the typical four-point ratingscale allowed the rater much flexibility in interpretation.
16's

-163-
Participants at the 1961 conference unanimously agreed on the needfor a comprehensive testing program to evaluate the English proficiency offoreign applicants. Almost 95 percent of over 500 colleges and universi-ties surveyed in 1962 also indicated a need for such a program.
As a result of the 1961 conference, the National Council on theTesting of English as a Foreign Language was formed in January 1962. Thefollowing year, with support by foundations to the Modern Language Associ-ation of America, the National Council established a program office at theCenter for Applied Linguistics in order to develop the proposed test,which became known as the Test of English as a Foreign Language, or TOEFL.A contract was signed with Educational Testing Service to administer andscore the test and report the test scores.
Development and administration of the test followed the guidelinesproposed by the 1961 testing conference: (a) the test would be givenunder secure conditions on a worldwide basis three times a year (on thesame dates at all test centers), with a new form developed for eachadministration; (b) the tests would be written by experienced teachers inEnglish as a foreign language; (c) the policy-making body for the testwould consist of representatives of government agencies and professionalorganizations involved with language assessment; and (d) the test wouldprovide, along with a total score, reliable subscores indicating anexaminee's listening comprehension, reading comprehension, knowledge ofgrammatical structure, command of English vocabulary, and recognitionof appropriate style and usage in formal writing. The test that wasdeveloped consisted of five sectiuns [see Introduction to this collection]providing subscores in the five areas specified above.
The test was first administered in February 1964 and again in Novem-ber 1964 and January 1965, which was the last administration as of thiswriting. The tests were given in 107 cities in 59 countries (including 13centers in the United States), and examinees included speakers of 71different languages. More than 100 schools and institutions have made useof the services of the TOEFL program. Although the total number ofcandidates for the first three administrations was relatively small(1,800), the number is expected to increase greatly in the coming years.
169

-164- C2
61. Perkins, K., & Pharis, K. (1980). TOEFL scores in relation tostandardized reading teats. In J. W. Oiler, Jr., & K. Perkins
(Eds.), Research in lan(uage testing. Rowley, MA: Newbury
House.
Purpose
The issue under research was the extent of association between the
TOEFL score and scores on three standardizel reading tests. It was
hypothesized that there should be a moderate to strong correlation between
the TOEFL score and reading measures among foreign students who were
almost ready for college study in English. Reading was selected as an
area for investigation due to its importance in the college curriculum and
the fact that nearly all proficiency testing in English as a second
language requires that the examinee possess discourse reading skills.
Method
The subjects were three groups of students enrolled in fall 1976 or
spring 1977 at the Center for English as a Second Language (CESL) at
Southern Illinois University, Carbondale. The subjects were all classi-
fied in the top two (of six) levels of English proficiency based on
TOEFL, Michigan, and CESL placement test scores.
Each of the three groups was given one of three English reading tests
along with TOEFL 'presumably the five-part version', which was adminis-
tered routinely by the Center. Group 1 (N 23) was administered the
Nelson-Denny Reading Test, Form D, intended for grades 9 through 16. This
test contains subtests of Reading Rate, Comprehension, and Vocabulary.
Only the Comprehension and Vocabulary subtests were used here. Group 2 (N
47) was administered level 2 of the Iowa Silent Reading Test; this level
is intended for grades 9 through 14. Only performance on the Vocabulary
and Comprehension sections of this test were examined. The Vocabulary
section consists of 50 items intended to measure the depth, breadth, and
precision of the student's general reading vocabulary. The Comprehension
section contains 50 items tapping literal detail, reasoning in reading,
and evaluation of information read. Thirty-eight questions are based on
six short passages, which the reader can reread while answering the
questions. Twelve questions test short-term recall; each question follows
a different passage and must be answered without looking back at the
passage. Group 3 (N 40) was administered the McGraw-Hill Basic Skills
System Reading Test, which contains 10 short passages followed by a total
of 30 questions testing for main ideas and supporting details.
Results aud Conclusions
For Group 1 there was a correlation ,of .49 .(.2. < .05) between TOEFL
score and the Nelson-Denny test score. The TOEFL Reading Comprehension

-165-
subscore correlated .15 with the Nelson-Denny score. For Group 2,the TOEFL total score correlated .46 (2 < .01) with the Iowa test score.The correlation between the TOEFL Reading Comprehension subscore and theIowa test score was .23. For Group 3, only the TOEFL Reading Comprehen-sion subscore was used; this subscore correlated .91 < .01) with theMcGraw-Hill test score.
It is concluded that the TOEFL total score, as hypothesized, ismoderately to strongly related to reading test scores. Regarding thefinding that TOEFL Reading Comprehension subscores did not correlate aswell as expected with reading test scores for Groups 1 and 2, either oftwo explanations for this finding seems most likely. First, the number ofitems comprising the TOEFL Reading Comprehension section is smaller thanthe number of items on the whole TOEFL. This would reduce the variance ofobserved scores, and, as a result, the correlation between the TOEFLReading Comprehension section and reading test scores might be expected tobe smaller than the correlation between TOEFL total score and the readingmeasures. Second, the standardized reading measures used here might bespeeded for nonnative English speakers. As a result,, the constructvalidity of the reading tests might be questioned for nonnative Englishexaminees.

62. Pike, L. W.testing2; ETSTesting627.)
-166- A2, B1, 82, 83, 36, El, F1,GI
(1979). An evaluation of alternative item formats forEnglish as a foreitn language. (TOEFL Research Rep. No.
Research Rep. No. 79-6) Princeton, NJ: Educational
Service. (ERIC Document Reproduction Service No. ED 206
Purpose
Data were collected that would contribute to evaluating the five-partTOEFL and determining ways in which the test might be revised. Correla-
tions were examined between sections of the test and (a) direct measures
of speaking and writing ability, (b) indirect measures of writing ability,
and (c) experimental multiple-choice tests. Students in three different
countries were included to determine the generality of the relationships
observed.
Method
The subjects were 98 examinees from Peru, 145 from Chile, and 199
from Japan. Scores on the five-part TOEFL were obtained from the October1971 International administration for all subjects in the Peruvian sample
and for about half the subjects in the other groups; scores were obtained
from a special administration of the same TOEFL form for the remainingsubjects. The five TOEFL subtests are Listening Comprehension, EnglishStructure, Vocabulary, Reading Comprehension, and Writing Ability [see
Introduction to summaries).
other instruments were administered a short time after the adminis-
tration of TOEFL. The subjects' scores on an essa test and an interview
were obtained, to provide direct evidence of writing and speaking ability.
[Both essay form and essay content were assessed, although essay form wasof principal interest in this study.] The cloze test, in which thesubjects determined the words deleted from a passage, also provided an
index of writing ability that was more direct than a multiple-choice test
but less direct than an essay (it is also thought to provide evidence of
reading ability). A rewritin& test, requiring the subjects to rewrite a
passage of short, choppy sentences, provided another indirect measure of
writing ability. Finally, four experimental objective tests were admin-
istered. In the sentence comprehension test, the subjects read and
answered questions about written questions or statements. In the words in
context test, the subjects selected the word or phrase that best matched
that underlined in a sentence. The combininj sentences test required the
subjects to choose the best combination of several short sentences. The
paragraph completion test was a multiple-choice cloze test; for each blank
in a passag43, the subject was to choose the deleted word from among four
choices.
1 72
-167-
Results and Conclusions
Mean scores on the nine objective measures were lowest for subjectsfrom Peru, while scores for subjects from Chile and Japan were relativelycomparable to each other, with some variation across measures. Meanscores on the other measures were lowest for Peru and highest for Chile.These differences may reflect social class differences in the samples.Reliabilities of the measures (both objective and subjective) werehighest for Peru (.82 to .98), most likely due to the fact that there wasgreater variation in scores for this group; in most cases, reliabilitieswere lowest for Japan (.66 to .92).
Intertest relationships were examined by correlations correctedfor attenuation (unreliability). The Listening Comprehension oubtestshowed lower corrected correlations with the eight other objective mea-sures than did the latter tests among themselves. Thus, the listening'Isk apparently contributed variance not contributed by tests presented inthe written mode. Reasonably high corrected correlations between ListeningComprehension and interview scores (ranging from .75 to .84 across groups)suggest that Listening Comprehension is an effective estimator of spokencommunication ability. These results point to the value of retainingListening Comprehension as a separate measure in TOEFL.
English Structure generally ranked second among the nine objectivetests in reliability (.78 to .92 across countries). It was usually thebest estimator of the essay form score (corrected r's of .81 to .98) andwas one of the two best estimators of the interview scores (corrected r'sof .69 to .88). These results indicate the value of retaining the EnglishStructure section in TOEFL. A high relationship between this section andWriting Ability (corrected r's of .82 to .97) suggest that these twosections could 'be combined.
The Vocabulary score showed a relatively high relation to ReadingComprehension (corrected r's of .88 to .95) suggesting that these twosections could be combined.
Reading Comprehension correlated highly with three of the fourexperimental tests: words in context, combining sentences, and paragraphcompletion (corrected r's of .93 to .99) as well as with cloze test scores(.88 to .97). Thus, these other zeta could also be used to tap processesrelated to reading ability.
Writing Ability estimated the essay form score reasonably well, withcorrected r's of .93, .88, and .73 for Peru, Chile, and. Japan, respective-ly. Thus, for the first two populations at least, the data did notsupport the notion that the TOEFL Writing Ability section should bereplaced with a writing sample. English Structure correlated highly withWriting Ability (corrected r's of .82 to .97), suggesting that these twosections could be combined. Of the two subtests of Writing Ability, theone requiring error recognition correlated more highly with the essay form

-168-
score (corrected r's of .75 to .93) than did the one requiring sentencecompletion (.55 to .84), implying that the former section is more usefulas an indirect index of subjects' writing ability.
Of the experimental subtests, three showed high corrected correla-tions with Reading Comprehension, as noted above. The fourth, the sentencecomprehension test, showed lower corrected correlations with ReadingComprehension (.78 to .91), apparently because many subjects receivedperfect or near-perfect scores on this test, thus restricting the range ofscores.
The scores for the rewriting test showed disappointingly low correct-ed correlations with the essay form scores (.19 to .54), perhaps becauseof the wide range of structural complexity in the subjects' responses,indicating that the rewriting task may be of limited value in Its presentform.
The close test was a reasonably good estimator of essay fora scores(corrected is of .78 to .94) and Reading Comprehension (.88 to .97),indicating its value as an indirect measure of writing or reading ability.The close test, in turn, was well estimated by several multiple-choicetests, including the words in context test (.94 to .98), the paragraphcompletion test (.86 to .99), and TOEFL English Structure (.82 to .93).
In general, the results suggest that the Listening Comprebens.onscores are relatively independent of the other multiple-choice measures;English Structure and Writing Ability form one cluster, and ReadingComprehension and Vocabulary form another. An implication is that TOEFLcould be revised to provide three scores, corresponding to these threeapparent groupings.
174

-169- 133, G1
63. Pitcher, B., & Ra, J. 11. (1967). The relation betweer scores on theTest of Enilish as a Foreign Language and-ratings of actual
theme writing. (Statistical Rep. No. 67-9). Princeton, NJ:
Educational Testing Service,
Purpose
This tudy sought to determine the degree to which students' writingability csn be measured with an objective test by assessing the relation
between the quality of students' writing samples and their scores onTOEFL, particularly the Writing Ability section.
Method
The subjects were 310 foreign students who had recently arrived inthe U.S. and were enrolled in university courses in English as a foreignlanguage or in intensive English language courses at six different insti-tutions of higher education.
Scores on the five-part TOEFL were available for each student [pre-sumably from International administrations]. Also, each student was given
30 minutes to write each of four themes dealing with (a) a holiday orfestival, (b) a family member, (c) a city, and (d) a significant event.Fourteen persons served as readers, and each theme was rated by tworeaders. After a practice session in which rating standards were estab-lished by examining 10 sample themes, the themes were rated on a four-point scale. During the readings, the readers occasionally discussed andrated "problem themes," to further ensure consistency of rating standards.A student's overall score was the sum of the two ratings on each of the
four themes; scores thus ranged from 8 to 32.
Results and Conclusions
One possible method of estimating reliability of ratings would be toobtain a correlation between the two ratings of each theme, for all 1,240
themes; this correlation was .64. Note, however, that this method ignorestheme topics and counts each subject four times. A method that avoids
these problems is to correlate the sum of the first four ratings with thesum of the second four ratings, for the four themes written by each
subject. The correlation obtained by this method was .85. Application of
the Spearman-Brown correction to this figure yielded a reliability coeffi-
cient of .92 for the sum of all eight ratings combined.
Correlations with overall theme rating for the TOEFL part scores wereListening Comprehension, .56; English Structure, .74; Vocabulary, .71;

-170-
Reading Comprehension, .65; and Writing Ability, .74. Correlation withtotal TOEFL score was .78.
Correlations were computed among TOEFL subtests. The highestcorrelations were those among En,lish Structure, Vocabulary, and WritingAbility (ranging from .75 to .79); Listening Comprehension showed thelowest correlations with the other parts of the test. However, therange of correlations was relatively small --.60 to .79.
Stepwise regression analyses were also performed in which themeratings were predicted from various combinations of TOEFL part scores.This analysis showed that the combination of English Structure and WritingAbility provided somewhat more effective prediction (multiple R .78)
than did either of these two subtests alone, and that prediction wasimproved slightly by also including the Vocabulary score (multiple R.79). The other two TOEFL subtests are believed to measure aspects oflanguage proficiency that are less important in predicting theme writing.
176

-171- Cl, D3, Fl, H
64. Powers, D. E. (1980). The relationship between scores on the Gradu-ate Management Admission Test and the Test of English as aForeign Langualle (TOEFL Research Rep. No. 5; ETS Research Rep.No. 8u-3f). Princeton, NJ: Educational Testing Service. (ERICDocument Reproduction Service No. ED 218 329)
Purpose
This study investigated the relationship between section and totalscores on the Graduate Management Admission Test (GMAT) and TOEFL. Of
particular interest was the role played by the examinee's native language.It was hoped that the results would provide an explanation for the common-ly observed "discrepancy" between TOEFL and GMAT scores. A second objec-tive was to investigate the accuracy with which GMAT examinees reporttheir TOEFL scores, in order to determine if self-reported scores could beused in certain contexts.
Method
A sample of 5,781 GMAT candidates, who had also taken the three-partTOEFL via International or Special Center administrations, were drawn fromtest files for the period between September 1977 and August 1979. The
GMAT, a multiple-choice test designed for applicants to graduate schoolsof business, measures general verbal and mathematical abilities. Theverbal section measures ability to understand and evaluate what is readand to recognize basic conventions of standard written English. Thequantitative section tests basic mathematical skills and understanding ofelementary mathematical concepts, as well as the ability to reason quanti-tatively, to solve quantitative problems, and to interpret data given ingraphs, charts, or tables [description paraphrased from a recent GMATpublication]
Only examinees who indicated that they were not U.S. citizens andthat English was not their primary language were selected. The averageTOEFL score for the group was 552, which is considerably greater than theaverage of 506 for all graduate-level TOEFL examinees during 1976-77. Themean GMAT total score of this group was 394.5 as compared with a GMATpopulation man of 500. The mean verbal score on the GMAT (GMAT-V) was16.7 as compared to 26 for the GMAT population, and the mean quantitativescore (GMAT-Q) was 28.4 as compared to 27 for all GMAT candidates testedduring 1975-1978. Thus, these foreign candidates scored considerablybelow the mean on the GMAT-V and on the total test, and they scoredslightly above the mean on the GMAT-Q.
Section and total scores on both tests were correlated using linearand curvilinear (quadratic) regression. The relationships were computedfor all candidates and for the countries with the largest contingents.

-172-
The reported TOEFL scores of GMAT candidates were correlated with theactual TOEFL scores recorded in TOEFL program files, and the relationshipsbetween those scores and other selected variables were compared.
Results and Conclusions
Table 1 shows simple linear correlations between GMAT and TOEFLscores. As can be seen, the correlations between TOEFL subscores andGMAT-V score are considerably higher (.58 to .69) than those between TOEFLsubscores and GMAT-Q score (.29 to .39). Thus, while these aptitude testscores consistently correlated with proficiency in English, the correla-tion was much higher for aptitude in the verbal domain than for aptitudein the quantitative domain. Table 1 also shows that the overall patternof correlations of TOEFL scores with GMAT-V and GMAT-Q scores providessupport for the discriminant validity of TOEFL as a measure of verbalrather than quantitative skills. The Listening Comprehension sectionshowed a lower relationship with GMAT-V than did the other two TOEFLsubscores. This finding is to be expected since the GMAT-V does notmeasure listening comprehension.
Table 1
Correlations Between GMAT and TOEFL Scores
TOEFL Score
Structure ReadingComp.
Listening WrittenGMAT Score Comprehension Expression Vocabulary Total
GMAT-Verbal .58 .66 .69 .71
GMAT-Quantitative .29 .37 .39 .39
GMAT-Total .52 .61 .64 .66
The use of curvilinear regression significantly increased the corre-lations between TOEFL scores and GMAT-V (increases ranged from .02 to .05)
but did not increase the correlations with GMAT-Q. As would be expected,the increase in correlations with GMAT-Total, which is a combination ofthe verbal and quantitative scores, is midway between those for GMAT-V andGMAT-Q.
Using a quadratic equation, the relationship between TOEFL and GMAT-Vand total scores was determined for the five native language groups havingthe largest number of GMAT candidates (India, Iran, Japan, Taiwan, andThailand). The relationship between GMAT-V and TOEFL scores was similar
178

-173-
across language groups, excep.: that the correlations were lower forIranian examinees. The Iranians received lower scores than did any othergroup on both tests, and because the GMAT scores should show littledifferentiation among very low scoring candidates, the correlationsbetween GMAT and TOEFL scores would also be expected to be lower for thisgroup. 117
_Finally, the mean section and total scores on both tests were calcu-lated for each of 137 different native country groups. The native. countrymeans on both tests were then correlated and each correlation was found tobe .91 or higher. Thus, the discrepancy observed between the TOEFL andGMAT scores of foreign students was consistent from country to country andwas related to examinee.English language proficiency. While nonnativeEnglish apcakers consistently score lower on the GMAT than do nativespeakers, examinees who score higher on the TOEFL also tend to scorehigher on the GMAT.
The rorrelation betwe-m self-reported and actual TOEFL scores wasfound to oe .91 or .92 (depending on the regression method used). Thecorrelations of self-reported and actual TOEFL scores with Gr.f.T scores andwith self-reported undergraduate grade-point average were nearly identi-cal. This suggests that self-reported TOEFL scores may be a usefulsubstitute for actual TOEFL scores in studies in which the focus is onaverages for groups or relationships among variables rather than onindividuals.
179

-174 -- B1, C2
65. Ratchford, D. L. (1982). Readl.cg ability of entering freshmeninternational students at a soutnwestern state university: Someimplications (Doctoral dissertation, University of Oklahoma,1981). Dissertation Abstracts International, 42, 3088A-3089A.(University Microfilms No. 8129435)
Purpose
The present study examined the reading ability of foreign studentsseeking enrollment at g southwestern state university. One objective wasto determine how well students were prepared to read textbooks, where thisassessment was based on the students' doze test scores and experts'judgments of the students' reading ability. A second objective was toassess the validity of scores on TOEFL, the Nelson-Denny Reading Test, andthe doze test against students' reading grade level as determined by thepanel of experts.
Method
The subjects were 70 foreign students beginning their freshman yearat the University of Oklahoma. All subjects had scores on the three-partTOEFL [presumably obtained in International or Special Center administra-tions]; only the original TOEFL score was used for any subject who hadtaken the test more than once. Students were sampled so that exactly 14subjects fell into each of five TOEFL score ranges: 400-449, 450-499,500-549, 550-599 and 600-649. The sample included only students majoringin engineering or nonscience related fields.
The subjects were administered the Nelson-penny Readit4, Test. rhistest, designed for grades 9 to 16, consists of 1DO vocabulary questionsand 36 reading comprehension questions ;based. on eight reading passages)requiring 10 minutes and 20 minutes, r espectively, to administer. Thetotal score on this test is the score on the vocabulary items plus twicethe score on the comprehension items. (Although the test also yields areading rate score, this score was not used le the present study). Thesubjects were also administered two cic-e tests. One was the generaldoze test, which was constructed from a political vzience text. Thepassages used in this test fell in the upper one-third of reading diffi-culty (as determined by the Dale-Chall Readability Formula) among a set ofpassages sampled from general core course textbooks encountered by under-graduates. The second doze test was either the nonscience doze test(administered to 31 subjects) or the science doze test (administered to39 subjects). The nonscience doze test used a passage from a journalismtext, while the science doze test used a passage from an engineeringtext. In constructing doze test passages, every fifth word was deletedfrom the passages, which varied in length from 297 to 340 words.

-175-
A panel of reading experts assessed the general reading level, andreading level within the major field, for each subject. For this purpose,an instrument known as the Informal Reading Inventory was administeredindividually to a subject by one of the panel members. The subject read aseries of passages, selected so as to represent readability levels ratwirrigfrom the fourth through the sixteenth grade, as determined by use of theFry and Flesch Readability Formulas. After reading a passage, the subjectwrote answers to a brief set of questions about the passage [the exactnumber of questions is not given]. The panel member then evaluated thesubject's answers. If an answer was vague the panel member restated thequestion until a response was given that indicated understanding or lackof understanding of the passage. If a subject was found to exhibitat least a 75 percent comprehension of a passage (as determined by acriterion established in other research), he ov she was permitted to go onto the next most difficult passage. The total number of passages read bya subject was thus dependent on attaining a criterion level of perform-ance. The final performance score assigned to the subjects was aninteger from 4 to 16 that represented their reading grade level. Acomparison of reading level judgments of the four panel members showedvery high agreement for a sample of three subjects.
Results and Conclusions
Four sets of hypothesas were tested. Hypothesis 1 was that therewould be a relation between the general doze test score and the TOEFLscore. Inspection of the data shows chat, even though only four subjectsanswered 40 percent or more of the ci,ze ieems correctly (and thus weredefined as falling into the group c asified as the "instructionallevel"), the general doze test score correlated .71 with the TOEFL score
< .001).
Hypothesis 2 was similar to Hypothesis 1, except that it involved therelation between TOEFL and either the nonscience or science doze test.For the nonscience doze test, although only five of the 31 subjectsscored at the instructional level, the score on this test correlated .78with TOEFL score (2 < .001). For the science cloze test, only threesubjects scored at the instructional level, and the correlation with TOEFLscore was .55 (2 < .001).
Hypothesis 3 was that the eYpert panel's judgment of the subject'sgeneral reading grade level would relate to the other measures in thestudy--i.e., scores on the TOEFL, doze, and Nelson-Denny tests. TheTOEFL .:core was found to correlate .67 (2 < .001) with the panel's judg-ment of reading grade level as determined by the Informal Reading Inven-tory. Performance on the general doze test correlated .61 (2 < .001)with judgment of the subject's reading grade level. The total Nelson-Dennyscore correlated .68 with the subject's reading grade level (2. < .001);th, correlation for the Nelson-Denny Vocabulary subscore was .61
< .001) and the correlation for the Nelson-Denny Comprehension subscorewas .62 (2 < .00i).

-176--
Hypothesis 4 investigated whether there was a relationship among theexperts' judgment of the subject's reading grade level, Nelson-DennyReading Test score, general cloze test score, and performance on thenonscience or science cloze test of reading ability. TOEFL scores were
also reconsidered in the ensuing analyses. Inspection of the correlationsbetween judged reading grade level and other scores for nonscience majorsshowed no correlation higher than .65. (This latter correlation wasestablished as a criterion for deciding that a given proficiency measurewas an adequate indicator of a subject's reading ability.) A very similar
result was found for science majors. While none of the correlationsattained the .65 level, the correlations ranged from .45 to .63 for thenonscience majors, with the highest correlation between Nelson-Denny totalscore and judged reading grade level. The corresponding correlations forscience majors ranged only from .29 to .57, with the highest correlation
between TOEFL and judged reading grade level.
In general, the TOEFL score and the Nelson-Denny Reading Teat scoreappear to be useful for screening entering foreign students with regard to
their reading ability. Perhaps the Nelson-Denny Reading Test could beused as a supplement to TOEFL in making decisions about these students'
English reading proficiency. Further research could provide additionalinformation on the validity of the instruments used in the study.
IS

-177- B1, D1
66. Riggs, J. M. (1982). Cloze testing procedures in ESL: A predictionof academic success of foreign students and a comparison withTOEFL scores (Doctoral dissertation, Indiana University, 1981).Dissertation Abstracts International, 42, 5048A. ( University'Microfilms No. DA 8211187)
Purpose
This study examined the relation of first-year grade -point average(CPA) to cloze test scores and to TOEFL scores for foreign students at acommunity college.
Background
Although the purpose of TOEFL is not to predict acadeiic success, andthe evidence suggests that it is not very effective for this purpose,college faculty use TOEFL scores, in effect, to make decisions aboutprobability of student success. Therefore, another test should be used,at least as a supplement to TOEFL, to determine a foreign student'sability to begin academic work. One possibility in this regard is thecloze test, in which students determine the words that have been deletedfrua a prose passage. The cloze test is an integrative, functional testin that it measures general language proficiency in the context of speci-fic subject matter. TOEFL, in contrast, is a discrete-point type of test,which assesses knowledge of specific lexical, grammatical, or syntacticalitems. An integrative test is believed to be more related to one'sability to handle language in a contextually rich environment and thusmore suitable for predicting academic success.
Method
The subjects were 23 foreign students who registered in fall 1977 atVincennee University, a two-year community college in Indiana (sevenadditional students in the original sample were excluded due to transferor placement into ESL classes). The large majority of the subjects (18 ofthe 23) were Arabic speakers and all but one were males. Students canbegin academic work et Vincennes either by presenting a TOEFL score ofat least 500 or by completing a set of courses in English as a secondlanguage. [The range of TOEFL scores reported below suggests that practi-cally all subjects were in the latter category.]
The five-part TOEFL was administered before registration in fall 1977to all subjects. The.cloze test was administered within one week of theTOEFL. The cloze test consisted of three paE ages, two taken from a

-178-
general chemistry text used at Vincennes University and one from thecommonly used freshman composition text. Every seventh word of eachpassage was deleted (except thet the first and last sentence of each
passage remained intact). The passages contained a total of 148 blanks,with approximately the same number of blanks per passage. The subject was
to fill in the word that best completed each blank. All subjects finishedwell within the two hours alloted. The synonym, or acceptable-word,scoring method was used, in that synonyms for deleted words were acceptedas correct; misspellings were not counted as mistakes.
CPAs were obtained for the fall semester, for the spring semester,and for the combined two semesters of the first year for each subject.
Results
TOEFL scores for the 23 subjects ranged from 314 to 522, with amedian of 374. Relati.)nships with GPA were examined by Spearman rankcorrelation. TOEFL score and doze score, respectively, correlated .29and .5; with overall GPA, .33 and .67 with fall-semaster GPA, and .10 and
.27 with spring-semester CPA. The correlation with overall GPA wasnonsignificant for TOEFL but significant for the doze test.
4 separate analysis was done for subjects taking Composition 1 and
chemistry, based on the combined grade for those courses alone Pi not
reported). The Spearman rank correlation with this score was .50 forTOEFL and .70 for the doze test.
The KR-21 reliability of the doze test was .97. Reliabilities of
the five parts of TOEFL ranged from .78 to .89. Scores on the doze testcorrelated .77 with those on TOEFL.
Conclusions
The low correlation betwen TOEFL and CPA found here is consistentwit;: -the findings of some other rcudies. The small sample size makes itdifficult to draw general conclusions, but the difference in correlations
with TOEFL and the doze test are worth noting. The suggestion is that a
clove test such as that used here more closely approximates a measure of
the student's ability to perform in a language situation involving course-
work than does TOEFL. The .77 correlation between the cl..4e test andTOEFL suggests some commonality between these tests, but the differential
correlations with GPA suggest that the cloze test may be tapping ail
additional factor, perhaps something resembling academic readiness.
The fact that correlations with CPA were lower for the second semes-ter than the first may be due to improvement in students' English skills

-179-
during the first semester, which tends to reduce the role of languagebility in determining academic performance.
It is suggested that a test such as the clone test be considered as asupplement to TOEFL in making admissions decisions about foreign students.More extensive empirical work would be needed, however, to determine thepredictive validity of the test for this purpose and to establish appro-priate decision scores for any specific institution that would use it

-180- 31
67. Scholz, C. E., & Scholz, C. M. (1981, Detroit). Multiple-choice
doze tests of EST discourse: An exploration. Paper presented
at the fifteenth annual TESOL convention. (ERIC DocumentReproduction Service No. ED 208 656)
Purpose
This study examined various types of doze tests, including a stand-
ard open-ended doze test and several multiple-choice doze tests that
differed in the method by which distractors were selected. For groups of
Chinese scientists, correlations were computed between these tests and
criterion measures, including selected subtests of TOEFL and of theComprehensive English Language Test for Speakers of English as a Second
Language (CELT).
Method
The principal subjects were Chinese scientists attending an exchange
program between Chin and the University of California - -Los Angeles in the
People's Republic of China. The subjects were drawn from many regions of
China and ranged in age from 37 to 45. Most of them were lecturers,researchers, or professors in universities and technical institutes in
China.
Two passages were used for the doze test, one of 415 words involving
science as an academic subject, anJ thr_.- other of 440 words involving
science as a topic of popular interest. In each passage, every seventh
word was deleted, except that one or two sentences at the beginning and
end remained intact. There were 50 deletions per passage.
For tne standard, open-ended doze test, the subject was to write, in
the blank space corresponding to each deleted word, the word that would
best fill the space. Acceptable-word scoring was used; i.e., reasonable
substitutes for the deleted word were accepted as correct. Four multiple-
choice (MC) doze tests were also developed. In one, the interlingual MC
doze test, the distractors were the three most common errors made by a
sample of 161 Algerian students of the English language; the fceirth
response alternative was the deleted word.
lo develop the othe... MC cloze tests, the two above-mentioned cloze
tests were administered to a sample (Sample 1) of 187 Chinese scientists,
the open-ended cloz,7. test to 91 subjects, and the interlingual MC dozetest to 96 different subjects in the sample. The interlingual MC doze
ter,'.. was then item-analyzed, and items with facility less than .15 (i.e.,
fewer than 15 percent of the subjects answering them correctly) or greater
than .85 ware eliminated, as were items with a discrimination parameter of
.25 or less (i.e., correlation of .25 or less with total test score). The
156

-181-
result was the revised interlingual MC doze test, which consisted of 20items. In addition, the intralingual MC doze test was developed byusing, as distractors for each deleted word, the three most common errorsmade by the 91 Chinese subjects in Sample 1 who were given the open-endedcloze test. Finally, a teacher-made MC doze test was developed by havingChinese and American teachers of English as a second language, working ingroups, write what they believed to be the best distractors for eachdeleted word.
These last three MC doze tests (revised interlingual, intralingual,and teacher-made) were administered to three randomly selected groupsdrawn from a second sample (Sample 2) of 167 Chinese scientists (Ns 57,56, and 54, respectively, for the three types of cloze test.) Alsoadministered to all subjects were the Structure and Listening subtests ofthe CELT and the Reading Comprehension, Vocabulary, and Writing Abilitysubtests of the five-part TOEFL. The combination of these five scores,here labeled "composition proficiency score," was also computed for eachsubject.
Results and Conclusions
Reliabilities of the TOEFL subtests ranged from .55 to .81 for Sample1 (N 187) and from to .90 for Sample 2 (N 167), with the lowestreliability observed for Writing Ability and the highest for Vocabulary ineach case. Reliabilities for the CELT subtests ranged from .52 to .78across samples, and reliabilities for composite proficiency scores were.87 and .90 for the two samples. The homogeneity of the samples may havecontributed to relatively low reliabilities for some subtests.
Reliabilities of the various versions of the doze test, excludingthe revised interlingual MC doze test, were relatively consistent,ranging from .52 to .68. (For the revised interlingual MC doze test,which had 20 rather than the full 50 items, reliabilities were .67 and .48for the academic and popular passages, respectively.) Although thesereliabilities are somewhat lower than those observed in previous studies,this finding may have been due to the homogeneity of the samples.
Data pertaining to the criterion validity of the doze tests areavailable in the correlations between each of the doze tests and the CELTand TOEFL subtests and the composite proficiency score (see Table 1). AsTable 1 shows, performance in the open-ended doze test correlated moder-ately strongly with composite proficiency (.67 and .64 for the two pas-sages) and with TOEFL Reading Comprehension (.73 and .61). Also, theteacher-made MC test correlated moderately highly with the compositeproficiency score (.62 and .74).

-182-
Table 1
Concurrent Validity Coefficients
Clore test
Proficiency SubtestaTOEFL-V TOEFL-A
CompositeProficiency
Scoret..EEglish
CELT-S CELT-L TOEFL-RC
Open-endedacademic passage .39 .51 .73 .42 .51 .67
popular passage .40 .43 .61 .42 .52 .64
Interlingual MCacademic passage .39 .31 .42 .21 .45 .45
popular passage .39 .35 .57 .40 .53 .58.
Revised Interlingual MCacademic passage .29 .29 .56 .16 .36 .42
popular passageintralingual MC
academic passage
.28
.33
.08
.41
.39
.53
.31
.35
.32
.42
.38
.49
popular passage .43 .49 .64 .42 .55 .66
Teacher-made MCacademic passage .35 .44 .55 .53 .54 .62
popular passage .48 .48 .69 .66 .59 .74
aSubtests, listed in order, are CELT-Structure, CELT-Listening,TO FL- Reading Comprehension, TOEFL-Vocabulary, and TOEFL-Writing Ability.
In general, the validity coefficients were highest for the open-endedand teacher-made MC tests, and coefficients for the intralingual MC testwere next highest. The lowest correlations were those involving therevised interlingual MC test; this may have been due partly to the fact
that this test contained only 20 items, in contrast with the 50 items foreach of the other tests.
For the MC dime tests, correlations with the criterion measures weregenerally higher for the popular passage than for the academic passage.This may have resulted from the fact that the text of the academic passage
was similar in nature to the text of the passages in the TOEFL Reading
Comprehension subtest.
It appears that the open-ended doze test is a slightly more validmeasure English proficiency (particularly reading comprehension) than
are multiple-choice doze tests when an academically oriented science
passage is used. However, the intralingual and teacher-made MC dozetests appear to be at least as valid as the open-ended close test when thetext involves science as a topic of popular interest.
sl

-183- Al, B4, Cl, DI, D2, H
68. Schrader, W. B., & Pitcher, B. (1970). Interpreting performance offoreign law students on the Law School Admission Test and theTest of English as a Foreign Language (Statistical Rep. No.70-25). Princeton, NJ: Educational Testing Service.
Purpose
This study examined the degree to which foreign students' performancein a pre-law school orientation program and later performance in lawschool was predicted by (a) TOEFL, (b) the Law School Admission Test(LSAT), and the Michigan Test of English Language Proficiency (MTELP).The study also assessed the amount of change in scores on TOEFL and theLSAT during the orientation program.
Method
The subjects were drawn from a group of 121 foreign students enrolledin an eight-week summer orientation program designed to prepare them toenter one of 23 law schools in the United States. Scores were availablefor 112 subjects on all of the tests described below, and data indicatingperformance in the orientation program were available for 108 of thesesubjects. These 108 subjects came from 36 different countries, grouped asfollows: Europe (N 0, 41), Asia (N 33), Latin America (N - 24), andAfrica (N 10). A-total of 63 subjects had first-year average grades inone of four law schools: Columbia University, Harvard University, theUniversity of Michigan, and New York University.
The five-part TOEFL and the LSAT were administered by orientationprogram staff near the beginning and again near the end of the summersession.
The LSAT produces a single score but has several parts: (a) ReadingComprehension requires the subject to read several passages and answerquestions about them; (b) Reading Recall is similar but does not allow thesubject to look back at the passages when answering the questions; (c)Data Interpretation requires the subject to answer questions about graphsor tables; (d) Principles and Cases measures reasoning similar to thatrequired in legal studies; and (e) Figure Classification requires reason-ing involving geometric symbols.
The MTELP, administered before the subjects came to the UnitedStates, also produces a single score and has three parts: (a) Grammar,which taps understanding of English grammatical structure; (b) Vocabulary,which teats knowledge of words commonly encountered in university study;and (c) Reading Comprehension, which requires reading and answeringquestions about prose passages. [For a more complete description of theMTELP, see Summary No. 1, Abadzi, 1976.1 The Michigan Test of AuralComprehension was also administered to the subjects, but the data fromthis test were not analyzed.

-184-
At the end of the orientation program the subjects were graded in
each of their two courses on a nine-point scale. Each instructor also
rated the subjects on a four-point scale with regard to (a) their written
English and (b) their spoken English.
Average law school grades were obtained for each of 63 subjects.
Because of possible differences in grading standards among schools, it was
decided that the mean and standard deviation of law school grades and of
all other measures should be assumed to be uniform for the four law school
groups. Thus, score adjustments were made such that each measure for a
student was evaluated according to the student's score relative to other
students in his or her own law school.
Results and Conclusions
Scores on the LSAT, total TOEFL, and each TOEFL srctlon except
Reading Comprehension showed significant increases over the eight-week
orientation program. The mean initial TOEFL score of 570.1 was at the
84th percentile of all '''reign students seeking admission to U.S. colleges
between February 1964 ad June 1969; the mean final score of 601.5 was at
the 91st percentile. The mean initial and final LSAT scores, respectively,
were at the 12th and 25th percentiles of all candidates given the LSAT in
academic years 1966-67 and 1967-68. These gains may have been due to the
orientation program or to such factors as living in the United States for
eight weeks or the experience of having taken the test once before.
Analyses involving prediction of orientation-program grades included
the initial LSAT, the MTELP, and initial TOEFL (including part se( .'s)
(N ... 108). First, correlations among predictors e examined. All but
eFree (of 28) correlations were above .50. The LS correlated .66 with
TOEFL total and .52 with the MTELP; the latter t tests correlated .87
with each other. Among TOEFL part scores, the on that correlated most
highly with LSAT was Reading Comprehension (r other r's - .45 to
.55). Correlations with the MTELP were in irie 1 800 for three of the
TOEFL sections: English Structure, Vocabulary, nd Writing Ability;
correlations with the other two sections were in he 50s. In general,
there appears to be much overlap in abilities measur by the LSAT and the
English language tests, although these abilities are of identical. There
is evidently a strong commonality between TOEFL and t MTELP.
Average grade in the orientation program co related .41 with the
initial LSAT (N - 108). Average grade correlate .29 with the initial
TOEFL and .18 with the MTELP, showing that predi tion of academic per-
formance from these English language tests was rel tively poor. The fact
that the MTELP was used as a basis for selecti may have reduced its
predictive validity.
1 CI 0

-185-
Orientation-program instructors' ratings of writing ability correlat-ed .35 with the initial LSAT, .34 with the initial TOEFL, and .19 with theMTELP; ratings of oral English correlated .35, .43, and .33 with thesethree tests, respectively. The two course grades correlated .57 with eachother; the two ratings of writing ability correlated .59, and the tworatings of oral English correlated .62.
Post-orientation program TOEFL scores correlated .36, .42, and .48,respectively, with grades, written English ratings, and 'reel Englishratings. These correlations were slightly higher than the correlationswith initial TOEFL scores. Correlations of LSAT with these three measures,respectively, were .37, .34, and .32, which were slightly lower than thosewith the initial LSAT.
Prediction of grades in law school was based on 63 subjects land thedata were subjected to the above-mentioned adjustment] so the results mustbe interpreted with caution. Of the scores on the initial tests, fivescores correlated higher than .40 with grades: LSAT (.47), TOEFL (.41),MTELP (.42), and two TOEFL sections, Writing Ability (.47) and ReadingComprehension (.43). (r's for other TOEFL sections ranged from .27 to.31.)
The multiple R of initial scores on the LSAT and TOEFL scores withlaw school grades was .48. Given that LSAT and TOEFL Writing Ability eachcorrelated .47 with grades, joint use of TOEFL and the LSAT does notappear to improve prediction compared with use of either one of these twotests alone.

-186- C3, E3, E6, G2
69. Scoon, A. R., & Blanchard, J. D. (1970, March). The relation of n
test of English as a second language to measures of intelli-
ence achievement and ad ustment in a sample of American
Indian stu ents. Paper presented at the fourth annual TESOL
Convention, San Francisco. (EKIC Document Reproduction Service
No. ED 039 530)
Purpose
This study Investigated performance on, and interrelationships among,
intelligence and pervonality tests and TOEFL for a group of bilingual
American Indian students. Several hypotheses were investigated. The
first hypothesis was that Indian students would manifest an English
ability skill, as measured by TOEFL scores, that was discriminable from
personality adjustment and intelligence test scores. A second hypothesis
was that low TOEFL scores would be associated with low scores on the
personality adjustmen: teat. A third hypothesis was that scores on a
verbal intelligence test would be significantly different from ecores on a
nonverbal intelligence test for these Indian students. Further questions
for research were (a) whether there would be sex differences on these
tests and (b) whether these Indian students would show changes in their
test scores from the ninth through the thirteenth year of school.
Method
The subju is were 142 bilingual American Indian students at the
Institute of American Indian Arts in Santa Fe, New Mexico. Students
attending this school were selected for admission on the basis of their
artistic ability. The sample included 78 male and 64 female subjects from
11 Indian languiwe families.
The instruments used in the study were the five-part TOEFL, the Otis
Quick Scoring Mental Ability Test, Gamma, which was regarded as a test of
verbal intelligence (VIQ), the Chicago Non-Verbal Examination, regarded as
a test of nonverbal intelligence (NVIQ) , the Iowa Test of Educational
Development (ITED), and the Bell Adjustment Inventory Revised (1962)
Student Fo-m (Bell). INo details about these tests are given. However,
for a brief oescription of the ITED, see Summary No. 12, Blanchard and
Reedy, 1970.1
Not all subjects took all tests. Subjects :n Set 1, which consisted
of 78 students in grades 9-12, took the VIQ, NVIQ, TOEFL, ITED, and Bell
teats. Set 2 subjects, consisting of 16 students in grades 9, 11, rnd 12,
took the VIQ, NVIQ, TOEFL, and ITED tests. Set 3 subjects, consisting of
33 students in grade 13, took the VIQ, NVIQ, TOEFL, and BELL tests. Set 4
was the combination of subjects in Sets 1, 2, and 3 plus six additional
subjects; analyses for Set 4 involved only the VIQ, NVIQ, and TOEFL
scores.
192

-187-
Results
Over all subjects, NVIQ scores were found to be higher (mean 'is 107.7)than VIQ scores (mean is 90.6); this difference was statistically signifi-cant beyond the .001 level. The correlation between NVIO. scores and VIQscores was .52. Some Indian language groups manifested higher NVIQ andVIQ scores than others. *The average ITED scores for these subjects weregenerally low--below the 10th percentile nationally on all subscales ofthe ITED.
The'mean total TOEFL score of the subjects was 483. Scores on theTOEFL sections showed a steady increase from the ninth through the thir-teenth grade, with the exception of scores on the Listening Comprehensionand English Structure sections, which showed a decline in the twelfthgrade. Correlations between TOEFL subscores and total score and among theibtests of the ITED were modest to high; all of these correlations ranged
from .48 to .88. The correlations across the TOEFL and ITED subtexts werenot as high, overall, as were the correlations among subscores andtotal TOEFL score. Correlations between TOEFL (part and total) scores andthe scales on the Bell test were low, and none reached statistical signi-ficance.
Seventeen percent cf the 133 subjects who took the TOEFL scored 550or above, indicating no restriction based on their English proficiency forcollege work. Fifty-three percent of the subjects scored in the range450-549; these students were judged to need some classuork in English as asecond language (ESL) but no restriction in their college course load.Twenty-nine percent of the subjects scored in the range 300-449; thesestudents were judged as needing considerable ESL classwork and a reducedcollege class load. Only one subject scored in the range 200-299, indi-cating the need for full-time ESL class work.
Factorthrough 4.test scoresThis factor
analyses were performed separately on the data for Sets 1Across all analyses, the TOFFL, intelligence, and achievement
emerged as impnvtant contributors to a first, general factor.was interpreted as English language facility.
Conclusions
TOEFL appears to be a valid measure of English language skills ofIndian students. The observed variation in TOEFL scores was simiIar tothat typically observed among foreign students. ITED scores were judgedto measure language ability, although the ITED generally appeared toodifficult for these subjects. Colleges might benefit from evaluating theTOEFL scores of Indian students in making admissions decisions, as theability of Indian students to succeed academically might be associatedwith their English proficiency.

-188- Cl, D1, D2, F4
70. Sharon, A. T. (1972). English proficiency, verbal aptitude, and
foreign student success in American graduate schools. Educa-
tional and Psychological Measurement, 32, 425-431. Also printed
as Test of English as a Foreign Language as a moderator of
Graduate Record Examinations scores in the prediction of foreign
students' grades in graduate school, 1971 (ETS Research Bulletin
No. 71-50). Princeton, NJ: Educational Testing Service. (ERIC
Document Reproduction Service No. ED 058 304)
Purpose
This study sought to investigate how TOEFL would add to the predic-
tive validity of the Graduate Record Examinations (GRE) Aptitude Test.
One hypothesis was that TOEFL, as an English proficiency test, and the
GRE, as a measure of academic aptitude, should yield different information
about the preparation of foreign candidates for graduate school. A
further hypothesis was that GRE verbal (GRE-V) scores should be better
predictors of graduate school achievement for students with high TOEFL
scores than far students with low TOEFL scores.
Method
A total of 975 foreign students we r! Itudied. Scores on the five
part TOEFL, GRE Aptitude Test scores, and graduate school grade-point
average (GPA) were supplied by 24 graduate schools. [For a brief descrip-
tion of the GRE Aptitude Test, see Summary No. 4, American Association
19714 Test scores were presumably obtained via preadmissions test-
ing--e.g., International tes administrations, in the case of TOEFL.]
Information was also obtainers regarding major field of.study, number of
semesters upon which the CPA was based, and whether the subjects had
withdrawn from graduate school. For purposes of the study, major areas of
study were categorized as (a) engineering, technology, and mathematics,
(b) natural sciences, and (c) other.
Results and Conclusions
The TOFFL and GRE scores of the 975 subjects in this study were
noticeably different from those of reference samples of examinees who had
taken TOEFL and the GRE. The average TOEFL score of the present sample
was 537 as compared to an average score of 487 for 113,975 foreign stu-
dents who had taken the TOEFL in the period February 1964 through June
1969. The average GRE scores of the students in the present study were
348 for verbal (GRE-V) and 609 for quarititative (GRE-Q) score. These
scores contrast with average scores of 516 for GRE-V and 524 for VRE-Q for
194

-189-
those taking the test in the period May 1966 through April 1969. (Thelatter examinees, who numbered approximately 539,000, were almost allnative Americans.)
GRE-V score correlated .70 with TOEFL score for subjects in thepresent study. While this correlation is high, it is nonetheless consis-tent with a hypothesis that the tests are not measuring exactly the sameunderlying abilities.
The relationships of GPA with GRE-V, GRE-Q, and TOEFL scores wereinvestigate.' separately for different major areas of study as well as forall majors combined. Linear regression analysis was used to determine howwell CPA was predicted by combined GRE-V and TOEFL scores, and by combinedGRE-Q and TOEFL scores. A special linear regression procedure was usedthat accommodated for differences in grade distributions across the 24schools that were studied.
Over all majors, GRE-Q correlated .32 with GPA; this correlation washiOler than that between GRE-V and GPA (r = .24) and that between TOEFLand GPA (r = .26). Grade-point average correlated more highly with GRE-Qthan with TOEFL for both engineering,. technology, and mathematics (GRE-Q:r = .39; TOEFL: r = .21) and the natural sciences (GRE-Q: r = .59;TOEFL: r = .39). For the "other" category, however, GPA correlatedslightly higher with TOEFL (r = .39) than with GRE-Q (r
.... .28) or withGRE-V (r = .35). Combining TOEFL with GRE-V scores or TOEFL with GRE-Qscores was judged not to result in significantly higher predictability ofGPA than was observed when the single best predictor was used, (No testsof statistical significance are cited to support this statement.]
Associations between CPA and GRE scores were examined based onwhether the subjects had scored in a low, middle, or high TOEFL scorerange. These associations were investigated separately for (a) engineer-ing, technology and mathematics and (b) other. (The natural sciences areawas not investigated_ because of the small number of subjects in this majorarea.) For subjects with TOEFL scores in the low and middle.ranges therewere stronger ra.lationships between CPA and both GRE-V and GRE-Q scoresthan had been observed when all levels of TOEFL scores were combined. Forsubjects with high TOEFL scores, however, there was no strong indicationof a similar pattern of results. Further, prediction of GPA by GRE-Vscores was better for subjects with low and middle TOEFL scores than forsubjects with high TOEFL scores in the area of engineering, technology,and mathematics. This result was nor consiFrent with the hypothesisthat GRE-V scores should correlate better -41th GPA among students withhigh TOEFL scores than among those with low scores.

-190- Cl, DI
71. Shay, H. R. (1975). Affect [sic) of foreign students' language
proriciency on academic performance. (Doctoral dissertation,
West Virginia University, 1975). Dissertation Abstracts Inter-
national, 36, I983A-1984A. (University Microfilms No. 75-21,
931)
Purpose
This study ascertained the degree to which academic success of
foreign graduate students in a U.S. university is related to (a) Graduate
Record Examinations (GRE) Aptitude Test scores and (b) TOEFL scores. The
study also inquired whether the predictive relationships for the GRE tend
to differ for foreign and American graduate students.
Background
The literature for American and foreign students shows that the GRE
is not a consistently reliable predictor of academic performance in
graduate school. One problem for foreign students is that English lan-
guage preparation in certain foreign countries is not adequate. TOEFL was
developed to assist in making admissions decisions for foreign students.
The test has been shown to correlate to a moderately high degree with
other tests of English proficiency and thus appears to have good concur-
rent validity. However, relatively low correlations have been found
between TOEFL and measures of later academic success. It has been argued
that TOEFL's primary function for graduate students is as a moderator
variable, to be used along with the GRE and other data in making admis-
sions decisions.
Me shod
The subjects were graduate students who attended West Virginia
University between May 1964 and May 1974. There were four groups of
subjects: 174 foreign students who completed 30 hours toward a graduate
degree (Group 1); 61 foreign students who failed to complete degree
requirements (Group 2); 145 American students who had been undergraduates
at West Virginia University (Group 3); and 165 American students who had
been undergraduates elsewhere in the United States. (Group 4). The
subjects in Groups 1, 3, and 4 were matched according to field of study
and year of graduation. The foreign students were drawn from 31 different
countries.
Graduate Record Examinations verbal (GRE --V) and quantitative (GRF-Q)
Aptitude Test scores were available from preadmissions testing for 166
196

-191-
students in Group 1, 14 in Group 2, 144 in Group 3, and 164 in Group 4.(For a brief description of the GRE Aptitude Test, see Summary No. 4,American Association ..., 1971.1 Scores on the five-part TOEFL wereavailable from preadmissions testing (presumably International administra-tions) for 69 students in Group 1 and 55 students in Group 2. (Mean TOEFLscores of Groups 1 and 2 were 507 and 499, respectively; SOs = 52 and42.)
Grade-point averages (GPAs) were calculated for all students at threestages in their graduate training: after completion of (a) 9 credithours, (b) 21 credit hours, and (c) 30 credit hours.
Results and Conclusions
Analyses of variance showed no significant differences in GRE scoresbetween groups of foreign students (Groups 1 and 2) or between groups ofAmerican students (3 and 4). However, significant differences in both theGRE -V and GRE-Q scores were found between the principal group of foreignstudents (Group 1) and each of the two groups of American students (3 and4).
Correlational analyses performed separately for 9-, 21-, and 30-cred-it hour GPA revealed the following effects: GRE-V did not correlatesignificantly with any of the GPAs for Group 1 (r's = .06 to .09) or Group3 (all r's - .15) but showed low significant correlations with the GPAsfor Group 4 (r's .18 to .29). GRE-Q showed low but signific : ' correla-tions with the GPAs for Group 1 (.26 to .27), Group 3 (.25 . , .28), andGroup 4 (.16 to .25). Correlations for Group 2 were based on too fewcases to interpret (N = 14). These data show that GRE-V failed to predictacademic success for most groups and, while GRE-Q generally correlatedsignificantly with GPA, this score accounted for only a small percentageof the variance in students' GPAs and thus may be of limited value as apredictor of academic success.
For the principal group of foreign students (Group 1), GRE-V wassignificantly correlated with total TOEFL score (r = .52) and with scoreson four of the TOEFL subtests: Listening Comprehension (.30), Vocabulary(.46), Reading Comprehension (.43), and Writing Ability (.41). Thus,there appears to be at least some commonality in skills measured by thesetwo tests.
For the principal group of foreign students (Group 1), correlationswere computed between TOEFL and GPAs ,:based on 9-, 21-, and 30-credithours. Correlations between total TOEFL score and the CPAs were very low(ranging from .08 to .12). Of correlations involving the TOEFL subtestsand CPAs, the only significant ones were those between English Structureand (a) 21-credit GPA (r = .29) and (b) 30-credit GPA (r = .33). Allother correlw_ions fell between -.10 and +.20 and were nonsignificant.

-192-
These low TOEFL-GPA correlations indicate that TOEFL is not a reliable
predictor of academic success in graduate school.
It is recommended, among other suggestions, that admissions decisions
be based on undergraduate transcripts and that currently used verbal
aptitude and language proficiency tests be excluded as admissions criter-
ia.

-193- DI, D2
72. Sokari, H. (1981). Predictors of college success among foreignstudents from various ethnocultural backgrounds (Doctoraldissertation, University of San Francisco, 1980). DissertationAbstracts International, 41, 3543A-3544A. (University Micro-films No. 8103636)
Purpose
This study examined the role of several variables in predictingcollege grade-point average (GPA) for foreign students in two colleges.Predictor variably) included TOEFL scores, high school grades, sex, age,resident status (resident vs. commuter), college major, scores on theCollege Board Scholastic Aptitude Test (SAT), number of college units(credits) completed, and school attended.
Background
Three studies reviewed show that TOEFL appears to be a moderatelygood predictor of college success. However, these studies were limited inthat two of them focused only on Asian students, and these studies did notcompare TOEFL with other predictors. Research suggests that potentialpredictors include sex, age, high school grades, college entrance examina-tion scores, resident status, and college major.
Method
The subjec'41) were 420 undergraduate foreign students at two Catholiccolleges in uorthern California (207 subjects from College 1, and 213 fromCollege 2), each of which enrolls approximately 3,500 to 4,000 studentsannually. [The specific colleges are not named.] The total sampleincluded 196 males and 224 females, drawn from 35 different countries oforigin. The subjects ranged in age from 18 to 32 years, and TOEFL scoresranged from 412 to 660.
TOEFL scores were available from school records for College 1 only[these are presumably scores on the three-part TOEFL obtained via Inter-national or Special Center administrations]. Data for other predictorvariables were available for both schools (except that resident status insnot a variable for College 1, as all students there were commuters). Dataavailable from school records included (a) scores on the SAT [for a briefdescription of the SAT, see Summary No. 2, Alderman, 1982] ; (b) averagehigh school grade [whether transformed to a single scale is not indicat-ed]; (c) age of the subject; (d) resident status (i.e., resident on campusvs. commuter); (e) major field; (f) number of scholastic units completed;and (g) ethnocultural backround, grouped into seven categories: Africa

-194-
(Gambia only), Oceania, (Cuba and Guam), North America (Canada), Europe
(10 countries), Near and Middle East (seven countries), Middle and South
America (six countries), and Fat East (eight countries).
Results
Stepwise multiple regression analyses were performed separately for
College 1 and College 2, with GPA as the criterion and each of the other
variables mentioned above as predictors. The analyses included three
scores from the SAT: verbal (SAT-V), mathematics (SAT-M), and total
(SAT --V + SAT-M) scores. For College 1 (the college for which TOEFL scores
were available), SAT-M score accounted for most of the total variance (57
percent) and, after the effect of SAT-M had been taken out, other vari-
ables accounted for ntgligikle amounts of variance (each 4 percent or
less). For College 2, average high school grade accounted for 26 percent
of the total variance in GPA, SAT-M score added about 9 percent, and sex
added 6 percent; other variables accounted for negligible amounts of
variance (i.e., each 4 percent or less). Analysis for both colleges
combined showed that SAT-M accounted for the greatest amount of variance
in GPA (28 percent), with sex accounting for an additional 8 percent,
and average high school grade an additional 6 percent; other variables
accounted for negligible amounts of variance (3 percent or less).
A stepwise multiple regression analysis was also performed for
College 1 with TOEFL as a criterion and all ether variables, including
college GPA, as predictors. In this analysis, total SA' accounted for the
largest amount of variance in the TOEFL score (27 percent), with other
variables accounting for negligible amounts of variance (each 1 percent or
less).
Additional analyses were also performed to test the effects of each
predictor separately on college GPA. Each analysis consisted of a contrast
between groups, with the mean difference in GPA compared to the common
standard deviation. These analyses showed significant differences in CPA
as a function of college attended (grades at College 1 were higher than
those at College 2) and sex (males outperformed females), with the level
of significance greater for students from male-dominated geographic
regions, especially for certain college majors (humanities, physical and
life sciences, and business administration). GPA was also significantly
related to the subject's age (older subjects outperformed younger stu-
dents) and to average high school grade for College 2. Also related to
GPA were SAT scores, particularly SAT"M, and number of scholastic units
completed. There was a suggested relation between resident status and
GPA, with residents performing better than commuters, although the lack of
resident students at one college prevents strong conclusions in this
regard. Finally, the relation of TOEFL to GPA was examined for subjects
at College 1 by dividing these subjects into two groups according to their
TOEFL scores: 412 to 609 and 610 to 660. No significant difference
between groups was found, indicating a failure of the TOEFL score to
predict college GPA.
2u0

-195-
Conclusions
The results suggest that TOEFL is not a good predictor of collegeacademic performance. Of the variables studied here, the best predictorappeared to be the SAT-M score. Also of some value as a predictor is thestudent's sex (particularly for students from male- dominated societies)and, to a lesser degree, the student's age. The results regarding effectsof average high school grade are mixed, as a significant relation of thisvariable to GPA was found for one college but not the other. Perhaps therole of high school grades is moderated by the student's major and/orregion of origin; the college in which a significant relation was foundhad a high percentage of Middle and South Americans Majoring in engineer-ing, whereas in the other college, more than half the foreign studentswere from the Far East and there was a higher percentage of businessadministration majors.

73. St. Martin, G. M. (1979). sojourner on
second language acquisition. Paper presented at the meeting of
the Society for Intercultural Training, Education, and Research,
Mexico City. (ERIC Document Reproduction Service No. ED 183
005)
Purpose
This study sought to determine whether livfmg with an American family
while taking an intensive English language course would improve foreign
students' learning of English.
Method
The subjects were 83 students enrolled in a 14-week intensive. English
language course who had chosen to live with American families ("homestay
subjects") and 83 other students ("non-homestay subjects") who were
matched with them in scores on the Michigan A or Michigan Placement Test.
(The structures of these tests are not described.) In most cases, pairs
were also matched for sex and native language. Non-homestay subjects
lived in dormitories or apartments, typically with, or close to, speakers
of their native languages. Eleven different native languages were repre-
sented.
Instruction consisted of 22.5 total hours per week of classes in five
areas: spoken English, grammar, composition, reading, and laboratory. At
the end of the 14-week term, all students were graded in all areas except
the laboratory. Also, most subjects took the three-part TOEFL (presumably
at International or Special Center administrations), yielding 69 pairs of
subjects on which analyses involving TOEFL were based.
Results and Conclusions
Analysis of variance showed significant differences between homestay
and non-homestay subjects in total TOEFL score and in two subsections:
(a) Listening Comprehension, and (b) Reading Comprehension and Vocabulary;
the difference for the third section, Structure and Written Expression
section, was in the same direction but was not significant. Analyses of
variance also showed significant differences in favor of homestay subjects
in grades in all areas: spoken English, grammar, reading, and couposi-
tion.
The results support the assumption that the best way to acquire
language competence is to live an environment in which it is used.
Among possible reasons for this is that homestay students may be encour-
aged to experiment with English in a relatively relaxed atmosphere. The
202

-197-
present results, however, might also be due to the fact that students whochoose the homestay situation are less shy and have a more positiveattitude toward English and English language speakers than do students whodo nut choose this situation.

-198- B5, B7, Cl, G2
74. Stevenson, D. K. (1975) . A preliminary investigation of constructvalidity and the Test of English as a Foreign Language (Doctoral
dissertation, University of New Mexico, 1974). Dissertation
Abstracts International, 36, 1352A. (University Microfilms No
75-18, 664)
Purpose
The first portion of this thesis discusses the assessment of validity
in relation to TOEFL and language tests in general; the second portion
describes a project to develop an oral cloze test and determine its
relationship to TOEFL and other measures.
Background
Several forces led to development of TOEFL, including the need for a
language measure to use in selecting foreign students for admission to
colleges and universities in the United States and Canada. Although
TOEFL appears not to be a suitable predictor of college performance, it is
most important that TOEFL assess the language proficiency required for
academic success. A problem is that it has been difficult to define such
a requirement. Yet the validity of TOEFL as a measure of English language
proficiency needs to be established.
Content validation is one approach. Unfortunately, linguistic theory
does not intlude specifications that can provide a firm basis for content
validation of TOEFL. Expert judges can only determine if the content
seems reasonably in accord with theory. Even then, the content seler.ted
by such judgmental procedures might prove to relate more to a foreign-
speaks:. standard than to the more appropriate native-speaker standard.
A second method is criterion-related validationdetermining if the
test is sufficiently related to another, accepted measure of English
proficiercy. A problem, however, is that it is difficult to find a
criterion measure whose own validity has been clearly established. Also,
if the criterion is to be a behavior sample, appropriate quantification
poses some difficulty.
A third approach--construct validation ---is advocated here. This
approach involves demonstrating (a) that two or more intended indices of
the same skill aro. relatively highly related (thus showing "convergent
validity") an' hat two intended indices of different skills are less
highly relat, showing "discriminant validity"). The discriminant
validity of tht TOEFL subtests may not be sufficient to conclude that
these different parts are measuring different skills (cf., data from Pike,
1979).
204

-199-
A multitrait multimethod approach to examining the validity of theTOEFL Listening and Reading Comprehension section is advocated. ' By
this method, convergent and discriminant validity would be demonstrated ifcorrelations among tests of a single skill, using different methods, werehigher than correlations between tests of different skills, using similarmethods. In this regard, it is proposed that the TOEFL Listening andReading Comprehension subtests be administered along with an oral and awritten cloze test in order to examine interrelationships among thesetests. The research summarized below is an effort to develop an oralcloze test that might be used for this purpose and to determine itsrelation to TOEFL and to another test of listening ability.
Method
[Development of the oral cloze test included several phases, and onlythe phase involving comparison with TOEFL is summarized here. Developmentof a written cloze test, which was not compared with TOEFL, is also notdiscussed.)
The subjects were 101 foreign students at Indiana University,46 of whom were included in the analyses involving TOEFL.
In the oral cloze test, the subjects listened to two passages total-ing 434 words of difficulty appropriate for junior-high level nativeEnglish speakers. Every seventh word w.s replaced uith a bell sound,and a six-second pause was inserted after every sentence to facilitateresponding. The subjects guessed each deleted word by writing it on aseparate answer sheet. Each passage was repeated four times. Responses
were scored by an exact-word criterion (i.e., only the precise word that
had been deleted was scored correct).
A multiple-choice version of the noise test (see Gradman & Spolsky,1974) was also administered. in this test, the subjects listened to 50sentences with a white noise overlay and, for each sentence, chose the onesentence out of five listed on an answer sheet that matched the sentenceheard. Scores on the five-part TOEFL [presumably obtained at Internation-al administrations) were available from the students' institutionalrecords.
Results and Conclusions
For the full sample of 101 students, the oral cloze test showed asuitable score range (0 to 36, of a possible 50) and KR-21 reliability of
'Campbell, D. T., & Fiske, D. W. (1959). Convergent and discriminant
validation by the multitrait-mult1r.ethod matrix. Psychological Bulletin,56, 81-105.

-200-
.84. For the 46 students for whom TOEFL data were available, the scorerange was 2 to 36, and the KR-21 reliability was .76. For the noise test,
a KR -21 reliability of .51 was observed for these 46 students.
Correlations were computed among the oral close test, the noise test,and the five TOEFL subtests. Initial results of interest included the
following: (a) intercorrelations among the TOEFL subtests were not ashigh as in most studies (here, .05 to .67, median .54 ); (b) the oral
close test correlated most highly with the noise test (.67); and (c)correlations with the TOEFL subtests were higher for the oral close test(.29 to .51) than for the noise test (.19 to .45). Of particular interest
is that the oral close test correlated more highly with TOEFL Reading
Comprehension (.51) than with Listening Comprehension (.32). This last
result implies either (a) that the oral close test may not be an effective
test of listening ability, or (b) that the TOEFL subtests may be deficient
in construct validity.
A factor analysis of the seven variables was performed, and loadings
on two factors were generated by varimax rotation. The highest loadings
on one factor involved the oral close test, the TOEFL Listening Comprehen-sion subtest, and the noise test; the highest loadings on the other factor
involved the other four TOEFL subtests. Although caution is warranted ininterpreting the data from such a small sample, one factor observed here
is tentatively identified as a listening factor and the other as a general
language proficiency factor.
The oral close test, developed as an experimental measure, showspromise as un instrument for further research on the construct validity of
TOEFL and other language measures.
206

-201- D1, D2, El, F3
75. Stover, A. D. (1982). Effects of language admission criteria onacademic performance of non-native English-speaking student!(Doctoral dissertation, University of Arizona, 1981). Disserta-
tion Abstracts International, 42, 4374A-4375A. (UniversityMicrofilms No. DA 8207017)
Purpose
This study investigated the contribution of TOEFL scores, averagegrade in the final semester of pre-university classes in English as asecond language (ESL), native language, and major area of study to predic-tion of first-semester university grade-point average (GPA). Two indepen-
dent samples of students were employed in order to ascertain the gener-alizability of results.
Method
The main sample of subjects were 159 students (98 undergraduate and61 graduates) who enrolled in the Center for English as a Second Language
(CESL) at the University of Arizona between spring 1978 and fall 1979 and
later enrolled in the regular academic curriculum at the university.Admission to the University of Arizona required a TOEFL score of 450 or
above and a minimum average grade of 2.5 in CESL classwork. These subjects
had taken the three-part TOEFL.
The validation sample consisted of 142 students (91 undergraduatesand 51 graduates) who enrolled in the CESL during summer 1976 to fall
1977, then enrolled in the regular academic curriculum at the University
of Arizona. There was no minimum CESL grade requirement for universityadmission in force for the validation sample, which had matriculatedearlier than the main sample. The validation sample had taken the five-
part TOEFL. For both samples, TOEFL scores [presumably obtained inInternational administrations) and first-semester university GPA wereobtained from school records.
The predictive validity of TOEFL and the average CESL grade wereexamined for Arabic, Japanese, Spanish, and "other" language groucq.
Also, the data were examined separately for several major areas of study:
agriculture, business, engineering, liberal arts, fine arts, social
sciences, and "others."
Results and Conclusions
In both samples, subjects with a mthimum grade of 2.50 in the final
semester of the CESL obtained an average GPA in their first semester of

-202-
regular academic study that was higher than the minimum GPA required toavoid academic probation; this finding applied for subjects who scored at
or above 450 on TOEFL. The (three-part) TOEFL score of the main sampleand the (five-part) TOEFL score of the validation sample were found to
correlate .21 (2. < .05) and .16 (no) , respectively, with undergraduate
GPA. TOEFL score did not correlmte significantly with graduate GPA for
either sample.
There did not appear to be any systematic differences in GPA among
language groups or among major areas of study, either at the undergreJ:lce
or thf graduate level. The Arabic language subgroup, however, obtained alower mean TOEFL score than did the otner language groups in the main
`sample of subjects. ARegression analyses indicated that the graduate
versus undergraduatsavariable was the strongest predictor of first-semester college GPA and that the sw.rage CZSL grade was a strangerpredictor of first-semester college GPA than was the TOEFL score in both
the main and vas. dation samples. This result was not unexp'cted, given
that ESL course .'..nice was similar to regular course experience at the
university. T1, cession analyses also showed that preiction of
first-semester TOEFL was better for subjects given the three-part
TOEFL than for those giver the five-part TOEFL, These analyses alsoindicated that language group was u significant predictor of university
GPA for the validation sample but not for the min sample of subjects.
Graduate school first-soneetet G'any predictor variai,le except majorpercent of the varip.ace o! first -seine'ere earned by sub) acts in the libcr.
ences than in other majors.
1 was not *significantly related totree. Major arias counted for 29ter graduate GPA, as higher grades1 arts, line -arts, and 3o ial sci-
A combination of TOEFL scuze and average CESL grade segw-e effective
for prediction of undergraduate college ZPA. Score. on TOEFL and the
average CESL grade appeared to measure different language related phenom-
ena. More research is needed regarding the En&iish language requirementsof academic work in college. A discrepancy between the main and validation
samples in the importance of language group in determiniwY GPA suggests
that more attention needs to be given to how native language may influence
English proficiency and academic achievement.
2C8

7/0
-203- El, Fl, G2
Swinton, S. S., & Powers, D. E. (1980). Factor analysis of the Testof English as a Foreign Language for several language groups17TOEFL .Research Rep. No. 6; ETS Research Rep. No. 80-32).Princeton, NJ: Educational Testing Service. (ERIC DocimwMReproduction Service No. ED 218 921)
Purpose
study sought to identify the component abilities that aremeasured by TOEFL and to determine whether there are differences amonglanguage groups in the pattrrns of abilities tested. Toward this end,factor analysis was used to determine the factor structure of the test foreach of seven major lankage groups.
Metflod
Approximately 600 to 1,000 subjects from each of seven languagegroups we? re chosen from the total population of examinees at the November1976 International TOEFL administration. The language groups were Arabic,Chinese (non-Taiwanese), Farai, Japanese, and Spanish, along with group-ings of African and Gr.rmani.. languages. Represented in az: African groupwere Yoruba, Ibo, Eiik, and other West African languages; and in theGermanic group, German, Dutch, Swedish, Norwegian, Danish, and Icelandic.
Each item in the three-part TOEFL (excluding one item omitted fromoperational scoring) was used as a variable in the analyses. For eachlanguage r o..p, thd, matrix of tetrachoric interitem ,f,orrelations wascomputed. (This cito.rutation required that items answered correctlyby more than 96 percent of a group be omitted.) Factor analysis wasperformed, and a four-rector varimax rotation was applied for each lan-guage group. An additional factor analysis was also performed using anorthogonal rotation to fit the design structure of the test, as describedbelow.
Results
There was subtantial variation among language groups in mean TOEFLscores, with the Germanic group receiving the highest scores and the Feral
speakers the lowest. Also, the patterns of subtest scores differedsomewhat across language groups; speakers of African languages, forexample, ranked second on Structure and Written Expression but sixth onListening Comprehension.
Preliminary data from the factor analysis suggested that three tofive factors are appropriate to account' for the performance of each
-204-
language group except the Germanic group, for which as many as eightfactors might be appropriate. The four-factor varimax rotation wasapplied and, for each language group, the number of items with the highestloadings on each factor was determined. Listening Comprehension items
were found to form a separate factor for all language groups. Of the
items in the Structure and Written Expression section, the written expres-sion items clustered with the structure items for some rative languagesbut not for others, and the vocabulary items formed a dimension separatefrom the reading comprehension items in many groups.
The four-factor solutions for each language group were then submittedto an orthogonal rotation to ensure that they would fit the design struc-
ture of the test. The first factor was specified as that on which asample of 14 listening comprehension items showed maximum loadings; thesecond target factor was defined by maximum loadings of all 14 structureitems; and the third target factor was defined by maximum loadings of asample of 14 vocabulary items. The fourth factor remained unspecified.
A clear, unambiguous factor relating to listening comprehension wasidentified for all language groups. Other factors, however, were subject
to group differences. For the African, Arabic, Chtnese, and Japanesegroups, the majority of structure, written expression, and reading compre-hension items showed their highest loadings on Factor II, while the
majority of vocabulary items showed their highest loadings en Factor III.For the Spanish and Germanic groups, on the other hand, the preponderance
of structure items and written expression items showed their highest
loadings on Factor II, while most vocabulary items and reading comprehen-sion items showed highest loadings on Factor III. For Farsi speakers,
these two factors were much less differentiated. For most languagegroups, there was no obvious association between Factor IV and any parti-
cular item type.
Correlations were computed between each factor and the subjects' sex,age, academic status, and the number of times TOEFL had been taken. The
correlations that were most consistent across language groups were thosebetween Factor III and (a) age and (b) academic status, suggesting thatvocabulary items may be more susceptible than any of the other item typesto training or experience.
Conclusions
Three major factors appear to underlie performance on TOEFL. The
first involves listening comprehension for all language groups. The
nature of the second and third factors depends on the language group inquestion. For the two ludo-Europe= language groups, whose languages aremost similar to English (the Germanic and Spanish groups), the second andthird factors correspond with the current format of TOEFL, in whichstructure and written expression items contribute one subscore and reading
2 .i0

-205-
comprehension and vocabulary items contribute another. For most othergroups studied -- African, Arabic, Chinese and Japanese--reading comprehen-sion items cluster with structure and written expression items, withvocabulary forming a separate dimension.
These results indicate the value of examining not only the totalTOEFL score in assessing language competence but section scores as well.The results also suggest that, although the score on the third section ofTOEFL is based on a combination of performance on reading comprehensionand vocabulary items, there can be value in examining performance on thesetwo item types separately, since for some language groups these item typesapparently tap different factors.
An important issue of recent debate concerns the degree to whichlanguage proficiency is divisible into separate language skills. The
present results suggest that the answer to this issue may depend on thesample used, as the Farsi speakers showed relatively little differentia-tion among factors, whereas the Germanic speakers showed considerabledifferentiation, with other groups falling between these extremes. Thatthese two language groups also represented the extremes in average TOEFLscores suggests that the degree of differentiation may relate to overalllevel of English proficiency.
4211

-206- B3, D3, E6, H
77. Warner, C. J. (1982). A study of the relationships between TOEFLscores and selected performance characteristics of Arabicstudents in an individualized competency based training program(Doctoral dissertation, University of Tennessee, Knoxville,1981). Dissertation Abstracts International, 42, 4810A.(University Microfilms No. DA 8209009)
Purpose
This study addressed the following questions regarding Arabic train-
ees in a special two-year vocational education program in the United
States: (a) How does the distribution of TOEFL scores compare with the
distribution of instructors' performance ratings? (b) is there a differ-
ence in distribution of performance ratings given by English languageinstructors and those given by instructors in individual areas of-special-
ization? (c) How do TOEFL scores compare with students' class rankings?
and (d) Do trainees in different job categories differ in TOEFL scores?
Background
Grade-point average (CPA) for foreign students may be affected by
their relatively low English proficiency and instructors' attitudestoward them, thus obscuring the students' academic accomplishments. The
low relationship between TOEFL and academic success found in some studies
may relate to this fact and to the fact that TOEFL measures knowledge of
formal English structure but not necessarily ability to communicate. Astronger relationship might be observed if, as in the present study,academic success were measured by instructors' ratings rather than GPA.
Method
Eighty-one individuals from [an unnamed] Middle Eastern countryparticipated in a two-year training program in the United States. The
program prepared trainees, both professional and technical, to participate
in the development of vocational education centers in their home coun-
tries. The subjects attended English-language training programs during
the first six months and professional/technical training classes for the
remainder of the two years. English training was provided at six U.S.
universities, and professional/technical training was provided at four
U.S. universities.
Scores on TOEFL (presumably the three-part version] were obtained
for all 81 subjects at the end of their English training; except where
noted, these are the TOEFL scores used in analyses reported below. TOEFL
212

-207-
had also been administered to 61 of the...e subjects at the beginning oftheir English language training to pe ..A.t assessment of gain. Both setsof TOEFL scores were obtained from U.S. Department of Labor records [thescores were presumably earned in International or Special Center adminis-trations]. In addition, subjects were rated on a five-point scale bytheir English language instructors and professional/technical instructorson four variables: (a' xademic ability, (b) dependability, (c) profes-sional attitude, and (- ability to communicate.
Results and Conclusions
The overall mean TOEFL score after English language training was373.1., (SD - 39.0). The mean change in TOEFL score, for the 61 subjects..ct co at both times, was 34.6 points (SD gm 38.4).
The subjects were placed into five groups based on their TOEFLscores. The middle group was defined by adding one-half SD and subtract-ing one-half SD from the mean, and score ranges for groups 2 and 4 wereequal to one SD. Hence, the TOEFL scores for the five groups were (a)less than 314.6, (b) 314.6 to 353.5, (c) 353.6 to 392.5, (d) 392.6 to431.5, and (e) greater than 431.5. The numbers of subjects falling intothese five groups--1, 23, 40, 12, and 5, respectively--comprised thedistribution of TOEFL scores.
The numbers of subjects falling into each of five academic-perform-ance groups (poor, below average, average, above average, and outstand-ing), as rated by their English language instructors, were 5, 19, 31, 21,and 5, respectively. A chi-square goodness'of fit analysis showed thatthis distribution was significantly different from the distribution ofTOEFL scores. Analyses were also performed involving distributionsof English instructors' ratings on each of the other three variablesdescribed above and professional/technical instructors' ratings on each ofthe four variables. All of these distributions differed significantlyfrom the TOEFL distribution. (These results do not permit conclusionsabout the degree of relationship between TOEFL scores and instructors'ratings. Since scores were apparently provided to the investigatorwithout identification by subject name, it was not possible to conduct thetypes of analyses, such as correlational anE'ysis, that could indicate thedegree of match between individuals' scores.)
The distribution of ratings by English language instructors wascompared with the distribution of ratings by professional/technicalinstructors for each of the four factors. For the academic abilityfactor, these distributions differed significantly, with the first groupgiving a modal rating of "average" and the second group, "above average."The distributions also differed significantly for the professional atti-tude and ability to communicate factors, but not for dependability. Onall factors except dependability, then the students were rated more

-208-
favorably by their professional/technical instructors than by their
English language instructors. These results may have to do with differ-
ences in frame of reference, as the English language instructors' primary
experience is with foreign students preparing to enter college-degree
programs, whereas the professional/technical instructors are accustomed to
students studying vocational education.
The professional/technical instructors were asked to place their
students into three groups: top third, middle third, and bottom third of
the class. No significant difference in TOEFL scores among these groups
was observed, as the three groups had mean TOEFL scores of 388.5, 362.9,
and 357.1, respectively.
Five subgroups of trainees were identified: (a) administrator,
coordinator (N 13); (b) instructor-educator, TV director, media produc-
er/supervisor (N 13); (c) curriculum developer, media developer, engi-
neering technician, computer technician (N 7); (d) instructor, main-
tenance engineer (N 39); and (e) media operator, technician, recording
engineer, illustrator/artist (N 9). Subjects were placed into three
groups based on their post-training TOEFL scores: (a) below 353.6, (b)
between 353.6 and 392.6, and (c) above 392.6. A chi-square test ofindependent samples showed a significant relation between job classifica-
tion and TOEFL score. Mean TOEFL scores of the five groups were 379.2,
382.2, 401.0, 366.8, and 357.0, respectively. (No significant relation
was observed between job classification and gain in TOEFL score due to
English training, however.) English proficiency thus seems to have been
involved to some extent in selection of trainees for their jobs.
214

-2 01,,- DI, D2, F2, F3, Fk
78. Wilcox, L. 0. (1975). The prediction of academic success of under-graduate foreign students. (Doctoral dissertation, Universityof Minnesota, 1974). Dissertation Abstracts International, 35,6084B. (University Microfilms No./5-12, 178)
Purpose
This study examined the predictive validity of prior academic recordand standardized test scores for students from Hong Kong enrolled at astate university and for students from Vietnam enrolled at several insti-tutions.
Method
The subjects in this study were (a) 99 students from Hong Kong intheir freshman year at the University of Wisconsin -- Madison between 1968and 1973 and (b) 84 Vietnamese students in their freshman year at 16 U.S.institutions during 1967 and 1968. The subjects from Hong Kong allreceived financial support from their families, while the subjects fromVietnam were financed by the Agency for International Development. TheHong Kong group had taken the Hong Kong Certificate of Education Examina-tion (HKCEE), which is used to determine which students will be permittedto enroll in a local two-year course of study leading to enrollment in auniversity. There are two comparable versions of the HCKEE, one inChinese and one in English; data from the latter were used in this study.Students take examinations in five to nine subject areas and, in each, aregraded on an eight-point scale. For this study, the student's score westhe sum of his or her six best scores.
The Vietnamese subjects had taken the Baccalaureate Second PartExamination (Bac II), which is required in South Vietnam for admission toa university and for deferral from the military draft. The Bac II con-sists of essay questions in philosophy, natural science, physics andchemistry, mathematics, and two languages; and multiple-choice questionsin history, geography and civics. The results of each test are weightedand summed to provide a total score on a five-point scale.
/'1 subjects had graduated from secondary school in their homecountries and had taken the five-part TOEFL [presumably in Internationaladministrations) and the College Board Scholastic Aptitude Test (SAT).[For a brief description of the SAT, see Summary No. 2, Alderman, 1982.jThe subjects from Hong Kong had also taken at least two College BoardAchievement (Ach) tests. College Board Achievement tests, offered in15 subject areas, consist of multiple-choice items testing students'knowledge of the particular subjects. The group from Hong Kong took alltests in their native country while the group from Vietnam was tested uponarrival in the United States. The Hong Kong sample was divided into
215

-210-
subgroups by curriculum (liberal arts vs. engineering), year of enroll-
ment, and sex. The Vietnamese sample was divided into those studying in a
California university and those studying at any of 12 other U.S. institu-
tions.
Test scores and prior academic record were correlated with first-
semester grade-point average (GPA) for Hong Kong subjects, and with
first-year CPA for Vietnamese subjects. Multiple regression analysis was
then applied to the predictors to determine the best combination of
variables for predicting GPA and the relative contribution of each vari-
able. Both Bayesian and least squares regression weights were applied and
compared. Bayesian procedures are considered preferable for analyzing
data from small samples.
Results and Conclusions
The correlation between the HKCEE and first-semester CPA for Hong
Kong subjects was .40. This is slightly less than the correlation betweenhigh school performance and college GPA for U.S. students reported in the
literature, although the correlation increased to .50 when corrected forrestriction of range. The correlation between the BAC II and first-semester CPA for Vietnamese subjects was .34; the correlation with full
first-year GPA was .50. For this same group, high school grade averagecorrelated .47 with first-year CPA.
The correlations of these and other standardized tests with CPA are
depicted in Table 1. The data show that SAT mathematics (SAT-M) scores
were significantly related to CPA in both the Hong Kong and Vietnamese
samples. These correlations are comparable to those commonly reported for
U.S. students. For the Hong Kong groe ;p, the average score on three SAT
achievement tests (ACH Ave) functioned as a useful predictor of CPA (r =
.49). When added to HKCEE scores, ACH Ave scores contributed signifi-
cantly to the prediction possible from HKCEE alone. For both groups, the
addition of SAT-M to the measure of high school achievement (HKCEE or Bac
II) increased the correlation with freshman GPA by about .10.
TOEFL score was unrelated to CPA in the Hong Kong sample but corre-lated significantly with CPA in the Vietnamese sample. TOEFL did not
improve the prediction of GPA when combined with other good predictorsfor either group.
The two groups differed considerably in the mean and standard devia-
tion of their TOEFL scores (Hong Kong: mean = 570, SD 0 41; Vietnamese:
mean 459, SD 78). Far greater variation in the-Tietnamese than theHong Kong stiglects may partly account fpr the difference in correlation
for the two groups. Also, a threshold variable may have been operating.That is, English skills and academic success may be related at low levels
of proficiency but unrelated at levels above the threshold value. This
216

-211-
Table 1
Simple and Multiple Correlations of High School AcademicAchievement and Test Scores with College GPA
mo
Group
.,.....Predictor(s) Correlation with GPAa
Hong Kong HKCEE .40*N 99 SAT-V .01
SAT-M .41*41ACH Ave .49*TOEFL .00HKCEE + ACH Ave .56*BKCEE + TOEFL + ACH Ave .56*
Vietnamese BAC II .50*N 84 SAT-V .33*
SAT-M .51*TOEFL .46*Bac II + SAT-M .60*Bac II + SAT-M + TOEFL .60*
*First-semester CPA for Hong Kong sample; first-year GPA for Vietnamesesample.
*p < .01
might explain why the Hong Kong subjects showed no relationship betweenTOEFL and GPA while the Vietnamese subjects, whose English proficiency waslower, showed a significant relationship between these measures.
The Hong Kong and Vietnamese samples were subdivided according toyear of enrollment, sex, and curriculum. None of the resulting correla-tions for a particular predictor or set of predictors was significantlydifferent from the correlation for the total group. The least squares andthe Bayesian regression procedures predicted equally well.
A final analysis for the Vietnamese samplkexamined whether Englishproficiency served as a moderator variable in ditermining the predictivevalidity of aptitude test scores. This sample was divided into high andlow scoring groups on TOEFL, with the midpoint being a score of 450.No significant difference between groups was found in the correlationswith GPA for SAT-V or for SAT-M.
217

-212- E2, E3, E6, H
79. Wilson, K. M. (1982). A comparative analysis of TOEFL examineecharacteristics, 1977-1979 (TOEFL Research Rep. No. 11; ETS
Research Rep. No. 82-27). Princeton, NJ: Educational Testing
Service.
Purpose
To gain a better understanding of the role of TOEFL in the education-
al plans of foreign students, this study examined the charactvristics and
performance of foreign nationals who took TOEFL during the period from
September 1977 through August 1979 and reported that they were doing so
in order to study in the United States or Canada.
Method
A history file was created using TOEFL program records containing
data on personal and academic characteristics provided by examinees on the
TOEFL answer sheet. These data include the examinee's sex, age, nativelanguage, native country, country of residence, level of intended degree
program (and intended department of study for graduate level aspirants),previous TOEFL testing, and pattern of score reporting (i.e., designating
or not designating institutions/agencies as score-report recipients).Descriptive statistics on these data were computed. Section and total
scores on the three-part TOEFL were determined for subgroups on eachvariable. Finally, correlational analyses were performed in order to
quantify the relationship between membership in relevant subgroups and
performance on TOEFL. The analyses included only International andSpecial Center testing program examinees who designated native countries
and indicated that their reason for taking the TOEFL was to study at auniversity in the United States or Canada. A total of 235,738 examinees
met these criteria.
Results and Conclusions
Of the many findings reported in this study, the following are some
of the more salient.
A total of 163 countries were named as native countries by two or
more degree seekers. The 25 largest native country groups accounted for
84 percent of all degree seekers. Five countries accounted for 54 percentof all degree seekers; Asian and Mideastern countries accounted for 50
percent and 23 percent, respectively.
About half of all degree seekers were prospective undergraduate
students, and about half were prospective graduate students. Almost
218

-213-
one-third had taken TOEFL previously. More than sever in 10 w're male,and almost three in 10 were tested in the United States or Canada. Thetypical (median) undergraduate degree seeker was 20 years old, and thetypical graduate degree seeker was 25. Only 50 percent designated insti-tutions to receive TOEFL score reports. Sixty percent of all prospectivegraduate students did not name specific depaapents of study. Among the40 percent that did, 50 percent named one tW# the natural sciences, 20percent named a business school, 20 percent named one of t:e socialsciences, and 8 percent named a subject in the humanities.
Prospective graduate students performed better on TOEFL (mean totalscore 0 511) than did prospective undergraduates (499). Undergraduatestypically outperformed graduate students on the Listening Comprehensionsection and graduate students typically scored higher on Structure andWritten Expression and on Reading Comprehension and Vocabulary. Womentended to outperform men (mean scores 513 and 502, respectively), andexaminees tested in foreign centers did better than those tested domesti-cally (mean scores 512 and 488, respectively). Repeaters tended toattain a lower mean score (496) than did those taking the test for thefirst time (505). The 57 percent who did not request that official scorereports be sent to institutions received a considerably lower mean score(486) than did the total group (505).
For 129 native country subgroups with 15 or mere degree planners, thefollowing relationships were identified. The percentage of nonreportingof scores to institutions was inversely related to TOEFL score (r R - -.55).The percentage of repeaters was inversely related to TOEFL score (r-.64). Native countries with a higher percentage of women examinees had ahigher TOEFL score (r .40). On the average, examinees from developedcountries included higher percentages of women, were younger, and hadhigher TOEFL scores (especially on the Listening Comprehension subtest)compared to examinees from developing countries.
Based on the above findings, the following conclusions seem warrant-ed. Many examinees (perhaps the majority) do not apply to take TOEFL ator around an appropriate time of testing for admission for the followingacademic year. Those who designate institutions to receive score reportsare closer to the time of enrollment than are those who do not. The
latter group of examinees are primarily interested in assessing theirEnglish proficiency to determine if they should apply for admission now orcontinue to study English and repeat TOEFL until they attain an acceptablescore.

-214- Cl, E6, F5
AO. Wilson, K. M. (1982). GMAT and GRE Aptitude Test performance inrelation to Rrimary language and scores on TOEFL (TOEFL ResearchRep. No. 12; ETS Research Rep. No. 82-28). Princeton, NJ:Educational Testing Service.
Purpose
This study was conducted with two main goals: (a) to describe the
performance of foreign examinees on the Graduate Management Admission Test
(GMAT) and the Graduate Record Examinations (GRE) Aptitude Test in rela-
tion to self-reported primary language (English vs. other) and in relation
to the performance ef the total population examinees on these tests,
and (b) to analyze the relationships betwe,. . performance on TOEFL and
performance on the GMAT fano GRE.
Method
Through the use of cross-file matching of data maintained by the
GMAT, GRE, and TOEFL programs, a history file was constructed that con-
tained data on the performance of examinees who took either the GMAT and
TOEFL or the GRE and TOEFL between September 1977 and August 1979. [The
GMAT is briefly described in Summary No. 64, Powers, 1980; the GRE Apti-
tude Test is briefly described in Summary No. 4, American Association1971; TOEFL scores were presumably obtained via International or Special
Center administrations.] Separate analyses were conducted for foreigncandidates who indicated on their GMAT or GRE answer sheets that English
was their primary language (EPL) or second language (ESL). EPL examinees
were those who reported that they communicated better or were more fluent
in English than in any other language. The subgroups were further broken
down according to self-reported citizenship status (U.S. vs. foreign).
The GMAT consists of verbal (GMAT-V) and quantitative (GMAT-Q)aptitude sections, and the GRE consists of verbal (GRE-V), quantitative
(GRE-Q) , and analytical (GRE-A) aptitude sections. For each group of
examinees, means and standard deviations were obtained for section and
total scores on each test. Also, a linear correlation was computedbetween the score for each section of the GMAT or GRE and the TOEFL
score.
Results and Conclusions
GMAT/TOEFL
Over 5,000 examinees took both the GMAT and TOEFL during the period
in question. Table 1 shows mean scores 'on the two tests. Also indicated
220

-215-
are percentile ranks showing the standing of the examinees either (a) onthe GMAT relative to all examinees taking the GMAT betwt.en October 1977and July 1980, or (b) on TOEFL relative to all prospective graduateapplicants taking TOEFL between September 1978 and August 1980. Thetypical GMAT/TOEFL examinee apparently was well above average in Englishlanguage proficiency. The TOEFL mean (553) for this group was at the 77thpercentile in the distribution of scores for all prospective graduate-level examinees. Percentile ranks on GMAT subscores were considerablylower for this select group of TOEFL examinees, except for the score onthe quantitative section, which was above the mean for all examinees onthe GMAT. While the foreign EPL examinees (from non-English-speakingcountries) had higher verbal scores than the ESL examinees, they werestill substantially below the mean for all GMAT examinees.
Table 1
Means and Percentile Ranks on TOEFL and GMATfor TOEFL/GMAT Examinees
Foreign EPL(N so 1197)
Foreign ESL(N - 3918)
EPL & ESL(N 5115)
Mean Rank Mean Rank Mean Rank
GMAT - Verbal 20.2 25 15.7 13 16.8 18GMAT-Quantitative 27.5 52 29.0 60 28.6 60GMAT-Total 418.0 31 389.8 23 396.4 26
TOEFL Total 589.4 89 541.8 71 552.9 77
TOEFL Let 58.2 83 54.8 71 55.6 75TOEFL S & WE 58.7 88 53.0 68 54.3 72
TOEFL RC & V 59.9 88 54.8 67 56.0 74
aTOEFL sections, abbreviated here and in Tables 2 and 3, are LC: Listen -
ing Comprehension; S & WE: Structure and Written Expression; and RC & V:Reading Comprehension and Vocabulary.
The correlations between section and total scores on the GMAT andTOEFL were nearly identical to those reported by Powers (1980). They showthat the TOEFL scores were strongly related to the Quer verbal scores butonly moderately related to the quantitative scores. The correlationbetween TOEFL and the GMAT-V was slightly higher for 'the EPL group (r.76) than for the ESL group (r - .68). However, the EPL group attained
higher scores on the GMAT-V than did the ESL group. Thus, the lower
221

-216-
correlation for the ESL group may have resulted from the fact that this
group had lower and more homogeneous scores on the GMAT, thus producing a
possible cellar effect. Also, because of the EPL examinees' greater
proficiency in English, their performance may have been more reliably
assessed by the GMAT. Although it is not possible to identify precisely
the cause of the discrepancy in the correlations for the EPL and ESL
groups, the differences are small enough that, for purposes of interpret-
ing GMAT scores in light of TOEFL scores, separate treatment of EPL and
ESL subgroups may not be necessary.
GRE/TOEFL
Table 2 shows the means and percentile ranks for nearly 4,000 GRE/
TOEFL examinees. Reference groups for deriving the percentile ranks here
are (a) for TOEFL, all graduate-level candidates who took TOEFL between
October 1977 and August 1980, and (b) for the GRE, all candidates who took
the GRE between October 1977 and June 1980. The data show that the
typical GRE/TOEFL examinee was above average in English language profi-
ciency, as reflected in TOEFL performance (80th percentile). Performance
on the GRE, in contrast, was considerably lower for this subgroup of
examinees than for all GRE examinees on the verbal and analytical aptitude
sections, although it was above average for the quantitative section.
While the foreign EPL examinees exhibited higher ranks on TOEFL than did
their ESL counterparts (84 vs. 76), they were still substantially below
the mean for all GRE examinees on the GRE verbal and analytical subtests.
The foreign EPL candidates performed better than the ESL group on the
verbal section of the GRE but not on the other two sections.
Table 2
Means and Percentile Ranks for TOEFL/GRE Examinees
Foreign EPL Foreign ESL EPL & ESL
(N m. 1366) (N * 2422) (N - 3808)
Mean Rank Mean Rank Mean Rank
GRE-Verbal 386 23 345 16 360 18
GRE-Quantitative 603 72 606 72 605 72
GRE-Analytical 406 24 400 23 402 23
TOEFL Total 573 84 552 76 559 80
TOEFL LC 56 76 55 72 55 72
TOEFL S & WE 57 83 54 72 55 76
TOEFL RC & V 59 84 56 74 57 78
222

-217-
Table 3 depicts the relationships between GRE and TOEFL scores forthe EPL, ESL, and combined groups of GRE/TOEFL examinees. The combined-group data show that TOEFL total score was strongly related to the GREverbal score (r im .70), moderately related to the GRE analytical score(r .62), and only weakly related to the CRE quantitative score (r.21). The correlations between TOEFL and the GRE verbal and analyticalmeasures were slightly higher for the EPL than the ESL group. Among TOEFLsections, List:ming Comprehension consistently correlated lowest withthe GRE scores. This finding is not surprising since the GRE does notassess listening skills. Of the three TOEFL sections, Reading Comprehen-sion and Vocabulary showed the highest correlation with the GRE verbalscores, which is not surprising either, since reading is more consistentlyrequired for successful performance on all three sections of the GRE thanis listening or aspects of writing tapped by the TOEFL Structure andWritten Expression section. In general, the pattern of correlationssupports the construct validity of the three-section TOEFL.
Table 3
Correlations between Scores on TOEFL and Scores on theGRE Aptitude Test for EPL, ESL, and Combined Group
GRE-Verbal GRE-Quantitative GRE-AnalyticalEPL ESL Comb. ''EPL ESL Comb. EPL ESL Comb.
TOEFL Total .74 .66 .70 .21 .21 .21 .64 .61 .62TOEFL LC .60 .48 .52 .14 .08 .10 .53 .47 .49TOEFL S & WE .69 .56 .63 .20 .22 .21 .58 .52 .53TOEFL RC & V .72 .67 .70 .23 .25 .24 .61 .58 .59
A general conclusion suggested by the data is that limited Englishproficiency is a major factor contributing to the depressed scores offoreign examinees on the GRE and the GMAT.

-218- A2
81. Woodford, P. E. (1982). The Test of English for International
Communication (TOEIC). In C. Brumfit (Ed.), litaglisp for Inter-
national Communication. Oxford: Pergamon Tress. (ERIC Document
Reproductiw Service No. ED 198 146)
Purpcse
This paper provides a basic overview of the Test of English for
International Communication (TOEIC).
Method
The TOEIC is a secure multiple-choice test of the ability to under-
stand spoken and written English that is published by Educational Testing
Service. It consists of two sections: Listening Comprehension and
Reading Comprehension. Each section contains 100 items. Separate scaled
scores are provided for each section. Section scores range from 5 to 495;
thus, total scaled scores range from 10 to 990. The first form of the
TOEIC was administered to 2,710 Japanese adults in December 1979. From
this population, several samples representing five different section score
ranges were selected. Section scores were compared with scores obtained
on direct measures of listening comprehension, speaking,-reading, and
writing. These included a measure of the ability to answer questions
asked in the native language by a Japanese examiner, a similar exercise
involving comprehension of written English, a letter-writing exercise, and
an oral English proficiency interview. One hundred eighty-seven of the
TOEIC examinees also took TOEFL in a special administration.
Results and Conclusions
The subjects were divided into five proficiency levels according to
their section scores on the TOEIC. The mean TOEIC score of each group was
then contrasted with the mean score on each direct measure of language
skills and on the Listening Comprehension and Reading Comprehension
sections of TOEFL. Although no correlation coefficients were computed,
mean scores on all the direct measures and on TOEFL Listening and Reading
Comprehension showed a consistent relationship with mean TOEIC section and
total scores, as shown in comparisons of the five groups.
224

-219- 13
82. Yalden, J. (1978). TOEFL and the management of foreign studentenrollments. TESL Talk, 9, 16-21.
Purpose
This essay considers the issue whether the TOEFL is an appropriateinstrument for making admissions decisions for foreign applicants toCanadian colleges.
Discussion
In using TOEFL scores, two major issues must be considered: (a) howto interpret the scores and (b) whether TOEFL provides appropriateinformation. Regarding score interpretation, the TOEFL manual states fiveprinciples for the use of TOEFL in admissions decisions: (a) considerpart scores as well as the total score; (b) consider the different kindsand levels of proficiency required in different fields and levels of studyand the colleges' resources for developing students' English languageskills; (c) do not use "cutoff" scores; (d) use all available relevantinformation, not just TOEFL scores; and (e) assemble information on thevalidity of admissions decisions based on TOEFL scores (EducationalTesting Service, 1973). The manual also reports score ranges foundacceptable by institutions.
It has been argued that Educational Testing Service (ETS) is incon-sistent in its instructions, stating the above-mentioned principles while,at the same time, offering acceptable score ranges to assist in scoreinterpretation. Actually, the manual is clear in cautioning users againstmisuse of TOEFL scores; yet there is some evidence that certain cautionsprovided in the manual are being ignored. In a survey of Canadian collegesand universities that admit foreign students for a particular program, afixed score on TOEFL was mentioned as a condition for acceptance by almostall respondents, without reference to part scores or to use of othermeasures.
In seeking to ensure the proper use of TOEFL scores, it is essentialto consider the second of the two main issues mentioned above: whetherTOEFL provides appropriate information. It has been argued that TOEFL, asan American-made instrument, is not appropriate for use in Canada. Thisis not a major problem, however, since Canadian English is similar enoughto the type of English tested by TOEFL. The argument that TOEFL is anunreliable test is also inappropriate, as research has shown that stu-dents' scores do not vary greatly across administrations within a specifi-ed time frame.
Arguments about TOEFL's validity have also been raised. Studies atETS and elsewhere have addressed several aspects of validity. Concurrent
225

-220-
validity has been shown in high correlations of TOEFL with similar tests
of English language proficiency as well as with quite different types of
test, such as the close test. Concerning predictive validity, relatively
low correlations have been observed between TOEFL and later grade-point
average (GPA). ETS notes, however, that prediction of GPA is not an
appropriate criterion for evaluating TOEFL.' The fact that TOEFL differ-
entiates among foreign students but not among native American students
(Angoff & Sharon, 1971) is taken by those authors as evidence of construct
validity, in showing that TOEFL avoids the types of discriminations for
which it was not intended.
It must be asked whether the TOEFL subtests measure the skills
they are intended to measure, in light of findings such as that of Darnell
(1970) that the cloze test correlates more highly with the Listening
Comprehension section of TOEFL than with any other section. To understand
the origin of TOEFL subtests requires looking at different trends in
language assessment.
Three trends have been identified.2 During the prescientific
trend, issues of objectivity and reliability were ignored and teachers
were assumed capable of judging students' skill. The second, psychometric-
structuralist trend, grew out of a school of thought in which phonology,
morphology, syntax, and semantics were believed to comprise a hierarchy of
speech levels and that these levels should be assessed separately, at
should the four skills, listening, speaking, reading, and writing..)
TOEFL was developed out of this "discrete-point" testing approach and
contains subsections to measure separate skills.
The third, integrative-sociolinguistic trend, involves testing of
overall language proficiency, according to the view that an underlying
general language competence is common to all of the modalities of language
use (cf., articles by Spolsky and 011er cited in footnotes). In recent
studies, "integrative" testing techniques derived from this view have been
found to intercorrelate at high levels.
It is not clear at this stage whether the discrete-point or integra-
tive approach is best, and perhaps both approaches have their merits.
What is needed is a functional definition of the levels of language
1Educational Testing Service. (1970). TOEFL manual of interpretive
information. Princeton, NJ: Author.
2Spolaky, B. (1978). Introduction:
In B. Spolsky (Ed.), A roaches to language
livuistics, advances in language testing
ton, VA: Center for Applied Linguistics.
Linguists and language testers.testing. Papers in applied
series: 2. (Pp. 5-9). Arling-
3011er, J. W., Jr. (1976). A program for language testing research.
In H. D. Brown (Ed.), Papers in second language acquisition. Ann Arbor,
MI: Language Learning Special Issue No. 4.
226

-221-
competence required for academic study. Until such a definition can bereached, discrete point testing is the only available alternative. Itis hoped that a different type of testing approach can eventually bedeveloped based on functional statements for each situation in whichproficiency is to be determined. Meanwhile, those involved in admissionsdecisions should be made aware of TOEFL's purpose and how TOEFL scoresshould be interpreted.
227

TOEFL: Research Reports currently availableReport 1. The Performance of Native Speakers of English on the Test of English as a Foreign Language.
John L. D. Clark. November 1977.
Report 2. An Evaluation Alternative Item Formats for Testing English as a Foreign LanguageLewis W Pike. June 1979.
Report 3. The Performance of Nor'-Native Speakers of English on TOEFL and Verbal Aptitude TestsPaul J Angelis, Spencer S. Swinton, and William R. Cuwell. October 1979.
Report 4. An Exploration of Speaking Proficiency Measures in the TOEFL Context. John L D. Clark andSpencer S. Swinton. October 1979.
Report 5. The Relationship between Scores on the Graduate Management Admission Test and the Test ofEnglish as a Foreign Language. Donald E. Powers. December 1980.
Report IL Factor Analysis of the Test of English as a Foreign Language for Several Language GroupsDonald E. Powers and Spencer S. Swinton. December 1980.
Report 7. The Test of Spoken English as a Measure of Communicative Ability in English-Medium instructionalSettings. John L. D. Clark and Spencer S. Swinton. December 1980.
Report 8. Effects of item Disclosure on TOEFL Performance. Gordon A. Hale, Paul J Angelis, andLawrence A. Thtbadeau. December 1980.
Report 9. Item Performance Across Native Language Groups on the Test of English as a Foreign Language.Donald L. Alderman and Paul W. Holland August 1981
Report 10. Language Proficiency as a Moderator Variable in Testing Academic Aptitude. Donald L. Alderman.November 1981
Report 11. A Comparative Analysis of TOEFL Examinee Characteristics, 19774979, Kenneth M. WilsonJuly 1982
Report 12. GMAT and GRE Aptitude Test Performance in Relation to Pnmary Language and Scores on TOEFL.Kenneth M. Wilson. July 1982.
Report 13. The Test of Spoken English as a Measure of Communicative Ability in the Health ProfessionsValidation and Standard Setting. Donald E. Powers and Charles W. Stanstield. January 1983
Report 14. A Manual for Assessing Language Growth in Instructional Settings. Spencer S. Swinton.February 1983.
Report 15. Survey of Academic Writing Tasks Required of Graduate and Undergraduate Foreign StudentsBrent Bridgeman and Sybil Carlson. September 1983.
Report 16. Summaries of Studies Involving the Test of English as a Foreign Language. 1963-1982.Gordon A Hale. Charles W Stansfield, and Richard P Duran F. iary 1984
If you wish additional information about TOEFL research or would liketo be placed on the mailing list to automatically receive order formsfor newly published reports, write to:
TOEFL Program OfficeP.O. Box 2917Princeton, NJ 08541.2917USA
228