Hadron masses and decay constants with Wilson quarks at β=5.85 and 6.0
51
arXiv:hep-lat/9512031v1 28 Dec 1995 UTHEP-327 UTCCP-P-8 December 1995 Hadron Masses and Decay Constants with Wilson Quarks at β =5.85 and 6.0 QCDPAX Collaboration Y. Iwasaki a,b , K. Kanaya a,b , T. Yoshi´ e a,b , T. Hoshino c , T. Shirakawa c , Y. Oyanagi d , S. Ichii e and T. Kawai f a Institute of Physics, University of Tsukuba, Ibaraki 305, Japan b Center for Computational Physics, University of Tsukuba, Ibaraki 305, Japan c Institute of Engineering Mechanics, University of Tsukuba, Ibaraki 305, Japan d Department of Information Science, University of Tokyo, Tokyo 113, Japan e Computer Centre, University of Tokyo, Tokyo 113, Japan f Department of Physics, Keio University, Yokohama 223, Japan Abstract We present results of a high statistics calculation of hadron masses and meson decay constants in the quenched approximation to lattice QCD with Wilson quarks at β = 5.85 and 6.0 on 24 3 × 54 lattices. We analyze the data paying attention in particular to the systematic errors due to the choice of fitting range and due to the contamination from excited states. We find that the systematic errors for the hadron masses with quarks lighter than the strange quark amount to 1 — 2 times the statistical errors. When the lattice scale is fixed from the ρ meson mass, the masses of the Ω − baryon and the φ meson at two β ’s agree with experiment within about one standard deviation. On the other hand, the central value of the nucleon mass at β =6.0 (5.85) is larger than its experimental value by about 15% (20%) and that of the Δ mass by about 15% (4%): Even when the systematic errors are included, the baryon masses at β =6.0 do not agree with experiment. Vector meson decay constants at two values of β agree well with each other and are consistent with experiment for a wide range of the quark mass, when we use current renormalization constants determined nonperturbatively by numerical simulations. The pion decay constant agrees with experiment albeit with large errors. Results for the masses of excited states of the ρ meson and the nucleon are also presented.
Transcript of Hadron masses and decay constants with Wilson quarks at β=5.85 and 6.0
arX
iv:h
ep-l
at/9
5120
31v1
28
Dec
199
5
UTHEP-327UTCCP-P-8
December 1995
Hadron Masses and Decay Constantswith Wilson Quarks at β = 5.85 and 6.0
QCDPAX Collaboration
Y. Iwasakia,b, K. Kanayaa,b, T. Yoshiea,b,
T. Hoshinoc, T. Shirakawac, Y. Oyanagid,
S. Ichiie and T. Kawaif
aInstitute of Physics, University of Tsukuba, Ibaraki 305, JapanbCenter for Computational Physics, University of Tsukuba, Ibaraki 305, JapancInstitute of Engineering Mechanics, University of Tsukuba, Ibaraki 305, Japan
dDepartment of Information Science, University of Tokyo, Tokyo 113, JapaneComputer Centre, University of Tokyo, Tokyo 113, Japan
fDepartment of Physics, Keio University, Yokohama 223, Japan
Abstract
We present results of a high statistics calculation of hadron masses and meson decay constantsin the quenched approximation to lattice QCD with Wilson quarks at β = 5.85 and 6.0 on243×54 lattices. We analyze the data paying attention in particular to the systematic errorsdue to the choice of fitting range and due to the contamination from excited states. We findthat the systematic errors for the hadron masses with quarks lighter than the strange quarkamount to 1 — 2 times the statistical errors. When the lattice scale is fixed from the ρmeson mass, the masses of the Ω− baryon and the φ meson at two β’s agree with experimentwithin about one standard deviation. On the other hand, the central value of the nucleonmass at β = 6.0 (5.85) is larger than its experimental value by about 15% (20%) and that ofthe ∆ mass by about 15% (4%): Even when the systematic errors are included, the baryonmasses at β = 6.0 do not agree with experiment. Vector meson decay constants at two valuesof β agree well with each other and are consistent with experiment for a wide range of thequark mass, when we use current renormalization constants determined nonperturbativelyby numerical simulations. The pion decay constant agrees with experiment albeit with largeerrors. Results for the masses of excited states of the ρ meson and the nucleon are alsopresented.
1 Introduction
Although there have been many efforts to calculate hadron masses in lattice QCD by nu-merical simulations, it has turned out that derivation of convincing results is much harderthan thought at the beginning, even in the quenched approximation. For example, before1988, there was large discrepancy among the results for the mass ratio mN/mρ obtained forβ = 6/g2 = 5.7 — 6.0 and in the quark mass region corresponding to mπ/mρ ≥ 0.5. Thediscrepancy was caused by systematic errors due to contamination from excited states [1, 2]and effects of finite lattice spacing [3] and finite lattice volume. Recent high statistics sim-ulations employ lattices with large temporal extent [4, 5, 6] and/or extended quark sources[5, 6, 7, 8, 9, 10, 11] to reduce fluctuations as well as the contamination from excited states.However, a long plateau in an effective mass is rarely seen and data of effective massesfrequently show large fluctuations at large time separations. The uncertainty in the choiceof fitting range is therefore another source of systematic errors. In order to obtain reliablevalues for the spectrum, it is essential to make a quantitative study on these systematicerrors.
In this paper we report results of a high statistics calculation of the quenched QCD spec-trum with the Wilson quark action at β = 5.85 and 6.0 on 243 × 54 lattices. Our majorobjection is to calculate light hadron masses as well as meson decay constants paying atten-tion in particular to the systematic errors due to the choice of fitting range and due to thecontamination from excited states. In order to estimate the magnitude of these systematicerrors, we perform correlated one-mass fits to hadron propagators systematically varyingfitting ranges [5, 12]. Assuming the ground state dominance at large time separations, weestimate systematic errors in hadron masses which cannot be properly taken into account bythe standard least mean square fit when the fitting range is fixed. It is shown that, for thehadron masses with quarks lighter than the strange quark, the systematic errors amount to1 — 2 times the statistical errors. We then perform correlated two-mass fits, again varyingfitting ranges. We find that the ground state mass is consistent with that obtained from theone-mass fit within the statistical and systematic errors. Finally, we extrapolate the resultsof hadron masses at finite quark mass to the chiral limit, taking account of systematic errorsboth due to the choice of extrapolation function and due to the fitting range. We also studymeson decay constants in a similar way.
We use the point source in this study. Historically there was a report that numericalresults for hadron masses appear to depend on the type of the source adopted [13], althoughit has afterward reported in some works that masses are independent within the statisticalerrors [5, 6]. Note in this connection that there is no proof that the value of a hadron massis independent on the type of sources in the case of the quenched approximation due to thelack of the transfer matrix and that there is the so-called Gribov problem for gauge fixingwhich is necessary for almost all smeared sources. Under these circumstances it may beworthwhile to present the details of the results and the analyses with the point source as areference. The method of analyses of the systematic errors in this work can be applied tothe cases of smeared sources too.
Numerical simulations are performed with the QCDPAX [14], a MIMD parallel computerconstructed at the University of Tsukuba. For the calculations performed in this work, weuse 24× 18 processing units interconnected in a toroidal two-dimensional mesh with a peakspeed of 12.4 GFLOPS. (The maximum number of nodes is 24×20 with a peak speed of 14.0GFLOPS.) The sustained speed for the Wilson quark matrix multiplication is approximately5 GFLOPS. The calculations described here took about six months on the QCDPAX.
1
We start by giving in Sec. 2 some details about our numerical simulations. Then wederive hadron masses at finite quark mass in Sec. 3 and perform two-mass fits to estimatethe masses of excited states of the ρ meson and the nucleon in Sec. 4. We extrapolate theresults to the chiral limit in Sec. 5. Sec. 6 is devoted to the evaluation of meson decayconstants. In Sec. 7, we give conclusions and discussion on the results.
2 Numerical Calculation
We use the standard one-plaquette gauge action
Sg =2
g2
∑
P
Re Tr(UP ) (1)
and the Wilson quark action
Sq = −∑
n,m
ψ(n)D(K,n,m)ψ(m), (2)
D(K,n,m) = δn,m −K∑
µ
(I − γµ)Un,µδn+µ,m + (I + γµ)U†m,µδm+µ,n, (3)
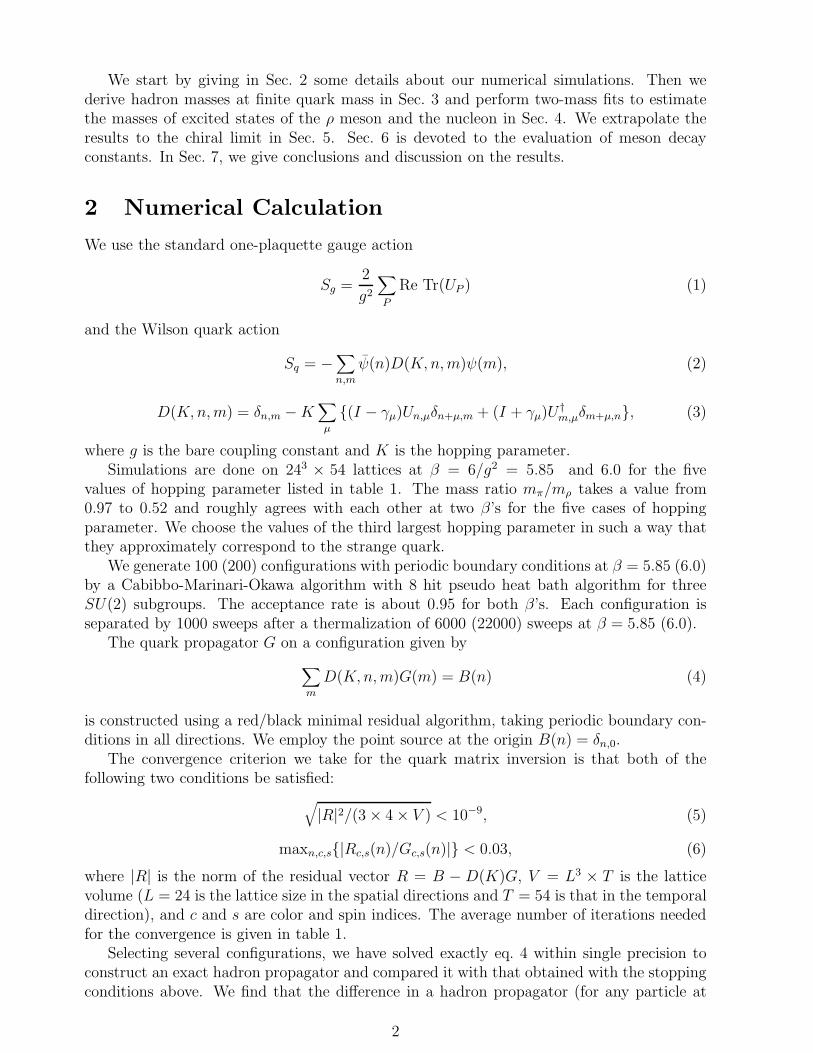
where g is the bare coupling constant and K is the hopping parameter.Simulations are done on 243 × 54 lattices at β = 6/g2 = 5.85 and 6.0 for the five
values of hopping parameter listed in table 1. The mass ratio mπ/mρ takes a value from0.97 to 0.52 and roughly agrees with each other at two β’s for the five cases of hoppingparameter. We choose the values of the third largest hopping parameter in such a way thatthey approximately correspond to the strange quark.
We generate 100 (200) configurations with periodic boundary conditions at β = 5.85 (6.0)by a Cabibbo-Marinari-Okawa algorithm with 8 hit pseudo heat bath algorithm for threeSU(2) subgroups. The acceptance rate is about 0.95 for both β’s. Each configuration isseparated by 1000 sweeps after a thermalization of 6000 (22000) sweeps at β = 5.85 (6.0).
The quark propagator G on a configuration given by
∑
m
D(K,n,m)G(m) = B(n) (4)
is constructed using a red/black minimal residual algorithm, taking periodic boundary con-ditions in all directions. We employ the point source at the origin B(n) = δn,0.
The convergence criterion we take for the quark matrix inversion is that both of thefollowing two conditions be satisfied:
√
|R|2/(3 × 4 × V ) < 10−9, (5)
maxn,c,s|Rc,s(n)/Gc,s(n)| < 0.03, (6)
where |R| is the norm of the residual vector R = B − D(K)G, V = L3 × T is the latticevolume (L = 24 is the lattice size in the spatial directions and T = 54 is that in the temporaldirection), and c and s are color and spin indices. The average number of iterations neededfor the convergence is given in table 1.
Selecting several configurations, we have solved exactly eq. 4 within single precision toconstruct an exact hadron propagator and compared it with that obtained with the stoppingconditions above. We find that the difference in a hadron propagator (for any particle at
2
any time slice) is at most one percent of the statistical error estimated using all (100 or 200)configurations. Therefore the error due to truncation of iterations is small enough and doesnot affect the following analyses and results.
We use uΓd for meson operators with Γ = γ5 for π, iγ0γ5 for π (π), and γi for ρ. Forbaryons, we use non-relativistic operators
Nl = ǫabc2
∑
i,j
uai τ
ij3 d
bju
cl l = 1, 2 (7)
∆l = ǫabc2
∑
i,j,k
Sijkl ua
i ubju
ck l = ±3/2,±1/2, (8)
where τ3 is the third component of Pauli matrices and Sl is the projection operator toJ = 3/2, Jz = l state. We also use anti-baryon operators obtained by replacing the uppercomponents of the Dirac spinor in eqs. 7 and 8 with the lower components.
We average zero momentum hadron propagators over all states with the same quantumnumbers; three polarization states for the ρ meson and two (four) spin states for the nucleon(∆). Then we average the propagators for particle and anti-particle: For mesons we averagethe propagator at t and that at T − t, for baryons we average the propagator for particle att and that of anti-particle at T − t. In this work we only calculate the masses of hadronscomposed of degenerate mass quarks.
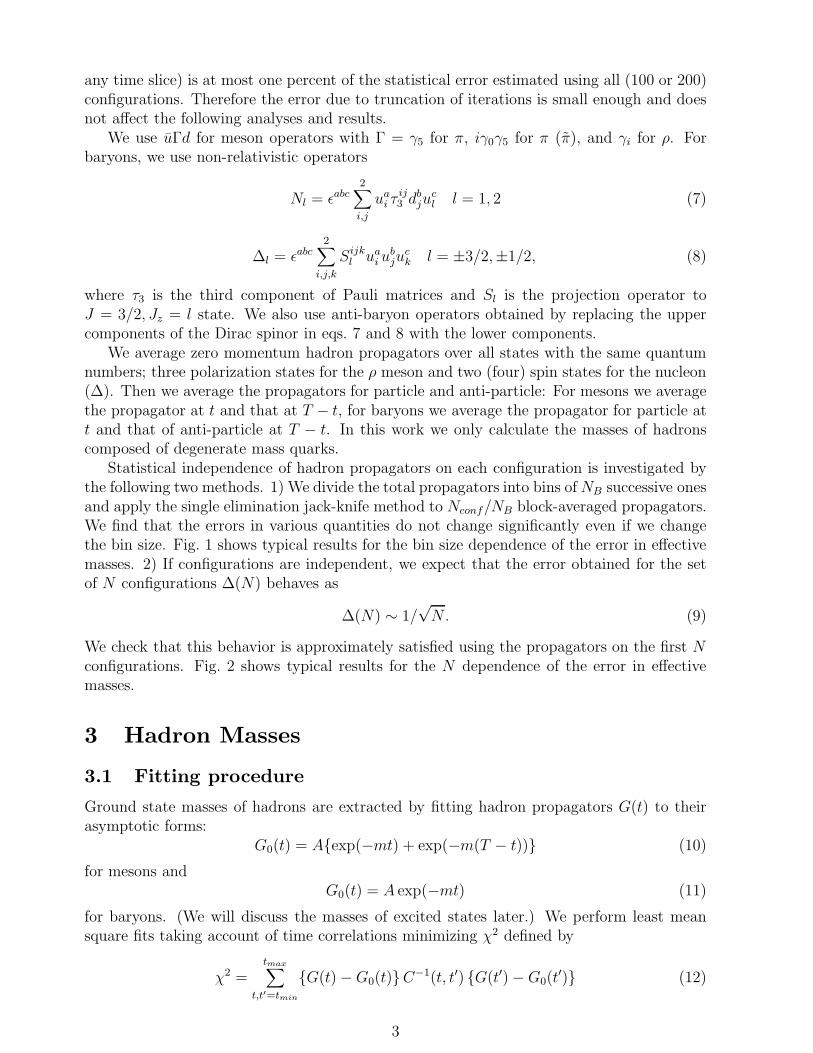
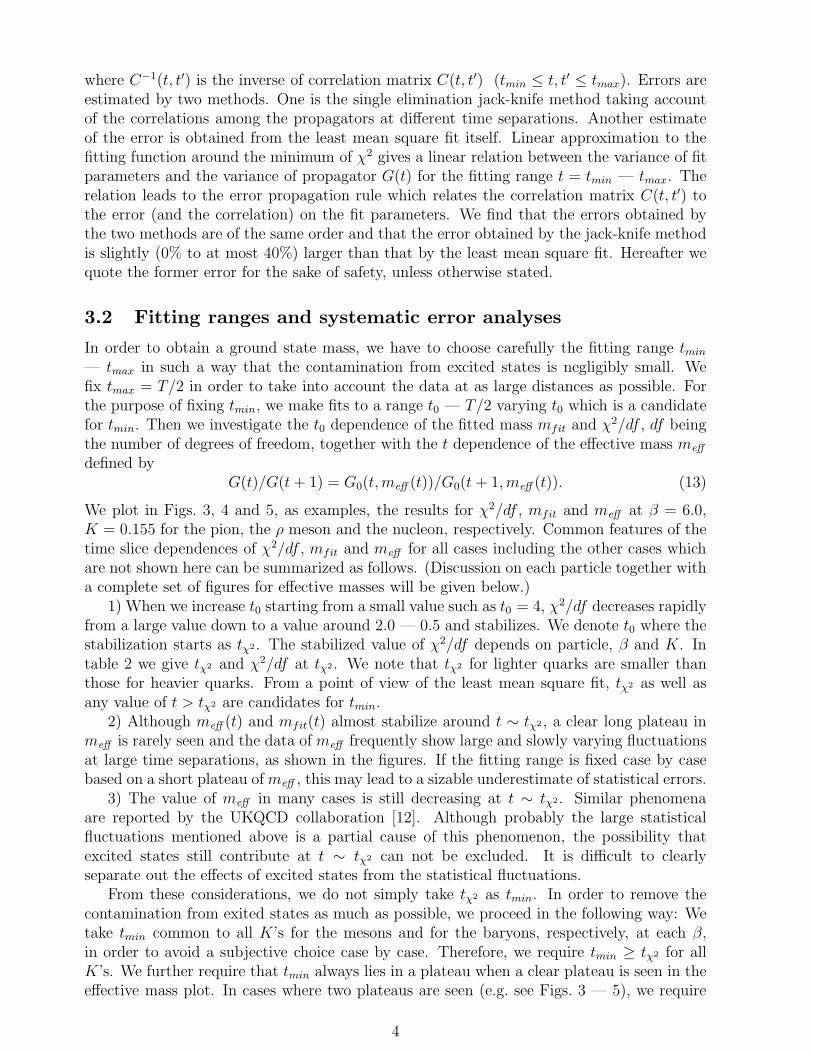
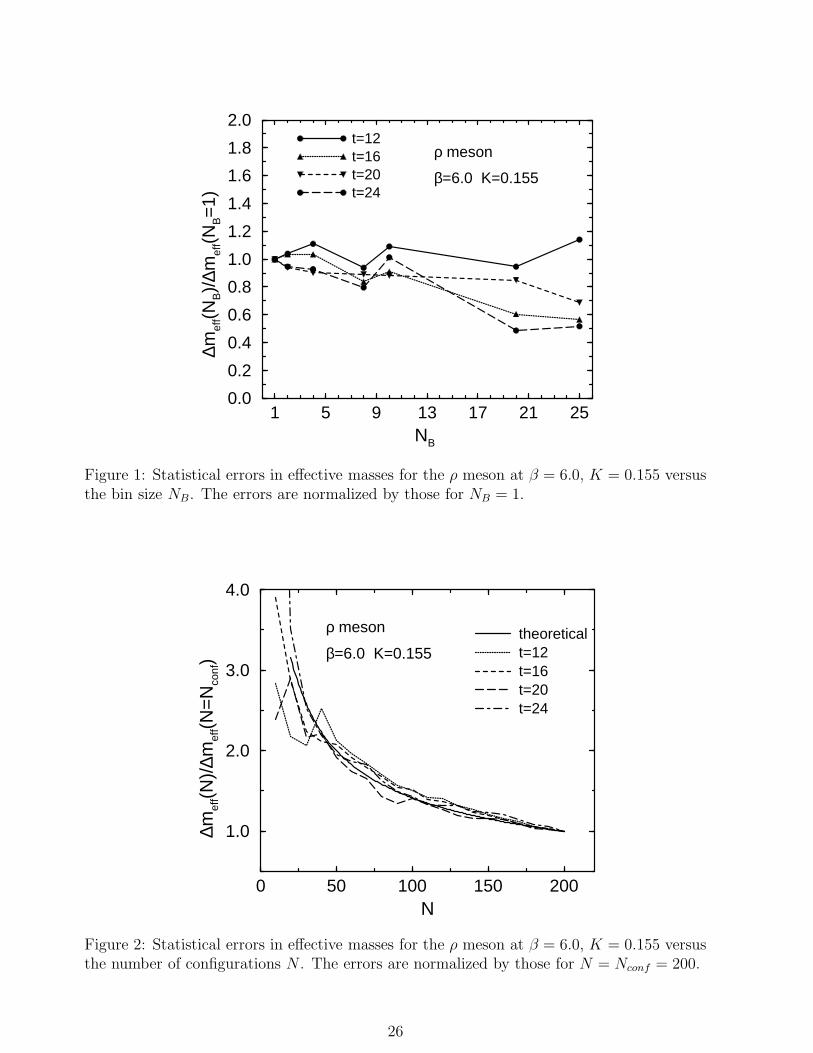
Statistical independence of hadron propagators on each configuration is investigated bythe following two methods. 1) We divide the total propagators into bins ofNB successive onesand apply the single elimination jack-knife method to Nconf/NB block-averaged propagators.We find that the errors in various quantities do not change significantly even if we changethe bin size. Fig. 1 shows typical results for the bin size dependence of the error in effectivemasses. 2) If configurations are independent, we expect that the error obtained for the setof N configurations ∆(N) behaves as
∆(N) ∼ 1/√N. (9)
We check that this behavior is approximately satisfied using the propagators on the first Nconfigurations. Fig. 2 shows typical results for the N dependence of the error in effectivemasses.
3 Hadron Masses
3.1 Fitting procedure
Ground state masses of hadrons are extracted by fitting hadron propagators G(t) to theirasymptotic forms:
G0(t) = Aexp(−mt) + exp(−m(T − t)) (10)
for mesons andG0(t) = A exp(−mt) (11)
for baryons. (We will discuss the masses of excited states later.) We perform least meansquare fits taking account of time correlations minimizing χ2 defined by
χ2 =tmax∑
t,t′=tmin
G(t) −G0(t)C−1(t, t′) G(t′) −G0(t′) (12)
3
where C−1(t, t′) is the inverse of correlation matrix C(t, t′) (tmin ≤ t, t′ ≤ tmax). Errors areestimated by two methods. One is the single elimination jack-knife method taking accountof the correlations among the propagators at different time separations. Another estimateof the error is obtained from the least mean square fit itself. Linear approximation to thefitting function around the minimum of χ2 gives a linear relation between the variance of fitparameters and the variance of propagator G(t) for the fitting range t = tmin — tmax. Therelation leads to the error propagation rule which relates the correlation matrix C(t, t′) tothe error (and the correlation) on the fit parameters. We find that the errors obtained bythe two methods are of the same order and that the error obtained by the jack-knife methodis slightly (0% to at most 40%) larger than that by the least mean square fit. Hereafter wequote the former error for the sake of safety, unless otherwise stated.
3.2 Fitting ranges and systematic error analyses
In order to obtain a ground state mass, we have to choose carefully the fitting range tmin
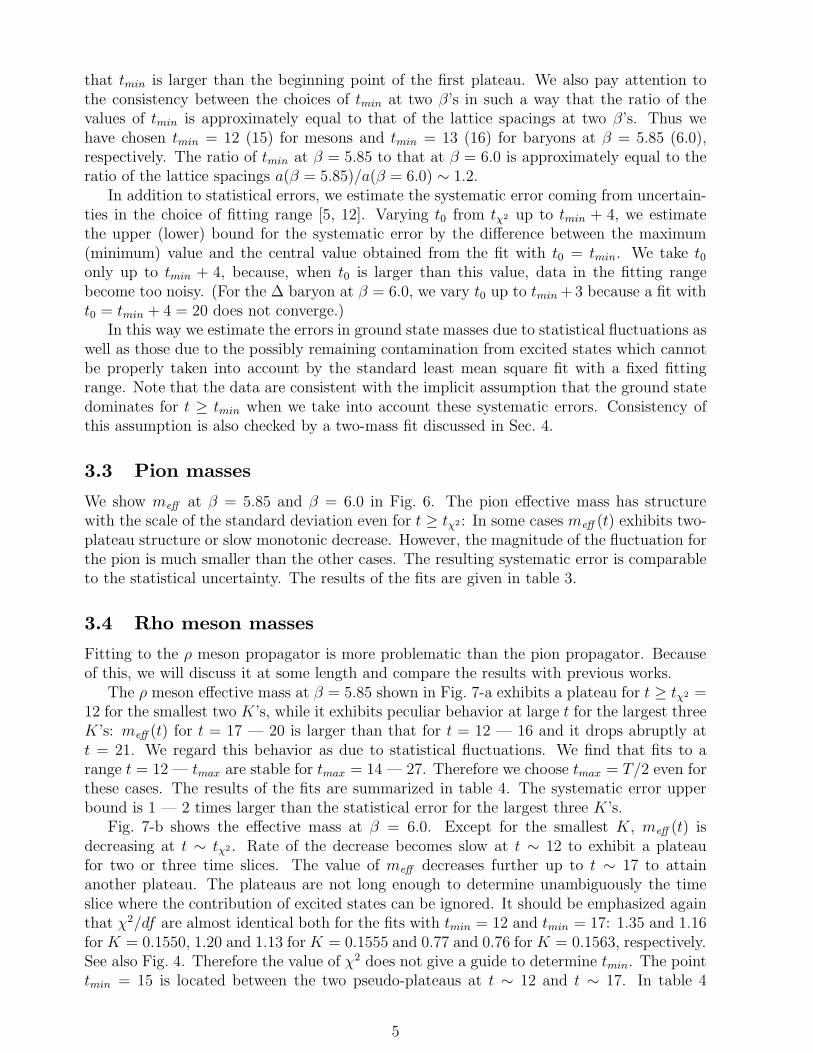
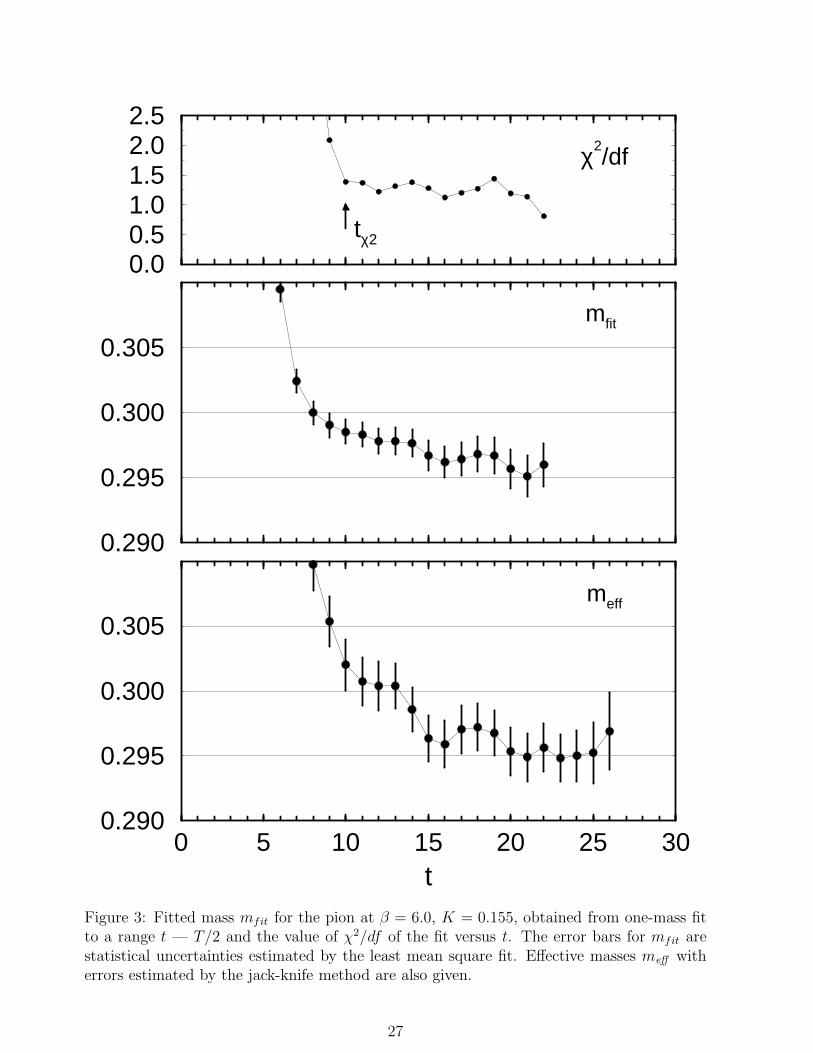
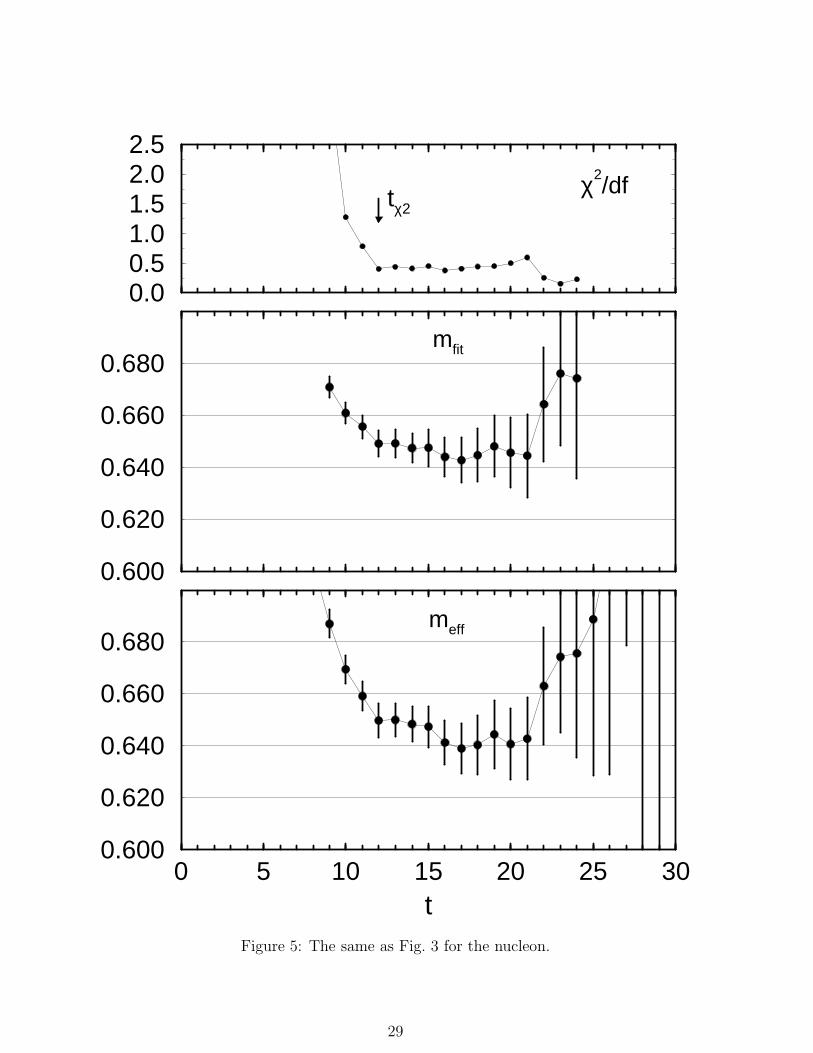
— tmax in such a way that the contamination from excited states is negligibly small. Wefix tmax = T/2 in order to take into account the data at as large distances as possible. Forthe purpose of fixing tmin, we make fits to a range t0 — T/2 varying t0 which is a candidatefor tmin. Then we investigate the t0 dependence of the fitted mass mfit and χ2/df , df beingthe number of degrees of freedom, together with the t dependence of the effective mass meff
defined byG(t)/G(t+ 1) = G0(t,meff (t))/G0(t+ 1, meff (t)). (13)
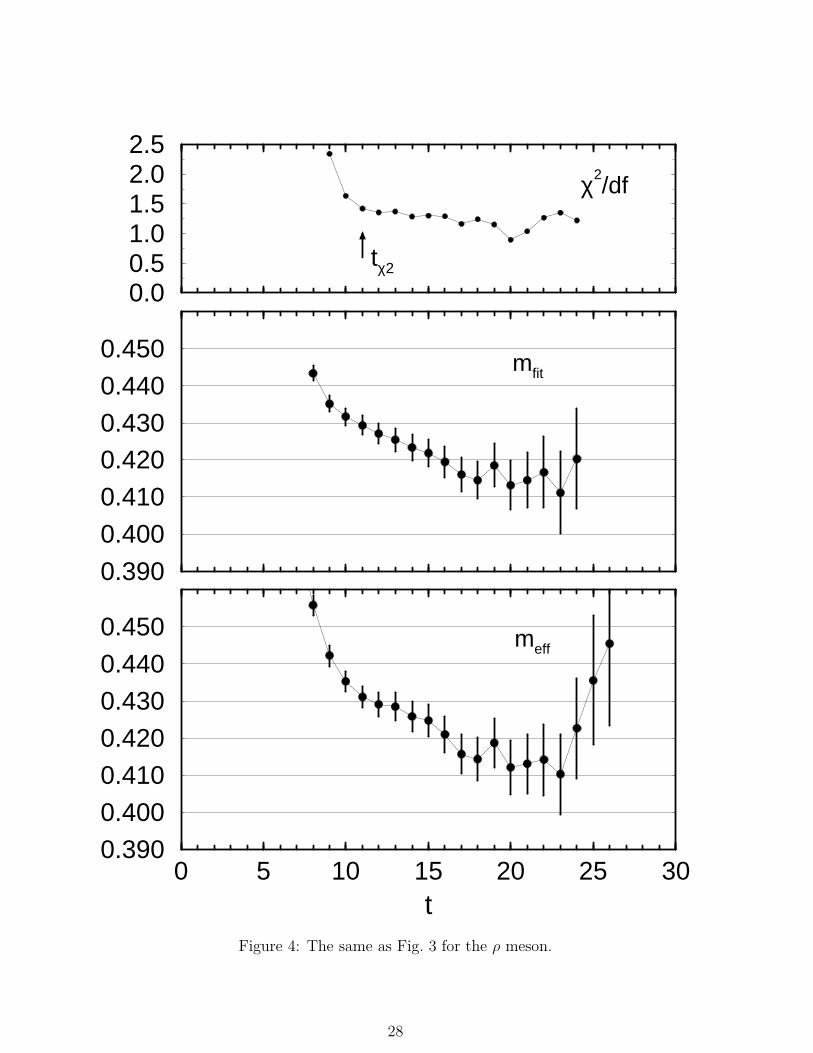
We plot in Figs. 3, 4 and 5, as examples, the results for χ2/df , mfit and meff at β = 6.0,K = 0.155 for the pion, the ρ meson and the nucleon, respectively. Common features of thetime slice dependences of χ2/df , mfit and meff for all cases including the other cases whichare not shown here can be summarized as follows. (Discussion on each particle together witha complete set of figures for effective masses will be given below.)
1) When we increase t0 starting from a small value such as t0 = 4, χ2/df decreases rapidlyfrom a large value down to a value around 2.0 — 0.5 and stabilizes. We denote t0 where thestabilization starts as tχ2. The stabilized value of χ2/df depends on particle, β and K. Intable 2 we give tχ2 and χ2/df at tχ2. We note that tχ2 for lighter quarks are smaller thanthose for heavier quarks. From a point of view of the least mean square fit, tχ2 as well asany value of t > tχ2 are candidates for tmin.
2) Although meff (t) and mfit(t) almost stabilize around t ∼ tχ2 , a clear long plateau inmeff is rarely seen and the data of meff frequently show large and slowly varying fluctuationsat large time separations, as shown in the figures. If the fitting range is fixed case by casebased on a short plateau ofmeff , this may lead to a sizable underestimate of statistical errors.
3) The value of meff in many cases is still decreasing at t ∼ tχ2. Similar phenomenaare reported by the UKQCD collaboration [12]. Although probably the large statisticalfluctuations mentioned above is a partial cause of this phenomenon, the possibility thatexcited states still contribute at t ∼ tχ2 can not be excluded. It is difficult to clearlyseparate out the effects of excited states from the statistical fluctuations.
From these considerations, we do not simply take tχ2 as tmin. In order to remove thecontamination from exited states as much as possible, we proceed in the following way: Wetake tmin common to all K’s for the mesons and for the baryons, respectively, at each β,in order to avoid a subjective choice case by case. Therefore, we require tmin ≥ tχ2 for allK’s. We further require that tmin always lies in a plateau when a clear plateau is seen in theeffective mass plot. In cases where two plateaus are seen (e.g. see Figs. 3 — 5), we require
4
that tmin is larger than the beginning point of the first plateau. We also pay attention tothe consistency between the choices of tmin at two β’s in such a way that the ratio of thevalues of tmin is approximately equal to that of the lattice spacings at two β’s. Thus wehave chosen tmin = 12 (15) for mesons and tmin = 13 (16) for baryons at β = 5.85 (6.0),respectively. The ratio of tmin at β = 5.85 to that at β = 6.0 is approximately equal to theratio of the lattice spacings a(β = 5.85)/a(β = 6.0) ∼ 1.2.
In addition to statistical errors, we estimate the systematic error coming from uncertain-ties in the choice of fitting range [5, 12]. Varying t0 from tχ2 up to tmin + 4, we estimatethe upper (lower) bound for the systematic error by the difference between the maximum(minimum) value and the central value obtained from the fit with t0 = tmin. We take t0only up to tmin + 4, because, when t0 is larger than this value, data in the fitting rangebecome too noisy. (For the ∆ baryon at β = 6.0, we vary t0 up to tmin +3 because a fit witht0 = tmin + 4 = 20 does not converge.)
In this way we estimate the errors in ground state masses due to statistical fluctuations aswell as those due to the possibly remaining contamination from excited states which cannotbe properly taken into account by the standard least mean square fit with a fixed fittingrange. Note that the data are consistent with the implicit assumption that the ground statedominates for t ≥ tmin when we take into account these systematic errors. Consistency ofthis assumption is also checked by a two-mass fit discussed in Sec. 4.
3.3 Pion masses
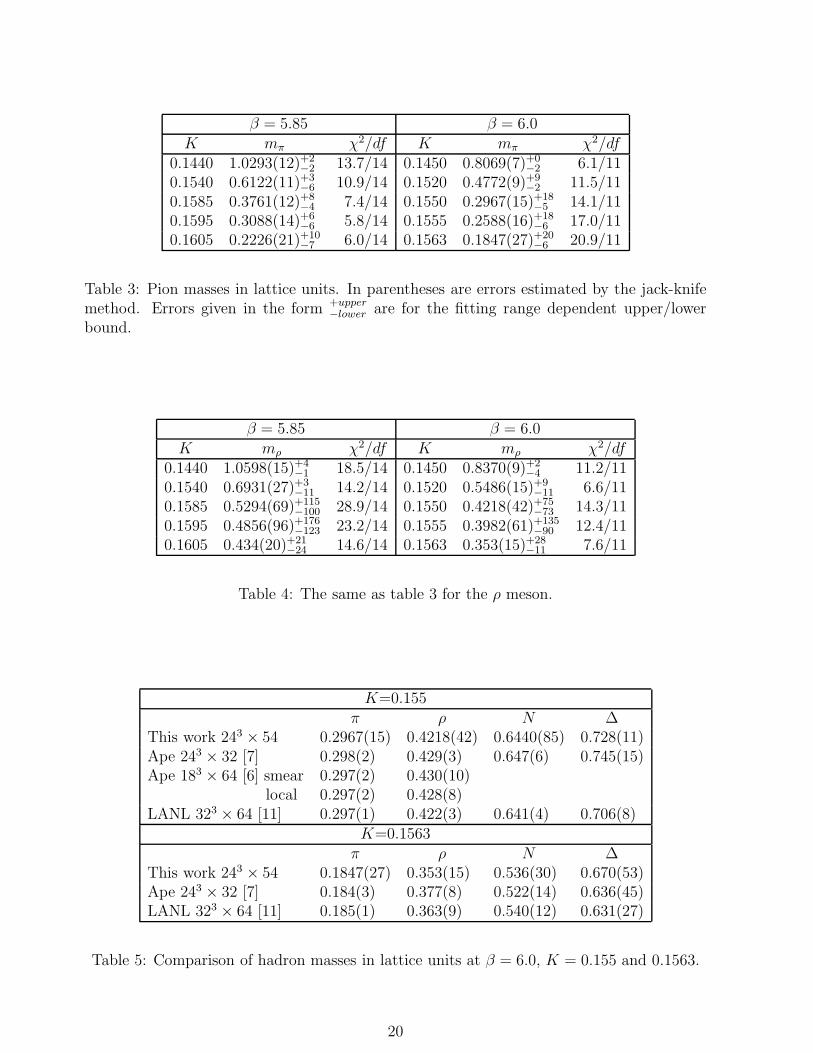
We show meff at β = 5.85 and β = 6.0 in Fig. 6. The pion effective mass has structurewith the scale of the standard deviation even for t ≥ tχ2 : In some cases meff (t) exhibits two-plateau structure or slow monotonic decrease. However, the magnitude of the fluctuation forthe pion is much smaller than the other cases. The resulting systematic error is comparableto the statistical uncertainty. The results of the fits are given in table 3.
3.4 Rho meson masses
Fitting to the ρ meson propagator is more problematic than the pion propagator. Becauseof this, we will discuss it at some length and compare the results with previous works.
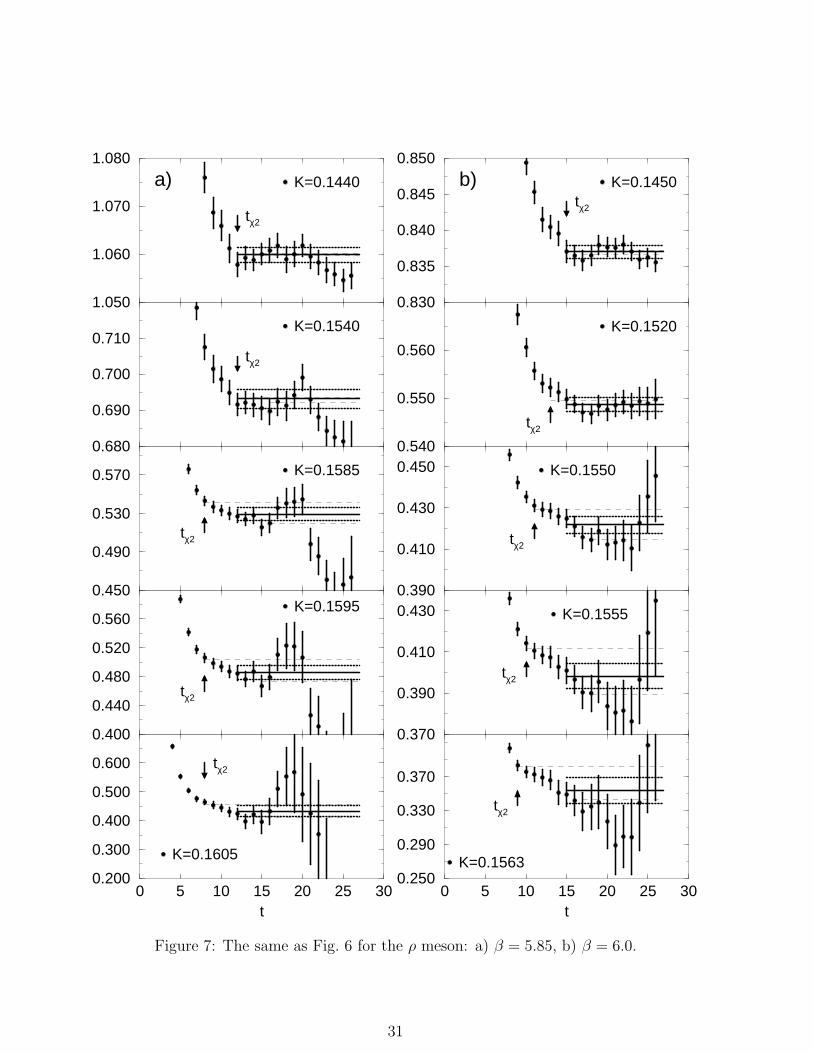
The ρ meson effective mass at β = 5.85 shown in Fig. 7-a exhibits a plateau for t ≥ tχ2 =12 for the smallest two K’s, while it exhibits peculiar behavior at large t for the largest threeK’s: meff (t) for t = 17 — 20 is larger than that for t = 12 — 16 and it drops abruptly att = 21. We regard this behavior as due to statistical fluctuations. We find that fits to arange t = 12 — tmax are stable for tmax = 14 — 27. Therefore we choose tmax = T/2 even forthese cases. The results of the fits are summarized in table 4. The systematic error upperbound is 1 — 2 times larger than the statistical error for the largest three K’s.
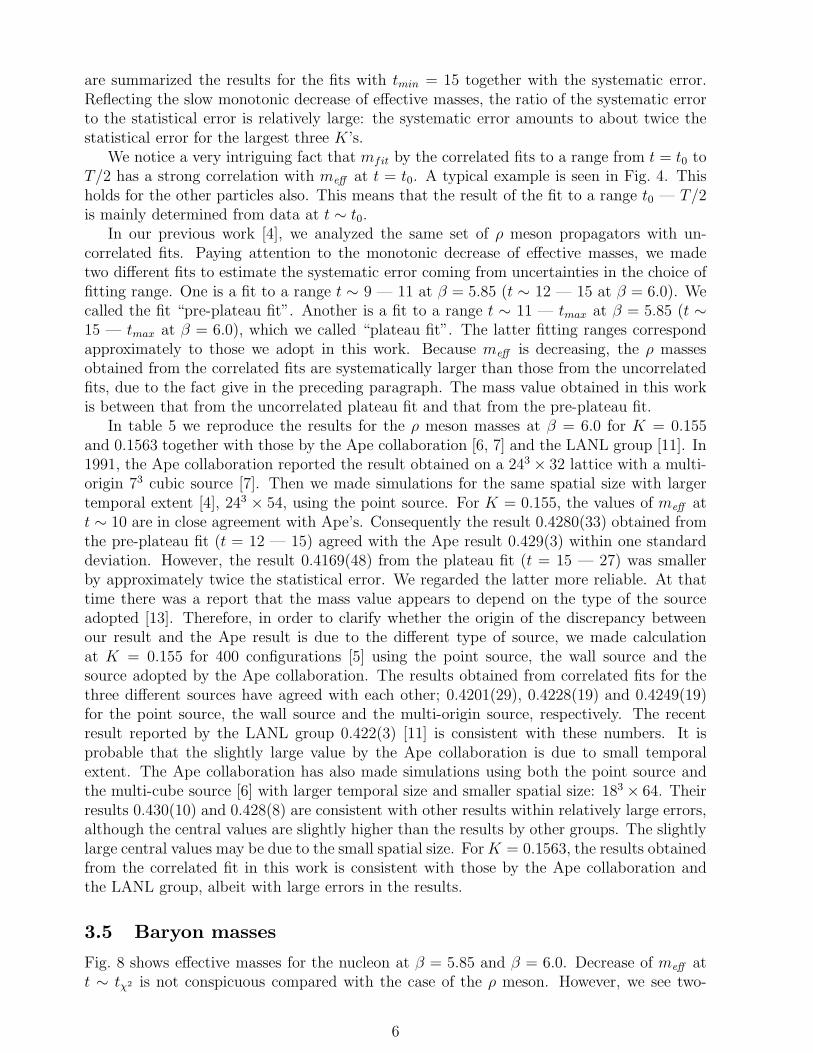
Fig. 7-b shows the effective mass at β = 6.0. Except for the smallest K, meff (t) isdecreasing at t ∼ tχ2 . Rate of the decrease becomes slow at t ∼ 12 to exhibit a plateaufor two or three time slices. The value of meff decreases further up to t ∼ 17 to attainanother plateau. The plateaus are not long enough to determine unambiguously the timeslice where the contribution of excited states can be ignored. It should be emphasized againthat χ2/df are almost identical both for the fits with tmin = 12 and tmin = 17: 1.35 and 1.16for K = 0.1550, 1.20 and 1.13 for K = 0.1555 and 0.77 and 0.76 for K = 0.1563, respectively.See also Fig. 4. Therefore the value of χ2 does not give a guide to determine tmin. The pointtmin = 15 is located between the two pseudo-plateaus at t ∼ 12 and t ∼ 17. In table 4
5
are summarized the results for the fits with tmin = 15 together with the systematic error.Reflecting the slow monotonic decrease of effective masses, the ratio of the systematic errorto the statistical error is relatively large: the systematic error amounts to about twice thestatistical error for the largest three K’s.
We notice a very intriguing fact that mfit by the correlated fits to a range from t = t0 toT/2 has a strong correlation with meff at t = t0. A typical example is seen in Fig. 4. Thisholds for the other particles also. This means that the result of the fit to a range t0 — T/2is mainly determined from data at t ∼ t0.
In our previous work [4], we analyzed the same set of ρ meson propagators with un-correlated fits. Paying attention to the monotonic decrease of effective masses, we madetwo different fits to estimate the systematic error coming from uncertainties in the choice offitting range. One is a fit to a range t ∼ 9 — 11 at β = 5.85 (t ∼ 12 — 15 at β = 6.0). Wecalled the fit “pre-plateau fit”. Another is a fit to a range t ∼ 11 — tmax at β = 5.85 (t ∼15 — tmax at β = 6.0), which we called “plateau fit”. The latter fitting ranges correspondapproximately to those we adopt in this work. Because meff is decreasing, the ρ massesobtained from the correlated fits are systematically larger than those from the uncorrelatedfits, due to the fact give in the preceding paragraph. The mass value obtained in this workis between that from the uncorrelated plateau fit and that from the pre-plateau fit.
In table 5 we reproduce the results for the ρ meson masses at β = 6.0 for K = 0.155and 0.1563 together with those by the Ape collaboration [6, 7] and the LANL group [11]. In1991, the Ape collaboration reported the result obtained on a 243 × 32 lattice with a multi-origin 73 cubic source [7]. Then we made simulations for the same spatial size with largertemporal extent [4], 243 × 54, using the point source. For K = 0.155, the values of meff att ∼ 10 are in close agreement with Ape’s. Consequently the result 0.4280(33) obtained fromthe pre-plateau fit (t = 12 — 15) agreed with the Ape result 0.429(3) within one standarddeviation. However, the result 0.4169(48) from the plateau fit (t = 15 — 27) was smallerby approximately twice the statistical error. We regarded the latter more reliable. At thattime there was a report that the mass value appears to depend on the type of the sourceadopted [13]. Therefore, in order to clarify whether the origin of the discrepancy betweenour result and the Ape result is due to the different type of source, we made calculationat K = 0.155 for 400 configurations [5] using the point source, the wall source and thesource adopted by the Ape collaboration. The results obtained from correlated fits for thethree different sources have agreed with each other; 0.4201(29), 0.4228(19) and 0.4249(19)for the point source, the wall source and the multi-origin source, respectively. The recentresult reported by the LANL group 0.422(3) [11] is consistent with these numbers. It isprobable that the slightly large value by the Ape collaboration is due to small temporalextent. The Ape collaboration has also made simulations using both the point source andthe multi-cube source [6] with larger temporal size and smaller spatial size: 183 × 64. Theirresults 0.430(10) and 0.428(8) are consistent with other results within relatively large errors,although the central values are slightly higher than the results by other groups. The slightlylarge central values may be due to the small spatial size. ForK = 0.1563, the results obtainedfrom the correlated fit in this work is consistent with those by the Ape collaboration andthe LANL group, albeit with large errors in the results.
3.5 Baryon masses
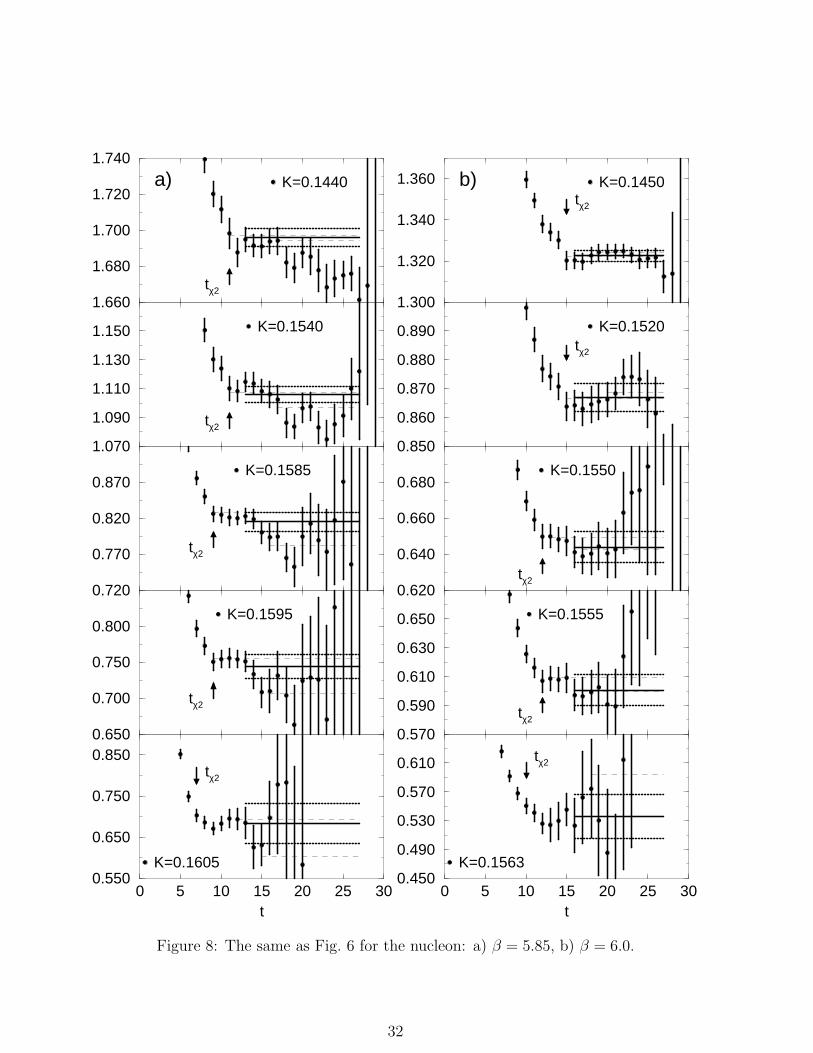
Fig. 8 shows effective masses for the nucleon at β = 5.85 and β = 6.0. Decrease of meff att ∼ tχ2 is not conspicuous compared with the case of the ρ meson. However, we see two-
6
plateau structure for the cases of K = 0.1585 and 0.1595 at β = 5.85 and K = 0.155 (see alsoFig. 5) and 0.1555 at β = 6.0. The choice tmin = 13 (16) for β = 5.85 (6.0) corresponds tothat we select the first (last) plateau as correct for the case where two plateaus are observed.Table 6 summarizes the results of the fits.
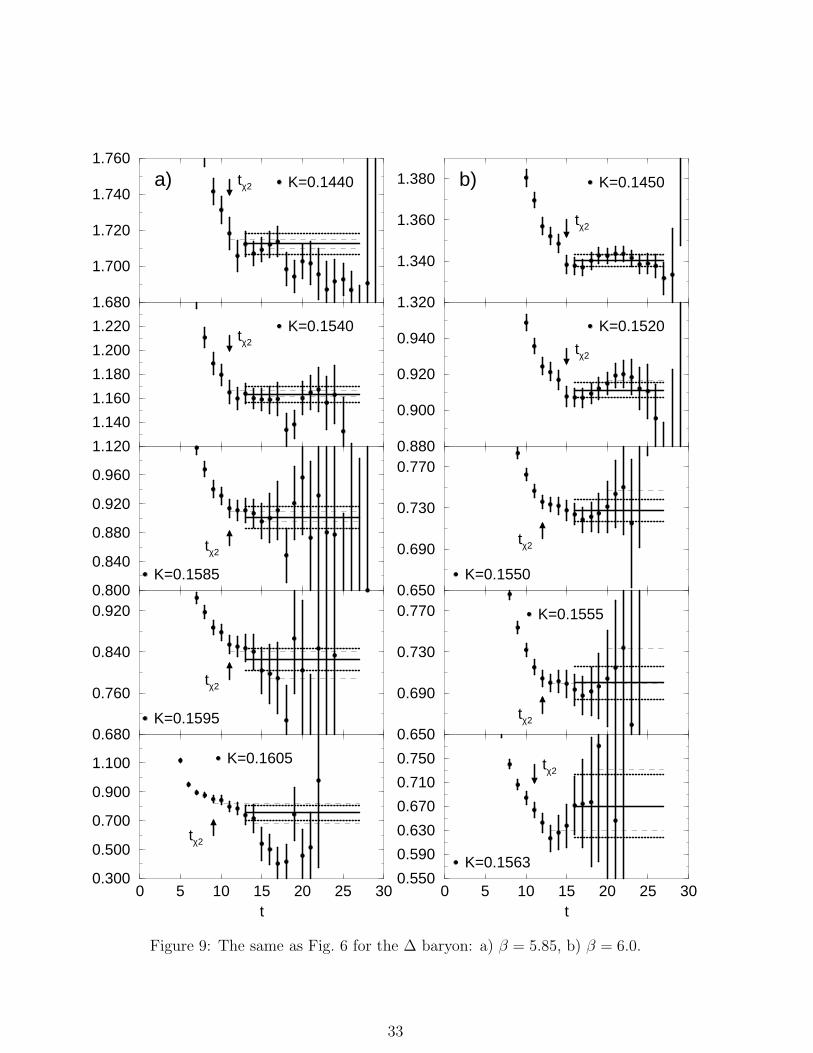
For ∆, monotonic decrease of effective masses at t ∼ tχ2 or two-plateau structure is seenfor K = 0.1595 and 0.1605 at β = 5.85 and for K = 0.1550 and 0.1563 at β = 6.0. Effectivemass plots are shown in Fig. 9. The results of the fits are summarized in table 7.
In table 5, the baryon masses at β = 6.0 for K = 0.155 and 0.1563 together with those bythe Ape collaboration and the LANL group are reproduced. The nucleon masses reportedby the three groups agree within the statistical uncertainties. The ∆ masses for K = 0.155are slightly scattered: Our result is higher than the LANL result by two standard deviations.However note that the values of the ∆ mass obtained on 400 configurations [5] (0.7054(95),0.7008(57) and 0.7128(191) for the point source, the wall source and the multi-origin source,respectively) are in good agreement with the LANL result. Therefore we think that thedifference between the LANL result and our present result is due to statistical errors.
3.6 Finite lattice effects
The linear extension of the lattice in the spatial directions is 2.45 (2.03) fm at β = 5.85(6.0), when we use a−1 = 1.93 (2.33) GeV determined from mρ (see Sec. 5). These valuesare much larger than twice the electromagnetic radius of the nucleon, 2× 0.82 fm. We alsonote that our results on the lattice with spatial volume 243 agree well with those on a latticewith 323 [11], as discussed above. Therefore we do not take into account in this work finitelattice effects which are supposed to be small.
3.7 Mass ratios
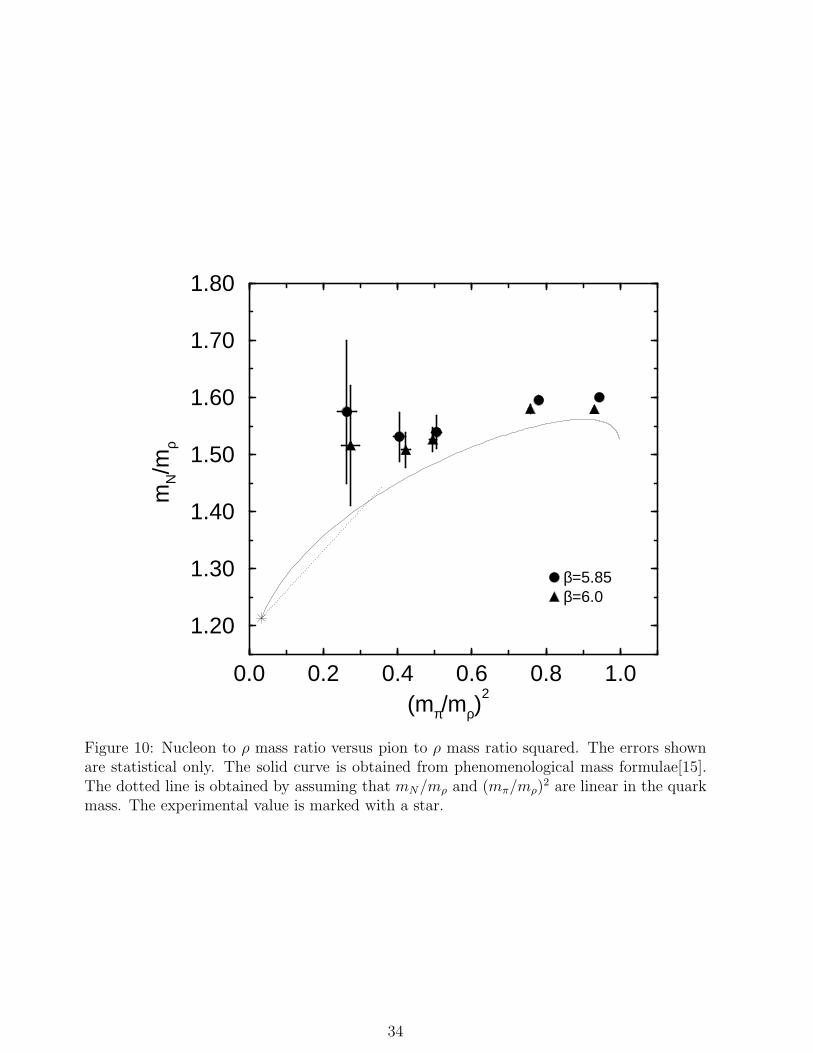
The mass ratio mN/mρ is plotted versus (mπ/mρ)2 in Fig. 10. The values of the mass ratio
are given in table 8. The value of mN/mρ at β = 6.0 is systematically smaller than that atβ = 5.85, although the results at two β’s agree within the statistical uncertainty except forthe case of the heaviest quark ((mπ/mρ)
2 ∼ 0.94).
4 Excited State Masses
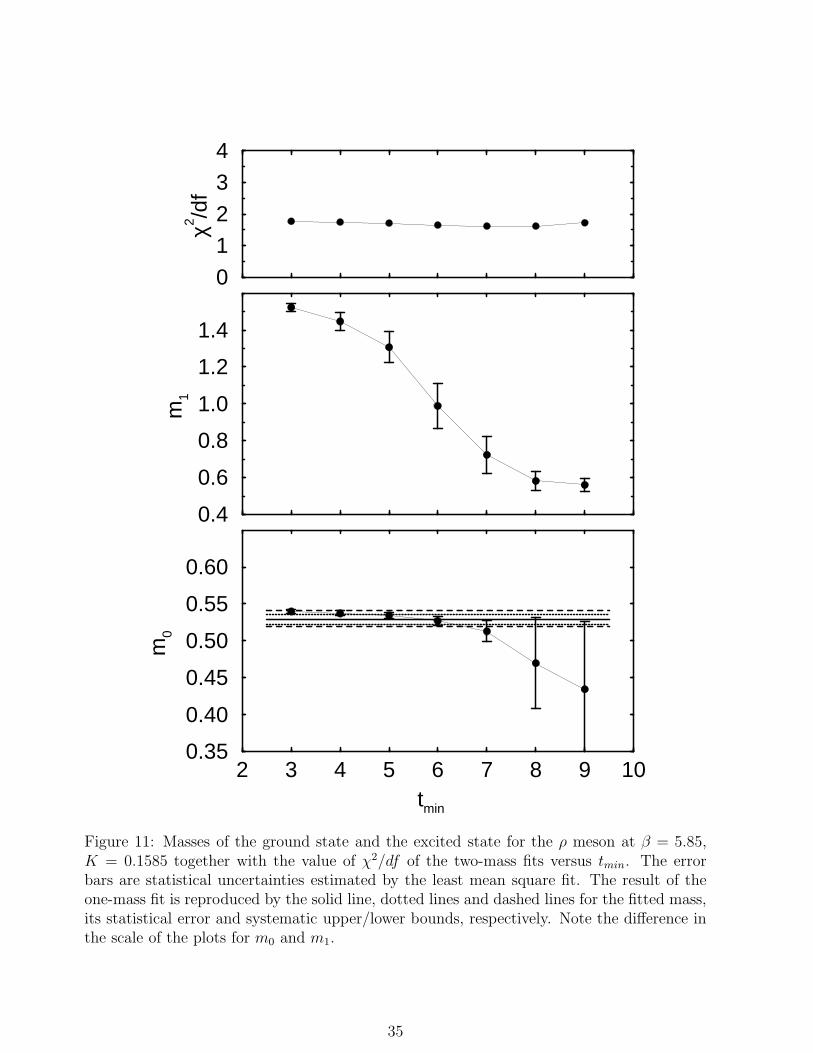
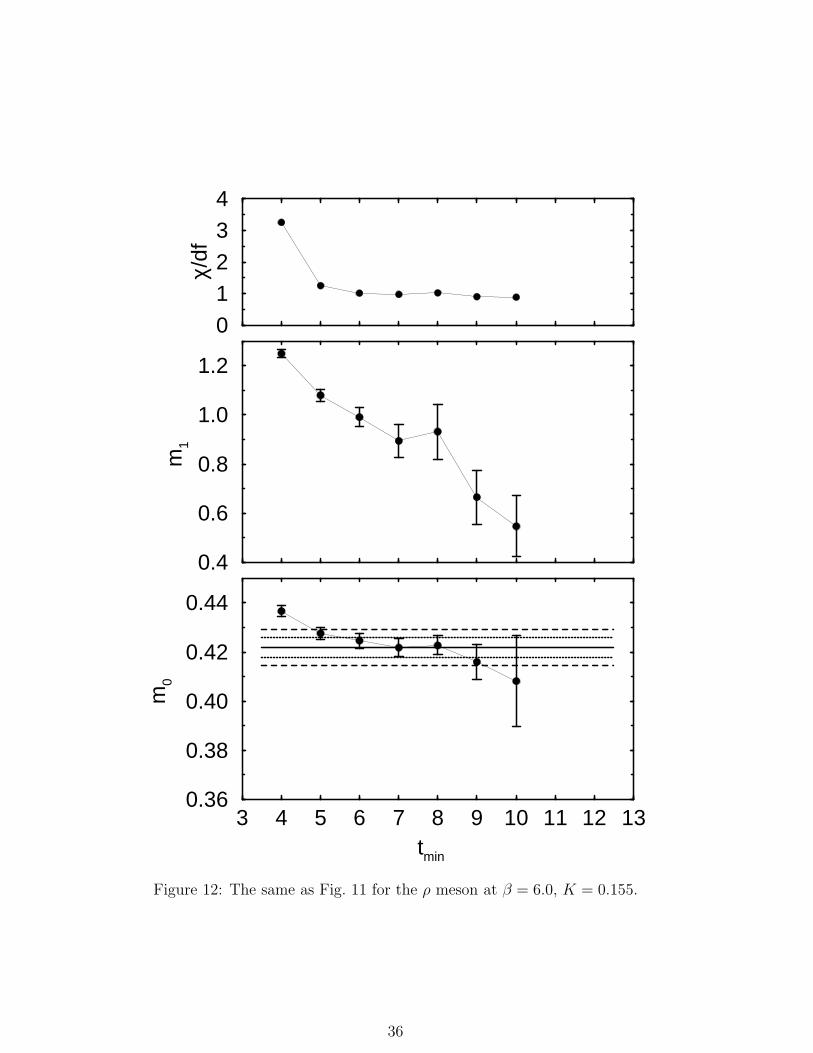
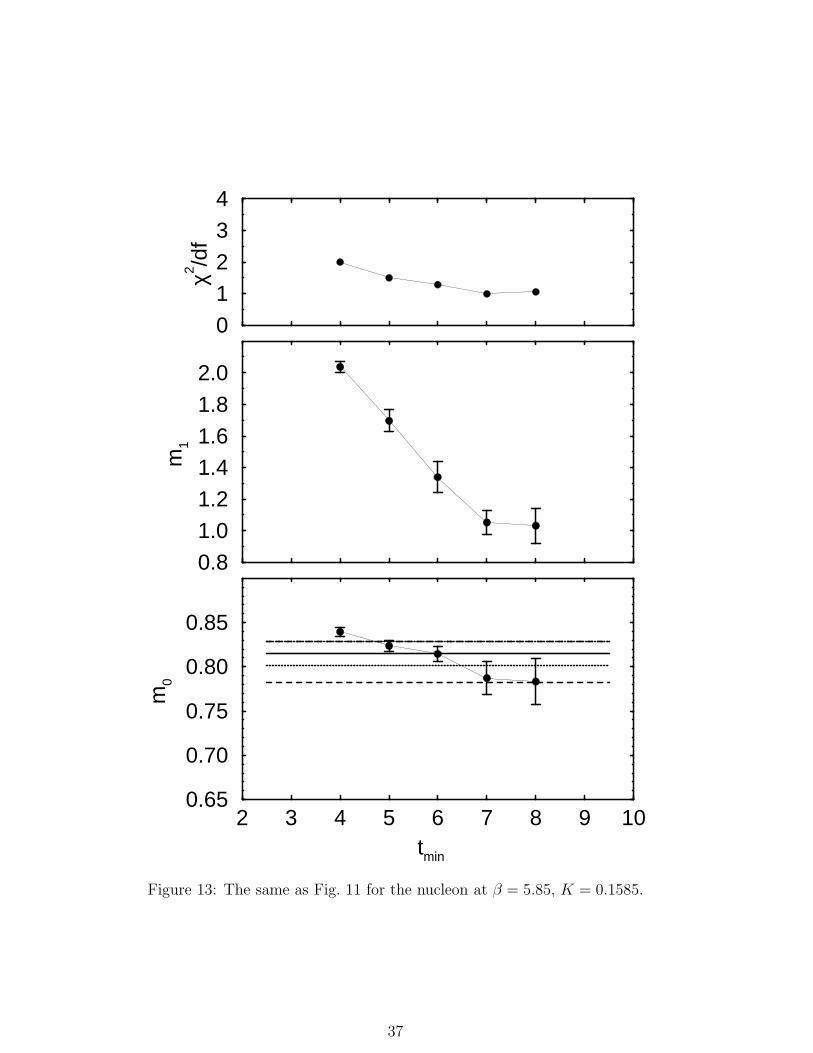
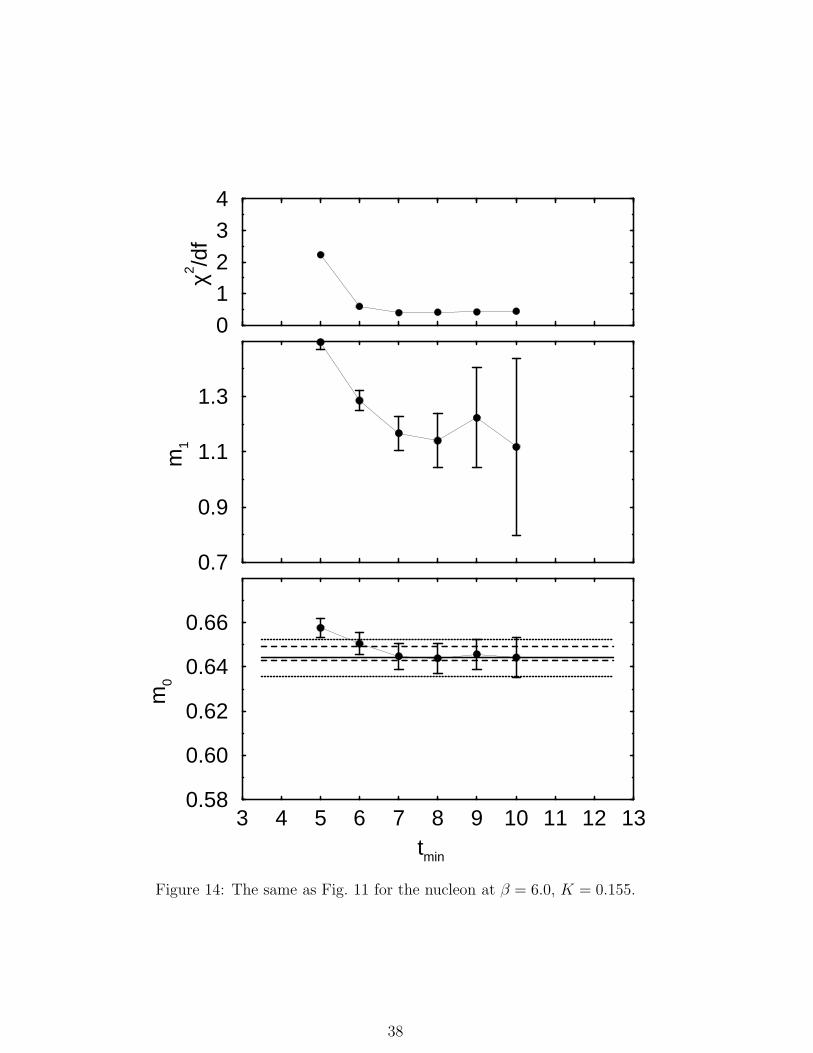
In addition to the masses of ground states, we study the masses of first excited states forthe ρ meson and the nucleon. To this end, we perform two-mass fits to the correspondingpropagators varying tmin. Our results for the ρ meson are shown in Fig. 11 for β = 5.85,K = 0.1585, and in Fig. 12 for β = 6.0, K = 0.155. The results for the nucleon are given inFigs. 13 and 14 for β = 5.85 and 6.0, respectively. We find the following:
1) χ2/df is stable and small (∼ 1 — 2) for tmin ≥ 4 (5) in the case of the ρ meson andfor tmin ≥ 5 (6) in the case of the nucleon at β = 5.85 (6.0), respectively.
2) When χ2/df is small, the ground state masses m0 from the two-mass fit are consistentwith those from the one-mass fit within the errors, although the errors for m0 from thetwo-mass fit become extremely large at large tmin.
3) Although χ2/df is stable, the mass of the first excited state m1 is in general quiteunstable. For example, for the ρ meson at β = 5.85, the value of m1 decreases from 1.5 fortmin = 3 to 0.6 for tmin = 9 (cf. Fig. 11). Similar behavior is also seen in the results for the
7
ρ meson at β = 6.0 (Fig. 12) and the nucleon at β = 5.85 (Fig. 13). The case of the nucleonat β = 6.0 is exceptional: m1 is relatively stable (Fig. 14).
Under these circumstances, we select two tmin’s which givem0 consistent with the result ofthe one-mass fit, under the condition that the errors are small. We then investigate whetherthe results for the excited state mass are consistent with the corresponding experimentalvalues.
In Figs. 15 and 16 are shown the first excited state masses of the ρ meson obtainedfrom the fit with tmin = 5 and 6 (8 and 9) versus 1/K at β = 5.85 (6.0), respectively. (Atwo-mass fit with tmin = 9 for the largest K at β = 6.0 does not converge. Therefore thecorresponding data is missing in the figure.) We give in the figures the experimental valuesfor the masses of ρ(1450) and φ(1680) which are the first excited states of the vector mesons.The mass of φ(1680) is plotted at the third largest K, because this value of K correspondsto the strange quark mass as mentioned in Sec. 5.7. Apparently the results for the excitedstate mass depend strongly on the value of tmin. For quarks lighter than the strange quark,the excited state mass obtained with smaller tmin is much larger than experiment, whilethat with larger one is consistent with experiment within large statistical errors. Therefore,although the value of m1 is unstable, there exist two-mass fits to the ρ propagators whichgive both the ground state mass consistent with the one-mass fit and the first excited statemass consistent with experiment.
Fig. 17 shows the masses of excited state of the nucleon at β = 5.85 versus 1/K. Theexcited state masses obtained from the fit with tmin = 7 are much smaller than those withtmin = 6. (A two-mass fit with tmin = 7 for the largest K does not converge.) We expectthat the mass difference between the ground state and the first excited state depends onlyweakly on the quark mass, because the mass difference for the spin 1/2 baryon satisfies thisproperty. The mass difference for the nucleon is mN(1440) −mN(940) = 500 MeV. The figureshows that the excited state masses with tmin = 7 lie approximately 500 MeV higher thanthe ground state masses. Therefore there exist two-mass fits whose results do not contradictwith experiment also for the nucleon at β = 5.85.
In Fig. 18 we show the excited state masses of the nucleon at β = 6.0 with tmin = 7. Themasses of the first excited state lie much more than 500 MeV above the ground state masses.As mentioned before, two-mass fits for the nucleon at β = 6.0 are stable and therefore thevalues of the excited state mass do not change much even if we take other tmin. When werecall that there exists a fit which gives a reasonable excited state mass at β = 5.85, thissituation is puzzling. One possible origin for the heavy excited state mass at β = 6.0 isa finite size effect, because the physical volume is smaller at β = 6.0. There remains apossibility that when we simulate on a larger lattice, a two-mass fit with larger tmin gives avalue consistent with the nucleon excited state mass.
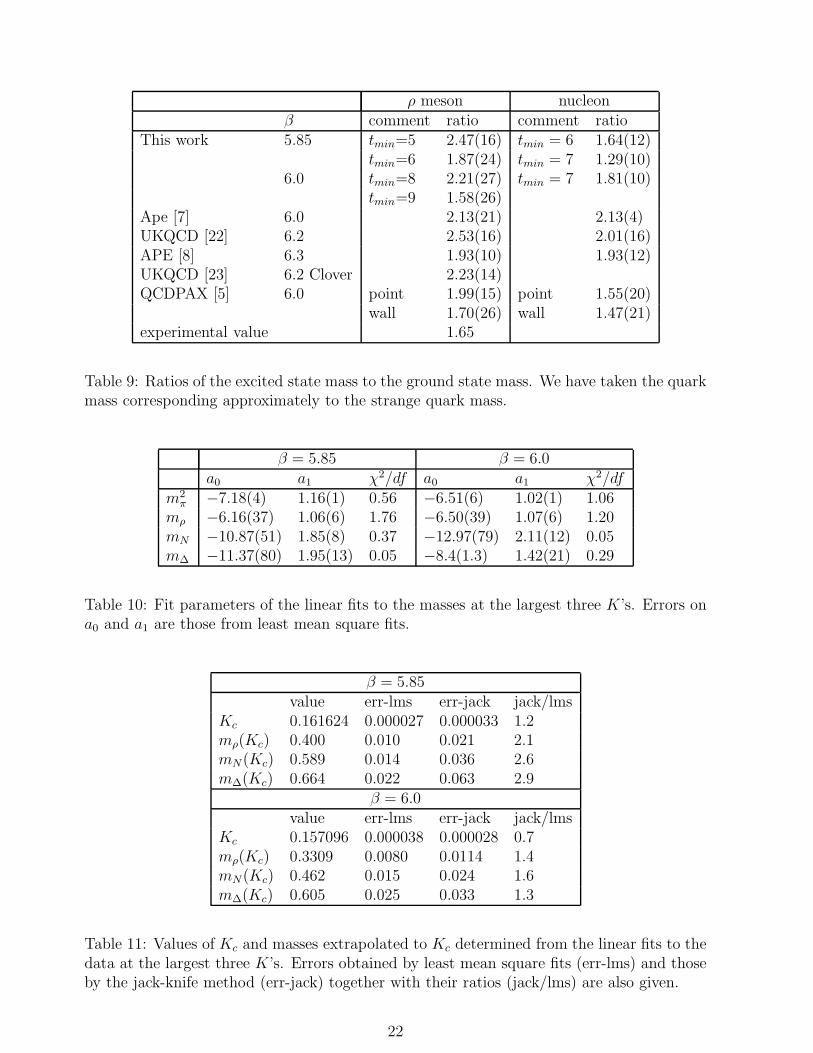
There are several published data for the mass of excited states [5, 7, 8, 22, 23]. In table9, we reproduce the results for the ratio of the excited state mass to the ground state massselecting the quark mass corresponding approximately to the strange quark mass. For the ρmeson, except our results in this work with tmin = 6 (9) at β = 5.85 (6.0) and the result forthe wall source in ref. [5], the reported ratios are considerably larger than the correspondingexperimental value mφ(1680)/mφ(1020) = 1.65. For the nucleon, the mass ratios reported bythe Ape collaboration and the UKQCD collaboration are considerably larger than our result.One possible origin of the differences is due to the choice of fitting range. Because the two-mass fit is very unstable, we certainly have to employ a more efficient way to extract reliablevalues for the excited state masses.
8
5 Masses of Hadrons with Physical Light Quarks
5.1 Extrapolation procedure
Extrapolation of hadron masses to the chiral limit is done with the correlation being takeninto account, among the masses at different values of hopping parameter. First we considera least mean square fit to minimize
χ2 =∑
t,t′,K,K ′
G(t,K) −G0(t,K)C−1(t,K; t′, K ′) G(t′, K ′) −G0(t′, K ′), (14)
where G0(t,K) = A(K)e−m(K)t is the fitting function to hadron propagator G(t,K) and C−1
is the inverse of the full correlation matrix C(t,K; t′;K ′). A linear approximation to thefitting function around the minimum of χ2 gives the relation between the error matrix Σ forfit parameters and correlation matrix C(t,K; t′, K ′) for propagators:
Σ = (DTC−1D)−1, (15)
where D is the Jacobian defined by
Dt,K;A(K ′),m(K ′) = [∂G0(t,K)/∂A(K ′), ∂G0(t,K)/∂m(K ′)]. (16)
(D is diagonal with respect to K.) The full least mean square fit to minimize χ2 in eq. 14is different from the set of least mean square fits for each K to minimize χ2’s in eq. 12: Themasses and amplitudes obtained by the two methods are in general different. We take thoseobtained from the fits to each propagator for evaluation of the Jacobian.1
For extrapolation, we minimize χ2 given by
χ2 =∑
K
m(K) − f(K)Σ−1(K,K ′) m(K ′) − f(K ′), (17)
where the correlation matrix Σ(K,K ′) is the sub-matrix among the masses of the full errormatrix Σ and f(K) is the fitting function. (For the pion, m(K) is replaced by m2(K) withappropriate replacement of Σ−1(K,K ′).)
5.2 Linear extrapolation to the chiral limit
We fit the data of the mass squared for the pion and the mass for the other hadrons at thelargest three K’s to a linear function of 1/K; f(K) = a0 + a1/K. We find that quality ofthe linear fit is good in the sense that χ2/df < 2 (df = 1 in this case) and therefore we donot study in this work the effects of possible chiral logarithms [24, 25]. We summarize thefit parameters together with χ2/df in table 10. The linear extrapolations of hadron massesat β = 5.85 and 6.0 are shown in Figs. 19 and 20, respectively.
In table 11 we summarize the results for the critical hopping parameterKc and the massesat Kc together with the errors estimated by the least mean square fit and those by the jack-knife method. We find that the error estimated by the jack-knife method is larger than thatby the least mean square fit except for Kc at β = 6.0. We take the error obtained by thejack-knife method as our estimate of the statistical uncertainty, unless otherwise stated.
1We have checked that the error matrix thus obtained is very close to that obtained using the Jacobianat the absolute minimum of eq. 14. Consequently the difference in the extrapolated values obtained using
two error matrices is at most 5% of their statistical uncertainties.
9
5.3 Systematic error analyses
We first estimate the systematic error on the masses in the chiral limit coming from uncer-tainties in the choice of fitting range for extracting the ground state mass at each K. Tothis end, we repeat linear extrapolations of the masses obtained from the fits to a ranget0 — T/2, varying t0 (common to all K’s) from maxKtχ2(K) to tmin + 4. We find thatquality of the linear fits depends on the choice of t0: χ
2/df are considerably large for somechoices of t0. We adopt the condition χ2/df < 2 for the linear fit to be accepted. We takethe difference between the fitted mass value and the maximum/minimum mass value underthe condition χ2/df < 2 as our estimate of the systematic upper/lower error. We call thesystematic error thus obtained the fit-range systematic error.
Data at the fourth largest K slightly deviates from the linear fit. In order to estimatethe systematic error which comes from the choice of fitting function, we make a quadraticfit (f(K) = a0 + a1/K + a2/K
2) to the largest four K’s, varying t0 in the range used for theestimate of the fit-range systematic error. We estimate the systematic error by the differencebetween the maximum/minimum value with χ2/df < 2 and that of the linear fits. We callthe systematic error thus obtained the fit-func systematic error.
5.4 Pion mass extrapolation and Kc
Pion masses squared are fitted to a linear function of 1/K to obtain the critical hoppingparameter. The value of χ2/df is 0.56 (1.1) for the fit (tmin = 12 (15)) at β = 5.85 (6.0).The fit-range systematic errors are estimated from the fits with t0 = 8 — 16 at β = 5.85and 10 — 19 at β = 6.0. All the fits give χ2/df < 2. The upper (lower) bound comes fromthe fit with t0 = 11 (14) with χ2/df of 0.36 (0.04) for β = 5.85 and from the fit with t0 = 12(19) with χ2/df of 0.44 (0.96) for β = 6.0.
For data at β = 5.85, no quadratic fits with t0 = 8 — 16 give χ2/df < 2. On the otherhand, quadratic fits to data at β = 6.0 with t0 = 13 — 19 give χ2/df < 2. Because m2
π isa concave function of 1/K when the data at the fourth largest K is included, Kc obtainedfrom the quadratic fit is larger than that from the linear fit.
The values of Kc’s together with the fit-range systematic error and the fit-func systematicerror are given by
stat. sys.(fit-range) sys.(fit-func.)β = 5.85 Kc = 0.161624 ±0.000033 +0.000001 −0.000025β = 6.00 Kc = 0.157096 ±0.000028 +0.000033 −0.000009 +0.000109
The fit-range systematic error is comparable to the statistical uncertainty.The result for Kc at β = 6.0 agrees well with that in ref. [7]. Although it is slightly
smaller than the LANL result 0.15714(1) [11], we conclude that our result is consistent withtheirs within the sum of the statistical error and the fit-range systematic error.
In this work, we do not distinguish the physical point wheremπ/mρ takes its experimentalvalue from the critical point where the pion mass vanishes, because we find that physicalquantities at the two points differ only at most 30% of their statistical errors.
5.5 Rho meson mass extrapolation and lattice spacing
A linear fit to the ρ meson masses (with tmin = 12 (15)) at the largest three K’s gives χ2/dfof 1.8 (1.2) for β = 5.85 (6.0). Therefore the linear fit is acceptable.
10
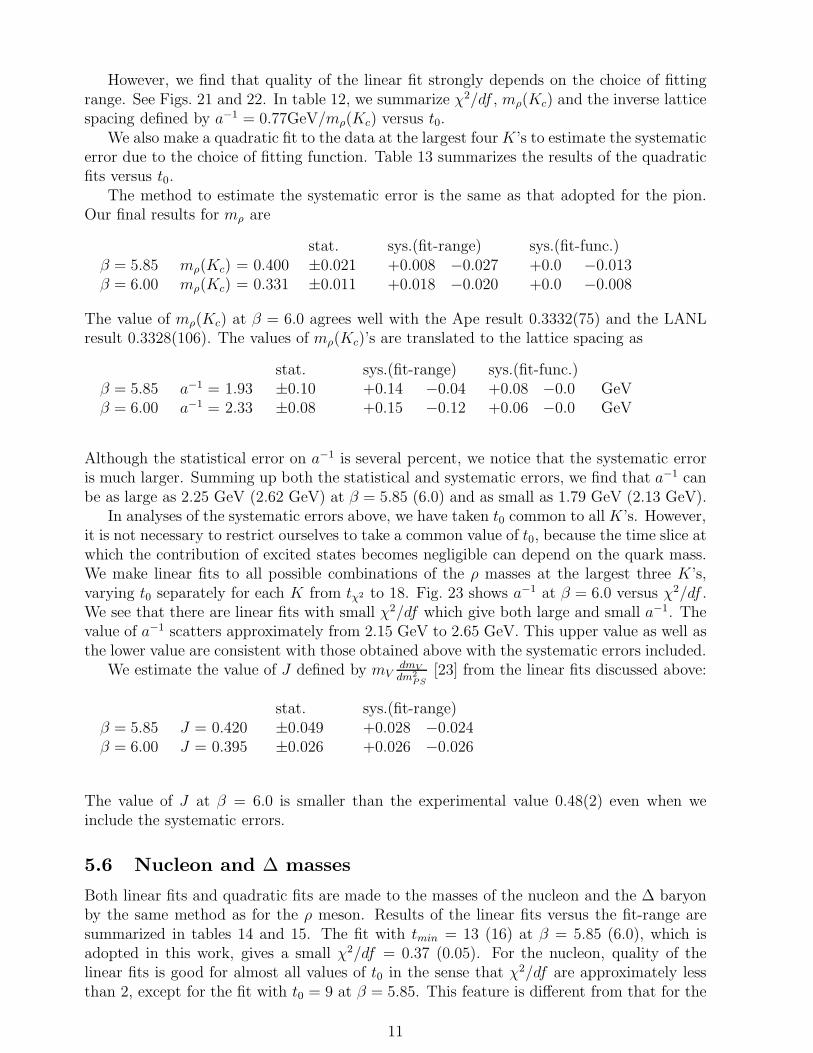
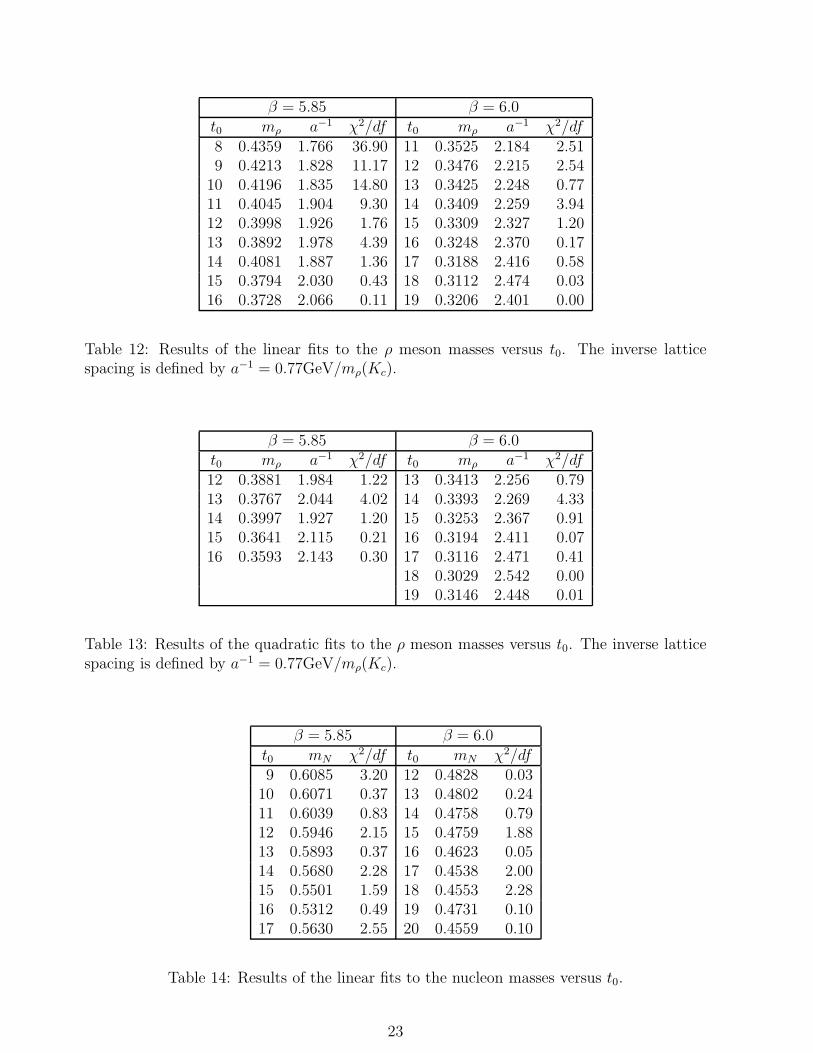
However, we find that quality of the linear fit strongly depends on the choice of fittingrange. See Figs. 21 and 22. In table 12, we summarize χ2/df , mρ(Kc) and the inverse latticespacing defined by a−1 = 0.77GeV/mρ(Kc) versus t0.
We also make a quadratic fit to the data at the largest fourK’s to estimate the systematicerror due to the choice of fitting function. Table 13 summarizes the results of the quadraticfits versus t0.
The method to estimate the systematic error is the same as that adopted for the pion.Our final results for mρ are
stat. sys.(fit-range) sys.(fit-func.)β = 5.85 mρ(Kc) = 0.400 ±0.021 +0.008 −0.027 +0.0 −0.013β = 6.00 mρ(Kc) = 0.331 ±0.011 +0.018 −0.020 +0.0 −0.008
The value of mρ(Kc) at β = 6.0 agrees well with the Ape result 0.3332(75) and the LANLresult 0.3328(106). The values of mρ(Kc)’s are translated to the lattice spacing as
stat. sys.(fit-range) sys.(fit-func.)β = 5.85 a−1 = 1.93 ±0.10 +0.14 −0.04 +0.08 −0.0 GeVβ = 6.00 a−1 = 2.33 ±0.08 +0.15 −0.12 +0.06 −0.0 GeV
Although the statistical error on a−1 is several percent, we notice that the systematic erroris much larger. Summing up both the statistical and systematic errors, we find that a−1 canbe as large as 2.25 GeV (2.62 GeV) at β = 5.85 (6.0) and as small as 1.79 GeV (2.13 GeV).
In analyses of the systematic errors above, we have taken t0 common to all K’s. However,it is not necessary to restrict ourselves to take a common value of t0, because the time slice atwhich the contribution of excited states becomes negligible can depend on the quark mass.We make linear fits to all possible combinations of the ρ masses at the largest three K’s,varying t0 separately for each K from tχ2 to 18. Fig. 23 shows a−1 at β = 6.0 versus χ2/df .We see that there are linear fits with small χ2/df which give both large and small a−1. Thevalue of a−1 scatters approximately from 2.15 GeV to 2.65 GeV. This upper value as well asthe lower value are consistent with those obtained above with the systematic errors included.
We estimate the value of J defined by mVdmV
dm2
PS
[23] from the linear fits discussed above:
stat. sys.(fit-range)β = 5.85 J = 0.420 ±0.049 +0.028 −0.024β = 6.00 J = 0.395 ±0.026 +0.026 −0.026
The value of J at β = 6.0 is smaller than the experimental value 0.48(2) even when weinclude the systematic errors.
5.6 Nucleon and ∆ masses
Both linear fits and quadratic fits are made to the masses of the nucleon and the ∆ baryonby the same method as for the ρ meson. Results of the linear fits versus the fit-range aresummarized in tables 14 and 15. The fit with tmin = 13 (16) at β = 5.85 (6.0), which isadopted in this work, gives a small χ2/df = 0.37 (0.05). For the nucleon, quality of thelinear fits is good for almost all values of t0 in the sense that χ2/df are approximately lessthan 2, except for the fit with t0 = 9 at β = 5.85. This feature is different from that for the
11
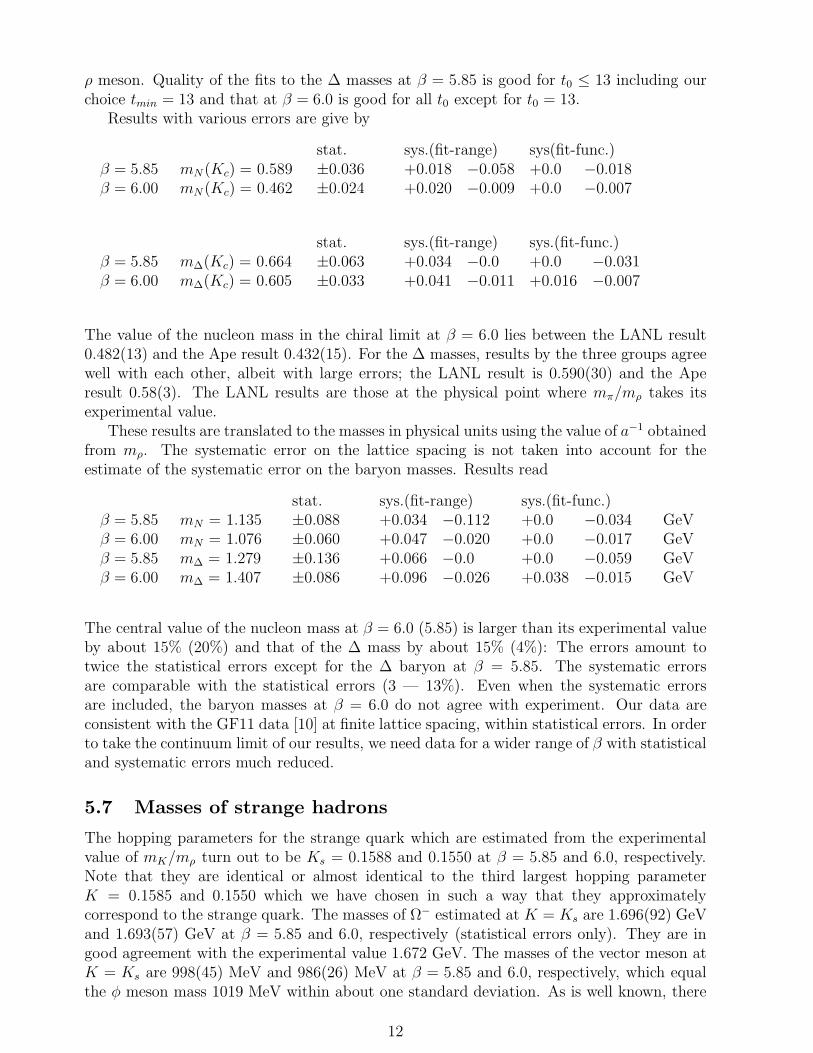
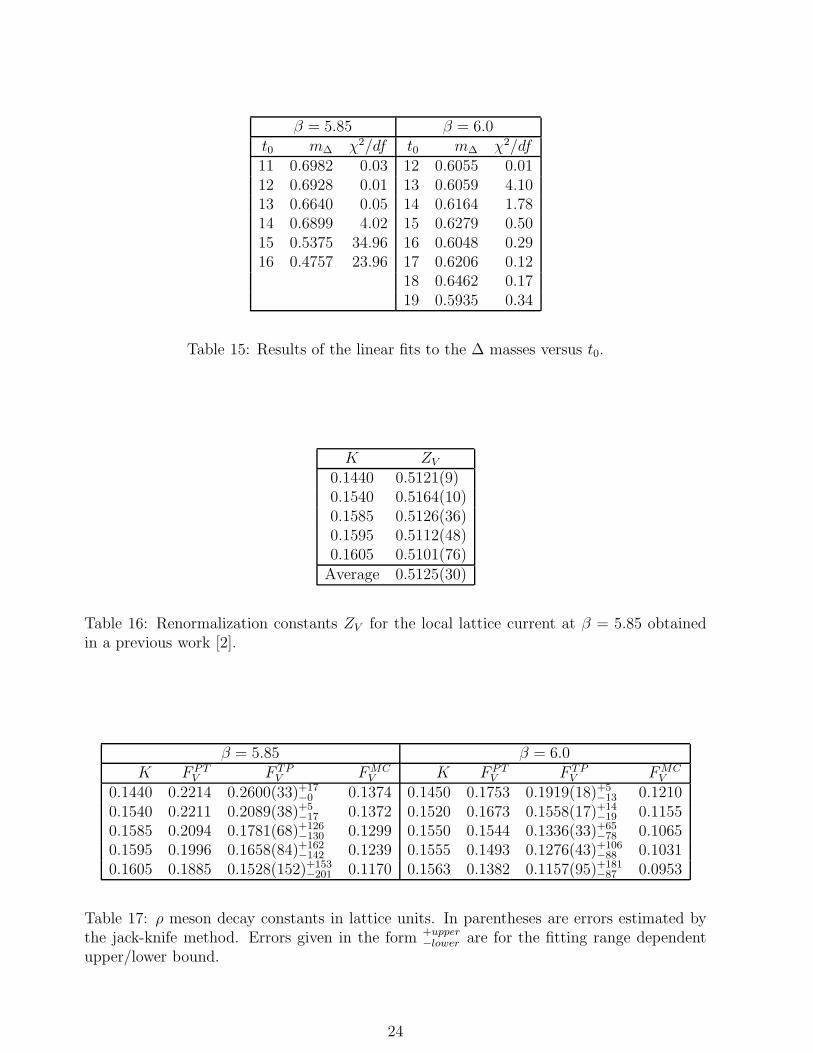
ρ meson. Quality of the fits to the ∆ masses at β = 5.85 is good for t0 ≤ 13 including ourchoice tmin = 13 and that at β = 6.0 is good for all t0 except for t0 = 13.
Results with various errors are give by
stat. sys.(fit-range) sys(fit-func.)β = 5.85 mN (Kc) = 0.589 ±0.036 +0.018 −0.058 +0.0 −0.018β = 6.00 mN (Kc) = 0.462 ±0.024 +0.020 −0.009 +0.0 −0.007
stat. sys.(fit-range) sys.(fit-func.)β = 5.85 m∆(Kc) = 0.664 ±0.063 +0.034 −0.0 +0.0 −0.031β = 6.00 m∆(Kc) = 0.605 ±0.033 +0.041 −0.011 +0.016 −0.007
The value of the nucleon mass in the chiral limit at β = 6.0 lies between the LANL result0.482(13) and the Ape result 0.432(15). For the ∆ masses, results by the three groups agreewell with each other, albeit with large errors; the LANL result is 0.590(30) and the Aperesult 0.58(3). The LANL results are those at the physical point where mπ/mρ takes itsexperimental value.
These results are translated to the masses in physical units using the value of a−1 obtainedfrom mρ. The systematic error on the lattice spacing is not taken into account for theestimate of the systematic error on the baryon masses. Results read
stat. sys.(fit-range) sys.(fit-func.)β = 5.85 mN = 1.135 ±0.088 +0.034 −0.112 +0.0 −0.034 GeVβ = 6.00 mN = 1.076 ±0.060 +0.047 −0.020 +0.0 −0.017 GeVβ = 5.85 m∆ = 1.279 ±0.136 +0.066 −0.0 +0.0 −0.059 GeVβ = 6.00 m∆ = 1.407 ±0.086 +0.096 −0.026 +0.038 −0.015 GeV
The central value of the nucleon mass at β = 6.0 (5.85) is larger than its experimental valueby about 15% (20%) and that of the ∆ mass by about 15% (4%): The errors amount totwice the statistical errors except for the ∆ baryon at β = 5.85. The systematic errorsare comparable with the statistical errors (3 — 13%). Even when the systematic errorsare included, the baryon masses at β = 6.0 do not agree with experiment. Our data areconsistent with the GF11 data [10] at finite lattice spacing, within statistical errors. In orderto take the continuum limit of our results, we need data for a wider range of β with statisticaland systematic errors much reduced.
5.7 Masses of strange hadrons
The hopping parameters for the strange quark which are estimated from the experimentalvalue of mK/mρ turn out to be Ks = 0.1588 and 0.1550 at β = 5.85 and 6.0, respectively.Note that they are identical or almost identical to the third largest hopping parameterK = 0.1585 and 0.1550 which we have chosen in such a way that they approximatelycorrespond to the strange quark. The masses of Ω− estimated at K = Ks are 1.696(92) GeVand 1.693(57) GeV at β = 5.85 and 6.0, respectively (statistical errors only). They are ingood agreement with the experimental value 1.672 GeV. The masses of the vector meson atK = Ks are 998(45) MeV and 986(26) MeV at β = 5.85 and 6.0, respectively, which equalthe φ meson mass 1019 MeV within about one standard deviation. As is well known, there
12
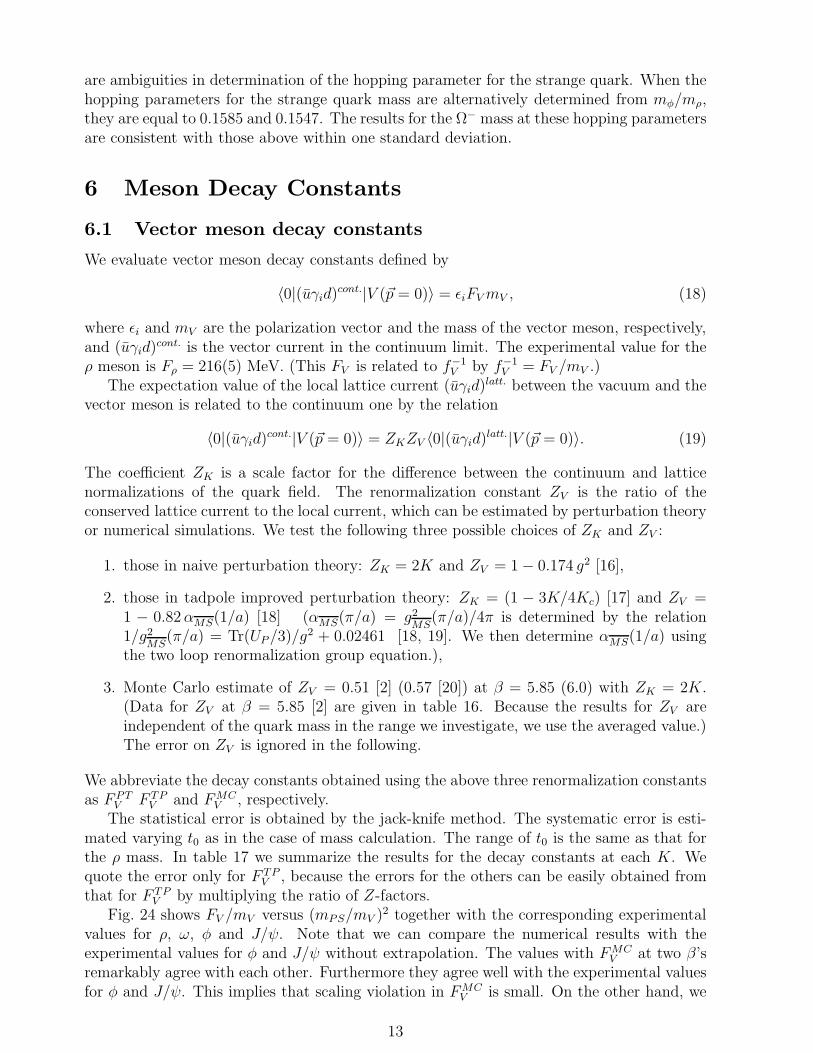
are ambiguities in determination of the hopping parameter for the strange quark. When thehopping parameters for the strange quark mass are alternatively determined from mφ/mρ,they are equal to 0.1585 and 0.1547. The results for the Ω− mass at these hopping parametersare consistent with those above within one standard deviation.
6 Meson Decay Constants
6.1 Vector meson decay constants
We evaluate vector meson decay constants defined by
〈0|(uγid)cont.|V (~p = 0)〉 = ǫiFVmV , (18)
where ǫi and mV are the polarization vector and the mass of the vector meson, respectively,and (uγid)
cont. is the vector current in the continuum limit. The experimental value for theρ meson is Fρ = 216(5) MeV. (This FV is related to f−1
V by f−1V = FV /mV .)
The expectation value of the local lattice current (uγid)latt. between the vacuum and the
vector meson is related to the continuum one by the relation
〈0|(uγid)cont.|V (~p = 0)〉 = ZKZV 〈0|(uγid)
latt.|V (~p = 0)〉. (19)
The coefficient ZK is a scale factor for the difference between the continuum and latticenormalizations of the quark field. The renormalization constant ZV is the ratio of theconserved lattice current to the local current, which can be estimated by perturbation theoryor numerical simulations. We test the following three possible choices of ZK and ZV :
1. those in naive perturbation theory: ZK = 2K and ZV = 1 − 0.174 g2 [16],
2. those in tadpole improved perturbation theory: ZK = (1 − 3K/4Kc) [17] and ZV =1 − 0.82αMS(1/a) [18] (αMS(π/a) = g2
MS(π/a)/4π is determined by the relation
1/g2MS
(π/a) = Tr(UP/3)/g2 + 0.02461 [18, 19]. We then determine αMS(1/a) usingthe two loop renormalization group equation.),
3. Monte Carlo estimate of ZV = 0.51 [2] (0.57 [20]) at β = 5.85 (6.0) with ZK = 2K.(Data for ZV at β = 5.85 [2] are given in table 16. Because the results for ZV areindependent of the quark mass in the range we investigate, we use the averaged value.)The error on ZV is ignored in the following.
We abbreviate the decay constants obtained using the above three renormalization constantsas F PT
V F TPV and FMC
V , respectively.The statistical error is obtained by the jack-knife method. The systematic error is esti-
mated varying t0 as in the case of mass calculation. The range of t0 is the same as that forthe ρ mass. In table 17 we summarize the results for the decay constants at each K. Wequote the error only for F TP
V , because the errors for the others can be easily obtained fromthat for F TP
V by multiplying the ratio of Z-factors.Fig. 24 shows FV /mV versus (mPS/mV )2 together with the corresponding experimental
values for ρ, ω, φ and J/ψ. Note that we can compare the numerical results with theexperimental values for φ and J/ψ without extrapolation. The values with FMC
V at two β’sremarkably agree with each other. Furthermore they agree well with the experimental valuesfor φ and J/ψ. This implies that scaling violation in FMC
V is small. On the other hand, we
13
find sizable scaling violation in F PTV and F TP
V . They are off the experimental values for φ andJ/ψ by 40 — 100%. We find that FMC
V /mV ’s at β = 6.0 agree well with the Ape data [7, 8].In fig. 25 we depict the values of Fφ/mρ versus mρa together with the GF11 result[21].
The values of the hopping parameter for the strange quark are given in Sec. 5.7. Note thatthe values of FMC
φ /mρ agree with experiment already at mρa = 0.33 — 0.40 within 1 — 2standard deviations. The values of F TP
φ /mρ are consistent with the GF11 result, althoughthe central values are about 1σ higher than the GF11 data. They are off the experimentalvalue by 30 — 40% at these values of mρa. Linear extrapolation of our data to zero latticespacing is consistent with experiment.
The value of FV in the chiral limit is obtained from a linear fit in terms of 1/K in a similarway to that made for hadron mass extrapolation. We first calculate the correlation matrixΣ(K,K ′) for FV (K) from the error matrix Σ for the mass and amplitude (eq. 15) using theerror propagation rule and then minimize χ2. A linear fit to the data at the largest threeK’s gives a reasonable χ2/df : χ2/df = 0.04 (0.38) for F TP
V , 0.09 (0.44) for F PTV and FMC
V atβ = 5.85 (6.0), respectively. Fig. 26 shows FV as functions of the quark mass together withthe fitting functions.
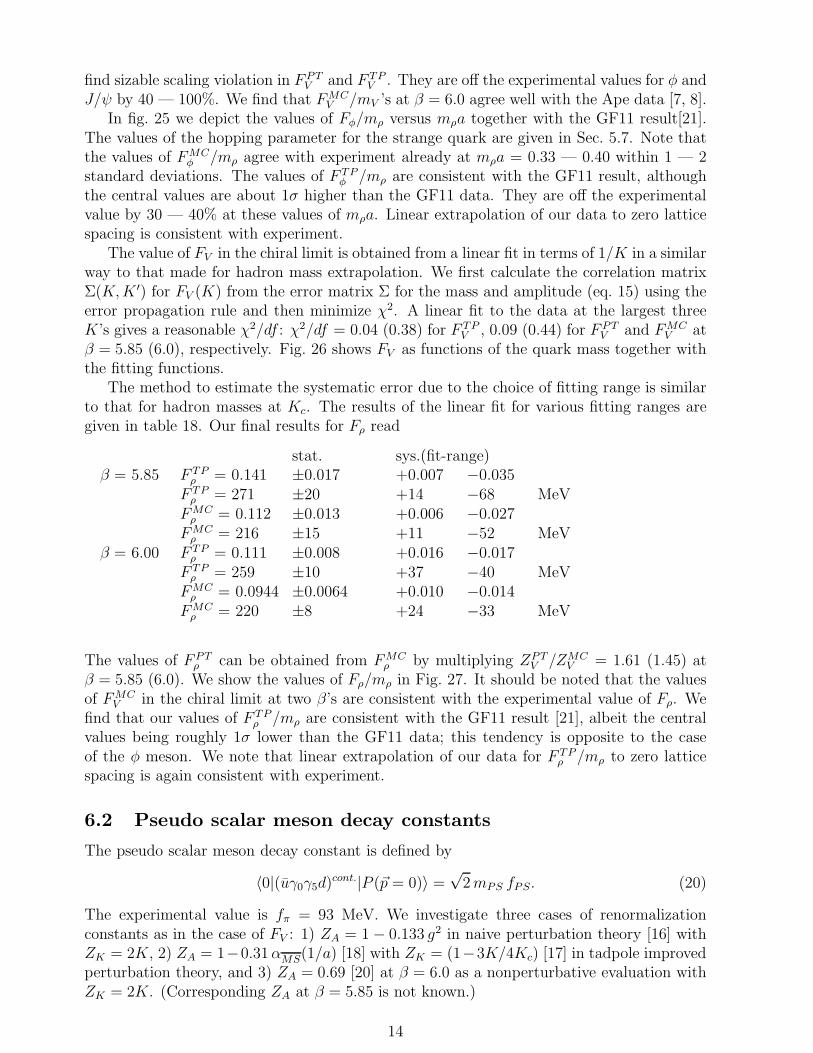
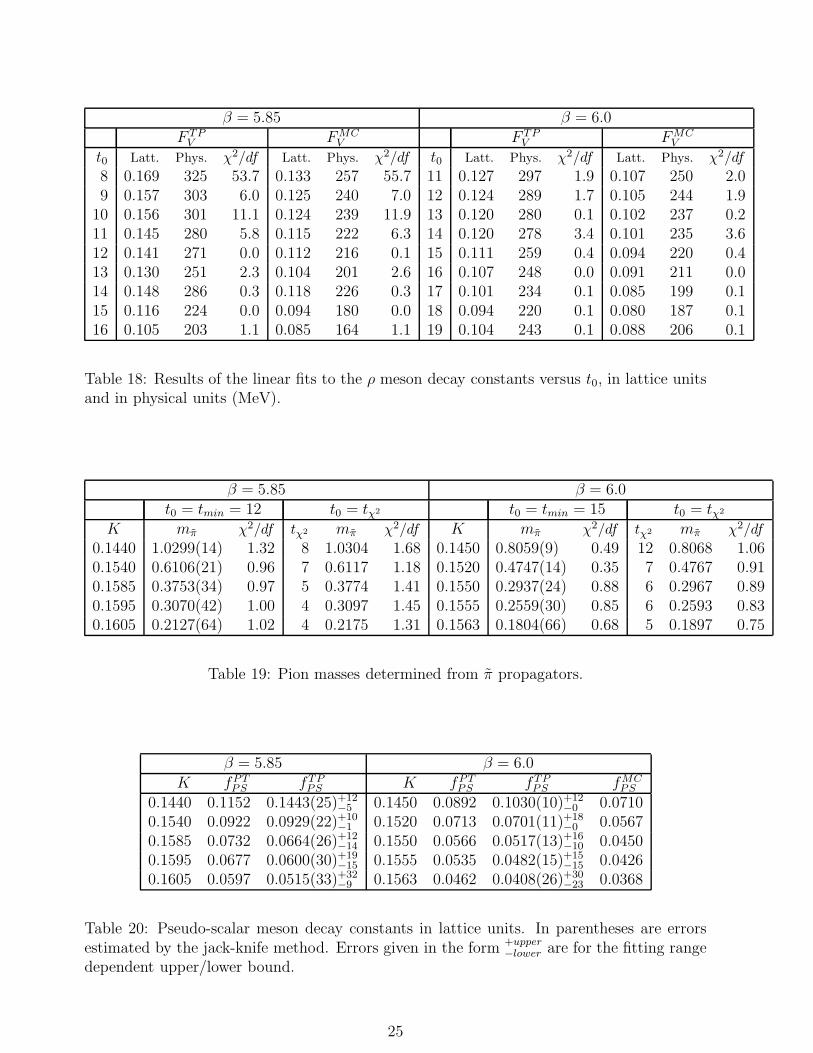
The method to estimate the systematic error due to the choice of fitting range is similarto that for hadron masses at Kc. The results of the linear fit for various fitting ranges aregiven in table 18. Our final results for Fρ read
stat. sys.(fit-range)β = 5.85 F TP
ρ = 0.141 ±0.017 +0.007 −0.035F TP
ρ = 271 ±20 +14 −68 MeVFMC
ρ = 0.112 ±0.013 +0.006 −0.027FMC
ρ = 216 ±15 +11 −52 MeVβ = 6.00 F TP
ρ = 0.111 ±0.008 +0.016 −0.017F TP
ρ = 259 ±10 +37 −40 MeVFMC
ρ = 0.0944 ±0.0064 +0.010 −0.014FMC
ρ = 220 ±8 +24 −33 MeV
The values of F PTρ can be obtained from FMC
ρ by multiplying ZPTV /ZMC
V = 1.61 (1.45) atβ = 5.85 (6.0). We show the values of Fρ/mρ in Fig. 27. It should be noted that the valuesof FMC
V in the chiral limit at two β’s are consistent with the experimental value of Fρ. Wefind that our values of F TP
ρ /mρ are consistent with the GF11 result [21], albeit the centralvalues being roughly 1σ lower than the GF11 data; this tendency is opposite to the caseof the φ meson. We note that linear extrapolation of our data for F TP
ρ /mρ to zero latticespacing is again consistent with experiment.
6.2 Pseudo scalar meson decay constants
The pseudo scalar meson decay constant is defined by
〈0|(uγ0γ5d)cont.|P (~p = 0)〉 =
√2mPS fPS. (20)
The experimental value is fπ = 93 MeV. We investigate three cases of renormalizationconstants as in the case of FV : 1) ZA = 1 − 0.133 g2 in naive perturbation theory [16] withZK = 2K, 2) ZA = 1−0.31αMS(1/a) [18] with ZK = (1−3K/4Kc) [17] in tadpole improvedperturbation theory, and 3) ZA = 0.69 [20] at β = 6.0 as a nonperturbative evaluation withZK = 2K. (Corresponding ZA at β = 5.85 is not known.)
14
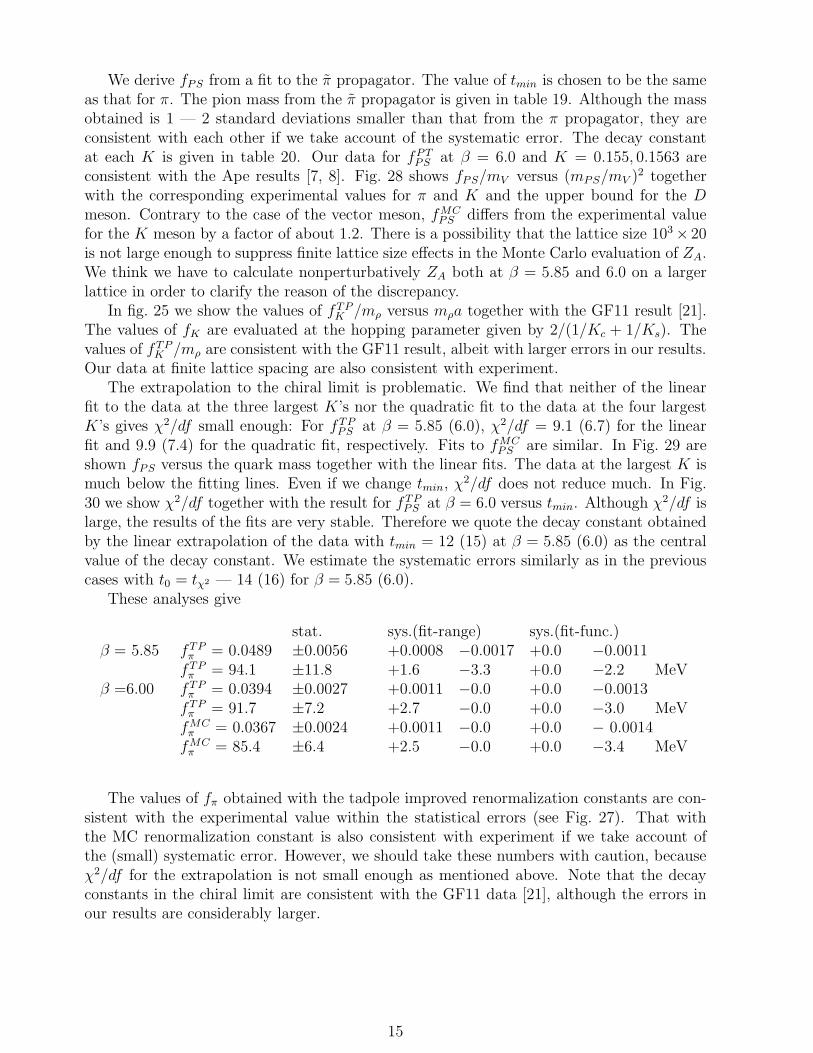
We derive fPS from a fit to the π propagator. The value of tmin is chosen to be the sameas that for π. The pion mass from the π propagator is given in table 19. Although the massobtained is 1 — 2 standard deviations smaller than that from the π propagator, they areconsistent with each other if we take account of the systematic error. The decay constantat each K is given in table 20. Our data for fPT
PS at β = 6.0 and K = 0.155, 0.1563 areconsistent with the Ape results [7, 8]. Fig. 28 shows fPS/mV versus (mPS/mV )2 togetherwith the corresponding experimental values for π and K and the upper bound for the Dmeson. Contrary to the case of the vector meson, fMC
PS differs from the experimental valuefor the K meson by a factor of about 1.2. There is a possibility that the lattice size 103 × 20is not large enough to suppress finite lattice size effects in the Monte Carlo evaluation of ZA.We think we have to calculate nonperturbatively ZA both at β = 5.85 and 6.0 on a largerlattice in order to clarify the reason of the discrepancy.
In fig. 25 we show the values of fTPK /mρ versus mρa together with the GF11 result [21].
The values of fK are evaluated at the hopping parameter given by 2/(1/Kc + 1/Ks). Thevalues of fTP
K /mρ are consistent with the GF11 result, albeit with larger errors in our results.Our data at finite lattice spacing are also consistent with experiment.
The extrapolation to the chiral limit is problematic. We find that neither of the linearfit to the data at the three largest K’s nor the quadratic fit to the data at the four largestK’s gives χ2/df small enough: For fTP
PS at β = 5.85 (6.0), χ2/df = 9.1 (6.7) for the linearfit and 9.9 (7.4) for the quadratic fit, respectively. Fits to fMC
PS are similar. In Fig. 29 areshown fPS versus the quark mass together with the linear fits. The data at the largest K ismuch below the fitting lines. Even if we change tmin, χ2/df does not reduce much. In Fig.30 we show χ2/df together with the result for fTP
PS at β = 6.0 versus tmin. Although χ2/df islarge, the results of the fits are very stable. Therefore we quote the decay constant obtainedby the linear extrapolation of the data with tmin = 12 (15) at β = 5.85 (6.0) as the centralvalue of the decay constant. We estimate the systematic errors similarly as in the previouscases with t0 = tχ2 — 14 (16) for β = 5.85 (6.0).
These analyses give
stat. sys.(fit-range) sys.(fit-func.)β = 5.85 fTP
π = 0.0489 ±0.0056 +0.0008 −0.0017 +0.0 −0.0011fTP
π = 94.1 ±11.8 +1.6 −3.3 +0.0 −2.2 MeVβ =6.00 fTP
π = 0.0394 ±0.0027 +0.0011 −0.0 +0.0 −0.0013fTP
π = 91.7 ±7.2 +2.7 −0.0 +0.0 −3.0 MeVfMC
π = 0.0367 ±0.0024 +0.0011 −0.0 +0.0 − 0.0014fMC
π = 85.4 ±6.4 +2.5 −0.0 +0.0 −3.4 MeV
The values of fπ obtained with the tadpole improved renormalization constants are con-sistent with the experimental value within the statistical errors (see Fig. 27). That withthe MC renormalization constant is also consistent with experiment if we take account ofthe (small) systematic error. However, we should take these numbers with caution, becauseχ2/df for the extrapolation is not small enough as mentioned above. Note that the decayconstants in the chiral limit are consistent with the GF11 data [21], although the errors inour results are considerably larger.
15
7 Conclusions and Discussion
In analyses of numerical simulations toward high precision determination of light hadronmasses, one first encounters the problem of fitting range for hadron propagators. We findthat effective masses of hadrons in general do not exhibit clear plateaus, although statis-tics is relatively high (the number of configurations is 100 (200) at β = 5.85 (6.0)). Thecorrelated χ2 fits do not determine unambiguously the time slice beyond which the groundstate dominates. We also notice a very intriguing fact that mfit by the correlated fits to arange from t = t0 has a strong correlation with meff at t = t0. Varying systematically thefitting range, we estimate systematic errors in hadron masses due to statistical fluctuationsas well as due to the contamination from excited states, which cannot be properly taken intoaccount by the standard least mean square fit with a fixed fitting range. We find that thesystematic errors for the hadron masses with quarks lighter than the strange quark amountto 1 — 2 times the statistical errors.
When the lattice scale is fixed from the ρ meson mass, the masses of the Ω− baryon andthe φ meson at two β’s agree with experiment within about one standard deviation. Onthe other hand, the central value of the nucleon mass at β = 6.0 (5.85) is larger than itsexperimental value by about 15% (20%) and that of the ∆ mass by about 15% (4%): Evenwhen the systematic errors are included, the baryon masses at β = 6.0 do not agree withexperiment. In order to take the continuum limit of the nucleon mass and the ∆ mass, weneed data for a wider range of β with statistical and systematic errors much reduced. For themasses of excited states of the ρ meson and the nucleon, there exist two-mass fits which donot contradict with experiment, except for the case of the nucleon at β = 6.0. Although thisdoes not necessarily imply that the excited state masses appear consistent with experimentbecause two-mass fits are very unstable, the existence of such a fit consistent with experimentencourages us to perform more works in this direction.
Determination of meson decay constants is usually accompanied by uncertainties of renor-malization constants. One can in principle employ any renormalization constant such as thatdetermined by naive perturbation theory or tadpole improved perturbation theory. We haveindeed shown that when we use renormalization constants given by tadpole improved per-turbation theory, although the decay constants for the φ, ρ, K and π mesons are in generaloff experiment at finite lattice spacing, for example, by 30 — 40% at mρa = 0.33 — 0.40 inthe case of the Fφ, they approach in the continuum limit toward values consistent with theexperimental values.
It is, however, desirable to employ a renormalization constant which gives weak a de-pendence for the decay constants. We have shown that when we use the renormalizationconstants determined by Monte Carlo simulations, the vector meson decay constants attwo β’s remarkably agree with each other and reproduce the experimental values withinthe errors for a wide range of the quark mass with the chiral limit included. This impliesa strong advantage to apply renormalization constants determined nonperturbatively. Forpseudo-scaler mesons, however, we find that although the decay constant fMC
PS in the chirallimit agrees with the experimental value of fπ albeit with large errors, it differs from theexperimental value of fK by about 20% at mρa = 0.33. This discrepancy might be due tosystematic errors in the numerical calculation of ZA. These results imply the importance ofmore systematic nonperturbative determination of the renormalization constants for variousmeson decays.
Numerical simulations are performed under the QCDPAX project which is supported
16

by the Grants-in-Aid of Ministry of Education, Science and Culture (Nos. 62060001 and02402003). Analyses of data are also supported in part by the Grants-in-Aid of Ministry ofEducation, Science and Culture (Nos. 07NP0401, 07640375 and 07640376).
Note Added
After this work was completed, three groups have reported results of high statistics studiesof the hadron spectrum [26, 27, 28] at β = 6.0. Their results are consistent with ours.
References
[1] Y. Iwasaki and T. Yoshie, Phys. Lett. B216 (1989) 387; Y. Iwasaki, Nucl. Phys. B
(Proc. Suppl.) 9 (1989) 254.
[2] T. Yoshie, Y. Iwasaki and S. Sakai, Nucl. Phys. B (Proc. Suppl.) 17 (1990) 413.
[3] Ape Collaboration (P. Bacilieri et al.), Phys. Lett. B214 (1988) 115; Ape Collaboration(P. Bacilieri et al.), Nucl. Phys. B317 (1989) 509; Ape Collaboration (S. Cabasino et
al.), Nucl. Phys. B (Proc. Suppl.) 17 (1990) 431.
[4] QCDPAX Collaboration (Y. Iwasaki et al.), Nucl. Phys. B (Proc.Suppl.) 30 (1993) 397.
[5] QCDPAX Collaboration (Y. Iwasaki et al.), Nucl. Phys. B (Proc.Suppl.) 34 (1994) 354.
[6] Ape Collaboration (C. R. Allton et al.), Nucl. Phys. B (Proc.Suppl.) 34 (1994) 360.
[7] Ape Collaboration (S. Cabasino et al.), Phys. Lett. B258 (1991) 195.
[8] Ape Collaboration (M. Guagnelli et al.), Nucl. Phys. B378 (1992) 616.
[9] K. M. Bitar et al., Phys. Rev. D46 (1992) 2169.
[10] F .Butler, H. Chen, J. Sexton, A. Vaccarino and D. Weingarten, Nucl. Phys. B430
(1994) 179.
[11] T. Bhattacharya and R. Gupta, Nucl. Phys. B (Proc. Suppl.) 42 (1995) 935.
[12] UKQCD Collaboration (C. R. Allton et al.), Phys. Rev. D49 (1994) 474.
[13] D. Daniel et al., Phys. Rev. D46 (1992) 3130.
[14] Y. Iwasaki et al., Computer Physics Communications 49 (1988) 449; T. Shirakawa et
al., Proceedings of Supercomputing ’89 495, Reno, USA, Nov. 13-17, 1989; Y. Iwasaki et
al., Nucl. Phys. B (Proc. Suppl.) 17 (1990) 259.
[15] S. Ono, Phys. Rev. D17 (1978) 888.
[16] G. Martinelli and Y. C. Zhang, Phys. Lett. B123 (1983) 433.
17
[17] G. P. Lepage, Nucl. Phys. B (Proc.Suppl.) 26 (1992) 45; A. S. Kronfeld, Nucl. Phys. B
(Proc.Suppl.) 30 (1993) 445; P. B. Mackenzie, Nucl. Phys. B (Proc.Suppl.) 30 (1993)35.
[18] G. P. Lepage and P. B. Mackenzie, Phys. Rev. D48 (1993) 2250.
[19] A. X. El-Khadra et al., Phys. Rev. Lett. 69 (1992) 729.
[20] L. Maiani and G. Martinelli, Phys. Lett. B178 (1986) 265.
[21] F. Butler, H. Chen, J. Sexton, A. Vaccarino and D. Weingarten, Nucl. Phys. B421
(1994) 217.
[22] UKQCD Collaboration (C. R. Allton et al.), Phys. Rev. D47 (1993) 5128.
[23] UKQCD Collaboration (P. Lacock and C. Michael), Phys. Rev. D52 (1995) 5213.
[24] S. Sharpe, Phys. Rev. D41 (1990) 3233; Phys. Rev. D46 (1992) 3146.
[25] C. Bernard and M. Golterman, Phys. Rev. D46 (1992) 853.
[26] JLQCD Collaboration (S. Aoki et al.), Tsukuba preprint UTHEP-323 (hep-lat/9510013), to appear in the Proceedings of Lattice ’95.
[27] M. Gockeler et al., DESY preprint DESY 95-128 (hep-lat/9508004).
[28] T. Bhattacharya, R. Gupta, G. Kilcup and S. Sharpe, Los Alamos preprint LA-UR-95-2354 (hep-lat/9512021); T. Bhattacharya and R. Gupta, Los Alamos preprint LA-UR-95-2355 (hep-lat/9510044).
18
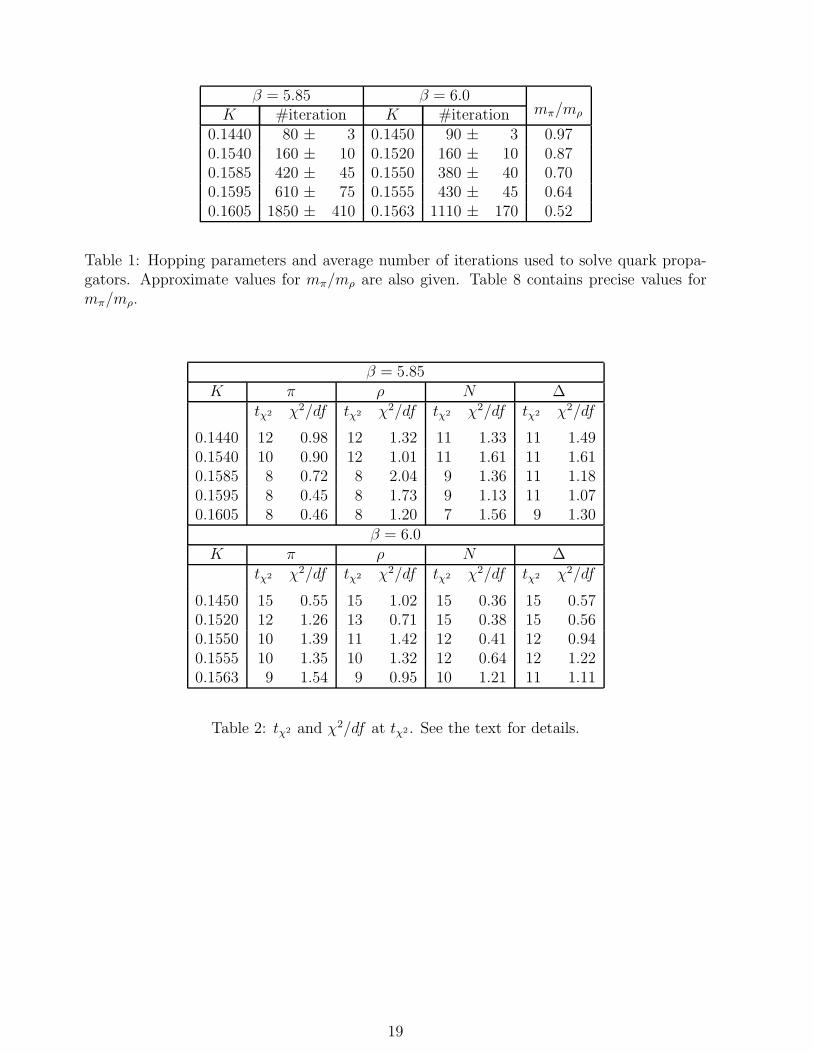
β = 5.85 β = 6.0mπ/mρK #iteration K #iteration
0.1440 80 ± 3 0.1450 90 ± 3 0.970.1540 160 ± 10 0.1520 160 ± 10 0.870.1585 420 ± 45 0.1550 380 ± 40 0.700.1595 610 ± 75 0.1555 430 ± 45 0.640.1605 1850 ± 410 0.1563 1110 ± 170 0.52
Table 1: Hopping parameters and average number of iterations used to solve quark propa-gators. Approximate values for mπ/mρ are also given. Table 8 contains precise values formπ/mρ.
β = 5.85K π ρ N ∆
tχ2 χ2/df tχ2 χ2/df tχ2 χ2/df tχ2 χ2/df
0.1440 12 0.98 12 1.32 11 1.33 11 1.490.1540 10 0.90 12 1.01 11 1.61 11 1.610.1585 8 0.72 8 2.04 9 1.36 11 1.180.1595 8 0.45 8 1.73 9 1.13 11 1.070.1605 8 0.46 8 1.20 7 1.56 9 1.30
β = 6.0K π ρ N ∆
tχ2 χ2/df tχ2 χ2/df tχ2 χ2/df tχ2 χ2/df
0.1450 15 0.55 15 1.02 15 0.36 15 0.570.1520 12 1.26 13 0.71 15 0.38 15 0.560.1550 10 1.39 11 1.42 12 0.41 12 0.940.1555 10 1.35 10 1.32 12 0.64 12 1.220.1563 9 1.54 9 0.95 10 1.21 11 1.11
Table 2: tχ2 and χ2/df at tχ2 . See the text for details.
19
β = 5.85 β = 6.0K mπ χ2/df K mπ χ2/df
0.1440 1.0293(12)+2−2 13.7/14 0.1450 0.8069(7)+0
−2 6.1/110.1540 0.6122(11)+3
−6 10.9/14 0.1520 0.4772(9)+9−2 11.5/11
0.1585 0.3761(12)+8−4 7.4/14 0.1550 0.2967(15)+18
−5 14.1/110.1595 0.3088(14)+6
−6 5.8/14 0.1555 0.2588(16)+18−6 17.0/11
0.1605 0.2226(21)+10−7 6.0/14 0.1563 0.1847(27)+20
−6 20.9/11
Table 3: Pion masses in lattice units. In parentheses are errors estimated by the jack-knifemethod. Errors given in the form +upper
−lower are for the fitting range dependent upper/lowerbound.
β = 5.85 β = 6.0K mρ χ2/df K mρ χ2/df
0.1440 1.0598(15)+4−1 18.5/14 0.1450 0.8370(9)+2
−4 11.2/110.1540 0.6931(27)+3
−11 14.2/14 0.1520 0.5486(15)+9−11 6.6/11
0.1585 0.5294(69)+115−100 28.9/14 0.1550 0.4218(42)+75
−73 14.3/110.1595 0.4856(96)+176
−123 23.2/14 0.1555 0.3982(61)+135−90 12.4/11
0.1605 0.434(20)+21−24 14.6/14 0.1563 0.353(15)+28
−11 7.6/11
Table 4: The same as table 3 for the ρ meson.
K=0.155π ρ N ∆
This work 243 × 54 0.2967(15) 0.4218(42) 0.6440(85) 0.728(11)Ape 243 × 32 [7] 0.298(2) 0.429(3) 0.647(6) 0.745(15)Ape 183 × 64 [6] smear 0.297(2) 0.430(10)
local 0.297(2) 0.428(8)LANL 323 × 64 [11] 0.297(1) 0.422(3) 0.641(4) 0.706(8)
K=0.1563π ρ N ∆
This work 243 × 54 0.1847(27) 0.353(15) 0.536(30) 0.670(53)Ape 243 × 32 [7] 0.184(3) 0.377(8) 0.522(14) 0.636(45)LANL 323 × 64 [11] 0.185(1) 0.363(9) 0.540(12) 0.631(27)
Table 5: Comparison of hadron masses in lattice units at β = 6.0, K = 0.155 and 0.1563.
20

β = 5.85 β = 6.0K mN χ2/df K mN χ2/df
0.1440 1.6961(50)+7−18 15.8/13 0.1450 1.3225(28)+15
−2 3.8/100.1540 1.1060(55)+15
−94 22.3/13 0.1520 0.8669(49)+19−3 4.2/10
0.1585 0.815(13)+13−33 17.5/13 0.1550 0.6440(85)+53
−12 3.8/100.1595 0.744(17)+12
−36 18.1/13 0.1555 0.6007(109)+84−7 6.2/10
0.1605 0.683(48)+10−82 23.4/13 0.1563 0.536(30)+58
−0 15.7/10
Table 6: Nucleon masses in lattice units. In parentheses are errors estimated by the jack-knifemethod. Errors given in the form +upper
−lower are for the fitting range dependent upper/lowerbound.
β = 5.85 β = 6.0K m∆ χ2/df K m∆ χ2/df
0.1440 1.7124(57)+21−25 17.7/13 0.1450 1.3404(29)+22
−1 6.2/100.1540 1.1629(67)+37
−15 20.3/13 0.1520 0.9112(41)+51−0 6.0/10
0.1585 0.9011(153)+83−57 16.5/13 0.1550 0.7278(109)+188
−0 12.1/100.1595 0.825(21)+16
−37 15.1/13 0.1555 0.7001(159)+336−10 15.3/10
0.1605 0.755(53)+67−78 19.4/13 0.1563 0.670(53)+61
−41 9.0/10
Table 7: The same as table 6 for the ∆ baryon.
β = 5.85 β = 6.0K mπ/mρ mN/mρ K mπ/mρ mN/mρ
0.1440 0.9712(8) 1.6004(45) 0.1450 0.9641(5) 1.5801(25)0.1540 0.8833(32) 1.5956(82) 0.1520 0.8699(21) 1.5802(79)0.1585 0.7104(90) 1.540(29) 0.1550 0.7033(69) 1.527(21)0.1595 0.636(12) 1.531(42) 0.1555 0.650(10) 1.509(31)0.1605 0.513(25) 1.57(12) 0.1563 0.523(23) 1.52(10)
Table 8: Mass ratios mπ/mρ and mN/mρ. The errors quoted are statistical only and areestimated by the jack-knife method.
21
ρ meson nucleonβ comment ratio comment ratio
This work 5.85 tmin=5 2.47(16) tmin = 6 1.64(12)tmin=6 1.87(24) tmin = 7 1.29(10)
6.0 tmin=8 2.21(27) tmin = 7 1.81(10)tmin=9 1.58(26)
Ape [7] 6.0 2.13(21) 2.13(4)UKQCD [22] 6.2 2.53(16) 2.01(16)APE [8] 6.3 1.93(10) 1.93(12)UKQCD [23] 6.2 Clover 2.23(14)QCDPAX [5] 6.0 point 1.99(15) point 1.55(20)
wall 1.70(26) wall 1.47(21)experimental value 1.65
Table 9: Ratios of the excited state mass to the ground state mass. We have taken the quarkmass corresponding approximately to the strange quark mass.
β = 5.85 β = 6.0a0 a1 χ2/df a0 a1 χ2/df
m2π −7.18(4) 1.16(1) 0.56 −6.51(6) 1.02(1) 1.06
mρ −6.16(37) 1.06(6) 1.76 −6.50(39) 1.07(6) 1.20mN −10.87(51) 1.85(8) 0.37 −12.97(79) 2.11(12) 0.05m∆ −11.37(80) 1.95(13) 0.05 −8.4(1.3) 1.42(21) 0.29
Table 10: Fit parameters of the linear fits to the masses at the largest three K’s. Errors ona0 and a1 are those from least mean square fits.
β = 5.85value err-lms err-jack jack/lms
Kc 0.161624 0.000027 0.000033 1.2mρ(Kc) 0.400 0.010 0.021 2.1mN(Kc) 0.589 0.014 0.036 2.6m∆(Kc) 0.664 0.022 0.063 2.9
β = 6.0value err-lms err-jack jack/lms
Kc 0.157096 0.000038 0.000028 0.7mρ(Kc) 0.3309 0.0080 0.0114 1.4mN(Kc) 0.462 0.015 0.024 1.6m∆(Kc) 0.605 0.025 0.033 1.3
Table 11: Values of Kc and masses extrapolated to Kc determined from the linear fits to thedata at the largest three K’s. Errors obtained by least mean square fits (err-lms) and thoseby the jack-knife method (err-jack) together with their ratios (jack/lms) are also given.
22
β = 5.85 β = 6.0t0 mρ a−1 χ2/df t0 mρ a−1 χ2/df8 0.4359 1.766 36.90 11 0.3525 2.184 2.519 0.4213 1.828 11.17 12 0.3476 2.215 2.54
10 0.4196 1.835 14.80 13 0.3425 2.248 0.7711 0.4045 1.904 9.30 14 0.3409 2.259 3.9412 0.3998 1.926 1.76 15 0.3309 2.327 1.2013 0.3892 1.978 4.39 16 0.3248 2.370 0.1714 0.4081 1.887 1.36 17 0.3188 2.416 0.5815 0.3794 2.030 0.43 18 0.3112 2.474 0.0316 0.3728 2.066 0.11 19 0.3206 2.401 0.00
Table 12: Results of the linear fits to the ρ meson masses versus t0. The inverse latticespacing is defined by a−1 = 0.77GeV/mρ(Kc).
β = 5.85 β = 6.0t0 mρ a−1 χ2/df t0 mρ a−1 χ2/df12 0.3881 1.984 1.22 13 0.3413 2.256 0.7913 0.3767 2.044 4.02 14 0.3393 2.269 4.3314 0.3997 1.927 1.20 15 0.3253 2.367 0.9115 0.3641 2.115 0.21 16 0.3194 2.411 0.0716 0.3593 2.143 0.30 17 0.3116 2.471 0.41
18 0.3029 2.542 0.0019 0.3146 2.448 0.01
Table 13: Results of the quadratic fits to the ρ meson masses versus t0. The inverse latticespacing is defined by a−1 = 0.77GeV/mρ(Kc).
β = 5.85 β = 6.0t0 mN χ2/df t0 mN χ2/df9 0.6085 3.20 12 0.4828 0.03
10 0.6071 0.37 13 0.4802 0.2411 0.6039 0.83 14 0.4758 0.7912 0.5946 2.15 15 0.4759 1.8813 0.5893 0.37 16 0.4623 0.0514 0.5680 2.28 17 0.4538 2.0015 0.5501 1.59 18 0.4553 2.2816 0.5312 0.49 19 0.4731 0.1017 0.5630 2.55 20 0.4559 0.10
Table 14: Results of the linear fits to the nucleon masses versus t0.
23
β = 5.85 β = 6.0t0 m∆ χ2/df t0 m∆ χ2/df11 0.6982 0.03 12 0.6055 0.0112 0.6928 0.01 13 0.6059 4.1013 0.6640 0.05 14 0.6164 1.7814 0.6899 4.02 15 0.6279 0.5015 0.5375 34.96 16 0.6048 0.2916 0.4757 23.96 17 0.6206 0.12
18 0.6462 0.1719 0.5935 0.34
Table 15: Results of the linear fits to the ∆ masses versus t0.
K ZV
0.1440 0.5121(9)0.1540 0.5164(10)0.1585 0.5126(36)0.1595 0.5112(48)0.1605 0.5101(76)
Average 0.5125(30)
Table 16: Renormalization constants ZV for the local lattice current at β = 5.85 obtainedin a previous work [2].
β = 5.85 β = 6.0K F PT
V F TPV FMC
V K F PTV F TP
V FMCV
0.1440 0.2214 0.2600(33)+17−0 0.1374 0.1450 0.1753 0.1919(18)+5
−13 0.12100.1540 0.2211 0.2089(38)+5
−17 0.1372 0.1520 0.1673 0.1558(17)+14−19 0.1155
0.1585 0.2094 0.1781(68)+126−130 0.1299 0.1550 0.1544 0.1336(33)+65
−78 0.10650.1595 0.1996 0.1658(84)+162
−142 0.1239 0.1555 0.1493 0.1276(43)+106−88 0.1031
0.1605 0.1885 0.1528(152)+153−201 0.1170 0.1563 0.1382 0.1157(95)+181
−87 0.0953
Table 17: ρ meson decay constants in lattice units. In parentheses are errors estimated bythe jack-knife method. Errors given in the form +upper
−lower are for the fitting range dependentupper/lower bound.
24
β = 5.85 β = 6.0F TP
V FMCV F TP
V FMCV
t0 Latt. Phys. χ2/df Latt. Phys. χ2/df t0 Latt. Phys. χ2/df Latt. Phys. χ2/df
8 0.169 325 53.7 0.133 257 55.7 11 0.127 297 1.9 0.107 250 2.09 0.157 303 6.0 0.125 240 7.0 12 0.124 289 1.7 0.105 244 1.9
10 0.156 301 11.1 0.124 239 11.9 13 0.120 280 0.1 0.102 237 0.211 0.145 280 5.8 0.115 222 6.3 14 0.120 278 3.4 0.101 235 3.612 0.141 271 0.0 0.112 216 0.1 15 0.111 259 0.4 0.094 220 0.413 0.130 251 2.3 0.104 201 2.6 16 0.107 248 0.0 0.091 211 0.014 0.148 286 0.3 0.118 226 0.3 17 0.101 234 0.1 0.085 199 0.115 0.116 224 0.0 0.094 180 0.0 18 0.094 220 0.1 0.080 187 0.116 0.105 203 1.1 0.085 164 1.1 19 0.104 243 0.1 0.088 206 0.1
Table 18: Results of the linear fits to the ρ meson decay constants versus t0, in lattice unitsand in physical units (MeV).
β = 5.85 β = 6.0t0 = tmin = 12 t0 = tχ2 t0 = tmin = 15 t0 = tχ2
K mπ χ2/df tχ2 mπ χ2/df K mπ χ2/df tχ2 mπ χ2/df
0.1440 1.0299(14) 1.32 8 1.0304 1.68 0.1450 0.8059(9) 0.49 12 0.8068 1.060.1540 0.6106(21) 0.96 7 0.6117 1.18 0.1520 0.4747(14) 0.35 7 0.4767 0.910.1585 0.3753(34) 0.97 5 0.3774 1.41 0.1550 0.2937(24) 0.88 6 0.2967 0.890.1595 0.3070(42) 1.00 4 0.3097 1.45 0.1555 0.2559(30) 0.85 6 0.2593 0.830.1605 0.2127(64) 1.02 4 0.2175 1.31 0.1563 0.1804(66) 0.68 5 0.1897 0.75
Table 19: Pion masses determined from π propagators.
β = 5.85 β = 6.0K fPT
PS fTPPS K fPT
PS fTPPS fMC
PS
0.1440 0.1152 0.1443(25)+12−5 0.1450 0.0892 0.1030(10)+12
−0 0.07100.1540 0.0922 0.0929(22)+10
−1 0.1520 0.0713 0.0701(11)+18−0 0.0567
0.1585 0.0732 0.0664(26)+12−14 0.1550 0.0566 0.0517(13)+16
−10 0.04500.1595 0.0677 0.0600(30)+19
−15 0.1555 0.0535 0.0482(15)+15−15 0.0426
0.1605 0.0597 0.0515(33)+32−9 0.1563 0.0462 0.0408(26)+30
−23 0.0368
Table 20: Pseudo-scalar meson decay constants in lattice units. In parentheses are errorsestimated by the jack-knife method. Errors given in the form +upper
−lower are for the fitting rangedependent upper/lower bound.
25
1 5 9 13 17 21 25NB
0.0
0.2
0.4
0.6
0.8
1.0
1.2
1.4
1.6
1.8
2.0
∆mef
f(NB)/
∆mef
f(NB=
1)
t=12t=16t=20t=24
ρ meson
β=6.0 K=0.155
Figure 1: Statistical errors in effective masses for the ρ meson at β = 6.0, K = 0.155 versusthe bin size NB. The errors are normalized by those for NB = 1.
0 50 100 150 200N
1.0
2.0
3.0
4.0
∆mef
f(N)/
∆mef
f(N=
Nco
nf)
theoreticalt=12t=16t=20t=24
ρ meson
β=6.0 K=0.155
Figure 2: Statistical errors in effective masses for the ρ meson at β = 6.0, K = 0.155 versusthe number of configurations N . The errors are normalized by those for N = Nconf = 200.
26
0 5 10 15 20 25 30t
0.290
0.295
0.300
0.305
0.290
0.295
0.300
0.305
0.00.51.01.52.02.5
tχ2
meff
mfit
χ2/df
Figure 3: Fitted mass mfit for the pion at β = 6.0, K = 0.155, obtained from one-mass fitto a range t — T/2 and the value of χ2/df of the fit versus t. The error bars for mfit arestatistical uncertainties estimated by the least mean square fit. Effective masses meff witherrors estimated by the jack-knife method are also given.
27
0 5 10 15 20 25 30t
0.390
0.400
0.410
0.420
0.430
0.440
0.450
0.390
0.400
0.410
0.4200.430
0.440
0.450
0.00.51.01.52.02.5
tχ2
meff
mfit
χ2/df
Figure 4: The same as Fig. 3 for the ρ meson.
28
0 5 10 15 20 25 30t
0.600
0.620
0.640
0.660
0.680
0.600
0.620
0.640
0.660
0.680
0.00.51.01.52.02.5
tχ2
meff
mfit
χ2/df
Figure 5: The same as Fig. 3 for the nucleon.
29

1.025
1.030
1.035
1.040
1.045
K=0.1440
tχ2
0.600
0.610
0.620
K=0.1540tχ2
0.370
0.380
0.390K=0.1585
tχ2
0.300
0.310
0.320
K=0.1595tχ2
0 5 10 15 20 25 30t
0.210
0.220
0.230
0.240K=0.1605
tχ2
a)
0.800
0.805
0.810
0.815K=0.1450
tχ2
0.470
0.475
0.480
0.485K=0.1520
tχ2
0.290
0.295
0.300
0.305K=0.1550
tχ2
0.250
0.255
0.260
0.265K=0.1555
tχ2
0 5 10 15 20 25 30t
0.175
0.185
0.195
K=0.1563tχ2
b)
Figure 6: Effective masses for the pion: a) β = 5.85, b) β = 6.0. The result of one-mass fit isreproduced by the solid line, dotted lines and dashed lines for the fitted mass, its statisticalerror and systematic upper/lower bounds, respectively.
30
1.050
1.060
1.070
1.080
K=0.1440
tχ2
0.680
0.690
0.700
0.710K=0.1540
tχ2
0.450
0.490
0.530
0.570 K=0.1585
tχ2
0.400
0.440
0.480
0.520
0.560K=0.1595
tχ2
0 5 10 15 20 25 30t
0.200
0.300
0.400
0.500
0.600
K=0.1605
tχ2
a)
0.830
0.835
0.840
0.845
0.850
K=0.1450tχ2
0.540
0.550
0.560
K=0.1520
tχ2
0.390
0.410
0.430
0.450 K=0.1550
tχ2
0.370
0.390
0.410
0.430 K=0.1555
tχ2
0 5 10 15 20 25 30t
0.250
0.290
0.330
0.370
K=0.1563
tχ2
b)
Figure 7: The same as Fig. 6 for the ρ meson: a) β = 5.85, b) β = 6.0.
31
1.660
1.680
1.700
1.720
1.740
K=0.1440
tχ2
1.070
1.090
1.110
1.130
1.150 K=0.1540
tχ2
0.720
0.770
0.820
0.870K=0.1585
tχ2
0.650
0.700
0.750
0.800K=0.1595
tχ2
0 5 10 15 20 25 30t
0.550
0.650
0.750
0.850
K=0.1605
tχ2
a)
1.300
1.320
1.340
1.360 K=0.1450tχ2
0.850
0.860
0.870
0.880
0.890 K=0.1520tχ2
0.620
0.640
0.660
0.680K=0.1550
tχ2
0.570
0.590
0.610
0.630
0.650 K=0.1555
tχ2
0 5 10 15 20 25 30t
0.450
0.490
0.530
0.570
0.610
K=0.1563
tχ2
b)
Figure 8: The same as Fig. 6 for the nucleon: a) β = 5.85, b) β = 6.0.
32
1.680
1.700
1.720
1.740
1.760
K=0.1440tχ2
1.120
1.140
1.160
1.180
1.200
1.220 K=0.1540tχ2
0.800
0.840
0.880
0.920
0.960
K=0.1585
tχ2
0.680
0.760
0.840
0.920
K=0.1595
tχ2
0 5 10 15 20 25 30t
0.300
0.500
0.700
0.900
1.100 K=0.1605
tχ2
a)
1.320
1.340
1.360
1.380 K=0.1450
tχ2
0.880
0.900
0.920
0.940K=0.1520
tχ2
0.650
0.690
0.730
0.770
K=0.1550
tχ2
0.650
0.690
0.730
0.770 K=0.1555
tχ2
0 5 10 15 20 25 30t
0.550
0.590
0.630
0.670
0.710
0.750
K=0.1563
tχ2
b)
Figure 9: The same as Fig. 6 for the ∆ baryon: a) β = 5.85, b) β = 6.0.
33
0.0 0.2 0.4 0.6 0.8 1.0(mπ/mρ)
2
1.20
1.30
1.40
1.50
1.60
1.70
1.80
mN/m
ρ
β=5.85β=6.0
Figure 10: Nucleon to ρ mass ratio versus pion to ρ mass ratio squared. The errors shownare statistical only. The solid curve is obtained from phenomenological mass formulae[15].The dotted line is obtained by assuming that mN/mρ and (mπ/mρ)
2 are linear in the quarkmass. The experimental value is marked with a star.
34
2 3 4 5 6 7 8 9 10tmin
0.35
0.40
0.45
0.50
0.55
0.60
m0
0.4
0.6
0.8
1.0
1.2
1.4
m1
0
1
2
3
4
χ2 /df
Figure 11: Masses of the ground state and the excited state for the ρ meson at β = 5.85,K = 0.1585 together with the value of χ2/df of the two-mass fits versus tmin. The errorbars are statistical uncertainties estimated by the least mean square fit. The result of theone-mass fit is reproduced by the solid line, dotted lines and dashed lines for the fitted mass,its statistical error and systematic upper/lower bounds, respectively. Note the difference inthe scale of the plots for m0 and m1.
35
3 4 5 6 7 8 9 10 11 12 13tmin
0.36
0.38
0.40
0.42
0.44
m0
0.4
0.6
0.8
1.0
1.2
m1
0
1
2
3
4χ/
df
Figure 12: The same as Fig. 11 for the ρ meson at β = 6.0, K = 0.155.
36
2 3 4 5 6 7 8 9 10tmin
0.65
0.70
0.75
0.80
0.85
m0
0.8
1.0
1.2
1.41.6
1.8
2.0
m1
0
1
2
3
4χ2 /d
f
Figure 13: The same as Fig. 11 for the nucleon at β = 5.85, K = 0.1585.
37
3 4 5 6 7 8 9 10 11 12 13tmin
0.58
0.60
0.62
0.64
0.66
m0
0.7
0.9
1.1
1.3
m1
0
1
2
3
4χ2 /d
f
Figure 14: The same as Fig. 11 for the nucleon at β = 6.0, K = 0.155.
38
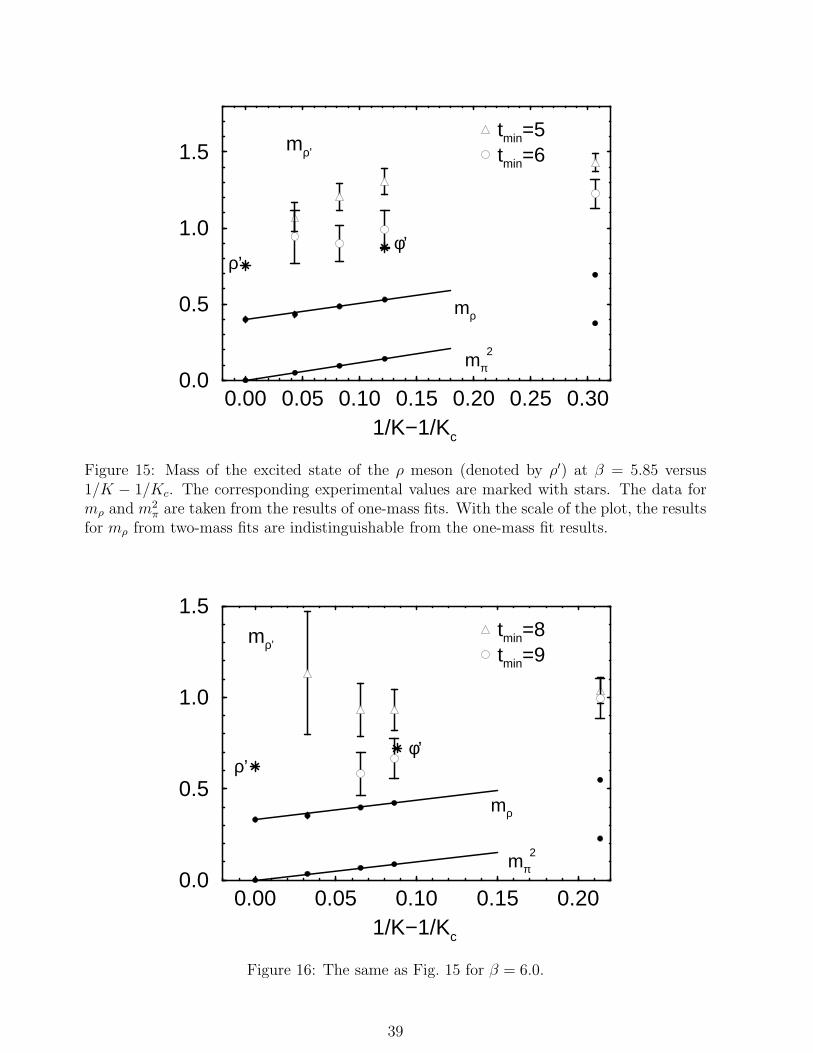
0.00 0.05 0.10 0.15 0.20 0.25 0.301/K−1/Kc
0.0
0.5
1.0
1.5tmin=5tmin=6
mπ2
mρ
mρ’
ρ’φ’
Figure 15: Mass of the excited state of the ρ meson (denoted by ρ′) at β = 5.85 versus1/K − 1/Kc. The corresponding experimental values are marked with stars. The data formρ and m2
π are taken from the results of one-mass fits. With the scale of the plot, the resultsfor mρ from two-mass fits are indistinguishable from the one-mass fit results.
0.00 0.05 0.10 0.15 0.201/K−1/Kc
0.0
0.5
1.0
1.5tmin=8tmin=9
mπ2
mρ
mρ’
ρ’φ’
Figure 16: The same as Fig. 15 for β = 6.0.
39

0.00 0.05 0.10 0.15 0.20 0.25 0.301/K−1/Kc
0.0
0.5
1.0
1.5 tmin=6tmin=7
mπ2
mρ
mN
mN’
N
N’
Figure 17: Mass of excited state of the nucleon (denoted by N ′) at β = 5.85 versus1/K−1/Kc. The experimental values for masses of the nucleon (N) and its excited state (N ′)are marked with stars. The data for mN , mρ and m2
π are taken from the results of one-massfits. With the scale of the plot, the results for mN from two-mass fits are indistinguishablefrom the one-mass fit results.
0.00 0.05 0.10 0.15 0.201/K−1/Kc
0.0
0.5
1.0
1.5
tmin=7
mπ2
mρ
mN
mN’
N
N’
Figure 18: The same as Fig. 17 for β = 6.0.
40

0.00 0.05 0.10 0.15 0.20 0.25 0.301/K−1/Kc
0.0
0.2
0.4
0.6
0.8
1.0
1.2
mπ2
mρ
mN
m∆
Figure 19: Linear extrapolations of hadron masses at β = 5.85 to the chiral limit. The opencircles at zero quark mass are extrapolated values. The errors shown are statistical only, anddo not include the systematic errors discussed in the text.
0.00 0.05 0.10 0.15 0.201/K−1/Kc
0.0
0.2
0.4
0.6
0.8
1.0
mπ2
mρ
mN
m∆
Figure 20: The same as Fig. 19 for β = 6.0.
41
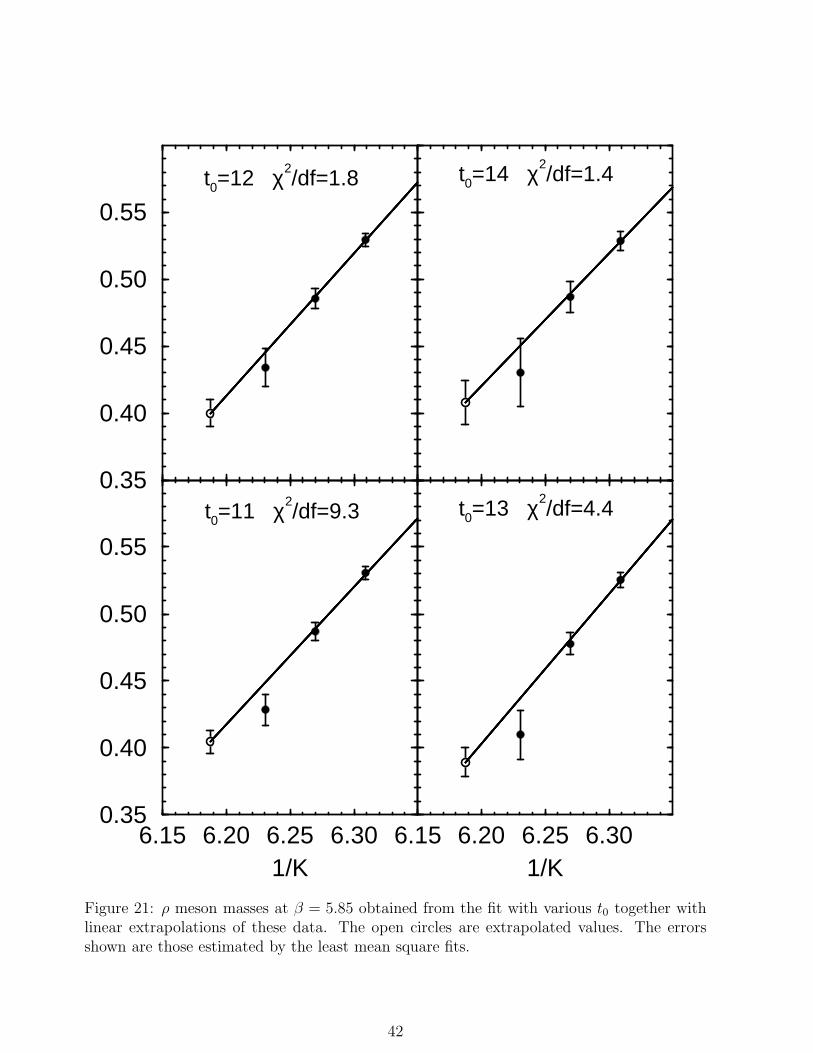
6.15 6.20 6.25 6.301/K
0.35
0.40
0.45
0.50
0.55
0.35
0.40
0.45
0.50
0.55
6.15 6.20 6.25 6.301/K
t0=11 χ2/df=9.3
t0=12 χ2/df=1.8
t0=13 χ2/df=4.4
t0=14 χ2/df=1.4
Figure 21: ρ meson masses at β = 5.85 obtained from the fit with various t0 together withlinear extrapolations of these data. The open circles are extrapolated values. The errorsshown are those estimated by the least mean square fits.
42

6.35 6.40 6.451/K
0.30
0.35
0.40
0.45
0.30
0.35
0.40
0.45
6.35 6.40 6.451/K
t0=14 χ2/df=3.9
t0=15 χ2/df=1.2
t0=16 χ2/df=0.2
t0=17 χ2/df=0.6
Figure 22: The same as Fig. 21 but for β = 6.0.
43
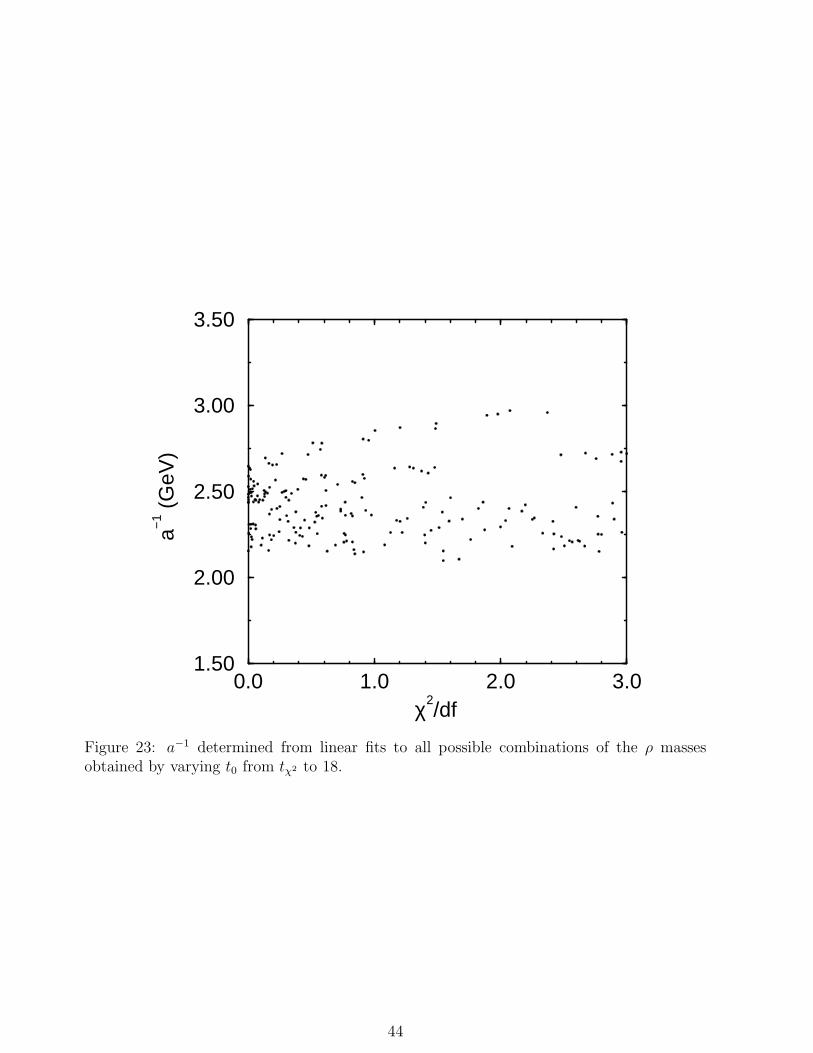
0.0 1.0 2.0 3.0χ2
/df
1.50
2.00
2.50
3.00
3.50
a−1 (
GeV
)
Figure 23: a−1 determined from linear fits to all possible combinations of the ρ massesobtained by varying t0 from tχ2 to 18.
44
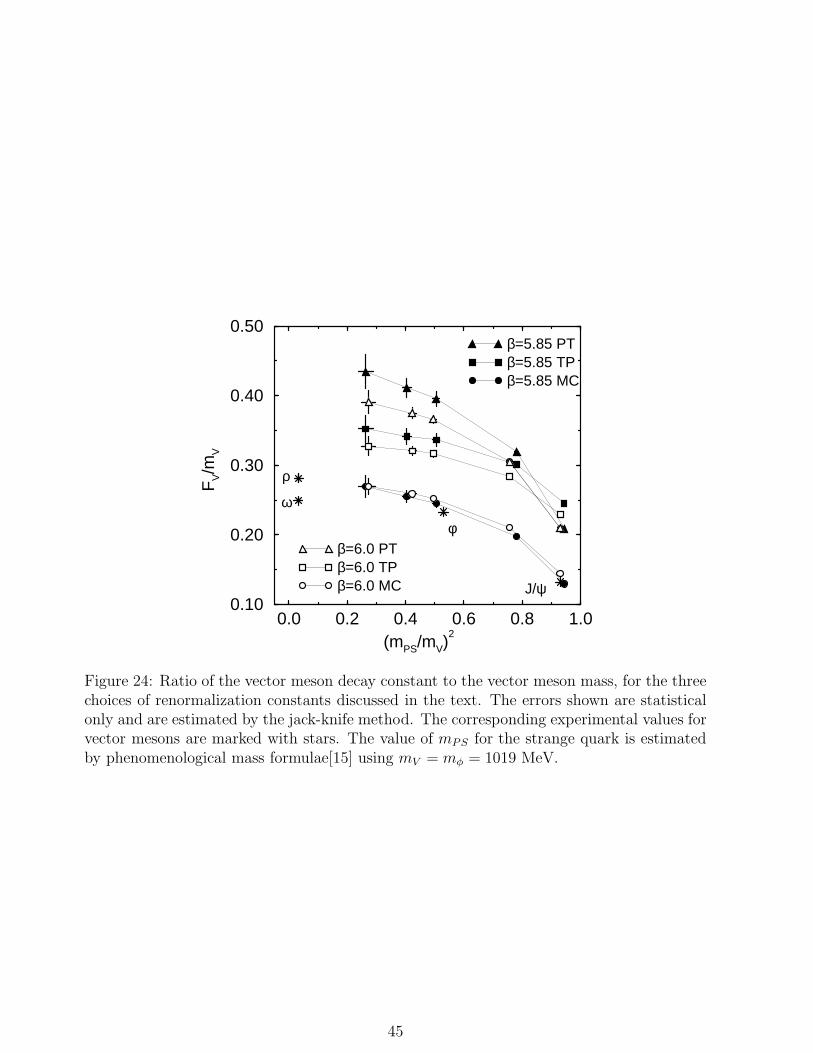
β=5.85 PTβ=5.85 TPβ=5.85 MC
0.0 0.2 0.4 0.6 0.8 1.0(mPS/mV)
2
0.10
0.20
0.30
0.40
0.50
FV/m
V
β=6.0 PTβ=6.0 TPβ=6.0 MC
ρ
ω
φ
J/ψ
Figure 24: Ratio of the vector meson decay constant to the vector meson mass, for the threechoices of renormalization constants discussed in the text. The errors shown are statisticalonly and are estimated by the jack-knife method. The corresponding experimental values forvector mesons are marked with stars. The value of mPS for the strange quark is estimatedby phenomenological mass formulae[15] using mV = mφ = 1019 MeV.
45
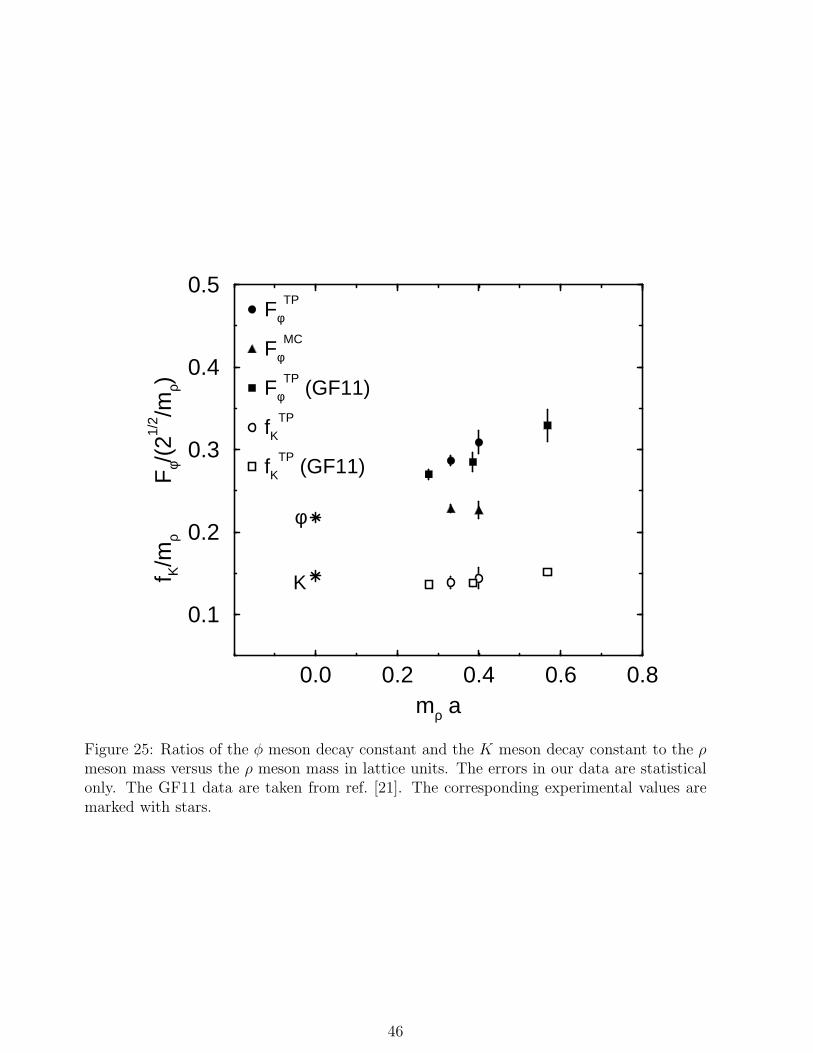
0.0 0.2 0.4 0.6 0.8mρ a
0.1
0.2
0.3
0.4
0.5
f K/m
ρ
F
φ/(2
1/2 /m
ρ)
FφTP
FφMC
FφTP
(GF11)
fK
TP
fK
TP (GF11)
φ
K
Figure 25: Ratios of the φ meson decay constant and the K meson decay constant to the ρmeson mass versus the ρ meson mass in lattice units. The errors in our data are statisticalonly. The GF11 data are taken from ref. [21]. The corresponding experimental values aremarked with stars.
46
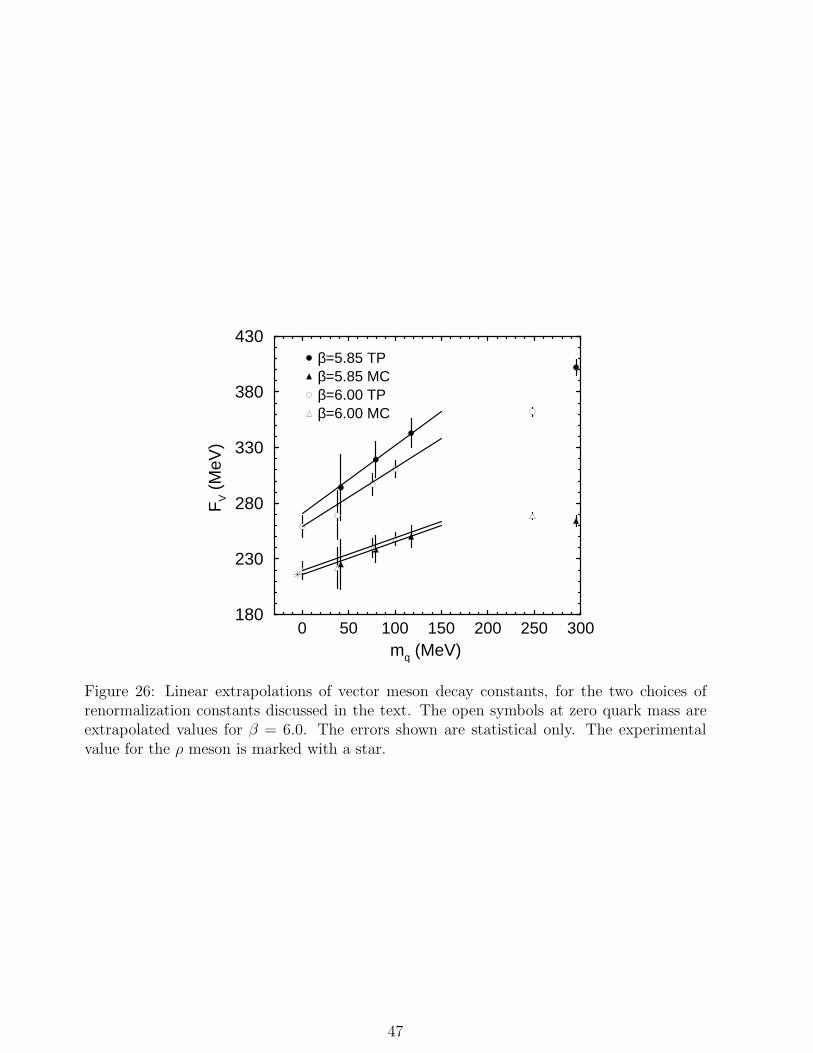
0 50 100 150 200 250 300mq (MeV)
180
230
280
330
380
430
FV (
MeV
)
β=5.85 TPβ=5.85 MCβ=6.00 TPβ=6.00 MC
Figure 26: Linear extrapolations of vector meson decay constants, for the two choices ofrenormalization constants discussed in the text. The open symbols at zero quark mass areextrapolated values for β = 6.0. The errors shown are statistical only. The experimentalvalue for the ρ meson is marked with a star.
47
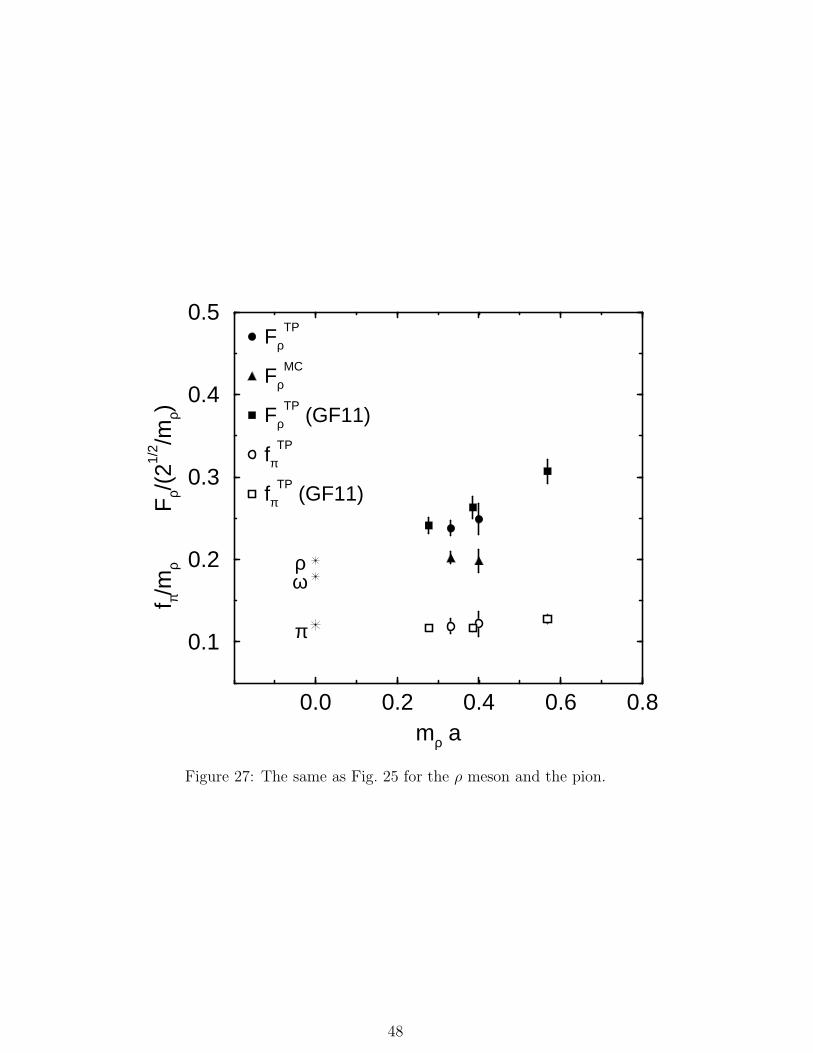
0.0 0.2 0.4 0.6 0.8mρ a
0.1
0.2
0.3
0.4
0.5
f π/m
ρ
F
ρ/(2
1/2 /m
ρ)
FρTP
FρMC
FρTP
(GF11)
fπTP
fπTP
(GF11)
ρω
π
Figure 27: The same as Fig. 25 for the ρ meson and the pion.
48
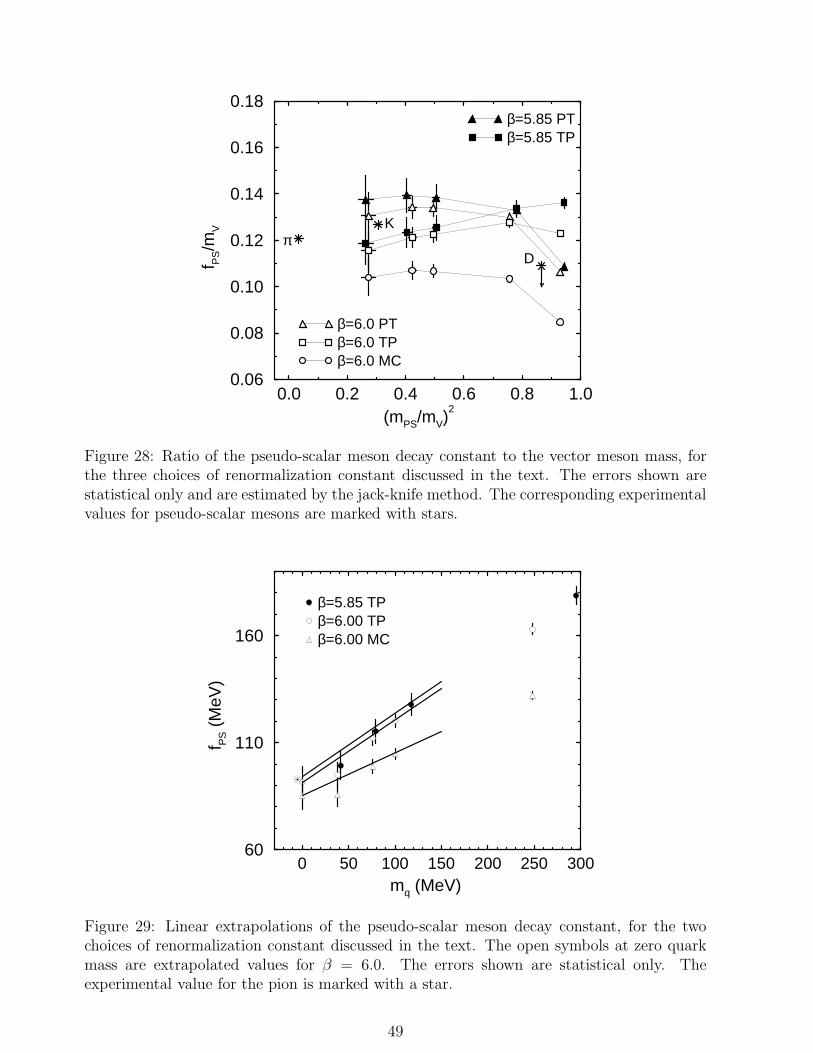
β=5.85 PTβ=5.85 TP
0.0 0.2 0.4 0.6 0.8 1.0(mPS/mV)
2
0.06
0.08
0.10
0.12
0.14
0.16
0.18
f PS/m
V
β=6.0 PTβ=6.0 TPβ=6.0 MC
πK
D
Figure 28: Ratio of the pseudo-scalar meson decay constant to the vector meson mass, forthe three choices of renormalization constant discussed in the text. The errors shown arestatistical only and are estimated by the jack-knife method. The corresponding experimentalvalues for pseudo-scalar mesons are marked with stars.
0 50 100 150 200 250 300mq (MeV)
60
110
160
f PS (
MeV
)
β=5.85 TPβ=6.00 TPβ=6.00 MC
Figure 29: Linear extrapolations of the pseudo-scalar meson decay constant, for the twochoices of renormalization constant discussed in the text. The open symbols at zero quarkmass are extrapolated values for β = 6.0. The errors shown are statistical only. Theexperimental value for the pion is marked with a star.
49
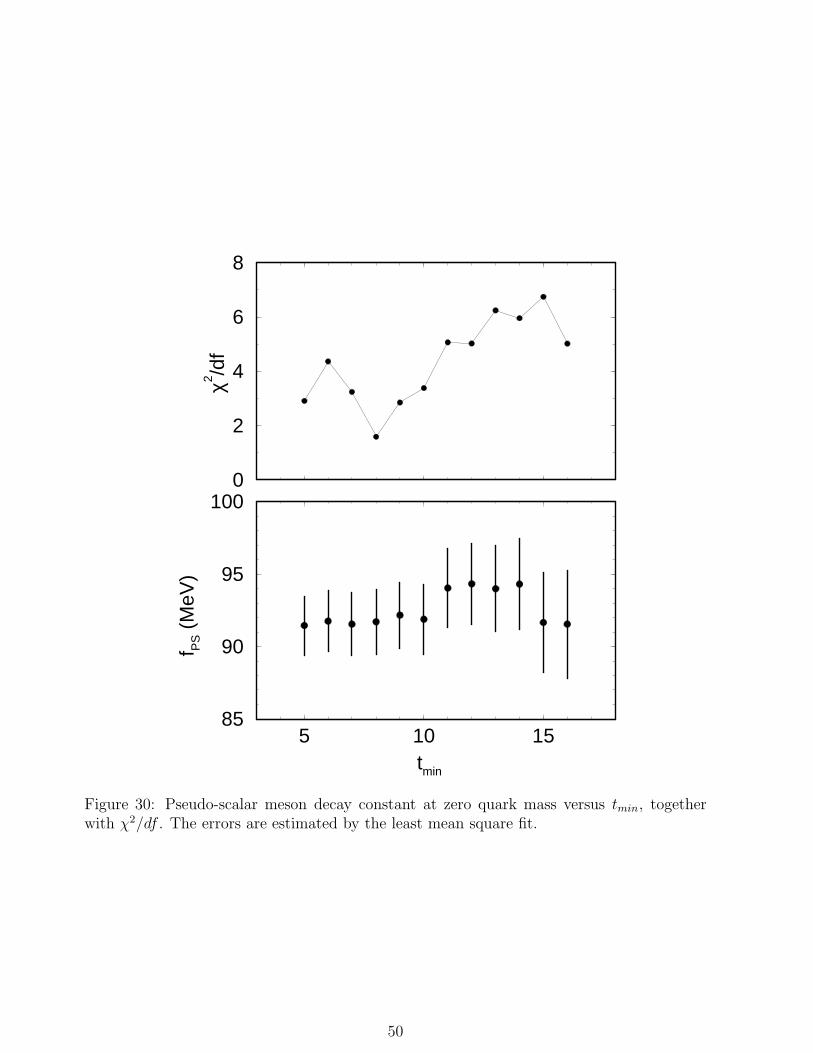
0
2
4
6
8
χ2 /df
5 10 15tmin
85
90
95
100
f PS (
MeV
)
Figure 30: Pseudo-scalar meson decay constant at zero quark mass versus tmin, togetherwith χ2/df . The errors are estimated by the least mean square fit.
50