Habitat use and home range size of red foxes in Prince Edward Island (Canada) based on snow-tracking...
12
Central European Journal of Biology Habitat use and home range size of red foxes in Prince Edward Island (Canada) based on snow-tracking and radio-telemetry data * E-mail: [email protected] Received 8 July 2007; Accepted 11 December 2008 Abstract: There is a lack of information regarding the ecology and behaviour of red foxes that can be used to elaborate effective management programs for this species on Prince Edward Island (Canada). The main goal of this study was to provide baseline information on habitat selection and home range size of red foxes on Prince Edward Island. Data were collected from snow-tracking and radio- telemetry sessions conducted in two study sites (including one site within Prince Edward Island National Park). Our results indicated that red foxes selected for roads and human-use areas during both the breeding and the kit-rearing seasons in the park. Outside the park, however, the data failed to conclusively show that foxes have a unique preference for human-use habitats or roads. Forests were selected against in both study sites. Although roads are frequently visited by foxes during the kit-rearing season in the park, each individual fox typically stays in this habitat only for short periods of time (< 15 min). This finding suggests that foraging efficiency along the roads is very high possibly reflecting the abundance of anthropogenic food sources. Overall, we present the largest amount of data on habitat selection ever collected for red foxes in Prince Edward Island, Canada. Our results show that food sources in human-use areas and roads are altering the selection and/or use of habitats of red foxes in some areas of Prince Edward Island. © Versita Warsaw and Springer-Verlag Berlin Heidelberg. Keywords: Anthropogenic resources • Canada • Canids • Habitat selection • Habitat use • Prince Edward Island • Red fox • Snow-tracking 1 Department of Biology, University of Prince Edward Island, Charlottetown, PE, Canada C1A 4P3 2 Department of Physics, University of Prince Edward Island, Charlottetown, PE, Canada C1A 4P3 Marina Silva 1* , Karen M. Johnson 1 , Sheldon B. Opps 2 Research Article 1. Introduction The red fox (Vulpes vulpes) was the largest mammalian carnivore on Prince Edward Island (PEI; Figure 1), until the arrival of coyotes (Canis latrans) during the early 80s [1]. Although no studies have assessed the abundance of red foxes on PEI, it is commonly known that they occur throughout the whole province. The red fox has been the subject of only one study on the island that focused on the reproductive success of red foxes using carcasses collected during eight hunting and trapping seasons [2]. Thus, there is no information regarding population size, home range size, habitat selection/use, location or density of dens, sex ratio, movement patterns or any other life history or ecological trait. Consequently, little is known about the behavior, ecology or population dynamics of red foxes in the province. This information is essential to elaborate an effective management program for this species on PEI. Human attitudes vary worldwide towards red foxes. In areas where they are potential carriers of the rabies virus, they are considered nuisance animals and are usually subject to population control even though these operations are generally unsuccessful (e.g. [3-4]). On PEI, red foxes are considered charismatic animals and Cent. Eur. J. Biol. • 4(2) • 2009 • 229–240 DOI: 10.2478/s11535-008-0061-2 229 - 10.2478/s11535-008-0061-2 Downloaded from PubFactory at 08/18/2016 03:39:38PM via free access
-
Upload
independent -
Category
Documents
-
view
2 -
download
0
Transcript of Habitat use and home range size of red foxes in Prince Edward Island (Canada) based on snow-tracking...

Central European Journal of Biology
Habitat use and home range size of red foxes in Prince Edward Island (Canada) based on snow-tracking and radio-telemetry data
* E-mail: [email protected]
Received 8 July 2007; Accepted 11 December 2008
Abstract:There is a lack of information regarding the ecology and behaviour of red foxes that can be used to elaborate effective management programs for this species on Prince Edward Island (Canada). The main goal of this study was to provide baseline information on habitat selection and home range size of red foxes on Prince Edward Island. Data were collected from snow-tracking and radio-telemetry sessions conducted in two study sites (including one site within Prince Edward Island National Park). Our results indicated that red foxes selected for roads and human-use areas during both the breeding and the kit-rearing seasons in the park. Outside the park, however, the data failed to conclusively show that foxes have a unique preference for human-use habitats or roads. Forests were selected against in both study sites. Although roads are frequently visited by foxes during the kit-rearing season in the park, each individual fox typically stays in this habitat only for short periods of time (< 15 min). This finding suggests that foraging efficiency along the roads is very high possibly reflecting the abundance of anthropogenic food sources. Overall, we present the largest amount of data on habitat selection ever collected for red foxes in Prince Edward Island, Canada. Our results show that food sources in human-use areas and roads are altering the selection and/or use of habitats of red foxes in some areas of Prince Edward Island.
© Versita Warsaw and Springer-Verlag Berlin Heidelberg.
Keywords: Anthropogenic resources • Canada • Canids • Habitat selection • Habitat use • Prince Edward Island • Red fox • Snow-tracking
1Department of Biology, University of Prince Edward Island, Charlottetown, PE, Canada C1A 4P3
2Department of Physics, University of Prince Edward Island, Charlottetown, PE, Canada C1A 4P3
Marina Silva1*, Karen M. Johnson1, Sheldon B. Opps2
Research Article
1. Introduction
The red fox (Vulpes vulpes) was the largest mammalian carnivore on Prince Edward Island (PEI; Figure 1), until the arrival of coyotes (Canis latrans) during the early 80s [1]. Although no studies have assessed the abundance of red foxes on PEI, it is commonly known that they occur throughout the whole province. The red fox has been the subject of only one study on the island that focused on the reproductive success of red foxes using carcasses collected during eight hunting and trapping seasons [2]. Thus, there is no information regarding
population size, home range size, habitat selection/use, location or density of dens, sex ratio, movement patterns or any other life history or ecological trait. Consequently, little is known about the behavior, ecology or population dynamics of red foxes in the province. This information is essential to elaborate an effective management program for this species on PEI. Human attitudes vary worldwide towards red foxes. In areas where they are potential carriers of the rabies virus, they are considered nuisance animals and are usually subject to population control even though these operations are generally unsuccessful (e.g. [3-4]). On PEI, red foxes are considered charismatic animals and
Cent. Eur. J. Biol. • 4(2) • 2009 • 229–240DOI: 10.2478/s11535-008-0061-2
229 - 10.2478/s11535-008-0061-2
Downloaded from PubFactory at 08/18/2016 03:39:38PMvia free access

Habitat use and home range size of red foxes in Prince Edward Island (Canada) based on snow-tracking and radio-telemetry data
many residents and tourists will feed them throughout the year. This human activity is particularly important in Prince Edward Island National Park (PEINP) where red foxes are fed by humans inhabiting houses or cottages located near the park, as well as by tourists on roadsides. The consequences of this human activity on habitat selection and movement patterns of red foxes on the island are unknown. According to Parks Canada, every year several red foxes are killed by vehicles along roads traversing PEINP (D. Lajeunesse, personal communication). For instance, 12 red foxes (adults and pups) were killed by vehicles in the park in 2003 alone. It has been postulated that because humans feed red foxes in the park, these animals tend to select road and human-use habitats, rather than natural habitats for foraging, thus increasing the probability of being killed by vehicles. However, reliable information on habitat selection and movement patterns of red foxes inhabiting the park, that could be used to evaluate this hypothesis, is lacking. The process of habitat selection in mammalian carnivores has increasingly been studied as a hierarchical, multi-scale process, in which selection of habitat features is accomplished at progressively smaller scales [5-7]. An organism selects a home range in which to live, and then it makes decisions about the use of different habitats within this home range in which fundamental activities such as foraging will be performed [8]. Rettie and Messier [7] proposed that animal selection patterns that are governed by an avoidance of factors that tend to limit individual fitness dominate at the larger spatial scales, while less important limiting factors influence habitat selection patterns at smaller spatial scales. Consequently, we predict that factors such as prey or food availability will influence red fox habitat selection patterns on PEI at the coarsest spatial scale. At smaller spatial scales, we predict that patterns of habitat selection will be influenced by the presence and availability of den sites as well as the spatial distribution of important food resources. We provide baseline information on habitat selection patterns of red foxes occurring on PEI. In particular, we examined habitat selection of foxes from snow-tracking data during the breeding season (January-March) by comparing use and availability of habitat cover-types within two sites in central PEI. This analysis was complemented with an analysis on home range and habitat selection during the kit-rearing season (April-September) using radio-telemetry data. Second, we explored the importance of human-use where fox-feeding takes place. This study represents the first attempt to provide quantitative information on the selection or use of human-use areas where fox-feeding takes place.
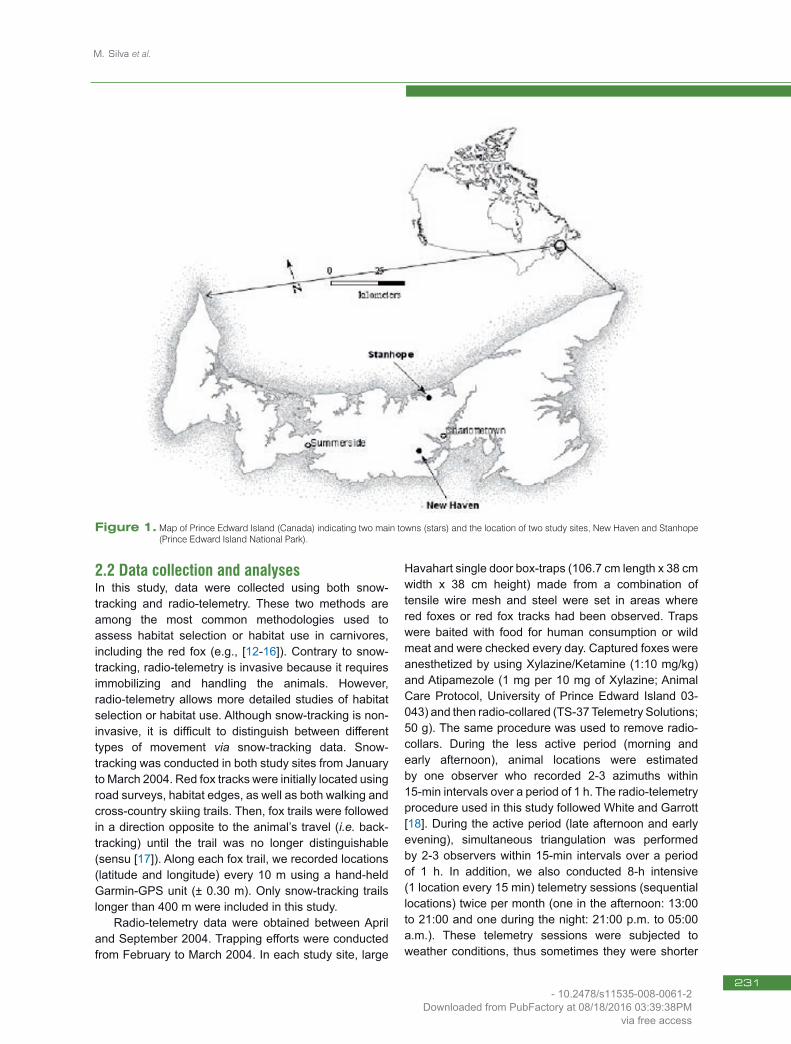
2. Experimental Procedures2.1 Study areaPEI is situated in the Gulf of the St. Lawrence and encompasses an area of about 5,660 km2 [9]. Anthropogenic activities such as urbanization, forestry, and agriculture have altered the natural habitats of PEI since the arrival of European colonizers about three centuries ago. Prior to the 17th century, PEI was covered by tree species characteristic of the Acadian Forest region such as sugar maple (Acer saccharum), yellow birch (Betula alleghaniensis) and beech (Fagus grandifolia) [10]. Although the peak of deforestation occurred in the early 1900s, the region has been under intensive exploitation for agriculture during the last century [11]. Currently, the forests of PEI are composed of species such as white spruce (Picea glauca), balsam fir (Abies balsamea), and trembling aspen (Populus tremuloides) [10]. Today, the economy of the island is largely driven by the agricultural industry, with about 45% of the province being forested [10]. In addition, during the last century, increased human presence has modified the landscapes of the province and has altered the abundance and distribution of resources for wildlife. Two sites that varied in terms of both the human-dwelling density and fox-feeding intensity were selected for this study (Figure 1). The study sites were also chosen because they provided an appropriate representation of habitat types available to red foxes in PEI. The first study site was located in Stanhope (543 ha; 46°25’E; 63°06’N), Prince Edward Island National Park (PEINP). Although situated within the park, Stanhope is surrounded by private houses and cottages, many of them inhabited throughout the whole year. Thus, this site also represents many other semi-residential areas on PEI where fox populations are in relatively close contact with humans. This site encompasses forest patches, marshes, shrubs, ponds, dunes, beaches, roads, agricultural fields, and human-use areas (about 0.30 human dwellings per ha). Although we do not possess quantitative data regarding fox-feeding intensity in Stanhope, anecdotal information and personal observations clearly indicate that fox-feeding is a common activity in Stanhope, with residents setting out food for foxes throughout the whole year and many tourists feeding these animals during the summer months. The second site used in this study was New Haven (216 ha; 46°12’E; 63°18’N) with approximately 0.14 human dwellings per ha. This site includes forest patches, abandoned fields, marshes, agricultural fields, roads, human-use areas, and a river (delimiting the southern portion of the site). Anecdotal information and personal observations indicate that there is very little fox-feeding in New Haven.
230 - 10.2478/s11535-008-0061-2
Downloaded from PubFactory at 08/18/2016 03:39:38PMvia free access
M. Silva et al.
2.2 Data collection and analysesIn this study, data were collected using both snow-tracking and radio-telemetry. These two methods are among the most common methodologies used to assess habitat selection or habitat use in carnivores, including the red fox (e.g., [12-16]). Contrary to snow-tracking, radio-telemetry is invasive because it requires immobilizing and handling the animals. However, radio-telemetry allows more detailed studies of habitat selection or habitat use. Although snow-tracking is non-invasive, it is difficult to distinguish between different types of movement via snow-tracking data. Snow-tracking was conducted in both study sites from January to March 2004. Red fox tracks were initially located using road surveys, habitat edges, as well as both walking and cross-country skiing trails. Then, fox trails were followed in a direction opposite to the animal’s travel (i.e. back-tracking) until the trail was no longer distinguishable (sensu [17]). Along each fox trail, we recorded locations (latitude and longitude) every 10 m using a hand-held Garmin-GPS unit (± 0.30 m). Only snow-tracking trails longer than 400 m were included in this study. Radio-telemetry data were obtained between April and September 2004. Trapping efforts were conducted from February to March 2004. In each study site, large
Havahart single door box-traps (106.7 cm length x 38 cm width x 38 cm height) made from a combination of tensile wire mesh and steel were set in areas where red foxes or red fox tracks had been observed. Traps were baited with food for human consumption or wild meat and were checked every day. Captured foxes were anesthetized by using Xylazine/Ketamine (1:10 mg/kg) and Atipamezole (1 mg per 10 mg of Xylazine; Animal Care Protocol, University of Prince Edward Island 03-043) and then radio-collared (TS-37 Telemetry Solutions; 50 g). The same procedure was used to remove radio-collars. During the less active period (morning and early afternoon), animal locations were estimated by one observer who recorded 2-3 azimuths within 15-min intervals over a period of 1 h. The radio-telemetry procedure used in this study followed White and Garrott [18]. During the active period (late afternoon and early evening), simultaneous triangulation was performed by 2-3 observers within 15-min intervals over a period of 1 h. In addition, we also conducted 8-h intensive (1 location every 15 min) telemetry sessions (sequential locations) twice per month (one in the afternoon: 13:00 to 21:00 and one during the night: 21:00 p.m. to 05:00 a.m.). These telemetry sessions were subjected to weather conditions, thus sometimes they were shorter
Figure 1. Map of Prince Edward Island (Canada) indicating two main towns (stars) and the location of two study sites, New Haven and Stanhope (Prince Edward Island National Park).
231 - 10.2478/s11535-008-0061-2
Downloaded from PubFactory at 08/18/2016 03:39:38PMvia free access

Habitat use and home range size of red foxes in Prince Edward Island (Canada) based on snow-tracking and radio-telemetry data
than 8 h. Tracking was done on foot using hand-held Yagi antennas and portable receivers (R-1000; Communications Specialists, Inc.). Triangulation angles were maintained between 30° and 150° [19]. About 50% of radio-tracking locations were taken with the animal in view of the observers. Bearings were plotted immediately using LOAS 2.1 (Ecological Software Solutions 2003) to determine the accuracy of the locations. For the purposes of this study, we have not looked for statistical independence of locations [20-22], but for their biological independence, using a minimum time interval between successive locations long enough to allow any radio-collared animal to cross entirely its home range [23]. Habitat variables were determined using 2000 Prince Edward Island aerial photographs (1: 17500; Prince Edward Island Department of Agriculture and Forestry) of both Stanhope and New Haven sites, and complemented with field observations to update any land-cover changes. ArcView GIS (version 3.3; Environmental Systems Research Institute, Inc., ESRI) was used to map animal locations obtained from both snow-tracking and radio-telemetry monitoring sessions and to assign to each location a habitat cover-type. Habitat was classified into 1 of 10 cover-types: agriculture (hay fields and pasture), forest (mature white spruce and hardwood forest), water or aquatic systems (frozen during winter; including ponds and saltwater bodies), dunes, beach, roads (mostly paved), human-use areas (residential areas, recreational areas, parking lots), abandoned fields, marsh (flooded in winter), and shrubs. Habitat selection during the breeding season (January-March) was investigated using the snow-tracking data, while radio-telemetry data were used to examine habitat selection during the kit-rearing season (April-September). In both cases, habitat selection was examined by comparing use and availability of habitat types within a study area using the Neu Method [24]. The Neu method is a straightforward application of the χ2 goodness-of-fit test, and is usually used to compare observed counts of animals in each habitat with the counts expected if habitats were used in proportion to their availability. The method involves the calculation of confidence intervals (Bonferroni Z-statistic) around the expected proportions to determine whether the observed proportion of usage in each habitat is significantly different from expected. The usage of a particular habitat type was defined as the ratio between animal locations in each habitat type and the total number of locations recorded in the study area. Expected usage of a habitat type was defined as the ratio of the area of the particular habitat to the total area of the study site. The study-site area
was defined as the area contained within the outermost points of the snow-tracking trails recorded at a given study site. This corresponds to a design-1 analysis of habitat selection [25] because snow-tracking data were collected at the population level as individual animals were not identified. On the other hand, during the breeding season individuals could be identified using radio-telemetry (i.e., design-2; [25]), and so we defined the study-site area at two different spatial scales. The study-site area was defined at the home-range spatial scale using the smallest rectangle that included all 95% fixed-kernel home-ranges, and at the core-area spatial scale using the smallest rectangle that included all the 50% fixed-kernel home ranges (sensu [26]). ArcView GIS (version 3.3; ESRI) was used to calculate all the study site areas, as well as the availability of the different habitat types comprised within each study site. Our second approach to examine habitat selection patterns of red foxes during the breeding season consisted in subdividing each snow-tracking trail into segments of uninterrupted displacement (hereafter movement-segments) through a given habitat. We recognize that it is difficult to distinguish between different types of movement via snow-tracking data. For the purpose of this study, however, we have assumed that these movement-segments can represent the uninterrupted selection or use of a given habitat type along the total distance traveled by the animal. Only movement-segments of at least 100 m through a given habitat type were included in the analysis. To adjust for differences in length among snow-tracking trails, all movement-segments from a given snow-tracking trail were normalized to its total length. Analysis of variance (ANOVA) and Tukey multiple comparison tests were used to compare movement-segments within each site. Similarly, the trails obtained through the 8-h telemetry sessions were also analyzed in terms of distance moved within each habitat type. In addition, these trails were also examined in terms of occupation times within each habitat cover-type, since locations were recorded every 15 min. All variables were examined for normality using the Kolmogorov-Smirnov test and proper transformations or non-parametric tests were used if needed. Statistical analyses were conducted with SAS version 8.2, unless specified differently. Data on home-range size and core-areas were analyzed using the Animal Movement SA version 2.0 [27] in ArcView (version 3.3; ESRI). The minimum number of locations required to accurately assess the home-range size of each animal was estimated by plotting cumulative home-range sizes against the number of locations (i.e. asymptotic home-range; [28]). The minimum convex polygon (MCP; [29]) and the 95%
232 - 10.2478/s11535-008-0061-2
Downloaded from PubFactory at 08/18/2016 03:39:38PMvia free access

M. Silva et al.
fixed-kernel [30] methods were used to determine home-range areas. The 100% MCP was utilized because it is the most commonly reported method in the literature [31], and therefore allows for some comparison with other studies. The 95% fixed-kernel method, while not without problems, has shown the best performance in simulation trials of home-range estimators that also included MCP. The 50% fixed-kernel method was used to estimate the size and shape of the core-areas or centers of activity within home-ranges. Fixed-kernel analyses were performed with a bandwidth (h) calculated using least-squares cross validation [32-33]. The overlap area in home-ranges between two individuals was estimated using ArcView (version 3.3; ESRI).
3. Results
3.1 Breeding seasonA total of 14.2 km (25 trails) of red fox snow-tracking trails were collected in New Haven, while 15.2 km (24 trails) were collected in Stanhope. The length of snow-tracking trails varied between 460 m and 1052 m in New Haven (mean = 568 ± 137 m), and between 404 m and 1177 m in Stanhope (mean = 637 ± 227). Although there were differences in habitat composition, forest was the most abundant habitat type in both study sites, representing 50.4% in New Haven and 50.2% in Stanhope. Except for the abandoned field in Stanhope, red foxes traveled in all available habitat types in both study sites (Table 1).
HabitatObservations
(# locations)
Habitat Use proportion
Average SD
Expected Use proportion Preference1
New Haven
Agriculture 451 0.294 0.034 0.211 +
Abandoned Field 176 0.115 0.024 0.098 +
Human-use 67 0.044 0.015 0.032 +
Road 41 0.027 0.012 0.013 +
Marsh 141 0.092 0.022 0.064 +
Water 107 0.070 0.019 0.07 0
Forest 550 0.359 0.036 0.512 -
Stanhope
Dune 421 0.267 0.041 0.053 +
Human-use 311 0.197 0.037 0.113 +
Shrub 78 0.049 0.020 0.019 +
Agriculture 37 0.023 0.014 0.005 +
Beach 182 0.115 0.030 0.100 0
Marsh 136 0.086 0.026 0.108 0
Road 59 0.037 0.018 0.033 0
Forest 331 0.210 0.038 0.504 -
Water 22 0.014 0.011 0.061 -
Abandoned Field 0 0 0.004 -
Table 1. Comparisons of use and availability of various habitat types used by red foxes in both study sites based on snow-tracking data. Habitat types are shown in order of red fox preference.
Comparisons were made using the Neu Method and Bonferroni confidence intervals. 1Preference was determined with Bonferroni confidence intervals (α = 0.001) placed on use. ”+” indicates used more than expected; “-“ indicates used less than expected; “0” use according to availability or non-significant difference between expected and available.
233 - 10.2478/s11535-008-0061-2
Downloaded from PubFactory at 08/18/2016 03:39:38PMvia free access
Habitat use and home range size of red foxes in Prince Edward Island (Canada) based on snow-tracking and radio-telemetry data
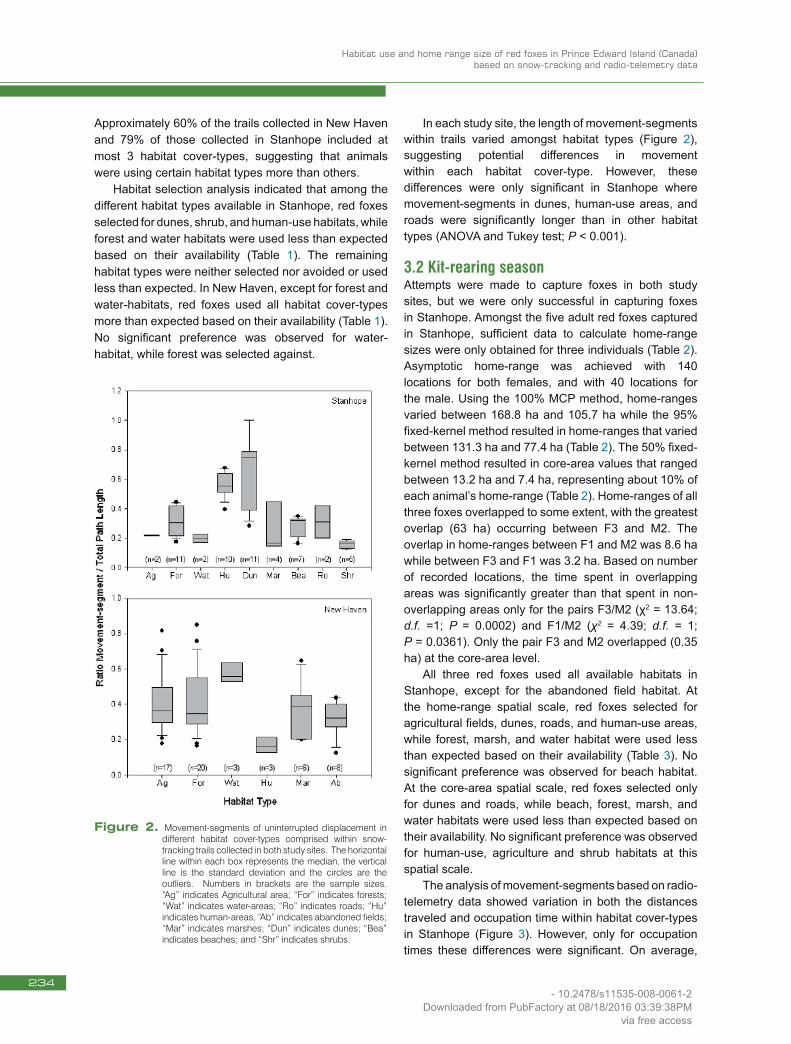
Approximately 60% of the trails collected in New Haven and 79% of those collected in Stanhope included at most 3 habitat cover-types, suggesting that animals were using certain habitat types more than others. Habitat selection analysis indicated that among the different habitat types available in Stanhope, red foxes selected for dunes, shrub, and human-use habitats, while forest and water habitats were used less than expected based on their availability (Table 1). The remaining habitat types were neither selected nor avoided or used less than expected. In New Haven, except for forest and water-habitats, red foxes used all habitat cover-types more than expected based on their availability (Table 1). No significant preference was observed for water-habitat, while forest was selected against.
In each study site, the length of movement-segments within trails varied amongst habitat types (Figure 2), suggesting potential differences in movement within each habitat cover-type. However, these differences were only significant in Stanhope where movement-segments in dunes, human-use areas, and roads were significantly longer than in other habitat types (ANOVA and Tukey test; P < 0.001).
3.2 Kit-rearing seasonAttempts were made to capture foxes in both study sites, but we were only successful in capturing foxes in Stanhope. Amongst the five adult red foxes captured in Stanhope, sufficient data to calculate home-range sizes were only obtained for three individuals (Table 2). Asymptotic home-range was achieved with 140 locations for both females, and with 40 locations for the male. Using the 100% MCP method, home-ranges varied between 168.8 ha and 105.7 ha while the 95% fixed-kernel method resulted in home-ranges that varied between 131.3 ha and 77.4 ha (Table 2). The 50% fixed-kernel method resulted in core-area values that ranged between 13.2 ha and 7.4 ha, representing about 10% of each animal’s home-range (Table 2). Home-ranges of all three foxes overlapped to some extent, with the greatest overlap (63 ha) occurring between F3 and M2. The overlap in home-ranges between F1 and M2 was 8.6 ha while between F3 and F1 was 3.2 ha. Based on number of recorded locations, the time spent in overlapping areas was significantly greater than that spent in non-overlapping areas only for the pairs F3/M2 (χ2 = 13.64; d.f. =1; P = 0.0002) and F1/M2 (χ2 = 4.39; d.f. = 1; P = 0.0361). Only the pair F3 and M2 overlapped (0.35 ha) at the core-area level. All three red foxes used all available habitats in Stanhope, except for the abandoned field habitat. At the home-range spatial scale, red foxes selected for agricultural fields, dunes, roads, and human-use areas, while forest, marsh, and water habitat were used less than expected based on their availability (Table 3). No significant preference was observed for beach habitat. At the core-area spatial scale, red foxes selected only for dunes and roads, while beach, forest, marsh, and water habitats were used less than expected based on their availability. No significant preference was observed for human-use, agriculture and shrub habitats at this spatial scale. The analysis of movement-segments based on radio-telemetry data showed variation in both the distances traveled and occupation time within habitat cover-types in Stanhope (Figure 3). However, only for occupation times these differences were significant. On average,
Figure 2. Movement-segments of uninterrupted displacement in different habitat cover-types comprised within snow-tracking trails collected in both study sites. The horizontal line within each box represents the median, the vertical line is the standard deviation and the circles are the outliers. Numbers in brackets are the sample sizes. “Ag” indicates Agricultural area; “For” indicates forests; “Wat” indicates water-areas; “Ro” indicates roads; “Hu” indicates human-areas, “Ab” indicates abandoned fields; “Mar” indicates marshes; “Dun” indicates dunes; “Bea” indicates beaches; and “Shr” indicates shrubs.
234 - 10.2478/s11535-008-0061-2
Downloaded from PubFactory at 08/18/2016 03:39:38PMvia free access

M. Silva et al.
foxes spent significantly more time in both dunes and human-use areas (ANOVA and Tukey-test; P = 0.002). Moreover, some habitat types were only used for short periods of time. For example, although roads were frequently visited by foxes, they typically stayed in this habitat less than 15 min, and then moved to a different habitat.
4. DiscussionRed foxes are typically considered habitat generalists, and their adaptability to marginal or degraded ecological conditions has been a key factor in allowing them to survive in fragmented landscapes and human-dominated areas. However, this does not necessarily mean that they do not have preferences for certain habitat types. In this study, we found that red foxes used both human-use areas and dune habitats during both the breeding and the kit-rearing seasons. Our analyses also indicate that in Prince Edward Island, red foxes seem to avoid forests even when this habitat is the most dominant habitat type. This was particularly obvious in Stanhope. However, the value of certain habitat cover types to red foxes varies with the spatial scale at which habitat selection is investigated. For example, even
F1 (♀) F3 (♀) M2 (♂)
Body mass (kg) 7.0 6.8 6.8Telemetry locations recorded 172 368 63
100% Minimum convex polygon (ha) 121.6 168.8 105.7
95% Fixed-kernel (ha) 99.5 131.3 77.4
50% Fixed-kernel (ha) 13.2 10.5 7.4
Table 2. Morphological and radio-telemetry data collected from three red foxes captured in Stanhope, Prince Edward Island Na-tional Park.
HabitatObservations
(# locations)
Habitat Use proportion
Average SD
Expected Use proportion Preference1
Home-range Level
Human-use 300 0.517 0.077 0.114 +
Dune 86 0.148 0.054 0.053 +
Road 64 0.110 0.048 0.033 +
Agriculture 31 0.053 0.034 0.005 +
Beach 41 0.071 0.039 0.100 0
Shrub 15 0.026 0.024 0.003 0
Marsh 1 0.002 0.006 0.109 0
Forest 39 0.067 0.038 0.503 -
Water 3 0.005 0.011 0.060 -
Abandoned Field 0 0 0 0.019 -
Core-Area Level
Dune 67 0.249 0.056 0.118 +
Road 16 0.172 0.036 0.084 +
Human-use 103 0.369 0.062 0.394 0
Shrub 8 0.035 0.026 0.028 0
Agriculture 11 0.012 0.007 0.008 0
Beach 18 0.089 0.048 0.161 -
Forest 27 0.067 0.028 0.142 -
Marsh 1 0.003 0.004 0.01 -
Water 1 0.003 0.008 0.054 -
Table 3. Comparisons of use and availability of various habitat types in Stanhope (Prince Edward Island National Park) based on three radio-collared red foxes. Habitat types are shown in order of red fox preference.
Comparisons were made using the Neu Method and Bonferroni confidence intervals. 1Preference was determined with Bonferroni confidence intervals (α = 0.001) placed on use. ”+” indicates used more than expected; “-“ indicates used less than expected; “0” use according to availability or non-significant difference between expected and available.
235 - 10.2478/s11535-008-0061-2
Downloaded from PubFactory at 08/18/2016 03:39:38PMvia free access

Habitat use and home range size of red foxes in Prince Edward Island (Canada) based on snow-tracking and radio-telemetry data
though red foxes used human-use areas at the home-range spatial scale, they did not significantly select for this habitat at the core-area spatial scale in Stanhope. This is particularly interesting when one considers that all three radio-collared foxes had at least one of their core-areas of activity located in human-use areas. The importance of understanding habitat selection by animals over a range of spatial scales has been highlighted in numerous works (e.g. [7-8, 34-35]), and it has even been suggested that failure to view habitat selection as a hierarchical process could result in a misleading notion of the value of habitats to animals [7,36]. In this study, we predicted that at the large spatial scale, habitat selection patterns will be influenced by factors such as food availability. In addition, we expected
that red foxes would show a preference for human-use habitat because anthropogenic food sources tend to be abundant, making this habitat cover-type particularly valuable to red foxes. Although caution should be made when interpreting habitat selection patterns during the kit-rearing season because telemetry data are based on three individuals, our results support the idea that red foxes may be using human-use areas more than expected based on their availability. This may be used as indirect evidence supporting the idea that fox-feeding is altering the way that red foxes use habitats in Stanhope. In Stanhope, red foxes did not show much preference for habitats such as forests, abandoned fields, and shrubs, in which they would normally have to hunt for prey such as small mammals (e.g., [16,37-40]). Movement-segments within both dunes and human-use areas tended to be longer than in other habitat types. Although it is unclear whether these habitats are used as foraging areas and/or movement corridors, analyses based on the movement-data also provide support for the idea that foxes do not use forested areas. Unfortunately, radio-telemetry data were not collected in New Haven because we failed to capture foxes in this study site. This limited our ability to make quantitative comparisons between the two sites during the kit-rearing season. Overall, data collected during the breeding season in New Haven failed to conclusively show that red foxes have a clear preference for human-use habitats at the coarse spatial scale at which the analyses were conducted. The data seem to suggest that red foxes were less selective in their use of habitat types in New Haven. This was also supported by the fact that there were no differences in the length of movement-segments within different habitats in New Haven. The most likely explanation for this finding is that red foxes in New Haven are not usually subsidized by human derived foods, forcing them to forage in other habitat types. Interestingly, we found that in both sites foxes used forested areas less than expected based on their availability. A possible explanation for this finding is that rodents, often a main prey of foxes (e.g., [39-40]), were more accessible in other habitat types. Several studies have shown that red fox uses forested areas significantly more than expected based on their availability mainly due to both low snow accumulation and the ability to forage for small mammals [38,41]. In our study sites, however, red fox used open habitats more than forested areas. A possible explanation for our finding is that on PEI snow accumulation is lower in open habitats than in forested areas due to the strong and constant winds that affect particularly open habitats. High snow accumulation may make the foraging for small mammals particularly difficult, explaining why red foxes
Figure 3. Distance traveled and occupation times in different habitat cover-types comprised within the 8-h intensive radio-telemetry monitoring-sessions in Stanhope. The horizontal line within each box represents the median, the vertical line is the standard deviation and the circles are the outliers. Numbers in brackets are the sample sizes. “Ag” indicates Agricultural area; “For” indicates forests; “Wat” indicates water-areas; “Ro” indicates roads; “Hu” indicates human-areas, “Ab” indicates abandoned fields; “Mar” indicates marshes; “Dun” indicates dunes; “Bea” indicates beaches; and “Shr” indicates shrubs.
236 - 10.2478/s11535-008-0061-2
Downloaded from PubFactory at 08/18/2016 03:39:38PMvia free access

M. Silva et al.
used forested areas less than expected based on their availability. A support for this explanation comes from a study conducted in Yellowstone National Park [16]. All of the above suggests that factors other than fox-feeding may explain how foxes select habitats during the breeding season. At smaller spatial scales, we predicted that patterns of selection will be influenced by den sites or the “spatial distribution” of important resources (rather than just their availability). Data collected in Stanhope during the kit-rearing season showed that red foxes selected for dunes and roads, but not for human-use areas. Rettie and Messier [7] suggested that at smaller spatial scales less important limiting factors may influence habitat selection patterns. In Stanhope, foxes use roads to move between different habitat cover-types and to obtain food. Fox-feeding along roads (especially the main highway traversing the park) is a common human-activity during the kit-rearing season. Indeed, it is very common to see many red foxes of all ages sitting along the roads waiting for humans to feed them. However, our data suggest that, at least during the kit-rearing season, any given individual fox uses the roads only for short periods of time. A potential explanation for this result is that “foraging” along the roads is so efficient that foxes do not need to spend too much time there to obtain sufficient amount of food. During the kit-rearing season, although humans inhabiting cottages and houses still set out food for foxes, these animals seem to prefer roads within their core-area. This is also supported by observations made by the staff of the national park (D. Lajeunesse, personal communication). During this season, it is not only easy to obtain food along the roads without too much effort, but roads (especially the main highway) are situated very close to the dunes where it is suspected (personal observations) that their dens are located. Parental care is particularly demanding in terms of food resources, so it may be more energetically efficient to stay close to the dens. At both coarse and small spatial scales, red foxes showed a preference for dune habitats in Stanhope, providing support for anecdotal information that suggest that it is in the dunes where the dens are located. Support for this explanation also comes from observations made by park wardens and one of the authors of this paper (K. Johnson). The granular and sandy composition of dune habitats likely provides suitable habitat for excavation of dens. In addition, dune habitats are protected within PEINP, thus limiting their access to humans. Unfortunately, we did not collect data in New Haven during the kit-rearing season, so we can only speculate where red foxes locate their dens. However, based on observations made during this study, we
suspect that red foxes use hollow trees or burrows within forests as dens in New Haven. Most land properties are privately owned in New Haven, and there is also a lack of tourist attractions. Therefore, it is possible that the low levels of human-presence in forest patches may make it possible to use them for dens. Although home-range and core-area sizes of red foxes occurring in Stanhope were comparable to values observed in studies conducted in other parts of North America and Europe (e.g. [42-44]), they were at the lower end of the spectrum for this species. There are several possible explanations for these results. First, these findings reflect the habitat requirements and movement patterns of foxes during the kit-rearing season when foxes are involved in cub rearing and lactation (especially females) and need to stay close to their dens (e.g. [45]). If this is true, it is possible to assume that the home-range and core-area values obtained during the kit-rearing season are underestimations of values at other times of the year. In addition, one of the females (F3) who was rearing three pups was receiving help from the male (M2), explaining the considerable overlap in home-range areas between these two animals. Second, the small home-ranges observed in this study may be the result of the aggregated distribution of anthropogenic food sources. It has been shown that the distribution of non-territorial, solitary carnivores tend to become more aggregated when anthropogenic resources are concentrated into a few patches, resulting in smaller and more stable home-ranges [46]. Third, it is also possible that home-range areas were small because Stanhope supports a high density of red foxes due to high fox-feeding levels. Small home-ranges would allow foxes to cover their territories in a relatively short time to maintain exclusive rights to the areas and reduce intraspecific competition [47]. Some studies have shown that intraspecific competition can drive home range size and territories cannot get larger [47-48]. Although this has not been investigated yet, anecdotal information suggests that there may be a correlation between fox numbers and the overabundance of anthropogenic resources within certain sectors of the park. Observations made by wardens from PEINP suggest that red fox abundance in Stanhope has actually increased during the last years. Although it is logical to expect that deaths caused by vehicles can reduce foxes abundance in the park, they can also incite an increase in the reproductive output or productivity of the fox population. Some predator species compensate for high mortality levels resulting from exploitation (e.g., trapping, hunting, etc.) by increasing their litter size or reproductive output (e.g., [49]). An overabundance of red foxes within the boundaries of the park is of particular concern for various reasons. Red
237 - 10.2478/s11535-008-0061-2
Downloaded from PubFactory at 08/18/2016 03:39:38PMvia free access

Habitat use and home range size of red foxes in Prince Edward Island (Canada) based on snow-tracking and radio-telemetry data
foxes in high-density populations are at greater risk of disease transmission [50-51]. The red fox is considered to be one of the main reservoirs of rabies in Europe (e.g. [52-53]) and is responsible for the geographical spread of this disease. An aggregated distribution, particularly one where resource use is not temporarily separated, will further facilitate transmission rates. An overabundance of foxes may also affect the survival and productivity of ground-nesting species, such as the threatened piping plover (Charadrius melodus), through predation by foxes. Finally, a high density of foxes within PEINP can also affect the ecological integrity of fragile ecosystems such as the dune habitats.
5. ConclusionsOur findings provide evidence suggesting that the presence of anthropogenic food sources in human-use areas and roads is altering habitat selection patterns of red foxes within the boundaries of PEINP. Although some of our findings should be taken with caution because of small sample sizes, we present in this study the largest amount of data on habitat selection ever collected for red foxes on PEI. It is obvious that red foxes are benefiting from food resources that humans are providing them along roads and in human-use areas. However, it is also evident that by selecting these areas, especially roads, red foxes are putting themselves at risk to be accidentally killed by motor vehicles. It is unknown how the antagonistic effect of these two factors is affecting population parameters such as abundance, spatial distribution or population survival. However, unpublished data collected by the staff of PEINP suggest an increase in red fox numbers within the park boundaries during the last few years. Clearly, our findings call for a long-term study of fox populations, including interactions with humans on PEI. For instance, quantitative information on the abundance and reproductive success patterns of foxes is essential for an effective management program of the fox population within or outside the boundaries of
the national park. Since most residents of PEI consider that foxes necessitate human resources for their survival, it would also be critical to develop a program to educate and inform people (residents and tourists) on both the ecology of mammalian predators and the adverse effects of fox-feeding.
AcknowledgmentsThis research was supported by research discovery grants to M. Silva and S. Opps from the Natural Sciences and Engineering Research Council of Canada, Parks Canada. Financial support was also received from the Faculty of Science of the University of Prince Edward Island and an internal grant from the University of Prince Edward Island. We thank the Prince Edward Island Department of Agriculture and Forestry for providing digital information on provincial forests. We are indebted to the Prince Edward Island National Park staff, especially Denyse Lajeunesse, for providing logistic support during this study.
[1] Thomas H.H., Dibblee R.L., A coyote, Canis latrans, on Prince Edward Island, Can. Field Nat., 1986, 100, 565-567
[2] Curley F.R., Population dynamics and morphological variation of the red fox (Vulpes vulpes rubricosa Bangs) on Prince Edward Island, MSc thesis, Acadia University, Nova Scotia, Canada, 1983
[3] Smith G.C., Harris S., Rabies in urban foxes (Vulpes vulpes) in Britain: the use of a spatial stochastic
simulation model to examine the pattern of spread and evaluate the efficacy of different control regimes, Philos. T. Roy. Soc. B, 1991, 334, 459-479
[4] Smith G.C., Harris. S., The control of rabies in urban fox populations, In: Putman R.J. (Ed.), Mammals as pests, Chapman and Hall, London, 1989, 209-224
[5] Orians G.H., Wittenberger J.F., Spatial and temporal scales in habitat selection, Am. Nat. Suppl., 1991, 137, 29-49
References
238 - 10.2478/s11535-008-0061-2
Downloaded from PubFactory at 08/18/2016 03:39:38PMvia free access

M. Silva et al.
[6] Schaefer J.A., Messier F., Habitat selection as a hierarchy: the spatial scales of winter foraging by muskoxen, Ecography, 1995, 8, 333-344
[7] Rettie W.J., Messier F., Hierarchical habitat selection by woodland caribou: its relationship to limiting factors, Ecography, 2000, 23, 466-478
[8] Johnson D.H., The comparison of usage and availability measurements for evaluating resource preference, Ecology, 1980, 61, 65-71
[9] Weighs J., Facts about Canada, its provinces, and territories, H.W. Wilson Press, New York, 1995
[10] Round Table on Resource Land Use and Stewardship, Cultivating Island Solutions, Prince Edward Island Round Table on Resource Land Use and Stewardship, Charlottetown, Canada, 1997
[11] Johnston I.G., Changes in the Island landscape, Brigus Books, Halifax, Canada, 2000
[12] Garth M., Poole K.G., Habitat associations of short-tailed weasels in winter, Northwest Sci., 2005, 79, 28-36
[13] Goldyn B., Hromada M., Surmacki A., Tryjanowski P., Habitat use and diet of the red fox Vulpes vulpes in an agricultural landscape in Poland, Z. Jagdwiss., 2003, 49, 191-200
[14] Kolbe J.A., Squires J.R., Pletscher D.H., Ruggiero L.F., The effect of snowmobile trails on coyote movements within lynx home ranges, J. Wildl. Manage., 2007, 71, 1409-1418
[15] Storch I., Lindstrom E., De Jounge J., Diet and habitat selection of the pine marten in relation to competition with the red fox, Acta Theriol., 1990, 35, 311-320
[16] Van Etten K.W., Wilson K.R., Crabtree R.L., Habitat use of red foxes in Yellowstone National Park based on snow tracking and telemetry, J. Mammal., 2007, 88, 1498-1507
[17] Murray D.L., Boutin S., O’Donogue M., Winter habitat selection by lynx and coyotes in relation to snowshoe hare abundance, Can. J. Zool., 1994, 72, 1444-1451
[18] White G.C., Garrott R.A., Analysis of wildlife radio-tracking data, Academic Press, 1990
[19] Gese E.M., Monitoring of terrestrial carnivore populations, In: Gittleman J.L., Funk S.M., Macdonald D.W., Wayne R.K. (Eds.), Carnivore Conservation, Cambridge University Press, 2001, 372-396
[20] Swihart R.K., Slade N.A., Influence of sampling interval on estimates of home-range size, J. Wildl. Manage., 1985, 49, 1019-1025
[21] Lucherini M., Lovari S., Habitat richness affects home range size in the red fox Vulpes vulpes, Behav. Process., 1996, 36, 103-105
[22] Chamberlain M.J., Conner L.M., Leopold B.C., Hodges K.M., Space use and multi-scale habitat selection of adult raccoons in central Mississippi, J. Wildl. Manage., 2003, 67, 334-340
[23] Lair H., Estimating the location of the focal center in red squirrel home ranges, Ecology, 1987, 68, 1092-1101
[24] Neu C.W., Byers C.R., Peek J.M., A technique for analysis of utilization availability data, J. Wildl. Manage., 1974, 38, 541-545
[25] Thomas D.L., Taylor E.J., Study designs and tests for comparing resource use and availability, J. Wildl. Manage., 1990, 54, 322-330
[26] Kazmaier R.E., Hellgren C., Ruthven D.C., Habitat selection by the Texas tortoise in a managed thornscrub ecosystem, J. Wildl. Manage., 2001, 65, 653-660
[27] Hooge P.N., Eichenlaub B., Animal movement extension to ArcView, Version 2.0, Alaska Science Center, Biological Science Office, US Geological Survey, Anchorage, 2000
[28] Philipps M., Catling P., Home range and activity patterns of red foxes in Nadgee Nature Reserve, Wildlife Res., 1991, 18, 677-686
[29] Mohr C.O., Table of equivalent populations of North American small mammals, Am. Midl. Nat., 1947, 37, 223-249
[30] Seaman D.E., Powell R.A., An evaluation of the accuracy of kernel density estimators for home range analysis, Ecology, 1996, 77, 2075-2085
[31] Harris S., Cresswell W.J., Forde P.G., Trewhella W.G., Woollard T., Wray S., Home range analysis using radio-tracking data – A review of problems and techniques particularly as applied to the study of mammals, Mammal Rev., 1990, 20, 97-123
[32] Seaman D.E., Millspaugh J.J., Kernohan B.J., Brundige G.C., Raedeke K.G., Gitzen R.A., Effects of sample size on kernel home range estimates, J. Wildl. Manage., 1999, 63, 739-747
[33] Powell R.A., Animal home ranges and territories and home range estimators, In: Boitani L., Fuller T.K. (Eds.), Research techniques in animal ecology: controversies and consequences, Columbia University Press, 2000, 65-110
[34] Pribil S., Picman J., The importance of using the proper methodology and spatial scale in the study of habitat selection by birds, Can. J. Zool., 1997, 75, 1835-1844
[35] McLoughlin P.D., Walton L.R., Cluff H.D., Paquet P.C., Ramsay M.A., Hierarchical habitat selection by tundra wolves, J. Mammal., 2004, 85, 576-580
[36] Buskirk S.W., Millspaugh J.J., Metrics for studies of resource selection, J. Wildl. Manage., 2006, 70, 358-366
239 - 10.2478/s11535-008-0061-2
Downloaded from PubFactory at 08/18/2016 03:39:38PMvia free access

Habitat use and home range size of red foxes in Prince Edward Island (Canada) based on snow-tracking and radio-telemetry data
[37] Artois M., Utilisation de l’espace et du temps chez le renard (Vulpes vulpes) et le chat forestier (Felis silvestris) en Lorraine, Gibier Faune Sauvage, 1985, 3, 33-57, (in French)
[38] Cagnacci F., Meriggi A., Lovari S., Habitat selection by the red fox Vulpes vulpes (L. 1758) in an Alpine area, Ethol. Ecol. Evol., 2004, 16, 103-116
[39] Lanszki J., Zalewski A., Horvath G., Comparison of red fox Vulpes vulpes and pine marten Martes martes food habits in a deciduous forest in Hungary, Wildl. Biol., 2007, 13, 258-271
[40] Pavey C.R., Eldrige S.R., Heywood M., Population dynamics and prey selection of native and introduced predators during a rodent outbreak in arid Australia, J. Mammal., 2008, 89, 674-683
[41] Cavallini P., Lovari S., Environmental factors influencing the use of habitat in the red fox Vulpes vulpes, J. Zool. (Lond), 1991, 223, 323-339
[42] Voigt D.R., Macdonald D.W., Variation in the spatial and social behaviour of the red fox, Vulpes vulpes, Acta Zoolog. Fennica, 1984, 171, 261-265
[43] Kolb H.H., Some observations on the home ranges of vixens (Vulpes vulpes) in the suburbs of Edinburgh, J. Zool. (Lond.), 1986, 210, 636-639
[44] Adkins C.A., Stott P., Home ranges, movement and habitat associations of red foxes Vulpes vulpes in suburban Toronto, Canada, J. Zool. (Lond.), 1998, 244, 355-346
[45] Saunders G., Coman B., Kinnear J., Braysher M., Managing vertebrate pests: foxes, Australian Government Service, Canberra, Australia, 1995
[46] Joshi A.R., Smith J.L., Cuthbert F.J., Influence of food distribution and predation pressure on spacing behavior in palm civets, J. Mammal., 1995, 76, 1205-1212
[47] Baker P.J., Funk S.M., Harris S., White P.C.L., Flexible spatial organization of urban foxes, Vulpes vulpes, before and during an outbreak of sarcoptic mange, 2000, Anim. Behav., 59, 127-146
[48] Baker P.J., Robertson C.P.J., Funk R.M., Harris S., Potential fitness benefits of group living in the red fox, Vulpes vulpes, 1998, Anim. Behav., 56, 1411-1424
[49] Van Deelen T.R., Gosselink T.E., Coyote survival in a row-crop agricultural landscape, Can. J. Zool., 2006, 84, 1630-1636
[50] Chautan M., Pontier D., Artois M., Role of rabies in recent demographic changes in red fox (Vulpes vulpes) populations in Europe, Mammalia, 2000, 64, 391-410
[51] Deplazes P., Hegglin D., Gloor S., Romig T., Wilderness in the city: the urbanization of Echinococcus multilocularis, Trends Parasitol., 2004, 20, 77-84
[52] Bourhy H., Dacheux L., Strady C., Mailles A., Rabies in Europe in 2005, Eurosurveillance, 2005, 10, 213-216
[53] European Commission, The oral vaccination of foxes against rabies, Report Scientific Commission in Animal Welfare, Health/Consumer Protection Directorate-General, 2002, 3-22
240 - 10.2478/s11535-008-0061-2
Downloaded from PubFactory at 08/18/2016 03:39:38PMvia free access