Guzmán, N. (2008). CLD Students at the Intersection of Bilingual Education and Special Education in...
223
Transcript of Guzmán, N. (2008). CLD Students at the Intersection of Bilingual Education and Special Education in...


CULTURALLY AND LINGUISTICALLY DIVERSE STUDENTS
AT THE INTERSECTION OF BILINGUAL EDUCATION
AND SPECIAL EDUCATION IN TEXAS
APPROVED BY SUPERVISING COMMITTEE:
Bertha Pérez, Ed.D., Chair
Ellen Riojas Clark, Ph.D.
Patricia Sánchez, Ph.D.
Jianmin Guan, Ph.D.
Accepted:
Criselda Guajardo Alvarado, Ed.D.
Dean, Graduate School

Copyright 2008 Norma A. Guzmán All Rights Reserved

DEDICATION Esta investigación está dedicada a las familias Guzmán y Noyola. ¡Gracias por sus labores!

CULTURALLY AND LINGUISTICALLY DIVERSE STUDENTS
AT THE INTERSECTION OF BILINGUAL EDUCATION
AND SPECIAL EDUCATION IN TEXAS
by
NORMA A. GUZMÁN, M.A.
DISSERTATION Presented to the Graduate Faculty of
The University of Texas at San Antonio In Partial Fulfillment Of the Requirements
for the Degree of
DOCTOR OF PHILOSOPHY IN CULTURE, LITERACY AND LANGUAGE
THE UNIVERSITY OF TEXAS AT SAN ANTONIO College of Education and Human Development
Division of Bicultural-Bilingual Studies August 2008

iv
ACKNOWLEDGEMENTS
Deseo dar gracias a mi familia, amigos/as y colegas que me apoyaron durante este
camino. ¡Muchisimas gracias a todos! I would like to take the time to express my appreciation
to my family, friends and classmates for their support and encouragement. This journey would
not have been possible without the assistance of everyone I was blessed to encounter.
Special thanks to my dissertation committee members for their guidance and support
throughout this process. Thanks to the College of Education at UTSA, for their financial support
through the graduate student research and travel grants. Thanks to the Division of Bilingual-
Bicultural studies for the foundation and support in reaching this goal.
I would like to acknowledge the staff at the Texas Education Agency for their assistance
in providing the data that I requested. To the school districts, elementary campuses and the
educators who participated in the study, ¡muchas gracias!
August 2008

v
CULTURALLY AND LINGUISTICALLY DIVERSE STUDENTS
AT THE INTERSECTION OF BILINGUAL EDUCATION
AND SPECIAL EDUCATION IN TEXAS
Norma A. Guzmán, Ph.D.
The University of Texas at San Antonio, 2008
Supervising Professor: Bertha Pérez, Ed.D.
Abstract. This study explored the phenomenon of disproportionality with regard to
culturally and linguistically diverse (CLD) students at the intersection of bilingual education and
special education in four districts and thirteen elementary campuses in South Texas. This mixed
methods research design included a survey developed to investigate educator perceptions of the
problem of over-representation. A total of 439 surveys were completed by educators in the
South Texas area. Educator perceptions are compared to existing data from the Texas Education
Agency (TEA) on the rates of representation of CLD students in special education. TEA data
was used to calculate the composition index, risk index, and odds ratios for CLD students in the
state, district and elementary campuses. The study used a concurrent data collection method and
data convergence occurred at the data analysis and interpretation stages. Findings show that
CLD students are over-represented in special education when data are disaggregated by
eligibility category and race/ethnicity at the state, district and campus level. Three-Way
ANOVA findings indicate that general education teachers lack familiarity and training in regards
to federal policies and programming that directly affect CLD students. Differences were also
noted among White and Latina educators in terms of their perceptions of CLD student over-
representation and appropriate educational programming practices. Latina educators rated CLD
student programming and services to be less than adequate, while White educators felt that
vi
special education programming and services were adequate in meeting the needs of CLD
students. Educator responses significantly show that over-representation is not seen as a problem
and is not consistent with the rates of representation of CLD students in special education (TEA
data). Findings support the need for collaboration among all educators (bilingual, special and
general education) in meeting the needs of CLD students in order to address the long standing
problem of disproportionate representation. The study also finds that a survey of educator
perceptions may be a viable method for districts and campuses to focus on the problem of over-
representation by investigating educator knowledge, previous experience and perceptions of
disproportionality.

vii
TABLE OF CONTENTS
Acknowledgments ......................................................................................................................... iv Abstract ............................................................................................................................................v List of Tables ................................................................................................................................ xii List of Figures ............................................................................................................................. xiv Chapter I Introduction .............................................................................................................1
Statement of the Problem ........................................................................................6
Research Questions .................................................................................................8
Assumptions ............................................................................................................9
Significance of the Study ......................................................................................11
Limitations ............................................................................................................13
Definition of Terms ...............................................................................................14
Organization of the Study .....................................................................................25
Chapter II Review of Literature ..............................................................................................27
Introduction ..........................................................................................................27
Sociohistorical Perspectives .................................................................................29
Current Perspectives ............................................................................................33
Deficit Thinking ....................................................................................................37
Federal Policies .....................................................................................................39
Bilingual Education ..................................................................................41
Special Education ......................................................................................42
Bilingual Special Education ......................................................................43
Court Cases and Litigation ...................................................................................46

viii
Language and Language Policy .............................................................................48
Appropriation of Policies .....................................................................................51
School District Policies and Practices ...................................................................53
Pre-referral ................................................................................................54
Assessment ...............................................................................................56
Eligibility Determination ..........................................................................58
Framing the Research Study .................................................................................59
Measuring Disproportionality ...............................................................................61
Rates of Representation ........................................................................................64
National Rates............................................................................................64
State Rates..................................................................................................66
San Antonio Rates of Representation ......................................................66
Qualitative Research Methods ..............................................................................70
Survey Research Review ..................................................................................... 72
Methodological Difficulties ................................................................................77
Summary .............................................................................................................79
Chapter III Methodology .........................................................................................................82
Introduction ...........................................................................................................82
Research Design and Questions ............................................................................82
Participants ............................................................................................................83
Survey Participants ...................................................................................83
District and Elementary Campus Demographics ......................................84
District and Campus Educator Demographics...........................................85
ix
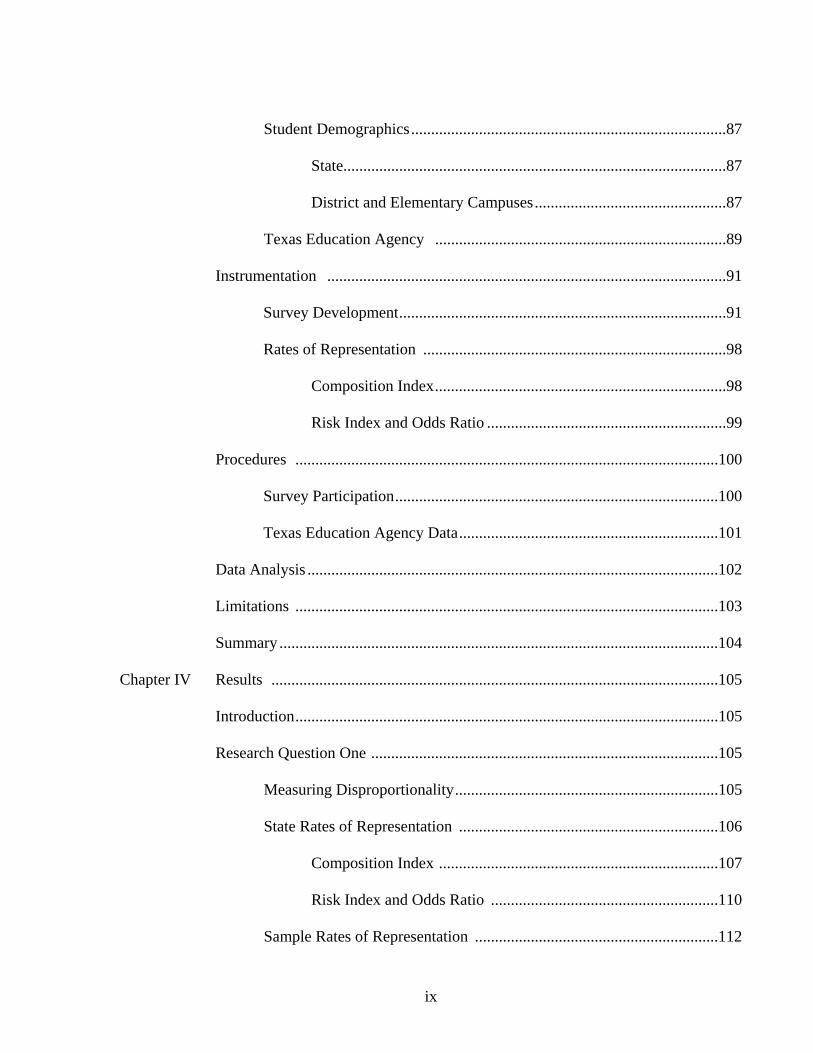
Student Demographics...............................................................................87
State................................................................................................87
District and Elementary Campuses................................................87
Texas Education Agency .........................................................................89
Instrumentation ....................................................................................................91
Survey Development..................................................................................91
Rates of Representation ............................................................................98
Composition Index.........................................................................98
Risk Index and Odds Ratio ............................................................99
Procedures ..........................................................................................................100
Survey Participation.................................................................................100
Texas Education Agency Data.................................................................101
Data Analysis .......................................................................................................102
Limitations ..........................................................................................................103
Summary ..............................................................................................................104
Chapter IV Results ................................................................................................................105
Introduction..........................................................................................................105
Research Question One .......................................................................................105
Measuring Disproportionality..................................................................105
State Rates of Representation .................................................................106
Composition Index ......................................................................107
Risk Index and Odds Ratio .........................................................110
Sample Rates of Representation .............................................................112

x
Composition Index ......................................................................112
Risk Index and Odds Ratio .........................................................120
Research Question Two .......................................................................................124
Survey of Educator Perceptions...............................................................124
Reliability.....................................................................................124
Validity ........................................................................................125
Analysis of Variance (ANOVA) .............................................................127
Dependent and Independent variables .........................................127
Open-Ended Survey Responses ..............................................................138
Training Attended .......................................................................138
Training Needs.............................................................................139
CLD and Special Needs Training ...............................................140
Additional Comments..................................................................140
Research Question Three ....................................................................................143
Chi Square Analyses................................................................................144
Rates of Representation and Educator Perceptions .................................147
Summary ..............................................................................................................154
Chapter V Discussion............................................................................................................156
Introduction..........................................................................................................156
Findings................................................................................................................157
Discussion............................................................................................................160
Implications..........................................................................................................162
Future Research ..................................................................................................164
xi
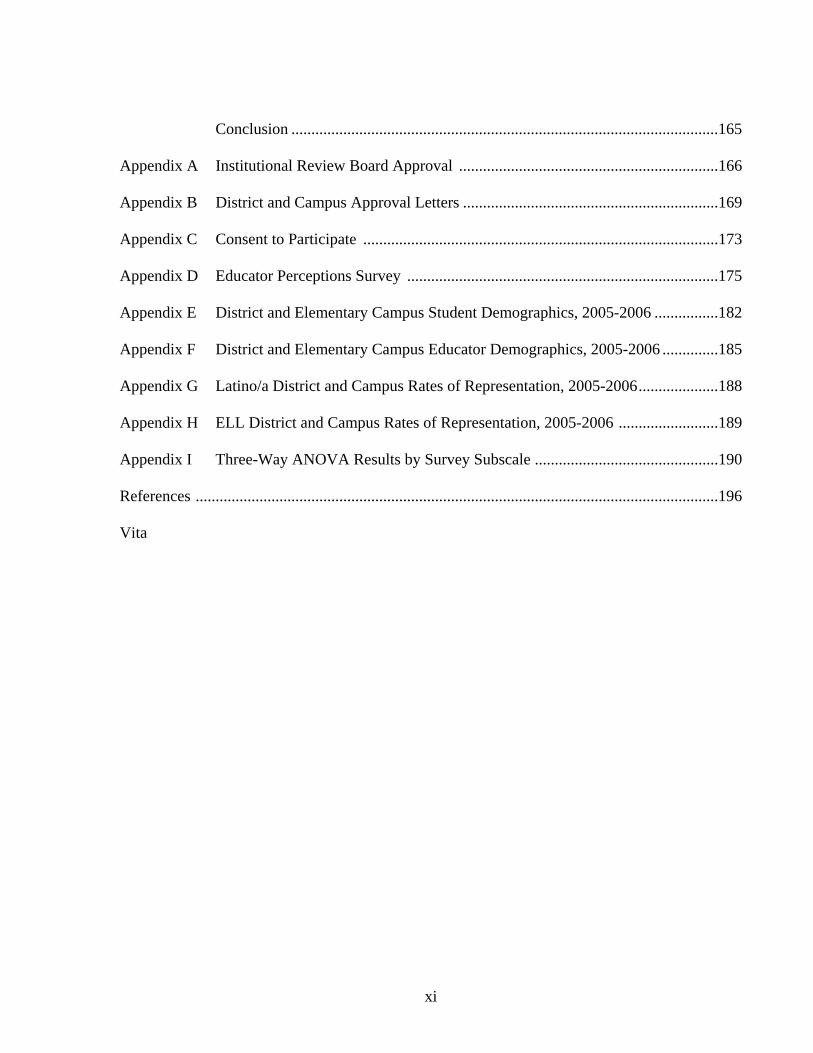
Conclusion ...........................................................................................................165
Appendix A Institutional Review Board Approval .................................................................166
Appendix B District and Campus Approval Letters ................................................................169
Appendix C Consent to Participate .........................................................................................173
Appendix D Educator Perceptions Survey ..............................................................................175
Appendix E District and Elementary Campus Student Demographics, 2005-2006 ................182
Appendix F District and Elementary Campus Educator Demographics, 2005-2006 ..............185
Appendix G Latino/a District and Campus Rates of Representation, 2005-2006....................188
Appendix H ELL District and Campus Rates of Representation, 2005-2006 .........................189
Appendix I Three-Way ANOVA Results by Survey Subscale ..............................................190
References ...................................................................................................................................196
Vita
xii
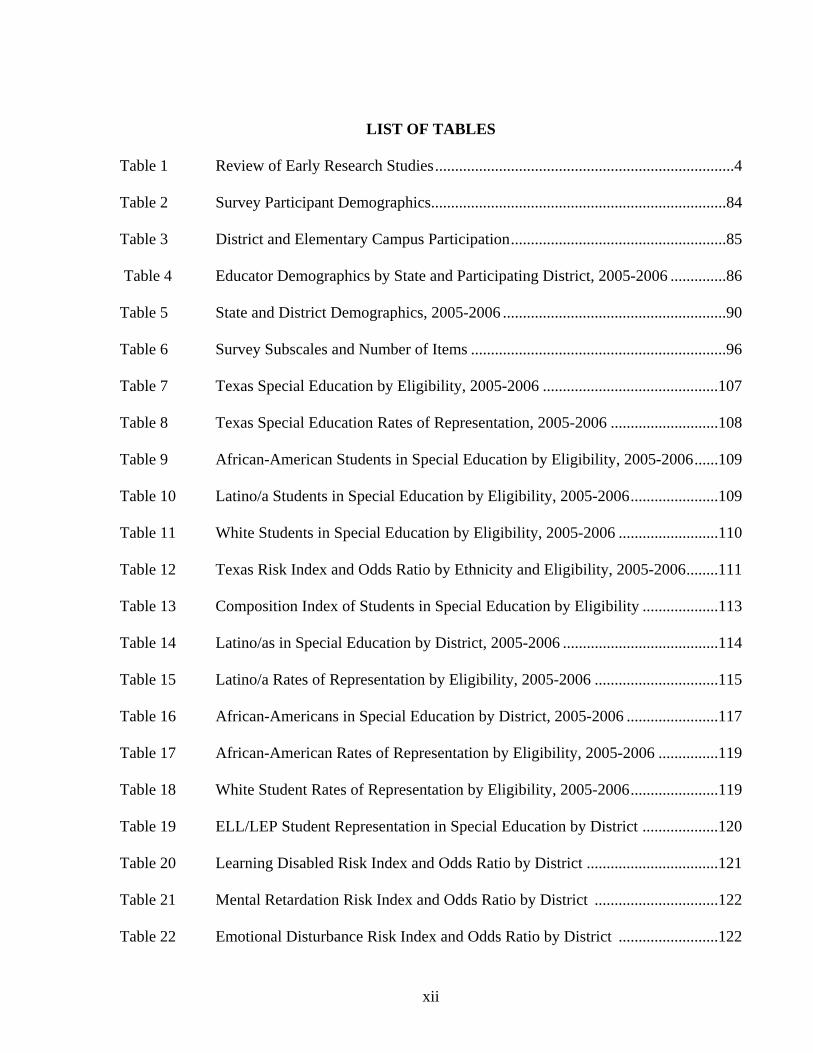
LIST OF TABLES
Table 1 Review of Early Research Studies...........................................................................4
Table 2 Survey Participant Demographics..........................................................................84
Table 3 District and Elementary Campus Participation......................................................85
Table 4 Educator Demographics by State and Participating District, 2005-2006 ..............86
Table 5 State and District Demographics, 2005-2006 ........................................................90
Table 6 Survey Subscales and Number of Items ................................................................96
Table 7 Texas Special Education by Eligibility, 2005-2006 ............................................107
Table 8 Texas Special Education Rates of Representation, 2005-2006 ...........................108
Table 9 African-American Students in Special Education by Eligibility, 2005-2006......109
Table 10 Latino/a Students in Special Education by Eligibility, 2005-2006......................109
Table 11 White Students in Special Education by Eligibility, 2005-2006 .........................110
Table 12 Texas Risk Index and Odds Ratio by Ethnicity and Eligibility, 2005-2006........111
Table 13 Composition Index of Students in Special Education by Eligibility ...................113
Table 14 Latino/as in Special Education by District, 2005-2006 .......................................114
Table 15 Latino/a Rates of Representation by Eligibility, 2005-2006 ...............................115
Table 16 African-Americans in Special Education by District, 2005-2006 .......................117
Table 17 African-American Rates of Representation by Eligibility, 2005-2006 ...............119
Table 18 White Student Rates of Representation by Eligibility, 2005-2006......................119
Table 19 ELL/LEP Student Representation in Special Education by District ...................120
Table 20 Learning Disabled Risk Index and Odds Ratio by District .................................121
Table 21 Mental Retardation Risk Index and Odds Ratio by District ...............................122
Table 22 Emotional Disturbance Risk Index and Odds Ratio by District .........................122

xiii
Table 23 Speech Impaired Risk Index and Odds Ratio by District ....................................123
Table 24 Survey Subscale Mean, Standard Deviation and Chronbach’s Alpha.................126
Table 25 Dependent and Independent Variable Descriptive Data for ANOVA.................129
Table 26 Chi Square Results, District One .........................................................................146
Table 27 Chi Square Results, District Two.........................................................................146
Table 28 Chi Square Results, District Three.......................................................................147
Table 29 Chi Square Results, District Four ........................................................................147

xiv
LIST OF FIGURES
Figure 1 Ethnic/Racial Diversity in Texas and San Antonio, 2003-2004............................67
Figure 2 State and San Antonio ELL/LEP and SpEd, 2003-2004. ......................................69
Figure 3 Interaction for Race/ethnicity on Job/position for S1 ..........................................131
Figure 4 Interaction for Job/position on Total Years Teaching for S2 ..............................133
Figure 5 African-American Over-Representation and Educator Perceptions D1 ..............149
Figure 6 Latino/a Student Over-Representation and Educator Perceptions D1.................149
Figure 7 White Student Over-Representation and Educator Perceptions D1 ....................150
Figure 8 African-American Over-Representation and Educator Perceptions D2 ..............151
Figure 9 Latino/a Student Over-Representation and Educator Perceptions D2.................151
Figure 10 White Student Over-Representation and Educator Perceptions D2 ....................152
Figure 11 African-American Over-Representation and Educator Perceptions D3 ..............153
Figure 12 Latino/a Student Over-Representation and Educator Perceptions D3.................153
Figure 13 White Student Over-Representation and Educator Perceptions D3 ....................154

1
CHAPTER I: INTRODUCTION
The problem of over-representation of culturally and linguistically diverse (CLD) or
minority students in special programs and classrooms within U.S. schools has a long history
(Artiles & Trent, 1994; Donovan & Cross, 2002; Heller, Holtzman, & Messick, 1982; Losen &
Orfield, 2002; Valdés & Figueroa, 1994). The trend of disproportionate representation of CLD
students includes over-representation in special education and under-representation in gifted
education programs. Factors that influence the rates of representation of minority or CLD
students in special programs include the appropriation (Koyama, 2004) of federal, state and
district policies that guide practices in terms of pre-referral, assessment, eligibility determination
and program placement processes within districts and schools. The term appropriation (Koyama,
2004) is used to describes how educators selectively implement and ignore parts of policy. In
this sense, educators appropriate federal, state, district and campus policies based on their ways
of knowing or understanding.
Research on minority student placement in special education indicates that, “From the
enactment of the 1975 federal law requiring states to provide a free and appropriate public
education to all students with disabilities, children in some race/ethic groups have been identified
for services in disproportionately large numbers” (Donovan & Cross, 2002, p. 1). According to
Artiles and Ortiz (2002b), research findings reveal that some racial and ethnic groups had
disabilities in greater numbers than would be expected, given their percentage in the general
student population, while other groups were significantly under-represented (p. 3).
Disproportionate representation is defined as “the extent to which membership in a given group
affects the probability of being placed in a specific special education disability category”
(Oswald, Coutinho, Best, & Singh, 1999, p. 198). A study using ethnographic methods to

2
investigate disproportionate placement in special education, Harry, Klinger, Sturges and Moore
(2002) state that “disproportionality in special education placements occurs through a process of
social construction by which decisions about disability and its appropriate treatments are
negotiated according to official and unofficial beliefs and practices” (p. 71). Research on the
phenomenon of disproportionality has been conducted from interdisciplinary perspectives and
through the use of mixed methods approaches.
Two large scale studies have been commissioned by the Department of Education to the
National Research Council (NRC) to address the problem of over-representation of minority
students in special education. The NRC efforts resulted in two reports, the first, Placing children
in special education: A strategy for equity, (Heller, Holtzman, & Messick, 1982), and the most
recent, Minority students in special and gifted education, (Donovan & Cross, 2002). Heller,
Holtzman and Messick (1982) found that although the magnitude of the difference in terms of
over-representation of minority students in special education varies from state to state, the
disproportionate classification of minority students as educable mentally retarded (EMR) was
evident by race/ethnicity nationwide. Donovan and Cross (2002) found that minority students,
particularly American Indian and Black children, are represented in disproportionately large
numbers in some high incidence special education categories (p. 357). Donovan and Cross
(2002) focused on recommendations for both general and special education in addressing
disproportionality. In other words, the education of students who are culturally and linguistically
diverse is the responsibility of all stakeholders and not solely the responsibility of bilingual
educators and/or special educators.
The investigation of the trend of over-representation of CLD students has included the
collection and analysis of national, state and district data obtained through surveys by the Office

3
for Civil Rights (OCR) since the 1970s and now includes the collection of race/ethnic group
placement patterns in ‘high incidence’ eligibility categories mandated by the Office of Special
Education Programs (OSEP) through the re-authorization of the Individuals with Disabilities
Education Act (1997, 2004).
Dr. Jane Mercer conducted research in California that focused on Mexican-
American/Hispanic students before the federal special education law of 1975. She found that
Mexican-American students in this CA school district had similar referral rates as other students,
but were more likely to be misdiagnosed and misplaced in special education (Valdés & Figueroa,
1994). Dr. Mercer investigated the use of intelligence tests, acculturation factors, as well as the
referral, testing and placement practices implemented by district personnel with the Mexican-
American/Hispanic student population. Early calls to attention on the problem of over-
representation (See Table 1) indicate problems with the use of a within-child deficit model,
reliance on IQ test scores, and highlight the high referral to placement pattern for Hispanic
students in the early 1970s.
In addition to the early calls to attention on the problem of over-representation, two
research institutes were established in Texas and California (Handicapped Minority Research
Institutes) in the 1980s to investigate factors related to testing, eligibility and placement
outcomes for bilinguals and minorities (Valdés & Figueroa, 1994). Studies undertaken by the
research institutes found similar patterns of practices that contributed to disproportionality, such
as testing CLD students only in English; reliance on IQ test scores; and high rates of placement
in classrooms for students with mental retardation (MR).

4
Table 1. Review of Early Research Studies
Researcher Year Study Findings
Dunn, Lloyd 1968 Disproportionate numbers of minority students placed in classrooms for educable mental retardation (cited in Artiles & Trent, 1994).
Deno, Evelyn 1970 Preoccupation with, and use of, a pathological model to place and serve students in special education programs is a factor in disproportionality (cited in Artiles & Trent, 1994).
Mercer, Jane 1971
IQ score below 80 was a “necessary but not sufficient” condition for [CLD students] being placed in the Educable Mentally Retarded classes (cited inValdés & Figueroa, 1994, p. 125).
Mercer, Jane 1973
Mexican-American students were referred at equal number to White students in the population, but were found eligible and were overrepresented in the number that failed IQ tests and were recommended for placement in classes for educable mentally retarded (cited in Valdés & Figueroa, 1994, p. 125)
Furthermore, Artiles and Trent’s (1994) review of over-representation of minority
students in special education suggested that the early calls to attention on the problem by Dunn
(1968), Deno (1970) and Mercer (Table 1) point toward a need to develop “an encompassing
reform agenda that will include: (a) concept refinement, (b) a culturally sensitive research
agenda, (c) systemic reform, (d) personnel preparation reform and (e) advocacy and policy
making” (p. 426). Although changes in policies have been enacted since these early calls to
attention to the problem of disproportionality, systemic modification, advocacy, and litigation
have not resulted in amelioration or deterrence of the problem.
Artiles and Trent (1994) concluded that “the over-representation problem ought to be
examined from a multivariate perspective and that the problems exhibited by culturally different
children ought to be explained beyond the traditional within-child deficit view” (p. 426). Artiles
and Ortiz (2002b) state that taking into account the cultural and linguistic backgrounds of
5
students within “a comprehensive system of services — from prereferral to instruction — will
force professionals to transcend what until now has been the field’s almost exclusive focus on
student deficits” (p. 19). Research, educational policies and practices need to move beyond
ascribing special education labels based on perceived within-child, home or community
deficiencies. Furthermore, research efforts must be multivariate in nature.
Using national and state level data on minority student representation may not reveal
local district and campus patterns of disproportionality (Artiles, Rueda, Salazar, & Higareda,
2005; Artiles & Trent, 1994; Harry & Klingner, 2006; Losen & Orfield, 2002; Rhodes, Ochoa, &
Ortiz, 2005; Valdés & Figueroa, 1994). In addition, the differential appropriation of federal,
state and district policies by educators’ results in a wide range of practices that develop.
According to Donovan and Cross (2002), imprecision is inherent in specifying variables in
datasets used by federal government agencies, OCR and OSEP, which provides a limitation to
the findings in the area of disproportionality.
The research points to a need for disaggregation of data in order to discern
disproportionality and examine it from a district and local campus level. Investigations should
encompass both the sociocultural and linguistic backgrounds of students (Artiles & Ortiz,
2002b). The variables explored in disproportionality studies include systemic factors (e.g.,
tracking, segregation), as well as the variables of race/ethnicity, gender, socioeconomic status,
program availability and placement. In addition, implementation and appropriation of district
policies, practices and procedures is affected by educational funding and top-down
accountability measures.

6
Statement of the Problem
Demographic changes in the U.S. indicate that a large proportion of students entering
schools come from culturally and linguistically diverse backgrounds. Studies that have
investigated the question of over-representation point to variability across time and place in
terms of the patterns of ethnic disproportionality in special education (Harry & Klingner, 2006,
p. 2). Disproportionality studies have focused on categorical variables and tend to be: a)
aggregated in terms of the placement rate of CLD students in all disability categories; b)
aggregated by state level placement rates; and c) do not account for the shift in use of specific
disability categories over time (Harry & Klingner, 2006). The variability in results points to a
need for disaggregation of the data at different levels within district and campus in terms of
program availability and placement as well as diversity within groups represented in the school
population, such as Hispanics/Latinos (Artiles, Rueda, Salazar, & Higareda, 2005; Artiles &
Trent, 1994).
Furthermore, investigations need to include “the proclivities of teachers, administrators,
and parents” (Donovan & Cross, 2002, p. 76) on the problem of over-representation. Losen and
Orfield (2002) state that one of the key elements to the problem, is “the perceptions and
decisions of classroom teachers, as well as school-level policies and practices that have an
impact on students in regular classrooms” (p. xxv). Research studies that focus on the outcomes
rather than the processes and practices provide limited insight into the static phenomenon of
over-representation; therefore, studies need to start from an investigation of educator
perceptions, or ways of knowing. There is limited research that includes the examination of the
problem of over-representation through the examination of mediating variables such as teacher
beliefs and perceptions within decision-making processes (Artiles & Trent, 1994, p. 428). In this

7
sense both special education and the general education practices, need to be explored in terms of
the construction of difference and disability (Artiles, 1998; McDermott, Goldman, & Varenne,
2006).
Due to policies, practices and the political nature of schooling, educators may have been
socialized to equate cultural diversity with disability (Artiles & Trent, 1994, p. 425). Current
practices that encompass deficit perspectives, as well as the continued use of a medical model for
the process of referral, assessment, eligibility determination and placement of students into
special education, require a paradigm shift from school personnel involved in the educational
decision-making process (Valdés & Figueroa, 1994). Artiles and Trent (1994) concluded that
from a social perspective, we have continued to develop educational structures without examining and considering how the belief systems, biases, prejudices, and socioeconomic inequities that have existed for centuries in the American society would be played out and perpetuated in our nation’s schools…and reiterate that the time to extend [the] analyses of the problems and pitfalls of special education needs to encompass sociohistorical and political perspectives (p. 432).
An investigation of educator perceptions appears pertinent, given that deficit
thinking models continue to (re)surface in educational thought and practice (Valencia,
1997b), in times of sociopolitical tensions. This study utilizes theoretical frameworks
(Artiles, 1998; Trent, Artiles, & Englert, 1998; Valencia, 1997b) that challenge deficit
theories of CLD students. Deficit theories have guided general and special education
policies and programming which shape educators’ perceptions of CLD students. The
investigation of educators’ perceptions of CLD students may provide a better
understanding of the problem of over-representation.
In addition, the current school reform agenda (e.g., No Child Left Behind Act) aimed at
equity and inclusion of all students in U.S. education, appears to penalize the students, such as

8
English Language Learners (ELL) and those identified as needing special education, whom the
Act claims to ‘help’ through measuring accountability. The institutionalized practices that have
been appropriated based on federal policies serve as mechanisms for the continuation of deficit
thinking and subtractive educational practices (see Valenzuela, 1999, 2005). The negative
consequences for CLD students is in part the ascription of a label after having been measured
against a monolingual, monoliterate English-language standard that results in inaccurate and
invalid assessment of their capabilities (De la Luz Reyes & Halcón, 2001; Valencia & Suzuki,
2001) and leads to misplacement and misdiagnosis (Valdés & Figueroa, 1994) in special
education programs.
The research on the phenomenon of disproportionality requires not only understanding
the measurement of over-representation indexes, ratios, and odds, but calls for an examination of
the belief systems, biases, and prejudices of all stakeholders. Educators’ epistemological beliefs
shape the selection and implementation of policies that directly impact CLD and ELL students in
U.S. schools.
Research Questions
Based on a review of the literature on the problem of disproportionality of CLD students
at the intersection of bilingual education and special education, there appears to be a need for
further research in terms of educator perceptions, as well as a need to understand the
measurements used in reporting rates of representation of CLD students by way of
disaggregating of data, to discern the continued trend from the bottom-up. The study seeks to
determine if over-representation of minority students in special education is perceived as a
concern/problem in the South Texas area and compare these perceptions to actual Texas
Education Agency (TEA) data. The research questions are:
9
1) What are the rates of representation of CLD students in special education by
ethnicity/race, eligibility category, and language status in the South Texas area?
What are the rates of representation of ELLs (LEP) in special education?
2) Do educator perceptions differ in regards to disproportionality of CLD students in
special education? Do school personnel perceptions differ based on their school
position, ethnicity/race, gender, or years of experience?
3) Do school personnel perceptions on disproportionality of CLD students differ in
comparison to actual TEA data for the selected school district and campus?
The complex nature of the phenomenon of over-representation is a daunting area of
investigation. This seems to be complicated by the variability in results based on determining
relative rates of representation (e.g., risk index, odds ratio). In addition, states and districts vary
in how they select, report, and implement federal and state policies that guide practices.
Assumptions
The research suggests that CLD students are over-represented in special education
programs within ‘subjective, soft or judgmental’ disability categories such as mental retardation
(MR), Learning Disability (LD), Emotionally Disturbed (ED) and Speech and Language
Impaired (SI). Although the OCR does not collect data on the rates of representation for the
speech impaired (SI) category, this is an area that has shown variability in over-representation
rates for CLD students by geographic region (Donovan & Cross, 2002; Valdés & Figueroa,
1994). At the national and state level, Hispanic/Latino students tend to be over-represented in
LD categorization and have historically been over-represented and placed in programs for
students with Mental Retardation (MR). Variability in representation rates is affected by the
composition or density of ethnic/racial groups as well as by geographic area (Donovan & Cross,

10
2002; Heller, Holtzman, & Messick, 1982; Valdés & Figueroa, 1994). School districts in the
South Texas area may display variability in terms of the rates of representation of CLD, Latino/a
and students considered ELLs.
Educator perceptions of over-representation of CLD students in special education could
differ from the actual data reported from TEA. Educators’ previous experience and training may
influence their perception of students who are CLD. Educators who work in districts considered
higher in socioeconomic means (based on TEA indicator) and have lower concentrations of CLD
and LEP/ELL students may not consider over-representation of CLD students in special
education a problem regardless of the eligibility category or language status of the student
(Artiles, Rueda, Salazar, & Higareda, 2005). Educators who work in school districts considered
to be in the lower socioeconomic brackets (based on TEA indicator) and have high
concentrations of CLD and ELL/LEP students may not consider over-representation a problem
due to the lack of ethnic/race, and class diversity in the population (Heller, Holtzman, &
Messick, 1982).
Lastly, school personnel perceptions of CLD, Latino/a and ELL students differ based on
their educational background, training, and school position as well as by ethnicity/race, gender or
years of experience. Familiarity with education policies that guide practices influence educator
perceptions of CLD students and the phenomenon of over-representation. In survey data
collection, researchers assume that educators’ responses are valid and reflect their beliefs. The
purpose of the research is twofold: 1) to examine the rates of representation of CLD students in
special education in selected districts and elementary campuses, and 2) determine differences in
educator perceptions of the phenomenon of disproportionality.

11
Significance of the Study
The problem of over-representation of CLD students in special education “has largely
been ignored by researchers and practitioners in general education” (Artiles, Klinger, & Tate,
2006, p. 3). The traditional explanations of CLD or minority school failure and over-
representation in special programs requires a paradigm shift away from binary explanations such
as race/ethnic differences, as well as a move away from the division of professional
responsibility for the ‘problem’ lying solely with education specialties, such as bilingual or
special education (Artiles, Klinger, & Tate, 2006).
This mixed methods research design (Creswell, 2003) aims at understanding the
complexities of the problem of over-representation through the use of multiple methods of data
collection to compare and converge findings within one study. Concurrent data collection
includes survey collection and TEA data from selected districts and campuses. CLD students’
language, culture, and socio-economic class background are variables that compound the
phenomenon of disproportionality grounded in educator ways of knowing, as well as the
selection and implementation of federal and state policies within U.S. schools. Additionally,
data is provided that demonstrates how educators’ interpretation of policies at the campus level
affects CLD students’ educational programming.
Another aspect of the study aims to provide baseline data, which includes descriptive
profiles of districts and elementary schools in the South Texas area through the examination of
data from the Texas Education Agency (TEA). The TEA data was used to 1) compare
campus/district educators’ perceptions to the actual proportions of CLD students in special
education, and 2) obtain the composition index, odds ratio and risk index of CLD students. Data
disaggregation included the variables of ethnicity/race, eligibility category, program placement

12
and language status. An investigation of the rates of representation of CLD students in high
incidence eligibility categories of MR, ED, LD and SI in the selected South Texas districts and
elementary campuses may provide the basis for further qualitative and quantitative research.
Therefore, the use of a mixed methods approach provides an avenue for understanding the
complex nature of the problem of over-representation.
Current federal regulation, the Individuals with Disabilities Education Act (IDEA) (1997,
2004), mandate that states and districts collect and report data on minority student representation
in special education by category and educational setting. Using national and state level data on
minority student representation may not reveal local district and campus patterns of
disproportionality (Artiles, et al. , 2005; Rhodes, Ochoa, & Ortiz, 2005). In addition, examining
data solely based on statistics may not provide insight into the perceptions of school/district
personnel involved in the decision-making process. The entrenched educational thoughts and
practices could preclude individuals from realizing the existence and perpetuation of a decade’s
long problem of disproportionality.
Finally, the ramifications of discriminatory sociopolitical and sociohistorical schooling
practices do not appear to be deterring the negative trend in education reform policies focused on
accountability and use of standardized testing (e.g., No Child Left Behind). Further, there is a
lack of research on within-group diversity, such as Puerto Ricans, Central Americans, and Cuban
Americans, under the category of Hispanic/Latino, which simultaneously examines the influence
of language and ethnic status on special education representation (Artiles, Rueda, Salazar, &
Higareda, 2005; Rhodes, Ochoa, & Ortiz, 2005, p. 19).
13
Limitations
Any research design has limitations based on knowledge claims and the approach to the
research inquiry. Strategies associated with mixed methods approaches involve collecting and
analyzing data that could be qualitative and quantitative in nature within one study (Creswell,
2003). This study aims to collect and analyze data concurrently, to capture a picture of the
phenomenon of disproportionality, which in itself is varied and complex. The data for this study
cannot be dichotomized as strictly quantitative or qualitative, but rather is a collection and
analysis of mixed/multiple sources of data to provide a broad perspective of the problem of
disproportionality (Creswell, 2003).
Research utilizing surveys has limitations based on the participants’ views of CLD
students and the ensuing education programming and practices appropriated within the
classrooms and schools in which they work. Survey data is based on participant self-report and
one assumes that participants answer the questions truthfully. The reliability of survey
items/domains is important as well. Due to this, statistical analysis of the survey developed was
completed for internal consistency (reliability) and evidence of validity of the scores based on
items adapted from a review of the literature. The items developed for inclusion in the survey
attempt to capture complex multivariate phenomena. A review of the literature in
multidisciplinary areas was conducted to locate previous surveys on disproportionality and
educator perceptions. The review of the literature found questionnaires that addressed educator
perceptions, training, and practices, but did not include questions directly related to
disproportionality; therefore, items from previous surveys were adapted in addition to new items
developed for the survey entitled, “Educator Perceptions on Cultural and Linguistic Diversity:
Educational Practices, Policies and Programming” (See Appendix D). The review of the
14
research included the areas of general education, bilingual education, special education, bilingual
special education, as well as school psychology.
A limitation of databases, such as the one used by the Texas Education Agency, includes
the narrow criteria set for categories/variables. For example, recent immigrants/refugees from
Africa may be erroneously coded as African-American by district personnel (Gershberg,
Danenberg, & Sánchez, 2004) due to the lack of specificity available for coding race/ethnicity.
There is great variability in not only the reporting of data, but in the interpretation of the
categories offered as choices, such as ethnicity/race, language, and socioeconomic status. In
addition, the criteria for eligibility may differ at any level in which federal and state regulations
are selectively implemented. The individual entering the data becomes a factor in which
accuracy of reporting would come into question. For state and federal level data, these figures
are directly tied to funding, school and district ratings, and with the current NCLB act, the data
are tied to accountability. The negative consequences involved with the reporting of data to state
and federal databases for CLD students may be a factor that affects educator perceptions of
disproportionality. At the same time, the lack of understanding the direct impact of the data,
educators’ responsibility for considering or ameliorating disproportionality as a ‘problem’ is
perhaps not evident.
Definition of Terms
Due to the multivariate nature of the phenomena of over-representation of students in
special education, terms are used from several disciplines. The meanings of words change over
time, based on the relationship to changing political, social and economic situations and needs;
therefore, a term in general use can have variable meanings and uses (Bennett, Grossberg, &
Morris, 2005). A review of the terms within the intersection of bilingual and special education,

15
as well as education in general, along with some operational definitions, are provided. To assist
with the understanding and consistency of terms and categories, language used by federal
education policy and laws, which are primarily used for reporting purposes by U.S. institutions,
was a starting point from which definitions that encompass the scope of this study were
expanded or (re)structured.
The following terms and acronyms are situated within the context of schooling within the
U.S., as well as in the state of Texas, according to the Texas Administrative Code (TAC), Texas
Education Agency (TEA) and the State Board of Education (SBOE). Federal terms and
categories are used to provide consistency of terms at a national level (e.g., Hispanics) when
appropriate in referring to policy or law. Unique terms and acronyms used in the state of Texas
include ARD and LPAC, which are not applicable to terms used in other states in the U.S. In
addition, the field of education is embedded with a plethora of acronyms which are used in lieu
of the entire term and are appropriated with variability by state, district and school. The
definitions pertinent to this study are presented in alphabetical order.
Admission Review and Dismissal Committee (ARD): The ARD committee is specific to
the state of Texas. This is comprised of campus based personnel which includes administrators,
teachers, parents, and specialists that convene when making decisions on students who are being
admitted to special education initially, or being considered for exit. The committee is charged
with annually reviewing the progress of students with disabilities based on the individualized
education program (IEP). It is the responsibility of a multidisciplinary teams, sometimes
referred to as MDT, to review the results of assessments and to determine whether a student has
a legally defined disability and due to the disability requires special education services (Ortiz &
Yates, 2002). “By law, the multidisciplinary team is made up of a representative of the school

16
administration, instructional representatives from special education and general education,
assessors, the student’s parent, and if appropriate, the student” (Ortiz & Yates, 2002, p. 79).
Team members who are familiar with the student and his/her educational programming, such as
ESL, bilingual education or special education, along with the general education personnel should
participate in the meeting.
Bilingual and Bilingualism: Hakuta (1986) describes bilingualism as a pattern of co-
existence, cooperation and competition formed by two languages in the individual. Bilingualism
is a relative term that researchers have described as one phenomenon in which individuals
possess knowledge of two languages rather than one (Hakuta, 1986; Mackey, 2000; Romaine,
1995; Valdés & Figueroa, 1994). Valdés and Figueroa (1994) indicate that because of the
complex nature of bilingualism, researchers have developed categories to help with measuring
and describing these differences within individuals and groups. One typology is that of elective
and circumstantial bilinguals. Circumstantial bilinguals are individuals who acquire a second
language out of necessity, compared to elective bilinguals who have chosen to learn a second
language. Circumstantial bilinguals may be groups or individuals who come from various
backgrounds and may be immigrants or descendents of colonized groups in the U.S. (Valdés &
Figueroa, 1994). The categories of circumstantial vs. elective bilingual are not mutually
exclusive, in that a circumstantial bilingual can elect to learn another language.
Bilingual education: Bilingual education is broadly defined as an educational program
that involves the use of two languages of instruction at some point in a student’s school career
(Nieto, 2004, p. 224).
Bilingual Special Education (BSE): The use of the home language and the home culture,
along with English in an individually designed program of special instruction for the student in

17
an inclusive environment, is described as bilingual special education (Baca & De Valenzuela,
1998). Fernandez (1992) defines bilingual special education as special instruction and related
services individually designed to meet the educational needs of LEP students with disabilities.
In Texas, BSE is described in terms of the service delivery options and is not designated as a
separate educational program.
Competencies: A review of training related to English language learners by Ochoa,
Rivera and Ford (1997) used competencies identified by Figueroa, et al. (1984). These include
knowledge of: (a) cross-cultural issues involved in bilingual psycho-educational assessment; (b)
second language acquisition factors and their relationship to assessment; and (c) methods to
conduct bilingual psycho-educational assessment (Ochoa, Rivera, & Ford, 1997, p. 333). Ochoa,
et al. (1997) added a fourth competency that pertains to the ability to interpret the results of the
bilingual psycho-educational assessments. In this study, these four competencies were kept in
mind when developing survey items for educators involved in the referral to special education
placement process. Ochoa, et al. (1997), developed a survey to investigate school psychologist
training in regards to the bilingual evaluation process. This study expands on the use of these
competencies to include educators’ level of training and experience in these areas with culturally
and linguistically diverse students.
Composition Index: The composition index is calculated by dividing the number of
students of a given racial or ethnic group enrolled in a particular disability category by the total
number of students (summed across all racial/ethnic groups) enrolled in that same disability
category (Donovan & Cross, 2002, p. 43). The composition index (CI) would reflect the
proportion of students placed and served in special education by eligibility category/disability.

18
Culturally and Linguistically Diverse (CLD): Culturally diverse refers to students who
may be distinguished by ethnicity, social class, and/or language (Pérez, 2004). The term
linguistically diverse refers to students whose first language or home language is either a
language other than English or a language other than the middle-class, mainstream English used
in schools (Pérez, 2004, p. 6). Artiles and Ortiz (2002a) state that the term culturally and
linguistically diverse is the broadest term and encompasses students, from African-Americans to
recently arrived immigrants, whose language and cultural backgrounds vary from that of the
mainstream (p. 19). The term culturally and linguistically diverse is preferred and used
throughout the study to be inclusive of all students, while specific terms used for government
categorization (e.g., Hispanic, Limited English Proficient, ELL, minority) are applied based on
the original study/research cited, as well as for consistency in data clarification in quantitative
methods.
Culture and Cultural Studies: According to Raymond Williams (1983), culture is one of
the most complicated words in the English language (p. 87). Traditionally culture has been
described as a social phenomenon that encompasses a set of norms, values, beliefs, and customs
shared by a group of people. Culture is a socially constructed concept. Conventional definitions
of culture include all the external factors that influence an individual’s behavior, ideology,
thought process, and everything that an individual is born and socialized into. Culture is referred
to as a “particular way of life, whether of a people, a period or a group” (Bennett, Grossberg, &
Morris, 2005, p. 67). Some of the social components of culture include the description of a
particular way of life, which expresses itself in certain meanings and values as part of ‘ordinary’
behavior. According to Gray (2003) one key focus in cultural studies research is that of
understanding culture as constitutive of and constituted by ‘the lived,’ that is the material, social

19
and symbolic practices of everyday life (p. 1). In this study, the term culture is used to describe
students, homes and communities as diverse with the understanding that groups are not
monolithic.
Deficit Thinking Models: Valencia (1997b) and colleagues indicate that the concept of
deficit thinking is 1) a mind-set molded by the fusion of ideology and science; 2) a dynamic form
of social thought allegedly accounting for between-group behaviors; and 3) an actual way of
thinking to combat problems. For example, a top-down approach or blaming the victim (p. xi).
Valencia (1997a) describes six characteristics of deficit thinking in the following contexts: 1)
blaming the victim; 2) oppression; 3) pseudoscience; 4) temporal changes; 5) educability; and 6)
heterodoxy (p. 3). Deficit thinking models are ideologically based on blaming the victim.
School segregation, high-stakes testing, compulsory ignorance laws are examples of how deficit
thinking models were forms of oppression for groups in the U.S. Valencia (1997a) also
describes how pseudo-scientific investigations have been used to advance deficit theories for
CLD groups. Deficit thinking is also dynamic and fluid, in that deficit thinking changes based
on the sociopolitical context of the time. In terms of educability, Valencia (1997a) states that
educators frequently attribute school failure to students and success to themselves. Lastly,
models which challenge deficit thinking models have been present (heterodoxy), yet they had
little influence on changing the status quo (orthodoxy).
Disproportionate representation: Defined as the extent to which membership in a given
group affects the probability of being placed in a specific special education category” (Oswald,
Coutinho, Best, & Singh, 1999) or special education service option (Artiles, Rueda, Salazar, &
Higareda, 2005).
20
Educators and Practitioners: Throughout the study, the word educator is used to be
inclusive of all stakeholders in education, such as teachers, policymakers, evaluation specialists,
administrators, counselors, as well as university researchers/professors, etc. The term educator
thus would not solely apply or refer to classroom teachers. Koyama (2004) indicates that
practitioners include those involved in policy making, interpretation and implementation. In this
sense, all educators within the micropolitical space of the classroom, as well as the
macropolitical space (public sphere) of state and federal institutions would be ‘educators,’ and
would participate in daily practices that include policymaking through interpretation and
appropriation. Koyama (2004) is guided by Sutton and Levinson (2001, p.1), who define policy
as “a complex social practice, an ongoing process of normative cultural production constituted
by diverse actors across diverse social and institutional contexts” (cited on p. 404).
Emotional Disturbance (ED): Refers to a condition exhibiting one or more of the
following characteristics that adversely affects a child’s educational performance: an inability to
build or maintain interpersonal relationships with peers and teachers; inappropriate types of
behavior or feelings under normal circumstances; a general pervasive mood of unhappiness or
depression; a tendency to develop physical symptoms of fears associated with personal or school
problems (Smith, 2001, cited in Artiles & Ortiz, 2002b, pp. 3-4).
English Language Learner (ELL) and Limited English Proficient (LEP): The term
limited English proficient has a negative connotation and the most current term is English
Language Learner (Carrasquillo & Rodríguez, 2002). Other terms used to describe linguistically
diverse students are second language learners and language-minority students (Pérez, 2004).
English language learners are students whose first or home language is other than English and
whose English skills are so limited that they cannot profit from instruction provided entirely in

21
English without support (Artiles & Ortiz, 2002a, pp. 19-20). In addition, Artiles and Ortiz state
that educators are increasing using the term English language learner (ELL) in place of limited
English proficient (LEP) to avoid the negative connotation of ‘limited’ as a descriptor of student
abilities, although LEP is still the official designation in government, laws and public policy
(Artiles & Ortiz, 2002a, p. 20).
Language minority student: The term refers to individuals from homes where a language
other than English is actively used, who therefore have an opportunity to develop some level of
proficiency in a language other than English (August & Hakuta, 1998). Minority refers to
quantitative differences in which the most relevant characteristic is that of a superordinate–
subordinate status relationship with the majority within a nation-state.
Language, Language Policy: Language is the medium by and through which individuals
define and inhabit their own identities and, in the process, assess and ascribe the identities of
others. It is often these differences in identities (whether achieved or ascribed) that lead to
conflicts in which language would play an important role (Ricento, 2006a). Sutton and Levinson
(2001), define policy as “a complex social practice, an ongoing process of normative cultural
production constituted by diverse actors across diverse social and institutional contexts” (p. 1)
(cited in Koyama, 2004, p. 404). Ricento (2006b) states that Language Policy is an
interdisciplinary field that focuses on research relevant to language matters in education, history,
sociology and other fields. Schools are sites where language policies determine or influence
what language(s) we will learn and speak.
Language rights: have been referred to as language minority rights, and linguistic
human rights. These terms can be described as the cultural, linguistic, and wider social and
political rights attributable to minority-group members, usually, but not exclusively, within the
22
context of nation-states (May, 2006). In the U.S., bilingual education programs emerged through
the Civil Rights Act in the 1960s. The notion of language rights plays a role in the development
and maintenance of bilingual education programs in the U.S. The definition of language rights,
is based on the usual distinction between so-called minority and majority groups employed in the
sociological and political literature; a distinction that is based not on numerical size, but on
clearly observable differences among groups in relation to power, status, and entitlement (May,
2006).
Language Proficiency Assessment Committee (LPAC): The LPAC committee is charged
with the identification, assessment and placement of students considered LEP in bilingual
education programs in Texas. These campus-based committees are regulated by state policy and
mandated by federal education policies aimed at students considered English language learners
(ELL) or limited English proficient (LEP).
Learning Disability: A learning disability indicates that an individual’s overall
development is within the normal range, but that there is a specific area of learning (most
frequently reading) in which the child falls significantly below the norm for his/her age (Harry &
Klingner, 2006). Learning disability as refers to “a disorder in one or more of the basic
psychological processes involved in understanding or in using language, spoken or written, that
may manifest itself in an imperfect ability to listen, think, speak, read, write, spell, or do
mathematical calculations” (Smith, 2001, cited in Artiles & Ortiz, 2002b, p. 3).
Mental Retardation: The term mental retardation is defined as substantial limitations in
present functioning. It is characterized by significantly below average intellectual functioning as
well as adaptive skills such as communication, self-care, home living, social skills, community
use, health and safety, functional academics, leisure and work (Smith, 2001, cited in Artiles &
23
Ortiz, 2002a, p. 3). Educable mental retardation is used to refer to a significant delay or
impairment in overall global development and functioning (Harry & Klingner, 2006, p. 4).
Distinctions in terms of the level of severity of mental retardation include mild, moderate,
severe, and profound. Students determined to fall within the mild range of mental retardation
have historically been classified as ‘educable’ (EMR). Special education and the label of EMR
have had stigmatizing and negative effects for CLD students from a sociohistorical perspective
(Harry & Klingner, 2006).
Odds ratio: The odds ratio divides the risk index of one racial/ethnic group (e.g.,
Hispanic) by the risk index of another racial/ethnic group (e.g., White) and provides a
comparative index of risk (Donovan & Cross, 2002, p. 43). The odds ratios for ethnic/racial
groups are typically presented in comparison to White students, in which a ratio greater than 1.0
indicates that ethnic/racial groups are at greater risk of identification for special education
(Donovan & Cross, 2002).
Psycho-educational evaluation/assessment: Students being referred for special education
go through an evaluation process in order to determine eligibility. A psycho-educational
evaluation includes both academic and psychological testing for students referred to special
education. Bilingual psycho-educational evaluations are those that are required for CLD
students. Since Public Law 94-142, students are required to be evaluated in their primary
language (Ochoa, Rivera, & Ford, 1997).
Risk Index: The risk index (RI) is calculated by dividing the number of students in a
given racial/ethnic category (e.g., Hispanic) placed in a given disability category (e.g., LD) by
the total enrollment for that racial/ethnic group in the school population (Donovan & Cross,

24
2002). The RI provides the percentage of all students in a given ethnic/racial group identified in
a specific eligibility category (e.g., MR) (Donovan & Cross, 2002).
Special Education: Special education means specially designed instruction, at no cost to
the parents, to meet the unique needs of a student with a disability.
Speech and Language Impaired: Although a speech impairment is not considered within
the ‘high incidence’ disability categories, this eligibility may be problematic for ELL and CLD
students. A speech impairment is defined as a the lack of production of sounds (words) that have
meaning in a given culture (language), which is indicative of a disorder (Kirk, Gallagher,
Anastasiow, & Coleman, 2006). Kirk, et al. (2006) distinguish between a communication
disorder and a language disorder because they have different origins and require different
interventions. A speech disorder is one that affects articulation, voice, or fluency (Kirk,
Gallagher, Anastasiow, & Coleman, 2006, p. 260). A language disorder is “the impairment or
deviant development of comprehension or use (or both) of a spoken, written, or other verbal
symbol system” (p. 260). A communication disorder, according to the American Speech and
Hearing Association (ASHA), is an impairment in the ability to receive, send, process, and
comprehend concepts of verbal, nonverbal, and graphic symbol systems (Kirk, Gallagher,
Anastasiow, & Coleman, 2006, pp. 262-263).
Student with a disability: Kirk, Gallagher, Anastasiow and Coleman (2006) state that the
term exceptional child is generally accepted to include both the child with developmental
disabilities and the child who is exceptionally able. The exceptional child is defined as a child
who differs from the average or normal child in (1) mental characteristics, (2) sensory abilities,
(3) communication abilities, (4) behavior and emotional development, and (5) physical
characteristics (Kirk et al., 2006, p. 3). Students with differences do not automatically require or

25
qualify for services, unless these differences occur to such an extent that the child requires either
modification of school practices or special educational services to meet his/her unique needs. A
student identified as eligible for special education services under the federal guidelines of the
Individuals with Disabilities Education Act (IDEA) must be determined to receive special
education and related services by a team of qualified professionals and the parent based on a
variety of sources.
Organization of the Study
This dissertation is presented in five chapters. Chapter One introduces the problem of
disproportionality and the purpose of the study. The research questions and assumptions are
presented followed by the significance of the study and the limitations. The definition of terms
is followed by the organization of the study.
Chapter Two introduces the problem of over-representation along with a review of the
relevant literature in terms of the trends within a sociohistorical perspective. The role of deficit
thinking is reviewed within the backdrop of federal and state policies relating to bilingual
education, special education and bilingual special education. A review of language policies and
litigation relating to CLD students is included. The tools used to ‘measure’ the problem of
disproportionality, such as the composition index, odds ratio and risk index, are reviewed.
School district policies and practices are delineated within the scope of a review of previous
small scale studies, which frame the development of the current study. A review of
methodological difficulties encountered in research with CLD populations is discussed.
Chapter Three outlines the research design, including a description of the participating
districts and schools. Four school districts and 13 elementary campuses are included in the
sample. Four hundred and thirty-nine educators in the selected districts and elementary

26
campuses completed a survey on educator perceptions of bilingual education and special
education programming, policies and practices related to CLD students and disproportionality.
Utilizing the review of literature, Chapter Three begins with the methodology for data collection
including survey development and participation, data from Texas Education Agency (TEA),
followed by the procedures for data collection and analyses.
Chapter Four contains a restatement of the research questions followed by the analyses
and findings. Each research question is presented along with the corresponding analyses. The
three research questions provide insight into the problem of disproportionality from the
perspective of educators in addition to data from the Texas Education Agency (TEA).
Chapter Five provides a discussion of the findings and conclusions. Implications and
recommendations are provided for research, practice and policy.

27
CHAPTER II: REVIEW OF LITERATURE
Introduction
One of the challenges that has re-surfaced for educators is the prevention, reduction and
elimination of the problem of disproportionality of CLD students placed in special education.
Valencia, Menchaca and Valenzuela (1993) stated that, “As our nation approach[ed] a new
century, the improvement of schooling for economically disadvantaged racial/ethnic minority
students [would present] one of the greatest challenges ever faced by educators and policymakers
(cited in Valencia, 1997a, p. 1). CLD students who enter U.S. schools have their cultural and
linguistic capital devalued, and are perceived as a ‘problem.’ Over-representation of CLD
students in special education continues as a dilemma, a problem, and a nationwide phenomenon
which calls for an affirmation of the problem within the educational context where it originates
− general education; as well as a collaborative effort in ameliorating this static phenomenon
(Artiles, Klingner, & Tate, 2006).
Educational services for CLD students must take into account their linguistic and cultural
backgrounds, in which Artiles and Ortiz (2002b) argue requires an emphasis on a comprehensive
system of program options. One that will force professionals to transcend what until now has
been almost an exclusive focus on student deficits (p. 19). CLD student over-representation in
special education occurs within ‘high incidence’ categories, such as learning disabled (LD),
mental retardation (MR), speech impaired (SI), and emotional disturbance (ED). Low incidence
disabilities include multiple disabilities, visual impairment, orthopedic impairment, other health
impairment, visual impairment, autism, traumatic brain injury, deaf-blind, and developmental
delay. In these ‘low incidence’ categories, there does not appear to be evidence of systematic
variation by ethnicity/race (Donovan & Cross, 2002; Harry & Klingner, 2006).

28
The problem of over-representation of CLD students in special education is complicated
by the apparent paradox of special education. In that, special education resources provided
through the Individuals with Disabilities Education Act (IDEA), and the right to an
individualized education program are framed within a process that requires a child to be “labeled
as having a disability” in order to receive services (Donovan & Cross, 2002, p. 2). The label
signals substandard performance, although intended to provide accommodation, assistance and
support, it may bring lowered expectations on the part of teachers, other children, and the
identified students (Donovan & Cross, 2002).
In this study, the theoretical frameworks used to help understand educator perceptions of
CLD students include deficit thinking models that have influenced general education and special
education policies and practices (Trent, Artiles, & Englert, 1998; Valencia, 1997b). Deficit
theories have held the longest currency in educational thought and practice. Valencia and
colleagues (Valencia, 1997b) provide an analysis of these deficit theories which is a term used
for the theory of school failure of CLD students. Trent, Artiles, and Englert (1998) argue toward
a change in theory, research and practice in special education that historically, has relied on
models that attributed learning and behavior problems to deficits within children. Trent, et al.
(1998) state that special education instructional approaches were derived from deficit thinking
perspectives.
This chapter provides a review of the literature in both sociohistorical and contemporary
perspectives that frame the study on disproportionality. A general review of the research include
a critique of deficit thinking models in educational thought and practice and federal education
policies, such as bilingual education and special education. Court cases and litigation are
reviewed after a discussion on language and language policy which shape educator practices.

29
Next, a review of school district policies and practices in terms of the prereferral to eligibility
determination is included. Finally, empirical research conducted to date is reviewed to frame the
dissertation.
Sociohistorical perspective
In tracing the problem of over-representation of CLD student in special education, Artiles
and Trent (1994) begin by asking the pertinent question, “Is over-representation a problem?” (p.
410). As Artiles and Trent (1994) argue that disproportionality is a problem, this study attempts
to fill a need in the research utilizing multiple lenses and an interdisciplinary perspectives that
incorporates a multivariate layered approach to understanding the continuing discussion. Artiles
and Trent (1994) argue that the issue of over-representation needs to be reexamined from a
broader perspective in order to understand how and why it has stubbornly persisted.
The majority of investigations on disproportionality suggest that over-representation has
continued to be a problem for CLD students in which the referral, evaluation, eligibility and
placement process comes into question. The social movement of the 1960s brought the plight of
the poor and minority groups in the U.S. to the forefront. This era resulted in the creation of
federal education programs that addressed the needs of CLD and minority students/groups in the
U.S. Before this era, students with special needs were simply denied access to the educational
system (Artiles & Trent, 1994; Losen & Orfield, 2002). The earliest calls to attention of
minority over-representation in special education included the segregation and placement of
CLD students in classrooms for students with mental retardation, as well as concerns in the use
of the “medical model” to diagnose, place, and serve students in special education programs
(Artiles & Trent, 1994, p. 410; Valdés & Figueroa, 1994).

30
The research has suggested a trend for over-representation of CLD students under the
classification categories of mentally retarded in the 1970s, which shifted in the 1980s and 1990s
into the categories of learning disabilities and speech and language problems (Coutinho &
Oswald, 2004; Heller, Holtzman, & Messick, 1982; National Research Council, 2002; Rhodes,
Ochoa, & Ortiz, 2005; Valdés & Figueroa, 1994). Variation by race/ethnic group eligibility in
low incidence disability categories (Donovan & Cross, 2002; Harry & Klingner, 2006) has been
a concern, with much of the research focusing on African-American/Black students, as well as
on racial/ethnic group differences. Studies on over-representation have indicated clear
geographic and demographic conditions in the trend of over-representation of CLD students in
the U.S. (Artiles, Rueda, Salazar, & Higareda, 2005; Heller, Holtzman, & Messick, 1982).
For Hispanic/Latino children, the work of Dr. Jane Mercer in the 1970s has been
“unparalleled in documenting how the school-based diagnostic process presents two alternatives.
Either Hispanic children are less intelligent and hence should be over-represented in classes for
mentally retarded, or the process, particularly the testing, fails with Hispanic children” (cited in
Valdés & Figueroa, 1994, p. 127). A trend in disproportionality of placement of students in
special education appears to be evident based on the availability of educational programming
(e.g., bilingual education, ESL, and special education).
Research trends in the area of disproportionality have primarily focused on over-
representation and racial/ethnic differences (Hosp & Reschley, 2003; Losen & Orfield, 2002).
Studies have also focused on African-American student [males] (Harry & Klingner, 2006;
Oswald, Coutinho, Best, & Singh, 1999) placement in restrictive settings. Katzman (2003)
indicates that the problem of over-representation of students of color, especially of African-
American males, dates back to 1954 and the Brown vs. Board of Education decision (p. 225).

31
Disproportionality tends to measured by comparing ethnic/minority group representation to the
rates of White students.
Less research on disproportionality has been conducted on other ethnic groups, and less
research is available on within-ethnic group diversity in terms of disproportionality (Artiles,
Rueda, Salazar, & Higareda, 2005). While Katzman (2003) traces the problem of
disproportionality for African-American students from 1954, Yzquierdo Mclean (1995) and B.
M. Flores (2005) provides historical reviews of bilingual assessment, and deficit thinking related
to bilingual and Spanish speaking children beginning at the turn of the century (1900).
Historically, public schools were not compulsory, and before its enforcement at the turn
of the twentieth century, relatively few children of working-class families completed or were
expected to complete a high school education (Aronowitz, 1997). At the advent of compulsory
schooling, segregation for non-White groups have been constructed in implicit and explicit ways.
Yet, Giroux (1997) and others involved within a progressive education frame, argue that
education has been necessary to human progress, not only technically and economically but also
in terms of emancipation.
A review of bilingual special education programming (Baca & Cervantez, 1998; Bernal,
1983; Ruiz, Figueroa, Rueda, & Beaumont, 1992) and bilingual assessment (Hamayan &
Damico, 1991; Rhodes, Ochoa, & Ortiz, 2005; Yzquierdo Mclean, 1995) practices point to the
continued phenomenon of disproportionality and the continuation of questionable practices, such
as testing (IQ tests) for basing educational placement decisions. For Hispanic students Ruiz, et
al. (1992), state that “they continue to enter the special education process under suspect
circumstances” (p. 350). The establishment of two Hispanic Minority research institutes
indicated a significant increase in Hispanic student identification for special education.

32
According to Valdés and Figueroa (1994) the data from the Hispanic Minority Institutes
established in the 1980s concluded that the laws and court cases proscribing malpractice with
bilingual children did not have an affect on diagnostic testing practices (p. 152) or the
improvement of Hispanic/Latino student outcomes. In addition, there continues to be a scarcity
of appropriate assessment instruments and a lack of personnel trained to conduct linguistically
and culturally relevant assessments (Rhodes, Ochoa, & Ortiz, 2005; Valdés & Figueroa, 1994).
Donovan and Cross (2002) state that since the passage of the federal special education
law in 1975 (PL 94-142), now called the Individuals with Disabilities Education Act (IDEA),
there has been racial disproportion in the assignment of students to special education, most
persistently in the category of mental retardation but also in the categories of emotional
disturbance and increasingly, learning disabilities. Disproportionality exists when students’
representation in special education programs or specific eligibility categories exceeds their
proportional enrollment in the school’s general population (Blanchett, 2006, p. 24). For all
students, the learning disabled (LD) category accounts for the largest number of students in
special education and for the largest growth rate of placement in special education (Donovan &
Cross, 2002).
One study, conducted by Brewer and Kakalik (1974) in the early history of Public Law
94-142, noted that one of the major implementation problems associated with federal policy on
special education was the mislabeling of students as handicapped (cited in Donovan & Cross,
2002, p. 18). Heller, et al. (1982) found that the larger the educable mental retardation (EMR)
program in the district, state or geographic area, the higher the minority over-representation in
these classes. In districts with small or nonexistent bilingual programs, Hispanics were
disproportionately served in EMR programs (Rueda, Artiles, Salazar, & Higareda, 2002; Valdés

33
& Figueroa, 1994). This suggests that a lack of language support programs influences the
placement rates for CLD students.
Each decade in which efforts to ameliorate the problem of over-representation have been
investigated has resulted in increased policies and an increase in ‘best practices’ in regards to the
(pre)referral (Garcia & Ortiz, 1988; NABE & ILIAD Project, 2002), assessment and evaluation
(Hamayan & Damico, 1991; Valdés & Figueroa, 1994), eligibility identification (Bernal, 1983),
placement, and pedagogical practices (Cummins, 1984; Maheady, Towne, Algozzine, Mercer, &
Ysseldyke, 1983) within U.S. schools. Although these efforts provide data on the problem, the
solutions adopted by districts/schools focus on standardizing practices that may be
decontextualized from the students’ lived experiences in terms of culture and language. The
focus is on ‘helping’ the student rather than changing the school (Artiles, Klingner, & Tate,
2006).
The historical reviews, as well as the suggested changes to the system, do not appear to
have resulted in a comprehensive reform agenda in which the problem of over-representation
needs to be examined from a multivariate perspective. In addition, current school reform
legislation includes a system that (re)creates CLD students and communities as ‘at risk’ of school
failure. A review of the problem of over-representation suggests that it is rooted in
sociohistorical, sociocultural, and sociopolitical processes.
Current perspectives
The trend in over-representation of minority students in special education has not
changed or been eliminated. In reviewing the debate, Artiles and Trent (1994) state that the
sociohistorical and political contexts of the problem of disproportionality has not been fully
examined. For states and districts, current federal regulation, the Individuals with Disabilities

34
Education Act (IDEA) (1997, 2004), mandates a collection and reporting of data on minority
representation in special education by category and educational setting. The passage of
legislation focused on the long-standing concern of disproportionality does not seem to have
changed the institutionalized practices, such as the continued use of testing for eligibility and
placement determination; or the use of a medical model in the pre-referral and identification
process. The disability labels continue to be socially constructed based on the schooling context
and the epistemological beliefs of educators, which results in special education programming
that sorts and stratifies CLD students (Harry & Klingner, 2006). A focus on establishing
standardizing practices (efficiency) now include pre-referral committees, prescribed intervention
programs, increase in bilingual/nonverbal testing materials as well as paperwork driven
procedures.
In a review of the dilemmas and paradoxes of the changing identity of special education
Artiles (2003) provides a review of the literature on inclusion and over-representation. Artiles
states that “unless researchers and practitioners surface their assumptions about difference, as
well as culture and space, the special education field will continue to perpetuate the silences that
threaten the educational and life needs of students who have historically been marginalized” (p.
164). In this sense, CLD students may continue to be relegated to the margins of educational
programming, practices, and research unless educators recognize their perceptions and
acknowledge the silences in terms of policies and practices that perpetuate the problem. In
addition to Artiles’ theoretical work in special education, several studies have been conducted to
address the problem of disproportionality.
In a study of eleven urban school districts in Southern California, Artiles, et al. (2005; ,
2002), investigated the patterns of disproportionate representation in special education for
35
English Language Learners (ELLs). The study found that students considered English Language
Learners displayed over-representation patterns related to grade level, language proficiency
status, disability category, type of special education program, and type of language support
program at the district level (Artiles, et al., 2005). The disproportionate representation patterns
show that students considered ELLs and who displayed limited proficiency in L1 and L2 were
the most affected. In other words, students with limited language skills in their native language
and English were over-represented in special education at the secondary level within the eleven
districts in southern California.
Artiles, et al. (2005) state that “a weakness of research on minority placement in special
education is the tendency to overestimate the homogeneity of populations by failing to
disaggregate factors such as language proficiency or to consider other relevant variables, … such
as program type” (pg. 283). A recent publication on English language learners with special
needs (Artiles & Ortiz, 2002b) seems to find a shift in the terms used for the processes (e.g.,
child study team, teacher assistance team, student support team) and educational services in
identification, assessment and instructional programming. The diagnosis and eligibility
determination for students within the high incidence eligibilities are “typically made by school
personnel after the child has started school, relying on a subjective referral and eligibility
determination process that varies from district to district and from school to school within the
same district” (Blanchett, 2006, pp. 24-25). The research denotes that students do not arrive at
school with a diagnosis and ELLs appeared to be affected by both policies and practices for
bilingual education and special education. Artiles, et al. and others support the need for research
that disaggregates data by groups and language status.

36
An early call for examination of disaggregation of data in order to be more precise in the
reporting of trends in over-representation was made by Artiles and Trent (1994). Within a
review of the continuing debate, Artiles and Trent (1994) contend that multiple variables must be
considered when investigating the phenomenon of disproportionality. In addition to research
pointing to ethnic/racial disproportionality, litigation and court cases appear to have had little
impact on changing the practice of psychoeducational evaluation in determining or ‘diagnosing’
disabilities. The use of an IQ measure continues to be current practice, which impacts the
decision-making process, although research has shown this practice to have negative
consequences for CLD students (Valencia & Suzuki, 2001). There is a dearth of research on
Latino/a students and ELLs. In addition, OCR surveys have not collected data or monitored
placement rates for low incidence disability categories because “few would question the
professional judgment or accuracy of a diagnosis in these cases. Moreover, the representation of
racial/ethnic groups in these categories has not been an issue in the court system (Donovan &
Cross, 2002, pp. 54-55).
Data for disproportionality needs to be investigated in as many levels as possible, which
includes national, state, district and school (Artiles, et al., 2005; Rhodes, et al. 2005). Research
indicates that studies need to disaggregate data when investigating disproportionality. In
addition to Composition indices, Odds ratios, and Risk indices, the following factors need to be
considered: 1) educational program availability; 2) within group differences; and 3) language
status (ELL).
The research foci on disproportionality appears to be toward an interdisciplinary
perspective, in that general education, bilingual education, and special education researchers and
practitioners are called to acknowledge and address the problem (Artiles, Klinger, & Tate, 2006).

37
The onus for the educational outcomes of students in U.S. schools rests squarely on the shoulder
of all educators.
Deficit thinking
Within the relationship of culture, knowledge, and power, educators “always work and
speak within historical and socially determined relations of power” (Giroux, 1997, p. 232).
Education practices encompassed within bilingual education, special education, and the process
of referral-evaluation-placement, work within multiple layers of policies, practices and
programming. Educators within these areas are involved in the social world of participation and
negotiation within the micropolitical sphere of the classroom as well as the macropolitical sphere
of U.S. democratic schooling.
In tracing the history and resurgence of deficit thinking models, Valencia (1997b) and
colleagues indicate that the notion of deficit thinking is: 1) a mind-set molded by the fusion of
ideology and science; 2) a dynamic form of social thought allegedly accounting for between-
group behaviors; 3) an actual way of thinking to combat problems (for example, top-down
approach or blaming the victim) (p. xi). In addition, Valencia (1997b) states that the deficit
thinking theory has held the longest currency among researchers, educators and policymakers; in
which, this model suggests that CLD students who fail in school do so because of inherent,
internal, cultural, social, and linguistic factors which deflects the responsibility of education from
systemic factors such as school segregation, inequalities in school financing, educational
tracking, the increased use of standardized testing, shortage of ‘highly qualified’ educators, and
curriculum inconsistencies. In addition, educator perceptions of CLD students place them at
higher risk of being referred, evaluated and found eligible for special education services based on
deficit thinking models as well as flawed institutionalized practices.

38
The continuation of deficit-ridden views of children who come from poor and minority
homes continue to have an impact on the education to which they are exposed (Purcell-Gates,
1995). The changing demographic landscape of the U.S. population, as well as changes in
federal schooling programs has resulted in imbedded practices that reconfigure CLD students as
‘needing’ special education rather than a need to change the institution of schooling in the U.S.
The current trend in education accountability policies have created a new guise for deficit
thinking through an ‘at risk’ category when referring to students exhibiting educational and
behavioral difficulties. Valencia (1997b) states that the construct of ‘at risk,’ now entrenched in
educational circles, views poor and working class children and their families as being
predominately responsible for school failure, while holding structural inequalities blameless (p.
xi).
Flores (2005) provides a historical review of the intellectual presence of deficit thinking
of Spanish speaking children during the 20th century. The research literature points to an early
trend in which Latino/a children’s cultural and linguistic backgrounds “came to be a ‘problem’ to
educators…and [have] been explained from an intrinsic cause-and-effect point of view” (p. 75).
In attempting to understand the ignorance or lack of knowledge by school personnel on bilingual
children, bilingualism, bilingual education, and pedagogical practices since the 1960s, Flores
(2005) contextualizes the nature of the research that emerged which provided contradictory
evidence to federal, compensatory, programs that were being implemented based on de-bunked
notions of deficiency and deprivation of bilingual children. Flores (2005) states that
by the 1970’s and 1980’s the new research in the area of linguistics (Chomsky), sociopsycholinguistics (Goodman, Flores), sociolinguistics (Krashen), sociocultural traditions (Moll and Diaz; Scribner and Cole; Vygotsky), critical pedagogy (Freire; Giroux) child language and thought development (Ferreiro and Teberosky), and educational linguistics, which was available and provided, was ignored by policy makers and resisted by educators (p. 88).

39
In concluding her review, Flores (2005) cites Garcia (1977), who states that “the
research [based on deficit thinking] and documents of the first six decades of the [20th] century,
in effect, rendered the Mexican American and his bilingualism—which have a history of more
than two hundred years of linguistic and cultural development—speechless and cultureless,” p.3
(cited on p. 76). This summary provides evidence of the trend in which the intellectual presence
of the deficit view of Spanish-speaking children emerged; and as Valencia (1997) has alluded,
continues to hold currency with educators. The deficit views of CLD groups, in terms of culture
and language seem to re-appear when sociopolitical issues of power and a fear of change to the
status quo surfaces through time and place in U.S. history. The various communities of practice
encompassed with the institution of schooling suggests that the tacit knowledge and practices
embedded within these entities requires an “urgent need for reflection and rethinking” (Wenger,
1998, p. 9).
In addition to policies related to general education, special education instructional
approaches have historically also relied on a deficit thinking perspective. In addition, there has
been an over-reliance on models that attributed learning and behavior problems to deficits within
children (Trent, Artiles, & Englert, 1998). Over the history of attention to the problem of
disproportionate representation, scholars and policymakers have privileged a child deficit
explanation (Artiles, Klinger, & Tate, 2006). Trent, et al. (1998) advocate for a paradigm shift
that would transcend deficit thinking and promote equitable programming for special education
students that considers the sociocultural contexts in which students with disabilities learn.
Federal Policies
Educational policies in the U.S. have been enacted at the federal level in terms of
compulsory education for all U.S. citizens in the 1900’s with an ensuing cycle of trickle-down

40
education reform described as “a pendulum continuously oscillating from left to right” (Halcon
& de la luz Reyes, 1992, p. 304). In general, the swings of the pendulum are ruled by the
sociopolitical and economic conditions in society. The passage of the Elementary and Secondary
Education Act (1965) was followed by an amendment to ESEA in 1968 that included the
implementation of the Bilingual Education Act (Title VII). For culturally and linguistically
diverse groups, the problem of trickle-down reform is that “proposed initiatives designed for
mainstream students are not necessarily the most appropriate” (Halcon & de la luz Reyes, 1992,
p. 306). The federal policies for education are interconnected with civil rights, language rights,
and human rights, as well as the sociopolitical context of the time.
The current education reform agenda is embedded with rhetoric that claims to hold
educators accountable and provide parents with greater flexibility in making decisions on their
children’s schooling. The No Child Left Behind Act of 2001 claims to be designed to help close
the achievement gap between disadvantaged and minority students and their peers (U.S. Dept. of
Education, 2004). This section traces federal policies for bilingual education, special education
and the intersections within bilingual special education in the U.S. Within this discussion, the
notion of language/linguistic rights (minority language rights) needs to be considered.
The general tendency throughout U.S. history in terms of policies has been an attempt to
do away with differences, based on the notion that unity creates harmony whereas diversity
breeds instability and discord (Nieto, 2004, p. 145). Schooling practices have been developed
from policies within this frame of thinking, which tends to ignore the historical and systemic
inequalities in U.S. schooling for CLD students. The intersections of bilingual and special
education policies and programming for CLD students provided the foundation for this research
investigation.

41
Bilingual Education. In the 1960s, the concepts of cultural and linguistically deprivation
resulted in the development of educational programs geared at providing a ‘remedy’ to the
disadvantaged child’s problem (B. M. Flores, 2005). Lindholm (1990) states that the current
bilingual education programs developed in the 1960s out of a need for a system of education
where language minority students would receive equal access to education (p. 92). Bilingual
education, a program established based on research in the areas of linguistics and
psycholinguistics, advocated for the teaching of literacy to Spanish-speaking children in their
mother tongue (B. M. Flores, 2005, p. 85), in addition to providing a setting in which the
student’s native language and culture would be valued (Lindhom, 1990). According to Flores
(2005), bilingual education was a welcomed option in attempting to solve the problem of the
Latino/a child’s language problem as long as the program was transitional in nature.
Bilingual education can be defined as an educational program that involves the use of two
languages of instruction at some point in a student’s school career (Nieto, 2004, pg. 224). In the
U.S., the goal of bilingual education is to transition to English as soon as possible. According to
Hakuta (1986), the history of bilingual education in the U.S. can be divided into pre-World War I
and post-1960. Since its passage, the Bilingual Education Act (BEA) of 1968, bilingual
education has consistently been criticized as a method of instruction for linguistic minorities.
According to Padilla (1990), the key issue has been whether bilingual education has provided a
benefit to students or “whether federal monies could be better spent on other educational
programs” (p. 15).
The passing of the BEA was seen by many as a victory for linguistic human rights as well
as a research based program. Yet the BEA has been positioned as an educational program that
threatens national unity, which makes the practice of bilingual education controversial and

42
political. In addition, the Bilingual Education Act of 1968 (BEA) did not define or mandate the
specific type of bilingual program to be created, but districts were provided with federal fund to
develop bilingual programs for students considered LEP/ELL. Unfortunately, researchers such
as Rosen and Ortego (1969) “reported that poorly trained and unsophisticated teachers with
cultural biases and profoundly ignorant notions concerning how language is learned were…too
common in the schools” (cited in B. M. Flores, 2005, p. 85). In this case, educators’
interpretation of policies and best practices for ELL students produces a different reality in terms
of the services that CLD students receive at the campus level and within the classrooms.
Special Education. Special education policy, passed in 1975 as the Education for All
Handicapped Children Act (PL 94-142) is a landmark piece of legislation, which, for the first
time “guaranteed that all handicapped children in the U.S. had a right to a free appropriate public
education, an individualized education program (IEP), education in the least restrictive
environment, nonbiased assessment procedures, and a series of due process protections” (Ruiz,
Figueroa, Rueda, & Beaumont, 1992, pp. 350-351). Prior to PL-94-142, Section 504 of the
Rehabilitation Act of 1973 established that:
No otherwise qualified handicapped individual in the United States as defined in Section 7(6) shall, solely by reason of his handicap, be excluded from the participation in, be denied benefits of, or be subjected to discrimination under any program or activity receiving federal financial assistance (Fernandez, 1992, p. 121). Fernandez (1992) states that the Section 504 regulations of 1990 were similar to the non-
discrimination requirement under Title VI and Equal Educational Opportunity Act (EEOA) of
1974, which pertains to all students, including those with disabilities.
The Education of all Handicapped Children Act (Public Law 94-142) was passed in 1975.
This legislation guaranteed that all handicapped children in the U.S. have a right to a free
appropriate public education, an individualized education program (IEP), education in the least

43
restrictive environment, nonbiased assessment procedures, and a series of due process
protections (Ruiz, Figueroa, Rueda, & Beaumont, 1992). The processes for receiving special
education services were delineated in terms of referral, assessment and placement. The
mandated federal policies are interpreted and appropriated in a variety of ways by state, district,
and campus educators. PL 94-142 also established guidelines that included parents as an integral
part of the educational program (Fernandez, 1992).
The establishment of bilingual education and special education programs aimed at
providing equity in services erases the historical inequity and segregation of CLD students in
U.S. history. These programs have provided a shift in responsibility, ideologically and spatially,
for educators to who feel that they are or were not trained to ‘deal’ with differences. Educators
may use special education programming as a way to justify the rationale for student’s lack of
educational progress in mainstream classrooms, in which reflection and awareness of over-
representation of CLD students in special education is lacking.
Circumstantial bilinguals may be seen as slow in acquiring English and have an increased
risk of being referred for special education services. Intelligence scores in the assessment
process have a long history of use for eligibility and placement determination of CLD students’
perceived differences. The ‘ideology of normalcy’ (Reid & Knight, 2006) and its subsequent
legacy have made it “seem natural to see students of color and those living in poverty as ‘other’
by associating them with disability” according to Gallagher (1999) (cited in Reid & Knight,
2006, p. 18).
Bilingual Special Education. Bilingual special education is defined as the use of the
home language and the home culture along with English in an individually designed program of
special instruction for the student in an inclusive environment (Baca & De Valenzuela, 1998). In

44
his review, Fernandez (1992) defines bilingual special education as special instruction and
related services individually designed to meet the educational needs of students who are
considered LEP/ELL and also have disabilities.
Fernandez (1992) offers a comprehensive review of legislation, regulations and court
decisions related to students who are ELL/LEP and students with disabilities, which have
established legal support for bilingual special education (pg. 118). According to Fernandez
(1992), the legal base for bilingual education and language appropriate related services for
ELL/LEP students with disabilities began with the Civil Rights Act of 1964 (Title VI).
Fernandez claims that in order to interpret IDEA’s appropriate education mandate, Title VI,
Equal Education Opportunity Act (EEOA) and the department of Health, Education and Welfare
(HEW) guidelines should be consulted.
According to Baca (1990 and 1998), there are currently no laws formulated to deal
specifically with bilingual special education as an entity. The development of bilingual special
education can be viewed as an extension of the equal educational opportunity movement in the
1960s and 70s. Fernandez (1992) indicates that in 1984, the BEA addressed ELL/LEP students
with special needs by funding Special Populations Programs, intended to meet the needs of
students with disabilities who may not be participating in regular bilingual programs (p. 119).
School systems are then obliged to provide equal access to bilingual education for students who
are ELL/LEP and disabled (Fernandez, 1992). It is further asserted that students who are
ascribed as ELL/LEP and disabled should be provided with related services designed to meet
their linguistic needs (e.g., counseling and speech therapy).
In 1990, IDEA, for the first time addressed the needs of students who are ELL/LEP and
disabled. Fernandez (1992), claims that IDEA regulations indicate that students who are

45
ELL/LEP and disabled should be afforded bilingual education, special education and related
services to meet their needs, including their linguistic needs. The language in the Lau decision
(1974) also included students who are ELL/LEP and disabled, in terms of their right to
specialized language appropriate services (Fernandez, 1992). The Lau remedies were codified
by the passing of the Equal Educational Opportunity Act of 1974 (EEOA).
Ruiz, Figueroa, Rueda and Beaumont (1992) state that Hispanic students continue to
enter the special education process under suspect circumstances. In addition, Romaine (1995)
claims that there has been an unacknowledged relationship between bilingualism and special
education. These suspect circumstances and the unacknowledged relationship between
difference and disability tends to surround the practice of special education in which, one may
not be able to distinguish (with the naked eye) the presence or absence of a high incident
disability (LD, MR, ED, SI). The mystery and the lack of knowledge on the part of educators
seem to create a schism between policy, practice and research.
Ruiz, et al. (1992) state that early literature on bilingual special education as defined by
Baca (1990, 1998) was predominately prescriptive on how to merge bilingual and special
education, and it had a very small empirical database (pg. 356). One major criticism with the
early development of bilingual special education was that it appeared to suggest a system
modification approach which “accepts the system as currently structured and attempts to improve
practices without making fundamental changes in the referral, assessment and placement system”
(Ruiz, Figueroa, Rueda, & Beaumont, 1992, p. 356). The research institutes, the standardization
in practice and the increased federal control of education seem to implicitly or explicitly
perpetuate the negative cycle of disproportionality of CLD student placement in special
education.
46
Court Cases and Litigation
In terms of disproportionality, the Office for Civil Rights (OCR) does not collect data or
monitor rates of representation of CLD students found eligible for special education in one of the
low incidence categories because “few would question the professional judgment or accuracy of
a diagnosis in these cases. Moreover, the representation of racial/ethnic groups in these
categories has not been an issue in the court system” (Donovan & Cross, 2002, pp. 54-55).
Baca (1998) states that litigation related to special education can be grouped into the
following categories: 1) right to education; 2) right to adequate treatment, and 3) improper
classification and placement (pg. 95). In terms of court cases addressing both bilingual and
special education, Fernandez (1992) points to the Jose P v. Ambach (1979) from NY. This
litigation merged three cases in which the rights of student with disabilities living in New York
City were being violated.
Jose P. was a class action suit on behalf of CLD students 1) who claimed they were
denied an appropriate education due to failure to properly evaluate and place students into
special programs; 2) an individual with central nervous system impairment; and 3) Hispanic
students not receiving needed bilingual special education (Fernandez, 1992). Based on Jose P.,
the court ordered the state of NY to: 1) provide data on all the students who were ELL/LEP and
disabled; 2) provide a plan that described the programs available to ELL/LEP and disabled
students; 3) establish an outreach office for dissemination of information regarding special
education; and 4) establish procedures for the provision of competent interpreters (Fernandez,
1992). This case appeared to set the precedent for ELL/LEP and disabled students in terms of
providing appropriate educational services within the all educational programs available to
students based on the notion of a free and appropriate public education (FAPE). The results of

47
the Jose P. case also included the training and use of competent interpreters within the referral to
placement process.
In Valdés and Figueroa’s (1994) review of the most relevant court cases concerning the
testing of Hispanic students, they pay particular attention to the Diana v. California State Board
of Education (1970) case for three reasons:
(a) it covers most of the issues involved in Hispanic testing cases – cf. Arreola v. Board of Education (1968), Guadalupe v. Tempe School District (1978), Ruiz v. State Board of Education (1971), Covarrubias v. San Diego Unified School District (1972), Jose P. v. Ambach, 1979, Lora v. Board of Education of the City of New York; (b) it is a case that is still evolving and that may yet change the predominant over concern of the courts with just tests; and (c) it is a case that typifies the resistance extant in many who are charged with the responsibility of executing court mandates, federal laws, and state regulations concerning Hispanic testing (Valdés & Figueroa, 1994, p. 130). The Diana v. SBOE case was the first to challenge the testing and practice of placement
of Hispanic students in special education, specifically in classes for students with mental
retardation. This case set the precedent for the Larry P. v. Wilson Riley (1971/1979) case which
had an impact on decreasing the use of intelligence testing with African-American students in
California for program placement in classes for students with MR (Lambert, 1981). In 1975, the
California State Board of Education imposed a moratorium on the use of intelligence tests as a
result of the civil rights suit based on the over-representation of minority children in special
education under the MR category (Lambert, 1981). Lambert (1981) states: 1) the court
prohibited the use of individual intelligence tests with black children; 2) required numbers of
children of all ethnic groups in special classes to reflect the proportions in the school population;
3) and concluded that the state deliberately intended to discriminate against the black children
who were placed in programs for the educable mentally retarded (p. 973). Lambert (1981)

48
positions the article as taking exception to the court ruling in Larry P. and states that the article
provides evidence:
that the required method for determining over-representation of minority children in special classes is flawed; that there is no evidence that the tests are biased; and that informed consent procedures and regular review of children's progress in special education would protect rights to equal protection under the law; as well as rights to special education services when needed (Lambert, 1981, p. 973).
These court cases and litigation have spanned decades. The results of the lengthy and
contested court case decisions, especially Larry P., suggest the deep rooted ideologies which
seem to suggest that current practices are justified, unbiased, and are in the best interest of the
student while ignoring the social, cultural, linguistic, as well as sociohistorical context of
segregation and systemic inequalities in schooling practices for CLD students. Current
education policies for CLD students disregard the barriers to enrichment programs, and access to
higher education that have resulted in the perpetuation of school practices that continue to sort
and track CLD students.
Language and Language Policy
Language is the medium by and through which individuals define and inhabit their own
identities and, in the process, assess and ascribe the identities of others (Ricento, 2006a, p. 231).
Language plays an important role in terms of the epistemologies (ways of knowing) developed
by educators in U.S. schools as well as what becomes valued or devalued based on minority
group status. Language policy prescribes the schooling linguistic minorities receive (Koyama,
2004, p. 417). Ascribing CLD student language and culture as deficient or deficit-ridden begins
from a perspective on bilingualism.
Hakuta (1986) describes bilingualism as a pattern of co-existence, cooperation and
competition formed by two languages in the individual. Wei (2000) states that language is a

49
human faculty that co-evolves and is given life by those who use it (humans). We also have the
ability to change it or abandon it if we desire to do so (p. 3). Individuals who are bilingual can
vary in their ability to speak, read, write, and comprehend in each language (AERA, APA,
NCME, 1999; Valdés & Figueroa, 1994).
Hakuta (1986) states that the term bilingualism has meaning beyond the use of more than
one language, “the bilingual child in the American classroom commonly evokes the image of a
child who speaks English poorly, has difficulty in school, and is in need of remediation” (p. 10).
The image of a bilingual child, I would add, may be constructed as a student who comes from a
working class background (low SES), speaks with an accent, and needs to be provided with skills
that deem him/her as a legitimate member of U.S. society. However, the assimilation or
‘Americanization’ process has not proved to be a means by which individuals from CLD
backgrounds are granted full participation in U.S. democratic society, bur rather has prevent
groups and individuals from obtaining an equitable share of the power and resources.
For a student who comes from a home in which English is not the mother tongue, the
process of labeling begins at school enrollment in which the mandated (Lau remedies) home
language survey is completed by the parent. This practice sets into motion the process by which
a student is tested to determine his/her English language proficiency status and subsequent
participation in a regular education program. Students who are categorized as limited English
proficient (LEP) or as English Language Learner (ELL), may be eligible for bilingual education
programming as part of the regular education curriculum. In this sense, when a bilingual student
is ascribed as LEP/ELL, school personnel may no longer talk about the student and his abilities,
but rather refer to him/her based on the label, which as stated indicates something lacking and

50
limited which then becomes reified (made into a thing) (Harry & Klingner, 2006; Wenger, 1998)
as the cause and consequence of any difficulty exhibited within the educational process.
Skutnabb-Kangas (2006) states that educational linguistic human rights include both the
right to have the basic education mainly through the medium of the home language and the right
to learn the dominant language as well. In an additive environment, children learn the dominant
language without eliminating or erasing their native language. Hernandez-Chavez (1988)
claims that for minority groups, language rights should include the right to learn, use, and keep
their own language in all domains. All languages spoken by a group of people have worth or
value; therefore, Skutnabb-Kangas (1988) claims they should have the same rights. She also
defines linguicism as:
ideologies and structures, which are used to legitimate, effectuate and reproduce an unequal division of power and resources (both material and non material) between groups, which are defined on the basis of language (on the basis of their mother tongues) (pg. 13, emphasis in original). Although there is a claim that all languages ought to have the same rights, the status of
the language spoken by an individual plays a part in the distribution of power and rights
(Romaine, 1995).
The term language rights encompasses both the terms of language minority rights, and
linguistic human rights. These terms may be described as the cultural, linguistic, and wider
social and political rights attributable to minority-group members, usually, but not exclusively,
within the context of nation-states (May, 2006). In terms of official language policy for students
considered bilingual and needing special education services, these are addressed in both the
bilingual education and special education regulations (Fernandez, 1992).
In the U.S. bilingual education programs emerged through civil rights acts in the 1960s.
The notion of language rights plays a role in the development and maintenance of bilingual

51
education programs in the U.S. The definition of language rights, is also based on the usual
distinction between so-called minority and majority groups employed in the sociological and
political literature; a distinction that is based not on numerical size, but on clearly observable
differences among groups in relation to power, status, and entitlement (May, 2006).
The daily practice of interpretation and appropriation of education policy, including
language policy by educators produces variability in the education provided to
CLD students, specifically those who enter whole speaking a language other than English.
Sutton and Levinson (2001), define policy as “a complex social practice, an ongoing process of
normative cultural production constituted by diverse actors across diverse social and institutional
contexts” (p. 1) (cited in Koyama, 2004, p. 404). Using Koyama’s (2004) frame of practitioners
as policymakers, the definition of policymakers is inclusive of all educators.
Appropriation of Policy
Koyama (2004) investigated the processes by which official language policy creates
structures that are institutionally interpreted and appropriated at the federal, state and school
district levels. The ethnographic study focused on the processes by which school district
administrators, campus based teachers and students appropriate policies. An ethnographic study
situated in a California high school within the sociopolitical context of bilingual education and
Proposition 227, revealed that teachers appropriated federal, state and district policy to delineate
positions for ELLs. Teachers negotiate and give meaning to these positions by selectively
implementing and ignoring parts of policy in which ELL students are positioned as particular
‘types,’ situated within a deficit model of school outcomes. ELLs are framed as “immigrants”
and “foreigners” by their use (or non use) of English (Koyama, 2004, p. 402). Analyzing school
policy as practice, Koyama (2004) links the discursive practices of normative control [by

52
educators] to the processes by which official language policy (re)creates structures that are
institutionally interpreted and appropriated at the practitioner level.
Unlike previous studies that focus on the end product of policy implementation (e.g.,
Proposition 227), Koyama (2004) investigates the ongoing processes which construct ELL
student placements and ultimately affect their educational outcomes by focusing on two
interrelated reflexive phenomena, that of standardized testing for English language proficiency
and the instruction provided in classes designated for students who are categorized as limited
English proficient (LEP/ELL). Based on the state required standardized tests for English
language proficiency, students are limited in their ability to change positions from LEP to fluent
English proficient (FEP) due to these two structures (Koyama, 2004). Moreover, Artiles, et al.
(2005) indicated that a small proportion of ELLs were redesignated as fluent English proficient
in the eleven districts in Southern California. Artiles, et al. (2005) state that by fifth grade (1998-
1999 school year) only half of ELLs had been reclassified as FEP. The data on students in the
Artiles, et al. study indicates that these ELL were not recent arrivals (< 3 years) to the U.S., and
were primarily of Latino/a heritage. The ELL population comprised 94% of the elementary and
91% of secondary school students (Artiles, Rueda, Salazar, & Higareda, 2005, p. 287).
An understanding and appropriation of federal and state policies at the local district and
campus level is rooted in sociohistorical and sociopolitical events which ground epistemologies
of all stake holders. The implications of school personnel appropriation of school policies,
practices and programming may be affected by national education debates as well as the
construction of the U.S. as a monolingual English speaking nation. English is then considered
the legitimate language of instruction as well as the sole criterion by which CLD and ELLs are
judged to be successful in U.S. education institutions.

53
The appropriation of policies by practitioners then appears to re-establish a system of
stratification through sorting students by ‘labels.’ The discursive process of policy appropriation
positions CLD students as ‘at risk’ of school failure based on a sole criterion to measure student
success—high stakes tests. The practices that evolve within the micropolitical spaces of schools
have negative affects for CLD students (Valenzuela, 2005). The factors affecting the re-
establishment of subtractive educational programming and placement of students in special
classrooms now include policies that mandate pre-referral, assessment and eligibility
determination processes. The passage of landmark education policies aimed at equity and
inclusion of students in U.S. education, have not been realized. The institutionalized practices
that have resulted from federal regulation and policies have served as mechanism for the
continuation of subtractive schooling (Valenzuela, 1999) practices.
The implications of appropriating federal and state policies at the local district and
campus level for CLD students requires the disaggregation of data in which one is able to
investigate the multiple factors that affect over-representation through multiple lenses and
techniques, both qualitatively and quantitatively.
School District Policies and Practices
Within each school district, educational program options are made available based on
federal and state laws and program availability. Special education policies mandate that students
be ‘labeled’ before they are eligible to receive services (Donovan & Cross, 2002). Educators
have also been charged with identifying students eligible for special services through IDEA
(Artiles & Ortiz, 2002a). Educators may lack adequate training or an understanding of the CLD
students’ skills, as well as the nature of the families and communities ways of doing and being.
This becomes pertinent when educators participate in campus based decision-making teams.

54
Schools can serve as both institutions of emancipation or oppression. Educators within schools
are able to create spaces for freedom, transformation, critical engagement, as well as oppression
(McLaren, 2003).
Pre-referral. “In the best educational settings, numerous steps are taken to remediate
concerns prior to an evaluation” (Valencia & Suzuki, 2001, p. 191). According to Lambert
(1981), “it is failure in school, rather than test scores, that initiates action for special education
consideration” (p. 940) (cited in Valencia & Suzuki, 2001, p. 191). In other words, students do
not arrive at school already identified as disabled, or labeled as ED, LD, MR, or SI. Rather,
students are referred to special education when they have ‘failed’ to achieve in the general
education classroom (Donovan & Cross, 2002, p. 209). Acknowledging that CLD students do
not arrive at school with a disability or an innate problem, places educators in a position to affect
change through praxis (Freire, 1970, 1993). Educators should question the policies and
practices, specifically when considering subjective eligibility categories, for which no organic
cause is known and a diagnosis rests on professional judgment (O'Connor & DeLuca Fernandez,
2006).
Factors that contribute to the over-representation of minority students in special
education have been investigated from the point of differences between ethnicity/race in terms of
ability (IQ) and capacity. Both of these variables are confounded with culture and language.
The variable of acculturation, according to Rhodes, et al. (2005) is not one “that is as readily or
intuitively understood by school psychologists and other school personnel. Indeed, the exact
nature of acculturative influences are often misunderstood and frequently ignored altogether” (p.
124) with the pre-referral process. The lack of focus and understanding of acculturative
influences can occur at any point within the referral to placement process by educators. One

55
possible consequence of this practice may be directly related to the over-representation of
minority students in special education when CLD is viewed as a deficit and not an asset.
CLD students and groups are comprised of diverse individuals. Pre-referral teams faced
with investigating the factors related to a student referral, based on perceived academic difficulty
in general education programs, cannot oversimplify or dichotomize contributing factors, such as
poverty (SES), culture, language, or race/ethnicity. Research has reported that teacher
prejudices, racial bias, expectations and differential treatment influence referral decisions of
minority students (Harry, 1992, cited in Artiles & Trent, 1994, p. 421). Educators should not rely
on comparisons of CLD student performance to other students, specifically to that of a
mainstream, middle-class (White) norm (O'Connor & DeLuca Fernandez, 2006).
With the limited number of bilingual evaluation staff, one would need to take the roles of
advocate, gatekeeper, and expert within their respective and districts in order to prevent or
reduce the problem of disproportionality. Currently, in some districts, non-bilingual evaluators
probably engage in the assessment of bilinguals when CL factors are not discussed or ignored in
the pre-referral process.
Donovan and Cross (2002) clearly states that the responsibility for addressing over-
representation does not lie with one program (special and regular education) and IDEA as well as
the Standards (AERA, APA, NCME 1999; Yzquierdo Mclean, 1995) provide guidelines for all
educators involved in decision-making teams and practices. Therefore, this burden and
accountability fall with all evaluation staff, teachers, principals, counselors, etc. in
acknowledging and addressing disproportionality through discourse and praxis. The state and
federal regulations since NCLB further state that both regular education and special education
programs must work together in addressing the needs of ELLs in U.S. schools.

56
Assessment. Within the realm of education assessment in the public schools, those
primarily involved in the assessment include school psychologists, educational diagnosticians
and speech and language pathologists. Figueroa (2002) states that the federal law that opened
the door for public education for children with disabilities, affected the practices of evaluation
specialists. According to Figueroa, “this landmark legislation had profound implication for their
professional work, in which they were made into testers, sometimes almost exclusively” (p. 62).
Evaluation personnel may not be provided with university training in the areas of second
language acquisition, as well as cultural and linguistics differences that are needed for providing
bilingual psychoeducational evaluation services. Personnel involved in this activity, would be
practicing what Rhodes, Ochoa and Ortiz (2005) have describes as the testing of bilinguals
within the framework of a monolingual English evaluation and interpretation process. Educators
may fail to comprehend or recognize that “when a bilingual individual confronts a monolingual
test, developed by monolingual individuals, and standardized and normed on a monolingual
population, both the test taker and the test are asked to do something they cannot” (Valdés &
Figueroa, 1994, p. 87). The scores on this test would not reflect a student’s abilities; therefore,
educational decisions should not be based on one type of evaluation method or score.
Although this varies by district, evaluation specialists who are considered ‘bilingual’ as
well as those considered or consider themselves to be non-bilingual evaluators may enter the
practice of assessment of bilinguals, which brings into question, ethics, standards, as well as
accountability for educational practices and outcomes. This accountability would include
acknowledging and accepting responsibility for addressing the problem of disproportionality as
well as being reflective of their assessment practices. Educators need to engage in dialogue over
controversial topics, rather than following institutionalized practices without considering the

57
consequences. As has already been noted, that the laws and court cases proscribing malpractice
with bilingual children did not have an affect on diagnostic testing practices (Valdés & Figueroa,
1994, p. 152).
In Ochoa, Powell and Robles-Piña(1996) research investigating the use of assessment
instrument in the practice of bilingual psychoeducational evaluations by school psychologists,
the reasons given for the over-representation of minorities in special education include: (a)
socioeconomic status of the student, (b) test bias associated with cultural differences, (c) factors
associated with second language acquisition, and (d) inappropriate referrals (p. 251). Given the
amount of research available on bilingualism, bilinguals and the sociohistorical nature of
schooling for CLD students in the U.S., educators need to become aware of the limits within
their areas and establish collaborative relations with other members in different fields. This may
include establishing a relationship with their elected government officials, attending workshops
within different fields, as well as becoming involved in local and state education organizations
that promote equity and equality in practices and policies that benefit all students.
Educators as well as evaluation specialists may have a difficult time understanding the
nature of bilingualism and testing with CLD students, in light of the current sociopolitical
climate and NCLB, requires educators to make a paradigm shift in their practices. One such
practice is that of ascribing labels, deficits, weaknesses, and disabilities to individual students as
well as basing educational decision solely on standardized measures of ‘accountability.’ For
CLD students, referrals, evaluations and eligibility determination for special education services
should not be based on language, culture, or ‘failure’ rates on high stakes testing. Campus based
decisions based on policies, processes and practices are affected by educators existing worldview
of CLD.

58
Eligibility determination. Before federal legislation and education policies were
introduced, educational and psychological research had pointed to the use of intelligence
measures as a primary factor in the determination of special education eligibility, classification,
and placement affecting the disproportionality (Valencia & Suzuki, 2001; Mercer, 1971, 1973).
Evaluation specialist and special educators need to understand that judgmental, soft, high
incident, or ‘invisible’ disability categories are ambiguous, and usually confounded by an array
of sociocultural factors, such as socioeconomic status, family educational history, gender,
ethnicity, as well as the sociopolitical nature of schooling.
Factors that affect the problem of over-representation of CLD students in special
education can be based on the construction of CLD students by educators, policymakers and the
mainstream as deficient due to innately or inherited factors (e.g., culture, language, and ability)
rather than external factors, such as subtractive schooling policies and systemic practices
embedded within the U.S. education system. These decades of research on the ‘problem’ of
Mexican children in terms of their culture, their language and perceived mental deficiencies have
had negative effects on the educational outcomes, as well as having been ascribed as ‘disabled’
and placed in segregated special education classroom. Recent research has been redirected to
investigate the subtractive schooling practices to dismantle the myth of equitable education for
Latinos (Valenzuela, 1999, 2005) which points to the increased trend in eligibility determination
for CLD populations in the U.S.
With the limitations of testing of CLD students, any evaluation and process of
determinations of a disability that does not take into account the student’s cultural, linguistic and
educational background (sociological factors) would be considered uninterruptible and invalid
for use in making educational decisions. Yet this may appear to be a common practice, by

59
evaluators that has gone un-scrutinized. Historically assessment personnel have not been
subjected to investigation in terms of their linguistic and assessment skills, knowledge and
abilities in performing the practice of bilingual evaluations (Valdés & Figueroa, 1994).
Evaluation specialist and educators need to understand that the categories of ‘invisible’
disabilities are not clear, ambiguous, and are usually confounded by an array of sociocultural
factors, such as socioeconomic status, family educational history, gender, ethnicity, as well as the
sociopolitical nature of schooling make the practice of assessment and special education
eligibility determination with bilingual students questionable at best.
From the prereferral, assessment, eligibility to program placement process, educators
needs to incorporate practices that provide insight into, the culture and language of the student,
his/her previous educational exposure, as well as previous instruction in the native language. In
addition to shortages of bilingual educators, a lack of evaluation specialists and adequate testing
materials adds an additional layer of complexity to the problem of over-representation.
Framing the Research Study
The research indicates a need for disaggregation of data to the district and campus level
in order to present a picture of the trends on disproportionality as well as to include data on
program availability and implementation, based on the number of students in the district. In
addition, data on district and campus placement rates in special education continue to focus on
the rates of representation in high incident categories, such as learning disabled, mental
retardation, speech impaired, and emotional disturbance (Artiles, Rueda, Salazar, & Higareda,
2005; Artiles & Trent, 1994; Valdés & Figueroa, 1994).
Research approaches necessitate the investigation of multiple factors through multiple
methods. Strategies associated with a mixed methods approach involve collecting and analyzing

60
data that may be qualitative and quantitative in nature within one study (Creswell, 2003). The
collection of data can be in different phases in order to capture a broad and in-depth picture of
the problem/question. Disproportionality is a varied and complex phenomenon which would
suggest the data varied collection approaches that cannot be dichotomized as strictly quantitative
or qualitative. Therefore a mixed method research design tends to be less dichotomized as
strictly quantitative or qualitative (Creswell, 2003).
The findings by Donovan & Cross (2002) suggest that data documenting disproportionate
representation is difficult to interpret and that “without a measure of true incidence of special
needs or gifted, we cannot know whether there are too many …students in any racial/ethnic
group assigned to any of the categories” (pg. 20). The report (Donovan & Cross, 2002) outlines
four questions addressed by their investigation:
1. Is there reason to believe that there is currently a higher incidence of special needs or giftedness among some racial/ethnic groups? Specifically, are there biological and social or contextual contributions to early development that differ by race or ethnic group?
2. Does schooling independently contribute to the incidence of special needs or giftedness among students in different racial/ethnic groups through the opportunities that it provides?
3. Does the current referral and assessment process reliably identify students with special needs and gifts? In particular, is there reason to believe that the current process is biased in terms of race or ethnicity?
4. Is placement in special or gifted and talented education a benefit or a risk? Does the outcome differ by racial/ethnic group? (p. 21)
The questions posed by the committee seem to (re)construct the problem of
disproportionality based on deficit thinking models and excludes the sociohistorical and
sociopolitical context, as well a critical view of the embedded practices within a social learning
theory approach to the processes. For example, question one is framed as an attempt to
investigate differences based on debunked notions of ethnic/racial differences based on the
dichotomized biological (nature) vs. social (nurture) debate, with an addition of ‘contextual

61
factors.’ The second question privileges the notion of ‘knowledge and success or failure’ of the
student and not the schooling process. Question three frames the referral and assessment
process as ‘reliable’ when in fact the consistency in research results point positively that these
processes have reliably over identified CLD students as special needs (Valdés & Figueroa,
1994). Question four points to the need to investigate the proclivities and tacit knowledge
educators have of CLD students in determining eligibility and practices. Framing the questions
in this manner seems to make the proclivities of educators in the macropolitical sphere of
research − ambivalent.
In framing the current study, prior small scale empirical investigations qualitative and
quantitative in nature were conducted (Fall 2004 – Fall 2006) and brief findings leading to this
investigation are provided below. Each of the studies was guided by the question: “Is over-
representation of CLD students a problem?” In which each study attempted to offer one piece of
the puzzle in this area. The section begins with a review of literature to gain an understanding of
the rates of representation, and how is over-representation measured. A mini-case study of the
referral and decision-making process in an urban elementary school supplied qualitative data to
frame the research. A survey was developed and piloted to understand educator epistemologies
(ways of knowing), in relation to factors that affect disproportionality.
Measuring Disproportionality
Donovan and Cross (2002) indicate that data that attempts to explain the representation of
minority students in special education through statistically aggregated state or national data
cannot be explained due to the variability between states in terms of eligibility criteria used
under the Individuals with Disabilities Education Act (IDEA). Valdés and Figueroa (1994) state
that the entire question as to what constitutes a disparity has evolved into a full-blown debate,

62
which continues to confound the problem of over-representation with the use of aggregated data
and without considering intervening variables.
Factors that contribute to over-representation range from the community, school policies,
practices and educator perceptions. Rhodes, et al. (2005) state that research in the area of
disproportionality includes the following factors that may contribute to the disparity:
socioeconomic status (poverty); unequal educational opportunities for cultural and linguistically
diverse students; ethnic diversity; linguistic diversity and the special education referral and
placement process itself. Socioeconomic status (poverty) appears to be a significant factor in the
referral, assessment and placement outcomes for special education (Harry & Klingner, 2006;
O'Connor & DeLuca Fernandez, 2006). Artiles and Trent (1994) indicate that a correlation
between ethnicity, school failure, and placement in special education programs has been reported
consistently in the literature (p. 422). In addition, research has reported that teacher prejudices,
racial bias, expectations and differential treatment influence referral decisions of minority
students (Harry, 1992, cited in Artiles & Trent, 1994, p. 421). Research appears to point to the
complexity of determining disproportionality, especially over-representation of CLD students in
special education.
For cultural and linguistic minorities, these practices result in the construction of a
‘disability’ (category) in the referral-to-placement process. The programs, which established
legal access to education for students with disabilities has become the preferred method of
‘intervention’ or solution for ‘problems’ exhibited by CLD students in U.S. schools. Students
who come from low SES backgrounds may be at higher risk for referral and placement in special
education.

63
Coutinho and Oswald (2004), claim that the research community has not reached a
consensus on the preferred method for measuring the extent of disproportionality (p. 4). The
following calculation methods for determining disproportionate representation were reviewed by
Donovan and Cross (2002). The composition index (CI) which is calculated by dividing the
number of students of a given racial or ethnic group enrolled in a particular disability category by
the total number of students (summed across all five racial/ethnic groups) enrolled in that same
disability category. The CI reflects the proportion of all children receiving services under a
specific category who are members of a CLD group (Donovan & Cross, 2002). Artiles, et al.
(2005) used a rule established by Chinn and Hughes (1987) to identify over-representation; in
that a group is over-representation in special education is equal or greater than 10% of the
percentage expected on the basis of the school-age population (cited in Artiles, Rueda, Salazar,
& Higareda, 2005, p. 289). The CI index answers the question, What proportion of Latino/a
students are in Special Education?
The risk index (RI) is calculated by dividing the number of students in a given racial or
ethnic category (e.g., Hispanic/Latino) placed in a disability category or program (e.g., Learning
Disabled) by the total enrollment for that racial or ethnic group in the school population
(Donovan & Cross, 2002, pp. 42-43). The RI provides the percentage of all students in a given
ethnic/racial group identified in a specific eligibility category (Coutinho & Oswald, 2004;
Donovan & Cross, 2002). The risk index answers the question: What percent of Latino/a
students in the school or district are identified as LD? The risk index illustrates the rate in which
a disability occurs by ethnic/racial group.
The Odds ratio (OR) is calculated, which determines an ethnic group’s (e.g., Hispanic),
‘odds’ of being assigned into a specific eligibility category (e.g., Learning Disabled). The odds

64
ratio (OR) divides the risk index of one racial/ethnic group (e.g., Hispanic) by the risk index of
another racial/ethnic group (e.g., White) and provides a comparative index of risk (Donovan &
Cross, 2002, p. 43). The odds ratios for ethnic/racial groups are typically presented in
comparison to White students, in which a ratio greater than 1.0 indicates that ethnic/racial groups
are at greater risk of identification for special education (Donovan & Cross, 2002). Odds less
than 1.0 indicate that the ethnic/racial groups are less at risk for identification. The risk indexes
are expressed as a percent and are placed in a ratio, which results in a single number that
characterizes the extend of disproportionality and can be compared across groups (Coutinho &
Oswald, 2004). The relative risk ratio, or OR, takes into account race/ethnicity base rates in the
population (Coutinho & Oswald, 2004).
Given that these three different indices are used in the disproportionate representation
research, it is important to understand what each means to reduce confusion and to be able to
interpret the findings from different studies on this topic (Rhodes, et al., 2005).
Rates of Representation
National rates. Twelve years before the first National Research Council (NRC) report
(Heller, Holtzman, & Messick, 1982) was conducted, Lloyd Dunn (1968) brought attention to
high placement rates of minority students in segregated classrooms for students considered
mentally retarded. Heller at al., (1982) found that the trend in disproportionality had not changed
for CLD students. With the second NRC report (Donovan & Cross, 2002) we find that fourteen
percent (14%) of the African-American, thirteen percent (13%) of the Native American, twelve
percent (12%) of the White, and eleven percent (11%) of the Hispanic/Latino, and five percent
(5%) of the Asian/PI school age population are placed in special education nationwide1
1 Calculation based on 1998 OSEP data; Total number of students by ethnicity labeled with a disability divided by the total number of students by ethnicity in the population.
65
(Donovan & Cross, 2002, p. 1 & 57). For all ethnic groups, the learning disability (LD) category
accounts for the largest number of students in special education. Donovan and Cross (2002)
report notes that the LD category is the fastest growing category for special education
placements. MacMillan and Reschly (1998) found that the variability of identification rates
across states for LD, SL [speech and language], MR, and ED were substantial, and far greater
than one would expect for any disability, given that disproportionality is not found in eligibility
categories considered ‘low incidence’ (cited in Donovan & Cross, 2002, p. 37)
Current research investigating school district level data point to several patterns of
placement of minority students in special education under the categories of Learning Disabled
(LD), Emotionally Disturbed (ED) and Mentally Retarded (MR) or ‘high incidence’ disability
categories (Donovan & Cross, 2002). At both the national and federal level, Latino/a over-
representation in special education programs has persisted throughout the 1980s and 1990s,
although this was often masked when the data are not interpreted through disaggregated means
(Artiles, Rueda, Salazar, & Higareda, 2005). Valdés and Figueroa (1994) contend that over-
representation and under-representation vary by Hispanic concentration, state, rural-urban
setting, availability of bilingual instructional settings, and local policies, in which large
aggregates of data will bury meaning information (Valdés & Figueroa, 1994, p. 128).
A review of the literature has indicated that at the national level, states with large
Hispanic/Latino populations tend to have over representations in certain special education
categories (e.g., Mental retardation) which may suggest the same pattern for districts and schools
(Rhodes, et al., 2005, p. 17). Researchers have noted that Texas is one of the few states that
collect data on the number of Limited English Proficient (LEP/ELL) students along with other
factors, such as race/ethnicity in regards to student enrollment in special education by eligibility
66
category (Ladner & Hammons, 2001; Rhodes, Ochoa, & Ortiz, 2005). TEA data thus lends itself
to analysis to district and selected elementary campuses, focusing on variables that affect
disproportionality.
State rates. Texas school enrollment for the 2003-2004 (Texas Education Agency, 2003-
2004b) school year was approximately 4,311,500. Of the total students in Texas public schools,
Latino/Hispanics make up the biggest proportion of students in the state at 44%, Whites make up
39%, followed by African-Americans 14.3% and Other 3.2%. During the 2003-2004 school
year, 40% of the special education population was Latino/Hispanic, 41% White, and 18%
African-American. At the state level, Whites (41%) are the largest ethnic group represented in
special education.
The number of students in Texas (2003-2004) who received special education services
accounted for 11.8% of the population. Of the student’s in special education, 50% were
categorized as Learning Disabled (LD). Based on the aggregated data for the state, Texas
provided services to student in special education by eligibility category: MR, 5.9%, ED, 7.1%,
and SI, 20%.
San Antonio rates of representation. Bexar County which includes San Antonio, has
fifteen school districts (TEA). Situating a study within San Antonio provided a look at
perceptions within and among school district personnel as well as perceptions on the rates of
representation of CLD students in special education. Research studies on disproportionality tend
to use ethnic/racial categories which are socially constructed dichotomies. Few studies have
been conducted, that investigate within-group (race/ethnicity) diversity or language status.

67
State and San Antonio Ethnic Diversity
14.3%
43.8%
38.7%
3.2%
8%
66%
24%
0.02%
African American Hispanic White Other
Ethnic Category
Perc
ent o
f Pop
ulat
ion
State Pop SA Pop
Figure 1. Ethnic/racial Diversity in Texas and San Antonio, 2003-2004
In the San Antonio area, Latinos/Hispanics account for 66% (See Figure 1) of the total
school district student population. The next largest group is White at 24%, followed by African-
American at 8% (Texas Education Agency, 2003-2004a). The school district populations in San
Antonio vary by ethnic/race, SES, and language status. The Latino/a population in the San
Antonio may vary in terms language and generation status in U.S. For example, some Latino/as
can claim their ancestry and heritage in current day Southwest U.S. (Texas) back to the
colonization period (1848), while other Latino/as may be recent immigrants to the U.S.
Over half of the twelve districts in the San Antonio area have a Latino/Hispanic
population of over 80%. Two school districts in the area had a White population of over 45%
and only one school district had over 25% of their population listed as African-American (2003-
2004 school year). For San Antonio area districts, the ethnic/racial proportions would not reflect
the state population proportions given that only 24% of the student population in San Antonio is

68
categorized as White. This suggests that rates of representation in special education and
bilingual education would not reflect the state population proportions.
Sixty-four percent of the students in twelve of the San Antonio districts are considered
economically disadvantaged. Of the students in the 12 San Antonio districts 8% receive
bilingual/ESL services (See Figure 2). The districts in SA have 14% of the population receiving
special education services, based on aggregated data. This would suggest that SA area districts
place a higher proportion of students in special education compared to the state aggregated data
by all disability categories, indicating 11.8% of the students in Texas, receive special education
services.
In the SA area, data from TEA (2003-2004) indicated that 9% of students are categorized
as both LEP/ELL and Special Education (See Figure 2). The state proportion of students
categorized as both is 3% overall. The LEPSpEd category suggests that students are categorized
as eligible to receive services in both Bilingual/ESL and Special Education services to receive a
free and appropriate public education (FAPE). Based on the programs available on each campus,
students in the LEPSpEd would have an Individual Education Program (IEP) that would indicate
the location, amount of time, and language of instruction for each subject area in their daily
schedule. The variability in program options, and school personnel, students in this category
LEPSpEd may have a schedule that seems fragmented.

69
LEP and SpEd Comparisons
11.8%
15.0%
3.0%
14%
10%
9%
Sp. Ed. LEP LEPSpEd
Category
Perc
ent o
f Pop
ulat
ion
State Pop SA Pop
Figure 2. State and San Antonio LEP/ELL and SpEd, 2003-2004
In their ethnographic study, Harry and Klinger (2006) noted that schools, “with the best
of intentions…[and] some serving the neediest children were detrimentally affected” by the
proliferation of programs at the school, that gave an impression of “overall curricular
fragmentation, [that] were, in themselves, excellent programs or represented some very
convincing educational philosophy” but resulted in difficulty providing consistency in
educational programming for students (p. 36). In other words, programs that were intended to
serve the needs of CLD students tended to fragment their school day and resulted in
discontinuity in terms of instruction provided to students by teachers. The students spent more
time moving from room to room or program to program that the ‘needs’ of the students may not
have been met due to the disjointed schedule.
A recent study of eleven urban school districts in Southern California, Artiles, et al.
(2005) investigated the patterns of disproportionate representation in special education for
English Language Learners (ELL). The study indicated that students considered ELL displayed

70
over representation patterns related to grade level, language proficiency status, disability
category, type of special education program and type of language support program at the district
level (Artiles, et al., 2005). The disproportionate representation patterns noted indicates that
students considered ELLs that displayed limited proficiency in L1 and L2 were the most
affected. In other words, student with limited language skills in their native language and
English, were over represented in special education within the eleven districts included in the
study.
Oswald, Coutinho, and Best (2000) investigation at the school district level suggests that
higher rates of representation of Black and Hispanic students as LD and ED was noted in
districts characterized as high-poverty. Black and Hispanic students were identified as MR more
often in school districts characterized as low-poverty (Cited in Donovan & Cross, 2002, p. 76).
This study points to a need to investigate the variables of race and socioeconomic status in the
problem of disproportionality.
Qualitative Research Methods
An investigation of the “Special Education Referral Process in an urban elementary
school” (IRB # 06-095) was conducted during the Fall 2005 semester. The case study research
project focused on the decision-making processes in one elementary school in a school district in
the southwest area of San Antonio. Formal and informal interviews were conducted (n = 5) as
well as observations of the school and community. The principal provided the names of the
special education and bilingual education teachers that may be interested in participating in the
study. From the list, the special education and one bilingual educator consented to formal
interviews. In addition, two participants offered informal data via conversation and unstructured
71
interviews; one was the former vice principal at the campus and the other was the current vice
principal that was new to the campus that year.
The study found that decisions for special education evaluations were ultimately not
decided by the campus team. The pre-referral team meetings were held on a regular basis
(monthly). Cases were reviewed and a small proportion of cases were submitted for further
evaluation, once the campus staff completed a ‘referral packet’ and included additional
documentation requested in the ‘packet.’ The completed information packet was then forwarded
to the special education office for review and final approval. Therefore, the decision for an
evaluation was finalized by the special education office rather than the campus based team. This
finding was surprising and could be unique to this district in terms of practices. Research on pre-
referral and special education assessment place the decision on the local campus team as part of
the regular education process (Garcia & Ortiz, 1988).
In addition, one participant indicated that some of the referrals were denied because the
campus did not complete the correct form(s), which were changed on a yearly basis. At this
elementary campus, the educators interviewed indicated that the pre-referral and evaluation
process was time consuming, and it deterred teachers from making referrals for special
education. The teachers interviewed were clear to state that students who are LEP/ELL and need
special education are not denied services in either program. The participants indicated that they
did not think over-representation was a problem at their campus/district, but that it probably was
a problem at the state and national level. The special education teacher stated that she is aware
that statistically, there is an over-representation of CLD students in special education in the U.S.
and in Texas. The bilingual and special education teachers interviewed indicated that they had
never received any training on collaboration regarding bilingual and special education issues,

72
and that over-representation was not a topic that had been discussed at the campus (each had
worked at the campus over 10 years).
Survey Research Review
In Fall 2006, a survey was developed for a pilot study based on a review of the literature.
The survey was developed to encompass factors that affect disproportionality based on educator
epistemological beliefs. The survey attempts to investigate policy implementation and practices
that may possibly result in disproportionality. A review of the literature in the areas of school
psychology, education, bilingual education and special education yielded a range of information
for the survey development. No current surveys were found that addressed disproportionality or
over-representation building from educator perceptions.
Ochoa, et al. (1996, 1996) developed a large scale survey entitled, “Bilingual Psycho-
Educational Assessment Survey” to obtain data from school psychologists on their previous
training and current bilingual evaluation practices for ELL/LEP students. One article published
from this survey included a review of assessment practices (Ochoa, Galarza, & González, 1996)
in terms of testing for language proficiency for ELLs, as well as the frequency of formal and
informal testing methods used. Ochoa, et al. (1996) found that 62% of assessment personnel
conduct their own language proficiency testing, while 32% relied on data from other sources,
which suggests decisions being make from outside data could place ELL students at greater risk
of mis-identification for programs and services.
Ochoa, Powell, and Robles-Piña (1996) found that school psychologists testing bilingual
and students considered LEP were using English assessment instruments primarily, but obtaining
additional data sources as well. There was a need to examine the use of intermixing of languages
during test administration. Overall, Ochoa, et al. (1996) did not find that dynamic assessments

73
were being used, but there had been an increase in the use of non-verbal testing instruments or
procedures. Achievement testing was also primarily in English. This survey study points to the
need for the development of testing materials appropriate for bilingual students and appears to
point to the questionable validity of the assessment process for bilingual students which has been
cited as on area of concern for over-representation (Donovan & Cross, 2002; Heller, Holtzman,
& Messick, 1982).
In terms of training received in the area of bilingual psycho-educational evaluation
methods for primarily Hispanic students, Ochoa, River and Ford (1997) found that school
psychologist in eight states in the U.S. southwest, did not believe that they received adequate
training in this area. The focus of this section of the larger survey of National Association of
School Psychologist (NASP) members was to determine the level of training received in their
university programs. Nearly seventy percent (70%) of the respondents indicated that they had
received less than adequate training in the following competency areas that affect the evaluation
process. Ochoa, et al. (1997), utilizing the competencies identified by Figueroa, et al. (1984) as a
guide in developing survey items related to training received by school psychologists when
working with English Language Learners (p. 331). These competencies include knowledge of:
(a) cross-cultural issues involved in bilingual psycho-educational assessment; (b) second
language acquisition factors and their relationship to assessment; and (c) methods to conduct
bilingual psycho-educational assessment (Ochoa, Rivera, & Ford, 1997, p. 333). Ochoa, et al.
(1997) added a fourth competency that pertains to the ability to interpret the results of the
bilingual psycho-educational assessments.
Ochoa, et al. (1997) state, that “the field of School Psychology must ask itself whether
the lack of adequate training” in conducting bilingual psycho-educational evaluations contributes

74
to the over-representation of minority students in special education (p. 341). In addition, Ochoa,
et al. (1997) assert that the profession of school psychology does not appear to have made
sufficient progress in addressing the assessment practices with culturally and linguistically
diverse students, since the Diana v. California SBOE case in 1970. Investigating school
psychologist training and practices, twenty five years later, Ochoa, Rivera, and Ford (1997)
indicate that university training programs do not appear to have changed, in terms of preparing
school psychology graduate students for the increased diversity in schooling as well as best
practices for assessment of CLD students. In other words, the university training programs in
school psychology do not appear to have made changes in course work offered to address the
changing demographics of the U.S. school population.
An additional article investigated questions related to the referral-to-placement practices
for CLD students (Ochoa, Robles-Piña, Garcia, & Breunig, 1999). The investigation found that
campus team reasons for referrals to school psychologists could be plausibly associated with the
process of second language acquisition for CLD students (p. 1). A review of the survey results
by Ochoa, et al. (Ochoa, Galarza, & González, 1996; Ochoa, Rivera, & Ford, 1997; Ochoa,
Robles-Piña, Garcia, & Breunig, 1999) in the 1990s provides an indication of the shortage of
school psychologist who are adequately trained in bilingual psychoeducational evaluations and
the possible misuse of assessment when evaluating CLD students and the questionable validity
of the assessment practices for determining special education eligibility using test results
obtained primarily in English.
These trends point to the lack of adequate that training received by school personnel in
understanding as well as interpreting the results of bilingual psycho-educational evaluations
within the pre-referral to placement process. The validity of the assessment practices in terms of

75
appropriately determining students as eligible for special education is depicted. The lack of
adequate training in the bilingual psycho-educational evaluation process suggests that campus
based decision teams may lack crucial data in which to base educational decisions for
assessment, eligibility, and placement of students who are culturally and linguistically diverse.
A follow-up survey, based on Ochoa, et al. (1996) and others focused on bilingual school
psychologists practices with English Language Learners (Lopes, 2005). Similar to Ochoa, et al.
(1996), Lopes (2005) surveyed bilingual school psychologists listed in the National Association
of School Psychologists (NASP) directory on current issues related to training, evaluation and
decision-making practices. Similar to Ochoa, et al. (1996) Lopes found that the assessment of
language proficiency and the presentation of this information at pre-referral and assessment
teams varied. Less than half of the psychologists surveyed indicated that they conducted the
language proficiency assessments for CLD students they worked with. Lopes (2005) found that
additional training may be needed for monolingual school psychologist who work with CLD
students as well as additional research on the practices of monolingual school psychologists
working with CLD students.
A study addressing the aspects of training and skill knowledge of school psychologists in
working with cultural and linguistic diversity, resulted in the development of a multicultural
competence inventory (Moreno, 2003). The purpose of the survey was to develop a self-report
inventory of school psychologists’ multicultural competencies when providing assessment,
intervention and consultation services to multicultural individuals most represented in their work
setting (p. vii). Reviewing the literature within the area of multicultural competencies began
from the multicultural counseling field and then transitioned to multicultural school psychology
(Moreno, 2003). The self-report survey was intended to assist school psychologist who work
76
with multicultural groups as well as provide a way for university trainers a identify their
student’s competency levels and identify competency areas that need improvement. Few
graduate training programs offer adequate training on how to best provide services to
multicultural students, families and communities (Moreno, 2003; Ochoa, Rivera, & Ford, 1997).
The review of the literature, also yielded several surveys that addressed specific groups of
educators, such as general education teacher behaviors and attitudes (Lester & Bishop, 2000) as
well as teacher multicultural attitudes – Teacher Multicultural Attitude Survey (Ponterotto,
1998). The TMAS is a 20-item scale (alpha = .86) that assesses the multicultural awareness of
K-12 teachers.
One study utilized a survey to investigate bilingual teachers knowledge and beliefs about
bilingual students cognition as well as their teaching strategies (B. B. Flores, 1999). Interviews
were also utilized for this mixed methods design. Flores (1999) found that bilingual teachers had
specific views on how bilingual children learn and the teacher’s prior experiences (professional)
shaped their beliefs. The findings also show that teacher’s beliefs influence their teaching
practices.
The use of languages other than English in society and in schools specifically is an area of
considerable debate (See Haukuta, 1996). A review of surveys included in Baker (1996) were
ones that examine attitude to bilingualism, use of Spanish, attitude to Spanish and language use
survey samples. Many factors relating to the politics of language may influence educators’
beliefs about language maintenance and use in regards to CLD students, as well as language of
instruction for students with disabilities.

77
Methodological difficulties
Both quantitative and qualitative research with cultural and linguistically diverse
individuals is multifaceted and encompasses a large range of variables and questions.
Quantitative research with ethnic minorities has a long history (Padilla, 2004). According to
Padilla (2004) the earliest studies with educational implications focused on the intellectual
assessment and school achievement of ethnic minorities. “This research legacy is now well
known for its failure to consider the many variables that are critical for assessment” of student’s
skills and abilities (Padilla, 2004, p. 127). Padilla outlines a set of assumptions which were part
of the historical IQ studies and continue to date in educational research that involves culturally
and linguistically diverse students. Padilla asserts that one reason this set of assumptions have
been maintained is that they conform to common sense qualities yet the variables are complex
and interrelated. The assumptions are that: (a) the White-middle-class ‘American’ is the
standard against which other groups are measured or compared, (b) the instruments used for
assessing differences are universally applicable across groups, with minimal adjustment for CLD
groups, and (c) although there is a need to recognize the sources of potential variance, such as
social class, educational attainment, gender, cultural orientation, and proficiency in English,
these are variables that tend to be ignored or discarded in the interpretation process (Padilla,
2004, p. 127).
Padilla states that educational research has tended to adopt a universalistic (etic)
approach, which seeks confirmation of general truths across cultural groups. Emic principles are
relativistic in that they seek to uncover a particular truth that is confined to a single culture or
social group (Padilla, 2004, p. 128). Some of the problems with this approach are that
researchers tend to circumvent important cultural variables within their research methodologies.
78
The universalist approach to research is problematic because “it lends itself to a narrow database,
resulting in biased conclusions of substantive educational outcomes that are problematic even for
White samples that differ from the normative population” (Padilla, 2004). Another problem with
the universalist approach has been exacerbated by the procedures and instruments used in the
research (e.g., IQ tests) which have been applied to CLD students who do not share all of the
demographic characteristics of the normative sample. This is especially problematic for CLD
students, some who may be recent immigrants, who may not speak or comprehend English and
are not familiar with the tasks or the requests being made, even when translated (another
questionable practice).
In establishing standards for educational and psychological testing, joint committees from
the American Educational Association, American Psychological Association and the National
Council on Measurement in Education (1999) prepared the Standards in order to provide criteria
for the evaluation of tests, testing practices, and the effects of test use within the behavioral
sciences and society (p. 2).
Chapter nine of the Standards specifically addresses the testing of individuals of
diverse linguistic backgrounds and introduces the chapter with the following statements:
for all test takers, any test that employs language is, in part, a measure of their language skills…which is a concern for any test taker whose first language is not the language of the test…In addition, language differences are almost associated with concomitant cultural differences that need to be taken into account (p. 91).
Standards proposed may not be as powerful a guide to practice as federal, state, district
and campus policies embedded in the sociopolitical and sociohistorical nature of schooling in the
U.S. As McDermott, Goldman and Varenne (2006) indicate, the practical existence inside a
school system is one in which “the American classroom is well organized for the production and

79
display of failure, one child at a time if possible, but group by group if necessary” (p. 15).
Educators within the school system may feel justified in referring and evaluating CLD students
based on epistemological beliefs as well as the sociohistorical attention by scholars and
policymakers based on child deficit explanations for special education ‘labeling’ and placement
of CLD students.
Summary
Due to the demographic changes in the U.S. within the last decades, there has been an
increase of culturally and linguistically diverse students entering public schools. With the
increase in diversity and the continuation of flawed institutionalized practices, the problem of
over-representation of minority students in special education appears to be a static phenomenon.
Artiles, et al. (2005) state that “a weakness of research on minority placement in special
education is the tendency to overestimate the homogeneity of populations by failing to
disaggregate factors, such as language proficiency or to consider other relevant variables,… such
as program type” (pg. 283). Artiles (2003) states that “unless researchers and practitioners
surface their assumptions about difference, as well as culture and space, the special education
field will continue to perpetuate the silences that threaten the educational and life needs of
students who have historically been marginalized” (p. 164). In this sense, CLD students
continue to be relegated at the margins of educational programming, practices, and research
rather than placed at the center.
In addition, the prevalence of deficit thinking models in educational thought and practice
contribute to the construction of CLD students, language, culture and communities as
inadequate. The perpetuation of deficit based practices in school districts stifles a shift toward
multicultural education (Nieto, 2004). The sociopolitical influences contribute to the disparities

80
in educational outcomes and serve to divert the focus from systemic and historical inequalities in
education for CLD students in the U.S. A lack of understanding of the disproportionality from
both sociohistorical and sociopolitical perspectives diverts individuals (educators) from the
responsibility of addressing and ameliorating the problem.
The continued need for investigation called for a move beyond looking at aggregated data
at national and state levels. The need for continued investigation requires critical reflection and
praxis by educators on the institutionalized nature of ‘best practices’ for assessment, referral and
eligibility currently in place. Researcher requires an inspection of the attitudes and perceptions
of differences, which supply the base for the continued status quo based on practices which
perpetuates over-representation of minority students in special education. A problem, which
may appear to go unnoticed or disregarded, is that of school/district personnel ideological stance,
attitude and perception of CLD students. With all of the research over the last thirty five years as
well as the historical view of the subtractive education practices, one has to wonder what forces
would be needed to break these hegemonic traditions, trainings, and practices. The entrenched
hegemonic ideologies that facilitate the schooling practices in today’s education system suggest a
climate in which once more it is becoming “increasing inhospitable to minority ethnicities and
identities” (San Miguel, 1999, p. 31).
This study extends from the need for investigations of disproportionality to look at
district and school level perceptions and practices. The disaggregation of data on minority
representation in the South Texas area provides a unique area for research. One unique feature
of investigating school district practices is South Texas is that this is one area of the U.S. in
which Latino/as account for the majority of the population (e.g., Miami and San Diego). The
research indicates a need for the inclusion of factors, such as program availability, program

81
implementation, number of students in district, number of placements in special education ‘high
incident’ categories, such as learning disabled, mental retardation, speech impaired, and
emotional disturbance (Artiles, Rueda, Salazar, & Higareda, 2005; Artiles & Trent, 1994; Valdés
& Figueroa, 1994)

82
CHAPTER III: METHODOLOGY
Introduction
This chapter provides information on the research design, research questions, and data
collection. Chapter four presents the findings of the research. The mixed method research
design is introduced, followed by a restatement of the research questions. The procedure of
obtaining the research requests from districts and principals is provided along with the
descriptive data per district and elementary campus. The study developed and utilized a survey,
“Educator Perceptions on Cultural and Linguistic Diversity: Educational Practices, Policies and
Programming,” to obtain information on educator perceptions of factors that affect
disproportionality. In addition, the researcher utilized data from the Texas Education Agency
(TEA) to determine the rates of representation of CLD students in special education in the
selected districts and elementary campuses. Ethnic/racial group categories used in data analysis
and reporting were based on federal/state (TEA) terms for consistency.
Research Design and Questions
The phenomenon of disproportionality and the diverse sets of practices that emerge from
policies provide the framework for this mixed methods research design, mostly quantitative in
nature (Creswell, 2003). A mixed methods research design tends to be less dichotomized as
strictly quantitative or qualitative (Creswell, 2003) and includes a need for collecting and
analyzing ‘mixed’ sets of data. The study included concurrent data collection of surveys and
existing data from the Texas Education Agency (TEA), as well as qualitative data from open-
ended questions included in the survey. Convergence of survey and TEA data occurred at
analysis and interpretation. The purpose of the study was to investigate the following research
questions:

83
1) What are the rates of representation of CLD students in special education by
ethnicity/race, program placement, eligibility category/disability, and language status
in the South Texas area? What are the rates of representation of ELLs (LEP) in
special education?
2) Do educator perceptions differ in regards to disproportionality of CLD students in
special education? Do school personnel perceptions differ based on their school
position, race/ethnicity, gender, or years of experience?
3) Do school personnel perceptions on disproportionality of CLD students differ in
comparison to actual TEA data for the selected school district and campus?
Participants
Survey Participants. A stratified sample of 439 educators (See Table 2) at four districts
and thirteen elementary campuses in South Texas and San Antonio served as participants for
survey data collection. Of the 439 survey participants the majority were female (87%) and
Latino/a (60%). White educators made up the second largest group of participants (34%), with
African-American, Native American and Asian American educators comprising 6% of the
sample. The majority of educators possess a bachelor’s degree (63%) and had graduated
between the years of 2000 and 2007 (45%). General education teachers (42%) make up the
largest group of educators in the sample, followed by bilingual educators (31%),
administrative/support staff (14%), and special educators (8%). The administrative/support staff
subgroup is comprised of administrators, counselors, curriculum specialists, speech and language
pathologists and other itinerate staff members that may not be in a classroom teaching
environment on a daily basis. The educators ranged in age from 21 to over 45. The majority of
educators in this sample had between six and twenty years of experience (46%).

84
Table 2. Survey Participant Demographics (N = 439)
Demographic Variables Categories n %
Gender Male 34 8
Female 381 87
Age Range 21 - 34 156 36
35 - 44 124 28
> 45 152 35
Race/Ethnicity Latina 261 60
White 150 34
Af-Am, Asian, Other 24 6
Degree Bachelor’s 276 63
Master’s + 161 37
Year Graduated 2000 - 2007 196 45
1990 - 1999 102 23
< 1989 87 20
Job Title/Position Admin/Support 63 14
General Ed 184 42
Bil Ed/ESL 137 31
Special Ed 36 8
Total Years Teaching < 5 yrs. 142 32
6 – 20 yrs. 201 46
> 21 yrs. 85 19
District and Elementary Campus Demographics. Research requests were submitted to
districts in the South Texas area. Two districts in the San Antonio area provided support for the
study. Five elementary campuses in District one (D1) and six elementary campuses in District
two (D2) participated in the research. In addition, one elementary principal in the Rio Grande
Valley (RGV) and one elementary principal in another San Antonio district agreed to allow their
campus to participate in the research study for a total of 13 elementary campuses (See Table 3).

85
District approval allowed the researcher to contact and select the elementary campuses in D1, but
the decision to participate rested with the campus principal. A total of 231 surveys were
completed by educators in D1.
Table 3. District and Elementary Campus Participation
District Elementary Campuses
Surveys collected
%
District 1 (D1) 5 231 53
District 2 (D2) 6 153 35
District 3 (D3) 1 27 6
District 4 (D4) 1 28 6
Total 13 439 100
In D2, six elementary schools were selected for participation by the director of district
initiatives with input from the researcher. Campus participation was dependent on principal’s
approval. A total of 153 surveys were completed by educators in D2.
In district three (D3) and district four (D4), the researcher provided each principal with a
letter describing the purpose of the study, and provided a copy of the consent from and a draft of
the survey to review. The principals then provided the researcher with a letter of support.
Twenty seven surveys were completed by educators in D3 and twenty eight surveys were
completed by educators in D4. A total of 439 surveys were obtained from elementary educators
in the South Texas area.
District and Campus Educator Demographics. Educators in each of the participating
districts ranged in terms of diversity (See Table 4). Data from AEIS district profiles (Texas
Education Agency, 2005-2006) show that minority educators make up over half of the teaching

Table 4. Educator Demographics, State and Participating Districts, 2005 – 2006
Texas District 1 District 2 District 3 District 4
n % n % n % n % n %
Educator
Professional staff 372,671 63 4,938 65 4,556 59 6,148 61 419 48
Teachers 302,149 51 3,937 52 3,516 45 4,866 48 344 39
Total Minority staff 247,645 42 2,727 36 6,030 78 4,999 49 854 97
African-American 27,465 9 87 2 409 12 153 3 1 0.3
Hispanic 60,817 20 779 20 1,900 54 1,516 31 316 92
White 209,743 69 3,038 77 1,177 34 3,155 65 21 6
Other 4,123 2 34 1 30 1 42 1 6 2
Males 69,103 23 814 21 868 25 1,014 21 124 36
Females 233,045 77 3,124 79 2,648 75 3,851 79 220 64
Source: Texas Education Agency, Academic Excellence Indicator System (AEIS), 2005-2006 State and District Profile
86

87
staff in D2 (54%) and D4 (92%), while the majority of educators in D1 (77 %) and D3 (65%)
were categorized as White. Overall, there were few African-American, Asian/PI, and Native
American educators represented in the participating districts and elementary campuses. The
majority of educators in Texas and the participating districts were female (64-79%).
Administrative and support staff were also included in the survey data collection. Table four
shows that the majority of district and campus staff were educators.
Student Demographics
State. For the 2005-2006 school year, Texas students totaled 4,505,572 (See Table 5). Of
these students, 45% were Latino/Hispanic. Over half of the students in Texas were classified as
economically disadvantaged (55%). The state Limited English Proficient/English Language
Learner (LEP/ELL) population was sixteen percent. Of these ELLs, fifteen percent received
Bilingual/ESL programming in the 2005-2006 school year. Eleven percent of the student
population receives special education services with two percent of students in Texas also
categorized as LEP/ELL.
Districts and elementary campuses. Five elementary campuses were selected from
district one (D1) for participation. District one has forty two elementary campuses; therefore,
twelve percent of elementary campuses were included in the sample. D1 has a total student
population of 59,556 (See Table 5). The ethnic majority in this district were Latino/Hispanic
students (44%). The second largest group of students in D1 were White (42%). African-
American and other ethnic groups make up 14% of the district student population. Thirteen
percent of the student population in the district receives special education services and five
percent receive bilingual/ESL instruction. Nearly 40% of the students in D1 were categorized as
economically disadvantaged.

88
For each elementary campus participating from D1, Latino/Hispanic students comprised
over half of the student population ranging from a high of 94 percent (ES 2) to a low of 53
percent (ES5). The second largest group of students at the elementary campuses were White (35
– 5%). The five elementary campuses have over half of their student population classified as
economically disadvantaged (91 – 43%). The elementary campuses in the sample have higher
rates of students considered economically disadvantaged than the district as a whole. See
Appendix E (Table E1) for D1 elementary campus student and program demographics.
Six elementary campuses were selected from D2 for participation. District two has a
total student population of 56,371 (See Table 5). Overall, the Latino/Hispanic group comprises
88% of the student population in D2. African-American students make up 9% of the population.
Ninety-two percent of the student population was classified as economically disadvantaged.
Seventeen percent of the students were considered ELL/LEP and 15% of the students receive
bilingual/ESL programming. Twelve percent of the students received special education services.
See Appendix E (Table E2) for further demographic data on D2 elementary campuses.
District three (D3) has a total student population of 78,154 (See Table 5) and
Latino/Hispanic students comprise over half of the student population (61%). White students
make up 27% of the population, followed by African-Americans (8%). Thirteen percent of the
student population received special education services, and only 5% received bilingual education
programming in the 2005-2006 school year. Six percent of the student population in D4 was
considered English Language Learners (ELLs). Nearly half of the student population in D4 was
categorized as economically disadvantaged. See Appendix E (Table E3) for D3 and D4
elementary campus demographics.

89
The smallest school district in the sample has a student population of 5,471 located in the
Rio Grande Valley of Texas (See Table 5). This area is considered rural and is comprised of
Latino/a students (99.6%) predominantly. Ninety-two percent of students in D4 were
categorized as economically disadvantaged. Eight percent of the student population receives
special education services, while 42% receive bilingual education programming. Forty-two
percent of the population was considered English language learner (ELL).
Texas Education Agency. Data from the Texas Education Agency (TEA) was requested
to obtain information on the districts and campuses corresponding to the selected survey
participants. The Academic Excellence Indicator System (AEIS), Performance-Based
Monitoring Analysis System (PBMAS) reports available to the public were utilized. Additional
data was requested from TEA from the Public Education Information Management System
(PEIMS). Specific data requests were made to obtain program referral and participation data for
the state, school districts, and elementary campuses participating.
The Public Education Information Management System (PEIMS) encompasses all public
education data requested and received by TEA, including student demographics, student
academic performance, school personnel, district financial, and organizational information
(Texas Education Agency, 2008c).
The AEIS profile reports are available for the state, and disaggregated by districts and
campuses. The AEIS was established in 1984, when the Texas Legislature sought to emphasize
student achievement as the basis for accountability (Texas Education Agency, 2008a). The
student performance and the accountability system profile reports are used by the Texas
legislature to establish and revise educational policies and funding. The AEIS state, district, and
campus profile reports for the 2005-2006 school year were utilized for the current study.

Table 5. State and District Demographics, 2005-2006
State District 1 District 2 District 3 District 4
n % n % n % n % n %
Students
Af-Am 664,242 14.7 5,851 9.8 4,969 8.8 6,270 8.0 05 0.1
Latino/a 2,040,449 45.3 26,222 44.0 49,486 87.8 47,795 61.2 5,471 99.6
White 1,644,308 36.5 25,264 42.4 1,699 3.0 21,560 27.6 17 0.3
Other 156, 573 3.3 2,219 3.7 217 0.4 2,529 3.2 0 0
LEP/ELL 711,237 15.8 3,461 5.8 9,438 16.7 5,095 6.5 2,325 42.3
Eco. Dis. 2,503,755 55.0 22,846 38.4 51,988 92.2 38,664 49.5 5,062 92.1
Bil/ESL 657,716 14.6 2,874 4.8 8,385 14.9 3,935 5.0 2,310 42.0
Sp. Ed. 500,037 11.1 7,774 13.1 6,839 12.1 10,367 13.3 469 8.5
LEP/SpEd 79,245 1.8 275 0.5 1,085 1.9 785 1.0 * *
Total 4,505,572 59,556 56,371 78,154 5,495
Source: Texas Education Agency, Academic Excellence Indicator System (AEIS), 2005-2006 State and District Profile
90
91
which is an automated data system that reports annually on the performance of school districts
and the selected program areas, such as, Bilingual education/English as a second language,
special education, and programs under the No Child Left Behind Act (Texas Education Agency,
2006, 2008b). The current study used the 2006 PBMAS reports to obtain data on the
representation of CLD students in special education.
This study used public information from the TEA web site that included the
characteristics of districts and elementary campuses with regard to student ethnic diversity,
educational program participation, and educator demographics. Additional information on
characteristics of students served in special education by eligibility, ethnicity and language status
was requested from TEA personnel through the PEIMS as this information was not available on
the public website.
Instrumentation
Survey Development
The survey, “Educator Perceptions on Cultural and Linguistic Diversity: Educational
Practices, Policies and Programming,” was developed for this study. In fall 2006, a pilot survey
was developed based on a review of the literature and prior surveys found in the literature. The
survey was developed and a pilot study (IRB # 07-046E) was completed to obtain data on
teacher perceptions of disproportionality. The survey encompassed factors that affect
disproportionality based on educator epistemological beliefs. The pilot survey (Fall 2006) was
administered to focus groups and to master-level education students including special education
majors. The initial survey was refined and revised by deleting items and including items specific
to the research questions.

92
A review of the literature in the areas of school psychology, education, bilingual
education and special education yielded a range of information for the initial survey
development. No current surveys were found that addressed disproportionality or over-
representation from educator perceptions.
A review of the literature, yielded several surveys that addressed specific groups of
educators, such as general education teacher behaviors and attitudes (Lester & Bishop, 2000) as
well as teacher multicultural attitudes – Teacher Multicultural Attitude Survey (Ponterotto,
1998). One study with bilingual teachers (B. B. Flores, 1999) utilized a survey to investigate
bilingual teacher epistemology and teaching practices along with interviews. Surveys that
investigated the practices and training of school psychologists related to the assessment of
culturally and linguistically diverse students were also reviewed (Ochoa, Galarza, & González,
1996; Ochoa, Powell, & Robles-Piña, 1996; Ochoa, Rivera, & Ford, 1997). Other surveys
focused on multicultural competencies of school psychologists (Moreno, 2003) and a follow-up
survey on bilingual school psychologists’ practices with English Language Learners (Lopes,
2005) were investigated. Similar to Ochoa, et al. (1996, 1997), Lopes (2005) surveyed bilingual
school psychologists listed in the National Association of School Psychologists (NASP)
directory on current issues related to training, evaluation and decision-making practices.
The following scales framed the items adapted from the review of previous surveys, the
literature and the research questions for this particular study: 1) Familiarity with policies; 2)
Previous training/experience; 3) Racial/ethnic over-representation; 4) Decision-making practices;
and 5) Language and Bilingual Education. The items included in the survey were framed within
one of the five areas of interest. The items were either adapted from previous surveys or
developed by the researcher. The survey developed for the pilot study, contained eighty-one

93
questions. The majority of the items were developed by the researcher while some were adapted
from a review of the literature (Baker, 1996; B. B. Flores, 1999; Lopes, 2005; Moreno, 2003;
Ochoa, Galarza, & González, 1996; Ochoa, Powell, & Robles-Piña, 1996; Ochoa, Rivera, &
Ford, 1997).
Data for the pilot study was collected (Fall 2006) from current graduate students in the
College of Education and Human Development at the University of Texas at San Antonio. Four
graduate classrooms were visited by the researcher to solicit survey participation. Graduate
students were asked to participate by completing the survey on a voluntary basis. The only
requirement for participation was that individuals would have experience and knowledge in
schools, such as participation in decision-making teams. Participants were provided with a
consent form that described the purpose of the study, their rights to refuse to participate, as well
as information on how to contact the university Institutional Review Board (IRB) and the
researcher.
A total of forty-seven surveys were collected from five graduate classes. In terms of
gender, 72% of the respondents were female (n = 34) and 23% were male (n = 11). In terms of
ethnic/racial affiliation, 46% of the respondents identified as Latino/Hispanic, 34% as White,
10% as African-American, and 4% identified as Asian/Pacific Islander.
In age and years of experience, the results indicate 76% of respondents to be between the
ages of 25-44 (n = 36). Three respondents were 24 years old or younger and eight respondents
were over 45 years of age. In terms of educational experience (n = 45), half of the participants
(53%) had between 3-10 years of experience. There was one respondent who had been teaching
less than a year, ten respondents had less than 2 years of experience and ten participants had
more than 11 years of experience (21%). The majority of the participants were enrolled in a

94
master’s class (93%) and three respondents indicated they were enrolled in a doctoral program at
UTSA. Over 40% of the participants indicated they were certified as general education teachers,
6% as bilingual education teachers, and 4% had special education certifications. In terms of
school districts, participants worked at ten districts in the San Antonio area, with over half (53%)
of the respondents indicating they were employed at Northside ISD and 17% in San Antonio
ISD. The remainder of the participants were employed in one of eight other districts in the San
Antonio area. Forty-seven percent of the respondents indicated they had experience working in
elementary campuses.
Preliminary analysis of the survey developed for the pilot study indicated that there were
more than five factors being measured and the item clustering was not adequate. No further
analysis was possible due to the low internal reliability of the pilot survey. The survey items
were then re-organized into subscales that would provide insight into the problem of
disproportionality in addition to the factors addressed in the pilot survey, such as educational
programming, policies and practices by campus-level educators.
The current survey, “Educator Perceptions on Cultural and Linguistic Diversity:
Educational Practices, Policies and Programming,” is comprised of 18 demographic questions
followed by 12 subscales with a total of 92 items (See Table 6) to address educator perceptions
of educational programming, policies and practices in regards to CLD students in the South
Texas area. Educators are involved in school decision-making teams and also have explicit
knowledge of school policies, programs and practices.
The first two pages of the survey contain demographic questions in addition to a guide to
the acronyms used in the survey (See Appendix D). The survey is comprised of twelve subscales
and the item response format is a five-point Likert scale, from Not at all (1) to Very Much (5) for

95
all items. A description of the survey items by subscale is provided. The majority of survey
items was used for the pilot study and have been revised. Survey items for subscales four
through seven were developed by the researcher.
Subscale one, Familiarity with federal/state policies (Q 1-2). Subscale one (S1) includes
questions related to educators’ familiarity with federal and state policies in regards to bilingual
education, special education and pre-referral practices. The six items encompassed in question
one (Q1) include state and federal practices within the pre-referral to special education process
for culturally and linguistically diverse (CLD) students. The sentence stem for the six sub-items
is, “How familiar are you with the federal/state guidelines.” Question two asks participants to
rate their level of participation in campus-based decision team meetings. The items on this
subscale were developed by the researcher.
Previous training/experience with CLD (Q 3-13). Items for subscale two (S2) include
questions related to educators’ previous training and experience in regards to practices related to
first and second language acquisition, bilingual education, special education, and interpretation
of bilingual psycho-educational evaluations for CLD students. The sentence stem for this
subscale is, “To what degree do you believe your previous experience and training prepared you
in understanding….” Three of the 11 items on subscale two were adapted from Ochoa, et al.
(1997) and the remainder were developed by the researcher.
Racial/ethnic disproportionality (Q 14-20). The seven items for subscale three (S3) were
developed by the researcher and include questions about the perception of over-representation
for racial/ethnic groups (e.g., To what degree do you believe…African-American students are
over-represented in special education).

96
CLD (Q 21-28), Latino/a (Q 29-36), ELL (Q 37 – 44) and Gender (Q 45-46) Over-
representation. These four subscales (S3 – S7) were designed to obtain educator perceptions on
the over-representation of sub-groups of CLD students. Identical questions were asked for each
subscale, with the exception of the perception of the gender over-representation which is
comprised of two items (e.g., Girls are over-represented in special education). The sentence
stem for these subscales is, “To what degree to you believe that CLD, Latino/a, or ELL students
in your school are….” The items for subscales four through seven were developed by the
researcher.
Table 6. Survey Subscales and Number of Items
Subscale Question Number of items
1 Familiarity with federal/state policy (S1) 1-2 7
2 Previous experience and training (S2) 3-13 11
3 Racial/Ethnic Over-representation (S3)
14-20 7
4 CLD student Over-representation (S4) 21-28 8
5 Latino/a student Over-representation (S5) 29-36 8
6 ELL student Over-representation (S6) 37-44 8
7 Gender Over-Representation (S7) 45-46 2
8 Educational Programming for CLD (S8) 47-55 9
9 Pre-referral/Student Support Team process for CLD (S9)
56-64 9
10 Bilingual Psycho-educational Evaluation (S10) 65-69 5
11 Special Education and CLD (S11) 70-76 7
12 Culturally Relevant Teaching Practices (S12) 77-87 11
Total 92

97
Educational Programming (Q 47-55). Subscale eight (S8), includes questions relating to
the educational programming available and provided to CLD students in terms of bilingual
education and special education. The sentence stem for subscales eight through ten and a sample
question is as follows, “For your school, to what degree do you believe that…appropriate
educational programming is provided for all students.” Eight of the nine questions in this
subscale were developed by the researcher. One question was adapted from Moreno (2003).
Pre-referral/Student support team process for CLD (Q 56 – 64). Question for subscale
nine (S9) specifically targeted practices related to pre-referral intervention teams and the special
education process for CLD students. The sentence stem for these items is similar to subscale
eight. A sample question from this subscale, “For your school, to what degree do you believe
that …the pre-referral intervention (student support) team is effective in monitoring referrals for
special education.” The nine items in subscale nine were developed by the researcher.
Bilingual psycho-educational evaluation practices (Q 65-69). A sample question from
this subscale, “…trained bilingual evaluation personnel are available to complete testing.” The
five items on subscale ten were developed by the researcher.
Special Education and CLD (Q 70-76). This subscale includes questions related to
special education practices as they relate to CLD students. For example, “…the special
education committee reviews student language proficiency data.” The researcher developed four
of the seven items for this subscale. Three items were adapted from Moreno (2003) and Ochoa,
et al. (1999).
Culturally Relevant Teaching Practices (Q 77- 87). The eleven items that comprise
subscale twelve are aimed at providing insight into educator’s perception of their teaching
practices with multicultural populations. One item on attitude to language was adapted from

98
Baker (1996); one item on teaching methods was adapted from Flores (1999) and five of the
items on educators attitudes toward cultural and linguistic diversity and working with students
from CLD backgrounds were adapted from Ponterotto, et al. (1998).
Rates of Representation
Texas Education Agency (TEA) data for the 2005-2006 school year was requested to
calculate measures used for determining disproportionality: a) the composition index; b) risk
index; and c) odds ratio for CLD students in special education by state, district and elementary
campus when possible. Student data was disaggregated by race/ethnicity, disability, program
placement and language status (LEP SpEd) by state, district and campus level when possible.
Data from TEA was collected and entered into an EXCEL spreadsheet by district, campus,
program placement and eligibility category. The following calculation methods were used to
produce the CI, RI, and OR for the districts and elementary campuses in this sample.
Composition index. The composition index (CI) was calculated by dividing the number of
students of a given racial or ethnic group enrolled in a particular disability category by the total
number of students (summed across all five racial/ethnic groups) enrolled in that same disability
category. The CI index reflects the proportion of all children receiving services under a specific
category who are members of a CLD group (Donovan & Cross, 2002). The composition index
(CI) would reflect the proportion of students placed and served in special education, as well as
those served by eligibility category. The composition index answers the questions: 1) What
percent of students placed in special education are Latino/a? and 2) What percent of the Learning
Disabled student population is Latino/a? Knowing the composition index for Latino/as in special
education is not interpretable unless we know what percent of the students in the district, campus
or eligibility category who are Latino/a (Coutinho & Oswald, 2004, p. 5). The extent of

99
disproportionality was determined by calculating the difference between the composition index
(CI) and the percent of all students in the district, campus or eligibility category who were
Latino/a. Any positive differences indicate over-representation, while a negative number
suggests under-representation.
Risk index and Odds ratio. The risk index and the relative risk ratio or odds ratio
(Coutinho & Oswald, 2004) were calculated using the data from TEA at the state, district and
campus level when possible. The risk index (RI) was calculated by dividing the number of
students in a given racial/ethnic category (e.g., Hispanic) placed in a given disability category
(e.g., LD) by the total enrollment for that racial/ethnic group in the school population (Donovan
& Cross, 2002, pp. 42-43). The RI provides the percentage of all students in a given
ethnic/racial group identified in a specific eligibility category (Coutinho & Oswald, 2004;
Donovan & Cross, 2002). The risk index answers the question: What percent of Latino/a
percent in the school or district are identified as LD? The risk index illustrates the rate in which
a disability occurs by ethnic/racial group.
The odds ratio (OR) divides the risk index of one racial/ethnic group (e.g., Hispanic) by
the risk index of another racial/ethnic group (e.g., White) and provides a comparative index of
risk (Donovan & Cross, 2002, p. 43). The odds ratios were calculated for Latino/a and African-
American students compared to White students. If the ratio is greater than 1.0, this indicates that
the ethnic/racial groups are at greater risk of identification for special education (Donovan &
Cross, 2002). Odds less than 1.0 indicate that the ethnic/racial groups are less at risk for
identification. The risk indexes expressed as a percent were placed in a ratio, which resulted in a
single number that characterizes the extent of disproportionality and can be compared across

100
groups (Coutinho & Oswald, 2004). The relative risk ratio, or OR, takes into account
race/ethnicity base rates in the population (Coutinho & Oswald, 2004).
Procedures
Survey participation. Letters of support and permission to conduct the research were
obtained from two school districts, and two elementary principals in the South Texas area (Fall
2007). Following district approval to conduct research, principals at elementary campuses were
contacted to determine their willingness to allow school staff to participate. In district one (D1),
seven elementary campuses were contacted by the researcher. Each principal was given a letter
describing the purpose of the research, a copy of the district approval letter, and a draft of the
survey and consent form to review. Two principals chose not to participate in the research.
Upon meeting with the five principals willing to allow their campus to participate, data
collection was planned for a regularly scheduled staff meeting. At each phase of the data
collection process, the district director of research was notified of the elementary campuses
contacted by the researcher and the number of participants. I also plan to share the outcomes of
the study with each of the participating schools.
In district two (D2), six elementary schools were selected for participation by the director
of district initiatives with input from the researcher. Campus participation was dependent on
principals’ approval. Each principal was given a letter describing the purpose of the research, a
copy of the district approval letter, and a draft of the survey and consent form to review. All of
the schools selected were within the same geographical area within the district’s west side. Upon
meeting with each of the principals at the elementary campus, data collection was planned during
a regularly scheduled staff meeting, with the exception of one elementary campus in which the
surveys were administered and collected by the principal during grade level meetings.

101
Survey data collection was scheduled during regularly scheduled staff meetings − after
school − therefore, there was no interruption to the teacher or student educational program. At
each elementary school, the principal or his/her representative determined where the research
survey would be administered within the staff meeting agenda.
The researcher was available to answer questions before, during and after the survey
completion. Participants were provided with a copy of the consent form explaining the purpose
of the study and were informed that their participation was entirely voluntary. No personally
identifiable information was obtained or requested from participants. The consent form was
provided to the educators for their records, which included contact information for the researcher
as well as the UTSA IRB office (See Appendix A and C). If the educator agreed to participate,
they were asked to complete the survey entitled “Educator Perceptions on Cultural and
Linguistic Diversity: Educational Practices, Policies and Programming.” Participants were
provided with a ballpoint pen with the UTSA logo as a token of appreciation, which were handed
out along with the survey. The survey took approximately 30 minutes to complete. All surveys
were completed and collected during the staff meetings, with the exception of one elementary
campus in district two (D2). The researcher assigned the districts and elementary campuses a
unique number for coding and data entry. Following survey data collection completion, thank
you letters were sent to all elementary campus principals and district directors of research.
Survey data collection began October, 2007, and ended January, 2008.
Texas Education Agency Data. Concurrent data collection of Texas Education Agency
AEIS and PBMAS reports occurred. AEIS district and campuses reports as well as district
PBMAS reports were downloaded for each district and campus as approval for participation was
obtained. PEIMS data requests on special education eligibility, ELL/LEP status and bilingual

102
education participation continued through each stage of data collection and analysis. TEA
personnel were contacted by phone and e-mail for data requests in fall 2007 and spring 2008.
Data analysis
The Statistical Package for the Social Sciences (SPSS) software program and the
Microsoft Excel application programs were utilized for data entry and analysis. The SPSS
software program was used to analyze data and provide descriptives, frequencies, internal
consistency statistics, and ANOVAs. Frequencies were calculated for demographic variables
and subscale responses. Descriptive data for each subscale was obtained. Chronbach’s alpha
coefficients were calculated to examine internal consistency of the twelve survey subscales.
ANOVA’s were conducted to determine differences in educator perceptions on each of the
scales/domains using the independent variables of ethnicity/race, job/position, and years of
experience. The twelve survey subscales served as the dependent variables for each ANOVA
analysis.
The Chi square test was used to analyze five survey subscales that focus on over-
representation (S3-S7). The five point Likert scale items for each subscale were re-coded into
two categories for analysis. The subscales responses were re-coded as, one (1) indicating no
over-representation and two (2) signifying over-representation. Subscale 3: Ethnic/Racial over-
representation scores were recoded, 7 to 20 = 1; 21 to 35 = 2; Subscale 4 – 6: CLD student over-
representation, Latino/a student over-representation, and ELL/LEP student over-representation
scores were recoded, 8 to 20 = 1 and 21 to 40 = 2; Subscale 7: Gender over-representation scores
were recoded 2 to 4 = 1 and 4 to 10 = 2. Differences in categorical scores were investigated.

103
Limitations
Due to the large number of factors associated with disproportionality and over-
representation of CLD students in special education, this study is limited in scope. The study
aimed to investigate educator perceptions based on their ethnicity/race, job position, gender and
years of experience. Due to the small number of male participants, the gender variable was not
used for analyses. Survey subscales include items related to ethnic/racial group over-
representation, CLD student over-representation, gender over-representation, bilingual and
special education programming, pre-referral process, bilingual psycho-educational evaluations,
special education, and teaching practices. The survey and other data collected were limited to
these factors.
Second, the survey results are based on educators’ self-reports and perceptions, and is
limited to the one time veracity of responses. The goal of the study was to include all
professionals on the campus, but educational diagnosticians, school psychologists and speech
and language pathologists did not appear to attend regularly scheduled staff meetings, and
therefore, their representation in the sample is limited.
The majority of students in the South Texas area are Latino/Hispanic. Therefore, White,
African-American and other student groups may not be represented at each elementary campus
or district. Without the representation of other racial/ethnic groups, calculation and analyses of
odds ratios was not possible. Using data from TEA has limitations in terms of the variability of
reporting methods used by the districts and campuses as well as the state. The present study
utilized the federal terms and categories used by TEA when reporting data on ethnic/racial group
differences.

104
Summary
This research study, utilizing mixed sets of data, examines the phenomenon of
disproportionality of CLD students in the South Texas area in four districts and thirteen
elementary campuses. Data was collected from elementary educators through the use of a survey
developed for this study. A total of 439 surveys were collected for educators in the South Texas
area. In addition, data was collected from the Texas Education Agency to include the
disaggregation of data on student disability and program placement rates in special education.
The twelve survey subscales served as the dependent variables for ANOVA analyses in
examining differences in educator perceptions of disproportionality. TEA data was used to
calculate and compare the rates of representation of CLD students in special education by
race/ethnicity, program placement and disability category in each of the participating school
districts and elementary campuses. CLD student composition indexes were used to compare
educator perceptions on the problem of over-representation. The results of the study are
presented in Chapter Four.
105
CHAPTER IV: RESULTS
Introduction
This chapter provides the results of the data analyses for each research question. Each
research question provides insight into the problem of disproportionality from the perspective of
educators. Data from the Texas Education Agency (TEA) on culturally and linguistically diverse
(CLD) student representation in special education was disaggregated to the district and campus
level when possible. Data from the TEA and data from participant survey responses are
provided and analyzed.
Research Question One
What are the rates of representation for CLD students in special education by
ethnicity/race, eligibility category/disability, program placement and language status in the South
Texas area? What are the rates of representation of ELLs/LEP in special education?
TEA data for the 2005-2006 school year was requested and the following calculation
measures were used to determine and examine disproportionality: a) the composition index; b)
risk index; and c) odds ratio for CLD students in special education by state, district and
elementary campus when possible. Student data was disaggregated by race/ethnicity, disability,
program placement and language status (LEP SpEd) by state, district and campus level when
possible.
Measuring Disproportionality
The Composition Index (CI) was calculated by dividing the number of students of a given
racial or ethnic group enrolled in a particular disability category by the total number of students
(summed across all racial/ethnic groups) enrolled in that same disability category (Donovan &
Cross, 2002, p. 43).

106
The risk index (RI) was calculated by dividing the number of students in a given
racial/ethnic category (e.g., Hispanic) placed in a given disability category (e.g., LD) by the total
enrollment for that racial/ethnic group in the school population (Donovan & Cross, 2002, pp. 42-
43). The odds ratio (OR) was calculated by dividing the risk index of one racial/ethnic group
(e.g., Hispanic) by the risk index of another racial/ethnic group (e.g., White) and provided a
comparative index of risk (Donovan & Cross, 2002, p. 43). The odds ratios for ethnic/racial
groups are typically presented in comparison to White students, in which a ratio greater than 1.0
indicates that ethnic/racial groups are at greater risk of identification for special education
(Donovan & Cross, 2002). Odds less than 1.0 indicate that the ethnic/racial groups are less at
risk for identification compared to Whites. The risk indexes are expressed as a percent and were
placed in a ratio, which resulted in a single number that characterizes the extent of
disproportionality and was used for comparison across groups (Coutinho & Oswald, 2004). The
relative risk ratio, or OR, takes into account the race/ethnicity base rates in the population
(Coutinho & Oswald, 2004).
State Rates of Representation
Latino/a students make up 45% of the student population in Texas, followed by White
students (36%) and African-Americans (15%). Eleven percent of the students in Texas received
special education services (See Table 7) during the 2005-2006 school year. Almost half (49%)
of the special education students were considered Learning Disabled (LD), 6% receive services
under the Mental Retardation (MR) category, 7% as Emotionally Disturbed (ED) and 20% as
Speech Impaired (SI).

107
Table 7. Texas Sp. Ed. by Eligibility, 2005-2006
Texas
n %
Special Ed 500,037 11.1
Learning Disabled (LD) 244,736 48.9
Mental Retardation (MR) 30,462 6.1
Emotional Disturbance (ED) 36,801 7.4
Speech Impaired (SI) 99,997 20.0
Source: Texas Education Agency, 2005-2006, AEIS, PBMAS, PEIMS reports.
Composition index. During the 2005-2006 school year, Latino/a students comprised 41%
of the special education population (see Table 8), followed by White students with 39%, and
African-American students with 18%. English Language Learners (ELLs) account for 16% of
the special education students in Texas. Utilizing the composition index, which reflects the
proportion of students served in special education, African-American (+ 3.4), and White (+
2.9) students were over-represented in special education while Latino/a (- 3.9) students would
not be considered over-represented in special education in Texas. Difference scores were
calculated by subtracting the composition index of African-American, Latino/a and White
students in special education by the percent of African-American, Latino/a and White students
in the state population. Any positive differences indicate over-representation, while negative
numbers suggest under-representation. White student rates of representation in special
education are not typically monitored for disproportionality.

108
English language learners (ELL/LEP) made up approximately 16% of the student
population in Texas during the 2005-2006 school year. The composition index of ELLs in
special education was also close to sixteen percent; therefore, ELLs would not be considered
over-represented in special education at the state level.
Table 8. Texas Special Education Rates of Representation, 2005-2006 Texas
Demographics n % Sp. Ed. (CI)
% in Population
Difference
African-American 90,507 18.1 14.7 + 3.4
Latino / Hispanic 206,961 41.4 45.3 - 3.9
White 197,034 39.4 36.5 + 2.9
LEP / ELL & SpEd 79,245 15.84 15.78 + .06
Total Students 500,037 11.1 4,505,572
Source: Texas Education Agency, 2005-2006, AEIS, PBMAS, PEIMS reports.
African-American students make up 14.7% of the student population and 18.1% of the
special education population in Texas (See Table 9). Investigation of the high incidence
eligibility categories reveals that 19% of the LD population is African-American. Overall,
African-American students appear to be over-represented in special education under the
categories of learning disabled (+ 4.3), emotionally disturbed (+ 7.3), and mental retardation (+
13.6).

109
Table 9. African-American Students in Special Education by Eligibility, 2005-2006
African- American Students
Disability Category n % Af-Am by Elig.(CI) % in pop Difference
Learning Disabled 47,735 19.5 14.7 + 4.8
Emotionally Disturbed 8,097 22.0 14.7 + 7.3
Mental Retardation 8,614 28.3 14.7 + 13.6
Speech Impaired 12,556 12.6 14.7 - 2.1
Source: Texas Education Agency, 2005-2006, AEIS, PBMAS, PEIMS data.
Latino/a students account fors45.3% of the state population and account for 47% of the
learning disabled population in Texas (See Table 10). Latino/as make up 29% of the students
considered ED, 41% of students considered MR and SI. Latino/a students appear to be over-
represented, at the state level, in the category of learning disabled (+1.7). Over-representation
was not noted in the category of LD.
Table 10. Latino/a students in Special Education by Eligibility, 2005-2006 Latino/a Students
Disability Category n % Latino/a by Elig.(CI)
% Latino/a in Population Difference
Learning Disabled 115,057 47.0 45.3 + 1.7
Emotionally Disturbed 10,728 29.0 45.3 - 16.1
Mental Retardation 12,562 41.3 45.3 - 4.0
Speech Impaired 41,613 41.6 45.3 - 3.7
Source: Texas Education Agency, 2005-2006, AEIS, PBMAS, PEIMS data.
White students make up 36% of the student population in Texas. White students
comprise 39.4% of the special education population and were considered over-represented (See
Table 11) in special education (+ 2.9). White students were also over-represented in two of the

110
four subjective disability categories, ED (+ 11.3) and SI (+ 6.9). White students would be
considered under-represented in the categories of LD and MR.
Disaggregation of special education data indicates variability in the rates of
representation of CLD students in special education by eligibility category at the state level when
utilizing the composition index as the tool for measuring over-representation. For example,
Latino/a students would not be considered over-represented in special education at the state level
(-3.9), but examination of the rates of Latino/a students by eligibility category indicate over-
representation as learning disabled (+1.7).
Table 11. White Students in Special Education by Eligibility, 2005-2006 White Students
% in Sp.Ed. (CI)
% in Population
Difference
State 39.4 36.5 + 2.9
Learning Disabled 32.3 36.5 -4.2
Mental Retardation 28.4 36.5 - 8.1
Emotionally Disturbed 47.8 36.5 + 11.3
Speech Impaired 43.4 36.5 + 6.9
Source: Texas Education Agency, 2005-2006, AEIS, PBMAS, PEIMS reports.
Risk index and odds ratio. Other tools used by researchers to measure disproportionality
are the risk index and odds ratio. A risk index illustrates the rate in which a disability occurs by
ethnic/racial group in the state, district or school population. In Texas (See Table 12 below),
nearly 5% of White students were labeled LD, less than 1% as MR, 1% as ED, and 3% as SI.
Over 7% of African-American students were labeled LD, over 1% as MR, over 1% as ED, and

111
over 2% as SI. Over 5% of Latino/a students were labeled LD, less than 1% as MR, 1% as ED,
and 2% as SI in the 2005-2006 school year.
The odds ratios (OR) for ethnic/racial groups are typically presented in comparison to
White students; therefore, odd ratios were not calculated for the comparison group (White
students). A ratio greater than 1.0 indicates that ethnic/racial groups are at greater risk of
identification for special education. The odds ratio indicates that compared to White students,
African-American students had a 49% greater likelihood of being assigned to LD, were twice as
likely to be identified as MR, and had a 22% greater likelihood of being identified as ED (See
Table 12).
In Texas, Latino/a students had a 17% greater likelihood of being identified as LD, a 17%
greater likelihood of identification as MR, but were less at risk of identification as ED in
comparison to White students. In the speech impaired (SI) category, both African-American and
Latino/a students were less at risk of identification compared to White students in the state (OR
less than 1.0).
Table 12. Texas Risk Index and Odds Ratio by Ethnicity and Disability Category, 2005-2006 Texas
White African-American Latino/a
Disability Risk Index Risk Index Odds Ratio Risk Index Odds Ratio
LD 4.81 7.19 1.49 5.64 1.17
MR 0.53 1.30 2.47 0.62 1.17
ED 1.07 1.22 1.14 0.53 0.49
SI 2.64 1.89 0.72 2.04 0.77
Source: Texas Education Agency, 2005-2006, AEIS, PBMAS, PEIMS reports.

112
Overall, the largest proportion of special education students were Latino/a (41%), but
African-American students have the highest risk of representation and have greater odds of
identification as LD, MR, and ED in relation to White students. Latino/a students were over-
represented as LD and have a higher risk of identification in this category (RI = 5.64). White
students were over-represented as ED and SI and have a greater risk of representation as SI (RI =
2.64) compared to Latino/a and African-American students in Texas. The data reveals a need for
continued monitoring of disproportionality of CLD students in special education in Texas.
Sample Rates of Representation
In the four districts in this sample, Latino/a students ranged from 44 to 99.6% of the
student population (See district demographics Table 5 in Chapter 3). White students ranged
from less than 1% to 42% of the district population. African-American students ranged from less
than 1% to 10% of the student population in the districts in this sample. The composition index,
risk index and odds ratios were calculated to determine the rates of representation of CLD
students in special education for the districts in this sample. White and African-American
students made up less than 1% of the student population in D4 and therefore, CI, RI and OR
could not be calculated. The CI and RI for Latino/a students in D4 were calculated when
possible.
Composition index. Three of the four school districts participating in the research study
had a higher percentage of students in special education than the state rate (See Table 13).
Investigating the number of students receiving special education reveals that the learning
disabled (LD) category accounts for 28% of the students in D1, 48% in D2, 40% in D3 and 67%
in D4. There were fewer students receiving Special Education services as MR in two of the four
districts (<5%) in this sample compared to the state rate. In D1 and D4, about 7% of the students

113
received services as MR. Under the ED category, D1, D2 and D3 have more students receiving
services than the state rate (7.4%). Each district had about 12% of the population receiving
special education services as ED. District four had 1% of their students categorized as ED.
Twenty three percent of students in D1 receive services as speech impaired while 19% in D2,
22% in D3 and 13% of students in D4 receive services as speech impaired. D1, D2 and D3 may
be contributing to the problem of over-representation of CLD students in special education in
Texas, specifically under the category of Emotional Disturbance.
Table 13. Composition Index of Students in Special Education by Eligibility State D1 D2 D3 D4
Special Education 11.1 13.1 12.1 13.3 8.5
Learning Disabled 48.9 38.5 47.6 40.4 66.7
Mental Retardation 6.1 4.2 6.6 4.6 7.5
Emotional Disturbance 7.4 11.9 11.9 12.6 1.1
Speech Impaired 20.0 23.2 19.0 22.3 13.2
Source: Texas Education Agency, 2005-2006, PEIMS Note: D1 = District One; D2 = District Two; D3 = District three; D4 = District four
Utilizing the composition index, Latino/a students were over-represented in special
education in D1 (+2.0) and D3 (+ 2.2). Latino/a students in these two districts were also over-
represented in special education in three of the four subjective eligibility categories (LD, MR and
SI). Difference scores were calculated by subtracting the composition index of Hispanic/Latino
students in special education by the number of Latino/as in the district (See Table 14). Any
positive differences indicate over-representation, while negative numbers suggest under-
representation in our sample. Although D1 and D3 had an over-representation of Latino/a
students in special education, the five elementary schools in D1 and the ES in D3 did not appear

114
to have an over-representation of Latino/a students in special education (See Appendix G).
Further investigation may be warranted in D1 and D3 to determine which schools could be
contributing to the district over-representation of Latino/a students in special education.
At the state level, Latino/a students were over-represented as LD (+1.7). Two of the four
districts in the sample (Table 15) also indicate an over-representation of Latino/a students
receiving services as LD (D1 and D3). The difference score was calculated by subtracting the
composition index by the percent of Latino/a students in the district population.
Table 14. Latino/as in Special Education by District, 2005-2006 Latino/as in Special Education
% in Sp. Ed. CI
% in Population
Difference %
State 41.4 45.3 -3.9
District 1 46.0 44.0 + 2.0
District 2 83.1 87.7 - 4.6
District 3 63.4 61.2 + 2.2
District 4 * * *
Source: Texas Education Agency, 2005-2006, AEIS, PBMAS, PEIMS reports. * Not applicable
In the MR category, Latino/a students were not over-represented at the state level (-4.0).
In the sample, Latino/a students were over-represented in two of the districts (D1 and D3).
District 1 has the largest proportion of Latino/a students over-represented as MR (+4.0).
Latino/a students were under-represented at the state level under the category of ED (-16.1) and
were under-represented in the districts in the sample as well.

Table 15. Latino/a Student Rates of Representation in Sp. Ed. by Eligibility, 2005-2006 State D1 D2 D3 D4
CI % pop Diff CI % pop Diff CI % pop Diff CI % pop Diff CI % pop Diff
LD 47.0 45.3 +1.7 52.6 44.0 +8.6 86.6 87.7 -1.1 70.1 61.2 +8.9 100 99.6 +0.4
MR 41.3 45.3 -4.0 46.5 44.0 +2.5 78.3 87.7 -9.4 62.6 61.2 +1.4 100 99.6 +0.4
ED 29.2 45.3 -16.1 37.2 44.0 -6.8 74.2 87.7 -13.5 56.0 61.2 -5.2 * 99.6 *
SI 41.6 45.3 -3.7 44.5 44.0 +0.5 89.3 87.7 +1.6 65.2 61.2 +4.0 100 99.6 +0.4
Source: Texas Education Agency, 2005-2006, AEIS, PBMAS, PEIMS reports. Note: CI = Composition Index; % pop = percent of the population; Diff = Difference
115

116
Under the speech impaired (SI) category, Latino/a students were not over-represented at
the state level (-3.70), but disaggregating the data to the district level (Table 15) reveals that
three of the four districts in our sample have an over-representation of Latino/a students
receiving special education services as SI (D1, D2 and D3). District 3 has the largest rate of
over-representation (+4.0) of Latino/a students as SI.
In general, Latino/a students were over-represented in the LD category at the state level
and in two of the districts in the sample (D1 and D3). Latino/as were over-represented as MR
and SI in two of the school districts in the sample (D1 and D3). Latino/a students would be
considered under-represented in the category of ED. Latino students account for nearly 100% of
the student population in D4; and therefore, only Latino students are represented in special
education. Utilizing the composition index to measure over-representation was of limited use in
D4.
Over-representation of African-American students in special education was determined
by subtracting the composition index of African-American students in special education by the
percent of African-American students in the district population. The difference scores (Table 16)
indicate that, African-Americans would be considered as over-represented in special education at
the state level (+ 3.4), as well as in D1 (+2.4) and D2 (+1.8). White and African-American
students make up less than 1% of the student population in D4 and therefore the CI was not
calculated.

117
Table 16. African-Americans in Sp. Ed. by District, 2005-2006 African-American
% in Sp. Ed. CI
% in Population
Difference
State 18.1 14.7 + 3.4
District 1 12.2 9.8 + 2.4
District 2 10.6 8.8 +1.8
District 3 7.8 8.0 - 0.2
District 4 * * *
Source: Texas Education Agency, 2005-2006, AEIS, PBMAS, PEIMS reports. * Not applicable
African-American students were over-represented as learning disabled (Table 17) at the
state level (+ 4.8) and in three of the four districts in our sample (D1, D2 and D3). District 1
appears to have the greatest rate of over-representation (+ 4.2) of African-American students
under the category of LD.
Under the MR category, African-American students were over-represented at the state
level (+13.6) and in three of the four districts in the sample. D2 had the largest proportion of
over-representation of African-American students as MR (+4.5).
African-American students were over-represented at the state level in the category of ED
(+7.3) and were over-represented in three of the four districts in the sample. D2 had the largest
proportion of African-American students receiving special education services as ED (+8.8).
African-American students were not over-represented as speech impaired (Table 17) at the state
level (- 2.1) or in any of the districts in our sample for this category.

118
Overall, African-American students were over-represented in special education in three
of the four soft disability categories (MR, ED, and LD) at the state and district level compared to
the percent of African-American students in the state and district population. The data suggests a
pattern of over-representation in placing African-American in special education, that has
persisted since early studies on this problem (Heller, Holtzman, & Messick, 1982).
White students make up 36% of the student population in Texas. In our sample, White
students make up 42% of the population in D1, 3% of the population in D2, and 27% of the
population in D3 (See Table 18). The composition index for White students in special education
reveals that they were over-represented as ED in three of the districts in the sample. White
students were under-represented as LD. White students were over-represented as SI (+ 2.6) in
D1 and MR (+ 5.2) in D2.
At the state level, ELL students were not over-represented in special education (See
Table 19). In the sample, D3 appeared to display a small over-representation of ELLs in special
education (+0.57). Three schools in D2 had an over-representation of ELLs in special education,
but disproportionality was not indicated when data was aggregated to the district level (See
Appendix H). The data suggests a need for further investigation of ELL student representation in
special education.

Table 17. African-American Student Rates of Representation in Special Education by Eligibility, 2005-2006 State D1 D2 D3
CI % pop Diff CI % pop Diff CI % Pop Diff CI % pop Diff
LD 19.5 14.7 +4.8 32.0 9.8 -10 2.9 8.8 -0.1 20.3 8.0 -7.3
MR 28.3 14.7 +13.6 13.7 9.8 +3.9 13.3 8.8 +4.5 8.4 8.0 +0.4
ED 22.0 14.7 +7.3 15.6 9.8 +5.8 17.6 8.8 +8.8 9.7 8.0 +1.7
SI 12.6 14.7 -2.1 8.0 9.8 -1.8 6.7 8.8 -2.1 5.8 8.0 -2.2
Source: Texas Education Agency, 2005-2006, AEIS, PBMAS, PEIMS reports. Note: CI = Composition Index; % pop = percent of the population; Diff = Difference Table 18. White Student Rates of Representation in Special Education by Eligibility, 2005-2006 State D1 D2 D3
CI % pop Diff CI % pop Diff CI % Pop Diff CI % pop Diff
LD 39.4 36.5 +2.9 32.0 42.0 -10 2.9 3.0 -0.1 20.3 27.6 -7.3
MR 28.4 36.5 -4.2 37.4 42.0 -4.6 8.2 3.0 +5.2 25.3 27.6 -2.3
ED 47.8 36.5 -8.1 45.9 42.0 +3.9 7.7 3.0 +4.7 33.5 27.6 +5.9
SI 43.4 36.5 +6.9 44.6 42.0 +2.6 3.7 3.0 +0.7 26.5 27.6 -1.1
Source: Texas Education Agency, 2005-2006, AEIS, PBMAS, PEIMS reports. Note: CI = Composition Index
119

120
Table 19. ELL/LEP Student Representation in Special Education English Language Learners
% ELL/LEP Sp.Ed. (CI)
% ELL/LEP in population
Difference
State 15.84 15.78 + 0.06
District 1 3.5 5.8 - 2.3
District 2 15.86 17.0 - 1.14
District 3 7.57 7.0 + 0.57
District 4 * 42.0 *
Source: Texas Education Agency, 2005-2006, AEIS, PBMAS, PEIMS data.
Risk index and odds ratios. An exploration of the risk index illustrates the rate in which a
disability occurs by ethnic/racial group. In D1, over 7% of African-American students were
labeled LD, over 6% in D2, and over 5% in D3 (See Table 20). About six percent of Latino/a
students were identified as LD in all four districts in our sample. Over 3% of White students
were identified as LD in D1, over 5% in D2, and nearly 4% in D3.
The odds ratio, using White students as the comparison group (See Table 20), shows that
African-American students have a 90% greater likelihood of being identified as LD in D1, 20%
greater likelihood in D2, and a 39% greater likelihood of identification as LD in D3.
Latino/a students have a 58% greater likelihood of identification in contrast to White
students as LD in D1, a 3% greater likelihood in D2, and a 56% greater likelihood identification
as LD in D3.
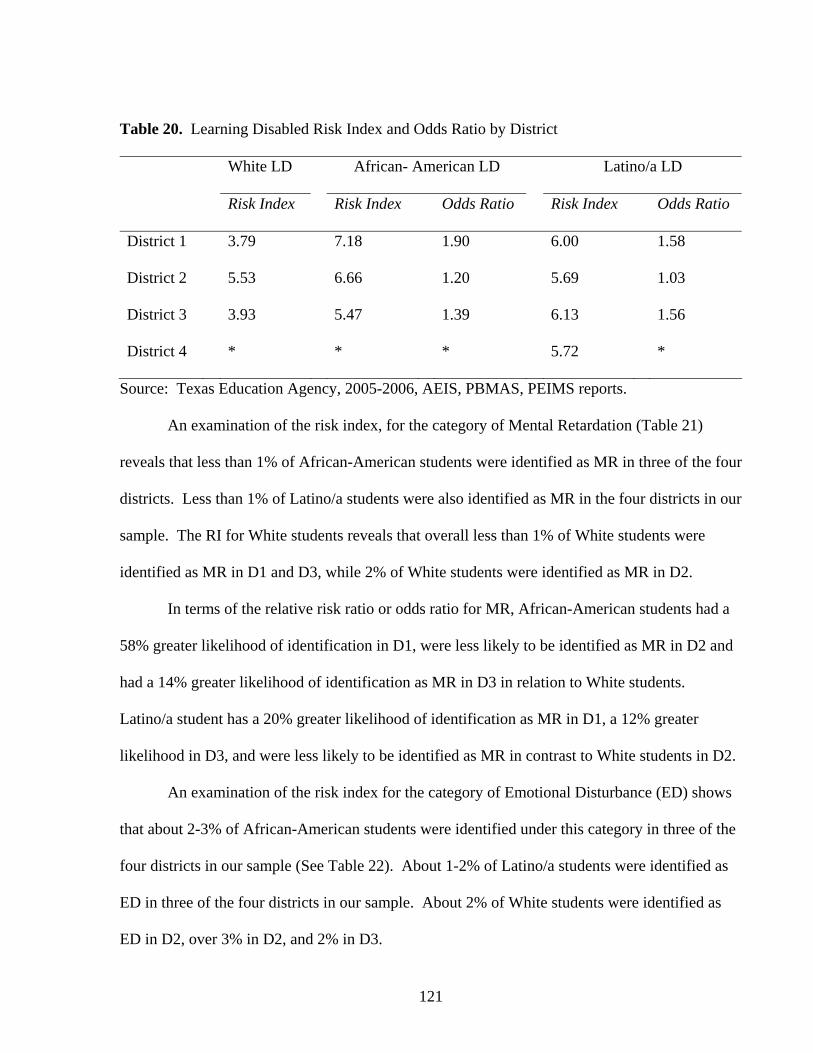
121
Table 20. Learning Disabled Risk Index and Odds Ratio by District White LD African- American LD Latino/a LD
Risk Index Risk Index Odds Ratio Risk Index Odds Ratio
District 1 3.79 7.18 1.90 6.00 1.58
District 2 5.53 6.66 1.20 5.69 1.03
District 3 3.93 5.47 1.39 6.13 1.56
District 4 * * * 5.72 *
Source: Texas Education Agency, 2005-2006, AEIS, PBMAS, PEIMS reports.
An examination of the risk index, for the category of Mental Retardation (Table 21)
reveals that less than 1% of African-American students were identified as MR in three of the four
districts. Less than 1% of Latino/a students were also identified as MR in the four districts in our
sample. The RI for White students reveals that overall less than 1% of White students were
identified as MR in D1 and D3, while 2% of White students were identified as MR in D2.
In terms of the relative risk ratio or odds ratio for MR, African-American students had a
58% greater likelihood of identification in D1, were less likely to be identified as MR in D2 and
had a 14% greater likelihood of identification as MR in D3 in relation to White students.
Latino/a student has a 20% greater likelihood of identification as MR in D1, a 12% greater
likelihood in D3, and were less likely to be identified as MR in contrast to White students in D2.
An examination of the risk index for the category of Emotional Disturbance (ED) shows
that about 2-3% of African-American students were identified under this category in three of the
four districts in our sample (See Table 22). About 1-2% of Latino/a students were identified as
ED in three of the four districts in our sample. About 2% of White students were identified as
ED in D2, over 3% in D2, and 2% in D3.
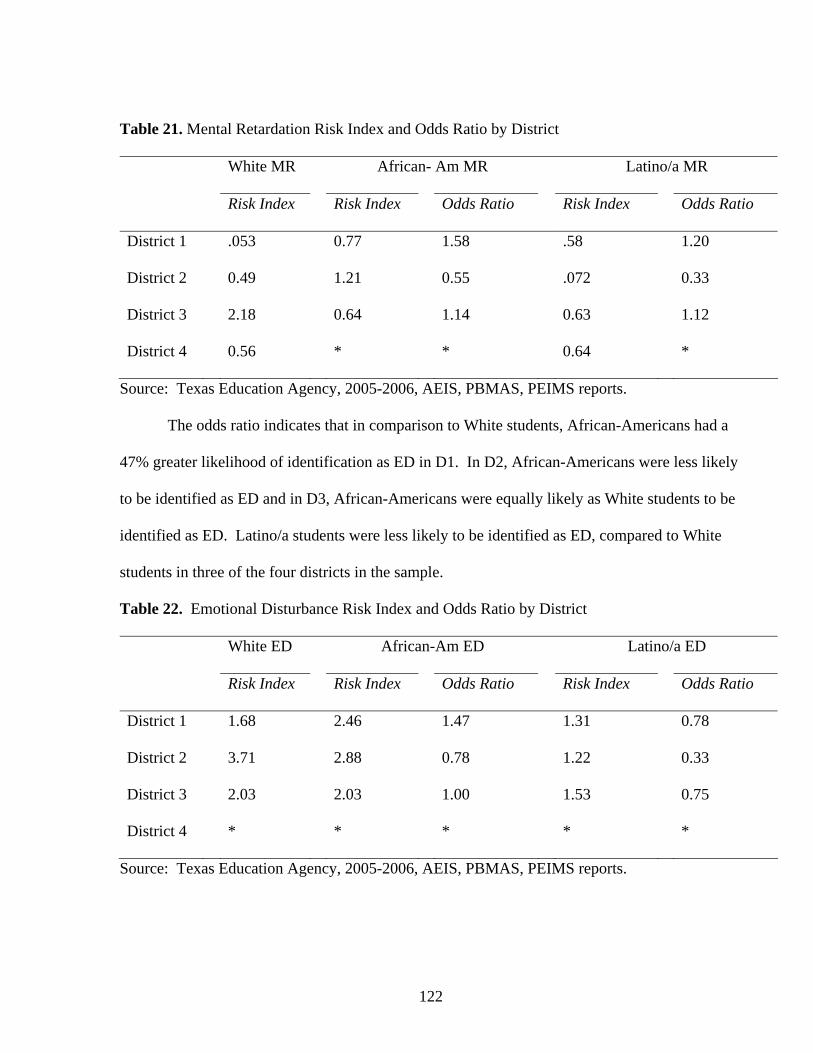
122
Table 21. Mental Retardation Risk Index and Odds Ratio by District White MR African- Am MR Latino/a MR
Risk Index Risk Index Odds Ratio Risk Index Odds Ratio
District 1 .053 0.77 1.58 .58 1.20
District 2 0.49 1.21 0.55 .072 0.33
District 3 2.18 0.64 1.14 0.63 1.12
District 4 0.56 * * 0.64 *
Source: Texas Education Agency, 2005-2006, AEIS, PBMAS, PEIMS reports.
The odds ratio indicates that in comparison to White students, African-Americans had a
47% greater likelihood of identification as ED in D1. In D2, African-Americans were less likely
to be identified as ED and in D3, African-Americans were equally likely as White students to be
identified as ED. Latino/a students were less likely to be identified as ED, compared to White
students in three of the four districts in the sample.
Table 22. Emotional Disturbance Risk Index and Odds Ratio by District
White ED African-Am ED Latino/a ED
Risk Index Risk Index Odds Ratio Risk Index Odds Ratio
District 1 1.68 2.46 1.47 1.31 0.78
District 2 3.71 2.88 0.78 1.22 0.33
District 3 2.03 2.03 1.00 1.53 0.75
District 4 * * * * *
Source: Texas Education Agency, 2005-2006, AEIS, PBMAS, PEIMS reports.
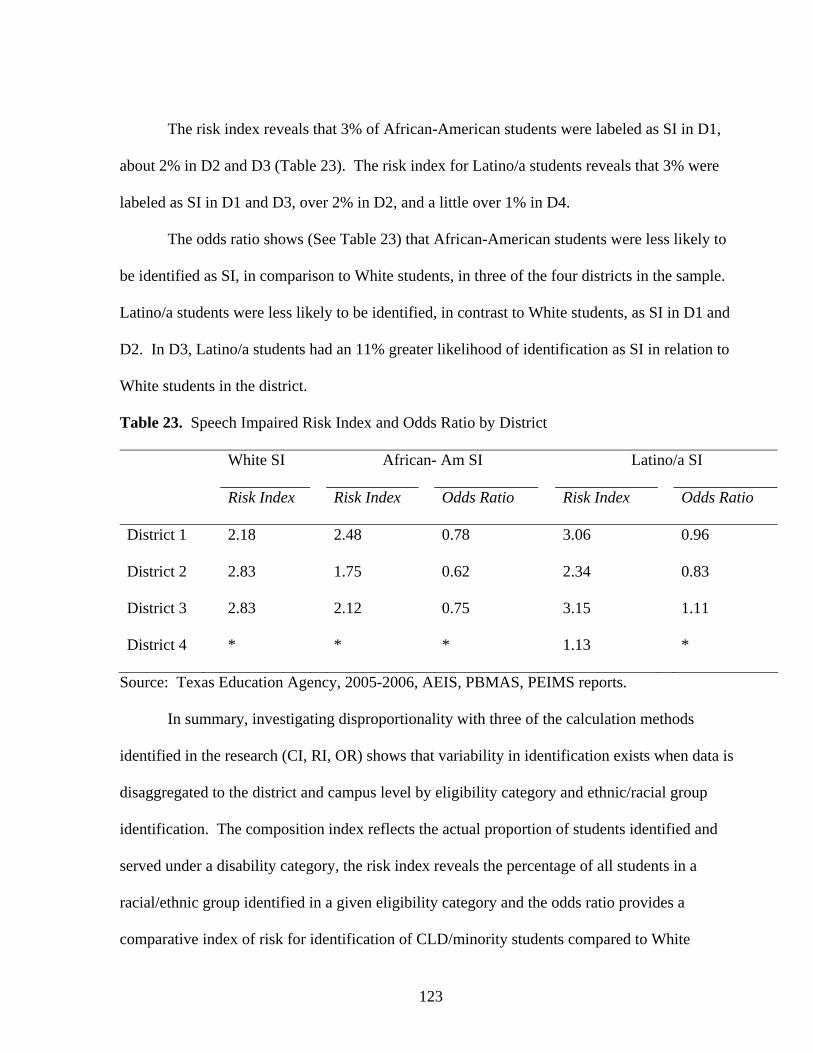
123
The risk index reveals that 3% of African-American students were labeled as SI in D1,
about 2% in D2 and D3 (Table 23). The risk index for Latino/a students reveals that 3% were
labeled as SI in D1 and D3, over 2% in D2, and a little over 1% in D4.
The odds ratio shows (See Table 23) that African-American students were less likely to
be identified as SI, in comparison to White students, in three of the four districts in the sample.
Latino/a students were less likely to be identified, in contrast to White students, as SI in D1 and
D2. In D3, Latino/a students had an 11% greater likelihood of identification as SI in relation to
White students in the district.
Table 23. Speech Impaired Risk Index and Odds Ratio by District White SI African- Am SI Latino/a SI
Risk Index Risk Index Odds Ratio Risk Index Odds Ratio
District 1 2.18 2.48 0.78 3.06 0.96
District 2 2.83 1.75 0.62 2.34 0.83
District 3 2.83 2.12 0.75 3.15 1.11
District 4 * * * 1.13 *
Source: Texas Education Agency, 2005-2006, AEIS, PBMAS, PEIMS reports.
In summary, investigating disproportionality with three of the calculation methods
identified in the research (CI, RI, OR) shows that variability in identification exists when data is
disaggregated to the district and campus level by eligibility category and ethnic/racial group
identification. The composition index reflects the actual proportion of students identified and
served under a disability category, the risk index reveals the percentage of all students in a
racial/ethnic group identified in a given eligibility category and the odds ratio provides a
comparative index of risk for identification of CLD/minority students compared to White

124
students in the district. Overall, African-American and Latino students were at greater risk of
identification for special education than White students.
Research Question Two
Do educator perceptions differ in regards to disproportionality of CLD students in special
education? Do school personnel perceptions differ based on their school position, race/ethnicity,
gender or years of experience? Survey data was used to answer this question, utilizing a three-
way ANOVA. Survey reliability and validity are presented, followed by the findings of the
ANOVAs. See Appendix I for Three-Way ANOVA SPSS results.
Survey of Educator Perceptions
The survey, “Educator Perceptions on Cultural and Linguistic Diversity: Educational
Practices, Policies and Programming” was developed to for this study. Based on a pilot study
(Fall, 2006), the survey was refined and revised by deleting items and including items specific to
the research questions for the investigation of disproportionality. The survey developed is
comprised of 18 demographic questions followed by 12 subscales with a total of 92 items to
address educator perceptions of educational programming, policies and practices in regards to
CLD students in the South Texas area (See Table 24).
Reliability
The survey responses were analyzed to determine internal reliability. Field (2005)
indicates that reliability is the ability of a measure to produce consistent results when the same
entities are measured under the same conditions. For this sample, respondents answered the
items in each subscale consistently within the overall questionnaire (Chronbach’s alpha = .98).
According to Field (2005), Chronbach’s alpha is the most common measure of scale reliability

125
and for this survey, the Chronbach’s alpha range from .42 to .95 by subscale. The survey
descriptive data and reliability indexes are presented in Table 24 by subscales.
The Chronbach’s alpha for ten subscales are within an acceptable range (.7 to .8), with
the perception of gender over-representation (Q 45 - 46), and the culturally relevant practices (Q
70 - 76) subscale alpha’s falling below .70. The perception of gender over-representation
subscale is comprised of two items, which lowers subscale reliability. The culturally relevant
practices subscale (S12) contains 11 items, but perhaps may be measuring more than one
construct. Item deletion would assist with internal consistency of the culturally relevant teaching
practices subscale.
Validity
The survey was developed with the intent to measure educators perceptions related to
educational policies, programming and practices for CLD students. Based on a review of the
literature in bilingual education, special education, school psychology and education did not
produce an existing instrument for this study. To this end, a survey was developed to determine
educator perceptions of disproportionality. The majority of items for the survey were developed
by the researcher based on a review of the literature and the research questions. Items for the
survey were also adapted from a review of questionnaires found in the literature.
The survey is intended to be used with school educators to determine their familiarity
with school policies, previous experience and training related to CLD, perceptions of over-
representation in special education, and perception of educational practices and programming
that affect CLD students at the intersection of bilingual education and special education.

Table 24. Survey Subscale Mean, Standard Deviation and Chronbach’s alpha
Subscales # of items Q n M SD Alpha
1. Familiarity with Federal / State Policy (S1) 7 1-2 345 22.17 5.52 .79
2. Previous Experience and Training (S2) 11 3-13 396 28.07 9.89 .95
3. Racial / Ethnic Over-representation (S3) 7 14-20 402 16.33 5.47 .84
4. CLD student Over-representation (S4) 8 21-28 411 19.09 5.56 .80
5. Latino/a student Over-representation (S5) 8 29-36 406 18.70 5.81 .82
6. ELL student Over-representation (S6) 8 37-44 401 18.07 5.75 .83
7. Gender Over-Representation (S7) 2 45-46 401 4.06 1.89 .67
8. Educational Programming for CLD (S8) 9 47-55 387 28.27 6.22 .80
9. Pre-referral / Student Support Team process for CLD (S9) 9 56-64 386 31.18 7.93 .93
10. Bilingual Psycho-educational Evaluation (S10) 5 65-69 355 16.50 5.15 .93
11. Special Education and CLD (S11) 7 70-76 383 25.24 6.41 .94
12. Culturally Relevant Teaching Practices (S12) 11 77-87 387 33.62 4.67 .42
126

127
According to the Standards for educational and psychological testing (1999), validity is a
unitary concept in which the degree of accumulated evidence supports the intended interpretation
of a result for the proposed purpose (p. 11). In other words, validity refers to the appropriateness
of interpretation of survey subscale results.
The survey was administered in a consistent fashion at each research site by the
researcher or her representative. The data was entered and coded consistently. Each educator
who chose to participate was provided with information about the study and was given time to
complete the survey during a staff meeting. No educators required or requested modifications or
adaptations to survey, time, or location during data collection. Participants were allowed to ask
questions during the administration process.
Analysis of Variance
Dependent and independent variables. Following the analyses of internal reliability for
survey subscales, a series of Analysis of Variances (ANOVAs) were conducted using
race/ethnicity, job title/position, and total years teaching as independent variables. The
independent variable, gender, was dropped due to the small number of participants in the sample
that were male (8%). The twelve survey subscales served as the dependent variables for each of
the ANOVA analysis. Each of the survey subscales provide data on educator perceptions of
education policies, programming and practices that directly affects schooling for CLD students
and the issue of disproportionality. See Table 25 for survey descriptives, dependent and
independent variables.
Subscale One, Educator’s familiarity with federal/state policies (Q1 and 2)
A three-way ANOVA revealed a significant main effect F (3, 290) = 4.73, p = .003, η2 =
.05, for job title/position on the familiarity with policies subscale (Q1 and 2). A significant

128
interaction F (6, 290) = 2.58, p = .019, η2 = .05, for race/ethnicity on job title/position (See
Figure 3). For this analysis, the interaction effect is the combined effect of the two variables
(race/ethnicity and job title/position) on the dependent variable, familiarity with policies
subscale.
A post hoc Tukey revealed a significant difference (p = .001) between general education
educators and administrative/support staff, bilingual education, and special education educators
on familiarity with federal/state policies. General education teachers were the least familiar with
federal/state policies related to CLD students, while administrative/support staff indicated greater
familiarity with federal/state policies related to pre-referral teams, bilingual education, and
special education.
Because the Univariate ANOVA revealed a significant interaction between job
title/position and race/ethnicity on the dependent variable familiarity with policies (F (6, 290) =
2.58, p = .019) an analysis of simple effects was warranted (See Figure 3). The results from the
simple effect analyses, revealed significant differences on general education teachers (F (2, 290) =
6.02, p = .003) and special education teachers (F (2, 290) = 3.26, p = .04). No significant
differences were found on job title/position in administration/support staff and bilingual/ESL
educators on the familiarity with policies subscale.
Post hoc tests (Bonferroni) indicated a significant difference among general education
teachers who are White and both Latino/a (p = .026) and other (p = .013) educators. White
general education teachers indicated significantly lower scores than Latino/a and other educators
on the familiarity with policies subscale.

Table 25. Dependent and Independent Variable Descriptive Data for ANOVA Race / Ethnicity Job Title / Position Total Years Teaching
Latino/a White Others Admin Gen Ed Bil / ESL Sp Ed < 5 Ys 6-20 Ys > 21 Ys
M SD M SD M SD M SD M SD M SD M SD M SD M SD M SD
Subscale
S1 23.1 5.4 20.5 5.5 22.7 4.6 24.6 5.6 19.9 5.1 23.5 5.1 24.7 4.5 20.9 5.5 22.7 5.2 23.0 6.0
S2 29.2 8.9 25.9 11.4 29.9 6.7 27.8 11.8 25.3 8.9 31.2 8.3 32.7 10.4 28.0 9.3 28.5 9.8 27.6 11.0
S3 17.2 5.2 14.9 5.7 16.4 5.0 18.2 6.0 15.5 5.0 16.9 5.6 16.3 5.7 16.3 5.4 16.3 5.5 16.3 5.6
S4 20.1 5.4 17.4 5.1 19.8 7.2 19.0 5.9 18.7 5.7 19.8 4.9 18.7 5.9 19.7 5.7 18.6 5.4 19.3 5.8
S5 19.9 5.5 16.6 5.7 19.6 6.1 18.5 5.8 18.5 6.2 19.5 5.2 17.7 5.5 19.3 5.8 18.2 5.8 18.9 5.7
S6 19.2 5.5 16.1 5.5 18.4 6.5 17.9 5.7 17.6 5.9 19.0 5.4 17.4 5.4 18.7 5.6 17.6 5.8 17.9 5.9
S7 4.4 1.9 3.4 1.8 4.5 1.9 4.4 2.1 3.9 1.7 4.1 2.0 4.2 1.8 4.1 1.4 4.0 1.9 4.0 1.9
S8 27.8 6.2 29.1 6.0 28.4 6.5 30.0 5.6 27.9 6.4 27.8 6.1 28.5 6.2 27.2 6.2 28.7 5.6 28.4 7.0
S9 30.2 7.8 32.8 7.9 32.7 8.1 34.4 7.3 29.9 8.3 30.3 6.9 34.9 7.9 29.9 7.9 32.2 7.4 30.1 8.6
S10 15.8 5.1 17.4 5.2 18.1 4.0 19.1 4.9 15.4 5.0 15.8 4.8 19.5 4.6 15.4 4.6 17.3 5.0 16.1 5.8
S11 24.2 6.4 26.6 6.4 28.4 4.3 26.3 5.9 24.6 6.6 24.9 5.8 28.3 6.7 24.4 6.3 25.7 5.9 25.3 7.4
S12 33.9 4.6 32.8 4.8 35.4 4.4 34.5 4.8 33.5 4.7 33.4 4.2 33.9 5.1 32.7 4.5 34.2 4.4 33.7 5.4
129

130
Post hoc tests (Bonferroni) indicated a significant difference among special education
teachers who are African-American, Asian, or other and White educators (p = .04). African-
American, Asian and other special education teachers had significantly lower scores than White
special education teachers on the familiarity with policies subscale. White educators in the
South Texas area indicated less familiarity with policies and programming related to pre-referral,
bilingual education and special education.
The results from the simple effect analyses, revealed significant differences between
White educators (F (3, 290) = 12.96, p = .001) and Latina educators (F (3, 290) = 7.81, p = .001) on
S1, familiarity with federal/state policy. No significant differences were found on job
title/position by African-American, Asian or other educators on this subscale.
Post hoc tests (Bonferroni) indicated a significant difference between White general
education teachers and admin/support staff (p = .004), as well as White general education and
special education (p = .000) teachers. General education teachers had significantly lower scores
than admin/support staff and special education teachers. No significant differences were found
between White bilingual/ESL teachers and special education teachers on job title/position for the
familiarity with federal/state policies subscale.
Post hoc tests (Bonferroni) also revealed significant difference in Latina general
education teachers and admin/support staff (p = .001) and bilingual/ESL (p =.000) teachers.
Latina general education teachers had significantly lower scores than Latina admin/support staff
and bilingual/ESL teachers. No significant differences were found between Latina
admin/support staff and special education educators. No significant differences were found on
African-American, Asian American or other educators on job/position on the familiarity with
federal policies subscale.

131
Figure 3. Interaction for Race/ethnicity on Job/position for S1
Subscale Two, Previous experience and training (Q 3-13)
A three-way ANOVA indicated a significant main effect F (3, 338) = 2.79, p = .04, η2 =
.04, on the previous experience and training subscale by job title/position. There was a
significant interaction F (6, 338) = 2.62, p = .017, η2 = .04, between job title/position and total
years teaching on the experience and training subscale (See Figure 4).
A post hoc Tukey revealed a significant difference between general education teachers
and both bilingual education (p = .001) and special education (p = .001) teachers on the previous
experience and training subscale. General education teachers indicated less experience and
training related to CLD students and students with disabilities in relation to bilingual and special
education teachers. Special education teachers indicated the most amount of training in these
areas.

132
Because the Univariate ANOVA revealed a significant interaction between job
title/position and total years teaching on the dependent variable experience and training subscale
(F(6,338) = 2.68, p = .017), an analysis of simple effect was warranted (See Figure 4). The results
from the simple effect analyses revealed no significant differences between the total years of
teaching in job title/position. The results from the simple effect analyses, however, revealed
significant differences of title/position in 6-20 years of teaching F(3,359) = 9.36, p = .000) and over
20 years of teaching (F(3,359) = 5.39, p = .001). No significant difference of title/position was
found in < 5 years of teaching.
Post hoc tests (Bonferroni) indicated a significant difference among educators with 6-20
years experience. A difference was noted between general education and admin/support staff (p
= .021), as well as between general education and bilingual/ESL (p = .000) teachers. General
education teachers placed significant lower scores than admin/support staff and bilingual/ESL
teachers on the training and experience subscale.
Post hoc tests (Bonferroni) also revealed significant difference in educators with over 20
years of teaching. A significant difference was noted between special education teachers and
admin/support (p = .003), and between special education and general education (p = .012)
teachers. Special education teachers had significant higher scores than admin/support and general
educators on the training and experience subscale.
Figure four displays the interaction between job title/position on total years teaching,
which shows that general education teachers, had the lowest amount of experience and training
related to CLD issues, such as disproportionality, special education, bilingual education, the
evaluation process, and cultural and linguistic diversity in relation to the other three group of
educators in the sample.

133
Administrators and support staff with over 20 years of experience did not appear to have
had experience and training in CLD issues compared to administrators and support staff with less
than five years of experience. Special educators appear to acquire experience and training in
terms of CLD issues, the longer they have been teaching (> 20 Ys).
Figure 4. Interaction for job/position on total years teaching for S2
Subscale Three, Ethnic/Racial Over-representation (Q 14-20)
A three-way ANOVA revealed a significant main effect F (3, 344) = 4.99, p = .002, η2 =
.04, for job title/position on the perception of ethnic/racial over-representation subscale (Q 14-
20). No significant interactions were noted on this subscale.
A post hoc Tukey (p = .006) revealed a significant difference between admin/support
staff and general education teachers on their perceptions of racial over-representation in special

134
education. Administrators and support staff responses suggest that students could be over-
represented in special education by race/ethnicity. General education teacher responses did not
suggest racial/ethnic over-representation in special education.
Item response analysis revealed that seventy to eighty percent of the survey respondents
did not feel that White, Asian, and Native-American students were over-represented in special
education (Likert scale responses 1-3). Forty-eight to fifty percent of respondents indicated that
Latino/a and African-American students were not over-represented in special education
respectively. Overall, respondents did not perceive any one ethnic/racial group to be over-
represented in special education.
Subscale Four, CLD Over-representation (Q 21-28)
A three-way ANOVA revealed a significant main effect F (2, 355) = 6.04, p = .003, η2 =
.03, for race/ethnicity on perception of CLD over-representation subscale (Q 21-28). No
significant interactions were noted on this subscale.
A post-hoc Tukey (p = .000) revealed a significant difference between White and
Latina/o educators on the CLD student over-representation subscale. White educators did not
perceive CLD students to be over-represented in special education, while Latina educator
responses indicated that CLD students could be over-represented in special education.
Subscale Five, Latino/a Over-representation (Q 29-36)
A three-way ANOVA revealed a significant main effect F (2, 350) = 6.24, p = .002, η2 =
.03, for race/ethnicity on the Latino/a student over-representation subscale (Q 29-36). No
significant interactions were noted on this subscale.
A post-hoc Tukey (p = .001) revealed a significant difference between White and
Latina/o educators on subscale five. White educators did not perceive Latino/a students to be

135
over-represented in special education, while Latina educators indicated that Latino/a students
could be over-represented in special education.
Subscale Six, ELL Over-representation (Q 37-44)
A three-way ANOVA revealed a significant main effect F (2, 345) = 7.70, p = .001, η2 =
.04, for race/ethnicity on the perception of ELL student over-representation subscale (Q 37-44).
No significant interactions were noted on this subscale.
A post-hoc Tukey (p = .001) revealed a significant difference between White and Latina
educators on perceptions of ELL over-representation. White educators perceived that ELL
students were less over-represented in special education than Latina educators.
Item response analysis revealed that educators did not perceive CLD, Latino/a or ELL
students to be over-represented as LD, SI, MR or ED. Educator responses suggest that they are
not aware of the problem of disproportionality.
Subscale Seven, Gender Over-representation (Q 45-46)
A three-way ANOVA revealed a significant main effect F (2, 344) = 6.27, p = .002, η2 =
.04, for race/ethnicity was noted on educators perception on the gender over-representation
subscale (Q 45-46). No significant interactions were noted on this subscale.
A post-hoc Tukey indicates a significant difference between White and Latina educators
(p = .001) educators on their perceptions of gender over-representation in special education. A
post-hoc Tukey (p = .01) indicates a significant difference between White educators and African-
American, Asian or Native American educators on their perceptions of gender over-
representation in special education. White educators tended to perceive less gender over-
representation in special education than educators from other ethnicities.

136
Subscale Eight, Educational Programming for CLD (Q 47-55)
A significant main effect F (2, 330) = 4.05, p =.018, η2 = .02, for race/ethnicity on the
perception of appropriate educational programming subscale (Q 47-55). No significant
interactions were noted on this subscale.
A post-hoc Tukey (p = .05) indicated a significant difference between White and Latina/o
educators on their perceptions of appropriate educational programming for CLD students.
Responses suggest that White educators perceive that CLD students receive appropriate
educational programming, while Latina educators indicated that the needs of CLD students may
not be adequately met.
Subscale Nine, Pre-referral/Student Support Team (Q 56-64)
A significant main effect F (2, 326) = 5.97, p = .003, η2 = .04 was detected for
race/ethnicity on the pre-referral/student support team practices subscale (Q 56-64). No
significant interactions were noted on this subscale.
A post hoc Tukey (p = .003) showed a significant difference between White and Latina/o
educators on the pre-referral/student support team practices subscale. Responses suggest that
White educators perceive SST practices for CLD students to be appropriate, while Latino/a
teachers perceived that these practices may not be adequate.
Subscale Ten, Bilingual Psycho-educational Evaluations (Q 65-69)
A three-way ANOVA revealed a significant main effect F (3, 303) = 3.62, p = .014, η2 =
.04 for job title/ position on the bilingual psycho-educational evaluation subscale (Q 65-69). A
significant main effect F (2, 303) = 3.25, p = .040, η2 = .02, was found on total years teaching.
No significant interactions were noted on this subscale.

137
A post-hoc Tukey indicates a significant difference between general education teachers
and administrators/support staff (p = .001). A significant difference was also noted between
general education and special education teachers (p = .001) on the bilingual evaluation practices
subscale. Administrators/support staff and special education personnel responses suggest that
bilingual evaluation practices appear to be adequate, while general education teacher responses
suggest that these practices may not be adequate.
A post-hoc Tukey (p = .002) revealed a significant difference between educators with less
than five years of experience and educators with 6-20 years of experience on the bilingual
psycho-educational evaluation practices subscale. Educators with five or less years of
experience did not believe that bilingual evaluation practices were adequate, while educators
with 6-20 years of experience indicated these practices to be appropriate.
Subscale Eleven, Special Education and CLD (Q 70-76)
A significant main effect F (2, 326) = 9.29, p = .001, η2 = .05 for race/ethnicity was
found on the special education subscale (Q 70-76). No significant interactions were noted on
this subscale.
A post-hoc Tukey revealed a significant difference between Latina/o educators and
African-American, Asian American, Native American and other educators (p = .006). A
significant difference was also noted between Latina/o educators and White educators (p = .001)
on the special education practices subscale. Latina/o educators perceived special education
services for CLD students to be less than adequate, while White and other educators felt these
services to be adequate.

138
Subscale Twelve, Culturally Relevant Practices (Q 77-87)
No significant main effects or interactions were noted on the culturally relevant teaching
practices subscale for any of the independent variables.
Open-Ended Survey Responses
The last page of the survey, “Educator Perceptions on Cultural and Linguistic Diversity:
Educational Practices, Policies and Programming” included four open-ended questions and an
opportunity for participants to provide comments on the survey. The first question asked
participants to reflect on any training they had attended in regards to cultural and linguistic
diversity or special needs students. The second question asked participants to indicate their
opinion on the training their school may need for CLD students in their district. The following
question asked participants to indicate any training needs for their school in regards to cultural
and linguistic diversity. The third question asked participants to indicate from seven specific
trainings, which were needed by their campus on topics from second language acquisition to
under-representation of CLD students in gifted education. The last item on this page provided
participants with space for additional comments. An analysis of participant responses for each of
the open-ended questions is provided.
Trainings attended. Seventy percent of the 439 survey participants included a response
for question one: “What training on cultural and linguistic diversity and/or special needs
students have you attended.” Twenty-five percent (25%) of the respondents framed their
response to this question based on their educational background, such as college courses for their
bachelor or master’s degree. The highest response was thirty-four percent (34%) for training in
the Structured Instruction Observation Protocol (SIOP) model. Twenty-eight percent (28%) of
the respondents indicated training related to diversity or bilingual-bicultural studies. Eight

139
percent (8%) of respondents indicated training in English as a Second Language (ESL).
Nineteen percent (19%) of participants included training in special education related topics (e.g.,
ARD, dyslexia) in their responses. While eight percent (8%) included training on Language
Proficiency Assessment Committee (LPAC), Texas Observation Protocol (TOP) or the Texas
English Language Proficiency Assessment System (TELPAS), the remaining responses included
training by Ruby Payne (5%), and differentiated instruction (3%).
In addition to trainings at the university level, participants indicated training was
provided by the school district, campus specialist, or the region service center. The next open-
ended question asked participants about training needs in their district.
Training needs. The second open-ended question in regards to training needs, based on
they type of CLD students in their district, provided an array of responses. “What training do
you feel your school may need in regards to CLD students in your district?” A total of 238
participants provided a response to this question (54%). The examples provided on the survey
included social justice, parental involvement, critical pedagogy, biliteracy development, and
identity. Of these, the most frequent response by participants was training needs pertaining to
parental involvement (39%) followed by biliteracy development (32%). Within the parental
involvement area, respondents integrated the following needs into their responses on parent
training needs: learning English; teaching parents strategies to help their children learn; and the
importance of education for the future.
In addition, 13% of respondents stated that training in all areas and for all teachers is
needed. One respondent states that training was needed, “…for everyone not just bilingual
teachers, [for] all teachers so that everyone can be sensitive to diversity.” Two respondents
added that the state and legislators needed the training on these issues as well. Twelve percent

140
(12%) of responses included the need for training on identity development, critical pedagogy or
social justice issues. Nine percent of the respondents indicated that no training was needed. The
remaining 8% of responses included a need for training on the legal issues related to special
education changes, CLD and special needs, social issues, and second language acquisition.
Specific training needs for CLD and special needs. The third open-ended question related
to specific training needs for school personnel in regards to areas that directly affect CLD
populations and special needs classifications. Seven topics were listed which included: first and
second language acquisition, bilingual education, special education, pre-referral intervention or
student support teams, response to intervention, over-representation in special education, and
under-representation in gifted education. Thirty percent (30%) of survey participants provided a
response to question three.
The majority of respondents indicated a need for training in Response to Intervention
(RTI), since this is a new federal requirement for early intervention (31%). Twenty-seven
percent (27%) of participants indicated a need for training in first and second language
acquisition, followed by special education (25%), student support team training (24%), bilingual
education (22%), and under-representation of CLD students in gifted education (21%). Training
in over-representation of CLD students in special education was perceived as least important to
participants at this time, with only a 14% response rate.
Specific training needs included by participants ranged from the process and procedures
in the pre-referral stages (e.g., paperwork, faster interventions, and documentation),
modifications, and as one participant wrote, “what to do if nothing works.”
Additional Comments. Participants were also provided with space for additional
comments at the end of the survey. Ten percent (10%) of survey participants included additional

141
comments, which offer some insights on issues related to CLD students and campus specific
dilemmas. The responses varied, but tend to include statements that reinforce the need to
investigate educator perceptions on these topics. Participants elaborated on the previous open-
ended questions as well as responded to survey questions in the space provided.
Open-ended survey responses were reviewed and coded as negative or positive in regards
to culturally and linguistically diverse students, families, and communities. Using the frame of
deficit thinking (Valencia, 1997b), the responses were grouped as deficit oriented (negative) or
anti-deficit oriented (positive). Deficit thinking typically offers a description of behavior, by
referring to deficits, deficiencies, deprivation, disadvantages, and limitations or shortcomings of
students, families or communities (Valencia, 1997b). Positive responses were considered anti-
deficit thinking in orientation, while negative responses were viewed as deficit-oriented in that
differences are linked to lack of academic progress, and blame is placed within the child, or with
the parent.
One example which appears to blame the parent, suggests that schools were not able to
provide appropriate educational programming, such as bilingual education because parents, “do
not tell the whole truth on home language surveys.” In addition, the respondent stated that,
“there has to be something more teachers can do when they know a parent has lied on a home
language survey.” Another example that uses the blame-the-parent approach stated, “I think that
parents often expect the teachers to teach correct reading, grammar, and vocab[ulary] in English,
yet do not reinforce it at home.”
The next set of deficit-oriented responses center on the notion of educability and appear
to suggest a prescriptive approach to services for CLD students. For example, one participant
shared that their “district has a policy of sink and swim;” while another felt that it was “time to

142
teach only in English for students that start school in Pre-K through second grade. Recent
immigrants in 3, 4, [and] 5 should have Spanish support, not be taught in Spanish all day.”
Fifteen percent (15%) of the responses indicated problems with special education and
bilingual education programs. For example, one participant stated that in her school, “[they]
have many students who should be in a bilingual class and are not.” While another felt that
placing students in bilingual programs was not appropriate just because they did not “score a
high enough score in English.” Another respondent stated that ELL students that were also
eligible for special education “were ‘encouraged’ to be placed in English only classes even
though they could not speak or understand English [because] bilingual resource personnel were
unavailable.”
In terms of special education, respondents stated that “teachers are reluctant to spend
precious time on the paper work to no avail” and that “too many students who need special
education services are not serviced.” The referral process was also perceived as not effective.
Anti-deficit-oriented responses included positive rather than deficit-oriented statements in
regards to the students’ language and development of their native language skills. For example
one educator stated, “I believe a child learns best in their own native language.” Another
educator stated that there was “too much focus on transitioning kids into English instead of
developing true biliterate-dual language students.”
Similar to previous statements about training needs for all educators, one educator stated
the he/she felt that “regular-general education teachers do not understand, and maybe do not
wish to understand what an ESL/Bilingual teacher go[es] through;” and in addition, “All teachers
including general education need to understand the importance of bilingual education.” One

143
respondent felt that general education teachers “need more training to understand bilingual and
special education needs.”
In addition to the open-ended responses, participants also wrote in comments to questions
within the survey. During survey administration, the researcher was asked to clarify what
psycho-educational evaluation meant or was at two research sites. Subscale ten (Q 65-69),
which includes questions about the bilingual evaluation process for CLD students, tended to have
the most blanks (9-15% of the items missing). Educators did not appear to be familiar with the
bilingual evaluation process for special education purposes on their campus, or were not sure
how to answer these questions. Evaluations play a major role in the referral to special education
placement process, but this appeared to be an elusive topic for educators. As one participant
wrote, “I am not aware if any psycho-educational evaluations are performed at this school.”
The open-ended responses suggest that educator perceptions on these topics are varied,
but play a critical role in how each perceives the education of CLD students. The referral to
special education process tends to be an area of concern to educators in terms of the paperwork
driven process and the changing guidelines for special education.
Research Question Three
Do school personnel perceptions on disproportionality of CLD students differ in
comparison to actual TEA data for the selected school districts and campuses?
Using the composition index as the tool for measuring the proportion of CLD students
over-identified in special education in the district and by eligibility category, the findings show
that African-American, Latino/a and White students all display over-representation in special
education at various levels when data is disaggregated. At the state level, African-American
(+3.4) and White students (+2.9) would be considered over-represented in special education. At

144
the district level, African-American students were over-represented in D1 (+2.4) as LD, ED and
MR; in D2 (+1.8) in the categories of LD, ED, and MR; and in D3 as LD. Latino/a students
were over-represented as LD at the state level. In D1 (+2.0), Latino students were over-
represented in the categories of LD and MR; in D2 as SI (+1.6); and in D3 (+2.2) as LD, MR,
and SI. White students were over-represented in D1 as ED and SI; in D2 as ED and MR; and in
D3 as ED.
Chi Square Analyses
The Chi square test was used to analyze five survey subscales that focus on over-
representation (S3-S7). The five point Likert scale items for each subscale were re-coded into
two categories for analysis. The subscales responses were re-coded by dividing the scale into
two categories, the subscale totals at the lower end of the scale were re-coded as one (1)
indicating no over-representation and responses at the higher end of the scale were re-coded as
two (2) signifying over-representation. The Chi Square test was used to analyze whether the
observed number of responses in the two categories differ from the expected responses by
educators on subscale three through seven. These subscales attempt to measure educator
perceptions of over-representation of CLD students.
The Chi Square tests are used most often to analyze data that consists of counts or
frequencies (Coolidge, 2000). The frequency of responses (how many) was analyzed to
determine if a difference exists between the number of educators who indicated no over-
representation (1) and educators who indicated over-representation (2). The educator responses
were analyzed by district to obtain a descriptive comparison to the composition index of CLD
students in special education.

145
District One. For D1, the Chi Square analyses for each of the five subscales were
significant (See Table 26). Subscale 3, Racial/Ethnic Over-Representation, χ2 (1) = 49.62, p =
.001, Subscale 4, CLD student Over-Representation χ2 (1) = 42.23, p = .001, Subscale 5,
Latino/a student Over-Representation, χ2 (1) = 43.01, p = .001, Subscale 6, ELL student Over-
Representation χ2 (1) = 59.39, p = .001, and Subscale 7, Gender Over-Representation
χ2 (1) = 21.49, p = .001.
The Chi Square analysis indicates that the observed cell frequencies vary from the
expected. Educators in D1 perceived that over-representation was not a problem for racial/ethnic
groups, CLD, Latino/a and ELL students. Sixty-five percent of responses by D1 educators did
not perceive boys or girls to be over-represented in special education.
District Two. In D2, a significant difference between educator responses (See Table 27)
was found for S3, χ2 (1) = 18.38, p = .001 and S6, χ2 (1) = 4.11, p = .043. D2 educators did not
perceive over-representation to be evident among racial/ethnic groups or for ELL students.
Educator responses were not significant for subscales four, five, or seven, based on Chi Square
analysis.
District Three. The Chi Square analysis for D3 educators (See Table 28) denotes a
significant difference on S3, ethnic/racial student over-representation. Eighty-one percent (81%)
of responses by educators in D3 suggest that ethnic/racial group over-representation in special
education was not perceived as a problem, χ2 (1) = 10.70, p = .001. No significant findings were
noted on any of the remaining subscales.
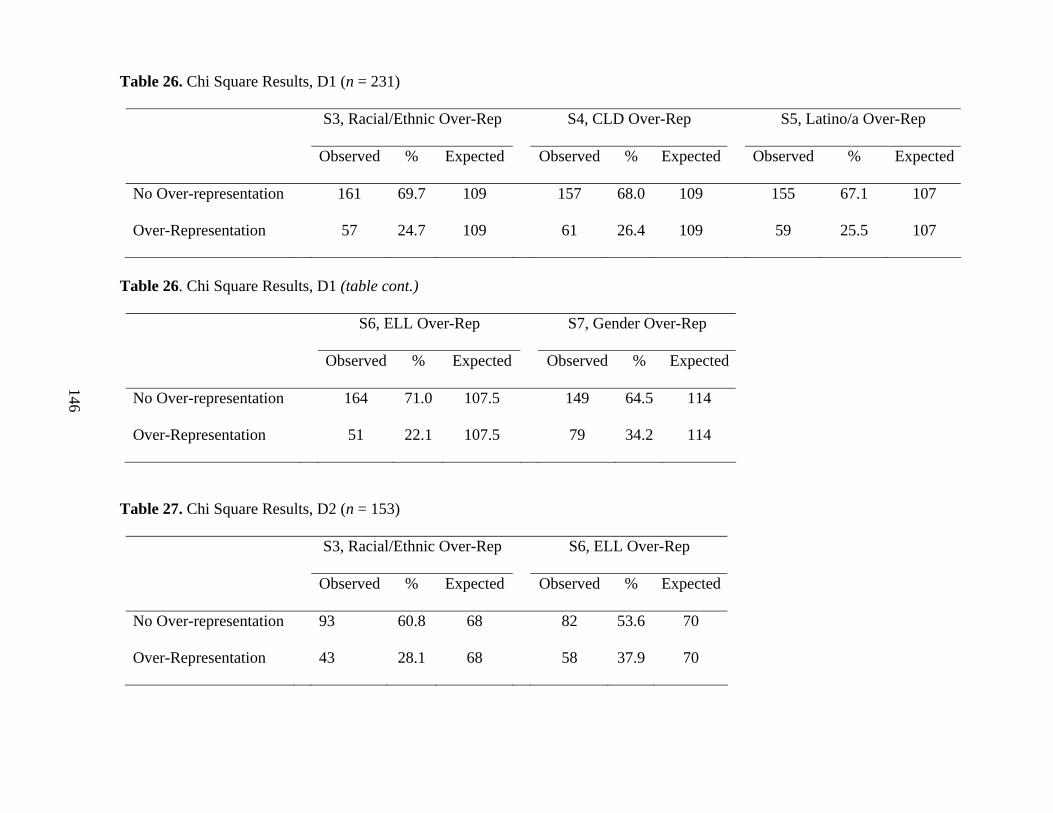
Table 26. Chi Square Results, D1 (n = 231)
S3, Racial/Ethnic Over-Rep S4, CLD Over-Rep S5, Latino/a Over-Rep
Observed % Expected Observed % Expected Observed % Expected
No Over-representation 161 69.7 109 157 68.0 109 155 67.1 107
Over-Representation 57 24.7 109 61 26.4 109 59 25.5 107
Table 26. Chi Square Results, D1 (table cont.)
S6, ELL Over-Rep S7, Gender Over-Rep
Observed % Expected Observed % Expected
No Over-representation 164 71.0 107.5 149 64.5 114
Over-Representation 51 22.1 107.5 79 34.2 114
Table 27. Chi Square Results, D2 (n = 153)
S3, Racial/Ethnic Over-Rep S6, ELL Over-Rep
Observed % Expected Observed % Expected
No Over-representation 93 60.8 68 82 53.6 70
Over-Representation 43 28.1 68 58 37.9 70
146
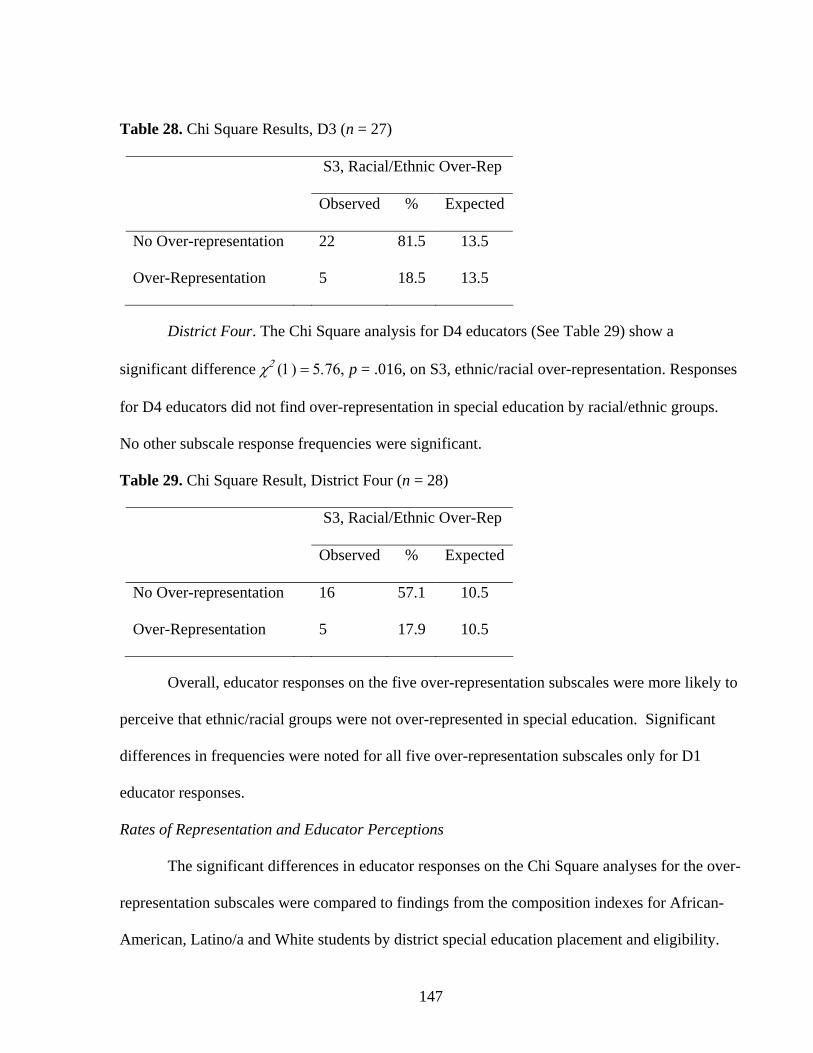
147
Table 28. Chi Square Results, D3 (n = 27)
S3, Racial/Ethnic Over-Rep
Observed % Expected
No Over-representation 22 81.5 13.5
Over-Representation 5 18.5 13.5
District Four. The Chi Square analysis for D4 educators (See Table 29) show a
significant difference χ2 (1) = 5.76, p = .016, on S3, ethnic/racial over-representation. Responses
for D4 educators did not find over-representation in special education by racial/ethnic groups.
No other subscale response frequencies were significant.
Table 29. Chi Square Result, District Four (n = 28)
S3, Racial/Ethnic Over-Rep
Observed % Expected
No Over-representation 16 57.1 10.5
Over-Representation 5 17.9 10.5
Overall, educator responses on the five over-representation subscales were more likely to
perceive that ethnic/racial groups were not over-represented in special education. Significant
differences in frequencies were noted for all five over-representation subscales only for D1
educator responses.
Rates of Representation and Educator Perceptions
The significant differences in educator responses on the Chi Square analyses for the over-
representation subscales were compared to findings from the composition indexes for African-
American, Latino/a and White students by district special education placement and eligibility.

148
Data from the TEA was used to calculate the composition indexes, odds ratio, and risk indexes
for research question one and was used to compare educator perceptions of over-representation.
The D4 student population was entirely Latino/a and no other ethnic groups were represented;
therefore analyses for African-American and White students was not possible and are not
included for comparison of student over-representation and educator perceptions for D4.
District One. Educator responses were significantly different on S3, ethnic/racial over-
representation and S4, CLD student over-representation. Figure five below links educator
responses to the rates of representation of African-American students, who were over-identified
in special education in D1 under the categories of LD, MR and ED.
The composition index for African-Americans in the LD category was 14%. Educator
responses for S3 (70%) and S4 (68%) indicate no over-representation of CLD students. Fourteen
percent of African-Americans were serviced as MR and 16% of African-American students were
serviced in special education as ED, while African-Americans only account for ten percent
(10%) of the district student population. The first bar in figure five shows the composition index
is above 10%, and therefore, African-American students were considered over-represented in the
categories of LD, MR, and ED. The S3 and S4 bars represented in figure five indicate the
percent of educator responses which responded that racial/ethnic groups or CLD students were
not over-represented in special education.

149
District One
14 14 16
70 70 7068 68 68
01020304050607080
LD MR ED
Perc
ent
Af-Am Over-Rep S3 S4
Figure 5. African-American Student Over-Representation and Educator Perceptions D1
Latino/a over-representation was also noted in D1 in the categories of LD, MR and SI.
Figure six below shows that Latino/as make up 53% of the students serviced as LD, 47% of
those as MR, and 45% of students serviced as SI, while they account for 44% of D1 student
population. Educator perceptions on S3, ethnic/racial over-representation (70%), S4, CLD
student over-representation (68%) and S5, Latino/a student over-representation (67%) show that
educators do not perceive Latino/a students to be over-represented in special education.
District One
5347 45
70 70 7068 68 6867 67 67
01020304050607080
LD MR SI
Perc
ent
Latino Over-Rep S3 S4 S5
Figure 6. Latino/a Student Over-representation and Educator Perceptions D1
White students in D1 make up 42% of the student population. Forty-six percent of White
students receive services as ED (See Figure 7) and 45% receive services as SI, which indicates

150
that White students were over-represented in these two eligibility categories. Chi Square
analyses revealed a significant difference between educator responses on S3, ethnic/racial over-
representation. Seventy percent (70%) of educators responded that over-representation of
ethnic/racial groups was not evident in D1.
District One
46 45
70 70
01020304050607080
ED SI
Per
cent
White Over-Rep S3
Figure 7. White Student Over-Representation and Educator Perceptions D1
District Two. Chi Square analysis revealed a significant difference on D2 educator
responses for S3, ethnic/racial over-representation. Sixty-one percent (61%) of educator
responses suggest that over-representation was not perceived as a problem by educators for
racial/ethnic groups (See Figure 8). The composition index revealed that African-American
students in D2 were over-represented in special education as LD (10%), MR (13%) and ED
(18%) while they only account for nine percent (9%) of the student population in D2.

151
District Two
10 1318
61 61 61
010203040506070
LD MR ED
Perc
ent
Af-Am Over-Rep S3
Figure 8. African-American Student Over-Representation and Educator Perceptions D2
Latino/a students in D2 were over-represented in special education in the category of SI
(89%). Latino/a students account for 87.7% of the student population in D2. Educator responses
on the Chi Square analysis indicated a significant difference on S3, ethnic/racial over-
representation and S6, ELL student over-representation. Sixty one percent of S3 and 54% of S6
educator responses suggest that student over-representation in special education was not evident
(See Figure 9).
District Two
89
6154
0102030405060708090
100
SI
Perc
ent
Latino Over-Rep S3 S6
Figure 9. Latino/a Student Over-Representation and Educator Perceptions D2

152
White students encompass only three percent (3%) of the student population in D2. Eight
percent (8%) of White students receive special education services as ED and MR in D2 and were
considered over-represented in special education in these two categories (See Figure 10). Chi
Square analyses revealed a significant difference on educator responses for S3, ethnic/racial
over-representation. Sixty-one percent (61%) of educator responses to S3 suggest that no over-
representation of ethnic/racial groups in special education was evident.
District Two
8 8
61 61
010203040506070
ED MR
Perc
ent
White Over-Rep S3
Figure 10. White Student Over-Representation and Educator Perceptions D2
District Three. In D3, African-American students were over-represented as LD (8%), ED
(10%) and MR (8%), while they only make up eight percent (8%) of the student population in
D3. Chi Square analyses were significant on S3, ethnic/racial student over-representation (82%).
Figure 11 shows that educator responses for S3 do not suggest ethnic/racial group over-
representation in special education.

153
District Three
8 10 8
82 82 82
0
20
40
60
80
100
LD ED MR
Perc
ent
Af-Am Over-Rep S3
Figure 11. African-American Student Over-Representation and Educator Perceptions D3 The composition index of Latino/a students in special education, indicates an over-
represented in D3 in the categories of LD (70%), MR (63%), and SI (65%). Latino/a students
represent sixty-one percent (61%) of the student population in D3. A significant difference in
educator perception of over-representation was found utilizing the Chi Square for subscale three
(S3), ethnic/racial over-representation. District three educator responses (Figure 12) indicate that
over-representation of ethnic/racial groups in special education was not apparent.
District Three
7063 65
82 82 82
0
20
40
60
80
100
LD MR SI
Perc
ent
Latino Over-Rep S3
Figure 12. Latino/a Student Over-Representation and Educator Perception D3
Twenty-eight percent (28%) of the student population in D3 was White. White students
were over-represented in special education in D3 in the category of ED (34%), while they make

154
up 28% of the student population. Figure 13 shows that educator responses to S3, racial/ethnic
group over-representation (82%), denotes that over-representation of students in special
education was not apparent.
District Three
34
82
0
20
40
60
80
100
ED
Perc
ent
White Over-Rep S3
Figure 13. White Student Over-Representation and Educator Perceptions D3
Overall, educator responses to over-representation subscale questions suggests that over-
representation of CLD students was not observable. D4 was not included in the analysis due to
the lack of ethnic student diversity in the district. Calculations for over-representation were not
possible and were therefore not included in research question three.
Summary
This chapter provided the data analysis for each of the research questions. The results are
wide-ranging and provide insight into educator perceptions of disproportionality. Practices vary
between districts and schools, which results in an array of educational outcomes for CLD
students in the South Texas area. Measures of disproportionality provide tools in which to
calculate the proportion of students serviced in special education as well as a means to examine
student group placement rates. Educator perceptions on disproportionality point to variability in
responses based on the race/ethnicity and job position of the participant. Responses to survey

155
subscales on over-representation reveal that educators may not be aware of the decade’s long
problem of disproportionality and placement of CLD students in special education. Linking data
from the TEA with educator responses to survey subscales that focus on over-representation
show that educators may not be aware of the number of CLD students in their school and district
that are placed in special education.

156
CHAPTER V: DISCUSSION
Introduction
This chapter provides a summary of the research and study findings followed by
implications. These findings and implications will help educators in linking research to policy
and practice. Areas for future research in terms of rates of CLD students in special education
and educator perceptions are provided.
This study on disproportionality is an extension of decades of research that have
previously shown that culturally and linguistically diverse students are at higher risk of referral
and placement into special education programs (Artiles & Ortiz, 2002b; Chinn & Hughes, 1987;
Donovan & Cross, 2002; Harry & Klingner, 2006; Heller, Holtzman, & Messick, 1982; Losen &
Orfield, 2002; Oswald, Coutinho, Best, & Singh, 1999). This study investigates educator
perceptions that may be shaped by historical and contemporary deficit thinking theories of CLD
students (Trent, Artiles, & Englert, 1998; Valencia, 1997b). Theories that rely on deficit
thinking (Valencia, 1997b) when examining schooling outcomes for CLD student have held the
longest currency in educational thought and practice. Special education approaches have also
relied on a within-child deficit view (Trent, Artiles, & Englert, 1998). This study investigates
disproportionality utilizing the framework of deficit thinking theories to help understand the
referral to placement process as well as offer recommendations for changes in pre-service and in-
service teacher training.
This study supports other researchers’ calls for the need for disaggregation of data to the
district and campus level allowing for additional means of examining the problem of
disproportionality. Disproportionality studies utilizing the composition index, odds ratios, and
risk index have shown variability when using these tools to measure and examining the rate and

157
extent of disproportionality. This study fills a gap in the research by examining the perceptions
of educators on the phenomenon of disproportionality and comparing these perceptions to state
data on the rates of representation of CLD students. In addition, this study adds to the dearth of
research on disproportionality with Latino/a students.
Findings
The primary findings of this study is that overall, educators in the sample did not perceive
over-representation of any racial/ethnic group or CLD students in special education, and they did
not perceive disproportionality to be an existing problem at their campus or district. Data from
the composition index by district, however, indicates that CLD students were over-represented in
high incidence or soft disability categories of LD, MR, ED, and SI. This study found that district
educators’ perceptions of the problem of over-representation were not consistent with actual
TEA data.
States and school districts are mandated to collect and report data on minority student
representation in special education and educational settings based on the current federal
regulation, the Individuals with Disabilities Education Act (1997, 2004). Previous studies have
reported that using national and state level data on minority student representation may not
reveal local district and campus patterns of disproportionality (Artiles, Rueda, Salazar, &
Higareda, 2005; Harry & Klingner, 2006; Losen & Orfield, 2002; Rhodes, Ochoa, & Ortiz, 2005;
Valdés & Figueroa, 1994). In fact, in this study, investigating disproportionality using the
composition index, risk index and odds ratio, show that variability in identification exists when
data is disaggregated to the district and campus level by eligibility category and ethnic/racial
group.

158
The data also show that Latino/a and African-American students are at greater risk of
identification for special education compared to White students at the state and district level.
The data also indicate an increase in the identification of CLD students for special education
under the category of Learning Disabled (LD).
Using the composition index to calculate the proportion of students identified in special
education, the findings show that African-American, Latino/a and White students are over-
represented in special education at state and district levels when ethnic/racial groups are not
separated by individual eligibility categories. At the state level, African-American and White
students were considered over-represented in special education. At the district level, African-
American students were over-represented in special education under the categories of LD, ED,
and MR. There was an over-representation of Latino/a students in special education as LD at the
state level and at the district level in the categories of LD, MR and SI. In the districts from the
sample, White students were over-represented to some extent under the categories of ED, SI, and
MR. Differences in African-American and White student representation in special education has
primarily been the focus of studies of disproportionality (Heller, Holtzman, & Messick, 1982;
Hosp & Reschley, 2003; Losen & Orfield, 2002; Oswald, Coutinho, Best, & Singh, 1999).
Latino/a student rates of representation in special education have varied based on geographic
region, density of student population as well as the availability of bilingual education services
(Rueda, Artiles, Salazar, & Higareda, 2002; Valdés & Figueroa, 1994).
The current study finds variability in terms of the rate of White student representation
based on district demographics. Districts with a smaller number of White students tended to
show over-representation of White students in special education. When there were fewer White
students in the population, White students seemed to be placed in special education at a higher

159
rate. African-American and White students were also over-represented as ED in three of the four
districts in the sample, while Latino students would be considered under-represented in this
category.
For ELLs, district level data did not reveal over-representation, but variability was found
among the elementary campuses in the sample. This finding is different from a study by Artiles,
et al. (2005), found a pattern of over-representation of ELL students in special education in
twelve urban school districts in California, at the secondary level. Further investigation of
secondary campuses in South Texas may be useful in determining a pattern of ELL student
representation. Further research on student language status is needed (Rhodes, Ochoa, & Ortiz,
2005).
This study examined educators’ perceptions of personnel preparation and over-
representation of CLD students. Artiles and Trent’s (1994) review of over-representation of
minority students in special education recommended “an encompassing reform agenda,” which
would include personnel preparation reform (p. 426). This study supports that recommendation
and finds that personnel preparation reform is needed specifically related to the training of
general education teachers. The study shows that general education teachers had the least
familiarity with policies and had the least amount of training in regards to CLD students and
students with special needs. Other research (Donovan & Cross, 2002; Harry & Klingner, 2006)
stressed the need for collaboration between general and special educators to better meet the
needs of students with disabilities and in particular CLD students. This study also finds that
racial/ethnic differences among educators are a factor in terms of their perceptions of CLD
student over-representation in special education and educational practices.
160
Discussion
The general education teacher makes the determination that a student’s lack of academic
progress or behavior is not acceptable (Donovan & Cross, 2002) and therefore their decision to
refer a student becomes the most important in the determination of special education eligibility
(Artiles & Ortiz, 2002b; Losen & Orfield, 2002). The finding that educators lacked familiarity
with policies paired with the finding that general educators have less experience and training in
regard to working with CLD students and students with disabilities, suggests that university
training programs need to re-evaluate the courses and field experiences offered in their teacher
preparation programs. The findings support previous studies that suggest that educator
preparation programs are not preparing general education teachers to work with CLD students
(Sleeter, 2000-2001), as well as students with disabilities. In addition, districts and schools need
to provide educators with professional development opportunities (in-service) that add to their
knowledge and skills relating to cultural and linguistic diversity including disabilities. A need to
understand the problem of disproportionality also appears to be pertinent for all educators.
According to the National Center for Education Statistics (Snyder, 2008), 83% of
teachers in public elementary and secondary schools are White. With the growing number of
CLD students in our public schools, and the low percentage of teachers from racial/ethnic
minority groups, there appears to be a need to recruit and graduate teachers prepared to work
with a diverse range of students, including students with special needs. White educators in this
sample were less likely than Latina educators to perceive over-representation of CLD students in
special education as a problem. Latina educators were also more likely to indicate that
educational programming offered or provided for CLD students was less than adequate.

161
Researchers (Artiles & Ortiz, 2002b; Losen & Orfield, 2002) point to the need for
collaboration or shared knowledge among educators when working with students; therefore,
training is needed for all educators rather than narrowing the training to only specialists
(bilingual/ESL and special education). Prevention and amelioration of the problem of
disproportionality point to the need to involve all educators in ensuring that the educational
environments provide adequate instructional programming and use of culturally relevant
instructional practices for all students.
In addition to the lack of training and experience of general education teachers, the
survey results from this study indicate that campus-based teams lack training and understanding
of the bilingual psycho-educational evaluation process. This suggests that campus-based
decision teams may not be prepared to understand and make educational decisions for
assessment, eligibility, and placement of students who bilingual/bicultural and are being
considered for special education. These findings together with those reported by Ochoa, et al.
(1996, 1997, 1999), which indicated that there is a shortage of school psychologists who are
adequately trained to conduct and interpret bilingual psycho-educational evaluations, point to
additional problem areas. These findings point to a need to investigate alternative means of
assessment for bilingual/bicultural students in the referral to special education process. The
over-use of IQ testing (Figueroa, 2002; Valdés & Figueroa, 1994) has historically proven to be a
questionable practice for evaluating culturally and linguistically diverse students; therefore
alternative forms of measuring students’ strengths may be needed rather than relying on
standardized testing for eligibility determination.
Educators in the sample indicated a need for further training related to cultural and
linguistic diversity and students with special needs. Respondents indicated a need for all

162
teachers, not just bilingual/ESL teachers, to be trained and be sensitive to diversity. Participants
indicated a need for training in Response to Intervention (RTI), second language acquisition,
biliteracy development and parental involvement in addition to training on the changes to special
education policies.
Having worked in the public school system for over ten years as a bilingual school
psychologist, I have found the study findings unusual. The lack of awareness of the problem of
disproportionality was evident year in and year out when the number of referrals for special
education evaluations did not decrease, but rather seemed to increase following the re-
authorization of IDEA and the passage of NCLB. Policies and school reform efforts did not
appear to deter the rate of referrals. Finding a difference between White and Latino/a educators
in terms of their perceptions of over-representation and educational programming for CLD
students was unexpected. The last school district I worked in was comprised of primarily
Latino/a students and the teaching force was also primarily Latino/a. The race/ethnicity of the
teacher or the educational program (general and bilingual education) would not appear to make a
difference in terms of the rate of referrals; therefore, finding that Latino/a educators in this study
responded significantly different than White educators was surprising. In addition, Latino/a
educator responses suggest that CLD students may not be receiving adequate educational
programming.
Implications
The over-representation of culturally and linguistically diverse students in special
education and the quality of their educational experiences have been regarded among the most
significant issues faced by the U.S. education system in the past 30 years (Coutinho & Oswald,
2004). Educators may not perceive over-representation as a problem, which may continue to

163
perpetuate disproportionality at the campus, district and state levels. Educators’ lack of
awareness on this topic should also be a concern.
The mis-perception that students are not over-represented in special education does not
compel educators to change policies and practices. In addition, these mis-perceptions may lead
them to be more likely to refer students to special education and to continue to view CLD student
educational difficulties from a deficit perspective (Valencia, 1997b). Educators indicated a need
for training in the referral process to special education (RTI) and felt the process was paperwork
driven and time consuming. Paired with the fact that educators did not indicate a need for
training on the problem of over-representation suggests that a paradigm shift is needed for
educators in terms of the difference between diversity and disability (Artiles, 1998).
There continues to be a real need for better data reporting to inform decision-making by
states, districts and campuses. If federal policies (IDEA) would mandate states and districts to
collect disaggregated data by race/ethnicity, disability category and educational setting (Losen &
Orfield, 2002), as well as language status, research on over-representation would be improved.
This need for adequate data collection requirements by federal and state agencies was also noted
by Donovan & Cross (2002). Collection of data disaggregated would better assist educators in
understanding the extent and proportion of the problem within their own schools and districts.
Educators’ awareness of the problem may help produce changes at the school and classroom
level that can improve the educational outcomes for CLD students. Improving data collection
methods would improve understanding of student outcomes and would be more useful for
determining changes for general, bilingual and special education programming and policies.
Bilingual education, special education and general education teachers need to find ways
to collaborate in order to meet the educational needs of all students. Campus educators need to

164
be provided with ongoing training that focuses on cultural and linguistic diversity, as well as
disproportionality.
Future Research
Further research is needed to include evaluation specialists, which tend to be the
gatekeepers in the special education process for CLD students. The current study did not obtain
sufficient data from evaluation specialists, including bilingual evaluation specialists, such as
speech and language pathologists, educational diagnosticians, and school psychologists to
provide a wider view of the proclivities of assessment staff on this topic. As key decision-
makers in the process of special education eligibility and placement, evaluation specialists’
knowledge of this topic may play a role in changing policies and practices for special education
eligibility. These decisions directly affect the rates of representation of students in special
education and would have an impact on disproportionality.
Future research utilizing the survey on educator perceptions may provide a means in
which to measure change in educator perceptions following awareness training on the topic of
disproportionality. This study shows that training appears to be needed in districts and schools
for general education teachers as well as for schools and districts that are composed of primarily
White educators.
Research in rural districts and schools that may not be as ethnically diverse is needed.
The current research study found that attempting to measure the rates of representation in one
small district (D4) was limited due to the lack of student diversity. This district is an example of
the difficulties faced in the research on disproportionality when data is both aggregated at the
state level as well as disaggregated to the district level. The survey on educator perceptions
developed for this study may provide a viable option in examining the problem of

165
disproportionality in districts and schools that may not be as ethnically diverse. In other words,
addressing educators’ perceptions of disproportionality may be more useful than examining
composition indexes, risk index, and odds ratios at the district level.
Conclusion
This study fills a gap in the research on educator perceptions of disproportionality of
CLD students in special education. This study adds to the limited research on ELLs and Latino
students on the issue of over-representation. Prior research has focused primarily on the
disparities between White and Black student rates of representation. Latino/a student over-
representation at the national level appears to be masked when data is aggregated. This study
shows that educator perceptions as well as disaggregation of state and district data are viable
methods for studying the rates of representation of CLD students in special education, including
language status (ELL/LEP).
Considering that deficit thinking theories have held the longest currency among educators
and policymakers (Valencia, 1997b), this study demonstrates that the problem of
disproportionality is not one that has been changed in the past thirty-five years with the addition
of federal mandates and policies for CLD students, bilingual students and students with
disabilities. As the diversity of our schools increases, the lack of trained and knowledgeable
educators places the public education system in a quandary.
Changes to practices and policies may need to begin from the bottom-up rather than from
the top-down. In other words, changes to over-representation need to begin with educator
perceptions, as current policies do not seem to produce a deterrence or amelioration to the
problem of over-representation.

166
APPENDIX A
Institutional Review Board Approval

167

168

169
APPENDIX B
District and Campus Approval Letters

170

171

172

173
APPENDIX C
Consent to Participate in Research as a Human Subject

174

175
APPENDIX D
Educator Perceptions Survey

176

177

178
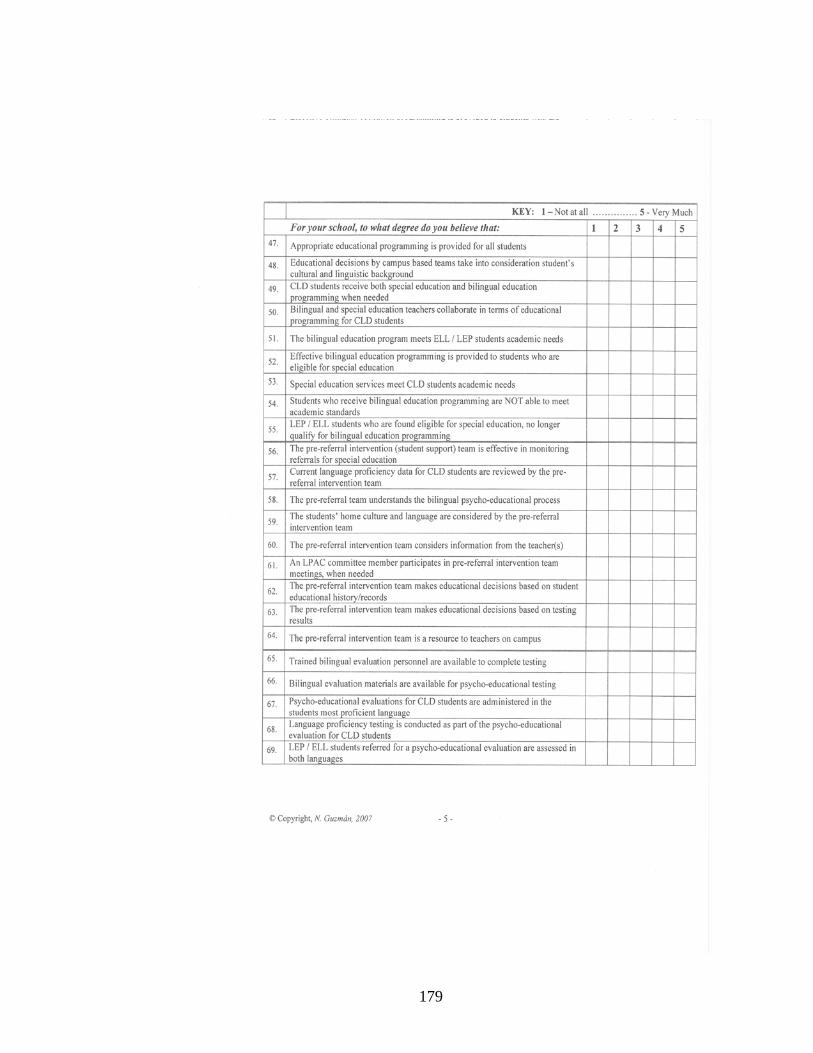
179

180

181
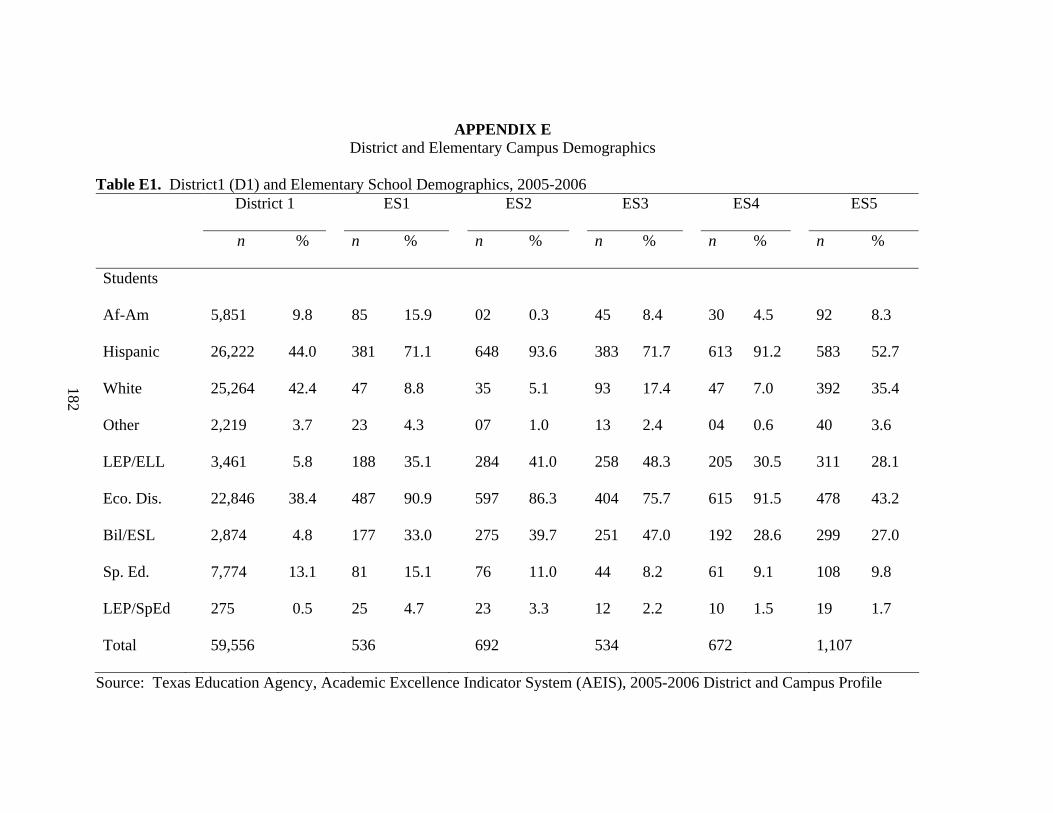
APPENDIX E District and Elementary Campus Demographics
Table E1. District1 (D1) and Elementary School Demographics, 2005-2006
District 1 ES1 ES2 ES3 ES4 ES5
n % n % n % n % n % n %
Students
Af-Am 5,851 9.8 85 15.9 02 0.3 45 8.4 30 4.5 92 8.3
Hispanic 26,222 44.0 381 71.1 648 93.6 383 71.7 613 91.2 583 52.7
White 25,264 42.4 47 8.8 35 5.1 93 17.4 47 7.0 392 35.4
Other 2,219 3.7 23 4.3 07 1.0 13 2.4 04 0.6 40 3.6
LEP/ELL 3,461 5.8 188 35.1 284 41.0 258 48.3 205 30.5 311 28.1
Eco. Dis. 22,846 38.4 487 90.9 597 86.3 404 75.7 615 91.5 478 43.2
Bil/ESL 2,874 4.8 177 33.0 275 39.7 251 47.0 192 28.6 299 27.0
Sp. Ed. 7,774 13.1 81 15.1 76 11.0 44 8.2 61 9.1 108 9.8
LEP/SpEd 275 0.5 25 4.7 23 3.3 12 2.2 10 1.5 19 1.7
Total 59,556 536 692 534 672 1,107
Source: Texas Education Agency, Academic Excellence Indicator System (AEIS), 2005-2006 District and Campus Profile
182

Table E2. District 2 (D2), Elementary School Student Demographics, 2005-2006
District 2 ES6 ES7 ES8 ES9 ES10 ES11
n % n % n % n % n % n % n %
Students
Af-Am 4,969 8.8 17 3.4 36 6.5 05 0.1 03 0.8 03 0.5 04 0.8
Hispanic 49,486 87.7 481 94.9 514 92.6 722 98.9 370 98.4 605 99.3 521 99.0
White 1,699 3.0 07 1.4 04 0.7 02 0.3 02 0.5 00 0 01 0.2
Other 217 0.4 02 0.4 01 0.2 01 0.1 01 0.3 01 0.2 00 0
LEP/ELL 9,438 16.7 91 17.9 79 14.2 302 41.4 145 38.5 184 30.2 74 14.1
Eco. Dis. 51,988 92.2 498 98.2 549 98.9 682 93.4 338 98.9 583 95.7 514 97.7
Bil/ESL 8,385 14.9 81 16.0 65 11.7 270 37.0 138 36.7 178 29.2 67 12.7
Sp. Ed. 6,839 12.1 72 14.2 43 7.7 61 8.4 22 5.9 54 8.8 76 14.4
LEP/SpEd 1085 1.9 07 1.4 5 0.9 19 2.6 12 3.2 18 3.0 13 2.5
Total 56,371 507 555 730 376 609 526
Source: Texas Education Agency, Academic Excellence Indicator System (AEIS), 2005-2006 District and Campus Profile
183

Table E3. District three (D3) and four (D4) Elementary School Demographics, 2005-2006 District 3 ES 12 District 4 ES 13
n % n % n % n %
Students
Af-Am 6,270 8.0 40 6.3 05 0.1 0 0
Hispanic 47,795 61.2 422 66.4 5,471 99.6 506 99.8
White 21,560 27.6 165 25.9 17 0.3 01 0.2
Other 2,529 3.2 9 1.4 0 0 0 0
LEP/ELL 5,095 6.5 146 23.0 2,325 42.3 353 69.6
Eco. Dis. 38,664 49.5 384 60.4 5,062 92.1 501 98.9
Bil/ESL 3,935 5.0 135 21.2 2,310 42.0 353 69.6
Sp. Ed. 10,367 13.3 73 11.5 469 8.5 23 4.5
LEP/SpEd 785 1.0 16 2.5 * * 17 3.4
Total 78,154 636 5,495 507
Source: Texas Education Agency, Academic Excellence Indicator System (AEIS), 2005-2006 District and Campus Profile; * Missing data, unable to calculate
184

APPENDIX F
District and Elementary Campus Educator Demographics
Table F1. District One (D1) Elementary Campus Educator Demographics, 2005-2006
ES1 ES2 ES3 ES4 ES5
n % n % n % n % n %
Educator
Professional staff 57 90 62 86 50 90 65 90 78 87
Teachers 49 77 54 74 42 77 57 78 69 77
Total Minority staff 34 53 47 64 31 56 30 41 42 46
Af-Am 0 0 0 0 1 2 2 4 4 6
Hispanic 25 51 34 63 25 59 20 35 24 35
White 23 47 20 37 17 39 35 61 39 56
Other 1 2 0 0 0 0 0 0 2 3
Males 8 16 2 4 3 7 4 7 1 2
Females 41 84 52 96 40 93 53 93 68 99
Source: Texas Education Agency, Academic Excellence Indicator System (AEIS), 2005-2006 Campus Profile
185

Table F2. District Two (D2) educator demographics by elementary campus, 2005–2006
ES6 ES7 ES8 ES9 ES10 ES11
n % n % n % n % n % n %
Educator
Professional staff 37 69 36 81 54 77 28 80 43 84 38 76
Teachers 31 58 30 66 44 64 23 66 35 69 32 64
Total Minority staff 44 83 37 81 56 81 30 87 48 94 38 76
Af-Am 1 3 2 7 2 5 2 9 0 0 2 6
Hispanic 22 71 21 70 31 70 16 71 31 89 20 63
White 8 26 7 23 11 25 5 20 2 6 10 31
Other 0 0 0 0 0 0 0 0 2 6 0 0
Males 4 13 3 10 6 14 2 9 5 14 3 9
Females 27 87 27 90 38 86 21 91 30 86 29 91
Source: Texas Education Agency, Academic Excellence Indicator System (AEIS), 2005-2006 Campus Profile
186

Table F3. District Three (D3) and District Four (D4) Educator Demographics, 2005-2006
District 3 ES 12 District 4 ES 13
n % n % n % n %
Educator
Professional staff 6,148 61 54 84 419 48 33 65
Teachers 4,866 48 45 69 344 39 29 57
Total Minority staff 4,999 49 36 57 854 97 50 98
Af-Am 153 3 0 0 1 .3 0 0
Hispanic 1,516 31 23 52 316 92 28 97
White 3,155 65 22 48 21 6 1 3
Other 42 1 0 0 6 2 0 0
Males 1,014 21 4 9 124 36 5 17
Females 3,851 79 41 91 220 64 24 83
Source: Texas Education Agency, Academic Excellence Indicator System (AEIS), 2005-2006 Campus and District Profile
187

188
APPENDIX G
Latino/a Rates of Representation in Special Education, 2005-2006 Latino/a Rates of Representation
% Latino/as in SpEd Composition Index (CI)
% Latino/as in Population
Difference
State 41.4 45.3 - 3.6
District 1 46.0 44.0 + 2.0
ES1 57 71.1 + 14.1
ES2 59 93.6 - 34.6
ES3 54 71.7 - 17.7
ES4 88 88.6 - 0.6
ES5 35 52.7 - 17.7
District 2 83.1 87.7 - 4.6
ES6 76 94.9 - 18.9
ES7 65 92.6 - 27.6
ES8 99.0 98.9 + 0.1
ES9 99 98.4 + 0.6
ES10 99 99.3 - 0.3
ES11 92 99.0 - 7.0
District 3 63.4 61.2 + 2.4
ES12 60 66.4 - 6.4
District 4 99 99 0
ES13 99 99 0
Source: Texas Education Agency, 2005-2006, AEIS, PBMAS, PEIMS reports.
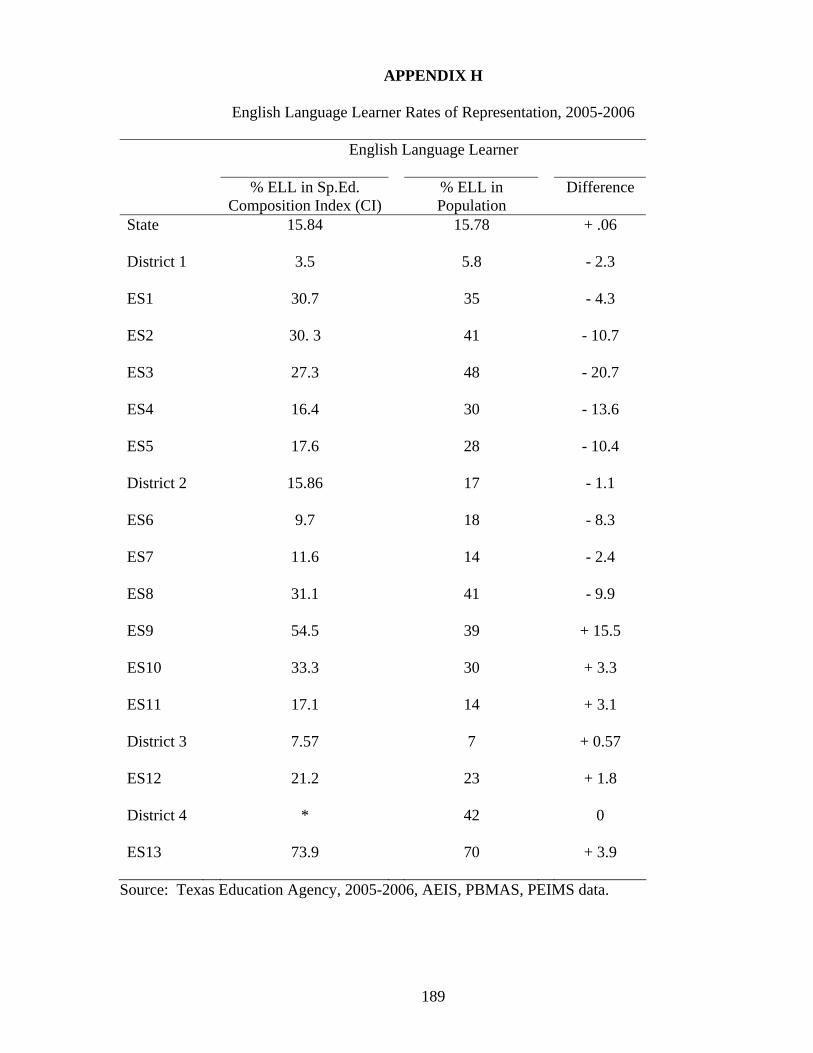
189
APPENDIX H
English Language Learner Rates of Representation, 2005-2006 English Language Learner
% ELL in Sp.Ed. Composition Index (CI)
% ELL in Population
Difference
State 15.84 15.78 + .06
District 1 3.5 5.8 - 2.3
ES1 30.7 35 - 4.3
ES2 30. 3 41 - 10.7
ES3 27.3 48 - 20.7
ES4 16.4 30 - 13.6
ES5 17.6 28 - 10.4
District 2 15.86 17 - 1.1
ES6 9.7 18 - 8.3
ES7 11.6 14 - 2.4
ES8 31.1 41 - 9.9
ES9 54.5 39 + 15.5
ES10 33.3 30 + 3.3
ES11 17.1 14 + 3.1
District 3 7.57 7 + 0.57
ES12 21.2 23 + 1.8
District 4 * 42 0
ES13 73.9 70 + 3.9
Source: Texas Education Agency, 2005-2006, AEIS, PBMAS, PEIMS data.
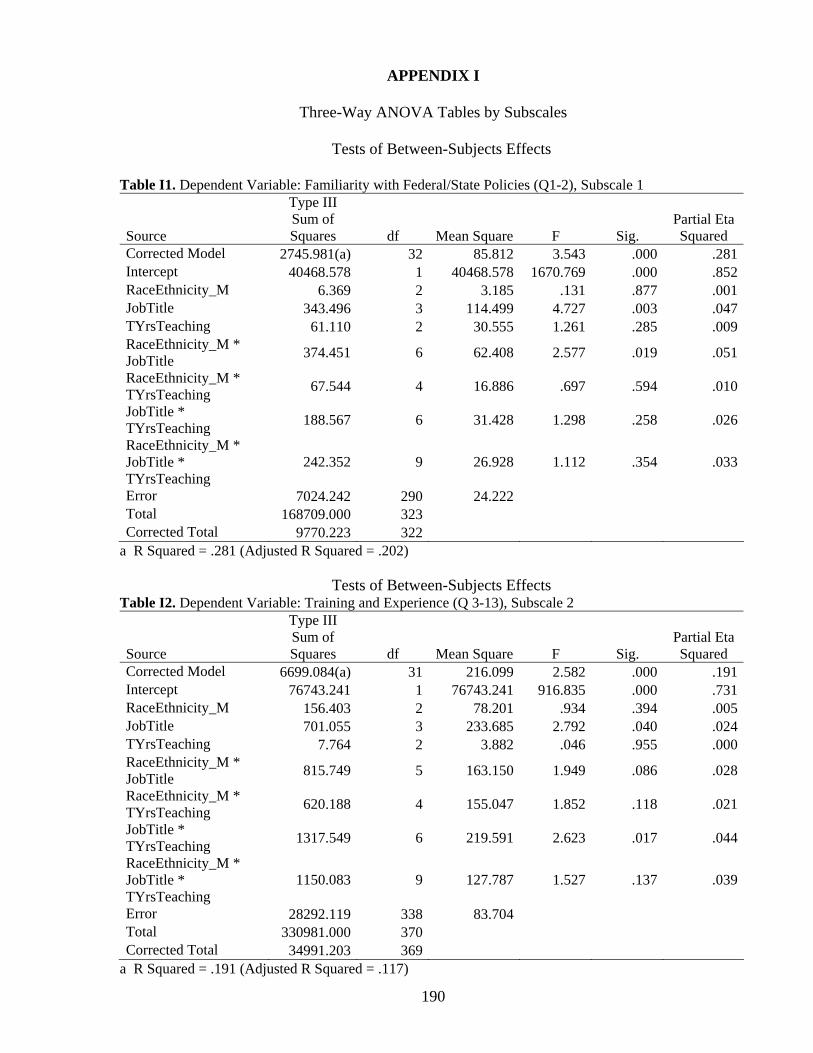
190
APPENDIX I
Three-Way ANOVA Tables by Subscales Tests of Between-Subjects Effects Table I1. Dependent Variable: Familiarity with Federal/State Policies (Q1-2), Subscale 1
Source
Type III Sum of Squares df Mean Square F Sig.
Partial Eta Squared
Corrected Model 2745.981(a) 32 85.812 3.543 .000 .281Intercept 40468.578 1 40468.578 1670.769 .000 .852RaceEthnicity_M 6.369 2 3.185 .131 .877 .001JobTitle 343.496 3 114.499 4.727 .003 .047TYrsTeaching 61.110 2 30.555 1.261 .285 .009RaceEthnicity_M * JobTitle 374.451 6 62.408 2.577 .019 .051
RaceEthnicity_M * TYrsTeaching 67.544 4 16.886 .697 .594 .010
JobTitle * TYrsTeaching 188.567 6 31.428 1.298 .258 .026
RaceEthnicity_M * JobTitle * TYrsTeaching
242.352 9 26.928 1.112 .354 .033
Error 7024.242 290 24.222 Total 168709.000 323 Corrected Total 9770.223 322
a R Squared = .281 (Adjusted R Squared = .202) Tests of Between-Subjects Effects Table I2. Dependent Variable: Training and Experience (Q 3-13), Subscale 2
Source
Type III Sum of Squares df Mean Square F Sig.
Partial Eta Squared
Corrected Model 6699.084(a) 31 216.099 2.582 .000 .191Intercept 76743.241 1 76743.241 916.835 .000 .731RaceEthnicity_M 156.403 2 78.201 .934 .394 .005JobTitle 701.055 3 233.685 2.792 .040 .024TYrsTeaching 7.764 2 3.882 .046 .955 .000RaceEthnicity_M * JobTitle 815.749 5 163.150 1.949 .086 .028
RaceEthnicity_M * TYrsTeaching 620.188 4 155.047 1.852 .118 .021
JobTitle * TYrsTeaching 1317.549 6 219.591 2.623 .017 .044
RaceEthnicity_M * JobTitle * TYrsTeaching
1150.083 9 127.787 1.527 .137 .039
Error 28292.119 338 83.704 Total 330981.000 370 Corrected Total 34991.203 369
a R Squared = .191 (Adjusted R Squared = .117)

191
Tests of Between-Subjects Effects
Table I3. Dependent Variable: Over-representation (Q 14-20), Subscale 3
Source
Type III Sum of Squares df Mean Square F Sig.
Partial Eta Squared
Corrected Model 1783.937(a) 32 55.748 2.008 .001 .157Intercept 23537.890 1 23537.890 847.874 .000 .711RaceEthnicity_M 39.721 2 19.861 .715 .490 .004JobTitle 415.608 3 138.536 4.990 .002 .042TYrsTeaching 39.436 2 19.718 .710 .492 .004RaceEthnicity_M * JobTitle 255.370 6 42.562 1.533 .166 .026
RaceEthnicity_M * TYrsTeaching 219.902 4 54.976 1.980 .097 .023
JobTitle * TYrsTeaching 281.196 6 46.866 1.688 .123 .029
RaceEthnicity_M * JobTitle * TYrsTeaching
347.992 9 38.666 1.393 .190 .035
Error 9549.814 344 27.761 Total 112345.000 377 Corrected Total 11333.751 376
a R Squared = .157 (Adjusted R Squared = .079) Tests of Between-Subjects Effects Table I4. Dependent Variable: CLD Over-Rep (Q 21-28), Subscale 4
Source
Type III Sum of Squares df Mean Square F Sig.
Partial Eta Squared
Corrected Model 1367.237(a) 32 42.726 1.491 .046 .119Intercept 30492.627 1 30492.627 1064.438 .000 .750RaceEthnicity_M 346.280 2 173.140 6.044 .003 .033JobTitle 99.376 3 33.125 1.156 .326 .010TYrsTeaching 92.809 2 46.404 1.620 .199 .009RaceEthnicity_M * JobTitle 165.259 6 27.543 .961 .451 .016
RaceEthnicity_M * TYrsTeaching 64.445 4 16.111 .562 .690 .006
JobTitle * TYrsTeaching 95.214 6 15.869 .554 .767 .009
RaceEthnicity_M * JobTitle * TYrsTeaching
163.929 9 18.214 .636 .766 .016
Error 10169.574 355 28.647 Total 153473.000 388 Corrected Total 11536.812 387
a R Squared = .119 (Adjusted R Squared = .039)

192
Tests of Between-Subjects Effects Table I5. Dependent Variable: Latino/a Over-Rep (Q 29-36), Subscale 5
Source
Type III Sum of Squares df Mean Square F Sig.
Partial Eta Squared
Corrected Model 1565.182(a) 32 48.912 1.540 .034 .123Intercept 27948.569 1 27948.569 879.999 .000 .715RaceEthnicity_M 396.612 2 198.306 6.244 .002 .034JobTitle 46.189 3 15.396 .485 .693 .004TYrsTeaching 80.380 2 40.190 1.265 .283 .007RaceEthnicity_M * JobTitle 106.192 6 17.699 .557 .764 .009
RaceEthnicity_M * TYrsTeaching 51.071 4 12.768 .402 .807 .005
JobTitle * TYrsTeaching 172.613 6 28.769 .906 .491 .015
RaceEthnicity_M * JobTitle * TYrsTeaching
126.054 9 14.006 .441 .912 .011
Error 11115.925 350 31.760 Total 146908.000 383 Corrected Total 12681.107 382
a R Squared = .123 (Adjusted R Squared = .043) Tests of Between-Subjects Effects Table I6. Dependent Variable: ELL Over-Rep (Q 37-44), Subscale 6
Source
Type III Sum of Squares df Mean Square F Sig.
Partial Eta Squared
Corrected Model 1485.619(a) 32 46.426 1.528 .037 .124Intercept 26311.132 1 26311.132 866.236 .000 .715RaceEthnicity_M 467.655 2 233.827 7.698 .001 .043JobTitle 22.662 3 7.554 .249 .862 .002TYrsTeaching 69.578 2 34.789 1.145 .319 .007RaceEthnicity_M * JobTitle 31.455 6 5.243 .173 .984 .003
RaceEthnicity_M * TYrsTeaching 47.426 4 11.856 .390 .816 .005
JobTitle * TYrsTeaching 256.766 6 42.794 1.409 .210 .024
RaceEthnicity_M * JobTitle * TYrsTeaching
286.982 9 31.887 1.050 .400 .027
Error 10479.061 345 30.374 Total 134833.000 378 Corrected Total 11964.680 377
a R Squared = .124 (Adjusted R Squared = .043)

193
Tests of Between-Subjects Effects Table I7. Dependent Variable: Gender Over-Rep (Q 45-46), Subscale 7
Source
Type III Sum of Squares df Mean Square F Sig.
Partial Eta Squared
Corrected Model 183.668(a) 30 6.122 1.874 .004 .140Intercept 1616.151 1 1616.151 494.707 .000 .590RaceEthnicity_M 40.939 2 20.470 6.266 .002 .035JobTitle 18.109 3 6.036 1.848 .138 .016TYrsTeaching 1.191 2 .595 .182 .834 .001RaceEthnicity_M * JobTitle 7.535 5 1.507 .461 .805 .007
RaceEthnicity_M * TYrsTeaching 9.671 4 2.418 .740 .565 .009
JobTitle * TYrsTeaching 23.157 6 3.859 1.181 .316 .020
RaceEthnicity_M * JobTitle * TYrsTeaching
29.737 8 3.717 1.138 .337 .026
Error 1123.809 344 3.267 Total 7420.000 375 Corrected Total 1307.477 374
a R Squared = .140 (Adjusted R Squared = .066) Tests of Between-Subjects Effects Table I8. Dependent Variable: EducProgamming for CLD (Q 47-55), Subscale 8
Source
Type III Sum of Squares df Mean Square F Sig.
Partial Eta Squared
Corrected Model 1150.676(a) 32 35.959 .972 .515 .086Intercept 63777.836 1 63777.836 1723.099 .000 .839RaceEthnicity_M 299.935 2 149.967 4.052 .018 .024JobTitle 6.680 3 2.227 .060 .981 .001TYrsTeaching 145.518 2 72.759 1.966 .142 .012RaceEthnicity_M * JobTitle 159.457 6 26.576 .718 .635 .013
RaceEthnicity_M * TYrsTeaching 39.257 4 9.814 .265 .900 .003
JobTitle * TYrsTeaching 107.796 6 17.966 .485 .819 .009
RaceEthnicity_M * JobTitle * TYrsTeaching
338.942 9 37.660 1.017 .426 .027
Error 12214.437 330 37.013 Total 300764.000 363 Corrected Total 13365.113 362
a R Squared = .086 (Adjusted R Squared = -.003)
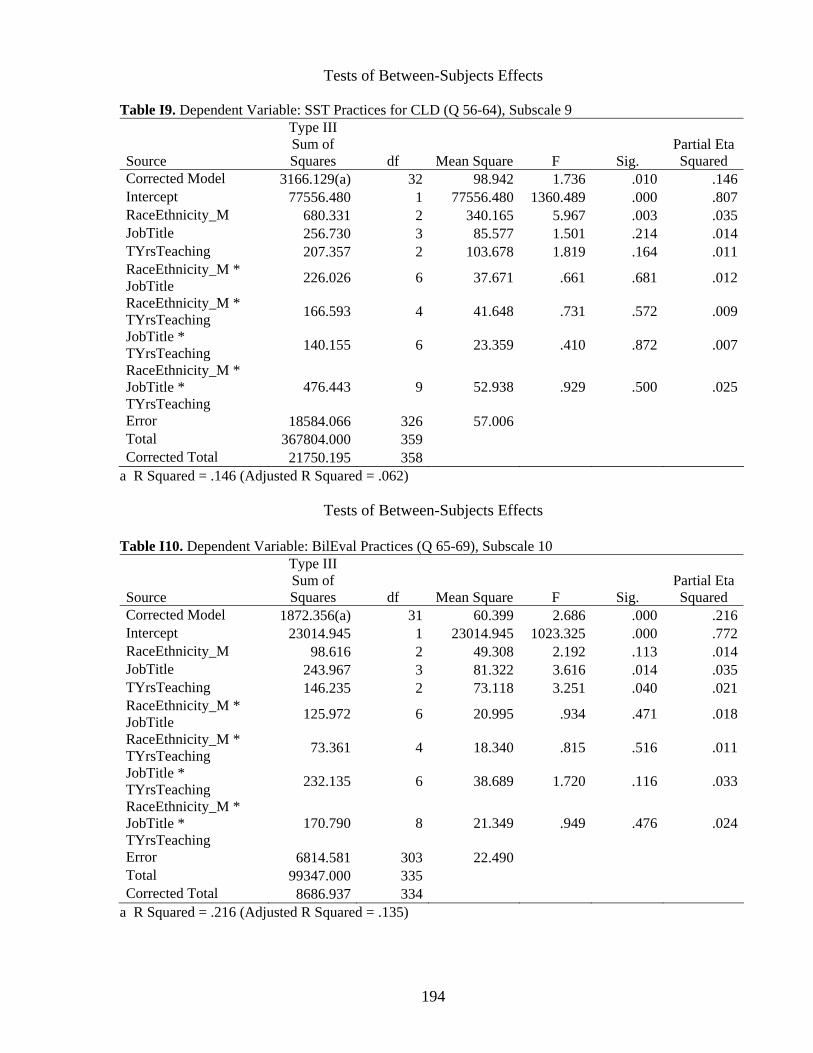
194
Tests of Between-Subjects Effects Table I9. Dependent Variable: SST Practices for CLD (Q 56-64), Subscale 9
Source
Type III Sum of Squares df Mean Square F Sig.
Partial Eta Squared
Corrected Model 3166.129(a) 32 98.942 1.736 .010 .146Intercept 77556.480 1 77556.480 1360.489 .000 .807RaceEthnicity_M 680.331 2 340.165 5.967 .003 .035JobTitle 256.730 3 85.577 1.501 .214 .014TYrsTeaching 207.357 2 103.678 1.819 .164 .011RaceEthnicity_M * JobTitle 226.026 6 37.671 .661 .681 .012
RaceEthnicity_M * TYrsTeaching 166.593 4 41.648 .731 .572 .009
JobTitle * TYrsTeaching 140.155 6 23.359 .410 .872 .007
RaceEthnicity_M * JobTitle * TYrsTeaching
476.443 9 52.938 .929 .500 .025
Error 18584.066 326 57.006 Total 367804.000 359 Corrected Total 21750.195 358
a R Squared = .146 (Adjusted R Squared = .062)
Tests of Between-Subjects Effects Table I10. Dependent Variable: BilEval Practices (Q 65-69), Subscale 10
Source
Type III Sum of Squares df Mean Square F Sig.
Partial Eta Squared
Corrected Model 1872.356(a) 31 60.399 2.686 .000 .216Intercept 23014.945 1 23014.945 1023.325 .000 .772RaceEthnicity_M 98.616 2 49.308 2.192 .113 .014JobTitle 243.967 3 81.322 3.616 .014 .035TYrsTeaching 146.235 2 73.118 3.251 .040 .021RaceEthnicity_M * JobTitle 125.972 6 20.995 .934 .471 .018
RaceEthnicity_M * TYrsTeaching 73.361 4 18.340 .815 .516 .011
JobTitle * TYrsTeaching 232.135 6 38.689 1.720 .116 .033
RaceEthnicity_M * JobTitle * TYrsTeaching
170.790 8 21.349 .949 .476 .024
Error 6814.581 303 22.490 Total 99347.000 335 Corrected Total 8686.937 334
a R Squared = .216 (Adjusted R Squared = .135)

195
Tests of Between-Subjects Effects Table I11. Dependent Variable: SpEd Practices for CLD (Q 70-76), Subscale 11
Source
Type III Sum of Squares df Mean Square F Sig.
Partial Eta Squared
Corrected Model 2474.564(a) 32 77.330 2.121 .001 .172Intercept 54750.647 1 54750.647 1501.964 .000 .822RaceEthnicity_M 677.473 2 338.736 9.292 .000 .054JobTitle 157.153 3 52.384 1.437 .232 .013TYrsTeaching 28.256 2 14.128 .388 .679 .002RaceEthnicity_M * JobTitle 318.563 6 53.094 1.457 .193 .026
RaceEthnicity_M * TYrsTeaching 56.339 4 14.085 .386 .818 .005
JobTitle * TYrsTeaching 93.769 6 15.628 .429 .860 .008
RaceEthnicity_M * JobTitle * TYrsTeaching
606.747 9 67.416 1.849 .059 .049
Error 11883.581 326 36.453 Total 243761.000 359 Corrected Total 14358.145 358
a R Squared = .172 (Adjusted R Squared = .091)
Tests of Between-Subjects Effects Table I12. Dependent Variable: Cult Relevant Practices (Q 77-87), Subscale 12
Source
Type III Sum of Squares df Mean Square F Sig.
Partial Eta Squared
Corrected Model 852.890(a) 32 26.653 1.272 .154 .110Intercept 87935.402 1 87935.402 4197.342 .000 .927RaceEthnicity_M 37.573 2 18.787 .897 .409 .005JobTitle 55.795 3 18.598 .888 .448 .008TYrsTeaching 19.564 2 9.782 .467 .627 .003RaceEthnicity_M * JobTitle 84.615 6 14.102 .673 .671 .012
RaceEthnicity_M * TYrsTeaching 26.794 4 6.698 .320 .865 .004
JobTitle * TYrsTeaching 168.078 6 28.013 1.337 .240 .024
RaceEthnicity_M * JobTitle * TYrsTeaching
50.965 9 5.663 .270 .982 .007
Error 6892.635 329 20.950 Total 417828.000 362 Corrected Total 7745.525 361
a R Squared = .110 (Adjusted R Squared = .024)

196
REFERENCES
American Educational Research Association, American Psychological Association, & National
Council on Measurement in Education. (1999). Standards for educational and
psychological testing. Washington, DC: American Educational Research Association.
Aronowitz, S. (1997). A different perspective on educational inequality. In H. A. Giroux & P.
Shannon (Eds.), Education and cultural studies: Toward a performative practice (pp. 179-
196). New York: Routledge.
Artiles, A. J. (1998). The dilemma of difference: Enriching the disproportionality discourse with
theory and context. The Journal of Special Education, 32(1), 32.
Artiles, A. J. (2003). Special education's changing identity: Paradoxes and dilemmas in views of
culture and space. Harvard Educational Review, 73(2), 164-204.
Artiles, A. J., Klinger, J., & Tate, W. F. (2006). Representation of minority students in special
education: Complicating traditional explanations, Editor's theme issue introduction.
Educational Researcher, 35(6), 3-5.
Artiles, A. J., Klingner, J., & Tate, W. F. (2006). Representation of minority students in special
education: Complicating traditional explanations, Editor's theme issue introduction.
Educational Researcher, 35(6), 3-5.
Artiles, A. J., & Ortiz, A. A. (2002a). English language learners with special education needs:
Contexts and possibilities. In A. J. Artiles & A. A. Ortiz (Eds.), English language learners
with special education needs: Identification, assessment, and instruction (pp. 3-30). Mc
Henry, IL: Center for Applied Linguistics and Delta Systems Co., Inc.
Artiles, A. J., & Ortiz, A. A. (Eds.). (2002b). English language learners with special education
needs: Identification, assessment, and instruction. Mc Henry, IL: Center for Applied
Linguistics and Delta Systems Co., Inc.

197
Artiles, A. J., Rueda, R., Salazar, J., & Higareda, I. (2005). Within-group diversity in minority
disproportionate representation: English language learners in urban school districts.
Exceptional Children, 71(3), 283-300.
Artiles, A. J., & Trent, S. C. (1994). Overrepresentation of minority students in special education:
A continuing debate. Journal of Special Education, 27(4), 410-438.
August, D., & Hakuta, K. (Eds.). (1998). Educating language-minority children. Washington,
DC: National Academy Press.
Baca, L., & Cervantez, H. (1998). The bilingual special education interface (3rd ed.). Columbus,
OH: Prentice Hall.
Baca, L., & De Valenzuela, J. S. (1998). Background and rationale for bilingual special
education. In L. Baca & H. Cervantez (Eds.), The bilingual special education interface
(3rd ed., pp. 98-118). Upper Saddle, NJ: Prentice Hall.
Baker, C. (1996). Foundations in bilingual education and bilingualism (2nd ed.). Philadelphia,
PA: Multilingual Matters.
Bennett, T., Grossberg, L., & Morris, M. (Eds.). (2005). New keywords: A revised vocabulary of
culture and society. Malden, MA: Blackwell Publishing Ltd.
Bernal, E. M. (1983). Trends in bilingual special education. Learning Disability Quarterly, 6(4),
424-431.
Blanchett, W. J. (2006). Disproportionate representation of African American students in special
education: Acknowledging the role of white privilege and racism. Educational
Researcher, 35(6), 24-28.
Carrasquillo, A. L., & Rodríguez, V. (2002). Language minority students in the mainstream
classroom (2nd ed.). Philadelphia, PA: Multilingual Matters, Ltd.
Chinn, P. C., & Hughes, S. (1987). Representation of minority students in special education
classes. Remedial and Special Education, 8, 41-46.

198
Coutinho, M. J., & Oswald, D. P. (2004). Disproportionate representation of culturally and
linguistically diverse students in special education: Measuring the problem. Denver, CO:
National Center for Culturally Responsive Education Systems.
Creswell, J. W. (2003). Research design: Qualitative, quantitative, and mixed methods
approaches (2nd ed.). Thousand Oaks, CA: Sage Publications
Cummins, J. (1984). Bilingualism and special education: Issues in assessment and pedagogy.
Clevendon, UK: Multilingual Matters Ltd.
De la Luz Reyes, M., & Halcón, J. J. (Eds.). (2001). The best for our children: Critical
perspectives on literacy for Latino students. New York: Teachers College Press.
Donovan, M. S., & Cross, C. T. (Eds.). (2002). Minority students in special and gifted education.
Washington, DC: National Academy Press.
Fernandez, A. (1992). Legal support for bilingual education and language appropriate related
services for limited English proficient students with disabilities. Bilingual Research
Journal, 16(3&4), 117-140.
Field, A. (2005). Discovering statistics using SPSS (2nd ed.). Thousand Oaks, CA: Sage
Publications, Inc.
Figueroa, R. A. (2002). Toward a new model of assessment. In A. J. Artiles & A. A. Ortiz (Eds.),
English language learners with special education needs: Identification, assessment, and
instruction (pp. 51-64). Mc Henry, IL: Center for Applied Linguistics and Delta Systems
Co., Inc.
Flores, B. B. (1999). Bilingual teachers' epistemological beliefs about the nature of bilingual
children's cognition and their relation to perceived teaching practices. Unpublished
Doctoral Dissertation, University of Texas, Austin.
Flores, B. M. (2005). The intellectual presence of the deficit view of Spanish-speaking children in
the educational literature during the 20th century. In P. Pedraza & M. Rivera (Eds.),
199
Latino education: An agenda for community action research (pp. 75-98). Mahwah, NJ:
Lawrence Erlbaum Associates.
Freire, P. (1970, 1993). Pedagogy of the oppressed (M. B. Ramos, Trans. 30th Anniversary
Edition ed.). New York: The Continuum International Publishing Group, Inc.
Garcia, S. B., & Ortiz, A. A. (1988). Preventing inappropriate referrals of language minority
students to special education [Electronic Version]. Focus: The National Clearinghouse
for Bilingual Education, Occasional papers in Bilingual Education, 5. Retrieved
2/20/2008 from http://www.ncela.gwu.edu/pubs/classics/focus/05referral.htm.
Gershberg, A. I., Danenberg, A., & Sánchez, P. (2004). Beyond "bilingual" education: New
immigrants and public school policies in California. Washington, DC: Urban Institute
Press.
Giroux, H. A. (1997). Is there a place for cultural studies in colleges of education? In H. A.
Giroux & P. Shannon (Eds.), Education and cultural studies: Toward a performative
practice (pp. 231-247). New York: Routledge.
Hakuta, K. (1986). Mirror of language: The debate on bilingualism. New York: Basic Books Inc.
Halcón, J. J., & de la Luz Reyes, M. (1992). Bilingual education, public policy, and the trickle
down reform agenda. In R. V. Padilla & A. H. Benavides (Eds.), Critical perspectives on
bilingual education research (pp. 303-323). Tempe, AZ: Bilingual Press.
Hamayan, E. V., & Damico, J. S. (Eds.). (1991). Limiting bias in the assessment of bilingual
students. Austin, TX: ProEd.
Harry, B., & Klingner, J. (2006). Why are so many minority students in special education?
Understanding race and disability in schools. New York: Teacher's College Press.
Harry, B., Klingner, J. K., Sturges, K. M., & Moore, R. F. (2002). Of rocks and soft places: Using
qualitative methods to investigate disproportionality. In D. J. Losen & G. Orfield (Eds.),

200
Racial inequality in special education (pp. 71-92). Cambridge, MA: The Civil Rights
Project at Harvard University, Harvard Education Press.
Heller, K. A., Holtzman, W. H., & Messick, S. (Eds.). (1982). Placing children in special
education: A strategy for equity. Washington, DC: National Academy Press.
Hosp, J. L., & Reschley, D. (2003). Referral rates for intervention or assessment: A meta-analysis
of racial differences. The Journal of Special Education, 37(2), 67-80.
Katzman, L. (2003). Editors review: Minority students in special and gifted education. Harvard
Educational Review, 72(2), 225-240.
Kirk, S. A., Gallagher, J. J., Anastasiow, N. J., & Coleman, M. R. (2006). Educating exceptional
children (11th ed.). Boston, MA: Houghton Mifflin Company.
Koyama, J. P. (2004). Appropriating policy: Constructing positions for English language learners.
Bilingual Research Journal, 28(3), 401-423.
Ladner, M., & Hammons, C. (2001). Special but unequal: Race and special education. In C. E.
Finn, A. J. Rotherham & C. R. Hokanson (Eds.), Rethinking special education for a new
century (pp. 85-110). Washington, DC: Progressive Policy Institute, Thomas B. Fordham
Foundation.
Lambert, N. M. (1981). Psychological evidence in Larry P. v. Wilson Riles: An evaluation by a
witness for the defense. American Psychologist, 36(9), 937-952.
Lester, P. E., & Bishop, L. K. (2000). Handbook of tests and measurement in education and the
social sciences (2nd ed.). Lanham, Maryland: The Scarecrow Press, Inc.
Lindhom, K. J. (1990). Bilingual immersion education: Criteria for program development. In A.
M. Padilla, H. H. Fairchild & C. M. Valadez (Eds.), Bilingual education: Issues and
strategies (pp. 91-105). Newbury Park, CA: Sage Publications, Inc.
Lopes, C. (2005). Bilingual school psychologists' practices with students with limited English
proficiency. Unpublished Doctoral Dissertation, University of Rhode Island.

201
Losen, D. J., & Orfield, G. (Eds.). (2002). Racial inequality in special education. Cambridge,
MA: The Civil Rights Project at Harvard University, Harvard Education Press.
Mackey, W. F. (2000). The description of bilingualism. In L. Wei (Ed.), The bilingualism reader
(pp. 26-54). NY: Routledge.
Maheady, L., Towne, R., Algozzine, B., Mercer, J., & Ysseldyke, J. (1983). Minority
overrepresentation: A case for alternative practices prior to referral. Learning Disability
Quarterly, 6(4), 448-456.
May, S. (2006). Language policy and minority language rights. In T. Ricento (Ed.), Introduction
to language policy: Theory and method (pp. 255-272). Malden, MA: Blackwell Publishers.
McDermott, R., Goldman, S., & Varenne, H. (2006). The cultural work of learning disabilities.
Educational Researcher, 35(6), 12-17.
McLaren, P. (2003). Life in schools: An introduction to critical pedagogy in the foundations of
education (4th ed.). Boston, MA: Allyn and Bacon.
Moreno, V. J. (2003). Development of the multicultural School Psychology competency
inventory: An exploratory and confirmatory factor analysis study. Unpublished
dissertation, University of Wisconsin, Madison.
National Association for Bilingual Education (NABE) & ILIAD Project. (2002). Determining
appropriate referrals of English language learners to special education, A self-assessment
guide for principals. Washington, DC; Arlington, VA: National Association for Bilingual
Education; Council for Exceptional Children.
National Research Council. (2002). Minority students in special and gifted education. In M. S.
Donovan & C. T. Cross (Eds.). Washington, DC: National Academy Press.
Nieto, S. (2004). Affirming diversity: The sociopolitical context of multicultural education (4th
ed.). Boston, MA: Allyn & Bacon.
202
O'Connor, C., & DeLuca Fernandez, S. (2006). Race, class, and disproportionality: Reevaluating
the relationship between poverty and special education placement. Educational
Researcher, 35(6), 6-11.
Ochoa, S. H., Galarza, A., & González, D. (1996). An investigation of school psychologists'
assessment practices with bilingual and limited English proficient students. Diagnostique,
21(4), 17-36.
Ochoa, S. H., Powell, M. P., & Robles-Piña, R. (1996). School psychologists' assessment
practices with bilingual and limited English proficient students. Journal of
Psychoeducational Assessment, 13(3), 250-275.
Ochoa, S. H., Rivera, B., & Ford, L. (1997). An investigation of school psychology training
pertaining to bilingual psycho-educational assessment of primarily Hispanic students:
Twenty-five years after Diana v. California. Journal of School Psychology, 35(4), 329-
349.
Ochoa, S. H., Robles-Piña, R., Garcia, S., & Breunig, N. (1999). School Psychologists'
perspectives on referrals of language minority students. Multiple Voices for Ethnically
Diverse Exceptional Learners, 3(1), 1-14.
Ortiz, A. A., & Yates, J. R. (2002). English language learners with special education needs:
Contexts and possibilities. In A. J. Artiles & A. A. Ortiz (Eds.), English language learners
with special education needs: Identification, assessment, and instruction (pp. 65-85). Mc
Henry, IL: Center for Applied Linguistics and Delta Systems Co., Inc.
Oswald, D. P., Coutinho, M. J., Best, A. N., & Singh, N. N. (1999). Ethnic representation in
special education: The influence of school-related economic and demographic variables.
Journal of special education, 32, 194-206.

203
Padilla, A. M. (1990). Bilingual education: Issues and strategies. In A. M. Padilla, H. H. Fairchild
& C. M. Valadez (Eds.), Bilingual education: Issues and perspectives (pp. 15-26).
Newbury Park, CA: Sage Publications.
Padilla, A. M. (2004). Quantitative methods in multicultural education research. In J. A. Banks &
C. A. McGee Banks (Eds.), Handbook of research on multicultural education (2nd ed.,
pp. 127-145). Somerset, NJ: Jossey-Bass.
Pérez, B. (2004). Literacy, diversity, and programmatic responses. In B. Pérez (Ed.),
Sociocultural contexts of language and literacy (2nd ed., pp. 3-24). Mahwah, NJ:
Lawrence Erlbaum Associates, Publishers.
Ponterotto, J. G., et al. (1998). Teacher multicultural attitude survey (TMAS). In P. E. Lester & L.
K. Bishop (Eds.), Handbook of tests and measurement in education and the social
sciences (2nd ed., pp. 374-375). Lanham, Maryland: The Scarecrow Press, Inc.
Purcell-Gates, V. (1995). Other people's words: The cycle of low literacy. Cambridge, MA:
Harvard University Press.
Reid, D. K., & Knight, M. G. (2006). Disability justifies exclusion of minority students: A critical
history grounded in disability studies. Educational Researcher, 35(6), 18-23.
Rhodes, R. L., Ochoa, S. H., & Ortiz, S. O. (2005). Assessing culturally and linguistically diverse
students: A practical guide. New York: The Guilford Press.
Ricento, T. (2006a). Topical areas in language policy: An overview. In T. Ricento (Ed.),
Introduction to language policy: Theory and method (pp. 231-237). Malden, MA:
Blackwell Publishers.
Ricento, T. (Ed.). (2006b). Introduction to language policy: Theory and method. Malden, MA:
Blackwell Publishers.
Romaine, S. (1995). Bilingualism (2nd ed.). Oxford, UK: Blackwell Publishers.

204
Rueda, R., Artiles, A. J., Salazar, J., & Higareda, I. (2002). An analysis of special education as a
response to the diminished academic achievement of Chicano/Latino students: An update.
In R. R. Valencia (Ed.), Chicano school failure and success: Past, present and future
(2nd ed., pp. 310-332). New York: Routledge Falmer.
Ruiz, N. T., Figueroa, R. A., Rueda, R., & Beaumont, C. (1992). History and status of bilingual
special education for Hispanic handicapped students. In R. V. Padilla & A. H. Benavides
(Eds.), Critical perspectives on bilingual education research (pp. 349-380). Tempe, AZ:
Bilingual Press.
San Miguel, G. (1999). The schooling of Mexicanos in the Southwest, 1848-1891. In J. F.
Moreno (Ed.), The elusive quest for equality: 150 years of Chicano/Chicana education
(pp. 31-51). Cambridge, MA: Harvard Education Review.
Skutnabb-Kangas, T. (2006). Language policy and linguistic human rights. In T. Ricento (Ed.),
An introduction to language policy: Theory and method (pp. 273-291). Malden, MA:
Blackwell Publishers.
Skutnabb-Kangas, T., & Cummins, J. (Eds.). (1988). Minority education: From shame to
struggle. Philadelphia, PA: Multilingual Matters, Ltd.
Sleeter, C. E. (2000-2001). Epistemological diversity in research on preservice teacher
preparation for historically underserved children. Review of Research in Education, 25,
209-250.
Snyder, T. D. (2008). Mini-digest of education statistics, 2007. Washington, DC: National Center
for Education Statistics, Institute of Educational Sciences, U.S. Department of Education.
Texas Education Agency. (2003-2004a). Academic Excellence Indicator System (AEIS), District
Profile. Austin, TX: Author.
Texas Education Agency. (2003-2004b). Academic Excellence Indicator System (AEIS), State
Profile. Austin, TX: Author.

205
Texas Education Agency. (2005-2006). Academic Excellence Indicator System (AEIS), District
Profile. Austin, TX: Author.
Texas Education Agency. (2006). Performance-Based Monitoring Analysis System 2006 Manual.
Austin, TX: Author.
Texas Education Agency. (2008a). Academic Excellence Indicator System. from
www.tea.state.tx.us/perfreport/aeis/.
Texas Education Agency. (2008b). Performance-Based Monitoring and Analysis System. from
www.tea.state.tx.us/pbm/.
Texas Education Agency. (2008c). Public Education Information Management System (PEIMS).
from www.tea.state.tx.us/peims/.
Trent, S. C., Artiles, A. J., & Englert, C. S. (1998). From deficit thinking to social constructivism:
A review of theory, reserach and practice in Special Education. Review of Research in
Education, 23, 277-307.
U. S. Department of Education, Office of the Secretary, & Office of Public Affairs. (2004). A
guide to education and No Child Left Behind. Retrieved April, 2007. from
www.ed.gov/nclb.
Valdés, G., & Figueroa, R. A. (1994). Bilingualism and testing: A special case of bias. Norwood,
NJ: Ablex Publishing Corporation.
Valencia, R. R. (1997a). Conceptualizing the notion of deficit thinking. In R. R. Valencia (Ed.),
The evolution of deficit thinking (pp. 1-12). Washington, DC: The Falmer Press.
Valencia, R. R. (Ed.). (1997b). The evolution of deficit thinking: Educational thought and
practice. Washington, DC: The Falmer Press.
Valencia, R. R., & Suzuki, L. A. (2001). Intelligence testing and minority students: Foundations,
performance factors, and assessment issues. Thousand Oaks, CA: Sage Publications, Inc.

206
Valenzuela, A. (1999). Subtractive schooling: U.S.-Mexican youth and the politics of caring. NY:
State University of New York Press.
Valenzuela, A. (Ed.). (2005). Leaving children behind: How "Texas style" accountability fails
Latino youth. NY: State University of New York Press.
Wei, L. (Ed.). (2000). The bilingualism reader. NY: Routledge.
Wenger, E. (1998). Communities of practice: Learning, meaning, and identity. New York:
Cambridge University Press.
Yzquierdo Mclean, Z. (1995). History of bilingual assessment and its impact on best practices
used today. New York State Association for Bilingual Education Journal, 10, 6-12.

VITA
Norma A. Guzmán was born in Raymondville, Texas in June 1970 to Guadalupe
Rodriguez and Arturo G. Guzmán. After graduating from Raymondville High School, Norma
entered college at Southwest Texas State University in San Marcos, Texas, and received her
Bachelor of Arts degree in Psychology (May 1992). In August of that year, Norma began
graduate work in school psychology at the University of Texas – Pan American in Edinburg,
Texas. Norma completed her Master of Arts degree in School Psychology in 1995, after
completing an internship with the Dallas Independent School District. Norma has provided
school psychological services for over 10 years in Dallas, Texas, Las Vegas, Nevada and San
Antonio, Texas. Throughout her career, Norma has worked as a bilingual evaluation specialist
and has taught bilingual assessment courses at UTSA. Norma began her doctoral coursework at
the University of Texas at San Antonio in the fall of 2004 in Culture, Literacy and Language.