
Guidance for Demonstrating Ecosystem Services Impacts
62
Guidance for Demonstrating Ecosystem Services Impacts Download Ecosystem Services Procedure: Impact Demonstration and Market Tools i Guidance for Demonstrating Ecosystem Services Impacts FSC-GUI-30-006 V1-1 EN Guideline All Rights Reserved FSC ® International 2021 FSC ® F000100 Forest Stewardship Council ®
-
Upload
khangminh22 -
Category
Documents
-
view
1 -
download
0
Transcript of Guidance for Demonstrating Ecosystem Services Impacts
Guidance for Demonstrating Ecosystem Services Impacts Download Ecosystem Services Procedure: Impact Demonstration and Market Tools i
Guidance for Demonstrating Ecosystem Services Impacts
FSC-GUI-30-006 V1-1 EN
Guideline
All Rights Reserved FSC®International 2021 FSC®F000100
Forest Stewardship Council ®
Guidance for Demonstrating Ecosystem Services Impacts Download Ecosystem Services Procedure: Impact Demonstration and Market Tools ii
ACKNOWLEDGEMENTS
This document was researched and written by Petra Westerlaan (ecosystem services consultant for FSC International) and Chris Henschel (FSC International). Lucio Brotto (ETIFOR) co-authored module 2.
Various people have contributed their time and expertise to develop this guidance document. The following are thanked for their contributions: Julianne Baroody (Verra), Bruno Brazil de Souza (Instituto de Manejo e Certificação Florestal e Agrícola, IMAFLORA), Mateo Cariño Fraisse (NEPCon), Shambhu Charmakar (Asia Network for Sustainable Agriculture and Bioresources, ANSAB), Mauro Ciriminna (Pact), Peter Ellis (The Nature Conservancy), Owen Hewlett (The Gold Standard Foundation), Rosario Galán (FSC International), Kees Hendriks (Wageningen University & Research), Alison von Ketteler (FSC International), Prof. Kanehiro Kitayama (Kyoto University),
Wendy Larsson (LimnoTech), Timo Lehesvirta (UPM), Anders Lindhe (HCV Resource Network), Jeff Milder (Rainforest Alliance), Giancarlo Raschio (The Gold Standard Foundation), Sini Savilaakso (Metsäteho Oy), Pranesh Selvendiran (LimnoTech), and Jiwon Sung (FSC International). We would like to thank FSC France for their constructive feedback that greatly supported the revision of this document.
V1-0 Editing, design, and layout: Green Ink (www.greenink.co.uk)
V1-1 Editing: Quiller Consultants (www.quillerconsultants.com);design, and layout: Green Ink (www.greenink.co.uk)
This guidance document supports the use of FSC-PRO-30-006, the Ecosystem Services Procedure.
Biodiversity conservation
Carbon sequestration and storage
Watershed services
Soil conservation
Recreational services
Icons used in this publication
Reference to Ecosystem Services Procedure
Example
Methodology
Version History
V1-0 approval date: October 9, 2018V1-1 approval date: October 1, 2021
This minor revision of the Ecosystem Services Guidance includes amendments to clarify how the high carbon stock approach can be applied, a change in the order of the modules to highlight the importance of how to obtain a payment or benefit from demonstrated positive impacts on ecosystem services, and an update of the graphics
in accordance with the revised Ecosystem Services Procedure.
REFERENCES . . . . . . . . . . . . . . . . . . . . . . . . . . . . . . . . . . . . . . . . . . . . . . . . . . . . . . . . . . . . . . . . . . . . . . . . . . . . . . . . . . . . . . . . . . . . . 54
ABBREVIATIONS . . . . . . . . . . . . . . . . . . . . . . . . . . . . . . . . . . . . . . . . . . . . . . . . . . . . . . . . . . . . . . . . . . . . . . . . . . . . . . . . . . . . . . . . . . 57
PHOTO CREDITS . . . . . . . . . . . . . . . . . . . . . . . . . . . . . . . . . . . . . . . . . . . . . . . . . . . . . . . . . . . . . . . . . . . . . . . . . . . . . . . . . . . . . . . . . . 57
CONTENTS
ACKNOWLEDGEMENTS . . . . . . . . . . . . . . . . . . . . . . . . . . . . . . . . . . . . . . . . . . . . . . . . . . . . . . . . . . . . . . . . . . . . . . . . . . . . . . . . . . . . . . ii
INTRODUCTION . . . . . . . . . . . . . . . . . . . . . . . . . . . . . . . . . . . . . . . . . . . . . . . . . . . . . . . . . . . . . . . . . . . . . . . . . . . . . . . . . . . . . . . . . . . . 1
HOW TO USE THIS DOCUMENT . . . . . . . . . . . . . . . . . . . . . . . . . . . . . . . . . . . . . . . . . . . . . . . . . . . . . . . . . . . . . . . . . . . . . . . . . . . . . . . . 2
MODULE 1
Identifying ecosystem servicesPAGE 3
MODULE 2
Ecosystem services claims: finding buyersPAGE 10
MODULE 3
Building a theory of changePAGE 13
MODULE 4
Selecting outcome indicatorsPAGE 16
MODULE 5
Measuring the outcome indicatorPAGE 18
MODULE 6
Determining the comparisonPAGE 21
MODULE 7
Results PAGE 23
MODULE 8
Management strategies for conserving or restoring forest carbonPAGE 25
MORE INFORMATION . . . . . . . . . . . . . . . . . . . . . . . . . . . . . . . . . . . . . . . . . . . . . . . . . . . . . . . . . . . . . . . . . . . . . . . . . . . . . . . . . . . . . . . 28
MODULE 9
Methodologies for measuring biodiversity conservationPAGE 29
MODULE 10
Methodologies for measuring carbon sequestration and storagePAGE 38
MODULE 11
Methodologies for measuring watershed servicesPAGE 43
MODULE 12
Methodologies for measuring soil conservationPAGE 46
MODULE 13
Methodologies for measuring recreational servicesPAGE 51
Guidance for Demonstrating Ecosystem Services Impacts Download Ecosystem Services Procedure: Impact Demonstration and Market Tools 1
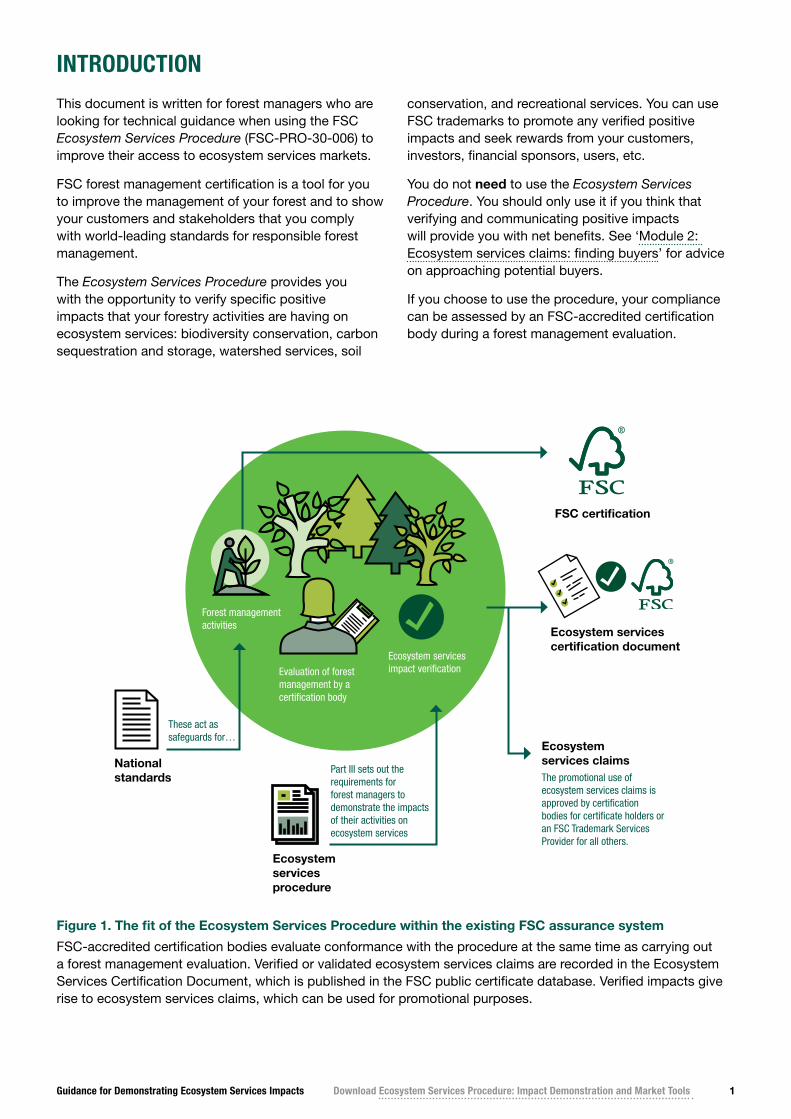
Figure 1. The fit of the Ecosystem Services Procedure within the existing FSC assurance system
FSC-accredited certification bodies evaluate conformance with the procedure at the same time as carrying out a forest management evaluation. Verified or validated ecosystem services claims are recorded in the Ecosystem Services Certification Document, which is published in the FSC public certificate database. Verified impacts give rise to ecosystem services claims, which can be used for promotional purposes.
INTRODUCTION
This document is written for forest managers who are looking for technical guidance when using the FSC Ecosystem Services Procedure (FSC-PRO-30-006) to improve their access to ecosystem services markets.
FSC forest management certification is a tool for you to improve the management of your forest and to show your customers and stakeholders that you comply with world-leading standards for responsible forest management.
The Ecosystem Services Procedure provides you with the opportunity to verify specific positive impacts that your forestry activities are having on ecosystem services: biodiversity conservation, carbon sequestration and storage, watershed services, soil
conservation, and recreational services. You can use FSC trademarks to promote any verified positive impacts and seek rewards from your customers, investors, financial sponsors, users, etc.
You do not need to use the Ecosystem Services Procedure. You should only use it if you think that verifying and communicating positive impacts will provide you with net benefits. See ‘Module 2: Ecosystem services claims: finding buyers’ for advice on approaching potential buyers.
If you choose to use the procedure, your compliance can be assessed by an FSC-accredited certification body during a forest management evaluation.
FSC certification
Ecosystem services certification document
Ecosystem services claimsThe promotional use of ecosystem services claims is approved by certification bodies for certificate holders or an FSC Trademark Services Provider for all others.
National standards
Ecosystem services procedure
Part III sets out the requirements for forest managers to demonstrate the impacts of their activities on ecosystem services
These act as safeguards for…
Evaluation of forest management by a certification body
Ecosystem services impact verification
Forest management activities
Guidance for Demonstrating Ecosystem Services Impacts Download Ecosystem Services Procedure: Impact Demonstration and Market Tools 2
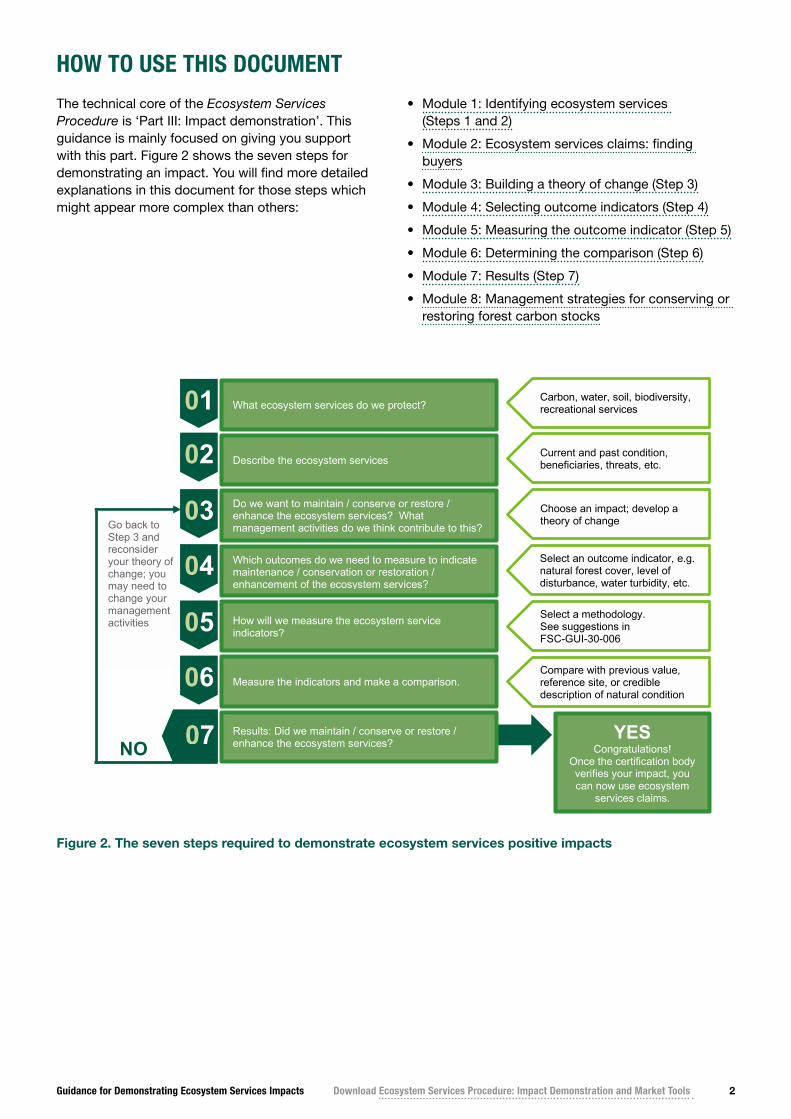
Figure 2. The seven steps required to demonstrate ecosystem services positive impacts
FSC-PRO-30-006 V1-1 EN
ECOSYSTEM SERVICES PROCEDURE: IMPACT DEMONSTRATION AND MARKET TOOLS 2020
– 16 of 67 –
Part III: Impact demonstration
Part III describes the steps to be followed by the organization in order to demonstrate the impact of its management activities on ecosystem services. The steps are summarized in Figure 2 (see also Annex B as a key resource for many of the steps). Complying with the requirements of an FSC Forest Stewardship Standard means that an organization is in conformance with responsible forest management. Demonstrating an impact according to this procedure means that the organization has measured specific positive outcomes compared with a reference level. It also means that the organization’s management activities contribute directly to these measured outcomes. These management activities will meet or exceed the requirements of FSC Forest Stewardship Standards. The organization may not need to implement additional management activities in order to demonstrate an impact (i.e. it may already be doing everything that is required to achieve the impact); in this case, the organization only needs to implement this procedure to measure the required outcomes.
Figure 2. The seven steps required to demonstrate ecosystem services impacts
YES Congratulations!
Once the certification body verifies your impact, you can now use ecosystem
services claims.
Carbon, water, soil, biodiversity, recreational services
Current and past condition, beneficiaries, threats, etc.
Choose an impact; develop a theory of change
Select an outcome indicator, e.g. natural forest cover, level of disturbance, water turbidity, etc.
Select a methodology. See suggestions in FSC-GUI-30-006
Compare with previous value, reference site, or credible description of natural condition
Go back to Step 3 and reconsider your theory of change; you may need to change your management activities
NO
What ecosystem services do we protect?
Describe the ecosystem services
Do we want to maintain / conserve or restore / enhance the ecosystem services? What management activities do we think contribute to this?
Which outcomes do we need to measure to indicate maintenance / conservation or restoration / enhancement of the ecosystem services?
How will we measure the ecosystem service indicators?
Measure the indicators and make a comparison.
Results: Did we maintain / conserve or restore / enhance the ecosystem services?
01
02
03
04
05
06
07
HOW TO USE THIS DOCUMENT
The technical core of the Ecosystem Services Procedure is ‘Part III: Impact demonstration’. This guidance is mainly focused on giving you support with this part. Figure 2 shows the seven steps for demonstrating an impact. You will find more detailed explanations in this document for those steps which might appear more complex than others:
• Module 1: Identifying ecosystem services (Steps 1 and 2)
• Module 2: Ecosystem services claims: finding buyers
• Module 3: Building a theory of change (Step 3)
• Module 4: Selecting outcome indicators (Step 4)
• Module 5: Measuring the outcome indicator (Step 5)
• Module 6: Determining the comparison (Step 6)
• Module 7: Results (Step 7)
• Module 8: Management strategies for conserving or restoring forest carbon stocks
Guidance for Demonstrating Ecosystem Services Impacts Download Ecosystem Services Procedure: Impact Demonstration and Market Tools 3
MODULE 1: IDENTIFYING ECOSYSTEM SERVICES
A CLOSER LOOK AT THE FIVE ECOSYSTEM SERVICES
This section briefly discusses the linkages between forests and each of the five ecosystem services covered by the Ecosystem Services Procedure (FSC, 2020):
• biodiversity conservation
• carbon sequestration and storage
• watershed services
• soil conservation
• recreational services.
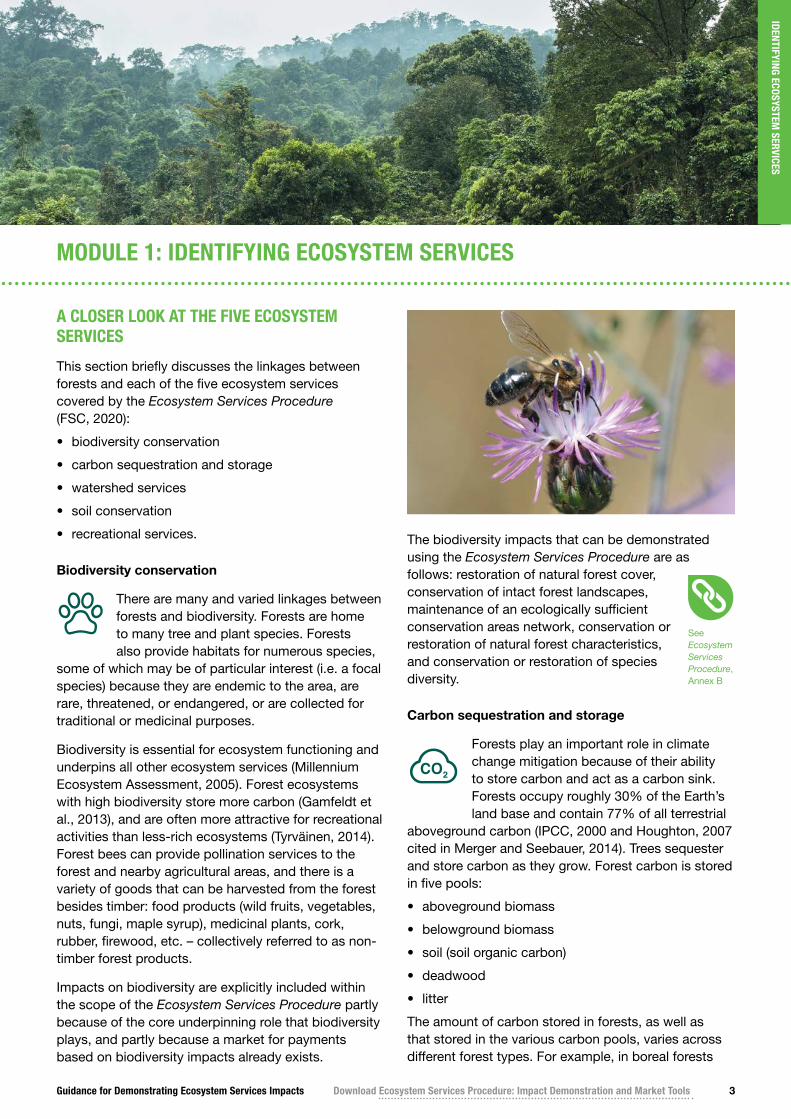
Biodiversity conservation
There are many and varied linkages between forests and biodiversity. Forests are home to many tree and plant species. Forests also provide habitats for numerous species,
some of which may be of particular interest (i.e. a focal species) because they are endemic to the area, are rare, threatened, or endangered, or are collected for traditional or medicinal purposes.
Biodiversity is essential for ecosystem functioning and underpins all other ecosystem services (Millennium Ecosystem Assessment, 2005). Forest ecosystems with high biodiversity store more carbon (Gamfeldt et al., 2013), and are often more attractive for recreational activities than less-rich ecosystems (Tyrväinen, 2014). Forest bees can provide pollination services to the forest and nearby agricultural areas, and there is a variety of goods that can be harvested from the forest besides timber: food products (wild fruits, vegetables, nuts, fungi, maple syrup), medicinal plants, cork, rubber, firewood, etc. – collectively referred to as non- timber forest products.
Impacts on biodiversity are explicitly included within the scope of the Ecosystem Services Procedure partly because of the core underpinning role that biodiversity plays, and partly because a market for payments based on biodiversity impacts already exists.
The biodiversity impacts that can be demonstrated using the Ecosystem Services Procedure are as follows: restoration of natural forest cover, conservation of intact forest landscapes, maintenance of an ecologically sufficient conservation areas network, conservation or restoration of natural forest characteristics, and conservation or restoration of species diversity.
Carbon sequestration and storage
Forests play an important role in climate change mitigation because of their ability to store carbon and act as a carbon sink. Forests occupy roughly 30% of the Earth’s land base and contain 77% of all terrestrial
aboveground carbon (IPCC, 2000 and Houghton, 2007 cited in Merger and Seebauer, 2014). Trees sequester and store carbon as they grow. Forest carbon is stored in five pools:
• aboveground biomass
• belowground biomass
• soil (soil organic carbon)
• deadwood
• litter
The amount of carbon stored in forests, as well as that stored in the various carbon pools, varies across different forest types. For example, in boreal forests
See Ecosystem Services Procedure, Annex B
IDENTIFYING ECOSYSTEM SERVICES
Guidance for Demonstrating Ecosystem Services Impacts Download Ecosystem Services Procedure: Impact Demonstration and Market Tools 4
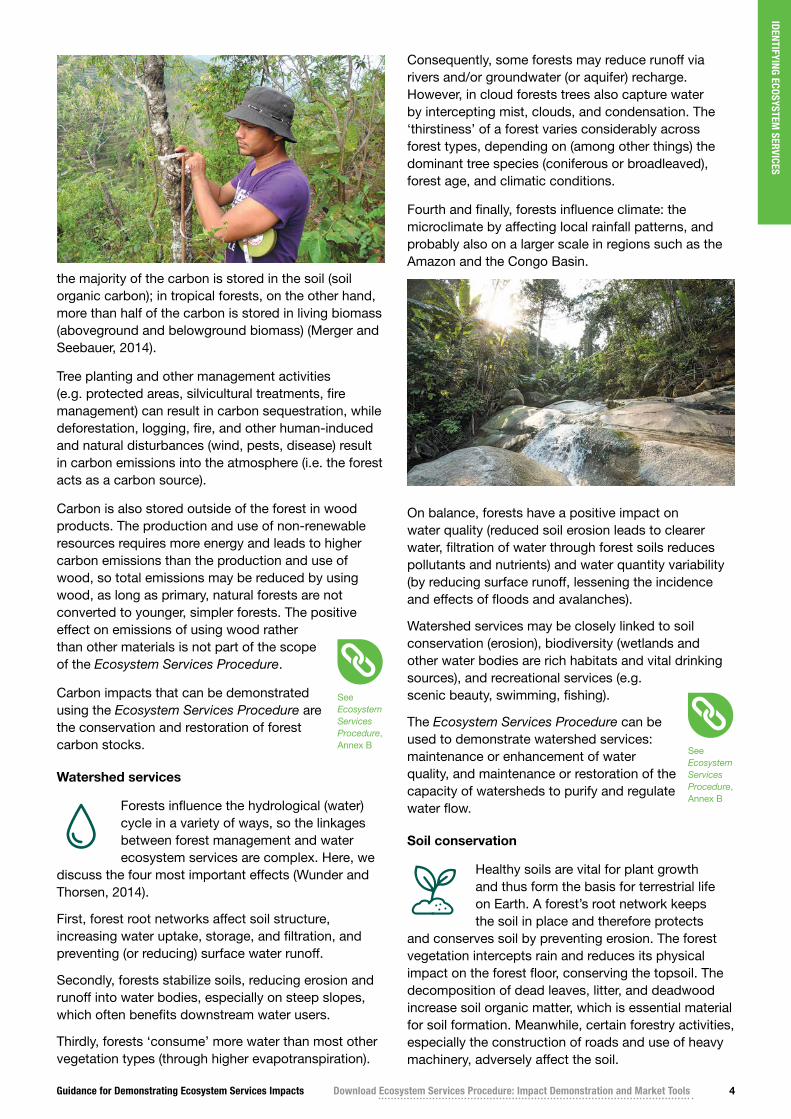
the majority of the carbon is stored in the soil (soil organic carbon); in tropical forests, on the other hand, more than half of the carbon is stored in living biomass (aboveground and belowground biomass) (Merger and Seebauer, 2014).
Tree planting and other management activities (e.g. protected areas, silvicultural treatments, fire management) can result in carbon sequestration, while deforestation, logging, fire, and other human-induced and natural disturbances (wind, pests, disease) result in carbon emissions into the atmosphere (i.e. the forest acts as a carbon source).
Carbon is also stored outside of the forest in wood products. The production and use of non-renewable resources requires more energy and leads to higher carbon emissions than the production and use of wood, so total emissions may be reduced by using wood, as long as primary, natural forests are not converted to younger, simpler forests. The positive effect on emissions of using wood rather than other materials is not part of the scope of the Ecosystem Services Procedure.
Carbon impacts that can be demonstrated using the Ecosystem Services Procedure are the conservation and restoration of forest carbon stocks.
Watershed services
Forests influence the hydrological (water) cycle in a variety of ways, so the linkages between forest management and water ecosystem services are complex. Here, we
discuss the four most important effects (Wunder and Thorsen, 2014).
First, forest root networks affect soil structure, increasing water uptake, storage, and filtration, and preventing (or reducing) surface water runoff.
Secondly, forests stabilize soils, reducing erosion and runoff into water bodies, especially on steep slopes, which often benefits downstream water users.
Thirdly, forests ‘consume’ more water than most other vegetation types (through higher evapotranspiration).
Consequently, some forests may reduce runoff via rivers and/or groundwater (or aquifer) recharge. However, in cloud forests trees also capture water by intercepting mist, clouds, and condensation. The ‘thirstiness’ of a forest varies considerably across forest types, depending on (among other things) the dominant tree species (coniferous or broadleaved), forest age, and climatic conditions.
Fourth and finally, forests influence climate: the microclimate by affecting local rainfall patterns, and probably also on a larger scale in regions such as the Amazon and the Congo Basin.
On balance, forests have a positive impact on water quality (reduced soil erosion leads to clearer water, filtration of water through forest soils reduces pollutants and nutrients) and water quantity variability (by reducing surface runoff, lessening the incidence and effects of floods and avalanches).
Watershed services may be closely linked to soil conservation (erosion), biodiversity (wetlands and other water bodies are rich habitats and vital drinking sources), and recreational services (e.g. scenic beauty, swimming, fishing).
The Ecosystem Services Procedure can be used to demonstrate watershed services: maintenance or enhancement of water quality, and maintenance or restoration of the capacity of watersheds to purify and regulate water flow.
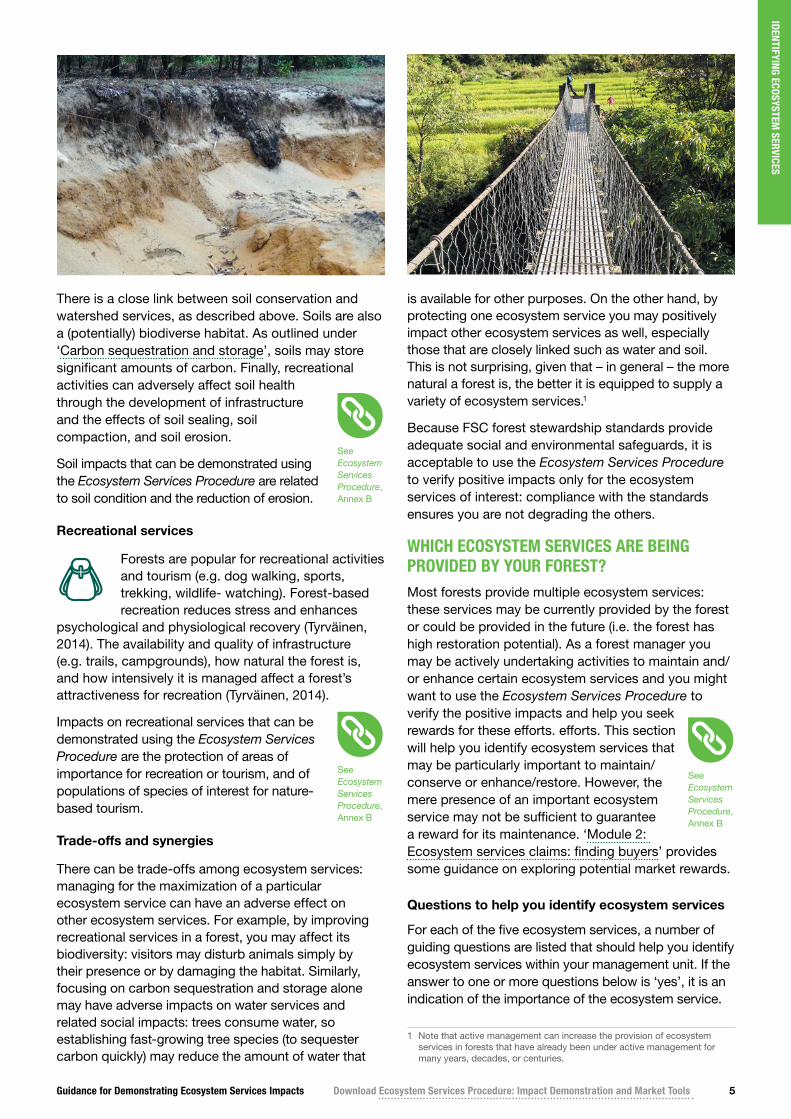
Soil conservation
Healthy soils are vital for plant growth and thus form the basis for terrestrial life on Earth. A forest’s root network keeps the soil in place and therefore protects
and conserves soil by preventing erosion. The forest vegetation intercepts rain and reduces its physical impact on the forest floor, conserving the topsoil. The decomposition of dead leaves, litter, and deadwood increase soil organic matter, which is essential material for soil formation. Meanwhile, certain forestry activities, especially the construction of roads and use of heavy machinery, adversely affect the soil.
IDENTIFYING ECOSYSTEM SERVICES
See Ecosystem Services Procedure, Annex B
See Ecosystem Services Procedure, Annex B
Guidance for Demonstrating Ecosystem Services Impacts Download Ecosystem Services Procedure: Impact Demonstration and Market Tools 5
There is a close link between soil conservation and watershed services, as described above. Soils are also a (potentially) biodiverse habitat. As outlined under ‘Carbon sequestration and storage’, soils may store significant amounts of carbon. Finally, recreational activities can adversely affect soil health through the development of infrastructure and the effects of soil sealing, soil compaction, and soil erosion.
Soil impacts that can be demonstrated using the Ecosystem Services Procedure are related to soil condition and the reduction of erosion.
Recreational services
Forests are popular for recreational activities and tourism (e.g. dog walking, sports, trekking, wildlife- watching). Forest-based recreation reduces stress and enhances
psychological and physiological recovery (Tyrväinen, 2014). The availability and quality of infrastructure (e.g. trails, campgrounds), how natural the forest is, and how intensively it is managed affect a forest’s attractiveness for recreation (Tyrväinen, 2014).
Impacts on recreational services that can be demonstrated using the Ecosystem Services Procedure are the protection of areas of importance for recreation or tourism, and of populations of species of interest for nature-based tourism.
Trade-offs and synergies
There can be trade-offs among ecosystem services: managing for the maximization of a particular ecosystem service can have an adverse effect on other ecosystem services. For example, by improving recreational services in a forest, you may affect its biodiversity: visitors may disturb animals simply by their presence or by damaging the habitat. Similarly, focusing on carbon sequestration and storage alone may have adverse impacts on water services and related social impacts: trees consume water, so establishing fast-growing tree species (to sequester carbon quickly) may reduce the amount of water that
is available for other purposes. On the other hand, by protecting one ecosystem service you may positively impact other ecosystem services as well, especially those that are closely linked such as water and soil. This is not surprising, given that – in general – the more natural a forest is, the better it is equipped to supply a variety of ecosystem services.1
Because FSC forest stewardship standards provide adequate social and environmental safeguards, it is acceptable to use the Ecosystem Services Procedure to verify positive impacts only for the ecosystem services of interest: compliance with the standards ensures you are not degrading the others.
WHICH ECOSYSTEM SERVICES ARE BEING PROVIDED BY YOUR FOREST?Most forests provide multiple ecosystem services: these services may be currently provided by the forest or could be provided in the future (i.e. the forest has high restoration potential). As a forest manager you may be actively undertaking activities to maintain and/or enhance certain ecosystem services and you might want to use the Ecosystem Services Procedure to verify the positive impacts and help you seek rewards for these efforts. efforts. This section will help you identify ecosystem services that may be particularly important to maintain/conserve or enhance/restore. However, the mere presence of an important ecosystem service may not be sufficient to guarantee a reward for its maintenance. ‘Module 2: Ecosystem services claims: finding buyers’ provides some guidance on exploring potential market rewards.
Questions to help you identify ecosystem services
For each of the five ecosystem services, a number of guiding questions are listed that should help you identify ecosystem services within your management unit. If the answer to one or more questions below is ‘yes’, it is an indication of the importance of the ecosystem service.
1 Note that active management can increase the provision of ecosystem services in forests that have already been under active management for many years, decades, or centuries.
IDENTIFYING ECOSYSTEM SERVICES
See Ecosystem Services Procedure, Annex B
See Ecosystem Services Procedure, Annex B
See Ecosystem Services Procedure, Annex B

Guidance for Demonstrating Ecosystem Services Impacts Download Ecosystem Services Procedure: Impact Demonstration and Market Tools 6
BIODIVERSITY CONSERVATION
• Are there any focal species (endemic to the area; rare, threatened, or endangered; or collected for traditional or medicinal purposes) encountered within the management unit, and/or have high conservation value (HCV) 1 (species diversity) areas been identified within the management unit?
• Does (part of) the management unit contain endemic and/or rare, threatened, or endangered ecosystems, habitats, or refugia, and/or have HCV 3 (ecosystems and habitats) areas which have been identified within the management unit?
• Does the management unit contain or is it part of an intact forest landscape (IFL),2 and/or have HCV 2 (landscape-level ecosystems and mosaics) areas which have been identified within the management unit?
• Is the management unit part of a larger conservation areas network that sustains viable populations of focal species?
• Is the forest in the management unit in a near-natural condition?
• Does the management unit stand out for its maintenance of forest cover, in contrast to adjacent areas?
• Does the management unit serve as a place of refuge for focal species from significant poaching pressures?
• Are you aiming to maintain and/or restore natural forest cover and/or biodiversity and/or connectivity with nearby conservation areas?
• Can you restore forest cover, habitats, or forest condition in the management unit? For example, are there any nearby protected areas or forests that harbour focal species for which you could restore habitat in the management unit?
CARBON SEQUESTRATION AND STORAGE
• Are there any forest areas that you should protect for their high stocks of forest carbon (see Box ‘How to identify forests with high carbon stocks’ for a methodology on how to identify such areas)? In these cases, we recommend focusing upon the protection of the potential high carbon stock forests with the highest density vegetation class.
• Does the management unit contain or is it part of an IFL?3
2 Global Forest Watch offers an interactive map on its website showing the locations of IFL land cover: www.globalforestwatch.org/map/ (see also ‘Module 9: Methodologies for measuring biodiversity conservation’)
3 Refer to Global Forest Watch interactive map: www.globalforestwatch.org/map/
• Have HCV 4 (critical ecosystem services) areas been identified in the management unit based on forest carbon stocks?
• Are you specifically aiming to increase forest carbon stocks?
• Are you using reduced-impact logging techniques when felling trees?
• Can you modify management activities to reduce losses of forest carbon (see ‘Module 8: Management strategies for conserving or restoring forest carbon stocks’)?
• Are you restoring the forest or planting trees in the management unit?
• Can you restore carbon stocks in the management unit?
• Is the surrounding area or region experiencing high deforestation or carbon loss?
WATERSHED SERVICES
• Is the forest located in an area of high- water risk?
• Does the management unit have an important role in the provision of water services in the watershed?
• Are there any wetlands and/or peatlands present in the management unit?
• Have HCV 4 (critical ecosystem services) areas been identified in the management unit based on critical watershed services that are being provided by the forest?
• Are there any water bodies present within or adjacent to the management unit?
• Do local/regional people or cities downstream use the water bodies for drinking water, household purposes, recreation, and/or irrigation of crops?
• Is groundwater used in the area of the management unit?
• Are there steep slopes in the management unit and/or areas that are prone to surface water runoff and erosion?
• Has there ever been any flooding? Are there recurrent (or seasonal) flooding events that can be attributed to poor land management?
• Is the watershed in a relatively intact and good forest condition relative to adjacent areas?
• Are you specifically aiming to maintain and/or enhance watershed services?
• Can you restore degraded areas of the management unit that have a direct impact on the regulation of water quality or flow?
IDENTIFYING ECOSYSTEM SERVICES
Guidance for Demonstrating Ecosystem Services Impacts Download Ecosystem Services Procedure: Impact Demonstration and Market Tools 7
SOIL CONSERVATION
• Have HCV 4 (critical ecosystem services) areas been identified in the management unit based on critical soil services that are being provided by the forest?
• Are there steep slopes in the management unit and/or areas that are prone to soil erosion and/or landslides?
• Are there any vulnerable soils present within the management unit?
• Are reduced-impact logging techniques practised in the planning and construction of roads?
• Are there any no-logging zones in the management unit established to protect soils?
• Is there a risk of soil compaction and are there measures in place to prevent this?
• Do you specifically aim to conserve and/ or restore soil?
• Can you restore degraded soils in the management unit?
RECREATIONAL SERVICES
• Is the forest used for recreational activities or nature-based tourism?
• Is there any infrastructure for tourism/ recreation within the management unit (e.g. walking trails, benches, litter bins, watchtowers, signposts)?
• Can you restore degraded attractions, trails, or other recreational infrastructure?
• Does the forest have good tourist potential, such as sites for birdwatching or observation of mammals, kayaking, fishing, trekking, cycling?
Mapping of ecosystem services
Once the ecosystem services that are being delivered by the forest have been identified, you could consider mapping them (see Savilaakso and Guariguata, 2013). A map depicting those forest areas that are (most) important in the provision of certain ecosystem services will enable you to identify areas of overlapping ecosystem services, that is areas that are of importance to multiple ecosystem services. You could also include the location of important beneficiaries and stakeholders in these maps.
IDENTIFYING BENEFICIARIES
As defined at the start of this module, ecosystem services are the various benefits that people obtain from nature. Therefore, strictly speaking, an ecosystem service that does not provide benefits to people directly, is not an ecosystem service (Science for Environment Policy, 2015).
It is thus important to identify the beneficiaries of the ecosystem services as well as stakeholders who affect or are affected by the ecosystem services. In the Ecosystem Services Procedure, beneficiaries of a particular ecosystem service are defined as: “Any person, group of persons, or entity that uses or is likely to use the benefits obtained from nature provided by the management unit.” The following are examples of beneficiaries of an ecosystem service:
• local communities
• Indigenous Peoples
• forest dwellers
• neighbours
• downstream water users
• tenure and use rights holders, including landowners.
Beneficiaries may be the people and organizations that you have already identified as stakeholders for forest management activities and decisions. They may be a subgroup of identified stakeholders – for example, only those downstream of the management unit.
Another reason for identifying the beneficiaries and stakeholders is their potential interest in paying for ecosystem services – for example, water users in a municipality located downstream of a forest.
Depending on the type of ecosystem service and the local context, beneficiaries can be local, regional, and/ or global. For example, for carbon sequestration and storage the global community are the beneficiaries, whereas for watershed services these are local or regional communities, governments, and/or corporations. Be aware that communities at local and regional levels are not homogeneous; it is likely that not all people use, benefit from, or are affected by ecosystem services in the same way.
When identifying ecosystem services beneficiaries, the following question is central: Who are the direct and indirect users or beneficiaries of the ecosystem service? Some guiding questions follow to help you identify beneficiaries for each of the five ecosystem services.
See Ecosystem Services Procedure, Step 2
Guidance for Demonstrating Ecosystem Services Impacts Download Ecosystem Services Procedure: Impact Demonstration and Market Tools 8
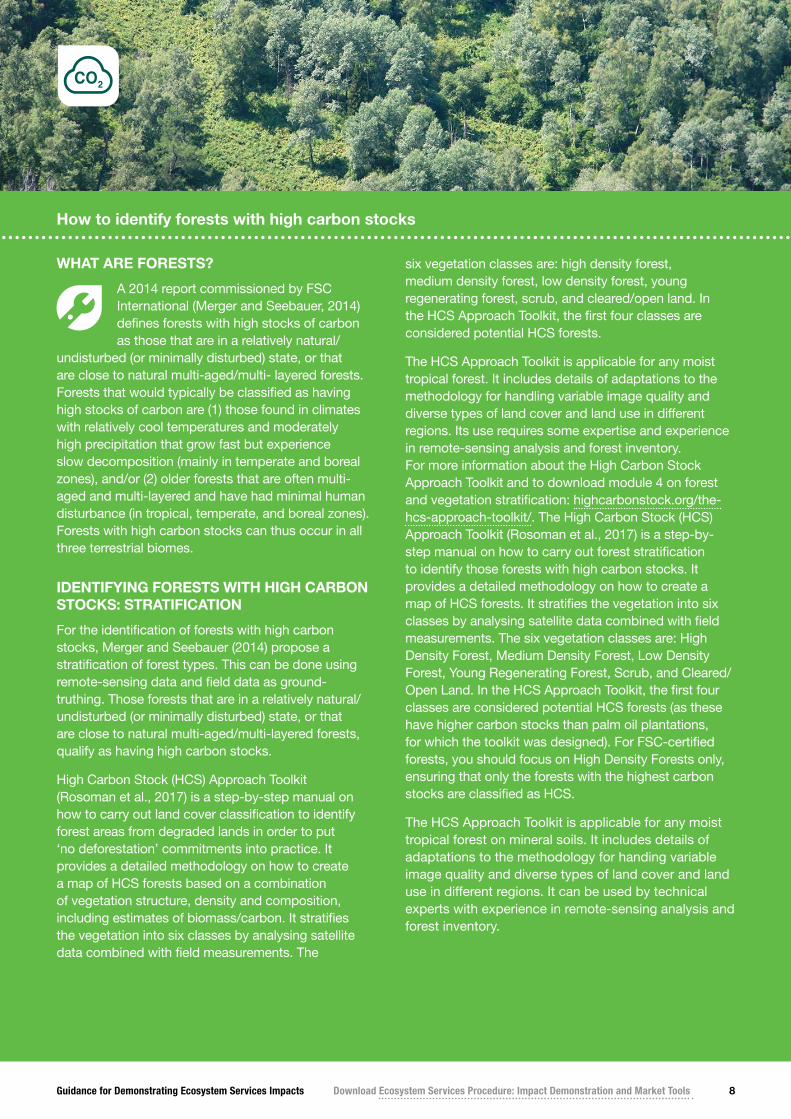
How to identify forests with high carbon stocks
WHAT ARE FORESTS?
A 2014 report commissioned by FSC International (Merger and Seebauer, 2014) defines forests with high stocks of carbon as those that are in a relatively natural/
undisturbed (or minimally disturbed) state, or that are close to natural multi-aged/multi- layered forests. Forests that would typically be classified as having high stocks of carbon are (1) those found in climates with relatively cool temperatures and moderately high precipitation that grow fast but experience slow decomposition (mainly in temperate and boreal zones), and/or (2) older forests that are often multi-aged and multi-layered and have had minimal human disturbance (in tropical, temperate, and boreal zones). Forests with high carbon stocks can thus occur in all three terrestrial biomes.
IDENTIFYING FORESTS WITH HIGH CARBON STOCKS: STRATIFICATION
For the identification of forests with high carbon stocks, Merger and Seebauer (2014) propose a stratification of forest types. This can be done using remote-sensing data and field data as ground-truthing. Those forests that are in a relatively natural/undisturbed (or minimally disturbed) state, or that are close to natural multi-aged/multi-layered forests, qualify as having high carbon stocks.
High Carbon Stock (HCS) Approach Toolkit (Rosoman et al., 2017) is a step-by-step manual on how to carry out land cover classification to identify forest areas from degraded lands in order to put ‘no deforestation’ commitments into practice. It provides a detailed methodology on how to create a map of HCS forests based on a combination of vegetation structure, density and composition, including estimates of biomass/carbon. It stratifies the vegetation into six classes by analysing satellite data combined with field measurements. The
six vegetation classes are: high density forest, medium density forest, low density forest, young regenerating forest, scrub, and cleared/open land. In the HCS Approach Toolkit, the first four classes are considered potential HCS forests.
The HCS Approach Toolkit is applicable for any moist tropical forest. It includes details of adaptations to the methodology for handling variable image quality and diverse types of land cover and land use in different regions. Its use requires some expertise and experience in remote-sensing analysis and forest inventory. For more information about the High Carbon Stock Approach Toolkit and to download module 4 on forest and vegetation stratification: highcarbonstock.org/the-hcs-approach-toolkit/. The High Carbon Stock (HCS) Approach Toolkit (Rosoman et al., 2017) is a step-by-step manual on how to carry out forest stratification to identify those forests with high carbon stocks. It provides a detailed methodology on how to create a map of HCS forests. It stratifies the vegetation into six classes by analysing satellite data combined with field measurements. The six vegetation classes are: High Density Forest, Medium Density Forest, Low Density Forest, Young Regenerating Forest, Scrub, and Cleared/Open Land. In the HCS Approach Toolkit, the first four classes are considered potential HCS forests (as these have higher carbon stocks than palm oil plantations, for which the toolkit was designed). For FSC-certified forests, you should focus on High Density Forests only, ensuring that only the forests with the highest carbon stocks are classified as HCS.
The HCS Approach Toolkit is applicable for any moist tropical forest on mineral soils. It includes details of adaptations to the methodology for handing variable image quality and diverse types of land cover and land use in different regions. It can be used by technical experts with experience in remote-sensing analysis and forest inventory.
Guidance for Demonstrating Ecosystem Services Impacts Download Ecosystem Services Procedure: Impact Demonstration and Market Tools 9
BIODIVERSITY CONSERVATION
Besides the global community as a beneficiary and the intrinsic value of biodiversity:
• Are there farmers who benefit from pollination services provided by forest bees?
• Are there traditional hunters in nearby areas who hunt species for which the forest provides a refuge?
• Are there any forests connected to the management unit that (potentially) provide movement of animals through the wider landscape, permanently or seasonally (e.g. migratory species), that would be of interest to managers of nearby national parks and nongovernmental organizations (NGOs) active in these connected forests?
CARBON SEQUESTRATION AND STORAGE
The ecosystem service related to carbon is of importance to the global community. These are assumed and do not need to be listed in the Ecosystem Services Certification Document (ESCD).
WATERSHED SERVICES
• Are there nearby and/or downstream communities that use water supplied by water bodies within the forest?
• Does wildlife or livestock use water bodies within the forest as an important source of drinking water, permanently or in specific seasons?
• Are there farmers downstream who use water for irrigation of agricultural fields?
• Is there a downstream hydropower plant, beer brewery, canoe rental, or other company that uses the water as a main input in its production process or services?
• Are there any houses, villages, towns, or cities that would be at an increased risk of flooding (or avalanches) if the forest were not there, or if it were not managed specifically to reduce risk?
SOIL CONSERVATION
• Are there any farmers adjacent to the forest area?
• Are there any sites where sediment deposition occurs after soil erosion incidents resulting in cleaning efforts and/or costs for companies and/or individuals, for example to downstream hydropower plants?
• Are there any houses, villages, towns, or cities that would be at an increased risk of landslides or mudflows if the forest were not there, or if it were not managed specifically to reduce risk?
RECREATIONAL SERVICES
• Who are the users of the recreational services?
• Are there any companies offering goods and services to visitors (tour operator, café/restaurant, visitor centre and shop, bike/canoe rental)?
• Are there any individuals/villagers or communities that offer lodging, meals, or other services to visitors?
IDENTIFYING ECOSYSTEM SERVICES
Guidance for Demonstrating Ecosystem Services Impacts Download Ecosystem Services Procedure: Impact Demonstration and Market Tools 10
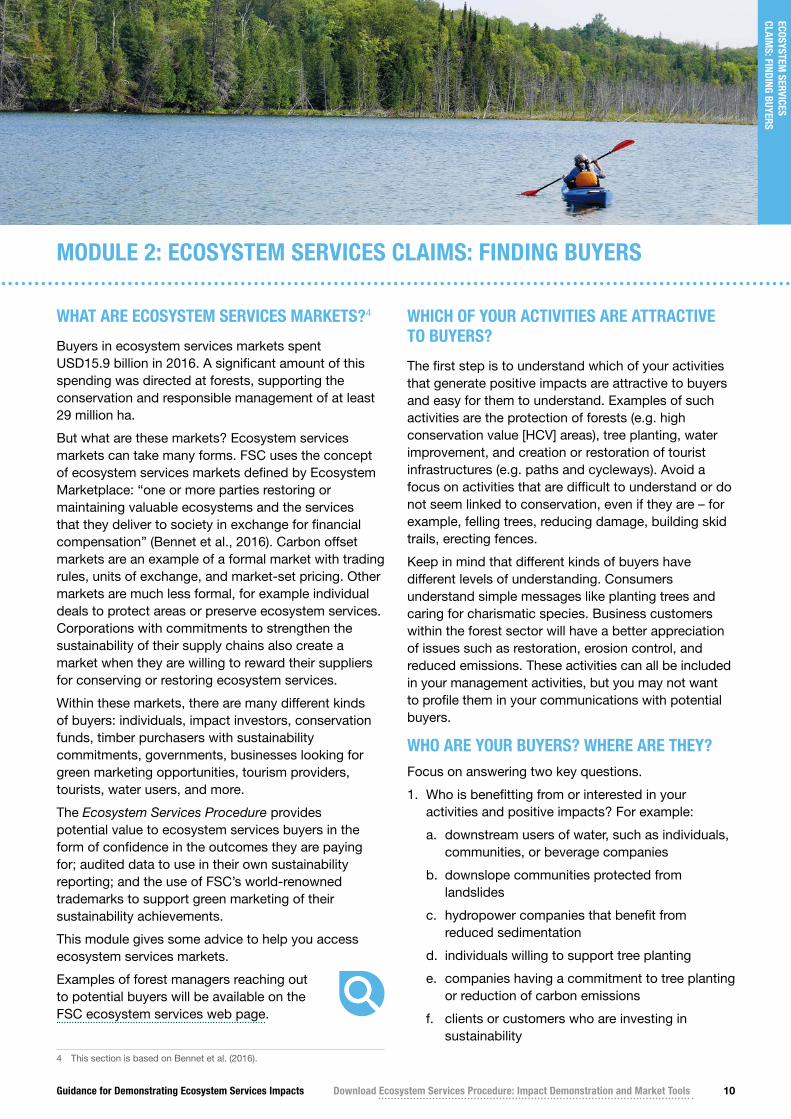
MODULE 2: ECOSYSTEM SERVICES CLAIMS: FINDING BUYERS
WHAT ARE ECOSYSTEM SERVICES MARKETS?4
Buyers in ecosystem services markets spent USD15.9 billion in 2016. A significant amount of this spending was directed at forests, supporting the conservation and responsible management of at least 29 million ha.
But what are these markets? Ecosystem services markets can take many forms. FSC uses the concept of ecosystem services markets defined by Ecosystem Marketplace: “one or more parties restoring or maintaining valuable ecosystems and the services that they deliver to society in exchange for financial compensation” (Bennet et al., 2016). Carbon offset markets are an example of a formal market with trading rules, units of exchange, and market-set pricing. Other markets are much less formal, for example individual deals to protect areas or preserve ecosystem services. Corporations with commitments to strengthen the sustainability of their supply chains also create a market when they are willing to reward their suppliers for conserving or restoring ecosystem services.
Within these markets, there are many different kinds of buyers: individuals, impact investors, conservation funds, timber purchasers with sustainability commitments, governments, businesses looking for green marketing opportunities, tourism providers, tourists, water users, and more.
The Ecosystem Services Procedure provides potential value to ecosystem services buyers in the form of confidence in the outcomes they are paying for; audited data to use in their own sustainability reporting; and the use of FSC’s world-renowned trademarks to support green marketing of their sustainability achievements.
This module gives some advice to help you access ecosystem services markets.
Examples of forest managers reaching out to potential buyers will be available on the FSC ecosystem services web page.
4 This section is based on Bennet et al. (2016).
WHICH OF YOUR ACTIVITIES ARE ATTRACTIVE TO BUYERS?
The first step is to understand which of your activities that generate positive impacts are attractive to buyers and easy for them to understand. Examples of such activities are the protection of forests (e.g. high conservation value [HCV] areas), tree planting, water improvement, and creation or restoration of tourist infrastructures (e.g. paths and cycleways). Avoid a focus on activities that are difficult to understand or do not seem linked to conservation, even if they are – for example, felling trees, reducing damage, building skid trails, erecting fences.
Keep in mind that different kinds of buyers have different levels of understanding. Consumers understand simple messages like planting trees and caring for charismatic species. Business customers within the forest sector will have a better appreciation of issues such as restoration, erosion control, and reduced emissions. These activities can all be included in your management activities, but you may not want to profile them in your communications with potential buyers.
WHO ARE YOUR BUYERS? WHERE ARE THEY?Focus on answering two key questions.
1. Who is benefitting from or interested in your activities and positive impacts? For example:
a. downstream users of water, such as individuals, communities, or beverage companies
b. downslope communities protected from landslides
c. hydropower companies that benefit from reduced sedimentation
d. individuals willing to support tree planting
e. companies having a commitment to tree planting or reduction of carbon emissions
f. clients or customers who are investing in sustainability
ECOSYSTEM SERVICES
CLAIMS: FINDING BUYERS

Guidance for Demonstrating Ecosystem Services Impacts Download Ecosystem Services Procedure: Impact Demonstration and Market Tools 11
g. companies that have a negative impact on the environment
h. tourists in popular destinations for nature-based recreation.
2. Who is close to or has a connection to your forest? A potential buyer can be close in different ways:
a. close to your business: your existing customers are a good place to start since they may have made public sustainability commitments to reduce deforestation or reduce emissions – perhaps they are setting science-based targets to reduce greenhouse gas emissions or taking action within their value chain to achieve positive impacts;
b. close to the forest: companies and individuals close to your forest might be more likely to benefit and thus to support improvements;
c. close to production: companies might prefer forest projects close to their production sites because they can integrate the project under their company welfare plan;
d. close to customers: your forest improvements can bring benefit to people who live nearby – these people are most likely buying products and services from companies;
e. close to supply: identify those companies that are sourcing products and services near your forest projects – they are most likely willing to support improvement in their supply chain;
f. close to philosophy: there are companies that share your vision of why you are improving your forest operations.
WHAT DO YOUR BUYERS WANT?
Once you have a list of potential buyers, figure out what they want. Remember that, except for foundations or funds, potential buyers are not motivated by philanthropy. What is in it for them? A primary value for many businesses will be the green marketing benefits that they can generate using FSC trademarks to promote their products or sponsorships.
In a global market survey conducted by Ecosystem Marketplace for FSC in 2016 (Bennet et al., 2016), the buyers identified several motivations to pay for verified ecosystem services impacts:
1. response to customer demand
2. seeking verified outcomes for key performance indicators/sustainability reporting
3. part of organizational mission
4. environmental risks affect business model
5. seeking to incentivize changes to practices or support sustainable development in the supply chain
6. demonstrating progress towards the Sustainable Development Goals.
Online research can teach you a lot about a potential buyer’s environmental commitments, the projects they invest in, and how they approach environmental communications. Is your timber buyer looking for data that can support their efforts to calculate and reduce their environmental footprint? Is a restoration fund interested in your ability to provide third-party verification of outcomes? Is a major retailer wanting to boost its environmental reputation by telling positive stories about wildlife to its customers?
Buyers will have various expectations about reporting: Will they want to visit the site? Receive annual reports? Monitor forest changes in real time using remote sensing?
COMMUNICATING WITH YOUR BUYERS
Communication with your buyers should be based on your existing relationships and what you think they want. If your buyer is an existing customer interested in data on positive impacts, communication may be straightforward. If you do not have a pre-existing relationship, start with a broad discussion of interests and find areas of alignment. In most cases, it will be important to communicate in simple messages that connect with buyers’ interests. Messages should be emotional and use the language of the buyer. Avoid detailed technical descriptions and terminology unless you are asked for them.
Start by reaching out to a broad range of companies to gauge their interest and invite them to an in-person meeting. If you expect green marketing benefits to be a major motivator, bring an example such as some draft messaging, documents, videos, or testimonials.
Remember to follow the rules in Part IV of the Ecosystem Services Procedure when using FSC trademarks to promote positive ecosystem services impacts.
See Ecosystem Services Procedure, Part IV
ECOSYSTEM SERVICES CLAIM
S: FINDING BUYERS

Guidance for Demonstrating Ecosystem Services Impacts Download Ecosystem Services Procedure: Impact Demonstration and Market Tools 12
NEED HELP?
If you don’t feel you are able to reach out to potential buyers on your own, ask for help. NGOs, consultants, and businesses may be able to find you buyers for a commission. FSC may also be able to help. Contact your national FSC office to see what kind of services it can offer: https://www.fsc.org
GETTING PAID
The nature of your payment will depend on the nature of the transaction. Your reward could be a grant, a financial investment, a premium price, or financial sponsorship. Common to most of these is the element of a negotiation. Think about the management costs of achieving the positive impact, the lost revenue from protecting the forest or harvesting differently, data collection costs, the time you need to reach out to buyers, acosts of reporting and marketing associated with the payment. Be sure the payment is sufficient to generate a net benefit for you.
ECOSYSTEM SERVICES CLAIM
S: FINDING BUYERS
Guidance for Demonstrating Ecosystem Services Impacts Download Ecosystem Services Procedure: Impact Demonstration and Market Tools 13
MODULE 3: BUILDING A THEORY OF CHANGE
Step 3 of the Ecosystem Services Procedure requires you to develop a theory of change. A theory of change is a chain of results over time that shows how you expect your management activities to contribute to a desired impact.
Making the connections between assumed activity–effect relationships clear has two advantages. First, it allows you to make the link between your activities in the forest and the positive impacts you wish to demonstrate (see Box ‘Chose the Ecosystem Services impact you will demonstrate’). Second, it allows you to focus on short-term measurable outputs and outcomes rather than waiting for long-term impacts to become measurable.
FLOW OF THE EXERCISE
The creation of a theory of change can be done as a group exercise (e.g. in a workshop) or alternativelyby an individual with sufficient knowledge of your management activities and the effects on the specific ecosystem service.
The building blocks of a theory of change are management activities, outputs, outcomes, and
an impact (see Box ‘Building blocks of a theory of change’ for a definition of each of these terms). A template of the ESCD (Annex A of the Ecosystem Services Procedure) contains the building blocks of the theory of change and is available for download on the resources page for forest managers (see ‘More information’).
When developing a theory of change, you can follow different approaches after selecting the desired impact (from Annex B of the Ecosystem Services Procedure). The first approach works in reverse:
1. Identify the necessary outcomes that are required to achieve the desired impact
2. Define the concrete outputs that will lead to the outcomes
3. Define the management activities and interventions that need to be implemented (Center for Theory of Change, nd).
This reverse approach ensures that no important outcomes or related outputs and management activities that contribute to the desired impact will be overlooked.
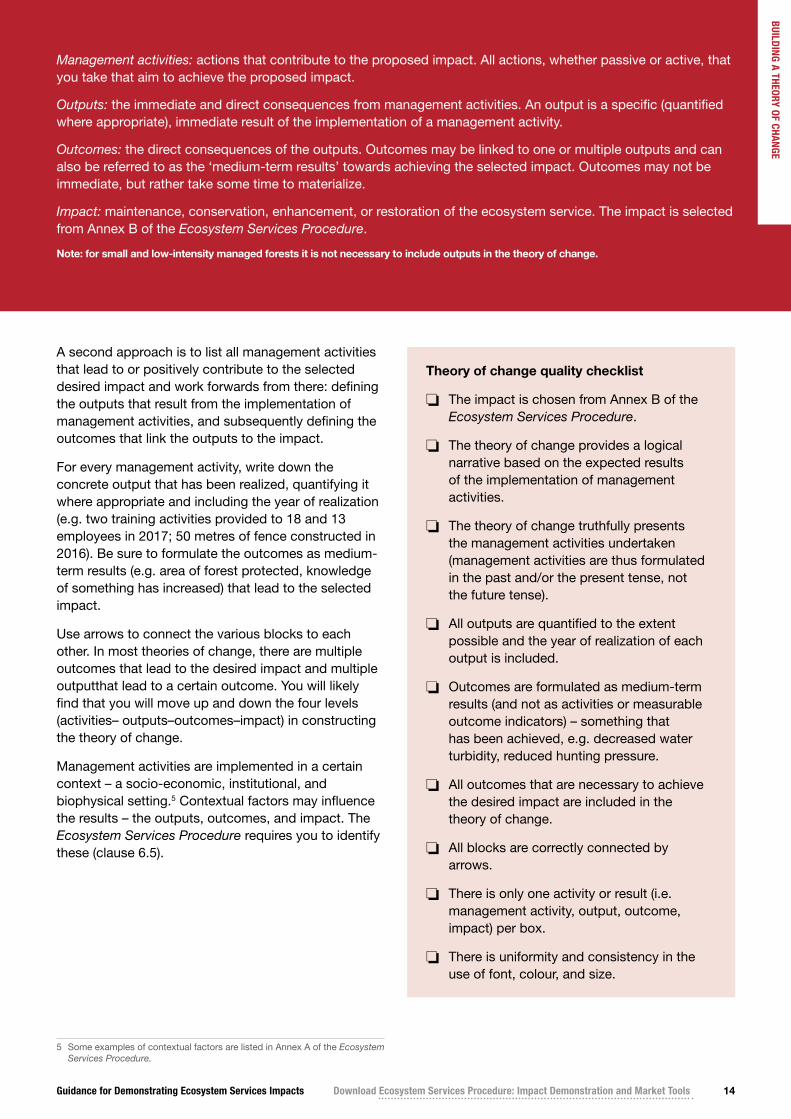
Building blocks of a theory of change
BUILDING A THEORY OF CHANGE
ManagementActivities:Actions thatcontribute to theproposed impact
Outputs:Immediate and direct consequences from management activities
Outcomes: Direct consequences ofthe outputs
Impact: Maintenance, conservation, enhancement, or restoration of the ecosystem service (selected from Annex B)
Contextual factors: Institutional and biophysical setting in which the management activities are implemented
See Ecosystem Services Procedure, Step 3
See Ecosystem Services Procedure, Annex B
(continued next page)
Guidance for Demonstrating Ecosystem Services Impacts Download Ecosystem Services Procedure: Impact Demonstration and Market Tools 14
Management activities: actions that contribute to the proposed impact. All actions, whether passive or active, that you take that aim to achieve the proposed impact.
Outputs: the immediate and direct consequences from management activities. An output is a specific (quantified where appropriate), immediate result of the implementation of a management activity.
Outcomes: the direct consequences of the outputs. Outcomes may be linked to one or multiple outputs and can also be referred to as the ‘medium-term results’ towards achieving the selected impact. Outcomes may not be immediate, but rather take some time to materialize.
Impact: maintenance, conservation, enhancement, or restoration of the ecosystem service. The impact is selected from Annex B of the Ecosystem Services Procedure.
Note: for small and low-intensity managed forests it is not necessary to include outputs in the theory of change.
Theory of change quality checklist
❏ The impact is chosen from Annex B of the Ecosystem Services Procedure.
❏ The theory of change provides a logical narrative based on the expected results of the implementation of management activities.
❏ The theory of change truthfully presents the management activities undertaken (management activities are thus formulated in the past and/or the present tense, not the future tense).
❏ All outputs are quantified to the extent possible and the year of realization of each output is included.
❏ Outcomes are formulated as medium-term results (and not as activities or measurable outcome indicators) – something that has been achieved, e.g. decreased water turbidity, reduced hunting pressure.
❏ All outcomes that are necessary to achieve the desired impact are included in the theory of change.
❏ All blocks are correctly connected by arrows.
❏ There is only one activity or result (i.e. management activity, output, outcome, impact) per box.
❏ There is uniformity and consistency in the use of font, colour, and size.
BUILDING A THEORY OF CHANGE
A second approach is to list all management activities that lead to or positively contribute to the selected desired impact and work forwards from there: defining the outputs that result from the implementation of management activities, and subsequently defining the outcomes that link the outputs to the impact.
For every management activity, write down the concrete output that has been realized, quantifying it where appropriate and including the year of realization (e.g. two training activities provided to 18 and 13 employees in 2017; 50 metres of fence constructed in 2016). Be sure to formulate the outcomes as medium-term results (e.g. area of forest protected, knowledge of something has increased) that lead to the selected impact.
Use arrows to connect the various blocks to each other. In most theories of change, there are multiple outcomes that lead to the desired impact and multiple outputthat lead to a certain outcome. You will likely find that you will move up and down the four levels (activities– outputs–outcomes–impact) in constructing the theory of change.
Management activities are implemented in a certain context – a socio-economic, institutional, and biophysical setting.5 Contextual factors may influence the results – the outputs, outcomes, and impact. The Ecosystem Services Procedure requires you to identify these (clause 6.5).
5 Some examples of contextual factors are listed in Annex A of the Ecosystem Services Procedure.
Guidance for Demonstrating Ecosystem Services Impacts Download Ecosystem Services Procedure: Impact Demonstration and Market Tools 15
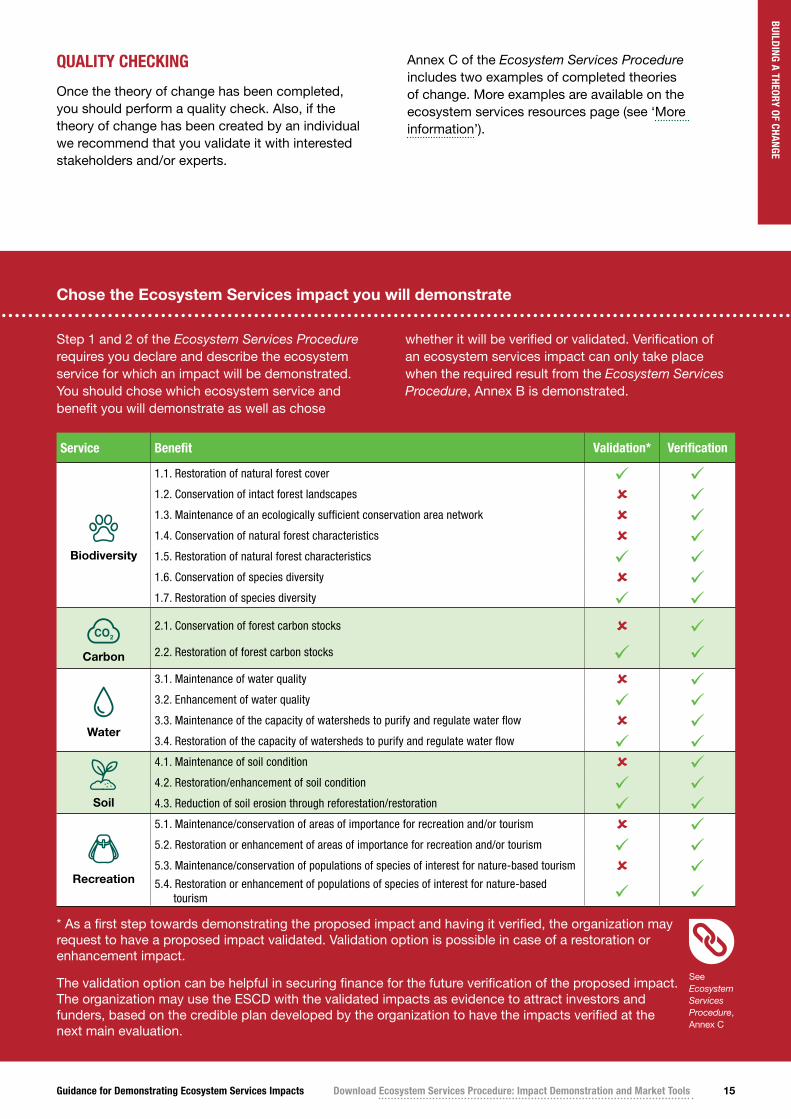
Chose the Ecosystem Services impact you will demonstrate
Step 1 and 2 of the Ecosystem Services Procedure requires you declare and describe the ecosystem service for which an impact will be demonstrated. You should chose which ecosystem service and benefit you will demonstrate as well as chose
whether it will be verified or validated. Verification of an ecosystem services impact can only take place when the required result from the Ecosystem Services Procedure, Annex B is demonstrated.
QUALITY CHECKING
Once the theory of change has been completed, you should perform a quality check. Also, if the theory of change has been created by an individual we recommend that you validate it with interested stakeholders and/or experts.
Annex C of the Ecosystem Services Procedure includes two examples of completed theories of change. More examples are available on the ecosystem services resources page (see ‘More information’).
BUILDING A THEORY OF CHANGE
Service Benefit Validation* Verification
Biodiversity
1.1. Restoration of natural forest cover
1.2. Conservation of intact forest landscapes
1.3. Maintenance of an ecologically sufficient conservation area network
1.4. Conservation of natural forest characteristics
1.5. Restoration of natural forest characteristics
1.6. Conservation of species diversity
1.7. Restoration of species diversity
Carbon
2.1. Conservation of forest carbon stocks
2.2. Restoration of forest carbon stocks
Water
3.1. Maintenance of water quality
3.2. Enhancement of water quality
3.3. Maintenance of the capacity of watersheds to purify and regulate water flow
3.4. Restoration of the capacity of watersheds to purify and regulate water flow
Soil
4.1. Maintenance of soil condition
4.2. Restoration/enhancement of soil condition
4.3. Reduction of soil erosion through reforestation/restoration
Recreation
5.1. Maintenance/conservation of areas of importance for recreation and/or tourism
5.2. Restoration or enhancement of areas of importance for recreation and/or tourism
5.3. Maintenance/conservation of populations of species of interest for nature-based tourism
5.4. Restoration or enhancement of populations of species of interest for nature-based tourism
* As a first step towards demonstrating the proposed impact and having it verified, the organization may request to have a proposed impact validated. Validation option is possible in case of a restoration or enhancement impact.
The validation option can be helpful in securing finance for the future verification of the proposed impact. The organization may use the ESCD with the validated impacts as evidence to attract investors and funders, based on the credible plan developed by the organization to have the impacts verified at the next main evaluation.
See Ecosystem Services Procedure, Annex C
Guidance for Demonstrating Ecosystem Services Impacts Download Ecosystem Services Procedure: Impact Demonstration and Market Tools 16
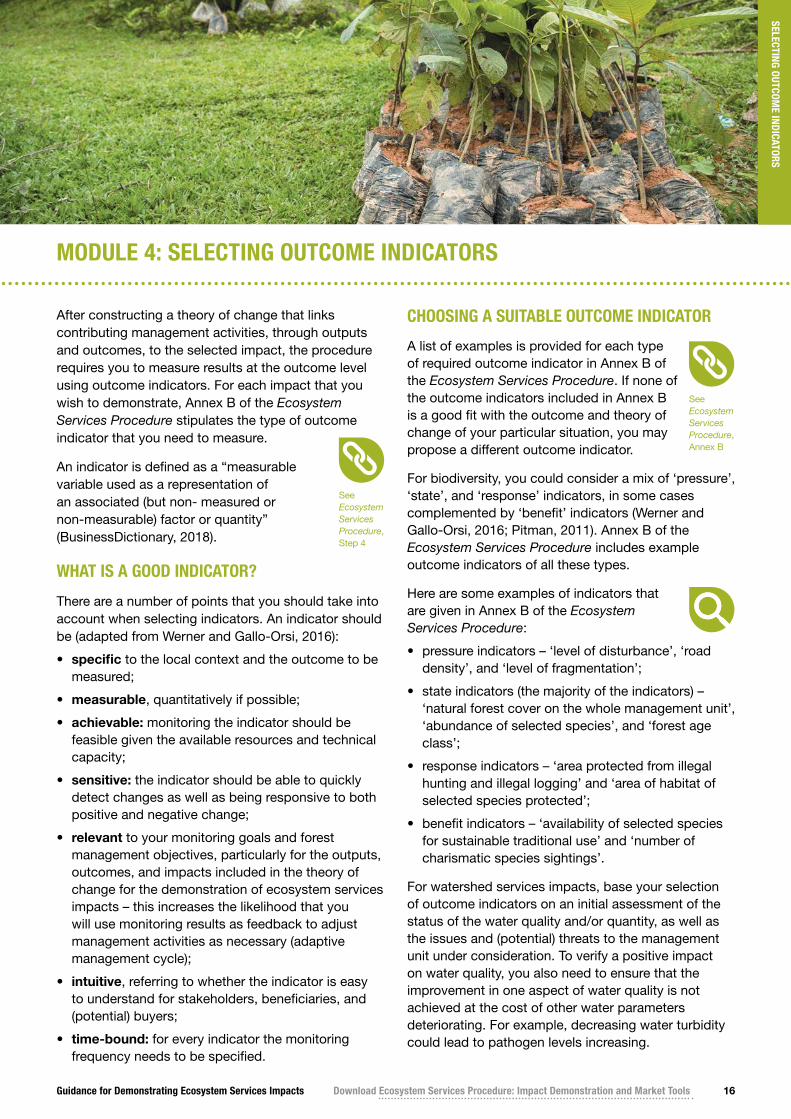
MODULE 4: SELECTING OUTCOME INDICATORS
After constructing a theory of change that links contributing management activities, through outputs and outcomes, to the selected impact, the procedure requires you to measure results at the outcome level using outcome indicators. For each impact that you wish to demonstrate, Annex B of the Ecosystem Services Procedure stipulates the type of outcome indicator that you need to measure.
An indicator is defined as a “measurable variable used as a representation of an associated (but non- measured or non-measurable) factor or quantity” (BusinessDictionary, 2018).
WHAT IS A GOOD INDICATOR?
There are a number of points that you should take into account when selecting indicators. An indicator should be (adapted from Werner and Gallo-Orsi, 2016):
• specific to the local context and the outcome to be measured;
• measurable, quantitatively if possible;
• achievable: monitoring the indicator should be feasible given the available resources and technical capacity;
• sensitive: the indicator should be able to quickly detect changes as well as being responsive to both positive and negative change;
• relevant to your monitoring goals and forest management objectives, particularly for the outputs, outcomes, and impacts included in the theory of change for the demonstration of ecosystem services impacts – this increases the likelihood that you will use monitoring results as feedback to adjust management activities as necessary (adaptive management cycle);
• intuitive, referring to whether the indicator is easy to understand for stakeholders, beneficiaries, and (potential) buyers;
• time-bound: for every indicator the monitoring frequency needs to be specified.
CHOOSING A SUITABLE OUTCOME INDICATOR
A list of examples is provided for each type of required outcome indicator in Annex B of the Ecosystem Services Procedure. If none of the outcome indicators included in Annex B is a good fit with the outcome and theory of change of your particular situation, you may propose a different outcome indicator.
For biodiversity, you could consider a mix of ‘pressure’, ‘state’, and ‘response’ indicators, in some cases complemented by ‘benefit’ indicators (Werner and Gallo-Orsi, 2016; Pitman, 2011). Annex B of the Ecosystem Services Procedure includes example outcome indicators of all these types.
Here are some examples of indicators that are given in Annex B of the Ecosystem Services Procedure:
• pressure indicators – ‘level of disturbance’, ‘road density’, and ‘level of fragmentation’;
• state indicators (the majority of the indicators) – ‘natural forest cover on the whole management unit’, ‘abundance of selected species’, and ‘forest age class’;
• response indicators – ‘area protected from illegal hunting and illegal logging’ and ‘area of habitat of selected species protected’;
• benefit indicators – ‘availability of selected species for sustainable traditional use’ and ‘number of charismatic species sightings’.
For watershed services impacts, base your selection of outcome indicators on an initial assessment of the status of the water quality and/or quantity, as well as the issues and (potential) threats to the management unit under consideration. To verify a positive impact on water quality, you also need to ensure that the improvement in one aspect of water quality is not achieved at the cost of other water parameters deteriorating. For example, decreasing water turbidity could lead to pathogen levels increasing.
SELECTING OUTCOME INDICATORS
See Ecosystem Services Procedure, Step 4
See Ecosystem Services Procedure, Annex B
Guidance for demonstrating ecosystem services impacts 1717
BUILDING A THEORY OF CHANGE
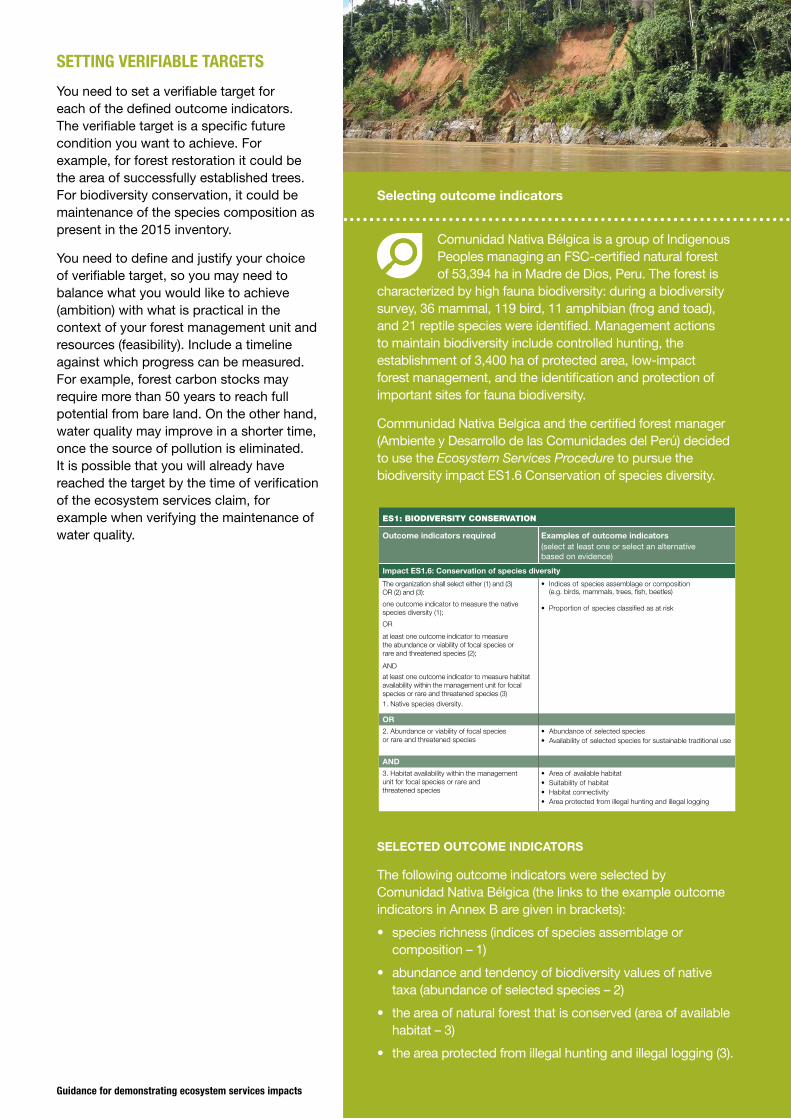
Selecting outcome indicators
Comunidad Nativa Bélgica is a group of Indigenous Peoples managing an FSC-certified natural forest of 53,394 ha in Madre de Dios, Peru. The forest is
characterized by high fauna biodiversity: during a biodiversity survey, 36 mammal, 119 bird, 11 amphibian (frog and toad), and 21 reptile species were identified. Management actions to maintain biodiversity include controlled hunting, the establishment of 3,400 ha of protected area, low-impact forest management, and the identification and protection of important sites for fauna biodiversity.
Communidad Nativa Belgica and the certified forest manager (Ambiente y Desarrollo de las Comunidades del Perú) decided to use the Ecosystem Services Procedure to pursue the biodiversity impact ES1.6 Conservation of species diversity.
SELECTED OUTCOME INDICATORS
The following outcome indicators were selected by Comunidad Nativa Bélgica (the links to the example outcome indicators in Annex B are given in brackets):
• species richness (indices of species assemblage or composition – 1)
• abundance and tendency of biodiversity values of native taxa (abundance of selected species – 2)
• the area of natural forest that is conserved (area of available habitat – 3)
• the area protected from illegal hunting and illegal logging (3).
ES1: BIODIVERSITY CONSERVATION
Outcome indicators required Examples of outcome indicators (select at least one or select an alternative based on evidence)
Impact ES1.6: Conservation of species diversity
The organization shall select either (1) and (3) OR (2) and (3):
one outcome indicator to measure the native species diversity (1);
OR
at least one outcome indicator to measure the abundance or viability of focal species or rare and threatened species (2);
AND
at least one outcome indicator to measure habitat availability within the management unit for focal species or rare and threatened species (3) 1. Native species diversity.
• Indices of species assemblage or composition (e.g. birds, mammals, trees, fish, beetles)
• Proportion of species classified as at risk
OR2. Abundance or viability of focal species or rare and threatened species
• Abundance of selected species• Availability of selected species for sustainable traditional use
AND3. Habitat availability within the management unit for focal species or rare and threatened species
•
Area of available habitat•
Suitability of habitat•
Habitat connectivity•
Area protected from illegal hunting and illegal logging
SETTING VERIFIABLE TARGETS
You need to set a verifiable target for each of the defined outcome indicators. The verifiable target is a specific future condition you want to achieve. For example, for forest restoration it could be the area of successfully established trees. For biodiversity conservation, it could be maintenance of the species composition as present in the 2015 inventory.
You need to define and justify your choice of verifiable target, so you may need to balance what you would like to achieve (ambition) with what is practical in the context of your forest management unit and resources (feasibility). Include a timeline against which progress can be measured. For example, forest carbon stocks may require more than 50 years to reach full potential from bare land. On the other hand, water quality may improve in a shorter time, once the source of pollution is eliminated. It is possible that you will already have reached the target by the time of verification of the ecosystem services claim, for example when verifying the maintenance of water quality.
Guidance for Demonstrating Ecosystem Services Impacts Download Ecosystem Services Procedure: Impact Demonstration and Market Tools 18
MEASURING THE OUTCOM
E INDICATOR
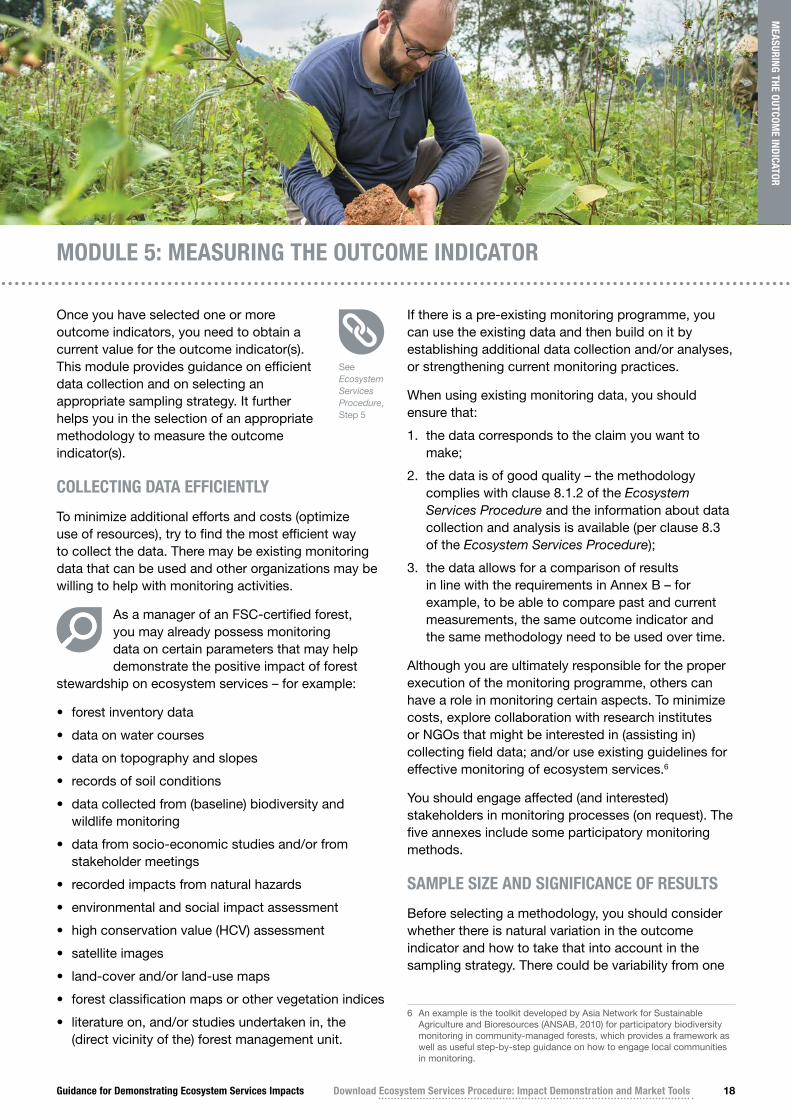
MODULE 5: MEASURING THE OUTCOME INDICATOR
Once you have selected one or more outcome indicators, you need to obtain a current value for the outcome indicator(s). This module provides guidance on efficient data collection and on selecting an appropriate sampling strategy. It further helps you in the selection of an appropriate methodology to measure the outcome indicator(s).
COLLECTING DATA EFFICIENTLY
To minimize additional efforts and costs (optimize use of resources), try to find the most efficient way to collect the data. There may be existing monitoring data that can be used and other organizations may be willing to help with monitoring activities.
As a manager of an FSC-certified forest, you may already possess monitoring data on certain parameters that may help demonstrate the positive impact of forest
stewardship on ecosystem services – for example:
• forest inventory data
• data on water courses
• data on topography and slopes
• records of soil conditions
• data collected from (baseline) biodiversity and wildlife monitoring
• data from socio-economic studies and/or from stakeholder meetings
• recorded impacts from natural hazards
• environmental and social impact assessment
• high conservation value (HCV) assessment
• satellite images
• land-cover and/or land-use maps
• forest classification maps or other vegetation indices
• literature on, and/or studies undertaken in, the (direct vicinity of the) forest management unit.
If there is a pre-existing monitoring programme, you can use the existing data and then build on it by establishing additional data collection and/or analyses, or strengthening current monitoring practices.
When using existing monitoring data, you should ensure that:
1. the data corresponds to the claim you want to make;
2. the data is of good quality – the methodology complies with clause 8.1.2 of the Ecosystem Services Procedure and the information about data collection and analysis is available (per clause 8.3 of the Ecosystem Services Procedure);
3. the data allows for a comparison of results in line with the requirements in Annex B – for example, to be able to compare past and current measurements, the same outcome indicator and the same methodology need to be used over time.
Although you are ultimately responsible for the proper execution of the monitoring programme, others can have a role in monitoring certain aspects. To minimize costs, explore collaboration with research institutes or NGOs that might be interested in (assisting in) collecting field data; and/or use existing guidelines for effective monitoring of ecosystem services.6
You should engage affected (and interested) stakeholders in monitoring processes (on request). The five annexes include some participatory monitoring methods.
SAMPLE SIZE AND SIGNIFICANCE OF RESULTS
Before selecting a methodology, you should consider whether there is natural variation in the outcome indicator and how to take that into account in the sampling strategy. There could be variability from one
6 An example is the toolkit developed by Asia Network for Sustainable Agriculture and Bioresources (ANSAB, 2010) for participatory biodiversity monitoring in community-managed forests, which provides a framework as well as useful step-by-step guidance on how to engage local communities in monitoring.
See Ecosystem Services Procedure, Step 5
Guidance for Demonstrating Ecosystem Services Impacts Download Ecosystem Services Procedure: Impact Demonstration and Market Tools 19
MEASURING THE OUTCOM
E INDICATOR
measurement point to another within the same data collection period (spatial variability). There could also be seasonal, annual, or periodic (e.g. El Niño, La Niña) variability between outcome indicator values (temporal variability). For example, fauna populations typically follow cyclic patterns based on factors such as food availability, climate, predator–prey dynamics, and disease. This natural variation of an outcome indicator entails a risk of being falsely interpreted as a positive or negative change caused by the management activities. However, there are several outcome indicators for which this is not an issue, for example area-based outcome indicators (e.g. area of natural forest cover, area planted), where variability should be low and predictable.
For a positive restoration impact, it is important to ensure that the positive change detected in the outcome indicator value is not within its range of natural variation. For a positive conservation impact, a stable trend may mean that a minor negative change can be accepted if this can be explained by the natural variation (in other words, the interpretation of ‘stable’ includes both minor positive changes and minor negative changes, because of natural variability).
As a general rule, the more samples that are collected the more confidence we can have in the results; and the more variable the measured values, the larger the sample size needs to be. Some methodologies included in the annexes provide guidance on the number of samples that should be taken.
CHOOSING A METHODOLOGY
A number of suitable methodologies are suggested for each of the five ecosystem services:
• biodiversity conservation
• carbon sequestration and storage
• watershed services
• soil conservation
• recreational services.
For each methodology, we give appropriate impacts and example outcome indicators (from Annex B of the Ecosystem Services Procedure), a brief description of the methodology, suitable local contexts, advantages and disadvantages, and where you can find the full methodology manual and/or any background information. No specific recommendations are made regarding the suitability for small and low-intensity managed forests, but certain methodologies have been specifically developed for community forests and for use in developing countries.
The methodologies we provide in this guidance are meant as a resource and the list is not exhaustive. Moreover, not all methodologies can be used everywhere. For these reasons, you can propose a different methodology as long as it is in line with the eligibility criteria as stipulated in the Ecosystem Services Procedure (clause 8.1.2). In evaluating compliance with the procedure, the certification body will assess the suitability of the chosen methodology.
DESCRIBING THE METHODOLOGY
The Box ‘Choosing a methodology’ provides an example of a description of data collection and data analysis.
See Ecosystem Services Procedure, Clause 8.1.2
Guidance for Demonstrating Ecosystem Services Impacts Download Ecosystem Services Procedure: Impact Demonstration and Market Tools 20
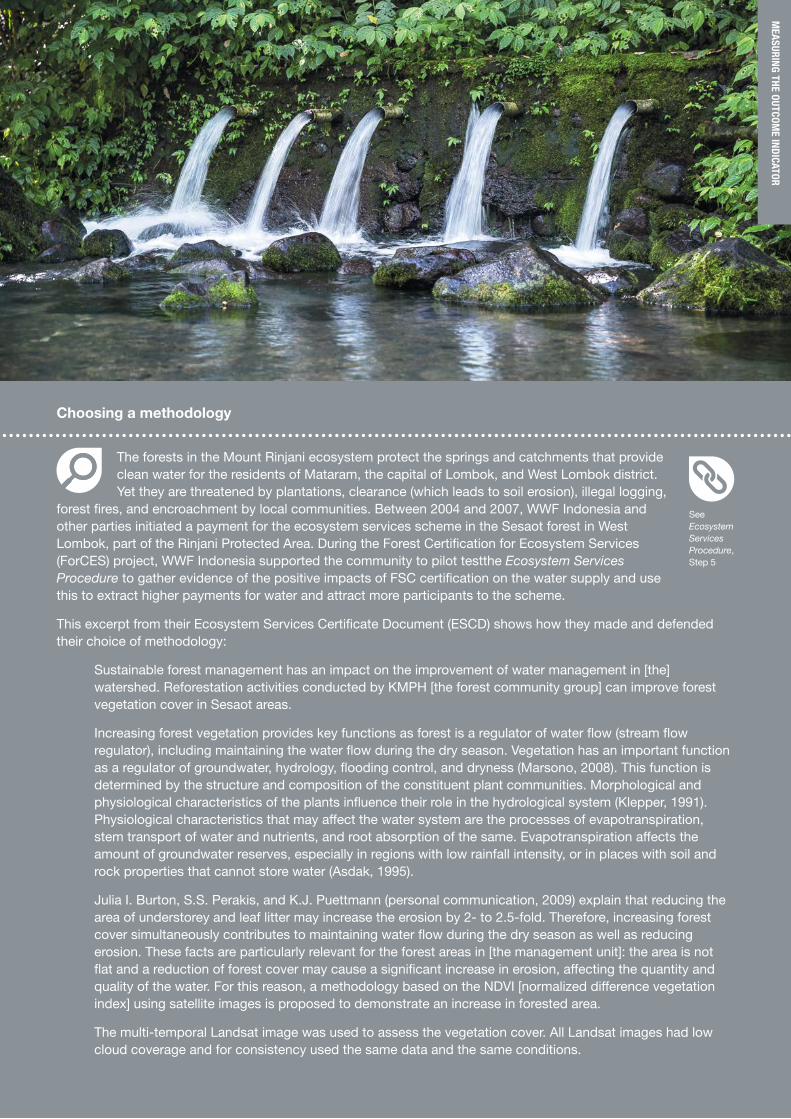
Choosing a methodology
The forests in the Mount Rinjani ecosystem protect the springs and catchments that provide clean water for the residents of Mataram, the capital of Lombok, and West Lombok district. Yet they are threatened by plantations, clearance (which leads to soil erosion), illegal logging,
forest fires, and encroachment by local communities. Between 2004 and 2007, WWF Indonesia and other parties initiated a payment for the ecosystem services scheme in the Sesaot forest in West Lombok, part of the Rinjani Protected Area. During the Forest Certification for Ecosystem Services (ForCES) project, WWF Indonesia supported the community to pilot testthe Ecosystem Services Procedure to gather evidence of the positive impacts of FSC certification on the water supply and use this to extract higher payments for water and attract more participants to the scheme.
This excerpt from their Ecosystem Services Certificate Document (ESCD) shows how they made and defended their choice of methodology:
Sustainable forest management has an impact on the improvement of water management in [the] watershed. Reforestation activities conducted by KMPH [the forest community group] can improve forest vegetation cover in Sesaot areas.
Increasing forest vegetation provides key functions as forest is a regulator of water flow (stream flow regulator), including maintaining the water flow during the dry season. Vegetation has an important function as a regulator of groundwater, hydrology, flooding control, and dryness (Marsono, 2008). This function is determined by the structure and composition of the constituent plant communities. Morphological and physiological characteristics of the plants influence their role in the hydrological system (Klepper, 1991). Physiological characteristics that may affect the water system are the processes of evapotranspiration, stem transport of water and nutrients, and root absorption of the same. Evapotranspiration affects the amount of groundwater reserves, especially in regions with low rainfall intensity, or in places with soil and rock properties that cannot store water (Asdak, 1995).
Julia I. Burton, S.S. Perakis, and K.J. Puettmann (personal communication, 2009) explain that reducing the area of understorey and leaf litter may increase the erosion by 2- to 2.5-fold. Therefore, increasing forest cover simultaneously contributes to maintaining water flow during the dry season as well as reducing erosion. These facts are particularly relevant for the forest areas in [the management unit]: the area is not flat and a reduction of forest cover may cause a significant increase in erosion, affecting the quantity and quality of the water. For this reason, a methodology based on the NDVI [normalized difference vegetation index] using satellite images is proposed to demonstrate an increase in forested area.
The multi-temporal Landsat image was used to assess the vegetation cover. All Landsat images had low cloud coverage and for consistency used the same data and the same conditions.
MEASURING THE OUTCOM
E INDICATOR
See Ecosystem Services Procedure, Step 5
Guidance for Demonstrating Ecosystem Services Impacts Download Ecosystem Services Procedure: Impact Demonstration and Market Tools 21
MODULE 6: DETERMINING THE COMPARISON
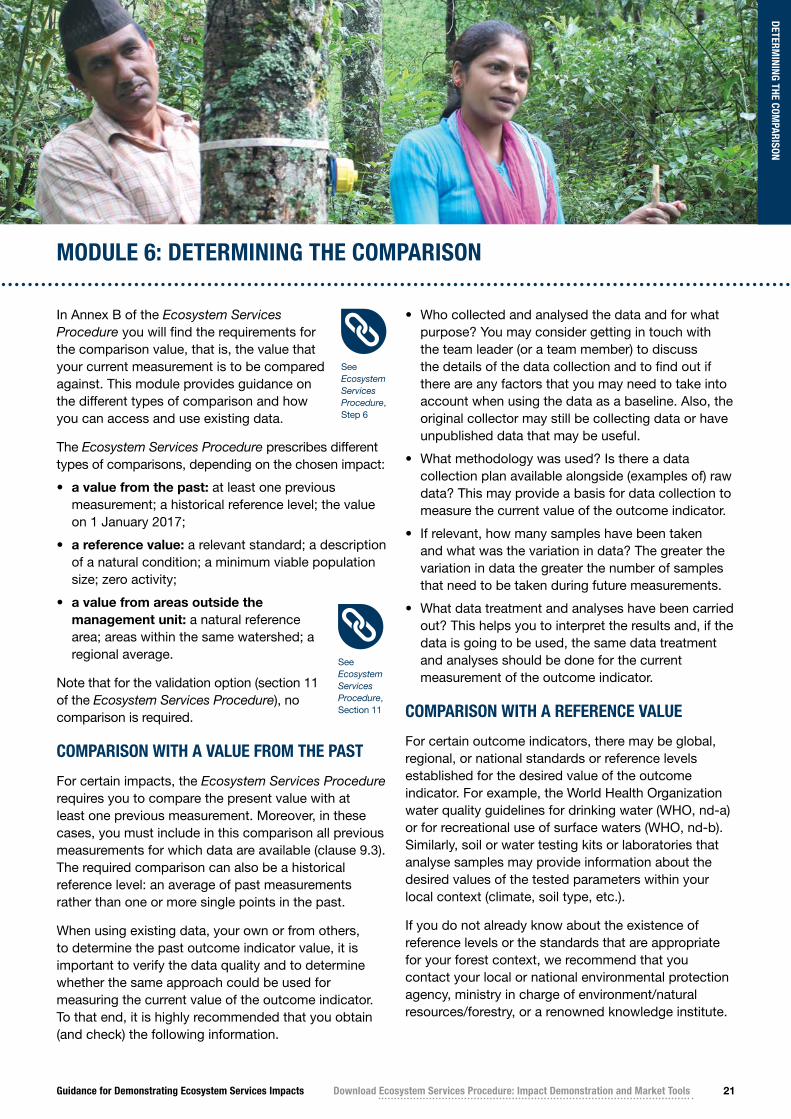
In Annex B of the Ecosystem Services Procedure you will find the requirements for the comparison value, that is, the value that your current measurement is to be compared against. This module provides guidance on the different types of comparison and how you can access and use existing data.
The Ecosystem Services Procedure prescribes different types of comparisons, depending on the chosen impact:
• a value from the past: at least one previous measurement; a historical reference level; the value on 1 January 2017;
• a reference value: a relevant standard; a description of a natural condition; a minimum viable population size; zero activity;
• a value from areas outside the management unit: a natural reference area; areas within the same watershed; a regional average.
Note that for the validation option (section 11 of the Ecosystem Services Procedure), no comparison is required.
COMPARISON WITH A VALUE FROM THE PAST
For certain impacts, the Ecosystem Services Procedure requires you to compare the present value with at least one previous measurement. Moreover, in these cases, you must include in this comparison all previous measurements for which data are available (clause 9.3). The required comparison can also be a historical reference level: an average of past measurements rather than one or more single points in the past.
When using existing data, your own or from others, to determine the past outcome indicator value, it is important to verify the data quality and to determine whether the same approach could be used for measuring the current value of the outcome indicator. To that end, it is highly recommended that you obtain (and check) the following information.
• Who collected and analysed the data and for what purpose? You may consider getting in touch with the team leader (or a team member) to discuss the details of the data collection and to find out if there are any factors that you may need to take into account when using the data as a baseline. Also, the original collector may still be collecting data or have unpublished data that may be useful.
• What methodology was used? Is there a data collection plan available alongside (examples of) raw data? This may provide a basis for data collection to measure the current value of the outcome indicator.
• If relevant, how many samples have been taken and what was the variation in data? The greater the variation in data the greater the number of samples that need to be taken during future measurements.
• What data treatment and analyses have been carried out? This helps you to interpret the results and, if the data is going to be used, the same data treatment and analyses should be done for the current measurement of the outcome indicator.
COMPARISON WITH A REFERENCE VALUE
For certain outcome indicators, there may be global, regional, or national standards or reference levels established for the desired value of the outcome indicator. For example, the World Health Organization water quality guidelines for drinking water (WHO, nd-a) or for recreational use of surface waters (WHO, nd-b). Similarly, soil or water testing kits or laboratories that analyse samples may provide information about the desired values of the tested parameters within your local context (climate, soil type, etc.).
If you do not already know about the existence of reference levels or the standards that are appropriate for your forest context, we recommend that you contact your local or national environmental protection agency, ministry in charge of environment/natural resources/forestry, or a renowned knowledge institute.
DETERMINING THE COM
PARISON
See Ecosystem Services Procedure, Step 6
See Ecosystem Services Procedure, Section 11
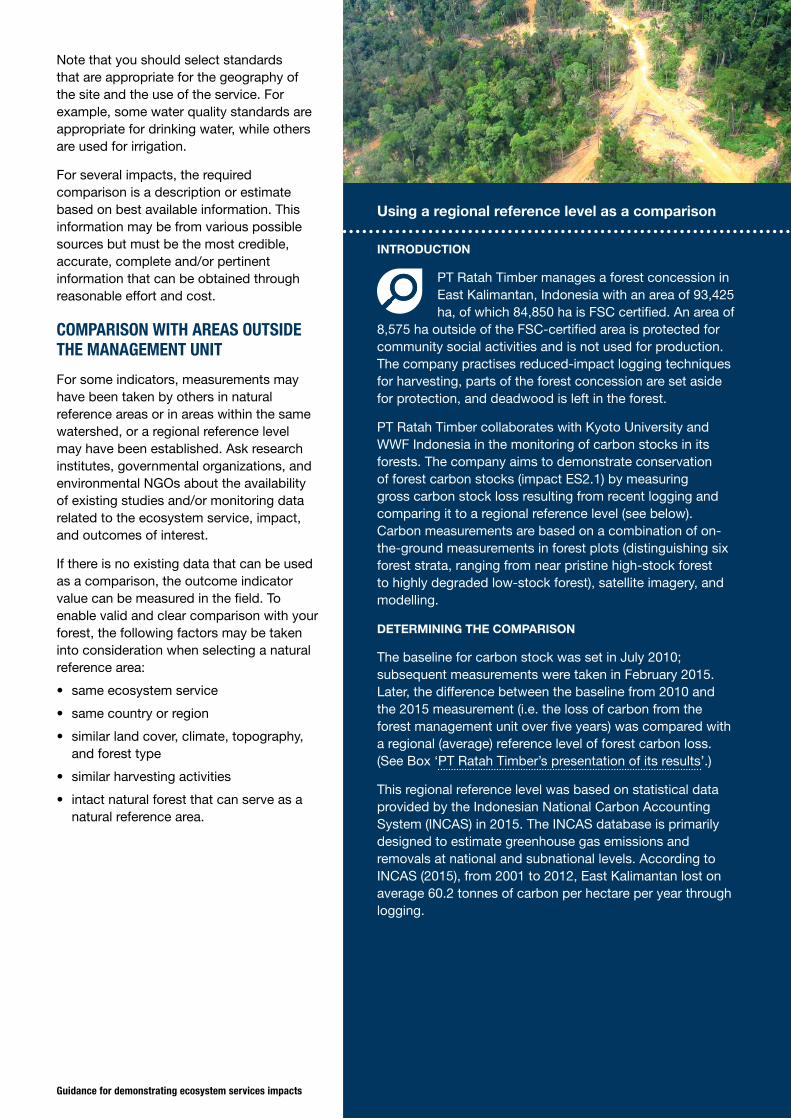
Guidance for demonstrating ecosystem services impacts 22
Using a regional reference level as a comparison
INTRODUCTION
PT Ratah Timber manages a forest concession in East Kalimantan, Indonesia with an area of 93,425 ha, of which 84,850 ha is FSC certified. An area of
8,575 ha outside of the FSC-certified area is protected for community social activities and is not used for production. The company practises reduced-impact logging techniques for harvesting, parts of the forest concession are set aside for protection, and deadwood is left in the forest.
PT Ratah Timber collaborates with Kyoto University and WWF Indonesia in the monitoring of carbon stocks in its forests. The company aims to demonstrate conservation of forest carbon stocks (impact ES2.1) by measuring gross carbon stock loss resulting from recent logging and comparing it to a regional reference level (see below). Carbon measurements are based on a combination of on- the-ground measurements in forest plots (distinguishing six forest strata, ranging from near pristine high-stock forest to highly degraded low-stock forest), satellite imagery, and modelling.
DETERMINING THE COMPARISON
The baseline for carbon stock was set in July 2010; subsequent measurements were taken in February 2015. Later, the difference between the baseline from 2010 and the 2015 measurement (i.e. the loss of carbon from the forest management unit over five years) was compared with a regional (average) reference level of forest carbon loss. (See Box ‘PT Ratah Timber’s presentation of its results’.)
This regional reference level was based on statistical data provided by the Indonesian National Carbon Accounting System (INCAS) in 2015. The INCAS database is primarily designed to estimate greenhouse gas emissions and removals at national and subnational levels. According to INCAS (2015), from 2001 to 2012, East Kalimantan lost on average 60.2 tonnes of carbon per hectare per year through logging.
Note that you should select standards that are appropriate for the geography of the site and the use of the service. For example, some water quality standards are appropriate for drinking water, while others are used for irrigation.
For several impacts, the required comparison is a description or estimate based on best available information. This information may be from various possible sources but must be the most credible, accurate, complete and/or pertinent information that can be obtained through reasonable effort and cost.
COMPARISON WITH AREAS OUTSIDE THE MANAGEMENT UNIT
For some indicators, measurements may have been taken by others in natural reference areas or in areas within the same watershed, or a regional reference level may have been established. Ask research institutes, governmental organizations, and environmental NGOs about the availability of existing studies and/or monitoring data related to the ecosystem service, impact, and outcomes of interest.
If there is no existing data that can be used as a comparison, the outcome indicator value can be measured in the field. To enable valid and clear comparison with your forest, the following factors may be taken into consideration when selecting a natural reference area:
• same ecosystem service
• same country or region
• similar land cover, climate, topography, and forest type
• similar harvesting activities
• intact natural forest that can serve as a natural reference area.

Guidance for Demonstrating Ecosystem Services Impacts Download Ecosystem Services Procedure: Impact Demonstration and Market Tools 23
MODULE 7: RESULTS
In Annex B of the Ecosystem Services Procedure you will find the requirements for the comparison value and the required result. This module will help you present your results and draw conclusions. Note that for the validation option (section 11 of the Ecosystem Services Procedure) you need only the initial measurement value of the outcome indicator; a comparison and a result are not needed.
PRESENTING YOUR RESULTSThe outcome indicator values for the comparison and the current measurement need to be comparable; in other words, the values need to be in the same units of measurement and at the same level of precision (e.g. for units, kg and kg rather than kg and tonnes; for precision, 3.48 and 4.85 instead of 3.4778 and 5).
Whenever there is data available over a longer period of time that allows for comparison, it is better to include multiple values and to show a trend over time rather than comparing data from just two points in time. Where possible, use a graph or table. Maps and/or photos can also powerfully convey useful information and can be part of the evidence to demonstrate a positive impact on ecosystem services. You should describe and explain the results.
Finally, you need to formulate a conclusion about the observed results for each of the outcome indicators separately, plus an overall conclusion regarding the selected impact based on the combination of results.
Besides comparing the comparison value with the current outcome indicator value, describe progress towards the verifiable target, including whether
RESULTS
PT Ratah Timber’s presentation of its results
INTRODUCTION
PT Ratah Timber manages a forest concession in East Kalimantan, Indonesia with an area of 93,425 ha, of which 84,850 ha is FSC certified. An area of 8,575 ha outside of
the FSC-certified area is protected for community social activities and is not used for production. The company practises reduced-impact logging techniques for harvesting; parts of the forest concession are set aside for protection; and deadwood is left in the forest.
PT Ratah Timber collaborates with Kyoto University and WWF Indonesia in the monitoring of carbon stocks in its forests. The company aims to demonstrate the conservation of forest carbon stocks (impact ES2.1) by measuring gross carbon stock loss resulting from recent logging and comparing it to a regional reference level (see Box ‘Using a regional reference level as a comparison’). Carbon measurements are based on a combination of on-the-ground measurements in forest plots (distinguishing six forest strata, ranging from near pristine high-stock forest to highly degraded low-stock forest), satellite imagery, and modelling.
HOW RATAH TIMBER PRESENTED THEIR RESULTS
Measurements in the forest showed a decrease in average carbon stock between 2010 and 2015 by 10 t/ha, excluding the eastern area (i.e. in the FSC-certified areas only), and by 2.8 t/ha including the eastern areas
(continued next page)
See Ecosystem Services Procedure, Step 7
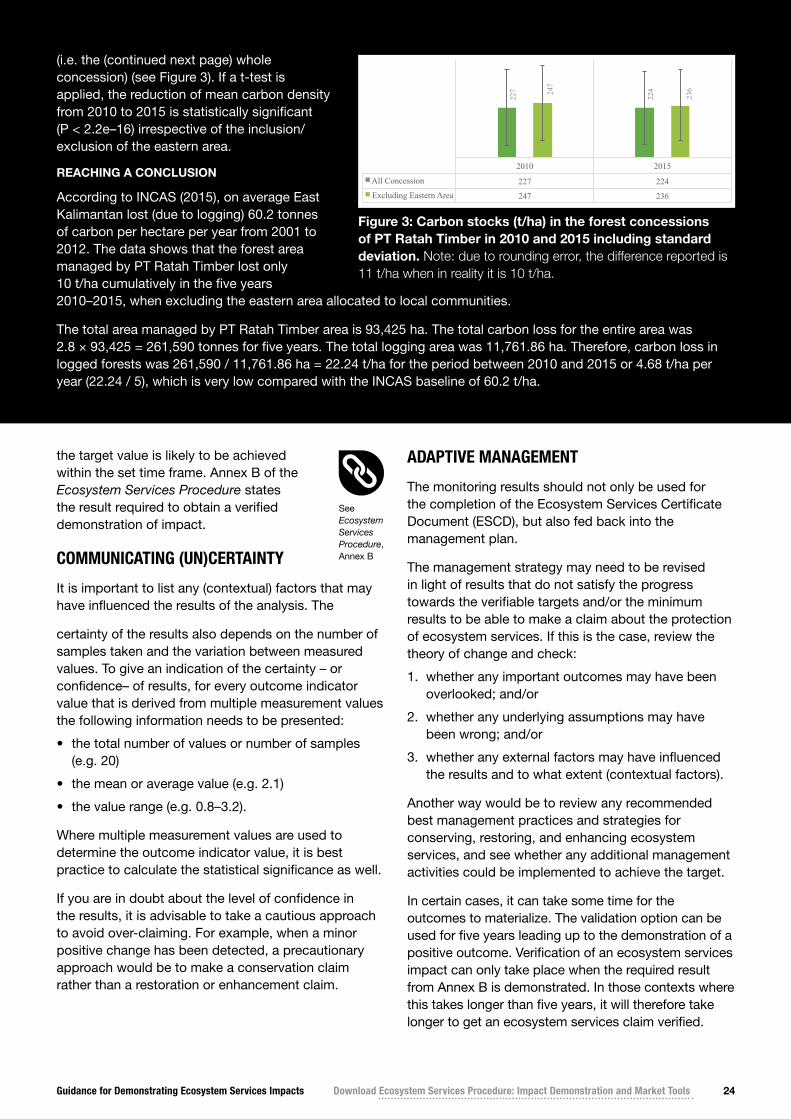
Guidance for Demonstrating Ecosystem Services Impacts Download Ecosystem Services Procedure: Impact Demonstration and Market Tools 24
the target value is likely to be achieved within the set time frame. Annex B of the Ecosystem Services Procedure states the result required to obtain a verified demonstration of impact.
COMMUNICATING (UN)CERTAINTY
It is important to list any (contextual) factors that may have influenced the results of the analysis. The
certainty of the results also depends on the number of samples taken and the variation between measured values. To give an indication of the certainty – or confidence– of results, for every outcome indicator value that is derived from multiple measurement values the following information needs to be presented:
• the total number of values or number of samples (e.g. 20)
• the mean or average value (e.g. 2.1)
• the value range (e.g. 0.8–3.2).
Where multiple measurement values are used to determine the outcome indicator value, it is best practice to calculate the statistical significance as well.
If you are in doubt about the level of confidence in the results, it is advisable to take a cautious approach to avoid over-claiming. For example, when a minor positive change has been detected, a precautionary approach would be to make a conservation claim rather than a restoration or enhancement claim.
ADAPTIVE MANAGEMENT
The monitoring results should not only be used for the completion of the Ecosystem Services Certificate Document (ESCD), but also fed back into the management plan.
The management strategy may need to be revised in light of results that do not satisfy the progress towards the verifiable targets and/or the minimum results to be able to make a claim about the protection of ecosystem services. If this is the case, review the theory of change and check:
1. whether any important outcomes may have been overlooked; and/or
2. whether any underlying assumptions may have been wrong; and/or
3. whether any external factors may have influenced the results and to what extent (contextual factors).
Another way would be to review any recommended best management practices and strategies for conserving, restoring, and enhancing ecosystem services, and see whether any additional management activities could be implemented to achieve the target.
In certain cases, it can take some time for the outcomes to materialize. The validation option can be used for five years leading up to the demonstration of a positive outcome. Verification of an ecosystem services impact can only take place when the required result from Annex B is demonstrated. In those contexts where this takes longer than five years, it will therefore take longer to get an ecosystem services claim verified.
(i.e. the (continued next page) whole concession) (see Figure 3). If a t-test is applied, the reduction of mean carbon density from 2010 to 2015 is statistically significant (P < 2.2e–16) irrespective of the inclusion/ exclusion of the eastern area.
REACHING A CONCLUSION
According to INCAS (2015), on average East Kalimantan lost (due to logging) 60.2 tonnes of carbon per hectare per year from 2001 to 2012. The data shows that the forest area managed by PT Ratah Timber lost only 10 t/ha cumulatively in the five years 2010–2015, when excluding the eastern area allocated to local communities.
The total area managed by PT Ratah Timber area is 93,425 ha. The total carbon loss for the entire area was 2.8 × 93,425 = 261,590 tonnes for five years. The total logging area was 11,761.86 ha. Therefore, carbon loss in logged forests was 261,590 / 11,761.86 ha = 22.24 t/ha for the period between 2010 and 2015 or 4.68 t/ha per year (22.24 / 5), which is very low compared with the INCAS baseline of 60.2 t/ha.
2010 2015
All Concession 227 224 Excluding Eastern Area 247 236
227
224 24
7
236
Figure 3: Carbon stocks (t/ha) in the forest concessions of PT Ratah Timber in 2010 and 2015 including standard deviation. Note: due to rounding error, the difference reported is 11 t/ha when in reality it is 10 t/ha.
See Ecosystem Services Procedure, Annex B
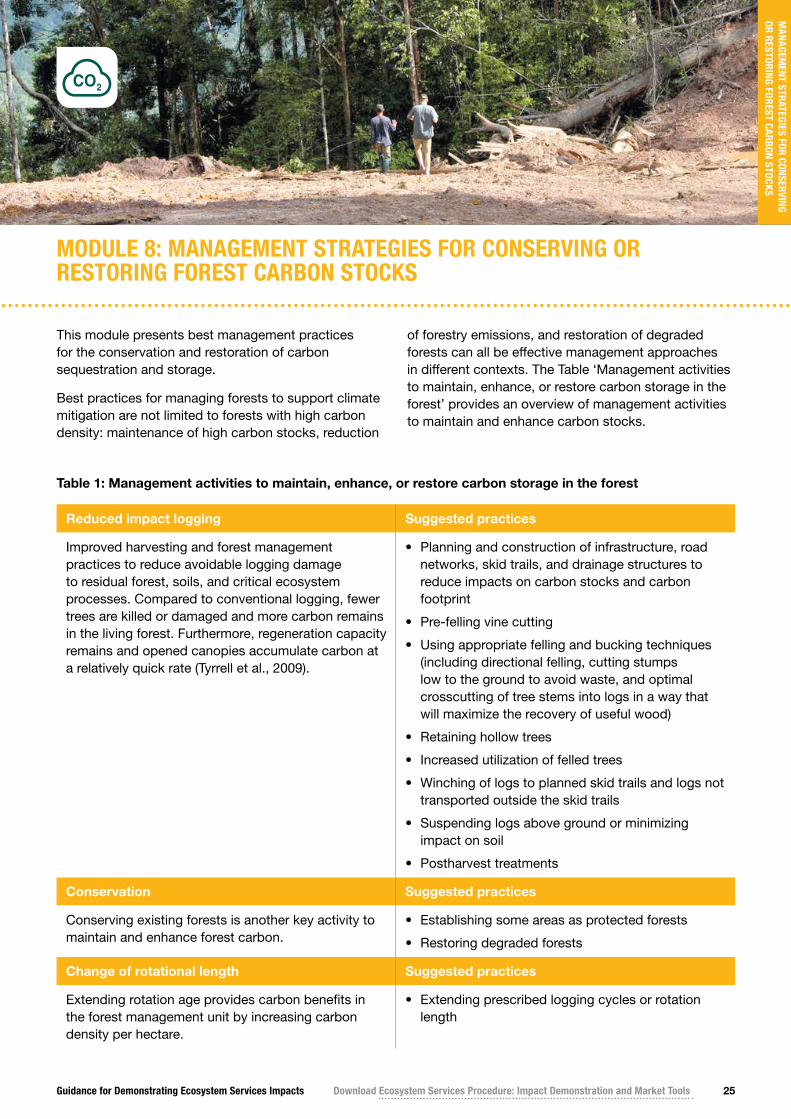
Guidance for Demonstrating Ecosystem Services Impacts Download Ecosystem Services Procedure: Impact Demonstration and Market Tools 25
MANAGEM
ENT STRATEGIES FOR CONSERVING OR RESTORING FOREST CARBON STOCKS
Table 1: Management activities to maintain, enhance, or restore carbon storage in the forest
Reduced impact logging Suggested practices
Improved harvesting and forest management practices to reduce avoidable logging damage to residual forest, soils, and critical ecosystem processes. Compared to conventional logging, fewer trees are killed or damaged and more carbon remains in the living forest. Furthermore, regeneration capacity remains and opened canopies accumulate carbon at a relatively quick rate (Tyrrell et al., 2009).
• Planning and construction of infrastructure, road networks, skid trails, and drainage structures to reduce impacts on carbon stocks and carbon footprint
• Pre-felling vine cutting
• Using appropriate felling and bucking techniques (including directional felling, cutting stumps low to the ground to avoid waste, and optimal crosscutting of tree stems into logs in a way that will maximize the recovery of useful wood)
• Retaining hollow trees
• Increased utilization of felled trees
• Winching of logs to planned skid trails and logs not transported outside the skid trails
• Suspending logs above ground or minimizing impact on soil
• Postharvest treatments
Conservation Suggested practices
Conserving existing forests is another key activity to maintain and enhance forest carbon.
• Establishing some areas as protected forests
• Restoring degraded forests
Change of rotational length Suggested practices
Extending rotation age provides carbon benefits in the forest management unit by increasing carbon density per hectare.
• Extending prescribed logging cycles or rotation length
MODULE 8: MANAGEMENT STRATEGIES FOR CONSERVING OR RESTORING FOREST CARBON STOCKS
This module presents best management practices for the conservation and restoration of carbon sequestration and storage.
Best practices for managing forests to support climate mitigation are not limited to forests with high carbon density: maintenance of high carbon stocks, reduction
of forestry emissions, and restoration of degraded forests can all be effective management approaches in different contexts. The Table ‘Management activities to maintain, enhance, or restore carbon storage in the forest’ provides an overview of management activities to maintain and enhance carbon stocks.
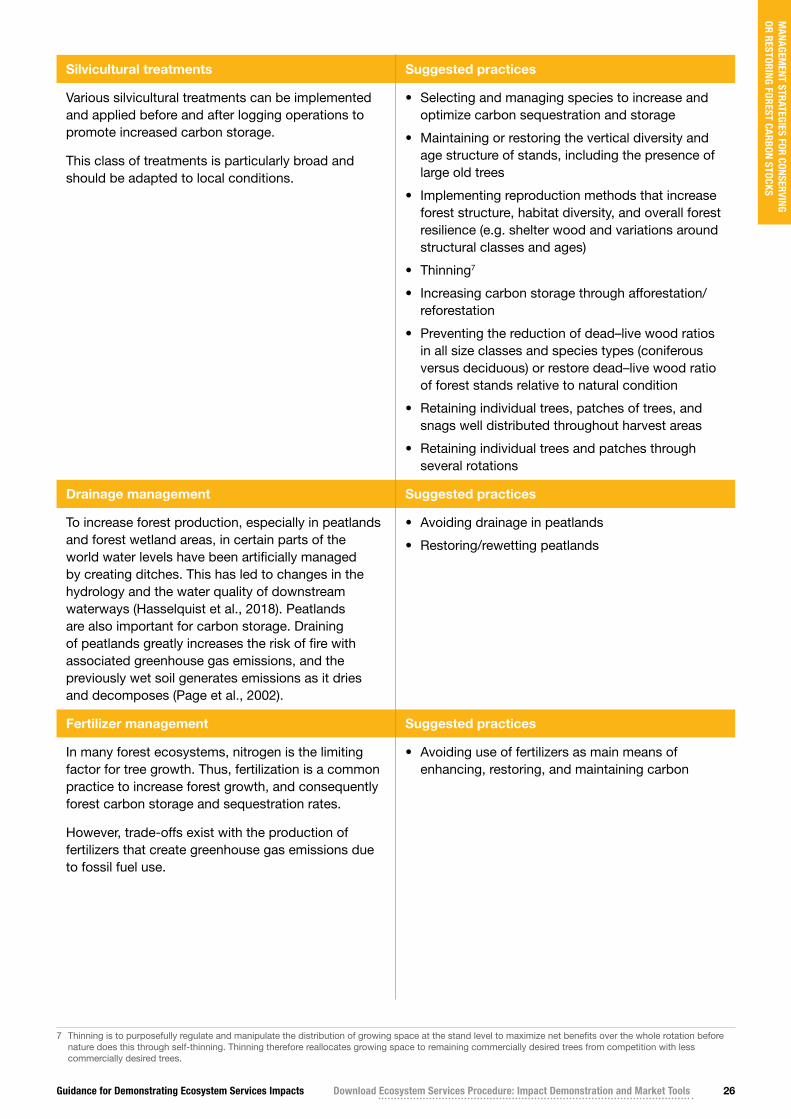
Guidance for Demonstrating Ecosystem Services Impacts Download Ecosystem Services Procedure: Impact Demonstration and Market Tools 26
Silvicultural treatments Suggested practices
Various silvicultural treatments can be implemented and applied before and after logging operations to promote increased carbon storage.
This class of treatments is particularly broad and should be adapted to local conditions.
• Selecting and managing species to increase and optimize carbon sequestration and storage
• Maintaining or restoring the vertical diversity and age structure of stands, including the presence of large old trees
• Implementing reproduction methods that increase forest structure, habitat diversity, and overall forest resilience (e.g. shelter wood and variations around structural classes and ages)
• Thinning7
• Increasing carbon storage through afforestation/ reforestation
• Preventing the reduction of dead–live wood ratios in all size classes and species types (coniferous versus deciduous) or restore dead–live wood ratio of forest stands relative to natural condition
• Retaining individual trees, patches of trees, and snags well distributed throughout harvest areas
• Retaining individual trees and patches through several rotations
Drainage management Suggested practices
To increase forest production, especially in peatlands and forest wetland areas, in certain parts of the world water levels have been artificially managed by creating ditches. This has led to changes in the hydrology and the water quality of downstream waterways (Hasselquist et al., 2018). Peatlands are also important for carbon storage. Draining of peatlands greatly increases the risk of fire with associated greenhouse gas emissions, and the previously wet soil generates emissions as it dries and decomposes (Page et al., 2002).
• Avoiding drainage in peatlands
• Restoring/rewetting peatlands
Fertilizer management Suggested practices
In many forest ecosystems, nitrogen is the limiting factor for tree growth. Thus, fertilization is a common practice to increase forest growth, and consequently forest carbon storage and sequestration rates.
However, trade-offs exist with the production of fertilizers that create greenhouse gas emissions due to fossil fuel use.
• Avoiding use of fertilizers as main means of enhancing, restoring, and maintaining carbon
7 Thinning is to purposefully regulate and manipulate the distribution of growing space at the stand level to maximize net benefits over the whole rotation before nature does this through self-thinning. Thinning therefore reallocates growing space to remaining commercially desired trees from competition with less commercially desired trees.
MANAGEM
ENT STRATEGIES FOR CONSERVING OR RESTORING FOREST CARBON STOCKS

Guidance for Demonstrating Ecosystem Services Impacts Download Ecosystem Services Procedure: Impact Demonstration and Market Tools 27
MANAGEM
ENT STRATEGIES FOR CONSERVING OR RESTORING FOREST CARBON STOCKS
Fire management Suggested practices
Reducing the risk of fire is a good strategy to reduce overall carbon loss in the long term.
• Developing a fire management plan, including a fire detection and communication plan
• Developing fire awareness, preparedness, and education programme for workers and other relevant stakeholders that may be affected by fires
• Implementing pre-fire season activities to reduce the risk of fire (e.g. infrastructure planning, fuel load removal, planned fires)
• Restoring burned areas

Guidance for Demonstrating Ecosystem Services Impacts Download Ecosystem Services Procedure: Impact Demonstration and Market Tools 28
MORE INFORM
ATION
MORE INFORMATION
You can find more information on the FSC ecosystem services web page for forest managers and the FSC ecosystem services web page for buyers, which is regularly updated. Information includes, but is not limited to:
• a template of the Ecosystem Services Certificate Document (ESCD) in Microsoft Word format
• examples of ESCDs with approved ecosystem services claims
• examples of business models, and trademark use.
Guidance for Demonstrating Ecosystem Services Impacts Download Ecosystem Services Procedure: Impact Demonstration and Market Tools 29
FOREST INTEGRITY ASSESSMENT TOOL
Impacts
ES1.1: Restoration of natural forest cover
ES1.3: Maintenance of an ecologically sufficient conservation area network
ES1.4: Conservation of natural forest characteristics
ES1.5: Restoration of natural forest characteristics
ES1.6: Conservation of species diversity
ES1.7: Restoration of species diversity
ES4.3: Reduction of soil erosion through reforestation/restoration
ES5.3: Maintenance/conservation of populations of species of interest for nature-based tourism
ES5.4: Restoration or enhancement of populations of species of interest for nature-based tourism
Example outcome indicators
• Forest or ecosystem structure
• Amount of standing and fallen deadwood (and/or other important natural microhabitats)
• Presence of natural environmental values
• Suitability of habitat (for selected species)
• Level of disturbance
• Road density
• All area-based biodiversity indicators for which you would like to add a qualitative measure, for example:
- Natural forest cover in the whole management unit
- Area of available habitat
- Area protected from illegal hunting and illegal logging
Description
The Forest Integrity Assessment (FIA) tool is a simple and user-friendly checklist approach developed by the HCV Resource Network in 2016 (SHARP programme and HCV Resource Network, 2016). Assessments focus on habitats as indirect proxies for biodiversity rather than on species, using natural forest types little affected by large- scale human activities as reference.
Regionally adapted field forms with sets of yes/no scoring questions guide and standardize the assessments, adding up to a numerical value of forest integrity. Questions are formulated to address forest elements and features as they occur on a relatively limited assessment area, typically plots of 0.25–1 ha (the actual size
MODULE 9: METHODOLOGIES FOR MEASURING BIODIVERSITY CONSERVATION
METHODOLOGIES FOR M
EASURING BIODIVERSITY CONSERVATION
Guidance for Demonstrating Ecosystem Services Impacts Download Ecosystem Services Procedure: Impact Demonstration and Market Tools 30
depends on the visibility in the particular forest). The proposed sampling strategy is based on stratification of the forest and subsequent selection of plots along transect lines.
Field forms divide scoring questions into four sections:
1. structure and composition (tree size, regeneration, trees important for biodiversity, coarse woody debris, fire, other elements);
2. impacts and threats (commercial trees, visibility, invasive species, illegal hunting/poaching, logging, human forest clearing, accessibility);
3. focal habitats;
4. focal species (endemic to the area; rare, threatened, or endangered; or collected for traditional or medicinal purposes).
The FIA manual also has a section on evaluating the results and calculating the scores, including showing trends over time. Data analysis can be done using Microsoft Excel.
Reasonably consistent results are achieved after basic training. Smallholders may learn how to assess and monitor their woodlots during a day of field training. A couple of days may be needed to train people to consistently sample and monitor larger forests.
Suitable local contexts
The approach is applicable both to larger forests and to remnant forest patches interspersed in agricultural and forestry landscapes.
The FIA manual is available in English, French, Spanish, Portuguese, and Indonesian.
Regional or national adaptation aims to further modify a generic template or adapt an already existing version for use in another region or country with similar forest types.
Regional/national adaptations (field forms) are available for:
• Chile (Valdivia moist temperate forest, dual forest types)
• Indonesia (lowland tropical forest peatlands and mineral soils, coming soon)
• Greater Mekong region (moist forest, dry forest)
• Panama (moist forest)
• Sabah (moist forest)
• Scandinavia
• United States of America (Pacific Northwest, south-east)
Advantages Disadvantages
• Can be used by non-experts after basic training.
• Both data collection and data analysis are relatively easy.
• No precise population data, due to the presence/ absence character of the methodology.
Access
SHARP programme and HCV Resource Network (2016) available at https://hcvnetwork.org/library/forest-integrity-assessment-tool/
METHODOLOGIES FOR M
EASURING BIODIVERSITY CONSERVATION
Guidance for Demonstrating Ecosystem Services Impacts Download Ecosystem Services Procedure: Impact Demonstration and Market Tools 31
FOREST INTACTNESS INDEX
Impacts
ES1.1: Restoration of natural forest cover
ES1.4: Conservation of natural forest characteristics
ES1.5: Restoration of natural forest characteristics
ES1.6: Conservation of species diversity
ES1.7: Restoration of species diversity
ES3.3: Maintenance of the capacity of watersheds to purify and regulate water flow
ES3.4: Restoration of the capacity of watersheds to purify and regulate water flow
ES4.1: Maintenance of soil condition
ES4.2: Restoration/enhancement of soil condition
Example outcome indicators
• Degraded forest area as a proportion of total land area
• Native species assemblage (trees)
• Proportion of native tree species
• Indices of species assemblage or composition (trees)
• Proportion/percentage of land that is degraded over total land area
• Percentage of forest cover (in the relevant watershed) in undisturbed condition
Description
The Forest Intactness Index (FII) is a simple quantitative index, indicating the degree of forest intactness/ degradation of a given stand in terms of the similarity/dissimilarity with the most pristine forest in a given management unit. The methodology is based on the ecological principle that logging directly influences tree- species (genus) assemblages. Combined with remote-sensing analysis, FII can be extrapolated to the entire landscape of the management unit as a map of forest ‘intactness’.
The FII methodology is termed BOLEH (Biodiversity Observation for Land and Ecosystem Health), developed by the Kyoto University Forest Ecology Lab. The method consists of fieldwork, analysis, and spatial extrapolation. A total of 50 circular plots (20-m radius each) are placed over an entire management unit with a stratified random design. Tree genera (not necessarily species) are identified and the diameters at breast height (DBH) are measured for all trees DBH > 10 cm. A numerical analysis is applied to the obtained data to derive the FII of each plot. Subsequently, FIIs outside the 50 plots are estimated using Landsat satellite imagery with a special extrapolation technique. Thus, it is possible to depict the FIIs of the entire area of a management unit.
Experiences with this methodology have shown that a team of five workers can generally finish all the fieldwork within one month without expert assistance. With repeated applications of this method to the same management unit at an extended time interval (e.g. five years), one can evaluate the spatial–temporal changes of forest intactness/ degradation due to forest management.
One of the advantages of this method is that responsible foresters can quantitatively verify biodiversity enhancement as an increment of mean FII values in their management units. Furthermore, carbon stock can be derived from the same dataset with an additional analysis. This method can be used to assess the bundle of biodiversity and carbon-stock services.
The FII manual has sections for adequate field sampling, numerical analyses, and remote-sensing analyses
Suitable local contexts
The FII methodology (BOLEH) has been developed primarily for the lowland dipterocarp production forests of South-East Asia, but not for plantation forests. The lead author indicates that it can be applicable to any natural production forests in any climate zones, where logging is the major driver of the conversion of tree-species composition.
METHODOLOGIES FOR M
EASURING BIODIVERSITY CONSERVATION
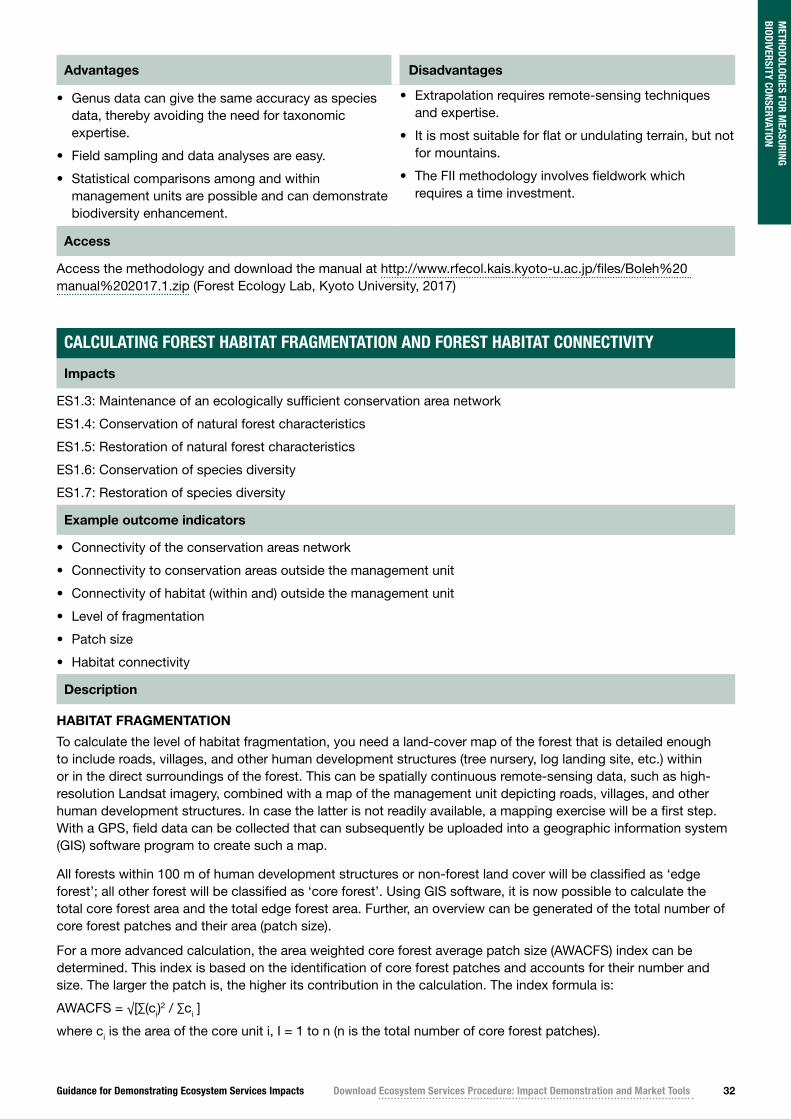
Guidance for Demonstrating Ecosystem Services Impacts Download Ecosystem Services Procedure: Impact Demonstration and Market Tools 32
METHODOLOGIES FOR M
EASURING BIODIVERSITY CONSERVATION
Advantages Disadvantages
• Genus data can give the same accuracy as species data, thereby avoiding the need for taxonomic expertise.
• Field sampling and data analyses are easy.
• Statistical comparisons among and within management units are possible and can demonstrate biodiversity enhancement.
• Extrapolation requires remote-sensing techniques and expertise.
• It is most suitable for flat or undulating terrain, but not for mountains.
• The FII methodology involves fieldwork which requires a time investment.
Access
Access the methodology and download the manual at http://www.rfecol.kais.kyoto-u.ac.jp/files/Boleh%20 manual%202017.1.zip (Forest Ecology Lab, Kyoto University, 2017)
CALCULATING FOREST HABITAT FRAGMENTATION AND FOREST HABITAT CONNECTIVITY
Impacts
ES1.3: Maintenance of an ecologically sufficient conservation area network
ES1.4: Conservation of natural forest characteristics
ES1.5: Restoration of natural forest characteristics
ES1.6: Conservation of species diversity
ES1.7: Restoration of species diversity
Example outcome indicators
• Connectivity of the conservation areas network
• Connectivity to conservation areas outside the management unit
• Connectivity of habitat (within and) outside the management unit
• Level of fragmentation
• Patch size
• Habitat connectivity
Description
HABITAT FRAGMENTATION
To calculate the level of habitat fragmentation, you need a land-cover map of the forest that is detailed enough to include roads, villages, and other human development structures (tree nursery, log landing site, etc.) within or in the direct surroundings of the forest. This can be spatially continuous remote-sensing data, such as high-resolution Landsat imagery, combined with a map of the management unit depicting roads, villages, and other human development structures. In case the latter is not readily available, a mapping exercise will be a first step. With a GPS, field data can be collected that can subsequently be uploaded into a geographic information system (GIS) software program to create such a map.
All forests within 100 m of human development structures or non-forest land cover will be classified as ‘edge forest’; all other forest will be classified as ‘core forest’. Using GIS software, it is now possible to calculate the total core forest area and the total edge forest area. Further, an overview can be generated of the total number of core forest patches and their area (patch size).
For a more advanced calculation, the area weighted core forest average patch size (AWACFS) index can be determined. This index is based on the identification of core forest patches and accounts for their number and size. The larger the patch is, the higher its contribution in the calculation. The index formula is:
AWACFS = √[∑(ci)2 / ∑ci ]
where ci is the area of the core unit i, I = 1 to n (n is the total number of core forest patches).
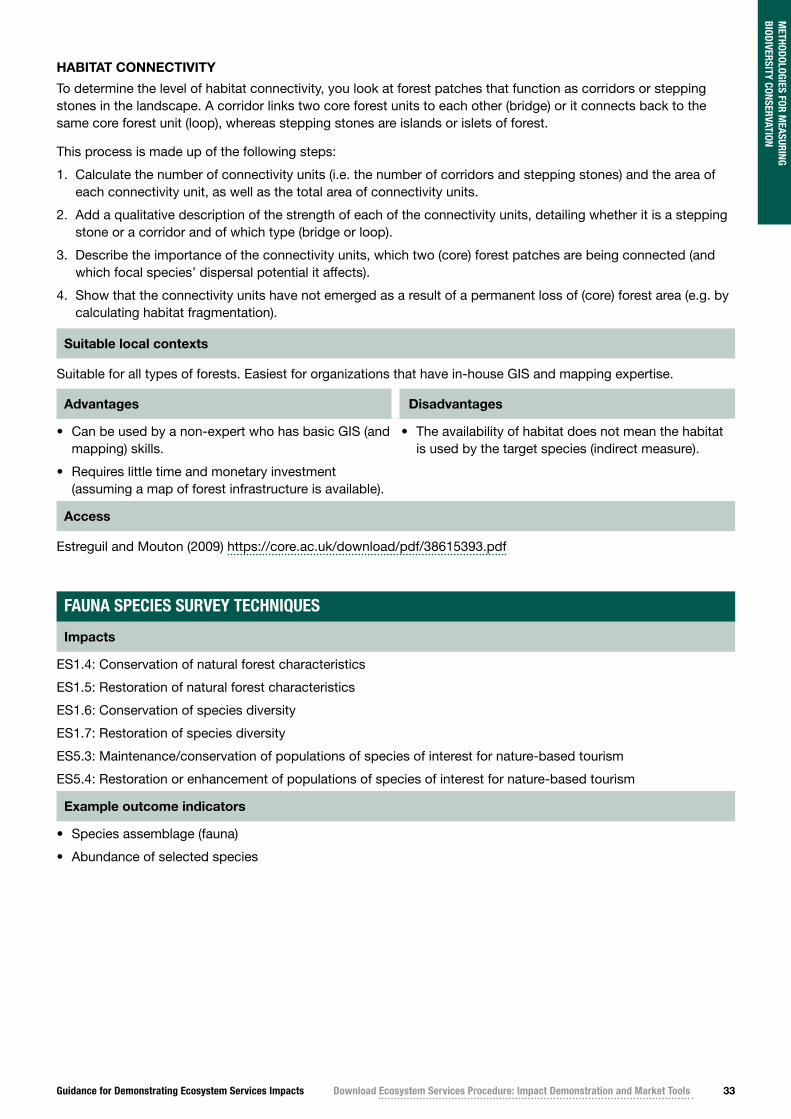
Guidance for Demonstrating Ecosystem Services Impacts Download Ecosystem Services Procedure: Impact Demonstration and Market Tools 33
HABITAT CONNECTIVITY
To determine the level of habitat connectivity, you look at forest patches that function as corridors or stepping stones in the landscape. A corridor links two core forest units to each other (bridge) or it connects back to the same core forest unit (loop), whereas stepping stones are islands or islets of forest.
This process is made up of the following steps:
1. Calculate the number of connectivity units (i.e. the number of corridors and stepping stones) and the area of each connectivity unit, as well as the total area of connectivity units.
2. Add a qualitative description of the strength of each of the connectivity units, detailing whether it is a stepping stone or a corridor and of which type (bridge or loop).
3. Describe the importance of the connectivity units, which two (core) forest patches are being connected (and which focal species’ dispersal potential it affects).
4. Show that the connectivity units have not emerged as a result of a permanent loss of (core) forest area (e.g. by calculating habitat fragmentation).
Suitable local contexts
Suitable for all types of forests. Easiest for organizations that have in-house GIS and mapping expertise.
Advantages Disadvantages
• Can be used by a non-expert who has basic GIS (and mapping) skills.
• Requires little time and monetary investment (assuming a map of forest infrastructure is available).
• The availability of habitat does not mean the habitat is used by the target species (indirect measure).
Access
Estreguil and Mouton (2009) https://core.ac.uk/download/pdf/38615393.pdf
FAUNA SPECIES SURVEY TECHNIQUES
Impacts
ES1.4: Conservation of natural forest characteristics
ES1.5: Restoration of natural forest characteristics
ES1.6: Conservation of species diversity
ES1.7: Restoration of species diversity
ES5.3: Maintenance/conservation of populations of species of interest for nature-based tourism
ES5.4: Restoration or enhancement of populations of species of interest for nature-based tourism
Example outcome indicators
• Species assemblage (fauna)
• Abundance of selected species
METHODOLOGIES FOR M
EASURING BIODIVERSITY CONSERVATION
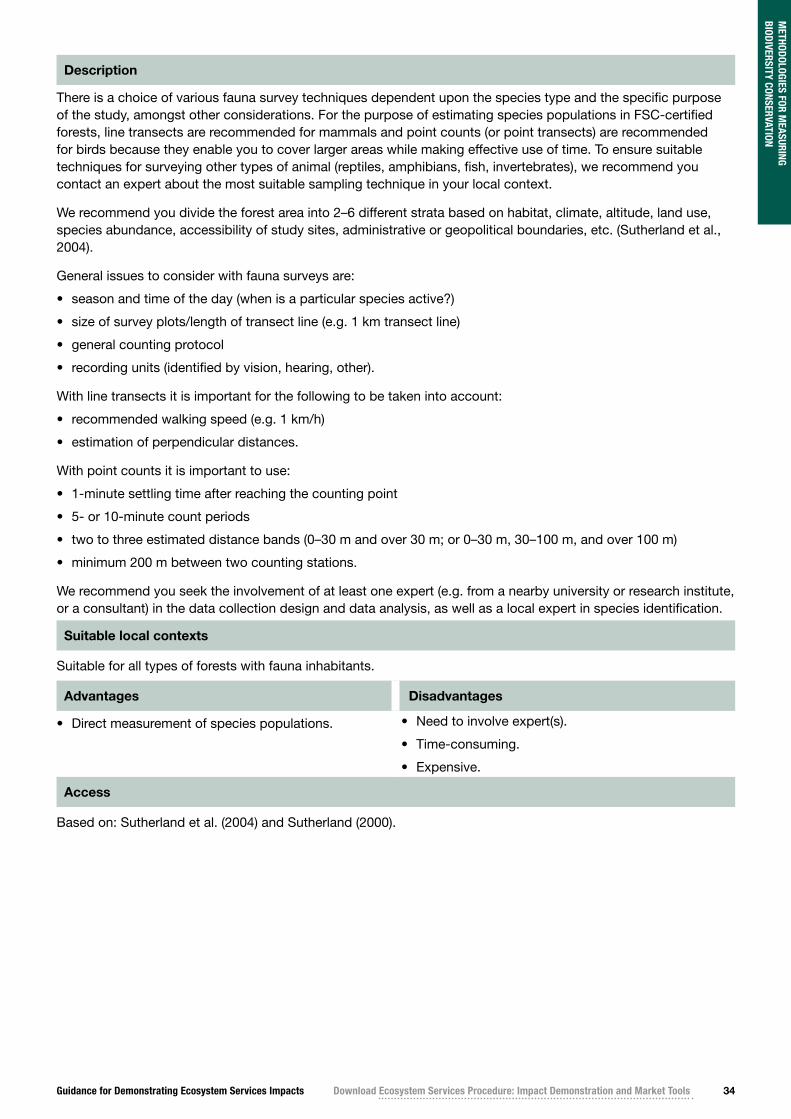
Guidance for Demonstrating Ecosystem Services Impacts Download Ecosystem Services Procedure: Impact Demonstration and Market Tools 34
Description
There is a choice of various fauna survey techniques dependent upon the species type and the specific purpose of the study, amongst other considerations. For the purpose of estimating species populations in FSC-certified forests, line transects are recommended for mammals and point counts (or point transects) are recommended for birds because they enable you to cover larger areas while making effective use of time. To ensure suitable techniques for surveying other types of animal (reptiles, amphibians, fish, invertebrates), we recommend you contact an expert about the most suitable sampling technique in your local context.
We recommend you divide the forest area into 2–6 different strata based on habitat, climate, altitude, land use, species abundance, accessibility of study sites, administrative or geopolitical boundaries, etc. (Sutherland et al., 2004).
General issues to consider with fauna surveys are:
• season and time of the day (when is a particular species active?)
• size of survey plots/length of transect line (e.g. 1 km transect line)
• general counting protocol
• recording units (identified by vision, hearing, other).
With line transects it is important for the following to be taken into account:
• recommended walking speed (e.g. 1 km/h)
• estimation of perpendicular distances.
With point counts it is important to use:
• 1-minute settling time after reaching the counting point
• 5- or 10-minute count periods
• two to three estimated distance bands (0–30 m and over 30 m; or 0–30 m, 30–100 m, and over 100 m)
• minimum 200 m between two counting stations.
We recommend you seek the involvement of at least one expert (e.g. from a nearby university or research institute, or a consultant) in the data collection design and data analysis, as well as a local expert in species identification.
Suitable local contexts
Suitable for all types of forests with fauna inhabitants.
Advantages Disadvantages
• Direct measurement of species populations. • Need to involve expert(s).
• Time-consuming.
• Expensive.
Access
Based on: Sutherland et al. (2004) and Sutherland (2000).
METHODOLOGIES FOR M
EASURING BIODIVERSITY CONSERVATION
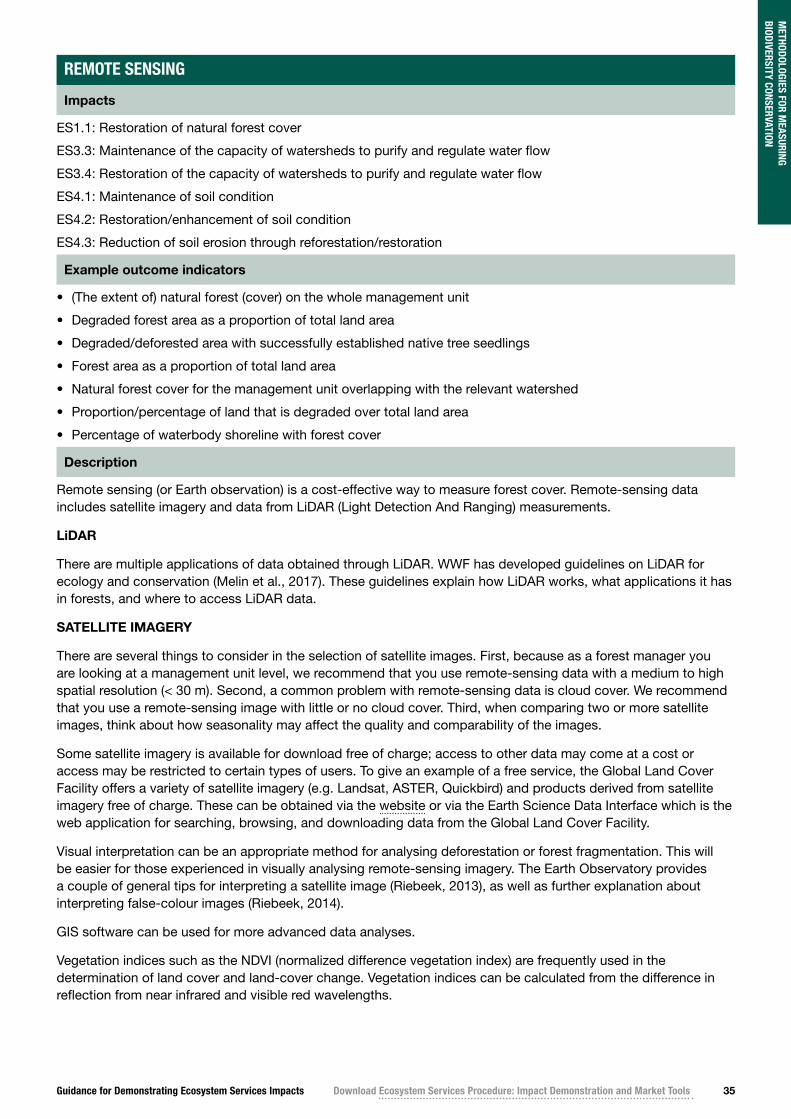
Guidance for Demonstrating Ecosystem Services Impacts Download Ecosystem Services Procedure: Impact Demonstration and Market Tools 35
REMOTE SENSING
Impacts
ES1.1: Restoration of natural forest cover
ES3.3: Maintenance of the capacity of watersheds to purify and regulate water flow
ES3.4: Restoration of the capacity of watersheds to purify and regulate water flow
ES4.1: Maintenance of soil condition
ES4.2: Restoration/enhancement of soil condition
ES4.3: Reduction of soil erosion through reforestation/restoration
Example outcome indicators
• (The extent of) natural forest (cover) on the whole management unit
• Degraded forest area as a proportion of total land area
• Degraded/deforested area with successfully established native tree seedlings
• Forest area as a proportion of total land area
• Natural forest cover for the management unit overlapping with the relevant watershed
• Proportion/percentage of land that is degraded over total land area
• Percentage of waterbody shoreline with forest cover
Description
Remote sensing (or Earth observation) is a cost-effective way to measure forest cover. Remote-sensing data includes satellite imagery and data from LiDAR (Light Detection And Ranging) measurements.
LiDAR
There are multiple applications of data obtained through LiDAR. WWF has developed guidelines on LiDAR for ecology and conservation (Melin et al., 2017). These guidelines explain how LiDAR works, what applications it has in forests, and where to access LiDAR data.
SATELLITE IMAGERY
There are several things to consider in the selection of satellite images. First, because as a forest manager you are looking at a management unit level, we recommend that you use remote-sensing data with a medium to high spatial resolution (< 30 m). Second, a common problem with remote-sensing data is cloud cover. We recommend that you use a remote-sensing image with little or no cloud cover. Third, when comparing two or more satellite images, think about how seasonality may affect the quality and comparability of the images.
Some satellite imagery is available for download free of charge; access to other data may come at a cost or access may be restricted to certain types of users. To give an example of a free service, the Global Land Cover Facility offers a variety of satellite imagery (e.g. Landsat, ASTER, Quickbird) and products derived from satellite imagery free of charge. These can be obtained via the website or via the Earth Science Data Interface which is the web application for searching, browsing, and downloading data from the Global Land Cover Facility.
Visual interpretation can be an appropriate method for analysing deforestation or forest fragmentation. This will be easier for those experienced in visually analysing remote-sensing imagery. The Earth Observatory provides a couple of general tips for interpreting a satellite image (Riebeek, 2013), as well as further explanation about interpreting false-colour images (Riebeek, 2014).
GIS software can be used for more advanced data analyses.
Vegetation indices such as the NDVI (normalized difference vegetation index) are frequently used in the determination of land cover and land-cover change. Vegetation indices can be calculated from the difference in reflection from near infrared and visible red wavelengths.
METHODOLOGIES FOR M
EASURING BIODIVERSITY CONSERVATION
Guidance for Demonstrating Ecosystem Services Impacts Download Ecosystem Services Procedure: Impact Demonstration and Market Tools 36
METHODOLOGIES FOR M
EASURING BIODIVERSITY CONSERVATION
Global Forest Watch offers an online interactive map that allows users to explore and analyse data on tree-cover change on a global, national, or jurisdictional level. The interactive map is based on global tree cover data from 2000 with a spatial resolution of 30 m. Data about tree cover loss is added annually and data on tree cover gain was added in 2012.
Suitable local contexts
All forests worldwide.
Advantages Disadvantages
• Cost-effective. • Requires medium-level expertise or interest
ASSESSMENT OF THE AREA OF INTACT FOREST LANDSCAPES
Impacts
ES1.2: Conservation of intact forest landscapes
Example outcome indicators
• Area of intact forest landscapes
• Area of intact forest landscape core area
To measure the baseline of intact forest landscape (IFL) area, you must use the Global Forest Watch IFL maps or a more recent IFL inventory using the same methodology (such as Global Forest Watch Canada) (FSC, 2016).
The frequently asked questions on the advice note for Motion 65 note that “the methodology can be further refined, but not altered to generate more detailed specifications, if it is agreed in consensus in the standard development group. The refined methodology will be assessed for approval by the policy and standards committee once the NFSS [national forest stewardship standard] . . . is submitted for approval” (FSC, 2016, p. 13).
Description
“The Intact Forest Landscapes (IFL) data set identifies unbroken expanses of natural ecosystems within the zone of forest extent that show no signs of significant human activity and are large enough that all native biodiversity, including viable populations of wide-ranging species, could be maintained. To map IFL areas, a set of criteria was developed and designed to be globally applicable and easily replicable, the latter to allow for repeated assessments over time as well as verification. IFL areas were defined as unfragmented landscapes, at least 50,000 ha in size, and with a minimum width of 10 kilometres. These were mapped from Landsat satellite imagery for the year 2000.
“Changes in the extent of IFLs were identified from 2000–2013 and from 2013–2016 within the original year 2000 IFL boundary using the global wall-to-wall Landsat image composite for years 2013, 2016, and the global forest cover loss dataset (Hansen et al., 2013). Areas identified as ‘reduction in extent’ met the IFL criteria in 2000, but no longer met the criteria in 2013 or 2016. . . .
“This data can be used to assess forest intactness, alteration, and degradation at global and regional scales” (Greenpeace et al., nd).
Suitable local contexts
All forests worldwide that include, or are part of, IFLs.

Guidance for Demonstrating Ecosystem Services Impacts Download Ecosystem Services Procedure: Impact Demonstration and Market Tools 37
Advantages Disadvantages
• Cost-effective.
• User-friendly.
• Debate over accurateness and intactness on the ground.
• Large area of forest may be classified as IFL.
Access
Access the interactive map via globalforestwatch.org/map/ (tab ‘land cover’).
For more information about the method see www.intactforests.org/method.html
OTHER METHODS
The United Nations Convention to Combat Desertification’s (UNCCD) computation of land degradation neutrality (under ‘Module 12: Methodologies for measuring soil conservation’)
Impacts: ES1.1: Restoration of natural forest cover
METHODOLOGIES FOR M
EASURING BIODIVERSITY CONSERVATION
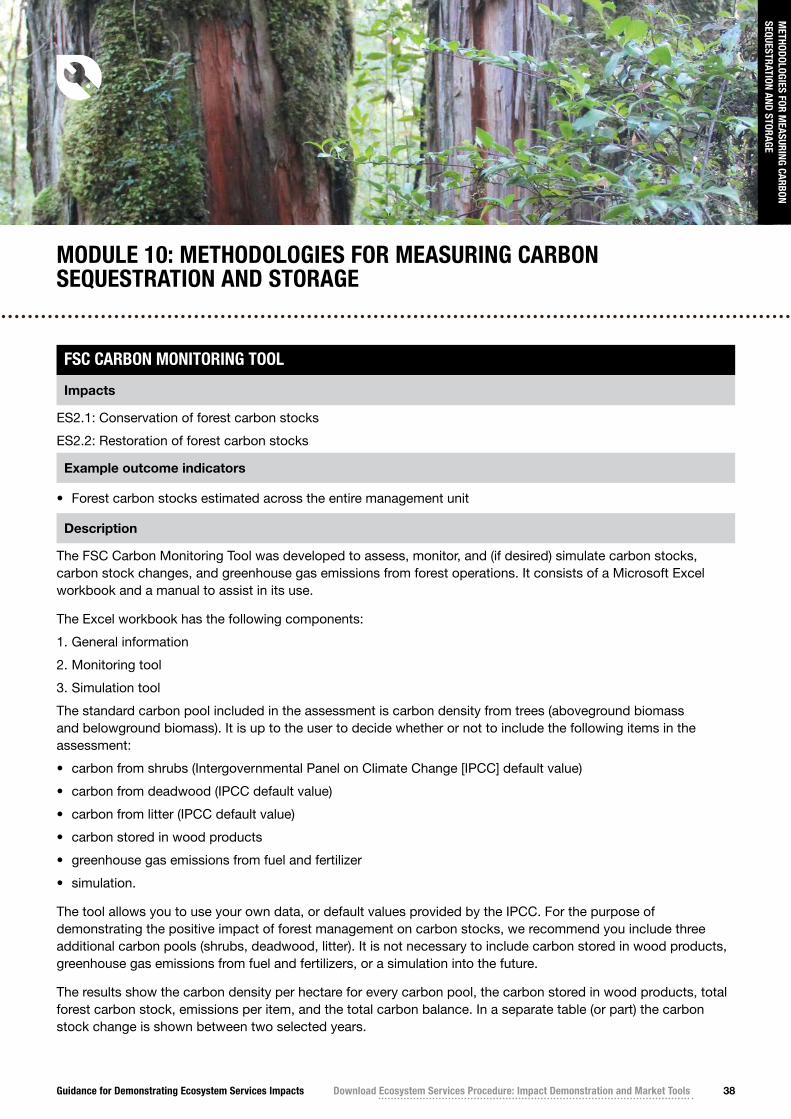
Guidance for Demonstrating Ecosystem Services Impacts Download Ecosystem Services Procedure: Impact Demonstration and Market Tools 38
METHODOLOGIES FOR M
EASURING CARBON SEQUESTRATION AND STORAGE
MODULE 10: METHODOLOGIES FOR MEASURING CARBON SEQUESTRATION AND STORAGE
FSC CARBON MONITORING TOOL
Impacts
ES2.1: Conservation of forest carbon stocks
ES2.2: Restoration of forest carbon stocks
Example outcome indicators
• Forest carbon stocks estimated across the entire management unit
Description
The FSC Carbon Monitoring Tool was developed to assess, monitor, and (if desired) simulate carbon stocks, carbon stock changes, and greenhouse gas emissions from forest operations. It consists of a Microsoft Excel workbook and a manual to assist in its use.
The Excel workbook has the following components:
1. General information
2. Monitoring tool
3. Simulation tool
The standard carbon pool included in the assessment is carbon density from trees (aboveground biomass and belowground biomass). It is up to the user to decide whether or not to include the following items in the assessment:
• carbon from shrubs (Intergovernmental Panel on Climate Change [IPCC] default value)
• carbon from deadwood (IPCC default value)
• carbon from litter (IPCC default value)
• carbon stored in wood products
• greenhouse gas emissions from fuel and fertilizer
• simulation.
The tool allows you to use your own data, or default values provided by the IPCC. For the purpose of demonstrating the positive impact of forest management on carbon stocks, we recommend you include three additional carbon pools (shrubs, deadwood, litter). It is not necessary to include carbon stored in wood products, greenhouse gas emissions from fuel and fertilizers, or a simulation into the future.
The results show the carbon density per hectare for every carbon pool, the carbon stored in wood products, total forest carbon stock, emissions per item, and the total carbon balance. In a separate table (or part) the carbon stock change is shown between two selected years.
Guidance for Demonstrating Ecosystem Services Impacts Download Ecosystem Services Procedure: Impact Demonstration and Market Tools 39
METHODOLOGIES FOR M
EASURING CARBON SEQUESTRATION AND STORAGE
Suitable local contexts
Designed to run on Microsoft Excel 2010.
Suitable for tropical, temperate, and boreal forest ecosystems.
Works best if forest inventory data is available.
Advantages Disadvantages
• Developed specifically for FSC, so fits well.
• Easy – can be used by a non-expert.
• Default IPCC values can be used where no data is available.
• In a biodiversity-rich forest, it will require a lot of data entry which can become time-consuming.
• Soil organic matter is not included in the calculation.
• Reduced reliability with less-detailed data (i.e. more use of preset default values).
Access
Available via https://fsc.org/en/for-forests/ecosystem-services/ecosystem-services-for-forest-managers
2006 IPCC GUIDELINES FOR NATIONAL GREENHOUSE GAS INVENTORIES
Impacts
ES2.1: Conservation of forest carbon stocks
ES2.2: Restoration of forest carbon stocks
Example outcome indicators
• Forest carbon stocks estimated across the entire management unit
Description
The IPCC (2006) methodology is the reference for the measurement and quantification of carbon sequestration and storage. Volume 4 concerns Agriculture, Forestry, and Other Land Use and includes several relevant chapters: ‘Introduction’ (chapter 1), ‘Generic methodologies’, (chapter 2), ‘Forest land’ (chapter 4), and ‘Wetlands’ (chapter 7).
The introduction includes a ‘decision tree’ on which type of data to use (tier 1, tier 2, or tier 3) and an overview of steps to take in preparing inventory estimate data. Chapter 4 includes a methodology for forest land, remaining forest land and for other land use converted into forest land. Both the Gain-Loss and Stock-Difference methods can be used.
The following carbon pools must be included in the calculation:
• aboveground biomass
• belowground biomass
• carbon pools that are (possibly) lower in the project scenario than in the baseline scenario.
When burning is an issue in the baseline scenario, it is advisable to include nitrous oxide (N2O) and methane (CH4) in the calculation. Other carbon pools can be included in the calculation as feasible. Note that the more carbon pools that are included, the higher the figure for total forest carbon stock/sequestered.
Chapter 7 includes a methodology to calculate the emissions from draining peatland.
Guidance for Demonstrating Ecosystem Services Impacts Download Ecosystem Services Procedure: Impact Demonstration and Market Tools 40
METHODOLOGIES FOR M
EASURING CARBON SEQUESTRATION AND STORAGE
Suitable local contexts
Suitable for all forest types.
Advantages Disadvantages
• The most widely recognized methodology for carbon measurements.
• Training is required to be able to perform the calculations successfully.
Access
IPCC (2006) available at https://www.ipcc-nggip.iges.or.jp/public/2006gl/vol4.html
RIL-C METHODOLOGY
Impacts
ES2.1: Conservation of forest carbon stocks
Example outcome indicators
• Gross carbon stock loss resulting from recent logging
Description
The RIL-C methodology was developed by The Nature Conservancy (TNC) and can be used at project or jurisdictional level. The RIL-C method is applicable to projects which implement reduced-impact logging (RIL) practices to reduce carbon (C) emissions. The effectiveness of RIL-C practices, and accounting of emission reductions attributable to those practices, is assessed on the basis of their postharvest impacts by measuring a set of so-called impact parameters. Four impact parameters are identified in version 1.0 (approved 28 April 2016):
• average percentage of felled trees abandoned in the forest
• average percentage of felled log length left (excluding abandoned logs) in the forest
• average number of trees > 20 cm diameter at breast height (DBH) killed by skidding per ha (= [average m length skid trail per ha] × [average no. trees DBH > 20 cm killed per m skid trail])
• area of haul road and log-landing corridors (m2 per ha).
A regional ‘business-as-usual’ baseline (crediting baseline) is determined for each of these parameters as well as an additionality benchmark (a minimum improvement from the ‘business-as-usual’ baseline) that acts as a threshold above which carbon reductions can be accounted for. Accounting of emission reductions needs to be done within five years post-harvest.
Suitable local contexts
Forests where selective logging takes place and reduced-impact logging practices are adopted to reduce carbon emissions.
Regional modules:
• East and North Kalimantan, Indonesia, in standing Bornean dipterocarp forest (approved)
• Yucatan, Mexico (under development)
• Madre de Dios, Peru (under development)
• Congo Basin: Gabon, Democratic Republic of Congo, Republic of Congo (under development)
• Suriname (under development as part of national monitoring system)
• Sarawak, Malaysia (pre-development work underway)
• Central/West Kalimantan and West Papua, Indonesia (pre-development work underway).
Guidance for Demonstrating Ecosystem Services Impacts Download Ecosystem Services Procedure: Impact Demonstration and Market Tools 41
METHODOLOGIES FOR M
EASURING CARBON SEQUESTRATION AND STORAGE
Advantages Disadvantages
• Simple, can be used by non-expert.
• Likely fits well with existing postharvest monitoring protocol.
• Currently limited to suitable geographic contexts with baseline research completed, but could be expanded in the future.
Access
Verra (2016) available at http://verra.org/methodology/vm0035-methodology-for-improved-forest-management- through-reduced-impact-logging-v1-0/
PARTICIPATORY CARBON MONITORING
Impacts
ES2.1: Conservation of forest carbon stocks
ES2.2: Restoration of forest carbon stocks
Example outcome indicators
• Forest carbon stocks estimated across the entire management unit
Description
The SNV Participatory Carbon Monitoring method is a series consisting of three manuals: a manual for local people, a manual for local technical staff, and a field reference manual.
The Manual for Local People (Huy et al., 2013a) includes measuring changes in forest area and forest status; and measuring aboveground carbon pools and other attributes in sample plots. Trees with a DBH of or above 6 cm are measured, regeneration trees are counted when they measure a DBH below 6 cm and a height of at least 1.3 m, and bamboo (age and average DBH) can be included in the data collection. This manual further explains what equipment is needed in the monitoring exercise, how to use a GPS, how to establish nested circular permanent sample plots, and how to measure DBH. Finally, it includes various data sheets.
The Manual for Local Technical Staff (Huy et al., 2013b) is the most comprehensive of the three. Besides the information given in the Manual for Local People, it includes data-collection preparatory activities such as mapping stratification and forest status, determining the number of sample plots, randomly distributing the sample plots per strata on a map, and entering them into a GPS. Further, it includes activities that happen after field data collection, including quality control, data synthesis, and analysis.
The Manual for Field Reference (Huy et al., 2013c) is designed to be used as a quick reference guide while monitoring changes in area and forest status, determining the position of a sample plot, setting up a permanent sample plot, and measuring forest biomass and carbon in a sample plot.
Suitable local contexts
The SNV manuals are written for Vietnam, but the authors state the target groups for this manual to be agencies, organizations, and individuals responsible for forest management who are also facilitators of REDD+ programme implementation, implying that it can be applied more widely.
Advantages Disadvantages
• Simple, user-friendly manuals. • Only aboveground biomass is included.
Guidance for Demonstrating Ecosystem Services Impacts Download Ecosystem Services Procedure: Impact Demonstration and Market Tools 42
METHODOLOGIES FOR M
EASURING CARBON SEQUESTRATION AND STORAGE
Access
Huy et al. (2013a) available at https://www.researchgate.net/publication/323144419_Participatory_Carbon_Monitoring_Manual_for_Local_People
Huy et al. (2013b) available at http://www.vietnam-redd.org/Upload/Download/File/pcm_manual_for_technical_staff_final_en-1_0402.pdf
Huy et al. (2013c) available at https://www.researchgate.net/publication/332187277_Participatory_Carbon_Monitoring_Manual_for_Field_Reference
The Asian Network for Sustainable Agriculture and Bioresources and a number of other organizations have developed guidelines for the Nepalese context to measure carbon stocks in community-managed forests (Subedi et al., 2010). This method includes multiple carbon pools (aboveground biomass, belowground biomass, deadwood, litter, and soil organic matter) so the guidelines are lengthier and more complex than the SNV manuals.
OTHER METHODS
Other accepted methodologies are those whose quality is assured by the International Carbon Reduction and Offset Alliance (ICROA) Code of Best Practice:
Verra’s Verified Carbon Standard Program
For Verified Carbon Standard (VCS) methodologies (http://verra.org/methodologies/), look for the category ‘Forestry’ (in some cases the category ‘Wetlands’ may be applicable). You will find methodologies that are mainly related to different aspects of improved forest management (reduced-impact logging, fire management, avoided unplanned degradation, forest protected area), REDD, and wetlands – most of which have been developed for specific forest type or have a regional focus.
Gold Standard
Gold Standard Afforestation/Reforestation (A/R) GHG [Greenhouse Gas] Emission Reduction & Sequestration Methodology (2017) can be found on the following page under ‘All Documents’: https://www.goldstandard.org/ project-developers/develop-project.
American Carbon Registry (ACR)
ACR Approved Methodologies: Sectoral Scope 3: Land Use, Land Use Change and Forestry (via http:// americancarbonregistry.org/carbon-accounting/standards-methodologies/approved-methodologies). You will find methodologies related to afforestation and reforestation, improved forest management, REDD, and wetlands – most of which have a national or regional focus on the United States of America.
Clean Development Mechanism (CDM)
Under CDM methodologies (http://cdm.unfccc.int/methodologies/index.html), look for large- and small-scale afforestation and reforestation methodologies. For each category, two methodologies exist: one for mangrove habitats and one for non-wetland forests.
Climate Action Reserve
The Forest Project Protocol (CAR, 2017), developed for the United States of America, is an all-in-one methodology for afforestation/reforestation, improved forest management, and avoided conversion. It includes carbon in harvested wood products and modelling of the baseline 100 years into the future, making it more complicated than other methodologies. Quantification guidance is needed to use this methodology. It is not approved by VCS.
Please note that the methodology you select needs to be suitable for your forest in terms of forest type, location, and context (including the characteristics of your organization).
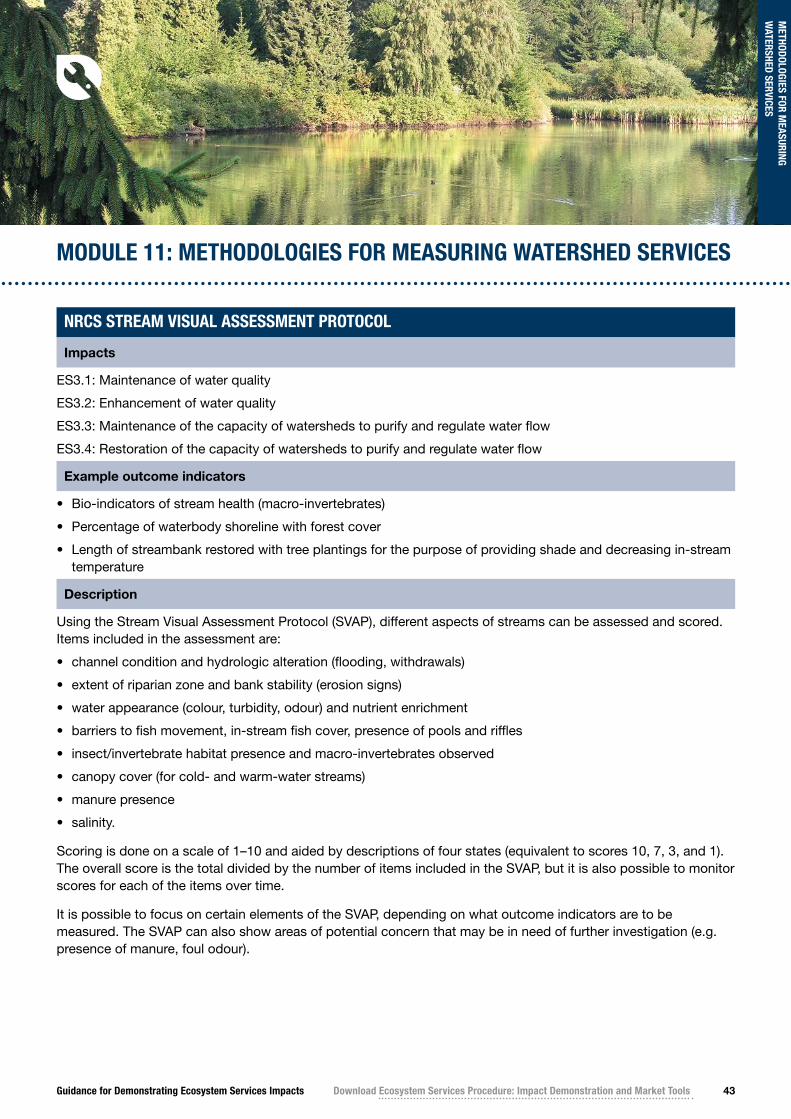
Guidance for Demonstrating Ecosystem Services Impacts Download Ecosystem Services Procedure: Impact Demonstration and Market Tools 43
METHODOLOGIES FOR M
EASURING W
ATERSHED SERVICES
MODULE 11: METHODOLOGIES FOR MEASURING WATERSHED SERVICES
NRCS STREAM VISUAL ASSESSMENT PROTOCOL
Impacts
ES3.1: Maintenance of water quality
ES3.2: Enhancement of water quality
ES3.3: Maintenance of the capacity of watersheds to purify and regulate water flow
ES3.4: Restoration of the capacity of watersheds to purify and regulate water flow
Example outcome indicators
• Bio-indicators of stream health (macro-invertebrates)
• Percentage of waterbody shoreline with forest cover
• Length of streambank restored with tree plantings for the purpose of providing shade and decreasing in-stream temperature
Description
Using the Stream Visual Assessment Protocol (SVAP), different aspects of streams can be assessed and scored. Items included in the assessment are:
• channel condition and hydrologic alteration (flooding, withdrawals)
• extent of riparian zone and bank stability (erosion signs)
• water appearance (colour, turbidity, odour) and nutrient enrichment
• barriers to fish movement, in-stream fish cover, presence of pools and riffles
• insect/invertebrate habitat presence and macro-invertebrates observed
• canopy cover (for cold- and warm-water streams)
• manure presence
• salinity.
Scoring is done on a scale of 1–10 and aided by descriptions of four states (equivalent to scores 10, 7, 3, and 1). The overall score is the total divided by the number of items included in the SVAP, but it is also possible to monitor scores for each of the items over time.
It is possible to focus on certain elements of the SVAP, depending on what outcome indicators are to be measured. The SVAP can also show areas of potential concern that may be in need of further investigation (e.g. presence of manure, foul odour).
Guidance for Demonstrating Ecosystem Services Impacts Download Ecosystem Services Procedure: Impact Demonstration and Market Tools 44
METHODOLOGIES FOR M
EASURING W
ATERSHED SERVICES
Suitable local contexts
Developed for the United States of America nationwide, but authors encourage state and regional adaptation. Can possibly be useful for other countries, for which specific adaptation will be necessary for the assessment of macro- invertebrates.
Advantages Disadvantages
• Simple, can be used by non-experts.
• Cheap.
• Limited suitability in terms of geographical context.
Access
NRCS (2009) available at https://www.wcc.nrcs.usda.gov/ftpref/wntsc/strmRest/SVAPver2.pdf
TESSA WATER METHOD 5A: MEASURING THE CONTRIBUTION OF A WETLAND SITE TO WATER QUALITY
Impacts
ES3.1: Maintenance of water quality
ES3.2: Enhancement of water quality
Example outcome indicators
• Water turbidity
• Water temperature
• Dissolved oxygen
• Water pH
• Pathogens (bacteria [e.g. E. coli], viruses) in water
• Nutrients (phosphorous, nitrogen) in water
• Total suspended solids
• Level of sedimentation/water sediment load (grams per litre)
Description
This method helps you select appropriate water quality parameters to measure. It provides links to water test kits that can be ordered online. It can also aid in the selection of sampling sites and describes how to collect water samples. Parameters can subsequently be analysed in the field and/or sent to a laboratory for further analysis.
Note: this method is described on pp. 1–8 of the TESSA Water Method 5 Assessing Water Quality Services (subsequent pages can be ignored).
Where the water is used for drinking water supply, refer to the United Nations Children’s Fund’s (UNICEF) water quality assessment and monitoring technical bulletin for which parameters to include in the assessment.
Suitable local contexts
All types of forests with water bodies that can be safely accessed to collect water samples.
Advantages
Simple, user-friendly wording.

Guidance for Demonstrating Ecosystem Services Impacts Download Ecosystem Services Procedure: Impact Demonstration and Market Tools 45
METHODOLOGIES FOR M
EASURING W
ATERSHED SERVICES
Access
Peh et al. (2017): available for download via http://tessa.tools/ – Fill out the download request form on the web page. Once approved, download the zipped TESSA toolkit folder. Unzip the folder and look for the method you are interested in.
UNICEF (2010) available at http://home.iitk.ac.in/~anubha/Water.pdf
OTHER METHODS
UNCCD’s computation of land degradation neutrality (under ‘Module 12: Methodologies for measuring soil conservation’)
Impacts: ES3.3: Maintenance of the capacity of watersheds to purify and regulate water flow
ES3.4: Restoration of the capacity of watersheds to purify and regulate water flow
Forest Intactness Index (under ‘Module 9: Methodologies for measuring biodiversity conservation’)
Impacts: ES3.3: Maintenance of the capacity of watersheds to purify and regulate water flow
ES3.4: Restoration of the capacity of watersheds to purify and regulate water flow
Remote sensing (under ‘Module 9: Methodologies for measuring biodiversity conservation’)
Impacts: ES3.3: Maintenance of the capacity of watersheds to purify and regulate water flow
ES3.4: Restoration of the capacity of watersheds to purify and regulate water flow
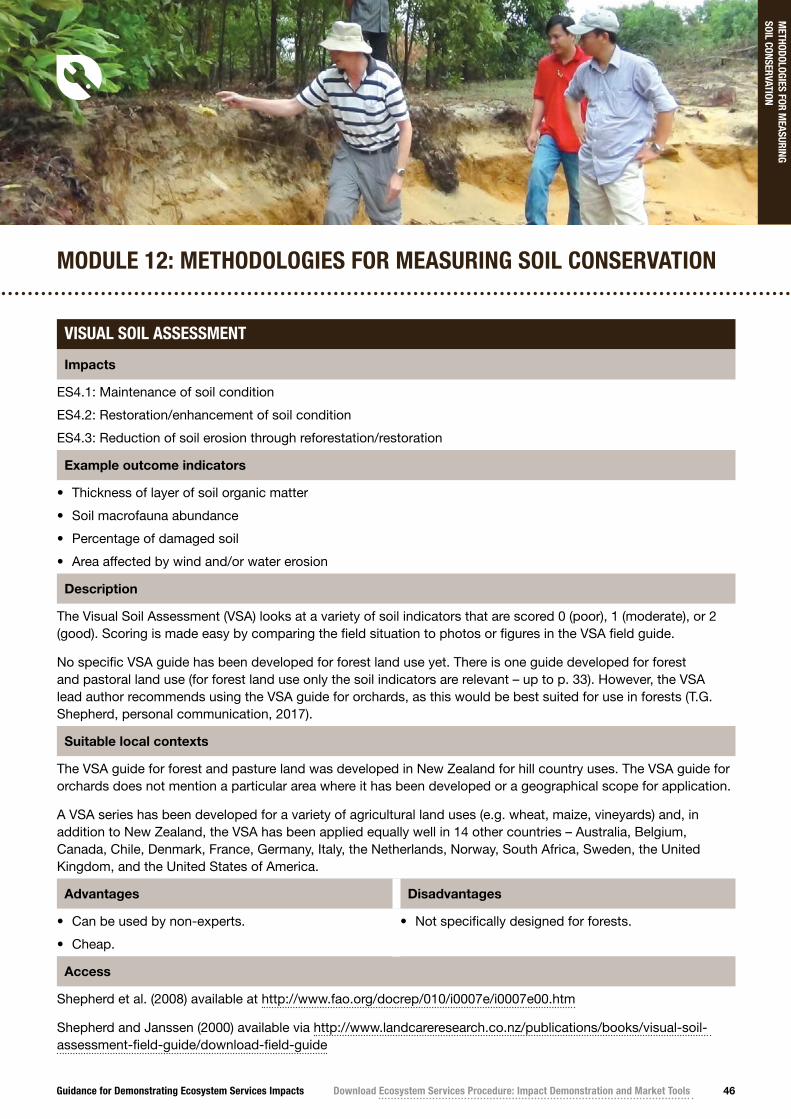
Guidance for Demonstrating Ecosystem Services Impacts Download Ecosystem Services Procedure: Impact Demonstration and Market Tools 46
METHODOLOGIES FOR M
EASURING SOIL CONSERVATION
MODULE 12: METHODOLOGIES FOR MEASURING SOIL CONSERVATION
VISUAL SOIL ASSESSMENT
Impacts
ES4.1: Maintenance of soil condition
ES4.2: Restoration/enhancement of soil condition
ES4.3: Reduction of soil erosion through reforestation/restoration
Example outcome indicators
• Thickness of layer of soil organic matter
• Soil macrofauna abundance
• Percentage of damaged soil
• Area affected by wind and/or water erosion
Description
The Visual Soil Assessment (VSA) looks at a variety of soil indicators that are scored 0 (poor), 1 (moderate), or 2 (good). Scoring is made easy by comparing the field situation to photos or figures in the VSA field guide.
No specific VSA guide has been developed for forest land use yet. There is one guide developed for forest and pastoral land use (for forest land use only the soil indicators are relevant – up to p. 33). However, the VSA lead author recommends using the VSA guide for orchards, as this would be best suited for use in forests (T.G. Shepherd, personal communication, 2017).
Suitable local contexts
The VSA guide for forest and pasture land was developed in New Zealand for hill country uses. The VSA guide for orchards does not mention a particular area where it has been developed or a geographical scope for application.
A VSA series has been developed for a variety of agricultural land uses (e.g. wheat, maize, vineyards) and, in addition to New Zealand, the VSA has been applied equally well in 14 other countries – Australia, Belgium, Canada, Chile, Denmark, France, Germany, Italy, the Netherlands, Norway, South Africa, Sweden, the United Kingdom, and the United States of America.
Advantages Disadvantages
• Can be used by non-experts.
• Cheap.
• Not specifically designed for forests.
Access
Shepherd et al. (2008) available at http://www.fao.org/docrep/010/i0007e/i0007e00.htm
Shepherd and Janssen (2000) available via http://www.landcareresearch.co.nz/publications/books/visual-soil- assessment-field-guide/download-field-guide
Guidance for Demonstrating Ecosystem Services Impacts Download Ecosystem Services Procedure: Impact Demonstration and Market Tools 47
METHODOLOGIES FOR M
EASURING SOIL CONSERVATION
LINE-POINT TRANSECT FOREST COVER AND EROSION ASSESSMENT METHOD
Impacts
ES4.1: Maintenance of soil condition
ES4.2: Restoration/enhancement of soil condition
ES4.3: Reduction of soil erosion through reforestation/restoration
Example outcome indicators
• Extent of land cover with forest canopy or ground vegetation
• Percentage of damaged soil
• Area affected by wind and/or water erosion
Description
The line-point transect forest cover and erosion assessment method was developed by the Food and Agriculture Organization of the United Nations as a rapid assessment of forest protective function for soil and water. It records forest canopy, floor cover, and erosion evidence in 30 readings along two lines in a 20 × 20 m plot. Forest canopy (sky or leaf/vegetation) is recorded by using a densitometer device. Floor cover is recorded by classifying each of the measurement points into vegetation, roots, forest litter, stones/rocks, deadwood, or bare soil. For erosion, the following items are recorded per sampling site: the number of rills and gullies, their width and depth, and the general slope. A team of three people is recommended to carry out these measurements.
Suitable local contexts
Specifically designed for, but not limited to, developing countries.
Advantages Disadvantages
• Can be used by non-experts after limited training.
• Cheap.
• No guidance is given on the number of plots that should be measured.
Access
FAO (2015) available at http://www.fao.org/3/a-i4498e.pdf
Adikari, Y., and MacDicken, K. (2015) available at http://www.fao.org/3/a-i4509e.pdf
Guidance for Demonstrating Ecosystem Services Impacts Download Ecosystem Services Procedure: Impact Demonstration and Market Tools 48
METHODOLOGIES FOR M
EASURING SOIL CONSERVATION
UNCCD’S COMPUTATION OF LAND DEGRADATION NEUTRALITY
Impacts
ES1.1: Restoration of natural forest cover
ES3.3: Maintenance of the capacity of watersheds to purify and regulate water flow
ES3.4: Restoration of the capacity of watersheds to purify and regulate water flow
ES4.1: Maintenance of soil condition
ES4.2: Restoration/enhancement of soil condition
Example outcome indicators
• Proportion/percentage of land that is degraded over total land area
• Degraded forest area as a proportion of total land area
Description
To measure land degradation, the following sub-indicators need to be measured:
• land cover and land-cover change (Land Cover Classification System/ Land Cover Meta Language)
• land productivity (Net Primary Productivity/ Normalized Difference Vegetation Index)
• carbon stocks with a focus on soil organic carbon, complying with the methodologies as stipulated in IPCC (2006).
A tiered approach is taken relating to how the measurements are to be carried out:
• tier 1 is through Earth observation and geospatial information
• tier 2 is statistical and based on estimated data for administrative or natural boundaries
• tier 3 is data led and based on surveys, assessment, and ground measurements.
To reach a conclusion with the results, the ‘one-out, all-out’ approach is used. This means that if any of the three indicators show significant negative change, it is considered a loss, and if at least one indicator shows a significant positive change and none show a significant negative change, it is considered a gain.
Work is underway to develop a standardized approach and best practice guidance on how to measure the three sub-indicators.
Suitable local contexts
Designed for use by the United Nations, i.e. for national-level reporting with options given to calculate regional and global land degradation. Not limited to forest land use.
Available in English, French, and Spanish.
Advantages Disadvantages
• Comprehensive.
• Direct fit with Sustainable Development Goal 15.3.1.
• Advanced GIS skills needed.
• Lengthy document, less user-friendly.
• Not developed for site-level measurements.
Access
Orr et al. (2017) available at http://www2.unccd.int/publications/scientific-conceptual-framework-land-degradation-neutrality-report-science-policy – Module E (chapter 7) is about monitoring the three sub-indicators and how to reach a conclusion on land degradation neutrality; p. 109 (English version) presents a summary of the methodology.
Guidance for Demonstrating Ecosystem Services Impacts Download Ecosystem Services Procedure: Impact Demonstration and Market Tools 49
METHODOLOGIES FOR M
EASURING SOIL CONSERVATION
SOIL TESTING KITS AND EQUIPMENT
Impacts
ES4.1: Maintenance of soil condition
ES4.2: Restoration/enhancement of soil condition
Example outcome indicators
• Organic matter content (%)
• Nutrient (nitrogen, phosphate) content of soil
• Area and degree of soil compaction in operated areas (roads and harvest areas)
• Degree of soil compaction in operated areas (roads and harvest areas)
Description
To measure soil compaction, a penetrometer can be used. This device mimics the growth of a plant root and its recordings are referred to as the cone index. At a soil resistance of more than 300 psi (psi = penetration resistance), plant roots will no longer be able to penetrate the soil, which is then identified as being compacted.
There are various soil-testing kits available to do simple tests in the field by yourself – for example, nutrients, pH, and soil texture. Most will be geared towards agricultural use, but there are also forest-specific kits. It is recommended that you search online for these, using terms in the language of your country.
Suitable local contexts
Soil compaction: any areas that are not extremely dry.
Advantages Disadvantages
• Can be used by non-experts after limited training. • There is different scoring by different operators of soil penetrometers.
• Depending on the area to be covered, multiple penetrometers may need to be acquired.
Access
Soil compaction:
Duiker (2002) available at https://extension.psu.edu/diagnosing-soil-compaction-using-a-penetrometer-soil- compaction-tester
Donaldson (2012) available at http://gadi.agric.za/articles/Agric/simple.php

Guidance for Demonstrating Ecosystem Services Impacts Download Ecosystem Services Procedure: Impact Demonstration and Market Tools 50
METHODOLOGIES FOR M
EASURING SOIL CONSERVATION
OTHER METHODS
Forest Integrity Assessment tool (under ‘Module 9: Methodologies for measuring biodiversity conservation’)
Impacts: ES4.3: Reduction of soil erosion through reforestation/restoration
Forest Intactness Index (under ‘Module 9: Methodologies for measuring biodiversity conservation’)
Impacts: ES4.1: Maintenance of soil condition
ES4.2: Restoration/enhancement of soil condition
Remote sensing (under ‘Module 9: Methodologies for measuring biodiversity conservation’)
Impacts: ES4.1: Maintenance of soil condition
ES4.2: Restoration/enhancement of soil condition
ES4.3: Reduction of soil erosion through reforestation/restoration
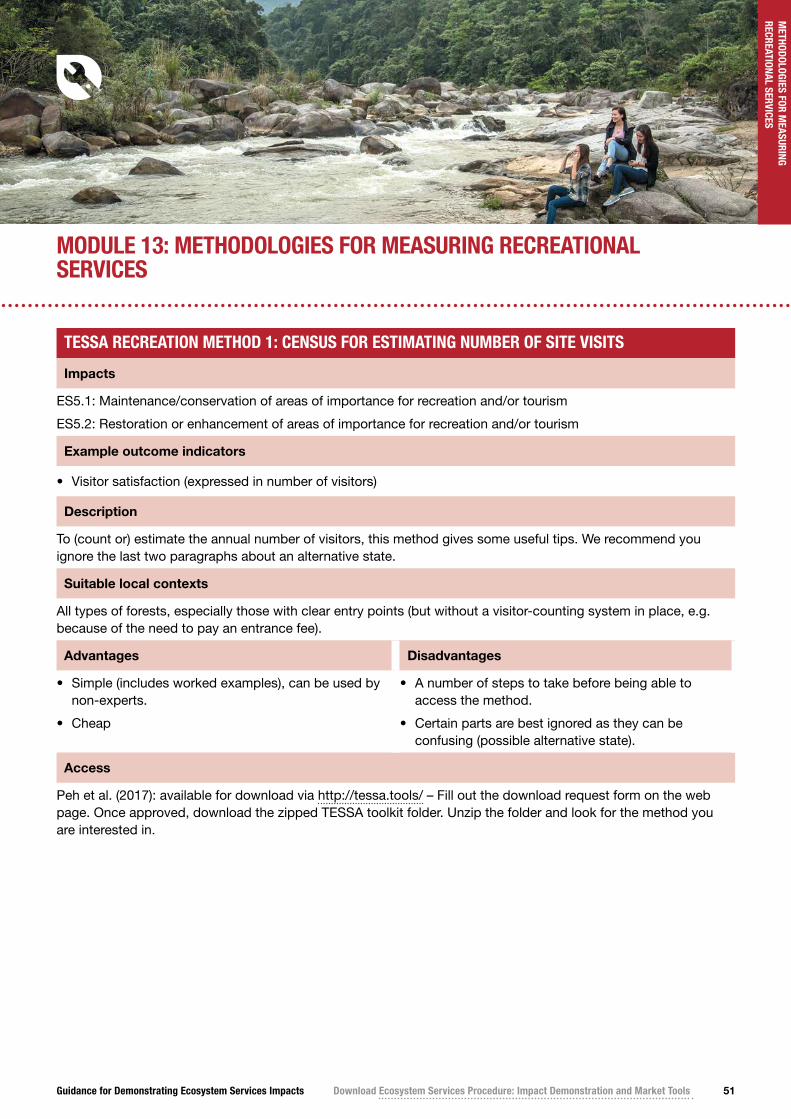
Guidance for Demonstrating Ecosystem Services Impacts Download Ecosystem Services Procedure: Impact Demonstration and Market Tools 51
METHODOLOGIES FOR M
EASURING RECREATIONAL SERVICES
MODULE 13: METHODOLOGIES FOR MEASURING RECREATIONAL SERVICES
TESSA RECREATION METHOD 1: CENSUS FOR ESTIMATING NUMBER OF SITE VISITS
Impacts
ES5.1: Maintenance/conservation of areas of importance for recreation and/or tourism
ES5.2: Restoration or enhancement of areas of importance for recreation and/or tourism
Example outcome indicators
• Visitor satisfaction (expressed in number of visitors)
Description
To (count or) estimate the annual number of visitors, this method gives some useful tips. We recommend you ignore the last two paragraphs about an alternative state.
Suitable local contexts
All types of forests, especially those with clear entry points (but without a visitor-counting system in place, e.g. because of the need to pay an entrance fee).
Advantages Disadvantages
• Simple (includes worked examples), can be used by non-experts.
• Cheap
• A number of steps to take before being able to access the method.
• Certain parts are best ignored as they can be confusing (possible alternative state).
Access
Peh et al. (2017): available for download via http://tessa.tools/ – Fill out the download request form on the web page. Once approved, download the zipped TESSA toolkit folder. Unzip the folder and look for the method you are interested in.
Guidance for Demonstrating Ecosystem Services Impacts Download Ecosystem Services Procedure: Impact Demonstration and Market Tools 52
METHODOLOGIES FOR M
EASURING RECREATIONAL SERVICES
VISITOR QUESTIONNAIRES
Impacts
ES5.1: Maintenance/conservation of areas of importance for recreation and/or tourism
ES5.2: Restoration or enhancement of areas of importance for recreation and/or tourism
Example outcome indicators
• Visitor satisfaction
• Number of charismatic species sightings (e.g. when birdwatching)
Description
A questionnaire can be simple or elaborate, depending on the level of information that you would like to collect.
Items that can be included are:
• general information (e.g. length and purpose of visit, first time or recurrent visitor)
• attributes of the forest (e.g. visual attractiveness and naturalness, cleanliness/unspoiled, number of charismatic species sightings)
• recreation infrastructure availability and maintenance (e.g. paths, signposts, benches, lookout towers, information availability)
• overall satisfaction
• value/price rating (if applicable) or willingness to pay for ecotourism attributes.
For some attributes (1–4), visitors can be asked to select the level of appreciation on a scale, for example from 1 to 5 (1 = poor, 2 = fair, 3 = average, 4 = good, 5 = excellent).
For the number of charismatic species sightings and the willingness to pay for ecotourism attributes, visitors or tour operators could be asked to indicate a quantification (or, if it is more practical, select a range, e.g. 0, 1–5, 6–10, 10–20, > 20 sightings or $$).
It is possible to add open questions (e.g. what did you enjoy most about your visit today?, How can we make improvements for our visitors?) as well as basic socio-demographic information about the visitors (where they come from?). Note that adding more questions would make data analysis more comprehensive (and time-consuming), so it is worth thinking about what information you will need.
Suitable local contexts
All types of forests that are accessible to visitors.
Advantages Disadvantages
• Simple, non-experts can use it after basic training.
• When kept really simple, the questionnaire could be automated, e.g. for visitor satisfaction, visitors could be invited to hit a ‘smiley’ button/touchscreen (unhappy to very happy smile) after their visit.
• For touristic areas, questionnaires may need to be available in multiple languages.
• Visitors may not be willing to participate in a questionnaire (especially if it is lengthy).

Guidance for Demonstrating Ecosystem Services Impacts Download Ecosystem Services Procedure: Impact Demonstration and Market Tools 53
OTHER METHODS
Forest Integrity Assessment tool (under ‘Module 9: Methodologies for measuring biodiversity conservation’)
Impacts: ES5.3: Maintenance/conservation of populations of species of interest for nature-based tourism
ES5.4: Restoration or enhancement of populations of species of interest for nature-based tourism
Fauna species survey techniques (under ‘Module 9: Methodologies for measuring biodiversity conservation’)
Impacts: ES5.3: Maintenance/conservation of populations of species of interest for nature-based tourism
ES5.4: Restoration or enhancement of populations of species of interest for nature-based tourism
METHODOLOGIES FOR M
EASURING RECREATIONAL SERVICES
Guidance for Demonstrating Ecosystem Services Impacts Download Ecosystem Services Procedure: Impact Demonstration and Market Tools 54
REFERENCESREFERENCES
Adikari, Y., and MacDicken, K. (2015) Testing Field Methods for Assessing the Forest Protective Function for Soil and Water. Field Resources Working Paper 185/e. Food and Agriculture Organization of the United Nations, Rome, 36 pp. (Available at http://www.fao. org/3/a-i4509e.pdf, accessed 04 November 2020).
ANSAB (2010) Participatory Biodiversity Monitoring in Community Managed Forests. Asia Network for Sustainable Agriculture and Bioresources, Kathmandu.
Bennet, G., Hamrick, K., Ruef, F., and Goldstein, A. (2016) Verified Value: Investigating Potential Supply and Demand for Verified Ecosystem Services Benefits from Responsibly Managed Forests. A report prepared for the Forest Stewardship Council by Ecosystem Marketplace, a Forest Trends initiative, Washington, DC.
BusinessDictionary (2018) indicator. http://www.businessdictionary.com/definition/indicator.html (accessed 13 September 2018).
CAR (2017) Forest Project Protocol. Climate Action Reserve, Los Angeles, CA. http://www. climateactionreserve.org/how/protocols/forest/ (accessed 04 November 2020).
Center for Theory of Change (nd) How does theory of change work? The Center for Theory of Change, United States of America. http://www.theoryofchange.org/what- is-theory-of-change/how-does-theory-of-change-work/ (accessed 04 November 2020).
Donaldson, C.H. (2012) Simple Techniques for Estimating Soil Compaction. Grootfontein Agricultural Development Institute, Middelburg. (Also available at http://gadi.agric.za/articles/Agric/simple.php, accessed 04 November 2020).
Duiker, S.W. (2002) Diagnosing Soil Compaction Using a Penetrometer (Soil Compaction Tester). Penn State Extension, Agronomy Facts 63. Pennsylvania State University, Pennsylvania, 3 pp. (Available at https:// extension.psu.edu/diagnosing-soil-compaction-using- a-penetrometer-soil-compaction-tester, accessed 04 November 2020).
Estreguil, C., and Mouton, C. (2009) Measuring and Reporting on Forest Landscape Pattern, Fragmentation and Connectivity in Europe: Methods and Indicators Joint Research Centre, Institute for Environment and Sustainability, Varese, 69 pp. (Available at https:// core.ac.uk/download/pdf/38615393.pdf, accessed 04 November 2020).
FAO (2015) Field Guide for Rapid Assessment of Forest Protective Function for Soil and Water. Food and Agriculture Organization of the United Nations, Rome, 15 pp. (Available at http://www.fao.org/3/a-i4498e.pdf, accessed 04 November 2020).
Forest Ecology Lab., Kyoto University (2017) Protocol Manual of the BOLEH Method for Tropical Foresters – Biodiversity Observation for Land and Ecosystem Health (BOLEH) for Bornean FMUs. Version 2017.1. Kyoto University, Kyoto, 28 pp. (Available at http://www. rfecol.kais.kyoto-u.ac.jp/files/Boleh%20manual%20 2017.1.zip, accessed 04 November 2020).
FSC (2016) FSC Advice Note for the Interpretation of the Default Clause of Motion 65. FSC-ADV-20-007-018 V1-0. Forest Stewardship Council, Bonn.
FSC (2020) Ecosystem Services Procedure: Impact Demonstration and Market Tools. FSC-PRO-30-006 V1-1 EN. Forest Stewardship Council, Bonn, 64 pp. (Also available at https://ic.fsc.org/en/document-center/, accessed 04 November 2020).
Gamfeldt, L., Snäll, T., Bagchi, R., Jonsson, M., Gustafsson, L., Kjellander, P., Ruiz-Jaen, M.C., Fröberg, M., Stendahl, J., Philipson, C.D., Mikusin ski, G., Andersson, E., Westerlund, B., Andrén, H., Moberg, F., Moen, J., and Bengtsson, J. (2013) Higher levels of multiple ecosystem services are found in forests with more tree species. Nature Communications 4: 1340. doi: 10.1038/ncomms2328
Global Forest Watch (nd) Interactive map. Global Forest Watch, Washington, DC. http://globalforestwatch.org/map/ (accessed 04 November 2020)
Greenpeace, University of Maryland, World Resources Institute, and Transparent World (nd) Intact Forest Landscapes. 2000/2013. (Accessed through Global Forest Watch on 04 November 2020). https://globalforestwatch.org.
Hasselquist, E.M., Lidberg, W., Sponseller, R.A., Agren, A., and Laudon, H. (2018) Identifying and assessing the potential hydrological function of past artificial forest drainage. Ambio 47 (5): 546–556. (Available at https:// www.ncbi.nlm.nih.gov/pmc/articles/PMC6072640/, accessed 04 November 2020).
Huy, B., Huong, N.T.T., Sharma, B.D., and Quang, V.T. (2013a) Participatory Carbon Monitoring: Manual for Local People. SNV Netherlands Development Organisation, Ho Chi Minh City, 31 pp. (Available at https://www.researchgate.net/publication/323144419_Participatory_Carbon_Monitoring_Manual_for_Local_People, accessed 04 November 2020).
Guidance for Demonstrating Ecosystem Services Impacts Download Ecosystem Services Procedure: Impact Demonstration and Market Tools 55
REFERENCESHuy, B., Huong, N.T.T., Sharma, B.D., and Quang, V.T. (2013b) Participatory Carbon Monitoring: Manual for Local Technical Staff. SNV Netherlands Development Organisation, Ho Chi Minh City, 51 pp. (Available at https://www.researchgate.net/publication/317380319_Participatory_Carbon_Monitoring_Manual_for_Local_Technical_Staff, accessed 04 November 2020).
Huy, B., Huong, N.T.T., Sharma, B.D., and Quang, V.T. (2013c) Participatory Carbon Monitoring: Manual for Field Reference. SNV Netherlands Development Organisation, Ho Chi Minh City, 19 pp. (Available at https://www.researchgate.net/publication/332187277_Participatory_Carbon_Monitoring_Manual_for_Field_Reference, accessed 04 November 2020).
INCAS (2015) Kalimantan Timur. Indonesian National Carbon Accounting System, Jakarta. http://www.incas- indonesia.org/id/data/east-kalimantan/ (accessed 04 November 2020).
IPCC (2006) 2006 IPCC Guidelines for National Greenhouse Gas Inventories, vol. 4 Agriculture, Forestry and Other Land Use. [Eggleston, S., Buendia, L., Miwa, K., Ngara, T., and Tanabe, K. (eds)].Intergovernmental Panel on Climate Change. Institute for Global Environmental Strategies, Kanagawa, Japan. (Available via https://www.ipcc-nggip.iges.or.jp/ public/2006gl/vol4.html, accessed 04 November 2020).
Melin, M., Shapiro, A.C., and Glover-Kapfer, P. (2017) LIDAR for Ecology and Conservation. WWF Conservation Technology Series 1(3). WWF-UK, Woking. (Also available at https://www.wwf.org.uk/sites/default/files/2019-04/Lidar-WWF-guidelines.pdf, accessed 04 November 2020).
Merger, E., and Seebauer, M. (2014) Feasibility of Integrating ‘High Carbon Density’ Forests as a High Conservation Value. UNIQUE Forestry and Land Use, Freiburg.
Millennium Ecosystem Assessment (2005) Ecosystems and Human Well-being: Biodiversity Synthesis. World Resources Institute, Washington, DC, 89 pp. (Available at https://www.millenniumassessment.org/documents/ document.354.aspx.pdf, accessed 04 November 2020).
NRCS (2009) Stream Visual Assessment Protocol version 2. National Biology Handbook, Subpart B – Conservation Planning, Part 614. Natural Resources Conservation Service, Portland, OR, 44 pp. + annexes. (Available at https://efotg.sc.egov.usda.gov/references/public/TN/Tool_SVAP_2_NationalBiologyHandbook_Part-614_Dec2009.pdf, accessed 04 November 2020).
Orr, B.J., Cowie, A.L., Castillo Sanchez, V.M., Chasek, P., Crossman, N.D., Erlewein, A., Louwagie, G., Maron, M., Metternicht, G.I., Minelli, S., Tengberg, A.E., Walter, S., and Welton, S. (2017) Scientific Conceptual Framework for Land Degradation Neutrality. A Report of the Science-Policy Interface. United Nations Convention to Combat Desertification, Bonn, 129 pp. (Available at http://www2.unccd.int/publications/scientific-conceptual-framework-land-degradation-neutrality-report-science-policy, accessed 04 November 2020).
Page, S.E., Siegert, F., Rieley, J.O., Boehm, H-D.V., Jaya, A., and Limin, S. (2002) The amount of carbon released from peat and forest fires in Indonesia during 1997. Nature 420: 61–65. (Available at https:// www.nature.com/articles/nature01131, accessed 04 November 2020).
Peh, K.S-H., Balmford, A.P., Bradbury, R.B., Brown, C., Butchart, S.H.M., Hughes, F.M.R., MacDonald, M.A, Stattersfield, A.J., Thomas, D.H.L., Trevelyan, R.J., Walpole, M., and Merriman, J.C. (2017) Toolkit for Ecosystem Service Site-based Assessment (TESSA). Version 2.0. Cambridge, UK. (Available at http://tessa.tools, accessed 04 November 2020).
Pitman, N. (2011) Social and Biodiversity Impact Assessment Manual for REDD+ Projects: Part 3 Biodiversity Impact Assessment Toolbox. Forest Trends, Climate, Community & Biodiversity Alliance, Rainforest Alliance, and Fauna & Flora International. Washington, DC. (Available at https://s3.amazonaws. com/CCBA/SBIA_Manual/SBIA_Part_3.pdf, accessed 04 November 2020).
R Development Core Team (2011) R.2.10.1. (Available via https://www.r-project.org/).
Riebeek, H. (2013) How to interpret a satellite image: five tips and strategies. NASA Earth Observatory. https://earthobservatory.nasa.gov/Features/ColorImage (accessed 04 November 2020).
Riebeek, H. (2014) Why is that forest red and that cloud blue? How to interpret a false-color satellite image. NASA Earth Observatory. https://earthobservatory.nasa. gov/Features/FalseColor (accessed 04 November 2020).
Rosoman, G., Sheun, S.S., Opal, C., Anderson, P., and Trapshah, R. (eds) (2017) The HCS Approach Toolkit Version 2.0: Putting No Deforestation into Practice.Module 4 Forest and Vegetation Stratification. HCS Approach Steering Group, Singapore. (Available at http://highcarbonstock.org/the-hcs-approach-toolkit/, accessed 04 November 2020).
Guidance for Demonstrating Ecosystem Services Impacts Download Ecosystem Services Procedure: Impact Demonstration and Market Tools 56
REFERENCESSavilaakso, S., and Guariguata, M.R. (2013) Proposed Methodology to Assess Environmental and Social Impacts of Certification of Ecosystem Services. Forest Certification for Ecosystem Services project report.Center for International Forestry Research, Bogor, 35 pp. (Available via https://www.researchgate.net/publication/320347076_Challenges_for_developing_Forest_Stewardship_Council_certification_for_ecosystem_services_How_to_enhance_local_adoption, accessed 04 November 2020).
Science for Environment Policy (2015) Ecosystem Services and Biodiversity. In-depth Report 11 produced for the European Commission, DG Environment by the Science Communication Unit, UWE, Bristol. (Available via http://ec.europa.eu/environment/integration/ research/newsalert/indepth_reports.htm, accessed 04 November 2020).
SHARP programme and HCV Resource Network (2016) Forest Integrity Assessment. HCV Resource Network, Oxford, 35 pp. (Also available https://hcvnetwork.org/library/forest-integrity-assessment-tool/, accessed 04 November 2020).
Shepherd, T.G., and Janssen, H.J. (2000) Visual Soil Assessment, Vol. 3 Field Guide: Hill Country Land Uses. horizons.mw & Landcare Research, Palmerston North, 48 pp. (Available at http://www.andcareresearch.co.nz/publications/books/visual-soil-assessment-field-guide/download-field-guide, accessed 04 November 2020).
Shepherd, G., Stagnari, F., Pisante, M., and Benites, J. (2008) Visual Soil Assessment – Field Guide: Orchards. Food and Agriculture Organization of the United Nations, Rome, 26 pp. (Available at http://www. fao.org/docrep/010/i0007e/i0007e00.htm, accessed 04 November 2020).
Subedi, B.P., Pandey, S.S., Pandey, A., Rana, E.B., Bhattarai, S., Banskota, T.R., Charmakar, S., and Tamrakar, R. (2010) Forest Carbon Stock Measurement: Guidelines for Measuring Carbon Stocks in Community-Managed Forests. ANSAB, FECOFUN, and ICIMOD, Kathmandu/NORAD, Oslo. (Available at https://lib.icimod.org/record/17151, accessed 04 November 2020)
Sutherland, W.J. (2000) The Conservation Handbook – Research, Management and Policy. Blackwell Science, Oxford, 296 pp.
Sutherland, W.J., Newton, I., and Green, R.E. (2004) Bird Ecology and Conservation – A Handbook of Techniques. Oxford Biology, Oxford.
Tyrrell, M.L., Ashton, M.S., Spalding, D., and Gentry, B. (2009) Synthesis and conclusions. In: Tyrrell, M.L., Ashton, M.S., Spalding, D., and Gentry, B. (eds) Forests and Carbon: A Synthesis of Science, Management, and Policy for Carbon Sequestration in Forests, pp. 507–518. Yale School of Forestry & Environmental Studies, New Haven, CT. (Available at http://environment.research.yale.edu/publication-series/5947, accessed 04 November 2020).
Tyrväinen, L. (2014) Forests and recreational services. In: Thorsen, B.J., Mavsar, R., Tyväinen, L., Prokofieva, I., and Stenger, A. (eds) The Provision of Forest Ecosystem Services, Vol. I Quantifying and Valuing Non-marketed Ecosystem Services. European Forestry Institute, Joensuu.
UNICEF (2010) Water Quality Assessment and Monitoring. Technical Bulletin No. 6. United Nations Children’s Fund, New York, 4 pp. (Available at http://home.iitk.ac.in/~anubha/Water.pdf, accessed 04 November 2020).
Verra (2016) Methodology for Improved Forest Management through Reduced Impact Logging. VCS Methodology VM0035. Version 1.0. The Nature Conservancy and TerraCarbon, Washington, DC, 28 pp. (Available via http://verra.org/methodology/ vm0035-methodology-for-improved-forest- management-through-reduced-impact-logging-v1-0/, accessed 04 November 2020)
Werner, F.A., and Gallo-Orsi, U. (2016) Biodiversity Monitoring for Natural Resource Management – An Introductory Manual. Deutsche Gesellschaft für Internationale Zusammenarbeit, Eschborn and Bonn. doi: 10.13140/RG.2.1.3141.8488/1
WHO (nd-a) Drinking-water quality guidelines. World Health Organization, Geneva. http://www.who.int/ water_sanitation_health/water-quality/guidelines/en/ (accessed 04 November 2020).
WHO (nd-b) Recreational waters. World Health Organization, Geneva. http://www.who.int/water_sanitation_health/water-quality/recreational/en/ (accessed 04 November 2020).
Wunder, S., and Thorsen, B.J. (2014) Quantifying water externalities from forests. In: Thorsen, B.J., Mavsar, R., Tyväinen, L., Prokofieva, I., and Stenger, A. (eds) The Provision of Forest Ecosystem Services, Vol. I Quantifying and Valuing Non-marketed Ecosystem Services. European Forestry Institute, Joensuu.
Guidance for Demonstrating Ecosystem Services Impacts Download Ecosystem Services Procedure: Impact Demonstration and Market Tools 57
PHOTO CREDITS
Front cover: Peter Ellis, TNC; Victor Fidelis Sentosa, WWF-Indonesia; Shambhu Charmakar/ANSAB, Storyteller-Labs
Page 3: Storyteller-Labs; Milan Reška
Page 4: Shambhu Charmakar/ANSAB; Storyteller-Labs
Page 5: Thi Que Anh Vu; Mateo Cariño Fraisse
Page 8: Milan Reška
Page 10: Allegra Newman
Page 11: Storyteller-Labs
Page 13: Allegra Newman
Page 16: Storyteller-Labs
Page 17: Roosevelt Garcia
Page 18: Storyteller-Labs
Page 20: Vlad Sokhin
Page 21: Shambhu Charmakar/ANSAB
Page 22: Aidenvironment
Page 23: Ana Young; Peter Ellis, TNC
Page 25: Peter Ellis, TNC
Page 29: Thi Que Anh Vu
Page 38: Ana Young
Page 43: Milan Reška
Page 46: Thi Que Anh Vu
Page 51: Storyteller-Labs
ABBREVIATIONS
DBH diameter at breast height
ESCD Ecosystem Services Certification Document
FSC Forest Stewardship Council
GIS geographic information system
GPS global positioning system
ha hectare
HCS high carbon stock
HCV high conservation value
IFL intact forest landscape
IPCC Intergovernmental Panel on Climate Change
NGO nongovernmental organization
REDD+ reducing emissions from deforestation and forest degradation and the role of conservation, sustainable management of forests and enhancement of forest carbon stocks in developing countries

Title: Guidance for Demonstrating Ecosystem Services Impacts
Document reference code: FSC-GUI-30-006 V1-1 EN
Approval body: FSC Director Policy Operations
Contact for comments: FSC International Center Performance and Standards Unit Adenauerallee 13453113 Bonn Germany
+49 (0)228 36766 0
+49 (0)228 36766 30
© 2021 Forest Stewardship Council AC. All rights reserved. FSC® F000100
No part of this work covered by the publisher’s copyright may be reproduced or copied in any form or by any means (graphic, electronic or mechanical, including photocopying, recording, taping, or information retrieval systems) without the written permission of the publisher.
Printed copies are uncontrolled and for reference only. Please refer to the electronic copy on the FSC website (ic.fsc.org) to ensure you are referring to the latest version.
ic.fsc.org FSC International Center GmbH
Adenauerallee 134 · 53113 Bonn · Germany
All Rights Reserved FSC® International 2021 FSC®F000100