A concave—convex elliptic problem involving the fractional Laplacian
GSA-PCA: gene set generation by principalcomponent analysis of the Laplacian matrix of ametabolic networkJacobson and Emerton
Jacobson and Emerton BMC Bioinformatics 2012, 13:197http://www.biomedcentral.com/1471-2105/13/197

Jacobson and Emerton BMC Bioinformatics 2012, 13:197http://www.biomedcentral.com/1471-2105/13/197
RESEARCH ARTICLE Open Access
GSA-PCA: gene set generation by principalcomponent analysis of the Laplacian matrix of ametabolic networkDan Jacobson* and Guy Emerton
Abstract
Background: Gene Set Analysis (GSA) has proven to be a useful approach to microarray analysis. However, most ofthe method development for GSA has focused on the statistical tests to be used rather than on the generation ofsets that will be tested. Existing methods of set generation are often overly simplistic. The creation of sets fromindividual pathways (in isolation) is a poor reflection of the complexity of the underlying metabolic network. Wehave developed a novel approach to set generation via the use of Principal Component Analysis of the Laplacianmatrix of a metabolic network. We have analysed a relatively simple data set to show the difference in resultsbetween our method and the current state-of-the-art pathway-based sets.
Results: The sets generated with this method are semi-exhaustive and capture much of the topological complexityof the metabolic network. The semi-exhaustive nature of this method has also allowed us to design ahypergeometric enrichment test to determine which genes are likely responsible for set significance. We show thatour method finds significant aspects of biology that would be missed (i.e. false negatives) and addresses the falsepositive rates found with the use of simple pathway-based sets.
Conclusions: The set generation step for GSA is often neglected but is a crucial part of the analysis as it definesthe full context for the analysis. As such, set generation methods should be robust and yield as complete arepresentation of the extant biological knowledge as possible. The method reported here achieves this goal and isdemonstrably superior to previous set analysis methods.
BackgroundGene Set Analysis (GSA) has proven to be a useful ap-proach to microarray analysis. The underlying principle ofGSA is that aggregate scores are assigned to each GeneSet based on all the individual gene scores within that set.There have been several different methods proposed to as-sign scores to gene sets [1-8]. Of the approaches publishedto date, Gene Set Enrichment Analysis (GSEA) [3] [7]seems to have become the most commonly used. Of issuethough is the fact that GSEA is based on a modifiedKolmogorov-Smirnov test. This test can exhibit a lack ofsensitivity; is difficult to employ in practical use, andrequires at least 1000 permutations to be run. However, ithas recently been found [9] that a one-sample Z-test canbe very effective with gene sets for detecting shifts from
* Correspondence: [email protected] for Wine Biotechnology, Stellenbosch University, Stellenbosch 7600,South Africa
© 2012 Jacobson and Emerton; licensee BioMCreative Commons Attribution License (http:/distribution, and reproduction in any medium
the mean (sets that collectively show up or down regula-tion of their constituent genes). Unfortunately, this willnot identify gene sets that have a balance of both up anddown regulated genes as there will not be the requisiteshift from the mean but in statistical terms is rather achange in scale. However, a chi-squared test can be usedto good effect to detect such changes in scale and thusfind gene sets that exhibit a mixture of up and down regu-lation [9]. Furthermore, Irizarry et al. [9] have shown thatthe use of a combination of the computationally simpleand rapid Z-test and chi-squared methods outperformGSEA. Dinu et al. [10]have extended the Significance Ana-lysis of Microarrays to Gene Set Analysis (SAM-GS). Offurther interest is the method described by Efron and Tib-shirani [11]which uses a max-mean statistic to target genesets with only a fraction of the genes differentiallyexpressed and the approach of Falcon and Gentleman [12]which takes into account the fact that overlap exists
ed Central Ltd. This is an Open Access article distributed under the terms of the/creativecommons.org/licenses/by/2.0), which permits unrestricted use,, provided the original work is properly cited.

Jacobson and Emerton BMC Bioinformatics 2012, 13:197 Page 2 of 14http://www.biomedcentral.com/1471-2105/13/197
between different gene sets. A good review of the variousstatistical approaches has been written by Goeman andBühlmann [13].
Gene set generationGiven the discussion above it is clear that considerableeffort has been made to apply different statistical meth-ods to GSA, however all of the methods are highlydependent on the very first step: the predefinition of thesets of genes to be analysed. The theoretical combinator-ial space for gene sets is quite large and is defined by thebinomial distribution of the number of genes in the gen-ome and the size of the desired set:
genesset size
� �� genes!
set size! genes� set sizeð Þ!
Thus, if one wanted to create all of the possible uniquesets with 8 members for the ~6000 genes present in theyeast genome, there would be (6000 choose 8) = 4.1 × 1025
sets. This is clearly an unfeasible number of sets to gener-ate, much less evaluate. Instead, methods to date have usedextant biological knowledge to generate relatively smallnumbers of sets to be evaluated. One of the commonapproaches taken for set generation is to simply place thegenes involved in a specific pathway into a set. This
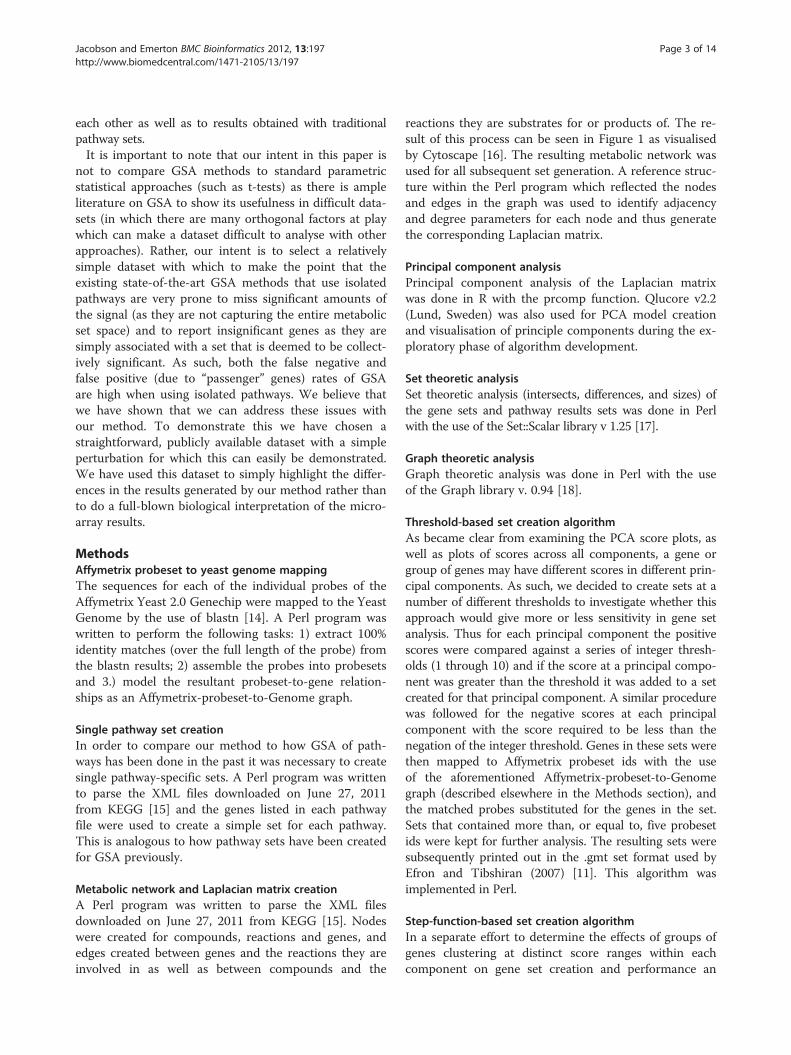
Figure 1 Location of the sets of nodes derived from the first three prnetwork, topographically depicted on the metabolic network itself.
approach suffers from the fact that pathways are merelyhuman abstractions that are useful for visualisation and in-terpretation, as they can serve as mnemonic devices forareas of metabolism. However, in isolation, single pathwaysets do not reflect the continuously connected nature ofbiological networks. The metabolic network of Saccharo-myces cerevisiae (and the location of some of the gene setsfound by PCA) can be seen in Figure 1. It is clear that thisis a complex, interconnected network and, as such, any at-tempt to use simple pathway representations of it will inev-itably be an incomplete representation of the underlyingnetwork. We therefore propose that many “pathway sets”are, by definition, rather arbitrary and incomplete, andgene expression patterns may therefore be potentiallymissed due to improper/incomplete set generation. Wesuggest that a method that semi-exhaustively partitions thenetwork into overlapping sets would be a better approachto set generation. In order to achieve this we have devisedtwo algorithms that use the Principal Component Analysisof a Laplacian matrix of a metabolic network to do geneset generation. We have also devised a hypergeomtric testto determine which of the genes in the sets identified bygene set analysis are likely to be driving set selection. Wehave used the resulting gene sets to analyse a publicly avail-able microarray dataset and compare the results obtainedfrom our algorithms (and their respective parameters) to
incipal components of the laplacian matrix of the metabolic
Jacobson and Emerton BMC Bioinformatics 2012, 13:197 Page 3 of 14http://www.biomedcentral.com/1471-2105/13/197
each other as well as to results obtained with traditionalpathway sets.It is important to note that our intent in this paper is
not to compare GSA methods to standard parametricstatistical approaches (such as t-tests) as there is ampleliterature on GSA to show its usefulness in difficult data-sets (in which there are many orthogonal factors at playwhich can make a dataset difficult to analyse with otherapproaches). Rather, our intent is to select a relativelysimple dataset with which to make the point that theexisting state-of-the-art GSA methods that use isolatedpathways are very prone to miss significant amounts ofthe signal (as they are not capturing the entire metabolicset space) and to report insignificant genes as they aresimply associated with a set that is deemed to be collect-ively significant. As such, both the false negative andfalse positive (due to “passenger” genes) rates of GSAare high when using isolated pathways. We believe thatwe have shown that we can address these issues withour method. To demonstrate this we have chosen astraightforward, publicly available dataset with a simpleperturbation for which this can easily be demonstrated.We have used this dataset to simply highlight the differ-ences in the results generated by our method rather thanto do a full-blown biological interpretation of the micro-array results.
MethodsAffymetrix probeset to yeast genome mappingThe sequences for each of the individual probes of theAffymetrix Yeast 2.0 Genechip were mapped to the YeastGenome by the use of blastn [14]. A Perl program waswritten to perform the following tasks: 1) extract 100%identity matches (over the full length of the probe) fromthe blastn results; 2) assemble the probes into probesetsand 3.) model the resultant probeset-to-gene relation-ships as an Affymetrix-probeset-to-Genome graph.
Single pathway set creationIn order to compare our method to how GSA of path-ways has been done in the past it was necessary to createsingle pathway-specific sets. A Perl program was writtento parse the XML files downloaded on June 27, 2011from KEGG [15] and the genes listed in each pathwayfile were used to create a simple set for each pathway.This is analogous to how pathway sets have been createdfor GSA previously.
Metabolic network and Laplacian matrix creationA Perl program was written to parse the XML filesdownloaded on June 27, 2011 from KEGG [15]. Nodeswere created for compounds, reactions and genes, andedges created between genes and the reactions they areinvolved in as well as between compounds and the
reactions they are substrates for or products of. The re-sult of this process can be seen in Figure 1 as visualisedby Cytoscape [16]. The resulting metabolic network wasused for all subsequent set generation. A reference struc-ture within the Perl program which reflected the nodesand edges in the graph was used to identify adjacencyand degree parameters for each node and thus generatethe corresponding Laplacian matrix.
Principal component analysisPrincipal component analysis of the Laplacian matrixwas done in R with the prcomp function. Qlucore v2.2(Lund, Sweden) was also used for PCA model creationand visualisation of principle components during the ex-ploratory phase of algorithm development.
Set theoretic analysisSet theoretic analysis (intersects, differences, and sizes) ofthe gene sets and pathway results sets was done in Perlwith the use of the Set::Scalar library v 1.25 [17].
Graph theoretic analysisGraph theoretic analysis was done in Perl with the useof the Graph library v. 0.94 [18].
Threshold-based set creation algorithmAs became clear from examining the PCA score plots, aswell as plots of scores across all components, a gene orgroup of genes may have different scores in different prin-cipal components. As such, we decided to create sets at anumber of different thresholds to investigate whether thisapproach would give more or less sensitivity in gene setanalysis. Thus for each principal component the positivescores were compared against a series of integer thresh-olds (1 through 10) and if the score at a principal compo-nent was greater than the threshold it was added to a setcreated for that principal component. A similar procedurewas followed for the negative scores at each principalcomponent with the score required to be less than thenegation of the integer threshold. Genes in these sets werethen mapped to Affymetrix probeset ids with the useof the aforementioned Affymetrix-probeset-to-Genomegraph (described elsewhere in the Methods section), andthe matched probes substituted for the genes in the set.Sets that contained more than, or equal to, five probesetids were kept for further analysis. The resulting sets weresubsequently printed out in the .gmt set format used byEfron and Tibshiran (2007) [11]. This algorithm wasimplemented in Perl.
Step-function-based set creation algorithmIn a separate effort to determine the effects of groups ofgenes clustering at distinct score ranges within eachcomponent on gene set creation and performance an
Jacobson and Emerton BMC Bioinformatics 2012, 13:197 Page 4 of 14http://www.biomedcentral.com/1471-2105/13/197
algorithm for set creation was created as follows. An ini-tial empty score-range set was created as an array andheld in memory. Scores at each component were sortedin numerical rank order. For positive scores greater thanone, neighbouring rank order scores were subtractedfrom one another and if the difference was < 1 they wereadded to the existing score-range set, if the differencewas > 1 the a existing score-range set was closed and anew one (for the next score range) was created and thenew gene added to it. This process was repeated acrossall of the scores in each principle component. A similarprocedure was used for the negative scores less thannegative one. This algorithm was implemented in Perl.
Gene set analysis with newly generated setsWe used the sets created by the Laplacian PCA methoddescribed above for the max-mean method by Efron andTibshiran (2007) [11]. In order to test the new sets on adata set that would likely have a limited number of sub-tle changes on metabolism, we selected a data set thatexamined the effect of an O-glycosylation inhibitor,OGT2468, on gene expression deposited by JavierArroyo. They used the Saccharomyces cerevisiae strainSEY6210 and analysed the global transcriptome in theabsence of the OGT2468 (but with the correspondingamount of DMSO, 0.1%) and in the presence of 0.1 μMof OGT2468. They report that “yeast cells exposed toOGT2468 in YPD growth medium show a significant in-hibition of mating, filamentation and induction of cellwall compensatory mechanism.” The resulting micro-array data was downloaded from the Gene ExpressionOmnibus (series id GSE12193) [19]. Specifically, themicroarrays used were those for the DMSO control(GSM306567, GSM306565, GSM306569) vs. the cellstreated with 0.1 μM of OGT2468 (GSM306573,GSM306577, GSM306581). The microarray data wasnormalised in R with the RMA method [20] and theresulting log2 transformed data used for GSA. GSA wasperformed on this data with the following settings: resp.type = "Two class unpaired", nperms = 1000, minsize =2 and FDR cut = 0.05. The GSA analysis for the largestnumber of sets (3481 Threshold 1 sets) ran in 2.3 min-utes on a single CPU Intel Xeon E5620 2.40 GHz CPU.The genes found in the sets created at PCA scorethresholds 1 through 10 which were determined to bedifferentially expressed by GSA were tested with thehypergeometric test described above. The genes selectedby this test were then used to create genes-only andcompounds-containing pathway-centric graphs asdescribed below. These graphs were visualised in cytos-cape. Fold change values were calculated as the ratio ofthe average expression values for the samples containing0.1 μM of OGT2468 to the DMSO controls, and used as
node attributes to colour the gene nodes in cytoscape.The negative reciprocal was taken of ratios less than 1.
Hypergeometric enrichment test to determine genesmost responsible for set selectionIn order to determine which genes identified by GSA onour newly derived sets are drivers we implemented ahypergeometric test. The probability (p) of obtaining anysuch set of values is given by the hypergeometric distri-bution:
p ¼aþ ba
� �cþ dc
� �
naþ c
� �
Wherenk
� �is the binomial distribution, a = Number
of times the gene is found in significant sets; b = Num-ber of times all other genes are found in significant sets;c = Number of times the gene is found in non-significant sets; d = Number of times all other genes arefound in non-significant sets, and n = a + b + c + d. APerl program was written to parse each of the gene setanalysis results as well as the original sets used for theanalysis after thresholding, and from these two sourcescalculate a, b, c, d and n. The two tailed Fisher moduleof the Text::NSP Perl package [21] was used to test forsignificance using these values and multiple hypothesistesting corrected for with the Holm-Bonferroni method[22]. Genes with a q-value less than or equal to 0.1 werereported as significantly enriched (i.e. drivers) andincluded in a pathway-centric network reconstructionfor visualisation and interpretation.
Pathway-centric network reconstruction for visualisationand interpretationAs was mentioned in the introduction, pathways arereally human abstractions of subgraphs of a metabolicnetwork that are particularly useful as mnemonic devicesfor contextual visualisation. Unfortunately, visualizingthe network with all of the reaction, compound geneand pathway nodes present is overwhelming and as suchdifficult to interpret. If a biologist can see that the genesselected are part of a well-known pathway it helps themto interpret what part of the metabolic network they areexamining. By evaluating the results in this linked meta-bolic context, one is able to see relationships betweenareas of metabolism that simply would not be apparentby looking at lists of genes or lists of pathways. Thus, wehave created two types of visualisations in order to bet-ter show the metabolic context of the results. The firstvisualisation just contains the significant genes and thepathways that they are associated with. This is a useful

Jacobson and Emerton BMC Bioinformatics 2012, 13:197 Page 5 of 14http://www.biomedcentral.com/1471-2105/13/197
and relatively simple way to visualize the results. How-ever, there are cases where related pathways are affectedbut do not show up as connected without the com-pounds being included in the network. Inclusion of all ofthe compounds leads to a very complex figure so wehave chosen to simply create a single edge betweenpathways if they share one or more compounds.Raw KEGG XML files actually pre-group all genes,
reactions and compounds into these contextualisedpathways. In order to provide these sorts of visualisationcues a pathway-centric view of the metabolic networkwas therefore constructed as follows:A Perl program was written to parse the KEGG XML
files such that a node was created for each pathway asdefined in KEGG. An edge was created between the path-way node and each gene or compound that is associatedwith that pathway. A gene determined to be significant byGSA and the subsequent hypergeometric test was used asa seed for a breadth first search of the pathway-centricgraph with a radius of one. This was done iteratively foreach gene and the union taken of the resulting subgraphs(for examples of outputs see Figure 2). A similar proced-ure was followed for the compound-linked-pathways viewwith the additional step of the creation of a single edge be-tween pathways that shared one or more compound.
Genes-only and compounds-containing graphsTwo different graphs were then created, one with andone without compounds. For the genes-only graph, com-pounds and their associated edges were simply removedfrom the graph. The compounds-containing graph wasconstructed by removing all compounds with a degreeless than two, such that compounds only served to linkpathway nodes together. The genes-only view of thegraph is easier to visualise and interpret whereas thegraph containing pathway-linking compounds was usefulin showing the connectedness (or lack thereof ) of thesubgraphs containing differentially expressed genes.
Gene Ontology and Funcat enrichment analysisGenes that were found by the threshold 1 method but notby the pathway GSA were checked for GO Enrichment byGOEAST [23] and FunCat Enrichment at MIPS [24].
Results and discussionGraph representation of a metabolic networkMathematically, a metabolic network can be representedas a graph, G = (V,E), where V is a set of n nodes andE a set of e edges (connections) between nodes. Let A(G) = A be the adjacency matrix of G such that eachelement Aij is assigned a value of one if the correspond-ing nodes are adjacent and zero if they are not. Thegraph can be further described by a Laplacian transform
of the adjacency matrix. The Laplacian matrix L(li,j)nxnisdefined as:
li;j:¼deg v ið Þð Þif i ¼ j�l if i 6¼ j and v ið Þis adjacent to vðjÞ0 otherwise
8<:
where deg(v(i)) denotes the degree of v(i), i.e. thenumber of edges incident to (i). Thus, the LaplacianMatrix is the difference between the diagonal DegreeMatrix (D) and the Adjacency Matrix (A).L = D - AA number of graph theoretic properties of a graph can
be derived from its Laplacian matrix and the eigenvectorand eigenvalues thereof, including the number of con-nected components in the graph; its algebraic connectiv-ity (Fielder value); its spectral gap, etc. In fact, the PCAof a graph and spectral graph clustering have beenlinked previously by Saerens et al. [25].
Principle component analysisGiven a matrix, one can use multivariate statistical methodssuch a Principal Component Analysis (PCA) to try and findcorrelative relationships amongst the vectors. PCA is abilinear modelling method which gives a visually interpret-able overview of the most salient information in large,multidimensional datasets. By plotting the principal compo-nents it is possible to view statistical relationships betweendifferent variables in complex datasets and detect and inter-pret object groupings, similarities or differences, as well asthe relationships between the different variables [26]. Asdescribed in the Methods section a graph was created fromthe KEGG database [15] and a Laplacian matrix derivedfrom said graph. The Laplacian matrix produced, while nota typical object-variable data matrix, may still be analysedwith multivariate methods. It was hypothesised that a princi-pal component model would enumerate groups of nodeswithin the graph with similar topological structure, with thethought that similar columns within the Laplacian matrixwould explain a certain amount of ‘variance’ in the matrix.Accordingly, we then performed PCA on the Laplacianmatrix with the hopes of finding an exhaustive set of struc-tures within the graph that could be used for gene setgeneration.
Gene set generation with score thresholds and step-functionsIt was observed that the scores for each principal com-ponent often generated discontinuous clusters of objects.Two algorithms for set generation were therefore devel-oped: one based on a step function that took the scorediscontinuities into account; and another that specifiedseveral predetermined thresholds. The sensitivity levelsof both these methods were subsequently compared.These algorithms were used to generate gene sets from
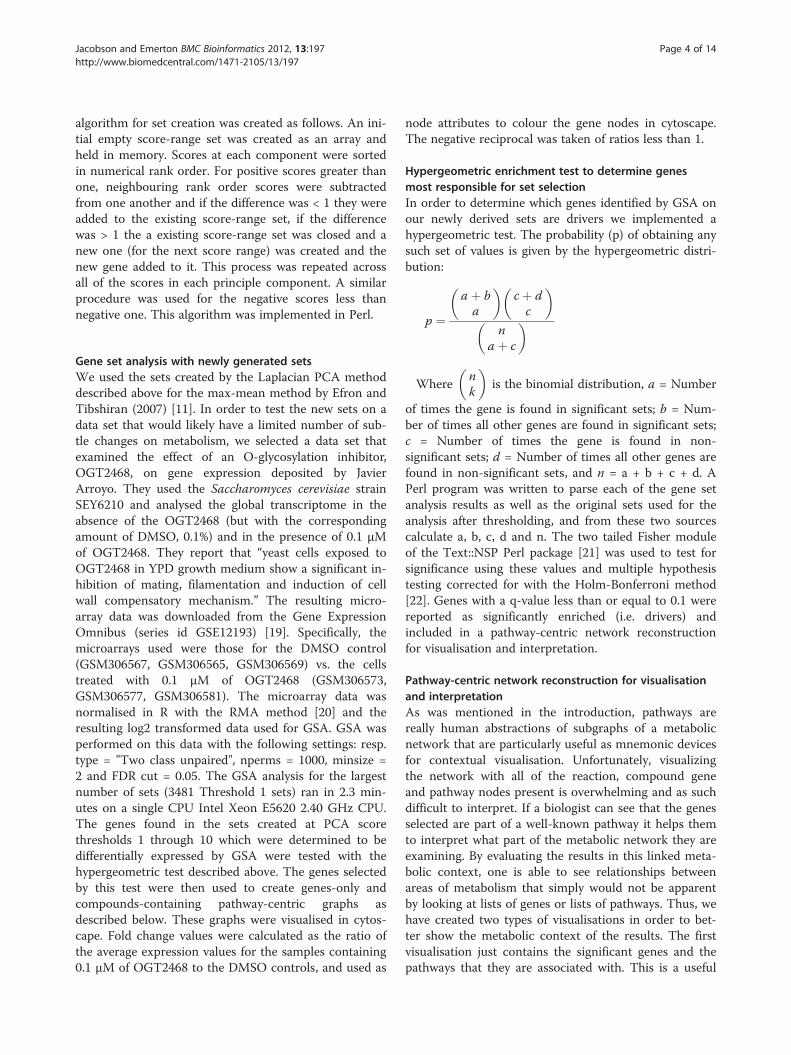
Figure 2 Genes from PCA scores threshold = 1 derived sets found to be significantly differentially expressed in their pathway-centriccontext. Nodes are coloured different intensities of blue (decrease) or red (increase) based on the fold change between treatment and control.
Jacobson and Emerton BMC Bioinformatics 2012, 13:197 Page 6 of 14http://www.biomedcentral.com/1471-2105/13/197
Jacobson and Emerton BMC Bioinformatics 2012, 13:197 Page 7 of 14http://www.biomedcentral.com/1471-2105/13/197
the genes found in each of the 2656 principal compo-nents (see Methods).
Gene set analysis with new gene setsWe used the sets created by the Laplacian PCA methoddescribed in the Methods section to perform the max-mean method of GSA [11]. In order to test the new setson a dataset that would likely have a limited number ofsubtle changes on metabolism, we selected a data setthat examined the effect of an O-glycosylation inhibitor.The analysis was done as described in the Methods sec-tion and the results described below.
Hypergeometric enrichment test to determine genesmost responsible for set selectionOne of the difficulties faced in Gene Set Analysis is thatit is unclear which of the genes within a set found to besignificantly and collectively different are most respon-sible for that difference. This means that each significantgene set likely has a subset of genes that really accountfor the difference that is detected (“drivers”); and a sep-arate subset of genes that do not significantly contributeto the greater set’s difference (“passengers”). Fortunately,due to the semi-exhaustive nature of our set creation al-gorithm we have the ability to test for the likelihood ofset members being drivers or passengers. If a gene isfound in a number of significant sets at a considerablyhigher frequency than one would expect to see at ran-dom then it is more likely that the gene in question is adriver. In order to determine which genes identified byGSA using our newly derived sets are drivers we imple-mented a hypergeometric test as described in the Meth-ods section. Those genes considered to be drivers wereincluded in a pathway-centric network reconstructionfor visualisation and interpretation (see Methods) asseen in Figures 2, 3, 4.
High numbers of components are required to model ametabolic laplacian matrixFirst, we noticed upon examining the Laplacian PCAmodel that it needed 2655 principal components to explainall of the variance in the matrix (the same number of total‘variables’ in the matrix). This is unusual as PCA modelsare normally quite efficient at reducing the dimensionalityof a data set. In this case we believe that it suggests thatthe model is likely semi-exhaustively explaining local struc-tures in the graph. Additional file 1: Figure S1 is a plot ofthe percentage of variance explained by each principlecomponent. It is easy to see from this plot that the variancebeing modelled is spread out quite broadly over the 2655components with almost all of the components individuallyexplaining less than 0.08% of the variance.
Individual components model local areas of the graphIn order to test this hypothesis visually we extractednodes from each principle component and examinedtheir locations in the metabolic network. Figure 1 is anoverview of the metabolic network with the significantnodes found in the first three principal components(according to an imposed score threshold of 1), identi-fied in green and their adjacent edges identified in red. Itis clear that the first three principal components areidentifying distinct, localised structures in the graph.With the hypothesis that genes that are closely relatedto one another in the metabolic network are likely to beco-regulated we believe that each principal componentin the model is a candidate for one or more sets of genesto be tested by GSA. To examine this further we lookedat the graph structures being located by many of theprincipal components. We found that the principal com-ponents are finding graph structures with highly con-nected sets of genes that will likely be good candidatesfor GSA. We continued this analysis through manyhigher components of the model to confirm that thiswas indeed occurring throughout a broad range of com-ponents. To confirm this observation the distance be-tween all genes in each set was determined and theaverage distance within each set calculated to be 8.4.Given that there is a distance of one between a gene andthe reaction it is associated with and a distance of two(reaction to compound to next reaction) between reac-tions, this means that in each set, on average, each geneis being associated with genes involved the first, secondor third neighboring reactions. The distances betweenall genes in the metabolic network have been calculatedand their sorted distribution is shown in Additional file2: Figure S2. The red arrow indicates the average intra-set gene distance. As such, the sets contain only about20% of the possible gene pair distances. Thus, it appearsthat sets are modelling relatively local topologies in thenetwork.
Semi-exhaustive nature of PCA-Graph gene set creationWe examined the distribution of PCA scores for eachgene in the model across all of the principal compo-nents. Almost all genes participate in multiple principalcomponents. This indicates that sets generated from theprincipal components from the PCA of the MetabolicLaplacian matrix will be topologically exhaustive, that isto say covering the combinatorial space as constrainedby the graph in an overlapping fashion. To confirm thiswe examined the number of times that each gene wasfound in sets created by a principal component scorethreshold of one. Additional file 3: Figure S3 shows therank order distribution of the number of sets each geneis a member of. Only two genes belong to only one setand some genes belong to as many as 336 different sets.

Figure 3 Genes from PCA scores threshold = 1 derived sets found to be significantly differentially expressed in their pathway-centricnetwork reconstruction including edges between pathways that share at least one compound. Node colouring as described in Figure 2.
Jacobson and Emerton BMC Bioinformatics 2012, 13:197 Page 8 of 14http://www.biomedcentral.com/1471-2105/13/197

Jacobson and Emerton BMC Bioinformatics 2012, 13:197 Page 9 of 14http://www.biomedcentral.com/1471-2105/13/197
As such, it is clear that in GSA almost every gene wouldbe tested in combination with many other groups ofgenes, which gives our method a higher likelihood offinding co-regulated sets of genes. We checked the loca-tion of the 20 genes that belong to the fewest gene setsand found that they typically are either located in the ex-treme leaf nodes of the large network or in the small dis-connected subgraphs. Intuitively, this makes sense asmembers of the outer extremities of the large networkand the disconnected subgraphs will be part of fewergraph structure variants and therefore occur in fewerprincipal components, and thus belong to fewer setsderived from the principal component scores.
Degree of overlap amongst setsIn order to determine the level of overlap between thesets generated by this approach an all-against-all com-parison of the sets was done by way of set theoreticintersects. For the 3481 sets generated at a score thresh-old of one, an all-against-all comparison is comprised of10,753,203 set intersects. The number of sets intersect-ing with each individual set was calculated and plotted(Additional file 4: Figure S4A). As can be seen from
Figure 4 Zoom in of the Genes and Pathways from Figure 3 that aremetabolism, Glycosylphosphatidylinositol(GPI)-anchor biosynthesis, InPhosphatidylinositol signaling system. Node colouring as described in F
Additional file 4: Figure S4A many of the sets do haveintersects with one another ranging from as few as 2 toas many as 2702. In order to achieve a semi-exhaustivecoverage of the graph’s local topology this sort of overlapis desirable, as long as the degree of overlap is not sohigh that the sets become effectively redundant. In orderto determine the degree of the overlap amongst sets thesize of each intersection was calculated, followed bythe number of set intersections of each respective size(Additional file 4: Figure S4B). Of the 10,753,203 setintersects performed, 8,225,500 showed no shared genesat all, 1,125,959 shared one gene, and 519,333 shared 2genes. As can be seen in Additional file 4: Figure S4B thenumber of set intersections with higher degrees of overlapdrops very quickly. This would appear to be a very desir-able result as it appears that the Laplacian PCA is yieldingsets that thoroughly cover local topological structures inthe graph without introducing an excessive level of over-lap, i.e. redundancy, in the sets. As such the set intersec-tion space is actually quite sparse as 80% of the potentialset intersections show no overlap at all. This again empha-sizes that local topological structures in the graph arebeing modelled by PCA, as one would not expect there to
involved in Glycerolipid metabolism, Glycerophospholipidositol phosphate metabolism, N-Glycan biosynthesis, and theigure 2.
Jacobson and Emerton BMC Bioinformatics 2012, 13:197 Page 10 of 14http://www.biomedcentral.com/1471-2105/13/197
be overlaps of subgraphs (and the sets generated fromthem) that are topologically separated from one another.
Set sizeThe sizes of the sets vary at each principal componentdepending both on the region of the graph being mod-elled by that component and the magnitude of the scorethreshold employed. Additional file 5: Figure S5 showsthe distribution of set sizes when a score threshold of+/− 1, 5 or 10 is used. The set sizes range from 5 to 92members with an average set size of 27 genes.
Hypergeometric testThe hypergeometric test resulted in a ten-fold reductionin the number of genes from the threshold 1 sets up to aforty-nine-fold reduction from the threshold 5 sets, thussimplifying the resulting network that needed to bevisualised and analysed.
Results from sets derived from different PCA scorethresholdsSets created at different PCA thresholds naturally havedifferent set sizes and composition and as such may haveslightly different sensitivities in finding differentialchanges in some portions of the metabolic network. Thethreshold-based set generation algorithm produced3481, 2703, 1487, 745, 331, 168, 80, 49 and 35 sets forthreshold 1, 2, 3, 4, 5, 6, 7, 8, 9, and 10 respectively for atotal of 11,216 sets.In order to evaluate the efficacy of sets created at
different thresholds, a set theoretic approach was usedto determine the effects of these thresholds employedduring set generation on the pathways identified byGSA. Lists (sets) of pathways with significant differ-ences were generated from the results of GSA per-formed with sets generated with PCA score thresholds1 through 7 (see Methods). Thresholds 6 through 10yielded no results after the application of the hyper-geometric test. This is likely due to the relatively smallnumber of genes and sets generated at the higherthreshold levels. As such, there are insufficient differ-ences in global and individual set frequencies for thehypergeometric test to discriminate between driver andpassenger genes (i.e. to generate sufficiently low p-values).The set theoretic difference was then determined betweenthe pathway sets resulting from PCA scores thresholds 2through 5 as compared to the pathway set found using aPCA scores threshold of 1.All but one of the pathways found at thresholds 2
through 5 were also found with a threshold of 1, the oneexception being one gene in Aminoacyl-tRNA biosyn-thesis found at threshold 3. As expected, the threshold 1results contained many pathways not found at the otherthresholds, specifically: 11, 17, 22 and 24 more pathways
were found with threshold 1 than with thresholds 2, 3, 4or 5 respectively. However, as the different thresholdscontain subsets of the pathways and genes found inthreshold 1 they can be used as a ‘zoom-in, zoom-out’method to view focused portions of the differentiallychanged network. Figure 2 contains the results of setsgenerated with a PCA scores threshold of 1. Figure 3 isa slightly different view of the results, containing edgesbetween pathways that share one or more compounds.Although somewhat more complex, it clearly shows thelinkages between genes in the result sets. Of note is theconnections between the pathways seen at the top of thefigure that show the connections between N-Glycanbiosynthesis, the Phosphatidylinositol signaling system,Inositol phosphate metabolism, Glycerophospholipidmetabolism, Glycerolipid metabolism and Glycosylpho-sphatidylinositol(GPI)-anchor biosynthesis (all but oneof which were missed by the single-pathway method)which can be seen in more detail in Figure 4.
Comparison of threshold-based sets to step-function-based setsThe step-function-based algorithm generated 1704 genesets. The lower number of sets generated is likely due tothe fact that the step-function identified many groupingswith less than five members which did not qualify as a setfor GSA purposes. The GSA results from sets generatedby the use of a step-function on PCA scores was com-pared to the results generated at a score threshold of 1.Similar to the threshold comparisons the step-functionidentified three pathways (Cysteine & methionine metab-olism, TCA cycle and Methane metabolism) not found bythe threshold 1 method. The threshold 1 method alsofound 18 pathways that were not found by the step-function method. This likely means that the entire positiveor negative branch of a principle component is accuratelymodelling a topological structure and that subgraphswithin that topology are not generally needed to increasethe sensitivity of gene sets to be used for GSA.
Comparison of threshold 1 sets to single pathway setsAs has been discussed above, threshold 1 sets, with veryfew exceptions, give the most complete view of differentialchanges occurring in the metabolic network. In order tocompare this new set generation method to previousapproaches we created single pathway sets (see Methods)which are the type of sets that have traditionally been usedin the past. We ran GSA on the 69 single pathway setsdescribed above and compared the results to those gener-ated by the use of threshold 1 sets. The results of the sin-gle pathway results can be seen in Figure 5. The singlepathway sets only identified 6 pathways as opposed to the30 identified by the threshold 1 method. Additionally, be-cause there is comparatively little overlap in the single
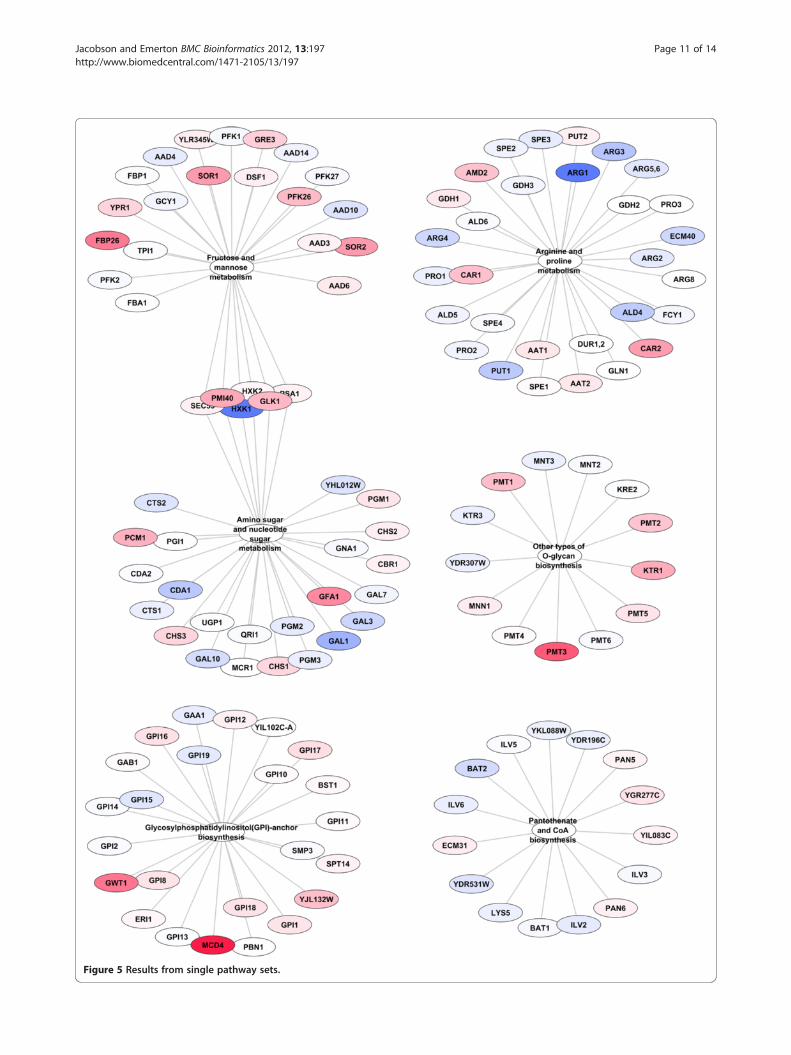
Figure 5 Results from single pathway sets.
Jacobson and Emerton BMC Bioinformatics 2012, 13:197 Page 11 of 14http://www.biomedcentral.com/1471-2105/13/197

Jacobson and Emerton BMC Bioinformatics 2012, 13:197 Page 12 of 14http://www.biomedcentral.com/1471-2105/13/197
pathway sets it is not possible to use a hypergeometric testto determine which of the genes are drivers of the set stat-istic and which are simply passengers. Furthermore, withsingle pathway sets it is much harder to determine howthe sets are related to each other within the metabolic net-work. It is clear that the results from Threshold 1 as pre-sented in Figures 2, 3, 4 are much more comprehensivethat those from single pathway sets as presented inFigure 5.Single pathway sets found 20 (true positives) of the 76
genes found to be differentially expressed by the Thresh-old 1 method, thus it missed 56 genes (false negatives)found by the Threshold 1 method. Furthermore, itincluded 111 apparent passenger genes (false positives)that were present presumably because the pathway setcontaining them was found to be significant and not be-cause they contributed to the signal.The results of the threshold 1 analysis could certainly be
presented as lists of genes or as lists of different pathways.However, we are attempting to point out the limitations ofprecisely this isolated pathway mode of thinking, the effectsof which have been noted elsewhere in the literature:“The classical method of metabolic engineering, iden-
tifying a rate-determining step in a pathway and alleviat-ing the bottleneck by enzyme overexpression, hasmotivated much research but has enjoyed only limitedpractical success. Intervention of other limiting steps, ofcounter-balancing regulation, and of unknown coupledpathways often confounds this direct approach [27].”Thus, it would appear that there have been many
attempts at metabolic engineering in which researchershave not taken into account the fact that pathways don’texist in isolation but are rather all interconnected. Assuch, many attempts at metabolic engineering fail asthey are based on an overly simplistic model. Therefore,we contend that seeing the genes in the context of themetabolic network is a more accurate way to portrayand understand what is really occurring in metabolism.Pathway names are very useful mnemonic devices to re-mind one what area of metabolism is involved, butshould not be used to artificially isolate gene functionsfrom one another.Our method finds differentially expressed genes involved
in N-Glycan biosynthesis, the Phosphatidylinositol signallingsystem, Inositol phosphate metabolism, Glycerophospholi-pid metabolism and Glycerolipid metabolism that weremissed by the single-pathway method. Furthermore, itprovides the visual context for how these pathways areinterlinked and how they are linked to Glycosylphosphatidy-linositol(GPI)-anchor biosynthesis (the one related pathwaywhich the single pathway method does find). These findingsand the relationship between them would seem to be an im-portant aspect of the biology that was missed by the single-pathway approach.
In addition, in order to determine the central biologicalthemes that our method found but were overlooked by thesingle pathway GSA method, all of the genes that werefound by our method and not found with single pathwayGSA were subjected to GO Enrichment analysis and FunCatEnrichment analysis as described in the Methods section.Although it is beyond the scope of this paper to do a fullbiological interpretation of these genes, we have discussedthem briefly below and included the full GO and FunCatEnrichment results as Supplementary Material.
FunCat enrichmentThe general categories of the functions that our methodfinds that would have been missed previously include, asidentified by FunCat enrichment: amino acid metabolism,nitrogen, sulphur and selenium metabolism, carbohydratemetabolism, lipid, fatty acid and isoprenoid metabolism,secondary metabolism, glycolysis and gluconeogenesis,tricarboxylic-acid pathway (citrate cycle, Krebs cycle, TCAcycle), metabolism of energy reserves (e.g. glycogen, trehal-ose), complex cofactor/co-substrate/vitamin binding andprotein modification (N-glycosylation) [Additional file 6].
Gene Ontology enrichmentSimply looking at the GO Enrichment diagrams gives one agood sense of how much pertinent biology was found withour method that was missed by pathway GSA. It is clearthat we are finding core biological themes in N-linked pro-tein glycosylation, which itself is interesting given that it wasO-linked glycosylation that was inhibited. In addition, lipid,phospholipid and glycerophospholipid biosynthesis areaffected which links nicely with the enrichment for GPI an-chor biosynthesis. There are further indications thatbranched chain and aromatic acid metabolism is affected aswell as the TCA cycle and redox metabolism. Furthermore,it is clear that there is an effect on a number of genesinvolved in the cell wall, ER and plasma membranes, as onewould expect to see with the inhibition of protein glycosyla-tion, which would be likely to affect a number of integralmembrane proteins [Additional file 7, Additional file 8 andAdditional file 9].
Differentially expressed genesA list of the differentially expressed genes found by ourmethod, including their systematic and gene names aswell as their descriptions have been included as supple-mentary material [Additional file 10].
Gene sets and software availabilityThe gene sets (affy probeset ids) generated by threshold1 are included as supplementary material [Additional file11]. Software used for the analysis is available upon re-quest to the first author.

Jacobson and Emerton BMC Bioinformatics 2012, 13:197 Page 13 of 14http://www.biomedcentral.com/1471-2105/13/197
ConclusionsTo our knowledge there is no report in the literature ofthe use of Principal Component Analysis of the Laplacianmatrix of a metabolic graph for any purpose, including setgeneration for Gene Set Analysis. As such, it appears thatthis is a novel method with which to find local topologicalstructures in metabolic networks. We have shown thatsets generated from the metabolic networks are semi-exhaustive in that there are many partial set overlaps, butthe degree of overlap is relatively low. The fact that eachgene is a member of many sets allowed us to devise ahypergeometric enrichment test to determine which geneswere likely to be driving the set statistic and which werelikely to simply be passengers, and could thus be prunedaway from the results set. We have further shown that thestructure represented by each signed half of each principalcomponent (greater than or equal to a score threshold of1) is adequate for set generation. Further stratification ofeach principal component, whether by threshold or step-function methods did not significantly increase sensitivity.However, the thresholding method did prove to be usefulas a ‘zoom-in, zoom-out’ function for biological interpret-ation of the results. When compared to traditional path-way sets this method appears to be much more sensitiveas it is a better representation of the underlying complex-ity of a metabolic network. Furthermore, the method ap-plied here allows one to see the full context of the geneslikely to be driving the set statistics rather than as simplylists of pathways each containing an unknown number ofdriver and passenger genes.
Additional files
Additional file 1: Figure S1. Percentage Variance Explained by eachprincipal component.
Additional file 2: Figure S2. Gene to Gene Distance Distribution.
Additional file 3: Figure S3. Rank order distribution of the number ofsets that each gene is contained in.
Additional file 4: Figure S4. A) number of other gene sets thatintersect with each gene set. B) Number of occurrences of gene overlapsbetween sets as found by set intersections.
Additional file 5: Figure S5. Set sizes generated at each positive andnegative arm of each principal component at thresholds 1, 5 and 10.
Additional file 6: FunCat Enrichment of the False Negatives fromtraditional GSA pathway sets.
Additional file 7: GO Enrichment (Biological Process) of the FalseNegatives from traditional GSA pathway sets.
Additional file 8: GO Enrichment (Molecular Function) of the FalseNegatives from traditional GSA pathway sets.
Additional file 9: GO Enrichment (Cellular Location) of the FalseNegatives from traditional GSA pathway sets.
Additional file 10: Gene ID, Name and Description of metabolicgenes found to be differentially expressed by GSA-PCA.
Additional file 11: The Gene Sets Generated with PCA ScoreThreshold 1.
Competing interestsThe authors declare that they have no competing interests.
Authors' contributionsDJ conceived of the study, created the graph and Laplacean matrix used inthis paper, wrote the R code to perform the PCA and the Perl code for setgeneration, set analysis, and hypergeometric testing, wrote the R script toperform the GSA analysis, did the subsequent interpretation of both the PCAand GSA results, created the figures and wrote the manuscript. GEperformed the initial PCA of a Laplacian matrix in Matlab and provided thePCA scores that DJ used to develop the initial prototype, participated indiscussions about the potential applications of this approach and edited themanuscript. All authors read and approved the final manuscript.
AcknowledgementsWe would like to thank the members of the Computational Biology Groupand the students and staff in general at the IWBT for support and discussion.We would particularly like to thank Piet Jones for useful discussions aboutthe hypergeometric test. We would like to gratefully acknowledge thefunding provided by Winetech, THRIP, and the South African NationalResearch Foundation Bioinformatics & Functional Genomics Programme.
Received: 14 October 2011 Accepted: 3 July 2012Published: 9 August 2012
References1. Pavlidis P, Lewis DP, Noble WS: Exploring gene expression data with class
scores.Pacific Symposium on Biocomputing. Pac Symp Biocomput 2002,474–85.
2. Pavlidis P, Qin J, Arango V, Mann JJ, Sibille E: Using the gene ontology formicroarray data mining: a comparison of methods and application to ageeffects in human prefrontal cortex. Neurochem Res 2004, 29:1213–1222.
3. Mootha VK, Lindgren CM, Eriksson K-F, Subramanian A, Sihag S, Lehar J,Puigserver P, Carlsson E, Ridderstråle M, Laurila E, Houstis N, Daly MJ,Patterson N, Mesirov JP, Golub TR, Tamayo P, Spiegelman B, Lander ES,Hirschhorn JN, Altshuler D, Groop LC: PGC-1alpha-responsive genesinvolved in oxidative phosphorylation are coordinately downregulatedin human diabetes. Nat Genet 2003, 34:267–73.
4. Goeman JJ, Oosting J, Cleton-Jansen A-M, Anninga JK, van HouwelingenHC: Testing association of a pathway with survival using geneexpression data. Bioinformatics (Oxford, England) 2005, 21:1950–7.
5. Goeman JJ, Van de Geer SA, de Kort F, van Houwelingen HC: A global testfor groups of genes: testing association with a clinical outcome.Bioinformatics 2003, 20:93–99.
6. Kim S-Y, Volsky DJ: PAGE: parametric analysis of gene set enrichment.BMC Bioinformatics 2005, 6:144.
7. Subramanian A, Tamayo P, Mootha VK, Mukherjee S, Ebert BL, Gillette MA,Paulovich A, Pomeroy SL, Golub TR, Lander ES, Mesirov JP: Gene setenrichment analysis: a knowledge-based approach for interpreting genome-wide expression profiles. Proc Natl Acad Sci USA 2005, 102:15545–50.
8. Tian L, Greenberg SA, Kong SW, Altschuler J, Kohane IS, Park PJ: Discoveringstatistically significant pathways in expression profiling studies. Proc NatlAcad Sci USA 2005, 102:13544–9.
9. Irizarry RA, Wang C, Zhou Y, Speed TP: Gene set enrichment analysis madesimple. Stat Methods Med Res 2009, 18:565–75.
10. Dinu I, Potter JD, Mueller T, Liu Q, Adewale AJ, Jhangri GS, Einecke G,Famulski KS, Halloran P, Yasui Y: Improving gene set analysis of microarraydata by SAM-GS. BMC Bioinformatics 2007, 8:242.
11. Efron B, Tibshirani R: On testing the significance of sets of genes. Annalsof Applied Statistics 2007, 1:107–129.
12. Falcon S, Gentleman R: Using GOstats to test gene lists for GO termassociation. Bioinformatics (Oxford, England) 2007, 23:257–8.
13. Goeman JJ, Bühlmann P: Analyzing gene expression data in terms ofgene sets: methodological issues. Bioinformatics (Oxford, England) 2007,23:980–7.
14. Altschul SF, Gish W, Pennsylvania T, Park U: Basic Local Alignment SearchTool. J Mol Biol 1990, 3:403–410.
15. Kanehisa M: KEGG: Kyoto Encyclopedia of Genes and Genomes. NucleicAcids Res 2000, 28:27–30.
Jacobson and Emerton BMC Bioinformatics 2012, 13:197 Page 14 of 14http://www.biomedcentral.com/1471-2105/13/197
16. Shannon P, Markiel A, Ozier O, Baliga NS, Wang JT, Ramage D, Amin N,Schwikowski B, Ideker T: Cytoscape: a software environment forintegrated models of biomolecular interaction networks. Genome Res2003, 13:2498–504.
17. Hietaniemi J: CPAN Set::Scalar. http:// search.cpan.org/dist/Set-Scalar/.18. Hietaniemi J: CPAN Graph. http://search.cpan.org/~jhi/Graph-0.94/.19. Gene Expression Omnibus. http://www.ncbi.nlm.nih.gov/geo/query/acc.cgi?
acc=GSE12193.20. Bolstad BM, Irizarry RA, Astrand M, Speed TP: A comparison of normalization
methods for high density oligonucleotide array data based on varianceand bias. Bioinformatics (Oxford, England) 2003, 19:185–93.
21. Banerjee S, Pedersen T: The design, implementation, and use of thengram statistics package. Computational Linguistics and Intelligent TextProcessing 2003, 2000:370–381.
22. Holm S: A simple sequentially rejective multiple test procedure. Scand JStat 1979, 6(2):65–70.
23. Zheng Q, Wang XJ: GOEAST: a web-based software toolkit for GeneOntology enrichment analysis. Nucleic Acids Research 2008, 36:W358–W363.
24. Ruepp A, Zollner A, Maier D, Albermann K, Hani J, Mokrejs M, Tetko I,Güldener U, Mannhaupt G, Münsterkötter M, Mewes HW: The FunCat, afunctional annotation scheme for systematic classification of proteinsfrom whole genomes. Nucleic Acids Res 2004, 32:5539–5545.
25. Saerens M, Fouss F, Yen L, Dupont P: The principal components analysisof a graph, and its relationships to spectral clustering. The 15th EuropeanConference on Machine Learning (ECML) 2004, 371–383.
26. Mardia K, Kent J, Bibby J: Multivariate Analysis; 1980.27. Bailey JE, Sburlati A, Hatzimanikatis V, Lee K, Renner WA, Tsai PS: Inverse
metabolic engineering: a strategy for directed genetic engineering ofuseful phenotypes. Biotechnol Bioeng 2002, 79:568–79.
doi:10.1186/1471-2105-13-197Cite this article as: Jacobson and Emerton: GSA-PCA: gene setgeneration by principal component analysis of the Laplacian matrix of ametabolic network. BMC Bioinformatics 2012 13:197.
Submit your next manuscript to BioMed Centraland take full advantage of:
• Convenient online submission
• Thorough peer review
• No space constraints or color figure charges
• Immediate publication on acceptance
• Inclusion in PubMed, CAS, Scopus and Google Scholar
• Research which is freely available for redistribution
Submit your manuscript at www.biomedcentral.com/submit
Copyright © 2022 FDOKUMEN