Quantitative microanalysis using electron energy-loss spectrometry. I. Li and Be in oxides

This article appeared in a journal published by Elsevier. The attachedcopy is furnished to the author for internal non-commercial researchand education use, including for instruction at the authors institution
and sharing with colleagues.
Other uses, including reproduction and distribution, or selling orlicensing copies, or posting to personal, institutional or third party
websites are prohibited.
In most cases authors are permitted to post their version of thearticle (e.g. in Word or Tex form) to their personal website orinstitutional repository. Authors requiring further information
regarding Elsevier’s archiving and manuscript policies areencouraged to visit:
http://www.elsevier.com/authorsrights

Author's personal copy
Growth rate variation and potential paleoceanographic proxiesin Primnoa pacifica: Insights from high-resolution traceelement microanalysis
Renita Aranha a,1, Evan Edinger a,b,c,n, Graham Layne a, Glenn Piercey d
a Department of Earth Sciences, Memorial University of Newfoundland, St John′s, NL, Canada A1B 3X5b Department of Geography, Memorial University of Newfoundland, St John′s, NL, Canada A1B 3X9c Department of Biology, Memorial University of Newfoundland, St John′s NL, Canada A1B 3X9d CREAIT, Memorial University of Newfoundland, St John′s, NL, Canada A1B 3X9
a r t i c l e i n f o
Available online 31 July 2013
Keywords:SclerochronologyGrowth ratesPaleotemperatureProductivityPrimnoaOctocoralMg/Ca ratioSecondary ion mass spectrometry (SIMS)Northeast Pacific
a b s t r a c t
Red tree coral, Primnoa pacifica, is one of the more common habitat-forming deep-sea gorgonian corals inthe northeast Pacific Ocean, growing in colonies up to 2 m high and living for decades to hundreds ofyears. Growth characteristics of P. pacifica were studied in Dixon Entrance, northern British Columbia,and the Olympic Coast National Marine Sanctuary, Washington State, USA, based on samples collected inJuly 2008. To minimize the impact of scientific sampling on coral populations, only dead coral skeletonsand dislodged live corals were collected. Ages and growth rates were measured using band counts, andchecked against AMS-14C ages of gorgonin rings. Ba/Ca, Mg/Ca, Na/Ca and Sr/Ca ratios in the calcite cortexwere measured using radial Secondary Ion Mass Spectrometer (SIMS) transects with a spot size ofo20 μm and separation distance of 25 μm. Growth banding was consistent in width between the centralmixed zone consisting of calcite and gorgonin and the dominantly calcite cortex. Average annual radialgrowth rate of the nine corals analysed ranged from 0.23 to 0.58 mm/yr, with an average growth rate of0.32 mm/yr in Dixon Entrance and 0.36 m/yr in OCNMS. These growth rates are slightly higher than P.pacifica growth rates from the Gulf of Alaska, and more than four times the growth rates of sister speciesPrimnoa resedaeformis in the northwest Atlantic. Primary productivity is likely a more important driver ofgeographic variation in Primnoa growth rates than temperature or current strength. Both Dixon Entranceand OCNMS are areas with high primary productivity and strong tidal currents. Lack of post-AtomicBomb radiocarbon in all but one of the gorgonin samples, and long radiocarbon reservoir ages in theNortheast Pacific, made radiocarbon-based verification of coral ages and growth rates difficult due towide errors in calibrated age estimates. Mg/Ca and Sr/Ca ratios were inversely correlated in two of thethree corals analyzed, and showed evidence of interannual variation. Mg/Ca ratios ranged from 70 to136 mmol mol�1, and Sr/Ca ratios from 2.041 to 3.14 mmol mol�1. Previously published relationshipsbetween gorgonian calcite Mg/Ca and seawater temperature yielded average temperatures matchingambient measurements, but the intra- and inter-annual variation in apparent temperature based on theMg/Ca ratios was more than double the observed variation in modern seawater temperature ranges inthe region. Annual variation in Mg/Ca and Sr/Ca could be related to seasonal changes in precipitationefficiency, which is likely a function of short-term fluctuations in coral growth rate, in turn related tovariation in primary productivity. Seasonal and interannual variations in food availability, driven byprimary productivity, may affect skeletal growth rate, hence Mg/Ca and Sr/Ca ratios. Primnoid coralskeletal microgeochemistry probably records temporal changes in both temperature and primaryproductivity.
& 2013 Elsevier Ltd. All rights reserved.
1. Introduction
Primnoid gorgonians are important long-lived habitat formingcorals in cold-water coral provinces world-wide. Their size andlongevity make them highly vulnerable to damage from fisheriesand other seafloor disturbances. Primnoa are of interest biologicallyfor their role in structuring habitat (DuPreez and Tunnicliffe, 2011),
Contents lists available at ScienceDirect
journal homepage: www.elsevier.com/locate/dsr2
Deep-Sea Research II
0967-0645/$ - see front matter & 2013 Elsevier Ltd. All rights reserved.http://dx.doi.org/10.1016/j.dsr2.2013.07.001
n Corresponding author at: Department of Geography, Memorial Universityof Newfoundland, St John′s, NL, Canada A1B 3X9. Tel.: +1 709 864 3233;fax: +1 709 864 3019.
E-mail addresses: [email protected] (R. Aranha),[email protected] (E. Edinger), [email protected] (G. Layne),[email protected] (G. Piercey).
1 Current address: Arcis Seismic Solutions, 2100, 250-5th Street SW, Calgary,AB, Canada, T2P 0R4.
Deep-Sea Research II 99 (2014) 213–226

Author's personal copy
and geologically for their calcite-protein skeletons, which may beuseful as paleoceanographic archives (Sherwood et al., 2005a, 2005b,2011). Further knowledge of their growth rates and longevity, and ofregional variation in their growth rates, can be important in under-standing recovery times from natural or anthropogenic disturbances,and designing appropriate conservation strategies. High-resolutionstudies of their skeletal geochemistry can help to evaluate theirutility as paleoceanographic archives. Here we present growth andpaleoceanographic records in the most common Primnoa of thenortheast Pacific Ocean, Primnoa pacifica.
P. pacifica, like its Atlantic counterpart Primnoa resedaeformis,has a skeleton composed of three distinct growth zones. It has aninner central rod, a middle zone composed of both calcite andgorgonin, and an outer calcitic zone, the cortex, which containsvery little gorgonin (Sherwood et al., 2005b). Smaller colonies onlydisplay two growth zones, the calcite cortex is absent.
The growth bands can be clearly seen as intercalations of calciteand gorgonin in the second growth zone, and by changes ingorgonin coloration that remain visible after dissolution of thecalcite (Risk et al., 2002). More diffuse growth bands can also berecognized in the calcite cortex. These growth bands are known tobe annual in P. pacifica (Andrews et al., 2002) and in its Atlanticsister species P. resedaeformis based on radiometric dating(Sherwood et al., 2005c), and annual banding is also recorded inthe calcitic cortex (Sherwood et al., 2005c). Primnoids are knownto have long life spans (up to 700 yr; Sherwood et al., 2006).Analysis of δ18O and Sr/Ca in the calcite skeletons of P.resedaeformis has suggested that growth related kinetic effectsmight have an impact on these isotopic and elemental ratios(Heikoop et al., 2002). Preliminary studies on P. resedaeformisindicate that the variation in Mg/Ca in its skeleton may becontrolled by temperature (Sherwood et al., 2005a), and severalauthors have investigated potential paleoceanographic records inprimnoids, bamboo corals (Isididae), and other cold-water gorgo-nian corals (e.g., Roark et al., 2005; Thresher et al., 2004, 2010; Hillet al., 2011, 2012; Sinclair et al., 2011). Mg/Ca and Sr/Ca in reef-forming tropical coral skeletons are very commonly used asproxies for sea surface temperatures (e.g., Smith et al., 1979;
Mitsuguchi et al., 1996; Cohen et al., 2006; Azmy et al., 2010). Na/Ca and Ba/Ca also vary systematically in many types of marinebiomineralization (Boyle, 1981; Lea et al., 1989; Lea and Boyle, 1990;Amiel et al., 1973), although their behavior during skeletal growth,and their utility as proxies for seawater temperature or chemicalvariations, has been examined in far less detail in the availableliterature.
Primnoids' longevity, annual skeletal banding and wide geo-graphic distribution make them potentially interesting from thestandpoint of paleoceanography. The purpose of this paper is tomeasure the growth rates and longevity of P. pacifica in twolocations, to investigate regional variation in the growth rate ofP. pacifica and P. resedaeformis, and to assess the paleoceano-graphic significance of trace element (Mg/Ca, Sr/Ca Ba/Ca, andNa/Ca) variation in the calcitic portion of P. pacifica skeletons. SinceP. pacifica is known to be a habitat forming deep sea coral(Andrews et al., 2002; DuPreez and Tunnicliffe, 2011); an accuratedetermination of its growth rate is extremely important in order togauge habitat recovery time after damage from deep sea trawlingand similar disturbances.
2. Materials and methods
2.1. Study areas
Dixon Entrance is a large elongate strait between Haida Gwaii,northern British Columbia, Canada, and Southeast Alaska, USA(Fig. 1). Dixon Entrance experiences strong tidal currents, and hostsa lush fauna of deep-sea corals including gorgonians, stylasterids, softcorals, sea pens, and rare antipatharians (Edinger et al., 2008;DuPreez and Tunnicliffe, 2011; Neves et al., 2014). Dixon Entrancewas scoured during Pleistocene glaciations, and strong tidal currentslimit post-glacial sedimentation, thus leaving winnowed glacialdeposits on the sea floor in much of Dixon Entrance, alongwith large glacial erratic boulders and glacially scoured bedrock(Barrie and Conway, 1999). Learmonth Bank is a large granite massifin the western end of Dixon Entrance, which hosts abundant
Fig. 1. Location map. (A) Learmonth Bank, Dixon Entrance, northern British Columbia, Canada. (B) Olympic Coast National Marine Sanctuary, Washington state USA.Dots indicate locations of coral collections from both study areas. Inset map shows regional geography.
R. Aranha et al. / Deep-Sea Research II 99 (2014) 213–226214
Author's personal copy
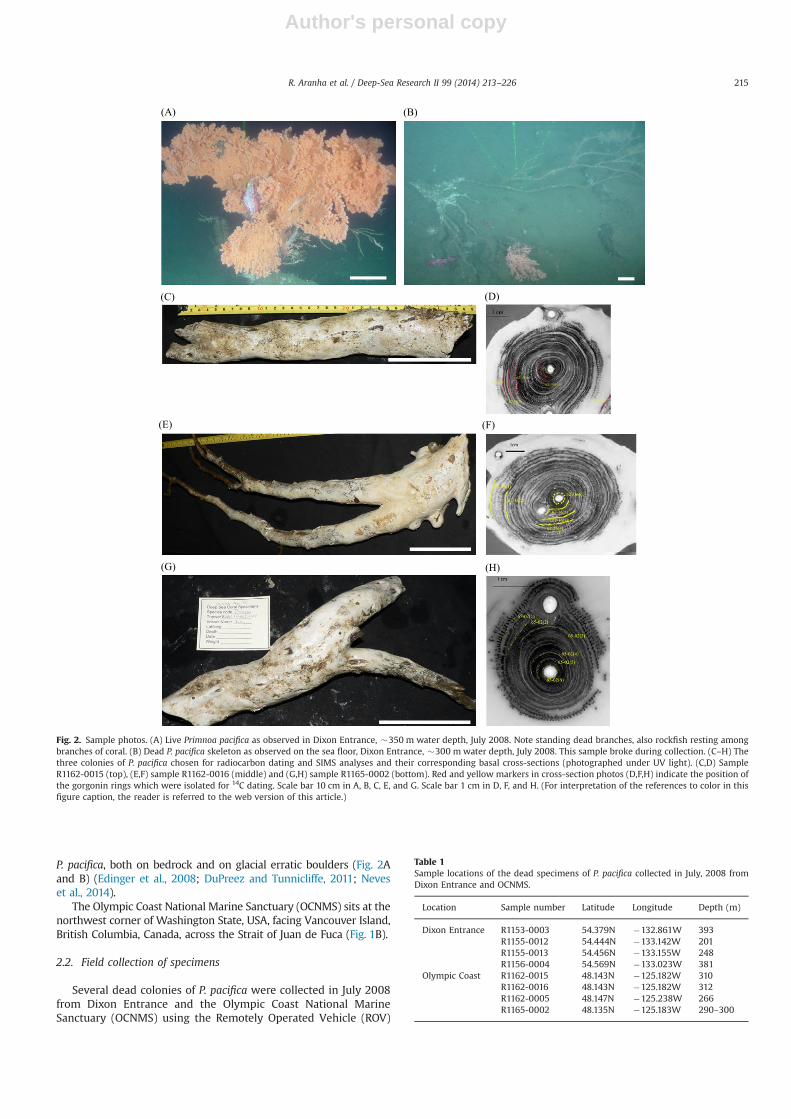
P. pacifica, both on bedrock and on glacial erratic boulders (Fig. 2Aand B) (Edinger et al., 2008; DuPreez and Tunnicliffe, 2011; Neveset al., 2014).
The Olympic Coast National Marine Sanctuary (OCNMS) sits at thenorthwest corner of Washington State, USA, facing Vancouver Island,British Columbia, Canada, across the Strait of Juan de Fuca (Fig. 1B).
2.2. Field collection of specimens
Several dead colonies of P. pacifica were collected in July 2008from Dixon Entrance and the Olympic Coast National MarineSanctuary (OCNMS) using the Remotely Operated Vehicle (ROV)
Fig. 2. Sample photos. (A) Live Primnoa pacifica as observed in Dixon Entrance, �350 m water depth, July 2008. Note standing dead branches, also rockfish resting amongbranches of coral. (B) Dead P. pacifica skeleton as observed on the sea floor, Dixon Entrance, �300 m water depth, July 2008. This sample broke during collection. (C–H) Thethree colonies of P. pacifica chosen for radiocarbon dating and SIMS analyses and their corresponding basal cross-sections (photographed under UV light). (C,D) SampleR1162-0015 (top), (E,F) sample R1162-0016 (middle) and (G,H) sample R1165-0002 (bottom). Red and yellow markers in cross-section photos (D,F,H) indicate the position ofthe gorgonin rings which were isolated for 14C dating. Scale bar 10 cm in A, B, C, E, and G. Scale bar 1 cm in D, F, and H. (For interpretation of the references to color in thisfigure caption, the reader is referred to the web version of this article.)
Table 1Sample locations of the dead specimens of P. pacifica collected in July, 2008 fromDixon Entrance and OCNMS.
Location Sample number Latitude Longitude Depth (m)
Dixon Entrance R1153-0003 54.379N �132.861W 393R1155-0012 54.444N �133.142W 201R1155-0013 54.456N �133.155W 248R1156-0004 54.569N �133.023W 381
Olympic Coast R1162-0015 48.143N �125.182W 310R1162-0016 48.143N �125.182W 312R1162-0005 48.147N �125.238W 266R1165-0002 48.135N �125.183W 290–300
R. Aranha et al. / Deep-Sea Research II 99 (2014) 213–226 215
Author's personal copy
ROPOS deployed from the Canadian Coast Guard ship John P. Tully(Table 1, Figs. 1 and 2). In Dixon Entrance, corals were collectedfrom Learmonth Bank and surrounding glacial deposits (Fig. 1A,Table 1). In OCNMS, corals were collected in 266–312 m waterdepth near the head of Juan de Fuca Canyon (Fig. 1B, Table 1). Thespecimens were collected using the ROV manipulator arms andwere measured, photographed, and frozen immediately aftercollection (Fig. 2).
2.3. Growth rate estimation
The radial growth banding in the mixed growth zone (consist-ing of alternating gorgonin and calcite) of P. pacifica can beobserved quite clearly in polished cross-sections when photo-graphed under UV light (Sherwood et al., 2005b, 2005c). Sincethese growth bands are known to be annual (Andrews et al., 2002;Sherwood et al., 2005c) longevity estimates were made by count-ing the number of bands in the mixed growth zone. Threeindependent readers counted rings in this zone for each colony.The average number of bands for each colony was then dividedby the length of the traversing radius of this zone only to obtainthe average annual radial growth rate. In order to determinelongevity, the average annual growth rate was extrapolated overthe length of the whole radius (including the calcite cortex region).Axial growth rates could not be determined accurately as mostcolonies were broken and fragmented after death and beforecollection.
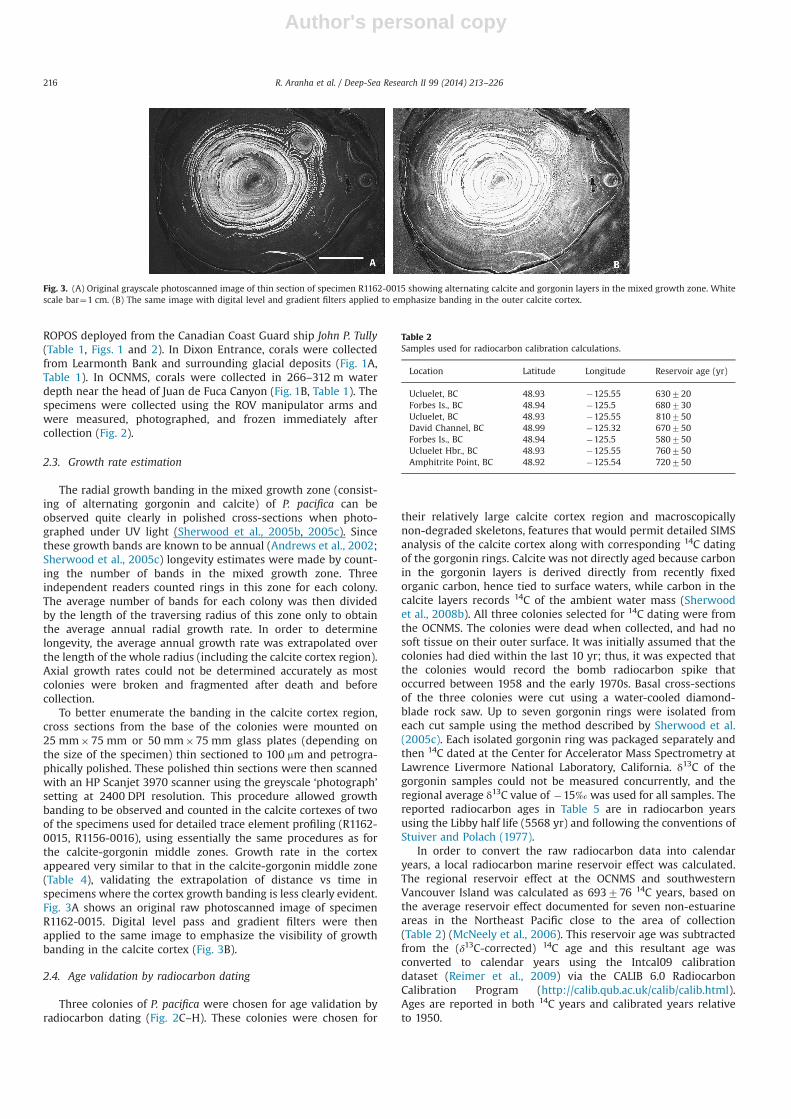
To better enumerate the banding in the calcite cortex region,cross sections from the base of the colonies were mounted on25 mm�75 mm or 50 mm�75 mm glass plates (depending onthe size of the specimen) thin sectioned to 100 mm and petrogra-phically polished. These polished thin sections were then scannedwith an HP Scanjet 3970 scanner using the greyscale ‘photograph’setting at 2400 DPI resolution. This procedure allowed growthbanding to be observed and counted in the calcite cortexes of twoof the specimens used for detailed trace element profiling (R1162-0015, R1156-0016), using essentially the same procedures as forthe calcite-gorgonin middle zones. Growth rate in the cortexappeared very similar to that in the calcite-gorgonin middle zone(Table 4), validating the extrapolation of distance vs time inspecimens where the cortex growth banding is less clearly evident.Fig. 3A shows an original raw photoscanned image of specimenR1162-0015. Digital level pass and gradient filters were thenapplied to the same image to emphasize the visibility of growthbanding in the calcite cortex (Fig. 3B).
2.4. Age validation by radiocarbon dating
Three colonies of P. pacifica were chosen for age validation byradiocarbon dating (Fig. 2C–H). These colonies were chosen for
their relatively large calcite cortex region and macroscopicallynon-degraded skeletons, features that would permit detailed SIMSanalysis of the calcite cortex along with corresponding 14C datingof the gorgonin rings. Calcite was not directly aged because carbonin the gorgonin layers is derived directly from recently fixedorganic carbon, hence tied to surface waters, while carbon in thecalcite layers records 14C of the ambient water mass (Sherwoodet al., 2008b). All three colonies selected for 14C dating were fromthe OCNMS. The colonies were dead when collected, and had nosoft tissue on their outer surface. It was initially assumed that thecolonies had died within the last 10 yr; thus, it was expected thatthe colonies would record the bomb radiocarbon spike thatoccurred between 1958 and the early 1970s. Basal cross-sectionsof the three colonies were cut using a water-cooled diamond-blade rock saw. Up to seven gorgonin rings were isolated fromeach cut sample using the method described by Sherwood et al.(2005c). Each isolated gorgonin ring was packaged separately andthen 14C dated at the Center for Accelerator Mass Spectrometry atLawrence Livermore National Laboratory, California. δ13C of thegorgonin samples could not be measured concurrently, and theregional average δ13C value of �15‰ was used for all samples. Thereported radiocarbon ages in Table 5 are in radiocarbon yearsusing the Libby half life (5568 yr) and following the conventions ofStuiver and Polach (1977).
In order to convert the raw radiocarbon data into calendaryears, a local radiocarbon marine reservoir effect was calculated.The regional reservoir effect at the OCNMS and southwesternVancouver Island was calculated as 693776 14C years, based onthe average reservoir effect documented for seven non-estuarineareas in the Northeast Pacific close to the area of collection(Table 2) (McNeely et al., 2006). This reservoir age was subtractedfrom the (δ13C-corrected) 14C age and this resultant age wasconverted to calendar years using the Intcal09 calibrationdataset (Reimer et al., 2009) via the CALIB 6.0 RadiocarbonCalibration Program (http://calib.qub.ac.uk/calib/calib.html).Ages are reported in both 14C years and calibrated years relativeto 1950.
Fig. 3. (A) Original grayscale photoscanned image of thin section of specimen R1162-0015 showing alternating calcite and gorgonin layers in the mixed growth zone. Whitescale bar¼1 cm. (B) The same image with digital level and gradient filters applied to emphasize banding in the outer calcite cortex.
Table 2Samples used for radiocarbon calibration calculations.
Location Latitude Longitude Reservoir age (yr)
Ucluelet, BC 48.93 �125.55 630720Forbes Is., BC 48.94 �125.5 680730Ucluelet, BC 48.93 �125.55 810750David Channel, BC 48.99 �125.32 670750Forbes Is., BC 48.94 �125.5 580750Ucluelet Hbr., BC 48.93 �125.55 760750Amphitrite Point, BC 48.92 �125.54 720750
R. Aranha et al. / Deep-Sea Research II 99 (2014) 213–226216

Author's personal copy
2.5. Sample preparation for trace element analyses
Cross sections between 3 mm and 5 mm in thickness were cutfrom the base of the same three colonies selected for radiocarbonanalyses, using a diamond-blade rock saw cooled with water.These cross sections were then cut into transverse strips usinga thin kerf Buehler Isomet low speed diamond blade saw.The calcitic cortex portion was subsequently isolated by simplybreaking the gorgonin portion off by hand from the transversestrips. A corresponding continuous strip of the calcitic cortex couldthen be mounted into the 1 in. diameter SIMS sample ring – analuminum ring with an outer diameter of 1 in. (25.4 mm).The SIMS samples were embedded in the ring using BuehlerEpothin Epoxide (Resin:Hardener; 10:3.9). The casts were polishedusing silicon carbide wet/dry sandpaper and then subsequently ona lapping wheel using 6 mm diamond polish, then manuallypolished with 0.5 mm and 0.03 mm deagglomerated alumina.
2.6. Trace element analysis
Trace element analysis followed the approach of Cohen et al.(2001). A Cameca IMS 4f Secondary IonMass Spectrometer (SIMS) wasused to perform high spatial resolution (o25 mm) spot analyses of Na/Ca, Mg/Ca, Sr/Ca and Ba/Ca in detailed traverses across the polishedbasal cross-sections from three specimens of P. pacifica. For the Mg/Caand Sr/Ca spot analyses reported here, typical internal precisions (1s)were better than 70.35% for Mg//Ca and 70.1% for Sr/Ca. SIMS alsoavoids the challenges involving (i) high analytical noise and (ii) poorsignal reproducibility associated with LA-ICP-MS and EPMA analysesdocumented by Sinclair et al. (2005, 2011).
Individual SIMS transects began at the outermost edge of thecalcite cortex region and ended at the beginning of the gorgonin/calcite mixed zone. The traverses were 7–11mm long and individualSIMS spots were spaced 25 mm apart. Visible gorgonin rings wereavoided during analysis. Each coral consequently had between 303and 367 SIMS analysis spots, depending on the length of the SIMStransect.
SIMS analyses utilized bombardment of the samples withprimary 16O� ions accelerated through a nominal potential of10 kV. A primary ion current of 3.0–6.0 nA was critically focusedon the sample over a spot diameter of 10–20 μm.
Sputtered secondary ions were accelerated into the massspectrometer through a nominal potential of 4500 V. Secondaryions were energy filtered using a sample offset voltage of �80 Vand an energy window of 60 eV to suppress isobaric interferences.
Prior to each analysis, the spot was pre-sputtered for 120 s. Thiswas designed to eliminate contamination from the 500 Å gold coatand also to penetrate the damaged and homogenized surface layerof the mechanically polished sample. Analytical craters were thustypically o20 μm diameter and o2 μm deep at the completion ofeach analysis.
Each analysis involved repeated cycles of peak counting on 23Na+
(2 s), 24Mg+ (6 s), 42Ca+ (2 s), 88Sr+ (4 s), 138Ba+ (10 s), as well ascounting on a background position (22.67 Da; 1 s) to monitordetection noise. A small wait time (0.2–0.5 s) was added betweeneach peak switch for magnet settling. For this study, 15 cycles of datawere collected over 546 s, for total analysis times of o10 min perspot, including pre-sputtering. Typical signal on the 42Ca+ referencepeak was 10,000–25,000 cps.
The Memorial IMS 4f is equipped with a High Speed CountingSystem (Pulse Count Technology Inc.) that produces dark noisebackground of less than 0.03 cps (2 counts per minute) when usedwith an ETP133H discrete dynode electron multiplier. Overall systemdead time in pulse-counting mode is 14 ns. This system alsoproduces very low detection limits for the elements studied. Theelemental detection limits based only on the uncertainty in correct-ing for detector dark noise (0.03 cps) are typically 1 ng g�1 for Na,2 ng g�1 for Mg, 2 ng g�1 for Sr and 2 ng g�1 for Ba. The error ofindividual spot analyses was estimated using the standard error ofthe mean of n cyclical measurements of each ratio during an analysis(internal precision).
Detailed trace element profiles were plotted against a time axis(years before death; year of death¼0). Time was calculated based onthe average annual radial growth rate. The smoothed data lines wereproduced using a second degree Savitzky–Golay type generalizedmoving average with filter coefficients determined by an unweightedlinear least-squares regression and a second degree polynomial model.
2.7. Seawater temperature data
Seawater bottom temperature data for the depths within theOCNMS region fromwhich the coral samples analyzed were collectedwere extracted from the World Ocean Database 2009 (Boyer et al.,2009). All records within the bounding coordinates 48.0–48.51N and124.75–125.51W were collated, and analyzed within depth intervalsof 260–280 m, 280–300 m, and 300–320 m. The mean, 95% con-fidence limits, minimum and maximum observed temperatures,number of years of observation, and number of data points for eachdepth class were calculated.
Table 3Growth rate data and calculations for P. pacifica. The total number of bands calculated when the average growth rate is extrapolated over the entire radius of the P. pacificais equal to the coral age in years.
Sample numberP. pacifica
Basal radius (mm) Radius of gorgoninbanded zone (mm)
Average number of bandscounted (71s)
Band width (mm) Average radial growth rate(mm yr�1)
Age (yr)71s
Maximum Minimum Maximum Minimum Max.radius
Min.radius
OCNMSR1162-0015 35.6 26.7 21.5 16.0 4572 0.474 0.352 0.41470.061 75715R1162-0016 17.0 16.0 12.0 21.0 3172 0.381 0.258 0.31970.061 51711R1162-0005 22.7 18.0 14.3 11.7 4072 0.361 0.294 0.32870.032 62710R1165-0002 35.0 32.0 9.7 6.5 2174 0.462 0.309 0.38670.076 8774Dixon EntranceR1153-0003 14.0 6.0 14.0 6.0 4674 0.302 0.129 0.21670.076 46726R1155-0012 24.0 15.0 24.0 15.0 3472 0.713 0.446 0.57970.132 34711R1155-0013 46.0 26.0 11.0 7.0 3073 0.371 0.236 0.30370.067 119747R1156-0004 6.0 4.0 6.0 4.0 2272 0.277 0.185 0.23170.046 2276R1156-0016(branch 1 )
16.7 11.5 5.9 3.3 1671 0.368 0.206 0.28870.08 49713
R. Aranha et al. / Deep-Sea Research II 99 (2014) 213–226 217
Author's personal copy
2.8. Paleotemperature estimation
The temperature of the seawater in which the corals grewwas estimated using the empirically defined relationship betweenMg/Ca and seawater temperature determined for P. resedaeformisin the NW Atlantic (Sherwood et al., 2005a).
Mg=Ca ðmmol mol�1Þ ¼ 5ð 7 1:4ÞTð1CÞ þ 64ð 7 10Þ ð1ÞThe paleotemperature estimate for all points was calculated
using this equation, then the curve was smoothed using a 5-pointrunning average.
3. Results
3.1. Growth rates
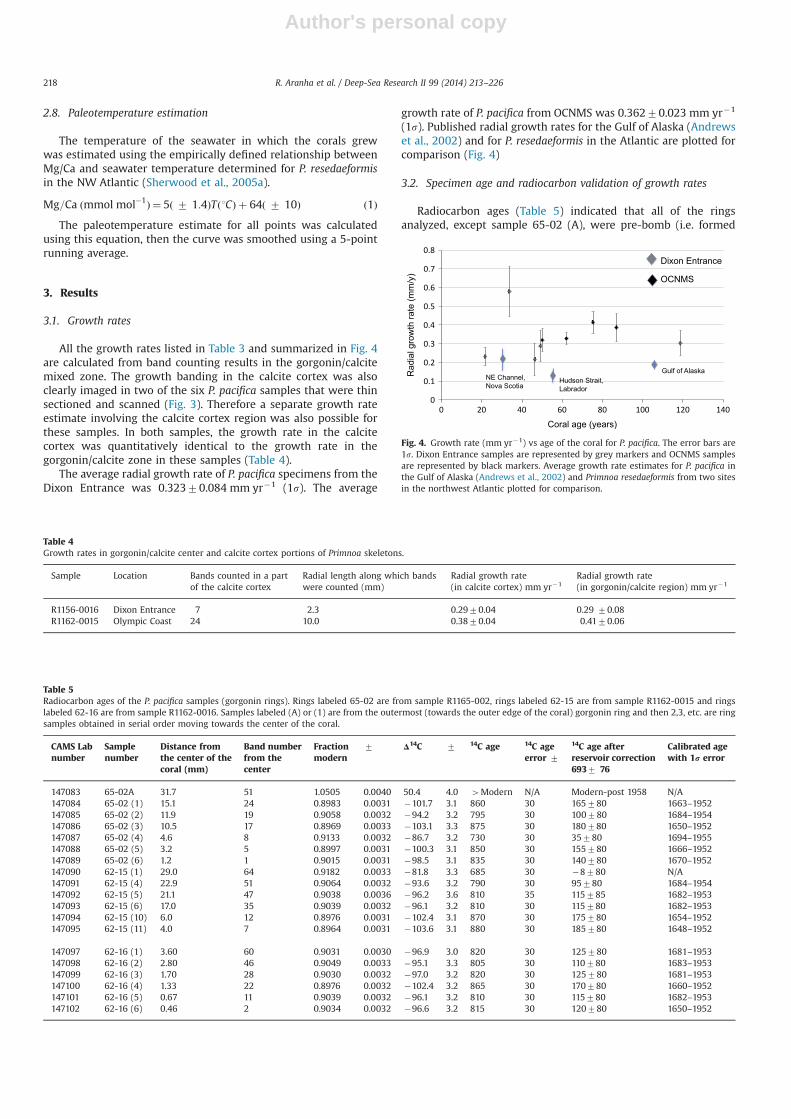
All the growth rates listed in Table 3 and summarized in Fig. 4are calculated from band counting results in the gorgonin/calcitemixed zone. The growth banding in the calcite cortex was alsoclearly imaged in two of the six P. pacifica samples that were thinsectioned and scanned (Fig. 3). Therefore a separate growth rateestimate involving the calcite cortex region was also possible forthese samples. In both samples, the growth rate in the calcitecortex was quantitatively identical to the growth rate in thegorgonin/calcite zone in these samples (Table 4).
The average radial growth rate of P. pacifica specimens from theDixon Entrance was 0.32370.084 mm yr�1 (1s). The average
growth rate of P. pacifica from OCNMS was 0.36270.023 mm yr�1
(1s). Published radial growth rates for the Gulf of Alaska (Andrewset al., 2002) and for P. resedaeformis in the Atlantic are plotted forcomparison (Fig. 4)
3.2. Specimen age and radiocarbon validation of growth rates
Radiocarbon ages (Table 5) indicated that all of the ringsanalyzed, except sample 65-02 (A), were pre-bomb (i.e. formed
Fig. 4. Growth rate (mm yr�1) vs age of the coral for P. pacifica. The error bars are1s. Dixon Entrance samples are represented by grey markers and OCNMS samplesare represented by black markers. Average growth rate estimates for P. pacifica inthe Gulf of Alaska (Andrews et al., 2002) and Primnoa resedaeformis from two sitesin the northwest Atlantic plotted for comparison.
Table 4Growth rates in gorgonin/calcite center and calcite cortex portions of Primnoa skeletons.
Sample Location Bands counted in a partof the calcite cortex
Radial length along which bandswere counted (mm)
Radial growth rate(in calcite cortex) mm yr�1
Radial growth rate(in gorgonin/calcite region) mm yr�1
R1156-0016 Dixon Entrance 7 2.3 0.2970.04 0.29 70.08R1162-0015 Olympic Coast 24 10.0 0.3870.04 0.4170.06
Table 5Radiocarbon ages of the P. pacifica samples (gorgonin rings). Rings labeled 65-02 are from sample R1165-002, rings labeled 62-15 are from sample R1162-0015 and ringslabeled 62-16 are from sample R1162-0016. Samples labeled (A) or (1) are from the outermost (towards the outer edge of the coral) gorgonin ring and then 2,3, etc. are ringsamples obtained in serial order moving towards the center of the coral.
CAMS Labnumber
Samplenumber
Distance fromthe center of thecoral (mm)
Band numberfrom thecenter
Fractionmodern
7 Δ14C 7 14C age 14C ageerror 7
14C age afterreservoir correction6937 76
Calibrated agewith 1r error
147083 65-02A 31.7 51 1.0505 0.0040 50.4 4.0 4Modern N/A Modern-post 1958 N/A147084 65-02 (1) 15.1 24 0.8983 0.0031 �101.7 3.1 860 30 165780 1663–1952147085 65-02 (2) 11.9 19 0.9058 0.0032 �94.2 3.2 795 30 100780 1684–1954147086 65-02 (3) 10.5 17 0.8969 0.0033 �103.1 3.3 875 30 180780 1650–1952147087 65-02 (4) 4.6 8 0.9133 0.0032 �86.7 3.2 730 30 35780 1694–1955147088 65-02 (5) 3.2 5 0.8997 0.0031 �100.3 3.1 850 30 155780 1666–1952147089 65-02 (6) 1.2 1 0.9015 0.0031 �98.5 3.1 835 30 140780 1670–1952147090 62-15 (1) 29.0 64 0.9182 0.0033 �81.8 3.3 685 30 �8780 N/A147091 62-15 (4) 22.9 51 0.9064 0.0032 �93.6 3.2 790 30 95780 1684–1954147092 62-15 (5) 21.1 47 0.9038 0.0036 �96.2 3.6 810 35 115785 1682–1953147093 62-15 (6) 17.0 35 0.9039 0.0032 �96.1 3.2 810 30 115780 1682–1953147094 62-15 (10) 6.0 12 0.8976 0.0031 �102.4 3.1 870 30 175780 1654–1952147095 62-15 (11) 4.0 7 0.8964 0.0031 �103.6 3.1 880 30 185780 1648–1952
147097 62-16 (1) 3.60 60 0.9031 0.0030 �96.9 3.0 820 30 125780 1681–1953147098 62-16 (2) 2.80 46 0.9049 0.0033 �95.1 3.3 805 30 110780 1683–1953147099 62-16 (3) 1.70 28 0.9030 0.0032 �97.0 3.2 820 30 125780 1681–1953147100 62-16 (4) 1.33 22 0.8976 0.0032 �102.4 3.2 865 30 170780 1660–1952147101 62-16 (5) 0.67 11 0.9039 0.0032 �96.1 3.2 810 30 115780 1682–1953147102 62-16 (6) 0.46 2 0.9034 0.0032 �96.6 3.2 815 30 120780 1650–1952
R. Aranha et al. / Deep-Sea Research II 99 (2014) 213–226218

Author's personal copy
prior to 1958). Almost all resultant reservoir corrected radiocarbonages were within error of each other. Sample 65-02 (A), theoutermost ring in specimen R1165-002, was of modern (post-bomb) age. The reservoir corrected radiocarbon ages indicate thatnone of the samples died more recently than 30 yr ago. Specimen# R1165-002 of P. pacifica has been dead for at least 30 yr,
specimen # R1162-0015 has been dead for at least 45 yr, andspecimen R1162-0016 has been dead for at least 50 yr (Fig. 5).
In aggregate, the samples belonging to coral R1162-0015showed a discernible growth trend in radiocarbon age with olderradiocarbon ages for samples that were closer to the center of thecorals (Table 5, Figs. 5 and 6A). However, the slope of the growthtrajectories obtained through fitting the reservoir corrected radio-carbon ages for this sample is steeper than that obtained fromannual band counting (Fig. 6A). Sample R1165-0016 and SampleR1165-002 did not show any discernible trend in the radiocarbonages (Fig. 6B and C).
3.3. Trace element analysis
In the three specimens analyzed in detail by SIMS, Sr/Ca variedbetween 2.04 and 3.14 mmol mol�1, Mg/Ca varied between 70.6and 136 mmol mol�1, Ba/Ca varied between 0.0036 and0.0550 mmol mol�1 and Na/Ca varied between 16.4 and53.1 mmol mol�1 (Table 6). Mean Mg/Ca and Na/Ca values aresimilar for Samples R1162-0015 and R1162-0016, but distinctlylower for Sample R1165-002. There was a weak, but statisticallyvalid, inverse correlation between Mg/Ca and Sr/Ca for samplesR1165-0015 and R1165-0016, but a positive correlation for sampleR1162-00 (Table 7).
All three samples analyzed showed some degree of cyclicity inthe Mg/Ca and Sr/Ca profiles (Fig. 7). The Mg/Ca and Sr/Ca ratios insamples R1162-0015 and R1162-0016 (Fig. 7A and B) showed anobvious inverse correlation, both short-term and, in R1162-0015,long term, as also reflected in Table 7. In Sample R1162-0015, amajor simultaneous spike in Mg/Ca and Sr/Ca occurred at thebeginning of the profile (Fig. 7A, between year 2 and 3). This spikecorresponds to the SIMS analysis spots that passed over a thingorgonin ring. Because gorgonin has a higher concentration ofmany elements than calcite, these analyses spots were excludedfrom the statistical analysis.
In both samples R1162-0015 and R1162-0016 (Fig. 7A and B) asingle large dip in Sr/Ca values was observed, with a simultaneousspike in Mg/Ca. This excursion in trace element values notedbetween year 6 and 7 in sample R1162-0015 and year 7 and 8 inR11162-0016, was not associated with any specific contaminationor growth feature in the cross-section. It is very distinct fromthe profile obtained when the SIMS analyses spot crossed thegorgonin ring, as there was a negative excursion in Sr/Ca values,not a positive excursion as seen when the analyses crossed agorgonin ring.
Ba/Ca and Na/Ca did not show any distinct cyclicity in theSIMS profiles of any of the samples analyzed. This lack of cyclicityis probably due to the fact that Na/Ca and Ba/Ca are not onlydissolved in the skeletal material but are also present within theskeleton as surface contaminants and/or particulate inclusions.Their patterns do not seem as readily intepretable in P. pacifica asthose observed for Mg/Ca and Sr/Ca.
3.4. Temperature records from the OCNMS region
The World Ocean Database temperature records for the OCNMSregion extend from 1938 to 2006, and included 19 records between260 and 279 m, 26 records between 280 and 299 m, and 38 recordsbetween 300 and 320 m. The average temperatures (795% con-fidence limits) observed in these three depth classes were 6.670.2,6.470.2, and 6.470.1, respectively (Fig. 8). The complete tempera-ture ranges recorded in each depth zone were 5.6–7.6, 5.7–7.3,and 5.4–7.0, respectively. Intra-annual temperature variation in theobserved data from 280 to 320 m depth was less than 1 1C.
Fig. 6. Radiocarbon validation of growth rates and ages based on ring counts.(A) Sample R1162-0015. (B) Sample R1162-0016. (C) Sample R1165-002 distance(from the center of the coral, center is at 0 mm) vs reservoir corrected radiocarbonyears. The radiocarbon age of the outermost ring was considered valid in plottingthe age based on band counting. The error bars (1s) for the age based on bandcounts are smaller than the size of the symbol in the graph.
Fig. 5. Radiocarbon ages of P. pacifica gorgonin subsamples analyzed, reservoir-corrected 14C years 71s error.
R. Aranha et al. / Deep-Sea Research II 99 (2014) 213–226 219

Author's personal copy
3.5. Paleotemperature reconstructions
Average calculated paleotemperatures in sample R162-0015matched observed bottom water temperatures in the 300–320 mdepth range, but the range in calculated paleotemperaturesexceeded the observed range of temperatures by a factor of two(Fig. 9A). Calculated paleotemperatures matched observed tem-peratures in the first 9 yr of the coral record in sample R1162-0016,but then dropped below observed temperatures in the last 5 yr(Fig. 9B). The calculated paleotemperatures in sample R1165-0002were approximately 3 1C lower than the observed temperature atthe 280–300 m depth range (Fig. 9C).
4. Discussion
4.1. Growth rate variations
The lowest radial growth rate recorded in this study was0.2270.09 mm yr�1 for a sample of P. pacifica from the DixonEntrance. This value closely matches the radial growth rate(0.1870.03 mm yr�1) for a colony of P. pacifica from AlaskanDixon Entrance studied by Andrews et al. (2002). The growthrates for P. pacifica reported here thus support the conclusions ofthis previous study that these corals are slow to recover fromdamage due to trawling and other disturbances.
P. pacifica was formerly thought to be the same species asP. resedaeformis (Cairns and Bayer, 2009). The growth rates ofP. resedaeformis from the Northwest Atlantic (Sherwood andEdinger, 2009) were more than four times lower than thegrowth rate of P. pacifica determined in this study. A log fittitled ‘model maximum′ fitted through the four specimens of P.pacifica with the largest radius in Fig. 10 indicates the upperlimit of growth rates in our study, along with log fit curvesfor Dixon Entrance and OCNMS individually. Comparison ofgrowth characteristics of P. pacifica and P. resedaeformis fromvarious locations, as compiled in Fig. 10, indicates that thesamples from different locations follow similar logarithmicgrowth trajectories, but with dramatically different radialgrowth rates.
Sherwood and Edinger (2009) attributed regional differences ingrowth rate of P. resedaeformis in the North Atlantic to differencesin the intensity of tidal currents, suggesting that faster growthrates occur due to stronger tidal currents. Other possible driversof regional variation in gorgonian coral growth rates includetemperature and primary productivity.
The California undercurrent is active in the OCNMS region. Thepeak speed of this current is 30–50 cm s�1, similar to the currentsin the Hudson Strait (�40 cm s�1), and considerably slower thanthe tidal currents in Dixon Entrance (90 cm s�1, Crawford andThompson, 1991) and the NE Channel (Sherwood and Edinger,2009). Thus, current velocity alone likely cannot explain the largedifference in growth rate between the four locations considered.
Similarly, temperature variation between the four locationsdoes not appear to explain the observed differences in growthrates. Average bottom temperatures (795% confidence limit)
at the depth zone from which corals were collected in the otherthree areas were 5.670.1 1C (Dixon Entrance, 300 m), 4.070.1 1C(Hudson Strait, 400 m), and 6.170.4 1C (Northeast Channel,400 m, Boyer et al., 2009).
Primary productivity, and food supply, may best explain thedifferences in growth rates among the areas compared. TheCalifornia current system is one of the most productive ecosystemsin the world (Carr, 2002). Since growth of most deep sea coralsis dependent on POM flux, it is likely that the relative higherproductivity in the NE Pacific is the dominant driver of the highergrowth rates of P. pacifica in comparison to P. resedaeformis fromthe Hudson strait and NE channel (Jones and Anderson, 1994;Carr, 2002; Thomas et al., 2003b). Ongoing work quantitativelycompares environmental correlates of growth rate variation inseveral species of cold-water gorgonian corals (Neves and Edinger,2012).
4.2. Radiocarbon dating
Since the radiocarbon ages of most of the samples were pre-bomb, and within error of each other, a precise age determinationwas not possible. It can be concluded, however, that none of thesamples died recently (within the past 30 yr). The radiocarbon ageranges of R1162-0015 and R1162-0016 are mostly overlapping,suggesting that the two corals may have lived at the same time(Fig. 5), but the precise times when the two corals lived aredifficult to determine. The calcite layers of the two corals likelyoverlapped the early part of the bottom temperature data reportedin Fig. 8. High precision dates of pre-bomb radiocarbon areunlikely to yield more precise age estimates from the northeastPacific, due to the large reservoir ages in that region.
4.3. Trace elements
4.3.1. Primary controls on trace element variation in P. pacificaThe skeletal morphology of P. resedaeformis is indistinguishable
from that of P. pacifica. Sherwood et al. (2005a) analyzed the bulkskeletal composition of several specimens of P. resedaeformis fromthe North Atlantic and found that the average bulk skeletal Mg/Cavaried between 86 and 118 mmol mol�1. Comparison of individualsample values to hydrographic temperature at their sites ofcollection yielded the relationship
Mg/Ca (mmol mol�1) ¼ 5(71.4) T (1C) + 64(�10).
Although the calculated average bottom temperature in one ofthe three samples studied matched observed temperature, therange of variation in calculated bottom temperatures within thiscoral far exceeded the observed temperature variation (Fig. 9A).The fact that calculated average bottom temperatures matchedobserved temperatures in the beginning of sample R1162-0016skeletal Mg/Ca record, but not at its end, is confusing, as no similarlarge-scale change was recorded in the oceanographic data. Theskeletal Mg/Ca in samples of P. pacifica analyzed in this studyvaried between 70 and 136 mmol mol�1, with averages of 103, 106and 81 mmol mol�1in the three samples studied in detail.
Table 6Summary of mean values and ranges of SIMS trace element results.
Samplenumber
Sr/Ca range(mmol mol�1)
Sr/Ca(mean)
Mg/Ca range(mmol mol�1)
Mg/Ca(mean)
Ba/Ca range(mmol mol�1)
Ba/Ca(mean)
Na/Ca range(mmol mol�1)
Na/Ca(mean)
R1162-0015 2.27–3.14 2.71 81.3–125.8 103.5 0.0046–0.0313 0.0179 22.5–37.4 29.9R1162-0016 2.04–2.97 2.50 76.2–136.6 106.4 0.0053–0.0115 0.0084 16.4–53.1 32.6R1165-0002 2.18–2.61 2.39 70.6–92.2 81.4 0.0036–0.0550 0.0293 17.9–26.8 22.4
R. Aranha et al. / Deep-Sea Research II 99 (2014) 213–226220

Author's personal copy
Applying the Sherwood et al. (2005a) temperature relationship toMg/Ca profiles obtained in this study implied temperature varia-tion from �3.5 1C to 12.4 1C in sample R1162-0015, from �2.4 1Cto 14.4 1C in sample R1162-0016 and from �1.2 1C to 5.6 1C insample R1165-0002. In OCNMS the highest ever temperaturerecorded at 300 m in the past 70 yr, by CTD casts, was 6.96 1C,and the lowest was 5.4 1C (Fig. 8, Boyer et al., 2009). Observedtemperature variation alone cannot account for the range ofobserved variation in Mg/Ca profiles of the samples studied herein.Thus sub-fossil Primnoa coral skeletons may be most useful forindicating average temperatures at some time in the past, andpossibly for recording decadal-scale changes. High-amplitude-shortwavelength fluctuations in Mg/Ca and/or Sr/Ca ratios likely reflectgrowth rate variations responding to changes in food availabilityrather than highly resolved annual or subannual temperature varia-tions (cf. Roark et al., 2005; Kuffner et al., 2012, see Section 4.4).
The temperature dependence of Sr/Ca inmost reef-forming tropicalscleractinian corals is between �0.08 and �0.10 mmol mol�1/1C(Gaetani and Cohen, 2006). Cold water scleractinian corals likeLophelia pertusa have a more extreme Sr/Ca sensitivity: approxi-mately �0.18 mmol mol�1 (Cohen et al., 2006). The temperaturedependence of Sr/Ca in abiogenic carbonate, however, is only�0.039 mmol mol�1/1C (Cohen et al., 2006).
If the variations of Sr/Ca record in the OCNMS Primnoaskeletons were attributed solely to the observed temperaturevariation in the sampling areas, it would imply a temperaturedependence of approximately �0.74 mmol mol�1/1C, seven timesmore sensitive than observed in any tropical coral, and four timeshigher than that for the cold water scleractinian L. pertusa. Factorsother than temperature, most likely short-term fluctuations ingrowth and calcification rate (cf. Kuffner et al., 2012) evidentlyexert a major control on the variation in Mg/Ca and Sr/Ca ratiosobserved in P. pacifica.
4.3.2. Trace element ratio correlations and possible diagenetic effectsA significant inverse correlation between Mg/Ca and Sr/Ca was
noted in the high resolution trace element traverses of two of thethree specimens of P. pacifica analyzed (R1162-0015 and -0016;Fig. 7A and B, Table 7).
In a third specimen (R1165-002; Fig. 7C; Table 7) the Mg/Ca andSr/Ca ratios showed a significant positive correlation. R1165-002shows several additional differences, relative to R1162-0015 and-0016, in terms of its trace element profile. These differencessuggest diagenetic effects involving re-equilibration of the calciteskeleton with seawater/shallow pore water before collection:
1. The mean Sr/Ca (2.39 mmol mol�1; Table 6) was discerniblylower. This agrees with the empirical observation (e.g., Carpenterand Lohman, 1992) that Sr/Ca in abiotic marine calcite is consis-tently lower than for biotic calcite.
2. The mean Mg/Ca for combined spot analyses of middle zoneand calcite cortex of R1162-0015 and -0016 was 103.5 and106.4 mmol mol�1, respectively (Table 6). These values areclosely comparable to the 100 mmol mol�1 mean value forbulk skeletal analysis of recent Primnoa by Sherwood et al.(2005a). The mean Mg/Ca (81.4 mmol mol�1; Table 6) is morethan 20% lower for R1165-002; and more similar to the valuesexpected in abiotic calcite. This value also yields anomalouslylow calculated temperatures relative to the observed range atthe site of collection (Fig. 9C). Conversely, specimens R1162-0015 and -0016 yield calculated temperatures that closelyoverlap those observed at their site of collection.
Sample 1165-002 did not yield discernibly older radiocarbonages in its gorgonin layers than the other two corals, nor was its
macroscopic taphonomic condition noticeably different (cf.Edinger and Sherwood, 2012). Despite the lack of any obvious“fossilization” or recrystallization textures under the petrographicmicroscope, diagenesis seems to be the most likely explanation forthe observed trace element pattern in R1165-002. All three speci-mens were dead at least 30 yr before collection, with potential forthe skeletal material of specimen R1165-002 to have experienced aperiod of shallow burial on the seafloor during that interval,accelerating incipient diagenetic changes in the calcite composi-tion through reaction with shallow marine pore waters. It alsoimplies a need for caution in the use of obviously “sub-fossil”samples of Primnoa for paleoclimate proxies (e.g., Sinclair et al.,2005; Heikoop et al., 2002). Use of SIMS microanalysis to assessthe polarity of correlation between Mg/Ca and Sr/Ca in this speciesappears to be a useful test to quickly assess if individual sampleshave undergone partial or wholesale diagenetic alteration. If theMg/Ca and Sr/Ca ratios are positively correlated, then suchsamples should be avoided in paleoceanographic studies.
Although the empirical expectation is that biotic marine calcitewill also display a positive correlation between Mg/Ca and Sr/Ca(e.g., Carpenter and Lohman, 1992), this is largely based on thecompiled data on bulk skeletal analyses for shallow water marinespecies. It is notable that the seemingly intact specimens of calciticP. pacifica in this study (R1162-0015 and -0016) show the oppositebehavior, mimicking the inverse correlation between Mg/Ca andSr/Ca observed in aragonitic zooxanthellate tropical reef corals(e.g., Gaetani and Cohen, 2006).
4.4. Potential influence of primary productivity and growth rate onMr/Ca and Sr/Ca ratios
Calculations performed by Gaetani and Cohen (2006) indicatethat, at a constant temperature, when ‘precipitation efficiency’ (i.e.the mass fraction of carbonate precipitated from the calcifyingfluid) increases, then Mg/Ca values increase and Sr/Ca and Ba/Cavalues simultaneously decrease. In L. pertusa the oscillations in theSr/Ca ratios could be reproduced by two-fold variation of theassumed precipitation efficiency, coupled with the observedtemperature dependence of the partition coefficients determinedfrom the abiogenic aragonite (Cohen et al., 2006).
Since only about 50% of the variation observed in the Sr/Caratios in P. pacifica can be attributed to temperature changes(Fig. 9), the observed changes in Sr/Ca and Mg/Ca ratios wouldcall for substantial variations of precipitation efficiency throughthe annual growth cycle.
In biogenic carbonate growth, a change in precipitation effi-ciency (i.e. mass of carbonate precipitated/growth rate of biogeniccarbonate) occurs due to changes in the saturation state of thecalcifying fluids. In tropical corals this change in saturation state islinked to zooxanthellate photosynthesis which is, in turn, linked tochanges in temperature and sunlight (Cohen and McConnaughey,2003; Cohen et al., 2006). Since any change in precipitationefficiency would be primarily reflected as a change in the observedgrowth rate of the coral, factors controlling growth rate arereflected in the trace element changes observed in P. pacifica andsimilar deep sea corals (cf. Kuffner et al., 2012). Observations of Sr/Ca ratios in the cold-water gorgonian Corallium rubrum indicatethat Sr/Ca ratios vary with skeletal density; i.e. they are indirectlycoupled to growth rate (Weinbauer et al., 2000). Cyclicity of Sr/Cain deep sea bamboo corals can be used as an indicator of growthrate rather than being coupled directly to temperature (Roarket al., 2005).
Since no changes in light occur at depths of �300 m (fromwhere P. Pacifica was collected), and short-term variations intemperature in the area of collection are negligible, the primaryfactor driving changes in the growth rate is most likely a change in
R. Aranha et al. / Deep-Sea Research II 99 (2014) 213–226 221

Author's personal copy
food availability (Miller, 1995; Ferrier-Pagès et al., 2003;Houlbrèque et al., 2003, 2005).
Several corals, including zooxanthellate species, can meetpart of their energy requirements by preying on zooplankton,phytoplankton, pico-nanplankton, dissolved organic matter andparticulate organic matter (Tsounis et al., 2010; Ribes et al., 1999,2003; Miller, 1995; Ferrier-Pagès et al., 2003; Houlbrèque et al.,
2003; Houlbrèque et al., 2005; Orejas et al., 2011). Stable isotopeanalysis of two commonly occurring cold water corals, L. pertusaand Madrepora oculata, indicated that they might be omnivoresand may primarily feed on mesozooplankton (Duineveld et al.,2004; Kiriakoulakis et al., 2005). Stable isotope (δ13C and δ15N)analysis indicated that P. resedaeformis likely feeds on phytode-tritus supplemented by mesozooplankton (Sherwood et al.,2008a). A previous study on P. pacifica suggested that it likelyfeeds on the same trophic level as P. resedaeformis (Sherwoodet al., 2005b).
In controlled laboratory experiments on Stylophora pistillata(a zooxanthellate scleractinian coral) it was noted that an increasein plankton feeding under constant water temperature increasedthe rate of both skeletal and tissue growth of the coral. Thisoccurred under both light and dark conditions, indicating thatfeeding has a direct effect on the mass fraction of skeletal materialprecipitated in the absence of light or temperature changes (Miller,
Fig. 7. Mg/Ca and Sr/Ca ratios vs time (years) in the calcite cortex of P. pacifica. Time was calculated by extrapolating average annual radial growth rate over the calcite cortex.Error bars are 71s. The profiles start from the time of death of the organism (i.e. the outer edge), hence younger ages are to the left, and older to the right. The datapresented has been smoothed using a second degree Savitzky–Golay filter. (A) Sample R1162-0015. (B) Sample R1162-0016. (C) Sample R1165-0002. In (B), data are missingin the areas where visible gorgonin rings cut across the calcite cortex.
Table 7Correlation coefficients between Mg/C and Sr/Ca ratios in calcite cortex ofP. pacifica.
Sample number r df p
R1162-0015 �0.18 368 0.0006R1162-0015 �0.13 334 0.015R1165-0002 0.29 301 0.0001
R. Aranha et al. / Deep-Sea Research II 99 (2014) 213–226222

Author's personal copy
1995; Ferrier-Pagès et al., 2003; Houlbrèque et al., 2003, 2005). Itwas also noted that in S. pistillata the amount of food ingested wasproportional to the food density and that the coral never reached asaturation of feeding capacity in the experiments (Ferrier-Pagèset al., 2003). Growth rates almost equivalent to tropical corals
were noted in L. pertusa and M. oculata specimens stored indark conditions in aquaria and fed exclusively with zooplankton– with temperature variation during the experiments controlled to�70.5 1C (Orejas et al., 2008, 2011).
In aragonitic scleractinian reef corals, Sr/Ca ratio is inverselycorrelated with calcification rate, and with temperature, thusshort-term variation in calcification rate causes high-amplitudefluctuations in Sr/Ca that mimic wide SST variations (Kuffner et al.,2012). Thus, accurate short-term fluctuations in Sr/Ca-derivedpaleotemperatures from tropical reef scleractinians should incor-porate growth rate into the Sr/Ca-SST calibration (Gaetani et al.,2011).
For Primnoa calcite, in the absence of light, zooxanthellae, orsubstantial temperature variations, short-term changes in thefeeding of the coral should be the major factor modulating theskeletal precipitation efficiency and, consequently, the trace ele-ment values. If the mass fraction of carbonate precipitatedincreases at a fixed temperature then we would expect to observea decrease in the Sr/Ca ratios and an increase in the Mg/Ca ratios ofthe carbonate (Gaetani and Cohen, 2006). By analogy with thetropical scleractinians, our results suggest that measured Mg/Caand Sr/Ca ratios in cold-water gorgonian calcites may indicatechanges in food supply, hence paleoproductivity, if seawatertemperature variation is known (cf. Hill et al., 2012). Similarly,Ba/Ca in cold-water gorgonian coral skeletons may serve as ameasure of paleoproductivity (Hill et al., 2011), although in ourdata, Ba/Ca ratios did not yield a readily interpreted signal.
4.4.1. Oceanography of the Olympic coast national marine sanctuaryThe waters of OCNMS are subject to changes in physical,
chemical and biological properties due to the California Currentsystem (CCS) (Hickey et al., 2006). The CCS mainly includes thesouthward California Current, the wintertime northward DavidsonCurrent, and the northward California Undercurrent (Hickey andBanas, 2003). The California Undercurrent (CUC) is of specialinterest with respect to our samples because it is very active inthe area of collection. It is continuous at depths of about 100–400 m and likely carries larval fish, invertebrates and evenphytoplankton seed stock (Hickey and Banas, 2003). The intensityof the CUC is known to attain its maximum values in late springand early autumn (Collins et al., 2003), and is the source of muchof the nutrient-rich water supplied to the shelf during coastalupwelling (Hickey and Banas, 2003).
Fig. 8. Observed bottom temperatures in the Olympic Coast National MarineSanctuary (OCNMS) region. All data derived from the World Ocean Database2009, within the bounding coordinates 48–48.51N and 124.75–125.51W. Meantemperatures 795% confidence limits, along with minimum and maximumobserved temperatures and the duration of observations, in the depth intervalsfrom which corals were collected: 260–280 m, 280–300 m, and 300–320 m.
Fig. 9. Calculated paleotemperatures from P. pacifica in OCNMS region, using thepublished equation of Sherwood et al. (2005a), Mg/Ca (mmol mol�1)¼5(71.4) T (1C)+64(710). (A) R1162-0015. (B) R1162-0016. (C) R1165-0002. In (A) and (B), shadedband indicates maximum temperature range observed in World Ocean Database datafor OCNMS region at 300–320m depth, 1938–1983. In (C), shaded band indicatesmaximum observed temperature range at 280–300 m depth, 1953–2006.
Fig. 10. Comparison of radial growth rates of P. resedaeformis from the Hudsonstrait ([1], Sherwood and Edinger, 2009) and the Northeast Channel ([2], Mortensenand Buhl-Mortensen, 2005) with those of P. pacifica from Dixon Entrance (thisstudy and [3], Andrews et al., 2002), and P. pacifica from Olympic Coast NationalMarine Sanctuary (OCNMS, this study). All logarthimic best-fit curves were passedthrough the youngest and largest coral data points in the Mortensen and Buhl-Mortensen (2005) data set. Andrews et al. (2002) provided radial growth data onlyfor one colony of P. pacifica (Gulf of Alaska), thus only one data point for [3] exists inthe graph. The fitted line labeled ‘Model Maximum’ is the logarithmic fit for thefour coral specimens from this study with the largest radii.
R. Aranha et al. / Deep-Sea Research II 99 (2014) 213–226 223
Author's personal copy
The seasonal upwelling (Huyer, 1983) in this area favorsa large spring plankton bloom, followed by a smaller autumnplankton pulse (Anderson, 1964; Landry et al., 1989; Thomas andStrub, 2001). Landry et al. (1989) have reported an increasedconcentration in chlorophyll twice a year offshore of WashingtonState (between 50 and 90 km); one of these episodes occursbetween February and April and the other in October. Thomasand Strub (2001) observed that, in the Pacific Northwest, chlor-ophyll concentrations greater than 2.0 mg m�3 extend furtheroffshore in late spring–summer (May–June) and that a secondoffshore extension occurs in late summer (September).
4.4.2. Expected and observed trace element variations in P. pacificabased on the oceanography of the region
Although the average paleotemperature estimate for one of thecorals analyzed matched observed temperatures (Fig. 9A),observed temperature variation cannot account for the measuredvariation in Mg/Ca and Sr/Ca ratios in the Primnoa skeletonsanalyzed (Fig. 9 and Section 4.3.1). Given that P. pacifica likelyfeeds on the downward flux of particulate organic matter, plank-ton and similar sources; the measured Sr/Ca and Mg/Ca ratioscould respond to changes in the skeletal growth rate broughtabout by changes in food availability (Roark et al., 2005; Kuffneret al., 2012, and Section 4.3.1). In reviews of the primary produc-tion, new production and vertical flux of organic carbon in theeastern Pacific it has been argued that production and vertical fluxwere directly related (Pace et al., 1987; Loubere and Fariduddin,1999).
The biannual increase in food availability (due to the twoplankton blooms per year) should theoretically be observed astwo cycles per year in Mg/Ca and Sr/Ca profiles. While an inversecorrelation is apparent in Sr/Ca and Mg/Ca profiles in Fig. 7, abiannual cyclicity is not obviously resolved.
There are suggestions in our data that P. pacifica may alsorecord more abrupt events. A particularly drastic decrease in Sr/Cavalues is noted along the SIMS profile in R1162-0016 (betweenyear 6 and 7) and R1162-0015 (between year 7 and 8). Thisdecrease in Sr/Ca is accompanied by a simultaneous increase inthe Mg/Ca ratios. This excursion is distinct from spikes caused bygorgonin-rich calcite samples because of the inverse relationshipbetween Mg/Ca and Sr/Ca, as opposed to parallel Mg/Ca and Sr/Cachanges in gorgonin-rich spots. This inverse Mg/Ca–Sr/Ca eventcould be attributed to a single period of increased growth due tosubstantial increase in the availability of food. This single period ofincreased growth occurs �7 yr before death in sample R1162-0015 and �8 yr before death in sample R1162-0016. The coralswere collected during the same ROPOS dive from adjacent areas.Thus the trace element profiles may provide a unique method ofcorrelating growth patterns in corals from proximal colonies.While it is possible that both P. pacifica samples have recordedthe same event, the age uncertainty of the radiocarbon ages fromthe two corals is high enough that it is impossible to demonstratethat the two Mg/Ca records precipitated at the same time.
A substantial, unusual increase in phytoplankton biomasswas recorded in the waters off Washington, Oregon and BritishColumbia in the spring of 2002 (Wheeler et al., 2003; Thomaset al., 2003a) due to the invasion of cool, saline subarctic waters(Freeland et al., 2003; Bograd and Lynn, 2003). Similar eventscould have occurred during the lifetime of R1162-0016 and -0015,leading to the spikes in the Mg/Ca and decreases in the Sr/Ca.Thus, elemental ratios in the calcite skeletons of Primnoa spp. maybe useful in recording short term changes in productivity in theocean, which reflect basin-scale changes in circulation, similar tothe records of oceanographic change preserved in the gorgoninlayers (Sherwood et al., 2011). This attribute would be most useful
in samples harvested live, where exact year of death is easilyestablished.
The decreased Mg/Ca ratios and apparently cooler watertemperatures recorded in sample R1162-0016 indicate variationon the same temporal scale as the Pacific Decadal Oscillation(PDO), although with only one shift, a correlation with PDO isimpossible to demonstrate. The seasonal upwelling in this regionis also influenced greatly by ENSO events, and a reduction in thenutrients and chlorophyll standing stock is known to occur inassociation with ENSO events (Carr, 2002; Corwith and Wheeler,2002). A strong ENSO event should be recorded as a dramatic dipin the Mg/Ca ratios with a simultaneous spike in the Sr/Ca ratios inresponse to decreased productivity. Thus if a coral could survivethrough a strong ENSO event it might also record changesoccurring in surface productivity due to the changes in upwelling.
5. Conclusions
The annual radial growth rate of P. pacifica calculated in thisstudy was 0.23–0.58 mm yr�1. The lowest reported growth rateclosely coincides with the previously reported growth rate for P.pacifica from the Dixon Entrance (Andrews et al., 2002). This lendsfurther support to studies indicating that recovery time fromdamage due to trawling and similar disturbances are very longfor this species (Andrews et al., 2002) and other deep-seagorgonians in Canadian waters (Sherwood and Edinger, 2009).
P. pacifica and P. resedaeformis showed dramatic regionaldifferences in the radial growth rate, with growth rates in P.pacificamore than four times greater than in its northwest Atlanticsister species. Primary productivity is likely the variable best ableto explain these regional differences in growth rate.
Growth rates in the calcite cortex and gorgonin/calcite mixedzone are virtually identical, thus indicating that the growth rate ofthe coral remains constant in spite of a change in the skeletalgrowth mode.
The previously established paleotemperature equation ofMg/Ca ratios in P. resedaeformis, applied to P. pacifica, yieldedaverage bottom water temperatures matching observed tempera-tures, but the range of variation in Mg/Ca ratios and calculatedpaleotemperatures exceeded the range of variation in observedbottom temperatures.
The Mg/Ca and Sr/Ca ratios in P. pacifica calcite are likelycontrolled by surface water productivity changes rather thanbottom water temperature alone. The changes in Mg/Ca and Sr/Ca thus have potential to record major changes in productivity,which in turn can provide evidence of other large scale annual anddecadal changes in hydrographic conditions.
The polarity of the correlation between Mg/Ca and Sr/Ca ratiosindicated diagenetic change in gorgonian coral skeletons that wasotherwise not readily apparent. Original biogenic calcites retaineda negative correlation, while diagenetically altered gorgoniancalcite exhibited a positive Mg/Ca–Sr/Ca correlation.
Acknowledgments
We thank the crew of the ROV ROPOS and CCGS John P. Tullyfor making field work possible. Canadian Hydrographic Service,Geological Survey of Canada, and Olympic Coast National MarineSanctuary provided access to bathymetric datasets. O. Sherwoodprovided invaluable guidance in sample processing and analysis.V. Lecours and B. Neves helped with cartography. Joel Finnisassisted with analysis of archival oceanographc data. M. Wisshakand D. Scott provided helpful comments on the thesis fromwhich this paper is derived, and O. Sherwood, C. Dullo, and an
R. Aranha et al. / Deep-Sea Research II 99 (2014) 213–226224

Author's personal copy
anonymous reviewer provided helpful comments on the manu-script. This research was sponsored by the NSERC-funded Cana-dian Healthy Oceans Network – a university-governmentpartnership dedicated to biodiversity science for the sustainabilityof Canada′s three oceans. Additional funding was provided byNSERC Discovery grants to EE and GL.
References
Amiel, A.J., Friedman, G.M., Miller, D.S., 1973. Distribution and nature of incorpora-tion of trace elements in modern aragonitic corals. Sedimentology 20 (1),47–64.
Anderson, G.C., 1964. The seasonal and geographic distribution of primaryproductivity off the Washington and Oregon coasts. Limnol. Oceanogr. 9,284–302.
Andrews, A.H., Cordes, E., Heifetz, J., Cailliet, G.M., Coale, K.H., Somerton, D., Munk,K., Mahoney, B.M., 2002. Age and growth of a deep sea, habitat-formingoctocorallian (Primnoa sp.) from the Gulf of Alaska, with radiometric agevalidation. Hydrobiologia 471, 101–111.
Azmy, K., Edinger, E., Lundbergm, J., Diegor, W., 2010. Sea level and paleotempera-ture records from a mid-Holocene reef on the north coast of Java, Indonesia. Int.J. Earth Sci. 99, 231–244.
Barrie, J.V., Conway, K.W., 1999. Late quaternary glaciation and post-glacialstratigraphy of the Northern Pacific margin of Canada. Quat. Res. 51, 113–123.
Boyer, T.P., Antonov, J.I., Baranova, O.K., Garcia, H.E., Johnson, D.R., Locarnini, R.A.,Mishonov, A.V., Seidov, D., Smolyar, I.V., Zweng, M.M., 2009, Chapter 1:Introduction. In: S. Levitus (Ed.), World Ocean Database 2009, NOAA AtlasNESDIS 66, U.S. Gov. Printing Office, Washington, D.C., 216 pp., DVD.
Boyle, E.A., 1981. Cadmium, zinc, copper, and barium in foraminifera tests. Earth.Planet. Sci. Lett. 53 (1), 11–35.
Bograd, S.J., Lynn., R.J., 2003. Anomalous subarctic influence in the southernCalifornia current during 2002. Geophys. Res. Lett. 30 (15), 8020.
Cairns, S.D., Bayer, F.M., 2009. A generic revision and phylogenetic analysis of thePrimnoidae (Cnidaria: Octocorallia). Smithson Contrib. Zool. 629, 1–79.
Carpenter, J., Lohman, K.C., 1992. Sr/Mg ratios of modern marine calcite: empiricalindicators of ocean chemistry and precipitation rate. Geochim. Cosmochim.Acta 6, 1837–1849.
Carr, M.-E., 2002. Estimation of potential productivity in eastern boundary currentsusing remote sensing. Deep Sea Res. Part II 49, 59–80.
Cohen, A.L., Layne, G.D., Hart, S.R., Lobel, P.S., 2001. Kinetic control of skeletal Sr/Cain a symbiotic coral; implications for the paleotemperature proxy. Paleoceano-graphy 16, 20–26.
Cohen, A., McConnaughey, T., 2003. Geochemical perspectives on coral mineraliza-tion. Rev. Mineral Geochem. 54, 151–187.
Cohen, A.L., Gaetani, G.A., Lundalv, T., Corliss, B.H., George, R.Y., 2006. Composi-tional variability in a cold-water scleractinian, Lophelia pertusa: new insightsinto vital effects. Geochem. Geophys. Geosyst. 7, Q12004.
Collins, C.A., Ivanov, L.M., Melnichenko, O.V., 2003. Seasonal variability of theCalifornia undercurrent: statistical analysis based on the trajectories of floatswith neutral buoyancy. Phys. Oceanogr. 13 (3), 135–147.
Corwith, H., Wheeler, P.A., 2002. El Niño related variations in nutrient andchlorophyll distributions off Oregon. Prog. Oceanogr. 54, 361–380.
Crawford, H., Thompson, R.E., 1991. Physical oceanography of the western Canadiancontinental shelf. Continent. Shelf Res. 11, 669–683.
Duineveld, G.C.A., Lavaleye, M.S.S., Berghuis, E.M., 2004. Particle flux and foodsupply to a seamount cold-water coral community (Galicia Bank, NW Spain).Mar. Ecol. Prog. Ser. 277, 13–23.
DuPreez, C., Tunnicliffe, V., 2011. Shortspine thornyhead and rockfish (Scorpaeni-daea) distirubtion in response to substratum, biogenic structures and trawling.Mar. Ecol. Prog. Ser. 425, 217–231.
Edinger. E., Boutillier. J., Workman, G., 2008, Coral distributions around LearmonthBank, Northern British Columbia, Canada: influence of surficial geology andtidal currents deep sea coral symposium. In: Fourth International Symposiumon Deep Sea Corals, 2008 Wellington, New Zealand, p. 98, Abstract nr. 6.04.
Edinger, E.N., Sherwood, O.A., 2012. Applied taphonomy of gorgonian and anti-patharian corals in Atlantic Canada: experimental decay rates, field observa-tions, and implications for assessing fisheries damage to deep-se coral habitats.Neues Jahrb. Geol. Palaont. Abh. 265, 199–218.
Ferrier-Pagès, C., Witting, J., Tambutté, E., Sebens, K.P., 2003. Effects of naturalzooplankton feeding on the tissue and skeletal growth of the scleractinian coralStylophora pistillata. Coral Reefs 22, 229–240.
Freeland, H.J., Gatien, G., Huyer, A., Smith, R.L., 2003. Cold halocline in the northernCalifornia current: an invasion of subarctic water. Geophys. Res. Lett. 30 (3),1141.
Gaetani, G.A., Cohen, A.L., 2006. Element partitioning during precipitation ofaragonite from seawater: a framework for understanding paleoproxies. Geo-chim. Cosmochim. Acta 70, 4617. (463).
Gaetani, G.A., Cohen, A.L., Wang, Z., Crusius, J., 2011. Rayleigh-based, multi-elementcoral thermometry: a biomineralization approach to developing climateproxies. Geochim. Cosmochim. Acta 75, 1920–1933.
Heikoop, J.M., Hickmott, D.D., Risk, M.J., Shearer, C.K., Atudorei, V., 2002. Potentialclimate signals from the deep-sea gorgonian coral Primnoa resedaeformis.Hydrobiologia 471, 117–124.
Hickey, B.M., Banas, N.S., 2003. Oceanography of the Pacific Northwest coastalocean and estuaries with application to coastal ecosystems. Estuaries 26 (48),1010–1031.
Hickey, B., MacFadyen, A., Cochlan, W., Kudela, R., Bruland, K., Trick, C., 2006.Evolution of chemical, biological, and physical water properties in the northernCalifornia Current in 2005: remote or local wind forcing? Geophys. Res. Lett. 33,L22S02.
Hill, T.M., Spero, H.J., Guilderson, T., LaVigne, M., Clague, D., Macalello, S., Jang, N.,2011. Temperature and vital effect controls on bamboo coral (Isididae) isotopegeochemistry: a test of the “lines method”. Geochem. Geophys. Geosyst.,Q04008, http://dx.doi.org/10.1029/2010GC003443.
Hill, T.M., LaVigne, M., Spero, H.J., Guilderson, T., Gaylord, B., Clague, D., 2012.Variations in seawater Sr/Ca recorded in deep-sea bamboo corals. Paleoceano-graphy 27, PA3202, http://dx.doi.org/10.1029/2011PA002260.
Houlbrèque, F., Tambutté, E., Ferrier-Pagès, C., 2003. Effect of zooplankton avail-ability on the rates of photosynthesis, tissue and skeletal growth of thescleractinian coral, Stylophora pistillata. J. Exp. Mar. Biol. Ecol. 296, 145–166.
Houlbrèque, F., Tambutté, E., Allemand, D., Ferrier-Pagès, C., 2005. Interactionsbetween zooplankton feeding, photosynthesis and skeletal growth in thescleractinian coral Stylophora pistillata. J. Exp. Biol. 207, 1461–1469.
Huyer, A., 1983. Coastal upwelling in the California current system. Prog. Oceanogr.12 (3), 259–284.
Jones, E.P., Anderson, L.G., 1994. Northern Hudson Bay and Foxe Basin watermasses, circulation and productivity. Atmos. Ocean 32, 361–374.
Kiriakoulakis, K., Fisher, E., WolV, G.A., Freiwald, A., Grehan, A., Roberts, J.M., 2005.Lipids and nitrogen isotopes of two deep-water corals from the North-EastAtlantic: initial results and implications for their nutrition. In: Freiwald, A.,Roberts, J.M. (Eds.), Cold-water Corals and Ecosystems. Springer, Berlin,pp. 715–729.
Kuffner, I.B., Jokiel, P.L., Rodgers, K.S., Andersson, A.J., MacKenzie, F.T., 2012. Anapparent “vital effect” of calcification rate on the Sr/Ca temperature proxy inthe reef coralMontipora capitata. Geochem. Geophys. Geosyst., 13, http://dx.doi.org/10.1029/2012GC004128.
Lea, D.W., Shen, G.T., Boyle, E.A., 1989. Coralline barium records temporal variabilityin equatorial Pacific upwelling. Nature 340 (6232), 373–376.
Lea, D.W., Boyle, E.A., 1990. Foraminiferal reconstruction of barium distributions inwater masses of the glacial oceans. Paleoceanography 5, 719–742.
Loubere, P., Fariduddin, M., 1999. Quantitative estimation of global patterns ofsurface ocean biological productivity and its seasonal variation on timescalesfrom centuries to millennia. Global Biogeochem. Cycles 13, 115–133.
Landry, M.R., Postel, J.R., Peterson, W.K., Newman, J., 1989. Broad-scale distributionpatterns of hydrographic variables on the Washington Oregon shelf. In: Landry,M.R., Hickey, B.M. (Eds.), Coastal Oceanography of Washington and Oregon.Elsevier, Amsterdam. (Chapter 1).
McNeely, R., Dyke, A.S., Southon, J.R., 2006, Canadian Marine Reservoir Ages,Preliminary Data Assessment, Geological Survey Canada, Open File 5049, pp. 3.
Miller, M.W., 1995. Growth of a temperate coral: effects of temperature, light,depth, and heterotrophy. Mar. Ecol. Prog. Ser. 122, 217–225.
Mitsuguchi, T., Matsumoto, E., Abe, O., Uchida, T., Isdale, P.J., 1996. Mg/Ca thermo-metry in coral skeletons. Science 274, 961–963.
Mortensen, P.B., Buhl-Mortensen, L., 2005. Morphology and growth of the deep-water gorgonians Primnoa resedaeformis and Paragorgia arborea. Mar. Biol. 147,775–788.
Neves, B.M., Du Preez, C., Edinger, E., 2014. Mapping coral and sponge habitats on ashelf-depth environment using multibeam sonar and ROV video observations:Learmonth Bank, Northern British Columbia, Canada. Deep-Sea Res. II 99,169–183.
Neves, B. M., Edinger, E.N., 2012, Geographic and environmental variation ingorgonian coral skeletal growth rates. In: Geological Association of Canadaannual meeting, St. Johns, Canada, Abstracts with program, p. 98.
Orejas, C., Gori, A., Gili, J.M., 2008. Growth rates of live Lophelia pertusa andMadrepora oculata from the Mediterranean Sea maintained in aquaria. CoralReefs 27, 255.
Orejas, C., Ferrier-Pages, C., Reynaud, S., Tsounis, G., Allemand, D., Gili, J.M., 2011.Experimental comparison of skeletal growth rates in the cold-water coralMadrepora oculata Linnaeus, 1758, and three tropical scleractinian corals. J.Exp. Mar. Biol. Ecol. 405, 1–5.
Pace, M.L., Knauer, G.A., Karl, D.M., Martin, J.H., 1987. Primary production, newproduction, and vertical flux in the eastern Pacific Ocean. Nature 325, 803–804.
Reimer, P.J., Baillie, M.G.L., Bard, E., Bayliss, A., Beck, J.W., Blackwell, P.G., BronkRamsey, C., Buck, C.E., Burr, G.S., Edwards, R.L., Friedrich, M., Grootes, P.M.,Guilderson, T.P., Hajdas, I., Heaton, T.J., Hogg, A.G., Hughen, K.A., Kaiser, K.F.,Kromer, B., McCormac, F.G., Manning, S.W., Reimer, R.W., Richards, D.A.,Southon, J.R., Talamo, S., Turney, C.S.M., van der Plicht, J., Weyhenmeyer, C.E.,2009. INTCAL 09 and MARINE09 Raadiocarbon age calibration curves, 0–50,000years Cal BP. Radiocarbon 51 (4), 1111–1115.
Ribes, M., Coma, R., Gili, J.M., 1999. Heterogeneous feeding n benthic suspensionfeeders: The natural diet and feeding rate of the temperate gorgonian Para-muricea clavata (Cnidaria:Octocorallia) over a year cycle. Mar. Ecol. Prog. Ser.183, 125–137.
Ribes, M., Coma, R., Rossi, S., 2003. Natural feeding of the temperate asymbioticoctocoral gorgonian Leptogorgia sarmentosa (Cnidaria:Octocorallia). Mar. Ecol.Prog. Ser. 254, 141. (15).
Risk, M.J., Heikoop, J.M., Snow, M.G., Beukens, R., 2002. Lifespans and growthpatterns of two deep-sea corals: Primnoa resedaeformis and Desmophyllumcristagalli. Hydrobiologia 471, 125–131.
R. Aranha et al. / Deep-Sea Research II 99 (2014) 213–226 225

Author's personal copy
Roark, E.B., Guilderson, T.P., Flood-Page, S.R., Dunbar, R.B., Ingram, B.L., Fallon, S.J.,McCulloch, M.T., 2005. Radiocarbon-based ages and growth rates for bamboocorals from the Gulf of Alaska. Geophys. Res. Lett. 32, L04606.
Sherwood, O.A., Heikoop, J.M., Sinclair, D.J., Scott, D.B., Risk, M.J., Shearer, C., Azetsu-Scott, K., 2005a. Skeletal Mg/Ca in Primnoa resedaeformis: relationship totemperature. In: Freiwald, A., Murray, J.M. (Eds.), Cold-Water Corals andEcosystems. Springer, Berlin, pp. 1061–1079.
Sherwood, O.A., Heikoop, J.M., Scott, D.B., Risk, M.J., Guilderson, T.P., McKinney, R.A.,2005b. Stable istopic composition of deep sea gorgonian corals Primnoa spp.: anew archive of surface processes. Mar. Ecol. Prog. Ser. 301, 135–148.
Sherwood, O.A., Scott, D.B., Risk, M.J., Guilderson, T.P., 2005c. Radiocarbon evidencefor annual growth rings in the deep-sea octocoral Primnoa resedaeformis. Mar.Ecol. Prog. Ser. 301, 129–134.
Sherwood, O.A., Scott, D.B., Risk, M.J., 2006. Late Holocene radiocarbon and asparticacid racemization dating of deep-sea octocorals. Geochim. Cosmochim. Acta 70,2806–2814.
Sherwood, O.A., Jamieson, R.E., Edinger, E.N., Wareham, V.E., 2008a. Stable C and Nisotopic composition of cold-water corals from the Newfoundland and Labra-dor continental slope: examination of trophic, depth and spatial effects. Deep-Sea Res. Part I 55, 1392–1402.
Sherwood, O.A., Edinger, E.N., Guilderson, T.P., Ghaleb, B., Risk, M.J., Scott, D.B.,2008b. Late Holocene radiocarbon variability in Northwest Atlantic slopewaters. Earth Planet. Sci. Lett. 275, 146–153.
Sherwood, O.A., Edinger, E., 2009. Ages and growth rates of some deep-seagorgonian and anthipatharian corals of Newfoundland and Labrador. Can. J.Fish Aquat. Sci. 66, 142–152.
Sherwood, O.A., Lehmann, M.F., Schubert, C.J., Scott, D.B., McCarthy, M.D., 2011.Nutrient regime shift in the western North Atlantic indicated by compound-specific d15N of deep-sea gorgonians. Proc. Natl. Acad. Sci. USA 108, 1011–1015.
Sinclair, D.J., Sherwood, O.A., Risk, M.J., Hillaire-Marcel, C., Tubrett, M., Sylvester, P.,McCulloch, M., Kinley, L., 2005. Testing the reproducibility of Mg/Ca profiles in
the deep-water coral Primnoa resedaeformis: putting the proxy through itspaces. In: Freiwald, A., Murray, J.M. (Eds.), Cold-Water Corals and Ecosystems.Springer, Berlin, pp. 1039–1060.
Sinclair, D.J., Williams, B., Allard, G., Ghaleb, B., Fallon, S., Ross, S.W., Risk, M., 2011.Reproducibility of trace element profiles in a specimen of the deep-waterbamboo coral Keratoisis sp. Geochim. Cosmochim. Acta 75, 5101–5121.
Smith, S.V., Buddemeier, R.W., Redalje, R.C., Houck, J.E., 1979. Strontium–calciumthermometry in coral skeletons. Science 204 (4391), 404–407.
Stuiver, M., Polach, H.A., 1977. Discussion: reporting 14 C data. Radiocarbon 19,355–363.
Tsounis, G., Orejas, C., Reynaud, S., Gili, J.M., Allemand, D., Ferrier-Pagès, C., 2010.Prey-capture rates in four Mediterranean cold water corals. Mar. Ecol. Prog. Ser.398, 149–155.
Thomas, A.C., Strub, P.T., 2001. Cross-shelf phytoplankton pigment variability in theCalifornia current. Cont. Shelf Res. 21, 1157–1190.
Thomas, A.C., Strub, P.T., Brickley, P., 2003a. Anomalous satellite measured chlor-ophyll concentrations in the northern California current in 2001–2002. Geo-phys. Res. Lett. 30 (15), 8022.
Thomas, A.C., Townsend, D.W., Weatherbee, R., 2003b. Satellite measured phyto-plankton variability in the Gulf of Maine. Cont. Shelf. Res. 23, 971–989.
Thresher, R., Rintoul, S.R., Koslow, J.A., Weidman, C., Adkins, J., Proctor, C., 2004.Oceanic evidence of climate change in southern Australia over the last threecenturies. Paleoceangraphy 31, L07212, http://dx.doi.org/10.1029/2003GL018869.
Thresher, R.E., Wilson, N.C., MacRae, C.M., Neil, H., 2010. Temperature effects on thecalcite skeletal composition of deep-water gorgonians (Isididae). Geochim.Cosmochim. Acta 74, 4655–4670.
Weinbauer, M.G., Brandstatter, F., Velimirov, B., 2000. On the potential use ofmagnesium and strontium concentrations as ecological indicators in the calciteskeleton of the red coral (Corallium rubrum). Mar. Biol. 137, 801–809.
Wheeler, P.A., Huyer, A., Fleischbein, J., 2003. Cold halocline, increased nutrients,and higher chlorophyll off Oregon in 2002. Geophys. Res. Lett. 30 (15), 8021.
R. Aranha et al. / Deep-Sea Research II 99 (2014) 213–226226
Copyright © 2022 FDOKUMEN