Estimation of uncertainty in electron probe microanalysis: iron determination in manuscripts, a case...
11
Microchim Acta (2007) DOI 10.1007/s00604-007-0821-0 Printed in the Netherlands Original Paper Estimation of uncertainty in electron probe microanalysis: iron determination in manuscripts, a case study Kristina Virro 1 , Enn Mellikov 2 , Olga Volobujeva 2 , Va ¨ino Sammelselg 3 , Jelena Asari 3 , Lilli Paama 1 , Jaana Ju ¨ rgens 1 , Ivo Leito 1 1 Institute of Chemical Physics, University of Tartu, Tartu, Estonia 2 Department of Materials Science, Tallinn Technical University, Tallinn, Estonia 3 Institute of Physical Chemistry, University of Tartu, Tartu, Estonia Received 16 November 2006; Accepted 31 May 2007; Published online 6 August 2007 # Springer-Verlag 2007 Abstract. A case study of ISO GUM-based estimation of measurement uncertainty of quantitative surface elemental analysis is presented. The analytical task was the measurement of iron content in the ink writing on the surface of an 18 th century manuscript by elec- tron probe microanalysis using a scanning electron microscope equipped with an energy-dispersive X- ray spectrometer (SEM=EDS). The problems that arise in uncertainty estimation of quantitative surface anal- ysis are outlined (defining the measurand, preparing calibration standards, non-uniformity of the surface, etc) and ways of overcoming them are suggested. The average iron content on the ink-covered surface of the sample manuscript was found to be 0.12 0.04 mg mm 2 (at confidence level 95.5%). Paper sheets with ink lines of known iron contents were used as calibration standards. The main source of uncertainty was the variability of the parallel measurement results from different locations of the sample surface (mostly due to the variations in the surface structure of paper), which contributed 78% of the total uncertainty. It is concluded that EPMA using a SEM=EDS is suitable for at least semi-quantitative determination of iron in the writing of ink-written manuscripts. Several specific issues in uncertainty analysis are pointed out that need further investigation. Keywords: Measurement uncertainty; scanning electron micros- copy (SEM); electron probe microanalysis (EPMA); SEM=EDS; iron-gall ink; manuscript Significant progress in uncertainty estimation of chemical measurement results has been made in the recent years. In addition to conceptual works quite some practical case studies and examples are available. These are included as examples in guidance docu- ments, such as the ISO GUM [1], the EURACHEM= CITAC uncertainty estimation guide [2] or the Nordtest handbook [3], in journal articles [4–9] and also on some measurement uncertainty related web- sites [10]. All these, however, relate only to the conventional ‘‘macroscopic’’ chemical analysis. Besides this, local and=or surface-analysis techniques are nowadays used more and more frequently. These measurements as any other have uncertainty. Due to the problems with defining the measurand, the (often high) non-unifor- mity of the surface and other problems, estimating Electronic Supplementary Material. The full uncertainty calcu- lation file in MS Excel 2002 format is available as electronic supplementary material (ESM). This material is available online at http:==www.ut.ee=katsekoda=GUM_examples=EDS_ESM.xls. Correspondence: Ivo Leito, Institute of Chemical Physics, University of Tartu, Jakobi 2, 51014 Tartu, Estonia, e-mail: ivo. [email protected]
-
Upload
independent -
Category
Documents
-
view
0 -
download
0
Transcript of Estimation of uncertainty in electron probe microanalysis: iron determination in manuscripts, a case...
Microchim Acta (2007)
DOI 10.1007/s00604-007-0821-0
Printed in the Netherlands
Original Paper
Estimation of uncertainty in electron probe microanalysis: irondetermination in manuscripts, a case study
Kristina Virro1, Enn Mellikov2, Olga Volobujeva2, Vaino Sammelselg3, Jelena Asari3,
Lilli Paama1, Jaana Jurgens1, Ivo Leito1
1 Institute of Chemical Physics, University of Tartu, Tartu, Estonia2 Department of Materials Science, Tallinn Technical University, Tallinn, Estonia3 Institute of Physical Chemistry, University of Tartu, Tartu, Estonia
Received 16 November 2006; Accepted 31 May 2007; Published online 6 August 2007
# Springer-Verlag 2007
Abstract. A case study of ISOGUM-based estimation
of measurement uncertainty of quantitative surface
elemental analysis is presented. The analytical task
was the measurement of iron content in the ink writing
on the surface of an 18th century manuscript by elec-
tron probe microanalysis using a scanning electron
microscope equipped with an energy-dispersive X-
ray spectrometer (SEM=EDS). The problems that arise
in uncertainty estimation of quantitative surface anal-
ysis are outlined (defining the measurand, preparing
calibration standards, non-uniformity of the surface,
etc) and ways of overcoming them are suggested.
The average iron content on the ink-covered surface
of the sample manuscript was found to be 0.12�0.04mgmm�2 (at confidence level 95.5%). Paper sheets
with ink lines of known iron contents were used as
calibration standards. The main source of uncertainty
was the variability of the parallel measurement results
from different locations of the sample surface (mostly
due to the variations in the surface structure of paper),
which contributed 78% of the total uncertainty. It is
concluded that EPMA using a SEM=EDS is suitable
for at least semi-quantitative determination of iron in
the writing of ink-written manuscripts. Several specific
issues in uncertainty analysis are pointed out that need
further investigation.
Keywords: Measurement uncertainty; scanning electron micros-
copy (SEM); electron probe microanalysis (EPMA); SEM=EDS;iron-gall ink; manuscript
Significant progress in uncertainty estimation of
chemical measurement results has been made in the
recent years. In addition to conceptual works quite
some practical case studies and examples are available.
These are included as examples in guidance docu-
ments, such as the ISO GUM [1], the EURACHEM=CITAC uncertainty estimation guide [2] or the
Nordtest handbook [3], in journal articles [4–9] and
also on some measurement uncertainty related web-
sites [10].
All these, however, relate only to the conventional
‘‘macroscopic’’ chemical analysis. Besides this, local
and=or surface-analysis techniques are nowadays usedmore and more frequently. These measurements as
any other have uncertainty. Due to the problems with
defining the measurand, the (often high) non-unifor-
mity of the surface and other problems, estimating
Electronic Supplementary Material. The full uncertainty calcu-
lation file in MS Excel 2002 format is available as electronic
supplementary material (ESM). This material is available online
at http:==www.ut.ee=katsekoda=GUM_examples=EDS_ESM.xls.
Correspondence: Ivo Leito, Institute of Chemical Physics,
University of Tartu, Jakobi 2, 51014 Tartu, Estonia, e-mail: ivo.
uncertainty in surface analysis is not an easy task.
Hence, not surprisingly, although there is no shortage
of papers devoted to surface analysis of a great variety
of objects, including quantitative analysis, the uncer-
tainty of such measurements, especially for materials
outside the alloy, mineral and semiconductor domain,
has received only limited attention. The sources of
uncertainty in such analysis have been studied, but
far less is known about the evaluation of their magni-
tude [11–15]. Works where the different uncertainty
sources are quantified and combined according to a
measurement model to yield the combined uncertainty
of the result are to the best of our knowledge com-
pletely absent from the literature. Such approach would
be valuable, as it would enable to analyze the contribu-
tions of different uncertainty sources and to point out
ways to improve the measurement procedure.
Among the objects that are analyzed using the sur-
face analysis methods, old manuscripts have an im-
portant place. Manuscripts and drawings made with
the iron-gall ink (active components are tannic acid
and iron(II)sulfate) form a major part of the European
cultural heritage. Iron-gall ink was the most common
ink used before the 19th century [16]. Unfortunately,
all such manuscripts are threatened by the so-called
ink corrosion – deterioration of paper by ink compo-
nents like acids and ions of metals (e.g. Fe, Cu) [16,
17]. The paper looses its mechanical strength and the
unique artifacts are damaged forever. This has become
a serious problem in the field of cultural heritage pres-
ervation. The problem has been recognized and large
collaborative efforts have been undertaken to find ways
of stopping manuscript degradation. See the InkCor
project homepage [17] and the Ink Corrosion Website
[16] for a good overview of the state of the art in this
field. The mechanisms of the processes are still under
investigation [16, 17]. Various parameters of the ink
and the paper have their influence on the corrosion
and on the possible means of retarding and stopping
it. An important factor among them is the iron content
in the ink writing on the paper surface. Exact cor-
relations have not been published, because there is
not enough iron content data in manuscripts available.
Therefore development of quantitative analysis meth-
ods are very important.
The broader goal of our research in this direction is
to evaluate the electron probe microanalysis approach
based on SEM=EDS for elemental quantification in
investigation of historic objects. The narrower aim of
this paper is to tackle the problem of estimating un-
certainty of quantitative surface analysis on the exam-
ple of measuring iron content on the paper surface
(surface concentration) of historic manuscripts. In this
context the term surface is to be understood in a broad
sense: it means not only the monomolecular surface
layer of the paper but a significantly deeper layer,
since a large part of the ink infiltrates deeper into the
paper at the time of writing. The exact definition of
the term surface concentration is given below.
Several rather difficult problems are associated with
this task: quantification in the actual surface analysis,
non-uniformity of the surface (e.g. in its porosity) and
the elemental content on the surface area, preparation
of calibration objects that are sufficiently similar to
the samples of unknown concentration.
We present here an uncertainty estimation procedure
according to the ISO GUM [1] and the EURACHEM=CITAC guide [2] applicable to SEM=EDS quantifica-
tion of iron in paper surface of historic manuscripts.
We explore and discuss the influence of various ex-
perimental parameters on the uncertainty of the mea-
surement result. In particular, our attention is devoted
to the difficult issues of measurand definition and
sample non-uniformity. Several specific problems in
uncertainty analysis are outlined, that need further
investigation.
Different spectroscopic techniques are used to ana-
lyze old written manuscripts or drawings to identify
inks [15, 18–20], gain information about the deterio-
ration of paper [21–24], investigate the distribution
and amounts of components in inks [11–14, 22, 25–
30] and the influence of inhibitors to iron or evaluate
conservation techniques or strategies [11, 29–35]. The
most important of them in the viewpoint of non-de-
structiveness are X-ray microprobe [29], microscopic
X-ray fluorescence analysis [15, 22, 27], Particle (pro-
ton) Induced X-ray Emission (PIXE) spectroscopy
[11–13, 18, 20, 31, 36], X-ray absorption near edge
spectroscopy [27, 28] and SEM=EDS [14, 26, 33]
(some of these methods, depending of the sample type,
are more or less destructive). Although PIXE is gen-
erally considered the most powerful of them, fully
meeting the requirements of analyzing objects of his-
torical value, it has poorer lateral resolution and is less
accessible than SEM=EDS. If quantitative results are
desired, then if the investigated object is not a homo-
geneous material, the quantification with SEM=EDS
has several difficulties (see below) but the method has
the important advantages of being sensitive, fast and it
is possible to measure the analyte content on a highly
K. Virro et al.
localized area. All in all the SEM=EDS method is cur-
rently perhaps the most widely used method for local-
ized elemental analysis of various surfaces and bulk
materials.
Experimental
Description of the analysis procedure
The intensity of the X-rays corresponding to iron atoms (i.e. the
EDS signal intensity of the Fe K� line at 6.404 keV) generated in the
paper surface by the electron probe was used as the analytical signal
to determine the iron content of the sample surface. Quantification
was carried out using the calibration graph method. The EDS signal
intensity of standards (paper sheets with ink lines) of known surface
concentration of iron was used for calibration.
Preparation of the calibration standards
It is very important to carry out calibration with standards that re-
semble the actual analysis objects as closely as possible. For our
analysis of manuscripts we prepared calibration standards in the
form of paper sheets with ink lines of known iron surface concen-
tration. The widths of the ink lines were adjusted to be as similar to
the widths of the lines on the sample manuscript as possible.
Pure Whatman cotton (without additives) paper (www.whatman.
com) with gelatin sizing was used. Gelatin was a common surface
sizing agent until 19th century. The other widespread method – the
alum-rosin sizing method was invented only in the early 19th century
(and was in use until the 1970s) [37].
Test sheets for simulation of old writing were prepared by plot-
ting 40 longitudinal lines (about 265mm long and 0.54mm wide)
with three different model-ink solutions on the paper. The fountain
pen used for plotting the lines was weighed before and after the
plotting in order to find out how much ink was consumed per area
unit of a line.
Preparation of the ink solutions
In order to achieve ink writing with known iron concentration
(expressed in mgmm�2), the iron concentration of the ink must be
known. Iron gall inks were made from aqueous solutions of iron(II)
sulfate, gallnuts (source of tannin) and gum arabic [32]. Preparation
of iron-gall ink with known iron concentration is not straightfor-
ward. The main reason is that the ink is not completely homogenous
and tends to form a precipitate. The generally used ink recipe, de-
scribed by Neevel [32] was taken as the basis for standard solutions.
Precise gravimetric preparation of the ink solution was complicated
because of precipitation. Hence, we prepared three ink solutions:
12, 18 and 24g of Mohr’s salt (Reakhim, the former USSR, no
website available) was dissolved in 200mL of aqueous solution of
gum arabic (Aldrich, www.sigmaaldrich.com) and then powdered
tannin (Reakhim, the former USSR, no website available) was
added. The tannin and gum arabic content was the same in all
three models of inks: 0.05 and 0.03gmL�1, respectively. The me-
dium concentration of the three inks with the Fe to tannin molar
ratio of 5.5 has been selected according to J. Neevel as a represen-
tative ratio in old inks [32]. These solutions were left standing and
were filtered twice through a plug of cotton-wool. After such treat-
ment the ink solutions were reasonably stable. The concentrations of
iron in the filtered ink solutions were measured by the flame AAS
method (using the standard conditions for iron determination at
wavelength 248.3 nm).
Calculation of the surface concentrations of iron
on the calibration samples
With the term ‘‘surface concentration’’ we denote the mass (in mg)of iron per unit of surface area (mm2) irrespective of how deep iron
has diffused into the paper. Under our experimental conditions the
X-rays are emitted throughout the thickness of the paper (standards
and sample).
The surface concentrations of iron in the calibration standards
were calculated using the following data: the lengths and widths of
the lines, iron concentration and the density of the ink solution, and
the mass difference of the fountain pen before and after drawing the
lines.
The original manuscript
Three small samples from different places located diagonally
over the investigated manuscript (18th century, from the Estonian
National Archive) were analyzed. The spots were chosen with letters
that visually looked similar to the model ink lines.
Analysis procedure
A SEM model Leo Supra 35 equipped with R€oontec EDS Xflash
3001 detector was used. Accelerating voltage of 15.00 kV was cho-
sen for the probe electrons. The beam cross-section was 0.5 mm,
the beam current was 1–2 � 10�8 A. From each of the three stan-
dard sheets several cutouts were subjected to the analysis. Select-
ed samples of approximately 0.5 cm2 were mounted on copper
supports using double-sided adhesive tape. The standards and the
manuscript samples were coated with a thin platinum layer of
2 nm thickness.
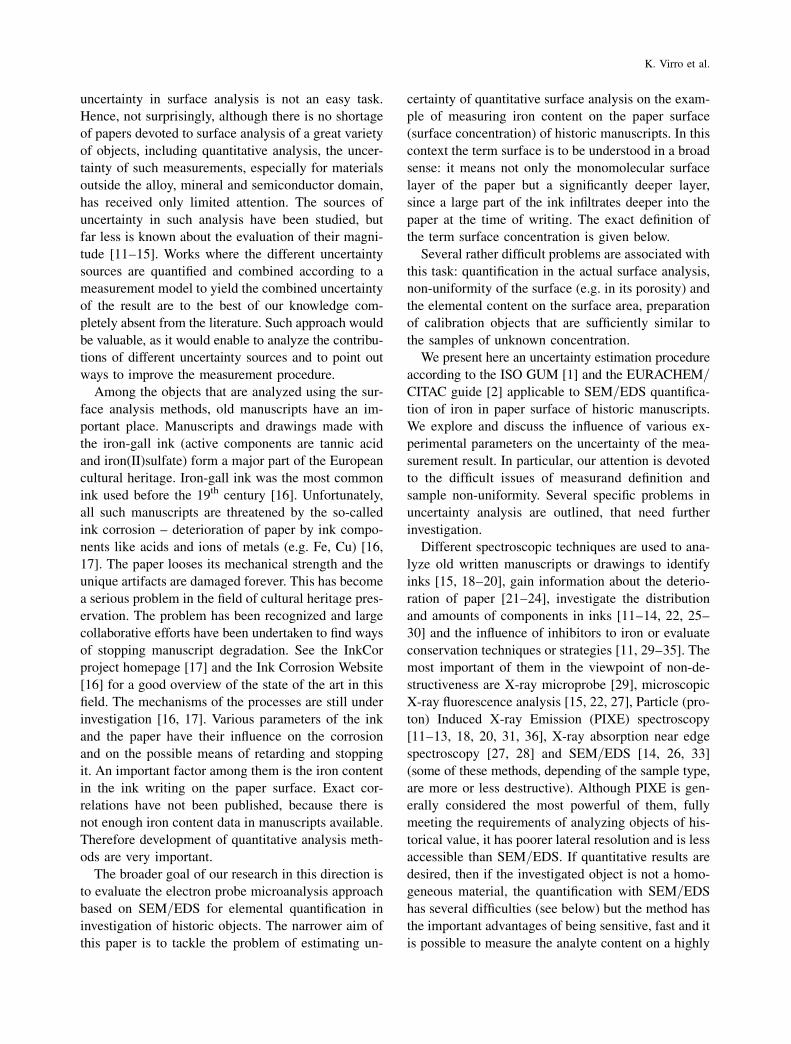
The standards and samples were examined using SEM magnifi-
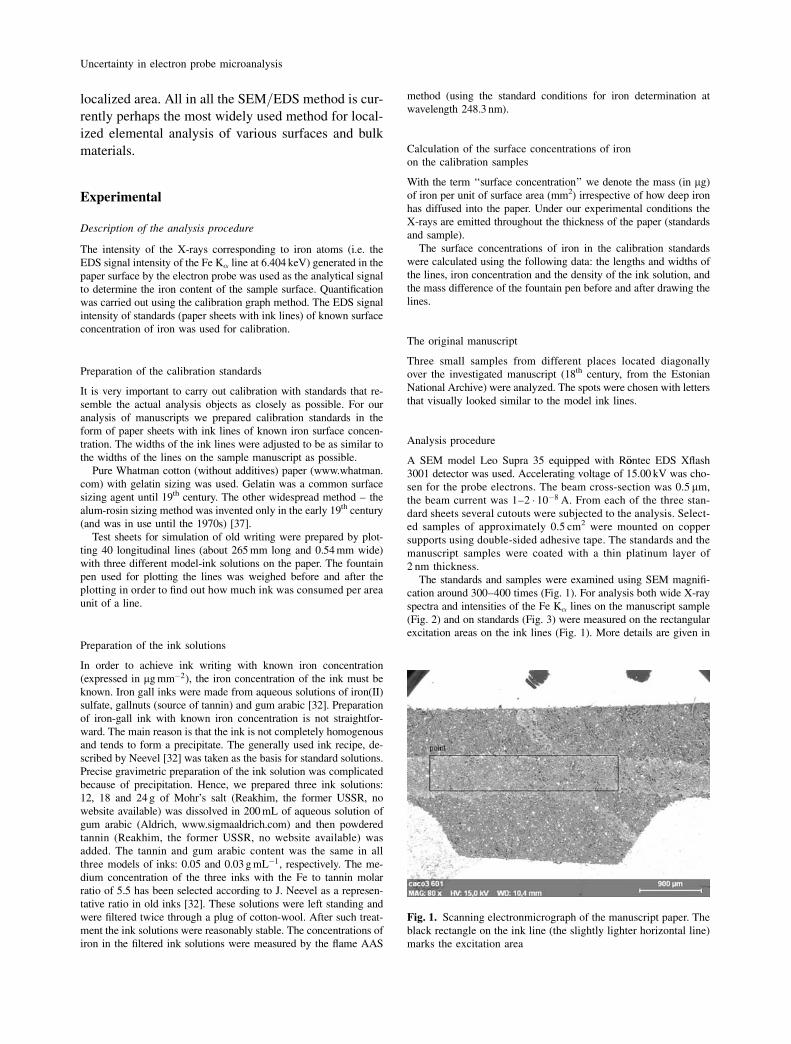
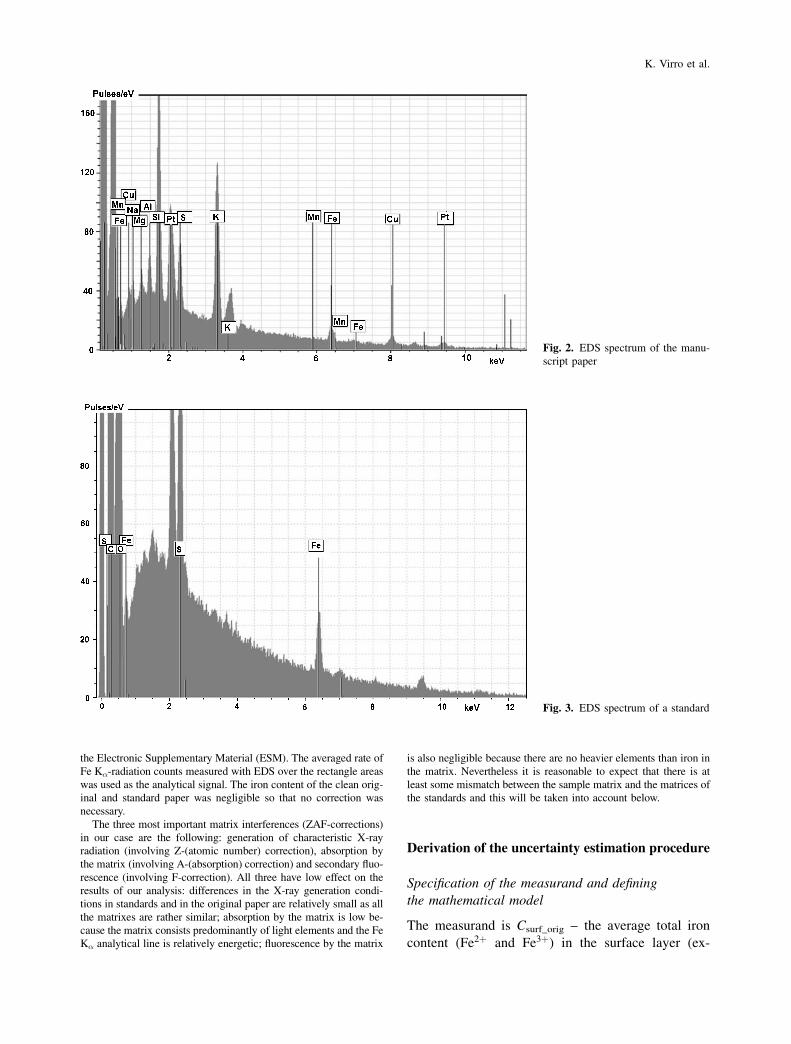
cation around 300–400 times (Fig. 1). For analysis both wide X-ray
spectra and intensities of the Fe K� lines on the manuscript sample
(Fig. 2) and on standards (Fig. 3) were measured on the rectangular
excitation areas on the ink lines (Fig. 1). More details are given in
Fig. 1. Scanning electronmicrograph of the manuscript paper. The
black rectangle on the ink line (the slightly lighter horizontal line)
marks the excitation area
Uncertainty in electron probe microanalysis
the Electronic Supplementary Material (ESM). The averaged rate of
Fe K�-radiation counts measured with EDS over the rectangle areas
was used as the analytical signal. The iron content of the clean orig-
inal and standard paper was negligible so that no correction was
necessary.
The three most important matrix interferences (ZAF-corrections)
in our case are the following: generation of characteristic X-ray
radiation (involving Z-(atomic number) correction), absorption by
the matrix (involving A-(absorption) correction) and secondary fluo-
rescence (involving F-correction). All three have low effect on the
results of our analysis: differences in the X-ray generation condi-
tions in standards and in the original paper are relatively small as all
the matrixes are rather similar; absorption by the matrix is low be-
cause the matrix consists predominantly of light elements and the Fe
K� analytical line is relatively energetic; fluorescence by the matrix
is also negligible because there are no heavier elements than iron in
the matrix. Nevertheless it is reasonable to expect that there is at
least some mismatch between the sample matrix and the matrices of
the standards and this will be taken into account below.
Derivation of the uncertainty estimation procedure
Specification of the measurand and defining
the mathematical model
The measurand is Csurf_orig – the average total iron
content (Fe2þ and Fe3þ) in the surface layer (ex-
Fig. 2. EDS spectrum of the manu-
script paper
Fig. 3. EDS spectrum of a standard
K. Virro et al.
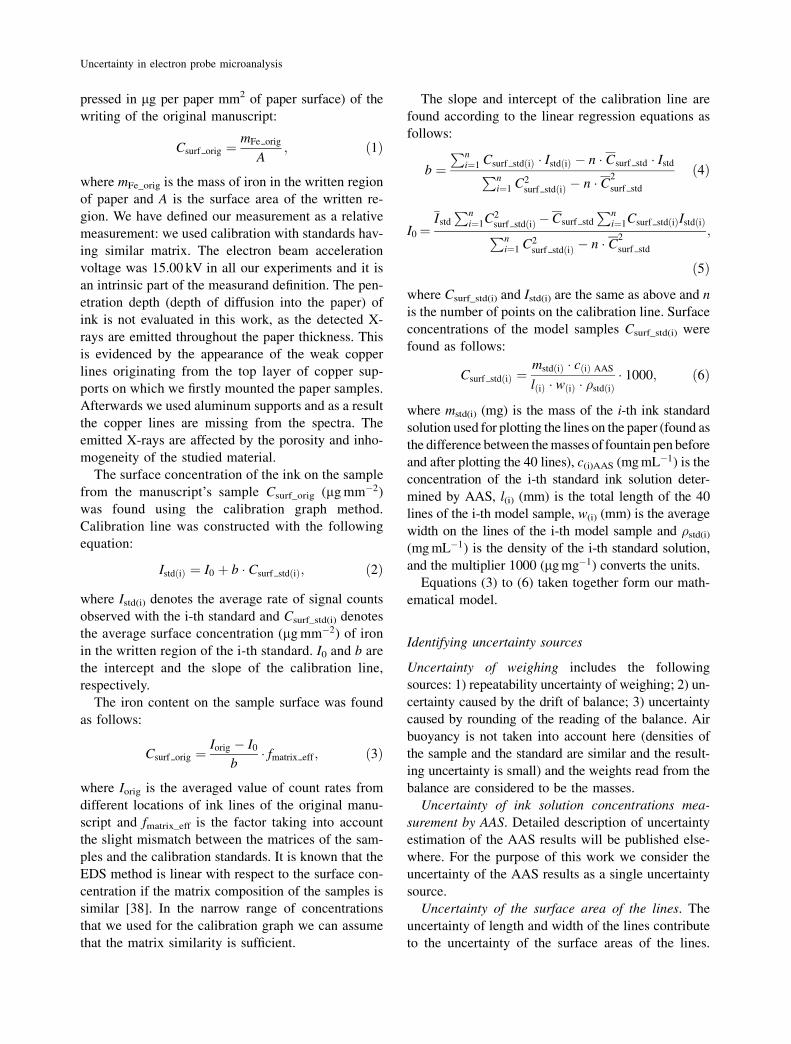
pressed in mg per paper mm2 of paper surface) of the
writing of the original manuscript:
Csurf orig ¼mFe orig
A; ð1Þ
where mFe_orig is the mass of iron in the written region
of paper and A is the surface area of the written re-
gion. We have defined our measurement as a relative
measurement: we used calibration with standards hav-
ing similar matrix. The electron beam acceleration
voltage was 15.00 kV in all our experiments and it is
an intrinsic part of the measurand definition. The pen-
etration depth (depth of diffusion into the paper) of
ink is not evaluated in this work, as the detected X-
rays are emitted throughout the paper thickness. This
is evidenced by the appearance of the weak copper
lines originating from the top layer of copper sup-
ports on which we firstly mounted the paper samples.
Afterwards we used aluminum supports and as a result
the copper lines are missing from the spectra. The
emitted X-rays are affected by the porosity and inho-
mogeneity of the studied material.
The surface concentration of the ink on the sample
from the manuscript’s sample Csurf_orig (mgmm�2)
was found using the calibration graph method.
Calibration line was constructed with the following
equation:
IstdðiÞ ¼ I0 þ b � Csurf stdðiÞ; ð2Þ
where Istd(i) denotes the average rate of signal counts
observed with the i-th standard and Csurf_std(i) denotes
the average surface concentration (mgmm�2) of iron
in the written region of the i-th standard. I0 and b are
the intercept and the slope of the calibration line,
respectively.
The iron content on the sample surface was found
as follows:
Csurf orig ¼Iorig � I0
b� fmatrix eff ; ð3Þ
where Iorig is the averaged value of count rates from
different locations of ink lines of the original manu-
script and fmatrix_eff is the factor taking into account
the slight mismatch between the matrices of the sam-
ples and the calibration standards. It is known that the
EDS method is linear with respect to the surface con-
centration if the matrix composition of the samples is
similar [38]. In the narrow range of concentrations
that we used for the calibration graph we can assume
that the matrix similarity is sufficient.
The slope and intercept of the calibration line are
found according to the linear regression equations as
follows:
b ¼Pn
i¼1 Csurf stdðiÞ � IstdðiÞ � n � Csurf std � IstdPni¼1 C
2surf stdðiÞ � n � C2
surf std
ð4Þ
I0 ¼Istd
Pni¼1C
2surf stdðiÞ �Csurf std
Pni¼1Csurf stdðiÞIstdðiÞPn
i¼1 C2surf stdðiÞ � n � C2
surf std
;
ð5Þ
where Csurf_std(i) and Istd(i) are the same as above and n
is the number of points on the calibration line. Surface
concentrations of the model samples Csurf_std(i) were
found as follows:
Csurf stdðiÞ ¼mstdðiÞ � cðiÞ AASlðiÞ � wðiÞ � �stdðiÞ
� 1000; ð6Þ
where mstd(i) (mg) is the mass of the i-th ink standard
solution used for plotting the lines on the paper (found as
the difference between themasses of fountain pen before
and after plotting the 40 lines), c(i)AAS (mgmL�1) is the
concentration of the i-th standard ink solution deter-
mined by AAS, l(i) (mm) is the total length of the 40
lines of the i-th model sample, w(i) (mm) is the average
width on the lines of the i-th model sample and �std(i)(mgmL�1) is the density of the i-th standard solution,
and the multiplier 1000 (mgmg�1) converts the units.
Equations (3) to (6) taken together form our math-
ematical model.
Identifying uncertainty sources
Uncertainty of weighing includes the following
sources: 1) repeatability uncertainty of weighing; 2) un-
certainty caused by the drift of balance; 3) uncertainty
caused by rounding of the reading of the balance. Air
buoyancy is not taken into account here (densities of
the sample and the standard are similar and the result-
ing uncertainty is small) and the weights read from the
balance are considered to be the masses.
Uncertainty of ink solution concentrations mea-
surement by AAS. Detailed description of uncertainty
estimation of the AAS results will be published else-
where. For the purpose of this work we consider the
uncertainty of the AAS results as a single uncertainty
source.
Uncertainty of the surface area of the lines. The
uncertainty of length and width of the lines contribute
to the uncertainty of the surface areas of the lines.
Uncertainty in electron probe microanalysis
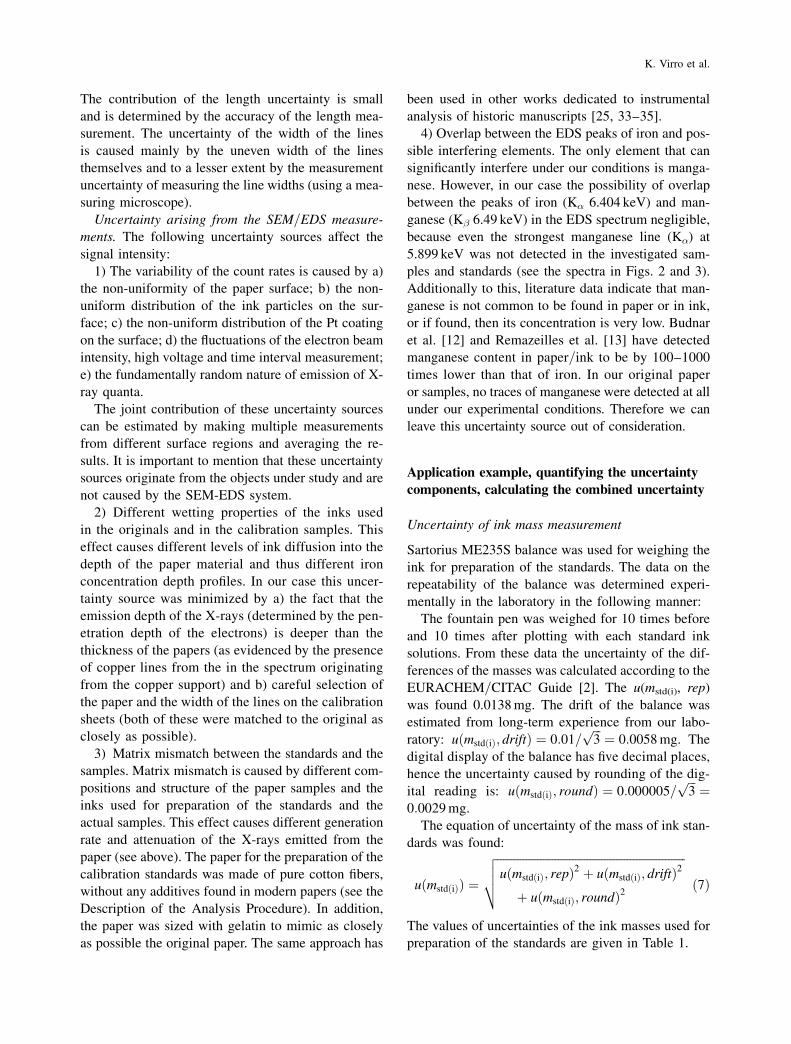
The contribution of the length uncertainty is small
and is determined by the accuracy of the length mea-
surement. The uncertainty of the width of the lines
is caused mainly by the uneven width of the lines
themselves and to a lesser extent by the measurement
uncertainty of measuring the line widths (using a mea-
suring microscope).
Uncertainty arising from the SEM=EDS measure-
ments. The following uncertainty sources affect the
signal intensity:
1) The variability of the count rates is caused by a)
the non-uniformity of the paper surface; b) the non-
uniform distribution of the ink particles on the sur-
face; c) the non-uniform distribution of the Pt coating
on the surface; d) the fluctuations of the electron beam
intensity, high voltage and time interval measurement;
e) the fundamentally random nature of emission of X-
ray quanta.
The joint contribution of these uncertainty sources
can be estimated by making multiple measurements
from different surface regions and averaging the re-
sults. It is important to mention that these uncertainty
sources originate from the objects under study and are
not caused by the SEM-EDS system.
2) Different wetting properties of the inks used
in the originals and in the calibration samples. This
effect causes different levels of ink diffusion into the
depth of the paper material and thus different iron
concentration depth profiles. In our case this uncer-
tainty source was minimized by a) the fact that the
emission depth of the X-rays (determined by the pen-
etration depth of the electrons) is deeper than the
thickness of the papers (as evidenced by the presence
of copper lines from the in the spectrum originating
from the copper support) and b) careful selection of
the paper and the width of the lines on the calibration
sheets (both of these were matched to the original as
closely as possible).
3) Matrix mismatch between the standards and the
samples. Matrix mismatch is caused by different com-
positions and structure of the paper samples and the
inks used for preparation of the standards and the
actual samples. This effect causes different generation
rate and attenuation of the X-rays emitted from the
paper (see above). The paper for the preparation of the
calibration standards was made of pure cotton fibers,
without any additives found in modern papers (see the
Description of the Analysis Procedure). In addition,
the paper was sized with gelatin to mimic as closely
as possible the original paper. The same approach has
been used in other works dedicated to instrumental
analysis of historic manuscripts [25, 33–35].
4) Overlap between the EDS peaks of iron and pos-
sible interfering elements. The only element that can
significantly interfere under our conditions is manga-
nese. However, in our case the possibility of overlap
between the peaks of iron (K� 6.404 keV) and man-
ganese (K� 6.49 keV) in the EDS spectrum negligible,
because even the strongest manganese line (K�) at
5.899 keV was not detected in the investigated sam-
ples and standards (see the spectra in Figs. 2 and 3).
Additionally to this, literature data indicate that man-
ganese is not common to be found in paper or in ink,
or if found, then its concentration is very low. Budnar
et al. [12] and Remazeilles et al. [13] have detected
manganese content in paper=ink to be by 100–1000
times lower than that of iron. In our original paper
or samples, no traces of manganese were detected at all
under our experimental conditions. Therefore we can
leave this uncertainty source out of consideration.
Application example, quantifying the uncertainty
components, calculating the combined uncertainty
Uncertainty of ink mass measurement
Sartorius ME235S balance was used for weighing the
ink for preparation of the standards. The data on the
repeatability of the balance was determined experi-
mentally in the laboratory in the following manner:
The fountain pen was weighed for 10 times before
and 10 times after plotting with each standard ink
solutions. From these data the uncertainty of the dif-
ferences of the masses was calculated according to the
EURACHEM=CITAC Guide [2]. The u(mstd(i), rep)
was found 0.0138mg. The drift of the balance was
estimated from long-term experience from our labo-
ratory: uðmstdðiÞ; driftÞ ¼ 0:01=ffiffiffi3
p¼ 0:0058mg. The
digital display of the balance has five decimal places,
hence the uncertainty caused by rounding of the dig-
ital reading is: uðmstdðiÞ; roundÞ ¼ 0:000005=ffiffiffi3
p¼
0:0029mg.
The equation of uncertainty of the mass of ink stan-
dards was found:
uðmstdðiÞÞ ¼
ffiffiffiffiffiffiffiffiffiffiffiffiffiffiffiffiffiffiffiffiffiffiffiffiffiffiffiffiffiffiffiffiffiffiffiffiffiffiffiffiffiffiffiffiffiffiffiffiffiffiffiffiffiffiffiffiffiffiffiffiffiffiffiffiffiuðmstdðiÞ; repÞ2 þ uðmstdðiÞ; driftÞ2
þ uðmstdðiÞ; roundÞ2
vuut ð7Þ
The values of uncertainties of the ink masses used for
preparation of the standards are given in Table 1.
K. Virro et al.
Uncertainty of the density and iron content
of the ‘‘Self-Prepared Ink’’
The densities of the model ink solutions at tem-
perature 22.6� 0.2 �C and their standard uncertainties
expressed in milligrams per milliliter were the follow-
ing: �1¼ 1033.1, u(�1)¼ 0.5, �2¼ 1045.0, u(�2)¼ 0.6
and �3¼ 1060.4, u(�3)¼ 0.7. Pure water (density at
the same temperature was 9976.6mgmL�1) was used
as the reference.
The iron contents of the three calibration ink so-
lutions measured by AAS were as follows: 7.33,
11.12, 14.57mgmL�1. The standard uncertainties
of these concentrations are 0.14, 0.20, 0.26mgmL�1,
respectively . The AAS analysis method and the un-
certainty estimates were validated by analyzing the
11.12mgmL�1 solution also with a different method
(ICP-AES) at a different laboratory. The concen-
tration was found as 11.00� 0.44mgmL�1, k¼ 2,
norm., which is well in line with our result.
Uncertainty of the lengths and widths
of the standard ink lines
Uncertainty of the length of the lines was calculated
through the following equation:
uðllineÞ ¼ffiffiffiffiffiffiffiffiffiffiffiffiffiffiffiffiffiffiffiffiffiffiffiffiffiffiffiffiffiffiffiffiffiffiffiffiffiffiffiffiffiffiffiffiffiffiffiffiffiffiffiffiuðlline; calÞ2 þ uðlline; repÞ2
q; ð8Þ
where the repeatability of uncertainty u(lline, rep) of the
line lengthwas estimated as the standard deviation of the
mean of 20 readings (of the same length) and the cali-
bration uncertainty was estimated as �0.5mm (rectan-
gular distribution): uðlline; calÞ ¼ 0:5=ffiffiffi3
p¼ 0:29mm.
The total lengths of standard (1), standard (2) and
standard (3) were 10538.7, 10582.4 and 10451.1 re-
spectively. The standard uncertainty of the three lengths
was the same: 11.6mm. Each of the total length of the
standard consisted of 40 short lines.
The widths (w(i)) were determined making mea-
surements in 22 different locations picked on the sheet
diagonal (every location was on a different ink line)
using a measuring microscope. The uncertainty aris-
ing from the measurement itself is negligible com-
pared to the uncertainty due to the uneven width of
the lines. The widths of the lines on the standards with
their uncertainties are presented in Table 1.
Uncertainty due to the SEM=EDS
The electron beam (the probe current) of the used
SEM=EDS is of high stability – better than 0.2%
per hour for analytical applications. Hence, the instru-
ment instability contribution to the uncertainty of Csurf
was considered of no importance. All the other direct
uncertainty sources of the SEM=EDS measurement as
well as uncertainty due to the uneven iron distribution
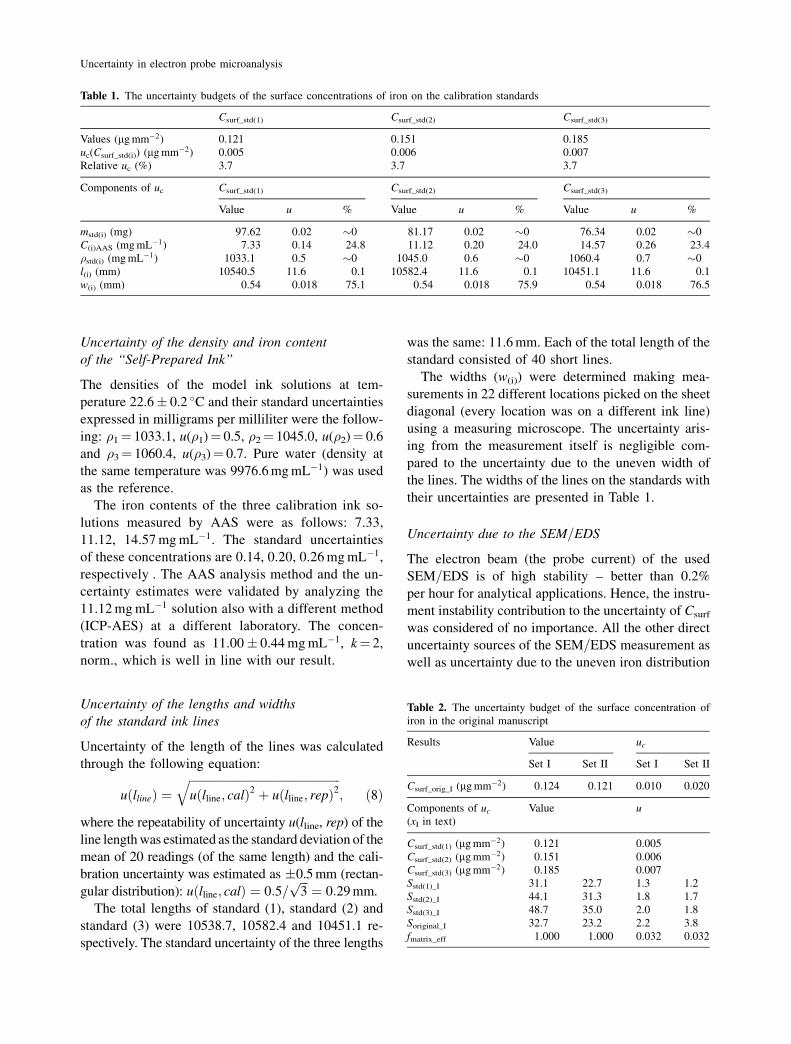
Table 1. The uncertainty budgets of the surface concentrations of iron on the calibration standards
Csurf_std(1) Csurf_std(2) Csurf_std(3)
Values (mgmm�2) 0.121 0.151 0.185
uc(Csurf_std(i)) (mgmm�2) 0.005 0.006 0.007
Relative uc (%) 3.7 3.7 3.7
Components of uc Csurf_std(1) Csurf_std(2) Csurf_std(3)
Value u % Value u % Value u %
mstd(i) (mg) 97.62 0.02 �0 81.17 0.02 �0 76.34 0.02 �0
C(i)AAS (mgmL�1) 7.33 0.14 24.8 11.12 0.20 24.0 14.57 0.26 23.4
�std(i) (mgmL�1) 1033.1 0.5 �0 1045.0 0.6 �0 1060.4 0.7 �0
l(i) (mm) 10540.5 11.6 0.1 10582.4 11.6 0.1 10451.1 11.6 0.1
w(i) (mm) 0.54 0.018 75.1 0.54 0.018 75.9 0.54 0.018 76.5
Table 2. The uncertainty budget of the surface concentration of
iron in the original manuscript
Results Value uc
Set I Set II Set I Set II
Csurf_orig_I (mgmm�2) 0.124 0.121 0.010 0.020
Components of uc(xI in text)
Value u
Csurf_std(1) (mgmm�2) 0.121 0.005
Csurf_std(2) (mgmm�2) 0.151 0.006
Csurf_std(3) (mgmm�2) 0.185 0.007
Sstd(1)_I 31.1 22.7 1.3 1.2
Sstd(2)_I 44.1 31.3 1.8 1.7
Sstd(3)_I 48.7 35.0 2.0 1.8
Soriginal_I 32.7 23.2 2.2 3.8
fmatrix_eff 1.000 1.000 0.032 0.032
Uncertainty in electron probe microanalysis
and surface non-uniformity will be accounted for by
the repeatability of the measurements. Parallel mea-
surements on different locations of the lines were per-
formed with each of the three standards and with the
original manuscript (see the ESM for the calcula-
tions). The mean values and the standard uncertainties
of the Sorig and Sstd(i) values are given in Table 2.
The uncertainty sources 2 and 3 (see above) are taken
into account by the matrix mismatch factor fmatrix_eff
(Eq. (3)). This factor is defined in such a way that its
value is equal to unity in order not to change the value
of Csurf_orig. Its uncertainty is defined as the estimated
relative standard uncertainty due to the matrix mis-
match. To get a rough estimate of this contribution a
model experiment was carried out. ZAF correction
factors for ’’pure paper’’ (c(C)¼ 98.35m%, c(Fe)¼0.88m% and c(S)¼ 0.77m%) and a paper with ad-
ditives (c(C)¼ 81.65m%, c(Fe)¼ 2.99m%, c(S)¼0.95m%, c(Si)¼ 8.54m%, c(Al)¼ 0.36m%, c(Na)¼0.17m%, c(K)¼ 4.50m%, c(Cl)¼ 0.12m% and
c(Ca)¼ 0.72m%) were calculated using EPMA cor-
rection algorithm Stratagem [39] switched into bulk
mode. This algorithm also permits to take the Pt coat-
ing into account. The difference between the calculat-
ed ZAF corrections was small: 3.2%. This value was
used as the estimate of standard uncertainty due to the
matrix mismatch (fmatrix_eff).
Finding the combined uncertainty
The combined standard uncertainty is calculated ac-
cording to the ISO GUM approach [1], that is, the
calculations were performed according to Eq. (9).
ucðCsurf origÞ ¼
ffiffiffiffiffiffiffiffiffiffiffiffiffiffiffiffiffiffiffiffiffiffiffiffiffiffiffiffiffiffiffiffiffiffiffiffiffiffiffiffiffiffiffiffiffiffiffiXi
�@Csurf orig
@xiuðxiÞ
�2
vuut ; ð9Þ
where xi denotes the values of seven components of
uncertainty in Table 2. The calculations were carried
out with the MS Excel package using the Kragten
Method [40] for approximating the partial derivatives.
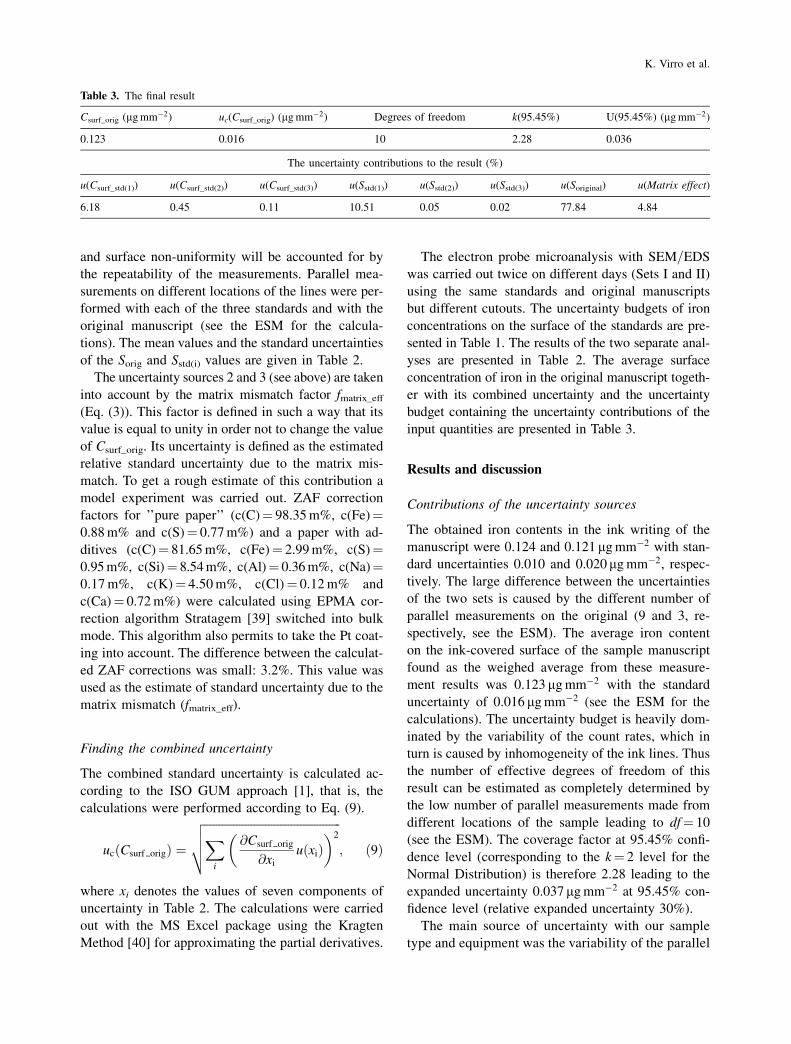
The electron probe microanalysis with SEM=EDSwas carried out twice on different days (Sets I and II)
using the same standards and original manuscripts
but different cutouts. The uncertainty budgets of iron
concentrations on the surface of the standards are pre-
sented in Table 1. The results of the two separate anal-
yses are presented in Table 2. The average surface
concentration of iron in the original manuscript togeth-
er with its combined uncertainty and the uncertainty
budget containing the uncertainty contributions of the
input quantities are presented in Table 3.
Results and discussion
Contributions of the uncertainty sources
The obtained iron contents in the ink writing of the
manuscript were 0.124 and 0.121 mgmm�2 with stan-
dard uncertainties 0.010 and 0.020mgmm�2, respec-
tively. The large difference between the uncertainties
of the two sets is caused by the different number of
parallel measurements on the original (9 and 3, re-
spectively, see the ESM). The average iron content
on the ink-covered surface of the sample manuscript
found as the weighed average from these measure-
ment results was 0.123 mgmm�2 with the standard
uncertainty of 0.016 mgmm�2 (see the ESM for the
calculations). The uncertainty budget is heavily dom-
inated by the variability of the count rates, which in
turn is caused by inhomogeneity of the ink lines. Thus
the number of effective degrees of freedom of this
result can be estimated as completely determined by
the low number of parallel measurements made from
different locations of the sample leading to df¼ 10
(see the ESM). The coverage factor at 95.45% confi-
dence level (corresponding to the k¼ 2 level for the
Normal Distribution) is therefore 2.28 leading to the
expanded uncertainty 0.037mgmm�2 at 95.45% con-
fidence level (relative expanded uncertainty 30%).
The main source of uncertainty with our sample
type and equipment was the variability of the parallel
Table 3. The final result
Csurf_orig (mgmm�2) uc(Csurf_orig) (mgmm�2) Degrees of freedom k(95.45%) U(95.45%) (mgmm�2)
0.123 0.016 10 2.28 0.036
The uncertainty contributions to the result (%)
u(Csurf_std(1)) u(Csurf_std(2)) u(Csurf_std(3)) u(Sstd(1)) u(Sstd(2)) u(Sstd(3)) u(Soriginal) u(Matrix effect)
6.18 0.45 0.11 10.51 0.05 0.02 77.84 4.84
K. Virro et al.
measurement results from different locations of the
manuscript surface contributing 54 and 84% of the
overall uncertainty in the first and second analy-
sis set, respectively, and 78% to the uncertainty of
the average result. This contribution is followed by
the signal variability of the first calibration standard
(11%) and the iron content of the first calibration
standard (6%). The prevailing influence of the sam-
ple heterogeneity fully validates the use of only 3
points for calibration in our case. Even in the impos-
sible case that calibration graph would contribute no
uncertainty to the result (meaning that there is infi-
nite number of points on the graph and there are no
systematic effects affecting the points – both condi-
tions unrealizable), the standard uncertainty of the
result would decrease only marginally: from 0.016
to 0.015 mgmm�2. The high contribution of the fist
calibration standard is not unexpected: the average
rate of counts from the sample is very similar to that
of the first standard.
The dominance of the signal variability (both in
the case of samples and standards) in the uncertainty
budget does not mean that the sample heterogeneity
is the only uncertainty source worth considering. With
a different sample the heterogeneity can be far lower
and the calibration graph points can have large rela-
tive contribution to the uncertainty. The uncertainty
contribution due to the variability of the signal can
be reduced by increasing the number of measurements
both from the calibration standards and from the sam-
ple. Both the purpose of the measurement and the eco-
nomic effect have to be carefully considered.
The uneven widths of the ink lines play the key role
in determining standards preparation as the second
most important source of uncertainty. The uncertain-
ty contribution arising from the uneven width of the
ink lines of the standards could in principle be re-
duced by drawing wider lines using the so-called red-
dish pen. The absolute uncertainty of the line widths
would remain more or less the same but the relative
uncertainty would drop several times. Because the
uncertainty contribution of the width of the line is
dependent on the relative uncertainty, the combined
uncertainty of the result would seemingly decrease.
However, this would destroy the similarity between
the sample and standards (see the Preparation of the
Calibration Standards Section): the diffusion of the
ink in the broad lines would not be the same any more
and a hard-to-quantify additional uncertainty source
would be introduced.
Limit of detection
All our samples, both standards and the original, had
non-detectable content of iron on the unwritten area.
Iron is a widespread element in the environment
and the paper of any manuscript contains iron traces
originating from contamination e.g. by paper verso
sides. Based on the baseline noise level of the EDS
spectra and the calibration line parameters a crude
estimate of the detection limit of iron was obtained
as 0.02mgmm�2 (signal to noise ratio 3) under our
conditions. The signal=noise ratio for the lowest cali-
bration standard was around 15. Thus, SEM=EDS is a
suitable method to determine, at least semi-quantita-
tively, the surface concentration of iron in inks on the
paper.
Comparison of our results with those of other authors
This type of analysis is not done by laboratories on a
regular basis. Thus it would be very desirable to com-
pare both the element content levels and the uncer-
tainties with those obtained by other authors in similar
measurements. Studies on quantification of iron in old
ink-written manuscripts have been published before
[11, 13, 14, 25, 33]. Budnar et al. [11, 12, 36] and
Remazeilles et al. [13] have done quantification of the
elemental components of ink with PIXE. With de-
structive GFAAS method quantitative analysis of iron
and copper in old manuscripts has been carried out
by Wagner et al. [25]. The same group has quantified
elements in iron-gall ink with energy dispersive X-ray
fluorescence analysis [14]. Semiquantitative analy-
sis of inorganic components has been carried out by
Odlyha et al. [33].
It is nevertheless difficult to compare our results to
the literature results. Our results are presented as iron
mass per area of written paper (unwritten area not
included). The literature results are mostly presented
in the form of mass of iron per mass of paper (unwrit-
ten area included). Analyzing our manuscript sample
by AAS would have been a possible approach for
comparing with an independent method, but that would
destroy the sample and also it would be extremely dif-
ficult to find the area of the ink lines as they were
irregular and the whole manuscript was patchy.
In some of the above-cited papers the issue of un-
certainty has been addressed but a full ISO GUM-
based uncertainty analysis has not been carried out.
In Ref. [13] the authors have given the estimates of
Uncertainty in electron probe microanalysis
the variations between the results obtained from sev-
eral spectra (measured with PIXE) from the same
manuscript, but at different locations. Each spectrum
was processed the same way and the authors looked at
the variabilities of the results for the most typical ele-
ments. For iron the variability was found as �16%
(presented as full spread of seven measurement re-
sults). In Ref. [11] the estimation of the variation
has also been presented as the full spread of �10%
(the number of measurements was not given). These
uncertainties are lower than our uncertainty estimate.
In Ref. [36] the accuracy of the analysis method
(PIXE) was under discussion. The systematic error
(5–20%) and precision (5%) were evaluated for the
analysis of Fe and Cu. The relative standard un-
certainty extracted from these data is in the range of
7–21%. This compares quite well with our relative
standard uncertainty estimate of 13%.
Conclusions
SEM=EDS was used to determine the surface concen-
tration of iron in the ink writing of an old manuscript.
For quantification a calibration graph method utilizing
AAS analyses of 3 standard ink solutions with dif-
ferent iron content was used. To estimate roughly
the surface concentration of iron in the ink writing on
the manuscript we recorded spectra on two days from
altogether six different locations. The mean iron surface
concentration on the written area was 0.123mgmm�2
with the expanded uncertainty 0.037 mgmm�2 at
95.45% confidence level, which we consider accept-
able for such a complicated analysis task.
Electron probe microanalysis with SEM=EDS is
a suitable method for evaluating the iron content
in old manuscripts. The method is universal (enables
to quantify other elements in a similar manner), quite
sensitive (down to few atomic percent detection lim-
its) and fast (it takes around 5min to record one
spectrum and around 1 h to prepare a set of 10–20
samples). Although non-destructive methods, like
PIXE, m-XRF, etc exist and are in use for the analysis
of old paper, the necessary equipment may not be
available for everyday analysis, and getting high pre-
cision quantitative results from ink-on-paper samples
is not a routine task also with those methods.
Acknowledgments. We are deeply indebted to Mr. Jaan Lehtaru, Dr.
Viljar Pihl and Dr. Koit Herodes for valuable suggestions. This work
was supported by the Estonian Science Foundation grants 5475 and
6651 and by the Basis financing grant 06902 of University of Tartu.
References
1. Guide to the Expression of Uncertainty in Measurement (1993)
BIPM IEC IFCC ISO IUPAC IUPAP OIML, ISO, Geneva
2. Quantifying Uncertainty in Analytical Measurement (2000)
In: Ellison S L R, R€oosslein M, Williams A (eds) 2nd ed.
EURACHEM=CITAC3. Handbook of Calculating Uncertainty in Environmental Labo-
ratories (2004) In: Magnusson B, Naykki T, Hovind H, Krysell
M (eds) 2nd ed. Nordtest Technical Report 537
4. Anglov T, Petersen I M, Kristiansen J (1999) Uncertainty of
nitrogen determination by the Kjeldahl method. Accred Qual
Assur 4: 504
5. Kuselman I, Shenhar A (1997) Uncertainty in chemical analy-
sis and validation of the analytical method: acid value deter-
mination in oils. Accred Qual Assur 2: 180
6. Bettencourt da Silva R J N, Cam~ooes M F G F C, Seabra E,
Barros J (1998) Validation of the uncertainty evaluation for the
determination of metals in solid samples by atomic spectrom-
etry. Accred Qual Assur 3: 155
7. Wolff Briche C S J, Harrington C, Catterick T, Fairman B
(2001) Orthodox uncertainty budgeting for high accuracy
measurements by isotope dilution inductively coupled plas-
ma-mass spectrometry. Anal Chim Acta 437: 1
8. Mazej D, Stibilj V (2003) Measurement uncertainty of seleni-
um determination in the reference material Seronorm Trace
Elements Serum by hydride generation atomic fluorescence
spectrometry. Accred Qual Assur 8: 117
9. Drolc A, Cotman M, Ros M (2003) Uncertainty of chemical
oxygen demand determination in wastewater samples. Accred
Qual Assur 8: 138
10. (a) The Eurachem Measurement Uncertainty Website: http:==www.measurementuncertainty.org= (b) Uncertainty examples
website hosted by Testing Centre of University of Tartu
http:==www.ut.ee=katsekoda=GUM_examples=11. Budnar M, Vodopivec J, Mando P A, Lucarelli F, Casu G,
Signorini O (2001) Distribution of chemical elements of iron-
gall ink writing studied by the PIXE method. Restaurator 22:
228
12. Budnar M, Simcic J, Rupnik Z, Ursic M, Pelicon P, Kolar J,
Strlic M (2004) In-air PIXE set-up for Automatic analysis of
historical document inks. NIM B 219=220: 4113. Remazeilles C, Quillet V, Calligaro T, Dran J C, Pichon L,
Salomon J (2001) PIXE elemental mapping on original
manuscripts with an external microbeam. Application to
manuscripts damaged by iron-gall ink corrosion. NIM B
181: 681
14. Wagner B, Bulska E, Hulanicki A, Heck M (2001) Topochem-
ical investigation of ancient manuscripts. Fresenius J Anal
Chem 369: 674
15. Janssens K, Vittiglio G, Aerts A, Vekemans B, Vincze L, Wei
F, Deryck I, Schalm O, Adams F, Rindby A, Kn€oochel A,
Simionovici A, Snigirev A (2000) Use of microscopic XRF
for non-destructive analysis in art and archaeometry. X-ray
Spectrometry 29: 73
16. The Ink Corrosion Website http:==www.knaw.nl=ecpa=ink=17. InkCor Homepage http:==www.infosrvr.nuk.uni-lj.si=jana=
Inkcor=index.Htm18. Andalo C, Biccheri M, Bocchini P, Casu G, Galletti G C,
Mando PA, Nardone M, Sodo A, Plossi Zappala M (2001) The
beautiful ‘‘Trionfo d’Amore’’ attributed to Botticelli: a chem-
ical characterisation by proton-induced X-ray emission and
micro-Raman spectroscopy. Anal Chim Acta 429: 279
19. Clark R J H (2002) Pigment identification by spectroscopic
means: an arts=science interface. C. R. Chimie 5: 7
K. Virro et al.
20. Lucarelli F, Mando PA (1996) Recent applications to the study
of ancient inks with the Florence external-PIXE facility. NIM B
109=110: 64421. Casieri C, Bubici S, Viola I, Luca F (2004) A low-resolution
non-invasive NMR characterization. Solid State Nuclear Reso-
nance 26: 65
22. Bicchieri M, Ronconi S, Romano F P, Pappalardo L, Corsi M,
Cristoforetti G, Legnaioli S, Palleschi V, Salvetti A, Tognoni E
(2002) Studyof foxing stains of paper by chemical methods,
infrared spectroscopy, micro-X-ray fluorescence spectrometry
and laser induced breakdown spectroscopy. Spectrochimica
Acta B 57: 1235
23. Proniewicz L M, Paluszkiewicz C, Weselucha-Birczynska A,
Baranski A, Dutka D (2002) FT-IR and FT-Raman study of
hydrothermally degraded groundwood containing paper. J
Molecular Structure 614: 345
24. Ali M, Emsley A M, Herman H, Heywood R J (2001) Spectro-
scopic studies of the ageing of cellulosic paper. Polymer 42:
2893
25. Wagner B, Garbos S, Bulska E, Hulanicki A (1999) Determi-
nation of iron and copper in old manuscripts by slurry sampling
graphite furnace atomic absorption spectrometry and laser
ablation inductively coupled plasma mass spectrometry. Spec-
trochimica Acta B 54: 797
26. Espadaler I, Sistach M C, Cortina M, Eljarrat E, Alcaraz R,
Cabanas J, Rivera J (1995) Organic and inorganic components
of manuscript inks. Anales de Quimica 91: 359
27. Kanngiesser B, Hahn O, Wilke M, Nekat B, Malzer W, Erko A
(2004) Investigation of oxidation and migration processes of
inorganic compounds in ink-corroded manuscripts. Spectro-
chimica Acta B 59: 1511
28. Proost K, Jannssens K, Wagner B, Bulska E, Schreiner M
(2004) Determination of localized Fe2þ=Fe3þ ratios in inks of
historic documents by means of m-XANES. Nucl Instrum
Methods Phy Res B 213: 723
29. Zappala A, Bajt S, Gigante G E, Hanson A L (1996) Applica-
tion of EDXRF in the conservation of acid papers using a
synchrotron light microbeam. NIM B 117: 145
30. Malzer W, Hahn O, Kanngiesser B (2003) A fingerprint model
for inhomogeneous ink-paper layer systems measured with
micro-x-ray fluorescence analysis. X-ray Spectrometry 33: 229
31. Kolar J, Strlic M, Budnar M, Malesic J, Selih V S, Simcic J
(2003) Stabilisation of corrosive iron gall inks. Acta Chim Slov
50: 763
32. Neevel J G (1995) Phytate:a potential conservation agent for
the treatment of ink corrosion caused by irongall inks. Restau-
rator 16: 143
33. Odlyha M, Walker R M, Liddell W H (1993) Thermal analysis
and the scientific conservation of cultural materials. J Thermal
Anal 40: 285
34. Bulska E, Wagner B, Sawicki M G (2001) Investigation of
complexation and solid-liquid extraction of iron from paper by
UV=VIS and atomic absorption spectrometry. Mikrochim Acta
136: 61
35. Wagner B, Bulska E (2003) Towards a new conservation
method for ancient manuscripts by inactivation of iron via
complexation and extraction. Anal Bioanal Chem 375: 1148
36. Budnar M, Ur�ssi�cc M, Sim�cci�cc J, Pelicon P, Kolar J, �SSelih V S,
Strli�cc M (2006) Analysis of iron gall inks by PIXE. NIM B 243:
407
37. Kolbe G (2004) Gelatine in historical paper production and as
inhibiting agent for iron-gall ink corrosion on paper. Restau-
rator 25: 26
38. Handbook of X-ray Spectrometry (1992) In: Grieken R E,
Markowic A A (eds) Marcel Dekker Inc., p 117
39. Stratagem is a registered trademark of SAMx, http:==www.samx.com=
40. Kragten J (1994) Calculating standard deviations and confi-
dence intervals with a universally applicable spreadsheet tech-
nique. Analyst 119: 2161
Uncertainty in electron probe microanalysis