Growth-and-Jobs-in-Slavonia-Baranja-and-Srijem-Rapid ...
386
Diagnostic Report RAS Growth and Jobs in Slavonija, Baranja & Srijem Growth and Jobs in Slavonia, Baranja and Srijem Rapid Diagnostics January 2019 (revised April 2019) Public Disclosure Authorized Public Disclosure Authorized Public Disclosure Authorized Public Disclosure Authorized
-
Upload
khangminh22 -
Category
Documents
-
view
4 -
download
0
Transcript of Growth-and-Jobs-in-Slavonia-Baranja-and-Srijem-Rapid ...
Diagnostic Report RAS Growth and Jobs in Slavonija, Baranja & Srijem
Growth and Jobs in Slavonia, Baranja and Srijem Rapid Diagnostics January 2019 (revised April 2019)
Pub
lic D
iscl
osur
e A
utho
rized
Pub
lic D
iscl
osur
e A
utho
rized
Pub
lic D
iscl
osur
e A
utho
rized
Pub
lic D
iscl
osur
e A
utho
rized

1
Acknowledgements
Preparation of the report was led by Austin Kilroy, and the chapters were written by the following teams. Chapter 1 (Austin Kilroy, Martine Bakker, Tuukka Cástren, Hans Kordik, Shaun Mann, Gjorgji Miskovski, Ivana Podhraški, and Carlo Rossotto), Chapter 2 (Hans Kordik, Miroslav Božić, Blair Lapres, Erika Felix, and Tonina Dumić), Chapter 3 (Ivan Nimac, Jana Krajcovicova, Joseph Phillips, Zenia Rogatschnig, and Maria Andersen), Chapter 4 (Todor Milchevski, Andreja Marušić, Aris Molfetas-Lygkiaris, Andrea August, and Jasmina Mrkonja), Chapter 5 (Todor Milchevski, Danica Ramljak, Hrvoje Meštrić, Pluvia Zuniga and Jasmina Mrkonja), Chapter 6 (Matija Laco, Šime Smolić, Tomislav Pašalić and Jasmina Mrkonja) and Chapter 7 (Luc Christiaensen, Céline Ferré, Diego Ambasz, Teo Matković, Ivica Rubil, Tara Sharafudheen, Valerie Morrica, Malte Johann, and Lidija Japec). The teams thank the following colleagues for further inputs: Slavica Banić, Ivana Čuljak, Stephen Hindlaugh, Katie McWilliams, Jasmina Mrkonja, and Bruno Škrinjarić. Chapters of the report were peer reviewed by Philip van der Celen, Paulo Correa, Svetlana Edmeades, Natasha Kapil, Isfandyar Khan, Alexandra Valerio, Andrea Woodhouse, and Michele Zini. The report team was assisted by Maja Vargić, Ida Mahečić-Bajović, Marija Radić, and Ružica Jugović. The report was prepared under the guidance of Marialisa Motta and the World Bank Group’s management team for European Union countries: Arup Banerji, Elisabetta Capanelli, Julian Lampietti, Andrea Liverani, Cem Mete, Harry Patrinos, Susan Shen, and Ian Walker.
The report team is very grateful for extensive meetings and consultations that have been held in Slavonia and in Zagreb. These meetings have included:
• the Regional Working Group (County Prefects, Mayors, Regional Coordinators, Chambers of Economy, and other institutional leaders);
• the Interministerial Working Group (Assistant Ministers and delegates from ten Ministries participating in Project Slavonia) and discussions with the Managing Authorities of European Structural and Investment Funds;
• industry focus groups in agri-food, ICT, wood, and tourism (consisting of businesses, associations, educational institutions, government bodies, and civil society);
• more than 200 bilateral meetings with companies (121 meetings), local government bodies (42 meetings), education and innovation organizations (34 meetings), and civil society organizations (16 meetings);
• the Ministry of Regional Development and EU Funds, especially the Minister, the Assistant Minister for Strategic Planning, and the Head of Sector for strategic management of EU instruments, and her team.
The report utilizes data from several Croatian organizations, especially the Croatian Bureau of Statistics (DZS), Croatian Employment Service (HZZ), Croatian National Bank (HNB), Financial Agency (FINA), Ministry of Science and Education (MZO), Agency for Vocational Education and Training and Adult Education (ASOO), and the Agency for Science and Higher Education (AZVO). The team is grateful for the continued cooperation of those organizations, which included multiple visits and correspondences.
Note
This report is a product of the staff of the World Bank Group. The findings, interpretations, and conclusions expressed in the report do not necessarily reflect the views of The World Bank Group, its Board of Executive Directors, or the governments they represent. The World Bank Group does not guarantee the accuracy of the data included in this work, which is drawn from multiple external sources. Nothing herein shall constitute, or be considered to be, a limitation upon or waiver of the privileges and immunities of The World Bank Group, all of which are specifically reserved.

2
Table of Contents
Overview: Leveraging Opportunities for Results 7
Chapter 1 Growth Opportunities and Constraints 19 Chapter 2 Special Focus on Agri-Food 51
Objective: Investment 100
Chapter 3 Foreign Investment 101 Chapter 4 Business Environment 149
Objective: Innovation 189
Chapter 5 Innovation System 190 Chapter 6 Financial Instruments 253
Objective: Inclusion 281
Chapter 7 Jobs, Skills & Inclusion 282
Annexes 332
3
List of Abbreviations
AKIS Agricultural Knowledge and Innovation System
ALMP Active Labor Market Program
ARD Agriculture and Rural Development
ASHE Agency for Science and Higher Education
AWU Agricultural Work Unit
BERD Business expenditure in R&D
BPC Brodsko-Posavska County
BSO Business support organization
CAP Common Agricultural Policy
CEKOM Centre of Competence
CNSF Croatian National Science Foundation
COA Chamber of Architects
CoE Center of Excellence
COECPP Chamber of Engineers in Construction and Physical Planning
CP Capital Productivity
CPR Common Provision Regulation
DwCP Dealing with construction permits
EAFRD European Agricultural Fund for Rural Development
EBITDA Earnings Before Interest, Taxes, Depreciation and Amortization
EC European Commission
ECA Europe and Central Asia
ECHE Erasmus Charter for Higher Education
EEA European Economic Area
EFSI European Fund for Strategic Investments
EIF European Investment Fund
ERDF European Regional Development Fund
EREF European Regional Economic Forum
ESIF European Structural and Investment Funds
EU European Union
FADN Farm Accountancy Data Network
FDI Foreign direct investment
FERIT Faculty of Electrical Engineering, Computer Science and Information Technology (in University of Osijek)
FINA Financial Agency
FIs Financial Instruments
FLP First Loss Portfolio
FSS Farm Statistical Survey
GAP Good Agricultural Practice
GASI General Agency for Specialized Inspections
GBER General Block Exemption Regulation
GDP Gross Domestic Product
GEM Global Entrepreneurship Monitor
GERD Gross Domestic Expenditure on R&D
4
GVA Gross Value Added
GYGA Global Yield Gap Atlas
HAKOM Croatian Regulatory Authority for Network Industries
HEI Higher education institutions
HO Home office permit
HRK Croatian Kuna
HRT Croatian Radio Television
HS Hrvatske Šume
HSE Health and Safety Executive
ICT Information & Communication Technology
ILO International Labor Organization
IP Intellectual property
IPR Intellectual property rights
KIS Knowledge-intensive services
KPIs Key performance indicators
LKIS Less knowledge-intensive services
LP Labor productivity
MFF Multiannual Financial Framework
MOA Ministry of Agriculture
MOCPP Ministry of Construction and Physical Planning
MOECC Ministry of Economy, Entrepreneurship and Crafts
MOI Ministry of the Interior
MOLPS Ministry of Labor and the Pension System
MoSE Ministry of Science and Education
MRDEUF Ministry of Regional Development and EU Funds
MSMEs Micro, Small and Medium Enterprises
NACE Statistical classification of economic activities in the European Community
NPLs Non-Performing Loans
NRDP National Rural Development Program
OECD Organization for Economic Cooperation and Development
OPCC Operational Program Competitiveness and Cohesion
OPEHR Operational Program Enhancing Human Resources
OSC Osječko-Baranjska County
PDO Protected Designation of Origin
PGI Protected Geographical Indications
PIT Personal income tax
PRO Public Research Organization
PSB Polytechnic of Slavonski Brod
PSC Požeško-Slavonska County
R&D Research and development
R&I Research and innovation
RAS Reimbursable Advisory Services
RD Rural Development
RDAs Regional development agencies
RDI Research, development and innovation
REFIT The European Commission's Regulatory Fitness and Performance Program
RIA Regulatory impact assessment

5
SGA State Geodetic Administration
SMEs Small and medium-sized enterprises
SO Standard Output
STEM Science, Technology, Engineering, and Mathematics
TEA Total entrepreneurial activity
TFP Total Factor Productivity
TSG Traditional Specialties Guaranteed
TTO Technology Transfer Office
TVET Technical and Vocational Education and Training
UAA Utilized Agricultural Area
UKF Unity Through Knowledge Fund
ULC Unit labor costs
VC Venture Capital
VPC Virovitičko-Podravska County
VSC Vukovarsko-Srijemska County
WBG World Bank Group
ZAMP Copyright Protection Service

6
Quick statistics for Slavonia1
Investment.
Slavonia has received only 2 percent of Croatia’s foreign investment.
Yet Slavonia generates 12 percent of Croatia’s GDP, hosts 18 percent of Croatia’s population, and has grown jobs in ICT, Tourism, Wood, and Mechanical Engineering by 20 percent since 2014.
Innovation.
Slavonia receives only 5.6 percent of Croatia’s R&D funding, and 7.8 percent of its innovation funding. Yet Slavonia hosts 9 percent of Croatia’s active companies, including almost 270 companies that have grown their revenues by more than 50 percent in a single year.
Inclusion.
Only 42 percent of working-age women in Slavonia are employed. And only 21 percent of the working-age population with a primary education are employed… …Yet more than half of Slavonia’s companies say they cannot find adequate job applicants. And only 3 percent of Slavonia’s unemployed persons attend training courses each year.
Expenditures on education for each young person up to 24 years old are almost three times higher in Zagreb than in Slavonia.
1 ‘Slavonia’ is used as a shorthand for the region of Slavonija, Baranja & Srijem, consisting of five counties in Eastern Croatia.

7
Overview: Leveraging Opportunities for Results Does Slavonia have the potential to do better? Slavonia’s economy is now amongst the poorest in the European Union, and has been growing more slowly than comparable regions.2 Some Polish and Romanian counties were less advanced until 2013, but have now overtaken Slavonia. Timiș in Romania was equivalent to Osijek-Baranja in 2009 but is now more than 30% richer (see Figure 1). Slavonia has achieved notable successes too—including some fast-growing companies and new innovations—but in relative terms it is falling behind. Can Slavonia achieve an economic resurgence?
Figure 1: Slavonia is missing opportunities to grow
SOURCE: World Bank Group analysis of data from Eurostat.
Achieving a turnaround is difficult: only 9 percent of lagging regions in the EU have managed to ‘graduate’.3 Part of the answer lies in smart use of European Union funds, as demonstrated by Pomorskie region in Poland. Pomorskie suffered from emigration and unemployment, but leveraged EU funds to grow its exports, attract new investment, and now is one of the youngest demographics in Poland. How can Slavonia achieve a similar turnaround? What opportunities and constraints does it face? How can it leverage opportunities in the European Union and beyond?
2 According to Eurostat data for GDP per capita at the NUTS3 level, four of Slavonia’s five counties are amongst the poorest 4 percent of NUTS3 regions, and its fifth (Osijek-Baranja) is in the poorest 8 percent. Data is for 2015 (most recent data). Some of these other poor regions in the European Union have achieved growth rates of 8 percent per year, while Slavonia has been growing at 3 percent or less. 3 Out of the poorest 20 percent of NUTS3 regions in 2004, only 9 percent managed to graduate out of that category by 2014.
0
2,000
4,000
6,000
8,000
10,000
12,000
14,000
16,000
18,000
GD
P p
er c
apit
a, in
EU
R, a
t cu
rren
t p
rice
s
Timis (Romania)
Alba (Romania)
Arad (Romania)
Ostrolecki (Poland)
Salaj (Romania)
Satu Mare (Romania)
Osjecko-baranjska
Vukovarsko-srijemska
Brodsko-posavska
Pozesko-slavonska
Viroviticko-podravska
Most recent EU-wide data is for 2015. Figures for 2015-2023 are projections based on 2013-2015 growth rates.
8
Three pathways to economic resurgence in Slavonia are analyzed in this report:
Obje
ctiv
e:
INV
ES
TM
EN
T
New private investments in Slavonia. Foreign investment in Slavonia can grow Slavonia’s economy, create new jobs, and connect Slavonia with new ideas, technologies and know-how. In nearby countries—Hungary, Slovakia, and Czechia—27 percent of all jobs are attributable to foreign companies; but in Croatia the figure is only 12 percent. And within Croatia, Slavonia has received only 2 percent of Croatia’s foreign investment4. Opportunities to attract foreign investment into Slavonia exist in the ICT industry (custom computer programming and services), agri-food industry (fruit and vegetable processing, such as fresh and convenience
foods5), tourism industry (boutique hotels and other niche tourism offerings), and potentially in metalworking and advanced machinery. The wood industry offers potential opportunities, but only if the quota system is reformed. To raise the quantity and quality of FDI, Slavonia needs an improved investment climate and business environment, and a proactive approach to FDI in targeted sectors and niches.
Obje
ctiv
e:
INN
OV
AT
ION
Improving competitiveness of Slavonian companies. Slavonia’s economy remains oriented towards lower value activities, such as basic wood products and agricultural commodities. Businesses in those segments are competing on low prices, rather than competing on high quality and innovative products. Funding for R&D and innovation has been disproportionately low in Slavonia: in the 2014-2020 period of European Structural and Investment Funds, Slavonia has received only 5.6 percent of Croatia’s R&D funding and 7.8 percent of innovation funding for SMEs, despite hosting 9 percent of Croatia’s active firms. Yet Slavonia’s companies include some successful and innovative businesses, and some research institutions which can be anchors for increased competitiveness. Slavonia’s innovation system can be strengthened, its firms can adopt advanced technologies, and can develop new products and services with higher value added for global markets.
Obje
ctiv
e:
INC
LU
SIO
N
Making investment and innovation work to the benefit of all. Slavonia hosts 18 percent of Croatia’s population, but 27 percent of its unemployed workers6. Activity rates of the labor force in Slavonia are 10 percentage points below the rest of Croatia. These problems are especially acute among unskilled and lower skilled workers. However, companies in Slavonia complain they cannot find workers to fill vacancies for highly-educated occupations and for some semi- and unskilled occupations. These labor market mismatches are caused by outmigration in search of higher wages, and by the education system in Slavonia, which underperforms from early childhood education and care (ECEC) onwards. Yet opportunities exist: to assist Slavonia’s employers to pay higher wages through innovation and a reduction in regulatory burdens; to align skills with industry needs, especially in TVET; and to bring more of Slavonia’s population into the workforce through inclusion initiatives such as business collectives and employment programs.
Top priority actions to seize these opportunities can be taken by Ministers, County Prefects, and Regional Coordinators. Each opportunity is constrained by several issues: (#1) a lack of collaboration within Slavonia; (#2) a need for national reforms; and (#3) alignment of Ministries around shared priorities. The decisions to unlock these constraints are outlined in the following pages.
4 Data for 2000 to 2017. The share of FDI is low, when compared with Slavonia’s share of Croatia’s GDP, which is 12 percent. 5 Perishable food products (such as fresh strawberries) have a higher value than storable food products (such as frozen strawberries). Convenience foods
involve the prepackaging of fruits, vegetables and other foods for high value markets (such as ready-prepared lunches for office workers). 6 Data on population from Croatian Bureau of Statistics for 2017, indicating Slavonia’s population as 733,000, and Croatia’s population as 4.1 million. Data on unemployment for December 2018, from Croatian Employment Service (HZZ), indicating 149,000 unemployed workers in Croatia.
9
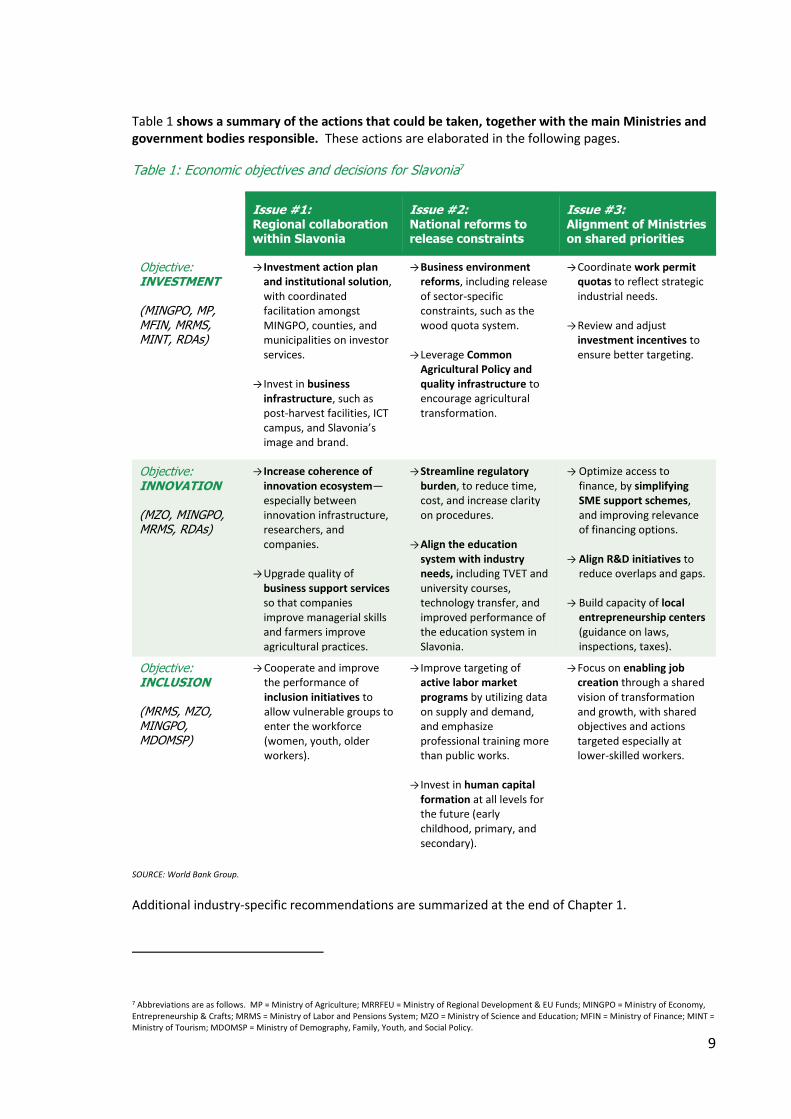
Table 1 shows a summary of the actions that could be taken, together with the main Ministries and government bodies responsible. These actions are elaborated in the following pages.
Table 1: Economic objectives and decisions for Slavonia7
Issue #1: Regional collaboration within Slavonia
Issue #2: National reforms to release constraints
Issue #3: Alignment of Ministries on shared priorities
Objective: INVESTMENT (MINGPO, MP, MFIN, MRMS, MINT, RDAs)
→ Investment action plan and institutional solution, with coordinated facilitation amongst MINGPO, counties, and municipalities on investor services.
→ Invest in business infrastructure, such as post-harvest facilities, ICT campus, and Slavonia’s image and brand.
→ Business environment reforms, including release of sector-specific constraints, such as the wood quota system.
→ Leverage Common
Agricultural Policy and quality infrastructure to encourage agricultural transformation.
→ Coordinate work permit quotas to reflect strategic industrial needs.
→ Review and adjust investment incentives to ensure better targeting.
Objective: INNOVATION (MZO, MINGPO, MRMS, RDAs)
→ Increase coherence of innovation ecosystem—especially between innovation infrastructure, researchers, and companies.
→ Upgrade quality of business support services so that companies improve managerial skills and farmers improve agricultural practices.
→ Streamline regulatory burden, to reduce time, cost, and increase clarity on procedures.
→ Align the education system with industry needs, including TVET and university courses, technology transfer, and improved performance of the education system in Slavonia.
→ Optimize access to finance, by simplifying SME support schemes, and improving relevance of financing options.
→ Align R&D initiatives to reduce overlaps and gaps.
→ Build capacity of local
entrepreneurship centers (guidance on laws, inspections, taxes).
Objective: INCLUSION (MRMS, MZO, MINGPO, MDOMSP)
→ Cooperate and improve the performance of inclusion initiatives to allow vulnerable groups to enter the workforce (women, youth, older workers).
→ Improve targeting of active labor market programs by utilizing data on supply and demand, and emphasize professional training more than public works.
→ Invest in human capital formation at all levels for the future (early childhood, primary, and secondary).
→ Focus on enabling job creation through a shared vision of transformation and growth, with shared objectives and actions targeted especially at lower-skilled workers.
SOURCE: World Bank Group.
Additional industry-specific recommendations are summarized at the end of Chapter 1.
7 Abbreviations are as follows. MP = Ministry of Agriculture; MRRFEU = Ministry of Regional Development & EU Funds; MINGPO = Ministry of Economy, Entrepreneurship & Crafts; MRMS = Ministry of Labor and Pensions System; MZO = Ministry of Science and Education; MFIN = Ministry of Finance; MINT = Ministry of Tourism; MDOMSP = Ministry of Demography, Family, Youth, and Social Policy.
10
Issue #1: Will counties and municipalities collaborate on key initiatives?
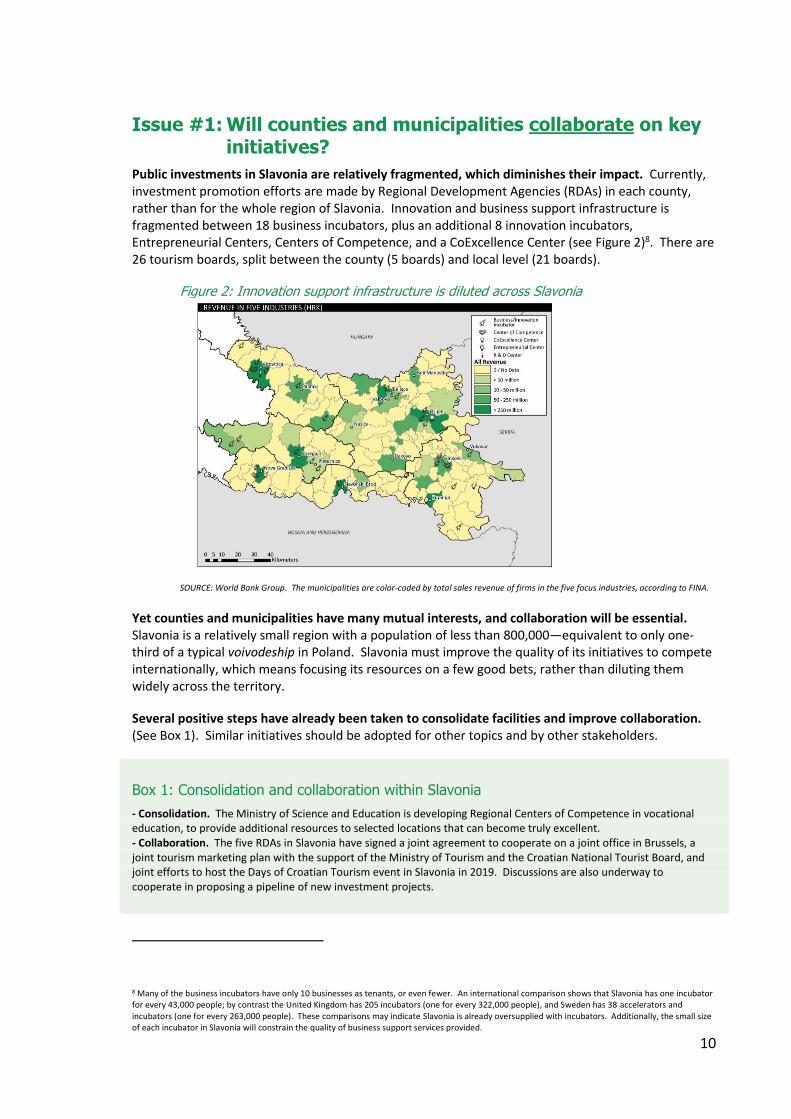
Public investments in Slavonia are relatively fragmented, which diminishes their impact. Currently, investment promotion efforts are made by Regional Development Agencies (RDAs) in each county, rather than for the whole region of Slavonia. Innovation and business support infrastructure is fragmented between 18 business incubators, plus an additional 8 innovation incubators, Entrepreneurial Centers, Centers of Competence, and a CoExcellence Center (see Figure 2)8. There are 26 tourism boards, split between the county (5 boards) and local level (21 boards).
Figure 2: Innovation support infrastructure is diluted across Slavonia
SOURCE: World Bank Group. The municipalities are color-coded by total sales revenue of firms in the five focus industries, according to FINA.
Yet counties and municipalities have many mutual interests, and collaboration will be essential. Slavonia is a relatively small region with a population of less than 800,000—equivalent to only one-third of a typical voivodeship in Poland. Slavonia must improve the quality of its initiatives to compete internationally, which means focusing its resources on a few good bets, rather than diluting them widely across the territory.
Several positive steps have already been taken to consolidate facilities and improve collaboration. (See Box 1). Similar initiatives should be adopted for other topics and by other stakeholders.
Box 1: Consolidation and collaboration within Slavonia
- Consolidation. The Ministry of Science and Education is developing Regional Centers of Competence in vocational education, to provide additional resources to selected locations that can become truly excellent. - Collaboration. The five RDAs in Slavonia have signed a joint agreement to cooperate on a joint office in Brussels, a joint tourism marketing plan with the support of the Ministry of Tourism and the Croatian National Tourist Board, and joint efforts to host the Days of Croatian Tourism event in Slavonia in 2019. Discussions are also underway to cooperate in proposing a pipeline of new investment projects.
8 Many of the business incubators have only 10 businesses as tenants, or even fewer. An international comparison shows that Slavonia has one incubator for every 43,000 people; by contrast the United Kingdom has 205 incubators (one for every 322,000 people), and Sweden has 38 accelerators and incubators (one for every 263,000 people). These comparisons may indicate Slavonia is already oversupplied with incubators. Additionally, the small size of each incubator in Slavonia will constrain the quality of business support services provided.
11
Under Issue #1 (Regional Collaboration), top priority actions should be:
→ INVESTMENT: A regional action plan for foreign investment. Slavonia’s international
competitiveness for FDI should be improved through a regional action plan. The action plan would include: investment promotion for specified subsectors; a defined range of services for investors; and a set of KPIs for each subsector. To achieve these actions, RDAs will need to collaborate at the regional level, and municipalities will need to be better leveraged for investment promotion (to deploy their responsibilities for business and economic zones, construction permit procedures, and access to land). Investment policy is currently focused on incentives, but incentives are less persuasive for investors than fundamental elements of the business environment, workforce skills, and appropriate infrastructure. The priority for Slavonia should be to attract FDI which can integrate Slavonia in global value chains, enable transfer of knowledge and technology, and create more jobs.
Upgrade economic infrastructure to catalyze new private investments. Domestic investments in Slavonia are held back by a lack of access to shared facilities and services. Examples include: post-harvest facilities; irrigation infrastructure; an ICT campus in Osijek; and Slavonia’s image and brand. These investments would help raise the productivity of companies and can help unlock new domestic investments and growth. The investments should be focused in the main hubs for each industry: ICT in Osijek, Wood in Belišće, Virovitica or Vinkovci; Mechanical Engineering in Slavonski Brod, and Agri-Food in several hubs such as Osijek, Semeljci and Nova Gradiška, to create industry hubs that can strengthen Slavonia’s clusters of companies in related activities.
→ INNOVATION: Consolidate innovation infrastructure across the region. Innovation infrastructure in Slavonia can be improved by increasing the connections between public research organizations, competence centers, business support institutions and firms—and by ensuring there are adequate resources and quality of services. Incubators and technology parks should provide high-quality business support services that help companies improve operational efficiency and strategic decisions. Quality can be improved by combining some of the small and disparate facilities, including the 18 incubators spread across Slavonia. A cluster approach would focus innovation infrastructure in locations where there is most demand, and would provide multiple support initiatives: technology testing, demonstration, commercialization, technology adoption, quality certifications and stadnards, and productivity diagnostics—with a focus on a few high quality centers, rather than a larger number of basic facilities. Innovation infrastructure should be planned for long-term sustainability, including operating costs, personnel costs, and the provision of specialized support programs for beneficiaries.
→ INCLUSION: Cooperate on inclusion initiatives to allow vulnerable groups to enter the workforce. Such groups include youth, older workers, rural women, and the less educated. In Slavonia, only 42.1 percent of women are employed, compared to 56.7 percent of women in the rest of Croatia. Only 21.4 percent of Slavonia’s population with less than an upper-secondary education are employed, compared to 61.5 percent of those with an upper-secondary education or higher. Inclusion and employment programs can be increased in effectiveness, through a better understanding of the needs of vulnerable populations, and a better link to growth opportunities such as family farms and community-based tourism. Inactivity is higher in rural areas than urban areas, which indicates a need for a spatial perspective on inclusion initiatives. Programs can also be increased in quality through standardization and quality control of initiatives such as Zaželi—which is an innovative program to include vulnerable populations in the labor market, but has had varying results, especially because the nature and quality of its training varies greatly. Self employment could further be promoted through business collectives (for example in agro-tourism and care

12
provision), building on good international experience. Performance of these programs can be improved through monitoring performance with program feedback.
13
Issue #2: Will national reforms increase the impact of expenditures?
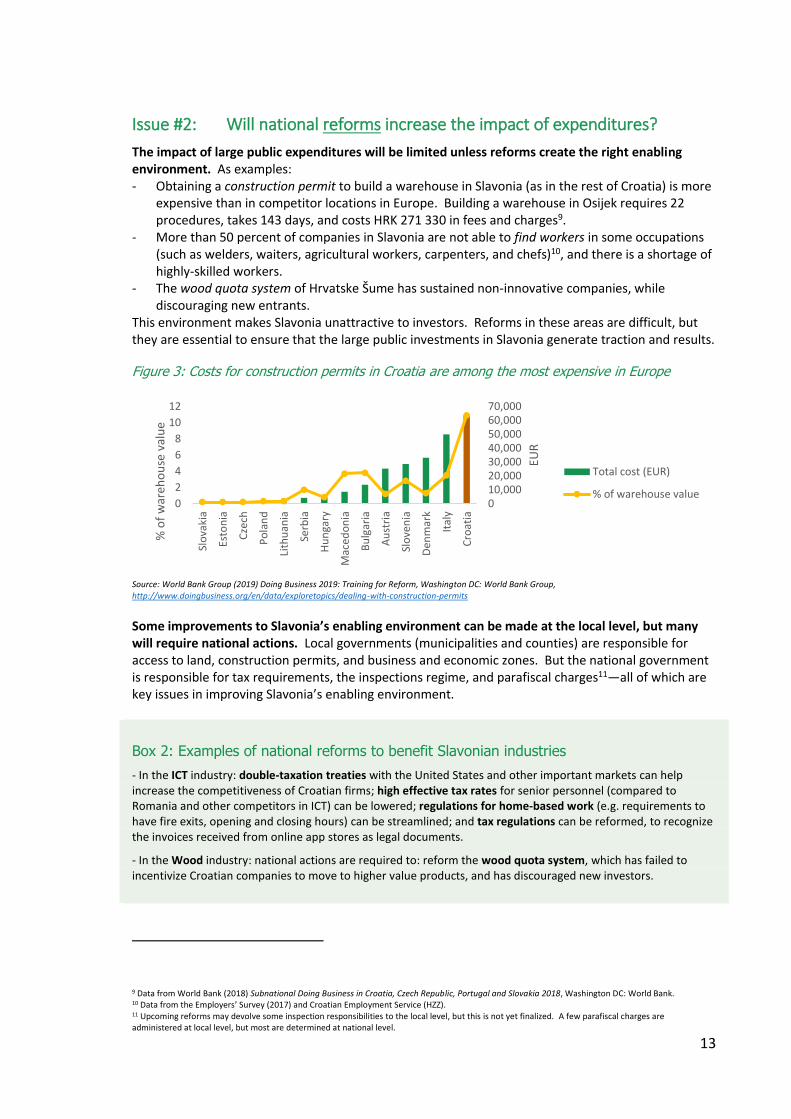
The impact of large public expenditures will be limited unless reforms create the right enabling environment. As examples: - Obtaining a construction permit to build a warehouse in Slavonia (as in the rest of Croatia) is more
expensive than in competitor locations in Europe. Building a warehouse in Osijek requires 22 procedures, takes 143 days, and costs HRK 271 330 in fees and charges9.
- More than 50 percent of companies in Slavonia are not able to find workers in some occupations (such as welders, waiters, agricultural workers, carpenters, and chefs)10, and there is a shortage of highly-skilled workers.
- The wood quota system of Hrvatske Šume has sustained non-innovative companies, while discouraging new entrants.
This environment makes Slavonia unattractive to investors. Reforms in these areas are difficult, but they are essential to ensure that the large public investments in Slavonia generate traction and results.
Figure 3: Costs for construction permits in Croatia are among the most expensive in Europe
Source: World Bank Group (2019) Doing Business 2019: Training for Reform, Washington DC: World Bank Group, http://www.doingbusiness.org/en/data/exploretopics/dealing-with-construction-permits
Some improvements to Slavonia’s enabling environment can be made at the local level, but many will require national actions. Local governments (municipalities and counties) are responsible for access to land, construction permits, and business and economic zones. But the national government is responsible for tax requirements, the inspections regime, and parafiscal charges11—all of which are key issues in improving Slavonia’s enabling environment.
Box 2: Examples of national reforms to benefit Slavonian industries
- In the ICT industry: double-taxation treaties with the United States and other important markets can help increase the competitiveness of Croatian firms; high effective tax rates for senior personnel (compared to Romania and other competitors in ICT) can be lowered; regulations for home-based work (e.g. requirements to have fire exits, opening and closing hours) can be streamlined; and tax regulations can be reformed, to recognize the invoices received from online app stores as legal documents.
- In the Wood industry: national actions are required to: reform the wood quota system, which has failed to incentivize Croatian companies to move to higher value products, and has discouraged new investors.
9 Data from World Bank (2018) Subnational Doing Business in Croatia, Czech Republic, Portugal and Slovakia 2018, Washington DC: World Bank. 10 Data from the Employers’ Survey (2017) and Croatian Employment Service (HZZ). 11 Upcoming reforms may devolve some inspection responsibilities to the local level, but this is not yet finalized. A few parafiscal charges are administered at local level, but most are determined at national level.
010,00020,00030,00040,00050,00060,00070,000
0
2
4
6
8
10
12
Slo
vaki
a
Esto
nia
Cze
ch
Po
lan
d
Lith
uan
ia
Serb
ia
Hu
nga
ry
Mac
edo
nia
Bu
lgar
ia
Au
stri
a
Slo
ven
ia
Den
mar
k
Ital
y
Cro
atia
EUR
% o
f w
areh
ou
se v
alu
e
Total cost (EUR)
% of warehouse value
14
Under Issue #2 (National Reforms), top priority actions should be:
→ INVESTMENT: Improve the business regulatory environment. Several reforms would ease the burden of time and costs on companies in Slavonia, in starting and operating businesses. Priorities should include:
o Streamlining the application process for construction permits; o Improving the information available to businesses on legal requirements for starting and
operating a business, and proactively informing businesses about new regulations; o Transforming the inspections regime towards compliance rather than punishment, and
implementing harmonized tools and information across inspectorates; o Reforming the system of parafiscal charges to increase transparency and predictability,
reviewing parafiscal charges and phase some out, and introducing the option of a single annual payment that can be made online.
o Addressing sector-specific constraints, especially: the wood quota system; regulatory obstacles to the ICT industry; and implementation of the Common Agricultural Policy and quality infrastructure to incentivize higher value production.
→ INNOVATION: Align the science and education system with industry needs. Improve the relevance of Technical and Vocational Education and Training (TVET) in Slavonia, through joint design with industry of the curricula, and provision of key competences for lifelong learning not just finite vocational courses. Incentivize university lecturers to increase their interactions with local industries, increase joint degrees that include residency of graduate students in local industries, and establish internships for university graduates. Improve the capabilities of Slavonia’s technology transfer office, to transform it into an industry-liaison office to promote industry-science linkages and articulate technology transfer activities.
→ INCLUSION: Improve targeting of labor market programs. Reshape active labor market programs (ALMPs) away from an emphasis on public works towards an emphasis on training, including on-the-job training. Currently in Slavonia, each year approximately 3 percent of unemployed persons attend a training course, but 6.3 percent participate in public works programs. Public works may help the most vulnerable populations, but they have limited, if any, impact on building skills. Training programs can be improved through multi-year arrangements with training providers, the active involvement of beneficiaries in the choice of programs, and broad multipartite ownership of the scope of training supplied (by county, economic, and social councils). Additionally, enrollments in ALMPs can be increased, from their current rate of only 17.5 percent of jobseekers, which is lower than the Croatian average. Participation targets should be set by type of ALMP, and the delivery capacity of the Croatian Employment Service (HZZ) should be strengthened to implement these programs. Recipients of Guaranteed Minimum Benefits (GMBs) face several barriers to enter the labor market, and addressing these requires cooperation between social welfare centers, HZZ branches, and local government, with provision of care and support services.
Invest in human capital formation at all levels (early childhood, primary, secondary, and tertiary), and improve the performance of the education system in Slavonia, which is currently underresourced compared to the rest of Croatia. In 2016, only 33 percent of kindergarten age children in Slavonia were enrolled, compared to 75 percent in Zagreb and 68 percent on the coast. Expenditures on education for each young person up to 24 years old are almost three times higher in Zagreb (HRK 6,356) than in Slavonia (HRK 2,344)12, particularly because of a reliance on the fiscal capacity of local governments rather than through national standardization of spending per young person.
12 Data is from Ministry of Finance, local government budgets, population estimates, and CBS education statistics.
15
Issue #3: Will national Ministries align their decisions on shared objectives?
Collaboration between Ministries can be enhanced by aligning Ministries around common objectives and priorities in Slavonia. As examples:
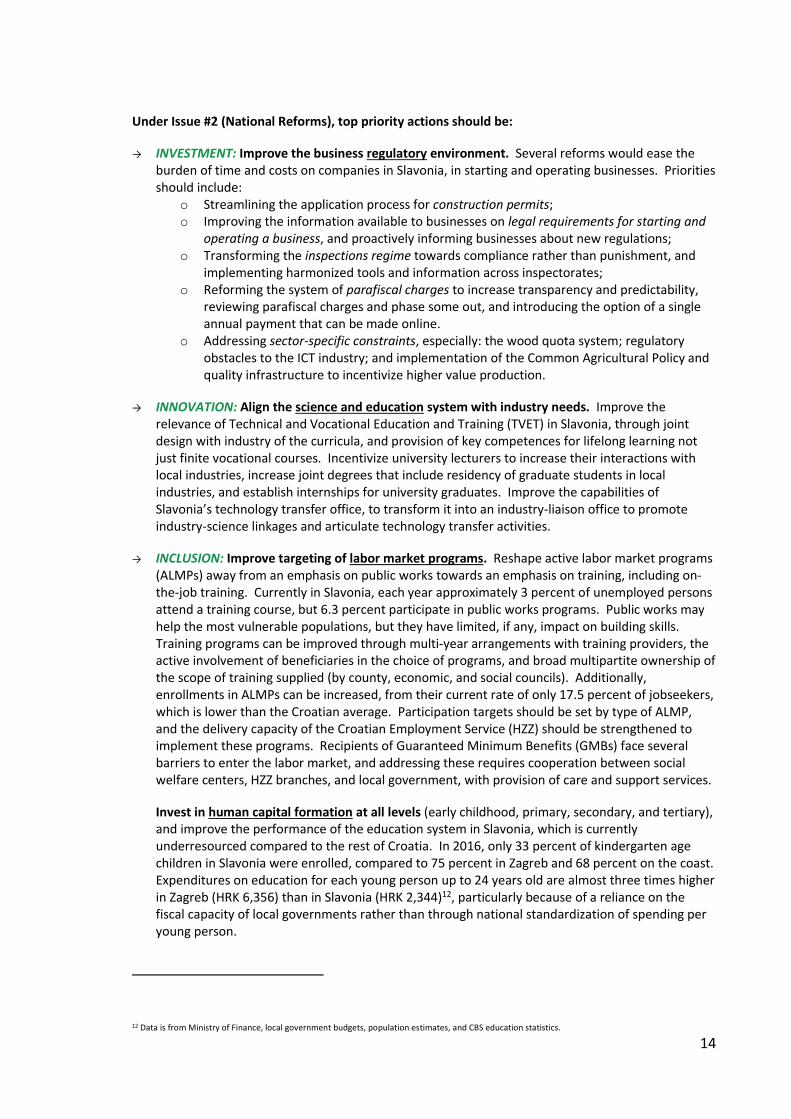
- Several ministries will need to be engaged to address the skills mismatch in Slavonia (a shortage of high-skilled workers and a surplus of middle- and unskilled workers—shown in Figure 4), including MINGPO, MZO, MRMS, MP, and MDOMSP.
- Public investments to support the Agri-Food industries are planned and managed by multiple ministries, and are missing out on complementarities (see Box 3).
- Slavonia’s business environment will require reforms by multiple Ministries on construction permits, inspections, parafiscal fees, and the wood quota system.
Alignment of these Ministries’ initiatives will require institutionalizing the interministerial discussions determine solutions to shared problems. Slavonia Council is a vital initiative to convene multiple Ministries and regional stakeholders. It should be underpinned by a fully functional Interministerial Working Group (IWG) to align initiatives at a technical level. Meetings of the IWG should be targeted sessions that interrogate options and decide on actions, and should have consistent participation of key ministries. Likewise, the four Managing Authorities for the Operational Programmes (OPs) should meet together to compare overlaps and synergies amongst their pipeline of projects.
Figure 4: Slavonia has too few jobs for low-skilled and middle-skilled workers, but needs more high-skilled workers
SOURCE: World Bank Group analysis of data from Croatian Employment Service (HZZ).
Box 3: Shared priorities in the Agri-food industry
Multiple initiatives are under implementation, and these will need to be coordinated to generate the best impacts. In Virovitica, for example: - an Innovation and Technology Center for R&D in Agriculture and Food Processing is planned by MZO using ERDF
funds; - a Center for Dairy R&D is planned by the Ministry of Agriculture using RDP funds; - a Center of Competence (CEKOM) on wood will be administered by MINGPO using OPKK funds; - a business incubator is administered by the county. All four of these have mutually complementary objectives, so how can they best leverage each other? For instance: could the two R&D centers combine some of their initiatives (e.g. innovations in product packaging)? Could the business incubator aim to foster spin-offs from the R&D centers? These activities are beginning to be coordinated by
0
10,000
20,000
30,000
40,000
50,000
60,000
Num
bers
of U
nem
ploy
ed a
nd
Vac
anci
es,
by s
kills
Skills - Secondary
Vacancies - Workersand operators
Skills - Elementaryand lower
Vacancies -Elementary
Skills - Graduate andpost-graduate
Too many middle-skilled workers
Too many unskilled workers
Too few high-skilled workers
16
the Ministry of Agriculture and Virovitica County; similar efforts at coordination should be made across Slavonia in similar situations.
Under Issue #3 (Alignment of Ministries), top priority actions should be:
→ INVESTMENT: Coordinate work permit quotas and the application process for immigrant workers to fill the gaps in Slavonia’s workforce that remain in unfilled despite education and training reform. Slavonia faces a notable skills shortage in some high-skilled occupations (such as ICT occupations), and other skills shortages in lower-skilled occupations such as welders, waiters, agricultural workers, and carpenters. Yet the quota of work permits available remains low in some of these: only 180 permits are available nationwide in ICT in 2019, compared to 300 in 2018. The application process is somewhat cumbersome, and is not available online.
Incentives for investors can be better coordinated with strategic priorities. A comprehensive inventory of all incentives (fiscal and financial) can be created to summarize the offer for investors in Slavonia, and the effectiveness of these incentives can be assessed.
→ INNOVATION: Optimize access to financial support schemes for SMEs and innovation. SME and innovation priorities and initiatives should be determined jointly between MZO and MINGPO, to reduce gaps and overlaps13. Joint planning between these two Ministries could prioritize the following improvements to financing for innovation in Slavonia.
Utilization of grants and financial instruments can be increased by using delivery mechanisms to suit companies in Slavonia at different stages in the innovation and life cycle, based on size (micro, small, medium, large) and/or type (start-ups and scale-ups). Public research organizations and private sector firms should be supported to leverage better the funds available, through support for project preparation. Availability and accessibility of finance through banks and development institutions (HBOR and HAMAG-BICRO) can be improved, including through greater use of financial instruments (particularly those alleviating collateral constraints).
The capacity of local entrepreneurship centers can be built to assist firms in navigating financing options (public and private sources) and legal responsibilities (laws, inspections, taxes).
→ INCLUSION: Enable job creation, including for the lower skilled. Initiatives to support innovation and growth in Slavonia’s industries span multiple Ministries. The efficiency of these actions can be increased if they are aligned, with a clear conception of how actions taken by several Ministries contribute to a set of shared objectives. Job creation can be a unifying objective, especially for low-skilled populations.
13 Currently, allocations for R&D expenditures are split between MZO and MINGPO. Each Ministry then decides how to spend their allocation, separately. This system creates overlaps in some areas, and gaps in other areas. Alternatively, if the Ministries collaborated, decisions on priorities would be made jointly, and then financing decisions would be taken in alignment with the priorities—with a clear idea of how each Ministry’s programs feeds into a comprehensive objective.

17
Chapters of this report
The report is structured as follows:
Chapter 1: Growth Opportunities and Constraints. The chapter outlines opportunities for growth and exports in five main industries: agri-food, wood, ICT, tourism, and Mechanical Engineering. It concludes that growth opportunities exist in subsectors, but several constraints—at national and local level—are limiting those opportunities. The main constraints are: the business regulatory environment; workforce and managerial skills; the innovation system; access to finance; and a lack of foreign investment. Each constraint is investigated in subsequent chapters of the report.
Chapter 2: Special Focus on Agri-Food. The chapter focuses on opportunities for growth and exports in agri-food, because of the special importance of this industry in Slavonia. It concludes that productivity can be increased through expanded irrigation infrastructure, adoption of newer agricultural technologies, improved farming practices, strengthened business management capacities, and investments in post-harvest facilities. Commercial partnerships would help smaller farmers enter more valuable markets, especially for higher value fruits and vegetables.
Obje
ctiv
e:
INV
ES
TM
EN
T
Chapter 3: Foreign Investment. The chapter identifies subsectors that have potential for foreign investment in Slavonia. It identifies key policy, regulatory, and institutional constraints currently limiting FDI. It concludes with a set of options for institutional and strategic structures to enhance regional investment promotion.
Chapter 4: Business Environment. The chapter assesses regulatory constraints for businesses operating in Slavonia, focusing on how the government can foster a more predictable and less cumbersome business environment. It concludes that business regulatory responsibilities are highly centralized in Croatia, so national authorities will need to act; but some improvements can also be made at local level.
Obje
ctiv
e:
INN
OV
AT
ION
Chapter 5: Innovation System. The chapter examines the research and innovation system in Slavonia, and finds several success cases yet a weak system overall. It recommends strengthening of: the University of Osijek; industry-science collaboration; innovation support infrastructure, especially with adequate management; and support for the private sector.
Chapter 6: Financial Instruments. The chapter examines the profile of financial sector intermediation in Slavonia, and the role of the government especially through HAMAG-BICRO and HBOR. It concludes that the availability and efficiency of financial support can be increased and better targeted, and that additional use can be made of financial instruments to provide more funding and to leverage additional commercial financing.
Obje
ctiv
e:
INC
LU
SIO
N
Chapter 7: Jobs, Skills, and Inclusion. The chapter examines the mismatch of jobs and skills in Slavonia, and also outlines challenges for social inclusion. It concludes that the main challenge in Slavonia’s labor market is job creation for the lower skilled. Meanwhile, reforms to education and labor market programs can help address Slavonia’s labor scarcity for some lower-skilled occupations. Inclusion initiatives can help bring more of Slavonia’s vulnerable population into the labor market.
18
Next steps in support to Project Slavonia
This diagnostic report is intended to provide Ministries and regional bodies with analysis to inform decisions on forthcoming projects and the mid-term review of Operational Programmes.
Subsequently, between February and June 2019, under the technical assistance agreement on Projekt Slavonija, Baranja & Srijem, the World Bank Group will further support the Government to:
• Develop a framework to prioritize and select strategic projects in Slavonia. The framework will include consideration of synergies among the proposed projects and schemes, and the expected impact on inclusive growth and employment outcomes. The work will also draw on technical inputs from officials of Emilia-Romagna region in Italy, which has been relatively successful in configuring its use of EU structural and investment funds.
• Revise the design and use of business support instruments and financial instruments in Slavonia. A strategic for use of instruments will consider the supply of financing from commercial institutions, and the quality of demand for financing (the bankability of project proposals by firms in Slavonia).
• Identify additional projects or schemes to support Slavonia’s economy. Project fiches for at least five additional projects or schemes will be prepared. The five could include, for example: (i) FDI or export promotion actions; (ii) schemes to improve managerial skills in Slavonia’s companies; (iii) initiatives to support the innovation system; (iv) alignment of vocational and educational programs with industry needs; (v) labor inclusion initiatives.
• Prepare a full territorial development strategy and integrated projects pipeline for the financing period 2021-2027. The strategy will situate Slavonia’s strategy in relationship to its neighboring regions and nearby countries—including cross-border value chains, and links to coastal nodes of growth. The scope of the strategy and projects pipeline will be broader than in the current phase of work, and may include regional transportation, urban interventions, and social inclusion, in addition to direct support to productive activities.

19
Chapter 1 Growth Opportunities and
Constraints

20
Chapter 1: Summary Key insights of this chapter:
• Agri-food. Slavonia’s economy is dominated by agri-food, but employment in this industry has shrunk by 14 percent since 2014, and operating profit margins and returns on assets are very slim (only 0.2 percent in 2017). Growth opportunities can be increased if farmers move away from bulk commodities towards higher value crops (perishables, vegetables, niche products), and embrace digital and precision farming. Seizing these opportunities will require improved farm and non-farm infrastructure (such as for packaging and logistics), knowledge and information systems, and better links to markets for smallholders.
• ICT. ICT, Wood, and Mechanical Engineering have all been successful at finding export markets, and have created 2465 new jobs in Slavonia since 201414. ICT firms are particularly healthy—with average profit margins of 15 percent—but will need to specialize their businesses to continue growing strongly. Growth opportunities exist through specialization in subsectors such as big data, 5G technologies, internet of things (IoT), cybersecurity, or other specialized areas where a competitive advantage can be found. Hybridization with other industries (such as digital agriculture) can offer good routes to specialization. A focus on integrated services, rather than subcontracted work as software developers for larger firms, would allow ICT firms to capture more value in their work, as firms like Mono and Inchoo have already been able to do.
• Wood. The wood industry should be doing much better than its average profit margins of only 2.4 percent, since it receives implicit subsidies through access to raw materials at below-market prices. Growth opportunities exist in higher-value markets, where competition is on quality and customization rather than price. Seizing these opportunities will require improved product design, technical quality, and engineering content in the products. Some additional opportunities may exist in biomass and modern wood energy segments.
• Tourism. The tourism industry is small, and the industry is not very profitable (on average it recorded losses in 2017). Growth opportunities exist through targeted and innovative tourism products (such as cycle tourism that incorporates homestays and community-based tourism), and the packaging of Slavonia’s assets into more memorable themes (such as ‘authentic lifestyle and hospitality’). Seizing these opportunities will require coordinated efforts across tourism operators for a united product offering.
• Mechanical Engineering will be analyzed in subsequent phases of this work. All five industries show a spatial concentration in some areas of Slavonia, which implies that regional hubs can drive growth. At least 30 percent of all value-added generated in each industry is located in one or two municipalities in Slavonia. This concentration implies that regional hubs of support initiatives can be an efficient way to drive further growth. In each of these industries, successful companies already exist in Slavonia, and can be good examples for others. Usually these are firms that have specialized in higher-value segments of their industry, such as customized wooden interiors, integrated ICT services, or niche agri-food products. Those successes illustrate the kinds of growth pathways that can be taken by more companies. Five main constraints are hindering Slavonia’s economy from seizing these opportunities. These constraints are: business regulatory environment; workforce and managerial skills; the innovation system; access to finance; and a lack of foreign investment. Further constraints afflict each industry,
14 The three industries have shown jobs growth between 2014 and 2017 as follows: 62 percent growth in jobs in ICT, 17 percent growth in jobs in Wood, and 9 percent growth in jobs in Mechanical Engineering.

21
including productivity issues, sector-specific regulations such as the wood quota system, specialized business infrastructure, and international branding and linkages.
Introduction
The objective of this chapter is to outline growth opportunities and main constraints for Slavonia’s economy. The chapter focuses on four main industries: agri-food, wood, ICT, and tourism, based on the agreement between the World Bank Group and Government of Croatia15. Mechanical Engineering industries are included in some parts of the chapter, but will be analysed in more detail subsequently. All five of these industries are ‘tradable’—i.e. open to regional and international competition, with the potential for Slavonian companies to grow their revenues through exports and through competing domestically with imported goods and services.
Amongst several pathways to growth, the chapter focuses especially on exports. Exports are a desirable pathway to growth, especially in Croatia as a relatively small country, which cannot offer as much potential for growth as will exist globally. Those export opportunities can help create jobs in Slavonia, and the chapter focuses especially on how to move into higher value-added segments within each industry which can pay higher wages. Usually companies will need to increase their productivity to compete in these segments.
The methodology of the chapter is to combine data analysis, with stakeholder consultations in Slavonia, plus international experience of similar industries. The chapter draws together inputs from World Bank Group team members specializing in each of the industries. Their recommendations also draw on prior analysis of agri-food and wood industries by a World Bank Group team supporting implementation of Croatia’s Smart Specialization Strategy with the Ministry of Economy, Entrepreneurship and Crafts16.
15 These four industries were chosen through discussions with the client and with regional counterparts before signing of the RAS agreement. The choice is based on the logic that Agri-Food and Wood are already large industries in Slavonia, while ICT and Tourism are small but fast-growing industries. In data on manufacturing output in Slavonia, food and beverages account for 33 percent of manufacturing, and wood products account for 16 percent. In other words, these two industries account for half of all manufacturing activity in Eastern Croatia (and as much as 73% in the county of Virovitica). ICT and Tourism are currently both smaller sectors in Slavonia (ICT accounts for 2% of GDP, and Tourism accounts for only 0.5% of overnight stays in all of Croatia), but are growing quickly and demonstrate further potential. 16 This work was delivered under the RAS Croatia Competitiveness, 2016-2019.
22
1. Profile of main industries This section summarizes the current profile of five industries in Slavonia—Agri-Food, ICT, Wood, Tourism, and Mechanical Engineering. The analysis presented here is a foundation for the subsequent sections on Growth Opportunities and Constraints. The section shows that:
• Slavonia’s economy is dominated by agri-food. But jobs in agri-food have shrunk in recent years while they have grown in other industries;
• The performance of the five industries differs: profits and returns are highest in ICT, moderate in Mechanical Engineering and Wood, and lowest in Agri-Food and Transport & Tourism. ICT, Wood and Mechanical Engineering have also been the most successful at finding export markets.
• All five industries are spatially concentrated within Slavonia: in each industry, at least 25 percent of all operating profits in Slavonia are made in one municipality alone.
• Slavonia has a lower density of businesses, and a lower share of large firms.
1.1. Slavonia’s economy is dominated by agri-food, but employment has shrunk compared to other industries
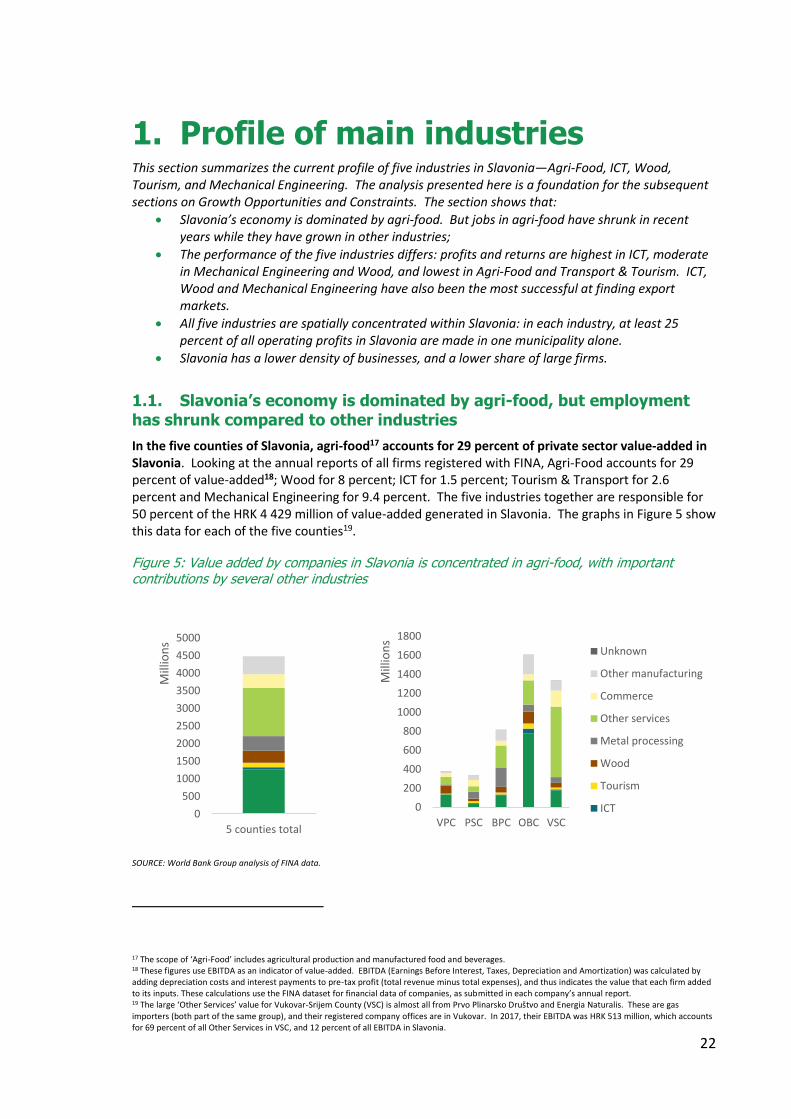
In the five counties of Slavonia, agri-food17 accounts for 29 percent of private sector value-added in Slavonia. Looking at the annual reports of all firms registered with FINA, Agri-Food accounts for 29 percent of value-added18; Wood for 8 percent; ICT for 1.5 percent; Tourism & Transport for 2.6 percent and Mechanical Engineering for 9.4 percent. The five industries together are responsible for 50 percent of the HRK 4 429 million of value-added generated in Slavonia. The graphs in Figure 5 show this data for each of the five counties19.
Figure 5: Value added by companies in Slavonia is concentrated in agri-food, with important contributions by several other industries
SOURCE: World Bank Group analysis of FINA data.
17 The scope of ‘Agri-Food’ includes agricultural production and manufactured food and beverages. 18 These figures use EBITDA as an indicator of value-added. EBITDA (Earnings Before Interest, Taxes, Depreciation and Amortization) was calculated by adding depreciation costs and interest payments to pre-tax profit (total revenue minus total expenses), and thus indicates the value that each firm added to its inputs. These calculations use the FINA dataset for financial data of companies, as submitted in each company’s annual report. 19 The large ‘Other Services’ value for Vukovar-Srijem County (VSC) is almost all from Prvo Plinarsko Društvo and Energia Naturalis. These are gas importers (both part of the same group), and their registered company offices are in Vukovar. In 2017, their EBITDA was HRK 513 million, which accounts for 69 percent of all Other Services in VSC, and 12 percent of all EBITDA in Slavonia.
0
500
1000
1500
2000
2500
3000
3500
4000
4500
5000
5 counties total
Mill
ion
s
0
200
400
600
800
1000
1200
1400
1600
1800
VPC PSC BPC OBC VSC
Mill
ion
s
Unknown
Other manufacturing
Commerce
Other services
Metal processing
Wood
Tourism
ICT
23
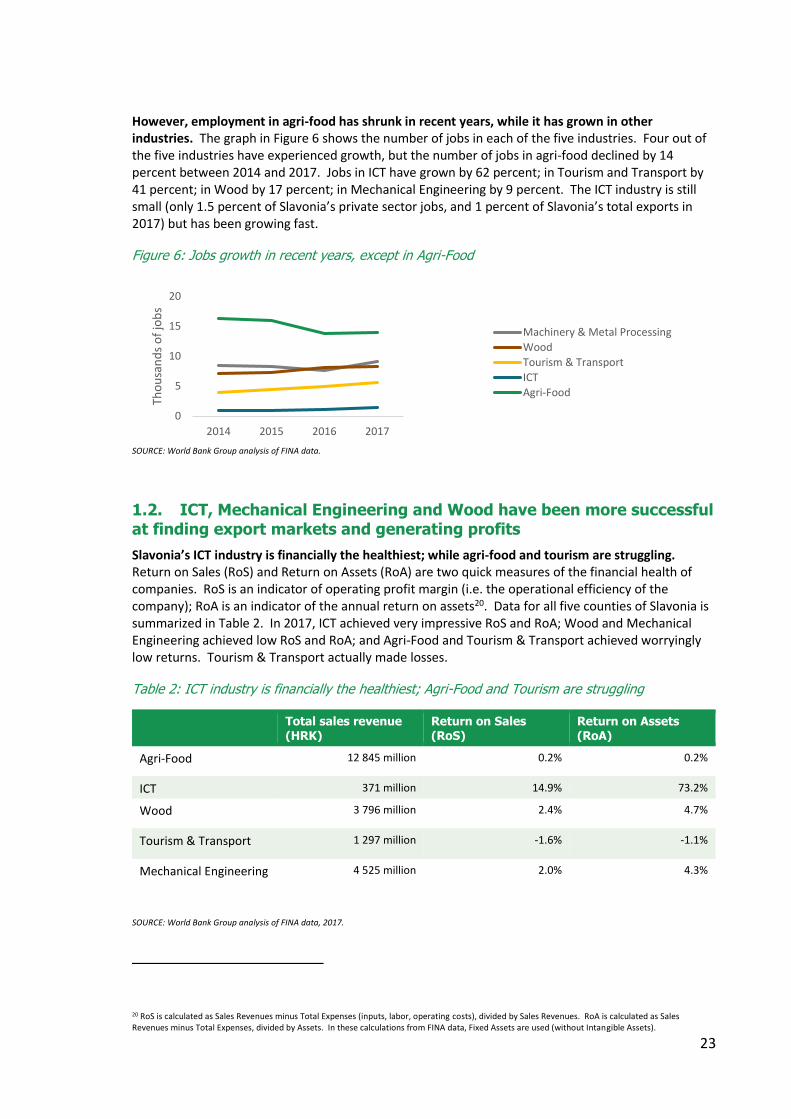
However, employment in agri-food has shrunk in recent years, while it has grown in other industries. The graph in Figure 6 shows the number of jobs in each of the five industries. Four out of the five industries have experienced growth, but the number of jobs in agri-food declined by 14 percent between 2014 and 2017. Jobs in ICT have grown by 62 percent; in Tourism and Transport by 41 percent; in Wood by 17 percent; in Mechanical Engineering by 9 percent. The ICT industry is still small (only 1.5 percent of Slavonia’s private sector jobs, and 1 percent of Slavonia’s total exports in 2017) but has been growing fast.
Figure 6: Jobs growth in recent years, except in Agri-Food
SOURCE: World Bank Group analysis of FINA data.
1.2. ICT, Mechanical Engineering and Wood have been more successful at finding export markets and generating profits
Slavonia’s ICT industry is financially the healthiest; while agri-food and tourism are struggling. Return on Sales (RoS) and Return on Assets (RoA) are two quick measures of the financial health of companies. RoS is an indicator of operating profit margin (i.e. the operational efficiency of the company); RoA is an indicator of the annual return on assets20. Data for all five counties of Slavonia is summarized in Table 2. In 2017, ICT achieved very impressive RoS and RoA; Wood and Mechanical Engineering achieved low RoS and RoA; and Agri-Food and Tourism & Transport achieved worryingly low returns. Tourism & Transport actually made losses.
Table 2: ICT industry is financially the healthiest; Agri-Food and Tourism are struggling
Total sales revenue (HRK)
Return on Sales (RoS)
Return on Assets (RoA)
Agri-Food 12 845 million 0.2% 0.2%
ICT 371 million 14.9% 73.2%
Wood 3 796 million 2.4% 4.7%
Tourism & Transport 1 297 million -1.6% -1.1%
Mechanical Engineering 4 525 million 2.0% 4.3%
SOURCE: World Bank Group analysis of FINA data, 2017.
20 RoS is calculated as Sales Revenues minus Total Expenses (inputs, labor, operating costs), divided by Sales Revenues. RoA is calculated as Sales Revenues minus Total Expenses, divided by Assets. In these calculations from FINA data, Fixed Assets are used (without Intangible Assets).
0
5
10
15
20
2014 2015 2016 2017
Tho
usa
nd
s o
f jo
bs
Machinery & Metal Processing
Wood
Tourism & Transport
ICT
Agri-Food
24
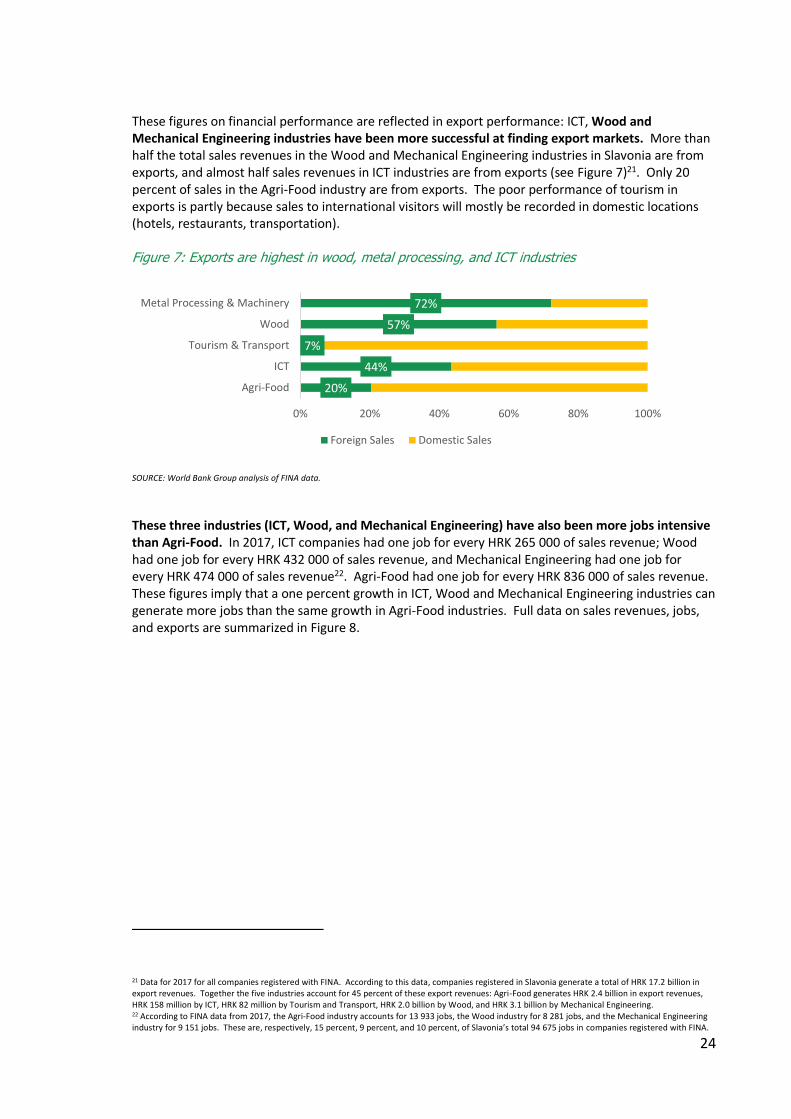
These figures on financial performance are reflected in export performance: ICT, Wood and Mechanical Engineering industries have been more successful at finding export markets. More than half the total sales revenues in the Wood and Mechanical Engineering industries in Slavonia are from exports, and almost half sales revenues in ICT industries are from exports (see Figure 7)21. Only 20 percent of sales in the Agri-Food industry are from exports. The poor performance of tourism in exports is partly because sales to international visitors will mostly be recorded in domestic locations (hotels, restaurants, transportation). Figure 7: Exports are highest in wood, metal processing, and ICT industries
SOURCE: World Bank Group analysis of FINA data.
These three industries (ICT, Wood, and Mechanical Engineering) have also been more jobs intensive than Agri-Food. In 2017, ICT companies had one job for every HRK 265 000 of sales revenue; Wood had one job for every HRK 432 000 of sales revenue, and Mechanical Engineering had one job for every HRK 474 000 of sales revenue22. Agri-Food had one job for every HRK 836 000 of sales revenue. These figures imply that a one percent growth in ICT, Wood and Mechanical Engineering industries can generate more jobs than the same growth in Agri-Food industries. Full data on sales revenues, jobs, and exports are summarized in Figure 8.
21 Data for 2017 for all companies registered with FINA. According to this data, companies registered in Slavonia generate a total of HRK 17.2 billion in export revenues. Together the five industries account for 45 percent of these export revenues: Agri-Food generates HRK 2.4 billion in export revenues, HRK 158 million by ICT, HRK 82 million by Tourism and Transport, HRK 2.0 billion by Wood, and HRK 3.1 billion by Mechanical Engineering. 22 According to FINA data from 2017, the Agri-Food industry accounts for 13 933 jobs, the Wood industry for 8 281 jobs, and the Mechanical Engineering industry for 9 151 jobs. These are, respectively, 15 percent, 9 percent, and 10 percent, of Slavonia’s total 94 675 jobs in companies registered with FINA.
20%
44%
7%
57%
72%
0% 20% 40% 60% 80% 100%
Agri-Food
ICT
Tourism & Transport
Wood
Metal Processing & Machinery
Foreign Sales Domestic Sales
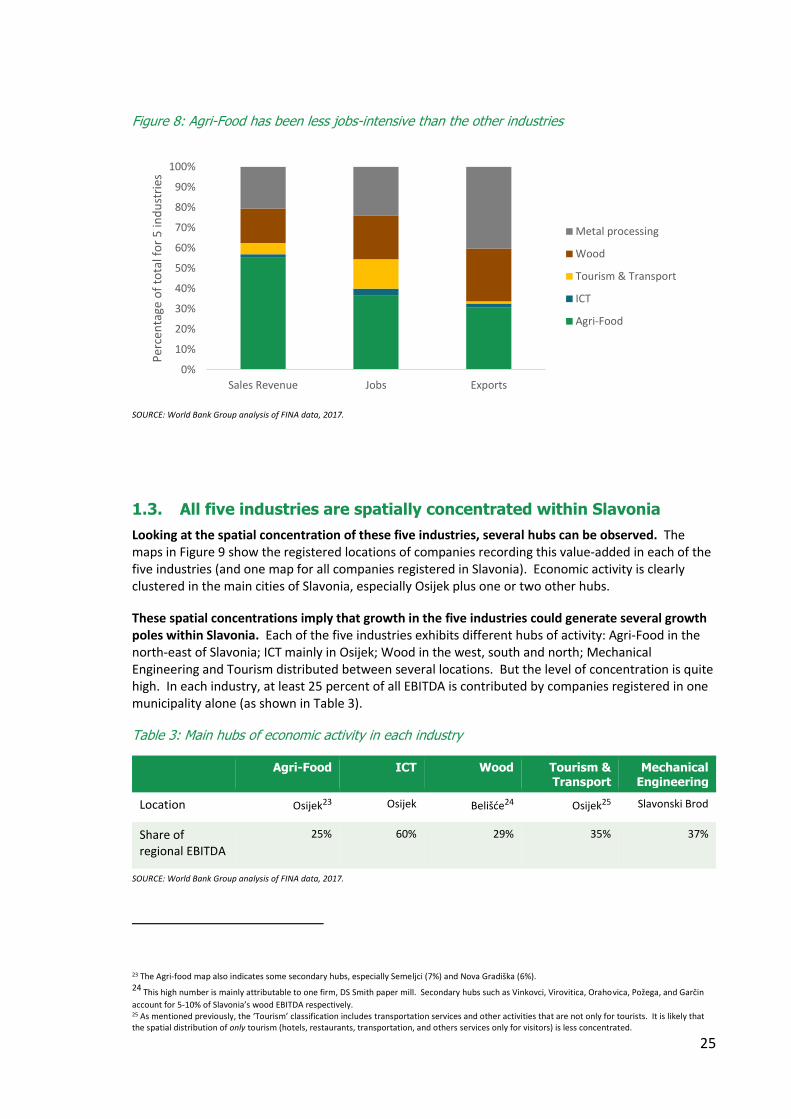
25
Figure 8: Agri-Food has been less jobs-intensive than the other industries
SOURCE: World Bank Group analysis of FINA data, 2017.
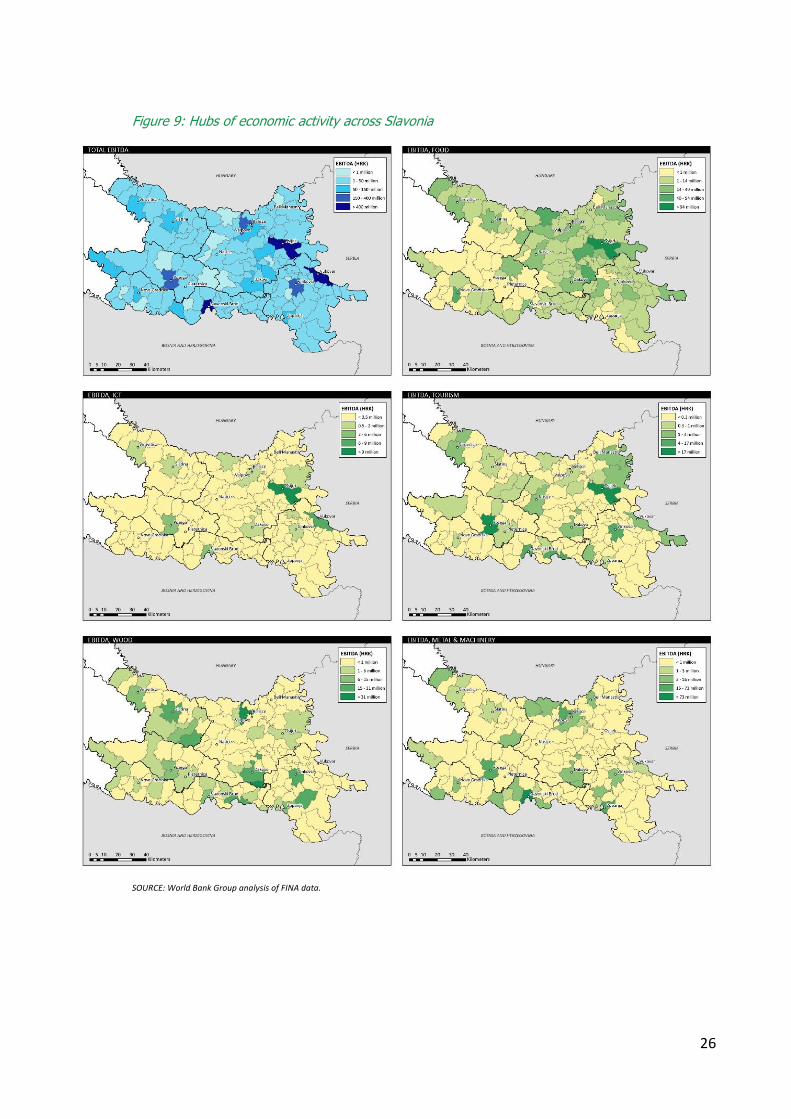
1.3. All five industries are spatially concentrated within Slavonia
Looking at the spatial concentration of these five industries, several hubs can be observed. The maps in Figure 9 show the registered locations of companies recording this value-added in each of the five industries (and one map for all companies registered in Slavonia). Economic activity is clearly clustered in the main cities of Slavonia, especially Osijek plus one or two other hubs.
These spatial concentrations imply that growth in the five industries could generate several growth poles within Slavonia. Each of the five industries exhibits different hubs of activity: Agri-Food in the north-east of Slavonia; ICT mainly in Osijek; Wood in the west, south and north; Mechanical Engineering and Tourism distributed between several locations. But the level of concentration is quite high. In each industry, at least 25 percent of all EBITDA is contributed by companies registered in one municipality alone (as shown in Table 3).
Table 3: Main hubs of economic activity in each industry
Agri-Food ICT Wood Tourism & Transport
Mechanical Engineering
Location Osijek23 Osijek Belišće24 Osijek25 Slavonski Brod
Share of regional EBITDA
25% 60% 29% 35% 37%
SOURCE: World Bank Group analysis of FINA data, 2017.
23 The Agri-food map also indicates some secondary hubs, especially Semeljci (7%) and Nova Gradiška (6%). 24 This high number is mainly attributable to one firm, DS Smith paper mill. Secondary hubs such as Vinkovci, Virovitica, Orahovica, Požega, and Garčin
account for 5-10% of Slavonia’s wood EBITDA respectively. 25 As mentioned previously, the ‘Tourism’ classification includes transportation services and other activities that are not only for tourists. It is likely that the spatial distribution of only tourism (hotels, restaurants, transportation, and others services only for visitors) is less concentrated.
0%
10%
20%
30%
40%
50%
60%
70%
80%
90%
100%
Sales Revenue Jobs Exports
Per
cen
tage
of
tota
l fo
r 5
ind
ust
ries
Metal processing
Wood
Tourism & Transport
ICT
Agri-Food
26
Figure 9: Hubs of economic activity across Slavonia
SOURCE: World Bank Group analysis of FINA data.
27
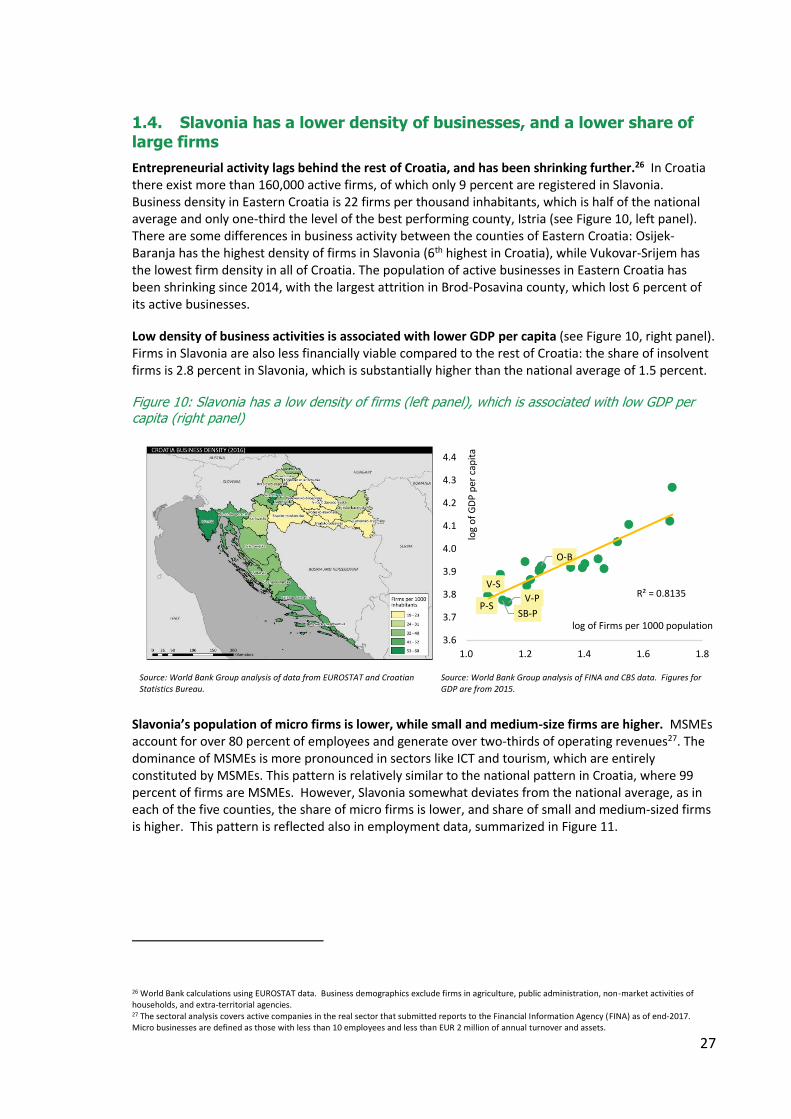
1.4. Slavonia has a lower density of businesses, and a lower share of large firms
Entrepreneurial activity lags behind the rest of Croatia, and has been shrinking further.26 In Croatia there exist more than 160,000 active firms, of which only 9 percent are registered in Slavonia. Business density in Eastern Croatia is 22 firms per thousand inhabitants, which is half of the national average and only one-third the level of the best performing county, Istria (see Figure 10, left panel). There are some differences in business activity between the counties of Eastern Croatia: Osijek-Baranja has the highest density of firms in Slavonia (6th highest in Croatia), while Vukovar-Srijem has the lowest firm density in all of Croatia. The population of active businesses in Eastern Croatia has been shrinking since 2014, with the largest attrition in Brod-Posavina county, which lost 6 percent of its active businesses.
Low density of business activities is associated with lower GDP per capita (see Figure 10, right panel). Firms in Slavonia are also less financially viable compared to the rest of Croatia: the share of insolvent firms is 2.8 percent in Slavonia, which is substantially higher than the national average of 1.5 percent.
Figure 10: Slavonia has a low density of firms (left panel), which is associated with low GDP per capita (right panel)
Source: World Bank Group analysis of data from EUROSTAT and Croatian Statistics Bureau.
Source: World Bank Group analysis of FINA and CBS data. Figures for GDP are from 2015.
Slavonia’s population of micro firms is lower, while small and medium-size firms are higher. MSMEs account for over 80 percent of employees and generate over two-thirds of operating revenues27. The dominance of MSMEs is more pronounced in sectors like ICT and tourism, which are entirely constituted by MSMEs. This pattern is relatively similar to the national pattern in Croatia, where 99 percent of firms are MSMEs. However, Slavonia somewhat deviates from the national average, as in each of the five counties, the share of micro firms is lower, and share of small and medium-sized firms is higher. This pattern is reflected also in employment data, summarized in Figure 11.
26 World Bank calculations using EUROSTAT data. Business demographics exclude firms in agriculture, public administration, non-market activities of households, and extra-territorial agencies. 27 The sectoral analysis covers active companies in the real sector that submitted reports to the Financial Information Agency (FINA) as of end-2017. Micro businesses are defined as those with less than 10 employees and less than EUR 2 million of annual turnover and assets.
O-B
V-S
P-SSB-P
V-P R² = 0.8135
3.6
3.7
3.8
3.9
4.0
4.1
4.2
4.3
4.4
1.0 1.2 1.4 1.6 1.8
log
of
GD
P p
er c
apit
a
log of Firms per 1000 population
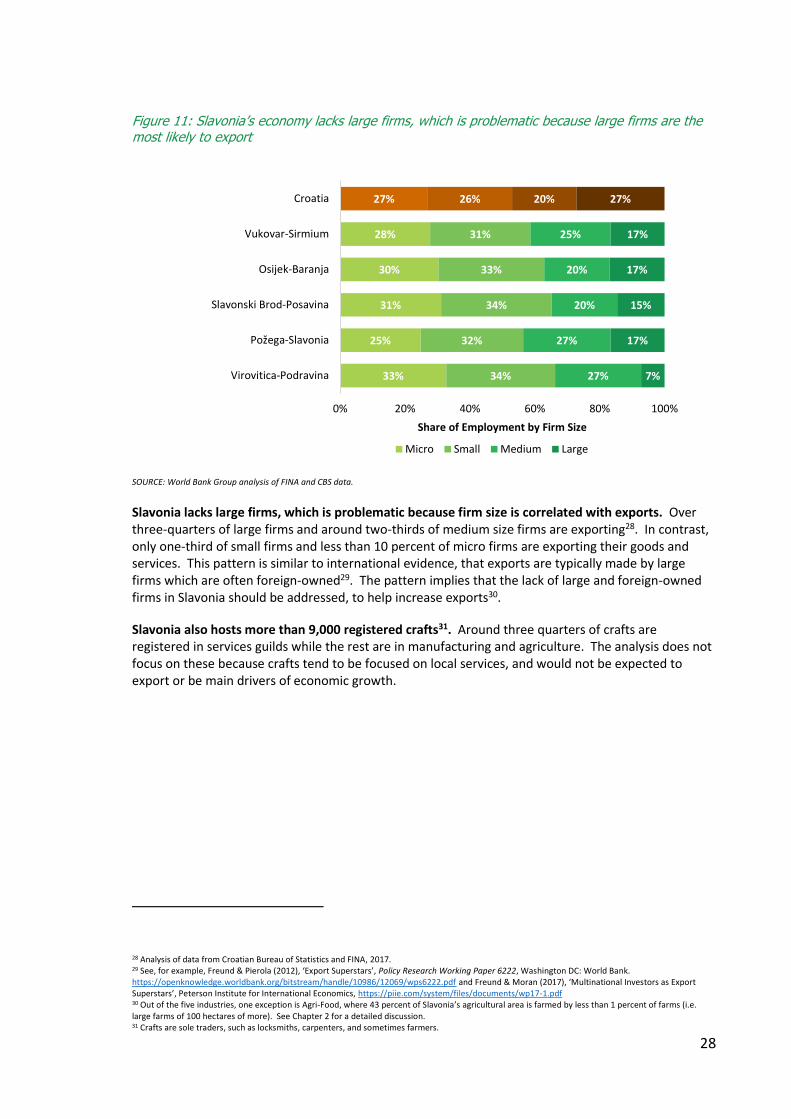
28
Figure 11: Slavonia’s economy lacks large firms, which is problematic because large firms are the most likely to export
SOURCE: World Bank Group analysis of FINA and CBS data.
Slavonia lacks large firms, which is problematic because firm size is correlated with exports. Over three-quarters of large firms and around two-thirds of medium size firms are exporting28. In contrast, only one-third of small firms and less than 10 percent of micro firms are exporting their goods and services. This pattern is similar to international evidence, that exports are typically made by large firms which are often foreign-owned29. The pattern implies that the lack of large and foreign-owned firms in Slavonia should be addressed, to help increase exports30.
Slavonia also hosts more than 9,000 registered crafts31. Around three quarters of crafts are registered in services guilds while the rest are in manufacturing and agriculture. The analysis does not focus on these because crafts tend to be focused on local services, and would not be expected to export or be main drivers of economic growth.
28 Analysis of data from Croatian Bureau of Statistics and FINA, 2017. 29 See, for example, Freund & Pierola (2012), ‘Export Superstars’, Policy Research Working Paper 6222, Washington DC: World Bank. https://openknowledge.worldbank.org/bitstream/handle/10986/12069/wps6222.pdf and Freund & Moran (2017), ‘Multinational Investors as Export Superstars’, Peterson Institute for International Economics, https://piie.com/system/files/documents/wp17-1.pdf 30 Out of the five industries, one exception is Agri-Food, where 43 percent of Slavonia’s agricultural area is farmed by less than 1 percent of farms (i.e. large farms of 100 hectares of more). See Chapter 2 for a detailed discussion. 31 Crafts are sole traders, such as locksmiths, carpenters, and sometimes farmers.
33%
25%
31%
30%
28%
27%
34%
32%
34%
33%
31%
26%
27%
27%
20%
20%
25%
20%
7%
17%
15%
17%
17%
27%
0% 20% 40% 60% 80% 100%
Virovitica-Podravina
Požega-Slavonia
Slavonski Brod-Posavina
Osijek-Baranja
Vukovar-Sirmium
Croatia
Share of Employment by Firm Size
Micro Small Medium Large

29
2. Growth Opportunities This section highlights the main growth opportunities for the four32 focus industries in Slavonia.
Growth opportunities are straightforward to define: they are segments within each industry where a competitive advantage is available and can be sustained over time. International competition is a litmus test of competitiveness, and is felt more immediately now that Croatia is a member of the European Union and its single market. Companies must find a way to create and sustain a competitive advantage over their competitors. Attractive segments within each industry are determined by the ease with which companies can earn a profit, which is diminished by several factors33: the strength of competition; the availability of substitutes; a lack of barriers to entry by other firms; and the market strength of suppliers and buyers. The stronger are these forces, the more difficult it is to earn a profit, and the less attractive will be that business34.
Companies in Slavonia will need to find these competitive niches within each industry. Based on consultations with industry stakeholders in Slavonia, and on emerging global trends within each industry, the main growth opportunities can be summarized as follows.
2.1. Agri-Food
In Agri-Food, farmers and processors must find opportunities to increase sales through higher productivity and value-added crops. Some opportunities for income diversification may also be viable.
Slavonia’s farmers and agribusiness producers have an urgent need to become more competitive, within Croatia and internationally. The agri-food sector in Slavonia has grown in recent years and exports have risen, but export intensity per inhabitant is still among the lowest in the EU-28. Imports from EU member states have risen into Croatia and Slavonia—especially in fresh and processed agri-food products—displacing Slavonian producers who have not been as fast in finding alternative markets or products. Smallholder farmers are mostly excluded from international trade, and are not integrated into agri-food value chains.
Examining data on the performance of companies in the agri-food sectors (see Figure 12):
• Primary production (code 01) accounts for approximately two-thirds of sales revenues, and half of all jobs;
• Processed foods (code 10) are currently specialized in low value products (code 10.4,6-8);
• Processing of meat, fruit and vegetables, or dairy (codes 10.1,3,5) are not yet a large proportion of the industry. These subsectors account for HRK 1.6 billion of sales and 1920 jobs—which is a large contribution to Slavonia’s economy—but is still only 12 percent of sales and 14 percent of jobs in Agri-Food.
32 Mechanical Engineering has not been included in this analysis because Project Slavonia did not include it as one of the four target industries at inception. However, it can be added subsequently if desired. 33 These factors were summarized most famously by Michael Porter as ‘Five Forces’. 34 For example: in the agri-food industry, bulk commodities and grains will tend to be an unattractive segment, because there will be many competitors (since the products can be stored and transported widely) and so profits will be competed away over time. Fresh fruits and vegetables will tend to be more attractive segments because there will be fewer competitors (since the products are perishable and cannot be stored or transported for long periods). All segments in agriculture are meanwhile affected by a growing market strength of suppliers and buyers, creating challenges for most producers to find a niche and earn profits.

30
Figure 12: Agri-Food is specialized in primary production and low-value products
SOURCE: World Bank Group analysis of FINA data.
Subsectors in the Agri-Food industry
1.1 Crop and animal production, hunting and related service activities
10.1 Processing and preserving of meat and production of meat products
1.2 Growing of perennial crops 10.2 Processing and preserving of fish, crustaceans and mollusks
1.3 Plant propagation 10.3 Processing and preserving of fruit and vegetables
1.4 Animal production 10.4 Manufacture of vegetable and animal oils and fats
1.5 Mixed farming 10.5 Manufacture of dairy products
1.6 Support activities to agriculture and post-harvest crop activities 10.6 Manufacture of grain mill products, starches and starch products
1.7 Hunting, trapping and related service activities 10.7 Manufacture of bakery and farinaceous products
3.1 Fishing 10.8 Manufacture of other food products
3.2 Aquaculture 11.01 Distilling, rectifying and blending of spirits
11.02 Manufacture of wine from grape
ALL CODES ARE STANDARD NACE CODES 11.03 Manufacture of cider and other fruit wines
(NACE is a standardized system for classifying industry data: Nomenclature des Activités Économiques dans la Communauté Européenne)
11.04 Manufacture of other non-distilled fermented beverages
11.05 Manufacture of beer
11.06 Manufacture of malt
11.07 Manufacture of soft drinks; production of mineral waters and other bottled waters
Global trends
Market power in Agri-Food industries is exercised by large conglomerate companies, in processing, buying, and retailing; while smaller producers may need to adopt niche products like organic, convenience or locally branded produce to make higher profit margins. Demand for food is expected to increase globally by 70% over the next three decades, driven by rising population and income levels. Most of this growth will be outside Europe. Yet succeeding in these new markets, and existing ones, becomes more difficult through price competition and changes in business models and consumer behaviour. On the side of businesses: there is an increasing concentration of processors, buyers and retailers in very large conglomerate companies, owing to the economies of scale that can be achieved along most activities in agri-food value chains. On the side of consumers: there are increased preferences for convenience, organic foods, and local produce. Producers and processors in Slavonia
-
2,000
4,000
6,000
8,000
10,000
Sale
s R
even
ues
(H
RK
mill
ion
)
2014 2015 2016 2017
0
2
4
6
8
10
Emp
loye
es (
tho
usa
nd
s)
2014 2015 2016 2017
31
will need to find these competitive niches to be able to sustain their businesses and avoid competition from an increasingly large number of competitors around the world.
Growth opportunities in Slavonia
Main opportunities exist in the following areas:
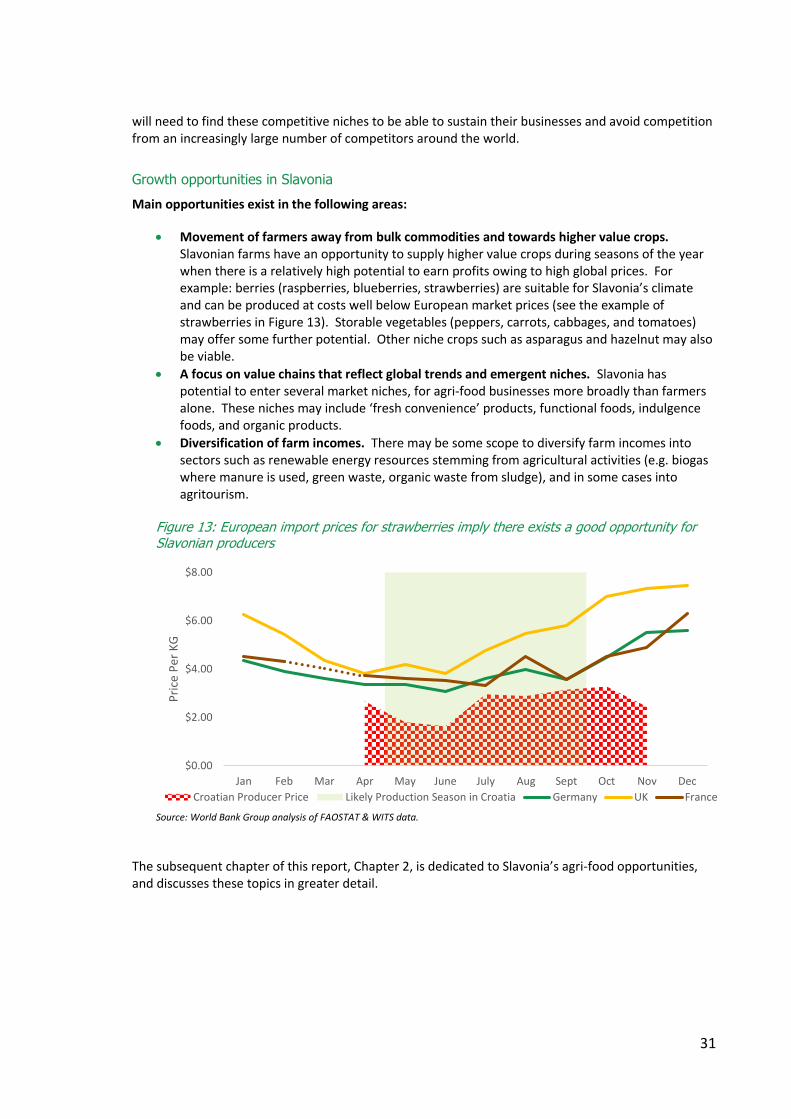
• Movement of farmers away from bulk commodities and towards higher value crops. Slavonian farms have an opportunity to supply higher value crops during seasons of the year when there is a relatively high potential to earn profits owing to high global prices. For example: berries (raspberries, blueberries, strawberries) are suitable for Slavonia’s climate and can be produced at costs well below European market prices (see the example of strawberries in Figure 13). Storable vegetables (peppers, carrots, cabbages, and tomatoes) may offer some further potential. Other niche crops such as asparagus and hazelnut may also be viable.
• A focus on value chains that reflect global trends and emergent niches. Slavonia has potential to enter several market niches, for agri-food businesses more broadly than farmers alone. These niches may include ‘fresh convenience’ products, functional foods, indulgence foods, and organic products.
• Diversification of farm incomes. There may be some scope to diversify farm incomes into sectors such as renewable energy resources stemming from agricultural activities (e.g. biogas where manure is used, green waste, organic waste from sludge), and in some cases into agritourism.
Figure 13: European import prices for strawberries imply there exists a good opportunity for Slavonian producers
Source: World Bank Group analysis of FAOSTAT & WITS data.
The subsequent chapter of this report, Chapter 2, is dedicated to Slavonia’s agri-food opportunities, and discusses these topics in greater detail.
$0.00
$2.00
$4.00
$6.00
$8.00
Jan Feb Mar Apr May June July Aug Sept Oct Nov Dec
Pri
ce P
er K
G
Croatian Producer Price Likely Production Season in Croatia Germany UK France
32
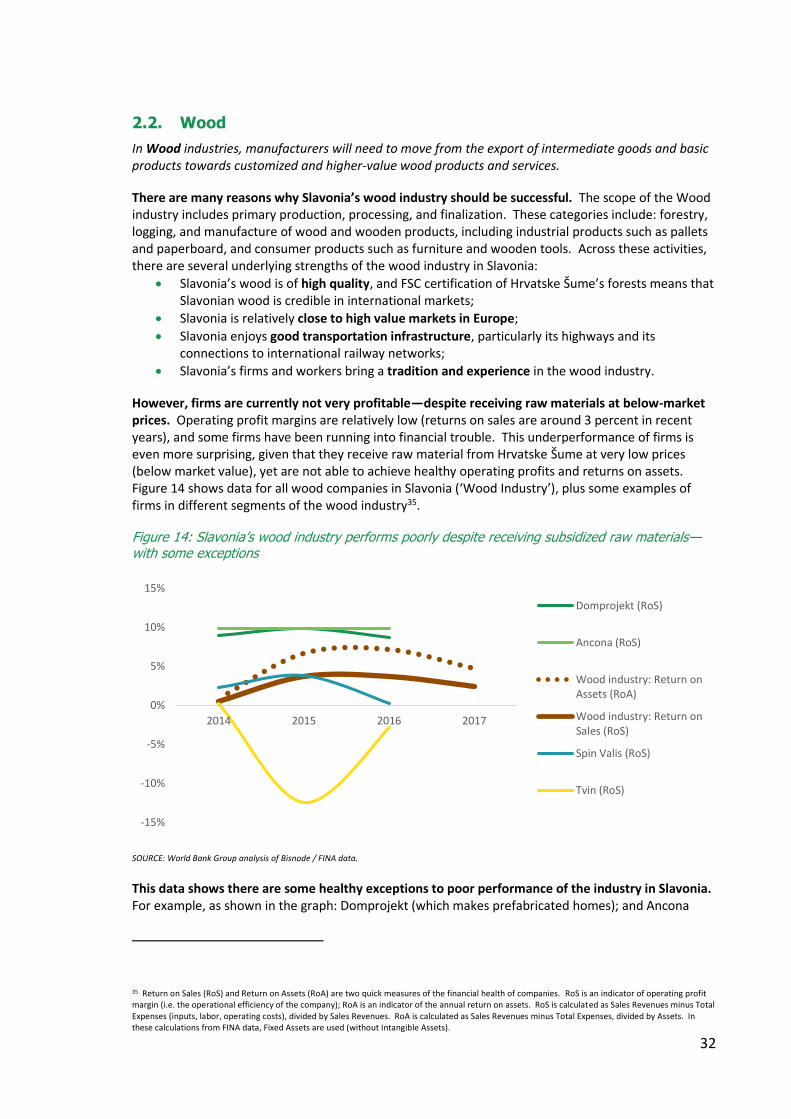
2.2. Wood
In Wood industries, manufacturers will need to move from the export of intermediate goods and basic products towards customized and higher-value wood products and services.
There are many reasons why Slavonia’s wood industry should be successful. The scope of the Wood industry includes primary production, processing, and finalization. These categories include: forestry, logging, and manufacture of wood and wooden products, including industrial products such as pallets and paperboard, and consumer products such as furniture and wooden tools. Across these activities, there are several underlying strengths of the wood industry in Slavonia:
• Slavonia’s wood is of high quality, and FSC certification of Hrvatske Šume’s forests means that Slavonian wood is credible in international markets;
• Slavonia is relatively close to high value markets in Europe;
• Slavonia enjoys good transportation infrastructure, particularly its highways and its connections to international railway networks;
• Slavonia’s firms and workers bring a tradition and experience in the wood industry.
However, firms are currently not very profitable—despite receiving raw materials at below-market prices. Operating profit margins are relatively low (returns on sales are around 3 percent in recent years), and some firms have been running into financial trouble. This underperformance of firms is even more surprising, given that they receive raw material from Hrvatske Šume at very low prices (below market value), yet are not able to achieve healthy operating profits and returns on assets. Figure 14 shows data for all wood companies in Slavonia (‘Wood Industry’), plus some examples of firms in different segments of the wood industry35.
Figure 14: Slavonia’s wood industry performs poorly despite receiving subsidized raw materials—with some exceptions
SOURCE: World Bank Group analysis of Bisnode / FINA data.
This data shows there are some healthy exceptions to poor performance of the industry in Slavonia. For example, as shown in the graph: Domprojekt (which makes prefabricated homes); and Ancona
35 Return on Sales (RoS) and Return on Assets (RoA) are two quick measures of the financial health of companies. RoS is an indicator of operating profit margin (i.e. the operational efficiency of the company); RoA is an indicator of the annual return on assets. RoS is calculated as Sales Revenues minus Total Expenses (inputs, labor, operating costs), divided by Sales Revenues. RoA is calculated as Sales Revenues minus Total Expenses, divided by Assets. In these calculations from FINA data, Fixed Assets are used (without Intangible Assets).
-15%
-10%
-5%
0%
5%
10%
15%
2014 2015 2016 2017
Domprojekt (RoS)
Ancona (RoS)
Wood industry: Return onAssets (RoA)
Wood industry: Return onSales (RoS)
Spin Valis (RoS)
Tvin (RoS)

33
(which makes customized kitchens, interiors, and other bespoke products). Some other innovative examples exist in Slavonia, such as Drvene Konstrukcije (construction beams) or Kronospan (manufacturer of composite wood panels).
Examining data on companies in the Wood industries in Slavonia (see Figure 15):
• Higher value subsectors (wood products [code 16.2] and furniture [code 31]) are the biggest generators of jobs;
• Forestry and logging generates a small proportion of industry revenues and jobs;
• Manufacture of paper (code 17) generates substantial sales revenues, but relatively few jobs.
Figure 15: Most jobs in the Wood industry are generated by higher value subsectors
SOURCE: World Bank Group analysis of FINA data.
Subsectors in the Wood industry
2 Forestry and logging 16.1 Sawmilling and planing of wood 16.2 Manufacture of products of wood, cork, straw and plaiting materials 17 Manufacture of paper and paper products 31 Manufacture of furniture
Global trends
Forest and wood product industries are global growth industries. Future global demand for wood products through 2060 is projected to increase substantially36: the demand for pulp and paper is expected to double, and for solid wood products the increase will be 28-61 percent. In the shorter
36 These estimates are based on an economic model known as the Global Forest Products Model and data sourced from the Food and Agriculture Organization's Statistical Database.
-
500
1 000
1 500
02 16.1 16.2 17 31
Sale
s R
even
ue
(HR
K m
illio
ns)
2014 2015 2016 2017
0
1
2
3
02 16.1 16.2 17 31
Emp
loye
es (
tho
usa
nd
s)
2014 2015 2016 2017

34
term, the global furniture market is expected to grow by 5 percent annually in the next five years. This indicates that there is a growing demand for Croatia’s wood industry.
However, also supply patterns are changing and East Asian producers, particularly China, have increased their share in global wood products markets with a focus on lower unit value mass consumer products. Croatia’s high quality, sustainability certified raw material base, closeness to EU markets and knowledge of Europeans design preferences form a good basis for ensuring a market niche if forest and wood market policies are improved, appropriate skills developed and innovations and use of technology promoted.
Climate change will be a major factor in the long-term development of forest and wood product industries both globally and in Croatia. Policies to mitigate climate change will, in the long run, likely favor sustainably produced carbon neutral wood products and wood energy. On the other hand, climate change itself will have an adverse impact on forests, their growth and regeneration. This will ultimately influence raw material supply.
Growth opportunities in Slavonia
Several attractive segments in the Wood industry exist, and may be available to Slavonian companies. The attractiveness of these segments is largely borne out in the examples cited earlier: the underperforming firms tend to be in traditional and mass-produced segments, while the more highly performing firms are in innovative and customized segments.
• The wood industry can diversify its manufactured goods and enter higher-value markets with competition on quality and customization, rather than high-volume markets with competition on price. Companies deciding to enter those higher-value segments must improve their product design, technical quality, and engineering content. Design improvements can happen either through investments within the company or through collaboration with design institutions (e.g. schools of design/architecture and universities; or private firms). Engineering content and technical quality can be enhanced likewise through internal innovations or through external collaborations and partnerships. These collaborations could happen within Croatia or even with other EU member states that have well established advanced furniture and wood industries but a limited raw material base (e.g. Italy, Denmark, Germany).
• Biomass and modern wood energy segments can offer some complementary routes to extract maximum value from the raw material. These segments involve the production of chips and residues, as byproducts of processing and manufacturing processes, which can yield additional value through power generation. Creating demand for small diameter wood (logging residue and thinnings) would further increase the value of forest production, and would also contribute to climate goals if they can substitute for fossil fuels. However, the economics of wood energy are still challenging, and profitability is currently dependent on special tariffs for renewable energy).
2.3. ICT
The ICT industry in Slavonia can grow further by finding niches in specialized subsectors, rather than generic subcontracting and freelancing.
The main challenge for the ICT industry in Slavonia—and in Croatia more broadly—is to find high-value niches in the industry to establish a comparative advantage. In Croatia, most ICT firms are resellers or distributors of software and equipment that is manufactured outside Croatia, by large multinationals such as Cisco or IBM. Some of these have the capacity to integrate and customize those solutions. A smaller subset of ICT companies are developing or offering their own solutions,
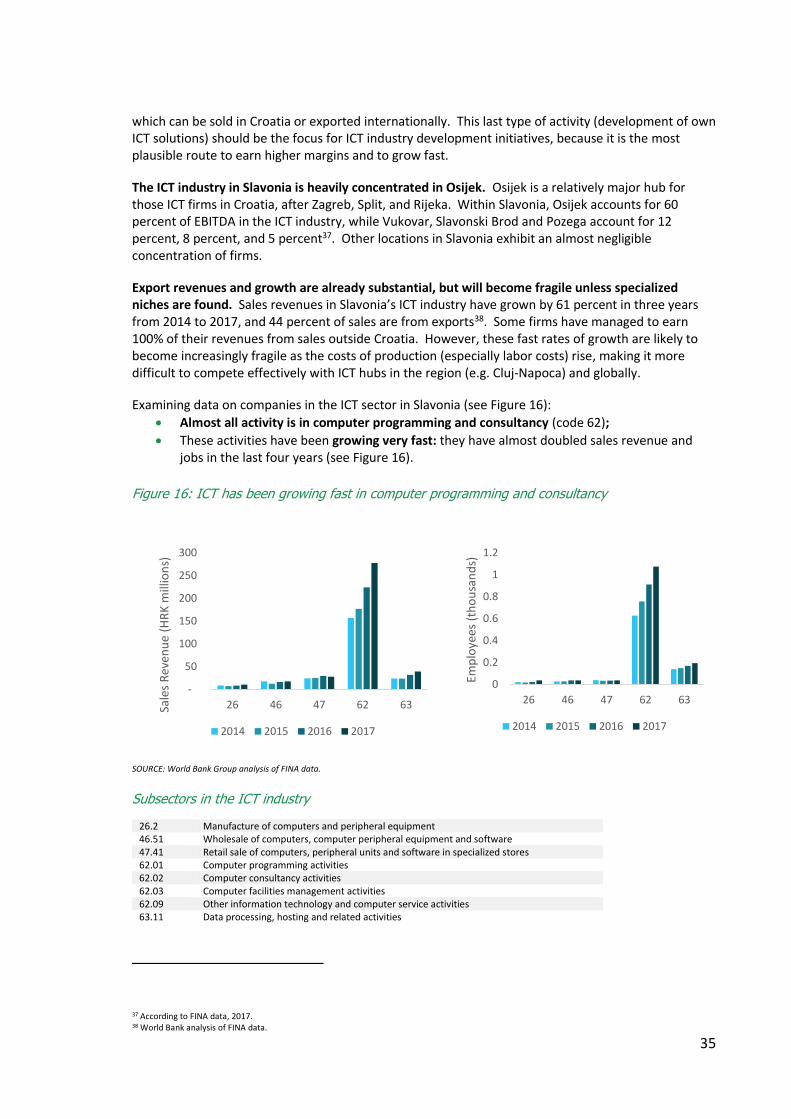
35
which can be sold in Croatia or exported internationally. This last type of activity (development of own ICT solutions) should be the focus for ICT industry development initiatives, because it is the most plausible route to earn higher margins and to grow fast.
The ICT industry in Slavonia is heavily concentrated in Osijek. Osijek is a relatively major hub for those ICT firms in Croatia, after Zagreb, Split, and Rijeka. Within Slavonia, Osijek accounts for 60 percent of EBITDA in the ICT industry, while Vukovar, Slavonski Brod and Pozega account for 12 percent, 8 percent, and 5 percent37. Other locations in Slavonia exhibit an almost negligible concentration of firms.
Export revenues and growth are already substantial, but will become fragile unless specialized niches are found. Sales revenues in Slavonia’s ICT industry have grown by 61 percent in three years from 2014 to 2017, and 44 percent of sales are from exports38. Some firms have managed to earn 100% of their revenues from sales outside Croatia. However, these fast rates of growth are likely to become increasingly fragile as the costs of production (especially labor costs) rise, making it more difficult to compete effectively with ICT hubs in the region (e.g. Cluj-Napoca) and globally.
Examining data on companies in the ICT sector in Slavonia (see Figure 16):
• Almost all activity is in computer programming and consultancy (code 62);
• These activities have been growing very fast: they have almost doubled sales revenue and jobs in the last four years (see Figure 16).
Figure 16: ICT has been growing fast in computer programming and consultancy
SOURCE: World Bank Group analysis of FINA data.
Subsectors in the ICT industry
26.2 Manufacture of computers and peripheral equipment 46.51 Wholesale of computers, computer peripheral equipment and software 47.41 Retail sale of computers, peripheral units and software in specialized stores 62.01 Computer programming activities 62.02 Computer consultancy activities 62.03 Computer facilities management activities 62.09 Other information technology and computer service activities 63.11 Data processing, hosting and related activities
37 According to FINA data, 2017. 38 World Bank analysis of FINA data.
-
50
100
150
200
250
300
26 46 47 62 63Sale
s R
even
ue
(HR
K m
illio
ns)
2014 2015 2016 2017
0
0.2
0.4
0.6
0.8
1
1.2
26 46 47 62 63
Emp
loye
es (
tho
usa
nd
s)
2014 2015 2016 2017

36
Global trends
Strong growth globally will not be reflected equally in all market segments and all regions. The ICT sector is witnessing strong growth on a global scale: sales revenues are expected to grow from US$3.98 trillion in 2016 to US$4.46 trillion in 2019. Within this trend, some segments of the industry are expected to grow faster than others:
• Digital platforms (or Multi-Sided Platforms, MSPs) are among the drivers of this accelerated growth. On a global scale, North American and Chinese digital platforms are growing at a faster pace than MSPs in the rest of the world, with Europe and emerging regions lagging behind. A large amount of sector growth is concentrated in the internet giants (Google, Amazon, Facebook and Apple, plus the Chinese giants Alibaba and Tencent), and, crucially, their vast ecosystem of partners. The platform model is also affecting digitalisation of key sectors of the economy, including deep transformation of oil and gas, and manufacturing, creating high value ecosystems of digitally enabled firms around the reorganisation of large enterprises.
• Software and software services are also growing at a fast pace, with high value niches, such as Artificial Intelligence, big data analytics, capturing both high sector value added, and high growth. Countries and regions that are well positioned to develop skills to match the global demand in emerging software and software services, are able to enjoy high growth.
• The BPO/ITO/KPO segment is also being transformed by technology, with the BPO demand being largely stagnant, while the ITO/KPO segments are growing at a fast pace.
• Telecommunications growth is being driven by data, and by the investments in fiber optic networks, and future infrastructure trends, including Internet of Things, 5G Network, and cloud infrastructure. “
Growth opportunities in Slavonia
Firms can find higher value export opportunities in two main ways: specialized subsectors (including hybridization with other industries), and/or higher value activities (specialization in some tasks). Examples of these are as follows:
• Specialized subsectors could include emerging niches such as 5G technologies; use of big data; internet of things; cybersecurity; or any other specialized area where a competitive advantage can be found. Some firms have already managed to move into these higher value segments, such as Inchoo39, which specialized in eCommerce and offers a full suite of integrated services. More of Slavonia’s ICT companies (or new start-ups) will need to follow this lead, to move from generic services towards specialized software development.
Hybridization with other industries is also a way for companies to develop a competitive niche. Two examples of this approach are Farmeron and Agrivi, which both achieved notable successes through developing ICT solutions for widespread industry needs in agriculture. Hybridization can be a win-win for ICT firms and the partner industries, if the solutions contribute to increased efficiencies. For example: ‘digital agriculture’ approaches can inform the planting and harvesting cycles by adjusting them more precisely to weather patterns and soil reactions, using a system of sensors and software. Other opportunities for hybridization could be found in the wood industries, metalworking, tourism, or other industries. An admirable example is shown by FERIT’s recent launch of a graduate study program in Automotive Computing and Communications40.
39 https://inchoo.net/ 40 http://autocom.ferit.hr/
37
• Integrated services, not subcontracted freelancers. Osijek includes a substantial community of freelancing software engineers, who work as subcontractors for larger companies, often internationally. They can be found via websites such as Toptal.com41. The quality of these freelancers is generally regarded to be competitive. But to reach the ‘next level’ of industry development, the ICT industry would need to focus on developing whole products, not just contributing part of a product. That is because the developers and providers of integrated services are able to carve out a competitive niche and therefore capture more value (rather than competing with thousands of other subcontracted software engineers around the world). Some software firms have already been able to reach this ‘next level’ (e.g. Mono, Inchoo, and others). But they are relatively in the minority, and more Slavonian firms will need to follow this pathway, by innovating and establishing their own niche products.
2.4. Tourism
In Tourism, there are opportunities to raise value-added in Slavonia by enhancing its image, branding and tourism ‘offer’—including in niche markets such as rural tourism, gastronomy, cycle tourism and others.
Currently there are a number of tourism ‘products’ in Slavonia. For example: Culinary tourism (Slavonia’s specific foods and dishes such as kulen and čobanac, and its many wines); Cultural heritage (especially Slavonia’s several fortresses, its churches, and its war heritage, UNESCO intangible cultural heritage: Ljelje and Bećarac; UNESCO geo park Papuk, sanctuary, archaeological site Vučedol); Cycle tourism (several hundred kilometres of cycle trails and a relatively flat landscape); Health tourism (focused on spas such as Lenije, or Bizovac, Sanatorium Lipik); and Agritourism (vineyards open for winetasting and visiting; and some farms which accommodate visitors). Much of the current demand is driven by business travel and special events including those related to sports.
But these products are not yet sufficiently attractive on their own to draw larger numbers of tourists to Slavonia. The products are relatively isolated from each other, and are not exploited as a package of attractions which together can attract greater numbers of tourists. Substantial numbers of international tourists will not travel to Slavonia especially for small attractions marketed separately.
Examining data on the Tourism sector in Slavonia (see Figure 17):
• Data classifications make it difficult to determine which subsectors reflect genuine ‘tourism’ activities, rather than transport and hospitality services for other economic sectors. Economic data on transport and hospitality subsectors does not make a distinction between leisure and business uses;
• Jobs growth in tourism has been driven most by hospitality services (hotels and restaurants; code 56) rather than transport (code 49);
• Revenues and jobs generated by travel and tour agencies (code 79) is small (less than 50 million HRK).
41 https://www.toptal.com/ is a website that allows contractors of various services (software developers, designers, project managers, etc) to search and find freelancers. It has a global coverage.

38
Figure 17: Tourism & Transport growth is driven by hospitality services
SOURCE: World Bank Group analysis of FINA data.
Subsectors in the Tourism & Transport industry
49.1 Passenger rail transport, interurban 77.11 Renting and leasing of cars and light motor vehicles
49.32 Taxi operation 77.12 Renting and leasing of trucks
49.39 Other passenger land transport n.e.c. 77.21 Renting and leasing of recreational and sports goods
50.1 Sea and coastal passenger water transport 79.11 Travel agency activities
50.3 Inland passenger water transport 79.12 Tour operator activities
51.1 Passenger air transport 79.9 Other reservation service and related activities
55.1 Hotels and similar accommodation 90.01 Performing arts
55.2 Holiday and other short-stay accommodation 90.02 Support activities to performing arts
55.3 Camping grounds, recreational vehicle parks and trailer parks
90.03 Artistic creation
55.9 Other accommodation 90.04 Operation of arts facilities
56.1 Restaurants and mobile food service activities 91.02 Museums activities
56.29 Other food service activities 91.03 Operation of historical sites and buildings and similar visitor attractions
56.3 Beverage serving activities 91.04 Botanical and zoological gardens and nature reserves activities
68.1 Buying and selling of own real estate 92 Gambling and betting activities
68.2 Renting and operating of own leased real estate 93.11 Operation of sports facilities
68.31 Real estate agencies 93.13 Fitness facilities
68.32 Management of real estate on a fee or contract basis 93.21 Activities of amusement parks and theme parks
93.29 Other amusement and recreation activities
Global trends
Global tourism demand, the number of international tourist arrivals (overnight visitors), increased by 6 percent to 1.4 billion in 2018. This was well above the 3.7 percent growth registered in the global economy. Growth in Europe was driven by Southern and Mediterranean Europe (7 percent growth) which includes Croatia. Worldwide demand is expected to continue to increase by an annual 3-4 percent over the next five years. The share of people in the global population over 60 years of age is expected to nearly double over the next 35 years making this an important target market.
-
100
200
300
400
500
600
49 50 51 55 56 68 77 79 90 92 93
Sale
s R
even
ue
(HR
K m
illio
ns)
2014 2015 2016 2017
0
0.5
1
1.5
2
2.5
3
49 50 51 55 56 68 77 79 90 92 93
Emp
loye
es (
tho
usa
nd
s)
2014 2015 2016 2017
39
Demand trends for the future can be themed around the following megatrends:
• the pursuit of healthy options (walking, wellness, self-care, organic and slow food, destressing and sports tourism);
• local and authentic experiences (especially activities around cooking as well as created around agricultural products such as wine and olives);
• interactive cultural experiences (connecting with local culture and people);
• new disruptive technologies (increased usage of new technologies including peer-to-peer digital platforms as well as user-generated data and mobile apps).
Issues surrounding ‘overtourism’ are expected to see travelers rethink old favorites as well as discover new destinations. The tourism sector in Slavonia should capitalize on these trends by highlighting and packaging high quality tourism offerings around their rich gastronomy, landscape and rural traditions.
Growth opportunities in Slavonia
The challenge for Tourism in Slavonia is to package its tourism products and target the most realistic markets. Clearly Slavonia will not compete for the same tourism market as coastal resorts: it will not be the next singles destination after Zrće, nor will it be the next summer island destination after Hvar. Slavonia will need to find its own niches, and determine the needs of those specific markets.
These niches could include the following (based on consultations in Slavonia, but requiring further discussion with the Croatian National Tourist Board and others):
• Authentic lifestyle, slow pace living and hospitality. These qualities of the Slavonian identity could help unify the various tourism ‘products’ with the idea of a ‘stress-free destination’ and wide open spaces in Slavonia. These themes could help combine several similar attractions—for example, the cultural heritage and fortresses of Osijek, Vukovar and Dakovo as a package—but ideally they would combine several complementary types of attractions into a compelling package (e.g. “cycle in the morning; eat a delicious lunch; and visit two fortresses in the afternoon”).
• Innovative products. There is a need for tourism products in Slavonia to become more innovative, to increase their value proposition and become more distinctive compared to other similar destinations in Europe. This objective can partly be achieved by exploiting the synergies between various isolated products, but it will also require some innovation within each attraction—how can cycle tourism in Slavonia be more attractive than similar destinations in Europe?
• Stronger proposition for domestic and regional tourists. Most of Slavonia’s recent tourism growth has been in domestic tourism, and it is possible this could be expanded through regional tourists (for example: from Hungary). This may be a more realistic short-term aim than international tourists, considering the sparsity of direct flights from Osijek airport.
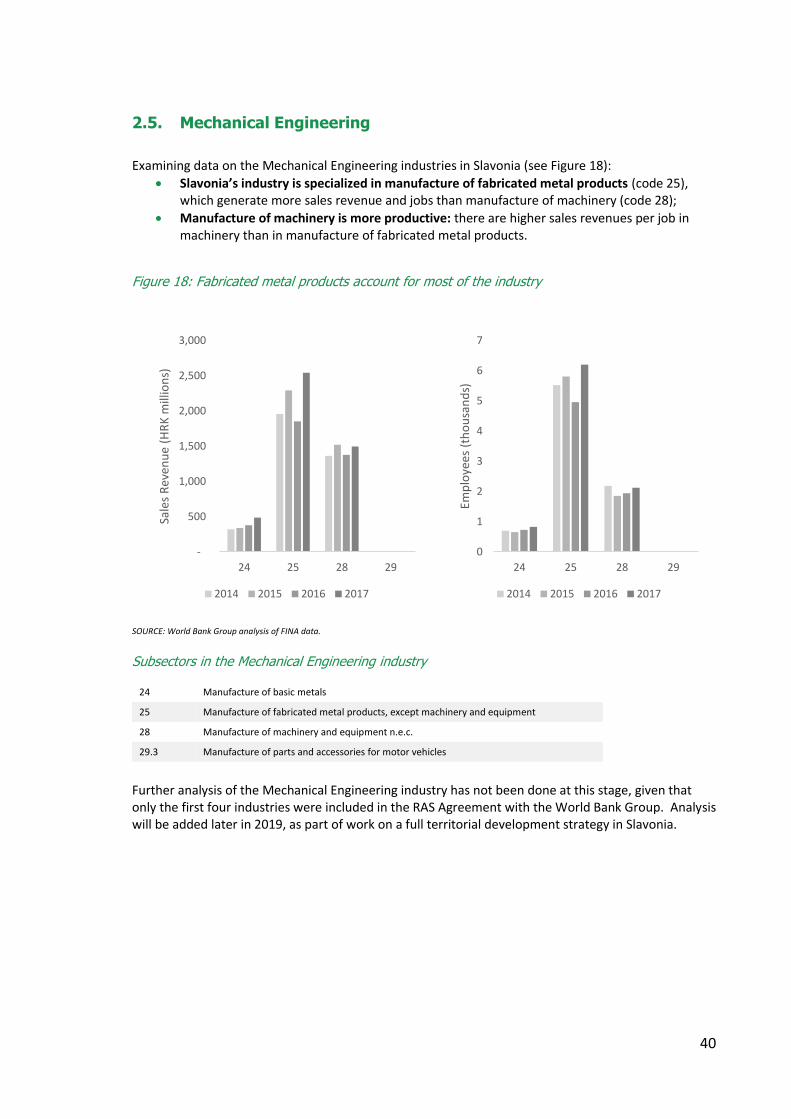
40
2.5. Mechanical Engineering
Examining data on the Mechanical Engineering industries in Slavonia (see Figure 18):
• Slavonia’s industry is specialized in manufacture of fabricated metal products (code 25), which generate more sales revenue and jobs than manufacture of machinery (code 28);
• Manufacture of machinery is more productive: there are higher sales revenues per job in machinery than in manufacture of fabricated metal products.
Figure 18: Fabricated metal products account for most of the industry
SOURCE: World Bank Group analysis of FINA data.
Subsectors in the Mechanical Engineering industry
24 Manufacture of basic metals
25 Manufacture of fabricated metal products, except machinery and equipment
28 Manufacture of machinery and equipment n.e.c.
29.3 Manufacture of parts and accessories for motor vehicles
Further analysis of the Mechanical Engineering industry has not been done at this stage, given that only the first four industries were included in the RAS Agreement with the World Bank Group. Analysis will be added later in 2019, as part of work on a full territorial development strategy in Slavonia.
-
500
1,000
1,500
2,000
2,500
3,000
24 25 28 29
Sale
s R
even
ue
(HR
K m
illio
ns)
2014 2015 2016 2017
0
1
2
3
4
5
6
7
24 25 28 29
Emp
loye
es (
tho
usa
nd
s)
2014 2015 2016 2017
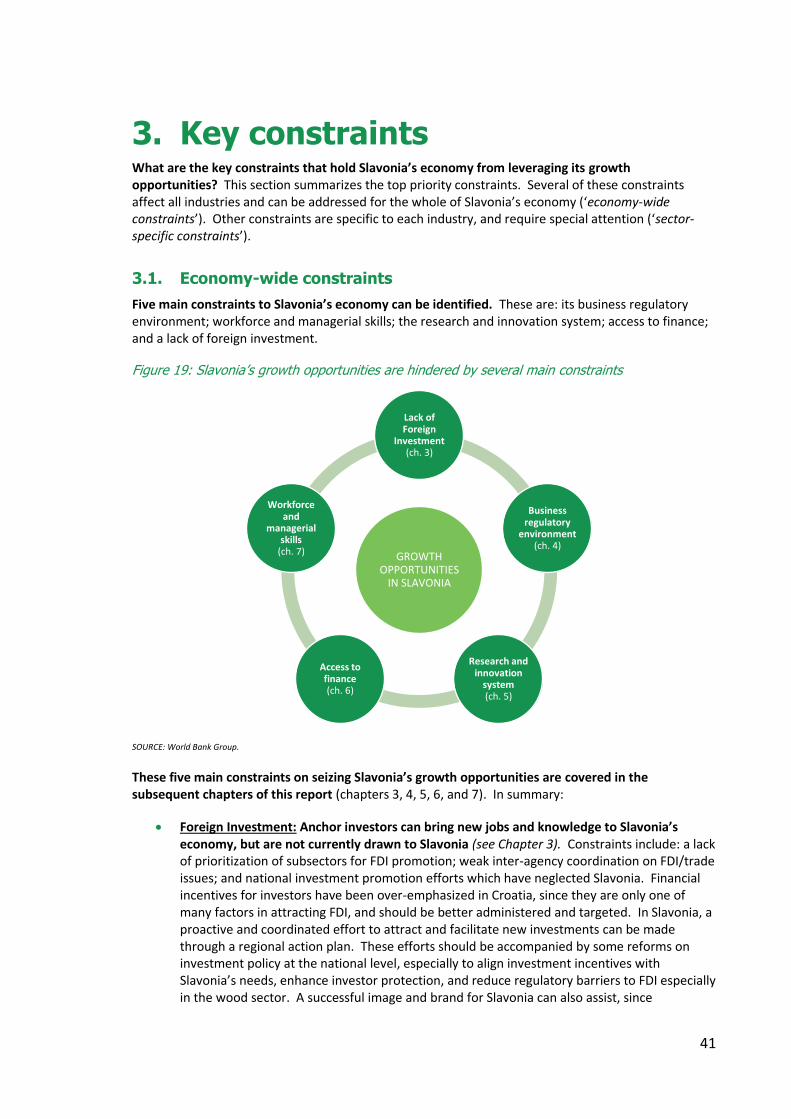
41
3. Key constraints What are the key constraints that hold Slavonia’s economy from leveraging its growth opportunities? This section summarizes the top priority constraints. Several of these constraints affect all industries and can be addressed for the whole of Slavonia’s economy (‘economy-wide constraints’). Other constraints are specific to each industry, and require special attention (‘sector-specific constraints’).
3.1. Economy-wide constraints
Five main constraints to Slavonia’s economy can be identified. These are: its business regulatory environment; workforce and managerial skills; the research and innovation system; access to finance; and a lack of foreign investment.
Figure 19: Slavonia’s growth opportunities are hindered by several main constraints
SOURCE: World Bank Group.
These five main constraints on seizing Slavonia’s growth opportunities are covered in the subsequent chapters of this report (chapters 3, 4, 5, 6, and 7). In summary:
• Foreign Investment: Anchor investors can bring new jobs and knowledge to Slavonia’s economy, but are not currently drawn to Slavonia (see Chapter 3). Constraints include: a lack of prioritization of subsectors for FDI promotion; weak inter-agency coordination on FDI/trade issues; and national investment promotion efforts which have neglected Slavonia. Financial incentives for investors have been over-emphasized in Croatia, since they are only one of many factors in attracting FDI, and should be better administered and targeted. In Slavonia, a proactive and coordinated effort to attract and facilitate new investments can be made through a regional action plan. These efforts should be accompanied by some reforms on investment policy at the national level, especially to align investment incentives with Slavonia’s needs, enhance investor protection, and reduce regulatory barriers to FDI especially in the wood sector. A successful image and brand for Slavonia can also assist, since
GROWTH OPPORTUNITIES
IN SLAVONIA
Lack of Foreign
Investment(ch. 3)
Business regulatory
environment(ch. 4)
Research and innovation
system(ch. 5)
Access to finance(ch. 6)
Workforce and
managerial skills
(ch. 7)

42
perceptions of Slavonia still focus on the war legacy, and this is unlikely to be an attractive draw for new investors.
• Business environment. Businesses already operating in Slavonia face a number of constraints that absorb time and increase their costs (see Chapter 4). Most of these constraints are the responsibilities of central authorities rather than local administrations, and thus require attention at the national level. The costs of these constraints are felt more in Slavonia than in some other parts of Croatia since business are already contending with emigration of human capital, lack of business dynamism, and low profit margins. The situation can be improved through reform to several regulatory requirements on businesses, including: the application process for construction permits; legal requirements for starting and operating a business; the inspections regime (which can be reshaped towards a risk-based deployment of inspectors, focusing on compliance); the system of parafiscal charges; and some sector-specific constraints especially the wood quota system and regulatory obstacles in the ICT industry. Many of these constraints are already well-known in Croatia and are on the government reform radar already; but implementation has been slow, and these constraints continue to impinge on the competitiveness of Slavonian companies. Faster changes are needed.
• Innovation system. Slavonia’s innovation system is holding back the region’s convergence with the rest of Croatia (see Chapter 5). There has been low private investment in R&D, low scientific productivity in public research organizations (PROs), and a lack of collaboration between industry and science. Innovation support infrastructure exists, but often does not provide sufficient business support and complementary services that can improve its impact on Slavonia’s industries. Management of the innovation infrastructure is sometimes also deficient. New innovation support schemes should be tailored to needs, including new product development and the various stages of the innovation cycle—which has not been the case so far.
• Access to financing, through commercial banks or SME support instruments (see Chapter 6). SMEs in Slavonia are characterized by low productivity, exports and profitability, but are also underserved by financial institutions. The financial sector has tended to be risk averse after the financial crisis, and has channelled credit more towards large companies. There is a lack of incentives and capacity to explore new and innovative approaches to finance. As such, there are constraints on the demand-side and supply-side for access to finance. Less than a third of SMEs have used EU funds, and many micro firms and SMEs, especially in the agricultural sector, lack understanding of financial products and their potential benefits. The use of financial instruments (guarantees and loans) via HAMAG-BICRO and HBOR could be increased in Slavonia.
• Jobs, skills, and inclusion (see Chapter 7). Workers in Slavonia face a wage gap, where wages in Slavonia are 25 to 30 percent lower in ICT, transportation, manufacturing, and wholesale and retail sectors. This helps explain the fast emigration from Slavonia to other parts of Croatia and the EU. Companies can incentivize workers to stay in Slavonia by increasing the value-added of their products and thereby being able to pay higher wages. This requires improvements in managerial skills, new investment, innovation, improvements to the business environment, and the other measures outlined in preceding chapters. Meanwhile on the supply side, Slavonia’s education system is underperforming at almost every level, from early childhood education through secondary education—creating a relatively poor pipeline of skills for employers. The relevance of Technical and Vocational Education and Training (TVET) can be increased; active labor market programs (ALMPs) can be shifted further towards training and away from public works programs; and the interactions between university faculty, students and local industries can be improved. Finally, the quota allocations for work

43
permits can be aligned more accurately with strategic priorities (e.g. ICT quota is currently very low), alongside a streamlined and online work permit application process.
3.2. Sector-specific constraints
Several sector-specific constraints affect the four target industries. (Mechanical Engineering has not been included at this stage, but can be added subsequently if desired). Main constraints are as follows:
3.2.1. Agri-Food
In the Agri-Food industry, opportunities are constrained by low farm-level productivity, a lack of investment in off-farm infrastructure, and the absence of collaborative initiatives that can help farmers enter lucrative markets.
Main constraints in Slavonia’s agri-food industry are as follows:
• Farm-level productivity. Despite Slavonia’s endowments with some of Europe’s best soils and access to water, and its relatively low labor costs, agricultural productivity is 30 percent lower than EU-15 averages. There appear to be several reasons for this low productivity:
→ Lack of irrigation. Slavonia’s irrigation infrastructure has nearly been depleted, and the region now has one of the lowest ratios of irrigated to irrigable land in Europe. This is a constraint to producing a predictable supply of perishable crops, and a constraint to mitigating the impact of climate change.
→ Suboptimal farming practices and technology. Enhanced knowledge on farming practices (e.g. optimal use of fertilizer, pesticides, tilling, etc.) can unleash significant increases in agricultural output due to higher labour and land productivity. A weak and fragmented agricultural knowledge and innovation system (AKIS) is failing to support farmers with modernization and the provision of knowledge in both management and farming. Agricultural productivity can also be increased through ‘digital agriculture’—i.e. the use of technology to optimize farming practices, according to weather, climate, crop and animal performance, and other factors42.
• Lack of investment in off-farm infrastructure, especially for cold chains. Slavonia lacks facilities for processing of agricultural products, cold storage and modern post-harvest management. As a consequence, farmers in Slavonia (except the largest companies) face impossible upfront expenses to enter higher-value segments, since they cannot afford to invest in post-harvest infrastructure on their own: it is too expensive. Some of these constraints may be overcome through forming small and medium scale farms into producer organizations that can make a coordinated effort to invest; or through making available the post-harvest infrastructure owned by large companies such as Agrokor and its subsidiaries.
• Fostering commercial partnerships. Most farmers are relatively small and isolated, and have not succeeded in working together to reach sufficient scale to be attractive for large buyers. Smallholders have achieved only very limited linkages to market unless they work together.
42 Currently there is little or no public support for innovators to develop digital agricultural services, and no incentives to farmers to adopt digital agricultural technologies, though under submeasure 4.1. of the RDP, digital technology is eligible expense (for example GIS technology, RTK systems, drones, software for data analysis, etc).
44
Currently, less than 8 percent of Slavonia’s agricultural producers are part of organized structures, as opposed to the EU average of 34 percent. Farmers in Slavonia are very cautious about collaborative initiatives (as an extreme example: one farmer said “I would rather share my wife than share my tractor”), but there is likely no other way that small farmers can hope to enter high-value markets than to collaborate for joint supply, and in negotiations with buyers. Changing this situation would require: (i) increased awareness amongst farmers of the benefits of cooperative structures; (ii) government vision and support for collaborative initiatives in agriculture; and (iii) knowledge provided to farmers about how to set-up and run such structures effectively. Some successful cases do already exist in Slavonia, such as the Vinkovci asparagus cooperative, which exports 45 percent of its production, and the Simentalac cattle cooperative. Those efforts can take place within a broader commercialization strategy, which would improve branding, quality schemes, and certification.
Chapter 2 of this report focuses on Slavonia’s agri-food industry in more detail—including opportunities and constraints.
3.2.2. Wood
The Wood industry is constrained by a distortive national subsidy and quota system for wood production, and meanwhile faces a shortage of specialized skills and entrepreneurial knowledge to enter higher value products and markets.
Main constraints in Slavonia’s wood industry are as follows:
• Quota system. In all discussions about the Wood industry in Croatia, the quota system for roundwood supply is the ‘elephant in the room’. The quota system has distorted, and continues to distort, the activities of companies in the wood industry, and it discourages new entrants43. It prevents development in the wood cluster, whether from domestic or foreign investment. For example, in the words of two members of Croatia’s wood processing industry in Slavonia:
“We would hire more people if the quota system was not in place. We would…invest in machinery and technical expertise, however there is not guarantee that we will receive more raw material if we invested more. Our only incentive in the current system is to survive, not expand.” —sawmill operator, interviewed in October 2018.
“It is very difficult to invest in the sector without being politically connected. Every year since 2011 we receive fewer raw materials. We have the equipment and staff to produce high-end products but the high-end product would require that we have more quantity to process in order to make profit. We decided to produce lower-end product in order to survive” —wood processing company staff, interviewed in October 2018.
The quota system has admirable objectives for developing Croatia’s wood industry around higher value activities, but it has failed to deliver on its policy objectives and has ended up sustaining uncompetitive companies. The quota system is sustained by decisionmakers in Croatia because it is intended to protect jobs, by supplying raw material at low prices and thereby helping companies compete internationally. But many companies are still operating in low
43 In brief, the quota system means that wood as a raw material (roundwood) is allocated to companies by quota, not according to market price. The quota allocation system is flawed: it is perceived that better-connected firms have better access to roundwood, and have more flexibility with rules. Incumbent firms are favoured over newcomers, so new investors face considerable barriers to entry. The system also favors integrating manufacturing into a single firm (e.g. sawmilling and furniture making together), rather than firms specializing in their niche technologies and markets. Even the well-known examples of a Swedish inward investor was actually a brownfield investment in an existing firm, to leverage their existing quota allocation. The quota system applies only to the wood supplied by Hrvatske Šume, but Hrvatske Šume accounts for more than 80 percent of all Croatia’s forestry, so is the dominant player almost to the point of being a monopolist. (Approximately 2.6 million hectares of land in Croatia are forested, of which 500,000 hectares are privately owned by a fragmented set of nearly 600,000 proprietors, and the remaining 2.1 million hectares are state owned, of which 80-90 percent is designated for commercial purposes with control given to Hrvatske Šume).
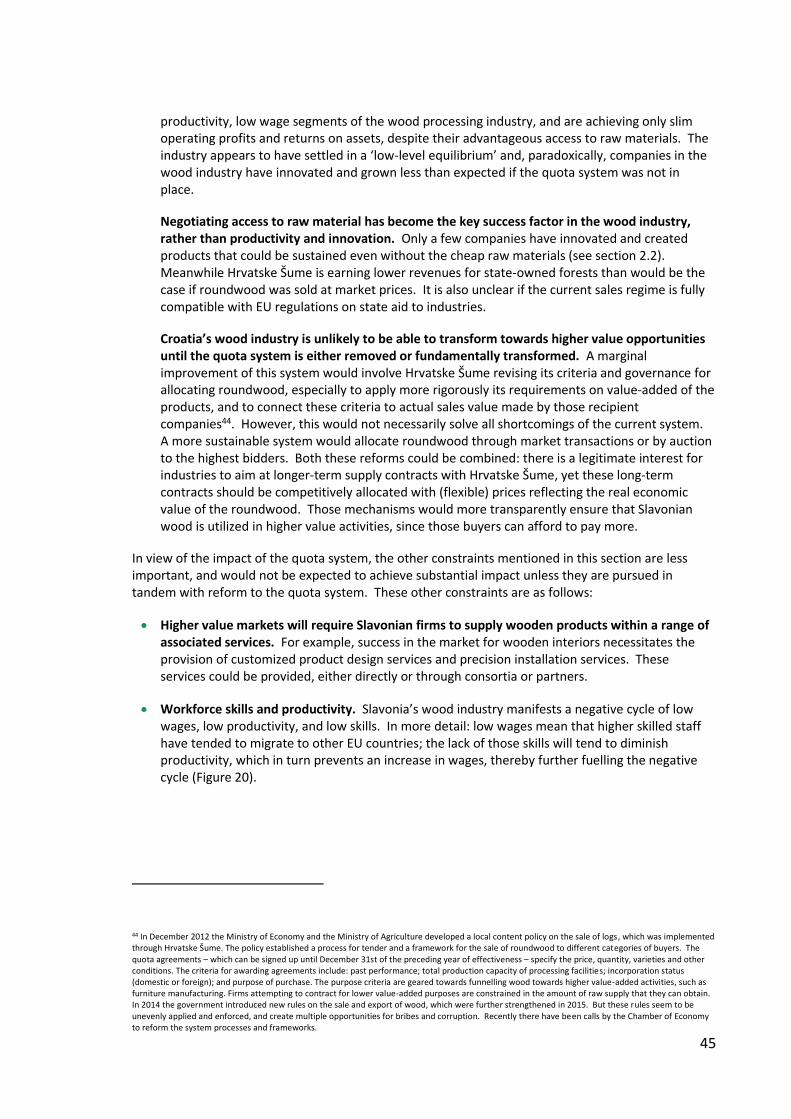
45
productivity, low wage segments of the wood processing industry, and are achieving only slim operating profits and returns on assets, despite their advantageous access to raw materials. The industry appears to have settled in a ‘low-level equilibrium’ and, paradoxically, companies in the wood industry have innovated and grown less than expected if the quota system was not in place.
Negotiating access to raw material has become the key success factor in the wood industry, rather than productivity and innovation. Only a few companies have innovated and created products that could be sustained even without the cheap raw materials (see section 2.2). Meanwhile Hrvatske Šume is earning lower revenues for state-owned forests than would be the case if roundwood was sold at market prices. It is also unclear if the current sales regime is fully compatible with EU regulations on state aid to industries.
Croatia’s wood industry is unlikely to be able to transform towards higher value opportunities until the quota system is either removed or fundamentally transformed. A marginal improvement of this system would involve Hrvatske Šume revising its criteria and governance for allocating roundwood, especially to apply more rigorously its requirements on value-added of the products, and to connect these criteria to actual sales value made by those recipient companies44. However, this would not necessarily solve all shortcomings of the current system. A more sustainable system would allocate roundwood through market transactions or by auction to the highest bidders. Both these reforms could be combined: there is a legitimate interest for industries to aim at longer-term supply contracts with Hrvatske Šume, yet these long-term contracts should be competitively allocated with (flexible) prices reflecting the real economic value of the roundwood. Those mechanisms would more transparently ensure that Slavonian wood is utilized in higher value activities, since those buyers can afford to pay more.
In view of the impact of the quota system, the other constraints mentioned in this section are less important, and would not be expected to achieve substantial impact unless they are pursued in tandem with reform to the quota system. These other constraints are as follows:
• Higher value markets will require Slavonian firms to supply wooden products within a range of associated services. For example, success in the market for wooden interiors necessitates the provision of customized product design services and precision installation services. These services could be provided, either directly or through consortia or partners.
• Workforce skills and productivity. Slavonia’s wood industry manifests a negative cycle of low wages, low productivity, and low skills. In more detail: low wages mean that higher skilled staff have tended to migrate to other EU countries; the lack of those skills will tend to diminish productivity, which in turn prevents an increase in wages, thereby further fuelling the negative cycle (Figure 20).
44 In December 2012 the Ministry of Economy and the Ministry of Agriculture developed a local content policy on the sale of logs, which was implemented through Hrvatske Šume. The policy established a process for tender and a framework for the sale of roundwood to different categories of buyers. The quota agreements – which can be signed up until December 31st of the preceding year of effectiveness – specify the price, quantity, varieties and other conditions. The criteria for awarding agreements include: past performance; total production capacity of processing facilities; incorporation status (domestic or foreign); and purpose of purchase. The purpose criteria are geared towards funnelling wood towards higher value-added activities, such as furniture manufacturing. Firms attempting to contract for lower value-added purposes are constrained in the amount of raw supply that they can obtain. In 2014 the government introduced new rules on the sale and export of wood, which were further strengthened in 2015. But these rules seem to be unevenly applied and enforced, and create multiple opportunities for bribes and corruption. Recently there have been calls by the Chamber of Economy to reform the system processes and frameworks.
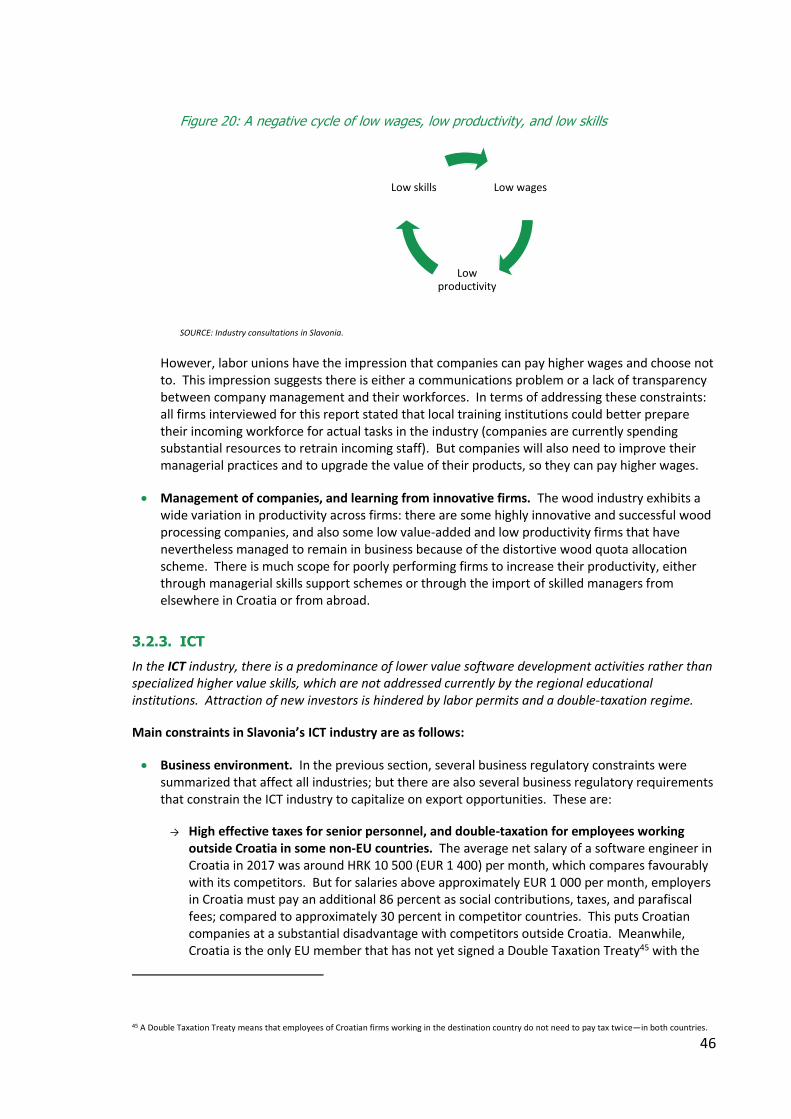
46
Figure 20: A negative cycle of low wages, low productivity, and low skills
SOURCE: Industry consultations in Slavonia.
However, labor unions have the impression that companies can pay higher wages and choose not to. This impression suggests there is either a communications problem or a lack of transparency between company management and their workforces. In terms of addressing these constraints: all firms interviewed for this report stated that local training institutions could better prepare their incoming workforce for actual tasks in the industry (companies are currently spending substantial resources to retrain incoming staff). But companies will also need to improve their managerial practices and to upgrade the value of their products, so they can pay higher wages.
• Management of companies, and learning from innovative firms. The wood industry exhibits a wide variation in productivity across firms: there are some highly innovative and successful wood processing companies, and also some low value-added and low productivity firms that have nevertheless managed to remain in business because of the distortive wood quota allocation scheme. There is much scope for poorly performing firms to increase their productivity, either through managerial skills support schemes or through the import of skilled managers from elsewhere in Croatia or from abroad.
3.2.3. ICT
In the ICT industry, there is a predominance of lower value software development activities rather than specialized higher value skills, which are not addressed currently by the regional educational institutions. Attraction of new investors is hindered by labor permits and a double-taxation regime.
Main constraints in Slavonia’s ICT industry are as follows:
• Business environment. In the previous section, several business regulatory constraints were summarized that affect all industries; but there are also several business regulatory requirements that constrain the ICT industry to capitalize on export opportunities. These are:
→ High effective taxes for senior personnel, and double-taxation for employees working outside Croatia in some non-EU countries. The average net salary of a software engineer in Croatia in 2017 was around HRK 10 500 (EUR 1 400) per month, which compares favourably with its competitors. But for salaries above approximately EUR 1 000 per month, employers in Croatia must pay an additional 86 percent as social contributions, taxes, and parafiscal fees; compared to approximately 30 percent in competitor countries. This puts Croatian companies at a substantial disadvantage with competitors outside Croatia. Meanwhile, Croatia is the only EU member that has not yet signed a Double Taxation Treaty45 with the
45 A Double Taxation Treaty means that employees of Croatian firms working in the destination country do not need to pay tax twice—in both countries.
Low wages
Low productivity
Low skills

47
United States, and has not signed a Treaty with China, Brazil, Saudi Arabia, Singapore, and other important markets. This puts Croatian companies at a competitive disadvantage compared with competitors from countries that have signed such treaties;
→ Home-based work is not recognized by regulations, which require home-based offices to have fire exits, approved lighting, and to post opening and closing times;
→ Tax regulations do not recognize invoices issued by Apple and Google app store as legal documents. This encourages Croatian vendors to register their operations in other EU countries such as Ireland instead of Croatia, to get around regulatory constraints. More information is contained in the business environment chapter;
• Technology infrastructure. The IT Campus proposed by local stakeholders would increase knowledge spillovers between firms and reduce some costs. Currently there are insufficient workspaces for ICT companies in Osijek. Additionally, Croatia’s broadband infrastructure is slower than EU competitors such as Romania (Romania is 5th fastest in the EU, while Croatia is 26th)46. Stakeholders would appreciate to know more about HAKOM’s telecoms strategy for Croatia and how to make its processes more efficient—for example, the processes to add new connections to fiber networks, which according to local companies are subject to lengthy bureaucratic processes and some hazards of corruption.
• Skills. The pipeline of skills is not yet sufficient to be attractive for new investors. For comparison: Cluj-Napoca in Romania produces 1 000 ICT graduates from its universities each year, while Osijek produces only 40 computer science graduates plus 180 from related disciplines in STEM47 subjects. The skills pipeline in Slavonia could be increased and made more relevant to industry in three ways:
→ University. For cutting edge-skills (e.g. blockchain, AI, big data, robotics), university courses will need to build a pipeline of graduates that can enter these emerging niches. Curricula can be developed together with companies, as has been done with the new automotive course at the University of Osijek, which is a joint effort with AVL, AST, GlobalLogic, Institut RT-RK, Rimac Automobili, Xylon, and Yazaki48. More work would be needed to understand why this is not already happening more widely. Some local stakeholders mention that the university could introduce better rewards for lecturers to collaborate with industry (rather than reward only based on academic citations). There may also be scope for the Ministry of Science and Education to permit greater flexibility amongst universities to innovate in their curricula.
→ Coding schools. Private coding schools (such as Algebra in Zagreb) can play a role on developing standardized, certified skills (e.g. Java, Cisco, Oracle). More work would be needed to understand why such schools have not already opened in Slavonia.
→ Work permits. Some specialized ICT developer skills, and perhaps also managerial skills, may not be readily available in Croatia. Temporary workers may also be required if companies wish to scale-up their businesses before a pipeline of qualified Croatian workers is available. Yet the quota of work permits available for non-EU/EEA workers for the ICT industry is only 180 for the whole of Croatia in 2019 (a decrease from 300 in 2018). The size
46 Average connection speed (IPv4), Akamai, accessed February 2018. 47 STEM is an abbreviation for Science, Technology, Engineering, and Mathematics. 48 http://autocom.ferit.hr/

48
of the quota is not the only problem: the process for application can also be cumbersome and is not available online.
• Anchor investors can help establish a more specialized labor pool, and raise the profile of Slavonia as an ICT hub. Ericsson Nikola Tesla’s investment in Osijek is a good step in this process. Specialized subsectors such as 5G, cybersecurity, IoT, etc would be most desirable, since they will allow Slavonia to reduce the extent to which other ICT hubs can substitute for it. There are some short-term risks for existing ICT firms, such as the increased competition for labor and the bidding-up of wages; but in the longer term an increased mass of the ICT industry in Slavonia will be a benefit to all stakeholders—through increased visibility, reputation, specialized labor pool, and knowledge spillovers between companies.
• Linkages with high growth nodes in the ICT industry. Companies in Slavonia can benefit from deepening their ties with established ICT hubs, such as London, Berlin, Tallinn, Cluj-Napoca, Kaliningrad, Tel Aviv, or even in the USA. The objective of these ties would be to exploit comparative advantages where Slavonian companies can provide some activities in a value chain more cost-effectively than the incumbents in those hubs. In doing so, over time, Slavonian companies would further upgrade their value proposition.
3.2.4. Tourism
In the Tourism industry, operators are not fully clear on the products and services demanded by targeted markets, and have not developed a coherent set of niche tourism ‘products’ that can appeal to those markets. The industry is further constrained by tourism promotion that is fragmented between too many local and county tourism boards, and is not backed up by a coherent branding of the region at national and international levels.
Main constraints in Slavonia’s tourism industry are as follows:
• Image and the brand of the region. Slavonia suffers from a poor image as a neglected region of Croatia, still affected by its war legacy. There is insufficient awareness in the domestic market of the available tourism products, and very limited marketing in foreign markets. The low volume of visitors impacts the profitability of enterprises in the sector. Some entrepreneurs are actively promoting their business on social media platforms as well as offering their products on distribution channels such as Booking.com and Expedia. However, their efforts need to be supported by domestic and international promotion of the region as a destination. The CNTB concurs with this view, and has recently signed an agreement with the five county tourism boards in Slavonia to prepare a Strategic Marking Plan, along with some follow-up activities. This approach will likely be of great benefit, as long as it is accompanied with funding for implementation of actions envisaged in the plan.
• Clear understanding of market niches and requirements, and a package of attractive tourism products. As mentioned in the section on export opportunities, Slavonia’s tourism sector will need to combine its tourism products into a compelling package. Packaging several tourism products into a 3-, 4- or 5-day itinerary will allow tourism operators to convince more visitors to make a long journey to reach Slavonia. Those packages must cater to specific market niches, which carry specific needs and requirements. Many operators in Slavonia are not yet clear on those market needs and requirements, and have not managed to collaborate with each other to package coherently a set of tourism products. An industry support initiative (perhaps provided via the Ministry of Tourism) can assist in segmenting opportunities more precisely, and to clarify where the industry is strong and where it needs to improve.
49
• Institutional cooperation and coordination. Slavonia’s institutional support for tourism is channelled through multiple county-level tourism boards, plus many local tourism boards49. This situation constitutes a fragmentation of public resources and negatively impacts the effectiveness of the work of tourism boards. In addition, there is often a lack of communication and coordination between public and private sector stakeholders50. Some reforms are now underway in this area at national level: the current system of 310 tourism boards nationally will be reformed with a destination management approach and the merging of smaller tourism boards; and a lower percentage of tourism-related taxes will now go to the national tourism board, with more to the county and local level, plus special funds for counties that are collaborating together. Within Slavonia, the new cooperation agreement signed between the five counties will introduce joint initiatives on tourism—especially a joint marketing strategy, and collaboration on the Croatia Tourism Days in 201951.
• Access to finance from banks and EU funds. Banks are hesitant to provide loans to tourism-related small and medium enterprises, and cite the high risk and low return on investment. This lack of financing limits the opportunities for starting entrepreneurs and restricts the expansion of existing businesses. Some reticence amongst banks may be rational assessment of risk in the tourism industry in Slavonia, but it also seems partly rooted in a lack of familiarity with the tourism industry52. Meanwhile, hotels have claimed that they are not eligible for EU funds, since they are not located in rural areas and do not fulfil other requirements, such as innovating their products or services. Private tourism operators mention that the lack of access to EU funds contrasts with the large funds that are committed to renovating public buildings as hostels or hotels, some of which will then be competing unfairly with private hotels.
A summary of the preceding two sections is provided in Figure 21.
49 For example, Osijek-Baranja county has nine local tourism boards. The county tourism boards report to the county government, while the local tourism boards report to the municipality level government. 50 There is no formal requirement for private sector participation in a tourism board, nor a requirement for professional qualifications or prior experience in the sector. For example, in Vinkovci, none of the eleven members of the tourism board are connected to the industry, and so the Mayor and tourism operators have established a separate Tourism Council to improve their communications in parallel to the tourism board. 51 In September 2018, the Ministry of Tourism and the Croatian National Tourist Board (CNTB) signed an agreement on the cooperation for promotion of the tourism brand for Slavonia with the tourist boards of the five counties. Under the agreement, the five counties will work together as a tourist cluster and prepare strategic marketing documents intended for common promotion during the period 2019-2025. The financial resources for the preparation will be provided by the CNTB, while the county tourism boards and the CNTB will provide strategic and operational support for implementation of the plan. This will be the first time that the five counties will undertake and coordinate joint activities and promote the region as one destination. The Croatian Institute for Tourism will support the cluster in the preparation of the marketing plan. See also: ‘Napokon Sinergija! Pet Slavonskih Županija Potpisalo Sporazumom O Zajedničkoj Suradnji’, 5 December 2018, http://hrturizam.hr/napokon-sinergija-pet-slavonskih-zupanija-potpisalo-sporazumom-o-zajednickoj-suradnji/ 52 One successful hotel in Slavonia could find a loan only from a bank outside Croatia, and is repaying it in foreign currency; another tourism operator got negative responses from three banks but finally an approval from HBOR.

50
Figure 21: Slavonia’s economy resurgence can be catalyzed through addressing key constraints

51
Chapter 2 Special Focus on Agri-Food
52
Chapter 2: Summary The agri-food sector is vital for the Slavonian economy. Primary agricultural production has a large spatial footprint, taking up nearly half of the area of Slavonia’s five counties, of which two-thirds are utilized for arable crops. The sector has also a large social footprint, with 41,000 farmers. While Slavonia is home to almost one-third of Croatia’s unemployed, the agriculture sector contributes to a higher share of employment (7.5%) than on average in new EU member states. Meanwhile, the food-processing industry employs 24% of the total manufacturing sector workforce. The agri-food sector also has major macroeconomic importance, as agriculture together with the food-processing industry generate 18% of regional GDP. The sector is also an important foreign exchange earner, as agri-food accounts for 16% of the total value of exported goods, and Slavonian sugar, corn, soybeans and wheat are in the top five Croatian agri-food export products.
However, in spite of its significant contribution to the regional economy, Slavonia’s agri-food sector has been underperforming. The Croatian agriculture sector has recorded constant negative growth in terms of both gross value added (-6.3% p.a.) and gross output (-5.6% p.a.), a 10-year trend that has continued following EU accession. This trend matches that of Slavonia. Low labor costs are offset by low labor productivity, and agricultural yields are lagging behind EU-15 averages, pointing to a sub-optimal use of production factors. The impacts of adverse climate events further contribute towards low agricultural productivity levels. It appears that low agriculture factor productivity has mainly been driven by low capital investment. A weak and fragmented agricultural knowledge and innovation system (AKIS) is failing to support farmers with modernization and the provision of knowledge in both management and farming. For a variety of reasons, historical and practical, farmers in Slavonia remain reluctant to work together through cooperatives or other alliances of producers.
Agri-food trade deficits have persisted after EU accession. While the value of agri-food exports from Croatia have doubled over the last 15 years, imports of primary and high-value processed products have generally outpaced exports. The agri-food trade deficit of almost EUR 1 billion in 2017 is driven by the accelerating imports of agricultural primary products from the EU member states, above all, from neighbouring countries (Italy, Slovenia, Hungary) with similar climatic conditions. The weak trade performance underlines the need to strengthen the competitive position of Slavonia’s agri-food value chains with a view to growing their domestic and international market shares.
Agri-food exports have shifted towards high-value products, but smallholders remain largely excluded from commercial market activities. Exports of high-value agri-food commodities have recorded higher growth rates than primary agriculture. This growth is good news but is currently driven almost completely by larger commercial farms, while smallholder farmers are focused on relatively short supply chains in domestic markets.
Smallholder inclusion in agri-food value chains represents a potential force for economic growth and for creating and sustaining jobs in rural areas. As more than half of Slavonia’s farmers manage less than 2 hectares of agriculture land, semi-commercial farmers (and to some extent semi-subsistence farmers) who already demonstrate some market activity, are a fundamental target group for deeper integration of Slavonia’s agri-food value chains. Whilst sharing many characteristics with other small farmers around the world (poor capitalization, limited bargaining power, political marginalization, etc.), Slavonia’s economy arguably stand to benefit significantly from smallholder integration in higher agri-food value-chains, by: (i) increasing the value of agricultural production that raises farming families’ incomes an thus, can boost shared prosperity, enabling enhanced health services, education and farm investments; (ii) having a strong local ripple effect, as farmers typically spend most of their income locally, spurring local business growth; and (iii) serving the manufacturing industry as a major source of growth, generating additional employment opportunities.
Multiple development pathways exist for smallholder inclusion in Slavonia’s agri-food value chains. Based on the analysis in this report, and drawing from regional and international experiences, it is likely that no single strategic intervention or financial support measure will be wholly appropriate for
53
all types of smallholder integration. In order to improve smallholder linkages to formal domestic markets, the Slavonian example of the ‘Vinkovci Asparagus’ cooperative shows that within 5 years a high-quality product accesses Western European market and generating significant incomes. Another example is the ‘BIZ Dairy’ in Požeško-Slavonska County, where the combination of a cooperative between dairy farmers, an integrated supply chain, and a branding strategy have led to expansion from local retail stores to national supermarkets.
Slavonia has both the productive assets and market opportunities to transform its agri-food sector. Slavonia is one of Europe’s best-endowed regions thanks to its chernozem soils, abundant availability of freshwater resources, and transport infrastructure that enables easy access to growing domestic and international markets for agri-food products. These endowments, together with the agro-ecological conditions and climate, offer great opportunities for growth and poverty reduction. However, to realize its potential, Slavonia must increase the competitiveness of its agri-food sector by:
(i) Improving productivity by investing in modern production systems. Strategic investment areas include: rehabilitation of irrigation infrastructure; improved farming practices; strengthening the business management capacity of farmers; and developing post-harvest management facilities;
(ii) Leveraging digital agriculture technologies for enhanced productivity, efficiency and environmental sustainability. By interconnecting data, digital agriculture technologies are a powerful force for the transformation of agri-food sector, which could also benefit producers and food processors to create direct links to buyers and consumers;
(iii) Promoting well-functioning value chains through commercial partnerships. These partnerships coordinate actions between upstream and downstream stakeholders and are aimed at better creating, delivering and capturing market value and opportunities;
(iv) Committing to a commercialization strategy that is inclusive of market-oriented smallholders. This commercialization strategy should also recognize the benefits of product differentiation through expanding EU quality schemes and strengthening GlobalG.A.P. certification options; and
(v) Providing smarter incentives for productivity and quality-enhancing investments. The promotion of well-functioning agri-food systems requires targeted financial support for many actors and activities along the value chain (for example, investments in irrigation).
While cereals and oilseeds currently dominate Slavonia’s agricultural production, the main potential for future growth lies with high-value products. Smallholders are currently the main producers of high-value crops, especially fruit and vegetables; larger commercial farmers specialize in less labor-intensive commodities such as wheat, maize and oilseeds. Considering Slavonia’s agro-ecological conditions, and also the most prominent trends in agri-food markets, the following strategic opportunities emerge:
(i) The seasonality of perishable fruits creates a unique competitive advantage. Fruits, such as raspberries and sour cherries, show potential under the competitive index. These products are commonly managed by small-scale farmers, as seen in some neighboring countries.
(ii) Fresh and storable vegetables have potential in the growing market of health-conscious consumers, but will require significant investments in post-harvest management facilities. Vegetables, such as peppers and asparagus, to a lesser extent, storable carrots and cabbage, and tomatoes reveal a comparative advantage.
(iii) Hazelnut production enjoys strong demand in food and non-food markets. The projections for the next decade indicate strong global demand for hazelnuts in the food industry (for example, MARS, Ferrero Rocher) but also in the cosmetics and pharmaceutical industries. This opportunity is reflected in the competitive index and growing producer prices, and first successful results can be found in neighboring countries.
(iv) Pig production from commercial producers creates an opportunity for value-addition in the meat processing industry. Pig and pork production show a strong existing competitive advantage in the livestock sector. Pork is the most widely consumed meat in Croatia, and given the benefit of EU quality schemes, specialty processed products have potential for export markets.

54
55
Introduction
The chapter provides a value-chain assessment for the Slavonian agri-food sector and responds to the following questions:
• What are the value chains and market segments which currently make a substantial contribution to value added in the Slavonian agri-food sector and which show the strongest growth prospects (either for exports or the domestic market)?
• Which of those value chains and market segments show the best prospects for commercialization and income generation?
• What are the constraints preventing Slavonian producers and agribusinesses from responding to these market opportunities, and to what extent do current policies and programs adequately address them?
• Based on international experience, what policies and instruments might the Government consider, to support investments and thus increasing farmer integration into these value chains?
The value-chain assessment relies on a combination of quantitative and qualitative methods, and includes:
• An analysis of market trends to identify the most dynamic value chains, with a focus on high-value products;
• An assessment of the competitiveness of those value chains, based on market demand and current public support schemes; and
• Structured discussions through stakeholder engagement meetings with representatives of agri-food value-chains.
Analysis in the chapter helps understand the main bottlenecks and constraints on producers and agribusinesses in taking advantage of emerging market opportunities, with attention to the benefits of producer organizations in forming horizontal cooperation and vertical coordination (commercial partnerships). The chapter also identifies opportunities for enhanced producer market entry and highlight models for better integration of market-oriented small-scale farmers in formal value chains. This includes an assessment of existing models in Slavonia (case studies), and also draws on international and EU experience, including recent research and analysis of models for improved market inclusion in high-value agricultural value chains.
The chapter complements the conclusions of the ‘Sustainable Food Production and Processing’ reports made by the World Bank Group to the Ministry of Economy, Entrepreneurship and Crafts, as part of support to implementation of Croatia’s Smart Specialization Strategy. The findings and recommendations of the chapter also align with the World Bank Group’s strategy development activities under the food and bio-economy component of the National Development Strategy (NDS), and the sector-specific RAS on the Strategic Transformation of Agriculture and Rural Space (STARS).

56
1. Agriculture Context Analysis Agriculture constitutes a significant share of the economy in the five Slavonian counties and remains important for several reasons. To start, agriculture has a large spatial footprint, taking up nearly half of Eastern Croatia’s total area (double the share for the whole country), of which two-thirds are utilized for arable crops. The sector also has a large social footprint, with 41,000 farmers. It has macroeconomic importance too, as agriculture and the agri-food industry generate nearly one-fifth of the GDP in Eastern Croatia. The sector is also an important foreign exchange earner, as exports of Slavonian sugar, corn, soybeans and wheat are in the top 5 Croatian agri-food export products. While the share of agriculture in value added and employment has decreased over the years in Slavonia, accelerating the structural transformation of the agri-food sector could be an engine of increased growth, better jobs, more export of products with value additions, and reduced poverty in rural areas.
1.1. Economic perspective
Agriculture is vital for Slavonia’s economy, given its vast agricultural resource base. Agriculture, fisheries and forestry account for 13.2% of GDP in Slavonia and, together with food processing, it generates nearly 18% of regional GDP (compared to 7% for the whole country). While Slavonia is home to almost one-third of Croatia’s unemployed, the agriculture sector contributes to a higher share of employment (7.5%) than on average in new EU member states. Slavonia is one of Europe’s best-endowed regions in terms of its natural resources, above all land availability, quality soil and abundant availability of freshwater resources. Nearly a quarter of Croatian farms are situated in Slavonia, and they manage almost half of the utilized agricultural area (UAA). Slavonia’s farms are also nearly 3 times larger than those in the rest of Croatia (Figure 22: Agriculture Area and Farm Sizes in Croatia and Slavonia). Thus, the weight of the agri-food sector in Slavonia’s economy is one of the largest in Europe.
Figure 22: Agriculture Area and Farm Sizes in Croatia and Slavonia
Source: World Bank Group calculations based on Paying Agency data, 2016
Slavonia’s agriculture performance is slightly better than that of the rest of Croatia. Analysis of GDP allocation per economic sector in Croatia reveals that the contribution of Slavonian agriculture, fisheries and forestry in the country’s sector GDP is equal to 45%, which almost matches the share of agricultural land in Slavonia’s total area. Analysis of Farm Accountancy Data Network (FADN) figures indicates that the efficiency of agriculture on farms in Slavonia expressed as value-added per annual work unit (AWU) is higher than on other farms (FADN, 2016). However, given the higher quality of land in Slavonia and the on-average much larger production units, the advantage in terms of overall productivity seems to be marginal compared to farming in other Croatian regions.
1,121,373
534,671
43,400 64,688 83,991
212,283130,309
7.6 15.18.8
9.3
13.4
20.0 19.3
0
5
10
15
20
25
0
200000
400000
600000
800000
1000000
1200000
Croatia Slavonia PS BP VP OB VS
tota
l a
gri
cult
ura
l L
PIS
are
a in
ha
ha
/A
G
ho
ldin
g
total AG area in ha ha/AG holding

57
Agri-food products made in Slavonia are a significant contributor to Croatia’s agri-food exports. The Croatian economy is characterized by large trade deficits in goods, rising from self-sufficiency rates of 43% in 2003 to a highest level of 64% in 2017. During the same period, the self-sufficiency rate for agri-food products was usually somewhat higher. However, the agri-food sector is also an important foreign exchange earner, especially in primary commodities such as sugar, corn, soybeans and wheat, which are predominantly produced in Slavonia, and which were in the top five Croatian agri-food products in terms of exports in the period 2015-2017. Their aggregated unit export value, however, is rather low.
Figure 23: The Development of Croatian Agri-food Exports (2003-2017)
Source: ITC, 2018
Agri-food exports do not yet reveal the benefits of access to the EU single market. The value of agri-food exports has more than doubled since 2003 and increased by 22% since EU accession. Figure 23 illustrates that agri-food exports accounted for around 16% of Croatia’s total exports in 2003, and this share has not changed significantly nearly 15 years later. While Croatia’s agri-food production and processing have evolved since EU accession, the industry has not yet reaped the benefits of access to the EU single market and its 500 million consumers, since export intensity measured as export value per inhabitant is among the lowest in the EU-28. The Croatian average for 2017 amounted to EUR 3,400, while at the same time the export of goods per capita in Slavonia amounted to only EUR 2,000, which was 60% below the Croatian average.
Croatia maintains significant deficits in its agri-food trade balances. As the country’s exports have grown, imports of primary and processed agri-food products have increased at a similar pace since early 2000, which has kept the trade deficit at around an average of USD 250 million per year. However, the growth of imports of primary products has been increasing more rapidly (see Figure 24). While agricultural production is diversified in Croatia, agricultural exports are mostly of low-value agricultural commodities and goods. Neighboring countries constitute Croatia’s export markets (Slovenia, Italy, Bosnia & Herzegovina) as well as its sources of imports of agri-food products (Italy, Hungary, Slovenia), while Germany is a major importing country. The gap in the agricultural trade balance is growing, particularly with EU countries, while a sizeable surplus with non-EU countries has been recorded.
0%
2%
4%
6%
8%
10%
12%
14%
16%
18%
20%
-
500,000
1,000,000
1,500,000
2,000,000
2,500,000
3,000,000
2003 2004 2005 2006 2007 2008 2009 2010 2011 2012 2013 2014 2015 2016 2017
Tota
l Agr
icu
ltu
re E
xpo
rts
/ To
tal E
xpo
rts
$U
S Th
ou
san
ds
Total Agriculture Exports Agriculture Exports/Total Exports
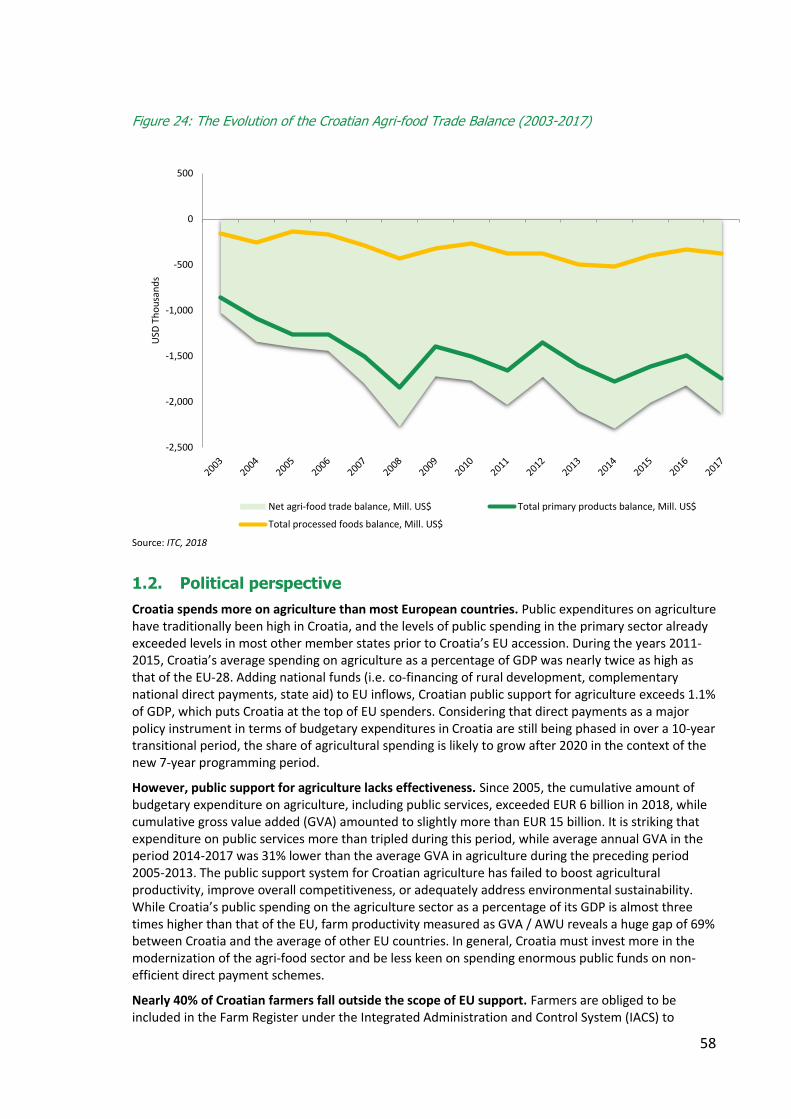
58
Figure 24: The Evolution of the Croatian Agri-food Trade Balance (2003-2017)
Source: ITC, 2018
1.2. Political perspective
Croatia spends more on agriculture than most European countries. Public expenditures on agriculture have traditionally been high in Croatia, and the levels of public spending in the primary sector already exceeded levels in most other member states prior to Croatia’s EU accession. During the years 2011-2015, Croatia’s average spending on agriculture as a percentage of GDP was nearly twice as high as that of the EU-28. Adding national funds (i.e. co-financing of rural development, complementary national direct payments, state aid) to EU inflows, Croatian public support for agriculture exceeds 1.1% of GDP, which puts Croatia at the top of EU spenders. Considering that direct payments as a major policy instrument in terms of budgetary expenditures in Croatia are still being phased in over a 10-year transitional period, the share of agricultural spending is likely to grow after 2020 in the context of the new 7-year programming period.
However, public support for agriculture lacks effectiveness. Since 2005, the cumulative amount of budgetary expenditure on agriculture, including public services, exceeded EUR 6 billion in 2018, while cumulative gross value added (GVA) amounted to slightly more than EUR 15 billion. It is striking that expenditure on public services more than tripled during this period, while average annual GVA in the period 2014-2017 was 31% lower than the average GVA in agriculture during the preceding period 2005-2013. The public support system for Croatian agriculture has failed to boost agricultural productivity, improve overall competitiveness, or adequately address environmental sustainability. While Croatia’s public spending on the agriculture sector as a percentage of its GDP is almost three times higher than that of the EU, farm productivity measured as GVA / AWU reveals a huge gap of 69% between Croatia and the average of other EU countries. In general, Croatia must invest more in the modernization of the agri-food sector and be less keen on spending enormous public funds on non-efficient direct payment schemes.
Nearly 40% of Croatian farmers fall outside the scope of EU support. Farmers are obliged to be included in the Farm Register under the Integrated Administration and Control System (IACS) to
-2,500
-2,000
-1,500
-1,000
-500
0
500
USD
Th
ou
san
ds
Net agri-food trade balance, Mill. US$ Total primary products balance, Mill. US$
Total processed foods balance, Mill. US$
59
receive direct payments, as well as rural development payments and state aid for sensitive sectors. There is a large discrepancy in the number of beneficiaries of direct payments as a major type of public support in agriculture and the total number of farms in the Farm Register. The number of direct payment beneficiaries in 2017 was 104,618, which represents 60% of the total number of farms in the register, since the eligibility condition was set at the minimum physical area of 1 ha. Therefore, in assessing the impact of CAP and national support policies on growth, jobs and income inequalities, one should bear in mind that nearly 40% of farms are not covered by payment statistics. In contrast with these farms, which have land but fall below the threshold, there are farms that do not apply for direct payments although they farm land and are registered in the IACS system. The main reason for this is that they do not have appropriate ownership documents for land claims, and sometimes even illegally use land owned by others (state or private). According to DG AGRI data for 2015, Croatia had the highest discrepancy between the UAA and the area determined for direct payments, the latter being only 66% of the UAA, while this difference for the average EU was less than 13%.
1.3. Geo-climatic perspective
Croatia has diverse agro-ecological conditions and a favorable climate for agricultural production. The three geographic and climatic zones in Croatia include: (i) the lowland zone in the north of the country, called the Pannonian Basin, which has a continental climate, (ii) the Mediterranean coastal zone in the south, which has a mild Mediterranean climate, and (iii) the mountainous zone stretching across the central part of the country. Slavonia, as the main agricultural region, is almost entirely in the lowland zone in the so-called ‘corn-belt’, where weather conditions are ideal for the production of cereals and oilseeds. Snowy winters and rainy springs provide enough moisture for the soil, while moderate temperatures during the summer allow a gradual ripening process for crops with a long vegetation period, resulting in high-quality produce. Overall, the various types of climate, relief and soil in Croatia are favorable for the production of a diverse range of products, including cereals, industrial crops, vineyards, as well as continental and Mediterranean fruits and vegetables.
While Slavonia’s climate is well suited to agriculture, climate change is posing significant risks. The number of floods and severe droughts combined with high temperatures in the last two decades has been the highest since meteorological events began to be recorded. This raises the importance of promoting better farming practices to mitigate climate change risks. Importantly, managing climate risks is addressed in the National Rural Development Program (NRDP) as one of the major crosscutting objectives. In addition, loss of soil and soil fertility due to erosion in Croatia is significantly higher than the EU average, and 23% of agricultural land is at high risk of soil erosion (NRDP 2014-20). A particularly negative effect of soil erosion occurs in cultivated soils without vegetation cover for a certain period during the year, as the removal of the topsoil means the disappearance of the organic matter essential for soil fertility.
1.4. Agricultural characteristics
Farm structures
Farm structures in Slavonia are highly polarized with a ‘missing middle’. More than a quarter of Croatia’s 157,000 agricultural holdings are located in Slavonia (Farm Structure Survey (FSS)). These cover an average area of 10 ha. While more than two-thirds of farms (69.4%) cover fewer than 5 ha, less than 1% of farms have access to more than 100 ha of agricultural land (Figure 25). These larger commercial farms comprise 43% of the utilized agricultural area (UAA), while nearly 70% of holdings occupy slightly more than one-tenth of available land. These numbers indicate big challenges, as uneven distribution of agricultural land clearly splits all beneficiaries of public support into two major blocks: a few very large farms on the one hand and a large number of smallholders on the other.
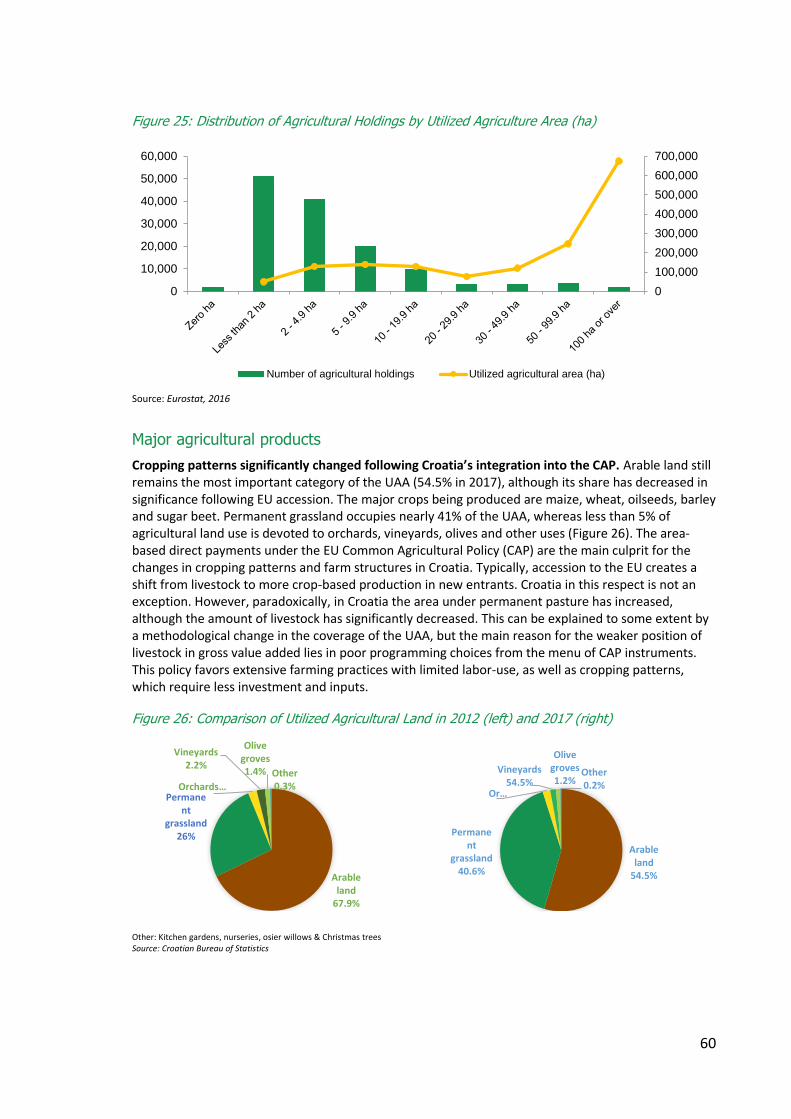
60
Figure 25: Distribution of Agricultural Holdings by Utilized Agriculture Area (ha)
Source: Eurostat, 2016
Major agricultural products
Cropping patterns significantly changed following Croatia’s integration into the CAP. Arable land still remains the most important category of the UAA (54.5% in 2017), although its share has decreased in significance following EU accession. The major crops being produced are maize, wheat, oilseeds, barley and sugar beet. Permanent grassland occupies nearly 41% of the UAA, whereas less than 5% of agricultural land use is devoted to orchards, vineyards, olives and other uses (Figure 26). The area-based direct payments under the EU Common Agricultural Policy (CAP) are the main culprit for the changes in cropping patterns and farm structures in Croatia. Typically, accession to the EU creates a shift from livestock to more crop-based production in new entrants. Croatia in this respect is not an exception. However, paradoxically, in Croatia the area under permanent pasture has increased, although the amount of livestock has significantly decreased. This can be explained to some extent by a methodological change in the coverage of the UAA, but the main reason for the weaker position of livestock in gross value added lies in poor programming choices from the menu of CAP instruments. This policy favors extensive farming practices with limited labor-use, as well as cropping patterns, which require less investment and inputs.
Figure 26: Comparison of Utilized Agricultural Land in 2012 (left) and 2017 (right)
Other: Kitchen gardens, nurseries, osier willows & Christmas trees Source: Croatian Bureau of Statistics
0
100,000
200,000
300,000
400,000
500,000
600,000
700,000
0
10,000
20,000
30,000
40,000
50,000
60,000
Number of agricultural holdings Utilized agricultural area (ha)
Arable land
67.9%
Permanent
grassland26%
Orchards…
Vineyards2.2%
Olive groves1.4% Other
0.3%
Arable land
54.5%
Permanent
grassland40.6%
Or…
Vineyards54.5%
Olive groves1.2%
Other0.2%
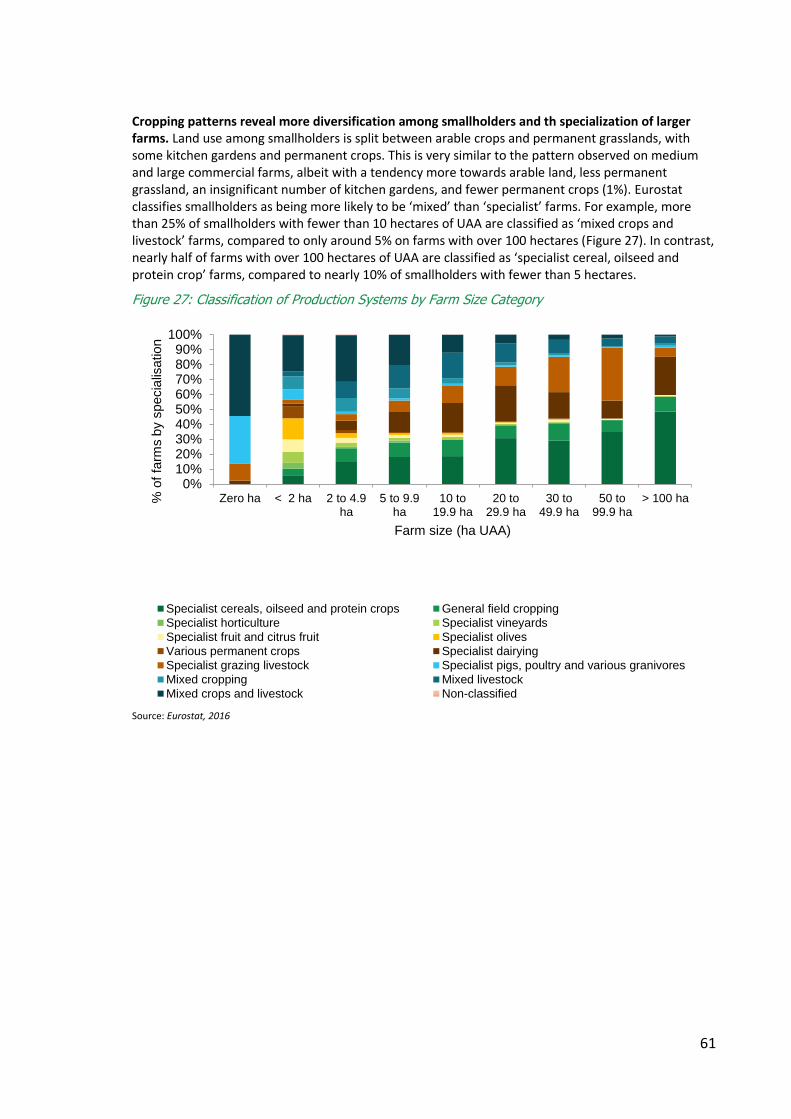
61
Cropping patterns reveal more diversification among smallholders and th specialization of larger farms. Land use among smallholders is split between arable crops and permanent grasslands, with some kitchen gardens and permanent crops. This is very similar to the pattern observed on medium and large commercial farms, albeit with a tendency more towards arable land, less permanent grassland, an insignificant number of kitchen gardens, and fewer permanent crops (1%). Eurostat classifies smallholders as being more likely to be ‘mixed’ than ‘specialist’ farms. For example, more than 25% of smallholders with fewer than 10 hectares of UAA are classified as ‘mixed crops and livestock’ farms, compared to only around 5% on farms with over 100 hectares (Figure 27). In contrast, nearly half of farms with over 100 hectares of UAA are classified as ‘specialist cereal, oilseed and protein crop’ farms, compared to nearly 10% of smallholders with fewer than 5 hectares.
Figure 27: Classification of Production Systems by Farm Size Category
Source: Eurostat, 2016
0%10%20%30%40%50%60%70%80%90%
100%
Zero ha < 2 ha 2 to 4.9ha
5 to 9.9ha
10 to19.9 ha
20 to29.9 ha
30 to49.9 ha
50 to99.9 ha
> 100 ha% o
f fa
rms b
y specia
lisation
Farm size (ha UAA)
Specialist cereals, oilseed and protein crops General field cropping
Specialist horticulture Specialist vineyards
Specialist fruit and citrus fruit Specialist olives
Various permanent crops Specialist dairying
Specialist grazing livestock Specialist pigs, poultry and various granivores
Mixed cropping Mixed livestock
Mixed crops and livestock Non-classified
62
2. Opportunities for Agri-food Value Chains
Global food demand is expected to increase by 70% over the next three decades, driven by population growth. For the agri-food sector, this represents an opportunity and a challenge. Growing market prospects are an evident boon to farmers worldwide. Yet, imperfect market infrastructure, and socio-economic and climate vulnerabilities are expected to increase food insecurities. In this global context, the northern hemisphere - including Europe - will be well positioned to continue supplying global markets with many key agri-food products.
Multiple opportunities undoubtedly exist for the greater emergence of modernized agri-food value chains in Slavonia, whether it is the strengthening of already established chains or start-ups. While Eastern Croatia’s agri-food industry is challenged by low agricultural factor productivity, the high costs of doing business and addressing the vulnerabilities of climate change, it exhibits a revealed comparative advantage for several arable crops. However, these same commodities are driving Slavonian agriculture into an unsustainable state. Instead, opportunities arising from the seasonality of perishable fruits and vegetables deserve further attention.
There is also ample potential for the development of a more competitive smallholder sector. Many relevant examples from European countries and beyond showcase the benefits of successful integration of smallholders in market activities. Smallholders in the dairy sector and horticulture (fruit and vegetable) value chains appear best positioned to take advantage of market opportunities.
2.1. Global and European agri-food market trends
Global demand for food is expected to increase by 70% by 2050, driven by rising population and income levels. The global population is projected to increase from 7 billion today to 9 billion by the middle of the century. 95% of this growth will occur in the least developed countries. Rising global incomes will be mostly associated with increased urbanization. 70% of the world’s population is expected to be urban by 2050. Most additional food demand is projected to come from the populous and rapidly urbanizing countries of China, India and Sub-Saharan Africa (OECD-FAO Agri-Outlook, 2018).
In contrast to the global trend, Europe’s population is projected to age and stagnate, resulting in a smaller rural labor supply and limited growth potential in demand for agri-food products. Similarly, Slavonia will also be confronted with the growing challenge of an ageing and stagnating population, especially in rural areas. In line with global trends, Europe will witness increased urbanization, with outward migration from rural areas rather than negative population growth rates being the main driving factor (Urbanization Development, DG REGIO, 2018). The declining rural population will decrease the farm labor supply, and threaten the vitality of rural areas, while overall demographic stagnation will result in limited opportunities for expansion. Global markets will thus become more important for Europe’s agri-food producers.
Global agricultural systems will be confronted with the expected negative impacts of climate change. Climate change is expected to result in a shift in rainfall patterns, increased frequency and strength of extreme weather events, and water shortages, which will – in combination with the rising costs of agricultural inputs, especially energy and fertilizers – lead to greater price volatility. However, the northern hemisphere, Europe included, should be well positioned to continue supplying global markets with many key agri-food products. Prospects are positive, for instance, for temperate cereal production, and areas suitable for crop production may even expand northward as temperatures rise.
In addition to the macro trends resulting from population dynamics and climate change, a number of micro trends will impact on agri-food production in Europe. Demand for agri-food products in Europe is increasingly shaped by a series of changes in business models and consumer behavior, and

63
both can be a source of opportunities for Slavonia’s farmers. The four trends considered most relevant for the purpose of this chapter are as follows:
2.1.1. Growth potential for fruits and vegetables in Europe and developing economies
The production and consumption of fruits and vegetables were generally considered to be stable in the three years to 2014, but have increased since 2015 (Eurostat, 2018). The combined value of fruit and vegetable imports was almost 25% higher in 2016 than in 2012 (Figure 28). Nevertheless, many EU consumers currently still eat significantly less than the recommended daily intakes of fruit and vegetables (Eurostat, 2018). Croatia’s population currently consumes the third least fruit and vegetables per capita in the EU, suggesting there is potential for increased sales of fruit and vegetables if healthier diets become more common as prosperity and awareness increase.
Figure 28: EU-28 Imports of Fruits and Vegetables (2012-16)
Source: ITC, 2017
Nevertheless, the most lucrative markets with the highest potential in the medium-term are in Western Europe and North America, where incomes are higher. For instance, while Europe and North America comprise approximately 17% of the current world population, they account for 32% of demand for fruit and vegetables (World Bank Group, Strategic Segmentation of the Horticulture Sector, 2018). Similarly, the import prices for the same commodities tend to be a bit higher in these markets for any given product, although there are some notable differences.53 Figure 29 further shows that consumers in Western Europe pay considerably more in absolute prices for food than consumers in Eastern Europe, and even more than in low-income economies. Understanding the differences between where high-value markets are located and where food demand is increasing the fastest will be important for discerning feasible export strategies for various types of company in the horticultural sector. However, in order to understand the pressures being exerted on the industry globally – and the factor endowments needed to participate in these various markets – a segmentation analysis is needed.
53 While the market is already quite mature in these high-income economies, and thus the total size of the market may not grow as much, they still generate more value per capita than other regions.
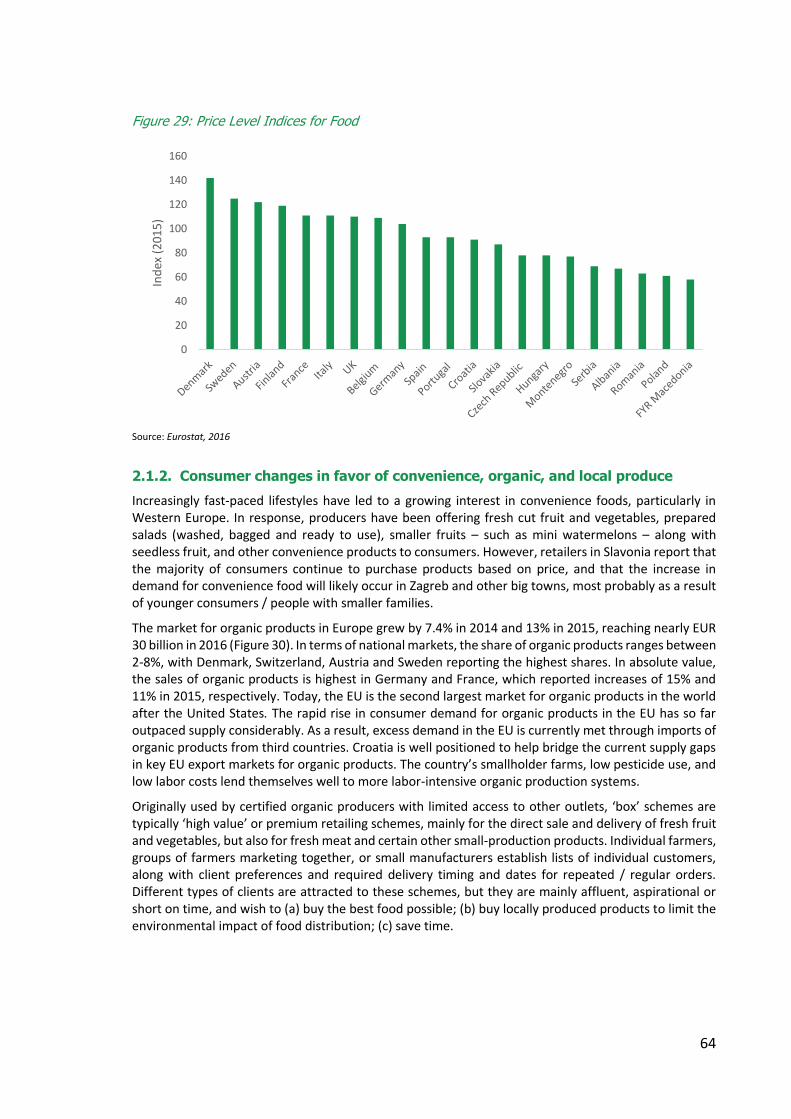
64
Figure 29: Price Level Indices for Food
Source: Eurostat, 2016
2.1.2. Consumer changes in favor of convenience, organic, and local produce
Increasingly fast-paced lifestyles have led to a growing interest in convenience foods, particularly in Western Europe. In response, producers have been offering fresh cut fruit and vegetables, prepared salads (washed, bagged and ready to use), smaller fruits – such as mini watermelons – along with seedless fruit, and other convenience products to consumers. However, retailers in Slavonia report that the majority of consumers continue to purchase products based on price, and that the increase in demand for convenience food will likely occur in Zagreb and other big towns, most probably as a result of younger consumers / people with smaller families.
The market for organic products in Europe grew by 7.4% in 2014 and 13% in 2015, reaching nearly EUR 30 billion in 2016 (Figure 30). In terms of national markets, the share of organic products ranges between 2-8%, with Denmark, Switzerland, Austria and Sweden reporting the highest shares. In absolute value, the sales of organic products is highest in Germany and France, which reported increases of 15% and 11% in 2015, respectively. Today, the EU is the second largest market for organic products in the world after the United States. The rapid rise in consumer demand for organic products in the EU has so far outpaced supply considerably. As a result, excess demand in the EU is currently met through imports of organic products from third countries. Croatia is well positioned to help bridge the current supply gaps in key EU export markets for organic products. The country’s smallholder farms, low pesticide use, and low labor costs lend themselves well to more labor-intensive organic production systems.
Originally used by certified organic producers with limited access to other outlets, ‘box’ schemes are typically ‘high value’ or premium retailing schemes, mainly for the direct sale and delivery of fresh fruit and vegetables, but also for fresh meat and certain other small-production products. Individual farmers, groups of farmers marketing together, or small manufacturers establish lists of individual customers, along with client preferences and required delivery timing and dates for repeated / regular orders. Different types of clients are attracted to these schemes, but they are mainly affluent, aspirational or short on time, and wish to (a) buy the best food possible; (b) buy locally produced products to limit the environmental impact of food distribution; (c) save time.
0
20
40
60
80
100
120
140
160In
dex
(20
15
)
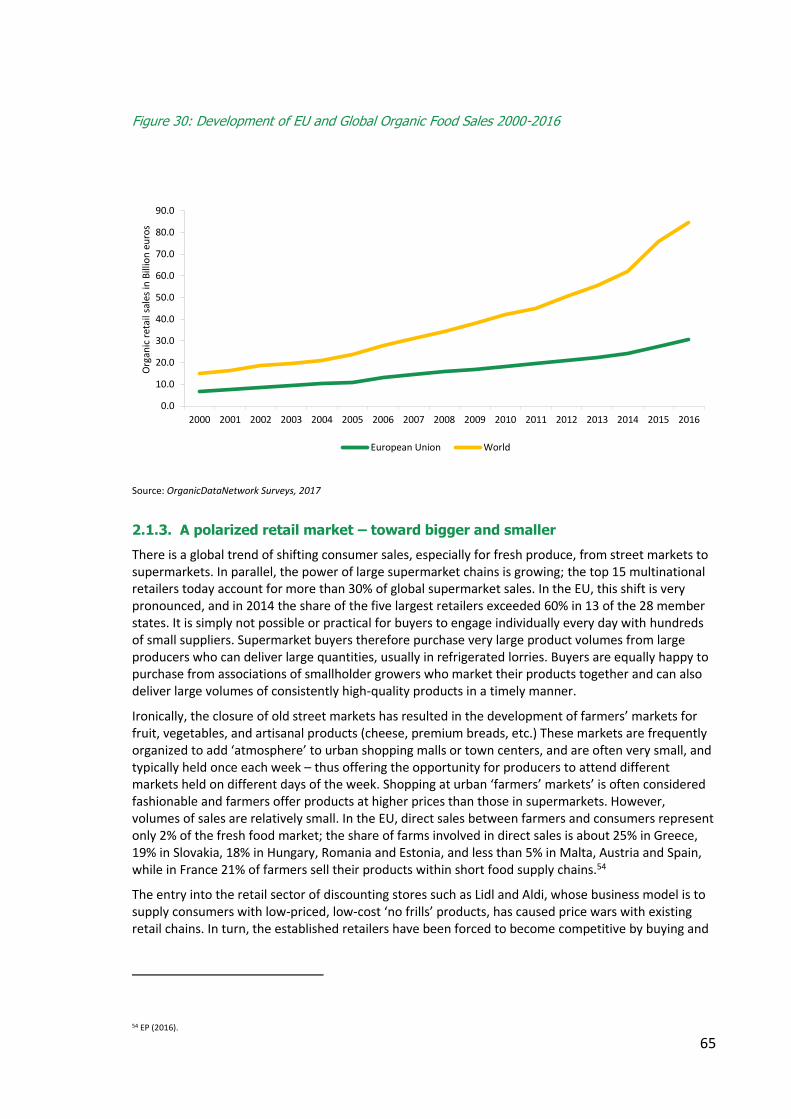
65
Figure 30: Development of EU and Global Organic Food Sales 2000-2016
Source: OrganicDataNetwork Surveys, 2017
2.1.3. A polarized retail market – toward bigger and smaller
There is a global trend of shifting consumer sales, especially for fresh produce, from street markets to supermarkets. In parallel, the power of large supermarket chains is growing; the top 15 multinational retailers today account for more than 30% of global supermarket sales. In the EU, this shift is very pronounced, and in 2014 the share of the five largest retailers exceeded 60% in 13 of the 28 member states. It is simply not possible or practical for buyers to engage individually every day with hundreds of small suppliers. Supermarket buyers therefore purchase very large product volumes from large producers who can deliver large quantities, usually in refrigerated lorries. Buyers are equally happy to purchase from associations of smallholder growers who market their products together and can also deliver large volumes of consistently high-quality products in a timely manner.
Ironically, the closure of old street markets has resulted in the development of farmers’ markets for fruit, vegetables, and artisanal products (cheese, premium breads, etc.) These markets are frequently organized to add ‘atmosphere’ to urban shopping malls or town centers, and are often very small, and typically held once each week – thus offering the opportunity for producers to attend different markets held on different days of the week. Shopping at urban ‘farmers’ markets’ is often considered fashionable and farmers offer products at higher prices than those in supermarkets. However, volumes of sales are relatively small. In the EU, direct sales between farmers and consumers represent only 2% of the fresh food market; the share of farms involved in direct sales is about 25% in Greece, 19% in Slovakia, 18% in Hungary, Romania and Estonia, and less than 5% in Malta, Austria and Spain, while in France 21% of farmers sell their products within short food supply chains.54
The entry into the retail sector of discounting stores such as Lidl and Aldi, whose business model is to supply consumers with low-priced, low-cost ‘no frills’ products, has caused price wars with existing retail chains. In turn, the established retailers have been forced to become competitive by buying and
54 EP (2016).
0.0
10.0
20.0
30.0
40.0
50.0
60.0
70.0
80.0
90.0
2000 2001 2002 2003 2004 2005 2006 2007 2008 2009 2010 2011 2012 2013 2014 2015 2016
Org
anic
ret
ail s
ales
in B
illio
n e
uro
s
European Union World

66
selling all products, including fruit, vegetables, meat and dairy products at lower prices. The lower prices for consumers are reflected in lower prices paid to growers.
2.1.4. Product differentiation through regional branding and certification
With respect to EU quality certification for traditional products - Protected Designation of Origin (PDO), Protected Geographical Indication (PGI), and Traditional Specialty Guaranteed (TSG), Slavonia has a lot of potential. These quality schemes tend to be more successful for processed products, while primary agricultural products show limited benefits. More than 1,441 products are registered (3,300 if products for which applications have been made are included) under the three designations in the EU-28, and Italy alone has 284 certified products (Figure 31). As well as providing a useful marketing tool in the EU and other markets, registration under these schemes provides producers with legal protection against imitation or misuse of the product name.
Figure 31: Number of Quality Schemes by Member State
Source: DOOR database, 2018
In some EU national markets, in particular in Western Europe, retailers’ food safety requirements are higher than EU requirements, and these more stringent rules are applied along the supply chain, i.e. to suppliers from other countries.55 The implementation of the voluntary GlobalGAP (Good Agricultural Practices) also continues to expand and the application of certification is important for producers who wish to improve their competitive position and / or the export potential of their products.56 GlobalGAP training can also help growers to understand and deal with forthcoming reductions in the numbers and types of pesticides registered for use, and the use of commercial biological pest control systems where applicable.
55 CBI (2016). 56 GAP standards promote good practices to ensure strict compliance with maximum residue levels (MRLs) and the prevention of microbiological contamination, along with ensuring the traceability of products.
0
50
100
150
200
250
300
350
Nu
mb
er o
f re
gist
ered
qu
alit
y sc
hem
es
# PDO # PGI # TSG
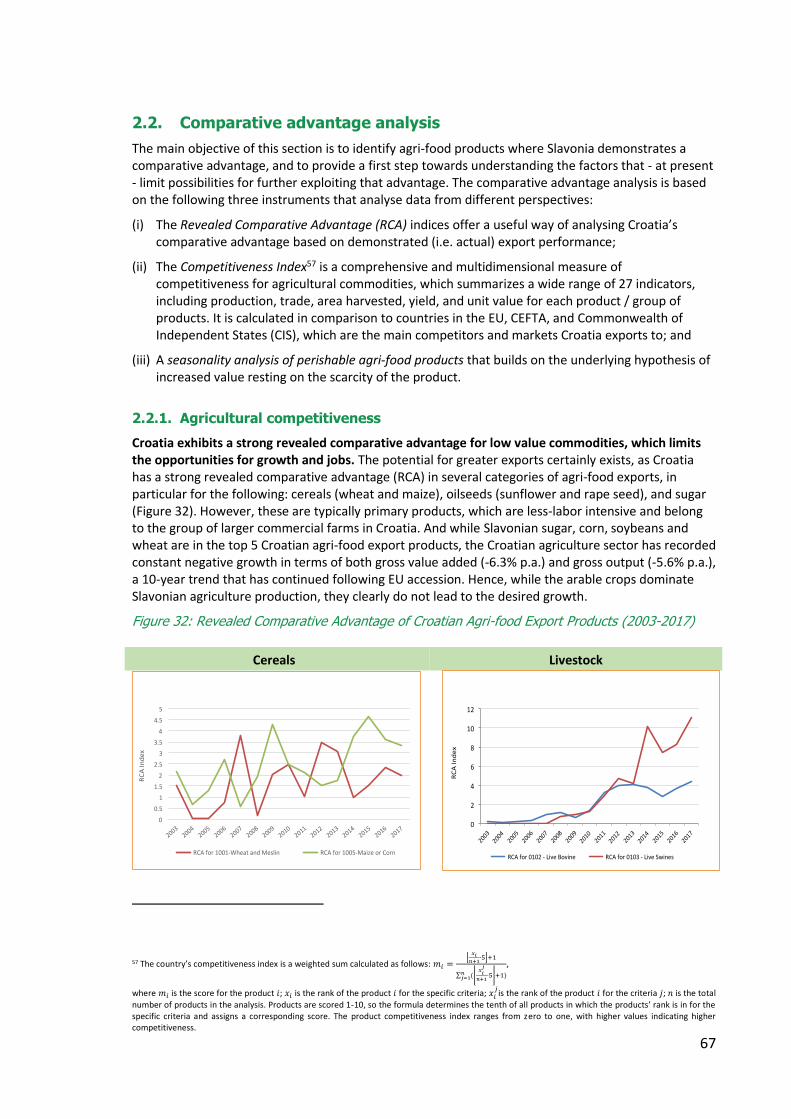
67
2.2. Comparative advantage analysis
The main objective of this section is to identify agri-food products where Slavonia demonstrates a comparative advantage, and to provide a first step towards understanding the factors that - at present - limit possibilities for further exploiting that advantage. The comparative advantage analysis is based on the following three instruments that analyse data from different perspectives:
(i) The Revealed Comparative Advantage (RCA) indices offer a useful way of analysing Croatia’s comparative advantage based on demonstrated (i.e. actual) export performance;
(ii) The Competitiveness Index57 is a comprehensive and multidimensional measure of competitiveness for agricultural commodities, which summarizes a wide range of 27 indicators, including production, trade, area harvested, yield, and unit value for each product / group of products. It is calculated in comparison to countries in the EU, CEFTA, and Commonwealth of Independent States (CIS), which are the main competitors and markets Croatia exports to; and
(iii) A seasonality analysis of perishable agri-food products that builds on the underlying hypothesis of increased value resting on the scarcity of the product.
2.2.1. Agricultural competitiveness
Croatia exhibits a strong revealed comparative advantage for low value commodities, which limits the opportunities for growth and jobs. The potential for greater exports certainly exists, as Croatia has a strong revealed comparative advantage (RCA) in several categories of agri-food exports, in particular for the following: cereals (wheat and maize), oilseeds (sunflower and rape seed), and sugar (Figure 32). However, these are typically primary products, which are less-labor intensive and belong to the group of larger commercial farms in Croatia. And while Slavonian sugar, corn, soybeans and wheat are in the top 5 Croatian agri-food export products, the Croatian agriculture sector has recorded constant negative growth in terms of both gross value added (-6.3% p.a.) and gross output (-5.6% p.a.), a 10-year trend that has continued following EU accession. Hence, while the arable crops dominate Slavonian agriculture production, they clearly do not lead to the desired growth.
Figure 32: Revealed Comparative Advantage of Croatian Agri-food Export Products (2003-2017)
57 The country’s competitiveness index is a weighted sum calculated as follows: 𝑚𝑖 =
⌊𝑥𝑖𝑛+1
∙5⌋+1
∑ (⌊𝑥𝑖𝑗
𝑛+1∙5⌋+1)𝑛
𝑗=1
,
where 𝑚𝑖 is the score for the product 𝑖; 𝑥𝑖 is the rank of the product 𝑖 for the specific criteria; 𝑥𝑖𝑗is the rank of the product 𝑖 for the criteria 𝑗; 𝑛 is the total
number of products in the analysis. Products are scored 1-10, so the formula determines the tenth of all products in which the products’ rank is in for the specific criteria and assigns a corresponding score. The product competitiveness index ranges from zero to one, with higher values indicating higher competitiveness.
Cereals Livestock
0
0.5
1
1.5
2
2.5
3
3.5
4
4.5
5
2003
2004
2005
2006
2007
2008
2009
2010
2011
2012
2013
2014
2015
2016
2017
RCAIndex
RCAfor1001-WheatandMeslin RCAfor1005-MaizeorCorn
0
2
4
6
8
10
12
2003
2004
2005
2006
2007
2008
2009
2010
2011
2012
2013
2014
2015
2016
2017
RCAIndex
RCAfor0102-LiveBovine RCAfor0103-LiveSwines

68
Source: ITC, 2018
High value agri-food products can boost inclusive growth. The competitiveness index summarizes a wide range of 27 indicators, including production, trade, area harvested, yield, and unit value for each product or group of products. It is compared against the EU, CEFTA, and Commonwealth of Independent States (CIS), which are the main competitors and markets for Croatian exports. Within the livestock sector, the competitive index reveals that Croatia is only competitive in pig and pig meat sector. However, within the category of fruits and vegetables, the competitiveness index shows that Croatia is ranked as being competitive in sour cherry, raspberry, hazelnut and pepper production (Figure 33). Drawing from the RCA, it confirms the competitive position of vegetables and, considering the trend of growing imports of fruits and vegetables into the EU, also reveals that apples show a lot of potential. As these more labor-intensive crops are mainly produced by small-scale farms and most of the work is provided by family labor, the increase in value of agriculture production directly raises
Sunflower Apples
Oil Crops Sugar
Sausages / Preserved Meat Vegetables
0
0.5
1
1.5
2
2.5
3
3.5
4
2003
2004
2005
2006
2007
2008
2009
2010
2011
2012
2013
2014
2015
2016
2017
RCAIndex
RCAfor1512-SunflowerSeedOil
0.00
0.20
0.40
0.60
0.80
1.00
1.20
1.40
2003
2004
2005
2006
2007
2008
2009
2010
2011
2012
2013
2014
2015
2016
2017
RCAIndex
RCAfor0808Apples Linear(RCAfor0808Apples)
0
1
2
3
4
5
6
7
8
2003
2004
2005
2006
2007
2008
2009
2010
2011
2012
2013
2014
2015
2016
2017
RCAIndex
RCAfor1205-RapeSeeds RCAfor1201-SoyaBeans
RCAfor1211-Plants&Parts
0
2
4
6
8
10
12
14
16
2003
2004
2005
2006
2007
2008
2009
2010
2011
2012
2013
2014
2015
2016
2017
RCAIndex
RCAfor17-Sugar&SugarProducts RCAfor1701-CaneorBeetSugar
0
1
2
3
4
5
6
7
2003
2004
2005
2006
2007
2008
2009
2010
2011
2012
2013
2014
2015
2016
2017
RCAIndex
RCAfor1601-Sausages RCAfor1602-PreservedMeat
0
0.1
0.2
0.3
0.4
0.5
0.6
2003
2004
2005
2006
2007
2008
2009
2010
2011
2012
2013
2014
2015
2016
2017
RCAIndex
RCAfor07-EdibleVegetables
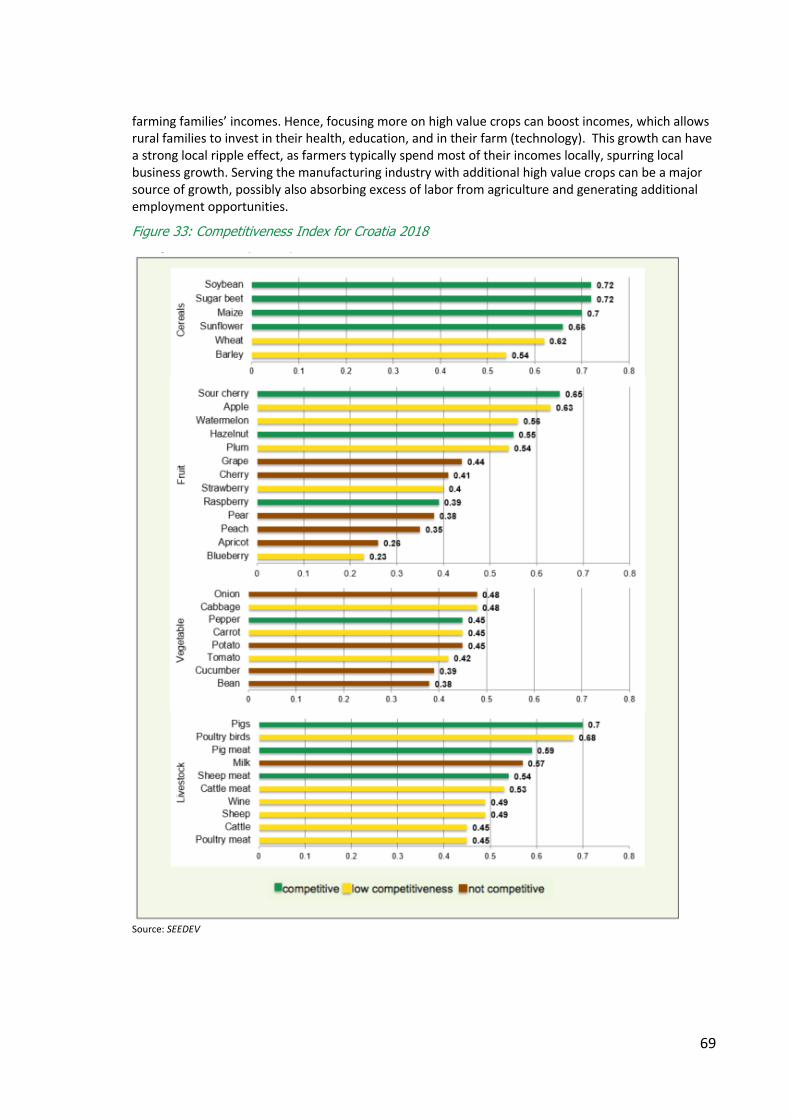
69
farming families’ incomes. Hence, focusing more on high value crops can boost incomes, which allows rural families to invest in their health, education, and in their farm (technology). This growth can have a strong local ripple effect, as farmers typically spend most of their incomes locally, spurring local business growth. Serving the manufacturing industry with additional high value crops can be a major source of growth, possibly also absorbing excess of labor from agriculture and generating additional employment opportunities.
Figure 33: Competitiveness Index for Croatia 2018
Source: SEEDEV
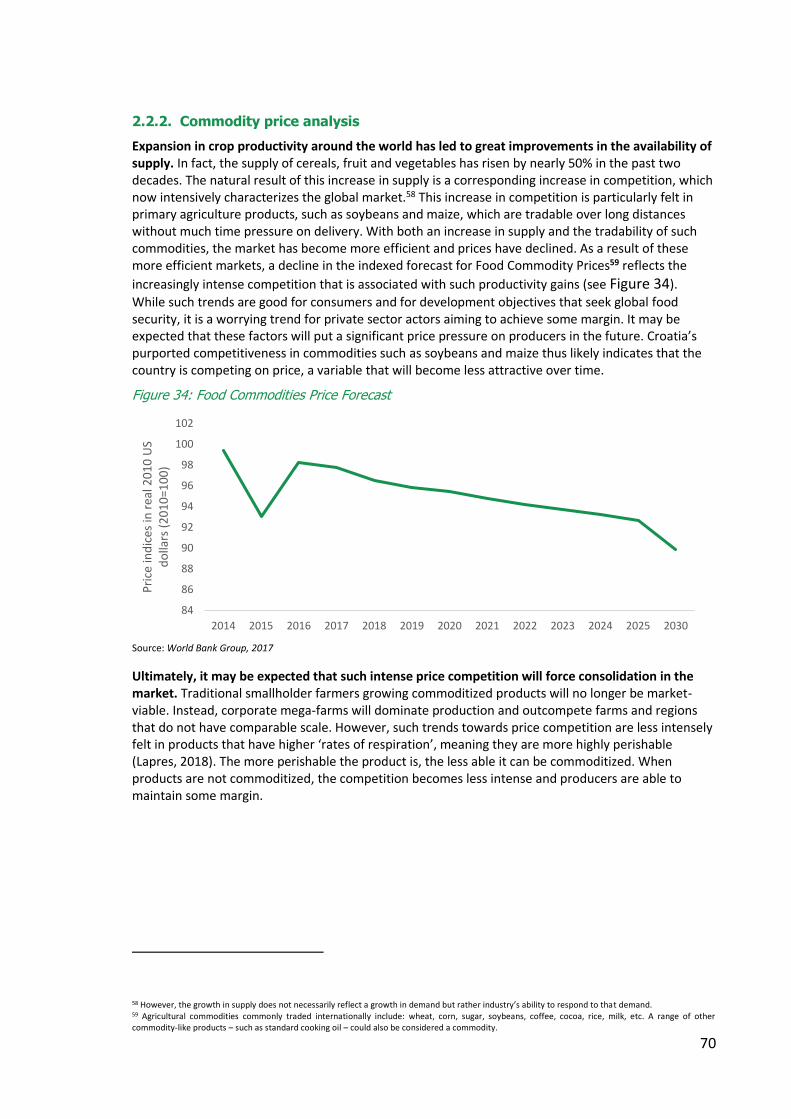
70
2.2.2. Commodity price analysis
Expansion in crop productivity around the world has led to great improvements in the availability of supply. In fact, the supply of cereals, fruit and vegetables has risen by nearly 50% in the past two decades. The natural result of this increase in supply is a corresponding increase in competition, which now intensively characterizes the global market.58 This increase in competition is particularly felt in primary agriculture products, such as soybeans and maize, which are tradable over long distances without much time pressure on delivery. With both an increase in supply and the tradability of such commodities, the market has become more efficient and prices have declined. As a result of these more efficient markets, a decline in the indexed forecast for Food Commodity Prices59 reflects the
increasingly intense competition that is associated with such productivity gains (see Figure 34).
While such trends are good for consumers and for development objectives that seek global food security, it is a worrying trend for private sector actors aiming to achieve some margin. It may be expected that these factors will put a significant price pressure on producers in the future. Croatia’s purported competitiveness in commodities such as soybeans and maize thus likely indicates that the country is competing on price, a variable that will become less attractive over time.
Figure 34: Food Commodities Price Forecast
Source: World Bank Group, 2017
Ultimately, it may be expected that such intense price competition will force consolidation in the market. Traditional smallholder farmers growing commoditized products will no longer be market-viable. Instead, corporate mega-farms will dominate production and outcompete farms and regions that do not have comparable scale. However, such trends towards price competition are less intensely felt in products that have higher ‘rates of respiration’, meaning they are more highly perishable (Lapres, 2018). The more perishable the product is, the less able it can be commoditized. When products are not commoditized, the competition becomes less intense and producers are able to maintain some margin.
58 However, the growth in supply does not necessarily reflect a growth in demand but rather industry’s ability to respond to that demand. 59 Agricultural commodities commonly traded internationally include: wheat, corn, sugar, soybeans, coffee, cocoa, rice, milk, etc. A range of other commodity-like products – such as standard cooking oil – could also be considered a commodity.
84
86
88
90
92
94
96
98
100
102
2014 2015 2016 2017 2018 2019 2020 2021 2022 2023 2024 2025 2030
Pri
ce in
dic
es in
rea
l 20
10
US
do
llars
(2
01
0=1
00
)

71
2.2.3. Seasonality of Perishable Products Creates Unique Competitive Advantages
Generally speaking, perishable items – ‘fresh’ crops with high rates of respiration60 – often have a greater value. The underlying cause of this increased value rests in the scarcity of the product. Scarcity of fresh products results from the short shelf life of horticultural items and of the limited seasons in which they grow. This creates supply issues. Differences in harvesting periods across geographies further reduces the intensity of competition on the global market at any one time, since producers only compete with others that have yields in the same time period. The seasonality of the products (in various producing regions) creates localized excess production or scarcity. As a result, the differences between the geographies of demand and supply at any given time can create a situation where producers of perishable products gain a bargaining advantage over otherwise price competitive markets.
At the most general level, markets in cooler climates often have a shortage in supply at the same time that warmer climates are yielding their supply. At a more nuanced level, yields only compete with others that produce in the same month or even week. This can be observed in Figure 35: The Supply and Price of Berries in the US, which depicts seasonality in consumer prices and domestic supply. As such, in the months where domestic US producers do not have a product, the competition is less intense and prices go up. Farmers that can supply markets during these weeks are able to appropriate a better margin during periods of scarcity. Thus, such supply gaps allow space for foreign producers to participate in these markets when domestic (or other sources of) supply are not available.
Figure 35: The Supply and Price of Berries in the US
Source: Schiavetti, 2016
60 The perishability of horticultural products is a function of the biological characteristics of the individual crop, as well as the manner in which the crop is controlled after harvest, including temperature and atmosphere control. Each product has a different temperature range that is suitable for its storage, transport, and ripening. These factors each affect the ‘respiration rate’ of the product, which determines how quickly it perishes.

72
Seasonality Analysis for Slavonia
Slavonia has a temperate, continental climate, but being a bit further south than the high-value markets in the rest of Europe, it can probably yield produce beyond the growing seasons of more northern countries (such as Germany). If Croatia can produce perishable crops at such times, it may be able to take advantage of regional scarcity in those markets. However, not all products hold the same potential. To demonstrate the differences in the opportunity that could exist, a selection of three fresh products61 currently grown in Croatia – apples, tomatoes and strawberries – was made to understand the extent to which perishability in products and inter-temporal scarcity in certain markets can enable producers to gain better prices.62 Other products, which have even higher levels of perishability, could have been chosen for the study, but the three that are listed were chosen because of their potential relevance for Slavonia. In summary:
• Fresh apples (HS080810) are grown in considerable quantities in Croatia. Across the country, 6,160 ha are cultivated and nearly 45,000 tons produced. Apples in general have low levels of perishability – their respiration rate is typically below 10 mg CO2/kg-hr – thus making their shelf life relatively long. Products with such long shelf lives tend to have pricing trends that look similarly flat to cereal commodities. Thus, it is likely that there will not be any substantial pricing opportunities arising from seasonality / perishability dimensions over the course of the year.
• Fresh tomatoes (HS070200) are only grown in small amounts in Croatia. Across the country, there are only 370 ha cultivated and nearly 31,000 tons produced. Tomatoes have a moderate level of perishability with a respiration rate of between 10-20 mg CO2/kg-hr. Thus, while they are not as commoditized as apples, they still have a reasonable shelf life. These products are more likely to be subject to some seasonality in pricing at the farm, import and consumer / retail levels.
• Fresh strawberries (HS081010) are grown in even smaller quantities in Croatia, on 367 ha of land, which only produced nearly 4,000 tons in 2016. Strawberries have a high rate of respiration (typically between 20-40 mg CO2/kg-hr) and cannot be commoditized (if consumed as a fresh product). Because of this, producers of strawberries are likely to get the highest price premiums if they can deliver out of season or in a different season compared with the rest of the world’s producers.
Therefore, as a starting point it will be useful to examine the average producer prices – the prices that Croatian farmers have received at the farm gate – to assess the extent to which their varying levels of respiration affect the commoditization of pricing on each of these products in Croatian markets at present (Figure 36: Croatian Producer Prices for Apples, Tomatoes and Strawberries)63 For example, the price of one kg of apples is not only relatively low, it is rather invariable between seasons, whereas tomatoes and strawberries deliver farmers a better price, albeit on more variable market terms.64
61 This study does not consider non-fresh or prepared products. For example, if any of the products were subsequently frozen, canned, pasteurized, etc. 62 Note that, without knowing peak harvest seasons for these crops or the agronomic conditions that are necessary to grow them, it will not be possible to advise on whether Slavonia will be able to benefit from scarcity in Europe. 63 Croatian producer price data was gathered from FAOSTAT. Prices for 2014-2016 were converted from the local currency unit (HRK) to USD at the historical average exchange rate for that month. The prices were then averaged over three years (to limit the effect of any individual production / weather anomalies on the price trend) and converted from tons to kg to make the data comparable with available trade data. Given variations in exchange rate and measurements, there is some room for data errors. 64 Note that these figures do not show input costs, and so we cannot infer the profitability of these products.

73
Figure 36: Croatian Producer Prices for Apples, Tomatoes and Strawberries
Source: FAOSTAT, 2017
A variation in price itself does not necessarily imply profit. However, it does reflect how the market values the product at different times of the year. This could indicate an opportunity for value capture. However, these figures are also only able to show how Croatian producers and markets – as currently organized – are able to produce. To make this information more useful, it is necessary to examine import values and prices in foreign markets in order to ascertain price disparities across markets.
Import Price Analysis for Apples
The global import market for fresh apples is not very concentrated, but the countries with the largest share of imports are luckily in Europe. In 2016, the largest importers of apples were Germany (6.4% of world imports at USD 472 million), the UK (5.6%, USD 415 million) and Russia (4.6%, USD 338 million). Thus, when considering these countries’ markets, it would be useful to look at a more nuanced analysis of the prices at which they typically buy.
Figure 37: Global Import Markets for Fresh Apples
Source: Atlas of Economic Complexity
$0.00
$1.00
$2.00
$3.00
$4.00
$5.00
$6.00
$7.00
$8.00U
SD/K
G
Average Price for 2014-2016
Average Producer Price of Apples (USD/KG) Average Producer Price of Tomatoes (USD/KG)
Average Producer Price of Strawberries (USD/KG)
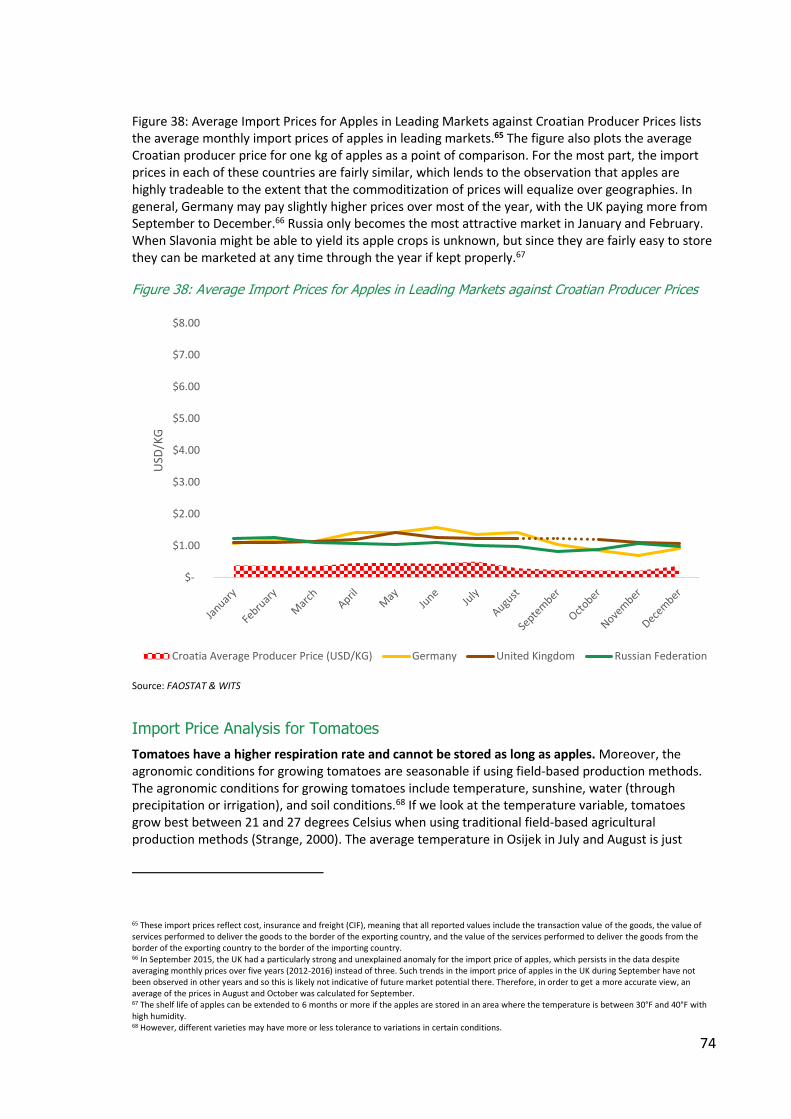
74
Figure 38: Average Import Prices for Apples in Leading Markets against Croatian Producer Prices lists the average monthly import prices of apples in leading markets.65 The figure also plots the average Croatian producer price for one kg of apples as a point of comparison. For the most part, the import prices in each of these countries are fairly similar, which lends to the observation that apples are highly tradeable to the extent that the commoditization of prices will equalize over geographies. In general, Germany may pay slightly higher prices over most of the year, with the UK paying more from September to December.66 Russia only becomes the most attractive market in January and February. When Slavonia might be able to yield its apple crops is unknown, but since they are fairly easy to store they can be marketed at any time through the year if kept properly.67
Figure 38: Average Import Prices for Apples in Leading Markets against Croatian Producer Prices
Source: FAOSTAT & WITS
Import Price Analysis for Tomatoes
Tomatoes have a higher respiration rate and cannot be stored as long as apples. Moreover, the agronomic conditions for growing tomatoes are seasonable if using field-based production methods. The agronomic conditions for growing tomatoes include temperature, sunshine, water (through precipitation or irrigation), and soil conditions.68 If we look at the temperature variable, tomatoes grow best between 21 and 27 degrees Celsius when using traditional field-based agricultural production methods (Strange, 2000). The average temperature in Osijek in July and August is just
65 These import prices reflect cost, insurance and freight (CIF), meaning that all reported values include the transaction value of the goods, the value of services performed to deliver the goods to the border of the exporting country, and the value of the services performed to deliver the goods from the border of the exporting country to the border of the importing country. 66 In September 2015, the UK had a particularly strong and unexplained anomaly for the import price of apples, which persists in the data despite averaging monthly prices over five years (2012-2016) instead of three. Such trends in the import price of apples in the UK during September have not been observed in other years and so this is likely not indicative of future market potential there. Therefore, in order to get a more accurate view, an average of the prices in August and October was calculated for September. 67 The shelf life of apples can be extended to 6 months or more if the apples are stored in an area where the temperature is between 30°F and 40°F with high humidity. 68 However, different varieties may have more or less tolerance to variations in certain conditions.
$-
$1.00
$2.00
$3.00
$4.00
$5.00
$6.00
$7.00
$8.00
USD
/KG
Croatia Average Producer Price (USD/KG) Germany United Kingdom Russian Federation
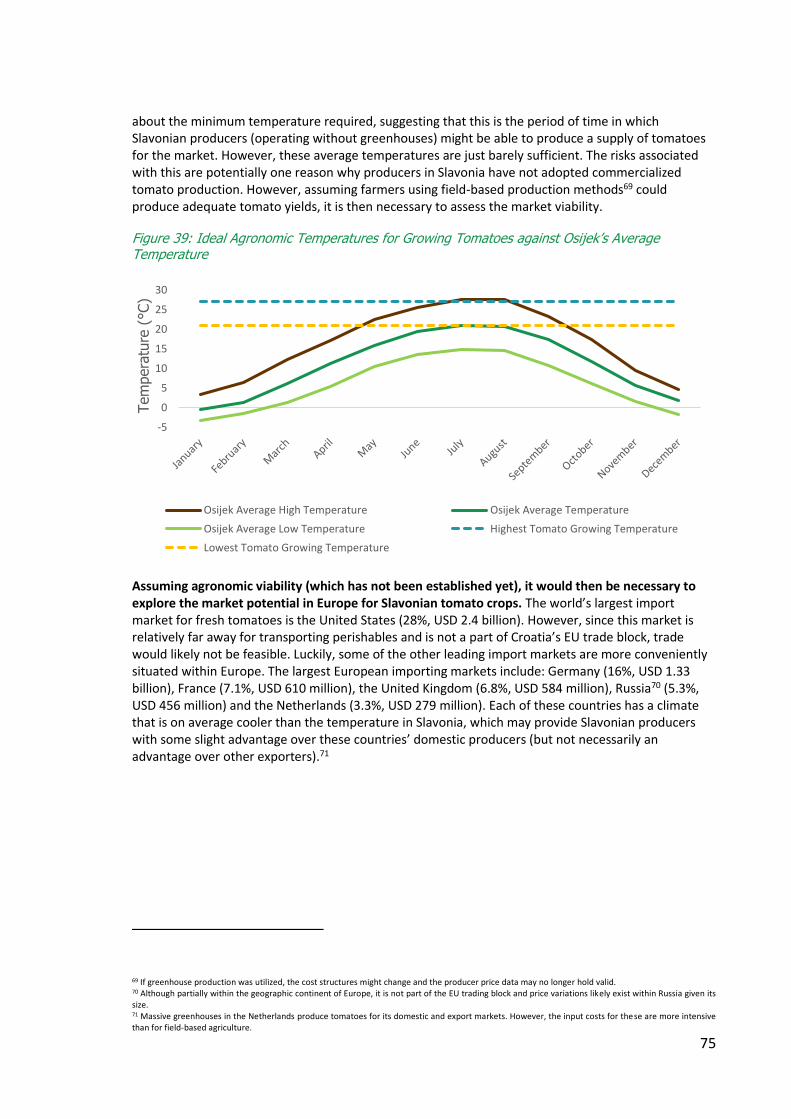
75
about the minimum temperature required, suggesting that this is the period of time in which Slavonian producers (operating without greenhouses) might be able to produce a supply of tomatoes for the market. However, these average temperatures are just barely sufficient. The risks associated with this are potentially one reason why producers in Slavonia have not adopted commercialized tomato production. However, assuming farmers using field-based production methods69 could produce adequate tomato yields, it is then necessary to assess the market viability.
Figure 39: Ideal Agronomic Temperatures for Growing Tomatoes against Osijek’s Average Temperature
Assuming agronomic viability (which has not been established yet), it would then be necessary to explore the market potential in Europe for Slavonian tomato crops. The world’s largest import market for fresh tomatoes is the United States (28%, USD 2.4 billion). However, since this market is relatively far away for transporting perishables and is not a part of Croatia’s EU trade block, trade would likely not be feasible. Luckily, some of the other leading import markets are more conveniently situated within Europe. The largest European importing markets include: Germany (16%, USD 1.33 billion), France (7.1%, USD 610 million), the United Kingdom (6.8%, USD 584 million), Russia70 (5.3%, USD 456 million) and the Netherlands (3.3%, USD 279 million). Each of these countries has a climate that is on average cooler than the temperature in Slavonia, which may provide Slavonian producers with some slight advantage over these countries’ domestic producers (but not necessarily an advantage over other exporters).71
69 If greenhouse production was utilized, the cost structures might change and the producer price data may no longer hold valid. 70 Although partially within the geographic continent of Europe, it is not part of the EU trading block and price variations likely exist within Russia given its size. 71 Massive greenhouses in the Netherlands produce tomatoes for its domestic and export markets. However, the input costs for these are more intensive than for field-based agriculture.
-5
0
5
10
15
20
25
30
Tem
pera
ture
(°C
)
Osijek Average High Temperature Osijek Average Temperature
Osijek Average Low Temperature Highest Tomato Growing Temperature
Lowest Tomato Growing Temperature

76
Figure 40: Global Import Markets for Fresh Tomatoes
Source: Atlas of Economic Complexity
To further nuance the opportunity, it is important to benchmark prices for fresh tomatoes in each of these countries during various months of the year. It would be especially important to zero in on those months where Slavonian farmers could potentially produce a crop (i.e. July and August). Figure 41: Croatian Farm Gate Producer Prices for Tomatoes Against average European Import Prices maps out the average Croatian producer prices72 (at the farm gate) against the average import price for 2014-2016 in the top 5 import markets.
Figure 41: Croatian Farm Gate Producer Prices for Tomatoes Against average European Import Prices
Source: FAOSTAT & WITS
72 Croatian producer price data was gathered from FAOSTAT. Prices for 2014-2016 were converted from the local currency unit (HRK) to USD at the historical average exchange rate for that month. The prices were then averaged over three years and converted from tons to kg to make the data comparable with available trade data. Given variations in exchange rates and measurements, there is some room for data errors.
$0.00
$1.00
$2.00
$3.00
$4.00
$5.00
$6.00
$7.00
$8.00
USD
/KG
Average Croatian Producer Price (USD/KG) Likely Producer Season in Croatia
EU Import Price Average Germany Import Price
Average France Import Price Average UK Import Price
Average Russia Import Price Average Netherlands Import Price

77
During the harvest period in July and August, Croatian producer prices for one kg of tomatoes drops, given that they are in more abundant supply in the immediate area. However, at the same time other parts of Europe (and indeed the world) face a relative scarcity. This can be observed when comparing the producer price in Croatia to the average import price in those markets during different months of the year. Germany on average pays the most for tomatoes during the months of both July (USD 2.25/kg) and August (USD 2.01/kg), followed by the UK and Russia. Croatia can purportedly produce one kg of tomatoes for USD 0.71 and USD 0.24 during those months respectively. Presumably, if Croatian producers could supply a fresh product of equal or greater quality, it could capture the difference after subtracting insurance, freight and other marketing costs.73 In March (if Slavonian producers could produce tomatoes then), such cost containment seems very unlikely. However, there may be more scope for participation in July and August (again assuming that production would be agronomically feasible).74 Assuming the cost of production stayed constant, Croatia would just need to ensure it had sufficient economies of scale (see Box 1) to contain post-farm marketing costs.
Box 1: Competitor Analysis for the Tomato Import Market in Germany
After identifying which import markets are most attractive on average, it is also important to consider the competition that Croatia may face in these import markets for those months. The top 5 exporters of tomatoes to Germany during these months include the Netherlands, Spain, Belgium, France, and Italy. Belgium is able to sell in Germany at the most competitive prices. However, the lion’s share of the market is delivered by the Netherlands. Such prices are still within the range of Croatia’s current producer price. However, it would have to scale up its production (ha planted and tons produced) in order to match the quantities these countries deliver. Such countries’ volumes and prices can serve as a more precise benchmark for Slavonian producers.
Table 4: Competitor Analysis for the German Tomato Market
Netherlands Spain Belgium France Italy
July Price (USD/KG)
USD 1.46 USD 1.80 USD 1.12 USD 2.32 USD 1.76
Value (Total) USD 71,191,208
USD 14,501,928
USD 6,611,229
USD 6,737,190
USD 4,311,023
August Price (USD/KG)
USD 1.46 USD 1.94 USD 1.20 USD 2.49 USD 1.90
Value (Total) USD 68,164,577
USD 11,598,321
USD 6,448,531
USD 3,719,452
USD 3,554,422
The current tomato production and exports (USD 7.9 million in 2017) of Croatia suggest that it is not competitive in this area. A lot of these exports are likely to originate from further south in Dalmatia, where the conditions for growing are better. The reason why Slavonia has not produced significant quantities of commercial tomatoes could be due to the agronomic risks to production in any given
73 Unit costs of insurance and freight were not available for this study. 74 Such price differentials would only be feasible if the cost of transport, insurance, and other services could be contained in the gap between the producer price and the average import price.

78
season resulting from the weather or other factors. Thus, while there could be some limited potential for value capture through exports, the risks in any given season would likely not outweigh the benefits. As a result, this is one reason why commercial producers in Slavonia have not adopted tomato production.
Import Price Analysis for Strawberries
The agronomic conditions to grow strawberries similarly include temperature. Strawberries grow best between 15 and 27 degrees Celsius when using traditional field-based agricultural production methods (Figure 42: Ideal Agronomic Temperatures for Growing Strawberries against Osijek’s Average Temperature). As such, these temperatures provide suitable growing conditions for Slavonian producers (operating without greenhouses) between May and October. Moreover, strawberries are known to be grown in sufficient quantities in neighboring Serbia, suggesting that this could also be agronomically possible for Slavonian producers.
Figure 42: Ideal Agronomic Temperatures for Growing Strawberries against Osijek’s Average Temperature
Similar to apples and tomatoes, the largest market potential for strawberries is in Europe (see Figure 43: Global Import Markets for Fresh Strawberries). In 2016, the largest importers of strawberries were Germany (11% of world imports at USD 274 million), the UK (8.6%, USD 222 million) and France (7%, USD 179 million). Germany, the UK and most of France have a climate that is on average cooler than the temperature in Slavonia, which may provide it with some slight advantage over these countries’ domestic producers (but not necessarily an advantage over other exporters).75 Thus, considering these countries’ markets, it would be useful to look at a more nuanced analysis of the prices at which they typically buy.
75 Massive greenhouses in the Netherlands produce tomatoes for its domestic and export markets. However, the input costs for these are more intensive than field-based agriculture. Being further south, the Slavonian season for field-based agriculture may extend slightly beyond the more limited period of field-based production in these more northerly countries.
-5
0
5
10
15
20
25
30
Ave
rage
Tem
per
atu
re (
°C)
Osijek High Osijek Average Temperature Osijek Low
Strawberry Growing High Strawberry Growing Low
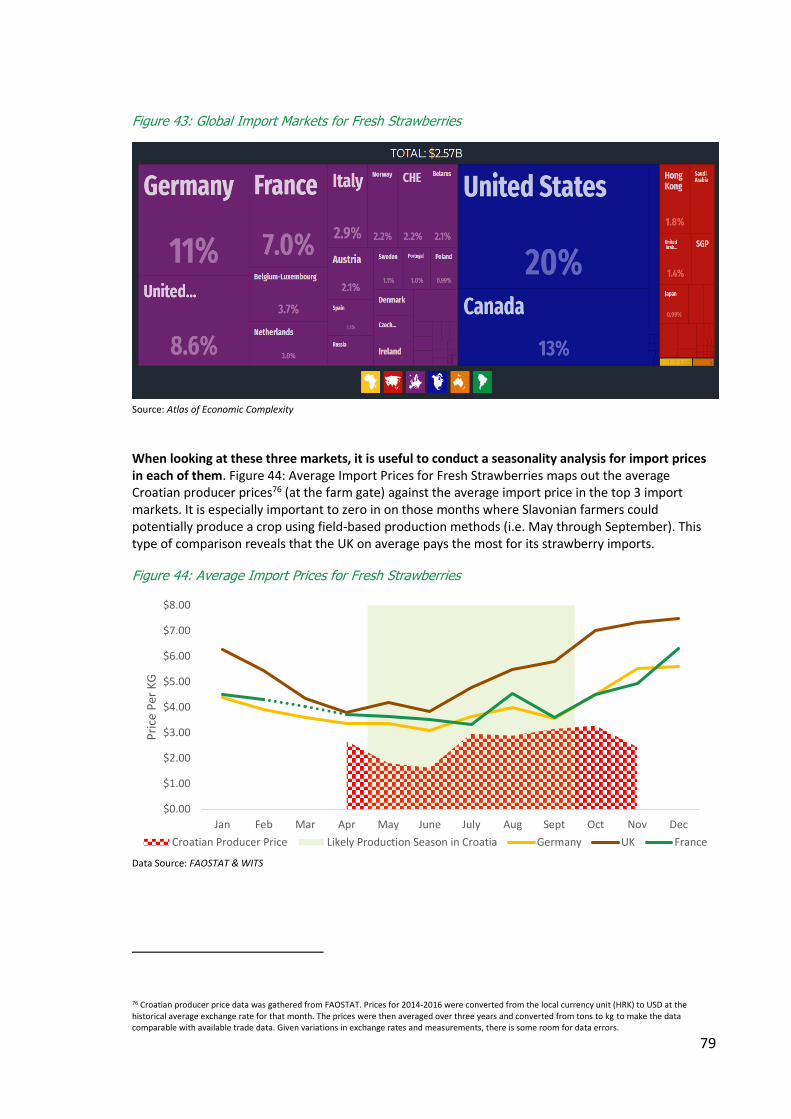
79
Figure 43: Global Import Markets for Fresh Strawberries
Source: Atlas of Economic Complexity
When looking at these three markets, it is useful to conduct a seasonality analysis for import prices in each of them. Figure 44: Average Import Prices for Fresh Strawberries maps out the average Croatian producer prices76 (at the farm gate) against the average import price in the top 3 import markets. It is especially important to zero in on those months where Slavonian farmers could potentially produce a crop using field-based production methods (i.e. May through September). This type of comparison reveals that the UK on average pays the most for its strawberry imports.
Figure 44: Average Import Prices for Fresh Strawberries
Data Source: FAOSTAT & WITS
76 Croatian producer price data was gathered from FAOSTAT. Prices for 2014-2016 were converted from the local currency unit (HRK) to USD at the historical average exchange rate for that month. The prices were then averaged over three years and converted from tons to kg to make the data comparable with available trade data. Given variations in exchange rates and measurements, there is some room for data errors.
$0.00
$1.00
$2.00
$3.00
$4.00
$5.00
$6.00
$7.00
$8.00
Jan Feb Mar Apr May June July Aug Sept Oct Nov Dec
Pri
ce P
er K
G
Croatian Producer Price Likely Production Season in Croatia Germany UK France
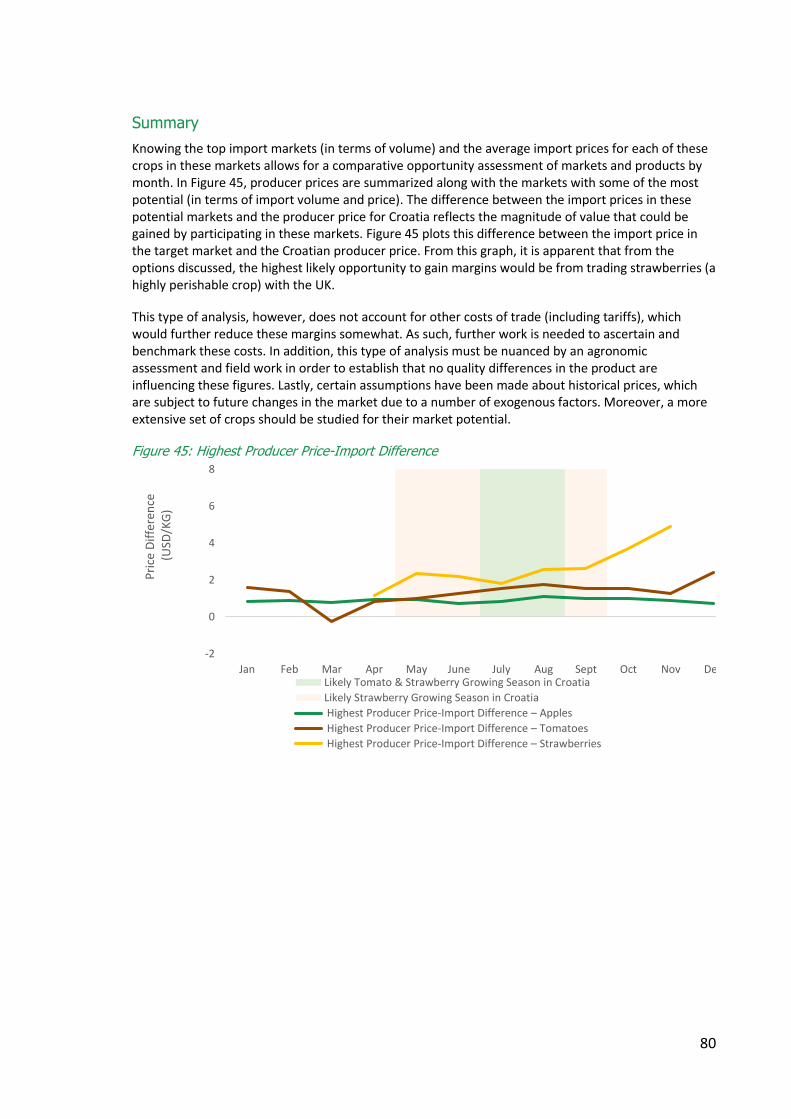
80
Summary
Knowing the top import markets (in terms of volume) and the average import prices for each of these crops in these markets allows for a comparative opportunity assessment of markets and products by month. In Figure 45, producer prices are summarized along with the markets with some of the most potential (in terms of import volume and price). The difference between the import prices in these potential markets and the producer price for Croatia reflects the magnitude of value that could be gained by participating in these markets. Figure 45 plots this difference between the import price in the target market and the Croatian producer price. From this graph, it is apparent that from the options discussed, the highest likely opportunity to gain margins would be from trading strawberries (a highly perishable crop) with the UK.
This type of analysis, however, does not account for other costs of trade (including tariffs), which would further reduce these margins somewhat. As such, further work is needed to ascertain and benchmark these costs. In addition, this type of analysis must be nuanced by an agronomic assessment and field work in order to establish that no quality differences in the product are influencing these figures. Lastly, certain assumptions have been made about historical prices, which are subject to future changes in the market due to a number of exogenous factors. Moreover, a more extensive set of crops should be studied for their market potential.
Figure 45: Highest Producer Price-Import Difference
-2
0
2
4
6
8
Jan Feb Mar Apr May June July Aug Sept Oct Nov Dec
Pri
ce D
iffe
ren
ce
(USD
/KG
)
Likely Tomato & Strawberry Growing Season in Croatia
Likely Strawberry Growing Season in Croatia
Highest Producer Price-Import Difference – Apples
Highest Producer Price-Import Difference – Tomatoes
Highest Producer Price-Import Difference – Strawberries
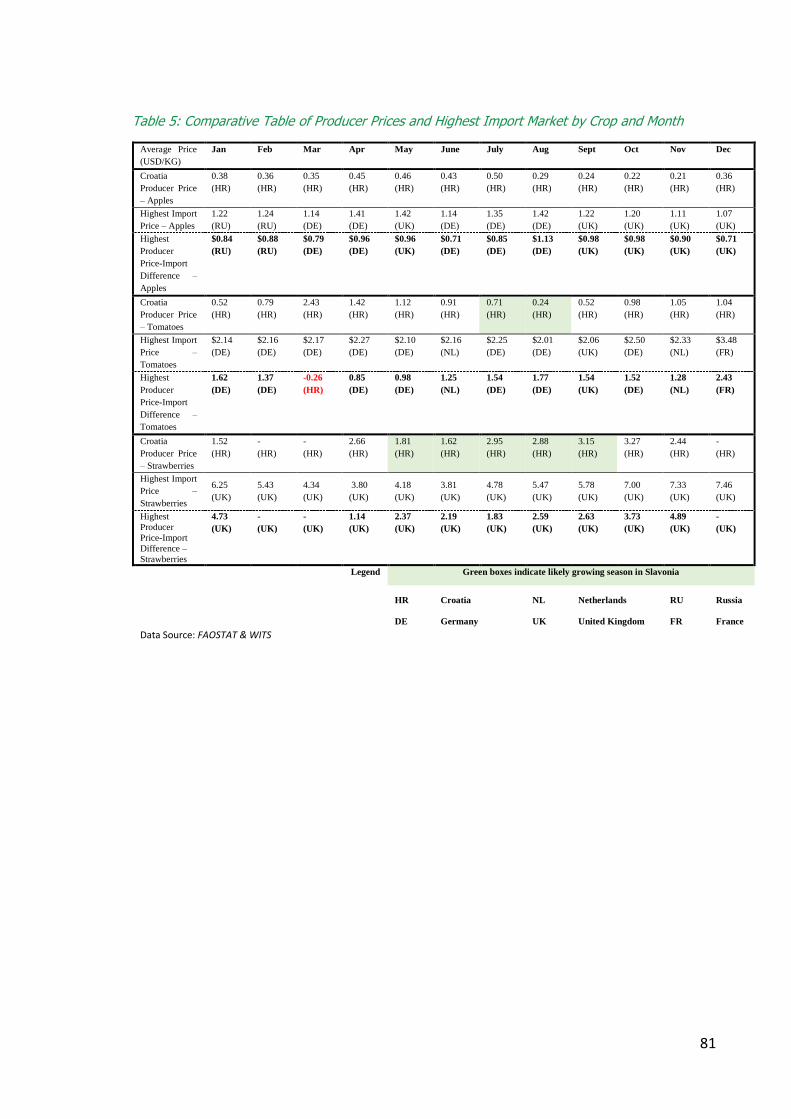
81
Table 5: Comparative Table of Producer Prices and Highest Import Market by Crop and Month
Average Price
(USD/KG)
Jan Feb Mar Apr May June July Aug Sept Oct Nov Dec
Croatia
Producer Price
– Apples
0.38
(HR)
0.36
(HR)
0.35
(HR)
0.45
(HR)
0.46
(HR)
0.43
(HR)
0.50
(HR)
0.29
(HR)
0.24
(HR)
0.22
(HR)
0.21
(HR)
0.36
(HR)
Highest Import
Price – Apples
1.22
(RU)
1.24
(RU)
1.14
(DE)
1.41
(DE)
1.42
(UK)
1.14
(DE)
1.35
(DE)
1.42
(DE)
1.22
(UK)
1.20
(UK)
1.11
(UK)
1.07
(UK)
Highest
Producer
Price-Import
Difference –
Apples
$0.84
(RU)
$0.88
(RU)
$0.79
(DE)
$0.96
(DE)
$0.96
(UK)
$0.71
(DE)
$0.85
(DE)
$1.13
(DE)
$0.98
(UK)
$0.98
(UK)
$0.90
(UK)
$0.71
(UK)
Croatia
Producer Price
– Tomatoes
0.52
(HR)
0.79
(HR)
2.43
(HR)
1.42
(HR)
1.12
(HR)
0.91
(HR)
0.71
(HR)
0.24
(HR)
0.52
(HR)
0.98
(HR)
1.05
(HR)
1.04
(HR)
Highest Import
Price –
Tomatoes
$2.14
(DE)
$2.16
(DE)
$2.17
(DE)
$2.27
(DE)
$2.10
(DE)
$2.16
(NL)
$2.25
(DE)
$2.01
(DE)
$2.06
(UK)
$2.50
(DE)
$2.33
(NL)
$3.48
(FR)
Highest
Producer
Price-Import
Difference –
Tomatoes
1.62
(DE)
1.37
(DE)
-0.26
(HR)
0.85
(DE)
0.98
(DE)
1.25
(NL)
1.54
(DE)
1.77
(DE)
1.54
(UK)
1.52
(DE)
1.28
(NL)
2.43
(FR)
Croatia
Producer Price
– Strawberries
1.52
(HR)
-
(HR)
-
(HR)
2.66
(HR)
1.81
(HR)
1.62
(HR)
2.95
(HR)
2.88
(HR)
3.15
(HR)
3.27
(HR)
2.44
(HR)
-
(HR)
Highest Import
Price –
Strawberries
6.25
(UK)
5.43
(UK)
4.34
(UK)
3.80
(UK)
4.18
(UK)
3.81
(UK)
4.78
(UK)
5.47
(UK)
5.78
(UK)
7.00
(UK)
7.33
(UK)
7.46
(UK)
Highest
Producer
Price-Import
Difference –
Strawberries
4.73
(UK)
-
(UK)
-
(UK)
1.14
(UK)
2.37
(UK)
2.19
(UK)
1.83
(UK)
2.59
(UK)
2.63
(UK)
3.73
(UK)
4.89
(UK)
-
(UK)
Legend Green boxes indicate likely growing season in Slavonia
HR Croatia NL Netherlands RU Russia
DE Germany UK United Kingdom FR France
Data Source: FAOSTAT & WITS

82
2.3. Success stories of smallholder inclusive value-chain development
There are many relevant examples of agri-food value chains in which smallholders successfully participate. Multiple positive experiences of participation of smallholders in short and long value chains in the region, including Slavonia, demonstrate that when enabling factors are in place, successful integration is possible. The following examples could serve as interesting aspirational models for pursuing broader mainstreaming actions / programs for smallholder value-chain integration in Slavonia.
Vukovarsko-Srijemska County: Asparagus cooperative going international
The ‘Vinkovci Asparagus’ cooperative is just 5 years old but builds on 2 decades of experience of individual farmers who experimented with producing asparagus on limited acreage (1 ha). Today, the cooperative comprises 10 members and produces on an area of around 100 ha. More than 45% of the asparagus is exported, for the time being exclusively to the EU market, mostly to Italy. The main buyer is REWE, one of the largest European retail chains, and partly BILLA from the Czech Republic. It is interesting how this small cooperative, with its rather modest volume of production, has managed to become a supplier of one the largest retail chains.
Mirko Bošković is the co-operative manager, the main driver of all activities and the largest producer. He noted that the quality of the local land is better utilized for high-value crops, which ensures higher incomes. The yields achieved by the cooperative are almost 20% higher than the average yield in Germany, which is one of the leading asparagus producers in Europe. There are only a few areas that are currently irrigated, but there is great potential for this to change. Asparagus production is seasonal, lasting from April to the middle of June, enabling producers to grow other crops during the same year and providing them with additional income. The successful production of asparagus is complemented by the production of other vegetables such as peas, sweet maize, carrots, and peppers.
The possibility of creating added value and profit lies in the freezing of vegetables. They already have an offer from the biggest producer of frozen vegetables in Europe, the Belgian company ARDO, which is delighted with the quality of the asparagus from Vinkovci, which they say is the best they have bought. The cooperative members believe that in about 3-4 years, it is possible to expand production to 500 hectares in their county alone, and there is also interest in nearby Slavonian counties. The long-term plan is to switch to organic production.
Kutjevo, Požeško-Slavonska County: Horizontal cooperation and vertical integration in the dairy sector
The ‘Simentalac’ cooperative was founded ten years ago and is connected to an initiative of Simmental cattle producers in 2001, when mostly younger producers who had become farm holders gathered to improve breeding and exchange experiences in milk and meat production. After a decade of non-profitable activities and the reunification of members and their families, the initiative started to grow into the organizational form of a cooperative, which started its professional market activity in 2010.
The members were inspired by the experiences of similar organizations of producers and cooperatives in the EU (mostly in Austria, Germany and Denmark), which they wanted to transfer to the area of their work in Požeško-Slavonska County. There are 13 founding members, who have gradually expanded their activities in the vertical chain from livestock production, meat and milk production, processing, distribution and sales to small cooperative-owned shops. In 2012, the cooperative established a veterinary clinic, and in 2017, the cooperative saved the small local dairy company ‘BIZ’ from bankruptcy by taking over its debts to banks and becoming its owner, and continuing with the production of dairy products.
The success of the cooperative is evident is based on: (i) its members retaining a large number of livestock, despite the fact that the region has shown a huge drop in such numbers; (ii) the cooperative has positive production results, creates added value, employs around 35 people (half of whom are
83
women) and ensured the existence of more than 80 families that link their production to the cooperative; (iii) dairy products carry the recognizable ‘Golden Valley’ brand which is strongly associated with the features of the local environment and the high quality of the product.
In the beginning, the majority of sales went directly through its smaller retail outlets, but now most of the sales are through established retail chains (Spar at national level, Konzum, Lidl, and Kaufland at local level). The cooperative manager, Miroslav Kovač, has spent his entire life in the field with producers, knows their needs, development limits, and mentality. In the example of this and other cooperatives, it has been confirmed that it is crucial to create mutual trust among members, and to take ‘small steps’, democratically and voluntarily, because the concept of cooperatives in socialism was greatly compromised, and the consequences of this period are still felt today.
Mr Kovač points out that great momentum for the co-operative came with Croatia joining the EU, as it became possible to use significant initial capital to start the work of producer organizations in accordance with the framework prescribed for all member states. After a series of administrative difficulties, the cooperative was one of the first in Croatia to obtain the status of a producer organization (PO) in 2015 and to use funds to expand its membership to a total of 44 farms in four Slavonian counties and one neighboring county in central Croatia. Support for the establishment of the PO was also the first financial aid they received as a cooperative. In 2018, their request for financial support under the Rural Development Program (M4.1.1) was approved, which will enable them to build and furnish a new modern facility and double their current production. Although the grant is generous and amounts to 50% of the investment, it will not be easy to secure the second half of the investment. Both this cooperative and many other producers point to the problems that relatively small investors have with commercial banks that generally prefer large businesses and large investments. However, they believe in the success and sustainability of their project.
Basque Country, Spain:
Strategic planning to develop competitive and resilient supply chains for
smallholders
Similar to Slavonia, agriculture in the Basque Country in Spain is characterized by large numbers of small farms with low productivity that are facing long-term problems in terms of the competitiveness of local products, the ageing of the farming community, and the loss of skilled labor. To address these issues, the Basque government has developed a Strategic Regional Plan for a Competitive Agri-food Industry (PCAI) that is managed by the Department for Agriculture, Fisheries and Food with the aim of boosting the development of a competitive and resilient agri-food industry in the region, with a specific emphasis upon local high-quality products from smaller-scale producers. The PCAI has five main approaches to achieve its objectives: (i) boosting innovation and technology transfer to generate added value for smallholder products; (ii) facilitating the transfer of necessary knowledge and skills to increase the level of professionalism in certain aspects of supply chain development (e.g. marketing, e-business); (iii) supporting actions to encourage both horizontal cooperation amongst smallholders and more vertical cooperation in the value chain – all with a focus on seeking synergies and building complementarity; (iv) creating new inter-relationships between local smallholders and the food industry to increase the presence of Basque food products in local, regional, national and international markets; and (v) providing the necessary financial tools to finance cooperative joint ventures in the value chain while sharing the risk.
Latin America:
Competitiveness through Productive Alliances
In order to improve smallholder linkages to formal domestic markets, the World Bank Group has also supported governments in Latin America to develop and implement a value-chain development approach known as ‘Productive Alliances’ that links smaller producers, buyers and the public sector. A Productive Alliance (PA) involves three core agents: a group of smallholder producers, one or more
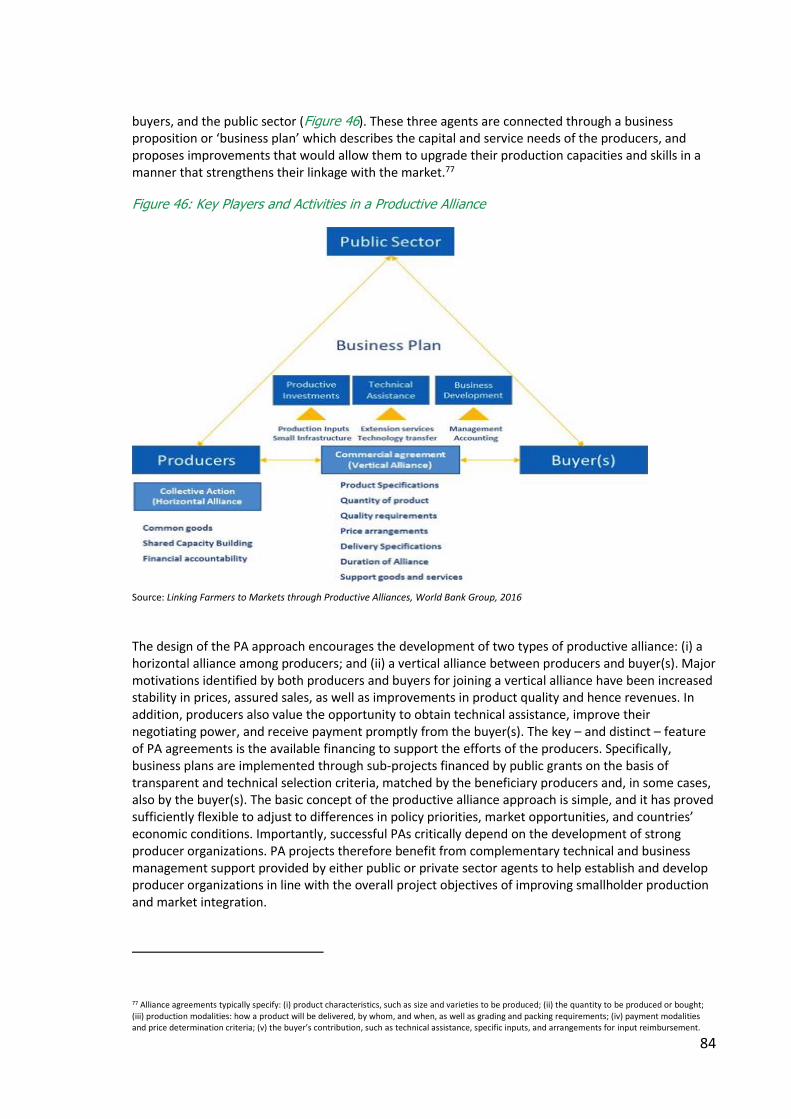
84
buyers, and the public sector (Figure 46). These three agents are connected through a business proposition or ‘business plan’ which describes the capital and service needs of the producers, and proposes improvements that would allow them to upgrade their production capacities and skills in a manner that strengthens their linkage with the market.77
Figure 46: Key Players and Activities in a Productive Alliance
Source: Linking Farmers to Markets through Productive Alliances, World Bank Group, 2016
The design of the PA approach encourages the development of two types of productive alliance: (i) a horizontal alliance among producers; and (ii) a vertical alliance between producers and buyer(s). Major motivations identified by both producers and buyers for joining a vertical alliance have been increased stability in prices, assured sales, as well as improvements in product quality and hence revenues. In addition, producers also value the opportunity to obtain technical assistance, improve their negotiating power, and receive payment promptly from the buyer(s). The key – and distinct – feature of PA agreements is the available financing to support the efforts of the producers. Specifically, business plans are implemented through sub-projects financed by public grants on the basis of transparent and technical selection criteria, matched by the beneficiary producers and, in some cases, also by the buyer(s). The basic concept of the productive alliance approach is simple, and it has proved sufficiently flexible to adjust to differences in policy priorities, market opportunities, and countries’ economic conditions. Importantly, successful PAs critically depend on the development of strong producer organizations. PA projects therefore benefit from complementary technical and business management support provided by either public or private sector agents to help establish and develop producer organizations in line with the overall project objectives of improving smallholder production and market integration.
77 Alliance agreements typically specify: (i) product characteristics, such as size and varieties to be produced; (ii) the quantity to be produced or bought; (iii) production modalities: how a product will be delivered, by whom, and when, as well as grading and packing requirements; (iv) payment modalities and price determination criteria; (v) the buyer’s contribution, such as technical assistance, specific inputs, and arrangements for input reimbursement.
85
Tukums, Latvia: Using advisory services to connect smallholders to large local
public buyers
Support for advisory services (M2 of the RDP) can be used to fund a variety of actions that build the knowledge, experience and technical capacity of farm advisors and other extension services. The measure is currently being used in a very innovative way in a community in Latvia to engage local advisers in building a short supply chain between local farmers and consumers. One of the 26 Rural Advisory and Research Centers in Latvia, which form the local branches of the National Agricultural Advisory Service, is currently using RDP M2 to connect producers to public authorities looking to procure local sources of food and drink. The advisers have helped develop and implement the Tukums Urban Food Strategy, which was initiated in response to stakeholder consultations which revealed that 90% of farms in the Tukums municipality are small with limited market opportunities, whilst almost 100 percent of public catering facilities, including school meals, were sourcing food from outside the municipality. The Strategy is focused on: (i) developing new public procurement procedures for local smallholders to contribute to school meals provision in 2017-2021, including ensured proof of origin, targets and mechanisms aimed at healthy nutrition (balanced menus, education of cooks, etc.); (ii) setting up a ‘school fruit’ program ensuring a direct supply of fresh products from local smallholders to seven school kitchens which organize procurement themselves; (iii) integrating local smallholders with an existing centralized service provision via a school catering company contracted by the municipality for 14 urban educational and care establishments, including kindergartens, hospitals and care homes; and (iv) organizing on-farm educational activities and excursions to local smallholdings for children.
Slovenia: Using LEADER to meet the requirements of new marketing channels
The local development strategies developed by LEADER local action groups (LAGs) have great potential to support smallholders in local and regional value-chain initiatives. In Slovenia, the Jarina cooperative accessed LEADER funding through the ‘Heart of Slovenia’ LAG to support the organization of local producers to take advantage of the particular opportunity presented by a newly opened public food market. Jarina sought to overcome the barriers to accessing the market by facilitating cooperation between a network of over 100 local smallholders. The cooperative has organized the whole supply chain in order to match up the relative requirements and capacities of producers and purchasers, picking up goods from farms and delivering them to buyers. They implement a market-led approach, combining the goods of multiple producers to achieve collectively the consistency and quality of supply needed to satisfy the market. Through working with Jarina, local producers are able to concentrate on their core activity of food production, leaving the cooperative to help identify and develop the market. At the other end of the supply chain, Jarina has worked with schools and kindergartens to raise their awareness of the (seasonal) availability and potential uses of local ingredients, and to support them in forming a consortium for coordinating food purchase. It has linked these discussions with the development of educational programs aiming to promote the benefits of consuming local produce to children and their families. 80% of the total project costs were funded under LEADER.
Bulgaria: Promoting GlobalG.A.P. certification
In 2016, the International Finance Corporation (IFC) Food Safety Advisory launched a program with Kaufland Bulgaria. This program supports smaller local suppliers of fruit and vegetables in improving food safety, as well as environmental and social practices. IFC and Kaufland also partnered GLOBALG.A.P. and BulG.A.P. to deliver training and farm consultations to growers from early spring until the certification audits during harvest. All growers involved eventually received GLOBALG.A.P. certification. Following this positive example, IFC and Kaufland have launched comparable GLOBALG.A.P. certification training in Romania.
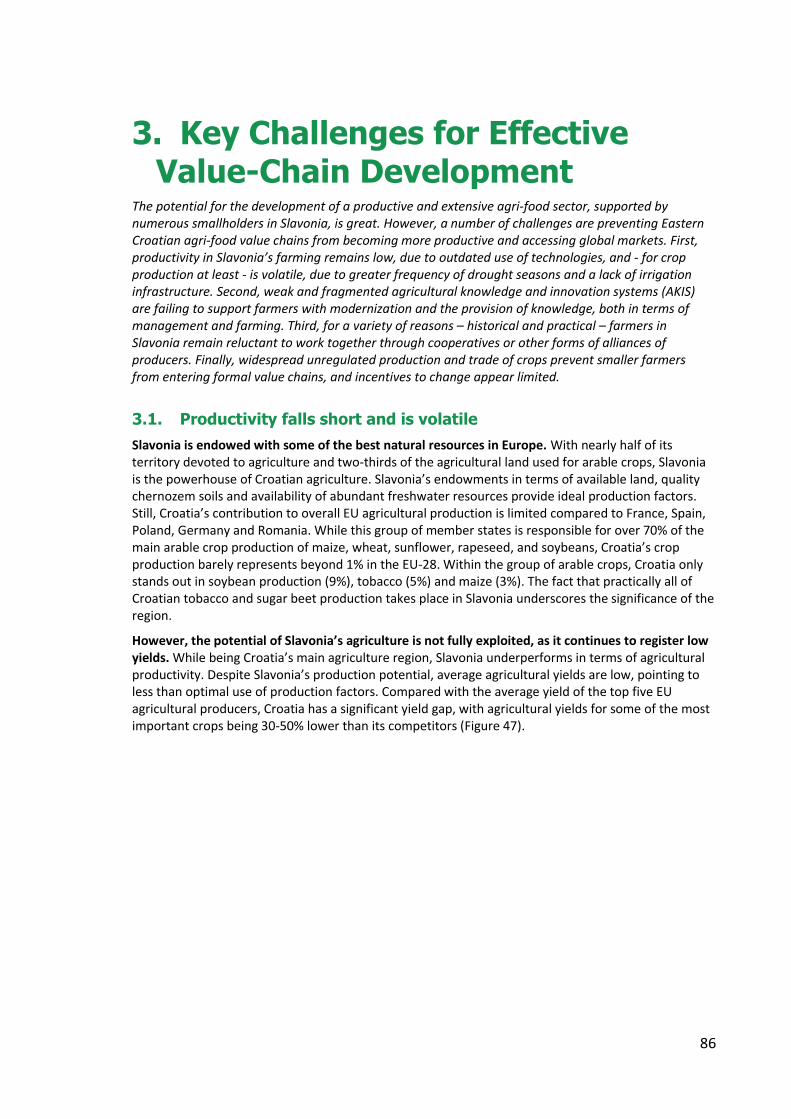
86
3. Key Challenges for Effective Value-Chain Development
The potential for the development of a productive and extensive agri-food sector, supported by numerous smallholders in Slavonia, is great. However, a number of challenges are preventing Eastern Croatian agri-food value chains from becoming more productive and accessing global markets. First, productivity in Slavonia’s farming remains low, due to outdated use of technologies, and - for crop production at least - is volatile, due to greater frequency of drought seasons and a lack of irrigation infrastructure. Second, weak and fragmented agricultural knowledge and innovation systems (AKIS) are failing to support farmers with modernization and the provision of knowledge, both in terms of management and farming. Third, for a variety of reasons – historical and practical – farmers in Slavonia remain reluctant to work together through cooperatives or other forms of alliances of producers. Finally, widespread unregulated production and trade of crops prevent smaller farmers from entering formal value chains, and incentives to change appear limited.
3.1. Productivity falls short and is volatile
Slavonia is endowed with some of the best natural resources in Europe. With nearly half of its territory devoted to agriculture and two-thirds of the agricultural land used for arable crops, Slavonia is the powerhouse of Croatian agriculture. Slavonia’s endowments in terms of available land, quality chernozem soils and availability of abundant freshwater resources provide ideal production factors. Still, Croatia’s contribution to overall EU agricultural production is limited compared to France, Spain, Poland, Germany and Romania. While this group of member states is responsible for over 70% of the main arable crop production of maize, wheat, sunflower, rapeseed, and soybeans, Croatia’s crop production barely represents beyond 1% in the EU-28. Within the group of arable crops, Croatia only stands out in soybean production (9%), tobacco (5%) and maize (3%). The fact that practically all of Croatian tobacco and sugar beet production takes place in Slavonia underscores the significance of the region.
However, the potential of Slavonia’s agriculture is not fully exploited, as it continues to register low yields. While being Croatia’s main agriculture region, Slavonia underperforms in terms of agricultural productivity. Despite Slavonia’s production potential, average agricultural yields are low, pointing to less than optimal use of production factors. Compared with the average yield of the top five EU agricultural producers, Croatia has a significant yield gap, with agricultural yields for some of the most important crops being 30-50% lower than its competitors (Figure 47).
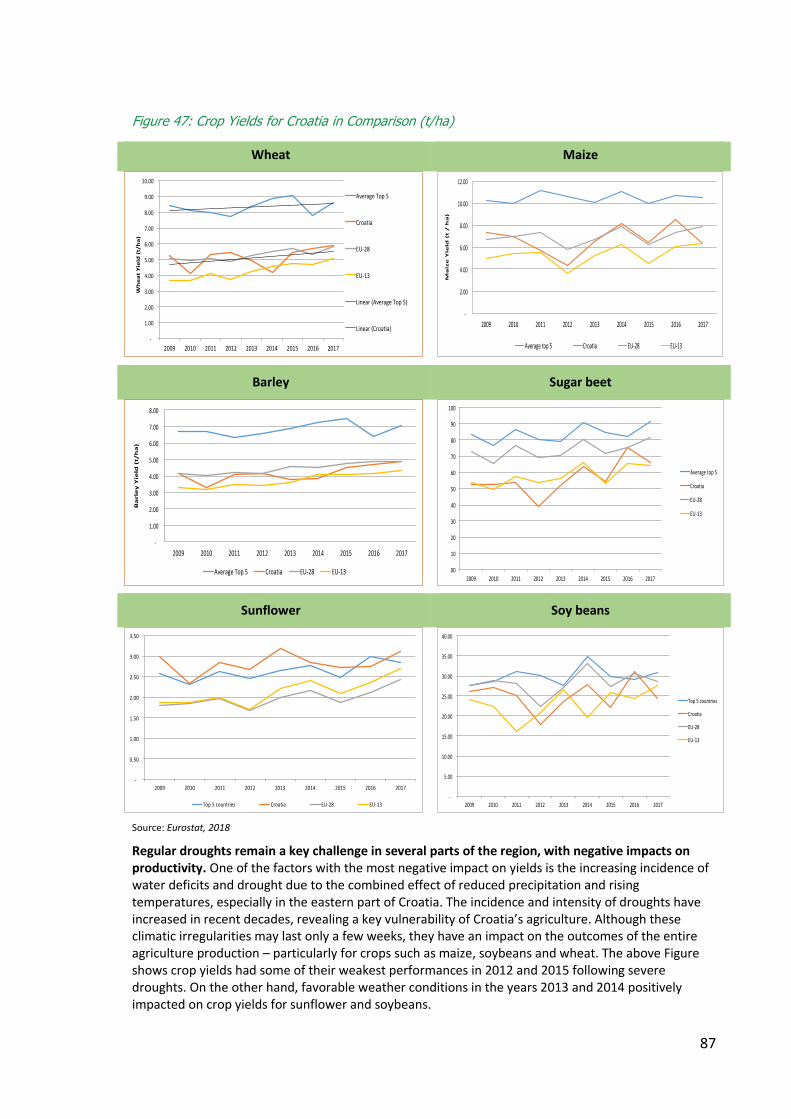
87
Figure 47: Crop Yields for Croatia in Comparison (t/ha)
Wheat Maize
Barley Sugar beet
Sunflower Soy beans
Source: Eurostat, 2018
Regular droughts remain a key challenge in several parts of the region, with negative impacts on productivity. One of the factors with the most negative impact on yields is the increasing incidence of water deficits and drought due to the combined effect of reduced precipitation and rising temperatures, especially in the eastern part of Croatia. The incidence and intensity of droughts have increased in recent decades, revealing a key vulnerability of Croatia’s agriculture. Although these climatic irregularities may last only a few weeks, they have an impact on the outcomes of the entire agriculture production – particularly for crops such as maize, soybeans and wheat. The above Figure shows crop yields had some of their weakest performances in 2012 and 2015 following severe droughts. On the other hand, favorable weather conditions in the years 2013 and 2014 positively impacted on crop yields for sunflower and soybeans.
-
1.00
2.00
3.00
4.00
5.00
6.00
7.00
8.00
9.00
10.00
2009 2010 2011 2012 2013 2014 2015 2016 2017
WheatYield(t/ha)
AverageTop5
Croatia
EU-28
EU-13
Linear(AverageTop5)
Linear(Croatia)
-
2.00
4.00
6.00
8.00
10.00
12.00
2009 2010 2011 2012 2013 2014 2015 2016 2017
MaizeYield(t/ha)
Averagetop5 Croatia EU-28 EU-13
-
1.00
2.00
3.00
4.00
5.00
6.00
7.00
8.00
2009 2010 2011 2012 2013 2014 2015 2016 2017
BarleyYield(t/ha)
AverageTop5 Croatia EU-28 EU-13 00
10
20
30
40
50
60
70
80
90
100
2009 2010 2011 2012 2013 2014 2015 2016 2017
Averagetop5
Croatia
EU-28
EU-13
-
0.50
1.00
1.50
2.00
2.50
3.00
3.50
2009 2010 2011 2012 2013 2014 2015 2016 2017
Top5countries Croatia EU-28 EU-13-
5.00
10.00
15.00
20.00
25.00
30.00
35.00
40.00
2009 2010 2011 2012 2013 2014 2015 2016 2017
Top5countries
Croatia
EU-28
EU-13
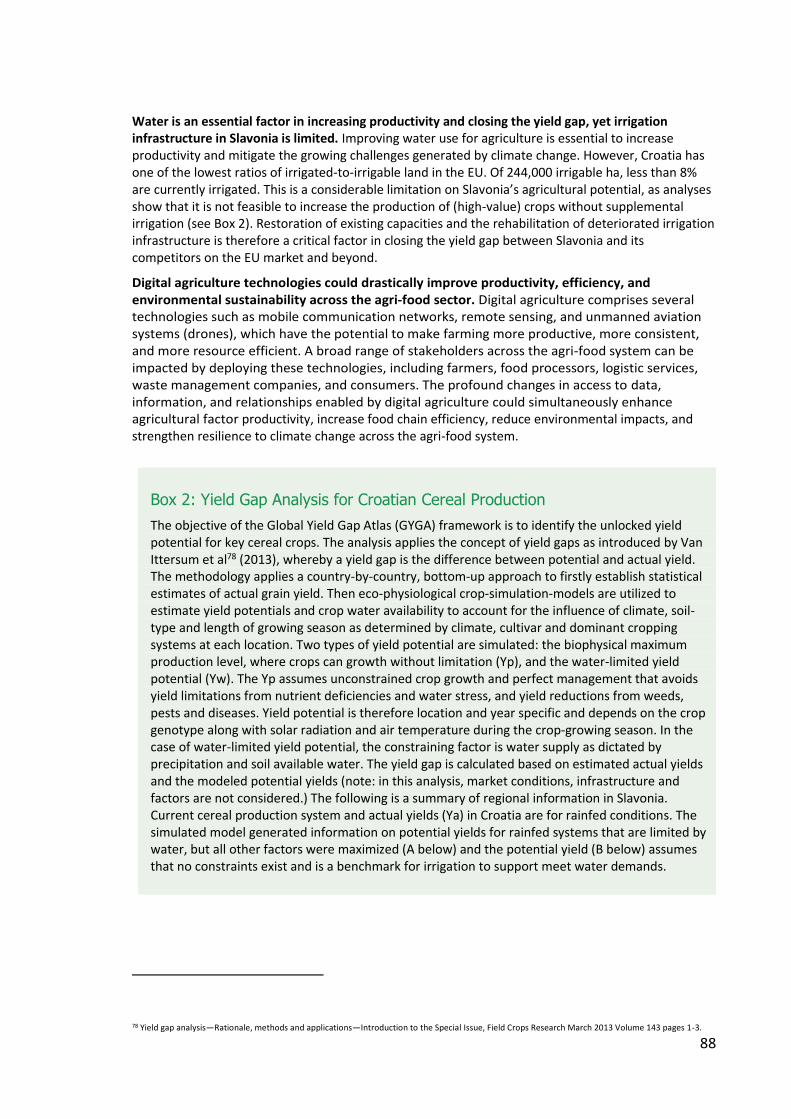
88
Water is an essential factor in increasing productivity and closing the yield gap, yet irrigation infrastructure in Slavonia is limited. Improving water use for agriculture is essential to increase productivity and mitigate the growing challenges generated by climate change. However, Croatia has one of the lowest ratios of irrigated-to-irrigable land in the EU. Of 244,000 irrigable ha, less than 8% are currently irrigated. This is a considerable limitation on Slavonia’s agricultural potential, as analyses show that it is not feasible to increase the production of (high-value) crops without supplemental irrigation (see Box 2). Restoration of existing capacities and the rehabilitation of deteriorated irrigation infrastructure is therefore a critical factor in closing the yield gap between Slavonia and its competitors on the EU market and beyond.
Digital agriculture technologies could drastically improve productivity, efficiency, and environmental sustainability across the agri-food sector. Digital agriculture comprises several technologies such as mobile communication networks, remote sensing, and unmanned aviation systems (drones), which have the potential to make farming more productive, more consistent, and more resource efficient. A broad range of stakeholders across the agri-food system can be impacted by deploying these technologies, including farmers, food processors, logistic services, waste management companies, and consumers. The profound changes in access to data, information, and relationships enabled by digital agriculture could simultaneously enhance agricultural factor productivity, increase food chain efficiency, reduce environmental impacts, and strengthen resilience to climate change across the agri-food system.
Box 2: Yield Gap Analysis for Croatian Cereal Production
The objective of the Global Yield Gap Atlas (GYGA) framework is to identify the unlocked yield potential for key cereal crops. The analysis applies the concept of yield gaps as introduced by Van Ittersum et al78 (2013), whereby a yield gap is the difference between potential and actual yield. The methodology applies a country-by-country, bottom-up approach to firstly establish statistical estimates of actual grain yield. Then eco-physiological crop-simulation-models are utilized to estimate yield potentials and crop water availability to account for the influence of climate, soil-type and length of growing season as determined by climate, cultivar and dominant cropping systems at each location. Two types of yield potential are simulated: the biophysical maximum production level, where crops can growth without limitation (Yp), and the water-limited yield potential (Yw). The Yp assumes unconstrained crop growth and perfect management that avoids yield limitations from nutrient deficiencies and water stress, and yield reductions from weeds, pests and diseases. Yield potential is therefore location and year specific and depends on the crop genotype along with solar radiation and air temperature during the crop-growing season. In the case of water-limited yield potential, the constraining factor is water supply as dictated by precipitation and soil available water. The yield gap is calculated based on estimated actual yields and the modeled potential yields (note: in this analysis, market conditions, infrastructure and factors are not considered.) The following is a summary of regional information in Slavonia. Current cereal production system and actual yields (Ya) in Croatia are for rainfed conditions. The simulated model generated information on potential yields for rainfed systems that are limited by water, but all other factors were maximized (A below) and the potential yield (B below) assumes that no constraints exist and is a benchmark for irrigation to support meet water demands.
78 Yield gap analysis—Rationale, methods and applications—Introduction to the Special Issue, Field Crops Research March 2013 Volume 143 pages 1-3.

89
Table 6: Summary of Absolute Yield Gap in Slavonia
A) Limited water yield gap
(rainfed) tons per ha
B) Potential yield gap
(irrigation) tons per ha
Crop Current yield Tons per ha
Osijek/Klisa Slavonski Brod Osijek/Klisa Slavonski Brod
Maize 6.7 2.3 2.1 6.0 8.1
Barley 4.0 4.3 4.5 4.4 4.5
Wheat 4.9 3.0 3.6 3.4 3.8
Source: Global Yield Gap Atlas79
It is widely recognized that full yield-gap closure is generally not economically feasible or environmentally desirable (Cassman, 199980; Van Ittersum et al., 2013). Observations indicate that yields plateau at around 80% of their potential (Lobell et al., 2009). This factor was considered, and a summary of exploitable yield potentials are presented below:
Table 7: Exploitable Yield Gap in Slavonia (Assuming an 80% of Yp)
Limited water yield tons per ha
Yield potential unconstraint tons per ha
Crop Current yield
Osijek/Klisa Slavonski Brod
Osijek/Klisa Slavonski Brod
Maize 6.7 7.2 7.0 10.1 11.8
Barley 4.0 6.7 6.8 6.7 6.8
Wheat 4.9 6.3 6.8 6.6 7.0
Source: Own calculations based on Global Yield Gap Atlas data
The GYCA generated the same set of information for Eastern European countries. A comparison of the relative yield gap among these countries for maize is presented below.
79 http://www.yieldgap.org/ 80 Ecological Intensification of Cereal Production Systems: Yield Potential, Soil Quality and Precision Agriculture.
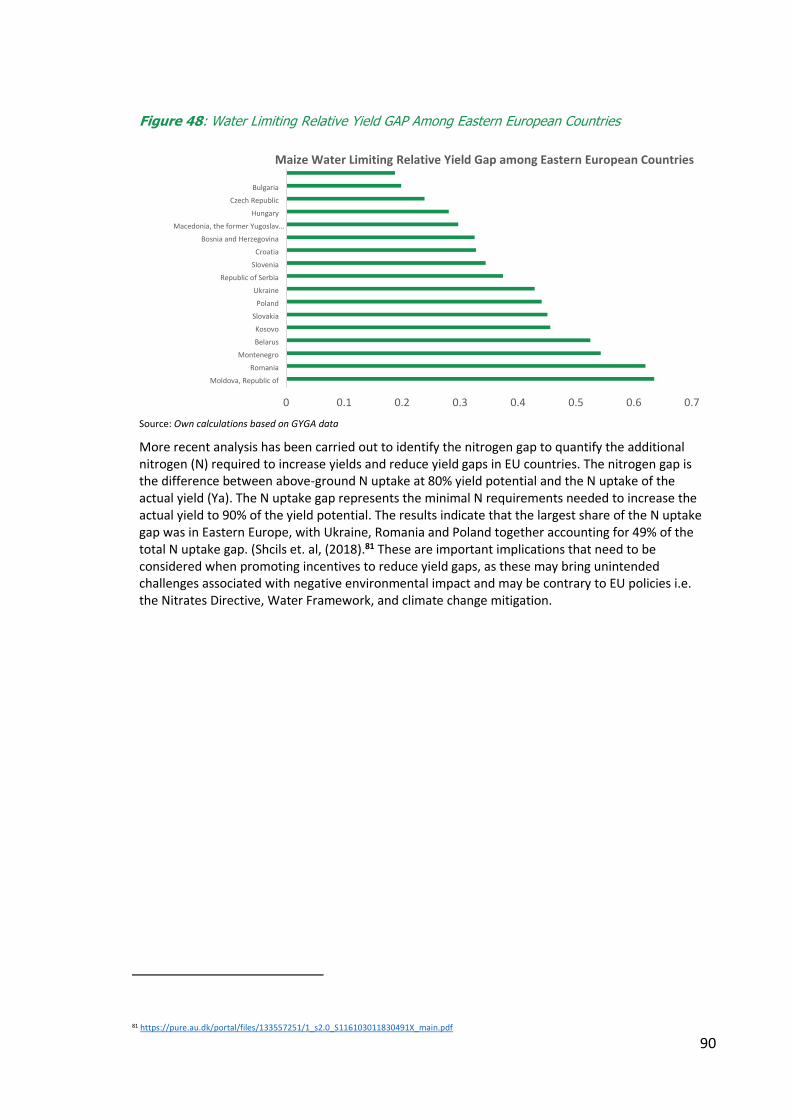
90
Figure 48: Water Limiting Relative Yield GAP Among Eastern European Countries
Source: Own calculations based on GYGA data
More recent analysis has been carried out to identify the nitrogen gap to quantify the additional nitrogen (N) required to increase yields and reduce yield gaps in EU countries. The nitrogen gap is the difference between above-ground N uptake at 80% yield potential and the N uptake of the actual yield (Ya). The N uptake gap represents the minimal N requirements needed to increase the actual yield to 90% of the yield potential. The results indicate that the largest share of the N uptake gap was in Eastern Europe, with Ukraine, Romania and Poland together accounting for 49% of the total N uptake gap. (Shcils et. al, (2018).81 These are important implications that need to be considered when promoting incentives to reduce yield gaps, as these may bring unintended challenges associated with negative environmental impact and may be contrary to EU policies i.e. the Nitrates Directive, Water Framework, and climate change mitigation.
81 https://pure.au.dk/portal/files/133557251/1_s2.0_S116103011830491X_main.pdf
0 0.1 0.2 0.3 0.4 0.5 0.6 0.7
Moldova, Republic of
Romania
Montenegro
Belarus
Kosovo
Slovakia
Poland
Ukraine
Republic of Serbia
Slovenia
Croatia
Bosnia and Herzegovina
Macedonia, the former Yugoslav…
Hungary
Czech Republic
Bulgaria
Maize Water Limiting Relative Yield Gap among Eastern European Countries
91
3.2. Weak agriculture knowledge and information systems
The successful establishment of an efficient and effective agricultural knowledge and innovation system (AKIS) in Slavonia remains elusive, starting with poor public agriculture extension services. The AKIS is a system that links people and organizations to promote mutual learning, as well as to generate, share, and utilize agriculture-related technology, knowledge, and information. A competitive agricultural sector needs an efficient and effective AKIS to support it. However, such a system – and particularly one that serves the needs of all farmers, including smallholders – remains a major challenge for Slavonia. A well-functioning AKIS is essential to support producers and agribusiness through training, technical advice, and critical information regarding production management systems and regulatory compliance. However, AKIS actors in Croatia are poorly connected and there is no systematic and effective exchange of knowledge, information, and innovation. Of particular concern are the on-going weaknesses in the public advisory services and agricultural education system. Yet, little progress will be made in transforming the agri-food sector without an effective advisory service and a well-resourced agricultural education system.
AKIS needs to be enhanced in order to provide adequate support to farmers and agribusinesses. Among agricultural institutions, which form an integral part of AKIS, the administrative service for agrarian payments (paying agency), veterinary and phytosanitary services are well developed, while farm advisory services are moderately developed but lack tools, training and specialists in modern production systems and sustainability management. Regarding the latter, there is limited technical support for farmers to transition to organic farming practices. Agricultural education as a public service, which includes several high schools and three faculties, is moderately developed. However, research and development is undeveloped, since faculties and research institutes do not produce adequate results, especially when it comes to applied research.
The agricultural education system is also struggling to adapt to the evolving needs of the agri-food sector. Only 6% of farm managers have completed higher education, while as many as 31% only completed primary education. Curricula remain very theory-oriented, as both universities and agricultural high schools have difficulties providing practical on-farm demonstration and training facilities. During recent decades, the number of high schools with agricultural specializations decreased significantly, while the number of graduates from agricultural universities also recorded striking drops. Slavonia still has one of the lowest proportions of trained farmers in the EU-28, with less than 10% of farm managers having any form (basic or full) of agricultural training. This was well below the EU-28 average of 28.9 percent and the EU-13 average of 16.9%. Universities and R&D companies are rarely seen as sources of information for innovation: only 6.9% of firms in Croatia would turn to universities for innovation.
3.3. Persistent reluctance of farmers to build alliances
Slavonian agriculture is characterized by fragmented production. More than half of the farmers in Croatia manage less than 2 hectares of land. Smallholders, who dominate the production structure, participate mainly in short value chains that typically end at local green or wholesale markets. On the other hand, the agri-food processing industry is very concentrated, as 62% of total revenues are generated by 1.26% of enterprises (EIB, 2018). Fragmentation in primary production, combined with limited competition in agri-food processing, constrains the development and expansion of well-functioning agri-food value chains. Meanwhile, lack of access to sufficiently large and reliable volumes of quality inputs further constrains the competitiveness of agri-food processors. Although agricultural producers and processors benefit from unrestricted access to high-value domestic and EU markets, increased investment and coordination between (smaller) producers and processors are needed to improve productivity, efficiency, and product quality levels and face up to increasing market competition, especially for small and medium-sized operations. For example, access to regional markets is critical for smaller producers who do not have proper resources to store and transport their production to consumers and agro-processors. However, access to these markets is relatively

92
constrained for producers in the Slavonia and (especially) Dalmatia regions, which increases transaction costs for producers operating in these regions with extensive arable land.
Despite many successful examples of farmers’ cooperatives in Slavonia, producers in general remain reluctant to work together. According to national expert estimates, less than 8% of Slavonia’s agricultural producers are part of organized structures, as opposed to the EU average of 34 percent. The reasons for this are complex and need careful unpacking. At the same time, it is important to note that many successful examples of agricultural cooperatives do exist in Slavonia. Some of these established cooperatives are actually based upon former communist collective farms, while others follow more modern concepts. One example is the BIZ dairy, which has accomplished a combination of forming a cooperative while at the same time building a vertical integration concept that links farmers to markets. Still, the overall number of cooperatives in the agricultural sector remains low, while the growth in EU-supported producer organizations / groups has been very slow.
One well-documented contributory factor is the reluctance among the older generations to work through cooperative structures due to historical experiences. Forced collectivization is widely acknowledged as having destroyed the independence, dignity and identity of smaller producers in Croatia. The continuing cultural and socio-economic legacy of collectivization should not be underestimated. That said, it is obviously declining with time and is not the only obstacle to greater cooperation. Other contributory factors include the lack of strategic vision for agricultural cooperatives that existed for years after the change in political system. In addition, there was no legal framework to guide the setting-up of agricultural cooperatives prior to joining the EU. Even where historical prejudices against cooperation have been overcome, there still remains a general lack of (i) awareness amongst farmers of the benefits of genuine cooperative structures, and (ii) knowledge about how to set up and run such structures effectively. This is compounded by the lack of an effective organization dealing with agriculture extension services, which includes providing specialized training.
3.4. Constraints on market integration of smallholders
The main challenges faced by farmers regarding market integration are well known and not unique to Slavonia. They include:
• The fact that food processors and retailers prefer to deal with large suppliers in order to minimize high transaction costs and ensure continuity of supply;
• The difficulties of farmers having to meet rising standards, including both EU standards and those of agri-food companies; and
• Limited access to finance, while falling beyond the scope of public support prevents smallholders from accessing much needed investment.
Semi-subsistence and semi-commercial farms represent a potential force for value-chain integration. Whilst sharing many characteristics with other small farmers around the world, like poor capitalization, limited bargaining power, political marginalization, and restricted access to finance and market information, as well as poor skills, the sizeable amount of holdings and valuable land they manage means that efforts to increasing the competitive position of agri-food chains in Slavonia cannot bypass smallholders. However, improved targeting of policy instruments towards the semi-commercial will be fundamental in successfully deepening the integration of agri-food value chains. Figure 49 provides a graphic representation of the key characteristics of smallholders in Slavonia with a standard output below EUR 15,000.
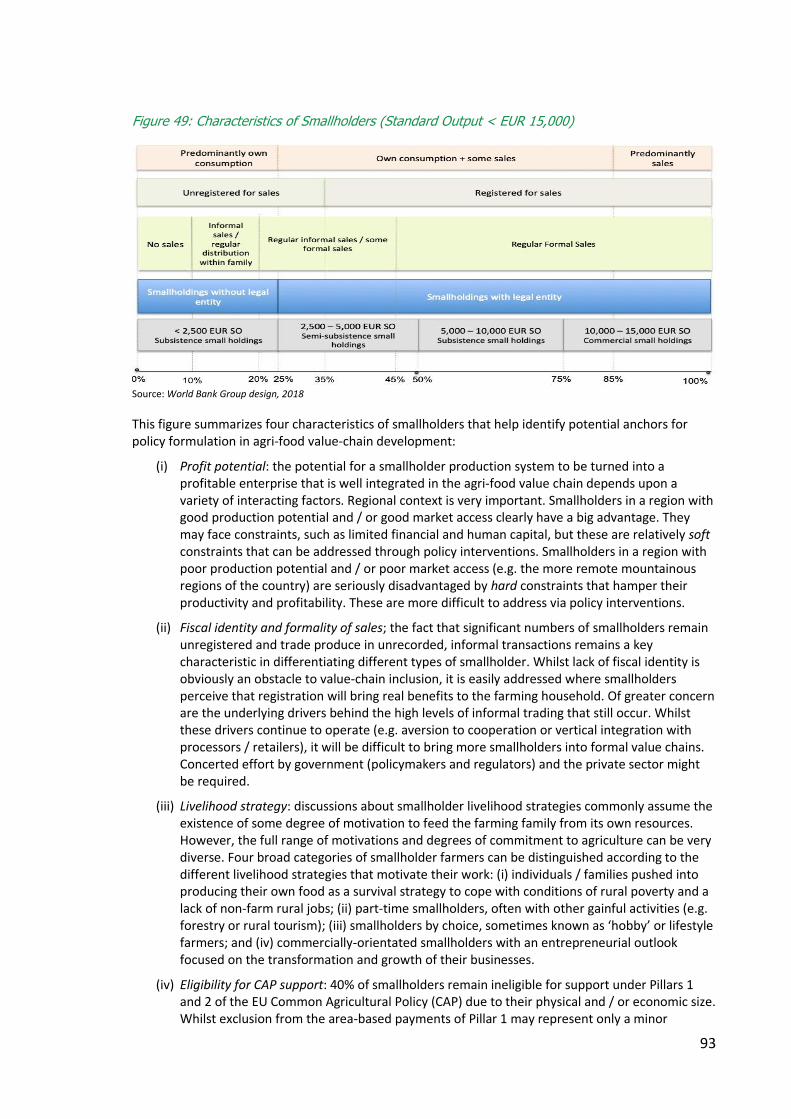
93
Figure 49: Characteristics of Smallholders (Standard Output < EUR 15,000)
Source: World Bank Group design, 2018
This figure summarizes four characteristics of smallholders that help identify potential anchors for policy formulation in agri-food value-chain development:
(i) Profit potential: the potential for a smallholder production system to be turned into a profitable enterprise that is well integrated in the agri-food value chain depends upon a variety of interacting factors. Regional context is very important. Smallholders in a region with good production potential and / or good market access clearly have a big advantage. They may face constraints, such as limited financial and human capital, but these are relatively soft constraints that can be addressed through policy interventions. Smallholders in a region with poor production potential and / or poor market access (e.g. the more remote mountainous regions of the country) are seriously disadvantaged by hard constraints that hamper their productivity and profitability. These are more difficult to address via policy interventions.
(ii) Fiscal identity and formality of sales; the fact that significant numbers of smallholders remain unregistered and trade produce in unrecorded, informal transactions remains a key characteristic in differentiating different types of smallholder. Whilst lack of fiscal identity is obviously an obstacle to value-chain inclusion, it is easily addressed where smallholders perceive that registration will bring real benefits to the farming household. Of greater concern are the underlying drivers behind the high levels of informal trading that still occur. Whilst these drivers continue to operate (e.g. aversion to cooperation or vertical integration with processors / retailers), it will be difficult to bring more smallholders into formal value chains. Concerted effort by government (policymakers and regulators) and the private sector might be required.
(iii) Livelihood strategy: discussions about smallholder livelihood strategies commonly assume the existence of some degree of motivation to feed the farming family from its own resources. However, the full range of motivations and degrees of commitment to agriculture can be very diverse. Four broad categories of smallholder farmers can be distinguished according to the different livelihood strategies that motivate their work: (i) individuals / families pushed into producing their own food as a survival strategy to cope with conditions of rural poverty and a lack of non-farm rural jobs; (ii) part-time smallholders, often with other gainful activities (e.g. forestry or rural tourism); (iii) smallholders by choice, sometimes known as ‘hobby’ or lifestyle farmers; and (iv) commercially-orientated smallholders with an entrepreneurial outlook focused on the transformation and growth of their businesses.
(iv) Eligibility for CAP support: 40% of smallholders remain ineligible for support under Pillars 1 and 2 of the EU Common Agricultural Policy (CAP) due to their physical and / or economic size. Whilst exclusion from the area-based payments of Pillar 1 may represent only a minor

94
financial disadvantage for smallholders, the limited accessibility to the rural development measures under Pillar 2 is more significant.
Nearly half of Slavonia’s holdings would fit the description of being more entrepreneurial and policy-responsive smallholders with good profit potential. It is difficult to estimate the size of the sub-group of more entrepreneurial and policy-responsive smallholders with good profit potential that would most benefit from an effective enabling environment. However, using the above-highlighted typology, it can be estimated that nearly 50% of Slavonia’s smallholders – a substantial target group for any policy intervention aiming to encourage greater market integration – would satisfy the criteria outlined above.
Semi-commercial smallholders in Slavonia are providers of employment in rural areas and their economic performance is better than larger farms. About 50% of the regular labor force that performs farming activities in Slavonia works on farms with a UAA of fewer than 2 hectares. Although smallholdings mainly use family labor, employment is not limited to this. According to Eurostat data for the years 2010-2015, the regular non-family labor force on smallholdings accounted for about 20% of the total number of people employed in Slavonia’s agriculture. The economic performance – per unit of UAA – of smallholdings also appears to be higher than that achieved on large farms. According to 2013 Eurostat data (Figure 50), smallholdings under 5 hectares in size have a stronger economic performance in terms of SO per hectare of UAA than any other farm size class. Furthermore, the economic performance of farms with fewer than 2 hectares is 4 times stronger than the performance of farms over 100 hectares in size and almost twice as high as the EU-28 average SO of 1,902 EUR per hectare of UAA.
Figure 50: Differences in Farm Performance by Physical Size in 2013 and 2016
Source: Eurostat, 2017.
The higher efficiency of utilization of land resources by semi-commercial smallholders is most likely explained by more diversified production. As already noted in the context section, smallholders tend to integrate livestock and crop production and have more diversified production systems than those observed on large-scale farms. In mountainous and sub-mountainous regions, large areas of permanent grassland provide an important additional forage resource for smallholders, whilst in the more favorable conditions of the lowland plain areas farm households use the land immediately adjacent to their homes for cultivating a broad range of higher-value crops such as fruit and vegetables.
95
4. Enabling Environment for Farm Inclusion in Agri-food Value Chains
The creation of an enabling environment that is supportive to all farms in Slavonia is an essential condition for greater integration into agri-food value chains. (Semi-) subsistence and smaller commercial farms are especially vulnerable when trying to realize these ambitions on the market. Eastern Croatia can benefit from significant inflows from the EU Common Agricultural Policy when targeted correctly. The support of vertical and horizontal co-operation among supply-chain actors for the establishment and development of short supply chains, promotion of quality schemes, support for producer organizations, and support for investments in agricultural holdings are key rural development measures related to better market integration available under the current 2014–2020 programming cycle. However, after nearly five years of implementation of the Rural Development Program, Slavonian (and other Croatian) farmers have hardly benefited from these measures. Transitioning to the new CAP programming cycle post 2020, there will be ample opportunities to strengthen agri-food value chains while also supporting smallholders in their inclusion in agri-food chains. The new CAP will promote food chain partnerships in the context of Common Market Organizations, whose aim is to better position farmers in the food chain.
4.1. Legal and business environment
Various policies, regulations and support programs influence how farmers operate and impact on their business performance. The so-called ‘enabling environment’ affects farmers’ access to agri-food value chains, whether these are well-structured and formalized value chains linked to supermarkets or more informal direct marketing initiatives and alternative food networks (short supply chains). An effective enabling environment supports those economic actors that can and want to succeed. To be effective, an enabling environment needs to impact positively upon those holdings and individuals that have (i) good profit potential (i.e. in favorable regions with good production potential conditions and market access); (ii) the entrepreneurial spirit and aspiration to become more integrated in the market; and, importantly, (iii) the inclination or interest to respond to policy signals for increased market integration.82
Agriculture is a heavily regulated sector, with most rules defined at EU level as part of CAP. At the same time, however, farmers operate in a wider economic environment, which influences entrepreneurs in all sectors in Croatia. Entrepreneurs often point to cases, which negatively affect their day-to-day operations, such as problems in realizing payments for goods or services delivered, the length of legal procedures, public procurement rules, and access to financing. Struggling with these difficulties may lead entrepreneurs, including farmers, to give up their business activities altogether.
There are significant constraints on doing business in Croatia. Recently, the American Chamber of Commerce in Croatia published a study on the business environment highlighting the main constraints on entrepreneurs doing business in Croatia. These included frequent changes in the legal framework, lengthy and complex administrative procedures, high income taxes, and a lack of workers. As regards the quality and implementation of the legal framework and the judiciary, the participants in the survey
82 Davidova et al. (2009) analyze the attitudes and perceptions of subsistence farm households in five new EU member states towards farming, commercialization and the barriers to / drivers for increased integration in agricultural markets. The authors concluded that for many subsistence / semi-subsistence farmers: ‘agriculture is a voluntary choice and not a necessity. They enjoy their lifestyle, produce for non-pecuniary reasons and insist on producing their own safe food. Such households will hardly respond to any policy signals providing incentives for market integration’.
96
are of the opinion that the situation in Croatia has deteriorated further in the last five years. Farmers in Croatia are facing the same business problems and sometimes even additional constraints.
Domestic producers face increasing competition from agri-food imports. Within overall household expenses in Croatia, food and beverages have a share of almost 30%, leading to a large part of the population giving lower-priced imported products preference over domestic products. The 2018 tax reform includes a reduction in VAT level from 25% to 13% on a number of agri-food products, for example meat, fruit and vegetables. The anticipated outcome would lead to reducing consumer prices for food. The potential consequence of the reform might also lead to decreased tax evasion and reduced informal value chains.
The agri-food market is dominated by buyers from the processing industry and retail sector. Their negotiating power often results in contract provisions that are unfavorable to farmers in terms of the price offered, payment deadlines, conditions for termination of contract, and the share of the business risk. The recently adopted Prohibition of Unfair Trading Practices in the Food Supply Chain Act is aimed at helping farmers regain their negotiating power in the food supply chain. However, it is still too early to evaluate the impact and efficiency of this Act, which entered into force during the first quarter of 2018.
Export conditions in third markets have become more restrictive since EU accession. Croatia traditionally achieved good results in exports to CEFTA countries, particularly with high value-added food products and a mostly duty-free trade regime. However, after accession to the EU these countries introduced customs duties for Croatian products.
Access to the EU single market also brings some challenges. The Russian import ban introduced in 2014 resulted in surpluses of agricultural products in the EU and consequently drove producer prices down, particularly in the livestock sector. The situation was further aggravated by the abolition of milk production quotas. Following the intervention measures introduced by the European Commission in order to stabilize the markets, prices started recovering, but the measures could not fully compensate farmers’ losses. Unlike some other EU members such Poland, Croatia was not very successful in exploring common funds as compensation due to the Russian import ban, particularly in the first wave when the crisis started.
4.2. Policy and regulatory developments
Greater market integration of Slavonia’s smallholders requires an improved enabling environment. As part of the EU single market since 2013, Slavonia has already benefited from considerable CAP funding, as well as accumulated experience from the pre-accession period. However, an improved enabling environment for the agri-food sector could help the integration of smallholders in agri-food value chains. Clearly, there are multiple policy and institutional determinants influencing the market participation of smallholders and no single intervention – even a well-targeted one – can address them all. Instead, an integrated set of measures is needed, guided by a clear strategic framework that deploys a range of tools and instruments aimed at:
• Ensuring a favorable regulatory environment for smallholders;
• Fostering ideas, providing advice, supporting the acquisition of practical skills and technical
knowledge, and promoting sound business planning;
• Providing finance for investments;
• Promoting co-operation between smallholders, including through the aggregation of
production;
• Improving market access for smallholders, including through an emphasis on product quality
and safety.
Croatia’s Rural Development Program (RDP) for the period 2014-2020 provides ample opportunities for Slavonian farmers and rural areas. The financing of this program amounts to EUR 2.4 billion, of
97
which 85% is EU funded. The program contains 16 measures which should contribute to the achievement of the following objectives: (i) restructuring and modernization of the agricultural and food sector; (ii) the promotion of environmentally-friendly agricultural systems; (iii) improved resource efficiency and a movement towards agricultural, food and forestry sectors adapted to climate changes, and (iv) reversing rural depopulation by economic recovery and improving the quality of life in rural areas.
Measures from the RDP generally address a large number of the needs of the agri-food sector in Slavonia, but they are not always adequate from stakeholders’ perspectives. The higher absorption of certain RD measures does not necessarily mean that the given measures meet stakeholders’ needs. A good example is the measure for investments in physical assets (M4), where halfway through the programming period, applications for only one sub-measure (M4.1.1) exceeded the total available amount for the whole 7-year period. This indicates that the funds allocated were not enough to address stakeholders’ needs in terms of volume. More budget resources would certainly have been available without the transfer of Pillar II funds to direct payments (Pillar I), which was a political decision at the beginning of the implementation of the current program. Although Croatia had the option to shift funds between the two pillars for a shorter period, nearly EUR 300 million was shifted from the RD envelope to direct payments for the period 2014-2019.
The first calls for applications for investment support favored large farms and agricultural companies. There is a big controversy about the implementation of M4, particularly related to its sub-measures (M4.1.1) and (M4.2.1) which provide support for investments in processing / marketing and / or the development of agricultural products. This controversy stems from the eligibility criteria in the first calls for applications in 2014 and 2015. The administration initially set up maximum limits for support amounting to EUR 5 million without any further limits per potential beneficiary per call for applications or throughout the programming period. In addition, the intensity rate for aid could go up to 90% cumulatively, which reduced the number of potential beneficiaries significantly, since the value of applications exceeded available allocations 2.5 times and left most applications below the threshold for approval. This situation created a lot of complaints from small and medium-scale farmers and public discussion.
Smallholders are being excluded from financial opportunities. One of the major constraints on small producers who are on the demand side of agri-finance is poor overall financial literacy, i.e. limited knowledge of modern value chains and their financing, as well as low creation of the value-added needed for a financially viable business. On the supply side of agri-finance, there is still a lack of expertise and knowledge of agriculture and its economics at the commercial bank level, which raises the risk profile of the sector in general and smallholder agriculture in particular. The lack of equity capital and the fact that guarantee programs demand collateral add to the constraints on smallholders. The Croatian Bank for Reconstruction and Development (HBOR) and the Croatian Agency for SMEs and Investments (HAMAG – BICRO) offer agricultural loans and / or direct support for various farming activities and investments at very favorable conditions. This in turn, prevents private agri-lending from developing and eventually becoming a relevant source of rural financing.
98
5. Conclusions and Recommendations
As the preceding sections of this chapter have clearly identified, there is a chronic deficiency in the ability of the Slavonian agri-food sector to meet the consumption demands of Croatia’s population or shift the country towards an improved agri-food trade balance in response to growth opportunities in international markets.
It is well understood that there are two basic but critical issues. On the one hand, Eastern Croatia has substantial agricultural resources, but productivity is relatively low and volatile compared to other countries. In the case of larger farms, production is also relatively undiversified and specialized in limited crops (maize, sunflower, sugar beet and soybeans) that provide a comparative advantage. On the other hand, small and fragmented farm structures combined with a lack of cooperation between farmers are the main reason that neither fresh nor processed agri-food products from Eastern Croatia can easily find their way from the farm to consumers, especially those in urban areas who have become more sensitive to issues of food quality and safety and are increasingly enjoying the convenience of supermarkets. Consequently, producer incomes in Eastern Croatia are low and Croatia continues to be a net importer of many agri-food products.
The development of agri-food value chains for domestic and export markets is a powerful tool for boosting broad-based economic growth and job creation. The agri-food sector, comprising inputs, primary agricultural production, off-farm processing, marketing, distribution, and retail, is one of the most important sectors in Eastern Croatia. Slavonia’s agri-food sector contributes to 18% of the regional GDP. The sector’s spatial footprint, multiple functions, and cross-sector linkages could transform the industry into a powerful driver of value addition, income diversification, innovation, and employment in rural areas. Global evidence suggests that agribusiness has the highest short-term indirect employment impact, where creating one job generates more than double the number of jobs in the rest of the economy.
Moving forward, there are multiple development pathways for Slavonia’s agri-food value chains. Based on the analysis in the chapter and also drawing on international experiences, it is likely that no single strategic intervention or financial support measure by the national or local authorities will be wholly appropriate for all development pathways. The following strategic decisions are recommended:
(i) Improving productivity by investing in modern production systems. Strategic investment areas include the rehabilitation of the depleted irrigation infrastructure, improved farming practices, strengthening the business management capacity of farmers, establishing an enabling environment that encourages bottom-up farm consolidation, and developing post-harvest management facilities.
(ii) Leveraging digital agriculture technologies for enhanced productivity, efficiency and environmental sustainability. Digital agriculture technologies are a powerful force for the transformation of agri-food sector. The profound changes in access to data, information, and relationships enabled by digital agriculture could simultaneously enhance agricultural factor productivity, increase food chain efficiency, reduce environmental impacts, and strengthen resilience to climate change across the agri-food system. By interconnecting data, digital agriculture could also benefit producers and food processors to create direct links to buyers and consumers.
(iii) Committing to a commercialization strategy that is inclusive of commercial-oriented smallholders and recognizes the benefits of product differentiation through expanding EU quality schemes and certification options. While subsistence food production contributes to feeding the rural population, most smallholders are not able to generate enough income to overcome poverty. In addition to improving productivity levels so that a higher share of production can be marketed, it is recommended that the government draft a commercialization strategy that aligns with smallholders’ current supply to local consumers and leverages EU quality schemes and certification options.
99
(iv) Taking an active role in promoting commercial partnerships for improved agri-food value-chain coordination. Well-functioning value chains help the agri-food sector to better create, deliver, and capture market value and opportunities by closely coordinating actions between upstream and downstream stakeholders. Manufacturers’ ability to deliver standardized food to consumers often depends on large-scale changes in producers’ production (for example, seed use, rootstock production, varietal structure), processing and marketing. In improving smallholder market-linkages, commercial partnerships through productive alliances have a proven global track-record regarding how producer groups, the retail sector and government can join forces to create sustainable market opportunities. This concept builds on (i) a horizontal alliance among smallholders, (ii) a vertical alliance between buyers and producers, and (iii) the public sector, which functions as the market enabler. It is recommended that the government take an active role in this concept, connecting the three agents through a ‘business proposition’, which describes the capital and services needed by producers and proposes improvements that would allow them to upgrade their production capacities and skills to strengthen their market linkage.
(v) Providing smarter incentives for private investments in productivity, well-functioning value chains, and diversification. Improvements in CAP programming are needed to encourage stronger cooperation between smallholders and vertical coordination with downstream value-chain stakeholders, while improving access to agricultural knowledge and information systems. Notably, investment schemes both on-farm and in processing and marketing facilities require significant rethinking of the use of public funds for the agri-food sector in Eastern Croatia. Adjustments are recommended to the 2014-2020 NRDP in light of its expected revision in 2019. In particular, it is recommended that a proportion of the remaining funds for the new sub-measure supporting the development of small farms (M6.3) should be redirected towards Focus Area measures to improve the competitiveness of primary producers by better integrating them in the agri-food supply chain (FA 3A). A much greater effort should also be made to target market-oriented smallholders under these measures.
While cereals and oilseeds will continue to dominate Slavonia’s agricultural production, the highest potential for future growth lies with high-value products. While larger commercial farmers in Slavonia specialize in commodities such as wheat, maize and oilseeds, smallholders are currently the main producers of high-value crops, especially fruit and vegetables. Taking into account the comparative advantage analysis of promising value chains that are suitable for Slavonia’s agro-ecological conditions, and considering the most prominent trends in agri-food markets, the following strategic opportunities emerge:
(i) The seasonality of perishable fruits creates a unique competitive advantage. Fruits, such as raspberries and sour cherries show a potential under the competitive index. These products are commonly managed by small-scale farmers, as seen in some neighboring countries.
(ii) Fresh and storable vegetables show potential in the growing market of health-conscious consumers, but will require significant investments in post-harvest management facilities. Vegetables, such as peppers and asparagus, and to a lesser extent, carrots, cabbage and more perishable tomatoes reveal a comparative advantage.
(iii) Hazelnut production enjoys strong demand on food and non-food markets. The projections for the next decade indicate strong global demand for hazelnuts in the food industry (for example, MARS, Ferrero Rocher), but also in the cosmetics and pharmaceutical industries. This opportunity is reflected in the competitive index and growing producer prices, and first successful results can be found in neighboring countries.
(iv) Pig production from commercial farmers creates an opportunity for the meat processing industry. Pig production and pork show a strong competitive advantage within the livestock sector. Pork is the most widely consumed meat in Croatia, and given the best-practices of EU quality schemes, speciality processed products have potential for export markets.
100
Objective: Investment

101
Chapter 3 Foreign Investment

102
Chapter 3: Summary Foreign Direct Investment (FDI) has been a key conduit for high-growth countries, such as those in Central and Eastern Europe. FDI has allowed these countries to import ideas, technologies and know-how from the rest of the world.83 The realization that a purely inward orientation on the domestic market will not sustain economic growth has been critical for their success.
Slavonia, even more than the rest of Croatia, has not yet sufficiently prioritized FDI, and consequently has had very low levels of investment. In recent years, FDI has created only 12% of jobs in Croatia, and even fewer in Slavonia. Of total FDI flows in Croatia, only about 2% have come to Slavonia. This is in contrast with many new EU member states that have developed their convergence strategies with FDI attraction as a central component. In those countries, FDI played a transformative role in boosting productivity, export diversification, and in upgrading activities in global value chains.
Limited FDI has implications for Slavonia’s learning opportunities, but also job creation, productivity enhancements and ultimately convergence with the EU. Once a relatively wealthy region tagged as ‘Croatia’s breadbasket’, today production is less conveniently positioned in the regional and international markets. Slavonia’s traditional sectors - agriculture and wood - remain concentrated in low value-added activities and are dominated by a few firms disadvantageously positioned in value chains. There is a real need to boost FDI in higher value-added activities to better connect the region to global value chains.
A key benefit of FDI is the creation of new and high and medium-skilled jobs. Many skilled people remain unemployed and are leaving the region to pursue better paid opportunities in the EU job markets. Hungary, Slovakia and the Czech Republic have created about 27% of all jobs through FDI. Challenges exist on both the demand and supply sides of the labor market, but FDI is clearly part of the solution for Slavonia’s job challenge.
The attraction of FDI to Slavonia and its growth are achievable but require supportive government action on investment policy and promotion. This chapter conducts a ‘sector scan’ with the objective of providing a more rigorous basis for policy dialogue on subsector prioritization for investment promotion in Slavonia. It examines nascent possibilities, with a focus on four sectors of Government interest and the government actions needed to facilitate them:
• ICT is the most vibrant of the four sectors in Slavonia, although it is still relatively small and held back primarily by challenges related to skills availability. It holds the most FDI potential, can be the most transformative to the local economy, and already has an FDI track record with IBM and Ericson Nikola Tesla.
• Wood is historically the strongest of the four sectors and offers evidence of the quality of Slavonia’s natural resources. However, success is unlikely without regulatory reform.
• Agribusiness has shown evidence of its strengths in the region, and has historically been strong. A key issue is reforming subsidies which encourage production of uncompetitive crops.
• Tourism is starting from a low base and currently offers limited opportunities for foreign investors. The key is to increase tourist demand, which is a role for the Government’s tourism agencies.
83 The Growth Report: Strategies for Sustained Growth and Inclusive Development. Commission on Growth and Development. World Bank, 2008.
103
The rapid assessment identifies two categories of opportunities:
(1) ‘Ready to go subsectors’. These are ready to be targeted by investment promotion. They offer both high potential value-add and are a relatively attractive existing offer for investors: o ICT subsectors: Custom computer programming, data processing, hosting, and related
services; o Agribusiness subsectors: Fruit and vegetable processing; o Tourism subsectors: Boutique hotels; and o Wood subsectors: No subsectors were identified as ‘ready to go’ due to the quota
system. (2) ‘Aspirational subsectors’. These are not yet ready but could become more attractive for
international investors subject to reforms addressing binding constraints: o ICT subsectors: Other computer-related services and software publishing; o Agribusiness subsectors: Warehousing and storage, and dairy product manufacturing; o Tourism subsectors: Bookings / reservations, museums, historical sites, and natural
attractions; o Wood subsectors: Furniture, related wood products, and wood products other than
furniture. Another sector that should be investigated is metal-processing, given its tradition and success in attracting FDIs in several counties.
Successful FDI attraction requires the implementation of several policy and regulatory reforms. Investment policy is currently focused on incentives, but incentives are less persuasive for investors than fundamental elements of the business environment, workforce skills, and appropriate infrastructure. These need to address the key binding constraints identified in each of the four sectors. Among others, these include lack of relevant skills, the quota system in wood, and distortions due to subsidies in agriculture. Improvements should be considered to improve the effectiveness of incentives but also investment promotion to boost Croatia’s reputation among existing and potential investors. The biggest challenge faced by investors in Croatia is improper implementation of laws (‘de facto’), regulations and contracts. Mirroring these challenges is a fairly large number of investor-state disputes. The 10 disputes registered over the last ten years is more than in regional neighbors.
At the regional level, there is also a need for proactive investment promotion, through a regional action plan. The action plan would include: investment promotion for specified subsectors; a defined range of services for investors; and a set of KPIs for each subsector. To achieve these actions, RDAs will need to collaborate at the regional level, and municipalities will need to be better leveraged for investment promotion (to deploy their responsibilities for business and economic zones, construction permit procedures, and access to land). Municipalities should be better leveraged for investment promotion, given that they have responsibility over business and economic zones, the efficiency of construction permit procedures, and access to land.
Finally, all these efforts will require the right institutional set up for Slavonia’s investment promotion. Given the developmental benefits of FDI, along with the competitive pressures of attracting foreign investors to the region, there is no question that Croatia needs an investment promotion agency. A strengthened investment policy capacity to oversee FDI reforms would also be desirable. A concrete institutional solution cannot be offered at this stage because a decision is yet to be taken about the Ministry of Economy’s role in replacing activities formerly pursued by AIK. This chapter provides examples of institutional solutions from other countries and offers options for further elaboration by the Government.

104

105
Introduction
This chapter addresses the request by the Government of Croatia for a report that:
• Identifies subsectors in agribusiness, wood-processing, ICT and tourism sectors in Eastern Croatia84 that hold potential for FDI with significant benefits for Slavonia in terms of job creation, value addition, domestic linkages development, skill and technology transfer, and export volume;
• Identifies key policy, regulatory and institutional constraints currently limiting FDI. If addressed, they would nt only unlock specific investment opportunities in subsectors, but also increase the value proposition of the four sectors as a whole;
• Proposes options for institutional and strategic structures to enhance the regional investment promotion framework and coordination; and
• Provides recommendations to agencies at the central and regional government levels to prioritize investment reform priorities and to better guide the focus areas for investment attraction and growth.
The chapter undertakes a rapid policy and legal review and uses both quantitative and qualitative analysis to assess and filter priority subsectors within the four identified sectors. This includes a variety of data sets, sector reports, and consultations with key stakeholders in Slavonia (particularly existing private firms) to arrive at an objectively ranked list of Slavonia’s most competitive subsectors for FDI promotion within each sector.
Data sources include the Central Bank of Croatia; the Croatian Bureau of Statistics; the Financial Times’ fDi Markets database;85 the United Nations Conference on Trade and Development; Eurostat; the World Bank Group; numerous and duly referenced reports and papers. In addition, the chapter uses data received from over 51 consultations that were conducted with: the private sector and business associations in Slavonia and throughout Croatia, in particular FDI companies; real estate companies and other firms with sector relevant statistics; government ministries and agencies, regional development agencies, chambers of commerce and sector organizations.
The chapter is organized as follows: section 1 briefly assesses Slavonia’s FDI performance within Croatia and across its counties and sectors; section 2 analyzes key location drivers for investors within Slavonia’s four sectors of interest; section 3 identifies specific investment opportunities following the FDI sector scan in each sector, and identifies different overseas markets / potential investors as well as draft value propositions; section 4 examines policy, regulatory and institutional barriers for FDI; and section 5 provides recommendations for developing a coherent FDI strategy for Slavonia, prioritizing subsectors for FDI promotion, addressing key policy and regulatory barriers, along with options for defining a new investment promotion framework for Slavonia. Annex A at the end of this report provides underlying data and background information, including: a list of firms consulted during consultative meetings; the full sector scan methodology and results along with information on investor motives for selecting an investment location by sector, details for selling and locating opportunities for investment by sector, and an assessment of the policy and regulatory challenges for each sector; an assessment of Croatia’s investor protection guarantees found within its bilateral investment treaties; and a listing of Croatia’s investor state disputes.
84 These four sectors were identified by the Government as key opportunities for growth, either due to their large contribution to GDP in the region or their rapid growth in recent years. However, analyzing additional sectors with potential due to recent investment trends or the level of available skills in the region should also be considered. 85 The Financial Times fDi Markets provides investment data based on FDI announcements.

106
1. Slavonia’s FDI Performance The following section analyzes Slavonia’s FDI performance in the context of comparator regions in Croatia. It takes a closer look at the breakdown of FDI received by county and sector within Slavonia in order to shed light on the region’s FDI experience across time.
1.1. FDI Trends and Jobs in Croatia & Slavonia
Overall, Croatia has seen volatile and decreasing national FDI inflows in the last decade (2007 to 2017), with flows declining drastically after the 2008 global crisis. Relative to its regional peers, Croatia saw comparable FDI inflows (as % of GDP) over the period.86 Notably, Croatia’s FDI inflows more than tripled between 2013 to 2014 (1.66 and 5.03 percent of GDP, respectively), which was likely a result of Croatia’s entry into the European Union. In fact, in 2014, Croatia’s FDI inflows were the highest relative to its comparators (Figure 51). The top sources of announced greenfield FDI for Croatia over the entire period were Austria, the United States, and Germany (Figure 52).87
Figure 51 Total FDI Inflows: Croatia vs. Regional
Comparators (2000-2017, % of GDP)
Figure 52 Top Ten Sources of Greenfield
FDI for Croatia (2003-2017)
Source: FDI Snapshot using UNCTAD.
Note: FDI flows are on a net basis (capital transaction credits less debits between direct investors and their foreign affiliates).
Source: FDI Snapshot using Financial Times fDi Markets.
Note: The data shown is the number of announced greenfield projects over the period. Data was unavailable prior to 2003.
Slavonia received only 2 percent of Croatia’s FDI inflows between 2000 and 2017, suggesting potential for significant improvement in its FDI strategy. Between 2000 and 2017, the City of Zagreb received the bulk of Croatia’s FDI (62 percent), while Primorje-Gorski Kotar and Istria received about 20 percent of FDI. FDI in Slavonia has been steady over time, hovering around 2 percent on average with a slight dip between 2008 and 2012 (less than 1 percent of total investments in Croatia), which was likely attributable to the impacts of the financial crisis. In recent years (2013 to 2017), Slavonia’s FDI grew to 4 percent of Croatia’s total (Figure 53).
86 The single exception is 2015, in which Croatia experienced the second lowest FDI inflows in the region (only the Slovak Republic saw lower amounts). 87 In terms of its regional comparators (Figure 51), Austria, Germany, and the United States also appeared as top sources of announced greenfield FDI for Slovenia and Slovakia, while Germany and Austria were also top sources for Bosnia and Herzegovina, while Serbia also saw top greenfield announcements from Germany and the United States. Financial Times fDi Markets, 2017.
-5
0
5
10
15
20
25
200
0
200
1
200
2
200
3
200
4
200
5
200
6
200
7
200
8
200
9
201
0
201
1
201
2
201
3
201
4
201
5
201
6
201
7
per
cen
t G
DP
Croatia Serbia
Bosnia and Herzegovina Slovak Republic
Slovenia
56
46 46
37
22 21
1714
11 10
0
10
20
30
40
50
60
# o
f p
roje
cts
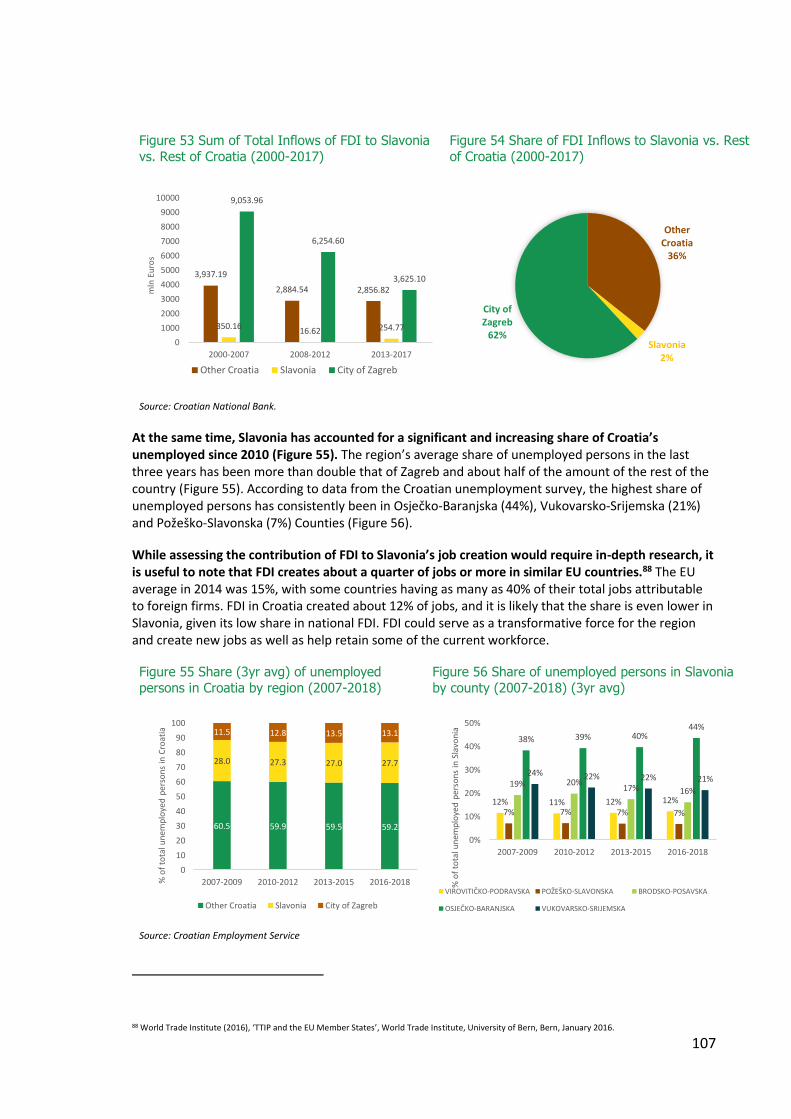
107
Figure 53 Sum of Total Inflows of FDI to Slavonia
vs. Rest of Croatia (2000-2017)
Figure 54 Share of FDI Inflows to Slavonia vs. Rest
of Croatia (2000-2017)
Source: Croatian National Bank.
At the same time, Slavonia has accounted for a significant and increasing share of Croatia’s unemployed since 2010 (Figure 55). The region’s average share of unemployed persons in the last three years has been more than double that of Zagreb and about half of the amount of the rest of the country (Figure 55). According to data from the Croatian unemployment survey, the highest share of unemployed persons has consistently been in Osječko-Baranjska (44%), Vukovarsko-Srijemska (21%) and Požeško-Slavonska (7%) Counties (Figure 56).
While assessing the contribution of FDI to Slavonia’s job creation would require in-depth research, it is useful to note that FDI creates about a quarter of jobs or more in similar EU countries.88 The EU average in 2014 was 15%, with some countries having as many as 40% of their total jobs attributable to foreign firms. FDI in Croatia created about 12% of jobs, and it is likely that the share is even lower in Slavonia, given its low share in national FDI. FDI could serve as a transformative force for the region and create new jobs as well as help retain some of the current workforce.
Figure 55 Share (3yr avg) of unemployed
persons in Croatia by region (2007-2018)
Figure 56 Share of unemployed persons in Slavonia
by county (2007-2018) (3yr avg)
Source: Croatian Employment Service
88 World Trade Institute (2016), ‘TTIP and the EU Member States’, World Trade Institute, University of Bern, Bern, January 2016.
3,937.19
2,884.54 2,856.82
350.1616.62 254.77
9,053.96
6,254.60
3,625.10
0
1000
2000
3000
4000
5000
6000
7000
8000
9000
10000
2000-2007 2008-2012 2013-2017
mln
Eu
ros
Other Croatia Slavonia City of Zagreb
Other Croatia
36%
Slavonia2%
City of Zagreb
62%
60.5 59.9 59.5 59.2
28.0 27.3 27.0 27.7
11.5 12.8 13.5 13.1
0
10
20
30
40
50
60
70
80
90
100
2007-2009 2010-2012 2013-2015 2016-2018% o
f to
tal u
nem
plo
yed
per
son
s in
Cro
atia
Other Croatia Slavonia City of Zagreb
12% 11% 12% 12%
7% 7% 7% 7%
19% 20%17% 16%
38% 39% 40%44%
24% 22% 22% 21%
0%
10%
20%
30%
40%
50%
2007-2009 2010-2012 2013-2015 2016-2018
% o
f to
tal u
nem
plo
yed
per
son
s in
Sla
von
ia
VIROVITIČKO-PODRAVSKA POŽEŠKO-SLAVONSKA BRODSKO-POSAVSKA
OSJEČKO-BARANJSKA VUKOVARSKO-SRIJEMSKA

108
Within Slavonia, FDI inflows were distributed unevenly, with Osječko-Baranjska County receiving the most FDI (47%) of Slavonia’s total between 2000-2017. The county has also seen the greatest fluctuations in inward FDI as the top recipient in Slavonia in all years except 2009, 2012, and 2015.89 Overall, it still constituted only 1 percent of Croatia’s total FDI over the same period. In recent years (2013 to 2017), 39 percent of FDI was received by Osječko-Baranjska, 34 percent by Vukovasko-Srijemska, 16 percent by Brodsko-Posavska, and the remainder by Požeško-Slavonska and Virovitičko-Podravska (9 and 1 percent respectively) Counties.
1.2. Sectoral Orientation of FDI in Slavonia
FDI inflows in Slavonia have been scattered across economic activities. According to the Central Bank data from 2012 to 2018 (Q1),90 the top FDI sectors in Slavonia were civil engineering (29 percent), followed by land transport via pipeline (14 percent), manufacturing of machinery and equipment (10 percent), and crop and animal production (9 percent).91 Civil engineering and land transport are most likely related to infrastructure development, while FDI in the other sectors primarily relates to the traditional sources of income for the region (metal processing and agriculture).
Overall, the four sectors of interest received less than one-fifth of total FDI in the region, suggesting a significant potential for improvement in targeted investment promotion. Agribusiness (crop and animal production and manufacturing of food products) accounted for 11 percent of total FDI received, followed by 4 percent in wood, 5 percent in sport activities and amusement and recreation activities (closest to tourism), and 3 percent in information services (closest to ICT)—see Figure 57.
The sectoral distribution of FDI varied across Slavonia’s counties. Brodsko-Posavska County saw the most FDI in its food products sector (29 percent) and manufacturing of fabricated metal products (21 percent). In Osječko-Baranjska County, more than half of FDI was in the construction of buildings, while in Požeško-Slavonska County, nearly half of FDI was in the manufacture of non-metallic mineral products. Wood dominated almost two-thirds of FDI in Virovitičko-Podravska County, while Vukovarsko-Srijemska County saw only 6 percent of FDI in wood, although it saw large shares of FDI in crop and animal production (25 percent) and the manufacture of machinery and equipment (30 percent).
Slavonia’s fairly weak FDI performance suggests that there is a need for reforms and investment promotion that would bring more FDI into the region. Investment promotion should be targeted at sectors that present the greatest potential contribution to the region’s development goals. Moreover, investment promotion should highlight the strengths of the region as a whole rather than working in siloes defined by county boundaries.
89 Information in this paragraph is based on the authors’ computations using Croatian National Bank FDI data. 90 Aggregated sectoral data from CNB is only available for 2012-2018Q1. 91 Civil engineering and land transport are most likely related to infrastructure development, while FDI in the other sectors primarily relates to the traditional sources of income for the region such as metal processing and agriculture.

109
Figure 57 Slavonia: Share of FDI by sector (2012-2018Q1)
Source: Croatian National Bank, FDI Database.
1.3. Observations about FDI Companies in Slavonia
As part of this project, the WBG met with a considerable share of FDIs as well as domestic companies in Slavonia (see Annex A). The following general FDI observations about company motivations are based on interviews conducted during September-November 2018 in the region:
• Slavonia has very few companies that are actual FDIs (with at least 10% foreign ownership). Apart from a few exceptions, most companies are domestic and their owners worked / studied abroad or come from the diaspora.
• Reasons for the establishment of FDI companies have more to do with personal motives than competitiveness for FDIs. The most cited reasons for establishment in Slavonia were (1) origin in the region, (2) connections with local stakeholders (public / private), and (3) lower costs (labor, living cost, and others).
• All companies face many constraints that limit their growth. A combination of horizontal and sector-specific constraints limit reinvestments in the four sectors as well as other promising ones (machinery / equipment production, fabricated metal products) which could be a source of additional FDI.
• Nevertheless, Slavonia has managed to attract a few ‘sparks’: FDI companies that use the region as an export platform (for example, Saint Jean Industries, Multinorm, Meggle). These are efficiency-seeking investors, who are typically the most difficult to attract and are highly correlated to certain advantages that the region offers.
Mirroring the FDI performance are Slavonia's traditional production patterns. With the exception of the ‘sparks’, production in the four sectors of interest is concentrated in low value-added activities (such as crop production in the case of agriculture) and appears to be dominated by a few larger and older companies. The Government’s intention to use FDI is clearly important and could transform the region’s productive structure. The following sections provide an overview of the typical location criteria that Slavonia can focus on to pull in FDI in the sectors of interest.
Civil engineering29%
Land transport and transport via pipelines
14%
Manufacture of machinery and equipment n.e.c.
10%
Crop and animal production, hunting and related service
activities9%
Manufacture of chemicals and chemical products
8%
Electricity, gas, steam and air conditioning supply
6%
Sports activities and amusement and recreation
activities5%
Manufacture of wood and of products of wood and cork, except furniture; manufacture of
articles of straw and plaiting materials4%
Manufacture of other non-metallic mineral products
4%
Information service activities3%
Manufacture of fabricated metal products, except machinery and
equipment…
Wholesale trade, except of motor
vehicles and motorcycles…
Manufacture of food products2%
Other1%
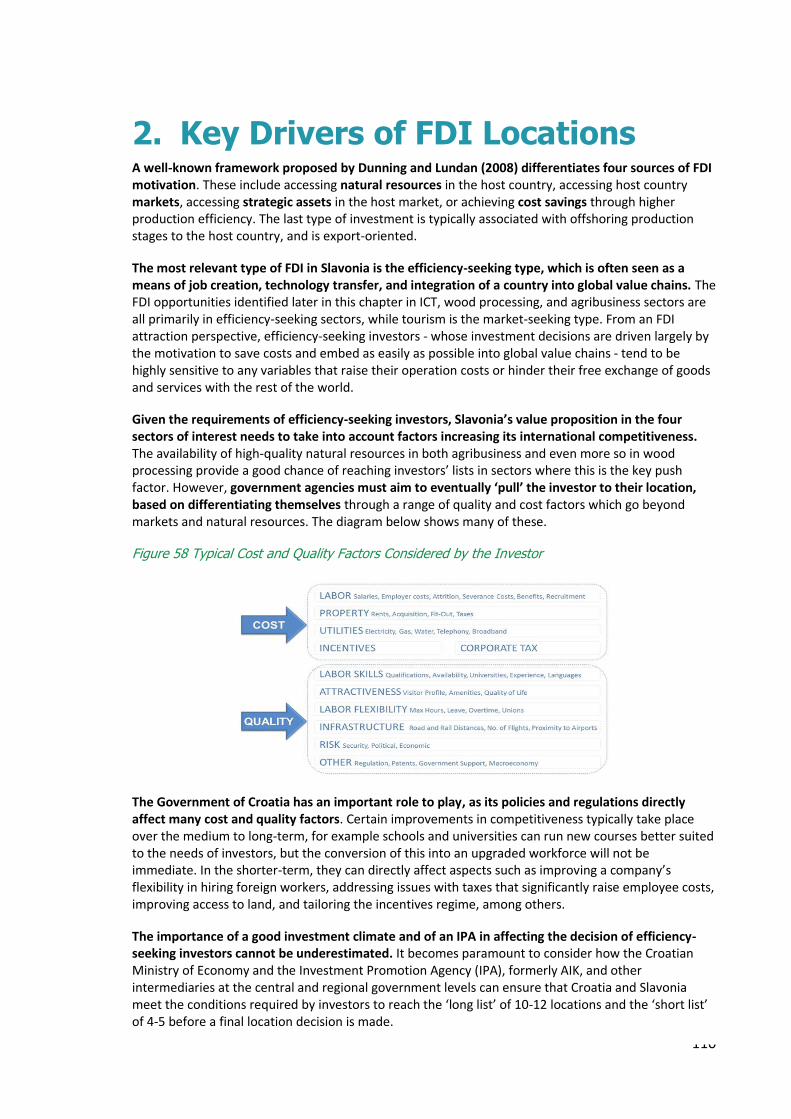
110
2. Key Drivers of FDI Locations A well-known framework proposed by Dunning and Lundan (2008) differentiates four sources of FDI motivation. These include accessing natural resources in the host country, accessing host country markets, accessing strategic assets in the host market, or achieving cost savings through higher production efficiency. The last type of investment is typically associated with offshoring production stages to the host country, and is export-oriented.
The most relevant type of FDI in Slavonia is the efficiency-seeking type, which is often seen as a means of job creation, technology transfer, and integration of a country into global value chains. The FDI opportunities identified later in this chapter in ICT, wood processing, and agribusiness sectors are all primarily in efficiency-seeking sectors, while tourism is the market-seeking type. From an FDI attraction perspective, efficiency-seeking investors - whose investment decisions are driven largely by the motivation to save costs and embed as easily as possible into global value chains - tend to be highly sensitive to any variables that raise their operation costs or hinder their free exchange of goods and services with the rest of the world.
Given the requirements of efficiency-seeking investors, Slavonia’s value proposition in the four sectors of interest needs to take into account factors increasing its international competitiveness. The availability of high-quality natural resources in both agribusiness and even more so in wood processing provide a good chance of reaching investors’ lists in sectors where this is the key push factor. However, government agencies must aim to eventually ‘pull’ the investor to their location, based on differentiating themselves through a range of quality and cost factors which go beyond markets and natural resources. The diagram below shows many of these.
Figure 58 Typical Cost and Quality Factors Considered by the Investor
The Government of Croatia has an important role to play, as its policies and regulations directly affect many cost and quality factors. Certain improvements in competitiveness typically take place over the medium to long-term, for example schools and universities can run new courses better suited to the needs of investors, but the conversion of this into an upgraded workforce will not be immediate. In the shorter-term, they can directly affect aspects such as improving a company’s flexibility in hiring foreign workers, addressing issues with taxes that significantly raise employee costs, improving access to land, and tailoring the incentives regime, among others.
The importance of a good investment climate and of an IPA in affecting the decision of efficiency-seeking investors cannot be underestimated. It becomes paramount to consider how the Croatian Ministry of Economy and the Investment Promotion Agency (IPA), formerly AIK, and other intermediaries at the central and regional government levels can ensure that Croatia and Slavonia meet the conditions required by investors to reach the ‘long list’ of 10-12 locations and the ‘short list’ of 4-5 before a final location decision is made.
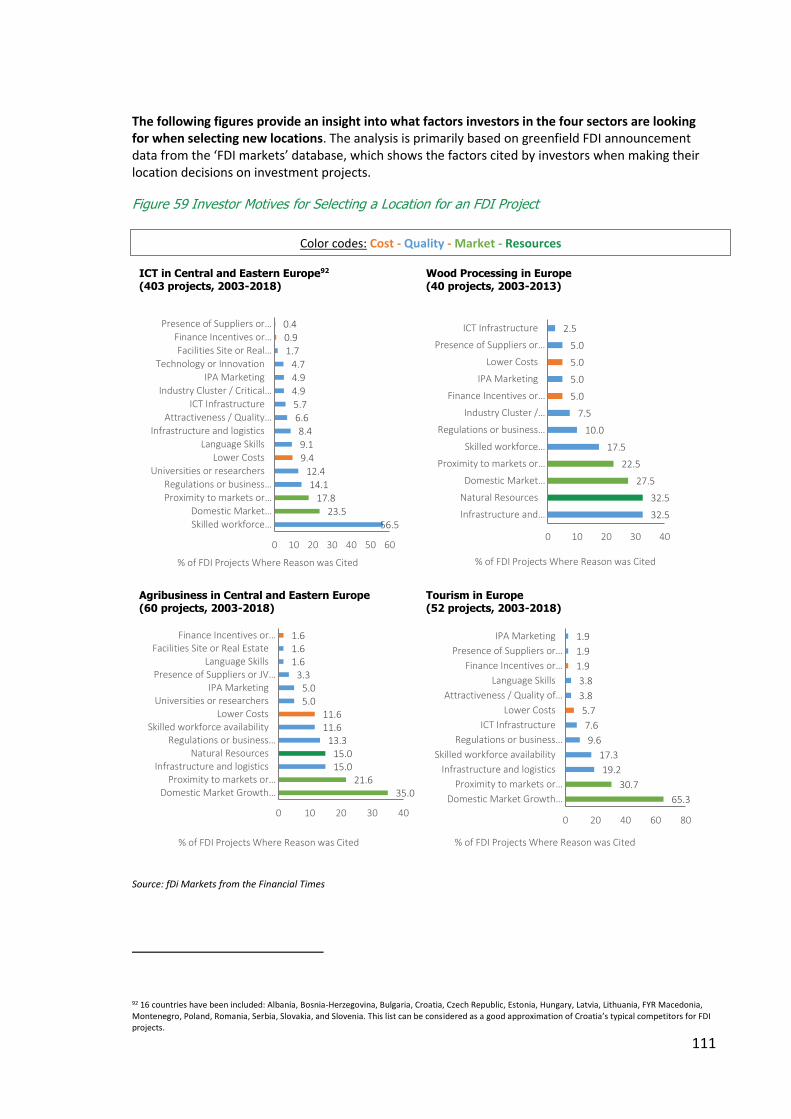
111
The following figures provide an insight into what factors investors in the four sectors are looking for when selecting new locations. The analysis is primarily based on greenfield FDI announcement data from the ‘FDI markets’ database, which shows the factors cited by investors when making their location decisions on investment projects.
Figure 59 Investor Motives for Selecting a Location for an FDI Project
ICT in Central and Eastern Europe92 (403 projects, 2003-2018)
Wood Processing in Europe (40 projects, 2003-2013)
Agribusiness in Central and Eastern Europe (60 projects, 2003-2018)
Tourism in Europe (52 projects, 2003-2018)
Source: fDi Markets from the Financial Times
92 16 countries have been included: Albania, Bosnia-Herzegovina, Bulgaria, Croatia, Czech Republic, Estonia, Hungary, Latvia, Lithuania, FYR Macedonia, Montenegro, Poland, Romania, Serbia, Slovakia, and Slovenia. This list can be considered as a good approximation of Croatia’s typical competitors for FDI projects.
56.5
23.5
17.8
14.1
12.4
9.4
9.1
8.4
6.65.7
4.94.9
4.71.7
0.9
0.4
0 10 20 30 40 50 60
Skilled workforce…
Domestic Market…
Proximity to markets or…
Regulations or business…
Universities or researchers
Lower Costs
Language SkillsInfrastructure and logistics
Attractiveness / Quality…
ICT Infrastructure
Industry Cluster / Critical…IPA Marketing
Technology or Innovation
Facilities Site or Real…Finance Incentives or…
Presence of Suppliers or…
% of FDI Projects Where Reason was Cited
32.5
32.5
27.5
22.5
17.5
10.0
7.5
5.0
5.0
5.0
5.0
2.5
0 10 20 30 40
Infrastructure and…
Natural Resources
Domestic Market…
Proximity to markets or…
Skilled workforce…
Regulations or business…
Industry Cluster /…
Finance Incentives or…
IPA Marketing
Lower Costs
Presence of Suppliers or…
ICT Infrastructure
% of FDI Projects Where Reason was Cited
35.021.6
15.015.0
13.311.611.6
5.05.0
3.31.61.61.6
0 10 20 30 40
Domestic Market Growth…Proximity to markets or…
Infrastructure and logisticsNatural Resources
Regulations or business…Skilled workforce availability
Lower CostsUniversities or researchers
IPA MarketingPresence of Suppliers or JV…
Language SkillsFacilities Site or Real Estate
Finance Incentives or…
% of FDI Projects Where Reason was Cited
65.3
30.7
19.2
17.3
9.6
7.6
5.7
3.8
3.8
1.9
1.9
1.9
0 20 40 60 80
Domestic Market Growth…
Proximity to markets or…
Infrastructure and logistics
Skilled workforce availability
Regulations or business…
ICT Infrastructure
Lower Costs
Attractiveness / Quality of…
Language Skills
Finance Incentives or…
Presence of Suppliers or…
IPA Marketing
% of FDI Projects Where Reason was Cited
Color codes: Cost - Quality - Market - Resources
Cost factor - Quality factor - Market factor - Resources factor

112
2.1. ICT sector
By a large margin, a skilled workforce is the key factor in investment decisions in this sector, as 66.5% of projects find it the most important driver, with regulations and business climate also gaining in importance. The next two factors are both related to the market. However, if the market is excluded, the role of quality factors becomes more important than cost factors in ICT. If one considers only the later period of 2013-2018, skills are more important for up to 67% of projects, while regulations / business climate are the second most important for 17% of projects. This demonstrates the importance of ensuring that policies concerning Slavonia’s business environment are optimized for investor attractiveness. Other factors such as technology / innovation and quality of life have also grown in importance, demonstrating the increasingly start-up driven mentality of the sector. A similar trend is found for costs, whose role as a key driver has been reduced even further since 2013.
Additional World Bank Group interviews with a number of ICT companies (both domestic and foreign) in Slavonia suggested that competitive wage rates and reliable broadband infrastructure are seen as an important overall driver for ICT sectors globally but one where Slavonia may be lagging behind in terms of download speeds.
2.2. Wood processing
Natural resources, and infrastructure and logistics are the leading factors here, with regulations / business climate gaining in importance. Market factors are also important, followed by a skilled labor force. If data is considered from 2013 only (at the global level, as the sample size is too small for Europe only), then the pattern is similar, but as with ICT, the role of regulations / business climate increases in prominence.
Additional interviews with companies in Slavonia suggested that if it were not for the quota system, its access to high-quality raw materials (oak, birch, good soil with a good microclimate) would be a key competitive advantage for Slavonia, given the region’s density of quality forest. Slavonia was also said to have good transportation in terms of road and rail links. Hence, these two factors align with the top two in the database analysis.
2.3. Agribusiness
The top motives for investors in agribusiness are market factors (domestic and international), followed by infrastructure and logistics, natural resources, and regulations and business climate, which are again gaining in importance. Comparing this to all of Europe since 2013 (68 projects recorded), a broader range of factors are cited. This shows the importance of natural resources and cost savings decreasing, with quality factors somewhat increasing in importance. However, in both cases, there is a broader range of factors that have some level of importance than is seen in ICT and wood processing above.
Additional interviews in Slavonia suggested that access to natural resources (excellent soil, fresh water, and climate for food production) was a leading driver. This was followed by availability and cost of land, the ease of transportation of products, and the region’s geographical position for nearby markets.
2.4. Tourism
Results demonstrate the extent to which tourism is a market-seeking type of FDI driven by the availability of the domestic market. In this sense, there is less opportunity for a location to compete on cost and quality factors than in other sectors. Nevertheless, regulations, a skilled workforce, and infrastructure / logistics do still have a role to play. Data since 2013 also suggests that the cost profile of a location plays almost no final selection role in location decisions within this sector.

113
Research from UNCTAD essentially supports the above findings. Its ‘FDI in Tourism’ report cites infrastructure, openness of the sector, size of host market, cost of labor, and exchange rates. In the case of Croatian tourism investors, economic size and growth rates were cited as location determinants, while government policies and FDI incentives were only reported as a determinant in the location decision of a small number of firms.93
An additional factor not cited above, but which should be considered important, would also be natural resources. In the case of Slavonia, this might mean climate, architecture, and similar.
93 FDI in Tourism: The Development Dimension, 2007, United Nations, https://unctad.org/en/Docs/iteiia20075_en.pdf
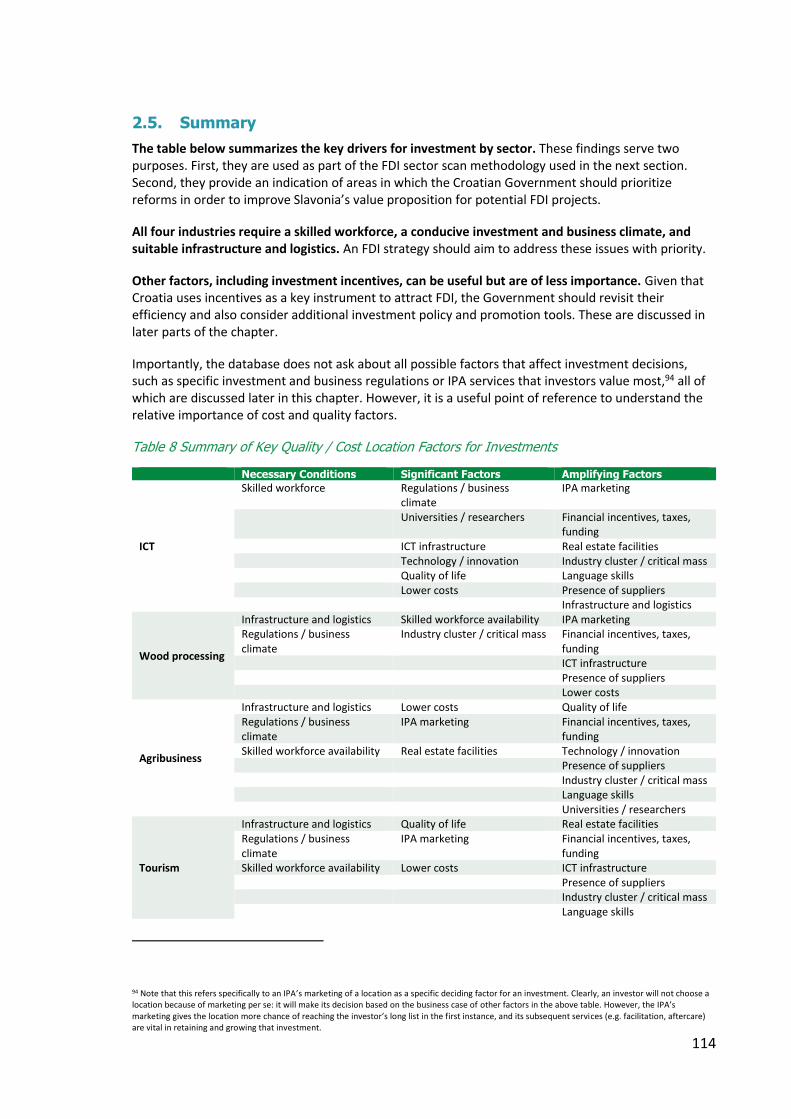
114
2.5. Summary
The table below summarizes the key drivers for investment by sector. These findings serve two purposes. First, they are used as part of the FDI sector scan methodology used in the next section. Second, they provide an indication of areas in which the Croatian Government should prioritize reforms in order to improve Slavonia’s value proposition for potential FDI projects.
All four industries require a skilled workforce, a conducive investment and business climate, and suitable infrastructure and logistics. An FDI strategy should aim to address these issues with priority.
Other factors, including investment incentives, can be useful but are of less importance. Given that Croatia uses incentives as a key instrument to attract FDI, the Government should revisit their efficiency and also consider additional investment policy and promotion tools. These are discussed in later parts of the chapter.
Importantly, the database does not ask about all possible factors that affect investment decisions, such as specific investment and business regulations or IPA services that investors value most,94 all of which are discussed later in this chapter. However, it is a useful point of reference to understand the relative importance of cost and quality factors.
Table 8 Summary of Key Quality / Cost Location Factors for Investments
Necessary Conditions Significant Factors Amplifying Factors
ICT
Skilled workforce Regulations / business climate
IPA marketing
Universities / researchers Financial incentives, taxes, funding
ICT infrastructure Real estate facilities Technology / innovation Industry cluster / critical mass Quality of life Language skills Lower costs Presence of suppliers Infrastructure and logistics
Wood processing
Infrastructure and logistics Skilled workforce availability IPA marketing Regulations / business climate
Industry cluster / critical mass Financial incentives, taxes, funding
ICT infrastructure Presence of suppliers Lower costs
Agribusiness
Infrastructure and logistics Lower costs Quality of life Regulations / business climate
IPA marketing Financial incentives, taxes, funding
Skilled workforce availability Real estate facilities Technology / innovation Presence of suppliers Industry cluster / critical mass Language skills Universities / researchers
Tourism
Infrastructure and logistics Quality of life Real estate facilities Regulations / business climate
IPA marketing Financial incentives, taxes, funding
Skilled workforce availability Lower costs ICT infrastructure Presence of suppliers Industry cluster / critical mass Language skills
94 Note that this refers specifically to an IPA’s marketing of a location as a specific deciding factor for an investment. Clearly, an investor will not choose a location because of marketing per se: it will make its decision based on the business case of other factors in the above table. However, the IPA’s marketing gives the location more chance of reaching the investor’s long list in the first instance, and its subsequent services (e.g. facilitation, aftercare) are vital in retaining and growing that investment.

115
3. FDI Sector Scan Results: Investment Opportunities
This section provides detailed findings from the rapid FDI sector scan assessment for each sector, with recommendations.
This FDI scan is the first step towards investor targeting. The outcome of the sector scan is to provide Slavonia with the analytical evidence needed to prioritize subsectors and develop value propositions, which would ultimately lead to an investment promotion plan for proactive targeting of potential foreign investors. Good practice is for an IPA to target a small number of sectors (often 3-5 in total) and the subsectors95 within them.
The assessment found that Slavonia presents a number of opportunities that should be taken up by investment promotion (Table 9). At the same time, there is significant scope to improve the value proposition of each of the four sectors, which will ultimately make these opportunities more attractive but also allow the transforming of aspirational opportunities into real ones through reforms.
Figure 60 How to Read the Results?96
Results are calculated considering a set of:
• Desirability criteria which consider whether FDI in the subsector has the potential to meet Slavonia’s long-
term economic and social development objectives. It is measured by the potential to contribute to job
creation, productivity enhancement, export growth / diversification and domestic value addition potential; and
• Feasibility criteria which consider Slavonia’s attractiveness and competitiveness as a location for investment
relative to alternative location options from the international investor perspective. It is measured by a set of
indicators related to cost, quality, and market and natural resource factors as per the analysis in the previous
section, and with further elaboration.
A full explanation of the methodology for selecting subsectors is provided in the appendices.
Output matrices show where each subsector sits in one of four quadrants:
• Quadrant 1: ‘Ready to Go’ subsectors in the top right that rank
as both beneficial for Slavonia and profitable for investors. The
recommendation is to pilot these through investment promotion in
Slavonia.
• Quadrant 2: ‘Aspirational subsectors’ in the top left that rank as
beneficial to Slavonia, but investors may be less likely to choose
the county in the absence of specific reforms.
• Quadrant 3: Subsectors that offer attractive opportunities for
investors but add relatively less value for Slavonia are in the
bottom right.
• Quadrant 4: Subsectors that offer less attractive opportunities
for investors and add less value for Slavonia are in the bottom
left.97
95 In fact, Estonia targets just one sector, ICT, albeit with various subsectors underneath: https://investinestonia.com/business-opportunities/ 96 Source: World Bank standard sector scan methodology. 97 Note that this is a relative comparison of subsectors. Hence, it is not suggested that a subsector in quadrant 4 has zero value as an investment or has zero value proposition to investors.
De
sira
bili
ty
Feasibility

116
Table 9 Overarching Considerations in the Pursuit of Investment Promotion by Sector and ‘Ready to Go’ Subsectors
Sector Desirability98 Feasibility ‘Ready to Go’ Subsectors
ICT Highly desirable, with significant crossovers of ICT activity into other sectors, e.g. mobile apps for tourism. While job creation is less than in manufacturing activities, the quality of jobs typically add value, boost exports, and offer significant productivity gains.
By far the largest sector in terms of the volume of FDI projects that can be competed for, although job numbers may not always be high in the short-term. Slavonia also has the basis of a competitive offer, as outlined in the previous section of this chapter.
• Custom
computer
programming
services
• Data
processing,
hosting and
related
services Wood FDI in the sector is desirable,
increasing as projects focus on value-added processing rather than simply sawmilling or untreated boards. There is also high potential for sizable job creation, productivity increases and exports, given the relatively few existing high-quality manufacturers in Slavonia.
Relatively small in terms of the scale of FDI potential. However, Slavonia has the basis for a highly competitive offer given its natural resources, but this can only be realized with the regulatory reform of access to wood supplies for new entrants, which is currently curtailed.
-
Agribusiness Processing activities are generally more desirable than simple crop / animal production. However strong desirability also extends to activities including manufacturing agricultural machinery, cold storage, etc. These will tend to offer greater export potential, as they are high value-added.
Similar to wood in that the region has strong natural resources, but it is restricted by regulatory issues – in this case agricultural subsidies which incentivize large landholdings and low productivity production, which impact on the sector as a whole. However, this is less of a key concern for processing activities.
• Fruit and
vegetable
preserving,
especially food
manufacturing
Tourism Generally weaker than other sectors, as salaries will tend to be lower. However, the sector can be a significant job creator and attract substantial foreign exchange from overseas tourists.
Highly driven by the demand of tourists, i.e. if Slavonia can attract more visitors, there is a greater business case to attract investors.
• Boutique
hotels
N.B. The conclusions of this section are distinct from Chapter 1. Chapter 1 examines growth opportunities for companies that are already in Slavonia, focusing on export opportunities. This section examines subsectors that can be attractive to new foreign investors and are desirable for Slavonia’s economy.
98 See the annexes for a further elaboration of the specific desirability and feasibility criteria considered in the assessment.

117
3.1. ICT Sector
3.1.1. The Potential Impact of FDI on ICT in Slavonia
Largely concentrated in the city of Osijek, the challenge for the ICT industry is to move on from generic lower-value outsourcing services to more specialized software development. The ICT sector represents just 2% of Slavonian GDP, well below the EU average,99 but is faster growing in terms of employees, exports, and revenues than other major sectors.100 By developing a clear specialized cluster, an increasing number of overseas firms can be drawn to the region, and thereby further grow the cluster into a true ICT hub. Osijek Software City is a positive step that contributes towards this, yet with only around 1,000 ICT employees across Slavonia and just 1% of total ICT exports in Croatia, the gap is still significant.101
FDI in the sector could be transformative in terms of productivity, salary levels, and the potential for increasing exports. Globally, ICT is the largest sector for FDI in terms of investment projects, and while some investments may not have the levels of job creation as in manufacturing, these jobs are often of high quality. Moreover, ICT plays a prominent role in enabling other sectors. For example, mobile apps and software are key to the modernizing process in agribusiness and the tourism sectors.
3.1.2. Rapid FDI Sector Scan Results
The figure below provides a high-level view of the desirability (vertical axis) and feasibility (horizontal axis) scoring for each of the subsectors identified as being worthy of full analysis. Detailed scores and explanations are provided in the appendices. This shows two subsectors that are ‘ready to go’ and two that are ‘aspirational’.
Figure 61 Matrix of ICT Subsector Scores
99 European Digital Progress report 2017, European Commission. 100 Concept Note, RAS Growth and Jobs in Eastern Croatia, July 2018. Analysis by HUP (Hrvatska Udruga Poslodavaca; Croatian Employers’ Association) in 2017. 101 Comparing this to Cluj in Romania, with 10,000 employees, and significant R&D activity. Source: Osijek Software City.
Internet publishing &
broadcasting & web search
Video games, applications and digital content
Computer systems design services
Custom computer programming services
Data processing, hosting, & related
services
Other computer related services
Software publishing
2.9
3.0
3.1
3.2
3.3
3.4
3.5
3.6
2.0 2.2 2.4 2.6 2.8 3.0 3.2 3.4
Desi
rabili
ty
Feasibility
ASPIRATIONAL
READY TO GO
LOW VALUE OPPORTUNITIES
LOW VALUE & ATTRACTIVENESS
LOW VALUE &
ATTRACTIVENESS
118
• Custom computer programming services score highly, as there is already strong evidence of
significant sales from Slavonian companies, and this is where the bulk of the existing companies are in the sector (more than 180), albeit none having 100+ employees. This includes firms such as Inchoo and Ofir. The subsector also has good potential for job creation from FDI projects relative to other subsectors.102
• Data processing, hosting & related services are on the border of being towards the lower value quadrant but nevertheless are a relatively competitive offer. While few specifics of the offer standout, there are more than 200 existing employees, and HRK 43 million of sales from existing firms such as Dokument Zastita (‘Document Security’) in 2017.
• Other computer-related services are more aspirational in large part because there are simply fewer FDI projects to target in this subsector. Moreover, because it covers activities not defined elsewhere, the market is smaller and more disparate than other subsectors.
• Software publishing is by far the largest sector in terms of FDI opportunity, as the Central and Eastern Europe region has seen more than 500 FDI projects here since 2003. However, it is aspirational as Slavonia currently has few companies engaged in actual software development. This is because this typically requires specialist skills, which are not yet available in sufficient numbers.
The three discounted subsectors are not undesirable per se, in that most activities within ICT are of relatively high value, but the others represent slightly higher value. In terms of feasibility, the key difference is largely in terms of market factors, i.e. the overall potential to attract investors rather than a particular strength that Slavonia currently offers in any of these areas. The exception here would be video games, where there is little evidence of any existing specialization.103 There is further detail on priority subsectors and specific activities in the next section.
3.1.3. The Existing ICT Company Presence
Key existing companies within the ‘ready to go’ subsectors cited above include the following, identified from our extensive company consultations and Financial Agency (FINA) data:104
Subsector Examples of existing companies
Custom computer programming services Ofir, Inchoo, Adcon, Mono.hr Data processing, hosting & related services Dokument Zastita, welove-IT (a small German investor)
3.1.4. Defining the ICT Opportunity
Within ICT, the subsector definitions using industry codes do not define the nature of the opportunity. Hence, it is important to describe these opportunities in terms of specific activities / technologies.
‘READY TO GO’:
Custom computer programming services cover firms primarily engaged in writing, modifying, testing, and supporting software to meet the needs of a particular customer. This is essentially where much of Slavonia’s ICT activity currently sits, and should therefore be the basis for the existing offer presented
102 More than 140 jobs on average per project, based on fDi Markets estimates. 103 One consultation did suggest the presence of video gaming activity in Osijek, but this is not supported by firm-level Bureau of Statistics data. 104 Financial Agency (FINA) data, 2017.
119
to investors. Effectively, it is a form of high-end consulting services, and should be marketed as such. For example, cloud computing is expanding, with adoption rates of software as a service (SaaS) and infrastructure as a service (IaaS) on a strong growth trajectory.105
Data processing, hosting & related services cover ICT infrastructure facilities but are also concerned with the handling of data. In this sense, they can be defined as being akin to business processing outsourcing (BPO). However, this can be extended: the export of software development services (SDS) is broader than BPO, and includes creative industries, remote software delivery, self-employment, and peer-to-peer business. Slavonia stands a better chance of competing in some of these niche sectors rather than competing on cost or size with Romania and Bulgaria.106
‘ASPIRATIONAL’:
Other computer-related services are essentially a subsector covering ICT activities that are not defined elsewhere, such as computer disaster recovery services or software installation services. However, by its nature, this subsector would be difficult to specifically target. It is categorized as ‘aspirational’, given that by combining its disparate parts it presents an overall opportunity, but in practical terms FDI promotion is likely to be more effective in considering the specific opportunities discussed elsewhere in this section.
Software publishing. This represents the aspirational subsector that existing ICT professionals can aspire to reach. Where the ‘ready to go’ sectors are selling a service, this subsector is selling a product. The challenge here is for the Osijek cluster to gain the expertise and critical mass to transform itself into a credible specialist cluster. This will take time and needs the commitment of the university in evolving its programs and research to become a genuine center of excellence, together with the city infrastructure that will allow firms to grow and expand. The entry of IBM and Ericsson should therefore be viewed as a boost that should enhance the levels of dynamism, competition, and professionalism across the industry rather than a threat to existing ICT SMEs. In terms of what the developing cluster could become, one suggestion is moving in the direction of developing internet / mobile applications,107 where more companies are operating. However, there are numerous ‘disruptive’ technologies that could form the anchor of the future software development offer, for example cybersecurity, machine learning, artificial intelligence, big data analytics, and blockchain.108
Annex A provides detailed information on how Croatia’s investment promotion team can take the results of this ICT sector scan forward through locating investors to target and more effectively selling the opportunity presented by the region. It also provides a thorough assessment of the policy and regulatory challenges faced in the ICT sector.
105 Growth opportunities & constraints in Slavonia: Information and Communications Technology. World Bank Presentation, February 2018. 106 Ibid. 107 Ibid. 108 Strategic Segmentation Cybersecurity, Croatia Competitiveness Reinforcement Initiative report. World Bank, 2018.
120
3.2. Wood Processing Sector
3.2.1. The Potential Impact of FDI on Wood in Slavonia
Slavonian wood sector activity is primarily low added-value from small firms, with a few larger firms such as Spačva being the exception. The Croatian wood sector has a strong tradition, and is largely concentrated in Slavonia, where it represents 16% of regional GDP109 and 8% of all Croatian exports.110 In 2015, the profit from furniture manufacturers was less than a tenth of that from forestry and logging.111
There is an opportunity for higher-end FDI to support the industry’s move up the value chain. This is not only desirable but a necessity for the long-term health of the sector. China is now the largest exporter of furniture worldwide, which therefore increases the competitive pressures on Croatian manufacturers, which are already evident following EU accession. The effect of FDI in adding to available technology, encouraging improvements in skills, and fostering innovation in new products is therefore crucial. While this competitive element may be difficult for some domestic firms, the net effects should be increased quality job creation within the sector, with firms more able to compete internationally.
Moreover, there is evidence that in the right conditions investors will enter Croatia. Examples have included the Hass Group (Germany) and DI Klana (Italy), but they do not tend to be in Slavonia, and have found success difficult due to the business environment.112
3.2.2. Rapid FDI Sector Scan Results
Figure 62 provides a high-level view on the desirability (vertical axis) and feasibility (horizontal axis) scoring for each of the subsectors identified as being worthy of full analysis. Detailed scores and explanations are provided in the appendices. Two subsectors that are ‘aspirational’ are shown.
The furniture subsector scores relatively well compared to other subsectors, as it provides high value-add and job creation (estimated at an average of almost 200 jobs per FDI project),113 which is combined with strong evidence of Slavonia’s existing track record in the sector in terms of sales from companies such as Spin Valis and Spačva. Other wood products score slightly higher, as in Slavonia it is actually a slightly larger sector than furniture in terms of sales, with more potential FDI projects to target (124 projects in CEE compared to 55 in furniture since 2003).114 However, it is important to note that despite these strengths, the two subsectors remain aspirational because of the closed quotas on wood resources.
Sawmilling and basic woodworking score lower in terms of desirability simply because they add less value, given that the logs remain either unprocessed or are simply processed into boards. Feasibility is also low, in particular due to the very few foreign investors looking to access this type of opportunity within Central and Eastern Europe.
109 Concept Note, RAS Growth and Jobs in Eastern Croatia, July 2018. 110 Global Value Chain Assessment for the Sustainable Wood Production and Processing Sector in Croatia, Croatia Competitiveness Reinforcement Initiative, Project Stribor, November 2016, World Bank. 111 Growth Opportunities & Constraints in Slavonia, Wood Industry, February 2018. Source: FINA data in World Bank Presentation. 112 Global Value Chain Assessment for the Sustainable Wood Production and Processing Sector in Croatia, Croatia Competitiveness Reinforcement Initiative, Project Stribor, November 2016, World Bank. 113 fDi Markets. 114 fDi Markets.

121
Figure 62 Matrix of Wood Subsector Scores
3.2.3. The Existing Wood Company Presence
Key existing companies within the ‘aspirational’ subsectors cited above include the following, identified from our extensive company consultations and Financial Agency (FINA) data:115
Subsector Examples of existing companies
Furniture, homeware and related wood products Spačva, Spin Valis, Tvin Other wood products Oprema Barić, Matešić
3.2.4. Defining the Wood Opportunity
Despite the strong tradition of the wood industry in Slavonia, no subsector is defined in this chapter as ‘ready to go’. This is simply due to the business environment. While the government’s quota system remains in its current form, the market is effectively closed to investors. Any overseas firm’s investment business case is based on achieving growth within the market’s conditions. While foreign firms have previously entered the market, consultations suggest that these attempts have been unsuccessful due to these quota restrictions.116 Should this be addressed, then FDI opportunities do exist, as Slavonia’s wood quality is a competitive advantage. This would primarily be with high-value manufacturing investors that address 'missing markets' resulting from innovation failures.117
‘ASPIRATIONAL’:
Furniture, homeware & related wood products. The main opportunities can be found in customized business-to-business markets, not in high-volume consumer markets. These high unit value products
115 Financial Agency (FINA) data, 2017. 116 Ikea is not at example here, as it is only a retailer in Croatia – no manufacturing takes place in the country but does so in other CEE countries (Hungary, Poland, Slovakia, and Lithuania). 117 Positively, the Wood Competence Center and the University of Osijek are working together with wood industries to improve their products and support innovation.
Furniture, homeware & related wood
products
Other wood products (i.e. not furniture)
Sawmilling and basic woodoworking
2.0
2.2
2.4
2.6
2.8
3.0
3.2
3.4
3.6
3.8
4.0
3 3.2 3.4 3.6 3.8 4 4.2 4.4
Desi
rabili
ty
Feasibility
ASPIRATIONAL READY TO GO
LOW VALUE OPPORTUNITIES
LOW VALUE & ATTRACTIVENESS
LOW VALUE &
ATTRACTIVENESS

122
require combining high-quality woodworking with design and project management skills. At the lower end, ‘flat pack’ furniture is also gaining a market share, but is a riskier business segment because it is heavily dependent on the low costs of production and is relatively footloose, meaning that foreign investors are often willing to relocate these types of operations when market conditions change. Hence, the key opportunities for Slavonia lie with higher-end manufacturing investors, who are attracted to Slavonia for reasons beyond costs, hence are more likely to become embedded in the region.
Other wood products (i.e. not furniture). Commercial buyers (e.g. the hospitality industry and luxury retail stores) are demanding interior solutions that differentiate their brands from the competition. Companies involved in manufacturing in this space do not just make the product but will engage in customized processing and finishing, but also follow-on installation and repair services.118 Hence, these types of manufacturers are meeting a high-end demand. At the same time, Slavonia does have historical comparative advantages in semi-finished products (i.e. parquet) and industrial products (wooden containers), and these types of investors should not be discounted.
Annex A provides detailed information on how Croatia’s investment promotion team can take the results of this wood sector scan forward through locating investors to target and more effectively selling the opportunity presented by the region. It also provides a thorough assessment of the policy and regulatory challenges faced in the wood sector.
118 Global Value Chain Assessment for the Sustainable Wood Production and Processing Sector in Croatia, Croatia Competitiveness Reinforcement Initiative, Project Stribor, November 2016, World Bank.
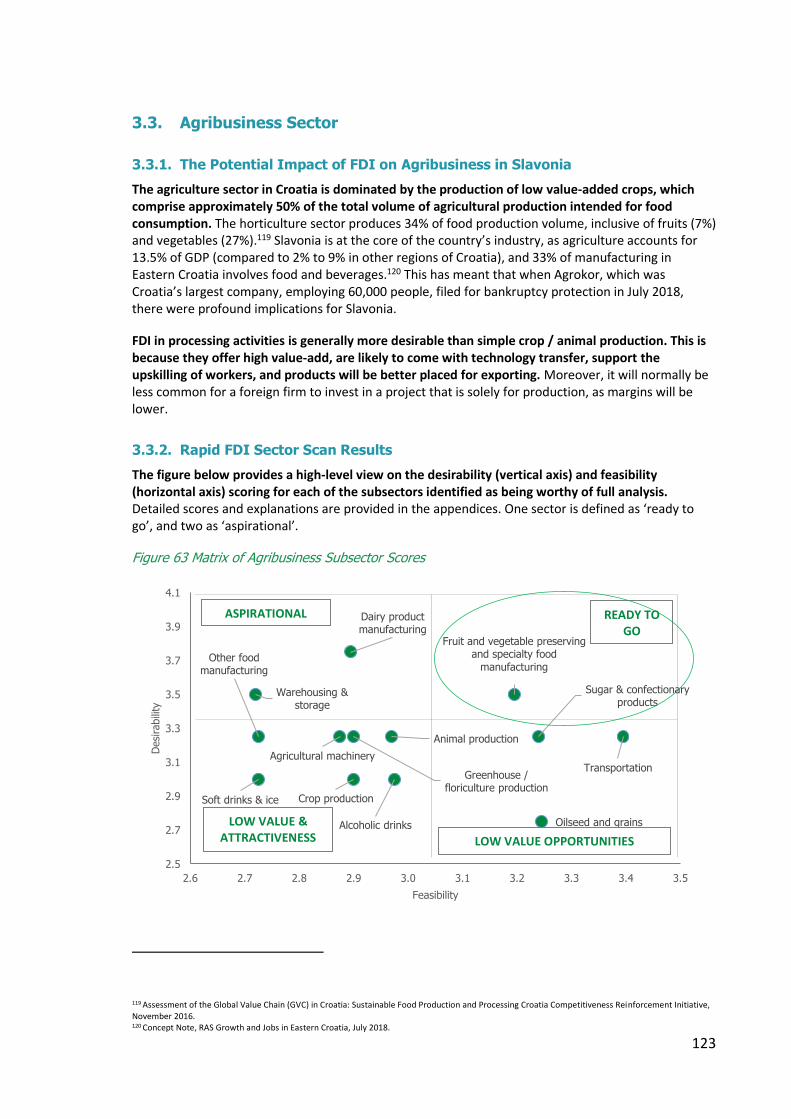
123
3.3. Agribusiness Sector
3.3.1. The Potential Impact of FDI on Agribusiness in Slavonia
The agriculture sector in Croatia is dominated by the production of low value-added crops, which comprise approximately 50% of the total volume of agricultural production intended for food consumption. The horticulture sector produces 34% of food production volume, inclusive of fruits (7%) and vegetables (27%).119 Slavonia is at the core of the country’s industry, as agriculture accounts for 13.5% of GDP (compared to 2% to 9% in other regions of Croatia), and 33% of manufacturing in Eastern Croatia involves food and beverages.120 This has meant that when Agrokor, which was Croatia’s largest company, employing 60,000 people, filed for bankruptcy protection in July 2018, there were profound implications for Slavonia.
FDI in processing activities is generally more desirable than simple crop / animal production. This is because they offer high value-add, are likely to come with technology transfer, support the upskilling of workers, and products will be better placed for exporting. Moreover, it will normally be less common for a foreign firm to invest in a project that is solely for production, as margins will be lower.
3.3.2. Rapid FDI Sector Scan Results
The figure below provides a high-level view on the desirability (vertical axis) and feasibility (horizontal axis) scoring for each of the subsectors identified as being worthy of full analysis. Detailed scores and explanations are provided in the appendices. One sector is defined as ‘ready to go’, and two as ‘aspirational’.
Figure 63 Matrix of Agribusiness Subsector Scores
119 Assessment of the Global Value Chain (GVC) in Croatia: Sustainable Food Production and Processing Croatia Competitiveness Reinforcement Initiative, November 2016. 120 Concept Note, RAS Growth and Jobs in Eastern Croatia, July 2018.
Agricultural machineryTransportation
Warehousing & storage
Sugar & confectionary products
Fruit and vegetable preserving and specialty food
manufacturing
Dairy product manufacturing
Other food manufacturing
Soft drinks & ice
Alcoholic drinks Oilseed and grains
Crop production
Animal production
Greenhouse / floriculture production
2.5
2.7
2.9
3.1
3.3
3.5
3.7
3.9
4.1
2.6 2.7 2.8 2.9 3.0 3.1 3.2 3.3 3.4 3.5
Desi
rabili
ty
Feasibility
ASPIRATIONAL
ASPIRATIONAL
READY TO GO
LOW VALUE OPPORTUNITIES
LOW VALUE & ATTRACTIVENESS
LOW VALUE &
ATTRACTIVENESS

124
Fruit and vegetable processing can be viewed as the logical higher-value progression from Slavonia’s current situation as primarily a producer. The subsector offers the strongest agribusiness pipeline of potential FDI projects, while having similar fundamentals around existing capabilities to other agribusiness subsectors. One existing innovative producer in tomatoes and cucumbers is Osatina, so it is in these types of specific crops, rather than all crops, where a processing investor would have opportunity.
Warehousing and storage score strongly for desirability in terms of the potential average job creation from FDI projects here, since they are of reasonably high value, as the focus would be on specific needs such as cold storage. While competitive in terms of cost, their competitive weakness is the relatively limited existing supply, which is why they are desirable as an enabler of the sector as a whole.
Dairy manufacturing scores highly based on the potential for high FDI job creation, high added value, and its strong export potential. While there are two existing firms with more than 100 employees in Slavonia, including FDI from German firm Meggle, the subsector does not stand out in terms of feasibility. This is because it appears there is relatively limited activity beyond these two firms, and it is not a subsector that sees major volumes of FDI compared to others.121 Hence, it is the desirability of this subsector that moves it into the priority list, particularly when the focus is on advanced, rather than basic processed products (e.g. butter, as opposed to raw milk).
A number of other sectors in the analysis were on the borderline between being low value and aspirational, and there is an argument that many of the processing subsectors would add clear value to Slavonia. Hence, those such as soft drinks & ice and alcoholic drinks scored low for desirability, simply because on average, these FDI projects tend to create slightly fewer jobs than those in other subsectors.122 The table also shows transportation and sugar & confectionery products being ranked high but rated as low value opportunities. This judgement is made based on a preference for Slavonia to move up the value chain. Hence, while there are large existing sugar & confectionery facilities in Slavonia, targeting this could be at the expense of the range of higher-value opportunities in fruits and vegetables processing, due to scarce time and resources. In this sense, desirability is given preference, since it is good practice to focus on a smaller number of opportunities with more resources. In terms of transportation, there is a case to incorporate this into warehousing & storage.
3.3.3. The Existing Agribusiness Company Presence
Key existing companies within the ‘ready to go’ and ‘aspirational’ subsectors cited above include the following, identified from our extensive company consultations and Financial Agency (FINA) data:123
Subsector Example existing companies
Fruit and vegetable processing PIK Vinkovci, Unifruit Warehousing and storage Lagermax, Hlad Usluge Dairy manufacturing Meggle, Novi Domil
3.3.4. Defining the Agribusiness Opportunity
As in the previous two sectors, a key objective of attracting FDI is for the industry to move up the value chain. This means positive impacts on the incomes of workers together with upgrading
121 For example, from 2003-18 fDi Markets recorded 62 projects in Central and Eastern Europe in dairy manufacturing. However, more were recorded in 6 other sectors, including fruit and vegetable processing with 99 projects. 122 These were the only two sectors estimated to create fewer than 100 jobs per FDI project on average in Agribusiness, based on fDi Markets data for Central and Eastern Europe since 2003. Wineries in particular create an estimated 48 jobs. In contrast, fruit and vegetable processing creates an estimated 124 jobs. 123 Financial Agency (FINA) data, 2017.

125
workforce skills and productivity. The challenge in achieving this, however, is to create an investment environment that provides comfort to an investor. The first element to this would involve land reform so that the region is able to produce better quantities, quality and varieties of crops that go beyond the typical corn (maize), wheat, potatoes, and sugar beets.124 This in itself creates more interest from processors. However, this will need to go hand in hand with upskilling and retention of the workforce, development of infrastructure, and technology improvements.
‘READY TO GO’:
Fruits and vegetable and specialty food manufacturing. It appears a natural progression to build upon the existing crop production taking place in the region. Higher-value segments tend to be ‘niche’ products, for example: organic and functional foods; PDO (protected designation of origin) and PGI (protected geographical indication) products, and ‘indulgence’ foods.125 The key in this subsector is identifying processors for each of the crops. If referring to wheat, this could mean a quality cereal manufacturer; if potatoes, this could mean an organic chips manufacturer, and so on.
‘ASPIRATIONAL’:
Warehousing and storage. This subsector is a key enabler of the sector and is aspirational in the sense that there is currently a gap. In particular, there is an absence of post-harvest and cold-chain infrastructure to assist in the production and commercialization of higher-value perishable crops.126 If this subsector is extended to transportation, while there is less of an acute need, one industry expert estimates that historical underinvestment by logistics service providers means that only 30-40% of Croatian companies are able to outsource this function compared to the EU average of 70%.127
Extending into other enabling areas of the agribusiness industry, bottling and packaging practices in Croatia are also substandard, and traditional packaging methods using metal cans and basic plastic packaging remain common.128
Dairy manufacturing represents a subsector which exists in Slavonia, and indeed has a foreign investor (Meggle), but there is potential for more under the right conditions. For example, Croatia currently has only one laboratory certified for milk, which is close to Zagreb rather than in Slavonia. New investors in the subsector will also continue to bring further innovation, which beyond milk and cheese can also include yogurt, ice cream, dairy ingredients, and whey protein.
Annex A provides detailed information on how Croatia’s investment promotion team can take the results of this agribusiness sector scan forward through locating investors to target and more effectively selling the opportunity presented by the region. It also provides a thorough assessment of the policy and regulatory challenges faced in the agribusiness sector.
124 Large plots are generally owned by large enterprises such as Agrokor. Hence, the only land that can be purchased is family-owned plots that are too small for conversion for significant commercial investment. 125 World Bank interview, Croatian Food Agency. 126 World Bank Concept Note, RAS Growth and Jobs in Eastern Croatia, July 2018. 127 World Bank, Assessment of the Global Value Chain (GVC) in Croatia: Sustainable Food Production and Processing. Croatia Competitiveness Reinforcement Initiative, November 2016. 128 Ibid.

126
3.4. Tourism Sector
3.4.1. The Potential Impact of FDI on Tourism in Slavonia
Tourism represents just 0.5% of Slavonia’s GDP, and 0.5% of overnight stays in all of Croatia, but has grown by one-third since 2010, a growth rate which rivals trends in the rest of the country.129 More than one-third of overnight arrivals are foreigners.
While the effect of FDI in tourism will be generally weaker than other sectors in terms of value added, as salaries will be lower, it can be a significant job creator and attract significant foreign exchange from international tourists. Targeting FDI opportunities is often about having a suitable combination of opportunities that are accessible for all the population. Hence, tourism’s scale of job creation can complement ICT’s quality of job creation.
3.4.2. Rapid FDI Sector Scan Results
The figure below provides a high-level view on the desirability (vertical axis) and feasibility (horizontal axis) scoring for each of the subsectors identified as being worthy of full analysis. Detailed scores and explanations are provided in the appendices. One sector is defined as ‘ready to go’, and as many as seven can be seen as ‘aspirational’.
Figure 64 Matrix of Tourism Subsector Scores130,131
129 Multiple sources: Concept Note, RAS Growth and Jobs in Eastern Croatia, July 2018. Moreover, between 2016 and 2017, Slavonia outpaced overall overnight growth in Croatia (14.1% increase in Slavonia versus 10.6% in Croatia. Source: Croatian Bureau of Statistics). 130 It is important that subsectors for investors are also aligned with targeting subsectors for tourists so that the tourism offer being developed through the attraction of foreign investors meets the types of tourism that Slavonian counties aim to attract. For example, efforts to attract wine tourists and eco-tourists etc. are relevant to each of the ‘ready to go’ and aspirational subsectors for investors identified here. 131 Some of the subsectors would often look more towards government investment or PPP solutions. However, there are FDI examples. In road transport, for example, major investors across Europe include Italian coach operator Terravison, and in rail the Dutch firm Abellio.
Boutique hotels
Bookings / reservations
Other supporting services / suppliers
Tour operators and holiday
representatives
Air
RailRoad
Performing arts, spectator sports, &
related
Other amusement & recreation industries
Museums, historical sites, & similar
Natural attractions
0.0
0.5
1.0
1.5
2.0
2.5
3.0
3.5
4.0
4.5
1.7 1.9 2.1 2.3 2.5 2.7 2.9 3.1 3.3 3.5
Desi
rabili
ty
Feasibility
ASPIRATIONAL READY TO GO
LOW VALUE OPPORTUNITIES
LOW VALUE & ATTRACTIVENESS
LOW VALUE &
ATTRACTIVENESS

127
The ‘ready to go’ sector is hotels. In terms of feasibility, this subsector will typically be identified because it is by far the largest subsector for foreign investors within tourism. However, it is also competitive in terms of desirability, as it can be a significant job creator.
Bookings / reservations firms are aspirational, given it is another area that sees solid numbers of FDI investments. However, like all subsectors in tourism, feasibility is present because the sense is that the industry is at an early stage in Slavonia, and that it will be driven by tourist demand, so its key investment drivers are quite different to the other sectors considered132. Other supporting services / suppliers are similar to this. Air transport is significant in terms of desirability, as air connections are very limited, which is a disincentive for international tourists. Again though, this subsector becomes feasible with demonstrable tourist demand.
The remaining four aspirational subsectors are performing arts, museums, natural attractions, and other amusements. While they have varying scores, they can all be categorized as types of attraction. All of them are desirable to varying degrees, but as above, investors would need to see tourist demand for the product / service. Moreover, the number of FDI investors compared to domestic investors in these areas may be low, although any single project could be quite large.
As with agribusiness, one subsector with a rank higher than other aspirational sectors misses out (road). This is because while Road transport scores well for feasibility (i.e. there are existing bus companies and good road links), the desirability for a foreign investor here is weak, as there is less of a gap to address.
3.4.3. The Existing Tourism Company Presence
Key existing companies within the ‘ready to go’ subsector cited above include the following, identified from our extensive company consultations and Financial Agency (FINA) data:133
Subsector Examples of existing companies
Hotels
Hotels Osijek, Waldinger, etc. ( although these are not in the specific niche of opportunity cited below)
3.4.4. Defining the Tourism Opportunity
The key to attracting FDI in the tourism sector is demonstrating demand for tourist products. While there is growth in the industry in Slavonia, it still represents a tiny proportion of that found elsewhere in the country.134 Therefore, to boost tourism demand will mean a concerted and coordinated marketing campaign towards tourists at the national and local levels. While other factors such as skills and infrastructure are important, they remain insignificant without efforts to attract more tourists. Hence, beyond the specific demand in hotels described below, all other subsectors are only aspirational at this point.
‘READY TO GO’
Hotels. There is little need for further supply of hotel rooms currently in Osijek, where the existing hotels are typically enough to meet current demand. Instead, there is a need for boutique, ‘experience’ hotels in rural areas, which in themselves can become destinations. Hence, the need is not for a large chain to invest (although they would normally franchise or use a management contract
132 Bookings / reservations here refers more to smaller scale niche operators that will help to strengthen the region’s tourism value chain. This will help to support growth in demand from tourists. The subsector is less focused on large scale investors such as Booking.com, which are significant job creators, but are less likely to be attracted to Slavonia currently. 133 Financial Agency (FINA) data, 2017. 134 There were more than 430,000 overnight stays in 2017, which represents just 0.5% of total stays in the country. Source: Croatian Bureau of Statistics.

128
rather than construct their own building anyway). In Požega-Slavonia County, there are currently no hotel beds at all, only guesthouses. Hence, a boutique hotel investment alongside a relevant attraction here would be beneficial. At the same time, it should be recognized that this gap could well be served by a domestic investment, and indeed this may be more likely.
‘ASPIRATIONAL’:
Bookings / reservations. This subsector would be important in managing an increase in tourism demand, and could be linked to an ICT investor (e.g. online booking systems), and so offers a crossover within the four sectors of this chapter. There are also relatively few existing incoming tour agencies in the region, so there is scope for other booking companies with an international reach should tourism increase. While difficult to define as a subsector, potential investors can also include firms such as UK-based Secret Escapes. This is an example of a travel company that sells hotel stays and trips through its website and mobile app, with offices in each of the locations they feature as destinations. Hence such an investment would create jobs, but more importantly contribute to boosting tourism demand.
Other supporting services / suppliers. This largely refers to companies supplying other investors. For example, supplying laundry, catering, furniture to a hotel, etc. The sector is aspirational in the sense that should the tourism industry significantly grow in terms of investors (domestic or foreign) in the other subsectors discussed here, there will not be sufficient local supply to meet their needs. At the same time, targeting of this subsector would have to be quite specific so that it does not crowd out local firms that do have the capability of adapting to increased demand.
Air transport. There is currently only one year-round international flight to Osijek, from Basel135. A small number of flights from Germany also operate seasonally, but this is not enough. Of course, the challenge is to demonstrate demand, and offering subsidies is not a recommended solution, as it is not sustainable without demonstrating that tourism numbers will grow at a more rapid pace. Nevertheless, it is clearly an aspirational subsector to target in the future, as it has the potential to unlock more significant tourism demand.
Performing arts / Museums / Natural attractions / Other amusements – These four subsectors can be grouped together, as the specific target will vary depending on the type of tourism that local and national government prioritize within future marketing efforts. Through consultations, the key tourist offer appears to come from food and wine, and that could lend itself to any of the types of activity above. Other potential areas cited in company consultations include:
• Further capitalizing on the natural environment beyond birdwatching
• Biking tourism
• A larger conference center
• Wellness / health tourism
Thus, the focus of tourism investment promotion will depend upon which of the above is the focus of tourist promotion. However, as with any of the above, there is the supply/demand dilemma, for example attracting health tourists will be difficult until the region has a health infrastructure to offer, but likewise this offer in unlikely to be developed without clear tourist demand.
While FDI could in time meet the need for more attractions, in the short-term, PPP solutions might be deemed more realistic. Nevertheless, there are examples of FDI investors in Europe, such as Smithsonian in museums, the Ambassador Theatre Group in performing arts, etc.
135 Served twice weekly by Wizzair.
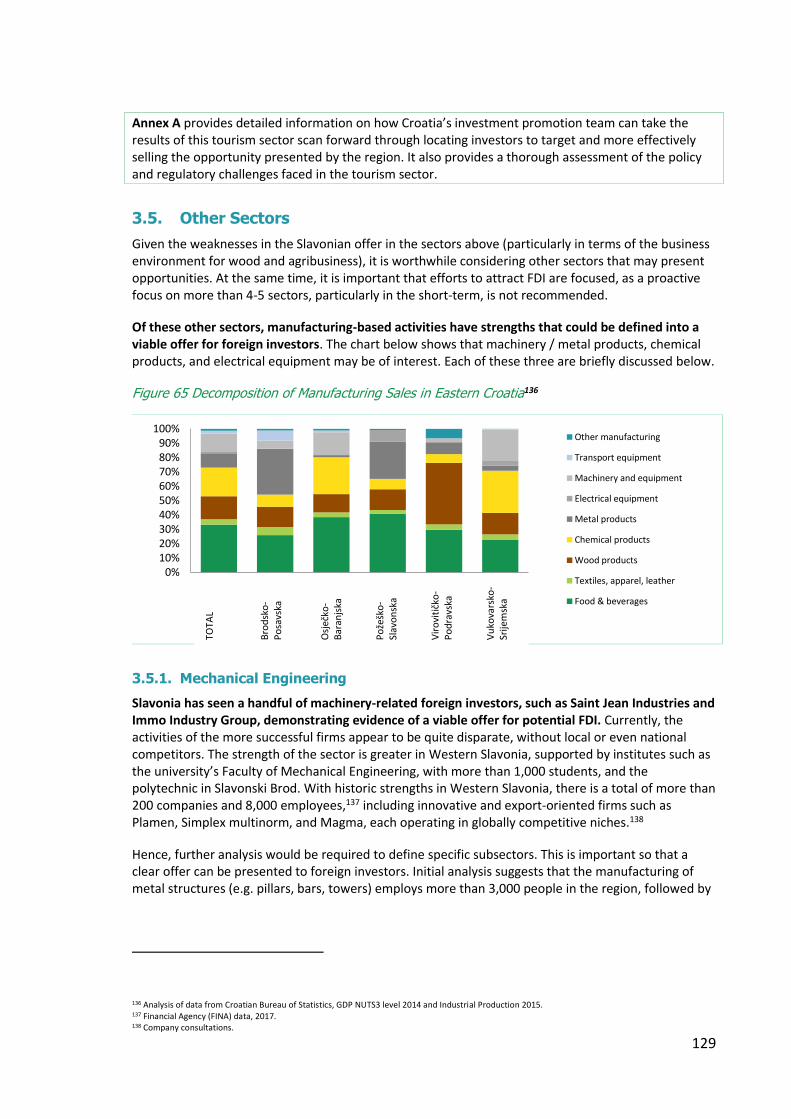
129
Annex A provides detailed information on how Croatia’s investment promotion team can take the results of this tourism sector scan forward through locating investors to target and more effectively selling the opportunity presented by the region. It also provides a thorough assessment of the policy and regulatory challenges faced in the tourism sector.
3.5. Other Sectors
Given the weaknesses in the Slavonian offer in the sectors above (particularly in terms of the business environment for wood and agribusiness), it is worthwhile considering other sectors that may present opportunities. At the same time, it is important that efforts to attract FDI are focused, as a proactive focus on more than 4-5 sectors, particularly in the short-term, is not recommended.
Of these other sectors, manufacturing-based activities have strengths that could be defined into a viable offer for foreign investors. The chart below shows that machinery / metal products, chemical products, and electrical equipment may be of interest. Each of these three are briefly discussed below.
Figure 65 Decomposition of Manufacturing Sales in Eastern Croatia136
3.5.1. Mechanical Engineering
Slavonia has seen a handful of machinery-related foreign investors, such as Saint Jean Industries and Immo Industry Group, demonstrating evidence of a viable offer for potential FDI. Currently, the activities of the more successful firms appear to be quite disparate, without local or even national competitors. The strength of the sector is greater in Western Slavonia, supported by institutes such as the university’s Faculty of Mechanical Engineering, with more than 1,000 students, and the polytechnic in Slavonski Brod. With historic strengths in Western Slavonia, there is a total of more than 200 companies and 8,000 employees,137 including innovative and export-oriented firms such as Plamen, Simplex multinorm, and Magma, each operating in globally competitive niches.138
Hence, further analysis would be required to define specific subsectors. This is important so that a clear offer can be presented to foreign investors. Initial analysis suggests that the manufacturing of metal structures (e.g. pillars, bars, towers) employs more than 3,000 people in the region, followed by
136 Analysis of data from Croatian Bureau of Statistics, GDP NUTS3 level 2014 and Industrial Production 2015. 137 Financial Agency (FINA) data, 2017. 138 Company consultations.
0%10%20%30%40%50%60%70%80%90%
100%Other manufacturing
Transport equipment
Machinery and equipment
Electrical equipment
Metal products
Chemical products
Wood products
Textiles, apparel, leather
Food & beverages
TOTA
L B
rod
sko
-P
osa
vska
O
sječ
ko-
Bar
anjs
ka
Po
žešk
o-
Slav
on
ska
Vir
ovi
tičk
o-
Po
dra
vska
V
uko
vars
ko-
Srije
msk
a

130
the manufacturing of steam generators with just under 1,000.139 Thus, these subsectors would likely be the starting point.
With these subsectors identified, the next steps would be to define the nature of the specific opportunity, the value proposition, and the locations of the opportunity, as has been done for the four main sectors of focus in this chapter.
The same general challenges as found in the four main sectors above would also apply to the investor concerning access to skilled labor and business environment factors.
3.5.2. Chemicals
Based on existing evidence, the chemicals sector does not currently represent a strong enough offer to justify proactive targeting for FDI. Slavonia has seen two chemicals investments in recent years, according to fDi Markets, which includes the Italian firm Adriatica investing in a fertilizer plant. 2017 firm data also shows around 200 employees in chemicals manufacturing from around 9 firms. While these are relatively small numbers, they do provide some evidence, and the overlap with agribusiness can also be supportive. Links to the broader sector have also been considered, such as EcoCortec for plastics and Vukovar-based Yasenka for pharmaceuticals, but again represent a very small existing number of companies.
3.5.3. Electrical Equipment
This subsector is likely to be better represented as a subset of the machinery and metal products sector above. Data suggests more than 20 companies and 450 employees are involved in the manufacture of electrical equipment. While there is limited evidence of existing FDI, domestic firms such as Đuro Đaković provide electrical and other engineering services and products for industrial and public utility use. These also offer synergies within the 4 key sectors of this chapter, such as fostering better automation in agribusiness.140
139 Financial Agency (FINA) data, 2017. 140 World Bank Presentation - Growth Opportunities & Constraints in Slavonia, ICT Industry, February 2018.

131
4. Policy, Regulatory & Institutional Barriers for FDI
The following sections provide analysis of the key policy, regulatory and institutional barriers to FDI in Slavonia. The first section examines policy and regulatory barriers, including the lack of a national FDI strategy, the limited alignment of investment incentives with Slavonia, and the currently insufficient status of investor protection; the second section examines shortcomings in the institutional framework for investment promotion; and the third section looks at regulatory barriers to FDI in each sector.
4.1. Policy and Regulatory Barriers
4.1.1. Lack of a National FDI Strategy
Croatia currently lacks a national FDI strategy, and the primary investment policy tool used by the Government of Croatia is investment incentives, which is only one of many policy instruments that are used by governments successful in attracting FDI. Recent research by the World Bank suggests that while export-oriented investors tend to be more responsive to incentives, incentives are of less importance to them than other investment climate factors.141 In addition, the analysis of locational criteria for FDI in this report suggests that incentives are generally not as important for an investment decision in the four sectors as other quality and cost factors.
In the absence of a national or county level strategy that would set a direction for Croatia’s FDI objectives and policy, government interventions remain incomplete and ad hoc. The country as a whole, but also the region, lacks sector-targeting of investment promotion, as well as a focus on specific policy reforms that matter for FDI.
4.1.2. Limited Alignment of Investment Incentives with Slavonia
As noted above, Croatia’s main investment attraction tool is investment incentives. Croatia’s Investment Promotion Act (2015), allows for the provision of various investment incentives (this Act is essentially the law on incentives), with job creation at the heart of the policy.
Table 10: Croatian Investment Incentives Offered under Investment Promotion Act (2015), Instrument Type and Objectives
Incentive Type of Instrument
Objective Specifications Sectors / Activities
Profit tax rate deduction
Tax holiday Not specified Profit tax reduction of 50%-100% for 5-10 years for creating between 5-15 jobs
Manufacturing and processing; Development and innovation; Business support; or High value-added services.
Aid for eligible costs of new jobs
Direct subsidy Job creation 10-30% of eligible costs for job creation in counties depending on unemployment rate
Aid for eligible costs of training
Technical support incentive
Human capital training
Grant for training employees in the newly created jobs
Aid for capital costs Direct subsidy Job creation Aid for projects creating at least 50 new jobs
132
Aid for labor-
intensive projects
Direct subsidy Job creation Considered labor intensive when creating at least 100 new jobs in 3 years
Investment aid
for high-skilled job creation
Direct subsidy High-skilled job creation
10 new jobs requiring a university degree
Free lease of inactive property for up to 10 years
Subsidized property
Utilizing unused government property
Reactivating inactive government property (increasing its value by 50% and creating at least 15 new jobs)
Source: Author analysis of incentives based on the 2015 Investment Promotion Act and the Agency for Investment Competitiveness’ info sheet on incentive measures for investments.
However, data on revenue foregone due to incentives is not available at the sectoral or county levels, making it difficult to establish if they are actually an effective policy instrument. Moreover, investors in Croatia do not always find incentives useful or easy to access (see Box, below).
In addition to the unknown effectiveness of incentives, the majority of incentives142 used in Croatia are profit tax reductions, which do not necessarily target the right investors into Slavonia. In 2017, the total amount of investment incentives awarded to companies was approximately EUR 70 million. Of this amount, approximately EUR 6.45 million were in the form of job creation subsidies and EUR 63.27 million in the form of fiscal (company profit tax) incentives.143 Tax holidays are demonstrated in the literature to benefit more ‘footloose’ investors with a short time horizon or investors that would have been profitable without the incentives. There are fewer benefits to longer-term and potentially more innovative investors who may face several years without profit in the start-up phase or during other periods of operations. The latter groups could offer higher developmental benefits for Slavonia.
4.1.3. Insufficient Investor Protection
Investor protection appears to be a challenge across Croatia, including in Slavonia. Investors cite an unpredictable and unstable regulatory framework, a lack of transparency in administrative
142 Data provided by the Ministry of Economy and sourced from the Ministry of Finance. 143 A total of 349 investment projects have been approved since the implementation of the Investment Promotion Act (in 2015) with a value of approximately HRK 14.4 billion (roughly EUR 1.95 billion) and the planned opening of 12,395 new jobs. This data does not cover agricultural subsidies regulated by the EU Common Agricultural Policy.
Box: Comments on Incentives by Interviewed Firms
▪ ‘I think Croatia has the strongest law for incentives on investments, but we spent two years trying to
understand it.’
▪ ‘Incentives are complicated and unclear. There needs to be a system that says if you are qualified for
the incentives.’ The investor wrote an email to the local employment office to complain about the
incentives process but stated that ‘no one listened or cared.’
▪ ‘I would let incentives go for a better tax policy.’
▪ One investor stated that the legal framework changes frequently, particularly with regard to incentives
under the rural development funds, and indicated that there is no clear information about tendering
for EU subsidies.
Comments on Incentives by Interviewed Firms
▪ ‘I think Croatia has the strongest law for incentives on investments, but we spent two years trying to understand it.’
▪ ‘Incentives are complicated and unclear. There needs to be a system that says if you are qualified for the incentives.’ The investor
wrote an email to the local employment office to complain about the incentives process but stated that ‘no one listened or
cared.’
▪ ‘I would let incentives go for a better tax policy.’
▪ One investor stated that the legal framework changes frequently, particularly with regard to incentives under the rural
development funds, and indicated that there is no clear information about tendering for EU subsidies.

133
proceedings, insufficient capacity at the national and local levels, and corruption as issues affecting their investments.144 Legal uncertainty with regard to changes in tax policy was also commonly noted.
Yet the biggest challenge faced by investors is the lack of implementation of laws or ‘de facto’ challenges. Croatia is facing a fairly large number of investor state disputes. The 10 disputes registered over the last ten years is more than in regional neighbors such as Bosnia (3) or Serbia (6). In fact, in 2017, more disputes were registered against the Government of Croatia than in any other country.145 These cases incur heavy costs for the Government and typically also investment losses. Annex A provides a full list of these disputes.
4.2. Institutional Barriers
4.2.1. Shortcomings in the Current Institutional Landscape
There are a range of stakeholders within the existing landscape that play at least some investment promotion role, as shown in the figure below.146
Agency for Investments and Competitiveness (AIK)
AIK had until recently served as the national Investment Promotion Agency (IPA) for Croatia, and as such has responsibility for attracting FDI across the country. As of September 2018, AIK had 35 staff in
144 Many of the disputes are in the financial sector, specifically due to a law that prescribed a change in the currency of loans, which is the reason for all four of the disputes in the finance sector. Among the other disputes, one indicates that Croatia has failed to implement measures required by EU law (postal services); others cite delays and irregularities in granting licenses, and one cites legislative changes that deprived the claimant of its status as an eligible power producer. A recent decision found Croatia in breach of expropriation obligations. Source: Investor interviews and the Croatian Foreign Investors Council (FIC) 2017 White Book. Available online at http://www.ficc.hr/white-book/ and in the US Department of State, Bureau of Economic and Business Affairs, Croatia Investment Climate Statement for 2017. 145 Source: International Institute for Sustainable Development, Investment Treaty News: https://www.iisd.org/itn/2018/10/17/icsid-tribunal-finds-croatia-in-breach-of-expropriation-obligations-under-austria-croatia-bit-kirrin-hough/. 146 Other institutions such as tourism development agencies and private sector consultancies do not appear to play any significant current investment promotion role. However, there is potential for a broader range of stakeholders to provide support in the future. This is discussed further on in this section.
Comments on Investor Protection by Interviewed Firms in Slavonia:
▪ ‘FDI needs clarity to feel secure, but there are often changes in regulations and there is a problem of trust ...
Having a local AIK office would be useful.’
▪ ‘The judicial system is not working – it is too slow, unpredictable, and has localized corruption. There are
similar problems with public administration.’
▪ An investor indicated that the business environment is most affected by changes in laws and the lack of
coordination on laws. They stated that they would not have invested again given their experience. It was
stated that, ‘More stable legal conditions and the start of a cluster might encourage us to reinvest.’
▪ ‘Bureaucracy and legal systems have many problems. The national government is aware, yet the
bureaucracy, administrative and legal system problems – including lots of illogical rules for investors – still
present problems for foreign investors.’
▪ One investor noted they experienced ‘corrupt practices in trying to access local land.’
▪ One firm indicated they have faced significant challenges from local government, and high levels of
regulation. The firm noted that it is ‘only staying in operation due to an emotional attachment to the
region.’
▪ ‘No one is here in the region to help firms with questions related to inspections and administrative
problems, etc., which is needed. The national government is not aware at a high enough level that there are
problems facing producers on a daily basis.’
Comments on Investor Protection by Interviewed Firms in Slavonia:
▪ ‘FDI needs clarity to feel secure, but there are often changes in regulations and there is a problem of trust ... Having a
local AIK office would be useful.’
▪ ‘The judicial system is not working – it is too slow, unpredictable, and has localized corruption. There are similar problems
with public administration.’
▪ An investor indicated that the business environment is most affected by changes in laws and the lack of coordination on
laws. They stated that they would not have invested again given their experience. It was stated that, ‘More stable legal
conditions and the start of a cluster might encourage us to reinvest.’
▪ ‘Bureaucracy and legal systems have many problems. The national government is aware, yet the bureaucracy,
administrative and legal system problems – including lots of illogical rules for investors – still present problems for foreign
investors.’
▪ One investor noted they experienced ‘corrupt practices in trying to access local land.’
▪ One firm indicated they have faced significant challenges from local government, and high levels of regulation. The firm
noted that it is ‘only staying in operation due to an emotional attachment to the region.’
▪ ‘No one is here in the region to help firms with questions related to inspections and administrative problems, etc., which
is needed. The national government is not aware at a high enough level that there are problems facing producers on a
daily basis.’
▪

134
total, although only 15 of these are focused on investment promotion, and all were based in Croatia. Hence, the agency’s reach to the regions had been restricted by the amount of available resources. AIK’s local focus had been largely restricted to developing marketing materials.
However, even this may now be reduced following its absorption into the Ministry of Economy as of January 1st, 2019. Good practice would be to have a separate and dedicated national IPA, so while AIK may have had room for improvement in its current operations, we would not have recommended abolition. Indeed, Croatia is now one of the few countries in the world without a dedicated IPA institution. While a leading attractor of FDI such as the United Kingdom does subsume the investment promotion function within government, it does this within a ministry that is specifically dedicated to trade and investment – hence, the ministry is in itself an IPA.
Figure 66 Existing Institutions
Regional development agencies / County government authorities
The role of county governments in investment promotion is generally limited. Each county also has an RDA which has a mandate for a broader range of functions, which includes investment promotion.147 Their primary role is to attract EU funds for development projects. RDAs lack resources for investment activities in terms of staffing but also have a misperception that this activity needs to be led by offering incentives (rather than promoting the full investment offer as discussed in this chapter). The Vukovarsko-Srijemska RDA, in conjunction with its Chamber of Economy, has created sets of marketing materials. These include hard-copy content and a website intriguingly using the address www.investinslavonia.eu. While these activities are 4-5 years old, the materials developed do have merit, although they could be improved.148
Chamber of Economy149
While its primary objective is to support its members in doing business and exporting, it also plays an informal investment promotion role, which varies across counties. For example, the Vukovarsko-Srijemska Chamber cited that around 10 investment leads over the last 5 years had come to it from international offices via headquarters. While these leads did not result in investments, nevertheless this does show the potential.150 Consultations also suggested it is unlikely the Chamber would wish to
147 See for example, ftp://ftp.repec.org/opt/ReDIF/RePEc/osi/journl/PDF/InterdisciplinaryManagementResearchVI/IMR6a73.pdf . 148 While this RDA has 39 staff, consultations suggested that just 3-4 were involved in investment promotion activity, and all also have full-time roles dedicated to other activities. 149 The Croatian Chamber of Economy is a professional association of business people, with its headquarters in Zagreb. It also has offices in every Croatian county, and four overseas offices in Brussels, Moscow, Shanghai, and Belgrade. 150 It is unclear why these leads did not convert, but all appeared to make a site visit. Hence, it may be likely that the investment offer was seen as weaker than the other candidate locations these investors were considering.
135
play any further, more formalized promotion role than it already does. However, it would still be worthwhile exploring this further, particularly given the Chamber’s international network.
Municipal government authorities / City mayors
Their role appears not to be very different from that of the counties but simply more localized. This means there is a promotion role but again largely in terms of providing facilitation. Specifically, the municipality has jurisdiction over certain investment-related procedures: the construction permits process, establishing and operating business / economic zones, incubators, etc., and small-scale subsidy programs for firms. These roles are relevant to the attraction of FDI because economic zones offer land, premises and generally faster permitting procedures, but can also be bottlenecks to investment if tasks are not actioned quickly.
Agency coordination
Coordination between AIK and the counties / RDAs had been limited. One initiative that was conducted up to 2012, managed by the Ministry of Economy in cooperation with USAID,151 was the Advanced Investment Certification Programme for Regions in Croatia (AICPR). While this project was valuable for capacity building, RDAs did not have the budget for a full-time staff and the momentum from the program was not sustained. In the last 3-4 years, AIK had developed new marketing materials for some counties, but support has not extended beyond this.
At the regional level, there are no real examples of counties / RDAs in Slavonia working together. One consultation suggested this is difficult to achieve, simply because the counties do not view themselves as part of a wider region. Hence, the starting point is to compete. The main localized example of collaboration comes again from Vukovarsko-Srijemska, where the RDA, county, and local chamber work closely together.
However, the challenge is not simply one of collaboration between different places, but a consequence of the fact that FDI is currently not seen as a key tool in economic development within Slavonia. Up to this point, there appears to have been little drive towards an overall FDI strategy for the region or counties within the region. Such a strategy must include the sector priorities discussed in this chapter, together with a clear approach to marketing the offer, addressing the wider range of issues in the business environment and the rules of coordination between institutions, among other steps. Hence, the challenge is not just one of resources, since simply adding extra resources for RDAs, for example, would not on its own be an effective solution, as a fundamentally more structured approach to winning FDI, and the economic benefits that come with it, needs to be prioritized.
4.3. Regulatory Barriers to FDI in each Sector
In addition to horizontal challenges, a number of sector-specific issues are identified in the sector scan results found in Annex A. The following three stand out in the researched sectors:
Wood quotas: The key issue relates to the implementation of quotas for raw materials applied by the National Forest Company (Hrvatske Šume). The current scope for additional FDI is limited because of unpredictable and limited access to raw materials, a critical precondition for businesses, in particular in higher-value activities such as furniture making and bespoke architectural solutions. Given that
151 One of the outputs was an investment brochure / material about the county and joint presentations and outreach campaigns with AIK. RDAs were supposed to serve as one-stop shops for investors, and developed agreements with local stakeholders (including municipalities, electricity providers, etc.) These serious efforts did not covert into a strong pipeline of investment leads.
136
access to natural resources, in this case wood, is restricted and the market appears to be de facto closed to new players, reform in this area that would ensure greater predictability around access to wood is a priority.
Agricultural subsidies and access to land: Agricultural subsidies offered under the Common Agricultural Policy which are contingent on the size of the land and without consideration of the actual produce constrain diversification of the sector into new economic activities and upgrading along value chains. The effects of agricultural subsidies potentially negatively affect access to land for FDI, and probably also prices and the quality of production inputs, which may deter FDI in processing facilities. In addition, the recent collapse of Agrokor has also created instability and agribusinesses have struggled even more to secure investments. Developments around Agrokor should be continuously monitored given its continuous importance to the sector, including land ownership and investment in Slavonia.
Labor / skill shortages in ICT and all other sectors: The availability of a skilled workforce remains the most important locational factor for an FDI decision. Against this, the primary challenge for Slavonia is its labor force and the significant level of emigration from the region in search of higher-paid jobs. This means the workforce is less attractive for potential FDI firms that consider the region. In the short-term, a solution could be a combination of: (i) strengthening Slavonia’s human resources and skills; (ii) attracting a foreign high-skilled workforce to Slavonia through a simplified and more open system of visas and work permits ;152 and (iii) strengthened partnerships between the private sector and Osijek University.
In addition to these key barriers, a further examination of policy and regulatory challenges by sector is presented in Annex A.
152 ICT in particular is an area where Croatia lacks sufficient work permits. For instance, of a total work permit quota allowance of 29,769 across all industries, only 300 are allowed for the entire ICT sector. In addition, most are allocated for specific professions that do not include management-related skills which might be particularly relevant and needed for foreign investors considering the sector.
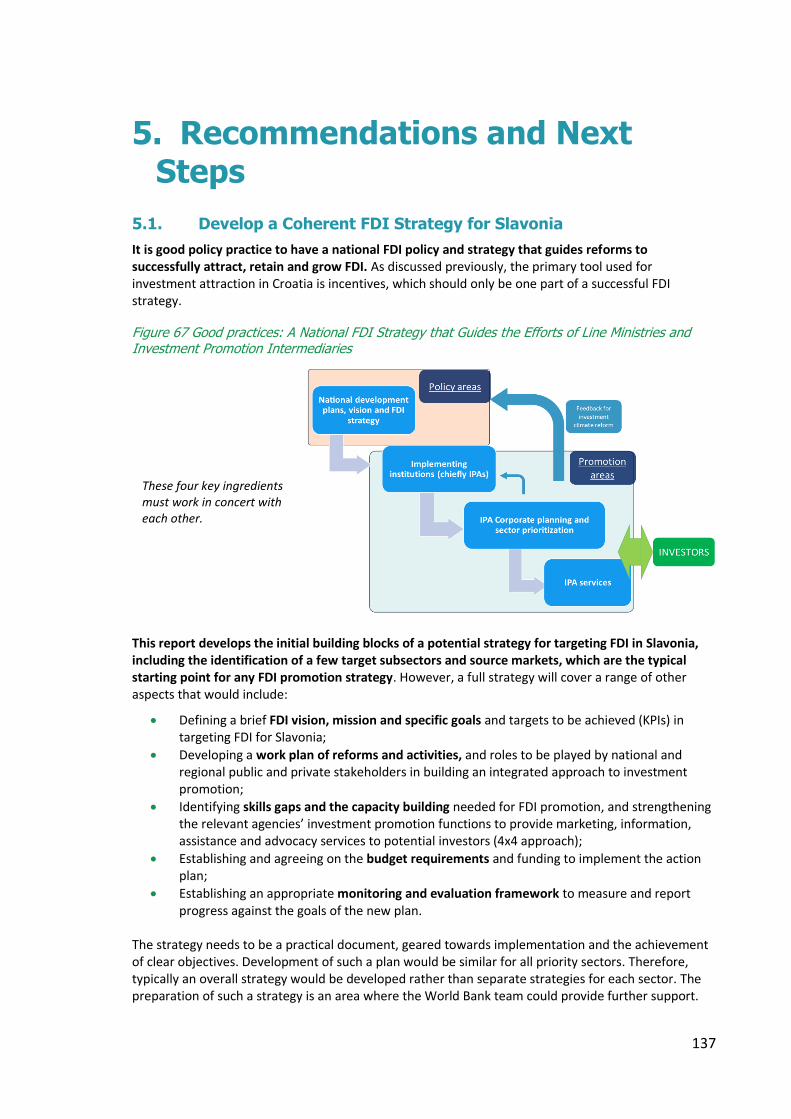
137
5. Recommendations and Next Steps
5.1. Develop a Coherent FDI Strategy for Slavonia
It is good policy practice to have a national FDI policy and strategy that guides reforms to successfully attract, retain and grow FDI. As discussed previously, the primary tool used for investment attraction in Croatia is incentives, which should only be one part of a successful FDI strategy.
Figure 67 Good practices: A National FDI Strategy that Guides the Efforts of Line Ministries and Investment Promotion Intermediaries
This report develops the initial building blocks of a potential strategy for targeting FDI in Slavonia, including the identification of a few target subsectors and source markets, which are the typical starting point for any FDI promotion strategy. However, a full strategy will cover a range of other aspects that would include:
• Defining a brief FDI vision, mission and specific goals and targets to be achieved (KPIs) in targeting FDI for Slavonia;
• Developing a work plan of reforms and activities, and roles to be played by national and regional public and private stakeholders in building an integrated approach to investment promotion;
• Identifying skills gaps and the capacity building needed for FDI promotion, and strengthening the relevant agencies’ investment promotion functions to provide marketing, information, assistance and advocacy services to potential investors (4x4 approach);
• Establishing and agreeing on the budget requirements and funding to implement the action plan;
• Establishing an appropriate monitoring and evaluation framework to measure and report progress against the goals of the new plan.
The strategy needs to be a practical document, geared towards implementation and the achievement of clear objectives. Development of such a plan would be similar for all priority sectors. Therefore, typically an overall strategy would be developed rather than separate strategies for each sector. The preparation of such a strategy is an area where the World Bank team could provide further support.
These four key ingredients must work in concert with each other.
138
5.2. Prioritize Subsectors for FDI Promotion
The results of the FDI sectpr scan in this report are intended to provide guidance to Slavonia for prioritizing subsectors for FDI targeting and developing the corresponding value propositions. It is good practice for an IPA to target a small number of sectors (often 3-5 in total) and the subsectors153 within them. This report highlights opportunities in the following sectors and subsectors, which are recommended for initiating the selection process following further analysis and discussion by the Government:
ICT subsectors:
• Custom computer programming services
• Data processing, hosting and related services
Agribusiness subsectors:
• Fruit and vegetable preserving, especially food manufacturing
Tourism subsectors:
• Boutique hotels
Additionally, the Government should further determine the potential of opportunities in the metal processing sector.
5.3. Address Key Policy and Regulatory Barriers
5.3.1. Evaluate and Better Align Investment Incentives with Slavonia
In line with the analysis showing the limited evidence of the cost-effectiveness of the current incentives policy, the Government should conduct an in-depth review of the current investment incentives. The idea is not to offer more incentives on top of the current regime but rather to make them more effective. Such a review could result in less government revenue foregone, with funds being channeled to FDI support instruments. For example, research suggests that effective investment promotion agencies can operate under a budget starting at USD 5 million,154 much less than what the government currently expends on investment incentives.
The three key recommendations for the review are as follows:
• Conduct a cost-effectiveness assessment to better align Croatia’s incentives regime with Slavonia’s policy objectives of creating certain types of jobs and upgrading production, among others: Croatia’s Investment Promotion Act (2015) prioritizes a range of policy objectives for incentives: projects that provide jobs for the unemployed; that are labor intensive; that provide education and training; or reactivate currently inactive government-owned property (see Table 10 earlier in this
153 In fact, Estonia targets just one sector, ICT, albeit with various subsectors underneath: https://investinestonia.com/business-opportunities/ 154 In a recent WBG study of investment promotion agencies (IPAs), it was revealed that the majority of highest performing IPAs had annual budgets of at least USD 5 million, while the majority of the poorest performers had budgets of USD 200,000 or less (with no high-performing agencies included in the group with budgets of USD 200,000 USD).
139
chapter).155 Some of these incentives are likely to be useful for companies in Slavonia, but there is also space for a better alignment with the region’s emerging priorities, in particular its specific labor market challenges. The creation of jobs for the unemployed and those pondering migrating from the region, in particular in medium and high-skilled job categories appears a priority, according to the findings of the WBG Jobs and Social Inclusion team. However, none of the incentives offered under the Act specifically refer to addressing particular skills gaps or enhancing regional development156 as a policy objective (see again Table 10). Morocco serves as a good practice example of demonstrating cost-effectiveness and alignment of incentives. The Government publishes a detailed account of tax expenditure as part of its annual budget. Expenditure is presented by tax instrument, by type of beneficiary, and by industrial sector. The detailed report also contains information on the types of incentives granted, their legal basis, the intended objectives, and the eligible beneficiaries.157
• Target incentives based on investment or other performance measures rather than profits: Incentives should better target specific company behaviors that the Government wishes to promote. For example, certain ICT companies suggested that incentives had marginal impact on investment decisions, and that the Government should instead support R&D and risk-taking by local companies to promote the software development industry in Slavonia.
• Increase transparency and accessibility of incentives by developing, maintaining and publishing a detailed and user-friendly inventory: Finally, there is also space for improving incentives administration. Incentives are being offered at the national level and to a certain degree by municipalities. Consultations with investors revealed the difficulty in understanding and applying for the different incentives available, and the cost incurred due to frequent changes in incentive and tax policies. Meetings with the Government also confirmed that there is no centrally located source of information on these different incentives. Creation of a database of incentives which would centralize information on the key incentives offered is another area for reform in order to provide clarity to investors. For example, multiple ECA countries have undertaken steps to increase transparency of incentives, including Armenia, Tajikistan, Kazakhstan and Kyrgyzstan. Beyond ECA, a good example is Jordan, where the Government developed a centralized online portal detailing the country’s incentives scheme with support from the World Bank Group, including searchable criteria and links to relevant laws and administrative documents.
5.3.2. Enhance Investor Protection
Slavonia’s agencies interacting with investors should aim to properly implement ‘de facto’ investor protection guarantees to address what is perceived to be an unpredictable and unstable regulatory framework. This will not only ensure reinvestments, but also compliance with investor protection legislation. Protection against expropriation and breach of contract, the ability to convert and transfer currency overseas, lack of transparency, arbitrary government action, and discrimination are embedded in different legislation at the national level, including the principal laws governing investments in the country, such as the Companies Act, the Constitution, Ownership Act, Expropriation
155 Eligibility for receiving incentives must fall within the following activity areas: manufacturing and processing; development and innovation; business support; high value-added services. The legislation also provides for additional incentives for projects that are in select activity areas. These include incentives for ICT system and software development, tourism activities and high value-added manufacturing, all of which could be relevant for FDI in Slavonia and the sectors examined as part of this report. The main aid instruments according to the Croatian Investment Promotion Act are summarized below. 156 Moreover, under the EU State Aid Rules, companies in Slavonia are subject to the same terms as companies in Zagreb, and worse terms than companies on the Adriatic, and this despite the relatively worse economic performance of Slavonia’s economy. The current allocation of Slavonia under NUTS2 Continental Croatia region together with Zagreb seems misplaced. 157 See http://www.finances.gov.ma/Docs/2014/DB/dep_fisc_fr.pdf.
140
Act, and Act on Strategic Investment Projects, among others. Croatia has also signed 61 international investment agreements (IIAs), which form an integral part of Croatia’s legal framework for investment (an analysis of several IIAs is provided in Investor Protection Guarantees in Croatia’s Bilateral Investment Treaties (see Annex A, Table 46).
The policy issue regarding the lack of ‘de facto’ implementation of laws requires a discussion at the national level, at a minimum, and Slavonia’s agencies should include investor aftercare services as part of their institutional framework for investor services. This will allow agencies in Slavonia to better understand the concerns of local investors, and to increase their capacity to raise these concerns as part of policy advocacy in Zagreb or with relevant regional agencies. A system for tracking investor concerns and issues would also allow for better investor retention and provide clear areas for continually improving the local government’s services. This solution could be further developed as part of devising a proper institutional framework for FDI in Slavonia.
5.3.3. Reduce Regulatory Barriers to FDI in Sectors
The sector-specific issues affecting Slavonia’s ability to competitively attract FDI should be addressed with priority:
• Wood quotas: Enacting reforms in this area that would ensure greater predictability around access to wood.
• Agricultural subsidies and access to land: The effects of agricultural subsidies on productivity, prices and access to land for FDI should be further examined.
• Labor / skill shortages in ICT and all other sectors: Over the short-term, a combination of attracting foreign talent to Slavonia through a simplified and more open system of visas and work permits, coupled with strengthened partnerships between the private sector and Osijek University could be a solution.
In addition, Annex A lists other sector-specific barriers to FDI. These should be reviewed and discussed as part of the FDI Stratgey development process.
5.4. Introduce Regional Investment Promotion: Mobilizing for Success
Slavonia can boost its investment promotion efforts through utilizing an improved institutional framework for regional investment promotion. This section provides examples and outlines options for such a solution. These models should be further discussed by the relevant stakeholders from national, regional and municipal governments. Their advantages and disadvantages need to be carefully assessed based on prior experiences and evolving FDI in the region.
5.4.1. Country Examples of Coordinating Investment Promotion
Several countries have been grappling with the question of an effective investment promotion framework at the national and regional level. This section discusses the cases of subnational investment promotion in the UK and Poland. The first shows a deliberate UK government shift towards a localized structure of investment promotion activity, working under a national agency. The second example from Poland is similar to the existing Croatian system where RDAs work with a national body (the Ministry of Economy). It shows significant collaboration within a region between a range of stakeholders, including a regional development agency, plus a number of cities and economic zones. The equivalent in Slavonia would see counties collaborate within an overall Slavonia brand.
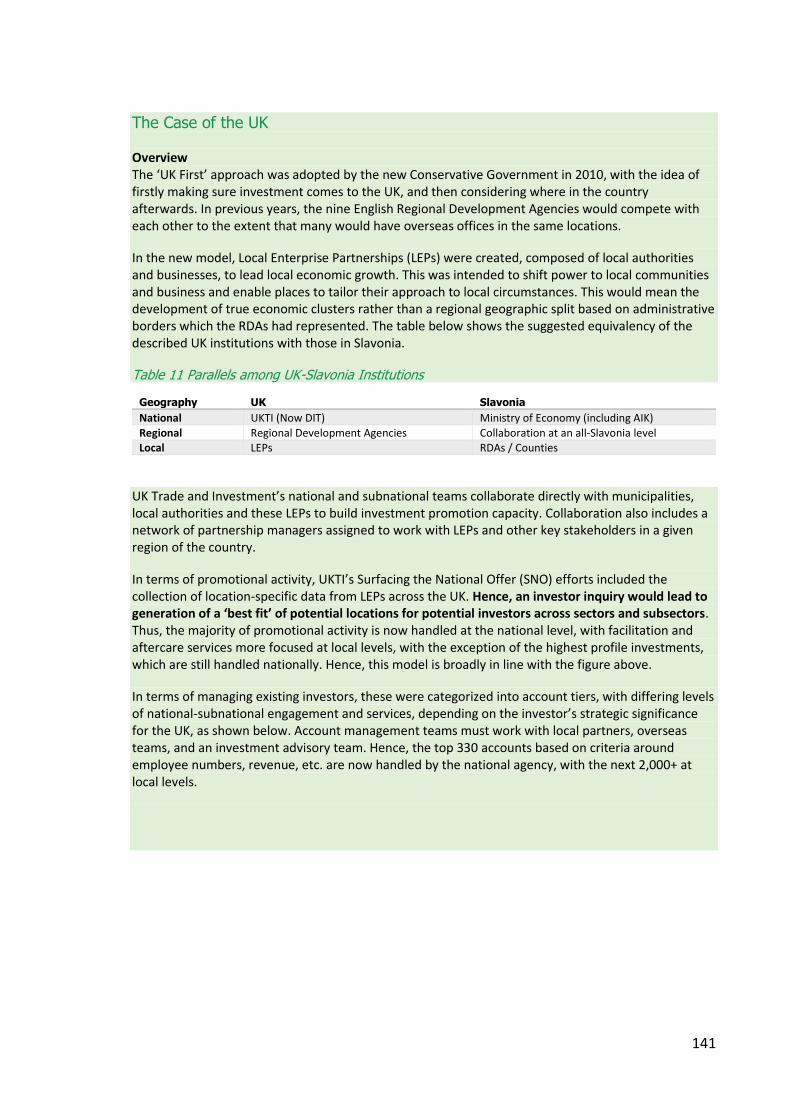
141
The Case of the UK Overview The ‘UK First’ approach was adopted by the new Conservative Government in 2010, with the idea of firstly making sure investment comes to the UK, and then considering where in the country afterwards. In previous years, the nine English Regional Development Agencies would compete with each other to the extent that many would have overseas offices in the same locations.
In the new model, Local Enterprise Partnerships (LEPs) were created, composed of local authorities and businesses, to lead local economic growth. This was intended to shift power to local communities and business and enable places to tailor their approach to local circumstances. This would mean the development of true economic clusters rather than a regional geographic split based on administrative borders which the RDAs had represented. The table below shows the suggested equivalency of the described UK institutions with those in Slavonia.
Table 11 Parallels among UK-Slavonia Institutions
Geography UK Slavonia
National UKTI (Now DIT) Ministry of Economy (including AIK)
Regional Regional Development Agencies Collaboration at an all-Slavonia level Local LEPs RDAs / Counties
UK Trade and Investment’s national and subnational teams collaborate directly with municipalities, local authorities and these LEPs to build investment promotion capacity. Collaboration also includes a network of partnership managers assigned to work with LEPs and other key stakeholders in a given region of the country.
In terms of promotional activity, UKTI’s Surfacing the National Offer (SNO) efforts included the collection of location-specific data from LEPs across the UK. Hence, an investor inquiry would lead to generation of a ‘best fit’ of potential locations for potential investors across sectors and subsectors. Thus, the majority of promotional activity is now handled at the national level, with facilitation and aftercare services more focused at local levels, with the exception of the highest profile investments, which are still handled nationally. Hence, this model is broadly in line with the figure above.
In terms of managing existing investors, these were categorized into account tiers, with differing levels of national-subnational engagement and services, depending on the investor’s strategic significance for the UK, as shown below. Account management teams must work with local partners, overseas teams, and an investment advisory team. Hence, the top 330 accounts based on criteria around employee numbers, revenue, etc. are now handled by the national agency, with the next 2,000+ at local levels.
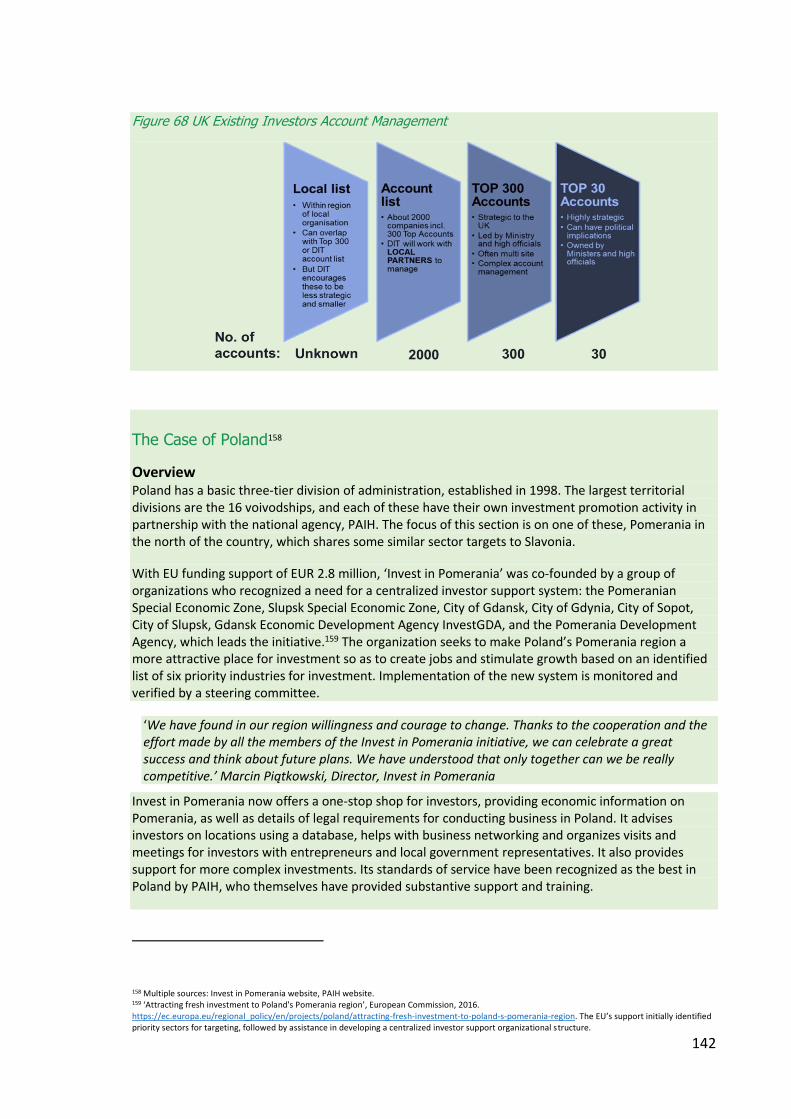
142
Figure 68 UK Existing Investors Account Management
The Case of Poland158
Overview Poland has a basic three-tier division of administration, established in 1998. The largest territorial divisions are the 16 voivodships, and each of these have their own investment promotion activity in partnership with the national agency, PAIH. The focus of this section is on one of these, Pomerania in the north of the country, which shares some similar sector targets to Slavonia.
With EU funding support of EUR 2.8 million, ‘Invest in Pomerania’ was co-founded by a group of organizations who recognized a need for a centralized investor support system: the Pomeranian Special Economic Zone, Slupsk Special Economic Zone, City of Gdansk, City of Gdynia, City of Sopot, City of Slupsk, Gdansk Economic Development Agency InvestGDA, and the Pomerania Development Agency, which leads the initiative.159 The organization seeks to make Poland’s Pomerania region a more attractive place for investment so as to create jobs and stimulate growth based on an identified list of six priority industries for investment. Implementation of the new system is monitored and verified by a steering committee.
‘We have found in our region willingness and courage to change. Thanks to the cooperation and the effort made by all the members of the Invest in Pomerania initiative, we can celebrate a great success and think about future plans. We have understood that only together can we be really competitive.’ Marcin Piątkowski, Director, Invest in Pomerania
Invest in Pomerania now offers a one-stop shop for investors, providing economic information on Pomerania, as well as details of legal requirements for conducting business in Poland. It advises investors on locations using a database, helps with business networking and organizes visits and meetings for investors with entrepreneurs and local government representatives. It also provides support for more complex investments. Its standards of service have been recognized as the best in Poland by PAIH, who themselves have provided substantive support and training.
158 Multiple sources: Invest in Pomerania website, PAIH website. 159 ‘Attracting fresh investment to Poland's Pomerania region’, European Commission, 2016. https://ec.europa.eu/regional_policy/en/projects/poland/attracting-fresh-investment-to-poland-s-pomerania-region. The EU’s support initially identified priority sectors for targeting, followed by assistance in developing a centralized investor support organizational structure.

143
Impact
Prior to this initiative, there were low levels of investment in Pomerania, and it is suggested this was because of a lack of priorities and long-term plans for investment promotion, and the absence of a single source of economic information, as there was no coordination between the 40 entities providing services to investors and little support for existing investors.
Investors are taken care of by qualified project managers. The number of inquiries about investment in Pomerania rose from 35 in 2008, to 121 in 2015. This helped in the successful completion of 57 projects, with job creation estimated at 8,930 jobs. Invest in Pomerania has also organized training for local government representatives working in investment support. The organization also fosters collaboration between universities, chambers of commerce, associations, business incubators, technology parks, technology transfer centers, consulting centers, financial institutions and development agencies.

144
5.5. Example Options for Slavonia
In order to be successful in attracting FDI, Slavonia needs concerted efforts in promotion. A concrete institutional solution cannot be offered at this stage and requires consultations with the relevant government agencies. The remainder of this section, however, outlines three potential options of how this could be structured, all of which assume that the necessary funding is in place.
5.5.1. Option 1: County / RDA-Led Promotion Model
In option 1, each county would undertake its own, separate promotional activity. It is likely this would take place through the RDA, but the county administration itself could also lead. Counties would therefore compete with each other. Hence, this is essentially a formalization of current circumstances, with RDAs strengthened, but there are no fundamental changes to the existing approach. Municipalities would provide a supporting facilitation role where necessary, but it would be understood that the county takes the primary lead. This can be seen as a version of the UK model. For such a model to be effective, RDAs would need to:
• Develop dedicated investment promotion staff resources.
• Have dedicated funds for investment promotion, with each RDA having its own FDI strategy.
• Have a coordinated framework of activities between themselves and the Ministry of Economy, which includes aligning a well-developed FDI strategy with that at the national level. Coordination would also be important in order to avoid duplication between each of the RDAs.
• Develop a robust program of capacity building for staff (see below).
• Explore how to formalize the supporting role of the Chambers of Economy within each county, at Zagreb headquarters, and in international offices.
The key issue with this option is that investors will not be presented with a clear, consolidated offer, as the five counties will still be acting independently of each other. While the approach has similarities to the UK approach, there are key differences to consider. First, the greater resources of the national UK agency compared to that in Croatia; second the local investment offers in the UK are stronger than in Croatia.
Figure 69 County / RDA-Led Promotion Model

145
5.5.2. Option 2: Dedicated Regional Promotion Model
Within this scenario, the counties (and municipalities) outsource investment promotion to an overall regional investment promotion agency. While the counties may have a strategic steering role for the new IPA, almost all activity would be delivered by the IPA, and there would be a limited operational role for the counties themselves beyond local facilitation (e.g. licensing, permits, etc.) This can be seen as a version of the Pomerania (Poland) model.
Clearly, this would be a major change to the existing approach in Slavonia, particularly for a country with a relatively small population. At the same time, numerous regions across Europe maintain their own dedicated IPAs. In addition, a key advantage that the model offers is the pooling of scarce resources around one consolidated regional offer.
An alternative way to consider this model is for the national agency (which is now the Ministry of Economy) to have an office in one or all five of the Slavonia counties themselves. This would ensure national-subnational coordination, and that Slavonia is effectively plugged into the promotional activities taking place at the national level.
Within this scenario, the investment promotion mandate of the RDAs is clearly reduced, so it would need to be explored further how this would be formally defined, together with that of the municipalities.160
Figure 70 Dedicated Regional Promotion Model
160 It is assumed the municipalities would effectively retain their current role, i.e. supporting specific areas of facilitation.

146
5.5.3. Option 3: Hybrid Promotion Model
Within this option, a Slavonia regional organization purely acts as a promotional portal to present a regional offer to incoming potential investors. Hence, all inquiries would be handled by the counties, together with subsequent facilitation and aftercare. Essentially, the portal would be a skeleton organization of 4-5 people with two roles:
• Focusing on marketing activities through a dedicated Slavonia investment promotion website.
• Providing a service to filter inquiries through to all five counties (i.e. they would not be selective about which counties received an inquiry).
The model essentially takes elements from both the UK and Polish examples, including elements of both localism and regionalism. It could be that the portal is managed by the national agency (i.e. with an approach similar to option 2). However, in the spirit of encouraging collaboration between counties, it should also be considered whether the counties themselves could be the driving force, and simply partner with the national agency. A recent article suggests that this type of collaboration has now become more achievable than our consultations had indicated.161
Figure 71 Hybrid Promotion Model
161 https://www.total-croatia-news.com/business/32856-five-slavonian-counties.
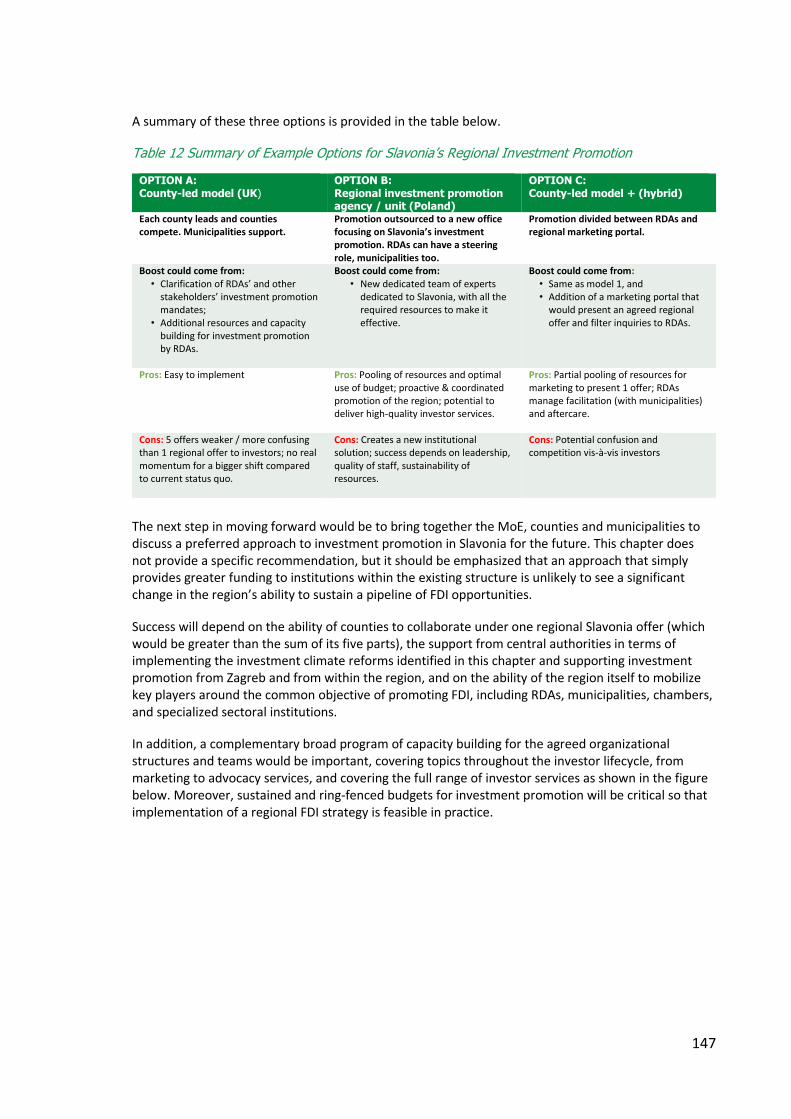
147
A summary of these three options is provided in the table below.
Table 12 Summary of Example Options for Slavonia’s Regional Investment Promotion
OPTION A: County-led model (UK)
OPTION B: Regional investment promotion agency / unit (Poland)
OPTION C: County-led model + (hybrid)
Each county leads and counties compete. Municipalities support.
Promotion outsourced to a new office focusing on Slavonia’s investment promotion. RDAs can have a steering role, municipalities too.
Promotion divided between RDAs and regional marketing portal.
Boost could come from: • Clarification of RDAs’ and other
stakeholders’ investment promotion mandates;
• Additional resources and capacity building for investment promotion by RDAs.
Boost could come from: • New dedicated team of experts
dedicated to Slavonia, with all the required resources to make it effective.
Boost could come from: • Same as model 1, and • Addition of a marketing portal that
would present an agreed regional offer and filter inquiries to RDAs.
Pros: Easy to implement Pros: Pooling of resources and optimal use of budget; proactive & coordinated promotion of the region; potential to deliver high-quality investor services.
Pros: Partial pooling of resources for marketing to present 1 offer; RDAs manage facilitation (with municipalities) and aftercare.
Cons: 5 offers weaker / more confusing than 1 regional offer to investors; no real momentum for a bigger shift compared to current status quo.
Cons: Creates a new institutional solution; success depends on leadership, quality of staff, sustainability of resources.
Cons: Potential confusion and competition vis-à-vis investors
The next step in moving forward would be to bring together the MoE, counties and municipalities to discuss a preferred approach to investment promotion in Slavonia for the future. This chapter does not provide a specific recommendation, but it should be emphasized that an approach that simply provides greater funding to institutions within the existing structure is unlikely to see a significant change in the region’s ability to sustain a pipeline of FDI opportunities.
Success will depend on the ability of counties to collaborate under one regional Slavonia offer (which would be greater than the sum of its five parts), the support from central authorities in terms of implementing the investment climate reforms identified in this chapter and supporting investment promotion from Zagreb and from within the region, and on the ability of the region itself to mobilize key players around the common objective of promoting FDI, including RDAs, municipalities, chambers, and specialized sectoral institutions.
In addition, a complementary broad program of capacity building for the agreed organizational structures and teams would be important, covering topics throughout the investor lifecycle, from marketing to advocacy services, and covering the full range of investor services as shown in the figure below. Moreover, sustained and ring-fenced budgets for investment promotion will be critical so that implementation of a regional FDI strategy is feasible in practice.

148
Figure 72 Good Practices: The 4x4 Matrix of Investor Services
Source: Macroeconomics, Trade and Investment Global Practice, World Bank Group.

149
Chapter 4 Business Environment

150
Chapter 4: Summary The objective of this chapter is to assess regulatory constraints on businesses operating in Eastern Croatia. The analysis covers the role of national government and local authorities to foster a more predictable and less cumbersome regulatory business environment. The principal findings are:
• The business environment agenda is centralized to a large extent and the competencies of the regional and local authorities are very limited. Key policies and regulations affecting the business environment are designed, issued and enforced at the national level. Regulatory services such as licenses, authorizations, and business inspections, are predominantly provided by national administration bodies.
• As a result, businesses in Eastern Croatia are facing similar regulatory constraints as other parts of Croatia. However, suboptimal regulation and enforcement may pose even greater constraints for businesses in Eastern Croatia, as they also face deteriorating demographics, brain drain and lack of business dynamism.
• Businesses have difficulty accessing information regarding the requirements for engaging in a specific activity, as well as what rules they need to comply with. Transparency and regulatory predictability are cornerstones of a well-functioning business regulatory environment and there could be a role for the local authorities in improving predictability for businesses. They could, for example, provide comprehensive online information on regulatory requirements, and facilitate public consultation on upcoming regulations.
• The lack of coordination and a shared vision among the numerous institutions overseeing business environment reforms poses significant implementation challenges. There are multiple ministries regulating the business cycle process, which requires good coordination and alignment in objectives and approach. This has proven to be a challenge, given the different policy perspectives that the ministries cover. The lack of proper outreach has sometimes yielded conflicting norms and regulations, and has resulted in resistance to reform at various levels of government.
• Interviews with businesses in the five counties of the Eastern Croatia region revealed constraints in construction permitting, inspections, employing non-EU workers, and parafiscal charges. The issue of access to land and construction planning is perhaps the only one where the local authorities have regulatory authority and which they can improve.
Specific recommendations include: 1. Streamlining the application process for construction permits; 2. Improving the information available to businesses on legal requirements for starting and
operating a business, and proactively inform businesses of new regulatory requirements. 3. Transforming the inspections regime towards compliance rather than punishment, and
implement harmonized tools and information across inspectorates. 4. Reforming the system of parafiscal charges to increase transparency and predictability,
review parafiscal charges and phase some out, and introduce the option of a single annual payment that can be made online.
5. Addressing sector-specific constraints, especially: the wood quota system; regulatory obstacles to the ICT industry; and implementation of the Common Agricultural Policy and quality infrastructure to incentivize higher value production.
Many of the business environment constraints elaborated in the chapter are well known in Croatia and have been on the government reform radar for some time. There have been many attempts in the past decade to undertake reforms to improve the business environment, most recently in the context of the National Reform Program. However, implementation has been slow, with various agendas undermining progress on reforms.

151
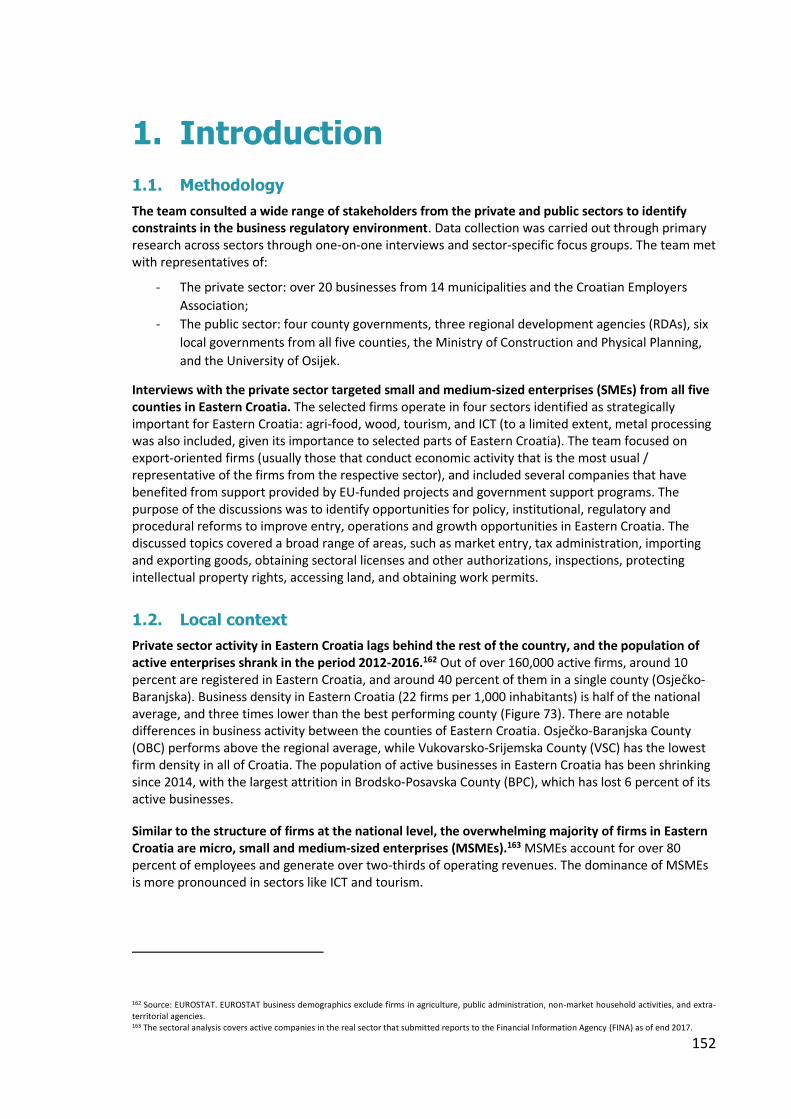
152
1. Introduction
1.1. Methodology
The team consulted a wide range of stakeholders from the private and public sectors to identify constraints in the business regulatory environment. Data collection was carried out through primary research across sectors through one-on-one interviews and sector-specific focus groups. The team met with representatives of:
- The private sector: over 20 businesses from 14 municipalities and the Croatian Employers
Association;
- The public sector: four county governments, three regional development agencies (RDAs), six
local governments from all five counties, the Ministry of Construction and Physical Planning,
and the University of Osijek.
Interviews with the private sector targeted small and medium-sized enterprises (SMEs) from all five counties in Eastern Croatia. The selected firms operate in four sectors identified as strategically important for Eastern Croatia: agri-food, wood, tourism, and ICT (to a limited extent, metal processing was also included, given its importance to selected parts of Eastern Croatia). The team focused on export-oriented firms (usually those that conduct economic activity that is the most usual / representative of the firms from the respective sector), and included several companies that have benefited from support provided by EU-funded projects and government support programs. The purpose of the discussions was to identify opportunities for policy, institutional, regulatory and procedural reforms to improve entry, operations and growth opportunities in Eastern Croatia. The discussed topics covered a broad range of areas, such as market entry, tax administration, importing and exporting goods, obtaining sectoral licenses and other authorizations, inspections, protecting intellectual property rights, accessing land, and obtaining work permits.
1.2. Local context
Private sector activity in Eastern Croatia lags behind the rest of the country, and the population of active enterprises shrank in the period 2012-2016.162 Out of over 160,000 active firms, around 10 percent are registered in Eastern Croatia, and around 40 percent of them in a single county (Osječko-Baranjska). Business density in Eastern Croatia (22 firms per 1,000 inhabitants) is half of the national average, and three times lower than the best performing county (Figure 73). There are notable differences in business activity between the counties of Eastern Croatia. Osječko-Baranjska County (OBC) performs above the regional average, while Vukovarsko-Srijemska County (VSC) has the lowest firm density in all of Croatia. The population of active businesses in Eastern Croatia has been shrinking since 2014, with the largest attrition in Brodsko-Posavska County (BPC), which has lost 6 percent of its active businesses.
Similar to the structure of firms at the national level, the overwhelming majority of firms in Eastern Croatia are micro, small and medium-sized enterprises (MSMEs).163 MSMEs account for over 80 percent of employees and generate over two-thirds of operating revenues. The dominance of MSMEs is more pronounced in sectors like ICT and tourism.
162 Source: EUROSTAT. EUROSTAT business demographics exclude firms in agriculture, public administration, non-market household activities, and extra-territorial agencies. 163 The sectoral analysis covers active companies in the real sector that submitted reports to the Financial Information Agency (FINA) as of end 2017.

153
Figure 73: Business density in Croatia by county (2017)
Figure 74: Size of target sectors by number of firms, employees and operating revenues
Source: EUROSTAT, Croatian Statistics Bureau, and staff calculations Source: EUROSTAT, Croatian Statistics Bureau, and staff calculations
The largest sector164 in terms of operating revenue is food, but metal processing, wood, and ICT have the highest export potential. Food, wood, and metal processing firms in Eastern Croatia contribute around a quarter of operating revenue at the national level in their respective sectors. While the ICT sector is still relatively small, it has a much higher share of revenues from abroad than food and tourism. Over 70 percent of sales revenues for metal processing companies are from exports, an indication of the sector’s competitive edge. About half of sales revenues in the wood sector come from exports, which is primarily attributable to the high-quality raw material rather than the sector’s high value-addition activities.
Figure 75: Share of firms from Eastern Croatia in total operating revenues by sector
Figure 76: Share of exports in target industries
Source: FINA and staff calculations Source: FINA and staff calculations
164 For analytical purposes, companies were classified into sectors based on their NACE code. Annex I contains a detailed breakdown of the NACE codes included in each sector.
Food
Wood
ICTTourism
Metal Processing
0
5000
10000
15000
20000
0 500 1000 1500
Avg
Nu
mb
er o
f Em
plo
yees
Number of FirmsBubble size indicates operating revenues
0%
25%
50%
75%
100%
Rest of Croatia Eastern Croatia
0%
25%
50%
75%
100%
Food ICT Tourism Wood Metalprocessing
Other
Foreign Domestic
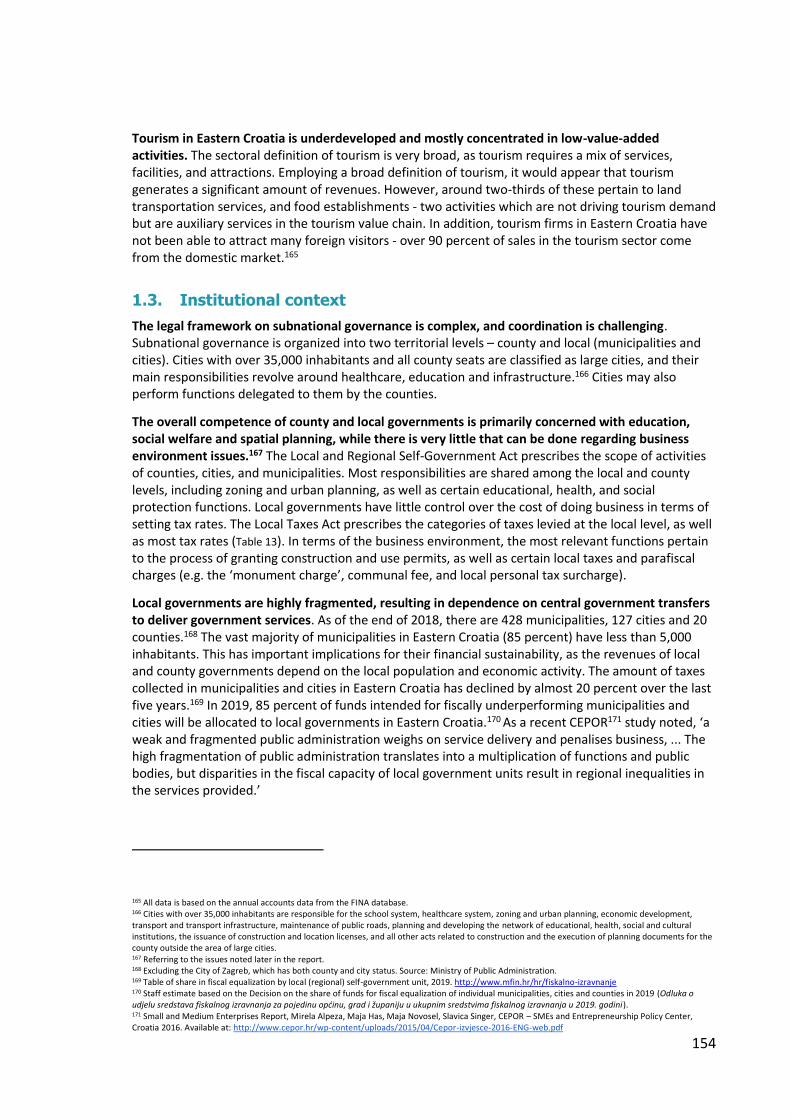
154
Tourism in Eastern Croatia is underdeveloped and mostly concentrated in low-value-added activities. The sectoral definition of tourism is very broad, as tourism requires a mix of services, facilities, and attractions. Employing a broad definition of tourism, it would appear that tourism generates a significant amount of revenues. However, around two-thirds of these pertain to land transportation services, and food establishments - two activities which are not driving tourism demand but are auxiliary services in the tourism value chain. In addition, tourism firms in Eastern Croatia have not been able to attract many foreign visitors - over 90 percent of sales in the tourism sector come from the domestic market.165
1.3. Institutional context
The legal framework on subnational governance is complex, and coordination is challenging. Subnational governance is organized into two territorial levels – county and local (municipalities and cities). Cities with over 35,000 inhabitants and all county seats are classified as large cities, and their main responsibilities revolve around healthcare, education and infrastructure.166 Cities may also perform functions delegated to them by the counties.
The overall competence of county and local governments is primarily concerned with education, social welfare and spatial planning, while there is very little that can be done regarding business environment issues.167 The Local and Regional Self-Government Act prescribes the scope of activities of counties, cities, and municipalities. Most responsibilities are shared among the local and county levels, including zoning and urban planning, as well as certain educational, health, and social protection functions. Local governments have little control over the cost of doing business in terms of setting tax rates. The Local Taxes Act prescribes the categories of taxes levied at the local level, as well as most tax rates (Table 13). In terms of the business environment, the most relevant functions pertain to the process of granting construction and use permits, as well as certain local taxes and parafiscal charges (e.g. the ‘monument charge’, communal fee, and local personal tax surcharge).
Local governments are highly fragmented, resulting in dependence on central government transfers to deliver government services. As of the end of 2018, there are 428 municipalities, 127 cities and 20 counties.168 The vast majority of municipalities in Eastern Croatia (85 percent) have less than 5,000 inhabitants. This has important implications for their financial sustainability, as the revenues of local and county governments depend on the local population and economic activity. The amount of taxes collected in municipalities and cities in Eastern Croatia has declined by almost 20 percent over the last five years.169 In 2019, 85 percent of funds intended for fiscally underperforming municipalities and cities will be allocated to local governments in Eastern Croatia.170 As a recent CEPOR171 study noted, ‘a weak and fragmented public administration weighs on service delivery and penalises business, ... The high fragmentation of public administration translates into a multiplication of functions and public bodies, but disparities in the fiscal capacity of local government units result in regional inequalities in the services provided.’
165 All data is based on the annual accounts data from the FINA database. 166 Cities with over 35,000 inhabitants are responsible for the school system, healthcare system, zoning and urban planning, economic development, transport and transport infrastructure, maintenance of public roads, planning and developing the network of educational, health, social and cultural institutions, the issuance of construction and location licenses, and all other acts related to construction and the execution of planning documents for the county outside the area of large cities. 167 Referring to the issues noted later in the report. 168 Excluding the City of Zagreb, which has both county and city status. Source: Ministry of Public Administration. 169 Table of share in fiscal equalization by local (regional) self-government unit, 2019. http://www.mfin.hr/hr/fiskalno-izravnanje 170 Staff estimate based on the Decision on the share of funds for fiscal equalization of individual municipalities, cities and counties in 2019 (Odluka o udjelu sredstava fiskalnog izravnanja za pojedinu općinu, grad i županiju u ukupnim sredstvima fiskalnog izravnanja u 2019. godini). 171 Small and Medium Enterprises Report, Mirela Alpeza, Maja Has, Maja Novosel, Slavica Singer, CEPOR – SMEs and Entrepreneurship Policy Center, Croatia 2016. Available at: http://www.cepor.hr/wp-content/uploads/2015/04/Cepor-izvjesce-2016-ENG-web.pdf
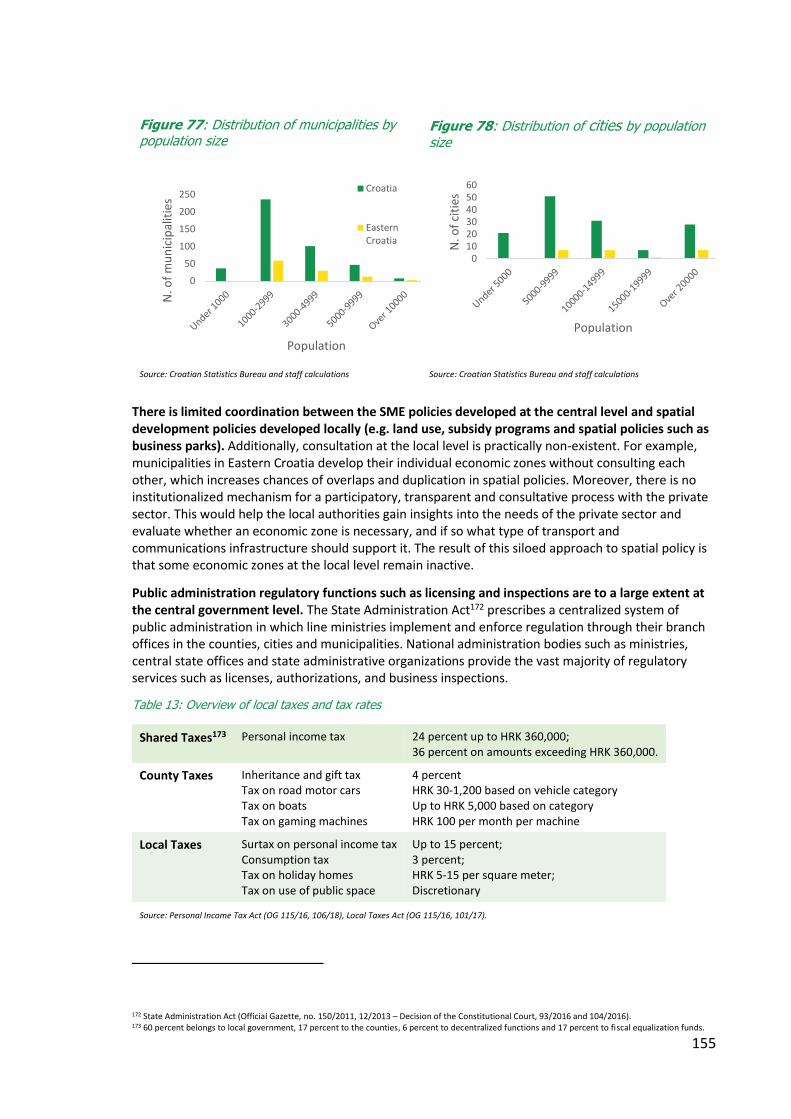
155
Figure 77: Distribution of municipalities by population size
Figure 78: Distribution of cities by population size
Source: Croatian Statistics Bureau and staff calculations Source: Croatian Statistics Bureau and staff calculations
There is limited coordination between the SME policies developed at the central level and spatial development policies developed locally (e.g. land use, subsidy programs and spatial policies such as business parks). Additionally, consultation at the local level is practically non-existent. For example, municipalities in Eastern Croatia develop their individual economic zones without consulting each other, which increases chances of overlaps and duplication in spatial policies. Moreover, there is no institutionalized mechanism for a participatory, transparent and consultative process with the private sector. This would help the local authorities gain insights into the needs of the private sector and evaluate whether an economic zone is necessary, and if so what type of transport and communications infrastructure should support it. The result of this siloed approach to spatial policy is that some economic zones at the local level remain inactive.
Public administration regulatory functions such as licensing and inspections are to a large extent at the central government level. The State Administration Act172 prescribes a centralized system of public administration in which line ministries implement and enforce regulation through their branch offices in the counties, cities and municipalities. National administration bodies such as ministries, central state offices and state administrative organizations provide the vast majority of regulatory services such as licenses, authorizations, and business inspections.
Table 13: Overview of local taxes and tax rates
Shared Taxes173 Personal income tax 24 percent up to HRK 360,000; 36 percent on amounts exceeding HRK 360,000.
County Taxes Inheritance and gift tax Tax on road motor cars Tax on boats Tax on gaming machines
4 percent HRK 30-1,200 based on vehicle category Up to HRK 5,000 based on category HRK 100 per month per machine
Local Taxes Surtax on personal income tax Consumption tax Tax on holiday homes Tax on use of public space
Up to 15 percent; 3 percent; HRK 5-15 per square meter; Discretionary
Source: Personal Income Tax Act (OG 115/16, 106/18), Local Taxes Act (OG 115/16, 101/17).
172 State Administration Act (Official Gazette, no. 150/2011, 12/2013 – Decision of the Constitutional Court, 93/2016 and 104/2016). 173 60 percent belongs to local government, 17 percent to the counties, 6 percent to decentralized functions and 17 percent to fiscal equalization funds.
0
50
100
150
200
250
N. o
f m
un
icip
alit
ies
Population
Croatia
EasternCroatia
0102030405060
N. o
f ci
ties
Population

156
2. Starting a Business or Project This section elaborates issues related to construction regulation and permits, and the difficulty of hiring non-EU workers. A recurring theme from interviews with businesses in Eastern Croatia was the cumbersome construction permitting process. Businesses also highlighted the significant constraints they face in employing non-EU workers.
Main findings Construction regulations:
• Investors are facing a fragmented construction permitting process with significant delays,
limited accountability of issuing authorities, and relatively high compliance costs;
• The permitting system is paper-based and lacks transparency;
• There are too many administrative requirements to support the application (a large
number of pre-approvals and supporting documents unavailable online need to be
acquired) which are an important source of delays;
• Inspection procedures are inefficient and contribute to elevated compliance costs;
• The overall costs related to acquiring construction permits are high.
Employing non-EU workers:
• While there is a lack of human capital, the possibility of employing non-EU workers is
limited;
• The procedures for obtaining work permits are burdensome and lengthy;
• The ineffective system for quota planning results in low quotas for certain strategic
sectors.
2.1. Construction regulation and permits
Problem statement
Dealing with construction-related procedures is one of the most challenging regulatory areas for the private sector in Eastern Croatia. Investors face a fragmented process with significant delays, limited accountability of issuing authorities, and relatively high compliance costs when compared with Croatia’s peers in the region. Anecdotal evidence suggests that delays may span into several months.
What businesses say:
‘We had to wait over 8 months to obtain the building permit and we lost a year of production. In the end, we circumvented the local authority and went to the Ministry of Construction to complain. We then received the permit a few days later.’
Business owner of production facility in Eastern Croatia – October 2018
Driven by the need to align the country’s building control system with European good practice, the Ministry of Construction and Physical Planning has introduced an online platform to facilitate the process.174 The Information and Communication Technology (ICT) platform launched in January 2015 is interoperable with the cadaster and connects 1,486 authorities at the time of writing. However, the
174 https://dozvola.mgipu.hr/web/edozvole/predaja-zahtjeva

157
requirements for paper format documents continue to exist, electronic payments are not possible, the monitoring of cases is imperfect, and there is no uptake by the private sector.
The ICT solution for construction permits does not currently have an impact on the private sector. The platform has limited uptake by design professionals (e.g. architects and engineers) despite the monetary incentive175 offered to applicants who submit their plans online. This may be partly attributable to insufficient communication measures (building professionals are not always aware of the online option) and the perceived limited benefits. For example, applicants are still required to submit their plans in hard copy even when they apply online.
Additionally, the platform does not allow applicants to verify their professional qualifications. As a result, design professionals have to visit the local building authority in person and submit their professional license before they can submit a building permit application. Therefore, they do not see the benefit of duplicating the submission process online. Moreover, the platform does not address the accountability and traceability aspects of the application process, which seem to be at the crux of the matter regarding delays. A more in-depth review of the existing ICT solution would be required to identify and close any gaps that are currently limiting its uptake.
A team in the Ministry is currently developing additional components to strengthen the platform’s scope and features. Zoning information is now being digitalized to include infrastructure (gas, water, electricity, sewerage, telecommunications), forestry zones, areas protected under the Natura 2000 network, and cultural heritage protection, among others. Completion is expected by the fall of 2019. The Ministry is now working on an e-archiving project to digitalize all records dating back to 1968, an e-inspections module, and an e-conference module to enable communication between utility providers, the relevant agencies176 and local authorities. While ongoing work towards digitalization is developing in the right direction, there is room for improvement, to close the gap between the work carried out by the Ministry and implementation by the local authorities, utility companies and applicable law agencies.
Despite the efforts towards digitalization, there is room for improvement in the existing process of obtaining construction and use permits.177 The relevant agencies and utility providers do not always publish their technical requirements and guidelines. This makes it difficult for building applicants to find the information, identify their obligations, and comply with technical requirements. A general obligation is imposed on construction permit applicants to obtain all additional approvals from the relevant agencies, but the construction law does not provide a comprehensive list of requirements, as these vary between the cities and counties. Investors therefore consistently struggle to determine whether they have fulfilled all legal obligations.
Obtaining pre-approvals from utility companies and applicable law agencies was consistently highlighted by both business owners and design professionals as an important source of delays. Applicants are required to submit their conceptual designs to the relevant agencies and utility companies for an initial approval before they commission more in-depth designs on geotechnical, architectural, structural, mechanical, electrical, plumbing and fire safety studies. Based on the feedback received by a building control department, the number of pre-approvals may range up to a maximum of 35 (based on information found on the website of the City of Osijek). This process is uncoordinated, since the applicant has to visit each stakeholder, submit the studies and obtain the approval separately. The team is aware that the Ministry of Construction and Physical Planning is currently working on its e-conference module, which is planned to streamline these procedures into a
175 Applicants who submit their plans through the e-permit system enjoy a 25 percent discount compared to the paper-based system. 176 The relevant agencies are authorities outside the main building control body (local authority) that provide prior clearances for a proposed project. 177 Use permits refer to the final approval issued by the local authority following the final inspection of the completed building by the building control bodies. This is required before the building can be occupied / used.
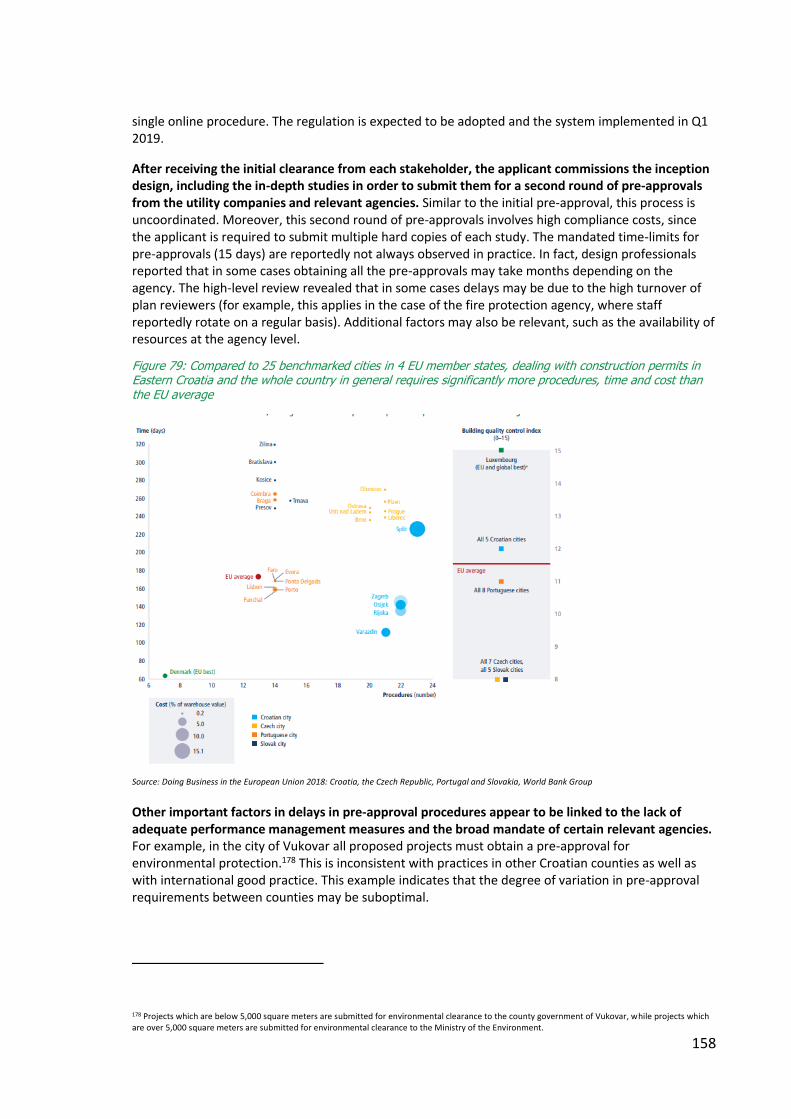
158
single online procedure. The regulation is expected to be adopted and the system implemented in Q1 2019.
After receiving the initial clearance from each stakeholder, the applicant commissions the inception design, including the in-depth studies in order to submit them for a second round of pre-approvals from the utility companies and relevant agencies. Similar to the initial pre-approval, this process is uncoordinated. Moreover, this second round of pre-approvals involves high compliance costs, since the applicant is required to submit multiple hard copies of each study. The mandated time-limits for pre-approvals (15 days) are reportedly not always observed in practice. In fact, design professionals reported that in some cases obtaining all the pre-approvals may take months depending on the agency. The high-level review revealed that in some cases delays may be due to the high turnover of plan reviewers (for example, this applies in the case of the fire protection agency, where staff reportedly rotate on a regular basis). Additional factors may also be relevant, such as the availability of resources at the agency level.
Figure 79: Compared to 25 benchmarked cities in 4 EU member states, dealing with construction permits in Eastern Croatia and the whole country in general requires significantly more procedures, time and cost than the EU average
Source: Doing Business in the European Union 2018: Croatia, the Czech Republic, Portugal and Slovakia, World Bank Group
Other important factors in delays in pre-approval procedures appear to be linked to the lack of adequate performance management measures and the broad mandate of certain relevant agencies. For example, in the city of Vukovar all proposed projects must obtain a pre-approval for environmental protection.178 This is inconsistent with practices in other Croatian counties as well as with international good practice. This example indicates that the degree of variation in pre-approval requirements between counties may be suboptimal.
178 Projects which are below 5,000 square meters are submitted for environmental clearance to the county government of Vukovar, while projects which are over 5,000 square meters are submitted for environmental clearance to the Ministry of the Environment.

159
Inspection procedures are another source of inefficiency and elevated compliance costs. Building professionals report an unusually high number of technical experts involved in inspections. In the case of small buildings, an electrical and mechanical engineer, both of whom are hired by the local authority and paid for by the developer / investor, are required to inspect the building jointly with a zoning officer from the local building authority before the use permit is issued. For more complex buildings, joint inspections typically involve experts from other disciplines as well, such as an architect, structural engineer, occupational safety inspector, fire safety expert, and two zoning officers from the local building authority. This is a relatively high number of technical experts when compared to good practice in the region. Additionally, pursuant to Articles 140 and 144 of the new Building Act, the final inspection and issuance of the use permit should take 23 days in total (15+8 days). A new, shorter time limit could be set for completing this procedure, particularly for low and medium-risk buildings.
Last but not least, based on the Dealing with Construction Permits (DwCP)179 indicator measured by the Doing Business project, Croatia compares unfavorably on the cost sub-indicator.180 According to the DwCP data, Croatia is the second most expensive country among the economies in the Europe and Central Asia region and the OECD member countries.
Figure 80: Croatia compares unfavorably relative to its peers regarding building costs
Source: Doing Business database
Good practice comparison
Greater access to regulatory information is consistently associated with more efficient regulatory processes.181 Transparency in the permitting process is of high importance, both to enhance legal certainty and to prevent corruption. In the context of construction, transparency is relevant vis-a-vis land planning information and building regulations.
For example, planning and zoning information tends to be consistently available across urban areas of England and Wales. The City of Birmingham, for example, has an outstanding wealth of high-level strategic information available on city master planning and urban regulation, although its website provides little detailed information and no interactive functions in relation to regulation of new
179 The Doing Business DwCP indicator divides the process of building a warehouse into distinct steps and calculates the time and cost of completing each procedure. The results are based on a standardized case study with assumptions regarding the construction company, the footprint and surface area of the building, the commercial purpose of the warehouse, and other conditions related to utility connections. For more details on the methodology of the standardized case study employed by the Doing Business report, please refer to the following resource: http://www.doingbusiness.org/Methodology/Dealing-with-Construction-Permits 180 Cost required to complete each procedure (% of income per capita). 181 Carolin Geginat, How transparent is business regulation around the world? 2013.
0
10,000
20,000
30,000
40,000
50,000
60,000
70,000
0
2
4
6
8
10
12
Slo
vaki
a
Esto
nia
Cze
ch
Po
lan
d
Lith
uan
ia
Serb
ia
Hu
nga
ry
Mac
edo
nia
Bu
lgar
ia
Au
stri
a
Slo
ven
ia
Den
mar
k
Ital
y
Cro
atia
EUR
% o
f w
areh
ou
se v
alu
e
Total cost (EUR)
% of warehouse value
160
construction in specific areas of the city. Despite this characteristic, it offers an online application system for planning permission that enables applicants to track the status of their planning permits at all times and to access in-depth legal information pertaining to the land plot and its history.
The trend in the EU is to make project engineers responsible for the compliance of building plans with fire safety regulations at the design stage (permitting stage). In several EU countries, fire departments only carry out targeted reviews and inspections for complex and high-risk buildings. To this end, these jurisdictions have developed risk-classification systems to determine procedural and documentation requirements for plan reviews and inspections. Projects that fall under the low and medium-risk classes are typically exempted from fire safety approval and inspection. In contrast to Croatia’s building inspection regime, other practices in Europe have eliminated the electromechanical and fire safety check from inspection procedures of low and medium-risk buildings, and have passed the responsibility to the supervising engineer. Croatia could leverage the new categorization of buildings introduced through the new Building Act to calibrate its inspection regime based on building complexity.
Several jurisdictions have taken advantage of ICT solutions to support construction permitting activities. Good practice software applications offer the following features and functionalities:
• An online informational portal where architects and developers can obtain information on
building regulations and permitting requirements;
• Online application forms for permits (and support for front-counter operations), including the
ability to upload building plans;
• Workflow management capabilities to allow simultaneous distribution of permit applications and
building plans to relevant reviewers;
• Secure document management and archiving of approved plans in case of later building failures;
• Support for field inspections of building sites using smartphones or tablets with the ability to
upload photos and building material test results, SMS / email notifications, and web interfaces
allowing architects to monitor the status of applications and to respond to questions or concerns
raised by government staff reviewing the application;
• Management dashboards allowing oversight of permit workflows and administrative performance,
and facilitating reporting on key analytical measures (e.g. geographic distribution of new
construction).
A preliminary review of Croatia’s ICT solutions revealed that there are areas for improvement. For example, at present building professionals who submit their plans through the platform, need to also appear in person before the building authority in order to submit hard copies of their plans and to verify their identity / license. Instead, registered design professionals and staff from building authorities could be provided with an encrypted key to access the system. Croatian legislation already enables digital signatures within a comprehensive legal framework. Allowing registered design professionals to verify their identity online through the online system, would negate the need to visit the building authority in person.
More importantly, the existing management dashboard could be strengthened to allow for increased oversight of permit workflows and administrative performance. Currently, there is no systematic supervision embedded in the system. As a result, performance at the local level is not adequately monitored to ensure compliance with administrative time limits. Other jurisdictions that have introduced ICT solutions at the national level, have leveraged the capabilities offered by technology to monitor performance through KPIs and identify areas for improvement in government-to-business service delivery. This was, for example, the approach selected by Serbia when implementing a national level ICT system for construction-related procedures (Box 1).

161
Box 1: Serbia’s far-reaching reforms in construction regulation culminated in a national e-permits portal in 2016
With the increasing use of cloud-based technologies in government, deployment of nationwide transactional portals has become a cost-effective approach to standardizing delivery of permitting services within a country. Serbia provides a good example.
Until 2014, developers seeking to obtain a building permit in Serbia faced high costs and a long, convoluted process involving several agencies with limited coordination. Following a set of reforms implemented between 2014 and 2016, Serbia has addressed some of the major challenges and now offers developers a more transparent and efficient system, enabled by a national e-permit portal implemented by the Secretariat for Urban Planning and Construction. A 2014 law on planning and construction introduced a new governance framework, including a new standardized procedure with strict timelines for reviews. A clear supervision hierarchy and sanctions were also established, allowing an independent central agency to monitor performance at the municipal level. A year later, a new integrated system was launched, and migration was initiated by digitalizing records. The new system attributed a ‘leading agency’ role to the municipalities, which became the single access points for developers, consistent with a one-stop-shop approach. In 2016, a national online platform182 was launched with a wide scope of functionalities, such as electronic filing, archiving, electronic exchange of information between the various authorities, automatic notifications to reviewers about upcoming deadlines, and monitoring of all statutory deadlines. The platform automated the new standardized process across municipalities, improved controls during construction, centralized the system for utility approvals, and introduced a new information system for end users and a monitoring mechanism for the authorities.
Doing Business 2018 reflects these results: two years after concluding these reforms, Serbia’s economy leapfrogged from a global rank of 152 in 2016 to 10 in 2018 in the topic of Dealing with Construction Permits.
Source: World Bank Group project team
Last but not least, with regard to pricing policy, the average fees for pre-approval and construction permits across Austria, Germany, and the UK are about 1.1 percent of the warehouse value. In Croatia, the cost is tenfold at 10.9 percent. Good practice regulatory regimes aim, on the one hand, to establish a minimum threshold to ensure the self-sustainability of administrative services for permitting and inspections, while on the other to ensure that this cost is reasonable and affordable for investors. A review of practices in the EU points to four major good practices relating to setting and administering construction permit fees. These are summarized in Table 14.
Table 14: Summary of good practices for establishing administrative building permit and inspection fees
Practice Background
Establish fee levels based on cost recovery for building control services.
Fees should include the costs associated with the reviews of plans and any inspections, along with overhead costs. This approach is followed in New Zealand, where building consent agencies charge fees for issuing building code compliance certificates when buildings are completed.
182 http://gradjevinskedozvole.rs/

162
Ensure that building control fees do not fulfill a tax purpose.
Low municipal tax resources often create an incentive to turn building permit fees into proxies for tax revenues. If deficiencies in the property tax system require collecting funds at the time of construction, the tax portion of the building permit fee should be clearly delineated in the interest of transparency and accountability.
Charge small, fixed fees for small projects presenting no risk for public health and safety.
For small buildings, setting a small, fixed fee is considered good practice. Minimum fees are necessary because the cost of providing services is not directly proportional to the area or cost of the building; a minimum charge is therefore necessary to cover enforcement costs for small projects. Large projects with substantial permit fees will typically cross-subsidize smaller projects.
Publicize fee schedules.
To support other relevant efforts in improving transparency and process efficiency, fee schedules for permits and inspections should be publicized and made available on local authorities’ websites and other means of communication.
Source: World Bank Group project team
Recommendations
Application process
Ensure that the current ICT solution being implemented is consistent with international good practice and implement the following key measures:
• Allow design professionals to verify their identity and professional qualifications
online;
• Eliminate the requirement to submit hard copies of building designs for applicants
who submit their applications online;
• Enable end users to track their application through each processing stage as well as to
receive updates on the status of their application by email and / or SMS.
Land-use planning
Continue the digitalization of land planning and zoning information with localized data, using mapping and GIS-supported data systems, and incorporate information on utility infrastructure (there is an ongoing WBG project that is already supporting the State Geodetic Administration for improving online access to cadaster data). Once developed, plans should be made publicly available through dedicated electronic platforms to allow interested parties to review the detailed conditions of the development down to specific land use conditions associated with land plots.
Documentary requirements
Eliminate pre-approval by utility companies for projects which are proposed to be built as part of an urban plan where utility infrastructure is readily available. Streamline procedural and documentation requirements for projects outside the urban plan where pre-approval by the utility companies will still be required.
Inspections Simplify the new inspection regime to impose only one certified third-party inspector across the whole construction cycle of the building for the majority of building types. Consider maintaining the joint inspection regime only for more complex and larger buildings which are open to the public.
Construction costs
Review the fees for construction permits and inspections to ensure that these are affordable within the local socioeconomic context and do not exceed 3 percent of construction costs, noting that the average in OECD countries is 1.5 percent. The Ministry of Construction and Physical Planning is in discussions on this topic with most of the local governments across Croatia, however further support may be warranted.

163
164
2.2. Difficulty of hiring non-EU workers
Problem statement
One of the challenges encountered by the private sector in Eastern Croatia is the limited supply of human capital. Croatia has been experiencing negative net migration flows and this trend has been exacerbated since the country’s accession to the EU in 2013. The trend is even more pronounced in the five counties of the Slavonia region. For example, in 2016 the largest share of emigrants from the Republic of Croatia to foreign countries was recorded in the City of Zagreb (13.4 percent), followed by Osječko-Baranjska County (10 percent). Almost half (46.7 percent) of emigrants to international destinations were between the ages of 20 and 39. Domestic migration flows indicate a similar negative trend for Eastern Croatia. In 2016, the largest negative net migration was recorded in Vukovarsko-Srijemska County (1,257 people) and Brodsko-Posavska (872 people).183 These migration trends have implications for business owners in Slavonia, who oftentimes struggle to find workers. Anecdotal evidence from the team’s review indicates that recruiting workers, and highly-skilled workers in particular, is a challenge for business owners in Slavonia, which is shared across sectors.
In principle, the pooling factors of growing deficits in the labor market combined with the long-lasting trends of an aging population and comparatively higher wages relative to those in neighboring countries could create positive dynamics for immigration to Croatia. However, this is not visible in the annual number of work permits issued to foreigners, since these indicate a substantial reduction from 8,397 permits in 2008 to 2,315 permits in 2016.184 The fall in the number of work permits to foreigners may be partly attributed to the decline in economic output and the expected lower demand for labor in the years following the global financial crisis. For example, this is evident in the construction industry, which typically relies on immigrant workers. In 2004, 6,471 companies were registered with 84,642 employees working in the construction sector. Nine years later, in 2013, there were 11,989 companies employing 77,129 workers.185
What businesses say:
Anecdotal evidence from interviews with business owners in Slavonia revealed that hiring workers who are not from the EU or the European Economic Area (EEA) can be a challenging undertaking. Firms and academia report a cumbersome and lengthy process (for example, dealing with this procedure should take 15 days, but businesses report it takes at least 2 months) with unpredictable outcomes when describing the immigration visa system. Moreover, they mention examples where their application to hire a foreign, non-EU / EEA national was rejected without justification and despite the fact that they could not resource these skills from the local labor market. - October 2018
Currently, third-country nationals (non-EU / EEA citizens) can be granted a stay and work permit following the application procedure as described on the Ministry of the Interior’s website.186 This is a unique permit issued by the competent police department and allows a foreigner to temporarily stay and work in the country. Stay and work permits187 are based on an annual quota and can be granted to a non-EU / EEA national who meets the prerequisites for a temporary stay, upon submission of the necessary documentation188 and payment of an administrative fee of HRK 800.00.
183 Migration of the population of the Republic of Croatia, 2016. More information available at: https://www.dzs.hr/Hrv_Eng/publication/2017/07-01-02_01_2017.htm 184 Government of Croatia (2016): Decision on the 2016 annual quota of work permits for non-EU workers, Article 74. Foreigners Act (Official Gazette 130/11 I 74/13), https://narodne-novine.nn.hr/clanci/sluzbeni/2016_04_39_1027.html 185 Source: https://www.flandersinvestmentandtrade.com/export/sites/trade/files/market_studies/2016-Croatia-Construction-and-infrastructure.pdf 186 https://www.mup.hr/UserDocsImages/Dokumenti/stranci/2013/obrazac_9a.pdf 187 https://ec.europa.eu/migrant-integration/librarydoc/the-foreigners-act-130/2011-74/2013 188 http://stari.mup.hr/120027.aspx
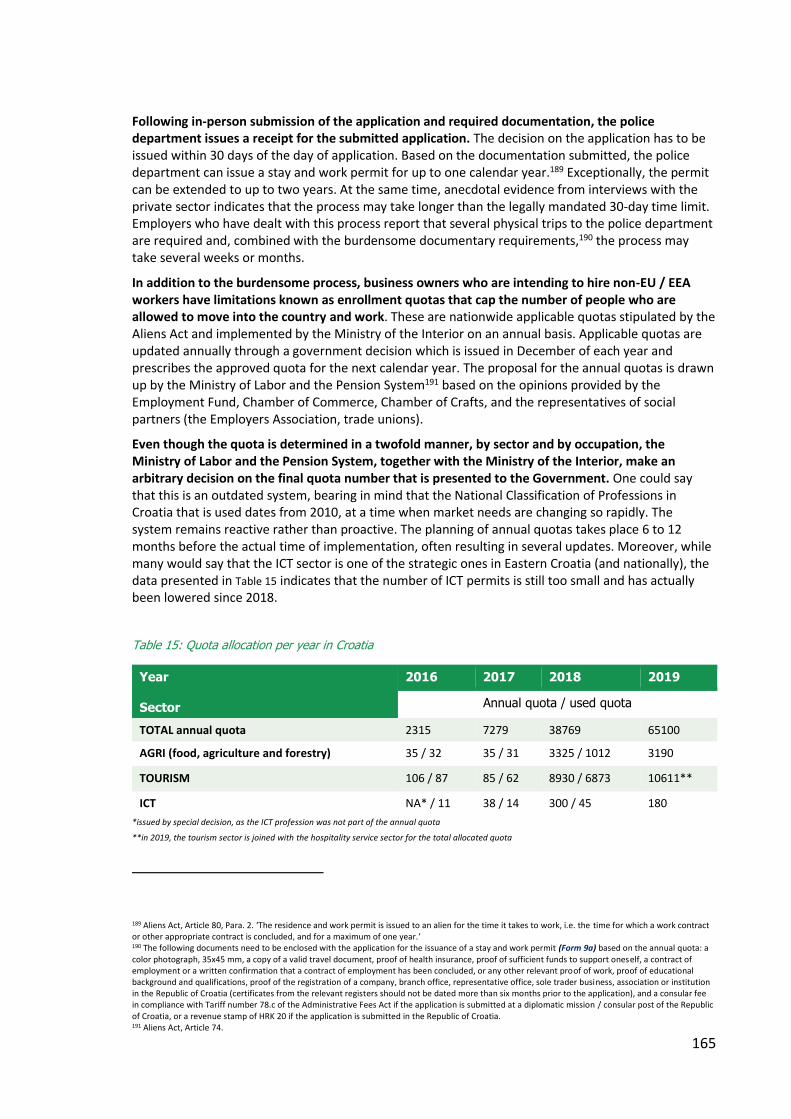
165
Following in-person submission of the application and required documentation, the police department issues a receipt for the submitted application. The decision on the application has to be issued within 30 days of the day of application. Based on the documentation submitted, the police department can issue a stay and work permit for up to one calendar year.189 Exceptionally, the permit can be extended to up to two years. At the same time, anecdotal evidence from interviews with the private sector indicates that the process may take longer than the legally mandated 30-day time limit. Employers who have dealt with this process report that several physical trips to the police department are required and, combined with the burdensome documentary requirements,190 the process may take several weeks or months.
In addition to the burdensome process, business owners who are intending to hire non-EU / EEA workers have limitations known as enrollment quotas that cap the number of people who are allowed to move into the country and work. These are nationwide applicable quotas stipulated by the Aliens Act and implemented by the Ministry of the Interior on an annual basis. Applicable quotas are updated annually through a government decision which is issued in December of each year and prescribes the approved quota for the next calendar year. The proposal for the annual quotas is drawn up by the Ministry of Labor and the Pension System191 based on the opinions provided by the Employment Fund, Chamber of Commerce, Chamber of Crafts, and the representatives of social partners (the Employers Association, trade unions).
Even though the quota is determined in a twofold manner, by sector and by occupation, the Ministry of Labor and the Pension System, together with the Ministry of the Interior, make an arbitrary decision on the final quota number that is presented to the Government. One could say that this is an outdated system, bearing in mind that the National Classification of Professions in Croatia that is used dates from 2010, at a time when market needs are changing so rapidly. The system remains reactive rather than proactive. The planning of annual quotas takes place 6 to 12 months before the actual time of implementation, often resulting in several updates. Moreover, while many would say that the ICT sector is one of the strategic ones in Eastern Croatia (and nationally), the data presented in Table 15 indicates that the number of ICT permits is still too small and has actually been lowered since 2018. Table 15: Quota allocation per year in Croatia
Year
Sector
2016 2017 2018 2019
Annual quota / used quota
TOTAL annual quota 2315 7279 38769 65100
AGRI (food, agriculture and forestry) 35 / 32 35 / 31 3325 / 1012 3190
TOURISM 106 / 87 85 / 62 8930 / 6873 10611**
ICT NA* / 11 38 / 14 300 / 45 180
*issued by special decision, as the ICT profession was not part of the annual quota
**in 2019, the tourism sector is joined with the hospitality service sector for the total allocated quota
189 Aliens Act, Article 80, Para. 2. ‘The residence and work permit is issued to an alien for the time it takes to work, i.e. the time for which a work contract or other appropriate contract is concluded, and for a maximum of one year.’ 190 The following documents need to be enclosed with the application for the issuance of a stay and work permit (Form 9a) based on the annual quota: a color photograph, 35x45 mm, a copy of a valid travel document, proof of health insurance, proof of sufficient funds to support oneself, a contract of employment or a written confirmation that a contract of employment has been concluded, or any other relevant proof of work, proof of educational background and qualifications, proof of the registration of a company, branch office, representative office, sole trader business, association or institution in the Republic of Croatia (certificates from the relevant registers should not be dated more than six months prior to the application), and a consular fee in compliance with Tariff number 78.c of the Administrative Fees Act if the application is submitted at a diplomatic mission / consular post of the Republic of Croatia, or a revenue stamp of HRK 20 if the application is submitted in the Republic of Croatia. 191 Aliens Act, Article 74.

166
Moreover, there is room for improvement in terms of policies related to the integration of foreign labor. According to the migrant integration policy index (MIPEX),192 Croatia scores unfavorably in several areas which are critical to foreign workers. First, temporary resident workers could spend years trapped in a job below their qualifications because they cannot change jobs and sectors (see instead Italy, Portugal and Spain - MIPEX) and cannot immediately open their own business (see recent openings in Greece and Poland – MIPEX). Second, Croatia is one of only 5 countries measured by the index where non-EU citizens are not guaranteed equal access to vocational training. Third, the index highlights the insecurity of status for non-EU workers after they have moved to Croatia as a challenge. For example, eligible applicants are typically insecure about their families’ future due to discretionary elements in the procedure. The authorities may reject their application or withdraw their permit on wide discretionary grounds, and the law does not require the authorities to take into account the family’s individual circumstances and positive links with Croatia. All of these practices compare unfavorably with the EU legal standard.
Good practice comparison
Restrictive skilled immigration regimes may impact on the viability of new ventures and may lead companies to invest elsewhere.193 Restrictive implementation of immigration policies, such as cumbersome and long processing times for foreign work permits may potentially lead to stalled productivity or loss of strategic or first-mover advantage for companies. For example, a 2012 research paper provides evidence that a less restrictive skilled immigration regime is conducive to attracting FDI.194 This evidence was supported further through a 2012 in-depth survey led by Harvard Business School. The multi-year project surveyed 10,000 Harvard alumni in senior leadership positions to identify the factors that undermine long-term competitiveness in the United States.195 According to the survey results, better access to skilled labor was stated as the third main reason for moving existing activities out of the United States, behind lower wages and proximity to customers. There is a consensus among experts that international migration can positively contribute to global economic growth and development by enhancing the hosting economies’ productivity and competitiveness.196 Moreover, economies which have smart and fast immigration regimes for skilled expatriates have a competitive advantage in attracting FDI.
Eastern Croatia could attract skilled workers from neighboring non-EU countries to enhance the competitiveness of the local private sector. Eastern Croatia can leverage its geographical proximity, comparatively higher wages, and low cultural and language barriers between the region and the countries of the former Yugoslavia, to attract highly skilled workers. To that end, adequate policies and procedures would need to be in place. Stakeholders report that there are already foreign students at the university, but keeping them for work is difficult because of the inefficient process of hiring non-EU workers.
Other countries have improved the efficiency of the process for temporary work permits so as to allow industry to have access to foreign talent even for seasonal positions. In Honduras, companies who intend to hire a foreign worker for a temporary position must first apply to the Work Secretariat to obtain a certificate of compliance with the quota requirements. Subsequently, the company must apply for a special stay permit to the Director of Immigration and Foreign Affairs. Upon receipt of the special stay permit, the skilled expatriate must register at the National Foreign Register and then apply to obtain a temporary working permit before the Work and Social Security Office of the Department of
192 Available at: http://www.mipex.eu/croatia 193 Employing Skilled Expatriates, Benchmarking Skilled Immigration Regimes across Economies, Dieter De Smet, World Bank Group, November 2013. 194 Medina, Maria. 2012. ‘Do Immigration Policies Make Countries More Attractive to Multinational Corporations?’ Iowa State University. 2012. 195 Porter, Michael E. and Jan W. Rivkin. 2012. ‘Prosperity at Risk: Findings of Harvard Business School’s Survey on U.S. Competitiveness.’ Harvard Business School, 2012. Available at: https://www.hbs.edu/faculty/Publication%20Files/Prosperity%20at%20Risk%20-%20HBS%20Survey%20on%20U.S.%20Competiveness_335134e0-0fb8-4957-b5c6-c0850e5898f4.pdf 196 World Economic Forum. 2010. ‘Stimulating Economies through Fostering Talent Mobility.’ Available at:http://www3.weforum.org/docs/WEF_PS_TalentMobility_report_2010.pdf
167
State. This is followed by an official visit to the company by the immigration officers of the Department of State to verify compliance with the quota requirements. The Department of State then reviews the application and grants the temporary work permit. The average time taken to obtain a temporary work permit for an Information Technology (IT) specialist is over 5 months. By contrast, in Singapore it only takes 10 days on average. The hiring company applies for an employment pass at the Ministry of Manpower, which issues an in-principle approval letter. Upon entering Singapore, the skilled expatriate is required to follow the instructions stated in the in-principle approval letter, for example to have a medical check-up, and upon compliance the employment pass is issued.197
Recommendations
Application process for work permits The government of Croatia could digitalize the process and ensure that strict timelines for processing are observed, at least for temporary work permits, which are typically more time sensitive. Other jurisdictions have reaped efficiency gains by doing so. Based on a World Bank Group survey carried out in 2013, seventy-five percent of the economies which have advanced online capability (meaning the system allows more than only downloading a temporary work permit application form) have average temporary work permit processing times which are lower than the global average of 8 weeks. Moreover, some economies have implemented a single interface to consolidate submission of the documentation requirements, coordinate the processing and manage the interaction with the applicants. Having a one-stop shop where the processing unit manages the relationship between the different competent authorities is applicant-friendly and normally results in shorter processing times. The Ministry of the Interior could enable applicants to submit their application, contract and copy of their passport online. This would simplify communication with officials, and would make the procedure transparent and easier to track (time, reasons for rejection, countries workers come from, etc.)
Long-term residency Other policies to consider include offering a reasonable path to permanent residency and facilitating entry to the labor market for accompanying spouses. Long-settled non-EU citizens in Croatia are eligible to become long-term residents after 5 years under quite straightforward conditions and acquire security of residence and equal opportunities. The path to permanent residence is on a par with several countries in the region. However, according to the migrant integration policy index, unlike in most countries, applicants in Croatia have to demonstrate proof of their health insurance, accommodation, integration and the highest-level of language fluency in Europe.
197 Employing Skilled Expatriates, Benchmarking Skilled Immigration Regimes across Economies, Dieter De Smet, World Bank Group, November 2013.
168
3. Operating a business The process of on-site inspections was indicated as a challenge by interviewed businesses in Eastern Croatia. Inspections are an important tool of regulatory control and present the ‘face’ of government. Due to the nature of inspections, a single official can determine whether a business is penalized or can continue operations, and they may hold significant authority. Businesses also highlighted issues affecting the predictability of operating a business, such as parafiscal charges, frequent legal changes and lack of access to information related to compliance.
Main findings Inspections:
• Lack of clarity and consistency in inspection procedures and requirements;
• Inspections have a punitive rather than a compliance-promotion approach;
• Businesses face a high level of uncertainty and unpredictability due to the limited
transparency of inspection procedures.
Parafiscal Charges:
• Parafiscal charges have unclear funding objectives and often overlap with other
mandatory contributions / payments;
• Administrative processes to pay parafiscal charges can be rigid;
• Previous attempts of the government to reduce the number and / or value (cost) of
parafiscal charges have had limited success.
Consultation and Transparency:
• Transparency is undermined by a lack of clear, accessible, and up-to-date information
necessary to establish and operate a business, particularly in the local context;
• Government portals providing services to businesses have become outdated and reliable
information is scattered across websites of different ministries and offices;
• Consultation is reportedly dominated by large influential businesses and local
governments have seemingly no role in the process.
3.1. Inspections
Problem statement
Interviews with the private sector in the five counties of the Eastern Croatia region reveal that inspections of business premises can be a burdensome process characterized by a high degree of discretion and lack of a compliance-promotion approach. The received feedback varied depending on the sector. Firms in the ICT industry reported limited interaction with inspectors, primarily for labor and tax compliance issues. Business owners operating in the wood industry reported inspections aimed at comparing the logs with the invoices to curtail an illegal market for wood raw material. Operators in the hotel industry mentioned that although they typically received a large number of inspections (an inspection on a weekly basis), improvement has been observed in more recent months. Business owners in the agribusiness, food production and processing sectors reported a large number of inspections, which pose a high compliance burden. This is due to both the opportunity costs associated with the fact that entrepreneurs have to spend time away from their operations to deal with long inspection procedures, as well as the likelihood of being sanctioned for alleged violations.
Croatia has reorganized inspection services through few institutional reforms in the past twenty years. However, challenges remain to be addressed in this area. The 1997 reform that consolidated
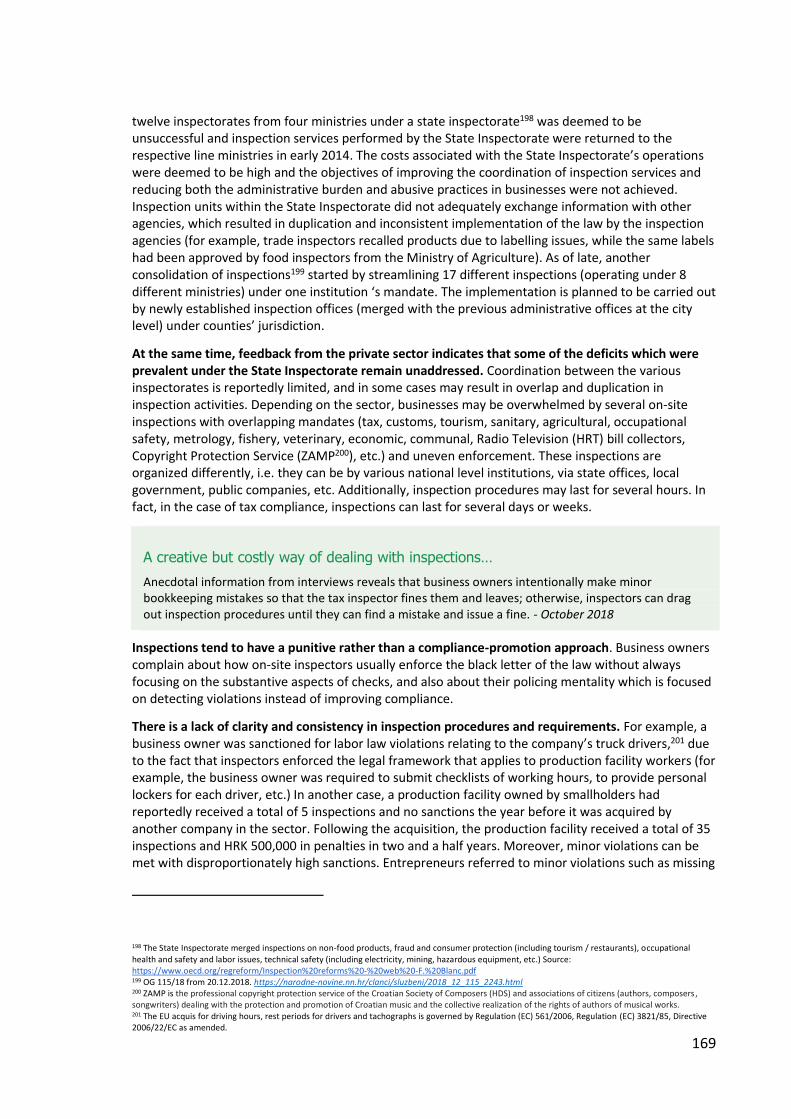
169
twelve inspectorates from four ministries under a state inspectorate198 was deemed to be unsuccessful and inspection services performed by the State Inspectorate were returned to the respective line ministries in early 2014. The costs associated with the State Inspectorate’s operations were deemed to be high and the objectives of improving the coordination of inspection services and reducing both the administrative burden and abusive practices in businesses were not achieved. Inspection units within the State Inspectorate did not adequately exchange information with other agencies, which resulted in duplication and inconsistent implementation of the law by the inspection agencies (for example, trade inspectors recalled products due to labelling issues, while the same labels had been approved by food inspectors from the Ministry of Agriculture). As of late, another consolidation of inspections199 started by streamlining 17 different inspections (operating under 8 different ministries) under one institution ‘s mandate. The implementation is planned to be carried out by newly established inspection offices (merged with the previous administrative offices at the city level) under counties’ jurisdiction.
At the same time, feedback from the private sector indicates that some of the deficits which were prevalent under the State Inspectorate remain unaddressed. Coordination between the various inspectorates is reportedly limited, and in some cases may result in overlap and duplication in inspection activities. Depending on the sector, businesses may be overwhelmed by several on-site inspections with overlapping mandates (tax, customs, tourism, sanitary, agricultural, occupational safety, metrology, fishery, veterinary, economic, communal, Radio Television (HRT) bill collectors, Copyright Protection Service (ZAMP200), etc.) and uneven enforcement. These inspections are organized differently, i.e. they can be by various national level institutions, via state offices, local government, public companies, etc. Additionally, inspection procedures may last for several hours. In fact, in the case of tax compliance, inspections can last for several days or weeks.
A creative but costly way of dealing with inspections…
Anecdotal information from interviews reveals that business owners intentionally make minor bookkeeping mistakes so that the tax inspector fines them and leaves; otherwise, inspectors can drag out inspection procedures until they can find a mistake and issue a fine. - October 2018
Inspections tend to have a punitive rather than a compliance-promotion approach. Business owners complain about how on-site inspectors usually enforce the black letter of the law without always focusing on the substantive aspects of checks, and also about their policing mentality which is focused on detecting violations instead of improving compliance.
There is a lack of clarity and consistency in inspection procedures and requirements. For example, a business owner was sanctioned for labor law violations relating to the company’s truck drivers,201 due to the fact that inspectors enforced the legal framework that applies to production facility workers (for example, the business owner was required to submit checklists of working hours, to provide personal lockers for each driver, etc.) In another case, a production facility owned by smallholders had reportedly received a total of 5 inspections and no sanctions the year before it was acquired by another company in the sector. Following the acquisition, the production facility received a total of 35 inspections and HRK 500,000 in penalties in two and a half years. Moreover, minor violations can be met with disproportionately high sanctions. Entrepreneurs referred to minor violations such as missing
198 The State Inspectorate merged inspections on non-food products, fraud and consumer protection (including tourism / restaurants), occupational health and safety and labor issues, technical safety (including electricity, mining, hazardous equipment, etc.) Source: https://www.oecd.org/regreform/Inspection%20reforms%20-%20web%20-F.%20Blanc.pdf 199 OG 115/18 from 20.12.2018. https://narodne-novine.nn.hr/clanci/sluzbeni/2018_12_115_2243.html 200 ZAMP is the professional copyright protection service of the Croatian Society of Composers (HDS) and associations of citizens (authors, composers , songwriters) dealing with the protection and promotion of Croatian music and the collective realization of the rights of authors of musical works. 201 The EU acquis for driving hours, rest periods for drivers and tachographs is governed by Regulation (EC) 561/2006, Regulation (EC) 3821/85, Directive 2006/22/EC as amended.
170
the sticker that marks the spot for the fire extinguisher, having an outdated ‘take your receipt’ sign displayed (due to frequent law changes, the text on stickers has to be updated as well), lacking proper hangers for purses in restrooms, having a trash can without a lid, and so on, for which inspectors can charge anything from HRK 2,000 to 150,000 as a fine.
Frequent changes in regulations and a lack of transparency regarding these changes create a sense of uncertainty and unpredictability in businesses. Regulatory requirements are not always easy to access through an authoritative source (e.g. ministry or local authority websites). In response, entrepreneurs are reportedly seeking guidance from non-authoritative sources, such as private online resources. Moreover, business owners lament the frequent changes in regulations as a significant challenge to operating a business in Slavonia. This is a greater challenge in the SME sector, where entrepreneurs oftentimes lack the resources necessary to keep up with an ever-shifting and fragmented regulatory landscape. As a result, they may fail to comply due to lack of awareness rather than due to a conscious attempt to cut corners. The prevalent view in the private sector is that businesses are not always provided with an opportunity to comply and cannot receive adequate guidance from inspectors on how to comply.
Good practice comparison
Good practice inspection regimes have assumed a holistic view of the inspection ecosystem. This requires reforming both the upstream (e.g. institutional set-up and legal framework) and the downstream (operational efficiency and ICT) elements to achieve adequate integration of inspection functions. A forthcoming World Bank Group study that surveyed inspection regimes across different regions confirmed that although there is no single model for reform, some patterns do emerge in successful reformers.
Grounding inspection reform upon strong institutional foundations is an important pillar for success, but not the only one. Lack of institutional clarity between the various inspectorates, as well as between the departments within those inspectorates, is one of the most common challenges. At the same time, there is no single blueprint on how to better organize institutions for inspections. As a rule of thumb, successful reformers have redefined institutional goals and mandates by redesigning regulatory control activities around risks instead of rules. This is a first step towards reducing overlap and duplication, facilitating harmonization of procedures, and calibrating regulatory control activities based on the desired regulatory outcomes. In some cases, this requires comprehensive institutional changes, such as merging all or most inspection bodies into a central inspectorate, consolidating several inspector units, or setting up an inter-ministerial coordinating body.
The lesson learned from jurisdictions that experimented with consolidation and merger is that institutional changes are not sufficient to address the underlying challenges. For consolidation to be successful, actual integration at the downstream level is required. This includes adequate information sharing, harmonization of tools and processes, coordination in inspections planning and objective setting, as well as a joint approach to resource allocation. If integration at the downstream level is not pursued, individual inspectorates continue to operate along ‘legacy’ lines. This may have been one of the reasons behind the State Inspectorate’s failure to improve coordination of inspection services, and reduce the administrative burden and abusive practices in businesses in Croatia as well.
Moreover, successful reformers have focused on improving inspectorates’ practices and procedures. This involves improving operational efficiency through harmonization and automation of inspection procedures, the use of harmonized tools and the development of guidelines for inspectors. The development of standardized tools is not only useful to harmonize, and streamline processes, but also in order to understand each agency’s needs, including their goals, evidence collection methods, and requirements. Developing checklists requires an analysis of the key technical requirements to be complied with and an understanding of what other agencies or departments do. For example, in Lithuania the use of checklists during inspection visits is not required by law. However, a number of

171
checklists have progressively been developed following a series of inspection reforms between 2008 and 2016. Prioritization in checklist development was given to areas and businesses where information asymmetry between inspectorates and economic operators was highest (e.g. small food operators, catering, repair shops, etc.)
One of the most important features of robust inspection systems is the adoption of risk-based strategies in planning and enforcement. Increasingly, inspectorates are leveraging data collected through inspections, as well as other resources (e.g. by triangulating data from other agencies and databases), to strengthen inspection planning. This approach can be a valuable strategy when deciding which duty holders to proactively inspect, taking into account factors such as size, type of activities, industry sector, and the associated death, injury, environmental risks, etc. This means that inspection and investigation resources are primarily targeted on those activities, industries and sectors that give rise to the most serious risks.
Figure 81: The basic elements of good practice in inspection ecosystems
Source: World Bank Group project team
Figure 82: Risk assessment tool

172
Medium and low risk activities are not, in general, subject to inspections unless actual harm has occurred. For example, the Health and Safety Executive (HSE) in the United Kingdom uses data from incidents, inspections and investigations. Risk-based strategies can also be deployed in enforcement by calibrating a graduated set of sanctioning options, moving to coercive solutions proportionate to the offense. This approach has been deemed to be more consistent with compliance promotion.
Figure 83: A graduated set of sanctioning options moving to coercive solutions proportionate to the offense can help promote compliance and ultimately the attainment of better regulatory outcomes
Source: World Bank Group project team
ICT solutions can be an important lever in effective use of data for risk-based planning. With the advent of technology and increasing automation in public administration, reformers have been tapping into the various databases held by agencies in different parts of government. Interoperable ICT systems in other agencies can even triangulate data from different databases and build more comprehensive profiles for risk-based planning. The richer the database, the more accurate risk assessments can be and hence the more informed the risk rating. This can include building a shared registry of business profiles and inspection histories, and link these with commercial registries and licensing databases. For example, in southern Italy’s Campania region, the authorities relevant to food safety implemented a risk-based system between 2007 and 2010, for licensing and inspection activities which was supported by an open-source custom-developed software. Furthermore, ICT can help enable information sharing and collaboration among inspectorates and ultimately reduce overlap and duplication in inspection procedures. For example, in Jordan a multi-year inspection reform culminated in a virtual integrated inspection management system by bringing 10 inspectorates together. The solution enabled extensive information sharing, joint development of risk assessments, and joint inspection planning and targeting.
In some cases, governments have implemented measures to directly limit the inspection burden on the private sector. For example, since 2001 many inspectorates in Georgia cannot inspect the same business twice in the same year for the same licenses and permits. A similar rule has existed in Bosnia and Herzegovina since 2005. Other countries have limited the maximum number of days for an inspection. In Armenia, the duration of an inspection visit cannot exceed 15 days, while in Poland SMEs can be inspected for a maximum of four weeks a year, with each inspection lasting no longer than 12 working days for microenterprises and 48 working days for large enterprises. Polish law also establishes limits on the duration and frequency of inspections per calendar year (save for cases where special authorization has been granted). In Lithuania, the nine largest inspectorates adopted a policy whereby they pledged to impose sanctions only as a last resort measure when inspecting businesses that have started to operate less than a year before the date of the inspection.
173
Last but not least, reformers in this area have strengthened performance and result measurement by developing KPIs. Adequate KPIs track performance on compliance promotion and achievement of the desired regulatory outcomes over time, such as the number of accidents in the workplace, in order to measure the inspections’ effectiveness in improving occupational safety or the number of food poisoning incidents. KPIs that measure the number of inspections and / or the volume of fines as proxies can have unintended consequences by increasing enforcement and the compliance burden for businesses without at the same time improving regulatory outcomes. The number of inspections is a circular reference and the number of sanctions provides a negative incentive in terms of compliance (lower compliance, means more sanctions, whereas the goal should be to increase compliance). Improving the individual performance of inspectors requires adequate training to effect a mindset / cultural change, and a robust performance management system with the right incentives in place.
Recommendations
Study the inspection system Consider commissioning an in-depth diagnostic of Croatia’s inspection system to better assess the gaps and identify specific regulatory areas for reform. Improve the inspection system The following set of key measures should be considered for implementation in Croatia’s inspection system:
• eliminate duplication and overlap in inspection procedures by calibrating the inspectorate’s
mandate and specific areas of control;
• risk-based planning and enforcement: the frequency of inspections should be proportional to
the level of risk; prioritization of inspections should be based on risk assessments; a graduated
set of sanctioning options should be applied by inspectors;
• ensure that adequate KPIs are introduced which are consistent with the desired regulatory
outcomes;
• implement harmonized tools (e.g. checklists, guidelines for inspectors) and procedures across
inspectorates;
• implement ICT systems to ensure adequate information sharing between inspectorates.

174
3.2. Parafiscal charges
Problem statement
The task team’s review revealed both horizontal and sector-specific parafiscal charges202 that increase the compliance burden for the private sector and weigh on the business environment. There is a strong consensus among entrepreneurs in Eastern Croatia that parafiscal charges add limited to no perceived value to their business operations or their sector in general. For example, every company in Eastern Croatia is required to pay membership fees to tourist boards at the national, regional and local levels, even when tourism has no direct or indirect link to their operations. Similarly, ICT firms are required to pay a percentage of their revenue as a forestry charge.
Moreover, entrepreneurs report that the administrative processes to pay parafiscal charges can be rigid, they are not available online and do not offer flexibility in terms of the payment schedule. In addition to increasing the compliance burden on the private sector, parafiscal charges often have unclear funding objectives and in some cases overlap with other mandatory contributions. For example, the fee for roads is paid on an annual basis upon vehicle registration, while at the same time it is calculated within the fuel price and is paid separately as a parafiscal charge. Even though they are the ‘extrabudgetary’ income of the different government bodies, state-owned enterprises and other government bodies, most often they represent the only source of funding for these government bodies. On the one hand, this partially solves the problem of financing the state at different levels, but on the other hand it brings uncertainty into the system, undermines the business environment, discourages investment, and encourages enterprises to operate, partly or completely, in the informal sector.
Previous government efforts to review and rationalize parafiscal charges have been only partially successful despite multiple attempts to lower them via various initiatives (government working groups, action plans, public consultations and a register of parafiscal charges). The reduction of parafiscal charges has been highlighted by the European Commission203however, to this day, implementation has been limited to reducing the monetary amount of parafiscal charges in some cases. According to the Ministry of the Economy, Entrepreneurship and Crafts, in 2016 the total amount of 213 different tariffs / parafiscal charges was HRK 9 billion. Out of this total, 5.2 billion relates to parafiscal charges that are applied to businesses and 3.8 billion to parafiscal charges applied to citizens, making it a total burden of 2.7 percent of GDP.
Box 2. List of parafiscal charges mentioned most often by the private sector Below is a list of parafiscal charges mapped by the team based on feedback received through interviews with the private sector. Additional parafiscal charges may also apply, but the list below includes the most common parafiscal charges mentioned by business owners in the Eastern Croatia region. The figures referred to are from 2016, based on the publicly available data in the register: 1. Water regulation charge Legal basis: the Water Act, the Regulation on the charges for water regulation, and the Rules on the calculation and collection of fees for water regulation Fee Assessment: based on surface area (per m2) and paid by the owner or other legal possessor of the property. Regulator: Ministry of Agriculture, Croatian Water revenues
202 Parafiscal charges are fees typically levied on goods or services by means of which a government raises money for a specific purpose. The money raised is usually paid to a body other than the national tax authority. 203 ‘The administrative burden and parafiscal charges continue to weigh on the business environment. Reduction of the administrative burden has been progressing steadily but at a modest pace. Cuts in parafiscal charges have been limited and transparency is low, as neither regular updates of the registry nor impact assessments of the planned cuts have been conducted.’ https://ec.europa.eu/info/sites/info/files/file_import/2018-european-semester-country-specific-recommendation-commission-recommendation-croatia-en.pdf

175
Total amount paid annually by entrepreneurs204: HRK 488,520,593.27 2. Tourist board membership Legal basis: the Tourist Board Membership Act, the Regulation on the content and form of the application form database for the calculation of tourist board membership fees Fee Assessment:205 0.0193 percent of total turnover206 Regulator: Ministry of Tourism, tourist boards (national, regional, local) Total amount paid annually by entrepreneurs: HRK 217,944,185.20 3. Membership of the Croatian Chamber of Economy Legal basis: Croatian Chamber of Economy Act and the Decision on the financing of the Croatian Chamber of Economy Fee assessment: HRK 1,083.00 per month / fixed fee207 Regulator: Ministry of Economy, Entrepreneurship, and Crafts, Croatian Chamber of Economy. Total amount paid annually by entrepreneurs: HRK 138,521,508.28 4. Monument charge Legal Basis: Protection and Preservation of Cultural Goods Act and the decision of the local government (city / municipality) on the value of payment Fee assessment: per surface area (m2) and paid by the owner or other legal possessor of the property Regulator: Ministry of Culture, local government Total amount paid annually by entrepreneurs: HRK 99,563,094.68 5. Forestry charge Legal basis: Forests Act and the Ordinance on the method of calculation, forms, special account and terms of payment of the forestry charge Fee assessment: 0.0265 percent of total revenue Regulator: Ministry of Agriculture, Hrvatske Šume Ltd. (Croatian Forests) Total amount paid annually by entrepreneurs: HRK 162,721,522.49 6. Annual fee for use of public roads Legal basis: Roads Act and Ordinance on the amount of annual fees for the use of public roads paid for the registration of motor vehicles and trailers Fee assessment: per cm3 for personal vehicles, per full load range for transport vehicles Regulator: Ministry of Sea, Transport and Infrastructure, Croatian Roads (Hrvatske ceste) Total amount paid annually by entrepreneurs: HRK 311,596,064.73 7. Radio and Television charge in the transport sector Legal basis: Croatian Radio Television Act Fee assessment: HRK 80.00 per month (per TV and / or radio receiver). Regulator: Croatian Radio Television Total amount paid annually by entrepreneurs: HRK 154,706,040.00
Firms in Eastern Croatia are questioning the need and benefit of parafiscal charges. For example, firms from various sectors pay the monument charge, but it is unclear what the reason behind the charge is, and how they benefit from it. Even firms from the tourism industry could not see the benefits of a fee for tourist board membership, considering their dissatisfaction with these bodies.
204 All data is based on the Register of Parafiscal Charges published on the website of the Ministry of Economy, Entrepreneurship and Crafts https://www.mingo.hr/public/documents/Registar_neporeznih_davanja_2016.pdf, and the calculations made by the Employers Association. 205 Tourist Board Membership Act (OG 121/16) Articles 9, 10, 11: The rate varies depending on the NACE code (which is based on the company’s registered activity), as there are 3 group levels and 4 classes (A-D) in the tourist classification of the city. 206 The revenue is allocated as follows: 65 percent to the city/ municipality tourist board, 10 percent to the county tourist board and 25 percent to the national tourist board. The base used in this example is based on the Doing Business methodology case study of a company, as it differs depending on the abovementioned classification. 207 Firms in their first year of operations are exempted.
176
A review should be undertaken on the purpose and effectiveness of funding raised through parafiscal charges for tourist boards. Currently, entrepreneurs in the Eastern Croatia region are required to pay 0.0193 percent of their turnover to fund tourist boards at the national, regional and local levels. However, the prevalent view in the private sector is that tourist boards add limited if any value to the industry.
The underlying policy objective behind tourist boards is to act as tourism promotion agencies for the region. However, individual tourist boards do not have strong incentives to collaborate and articulate a coherent vision for tourism promotion in Eastern Croatia. Anecdotal evidence from the team’s interviews with several professionals and business owners in the tourism industry indicates that the current organizational set up for tourist boards is fragmented and has been unsuccessful in coordinating the boards’ activities. Moreover, stakeholders from the private sector have highlighted the lack of initiative from public authorities tasked with tourism promotion and the lack of regional and local strategy for tourism development.
The human resource staffing of tourist boards is not conducive to developing a tourism promotion strategy. For example, there is no formal requirement for professional qualifications or prior experience in the sector, and there is no requirement for private sector participation in a tourist board. In fact, in some cases, as for example in Vinkovci, none of the eleven members sitting on the board are connected to the tourism industry. A parallel system of tourism councils exists in some cases in which mayors seek the tourism sector’s input by inviting business owners and professionals from the tourism industry in the form of a public-private dialogue. This is for example the case in Vinkovci, where a tourism council has been introduced by the mayor. However, the tourism council has no mandate to design or implement policy, has no formal or informal link to tourist boards or tourism offices, and its members participate on a pro bono basis.
Although positive examples of professionalism in tourist boards do exist the current institutional set up is not conducive to a concerted effort in tourism promotion. Fragmentation of tourism promotion activities across the five different counties and several cities is not supportive of articulating a coherent message and successful branding for the tourism industry. As a result, the local tourism sector in Eastern Croatia perceives tourist boards and offices as largely ineffective and redundant layers of bureaucracy that add limited if any value to the industry. In addition, the Slavonian tourism boards have a relatively small budget compared to the tourism boards in the Adriatic region. The limited staffing and promotional budgets, combined with the specific needs of developing and marketing an emerging destination, provides challenges in providing significant results. As a result, the local tourism sector in Eastern Croatia perceives tourist boards and offices as largely ineffective and redundant layers of bureaucracy that add limited if any value to the industry.
In addition, entrepreneurs are required to allocate part of their revenue to pay the local forestry charge. This is a parafiscal charge benefiting the state-owned forest company Hrvatske Šume (Croatian Forests) limited trading company at the expense of private sector businesses. In fact, the policy justification behind requiring private enterprise to subsidize a state-owned enterprise which is in charge of most (97 percent) state-owned forests and forestland in the country, and which is by far the largest forest manager in Croatia, remains elusive.
Given that Hrvatske Šume Ltd. enjoys a de facto monopoly as the only relevant commercial supplier to the commercial wood processing industry, it could fund its public administration duties of forest management through income from wood sales (currently amounting to 75 percent of the company’s revenue). Requiring the private sector to subsidize Hrvatske Šume through parafiscal charges is associated with the fact that the company is selling timber below market prices and hence current operators are receiving valuable raw material below its fair economic value. For example, a World Bank Group background note found that the realized prices on public bids are in many cases up to 50 percent (in extreme cases 100 percent) higher than starting prices, especially for oak and other high-quality timber. Starting prices are based on list prices and this increase indicates that market clearing auction prices would be much higher than the current list prices. This is a strong signal that the lack of
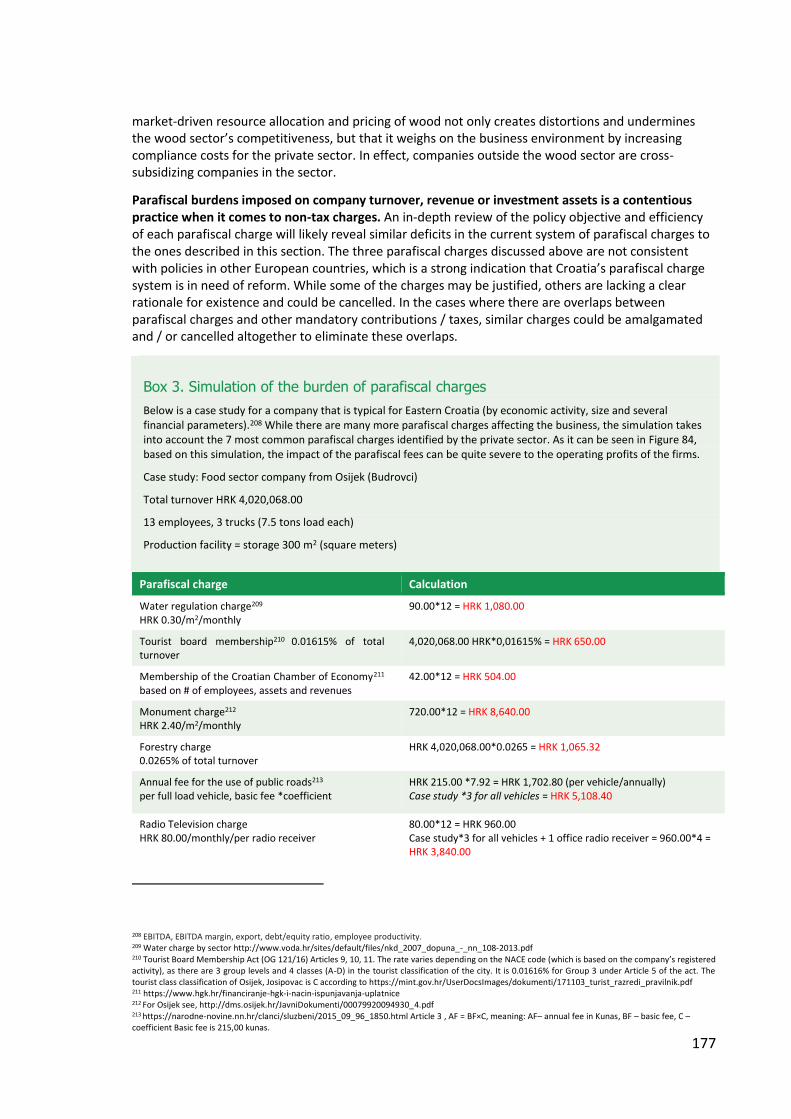
177
market-driven resource allocation and pricing of wood not only creates distortions and undermines the wood sector’s competitiveness, but that it weighs on the business environment by increasing compliance costs for the private sector. In effect, companies outside the wood sector are cross-subsidizing companies in the sector.
Parafiscal burdens imposed on company turnover, revenue or investment assets is a contentious practice when it comes to non-tax charges. An in-depth review of the policy objective and efficiency of each parafiscal charge will likely reveal similar deficits in the current system of parafiscal charges to the ones described in this section. The three parafiscal charges discussed above are not consistent with policies in other European countries, which is a strong indication that Croatia’s parafiscal charge system is in need of reform. While some of the charges may be justified, others are lacking a clear rationale for existence and could be cancelled. In the cases where there are overlaps between parafiscal charges and other mandatory contributions / taxes, similar charges could be amalgamated and / or cancelled altogether to eliminate these overlaps.
Box 3. Simulation of the burden of parafiscal charges
Below is a case study for a company that is typical for Eastern Croatia (by economic activity, size and several financial parameters).208 While there are many more parafiscal charges affecting the business, the simulation takes into account the 7 most common parafiscal charges identified by the private sector. As it can be seen in Figure 84, based on this simulation, the impact of the parafiscal fees can be quite severe to the operating profits of the firms.
Case study: Food sector company from Osijek (Budrovci)
Total turnover HRK 4,020,068.00
13 employees, 3 trucks (7.5 tons load each)
Production facility = storage 300 m2 (square meters)
Parafiscal charge Calculation
Water regulation charge209 HRK 0.30/m2/monthly
90.00*12 = HRK 1,080.00
Tourist board membership210 0.01615% of total turnover
4,020,068.00 HRK*0,01615% = HRK 650.00
Membership of the Croatian Chamber of Economy211 based on # of employees, assets and revenues
42.00*12 = HRK 504.00
Monument charge212 HRK 2.40/m2/monthly
720.00*12 = HRK 8,640.00
Forestry charge 0.0265% of total turnover
HRK 4,020,068.00*0.0265 = HRK 1,065.32
Annual fee for the use of public roads213 per full load vehicle, basic fee *coefficient
HRK 215.00 *7.92 = HRK 1,702.80 (per vehicle/annually) Case study *3 for all vehicles = HRK 5,108.40
Radio Television charge HRK 80.00/monthly/per radio receiver
80.00*12 = HRK 960.00 Case study*3 for all vehicles + 1 office radio receiver = 960.00*4 = HRK 3,840.00
208 EBITDA, EBITDA margin, export, debt/equity ratio, employee productivity. 209 Water charge by sector http://www.voda.hr/sites/default/files/nkd_2007_dopuna_-_nn_108-2013.pdf 210 Tourist Board Membership Act (OG 121/16) Articles 9, 10, 11. The rate varies depending on the NACE code (which is based on the company’s registered activity), as there are 3 group levels and 4 classes (A-D) in the tourist classification of the city. It is 0.01616% for Group 3 under Article 5 of the act. The tourist class classification of Osijek, Josipovac is C according to https://mint.gov.hr/UserDocsImages/dokumenti/171103_turist_razredi_pravilnik.pdf 211 https://www.hgk.hr/financiranje-hgk-i-nacin-ispunjavanja-uplatnice 212 For Osijek see, http://dms.osijek.hr/JavniDokumenti/00079920094930_4.pdf 213 https://narodne-novine.nn.hr/clanci/sluzbeni/2015_09_96_1850.html Article 3 , AF = BF×C, meaning: AF– annual fee in Kunas, BF – basic fee, C –coefficient Basic fee is 215,00 kunas.
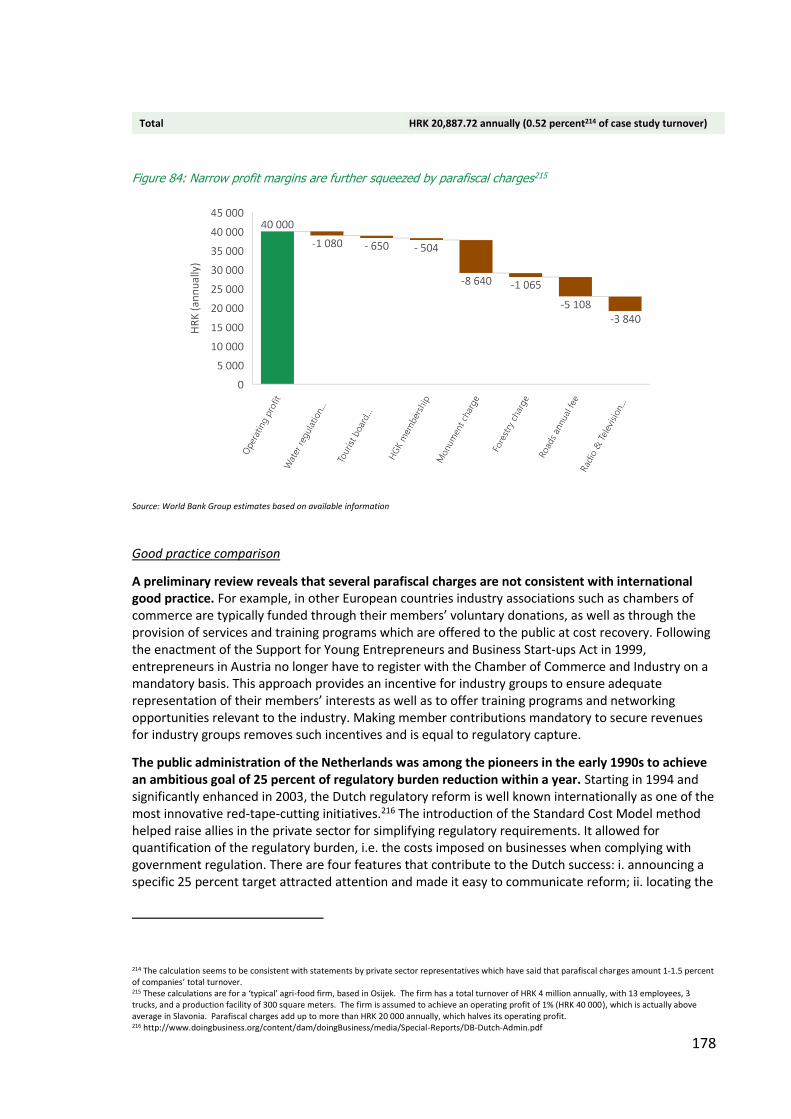
178
Total HRK 20,887.72 annually (0.52 percent214 of case study turnover)
Figure 84: Narrow profit margins are further squeezed by parafiscal charges215
Source: World Bank Group estimates based on available information
Good practice comparison
A preliminary review reveals that several parafiscal charges are not consistent with international good practice. For example, in other European countries industry associations such as chambers of commerce are typically funded through their members’ voluntary donations, as well as through the provision of services and training programs which are offered to the public at cost recovery. Following the enactment of the Support for Young Entrepreneurs and Business Start-ups Act in 1999, entrepreneurs in Austria no longer have to register with the Chamber of Commerce and Industry on a mandatory basis. This approach provides an incentive for industry groups to ensure adequate representation of their members’ interests as well as to offer training programs and networking opportunities relevant to the industry. Making member contributions mandatory to secure revenues for industry groups removes such incentives and is equal to regulatory capture.
The public administration of the Netherlands was among the pioneers in the early 1990s to achieve an ambitious goal of 25 percent of regulatory burden reduction within a year. Starting in 1994 and significantly enhanced in 2003, the Dutch regulatory reform is well known internationally as one of the most innovative red-tape-cutting initiatives.216 The introduction of the Standard Cost Model method helped raise allies in the private sector for simplifying regulatory requirements. It allowed for quantification of the regulatory burden, i.e. the costs imposed on businesses when complying with government regulation. There are four features that contribute to the Dutch success: i. announcing a specific 25 percent target attracted attention and made it easy to communicate reform; ii. locating the
214 The calculation seems to be consistent with statements by private sector representatives which have said that parafiscal charges amount 1-1.5 percent of companies’ total turnover. 215 These calculations are for a ‘typical’ agri-food firm, based in Osijek. The firm has a total turnover of HRK 4 million annually, with 13 employees, 3 trucks, and a production facility of 300 square meters. The firm is assumed to achieve an operating profit of 1% (HRK 40 000), which is actually above average in Slavonia. Parafiscal charges add up to more than HRK 20 000 annually, which halves its operating profit. 216 http://www.doingbusiness.org/content/dam/doingBusiness/media/Special-Reports/DB-Dutch-Admin.pdf
179
coordinating unit in the Ministry of Finance made reforms feasible because of the link to the budget and the leverage that the finance minister has in the cabinet, and also because of the personal dedication of the then actual minister; iii. the establishment of ACTAL217 as an independent agency made evaluation independent of any ministry and also helped build momentum for reform; iv. the commitment across all major political parties of Parliament to reduce business costs.
Germany reduced the regulatory burden by 25 percent, which resulted in over EUR 12 billion private sector savings.218 Based on the advanced approach of the Standard Cost Model measurement, binding methods / procedures were introduced for all ministries at the federal and ‘lander’ (regional) level. This helped to quantify regulations, improve the quality of data and ensure transparency. It set the scene for the introduction of independent scrutiny by the federal watchdog (the National Regulatory Control Council), plus oversight by the private sector. Germany also successfully introduced the ‘one-in, two-out’ model, which means that every regulator must abolish two administrative burdens if it desires to introduce a new one.
Recommendations
Increase transparency and predictability Compile an inventory of all parafiscal charges that apply to all partnership and company forms in the Eastern Croatia region from all levels of government (central, county, local), including state-owned enterprises. The inventory should include the frequency and volume of each parafiscal charge, whether they are collected at the local or national level, their legal basis, and the significance of this revenue source.
Review parafiscal charges Review and rationalize the parafiscal charge system. Conduct a validation test for each parafiscal charge by assessing the legality, necessity (rationale for existence) and ease of payment. Identify parafiscal charges that lack a clear rationale for existence and gradually phase them out. In the cases where there are overlaps between parafiscal charges and other mandatory contributions / taxes, amalgamate and / or cancel the parafiscal charge to eliminate overlaps.
Improve the payment system of parafiscal charges Streamline and automate the system for payment of parafiscal charges, such as one payment annually instead of monthly payments and consider unification of all payments for parafiscal charges into a single payment.
3.3. Legal changes (regulatory predictability and transparency)
Problem statement
Lack of regulatory predictability and transparency adversely affect firms in Croatia, including the business sector in the eastern part of the country. High administrative barriers, coupled with complex and frequently changing regulations, make it difficult to plan new investment. Frequent changes in the regulatory framework and a weak public consultation process contribute to legal uncertainty and undermine the ability of firms to adapt their operations in an efficient and timely manner. This is especially true for highly regulated sectors such as food and beverages, which is among the most prominent industries in Eastern Croatia. For example, a food company reported having to change their label twenty times in two years to comply with labelling requirements.
217 ACTAL is the Dutch Advisory Board on Regulatory Burden, an independent and external advisory body that advises government and Parliament on how to minimize regulatory burdens for firms, citizens, and professional workers in healthcare, education, safety and welfare. 218 https://ec.europa.eu/eurostat/documents/64157/4374310/11-STANDARD-COST-MODEL-DK-SE-NO-BE-UK-NL-2004-EN-1.pdf/e703a6d8-42b8-48c8-bdd9-572ab4484dd3
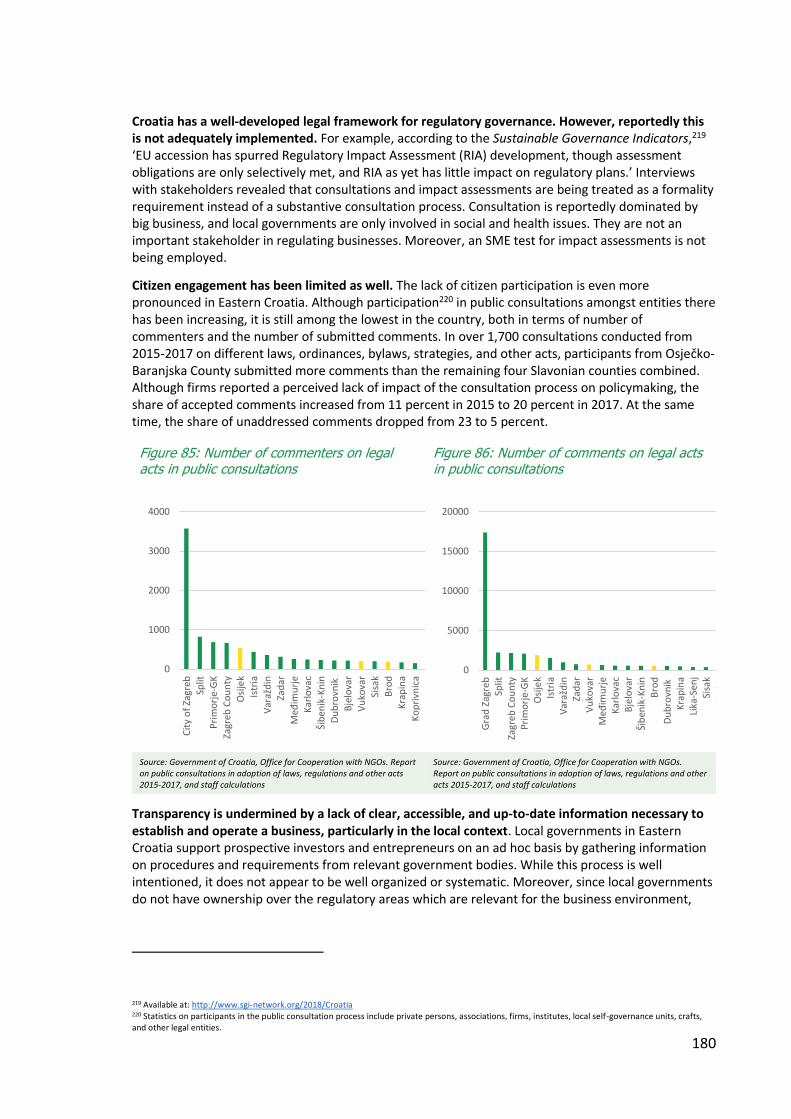
180
Croatia has a well-developed legal framework for regulatory governance. However, reportedly this is not adequately implemented. For example, according to the Sustainable Governance Indicators,219 ‘EU accession has spurred Regulatory Impact Assessment (RIA) development, though assessment obligations are only selectively met, and RIA as yet has little impact on regulatory plans.’ Interviews with stakeholders revealed that consultations and impact assessments are being treated as a formality requirement instead of a substantive consultation process. Consultation is reportedly dominated by big business, and local governments are only involved in social and health issues. They are not an important stakeholder in regulating businesses. Moreover, an SME test for impact assessments is not being employed.
Citizen engagement has been limited as well. The lack of citizen participation is even more pronounced in Eastern Croatia. Although participation220 in public consultations amongst entities there has been increasing, it is still among the lowest in the country, both in terms of number of commenters and the number of submitted comments. In over 1,700 consultations conducted from 2015-2017 on different laws, ordinances, bylaws, strategies, and other acts, participants from Osječko-Baranjska County submitted more comments than the remaining four Slavonian counties combined. Although firms reported a perceived lack of impact of the consultation process on policymaking, the share of accepted comments increased from 11 percent in 2015 to 20 percent in 2017. At the same time, the share of unaddressed comments dropped from 23 to 5 percent.
Figure 85: Number of commenters on legal acts in public consultations
Figure 86: Number of comments on legal acts in public consultations
Source: Government of Croatia, Office for Cooperation with NGOs. Report on public consultations in adoption of laws, regulations and other acts 2015-2017, and staff calculations
Source: Government of Croatia, Office for Cooperation with NGOs. Report on public consultations in adoption of laws, regulations and other acts 2015-2017, and staff calculations
Transparency is undermined by a lack of clear, accessible, and up-to-date information necessary to establish and operate a business, particularly in the local context. Local governments in Eastern Croatia support prospective investors and entrepreneurs on an ad hoc basis by gathering information on procedures and requirements from relevant government bodies. While this process is well intentioned, it does not appear to be well organized or systematic. Moreover, since local governments do not have ownership over the regulatory areas which are relevant for the business environment,
219 Available at: http://www.sgi-network.org/2018/Croatia 220 Statistics on participants in the public consultation process include private persons, associations, firms, institutes, local self-governance units, crafts, and other legal entities.
0
1000
2000
3000
4000
Cit
y o
f Za
greb
Split
Pri
mo
rje-
GK
Zagr
eb C
ou
nty
Osi
jek
Istr
ia
Var
ažd
in
Zad
ar
Međ
imu
rje
Kar
lova
c
Šib
enik
-Kn
in
Du
bro
vnik
Bje
lova
r
Vu
kova
r
Sisa
k
Bro
d
Kra
pin
a
Ko
pri
vnic
a
Vir
ovi
tica
0
5000
10000
15000
20000
Gra
d Z
agre
bSp
litZa
greb
Co
un
tyP
rim
orj
e-G
KO
sije
kIs
tria
Var
ažd
inZa
dar
Vu
kova
rM
eđim
urj
eK
arlo
vac
Bje
lova
rŠi
ben
ik-K
nin
Bro
dD
ub
rovn
ikK
rap
ina
Lika
-Sen
jSi
sak
Ko
pri
vnic
a

181
businesses cannot always fully rely on the reliability of this information. In many cases, they resort to private resources which are also prone to being outdated and unstructured.
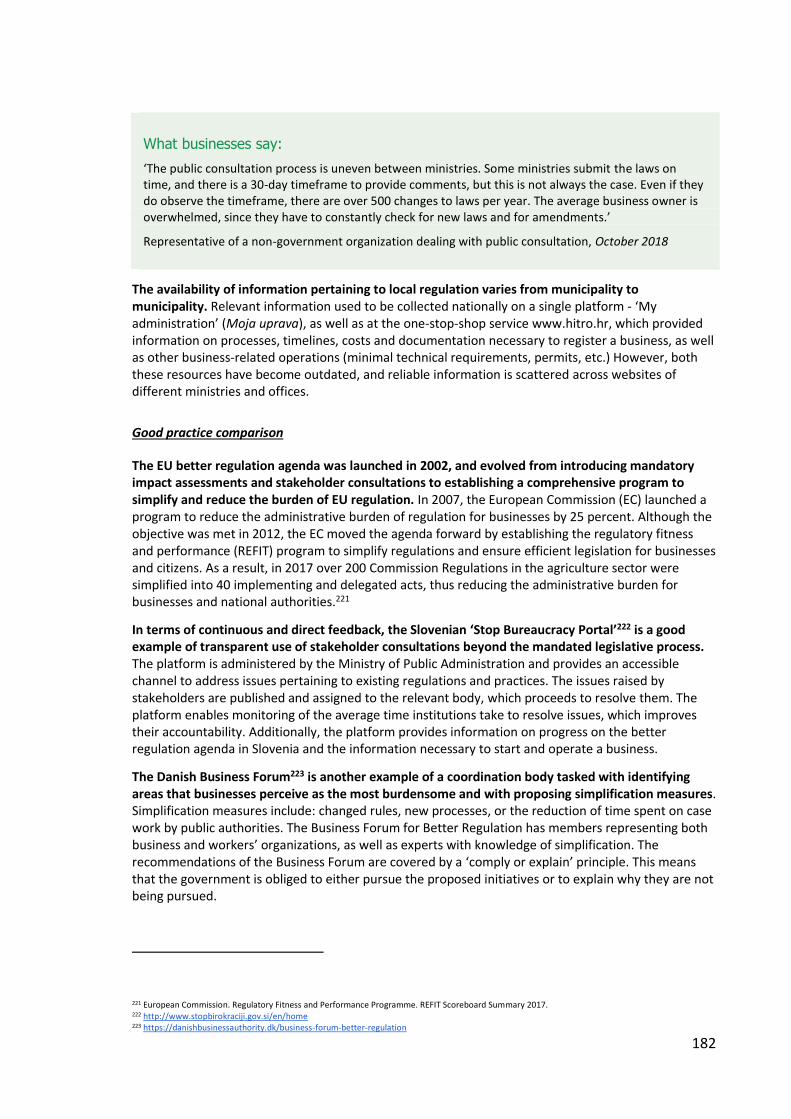
182
What businesses say:
‘The public consultation process is uneven between ministries. Some ministries submit the laws on time, and there is a 30-day timeframe to provide comments, but this is not always the case. Even if they do observe the timeframe, there are over 500 changes to laws per year. The average business owner is overwhelmed, since they have to constantly check for new laws and for amendments.’
Representative of a non-government organization dealing with public consultation, October 2018
The availability of information pertaining to local regulation varies from municipality to municipality. Relevant information used to be collected nationally on a single platform - ‘My administration’ (Moja uprava), as well as at the one-stop-shop service www.hitro.hr, which provided information on processes, timelines, costs and documentation necessary to register a business, as well as other business-related operations (minimal technical requirements, permits, etc.) However, both these resources have become outdated, and reliable information is scattered across websites of different ministries and offices.
Good practice comparison
The EU better regulation agenda was launched in 2002, and evolved from introducing mandatory impact assessments and stakeholder consultations to establishing a comprehensive program to simplify and reduce the burden of EU regulation. In 2007, the European Commission (EC) launched a program to reduce the administrative burden of regulation for businesses by 25 percent. Although the objective was met in 2012, the EC moved the agenda forward by establishing the regulatory fitness and performance (REFIT) program to simplify regulations and ensure efficient legislation for businesses and citizens. As a result, in 2017 over 200 Commission Regulations in the agriculture sector were simplified into 40 implementing and delegated acts, thus reducing the administrative burden for businesses and national authorities.221
In terms of continuous and direct feedback, the Slovenian ‘Stop Bureaucracy Portal’222 is a good example of transparent use of stakeholder consultations beyond the mandated legislative process. The platform is administered by the Ministry of Public Administration and provides an accessible channel to address issues pertaining to existing regulations and practices. The issues raised by stakeholders are published and assigned to the relevant body, which proceeds to resolve them. The platform enables monitoring of the average time institutions take to resolve issues, which improves their accountability. Additionally, the platform provides information on progress on the better regulation agenda in Slovenia and the information necessary to start and operate a business.
The Danish Business Forum223 is another example of a coordination body tasked with identifying areas that businesses perceive as the most burdensome and with proposing simplification measures. Simplification measures include: changed rules, new processes, or the reduction of time spent on case work by public authorities. The Business Forum for Better Regulation has members representing both business and workers’ organizations, as well as experts with knowledge of simplification. The recommendations of the Business Forum are covered by a ‘comply or explain’ principle. This means that the government is obliged to either pursue the proposed initiatives or to explain why they are not being pursued.
221 European Commission. Regulatory Fitness and Performance Programme. REFIT Scoreboard Summary 2017. 222 http://www.stopbirokraciji.gov.si/en/home 223 https://danishbusinessauthority.dk/business-forum-better-regulation
183
Recommendations
Information availability / accessibility Compile and regularly update available information that would serve as guidelines on start-up procedures, costs, timelines, and compliance issues for businesses. While not directly responsible, county or local authorities (possibly in cooperation with RDAs and / or entrepreneurship centers) could do this in cooperation with relevant national authorities.
Regulatory consultations Facilitate the consultative process through a ‘promote and educate’ campaign to encourage businesses in Eastern Croatia to participate in public consultations, and to inform the business community on new regulatory requirements. County or local authorities (possibly in cooperation with RDAs and / or entrepreneurship centers) could do this in cooperation with the relevant national authorities.
184
4. Sector-specific issues This section delves into issues and obstacles that are specific to sectors that have a comparative advantage and have the potential to grow in Eastern Croatia. These include the ICT sector and wood industry.
The ICT sector in Eastern Croatia has the potential to grow and create higher value-added output. Several ICT firms in Eastern Croatia have introduced new business models and developed networks through formal initiatives such as the Osijek Software City, which aims to develop the region into a competitive ICT hub in cooperation with the local government, the business incubator, and the University of Osijek.
The wood industry is an important generator of growth and employment in Eastern Croatia. The wood industry contributes around 10 percent of exports from Eastern Croatia and about 9 percent of private-sector jobs. Eastern Croatia also boasts an abundant natural supply of timber, including rare varieties such as Slavonian red oak, famously used in the production of wine.
4.1. ICT
Problem statement ICT firms are affected by specific obstacles to doing business, such as taxation issues, the framework for home-based businesses, and access to global digital platforms. These bottlenecks constrain firm-level growth in Slavonia’s ICT industry cluster, and disproportionately affect MSMEs. The main challenge for policymakers is to design a flexible and future-proof legal framework that can support digital frontrunners, while maintaining a level playing field for all firms.
The issues are as follows:
I. ICT firms face unfavorable tax treatment of so-called ‘posted workers’. They report high tax costs for ‘posted workers’, i.e. employees who are sent to carry out a service in another country on a temporary basis, typically as part of a service contract. The Croatian Contributions Act224 stipulates that the tax base for contributions on salaries for posted workers is the highest salary which the
224 Contributions Act, Art. 37 (OG 84/08, 152/08, 94/09, 18/11, 22/12, 144/12, 148/13, 41/14, 143/14, 115/16).
Main findings ICT specific:
• Overall unfavorable taxation issues for sector operations;
• Inflexible regulations to allow for the proper functioning of home-based businesses;
• Lack of access to global digital marketplaces and platforms.
Wood sector quota system:
• Timber sales are carried out at administratively regulated fixed prices and the distribution of
roundwood purchase rights is based on technical criteria;
• Unreliable delivery of contracted quotas, disrupting business and production plans and
causing delays in delivery to customers;
• Non-market based allocation of raw materials is inefficient, inequitable and lacks
transparency (for example, it is difficult to obtain information on delivered versus contracted
quantities).
185
posted worker could receive in Croatia for similar work, increased by 20 percent. Firms also report that the procedure is overly bureaucratic, as there is a requirement for the company to obtain a certificate issued by the pension fund that declares the estimated time the worker will be working abroad.
II. Regulatory requirements do not distinguish between commercial office spaces and home-based offices, which are frequently used by ICT firms in the start-up phase. For example, home-based businesses are subject to the same labor law requirements as other firms and hence are required to display working hours, maintain working hour logs, etc. The same applies to other regulatory requirements such as the ones pertaining to occupational safety. For example, it is not clear if home-based businesses need to comply with the onerous fire safety requirements that apply to other types of businesses. Firms may apply to the relevant ministries in order to seek clarifications and obtain exemptions, but these tend to be lengthy procedures and the opinion issued by the ministry is not binding, leaving the firm at risk of receiving fines during inspections. Additionally, there are no double taxation treaties with major ICT markets, such as the USA.
What businesses say:
‘My office is my laptop. As a freelancer consultant on tourism and mixed-use developments, I can do my work remotely from anywhere in Croatia. However, being incorporated as an LLC, the law requires me to have a VIP meeting room. To that end, I am paying fees on a monthly basis to rent a co-working space in Osijek in order to comply with this formal requirement, even though I don't really need this in order to deliver my work.’
Entrepreneur in Osijek, October 2018
III. Software developers do not have full access to global digital marketplaces and platforms. Developers in Croatia do not yet have full access to all the features offered by major digital platforms such as Google and Amazon. This prevents firms from fully accessing the global marketplace. For example, developers in Croatia cannot register a merchant account on Google Play. This means that they cannot monetize their applications but only list them for free. Merchant registration is currently supported in Macedonia, Hungary, Ukraine, Bulgaria and Romania, but not in Croatia.225 Similarly, Amazon allows registration of developers based in Croatia, but electronic payments are not available. In addition, Amazon may retain up to 30 percent of royalties for US tax purposes, since Croatia does not have a tax treaty with the United States.
Good practice comparison
Estonia is an example of a country with similar economic challenges that managed to find solutions to help the ICT sector thrive. Estonia repositioned itself as a leader on the global ICT market after a concerted effort to facilitate entrepreneurship, and invest in education and digitalization. By introducing the e-Residency226 initiative – a government-issued digital identity – Estonia allowed entrepreneurs from all over the world to set up and operate a business completely online. More recently, Estonia introduced a program227 designed to attract international talent by providing grants to firms who hire ICT specialists from abroad. Firms are eligible to receive grants of EUR 2,000 per foreign ICT specialist, which could be used to finance relocation costs, language training, and similar activities.
225 https://support.google.com/googleplay/android-developer/table/3539140?hl=en 226 https://e-resident.gov.ee/ 227 https://www.eas.ee/teenus/valisvarbamise-toetus/?lang=en

186
Croatia could also learn from the experience of Romania in reducing the income tax burden for ICT-related occupations. The ICT industry is among the fastest growing in Romania, and this is in part due to the favorable tax treatment of personal income for ICT specialists. Romania implements a tax exemption on personal income tax (PIT) for specific categories of ICT specialists. This is a substantial benefit, given that up to 2017 the PIT rate was 16 percent and is currently at 10 percent (compared to the progressive rate of 24%/36% in Croatia, the same as for most businesses).
Moreover, other jurisdictions have introduced frameworks to enable entrepreneurs to conduct their business from home. For example, in the United Kingdom entrepreneurs can conduct their business from home subject to certain criteria. Depending on the type of activity, the entrepreneur may need to obtain planning approval from the local planning office (the equivalent of a zoning approval or building permit in other jurisdictions) if the business activity requires changes to be made to the residence, or if running the business will cause ‘material change’ in the property usage. Additionally, permission from the local council may be necessary if the activity can be a source of nuisance (e.g. if the business is going to receive lots of customers or deliveries, or if the business intends to advertise outside the residence). Similarly, entrepreneurs may need to obtain a sector-specific license depending on the type of activity. Lastly, entrepreneurs may need to check with their home insurance to ensure that this will cover their business, as well as obtain permission from their landlord (if they rent the property).
In Singapore entrepreneurs who intend to conduct business from home need to obtain a home office permit (HO). This is a one-time permit which is valid for the duration of the home-office business and revocable if conditions are breached. Moreover, restrictions and performance criteria ensure that the scale of home office use is kept small so that it does not disturb or cause inconvenience to neighbors. For example, entrepreneurs have to observe a limit on the number of non-resident staff they can hire, they are not allowed to display any external business signage or advertisements, they are not allowed to engage in activities that generate noise, smoke, odor, waste matter or dust or that fall within the list of businesses that are not permitted under the HO scheme (e.g. car trading, shops or any form of retail activity, etc.)
Recommendations
Fiscal incentives Commission a study to propose recommendations on designing fiscal incentives for the ICT sector, including identifying relevant legal amendments necessary to reduce the tax burden and reviewing the available international experience in this area. This could be done as a joint collaboration between one of the RDAs and a local ICT cluster / association.
Home-based businesses Design a conducive framework for home-based businesses based on good practices from other countries, plus the specific local needs of industries in Eastern Croatia. This could potentially fit well with the planned amendments to labor legislation (likely to take place Q4 2019).
Public-private dialogue Form a working group at the local government level to work closely with ICT sector clusters / associations with a mandate to address ad hoc problems and sector-specific issues, and communicate in cooperation with the relevant bodies at the local, regional and national levels. This could be done as a joint collaboration between local government (city) and local ICT clusters / associations.
4.2. Wood sector
Problem statement
Inefficient market policies are holding the wood industry sector back. Businesses struggle to obtain sufficient raw materials for production due to the rationed supply of raw materials under the quota system administered by the state forest management company Hrvatske Šume. Timber sales are

187
carried out at administratively regulated fixed prices and the distribution of roundwood purchase rights is based on technical criteria pursuant to a price list which is approved by the Ministry of Economy, Entrepreneurship and Crafts. The current strategy gives the wood processing industry preferential access to raw material by directing quantities to industries with higher value-added activities. The market for raw timber in Croatia is controlled by Hrvatske Šume (HŠ), the state-owned enterprise in charge of forest management in Croatia. HŠ allocates a percentage of the overall supply of timber to firms at fixed below-market prices based on the degree of complexity of the finished goods.
Despite incentives to increase value addition in wood processing, most producers have not optimized their product strategies to move up the value chain and maximize the value of the raw material. Instead, they rely on receiving the raw material below its market value and optimizing production only up to the level that will secure them fulfilment of the minimum technical criteria to continue receiving their quota. Moreover, although this system guarantees low input prices for producers, it also creates shortages. All firms interviewed by the team indicated that the current policy for raw material allocation results in regular input shortages and underutilization of installed production capacity even for those already established in the quota system. Firms which rely on annual, as opposed to long-term, contracts reported that HŠ does not always deliver the contracted quota, disrupting business and production plans and causing delays in delivery to customers. Although allocation is supposedly based on technical criteria, in practice delivery is not always transparent. For example, it is difficult to obtain information on delivered versus contracted quantities.
What businesses say:
‘We would hire more people if the quota system was not in place. We would try to find a product niche and invest in machinery and technical expertise. However, there is no guarantee that we would receive more raw material if we invested more. Our only incentive in the current system is to survive, not expand.” -- Sawmill producer in Eastern Croatia, October 2018
‘It is very difficult to invest in the sector without being politically connected. Every year since 2011, we have received fewer raw materials. We have the equipment and staff to produce high-end products but the high-end product would require us to have a larger quantity to process in order to make a profit. We decided to produce lower-end products in order to survive.”
-- Wood processing company staff, October 2018
Firms from Eastern Croatia are unable to benefit from their proximity to natural resources. Instead, some firms reported having to purchase Slavonian wood from other parts of Croatia that had surpluses, or even import it from other countries (namely Bosnia and Serbia). Firms report that the non-market-based allocation of raw materials is inefficient, inequitable and lacks transparency. This removes the advantage to firms in Eastern Croatia of being close to forestry resources.
Moreover, the wood sector’s existing governance model poses outright barriers to entry. Since raw material is not distributed through a transparent and competitive process, and access to the quota system depends on access to decision-makers, new market entrants are de facto unable to enter the wood sector in Croatia. Additionally, the timber allocation system favors incumbents because they can apply for a specific type of wood at any level of production. Unlike incumbents, new firms can apply for a specific type of wood only if they produce solid wood furniture, while all other levels of production are assigned wood types based on their availability. This undermines the sector’s long-term development, since the wood sector’s existing governance model is unattractive to both foreign and domestic investors who could bring technical expertise and funding in order to improve productivity and upgrade product quality in the sector.

188
Good practice comparison
The timber allocation system in Austria features a more market-based and transparent system. The state forest management company distributes raw wood through a dedicated B2B platform. The harvested timber is recorded online and firms are able to bid on the available batches competitively. The platform provides immediate information on the type of wood, volume and prices in past auctions, as well as currently active auctions. Users also have access to an online app that provides descriptive information and photographic evidence of the quality of the harvest, collected and uploaded by forest rangers during regular inspections.
Recommendations
(See Chapter 1 of this report for more detailed recommendations on the wood quota system)
Transparency in the quota system Increase transparency in the distribution of raw timber, including a digital platform for tracking distribution and prices.
Impact assessment of the quota system Conduct a study to assess the impact of opening up the market for raw materials to new firms by removing the current restrictions. This would help to understand the effects on the number of employed people in the wood sector but also its growth prospects. This could be done by RDAs in cooperation with local wood associations.

Diagnostic Report RAS Growth and Jobs in Slavonija, Baranja & Srijem
Objective: Innovation

Diagnostic Report RAS Growth and Jobs in Slavonija, Baranja & Srijem
190
Chapter 5 Innovation System

Diagnostic Report RAS Growth and Jobs in Slavonija, Baranja & Srijem
191
Chapter 5: Summary Eastern Croatia is lagging behind the rest of the country in terms of productivity, and the innovation system is holding back the region’s convergence. Eastern Croatia is the least productive region in Croatia, and is more vulnerable to shocks than the rest of the country. During the latest recession, Eastern Croatia lost 20 percent of its productivity, compared to a national average of 10 percent. The innovation profile of Eastern Croatia is characterized by low private investment in R&D, low scientific productivity in public research organizations (PROs), and insufficient innovation support infrastructure. As a result, research and innovation competences in the region remain underdeveloped, and the generation of research and innovation results is sporadic. The share of firms that own intangible assets such as patents, concessions, trademarks, and software rights is below the national average.
Eastern Croatia has absorbed only a small portion of the European Structural and Investment Funds (ESIF) available to Croatia to improve its R&D capacity and innovation performance. The region received only 5.6 percent of the funding for R&D and innovation, and 7.8 percent of the funding for innovation in SMEs, both channeled through the main ESIF delivery program for RDI (Operational Program Competitiveness and Cohesion - OPCC). Innovation programs so far have not been tailored to the needs of lagging regions such as Eastern Croatia, and have often been too complex and inflexible. Insufficient coordination between relevant ministries at the national level, as well as between national and regional bodies, has resulted in situations where applicants had to adapt their innovation projects to fit the program rather than the program being adapted to the innovation needs of the applicants.
The University of Josip Juraj Strossmayer in Osijek is a critical resource for the development of Eastern Croatia, however it is lagging behind its peers in the country in terms of research excellence. The scientific performance of the University in terms of its number of publications, technology transfer, commercialization, and industry-science collaboration is low. Participation in centers of excellence and competence is limited. Some faculties are moving in a good direction in terms of internationalization and cooperation with industry, but much more needs to be done in these areas. However, there seems to be willingness to act and improve.
Although industry-science collaboration is far from satisfactory, there have been examples of successful initiatives. Some firms report that industry-academia collaboration is constrained due to the fact that local PROs do not have sufficient technological capacities to adequately respond to the needs of firms. While it is true that some research infrastructure and capacity is in need of improvement, onsite visits to PROs show that some of them are well equipped and highly knowledgeable. This mismatch in firm perception of PRO capabilities seems to be a consequence of a lack of regular communication and trust. On a positive note, there are encouraging examples to share, where PROs and the private sector have successfully collaborated by conducting joint research projects, jointly applying for funding, developing new teaching programs, and so on.
Innovation support infrastructure needs to be carefully thought through and well justified. There are cases of innovation infrastructure without an appropriate staffing strategy, business support infrastructure that lacks good management and does not provide the services needed for small firms and start-ups, and finally there is a shortage of physical space in some urban areas. When considering financing support, it is important to plan for: (i) complementarities with infrastructure and support that already exists, and (ii) a well-designed and comprehensive approach to building innovation support infrastructure.
The implementation of plans for business innovation projects will critically depend on carefully designed support. Preliminary estimates in a sample of firms of all sizes reveal that there is a pipeline

Diagnostic Report RAS Growth and Jobs in Slavonija, Baranja & Srijem
192
of innovation projects of at least HRK 250 million (EUR 35 million). These include plans to develop new products and services to be marketed within the next 1-3 years, and would rely on ESIF financing for 70-90 percent of the investment value. However, this can only succeed if the support programs are designed to cater to the specific needs of new product development and all the different stages of the innovation cycle, which has not been the case so far. Alongside financing, firms will also require technical assistance with respect to marketing and penetrating new markets within and outside the EU, as well as innovation management and quality production systems.
Strategically important sectors are typically oriented towards different types of innovation, and therefore experience different opportunities and challenges:
• Agri-Food. For firms in the food and agriculture sector, there are several emerging market niches that could provide opportunities for innovation. However, firms face obstacles, as they rarely conduct market research, are typically risk-averse (citing small market size and conservative consumers), and require technological upgrades and more business support services.
• Wood. Smaller companies from the wood industry could compete on quality and product differentiation, as well as in leveraging synergies related to biotechnology and clean-tech innovations. However, for this to happen, the cluster approach needs to be strengthened and innovation-enhancing activities identified, such as training, infrastructure, value-chain development, etc.
• ICT. Eastern Croatia boasts an emerging ICT scene, with several high-growth companies penetrating foreign markets. Firms mostly innovate by developing new products and services but struggle with attracting sufficient talent and require risk financing.
• Mechanical Engineering. The mechanical engineering sector features a good ecosystem in Slavonski Brod, starting from education institutions at different levels to large industrial groups and smaller technologically-advanced companies with strong export performance. This is an excellent potential that can be leveraged to foster innovative activities.
Increasing the innovation performance of Eastern Croatia will require interventions in the following areas:
• Cooperation and coordination. More effective cooperation and coordination will be required among national-level authorities, between national and regional authorities, between PROs and the private sector, and among PROs themselves.
• Access to finance. Financing mechanisms should be more tailored to specific innovation needs in the region, and financing should be complemented by advisory and acceleration services.
• Innovation support infrastructure. Slavonia’s innovation support infrastructure should be improved by providing reliable long-term financing and ensuring delivery of high-quality services.
• Human capital. Improving R&D competences in Slavonia will require investment in human capital, improving staffing and incentive frameworks, internationalization, and improvement of education programs and curricula in cooperation with the private sector.

Diagnostic Report RAS Growth and Jobs in Slavonija, Baranja & Srijem
193
Diagnostic Report RAS Growth and Jobs in Slavonija, Baranja & Srijem
194
Introduction
This chapter presents a diagnostic of the innovation and R&D conditions, competences, opportunities and challenges encountered in Eastern Croatia as a lagging region. It serves as an analytical background to revising the current programming of ESIF and preparing for the upcoming programming cycle (2021-2027). It should help steer investments and project ideas with the objective of maximizing opportunities presented by ESIF, thus ensuring highly relevant and fully functional interventions. Ultimately, it should contribute to the economic convergence of the region with the rest of Croatia.
The findings in the chapter follow an intensive data collection exercise, both through primary and secondary sources. The project team has been consulting relevant stakeholders in Eastern Croatia for more than a year, and in the last few months has met with 34 innovative companies, 8 business support organizations, and almost every higher education and research institution in Eastern Croatia. The focus has primarily been on 5 target sectors, as defined under RAS Growth and Jobs in Eastern Croatia. As a result, the findings and conclusions in this chapter (whether horizontal or vertical) draw on the current conditions in these 5 sectors. In addition to direct correspondence with private and public sector stakeholders, desk analysis was conducted using FINA (via BISNODE) data. The information presented is also supported by the over-a-decade-long engagement of the World Bank Group and the project team on various project activities related to innovation in Croatia.
The chapter takes a comprehensive view of the research and innovation capabilities of Eastern Croatia. It starts by providing a snapshot of the productivity and innovation profile of Eastern Croatia in section 2, and the utilization of ESIF for RDI in section 3. The rest of the chapter takes an in-depth view of the research (and higher education) sector, followed by an elaboration on the innovation support infrastructure available in Eastern Croatia, and finishes off with the challenges that the business sector is facing in engaging in innovation activities. The chapter concludes by focusing on recommendations but from a broad perspective. The next steps of this work will involve a prioritization exercise for interventions.
Diagnostic Report RAS Growth and Jobs in Slavonija, Baranja & Srijem
195
1. Innovation Profile of Eastern Croatia
Key Insights
• Eastern Croatia is the least productive region in Croatia. Micro and small firms are found to be more productive than medium and large firms, and ICT firms are the most productive of the strategically important industries, followed by the tourism, metal processing, wood and food industries.
• Firms in Eastern Croatia are less successful in transforming their R&D investments in the form of intangible assets than those in the rest of country. Similarly, export intensity is lower than the national average.
• Even though a good number of PhDs are coming from the university in Eastern Croatia, innovation capability in the form of patent applications is the lowest in the country. This negative result, among other factors, may be attributed to the weak entrepreneurial activity in the region.
Eastern Croatia displays embryonic regional innovation competences, with most of the knowledge, and economic and entrepreneurial activity being concentrated in the city of Osijek. The region underperforms compared to other regions in Croatia, not only in terms of R&D (relative to GDP), productivity levels and patenting, but also in terms of per capita exports (EUR 1,606). The region attracts low FDI per capita (EUR 966), which undermines private sector capacity to learn from global knowledge and its ability to catch up with the rest of the country. The city of Osijek plays a central role in fostering a regional innovation system by supplying skills (through the University of Osijek) and potentially becoming a knowledge hub in niche technology areas.
1.1. Firm Productivity
Eastern Croatia is the least productive region in Croatia, and will need to invest in innovation and technological advancement to catch up with the rest of the nation. Even though firms in Eastern Croatia have surpassed pre-crisis productivity levels, they remain less productive compared to other regions in Croatia (Figure 87). Firms in Eastern Croatia consistently have the lowest total factor productivity (TFP) among the five Croatian regions, and experienced a more pronounced productivity loss during the crisis. Labor productivity (LP) and TFP declined in all regions in 2008-13, but median TFP in Eastern Croatia declined by almost 20 percent, compared to a 10 percent decline at the national level. Conversely, capital productivity (CP) grew steadily after the onset of the crisis but gained further tailwind once economic recovery kicked in from 2015 onwards. The divergence in CP and LP trends could be explained by rising unit labor costs (ULC) during the crisis. The elevated price of labor input may have caused employers to switch to a more capital-intensive form of production, which would partially explain the sudden burst in capital productivity from 2013 onwards. Substantial gains in CP resulted in a TFP increase of around 20 percent compared to 2008, both in Eastern Croatia and nationally.
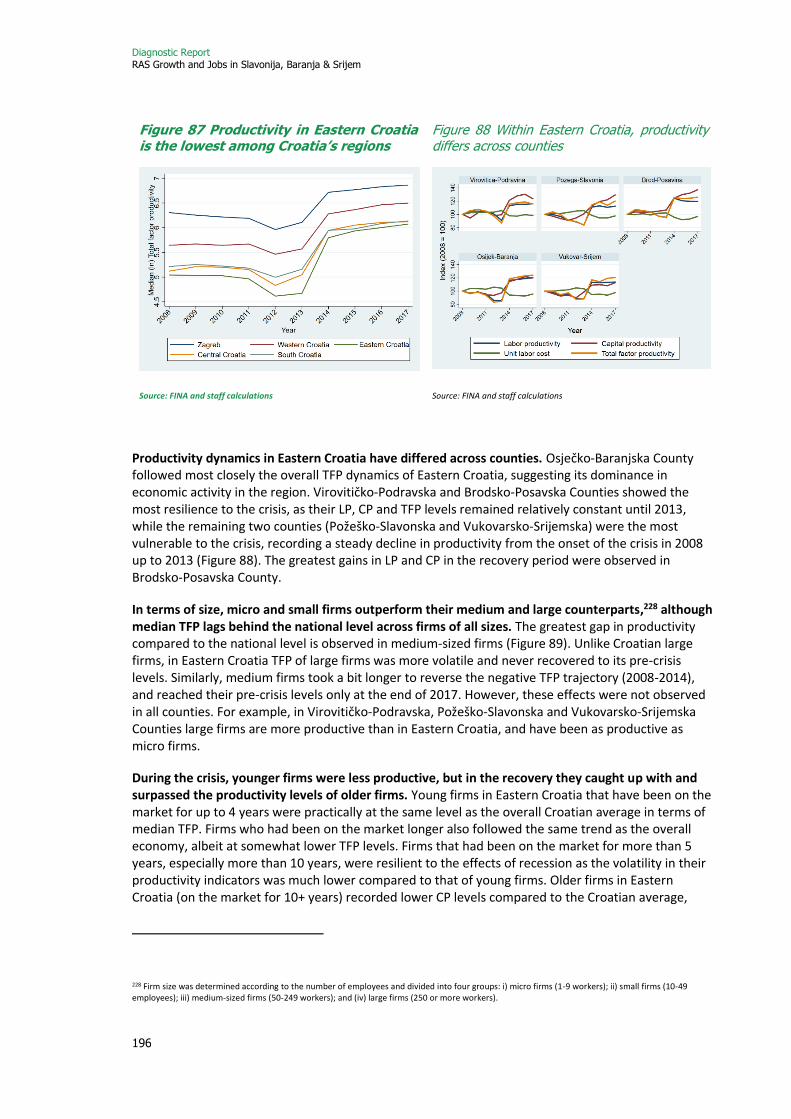
Diagnostic Report RAS Growth and Jobs in Slavonija, Baranja & Srijem
196
Figure 87 Productivity in Eastern Croatia is the lowest among Croatia’s regions
Figure 88 Within Eastern Croatia, productivity differs across counties
Source: FINA and staff calculations Source: FINA and staff calculations
Productivity dynamics in Eastern Croatia have differed across counties. Osječko-Baranjska County followed most closely the overall TFP dynamics of Eastern Croatia, suggesting its dominance in economic activity in the region. Virovitičko-Podravska and Brodsko-Posavska Counties showed the most resilience to the crisis, as their LP, CP and TFP levels remained relatively constant until 2013, while the remaining two counties (Požeško-Slavonska and Vukovarsko-Srijemska) were the most vulnerable to the crisis, recording a steady decline in productivity from the onset of the crisis in 2008 up to 2013 (Figure 88). The greatest gains in LP and CP in the recovery period were observed in Brodsko-Posavska County.
In terms of size, micro and small firms outperform their medium and large counterparts,228 although median TFP lags behind the national level across firms of all sizes. The greatest gap in productivity compared to the national level is observed in medium-sized firms (Figure 89). Unlike Croatian large firms, in Eastern Croatia TFP of large firms was more volatile and never recovered to its pre-crisis levels. Similarly, medium firms took a bit longer to reverse the negative TFP trajectory (2008-2014), and reached their pre-crisis levels only at the end of 2017. However, these effects were not observed in all counties. For example, in Virovitičko-Podravska, Požeško-Slavonska and Vukovarsko-Srijemska Counties large firms are more productive than in Eastern Croatia, and have been as productive as micro firms.
During the crisis, younger firms were less productive, but in the recovery they caught up with and surpassed the productivity levels of older firms. Young firms in Eastern Croatia that have been on the market for up to 4 years were practically at the same level as the overall Croatian average in terms of median TFP. Firms who had been on the market longer also followed the same trend as the overall economy, albeit at somewhat lower TFP levels. Firms that had been on the market for more than 5 years, especially more than 10 years, were resilient to the effects of recession as the volatility in their productivity indicators was much lower compared to that of young firms. Older firms in Eastern Croatia (on the market for 10+ years) recorded lower CP levels compared to the Croatian average,
228 Firm size was determined according to the number of employees and divided into four groups: i) micro firms (1-9 workers); ii) small firms (10-49 employees); iii) medium-sized firms (50-249 workers); and (iv) large firms (250 or more workers).

Diagnostic Report RAS Growth and Jobs in Slavonija, Baranja & Srijem
197
especially in the recovery phase from 2015 onwards. Virovitičko-Podravska County recorded the highest decline in CP in the 2008-13 period, which was then followed by the highest increase in this indicator (about 50 percentage points). Middle-aged firms recorded another peculiarity in Brodsko-Posavska and Vukovarsko-Srijemska Counties -decreasing ULC and increasing CP in the whole analyzed period, suggesting high levels of labor-to-capital substitution.
Figure 89 Micro and small firms are more productive than medium and large firms, with some exceptions
Source: FINA and staff calculations
Firms in knowledge-intensive services (KIS) outperform their less knowledge-intensive counterparts (LKIS), a phenomenon which was also observed at the national level. Firms in Eastern Croatia followed the same trend as the overall economy, but at lower TFP levels in all service sub-sectors. The story is similar at the county level, as LKIS firms fare worse than KIS firms. Brodsko-Posavska and Osječko-Baranjska Counties show a very clear distinction between KIS and LKIS firms with median TFP levels at about the same level. Vukovarsko-Srijemska and Virovitičko-Podravska Counties started off with higher TFP levels in other KIS firms compared to high-technology KIS firms, but the latter eventually caught up and had roughly the same TFP levels at the end of the observed period.
High-technology manufacturing firms outperform medium and low-technology firms in all productivity metrics, though in Eastern Croatia high-tech firms are less productive than the national average. In Eastern Croatia, high-technology manufacturing firms recorded a greater drop in LP and TFP in 2008-15, but bounced back to pre-crisis levels in 2014 and surpassed them by 20 percent during the recovery phase. ULC were also considerably higher in Eastern Croatia, as was CP. A clear distinction between high-, medium- and low-technology firms in terms of median TFP is evident only in Osječko-Baranjska and Brodsko-Posavska Counties. In Vukovarsko-Srijemska and Požeško-Slavonska Counties, the TFP levels of high-technology and medium-technology firms are very similar and there is no clear distinction between them.
The ICT industry is the most productive of the key industries in Eastern Croatia, followed by tourism, metal processing, wood, and food (Figure 90). However, the ICT, tourism and wood industries are somewhat less productive than the national average, while the food industry recorded higher levels of TFP. The tourism and wood industries experienced a mild drop in TFP figures in the 2008-12 period but

Diagnostic Report RAS Growth and Jobs in Slavonija, Baranja & Srijem
198
bounced back after 2013 and have surpassed their pre-crisis levels. Although food and metal processing are among the less productive industries, they were also more resilient to the prolonged recession. Conversely, the wood industry was more volatile in terms of overall productivity. Productivity in ICT, food, wood and metal processing are very homogeneous across all counties, while median TFP in tourism was the highest in Požeško-Slavonska County.
Figure 90 ICT industries are the most productive, though less than at the national level
Source: FINA and staff calculations
1.2. Investment in R&D
Very few firms in Eastern Croatia invest in R&D and innovation, reflecting nationwide difficulties in undertaking knowledge investments. Less than 1 percent of firms invest in R&D, mainly due to missing skills and lack of financing. Investment in innovation is further discouraged by underdeveloped regional innovation conditions, such as a lack of leading (highly ranked) public R&D institutions which could provide high-quality knowledge assistance and technology services, and also insufficiently skilled human capital (see Božić and Rajh, 2016). Firms rely on external R&D and technology acquisition and are more inclined to adopt external innovation and/or engage in incremental innovation activities (Bačić and Aralica, 2017).
Although a high percentage of firms declare themselves to be innovative, most of this innovation activity relates to incremental innovation and the adoption of new technologies and equipment. According to an innovation survey (2008-10), in Central-Eastern Croatia (Eastern Croatia plus Bjelovarsko-Bilogorska County) 40 percent of firms are considered to be innovative (engaging in innovation activities). The same share of innovative firms was observed in the Adriatic coastal region, but this region outperforms Eastern Croatia in terms of value added per employee (38 percent). Eastern Croatia also had the lowest number of patent applications per 100,000 inhabitants in 2015.
Firms barely invest in or commercialize intangible assets or other forms of intellectual property (Table 16). Only 10 percent of firms have other forms of intangible assets (concessions, licensing of patents, trademarks, software rights and other intellectual assets), which is below the national
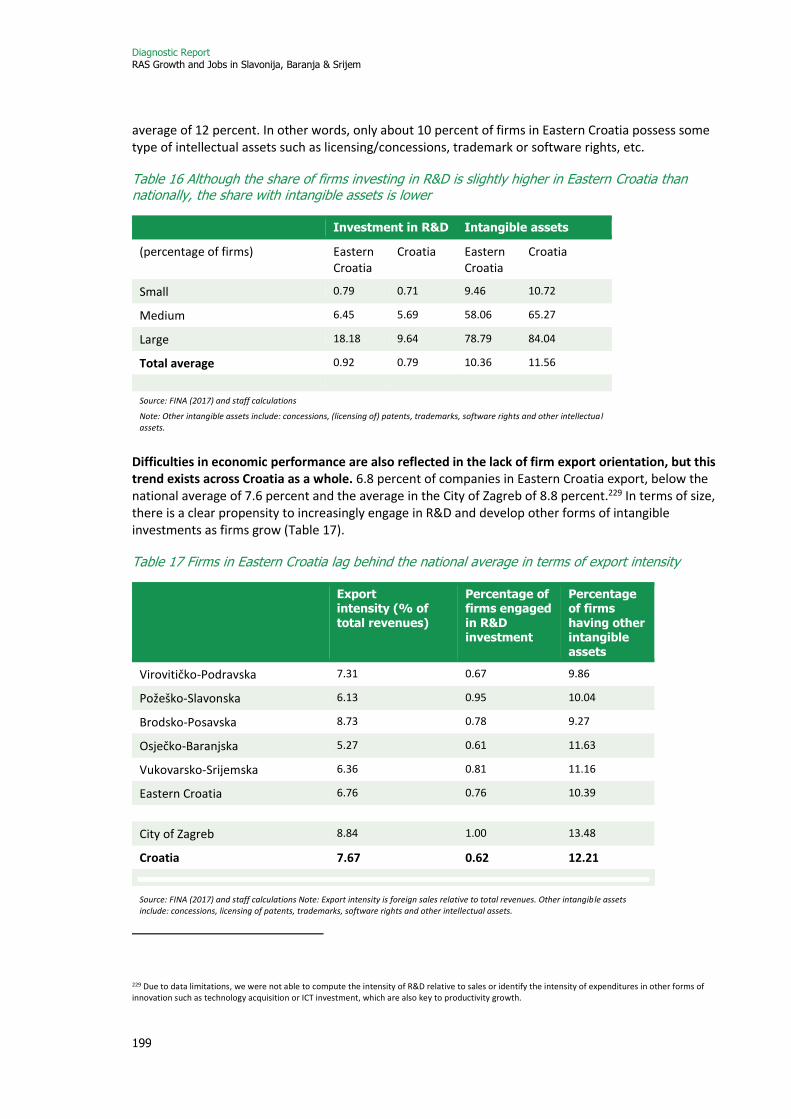
Diagnostic Report RAS Growth and Jobs in Slavonija, Baranja & Srijem
199
average of 12 percent. In other words, only about 10 percent of firms in Eastern Croatia possess some type of intellectual assets such as licensing/concessions, trademark or software rights, etc.
Table 16 Although the share of firms investing in R&D is slightly higher in Eastern Croatia than nationally, the share with intangible assets is lower
Investment in R&D Intangible assets
(percentage of firms) Eastern Croatia
Croatia Eastern Croatia
Croatia
Small 0.79 0.71 9.46 10.72
Medium 6.45 5.69 58.06 65.27
Large 18.18 9.64 78.79 84.04
Total average 0.92 0.79 10.36 11.56
Source: FINA (2017) and staff calculations
Note: Other intangible assets include: concessions, (licensing of) patents, trademarks, software rights and other intellectual assets.
Difficulties in economic performance are also reflected in the lack of firm export orientation, but this trend exists across Croatia as a whole. 6.8 percent of companies in Eastern Croatia export, below the national average of 7.6 percent and the average in the City of Zagreb of 8.8 percent.229 In terms of size, there is a clear propensity to increasingly engage in R&D and develop other forms of intangible investments as firms grow (Table 17).
Table 17 Firms in Eastern Croatia lag behind the national average in terms of export intensity
Export intensity (% of total revenues)
Percentage of firms engaged in R&D investment
Percentage of firms having other intangible assets
Virovitičko-Podravska 7.31 0.67 9.86
Požeško-Slavonska 6.13 0.95 10.04
Brodsko-Posavska 8.73 0.78 9.27
Osječko-Baranjska 5.27 0.61 11.63
Vukovarsko-Srijemska 6.36 0.81 11.16
Eastern Croatia 6.76 0.76 10.39
City of Zagreb 8.84 1.00 13.48
Croatia 7.67 0.62 12.21
Source: FINA (2017) and staff calculations Note: Export intensity is foreign sales relative to total revenues. Other intangible assets include: concessions, licensing of patents, trademarks, software rights and other intellectual assets.
229 Due to data limitations, we were not able to compute the intensity of R&D relative to sales or identify the intensity of expenditures in other forms of innovation such as technology acquisition or ICT investment, which are also key to productivity growth.

Diagnostic Report RAS Growth and Jobs in Slavonija, Baranja & Srijem
200
Despite this challenging context, Eastern Croatia possesses valuable endowments that could be leveraged through innovation, technology modernization, and upgrading business models and organizational practices. The existing strong regional value chain that includes agriculture and traditional low-technology industries could be expanded onto global markets. In these types of industries, the need for technological upgrades is met mainly through external R&D acquisition and adoption of foreign technology. Through research and innovation, agriculture firms could acquire new competences, new products with higher value added, and new market niches (e.g. healthy and organic food). The industrial sector could also be strengthened to better integrate into value chains (both regional and global) in areas such as the food processing, metal-mechanics and automotive industries, and new product markets could be developed based on existing industrial strengths and new knowledge and technological applications.
1.3. Skills for Innovation
Eastern Croatia currently suffers from a shortage of skills at both university and professional (technical) levels due to outmigration and declining enrollment numbers. This is becoming critical as young people and university graduates continue to leave the region while new funding programs for research and innovation are being deployed. The number of university undergraduates has nearly doubled over the last decade, but this trend started reversing in 2013 (Figure 91). In 2017/2018 the number of students at the University of Osijek declined by almost 800 compared to 2013/2014, and is expected to decline further. This trend is also evident in all universities in Croatia. As a result of declining enrollment, the number of undergraduates is also contracting, in spite of efforts to improve completion rates. In 2017, there was a total of 4,156 university graduates, whereas in 2011 this figure reached 4,288.
The share of the population with higher education degrees in Eastern Croatia remains low. Only 11.6 percent of the population has higher education degrees, well below the national average of 18 percent. According to a study conducted by Bačić and Aralica (2017), the four southernmost counties in Dalmatia (Traditional Coastal Region) have the highest number of graduates per 100,000 inhabitants, followed by the five Central Croatian counties (Metropolitan Region) and the northern coastal region (Table 18). The remaining continental counties, including those in Eastern Croatia, have the lowest number of graduates. In addition, higher education institutions are still weakly aligned with regional needs despite higher enrollment quotas in fields with skills shortages. Moreover, given that many graduates leave the region due to low salaries and a lack of jobs, there is currently a significant shortage of skills in the private
sector.
Figure 91 The number of students completing
higher education in Eastern Croatia has been declining
Source: Croatian Bureau of Statistics.
3000
8000
13000
18000
23000
28000
33000
38000
0
1000
2000
3000
4000
5000
6000
7000
2011 2012 2013 2014 2015 2016 2017
Nu
mb
er o
f st
ud
ents
wit
h h
igh
er e
du
cati
on
Osijek-Baranja Vukovar-Srijem
Virovitica-Podravina Pozega-Slavonia
Brod-Posavina Zagreb
Croatia (rhs)
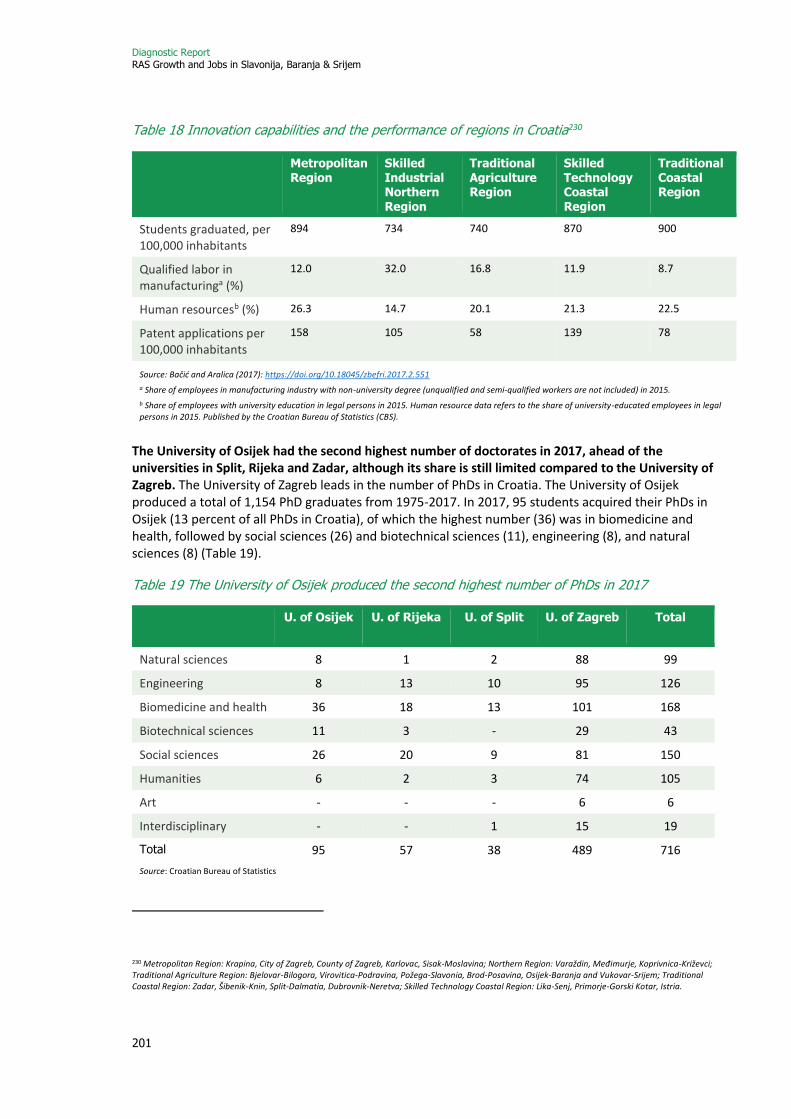
Diagnostic Report RAS Growth and Jobs in Slavonija, Baranja & Srijem
201
Table 18 Innovation capabilities and the performance of regions in Croatia230
Metropolitan Region
Skilled Industrial Northern Region
Traditional Agriculture Region
Skilled Technology Coastal Region
Traditional Coastal Region
Students graduated, per 100,000 inhabitants
894 734 740 870 900
Qualified labor in manufacturinga (%)
12.0 32.0 16.8 11.9 8.7
Human resourcesb (%) 26.3 14.7 20.1 21.3 22.5
Patent applications per 100,000 inhabitants
158 105 58 139 78
Source: Bačić and Aralica (2017): https://doi.org/10.18045/zbefri.2017.2.551
a Share of employees in manufacturing industry with non-university degree (unqualified and semi-qualified workers are not included) in 2015.
b Share of employees with university education in legal persons in 2015. Human resource data refers to the share of university-educated employees in legal persons in 2015. Published by the Croatian Bureau of Statistics (CBS).
The University of Osijek had the second highest number of doctorates in 2017, ahead of the universities in Split, Rijeka and Zadar, although its share is still limited compared to the University of Zagreb. The University of Zagreb leads in the number of PhDs in Croatia. The University of Osijek produced a total of 1,154 PhD graduates from 1975-2017. In 2017, 95 students acquired their PhDs in Osijek (13 percent of all PhDs in Croatia), of which the highest number (36) was in biomedicine and health, followed by social sciences (26) and biotechnical sciences (11), engineering (8), and natural sciences (8) (Table 19).
Table 19 The University of Osijek produced the second highest number of PhDs in 2017
U. of Osijek U. of Rijeka U. of Split U. of Zagreb Total
Natural sciences 8 1 2 88 99
Engineering 8 13 10 95 126
Biomedicine and health 36 18 13 101 168
Biotechnical sciences 11 3 - 29 43
Social sciences 26 20 9 81 150
Humanities 6 2 3 74 105
Art - - - 6 6
Interdisciplinary - - 1 15 19
Total 95 57 38 489 716
Source: Croatian Bureau of Statistics
230 Metropolitan Region: Krapina, City of Zagreb, County of Zagreb, Karlovac, Sisak-Moslavina; Northern Region: Varaždin, Međimurje, Koprivnica-Križevci; Traditional Agriculture Region: Bjelovar-Bilogora, Virovitica-Podravina, Požega-Slavonia, Brod-Posavina, Osijek-Baranja and Vukovar-Srijem; Traditional Coastal Region: Zadar, Šibenik-Knin, Split-Dalmatia, Dubrovnik-Neretva; Skilled Technology Coastal Region: Lika-Senj, Primorje-Gorski Kotar, Istria.
Diagnostic Report RAS Growth and Jobs in Slavonija, Baranja & Srijem
202
1.4. Business Dynamics and Entrepreneurship
Eastern Croatia suffers from weak entrepreneurial activity, which puts a drag on the overall regional productivity level. According to the Global Entrepreneurship Monitor (GEM) 2016, the regions of Lika, Banovina, and Eastern Croatia recorded the lowest rates of business venture start-up activity, whereas the highest rates were recorded in Istria, Primorje, Gorski Kotar, and Dalmatia (Figure 92 and Figure 93). The latter also recorded the highest indicator of starting entrepreneurial ventures because of perceived opportunity, as opposed to necessity-driven entrepreneurship (see TEA Opportunity Index).231 Eastern Croatia ranked just above Lika and Banovina in this indicator.
The contribution of firm dynamism to productivity growth in Croatia is surprisingly negative – the entry effect is typically positive. According to a recent study (Aprahamian and Correa, 2015), Croatia overall suffers from inefficiency in business dynamics and this is reflected in productivity performance. The study found that net firm entry has a net negative effect on productivity growth; and this seems more pronounced in continental region firms (as opposed to those in coastal regions) and firms in the services sector (except for knowledge-intensive services). The negative contribution of net entry suggests that the creative destruction process in Croatia is inefficient, as the market might be eliminating firms that are potentially productive, or conversely preventing the entry of more efficient firms. The lack of entrepreneurship and the weak capacity of the private sector to renew itself is, however, a country-level issue, as unproductive firms in Croatia linger in the market (ibid).
Entrepreneurial activity has been declining in Croatia since 2013, contrary to average worldwide and EU trends. According to the TEA Index, entrepreneurial activity in Croatia has been declining by an average of 8 percent annually from 2013-2015. Data on users of grants for self-employment also confirmed the decline of interest in starting business ventures, as the number of grant users decreased by 31 percent in 2015 compared to 2014 (CEPOR 2017). This situation is related to an unfavorable business environment, especially business establishment and financial constraints, as well as cultural factors (risk aversion), and the general deterioration of the economic context.
231 TEA stands for Total Entrepreneurial Activity, as defined by GEM (see CEPOR, 2017). The TEA index represents the number of entrepreneurially active people per 100 examinees that are 18-64 years old, and combines the number of people that are trying to start an entrepreneurial venture and the number of owners or owners/managers of enterprises under 42 months old.

Diagnostic Report RAS Growth and Jobs in Slavonija, Baranja & Srijem
203
Figure 92 Business venture start-up activity in Eastern Croatia has been declining since 2013…
Figure 93… and the region is ranked the lowest in Croatia in terms of entrepreneurship
Source: GEM Croatia, CEPOR – SMEs and Entrepreneurship Policy Center, 2016
1.5. General Business Context Conditions
Business environment conditions in Eastern Croatia reflect nationwide issues. Firms are discouraged from undertaking innovation activities due to problems in the business framework and environment: (discouraging) regulations on investment and firm creation (difficulty in starting and closing a business), rigid labor market regulations, and bureaucratic red tape such as lengthy procedures and difficulties in obtaining licenses and in contracting utilities.232
The business environment in Croatia has not shown signs of improvement over the last three years, as measured by the Doing Business rankings. According to Doing Business 2019, Croatia ranked 58th
overall, seven places below its 2017 ranking and eighteen places below its 2015 ranking. Croatia also scores behind peers such as Hungary and the Czech Republic, and the ECA regional average in terms of ease of doing business. Starting a business and dealing with construction permits are the most problematic areas (ranked 123rd and 159th respectively), followed by paying taxes and getting credit (89th and 85th). Access to finance remains a key constraint despite more intensive policy efforts in this domain and the availability of new structural funds.
232 To have a good understanding of the impact that the general business environment has on innovation, see ‘The Innovation Paradox’, Cirera and Maloney, World Bank Group, 2017.
0
5
10
15
2011 2012 2013 2014 2015
Tota
l En
trep
ren
eurs
hip
Act
ivit
y (p
erce
nt)
Istria, Primorje-Gorski Kotar Zagreb AreaDalmatia Northern CroatiaLika and Banovina Slavonia and Baranja
6. Eastern Croatia
6. Eastern Croatia
5. Northern Croatia
4. Northern Croatia
4. Lika and Banovina
5. Lika and Banovina
3. Dalmatia
2. Dalmatia2. Istria, Primorje-Gorski Kotar
1. Istria, Primorje-Gorski Kotar
1. Zagreb Area
3. Zagreb Area
2011 2012 2013 2014 2015
TEA regional rankings
Diagnostic Report RAS Growth and Jobs in Slavonija, Baranja & Srijem
204
2. Utilization of ESIF Funds for R&D and Innovation
Key Insights
• Absorption of the existing ESIF allocation is low in Eastern Croatia.
• Improvements are needed in three main areas:
− Design: Due to insufficient coordination with regional stakeholders, the programs do not adequately respond to the needs and capacities of the region;
− Implementation: Programs are encumbered with administrative burdens, lack of transparency, and slow evaluation;
− Governance: Regional authorities can play a strong role and contribute to the effective use of funding.
Most of the funding aimed at supporting research and innovation comes from the Operational Program for Competitiveness and Cohesion (OPCC 2014),233 but the policy mix is in need of improvement. The whole funding block is divided between the MoEEC and the MoSE, the same as the overall innovation agenda. Thematic Objectives (TO) 1 and 3 of the OPCC consist of a number of programs aimed at stimulating RDI. However, when it comes to absorption, some programs are more successful than others. The funding anticipated is substantial and could be the driver of converging with the Europe 2020 target of 1.4 percent R&D intensity, but this is not happening, among other reasons, due to the burdensome procedures associated with the policy mix and a lack of adaptability to regional demands.
Institutional failures and insufficient administration capacity at the national level have undermined the attractiveness and effectiveness of programs, contributing to the low absorption of EU funds in Eastern Croatia. Weak participation in ESIF funds in Eastern Croatia is structural and occurs in all OPs, which shows that Croatia is still facing serious difficulties in deploying administration and delivery capacity. Institutional barriers that still prevail include: administrative burdens, lack of transparency, and lengthy grant review processes, among others. Slow implementation has been related to changes in government leadership and in the institutional setting, a high turnover of administrative staff whose expertise takes time to build, and the lack of tradition and expertise in policy coordination (Malekovic et al., 2018). Concurring factors causing underperformance in R&I capabilities include: institutional and administrative deficiencies (in the design and implementation of programs), a policy approach more oriented towards the promotion of technology-based innovation, and governance deficiencies prevailing at both central and regional level. Evidence shows that the effectiveness of national (and supranational) policies and the use of EU-funded innovation programs are also constrained by asymmetric conditions in the regions in terms of innovation capabilities (Rodriguez-Pose and Wilkie, 2016).
The insufficient involvement of regional authorities in the initial conception of programs and their implementation has also been a contributing factor. Steps have been made to improve horizontal and
233 https://strukturnifondovi.hr/wp-content/uploads/2017/03/OPKK_eng-1.pdf
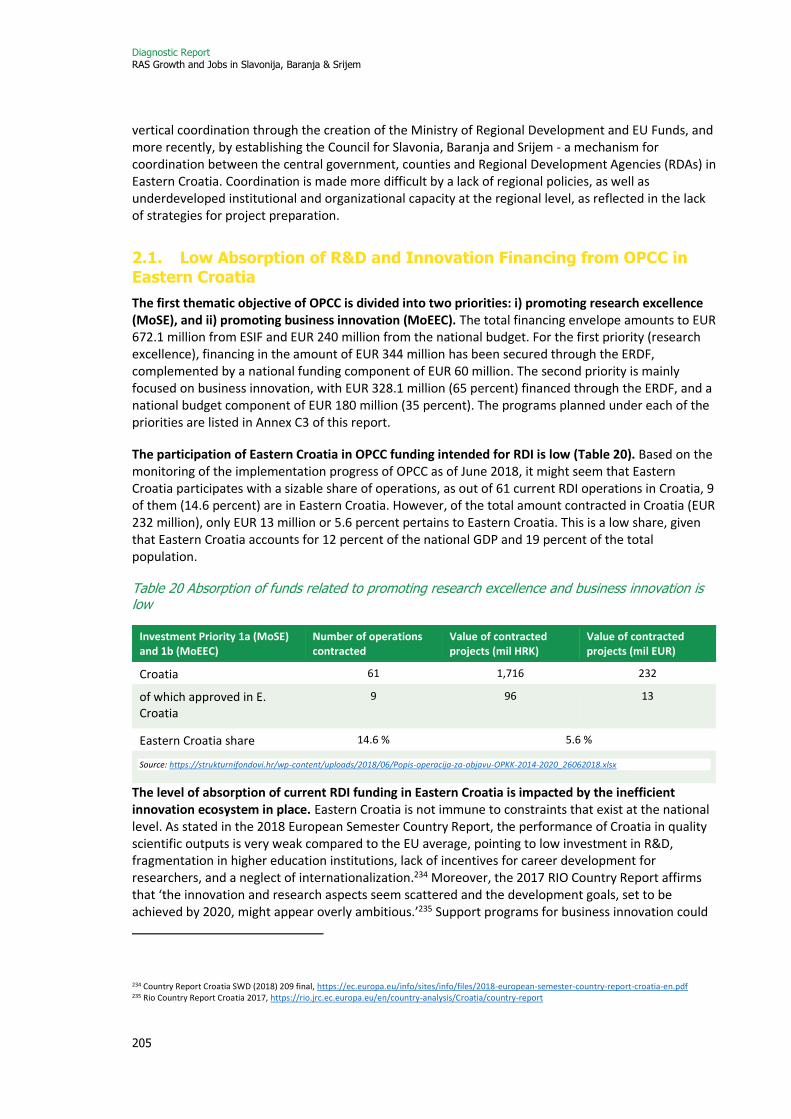
Diagnostic Report RAS Growth and Jobs in Slavonija, Baranja & Srijem
205
vertical coordination through the creation of the Ministry of Regional Development and EU Funds, and more recently, by establishing the Council for Slavonia, Baranja and Srijem - a mechanism for coordination between the central government, counties and Regional Development Agencies (RDAs) in Eastern Croatia. Coordination is made more difficult by a lack of regional policies, as well as underdeveloped institutional and organizational capacity at the regional level, as reflected in the lack of strategies for project preparation.
2.1. Low Absorption of R&D and Innovation Financing from OPCC in Eastern Croatia
The first thematic objective of OPCC is divided into two priorities: i) promoting research excellence (MoSE), and ii) promoting business innovation (MoEEC). The total financing envelope amounts to EUR 672.1 million from ESIF and EUR 240 million from the national budget. For the first priority (research excellence), financing in the amount of EUR 344 million has been secured through the ERDF, complemented by a national funding component of EUR 60 million. The second priority is mainly focused on business innovation, with EUR 328.1 million (65 percent) financed through the ERDF, and a national budget component of EUR 180 million (35 percent). The programs planned under each of the priorities are listed in Annex C3 of this report.
The participation of Eastern Croatia in OPCC funding intended for RDI is low (Table 20). Based on the monitoring of the implementation progress of OPCC as of June 2018, it might seem that Eastern Croatia participates with a sizable share of operations, as out of 61 current RDI operations in Croatia, 9 of them (14.6 percent) are in Eastern Croatia. However, of the total amount contracted in Croatia (EUR 232 million), only EUR 13 million or 5.6 percent pertains to Eastern Croatia. This is a low share, given that Eastern Croatia accounts for 12 percent of the national GDP and 19 percent of the total population.
Table 20 Absorption of funds related to promoting research excellence and business innovation is low
Investment Priority 1a (MoSE) and 1b (MoEEC)
Number of operations contracted
Value of contracted projects (mil HRK)
Value of contracted projects (mil EUR)
Croatia 61 1,716 232
of which approved in E. Croatia
9 96 13
Eastern Croatia share 14.6 % 5.6 % 5.6 %
Source: https://strukturnifondovi.hr/wp-content/uploads/2018/06/Popis-operacija-za-objavu-OPKK-2014-2020_26062018.xlsx
The level of absorption of current RDI funding in Eastern Croatia is impacted by the inefficient innovation ecosystem in place. Eastern Croatia is not immune to constraints that exist at the national level. As stated in the 2018 European Semester Country Report, the performance of Croatia in quality scientific outputs is very weak compared to the EU average, pointing to low investment in R&D, fragmentation in higher education institutions, lack of incentives for career development for researchers, and a neglect of internationalization.234 Moreover, the 2017 RIO Country Report affirms that ‘the innovation and research aspects seem scattered and the development goals, set to be achieved by 2020, might appear overly ambitious.’235 Support programs for business innovation could
234 Country Report Croatia SWD (2018) 209 final, https://ec.europa.eu/info/sites/info/files/2018-european-semester-country-report-croatia-en.pdf 235 Rio Country Report Croatia 2017, https://rio.jrc.ec.europa.eu/en/country-analysis/Croatia/country-report

Diagnostic Report RAS Growth and Jobs in Slavonija, Baranja & Srijem
206
benefit from improvement of the design and implementation arrangements. The best evidence for this is the lack of results of the Croatian innovation system, despite the availability of significant funding. To address this, revisiting the policy mix for RDI might be considered, but also adjusting the implementation arrangements to local circumstances, and allowing regional bodies to play a stronger role in the spending of EU funds.
2.2. Low absorption of SME competitiveness funds from OPCC in Eastern Croatia
Financing for innovation as part of OPCC is also available under the SME competitiveness component. Investment priorities under this thematic objective include facilitating the economic use of new ideas and supporting the capacity of SMEs to grow and engage in innovation processes. The overall funds earmarked for investment in enhancing the competitiveness of SMEs amounts to EUR 648.5 million plus financial instruments in the amount of EUR 340 million.
The absorption of funds for competitiveness by SMEs in Eastern Croatia is low, which indicates that there are inefficiencies in the administration of funds, but also that the current policy design might not be suited to the specific needs of firms in the region. Of over 1 billion euros of approved operations, only 7.8 percent are located in Eastern Croatia (Table 21). This low share implies that the capacity of SMEs to absorb business development grants is low and may mean that the grant delivery mechanism is inadequate for SMEs in Eastern Croatia. The effectiveness of matching grants is likely to be dampened by the current administrative and institutional context, which lacks preconditions for effective grant administration. Common obstacles hindering grant implementation include insufficient capacity for business planning, timely review and evaluation of applications, lack of financial and legal expertise, and lack of internationalization strategies.
Table 21 Absorption of funds for innovation in SMEs is also low
TO3 ‘Enhancing the competitiveness of SMEs’
Number of operations Amount (mil HRK) Amount (mil EUR)
Croatia 1,768 8,084 1,092
of which approved in E. Croatia
338 633 86
E. Croatia share 19.1 % 7.8 % 7.8 %
Source: https://strukturnifondovi.hr/wp-content/uploads/2018/06/Popis-operacija-za-objavu-OPKK-2014-2020_26062018.xlsx

Diagnostic Report RAS Growth and Jobs in Slavonija, Baranja & Srijem
207
3. Public Sector Institutions and their Role in Regional Innovation
Key Insights
• The University of Josip Juraj Strossmayer in Osijek and the Institute of Agriculture have some R&D capabilities but are still not internationally competitive.
• PROs are facing staffing restrictions, limited R&D budgets, and weak internationalization.
• Scientific productivity has been improving but is still low compared to the rest of Croatia. Collaboration with the private sector is insufficient and project preparation support is very much needed.
• Several polytechnics also contribute to the education of new professionals.
Public research organizations (PROs) and technology centers are important sources of technological solutions for the private sector. They are a source of technology, knowledge spillovers, and also provide specialized training and advanced human resources. Universities and polytechnics (higher education institutions - HEIs) are key drivers of regional development and catalysts of innovation through the provision of highly-skilled labor, research, knowledge transfer, and academic entrepreneurship.
Innovative activities in Croatia are mostly concentrated in economically advanced parts of the country. These areas benefit from more skilled human capital and more advanced technological infrastructure. Developed areas also have a higher concentration of public organizations and private firms, and benefit from the positive externalities associated with co-location and agglomeration. In contrast, lagging regions are typically less innovative. The majority of PROs performing R&I, including the leadership of the recently established centers of excellence, are located in the capital Zagreb, while only a few are located in Rijeka, Split and Osijek.
R&D and innovation-related activities in the public sector in Eastern Croatia are rather limited, and there are only a few PROs with strong research capabilities. Out of 182 scientific organizations registered in Croatia, only seven236 are registered in Eastern Croatia. Two more R&D centers are expected to be established in Virovitica in the near future. Osijek, the largest city in Eastern Croatia, hosts several PROs involved in R&I: the University of Josip Juraj Strossmayer, the Institute of Agriculture, and the Institute for Seed and Seedlings (one of the four institutes under the umbrella of the Croatian Center for Agriculture, Food and Rural Affairs). The University also has an off-campus Faculty of Mechanical Engineering located in Slavonski Brod. The Croatian Veterinary Institute has a branch in Vinkovci, though its R&D activities are limited. The University and Institute of Agriculture in Osijek (one of 25 public research institutes in Croatia) have the strongest research and development capabilities among PROs in Eastern Croatia that could potentially generate innovation, from the development of new procedures or methods to novel technologies. Their contribution to regional innovation could be leveraged by providing skills that are in demand, supporting entrepreneurial development, and enabling strategic knowledge collaboration, including provision of engineering and
236 One public university, one public research institute, three polytechnics, one community college and one center of competence.
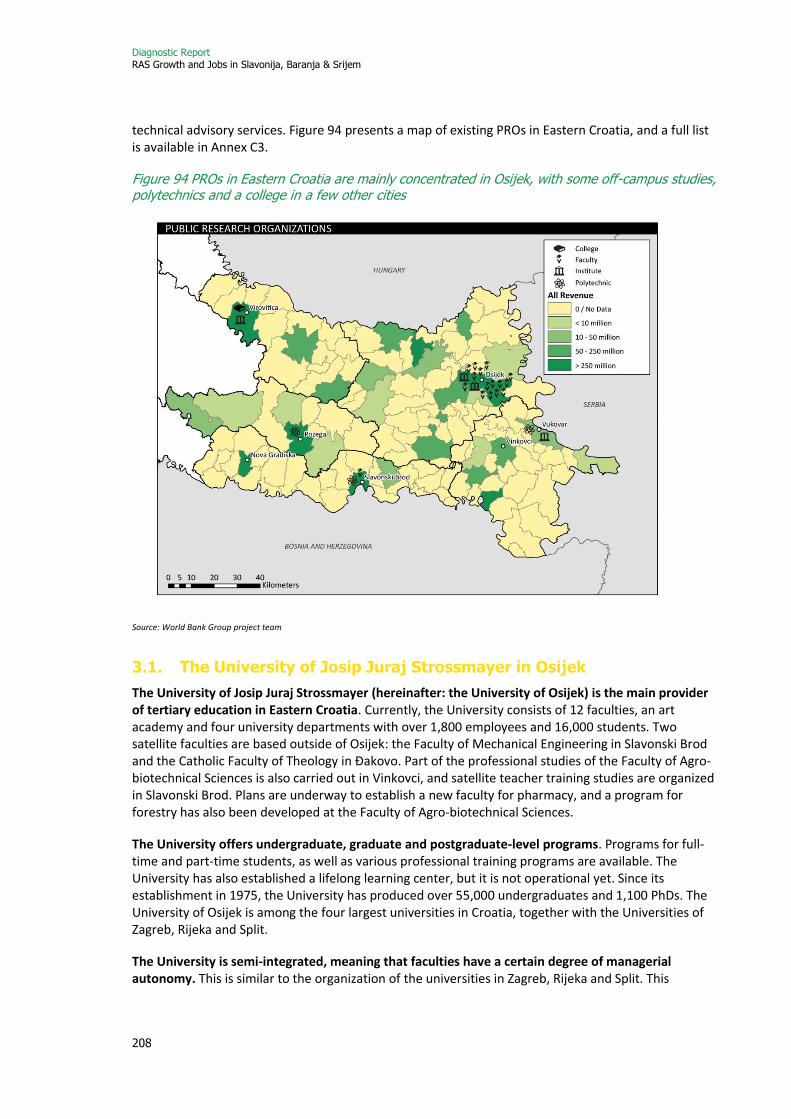
Diagnostic Report RAS Growth and Jobs in Slavonija, Baranja & Srijem
208
technical advisory services. Figure 94 presents a map of existing PROs in Eastern Croatia, and a full list is available in Annex C3.
Figure 94 PROs in Eastern Croatia are mainly concentrated in Osijek, with some off-campus studies, polytechnics and a college in a few other cities
Source: World Bank Group project team
3.1. The University of Josip Juraj Strossmayer in Osijek
The University of Josip Juraj Strossmayer (hereinafter: the University of Osijek) is the main provider of tertiary education in Eastern Croatia. Currently, the University consists of 12 faculties, an art academy and four university departments with over 1,800 employees and 16,000 students. Two satellite faculties are based outside of Osijek: the Faculty of Mechanical Engineering in Slavonski Brod and the Catholic Faculty of Theology in Đakovo. Part of the professional studies of the Faculty of Agro-biotechnical Sciences is also carried out in Vinkovci, and satellite teacher training studies are organized in Slavonski Brod. Plans are underway to establish a new faculty for pharmacy, and a program for forestry has also been developed at the Faculty of Agro-biotechnical Sciences.
The University offers undergraduate, graduate and postgraduate-level programs. Programs for full-time and part-time students, as well as various professional training programs are available. The University has also established a lifelong learning center, but it is not operational yet. Since its establishment in 1975, the University has produced over 55,000 undergraduates and 1,100 PhDs. The University of Osijek is among the four largest universities in Croatia, together with the Universities of Zagreb, Rijeka and Split.
The University is semi-integrated, meaning that faculties have a certain degree of managerial autonomy. This is similar to the organization of the universities in Zagreb, Rijeka and Split. This
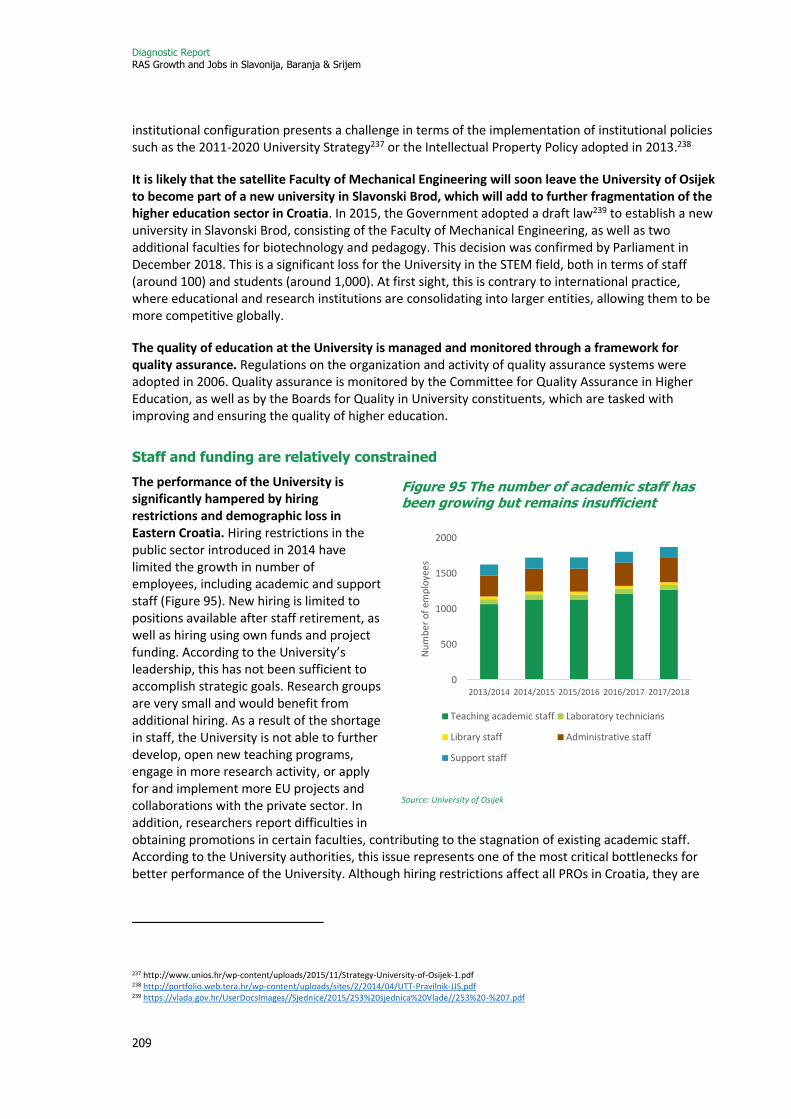
Diagnostic Report RAS Growth and Jobs in Slavonija, Baranja & Srijem
209
institutional configuration presents a challenge in terms of the implementation of institutional policies such as the 2011-2020 University Strategy237 or the Intellectual Property Policy adopted in 2013.238
It is likely that the satellite Faculty of Mechanical Engineering will soon leave the University of Osijek to become part of a new university in Slavonski Brod, which will add to further fragmentation of the higher education sector in Croatia. In 2015, the Government adopted a draft law239 to establish a new university in Slavonski Brod, consisting of the Faculty of Mechanical Engineering, as well as two additional faculties for biotechnology and pedagogy. This decision was confirmed by Parliament in December 2018. This is a significant loss for the University in the STEM field, both in terms of staff (around 100) and students (around 1,000). At first sight, this is contrary to international practice, where educational and research institutions are consolidating into larger entities, allowing them to be more competitive globally.
The quality of education at the University is managed and monitored through a framework for quality assurance. Regulations on the organization and activity of quality assurance systems were adopted in 2006. Quality assurance is monitored by the Committee for Quality Assurance in Higher Education, as well as by the Boards for Quality in University constituents, which are tasked with improving and ensuring the quality of higher education.
Staff and funding are relatively constrained
The performance of the University is significantly hampered by hiring restrictions and demographic loss in Eastern Croatia. Hiring restrictions in the public sector introduced in 2014 have limited the growth in number of employees, including academic and support staff (Figure 95). New hiring is limited to positions available after staff retirement, as well as hiring using own funds and project funding. According to the University’s leadership, this has not been sufficient to accomplish strategic goals. Research groups are very small and would benefit from additional hiring. As a result of the shortage in staff, the University is not able to further develop, open new teaching programs, engage in more research activity, or apply for and implement more EU projects and collaborations with the private sector. In addition, researchers report difficulties in obtaining promotions in certain faculties, contributing to the stagnation of existing academic staff. According to the University authorities, this issue represents one of the most critical bottlenecks for better performance of the University. Although hiring restrictions affect all PROs in Croatia, they are
237 http://www.unios.hr/wp-content/uploads/2015/11/Strategy-University-of-Osijek-1.pdf 238 http://portfolio.web.tera.hr/wp-content/uploads/sites/2/2014/04/UTT-Pravilnik-JJS.pdf 239 https://vlada.gov.hr/UserDocsImages//Sjednice/2015/253%20sjednica%20Vlade//253%20-%207.pdf
Figure 95 The number of academic staff has been growing but remains insufficient
Source: University of Osijek
0
500
1000
1500
2000
2013/2014 2014/2015 2015/2016 2016/2017 2017/2018
Nu
mb
er o
f em
plo
yees
Teaching academic staff Laboratory technicians
Library staff Administrative staff
Support staff

Diagnostic Report RAS Growth and Jobs in Slavonija, Baranja & Srijem
210
especially detrimental to the growth of the University of Osijek, which is also adversely affected by the significant outmigration of highly educated people.
The University budget has increased slightly over the last five years and is mostly allocated to salaries. It has increased by 9.5 percent in nominal terms since 2013. In 2017/2018, the University budget was HRK 542 million. The increase in the total revenue is mostly due to an increase in the budget allocation from the state for staff salaries. Staff salaries are the largest expense item and are covered by the national budget.
R&D activities are underfunded at faculties important for the development of the strategic sectors in Eastern Croatia. In 2017, the R&D budget of the Faculty of Agro-biotechnical Sciences was 6 percent of its total budget (Figure 96), and was even lower at the Faculty of Electrical Engineering, Computer Science and IT (FERIT, 4.2 percent, Figure 97). Moreover, the R&D budget of the Faculty of Agro-biotechnical Sciences has decreased by 25 percent since 2013. These faculties are found to be most productive in terms of scientific publications, applications for competitive funding, and collaboration with the private sector, and this should be further stimulated with an increased R&D budget. In addition, to maximize the utilization of funds available for R&D, faculties need technical assistance in preparing projects financed through ESIF (or even other sources). The University does not seem to have sufficient administrative staff dedicated to helping researchers to be more productive in ESIF grants applications (see section 0).
Figure 96 The R&D budget at the Faculty of Agro-
biotechnical Sciences has been reduced by 25
percent…
Figure 97 … and while the R&D budget in FERIT has grown, it is still low both in nominal terms and as a percentage of the total budget
Source: Faculty of Agro-biotechnical Sciences, FERIT
The University is mainly financed through institutional (block) funding from the MoSE, but the funding model might become performance-based in the future. The MoSE is in the process of introducing a new model of funding for public universities, which involves performance-based logic. Preparations are underway to decide on the best possible model of performance-based financing to improve the future funding of public universities. The new financing model should strike a balance between block (institutional-fixed) and performance-based funding.
0
2
4
6
8
10
0
1
2
3
4
5
2013 2014 2015 2016 2017
per
cen
t o
f to
tal b
ud
get
HR
K m
illio
ns
R&D budget (MSE) R&D (other sources)
R&D budget (rhs)
0
1
2
3
4
5
0.0
1.0
2.0
3.0
4.0
5.0
2013 2014 2015 2016 2017
per
cen
t o
f to
tal b
ud
get
HR
K m
illio
ns
R&D budget R&D budget (rhs)

Diagnostic Report RAS Growth and Jobs in Slavonija, Baranja & Srijem
211
Enrollment is declining, but the number of STEM students is increasing
The number of students at the University of Osijek has been declining over the last five years (Figure 98). This reflects a national trend of decline in the number of students, and is expected to persist. According to information provided by the Croatian Agency for Higher Education to HEIs, a decline of 4,400 students nationally is expected by 2021. The decline in the number of students has been observed both in STEM and non-STEM programs (Annex C3).
The majority of students at the University of Osijek are enrolled in STEM programs. In the academic year 2017/2018, over 50 percent of students were studying in STEM fields. Over the last five years, enrollment in STEM fields has been increasing, although a negative trend has been recorded in some faculties, such as the Department
of Physics, FERIT, the Faculty of Civil Engineering and Architecture, etc. The University recently launched several new STEM programs, which is a good step forward, as such qualifications are in high demand on the labor market. Most faculties have alumni clubs which monitor the hiring of their graduates. However, the University does not have a centralized tracking system, which would significantly improve enrollment and resource planning.
Research infrastructure is due for improvement
The University’s research infrastructure is unbalanced and needs significant improvements. Some faculties have very modern buildings with state-of-the-art research equipment (e.g. the Faculty of Agro-biotechnical Sciences and Faculty of Medicine), while others either lack their own buildings (the Faculty of Food Technology and Faculty of Law) or are situated in insufficient office and laboratory space (FERIT). The University is preparing projects for ESIF financing to modernize its research infrastructure, including university buildings and research instruments and equipment. The University of Osijek is the only large university in Croatia without an incubator to host spin-off companies, lagging behind other large public universities in Rijeka and Zagreb that have functioning R&D incubators, and the University of Split which was recently awarded an EU grant to build one.
The University lacks a centralized library and multimedia center. Currently, each faculty has its own library. However, the University needs an integrated University library cataloguing/computer system for educational and scientific research purposes, which would act as a single communication center, and provide access to scientific literature for both students and researchers. The University is planning to apply for ESIF funding to build this type of infrastructure in the future.
Figure 98 Number of students at the University of Osijek
Source: University of Osijek
16000
16500
17000
17500

Diagnostic Report RAS Growth and Jobs in Slavonija, Baranja & Srijem
212
Internationalization is weak
The University of Osijek is weakly internationalized, which is reflected in low rates of student and faculty mobility, as well as in terms of international cooperation in education and research. Internationalization of education and research helps raise the quality of programs and research, making them internationally competitive and more attractive, and increases opportunities for mutual learning and networking. When it comes to staff mobility, there were only 67 incoming foreign staff in non-STEM fields and 161 in STEM fields in the period 2015-17. At the same time, outgoing mobility of academic staff was 32 for non-STEM and 121 for STEM areas. Although the University has signed 413 contracts as part of the Erasmus Mobility Program, it has managed to attract only a few international students to study full time at the University. In comparison, the University of Pecs (Hungary), which has similar faculties and is located near Osijek, has over 4,000 international students (20 percent of the student body).
The University aims to attract more international students by introducing programs in foreign languages and improving accommodation conditions. In order to meet the requirements of international students, all faculties have developed programs in English, and 720 courses in foreign languages are available both at undergraduate and graduate level. In 2018, the University received financing for four new teaching programs240 in English and German to be funded by the European Social Fund (ESF). Faculties report that in order to finance new academic programs in foreign languages they need additional financial support from the state budget or other sources of funding. The University is also working on increasing student accommodation capacities, which will significantly contribute towards internationalization efforts.
Internationalization of research activities and collaboration with foreign researchers and institutions should also improve. This is crucial for improving the quality of scientific research and the quality of research proposals for competitive funding. The Croatian diaspora could be instrumental in improving connectivity and leveraging research competences. There are a number of Croatian scientists working at leading academic institutions, who would likely collaborate with Croatian research and academic institutions. For this purpose, Croatia established the Unity Through Knowledge Fund (UKF), a highly competitive and internationally-recognized program that provides funding for collaborative projects between the diaspora and scientists in Croatia. The University of Osijek has obtained funding for only one small UKF program,241 far less than other Croatian research institutions.
More project preparation support is needed
The University Department for EU Projects is underdeveloped and lacks resources for project preparation support. The University has established a special Office for EU FundingProfessional, and Development Projects with the Private Sector. However, the office is supported by only one employee, which is not sufficient. Most faculties and departments have one or two staff members supporting preparation and implementation of EU projects. During 2018, the Office for EU Projects held five educational workshops attended by 65 university researchers. The Office helps faculty members in their project applications and provides support to project applicants during implementation. During
240 (i) The Faculty of Medicine will offer a program in German; (ii) the Faculty of Agro-biotechnical Sciences together with the Faculty of Electrical Engineering will offer a new program in ICT in agriculture; (iii) the Faculty of Civil Engineering will offer a new program in English (Resilient Structures – InterStruct) and (iv) the Faculty of Food Technology will offer a new program in biotechnology in English. 241 The only UKF program that researchers from the University of Osijek were able to obtain was a short-term mobility funding program (EUR 10,000 per project). However, they have never managed to obtain more significant funding through the very successful Cooperability Program (EUR 200,000 per project).
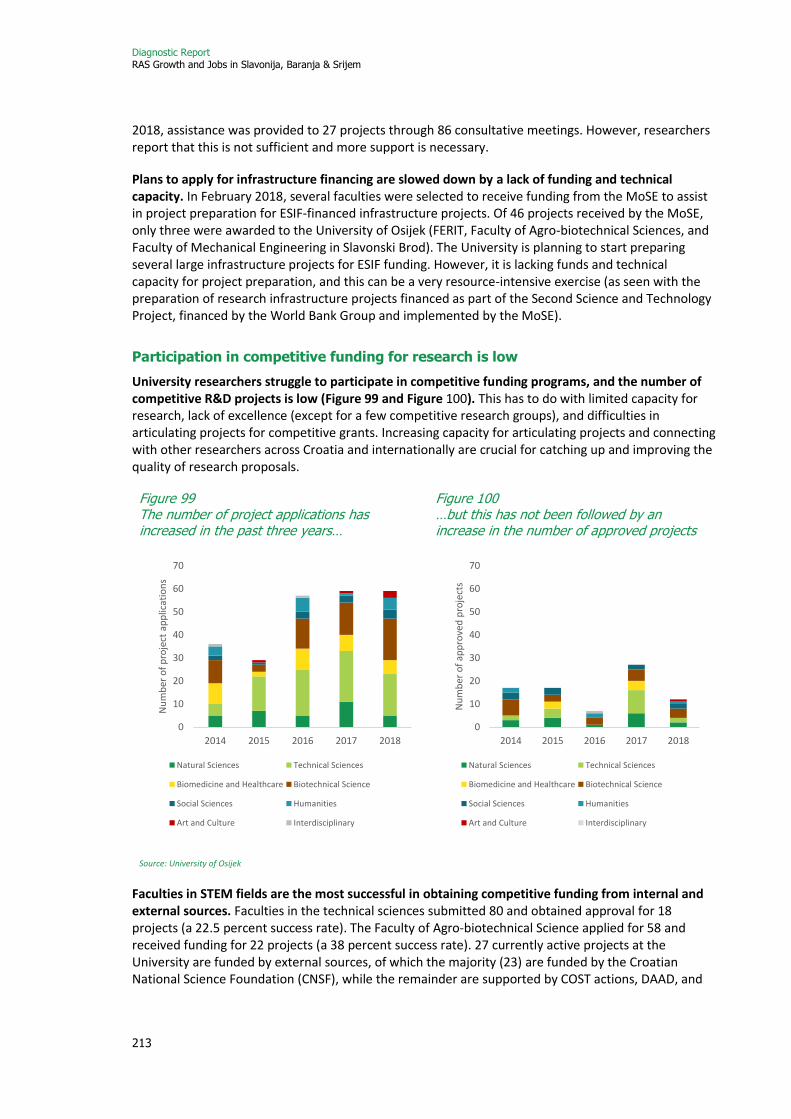
Diagnostic Report RAS Growth and Jobs in Slavonija, Baranja & Srijem
213
2018, assistance was provided to 27 projects through 86 consultative meetings. However, researchers report that this is not sufficient and more support is necessary.
Plans to apply for infrastructure financing are slowed down by a lack of funding and technical capacity. In February 2018, several faculties were selected to receive funding from the MoSE to assist in project preparation for ESIF-financed infrastructure projects. Of 46 projects received by the MoSE, only three were awarded to the University of Osijek (FERIT, Faculty of Agro-biotechnical Sciences, and Faculty of Mechanical Engineering in Slavonski Brod). The University is planning to start preparing several large infrastructure projects for ESIF funding. However, it is lacking funds and technical capacity for project preparation, and this can be a very resource-intensive exercise (as seen with the preparation of research infrastructure projects financed as part of the Second Science and Technology Project, financed by the World Bank Group and implemented by the MoSE).
Participation in competitive funding for research is low
University researchers struggle to participate in competitive funding programs, and the number of competitive R&D projects is low (Figure 99 and Figure 100). This has to do with limited capacity for research, lack of excellence (except for a few competitive research groups), and difficulties in articulating projects for competitive grants. Increasing capacity for articulating projects and connecting with other researchers across Croatia and internationally are crucial for catching up and improving the quality of research proposals.
Figure 99 The number of project applications has increased in the past three years…
Figure 100 …but this has not been followed by an increase in the number of approved projects
Source: University of Osijek
Faculties in STEM fields are the most successful in obtaining competitive funding from internal and external sources. Faculties in the technical sciences submitted 80 and obtained approval for 18 projects (a 22.5 percent success rate). The Faculty of Agro-biotechnical Science applied for 58 and received funding for 22 projects (a 38 percent success rate). 27 currently active projects at the University are funded by external sources, of which the majority (23) are funded by the Croatian National Science Foundation (CNSF), while the remainder are supported by COST actions, DAAD, and
0
10
20
30
40
50
60
70
2014 2015 2016 2017 2018
Nu
mb
er o
f p
roje
ct a
pp
licat
ion
s
Natural Sciences Technical Sciences
Biomedicine and Healthcare Biotechnical Science
Social Sciences Humanities
Art and Culture Interdisciplinary
0
10
20
30
40
50
60
70
2014 2015 2016 2017 2018
Nu
mb
er o
f ap
pro
ved
pro
ject
s
Natural Sciences Technical Sciences
Biomedicine and Healthcare Biotechnical Science
Social Sciences Humanities
Art and Culture Interdisciplinary

Diagnostic Report RAS Growth and Jobs in Slavonija, Baranja & Srijem
214
the Interreg IPA EU project.242 In addition to external funding sources, the University has its own fund for projects financed through the proceeds of collaboration with the private sector. Each year the University allocates funding through a competitive selection process.243 In 2018, the University allocated HRK 1.5 million to 34 research projects.
Participation in research excellence initiatives is low
The University of Osijek is lagging in terms of participation in research excellence initiatives. In 2014 and 2016, with ESIF funding, Croatia established 13 centers of excellence244 (CoE): 10 in STEM fields and 3 in social sciences and humanities. Out of 13 CoEs, the University of Osijek was not a leading applicant in any of the awarded centers. For comparison, the University of Rijeka received EU funding as a leading institution in one CoE in Medicine. However, several faculties from the University of Osijek do participate as partnering institutions: FERIT (a partner in two CoEs), the Faculty of Agro-biotechnical Sciences, the Faculty of Medicine, and the Faculty of Food Technology.
The University is a partner in a few pending applications for centers of competence and R&D centers. A call for proposals was published in 2017 for a grant scheme to finance the establishment and operations of centers of competence,245 but the selection process has been delayed for over a year now. In Eastern Croatia, four centers of competence applied to the grant-scheme, and two are from the University of Osijek.246 The University is also a key partner in the new R&D and technology center in Virovitica (the Faculty of Agro-biotechnical Sciences and the Faculty of Food Production), where researchers will have access to modern equipment. The University also allows all other PROs in Eastern Croatia to use its infrastructure.
Scientific productivity and industry-science collaboration is insufficient
The scientific impact and output of the University of Osijek has been lagging behind PROs in the rest of Croatia. The University of Osijek is ranked 5th in Croatia based on the number and quality of scientific articles produced, behind the University of Zagreb, the Ruđer Bošković Institute (RBI), and the universities in Split and Rijeka (Figure 101 and Figure 102).The University of Rijeka, which is similar in terms of the number of students and academic staff, outperforms the University of Osijek in its number of published scientific articles, citations, share of articles published in Q1 journals, and share of articles published in the top 10 percent of scientific journals. However, some of the reasons for the low research output could also be found in the fact that over the last two decades the research infrastructure has not been in very good condition.
242 Department of Mathematics (8), Faculty of Medicine (4), Department of Biology (3), Faculty of Economics (3), FERIT (2), Faculty of Philosophy (2), Faculty of Food Technology (2), and Faculty of Humanities and Social Sciences (1). 243 In 2018, the University Senate approved a total of 38 projects to be funded (12 interdisciplinary research projects, 9 research projects, 8 projects for collaboration with the private sector, and 9 projects for young scientists). 244 For more information on centers of excellence, see section 00. 245 See section 0 for more details. 246 The Centre of Competence for Healthy Food Chains in Osijek, and the Centre of Competence for Personalized Medicine in Osijek.
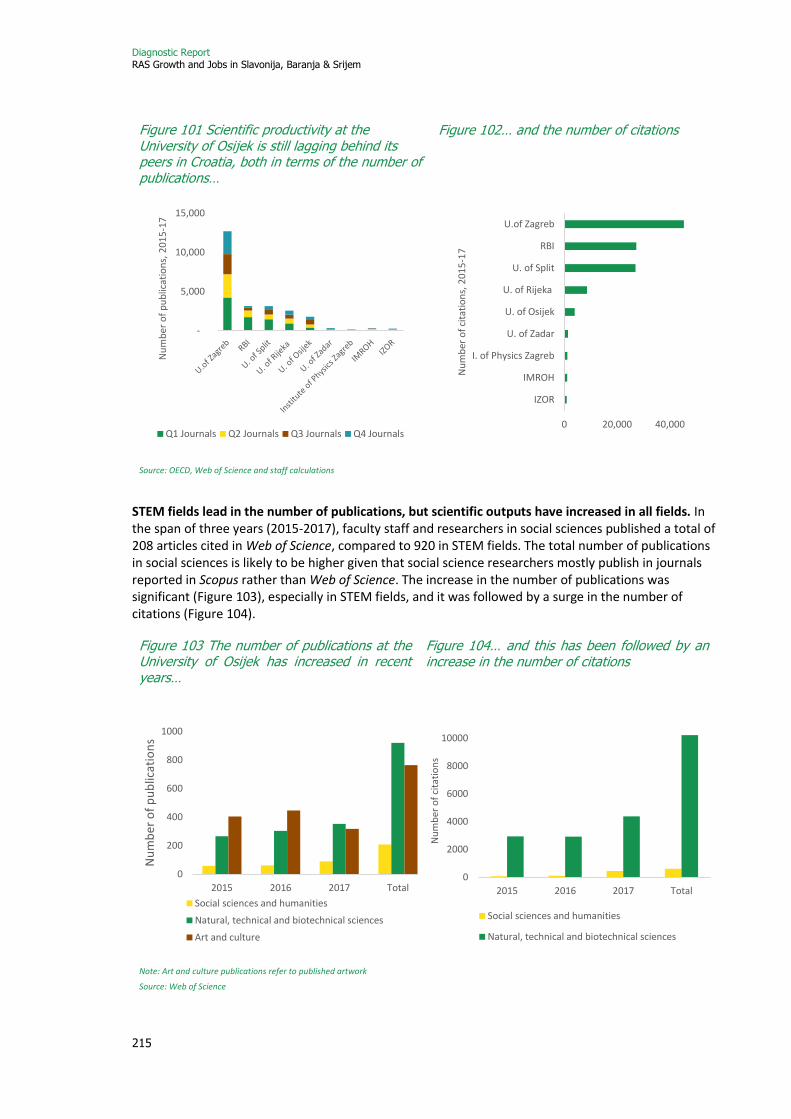
Diagnostic Report RAS Growth and Jobs in Slavonija, Baranja & Srijem
215
Figure 101 Scientific productivity at the University of Osijek is still lagging behind its peers in Croatia, both in terms of the number of publications…
Figure 102… and the number of citations
Source: OECD, Web of Science and staff calculations
STEM fields lead in the number of publications, but scientific outputs have increased in all fields. In the span of three years (2015-2017), faculty staff and researchers in social sciences published a total of 208 articles cited in Web of Science, compared to 920 in STEM fields. The total number of publications in social sciences is likely to be higher given that social science researchers mostly publish in journals reported in Scopus rather than Web of Science. The increase in the number of publications was significant (Figure 103), especially in STEM fields, and it was followed by a surge in the number of citations (Figure 104).
Figure 103 The number of publications at the University of Osijek has increased in recent years…
Figure 104… and this has been followed by an increase in the number of citations
Note: Art and culture publications refer to published artwork
Source: Web of Science
-
5,000
10,000
15,000
Nu
mb
er o
f p
ub
licat
ion
s, 2
01
5-1
7
Q1 Journals Q2 Journals Q3 Journals Q4 Journals0 20,000 40,000
IZOR
IMROH
I. of Physics Zagreb
U. of Zadar
U. of Osijek
U. of Rijeka
U. of Split
RBI
U.of Zagreb
Nu
mb
er o
f ci
tati
on
s, 2
01
5-1
7
0
200
400
600
800
1000
2015 2016 2017 Total
Nu
mb
er o
f p
ub
licat
ion
s
Social sciences and humanities
Natural, technical and biotechnical sciences
Art and culture
0
2000
4000
6000
8000
10000
2015 2016 2017 Total
Nu
mb
er o
f ci
tati
on
s
Social sciences and humanities
Natural, technical and biotechnical sciences
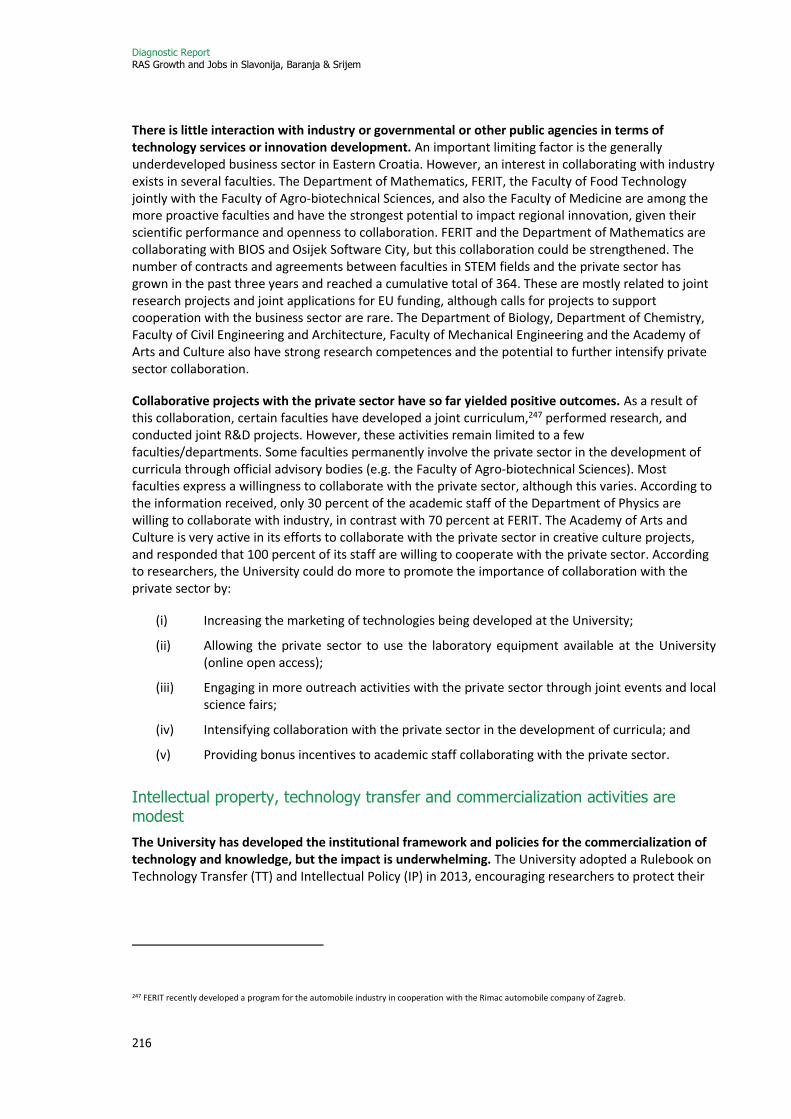
Diagnostic Report RAS Growth and Jobs in Slavonija, Baranja & Srijem
216
There is little interaction with industry or governmental or other public agencies in terms of technology services or innovation development. An important limiting factor is the generally underdeveloped business sector in Eastern Croatia. However, an interest in collaborating with industry exists in several faculties. The Department of Mathematics, FERIT, the Faculty of Food Technology jointly with the Faculty of Agro-biotechnical Sciences, and also the Faculty of Medicine are among the more proactive faculties and have the strongest potential to impact regional innovation, given their scientific performance and openness to collaboration. FERIT and the Department of Mathematics are collaborating with BIOS and Osijek Software City, but this collaboration could be strengthened. The number of contracts and agreements between faculties in STEM fields and the private sector has grown in the past three years and reached a cumulative total of 364. These are mostly related to joint research projects and joint applications for EU funding, although calls for projects to support cooperation with the business sector are rare. The Department of Biology, Department of Chemistry, Faculty of Civil Engineering and Architecture, Faculty of Mechanical Engineering and the Academy of Arts and Culture also have strong research competences and the potential to further intensify private sector collaboration.
Collaborative projects with the private sector have so far yielded positive outcomes. As a result of this collaboration, certain faculties have developed a joint curriculum,247 performed research, and conducted joint R&D projects. However, these activities remain limited to a few faculties/departments. Some faculties permanently involve the private sector in the development of curricula through official advisory bodies (e.g. the Faculty of Agro-biotechnical Sciences). Most faculties express a willingness to collaborate with the private sector, although this varies. According to the information received, only 30 percent of the academic staff of the Department of Physics are willing to collaborate with industry, in contrast with 70 percent at FERIT. The Academy of Arts and Culture is very active in its efforts to collaborate with the private sector in creative culture projects, and responded that 100 percent of its staff are willing to cooperate with the private sector. According to researchers, the University could do more to promote the importance of collaboration with the private sector by:
(i) Increasing the marketing of technologies being developed at the University;
(ii) Allowing the private sector to use the laboratory equipment available at the University (online open access);
(iii) Engaging in more outreach activities with the private sector through joint events and local science fairs;
(iv) Intensifying collaboration with the private sector in the development of curricula; and
(v) Providing bonus incentives to academic staff collaborating with the private sector.
Intellectual property, technology transfer and commercialization activities are modest
The University has developed the institutional framework and policies for the commercialization of technology and knowledge, but the impact is underwhelming. The University adopted a Rulebook on Technology Transfer (TT) and Intellectual Policy (IP) in 2013, encouraging researchers to protect their
247 FERIT recently developed a program for the automobile industry in cooperation with the Rimac automobile company of Zagreb.
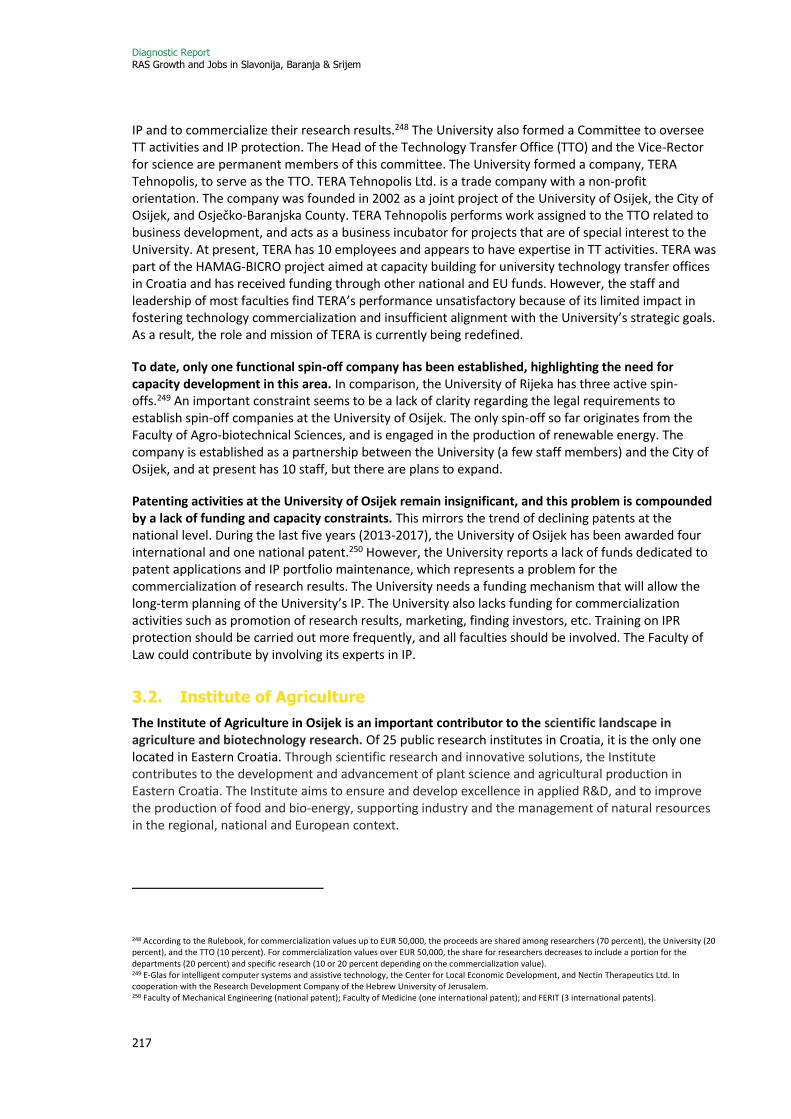
Diagnostic Report RAS Growth and Jobs in Slavonija, Baranja & Srijem
217
IP and to commercialize their research results.248 The University also formed a Committee to oversee TT activities and IP protection. The Head of the Technology Transfer Office (TTO) and the Vice-Rector for science are permanent members of this committee. The University formed a company, TERA Tehnopolis, to serve as the TTO. TERA Tehnopolis Ltd. is a trade company with a non-profit orientation. The company was founded in 2002 as a joint project of the University of Osijek, the City of Osijek, and Osječko-Baranjska County. TERA Tehnopolis performs work assigned to the TTO related to business development, and acts as a business incubator for projects that are of special interest to the University. At present, TERA has 10 employees and appears to have expertise in TT activities. TERA was part of the HAMAG-BICRO project aimed at capacity building for university technology transfer offices in Croatia and has received funding through other national and EU funds. However, the staff and leadership of most faculties find TERA’s performance unsatisfactory because of its limited impact in fostering technology commercialization and insufficient alignment with the University’s strategic goals. As a result, the role and mission of TERA is currently being redefined.
To date, only one functional spin-off company has been established, highlighting the need for capacity development in this area. In comparison, the University of Rijeka has three active spin-offs.249 An important constraint seems to be a lack of clarity regarding the legal requirements to establish spin-off companies at the University of Osijek. The only spin-off so far originates from the Faculty of Agro-biotechnical Sciences, and is engaged in the production of renewable energy. The company is established as a partnership between the University (a few staff members) and the City of Osijek, and at present has 10 staff, but there are plans to expand.
Patenting activities at the University of Osijek remain insignificant, and this problem is compounded by a lack of funding and capacity constraints. This mirrors the trend of declining patents at the national level. During the last five years (2013-2017), the University of Osijek has been awarded four international and one national patent.250 However, the University reports a lack of funds dedicated to patent applications and IP portfolio maintenance, which represents a problem for the commercialization of research results. The University needs a funding mechanism that will allow the long-term planning of the University’s IP. The University also lacks funding for commercialization activities such as promotion of research results, marketing, finding investors, etc. Training on IPR protection should be carried out more frequently, and all faculties should be involved. The Faculty of Law could contribute by involving its experts in IP.
3.2. Institute of Agriculture
The Institute of Agriculture in Osijek is an important contributor to the scientific landscape in agriculture and biotechnology research. Of 25 public research institutes in Croatia, it is the only one located in Eastern Croatia. Through scientific research and innovative solutions, the Institute contributes to the development and advancement of plant science and agricultural production in Eastern Croatia. The Institute aims to ensure and develop excellence in applied R&D, and to improve the production of food and bio-energy, supporting industry and the management of natural resources in the regional, national and European context.
248 According to the Rulebook, for commercialization values up to EUR 50,000, the proceeds are shared among researchers (70 percent), the University (20 percent), and the TTO (10 percent). For commercialization values over EUR 50,000, the share for researchers decreases to include a portion for the departments (20 percent) and specific research (10 or 20 percent depending on the commercialization value). 249 E-Glas for intelligent computer systems and assistive technology, the Center for Local Economic Development, and Nectin Therapeutics Ltd. In cooperation with the Research Development Company of the Hebrew University of Jerusalem. 250 Faculty of Mechanical Engineering (national patent); Faculty of Medicine (one international patent); and FERIT (3 international patents).
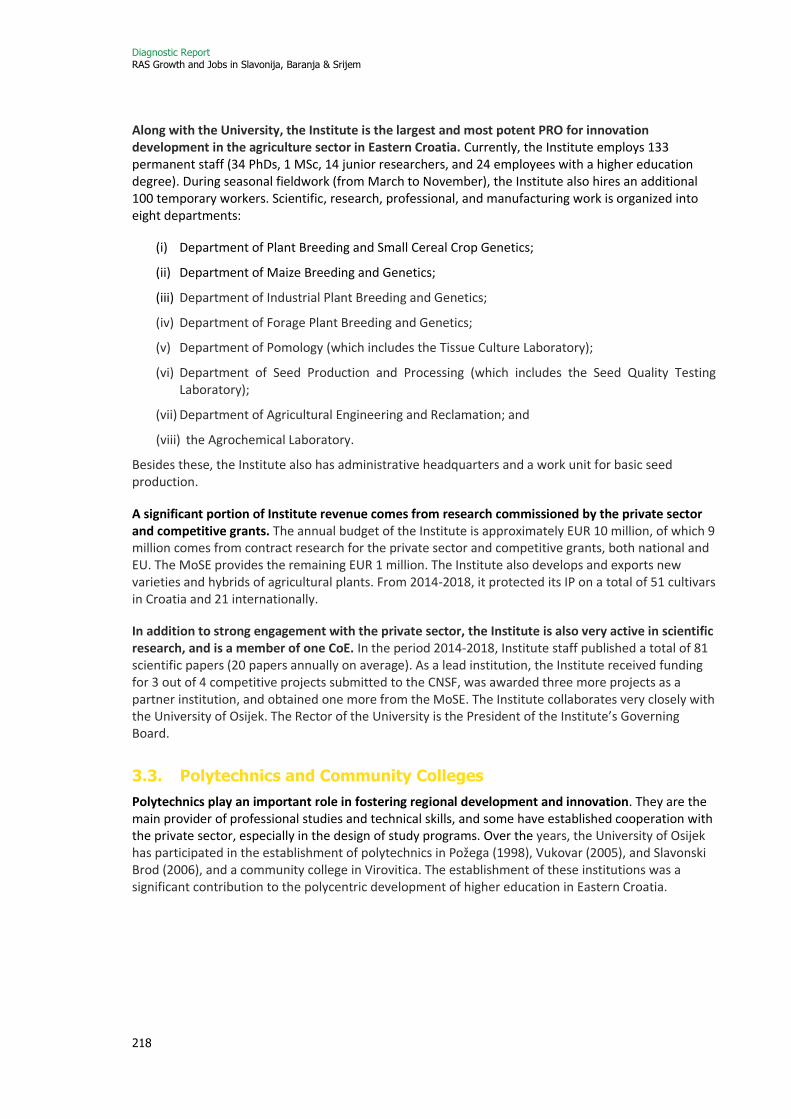
Diagnostic Report RAS Growth and Jobs in Slavonija, Baranja & Srijem
218
Along with the University, the Institute is the largest and most potent PRO for innovation development in the agriculture sector in Eastern Croatia. Currently, the Institute employs 133 permanent staff (34 PhDs, 1 MSc, 14 junior researchers, and 24 employees with a higher education degree). During seasonal fieldwork (from March to November), the Institute also hires an additional 100 temporary workers. Scientific, research, professional, and manufacturing work is organized into eight departments:
(i) Department of Plant Breeding and Small Cereal Crop Genetics;
(ii) Department of Maize Breeding and Genetics;
(iii) Department of Industrial Plant Breeding and Genetics;
(iv) Department of Forage Plant Breeding and Genetics;
(v) Department of Pomology (which includes the Tissue Culture Laboratory);
(vi) Department of Seed Production and Processing (which includes the Seed Quality Testing Laboratory);
(vii) Department of Agricultural Engineering and Reclamation; and
(viii) the Agrochemical Laboratory.
Besides these, the Institute also has administrative headquarters and a work unit for basic seed production.
A significant portion of Institute revenue comes from research commissioned by the private sector and competitive grants. The annual budget of the Institute is approximately EUR 10 million, of which 9 million comes from contract research for the private sector and competitive grants, both national and EU. The MoSE provides the remaining EUR 1 million. The Institute also develops and exports new varieties and hybrids of agricultural plants. From 2014-2018, it protected its IP on a total of 51 cultivars in Croatia and 21 internationally.
In addition to strong engagement with the private sector, the Institute is also very active in scientific research, and is a member of one CoE. In the period 2014-2018, Institute staff published a total of 81 scientific papers (20 papers annually on average). As a lead institution, the Institute received funding for 3 out of 4 competitive projects submitted to the CNSF, was awarded three more projects as a partner institution, and obtained one more from the MoSE. The Institute collaborates very closely with the University of Osijek. The Rector of the University is the President of the Institute’s Governing Board.
3.3. Polytechnics and Community Colleges
Polytechnics play an important role in fostering regional development and innovation. They are the main provider of professional studies and technical skills, and some have established cooperation with the private sector, especially in the design of study programs. Over the years, the University of Osijek has participated in the establishment of polytechnics in Požega (1998), Vukovar (2005), and Slavonski Brod (2006), and a community college in Virovitica. The establishment of these institutions was a significant contribution to the polycentric development of higher education in Eastern Croatia.

Diagnostic Report RAS Growth and Jobs in Slavonija, Baranja & Srijem
219
Polytechnic in Požega
Požega Polytechnic is a well-equipped teaching facility that offers higher education and lifelong education in biotechnical and social sciences. The institution is engaged in scientific and professional research, international cooperation, and cooperation with the local community with the aim of educating graduates to meet the needs of the economy and the labor market. It is considered to be one of the best in Croatia. The school offers studies in food production, viticulture, grape growing and wine production, administrative law, accounting and trade. It also offers an adult education program. The staff consists of 52 employees (mostly young and very active), of whom 32 are teachers, and 34 external associates. In addition to classrooms, the facilities include a wine lab, a cellar, a vineyard, sports grounds, and ample office space. In February 2017, out of a total of 1,143 students, 577 attended full-time study programs, while 566 were in special education programs.
The Polytechnic is very active in collaboration with the private sector,251 other research organizations, and in applications for EU funds. The private sector is involved in designing some of the study programs. The Polytechnic also collaborates very closely with the University of Osijek, participates in the Erasmus Mobility Program, and once a year organizes a workshop focused on innovation together with a partnering institution from Austria. Over the last several years, the Polytechnic has received funding for projects worth EUR 1 million in total. Recently, together with the Polytechnic in Slavonski Brod, it has received ESF funds to start a new teaching program in Eco-energetics in English.
Shortages in infrastructure and resources were identified as the main weaknesses of the Polytechnic. Over two-thirds of full-time students (over a third of the total student body) commuted to attend lectures. Building student accommodation facilities would improve access to educational facilities for a greater number of students. Aside from accommodation facilities, the Polytechnic leadership also identified the following weaknesses: (i) partially obsolete curricula; (ii) an insufficient number of specialist studies; (iii) an insufficient number of teachers; and (iv) the need for additional lecture halls, classrooms and laboratories.
Polytechnic in Slavonski Brod
The Polytechnic in Slavonski Brod (PSB) contributes to professional education in agriculture, technical and biotechnical sciences. It seems to be strong in education in STEM fields but has limited R&D activities. Since its establishment, around 1,650 students have graduated from undergraduate professional study programs in plant production (with specialization programs in horticulture and farming), production engineering and management, as well as graduate professional studies in ecological agriculture and rural development, energetics, and management. Over a thousand students were enrolled in six professional study programs in the academic year 2018/2019, and contrary to enrollment trends in other institutions in Eastern Croatia, the number of students has not declined. Programs are delivered by 27 full-time teachers and 67 external associate teachers, and supported by 10 administrative staff. In 2012, PSB was reaccredited by the national Agency for Science and Higher Education (ASHE) with a very good assessment. In 2015, ASHE performed an audit of the quality assurance system in PSB and awarded it with a Certificate of Quality. Only 17 of 131 HEIs in Croatia
251 The companies the Polytechnic collaborates with include: Zvečevo d.d., Kutjevo d.d., Gastro grupa d.d., Spin Valis d.d., Color trgovina d.o.o., Alles, d.o.o., Plamen International d.o.o, Tommy d.o.o, Orljava d.o.o., Konto d.o.o, Poljoprivredna zadruga Prvča, Croatia osiguranje d.d., Unius d.o.o., Spinot d.o.o., Alca d.o.o., Sirela d.o.o., Orljava d.o.o., Metalija-Trans d.o.o., Papuk d.d., Grbić d.o.o, Agronom d.o.o, Autoprometno poduzeće d.d. Požega (APP), PJ Požežanka, Mljekara BIZ, Vindija d.d., and Zvijezda d.d.
Diagnostic Report RAS Growth and Jobs in Slavonija, Baranja & Srijem
220
have obtained this certificate. PSB is also a signatory of the Erasmus Charter for Higher Education (ECHE).
Financing is mostly provided by the MoSE, and the share of ESIF revenues is low. Approximately 70 percent of the annual budget originates from state funds. The rest is financed by ESIF financed projects and own revenues (tuition, expertise, lifelong learning programs, etc.) In the last five years, PSB has received three ESIF-financed projects amounting to 2.4 percent of the budget. Around 4.2 percent of the budget is spent on scientific research, but this share is expected to grow in the future. In 2018, PSB as a lead partner, received ESF funds to launch a new study program in English (Eco-energetics). After completion of this project, PSB will be able to offer two STEM master’s degree programs in English, which will significantly increase the attractiveness of their master’s degree programs to foreign students.
Although the Polytechnic has invested in increasing the quality of its study programs, it is facing major infrastructure difficulties. PSB is working towards modernizing and adapting its programs to the needs of the private sector, as well as introducing highly demanded master’s degree programs, particularly in STEM fields. However, the quality and quantity of programs is limited by a lack of infrastructure. The Polytechnic rents space at 10 different locations in Slavonski Brod, which is problematic both from an organizational perspective and from a student perspective. To address this issue, PSB has prepared documentation to finance the construction of a new building with ESIF funding.
Polytechnic Lavoslav Ružička in Vukovar
Lavoslav Ružička Polytechnic in Vukovar offers a program in physiotherapy with great potential synergies with health tourism. The Polytechnic was founded in 2005 and has 42 employees (of whom 27 are academic staff). The MoSE finances the majority of the budget while the remainder is covered by tuition fees. The Polytechnic is organized into four centers: the Student Standard Center, Center for Lifelong Learning, Center for Quality, and Center for Sports Diagnostics and Recreation. 954 students are enrolled into three professional degree programs: Administrative Studies, Trade Studies and Physical Therapy. The Polytechnic also offers a specialist graduate professional study program in Preventive Physiotherapy. This program is of special interest to the development of health tourism in Eastern Croatia. Over the last few years, student enrollment in Administrative Studies and Trade Studies programs has been declining, while STEM programs continue to have full enrollment. As a result, the Polytechnic is planning to introduce more STEM programs, and to further develop lifelong learning programs. The Polytechnic follows the professional development and employability of its graduates in coordination with the Croatian Employment Service, and most of them are able to find employment.
The Polytechnic is engaged in several activities to attract domestic as well as international students. Every year, the Polytechnic engages in outreach activities targeting high schools in Eastern Croatia, where staff present study programs. This is supported by media and social media campaigns. Financial support for low-income students is available, and student accommodation has recently been built with the financial support of ESIF. The Polytechnic aims to internationalize its activities through international cooperation agreements. The Erasmus+ program enabled 34 exchanges of staff and students over the last two academic years (9 incoming and 25 outgoing). Collaboration through the Erasmus mobility program has been established with institutions from Belgium, Finland, France, Georgia, Hungary, Lithuania, Poland, Romania, Slovenia, and Bosnia and Herzegovina. The Polytechnic also invests in networking with academics from abroad by organizing two international conferences, one on STEM and the other on non-STEM fields.
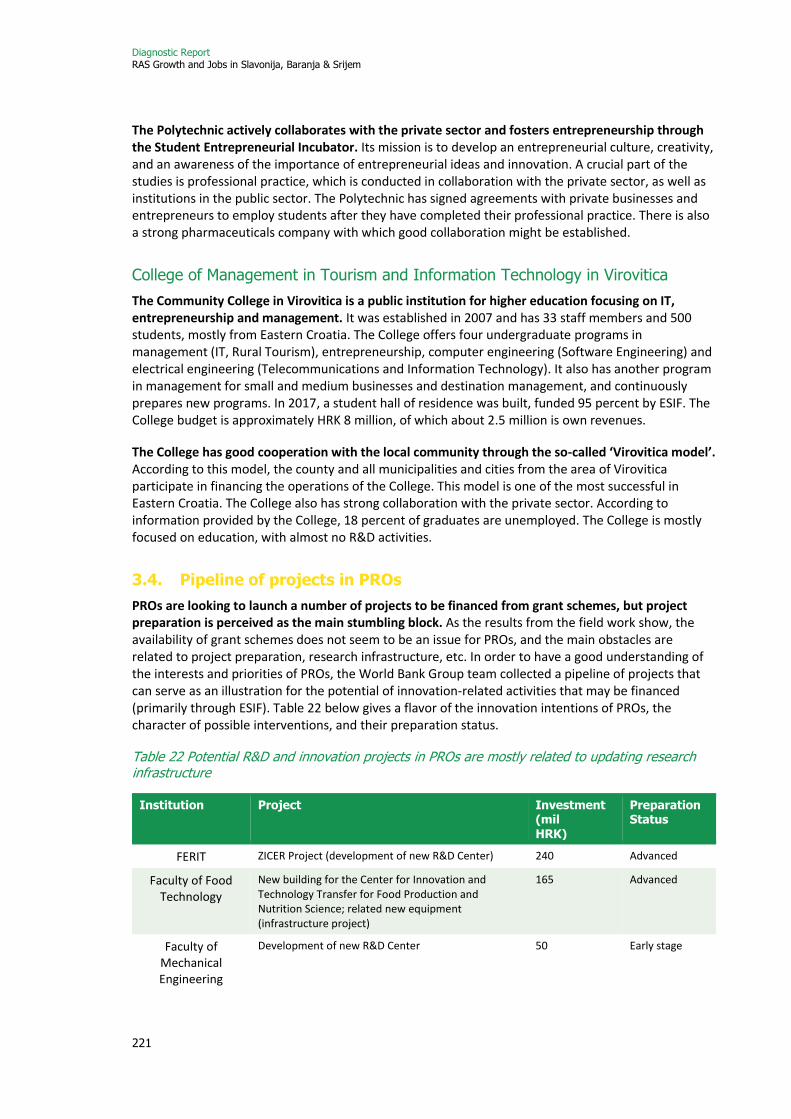
Diagnostic Report RAS Growth and Jobs in Slavonija, Baranja & Srijem
221
The Polytechnic actively collaborates with the private sector and fosters entrepreneurship through the Student Entrepreneurial Incubator. Its mission is to develop an entrepreneurial culture, creativity, and an awareness of the importance of entrepreneurial ideas and innovation. A crucial part of the studies is professional practice, which is conducted in collaboration with the private sector, as well as institutions in the public sector. The Polytechnic has signed agreements with private businesses and entrepreneurs to employ students after they have completed their professional practice. There is also a strong pharmaceuticals company with which good collaboration might be established.
College of Management in Tourism and Information Technology in Virovitica
The Community College in Virovitica is a public institution for higher education focusing on IT, entrepreneurship and management. It was established in 2007 and has 33 staff members and 500 students, mostly from Eastern Croatia. The College offers four undergraduate programs in management (IT, Rural Tourism), entrepreneurship, computer engineering (Software Engineering) and electrical engineering (Telecommunications and Information Technology). It also has another program in management for small and medium businesses and destination management, and continuously prepares new programs. In 2017, a student hall of residence was built, funded 95 percent by ESIF. The College budget is approximately HRK 8 million, of which about 2.5 million is own revenues.
The College has good cooperation with the local community through the so-called ‘Virovitica model’. According to this model, the county and all municipalities and cities from the area of Virovitica participate in financing the operations of the College. This model is one of the most successful in Eastern Croatia. The College also has strong collaboration with the private sector. According to information provided by the College, 18 percent of graduates are unemployed. The College is mostly focused on education, with almost no R&D activities.
3.4. Pipeline of projects in PROs
PROs are looking to launch a number of projects to be financed from grant schemes, but project preparation is perceived as the main stumbling block. As the results from the field work show, the availability of grant schemes does not seem to be an issue for PROs, and the main obstacles are related to project preparation, research infrastructure, etc. In order to have a good understanding of the interests and priorities of PROs, the World Bank Group team collected a pipeline of projects that can serve as an illustration for the potential of innovation-related activities that may be financed (primarily through ESIF). Table 22 below gives a flavor of the innovation intentions of PROs, the character of possible interventions, and their preparation status.
Table 22 Potential R&D and innovation projects in PROs are mostly related to updating research infrastructure
Institution Project Investment (mil HRK)
Preparation Status
FERIT ZICER Project (development of new R&D Center) 240 Advanced
Faculty of Food Technology
New building for the Center for Innovation and Technology Transfer for Food Production and Nutrition Science; related new equipment (infrastructure project)
165 Advanced
Faculty of Mechanical Engineering
Development of new R&D Center 50 Early stage
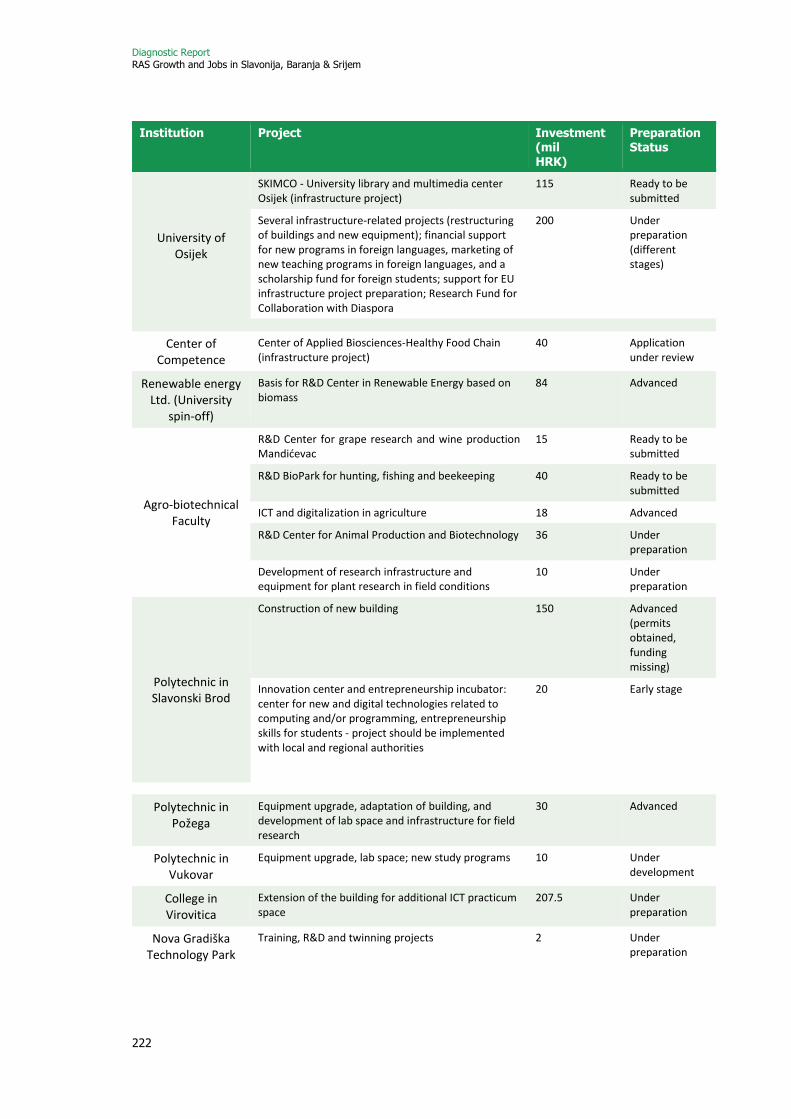
Diagnostic Report RAS Growth and Jobs in Slavonija, Baranja & Srijem
222
Institution Project Investment (mil HRK)
Preparation Status
University of Osijek
SKIMCO - University library and multimedia center Osijek (infrastructure project)
115 Ready to be submitted
Several infrastructure-related projects (restructuring of buildings and new equipment); financial support for new programs in foreign languages, marketing of new teaching programs in foreign languages, and a scholarship fund for foreign students; support for EU infrastructure project preparation; Research Fund for Collaboration with Diaspora
200 Under preparation (different stages)
Center of Competence
Center of Applied Biosciences-Healthy Food Chain (infrastructure project)
40 Application under review
Renewable energy Ltd. (University
spin-off)
Basis for R&D Center in Renewable Energy based on biomass
84 Advanced
Agro-biotechnical Faculty
R&D Center for grape research and wine production Mandićevac
15 Ready to be submitted
R&D BioPark for hunting, fishing and beekeeping 40 Ready to be submitted
ICT and digitalization in agriculture 18 Advanced
R&D Center for Animal Production and Biotechnology 36 Under preparation
Development of research infrastructure and equipment for plant research in field conditions
10 Under preparation
Polytechnic in Slavonski Brod
Construction of new building 150 Advanced (permits obtained, funding missing)
Innovation center and entrepreneurship incubator: center for new and digital technologies related to computing and/or programming, entrepreneurship skills for students - project should be implemented with local and regional authorities
20 Early stage
Polytechnic in Požega
Equipment upgrade, adaptation of building, and development of lab space and infrastructure for field research
30 Advanced
Polytechnic in Vukovar
Equipment upgrade, lab space; new study programs 10 Under development
College in Virovitica
Extension of the building for additional ICT practicum space
207.5 Under preparation
Nova Gradiška Technology Park
Training, R&D and twinning projects 2 Under preparation

Diagnostic Report RAS Growth and Jobs in Slavonija, Baranja & Srijem
223
Institution Project Investment (mil HRK)
Preparation Status
Center of Competence in the
Wood Sector
Training, R&D and twinning projects 2 Under preparation
Agriculture High School in Slavonski
Brod
Infrastructure improvements and new accommodation for students
7 Under preparation
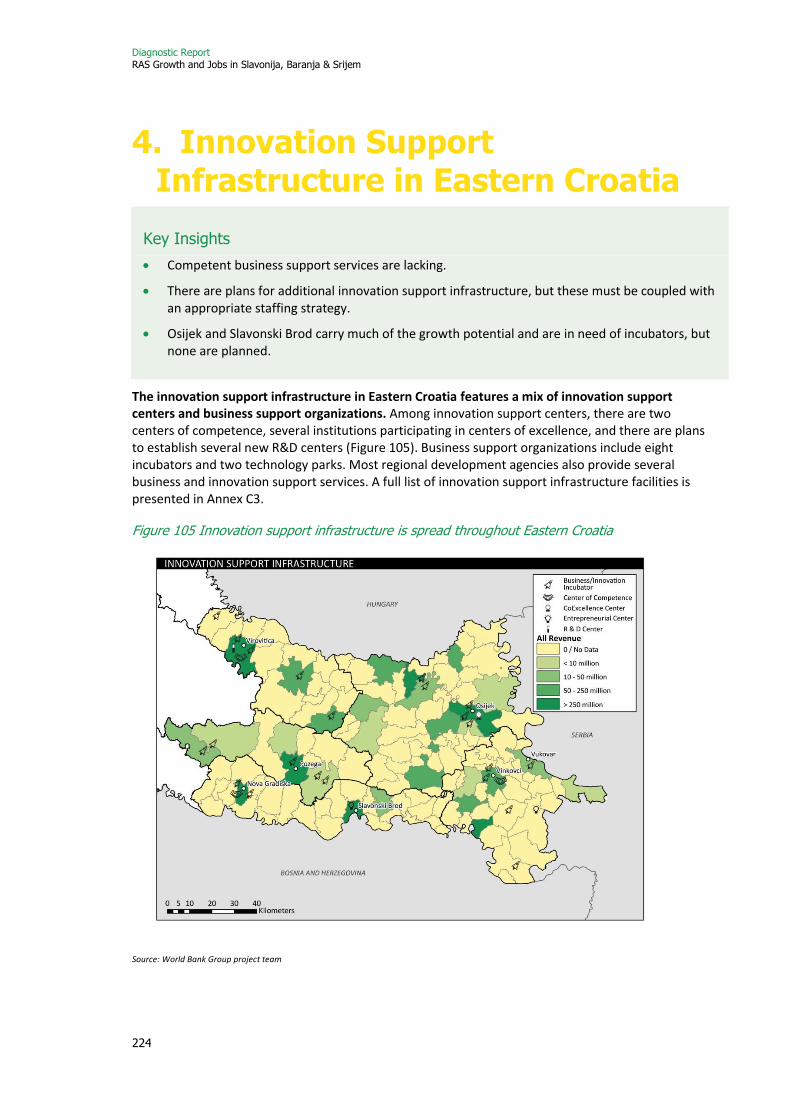
Diagnostic Report RAS Growth and Jobs in Slavonija, Baranja & Srijem
224
4. Innovation Support Infrastructure in Eastern Croatia
Key Insights
• Competent business support services are lacking.
• There are plans for additional innovation support infrastructure, but these must be coupled with an appropriate staffing strategy.
• Osijek and Slavonski Brod carry much of the growth potential and are in need of incubators, but none are planned.
The innovation support infrastructure in Eastern Croatia features a mix of innovation support centers and business support organizations. Among innovation support centers, there are two centers of competence, several institutions participating in centers of excellence, and there are plans to establish several new R&D centers (Figure 105). Business support organizations include eight incubators and two technology parks. Most regional development agencies also provide several business and innovation support services. A full list of innovation support infrastructure facilities is presented in Annex C3.
Figure 105 Innovation support infrastructure is spread throughout Eastern Croatia
Source: World Bank Group project team
Diagnostic Report RAS Growth and Jobs in Slavonija, Baranja & Srijem
225
Despite this, the existing infrastructure needs improvement, as it lacks competent advisory services and physical business space. Tailored advisory services – including digital marketing assistance, market access services, promoting business linkages and support for technology and product development – are scarce and yet to be developed. Business support organizations do not have clear goals (partly because of the recent change in the legal structure and mission of the Local Development Agencies) and do not have continuous support to provide services to overcome market and information failures. Moreover, there is a shortage of suitable and affordable office space in urban centers and industrial prototyping spaces, where innovative companies could gather, communicate and have access to necessary business services. The lack of physical infrastructure is most evident in urban areas (Osijek and Slavonski Brod), where there are no contracted projects for new incubators, and where local development agencies and SME associations are arguing for their development. Incubators, accelerators, and hubs usually figure as the focal points of innovative businesses in cities, and such places can make a difference in terms of attracting entrepreneurs and investors.
Access to business support services could be facilitated with innovation vouchers, but their use in Croatia is limited. Innovation vouchers are agile funding instruments through which firms may have expenses for business and technology services reimbursed by simply presenting invoices.252 In Denmark, a successful innovation voucher program (InnoBooster) is the main funding source for digital/ICT services for SMEs. In Croatia, there is a project as part of OPCC to provide innovation vouchers to SMEs,253 but the allowed service providers are restricted to registered R&D organizations. In practice, these are mostly PROs and large companies.254 So far, only several companies have obtained such vouchers, and none are from Eastern Croatia.
A major shortcoming in the innovation infrastructure is the lack of technology extension services. This type of technology support is key to productivity increases and innovation adoption in SMEs. Technology extension services are a form of technology diffusion activity, and they can be provided by academic and research institutions, public-private organizations, industry associations and the private sector. Through training, coaching, and diagnostic services, these entities help firms in the process of identification and adoption of technologies and innovation practices, including non-technological practices such as quality systems, norms and standards, and new production practices (lean manufacturing, automation of production, etc.)255
In developing its own model for technology extension services, Croatia could benefit from international experience. The model could be developed based on the specific needs of industry (see Shapira et al., 2015) and tailored assistance to firms. Technology extension institutions are crucial for the testing and adoption of new technologies and innovation by public research institutions on a large scale. For example, cooperative research centers in the Netherlands and Australia (e.g. Viticulture, Citrics) are strongly engaged in technology extension services to farmers. In the United States, the Manufacturing Extension Partnership Program assists SMEs in technology adoption and upgrading in manufacturing industries, including food processing industries.
Future funding programs for innovation infrastructure should focus not only on the development of physical infrastructure but also the reinforcement and expansion of business support activities. This will enable infrastructure management to provide specialized and customized business support services and the organization of training programs. Financial sustainability and the professionalism of
252 For example, in Finland, firms may claim up to EUR 6,200, and in Singapore up to USD 5,000, for any type of innovation-related expenses, not just R&D. 253 https://efondovi.mrrfeu.hr/MISCms/Pozivi/Poziv?id=cfc4e79b-68c5-4ce8-a481-04ee5d76dda2 254 http://pregledi.mzos.hr/Ustanove_Z.aspx; https://www.azvo.hr/en/science/scientific-organizations 255 For example, Digital Hub Logistics in Dortmund, Germany provides maturity assessments as a core service. This diagnostic helps both companies and the agency to understand the current position of the company and identify future options and needs.

Diagnostic Report RAS Growth and Jobs in Slavonija, Baranja & Srijem
226
management are preconditions for the ultimate success of innovation infrastructure, and this cannot be achieved at early stages without state aid. It is essential that innovation infrastructure has the capacity and resources to select and nurture innovative enterprises, otherwise it risks becoming a glorified agency for renting business space.
4.1. Innovation Support Centers
Plans to establish R&D centers
At this time, there are no R&D centers in Eastern Croatia, but there are plans to establish new centers in Virovitica, Slavonski Brod and Osijek. In Virovitica, plans have been developed to establish an Innovation and Technology Center for R&D in Agriculture and Food Processing and a Center for Dairy Research and Development. The former will be funded by the ERDF under the MoSE allocation, while the latter is expected to receive funding from the allocation of the Ministry of Agriculture. The Faculty of Mechanical Engineering and FERIT are also planning to launch new R&D centers. Given the limited research and innovation activities and evident need for competent research staff, there is a risk that the newly-built infrastructure could be underused. To maximize the potential of new R&D centers, plans to develop infrastructure will need to be coupled with strategies to attract additional staff, including cooperation with foreign centers and researchers.
Institutions from Eastern Croatia do not have a leading role in centers of excellence
Institutions from Eastern Croatia do not have a leading role in any of the 13 centers of excellence (CoE) established across Croatia, but they are involved as partners. A CoE is a research entity that is among the best organizations or groups in the world within its scientific discipline in terms of the originality, significance and relevance of its scientific research. Although these are purely academic centers with no private sector participation, they contribute to the innovation ecosystem with frontier cutting-edge research. In 2014 and 2016, 10 CoEs were established in STEM fields, and 3 in social sciences and humanities. The establishment of CoEs was supported by EUR 50 million from ERDF. Several faculties participate as partnering institutions, including FERIT (a partner in two CoEs), the Faculty of Agro-biotechnical Sciences, the Faculty of Medicine, and the Faculty of Food Technology.
Centers of competence exist but need improvement
Experience with existing centers of competence highlights the need for financing support services as well as physical infrastructure. Centers of competence are a form of specialized innovation cluster – associations of SMEs and business support organizations, designed to stimulate innovative activity by sharing facilities and facilitating the exchange of knowledge and expertise. They are meant to offer sector-specific services and/or high-tech equipment, with professional staff providing industry-specific advice on technology and markets. There are currently two centers of competence in Eastern Croatia256 – one for bioeconomy in Vinkovci (Vukovarsko-Srijemska County), and one for wood in Virovitica. The center of competence in Vinkovci is currently participating in the EU Rosewood project, which stimulates sustainable use of raw wood and the creation of a European network of regions which would facilitate the exchange of good practices and innovation in forestry. The Pannonian Centre of Competence for the Wood Industry in Virovitica was established in 2016 and equipped with
256 Additionally, the city of Valpovo (Osječko-Baranjska County) hosts a Center for Production of Organic Food in partnership with organizations from Serbia. The project is part of the Organic Bridge cross-border cooperation project.

Diagnostic Report RAS Growth and Jobs in Slavonija, Baranja & Srijem
227
state-of-the-art technology. In the two years of its existence, the Center has completed 14 projects, mostly contract research for the private sector. However, because of a lack of funding for operations, the modern laboratory equipment is used only 30 percent of the time. The Center also struggles with staffing, as there is no faculty of forestry at the University of Osijek (although, as mentioned previously, the Faculty of Agro-biotechnical Sciences is in the process of launching a program in forestry), and collaboration with the faculty in Zagreb is insufficient. Besides investment in physical infrastructure, the supporting programs for centers of competence should include financing for operating costs, personnel costs, the provision of specialized and customized business support services, and organization of training programs.
Additional centers of competence could potentially become the backbone of technology development in strategically important industries, but initiatives to establish new centers are undermined by excessive delays in the evaluation of project proposals and a lack of transparency. A call for proposals257 was published in 2017 to finance the establishment and operations of additional centers of competence. Four centers from Eastern Croatia258 applied to the grant scheme, but they have been waiting for a financing decision for over a year now. If financing is eventually approved, centers could be developed for engineering (Nova Gradiška), renewable energy, food and medicine (all in Osijek). In particular, the center of competence for organic food could become a collaboration hotspot for organic food between the University of Osijek and the polytechnics in Slavonski Brod and Požega. The financing envisages 5-year support (c. EUR 3 million per project) to consortia of ten or more companies and institutions led by industry partners.
4.2. Business Support Organizations
Business support organizations – incubators and technology parks – are important providers of infrastructure and services, but their management and oversight in Eastern Croatia could be improved. In particular, improvements are necessary in the management of innovation infrastructure and innovation ecosystems to better serve the needs of entrepreneurs. Oversight by the owners (cities and counties) could also be strengthened to include more experts on the supervisory boards of facilities.
Incubators lack business support services and physical space
There are 8 incubators across all five counties in Eastern Croatia, but some have reached their capacity in terms of physical infrastructure. Currently, 114 companies reside in incubators throughout Eastern Croatia, around half of them in Osijek. Another eight incubators259 are under development, but none are envisaged in the urban areas of Osijek and Slavonski Brod, where the shortage of infrastructure is most severe. Two of the most active public institutions in terms of R&D – the University of Osijek and the Institute of Agriculture – do not have incubators. Incubators provide valuable services to their tenants. Some have specialized in providing advisory services on ESI fund project application and implementation, and residents generally fully rely on them (e.g. BIOS in Osijek). To some extent, they also provide policy and advocacy support for SMEs, as is the case in BIOS and Osijek Software City.
257 https://strukturnifondovi.hr/natjecaji/podrska-razvoju-centara-kompetencija/ 258 The Centre of Competence for Advanced Engineering in Nova Gradiška, the Centre for Renewable Energy Sources with a biogas power plant in Osijek, the Centre of Competence for a Healthy Food Chain in Osijek, and the Centre of Competence for Personalized Medicine in Osijek. 259 In Vinkovci, Otok, Virovitica, Požega, Pleternica, Lipik, and Nova Gradiška.

Diagnostic Report RAS Growth and Jobs in Slavonija, Baranja & Srijem
228
Due to financial limitations, incubators do not offer the full range of specialized services necessary for innovative business development. The operating costs of business incubators are covered by the city or county, and financial support is not always predictable. This makes it difficult to establish and develop capacities for reliable provision of business support services, and often results in insufficient staff training. With additional training and funding, incubators and innovation assistance centers could provide assistance on technology adoption and business organizational support. These services could be combined with or directed through cluster support programs, and provided through innovation infrastructure services.
Technology park equipment needs upgrading
Of the two technology parks in Eastern Croatia, only one actively conducts research for the private sector. The Technology Park and Innovation Center in Nova Gradiška performs contract research mostly for the metal and automobile industry (Rimac Automobili is one of their prominent clients). The Park has received funding to build modern facilities for the incubation of start-ups and SMEs, but the research equipment has not been updated in 10 years. The metal industry is very strong in Brodsko-Posavska County, and with updated equipment, the Technology Park would be a great asset for further development of this industry sector in Eastern Croatia. The second technology park in Vinkovci at present does not have any companies performing R&D or innovation-related activities.
Diagnostic Report RAS Growth and Jobs in Slavonija, Baranja & Srijem
229
5. Companies’ views of the innovation system in Eastern Croatia
Key Insights
• Most firms do not approach innovation in a systematic manner.
• Collaboration and coordination between PROs and the private sector is limited.
• Attracting and retaining talent is difficult.
• The existing innovation financing mechanisms do not meet the needs of the private sector, and there is strong demand for a more varied mix of instruments.
The profile of competences presented in this section is supported by information gathered from a selection of innovative firms. The team met with 34 firms of all sizes from priority sectors in all five counties that comprise Eastern Croatia. Of particular interest were firms that recently launched new or significantly improved products or services, firms that benefited from ESIF-funded technical or financial assistance, or ones which implemented other business innovation development projects. The firms provided insights into their strategy in implementing innovation, the support necessary to overcome market failures in implementing innovation and develop businesses, and general challenges and problems in their business development.
Eastern Croatia generally suffers from a lack of innovation in the private sector, mostly due to a shortage of financial and human resources. Firms that do strive to commercialize innovative ideas generally lack in-house skills in engineering, IT, R&D and sales and marketing. The lack of high-skilled labor and an insufficient quality of education is a problem in all sectors, but particularly in ICT and mechanical engineering. Access to financial resources is limited, especially in SMEs. Incentives for the development of new products, services, tailored education and cooperation with academia are lacking, which discourages firms from undertaking risky investments in R&D and engaging in broader innovation activities such as new technology adoption or upgrading skills.
5.1. Innovation Strategies of Firms in Eastern Croatia
Priorities for innovation in firms in Eastern Croatia vary based on the sector they operate in. Developing new products and services is crucial for business development in ICT and mechanical engineering. However, in the other industries, such as agriculture and wood processing, firms prioritize new-to-the-market innovations and technology adoption, and generally look for ways to improve sales of existing products and increase productivity. Firms are also interested in implementing new marketing tools to boost sales and reach new markets (e.g. packaging, design, pricing policies, online marketing etc.)
Most firms do not implement a systematic innovation process, and R&D departments and R&D personnel are rare. Even though many firms in Eastern Croatia claim to be working on developing or introducing innovation in their current business, many of them are lacking sufficient resources and capacities for systematic innovation development. Acquisition of new ideas occurs mainly through
Diagnostic Report RAS Growth and Jobs in Slavonija, Baranja & Srijem
230
regular industry and market analysis, interactions with customers, as well as (limited) collaboration with PROs.
Collaboration with PROs is limited
The perception of some firms is that PROs have limited R&D capacity and an inadequate offer, which discourages them from seeking out collaboration. Not many firms have open communication with academia to regularly discuss opportunities for collaboration and their problem-solving needs. Existing collaboration is largely based on cooperative R&D projects financed by grant schemes from OPCC for RDI.260 Some firms find that PROs do not have the capacity/offer that corresponds to their needs. Some agriculture and food companies often seek expertise outside of Croatia to improve their production and processes, since they believe such capacities do not currently exist in the region (or even in Croatia). Those that do collaborate with PROs and think there are R&D results and ideas with a potential to be commercialized, indicate a lack of motivation (and entrepreneurial spirit) for collaboration from the academic side. This is related to the well-known problem of constrained knowledge transfer because of insufficient incentives for PROs (or their staff) to cooperate with the private sector.
Skills for innovation are difficult to find and retain
Firms in Eastern Croatia struggle to attract and retain sufficient talent at all levels of education. Competition for highly qualified employees in mechanical engineering and ICT is fierce, both domestically and abroad. Business investment in formal and informal training is insufficient, and there are no government programs in place to support training activities within firms.
Insufficient coordination between educational institutions and industry has resulted in a mismatch between the supply and demand of skills. To overcome this, it is necessary to deepen cooperation between the private sector and educational institutions. Some HEIs have already been involved in developing curricula jointly with the private sector (see sections 0 and 0), but this practice could be further expanded. Firms could (and are willing to) offer training and internships for students of vocational schools, university students and PhD students. A program aimed at matching educational programs with private sector needs (including demand for skills in target clusters) could be developed to support such activities. Recently, the MoSE launched a call for projects aimed at increasing the capacity of higher education institutions for work-based learning,261 financed through OP Efficient Human Resources. However, this project does not specifically address the mismatch in supply and demand of skills, and does not include lower levels of education and the private sector.
Innovation financing instruments are too rigid
OPCC unlocked significant financing for RDI through matching grants and microloans, but these mechanisms do not meet the needs of innovation projects in Eastern Croatia. OPCC matching grants and microloans were helpful in financing technological upgrades but not necessarily new product development. Firms report that current financing support schemes are burdened with strict bureaucratic requirements and onerous administrative procedures. Because of this, firms in Eastern Croatia still rely on internal sources of funding (i.e. retained earnings) to finance innovation activities. Moreover, there is interest in financial instruments such as repayable advances (i.e. convertible loans),
260 https://strukturnifondovi.hr/natjecaji/jacanje-kapaciteta-za-istrazivanje-razvoj-i-inovacije/
261 https://strukturnifondovi.hr/natjecaji/razvoj-unapredenje-i-provedba-strucne-prakse-u-visokom-obrazovanju/

Diagnostic Report RAS Growth and Jobs in Slavonija, Baranja & Srijem
231
guarantees for leasing of new equipment, and venture capital (VC) equity investments, but firms report these financing mechanisms to be currently missing from the innovation ecosystem. Boxes 1 and 2 present cases of firms from Eastern Croatia that would benefit from an increased variety of financing options.
Flexible financing schemes could be designed to better respond to the needs and capacity of firms in Eastern Croatia. Companies urge more suitable support schemes that will help them increase capacities for innovation within firms, especially for incremental, process and organizational innovations. There must be a careful consideration of the design of proper support schemes, ensuring that the objectives of the program correspond to other program elements, such as target beneficiaries, adequacy of the instrument, etc. As firms report, at this point in time, they adjust their project ideas to the calls for proposals, while it should be the other way around. In addition to this, the delivery of the programs must be improved, particularly when it comes to the time and quality of the evaluation process. In addition, while acknowledging the opportunities provided by direct financing, firms also request programs complemented by mentoring and advisory services.
Box 1. A modern factory for food supplements with high export potential
A new modern factory for medicinal products and food supplements is producing premium innovative health food and cosmetics products for the global market. The company has already developed a range of more than 30 products. It produces liquid and semisolid dosage forms, and carries out the batch testing and batch release of medicinal products and food supplements in line with GMP standards, and has launched them on the global market (Russia, Eastern Europe, UAE etc.) The company has highly motivated management, a knowledgeable team and excellent infrastructure.
To support such high-tech and high value-added investments, introducing well-managed, accessible state-aid financial instruments should be considered. The company may benefit from various support mechanisms, such as: (a) more favorable tax conditions for R&D and investments, (b) risk capital investment in small mid-caps, which is currently unavailable in Croatia; or (c) risk investment in the form of leases/guarantees for acquiring new equipment or repayable advances for innovation and R&D.
Box 2. A plastics manufacturing company with new-to-the-market innovation potential
A traditional plastics processing company produces retail products covering certain market segments in Croatia. They have good production, sales and exports, which ensures stable revenue and the employment of 50 workers. However, the challenge that the company faces is producing environmentally friendly garbage bags for selective waste collection, which will be mandatory in Croatia soon. Currently, such production does not exist in Croatia, meaning that this new market opportunity will either be covered by imports or by a domestic producer who will implement new technology in time.
To take this forward, this new-to-the-market innovation could be realized by a risk investment in the form of risk-sharing by leasing (rather than buying) modern manufacturing equipment, or VC investment, which would, besides finance, also provide marketing and production support. To further stimulate this, one policy measure could be to organize innovative public procurement by a national/regional innovation fund upon the request of county/city governments for environmentally friendly products.
Diagnostic Report RAS Growth and Jobs in Slavonija, Baranja & Srijem
232
Capacity for managing intellectual property is limited
The capacity to manage intellectual property (IP) in Eastern Croatia is low, and firms mostly use traditional forms of IP protection. The most widely used mechanisms for IP protection are trademarks, copyright, industrial design, and company secrets. The use of patents in the private sector is rare, which reflects a national trend of declining patent applications. TERA Tehnopolis provides some training on IP protection, but this is not sufficient to address the gap in firm capacity. TERA is primarily owned by the University, therefore its activities on raising awareness and IP protection mainly target the University itself. For more impactful results, it would be necessary to have a more systematic approach to capacity building in the fields of knowledge transfer and IP protection, not only through TERA but also involving other institutions with relevant competences (e.g. RDAs).
The business support infrastructure does not provide the necessary services
The business support infrastructure for innovative companies and start-ups is insufficient and inadequate. The existing (and currently developing) infrastructure is not properly managed, operational costs are barely covered with public support, and there are no firm plans for providing the full range of business and innovation advisory services that are needed for innovative business development. Besides investment aid, the idea behind innovation infrastructure should be to ensure stability and the long-term development of incubators and cluster operations. Although a number of incubators are being developed, there is still a significant lack of adequate office space for innovative companies and start-ups in Osijek and Slavonski Brod.
Professionally delivered and tailored innovation support services are missing. Firms need support and guidance to integrate in regional and global value chains. Many of the analyzed companies still lack internal skills in engineering, IT, R&D, design, project management, sales and marketing. The use of expert services to assist with global marketing and sales, technology adoption, value-chain development, internationalization and financing might be considered. These services may come in various forms, from mentoring support programs to well-functioning cluster initiatives.
There is a sizable pipeline of business innovation projects
Preliminary estimates show that firms in Eastern Croatia are interested in considerable investments in innovation projects in the medium-term. Firms of all sizes are planning to develop new products and services, which are expected to be marketed within 1-3 years. They would largely rely on external sources of financing (ESIF primarily), with own co-financing of 10-30 percent. Discussions with visited firms reveal that they plan to invest a total of HRK 250 million (EUR 35 million) in innovation projects. A critical element that is emphasized is that support programs must be designed to respond to the specific need for new product development in the different phases of the innovation cycle up to commercialization.
Firms need investments in expertise, technology, and marketing to launch new or significantly improved products and services. Firms in knowledge-intensive sectors such as ICT and mechanical engineering plan to invest in training and hiring additional staff, while capital-intensive sectors such as food, wood, and chemicals intend to acquire new or upgrade existing equipment. The development of new products and services will also require investment in advice on marketing and penetrating new markets within and outside the EU, as well as innovation management and quality production systems.
Firms are constrained by the unfavorable business environment
The innovation ecosystem suffers from generally unfavorable business environment conditions. Firms complain about red tape and restrictive regulations. Barriers to market entry and exit, and
Diagnostic Report RAS Growth and Jobs in Slavonija, Baranja & Srijem
233
restrictive labor market regulations are a drag on resources that businesses could be directing towards innovative activities. Innovative businesses are also hampered by bureaucratic red tape, such as delays and difficulties in obtaining licenses and contracting utilities.
The perception of corruption and a lack of trust in the effectiveness of the legal framework is a significant barrier to innovation and growth. Many firms would welcome increased transparency in the public procurement process. Improved partnerships with the public sector could utilize innovation potential to develop renewable energy projects and various smart city services (public wireless, transport, etc.)
5.2. Sector-Specific Opportunities and Constraints on Innovation
5.2.1. Snapshot of ICT
Key Insights
• Eastern Croatia boasts an emerging ICT sector, but obstacles related to access to finance and a shortage of human capital constrain innovation activities.
• ICT firms struggle with lack of space and access to business support services.
• Opportunities exist to utilize synergies with other key sectors, as well as the public sector.
Despite the emergence of a number of successful ICT firms, the development of the sector and the integration of ICT in the regional economy have not reached their full potential. The ICT sector is by far the most productive of the strategically important sectors in Eastern Croatia, and its productivity has been steady both during the recession and the subsequent economic recovery. Several ICT firms have achieved notable successes on the national market – and some have even launched operations abroad. Recently, Ericsson Nikola Tesla established an R&D office in Osijek, which should contribute to the development of 4G and 5G technology alongside similar centers established in Zagreb and Split.
ICT firms262 in Eastern Croatia report two major obstacles to innovation-based growth: (i) access to finance, and (ii) a shortage of trained workers. Although microloans are offered, they do not adequately enable support for the development of new products. Alternative financial instruments such as seed and venture capital investments, or convertible loan schemes are not available. In addition, a shortage of skilled workers limits the sector’s potential to further expand. No strategic decision has been implemented yet to ensure the provision of ICT specialists and/or attract IT professionals to the region.
The development of the sector is constrained by lack of physical infrastructure and business support services. Access to collaborative knowledge spaces and to investors and finance is limited by the lack of physical, digital, and business support infrastructure (business incubators, testbeds, innovation parks, etc.) ICT start-ups in particular require services such as technological support and expansion services (mentoring, tailored consulting and training), as well as facilitated access to venture capital and other forms of early-stage finance.
262 The team interviewed six ICT firms from Eastern Croatia.
Diagnostic Report RAS Growth and Jobs in Slavonija, Baranja & Srijem
234
More intensive collaboration with PROs and more innovation-based projects for public services could help develop the sector further. Collaboration with scientific institutions is progressing well. For example, the new study program on Automotive Computing and Communications at FERIT263 and the Bachelor’s Program for Computer Science at the Department of Mathematics were designed in collaboration with Osijek Software City. However, despite the recent progress on education, many ICT firms report that generally the development of new technological solutions is not designed or sufficiently guided by scientific research and technical analysis. This is due to weak incentives for cooperation. Finally, the public sector in general is not sufficiently oriented towards innovative solutions for public services, and when it is, procurement of IT services targets mainly large firms.
The development of an innovation incubator center for ICT companies in Osijek could support the growth of existing companies, and help create a start-up ecosystem. This highly-demanded project could provide the necessary physical infrastructure and business support services for ICT firms and start-ups in Eastern Croatia. In addition, an innovative ICT sector cannot be developed without providing risk finance in the form of seed and VC investments, which could be connected to an accelerator program, possibly led by experts of local origin with entrepreneurial careers elsewhere.
For the sector to flourish, it is important to establish synergies with other key sectors – agriculture, food processing and mechanical engineering, as well as energy, environmental sustainability, and tourism. In order to stimulate demand for ICT services, the use of innovation vouchers needs to be mobilized. As a transversal technology, ICT has the potential to impact innovation and business performance in almost all industries. In some cases, there is already an effort to develop skills to maximize synergies between ICT and other sectors, such as the abovementioned program on automotive computing at FERIT, and the program in ICT in tourism at the College in Virovitica.
Box 3. A start-up developing an innovative hardware solution with global potential
A hardware production start-up in Osijek is an excellent example of a successful young team with high-tech ideas and ability to make globally competitive products. They market their hardware solutions globally under their brand name, providing services including design thinking, rapid product development, technical research on product innovation, building a functional prototype, and ensuring product compliance. Recently they launched a prototype of superb first-person view goggles for drones and have already closed an investment deal with an EU-based VC investment fund.
The company is an excellent example of a successful high-tech start-up with an innovative product with global potential. Usually, such companies emerge around innovative and talented teams and innovative ecosystems, e.g. (i) a professionally managed accelerator with appropriate infrastructure (as proposed by Osijek Software City association), (ii) a high-tech investment fund for both seed and VC phase investments, (iii) an innovation cluster with high-end equipment for prototyping in software, hardware and mechatronic development; (iv) a critical concentration of highly-skilled and motivated entrepreneurs.
263 A graduate study program in Automotive Computing and Communications (AutoCom) will be launched in 2019. The program will be completely in English in collaboration with Rimac Automobili, Institute RT-RK, AVL AST, GlobalLogic, Xylon and Yazaki.
Diagnostic Report RAS Growth and Jobs in Slavonija, Baranja & Srijem
235
5.2.2. Snapshot of Food and Agriculture
Key Insights
• Firms in the agri-food sector are not well-integrated into global and regional value chains.
• Innovation activities are mostly limited to improving sales or productivity, and efforts to develop new products are rare.
• Opportunities to serve emerging market niches could be seized by strengthening market research as well as technological capacities, and intensifying collaboration with PROs.
The food and agriculture sector in Eastern Croatia could take advantage of opportunities arising from several emerging customer segments and market niches. Specifically, firms264 have identified convenience products (easy-to-prepare food), indulgence products (food as an experience, connected with agri-tourism), organic food, and pet food as being particularly interesting.
Orientation towards these segments would require integration into global and regional value chains. However, there are several constraints connected to innovation which prohibit farmers, SMEs and large companies in Eastern Croatia from integrating into sustainable value chains:
(i) Lack of strategic information and research. Companies do not regularly perform strategic market research in order to identify new market segments and understand demand. Investment in research and innovation is still too low to allow for the development of new products with higher value added and to access new market niches.
(ii) Lack of risk incentives. Companies in this sector do not have any particular motivation to innovate, i.e. to undertake risks to develop new products or open up new markets. They only regard innovation as a means of improving sales of existing products and/or increasing their productivity. Most companies in food and agriculture consider small market sizes and conservative consumers as the main constraints on innovating.
(iii) Lack of technological capacities and business services. Technological upgrades are achieved mainly through external (foreign) R&D acquisition and adoption of foreign technology, while cooperation with local PROs has been limited. Lack of regular industry-science dialogue has contributed to a perception by some firms that local PROs do not have the capacity to provide technological innovations, which may not be the case. Insufficient innovation advisory services (such as quality control, marketing, branding, food safety, etc.) also hinder the development of the food industry and strategic integration into global value chains.
PROs have the potential to become a more effective partner for the industry by building on existing capacities and enhancing technology extension competences. With adequate support, PROs could become a regional backbone for the provision of technology extension services in agriculture and the food industry. The demand of the private sector for technology upgrades could be fulfilled by local PROs – notably the Institute of Agriculture, Faculty of Food and Technology, Faculty of Agro-
264 The team met with eight companies in the agriculture and food industry.

Diagnostic Report RAS Growth and Jobs in Slavonija, Baranja & Srijem
236
biotechnical Sciences, Požega Polytechnic, and the Veterinary Institute – especially as they already have advanced laboratories and equipment.
There is ample scope for vertical integration of agriculture and food innovation cluster(s), organized on a bottom-up principle. This would require financial support for agri and food business cluster(s), along with support for capacity development and innovation advisory services. The planned R&D center for agriculture in Virovitica is a step in the right direction, provided it obtains steady operational financing (not envisaged in the current project), and establishes linkages in an innovation cluster with PROs in Osijek and Vinkovci. If approved, the Centre of Competence for Healthy Food Chains in Osijek could be regarded as a pilot example for other industrial segments to set up similar innovation clusters.
5.2.3. Snapshot of Wood
Key Insights
• Innovation in wood sector firms is related mostly to sales or productivity improvements.
• The main constraints on companies in the wood sector are related to access to finance for technological upgrades.
• Despite the importance of the wood industry in Eastern Croatia, there has not been any PRO work in this area, although recently there has been some progress.
• Possible avenues for future innovation activities could focus on design, new materials, clean tech, and biotechnology.
Wood sector exports from Eastern Croatia are dominated by primary products, raw materials and semi-finished goods with lower added value. Companies lack high-technology processing capacities, which is one of the reasons why imported products dominate the furniture market in Croatia. In general, the value chain of wood and forest industries has not yet been well developed in Eastern Croatia. The wood industry involves many interdependent activities – the production of joinery, parquet, furniture, paper, wood pulp, bio-fuel – and value-chain development would require more effective supply chain management to link these industries.
Wood companies265 indicate that the main constraints on the development of the sector are conservative consumers, small market size and poor access to finance for technological upgrades and exports. In general, they see innovations only as a means of improving sales of existing products and increasing productivity. Firms perceive opportunities for innovative development only in acquiring new or significantly upgraded production equipment, or in developing connections with other sectors (e.g. energy).
However, new business models and product categories are emerging, allowing smaller companies to compete on quality and product differentiation. Design-responsive service and customized processing and finishing are market segments where innovations are critical. A mix of long-term and short-term measures is necessary in order to overcome market and governance failures and help companies in this sector to grow in terms of innovations. Innovation in the wood industry sector could be promoted by better articulating the regional cluster and its supportive innovation ecosystem to develop key
265 The team met with three companies in the wood sector.
Diagnostic Report RAS Growth and Jobs in Slavonija, Baranja & Srijem
237
areas of growth. A joint innovation agenda should help identify innovation needs and focuses (specialization niches), as well as the innovation-enhancing activities to be deployed - training, infrastructure, value-chain development, etc. This agenda could then be supported by innovation policy programs for the wood industry.
Several initiatives have been launched to address the need for innovation in this sector. The Centre of Competence for the Wood Industry in Virovitica started working two years ago, and the infrastructure and equipment were financed through an OPCC grant. However, because there is no financing for operational activities, this well-equipped center is still far from being used at its full potential.
Existing cluster initiatives have not yielded the expected economic benefits. There are three clusters operating in Eastern Croatia: the Wood Industry Cluster of Slavonia (4), the Wood Industry Cluster of Vukovarsko-Srijemska County (22) and the ‘Slavonian Oak’ Cooperative Society (12). The underwhelming results are partly related to inadequate models of organizational structure, which are based on horizontal rather than vertical integration of cluster members. In other words, much of the lack of effectiveness of clusters is due to a lack of implementation of supply-chain management in the overall production system. In addition to this, the well-known wood quota problem continues to exist, where companies are exposed to a limited and unreliable supply of wood via the state-owned enterprise Croatian Forests.
Through innovations related to design (furniture), new materials, clean tech and biotechnology, the wood industry could leverage new economic opportunities that could benefit the regional economy. Through design and innovation, the furniture sector could revive and offer creative and high-quality furniture with higher export potential. New uses are also emerging from new technological solutions connected with biotechnology and clean-tech, especially related to bio-economy. Examples include biomedical solutions and the production of bioenergy from process waste and wood-based textiles (like in Finland). Seizing these opportunities would require more intense cooperation with education and research institutions,266 as well as support through innovation clusters, proper forest management, and green production practices.
5.2.4. Snapshot of Mechanical Engineering
Key Insights
• The mechanical engineering and machinery sector features a diverse ecosystem consisting of technologically-advanced export-oriented firms and a network of educational institutions and specialized PROs.
• However, due to lack of awareness of PRO technological capacities, technology and knowledge transfer is limited.
• The establishment of a new center of competence would provide expertise and high-end equipment for prototyping in software, hardware and mechatronic development, and for training in advanced skills.
266 Currently, there is no faculty of forestry at the University of Osijek, though a program for forestry was recently launched at the Faculty of Agro-biotechnical Sciences.
Diagnostic Report RAS Growth and Jobs in Slavonija, Baranja & Srijem
238
• The sector would benefit from the availability of risk finance such as equity and quasi-equity.
The mechanical engineering sector in Eastern Croatia boasts a vibrant export-oriented private sector, with a well-established ecosystem in place. Firms267 in the mechanical engineering sector (machinery manufacturing) are well developed technologically, and many produce for export. Many of them are concentrated in Brodsko-Posavska County, which also hosts two relevant secondary schools (one for machinery and another for metal processing). In addition, Slavonski Brod is home to the satellite Faculty of Mechanical Engineering of the University of Osijek, a polytechnic with a strong program in mechanical engineering, and several business support institutions. Slavonski Brod also hosts one of the largest industrial groups in Croatia – Đuro Đaković – which has a long-standing tradition in the metal and machinery industry, producing military vehicles, railroad freight cars, steel bridges, factories, and power plant equipment.
However, the sector is struggling to retain qualified workers, especially as engineers are highly sought after in the rest of Croatia and abroad. The demand for engineers exceeds the supply provided by the University of Osijek, and in some cases, technologically obsolete study programs produce graduates that are not well equipped to integrate into the much more advanced private sector. Overall, the supply of skills does not match industry needs and the cooperation between PROs and industry is insufficient.
The insufficient awareness of firms of the technological capacity in PROs is hindering cooperation with them and preventing effective technology and knowledge transfer. This means that the technological capacity of companies is typically developed from their own resources. Innovation and cooperation between business and PROs is particularly important for mechanical engineering and mechatronics. These industries provide opportunities for enhancing integration in global value chains, especially in the automotive value chain. A good example of this is the cooperation between FERIT and Rimac Automobili, which resulted not only in a joint teaching program, but also in the establishment of a new R&D office of the company in Osijek, which will work on developing high-voltage transformers, and systems for charging electric car batteries, among other things.
Businesses in mechanical engineering do not invest enough in formal and informal education or training their employees, and more government support is needed in this respect. The Nova Gradiška Technology Incubator is a good example of providing education and technology extension services but should be modernized with new equipment and re-organized to add companies and PROs to the stakeholders’ structure in order to become a real innovation cluster and provide modern technology extension services to companies.
The development of an innovation center for mechanical engineering in Slavonski Brod, connected to the existing one in Nova Gradiška, is crucial for the future development of this sector. The development of center(s) of competence (innovation clusters) for mechanical engineering and the metal processing industry is key for Eastern Croatia to strengthen its research and innovation capacity. It is important to ensure private sector involvement and leadership in these organizations. The innovation cluster would provide expertise and high-end equipment for prototyping in software, hardware and mechatronic development, and for training in advanced skills (mechatronics, CNC machinery, software design engineering, composite materials, etc.)
267 The team met with nine firms in the mechanical engineering sector.

Diagnostic Report RAS Growth and Jobs in Slavonija, Baranja & Srijem
239
The mechanical engineering sector will not grow significantly without improving access to finance for innovative SMEs. Risk funding for innovative and high-tech SMEs is needed in the form of either equity or quasi-equity to ensure the sustainability of this highly-productive sector.
Box 4. A high-tech company developing innovative mechatronics machines in the automotive industry
An export-oriented, high-tech company in Slavonski Brod found their niche in producing industrial mechatronic machines for manufacturing automotive parts. Manufacturing equipment is usually produced and sold in large lots, but typically there is no offer of tailored, custom-specific machines with non-standard specifications, which is exactly what the firm provides.
The company designs and produces highly-efficient and reliable computer-driven machines for customers with specific demands. Their service includes customized design, simulations, testing, and producing entire manufacturing machines, including installation at the customer’s plant. Such mechatronic custom-specific products allow them to achieve excellent revenues. The firm has a highly productive and skilled team of engineers and technicians focused on maintaining high-level quality control and process management systems.
For the next steps in the firm’s growth, they would like to improve their production equipment so that they can accept more orders and increase their production capacity. This is a good example of a company which would be a good investee for a high-tech VC fund who would, besides finance, also provide the company with access to new markets. Alternatively, they could also invest in broadening their business with a repayable advance loan, or risk-sharing leasing of manufacturing equipment.
5.3. Pipeline of Innovation Projects in Selected Firms
There are plenty of R&D innovation project ideas ready to be financed; the issue is having the right instrument and approach to support firms. As part of the fieldwork and visits to companies, attention was paid to finding examples of innovation-based business development projects. The idea behind this exercise was to understand whether there is a pipeline of potential projects and what the level of their maturity is.

Diagnostic Report RAS Growth and Jobs in Slavonija, Baranja & Srijem
240
Table 23 presents several examples of projects that might be considered and that the private sector in Eastern Croatia is working on. The information presented is based on first order assessment, an innovation idea concept-note assessment, and companies’ track record working on RDI so far. This is just an illustration of the potential for innovation projects, taking into account their technology readiness level and stage of investment readiness.
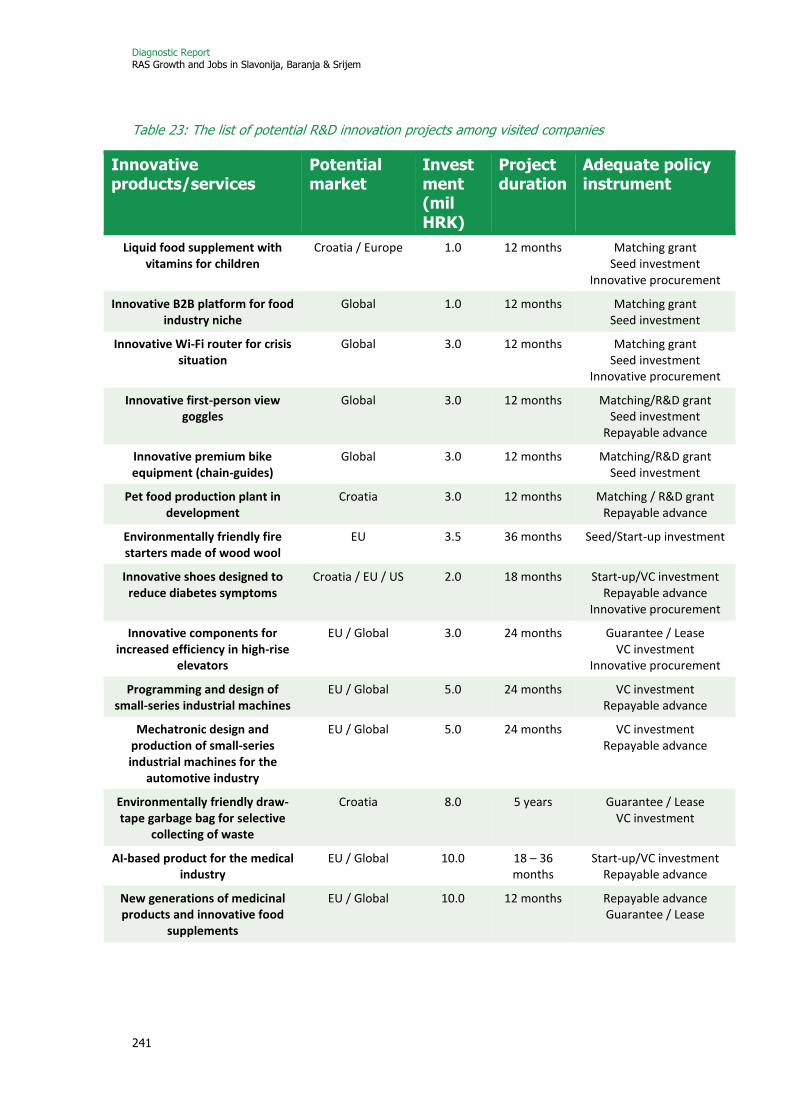
Diagnostic Report RAS Growth and Jobs in Slavonija, Baranja & Srijem
241
Table 23: The list of potential R&D innovation projects among visited companies
Innovative products/services
Potential market
Investment (mil HRK)
Project duration
Adequate policy instrument
Liquid food supplement with vitamins for children
Croatia / Europe 1.0 12 months Matching grant Seed investment
Innovative procurement
Innovative B2B platform for food industry niche
Global 1.0 12 months Matching grant Seed investment
Innovative Wi-Fi router for crisis situation
Global 3.0 12 months Matching grant Seed investment
Innovative procurement
Innovative first-person view goggles
Global 3.0 12 months Matching/R&D grant Seed investment
Repayable advance
Innovative premium bike equipment (chain-guides)
Global 3.0 12 months Matching/R&D grant Seed investment
Pet food production plant in development
Croatia 3.0 12 months Matching / R&D grant Repayable advance
Environmentally friendly fire starters made of wood wool
EU 3.5 36 months Seed/Start-up investment
Innovative shoes designed to reduce diabetes symptoms
Croatia / EU / US 2.0 18 months Start-up/VC investment Repayable advance
Innovative procurement
Innovative components for increased efficiency in high-rise
elevators
EU / Global 3.0 24 months Guarantee / Lease VC investment
Innovative procurement
Programming and design of small-series industrial machines
EU / Global 5.0 24 months VC investment Repayable advance
Mechatronic design and production of small-series industrial machines for the
automotive industry
EU / Global 5.0 24 months VC investment Repayable advance
Environmentally friendly draw-tape garbage bag for selective
collecting of waste
Croatia 8.0
5 years Guarantee / Lease VC investment
AI-based product for the medical industry
EU / Global 10.0 18 – 36 months
Start-up/VC investment Repayable advance
New generations of medicinal products and innovative food
supplements
EU / Global 10.0 12 months Repayable advance Guarantee / Lease

Diagnostic Report RAS Growth and Jobs in Slavonija, Baranja & Srijem
242
6. Recommendations
Addressing the shortcomings of the innovation system in Eastern Croatia requires a multi-pronged approach. A number of elements are missing from the innovation ecosystem, and prioritizing interventions is made more challenging by their mutual interdependence. We group the recommendations in four categories. First, it is necessary to improve cooperation and coordination at three different levels: between national and regional authorities, among PROs, and between PROs and the private sector. Second, existing financing mechanisms should be managed more efficiently, and new instruments should be introduced to better respond to innovation needs in the region. Third, innovation support infrastructure should be improved, both from the perspective of providing more business services, and increasing physical infrastructure. Finally, investing in human capital will be necessary to improve research and innovation competences, and increase efficiency in generating research and innovation results. Considering the aforementioned, the prioritization of the recommendations largely depends on the current context and circumstances under Project Slavonija, Baranja and Srijem. Certain recommendations may be implemented in a shorter period of time, but for some, the timeline may be more long-term.
Figure 106 Improving the innovation performance of Eastern Croatia will require a multi-pronged approach
•Increasing coordination between national and regional authorities
•Enhancing cooperation between PROs and industry
•Improving cooperation among PROs
Effective Cooperation and Coordination
•Improving existing financing schemes at the national level
•Leveraging existing investment priorities under OPCC for innovation
•Establishing a dedicated innovation funding mechanism for Eastern Croatia
•Increasing and improving the mix of instruments
•Supporting technological and non-technological innovation and the use of innovation services
Accessible and Flexible Financing
•Developing innovation support services and infrastructure
•Improving technology transfer capabilities
Improved Innovation Support Infrastructure
•Improving governance in PROs
•Ensuring provision of adequate skills and human capital supply
•Enhancing research and innovation competences
Upgrading Skills for Innovation
Diagnostic Report RAS Growth and Jobs in Slavonija, Baranja & Srijem
243
6.1. Effective Cooperation and Coordination
Increasing coordination between national and regional authorities
Governance improvements are required to address overlapping competencies across national agencies and to improve vertical coordination within the region. This includes coordination between ministries, the ESIF managing authority, Level 1 and 2 implementing bodies, HAMAG-BICRO, RDAs, and other agencies. Delegating programming and implementation of specific regional actions in R&I to the regional level would be beneficial for improving governance and implementation.
A regional R&D and innovation policy approach is necessary to increase R&D and innovation performance, designed in coordination between national and regional authorities. In defining this policy approach, Eastern Croatia should be able to utilize top-down national policies and combine them with more bottom-up approaches conceived at the regional level. A good opportunity to set the tone at the national level will be the upcoming revision of the Smart Specialization strategy in 2019. Regional and local stakeholders should define the innovation agenda for Eastern Croatia jointly with the relevant ministries at the national level (MRDEUF, MoSE, MoEEC), with corresponding priority areas for support and intervention. Coordination with national authorities should maximize the impact and synergies of EU funds, by amending policy programs and mechanisms within OPs and national initiatives to take full advantage of complementarities between them. The renewed policy approach should better address the innovation needs of businesses and PROs in the region, offer more suitable and accessible financial assistance, and provide implementation capacity support. Regional authorities should ensure that the innovation agenda corresponds with local innovation needs, including needs for sectoral initiatives such as clusters and centers, access to finance for micro firms and SMEs, and export support, including through value-chain integration in relevant industries, such as the agri-business and metal sectors, especially with neighboring countries.
From a horizontal perspective, policy interventions should be aimed at improving the general level of innovation capacity of all firms and PROs, and set the basis for technological learning across all types of companies and public institutions. These relate to access to finance, training and business and technology diffusion services. Diffusion activities include support for technology adoption (and training assistance), both financially and by means of hands-on support through extension services and upgrading activities. Strategies for building public research capabilities should also be incorporated into regional innovation plans and oriented more towards responding to local needs and competences. Public R&D organizations and educational institutions should be strengthened, or created where missing, to address priority regional demands. Funding support and capacity-building efforts should be directed towards the development of more research-performance-driven institutions. In particular, the new innovation plans should have a long-term roadmap for building up competences over time and towards specific regional socio-economic priorities. This particularly applies to public research and innovation institutions, whose funding should be sustainable in the medium and long-term.
From a vertical perspective, leveraging cluster and network coordination to address regional technological and innovation challenges in key sectors is a pertinent strategy for Eastern Croatia. Sector-focused interventions should be articulated in wood processing, engineering and metal processing, food and agri-business, ICT and tourism, along with innovation and training agendas supported by innovation policy programs. This approach has helped many regions in Europe, notably in Spain (Murcia), Portugal, the Netherlands and France (Vitagora) to boost innovation systems and performance in traditional sectors such as agri-food industries.
Public procurement of innovation solutions for public services could be an avenue for encouraging innovation activity in firms, catalyzing public research, but also improving administration and
Diagnostic Report RAS Growth and Jobs in Slavonija, Baranja & Srijem
244
regional governance. In this way, the public sector would create a market for technology and innovation but also modernize and improve its efficiency. In Eastern Croatia, a lack of potential providers could limit the implementation of such a policy as it commonly exists in Western European countries. Therefore, a pilot program following a step-by-step approach could be considered, focusing on one or two areas of application where technology providers exist or where public research shows potential for developing solutions. A national-level initiative could help advances in this direction, leveraging support from central authorities and other innovation support programs such as R&D funding, industry-science collaborative projects, and/or start-up support programs. Examples of how this policy could be successful in Eastern Croatia include procurement of ICT solutions for e-governance, and technological solutions for waste and water management.
Enhancing cooperation between PROs and the private sector
Better coordination between the public and private sector is needed, not only on R&D collaboration but also through bilateral flows of interaction. This would include joint master’s and PhD research projects with residency in industry; industry-focused, problem-targeting internships for university graduates; bi-directional personnel mobility (researchers in industry; professionals from industry doing part or full-time lab/research residency in universities); and training programs and ad-hoc technical programs for industry. Collaborative R&D, engineering, quality testing/calibration services, and other forms of technology adoption and extension services are also avenues for enhancing industry-science collaboration. These activities could be funded with more calls for collaborative projects and partnerships.
To effectively address industry needs for coordination, it is necessary to bolster support for clusters in the region. Coordination is key for economically or technology-related firms to overcome common bottlenecks, such as missing key technological or production infrastructure, by sharing innovation tasks and jointly creating innovation solutions. Cluster agendas might cover R&D and more downstream activities such as technology testing, demonstration, commercialization, training and value-chain upgrade/integration activities, as well as technology adoption, quality certifications and standards, and technology/productivity diagnostics. The support for cluster and network formation within OPCC should be followed up by diagnostics that would inform the innovation agenda, and which would subsequently be funded. Education and training support programs for innovation clusters could also be provided through OPEHR268 measures, possibly involving professionals and experts from abroad and other parts of Croatia (especially those originating from Eastern Croatia). The design of cluster programs should take on board the lessons from the delayed OPCC program for centers of competence by choosing lead partners in a strategic and transparent manner, and by avoiding overlaps in activities. An innovation cluster with average equipment, assuming 7-year operational support, would cost up to EUR 5 million. Supposing that 5 innovation clusters would be created in Eastern Croatia (ICT, agriculture, wood, food and mechanical engineering), the total investment would not exceed EUR 3.5 million annually. In the second stage, implementation of innovation activities would require specific funding, and in parallel this could be matched (on a competitive basis) with related innovation support programs for SMEs.
Improving cooperation among PROs
Inter-institutional collaboration and collaboration across regions should be intensified, with the support of a funding mechanism dedicated to Eastern Croatia. This includes joint PhD and master’s
268 http://arhiva.strukturnifondovi.hr/UserDocsImages/Novosti/FINAL%20OP%20EHR.pdf

Diagnostic Report RAS Growth and Jobs in Slavonija, Baranja & Srijem
245
programs, especially in agriculture and biosciences. Connectivity and mobility initiatives linked to training and research projects for MScs, PhDs and fellowships should be strengthened. The Unity through Knowledge Fund is a good example of connectivity both nationally and with foreign institutions and researchers, including the Croatian diaspora. In terms of the need to increase research excellence, the University of Osijek and other PROs in Eastern Croatia would benefit from a dedicated UKF fund for Eastern Croatia. A regional body (UKF branch) or specific program could be developed to introduce funding instruments to stimulate research excellence. A program of this kind would fit very well in the context of Eastern Croatia, as it is an internationally recognized program (best practice) for making the best of migration.269
6.2. Accessible and Flexible Financing
Public support for investments in R&D and innovation in the private sector should be increased and tailored to the innovation needs of firms in Eastern Croatia. Overall, current state support for innovation in the business sector in Eastern Croatia is too small to have a significant impact, so mobilizing absorption of EU funds is critical. Support is necessary in the areas of technology adoption, non-technological innovation, joint innovation activities in key sectors, and value-chain development. The mix of policy measures for R&D and business innovation should be targeted and more balanced, supporting different types of beneficiaries along various stages of the innovation chain.
Improving existing financing schemes at the national level
The grant and matching grant scheme application process should be simplified, and new delivery mechanisms should be designed to support different types of innovation. Application and grant procedures should be streamlined with faster, more transparent, and efficient administration, which will require improved administrative capacity and evaluation competences. Evaluation quality could be improved by including national and international evaluators with industrial expertise on the evaluation panels, as in most EU innovation agencies. In addition, new delivery mechanisms should be considered to respond to the needs of different types of companies (SMEs, large, and young firms) and effectively support the different stages in the innovation and life cycle. This would also include more public consultations on the design and implementation of programs and instruments, and improved monitoring and evaluation instead of administrative burdens to prevent fraud by applicants. Innovation support schemes should cut across ministerial/county boundaries and include coordination mechanisms between national and county/city levels.
Institutional support should be provided for preparatory and planning activities for strategy-setting and project preparation both for PROs and the private sector. The quality of proposals could be improved by providing grants for research/innovation preparatory work (not more than EUR 3-5 thousand) and assisting firms in connecting with relevant potential partners. This should entail personnel and support services related to project preparation (e.g. writing in English and/or translations, etc.) Improving the quality of proposals would make evaluation easier and faster. The following considerations could apply:
− In PROs, preparatory assistance will entail helping institutions strategically plan and deploy future investments in research and training, and connect with international and national institutions to accelerate capacity development, specialization and research excellence standards. PROs also require technical assistance and appropriate training for EU project
269 Awarded by the ILO for good practice on the topic of ‘Promoting the linkages between migration and development’ and awarded by EREF for ‘Developing human capital and managing migration for more competitive European regions’.
Diagnostic Report RAS Growth and Jobs in Slavonija, Baranja & Srijem
246
preparation and implementation. This could leverage funding for preparatory activities, particularly in research infrastructure.
− For the business sector, assistance could be provided through existing business support entities such as regional development agencies, innovation support institutions (centers of competence, incubators, innovation centers) and PROs. Support for project preparation should include assisting firms in: (i) identifying innovation needs and project relevance and feasibility; (ii) helping firms to articulate innovation projects and connect with relevant partners; (iii) directing firms towards available funds with assistance for project application. This assistance and related consultancy on project articulation should be provided free of charge, at least to SMEs and young firms. In addition, to increase interest in innovation funding programs, policy actions should be complemented with awareness and outreach campaigns, visits to chambers, associations and universities/PROs, and also with online, phone, and face-to-face desk support.
Leveraging existing investment priorities under OPCC for innovation
Additional funds for innovation investment in Eastern Croatia could be leveraged within the existing investment priorities of OPCC. Examples of available resources include actions as part of integrated territorial investment. In the current OPCC,270 EUR 20 million has been allocated for RDI and 60 million for business competitiveness. A portion of these funds should be partly allocated to Eastern Croatia in coordination with the cities of Osijek and Slavonski Brod. Additional funds in the OPCC framework could also be allocated through financial instruments271 in order to create a risk fund for innovative enterprises with a focus on Eastern Croatia. Within other measures of the current OPCC, the allocation for business infrastructure organizations could be used to support innovation clusters or introduce/promote typical support activities that a BSO should provide (for more information, see the respective section of the chapter).
Establishing a dedicated innovation funding mechanism for Eastern Croatia
A regional innovation funding program could work well for Eastern Croatia. Regional authorities could have a leading role in designing such a program, which should be supported by regional mechanisms for project preparation, promotion and implementation. The government has already committed to providing funding specifically for Eastern Croatia, a portion of which could be assigned to a dedicated innovation funding program. This will ensure that programs are designed to respond to specific regional needs, and will allow innovation actors to enhance their capacity by competing against regional peers, rather than top performers nationally. In doing so, it is fundamental to improve implementation and administration procedures at national-level agencies and deploy local support mechanisms for project preparation.
An alternative strategy could be to create a regional innovation fund and a corresponding administrative agency which could manage funds for Eastern Croatia. In order to implement a tailored policy mix for business innovation and R&D support programs, the proposed regional agency/fund should have strong professional capacities and operational autonomy. The agency could coordinate and mobilize actions for policy strategies and implementation, and have a leading role in awareness and outreach initiatives. The fund could manage the financing of all R&D and innovation
270 OPCC 2014-2020, p. 333 http://arhiva.strukturnifondovi.hr/UserDocsImages/Documents/OPKK_2014_20_FINALNI_NACRT_21_07_2014.pdf 271 Specific objective 3a1 - Easy access to finance for SMEs, including start-ups; as above, p. 103.
Diagnostic Report RAS Growth and Jobs in Slavonija, Baranja & Srijem
247
instruments, both for PROs and businesses, and could help with building up capacity to absorb ESIF funds. The fund could contribute towards simplification of administrative procedures related to investments in RDI. Furthermore, it could increase access to finance for SMEs in the region, as well as provide risk finance. Finally, the Government could provide additional national funds for innovation activities in the region and channel them through an innovation fund for Eastern Croatia, ensuring a more efficient, stable and agile platform to support Project Slavonia, Baranja and Srijem.
Increasing and improving the mix of instruments
When choosing instruments, there needs to be a clear distinction between incremental innovation projects and services, and R&D-based projects with longer horizons. Incremental innovation projects and services can benefit from simple and fast implementation based on reimbursement schemes such as innovation vouchers. R&D grants and matching grants would be more suitable for longer-term projects, but eligibility and evaluation criteria should be simplified. The existing matching grant scheme should be revised to allow for fast-track evaluation by specialists. Matching grants can be effective in promoting business R&D and leveraging additional private investment, conditional upon effective administration and a relevant pipeline of projects.
In general, the choice of instruments should be guided by the following considerations:
• Grants should continue to be available as a support mechanism for R&D projects to all types of enterprises, but the design, implementation and evaluation should be strengthened. R&D grant support should be accessible and delivered on a regular basis (e.g. twice a year), with a simple but rigorous application procedure and flexible financial plan, and have maximum aid intensity allowed by state aid regulations. Evaluation should be rapid and merit-based, performed by experts from respective industry sectors. This type of support requires high in-house capacities of companies, and would require enhancing their R&D capabilities. Project conditions, criteria and evaluation should be tailored to the type of research (fundamental research, industrial research or experimental development). The annual amount for possible R&D support of this kind in Eastern Croatia, considering current and future capacities, would not exceed EUR 5 million.
• Innovation support for SMEs should be delivered in the form of grants and repayable advances (convertible loans), including for process and organizational innovation. This support should be focused on SMEs willing to develop intangible assets, improving their production/service delivery, etc. Grants should be deployed at regular intervals, and because of lower aid intensity (50 percent) should be very flexible, rapid, and focused on monitoring and evaluation, rather than administrative requirements for applications. Grants should be underpinned with coaching and training support provided by innovation clusters (incubators and technology centers). Aside from grants, the program for innovation in SMEs should include a repayable advance instrument (soft loans), i.e. loans where the conditions for repayment depend on the outcome of the project. This would allow for a higher flexibility of project activities and higher liquidity for innovation than grants. This support program is expected to be the most generous and should also increase the demand for innovation within the business ecosystem in Eastern Croatia. Because of the currently limited capacities for innovation, this support program could amount to about EUR 10 million annually.
• New and existing start-ups would benefit from support in the form of soft loans, guarantees and grants. A special support niche is necessary for start-ups, in the form of quasi-equity instruments (repayable advances/soft loans) connected with mentoring and acceleration support. The most efficient way of delivering this would be through start-up accelerators/incubators, which would, besides financial support, also provide all necessary
Diagnostic Report RAS Growth and Jobs in Slavonija, Baranja & Srijem
248
innovation advisory and support services, and physical facilities. Osijek and Slavonski Brod would be good candidates to host such incubators, given the already existing private sector demand in these locations. The Potential Innovation Fund for Eastern Croatia could coordinate this effort within the region. The investment amount for this program should not exceed EUR 10 million over 3 years.
• Innovative and high-tech SMEs would be good candidates for a mix of repayable advances, and seed and VC investments. An investment ‘risk finance’ fund could provide funding to innovative and high-tech SMEs in the form of either equity or quasi-equity. This would include (i) acceleration financing, i.e. initial (seed) financing supporting entrepreneurs to research, assess and develop an initial concept; (ii) VC financing providing follow-up funding to SMEs upon successful graduation from the acceleration stage, or to SMEs which have not participated in the acceleration stage, as long as the initial concept is developed. This support could be designed in the form of an investment fund managed by a financial intermediary selected by public tender, who would also provide private investments to the fund. Such an initiative to create a VC fund for Croatia has recently been launched by the European Investment Fund,272 with an allocation from TO3 of EUR 23 million. A dedicated VC fund and accelerator for Eastern Croatia could be based on experiences of similar projects.273 The investment for a seed and venture capital initiative dedicated to Eastern Croatia should not exceed EUR 10 million.
Beyond financial instruments, regional innovation could also be incentivized through tax deduction schemes. In the context of Eastern Croatia, simplified schemes could be considered particularly for: (i) acquisition of technology and equipment (like in Poland); and (ii) hiring highly-skilled employees such as engineers and researchers; (iii) entrepreneurs setting up new businesses (like in France). The government reintroduced tax incentives for business R&D at the national level, but improvements may be warranted in its design and administration.
Supporting technological and non-technological innovation and the use of innovation services
Facilitating technology upgrades is fundamental for the business sector to accelerate competence formation for innovation. This will help firms be in a better position to start R&D projects and eventually move towards more ambitious R&D-oriented collaborative approaches. A renewed policy approach should provide mechanisms for firms to upgrade productive systems through technology diffusion, incremental innovation, and adoption and creation of technological innovation. Technology acquisition, purchasing equipment and upgrading production systems can be addressed through loans and credit lines via the banking system and relevant agencies, as well as matching grants for investment. Tax deductions can also be implemented for purchasing new technology/equipment (see above).
Technological upgrades should be complemented by support for non-technological innovation. This could include training associated with technology adoption, adoption of new organization and managerial practices, new business models, and advisory services regarding productivity diagnostics, marketing and commercialization. Such projects could be financed through grants and innovation vouchers (see section 4). This will require revisiting the current rules of the innovation voucher
272 Croatian Venture Capital Initiative, http://www.eif.org/what_we_do/resources/CVCiFoF/index.htm 273 Bulgarian Early Stage Fund(s) with Acceleration Component http://www.eif.org/what_we_do/resources/jeremie/calls-for-expression-of-interest/2016/2016_call_EOI_JEREMIE_Bulgaria_JER-009_8.htm, Western Balkans Enterprise Development & Innovation Facility http://www.eif.org/what_we_do/resources/wbedif/index.htm, www.sc-ventures.com

Diagnostic Report RAS Growth and Jobs in Slavonija, Baranja & Srijem
249
scheme274 to extend the eligibility of service providers to public and private BSOs, as well as polytechnics and innovation centers. The scheme should have a streamlined and rapid procedure (less than a month) for grants or reimbursements, and should operate year-round on a rolling-window basis. The vouchers should also allow for support of non-technological innovation and advisory services such as ICT services, assistance in product design and engineering, adoption of quality systems, and other forms of organizational change. This is the practice in most European countries, where innovation vouchers are used to subsidize broader innovation services, not only R&D services. A complementary activity would be to leverage the support of offices for SME development and their regional network. Experiences from Poland, the Czech Republic and Estonia demonstrate how these entities can help direct firms to specific support providers and funding lines, and even provide direct advisory services on business project planning, exporting, new organizational practices, and finance.
6.3. Improving Innovation Support Infrastructure
Developing innovation support services and infrastructure
Innovation infrastructure and the provision of innovation services should be strengthened by improving their funding model. Besides developing physical space, support for existing innovation infrastructure should be designed to ensure long-term development and sustainability, covering operating costs, personnel costs, and the provision of specialized and customized business support services and training programs. This applies to incubators, centers of competence, and other innovation support providers. Advanced human capital formation and hiring of researchers should be considered in line with strategic areas, and in the conception of centers of competence, centers of excellence, and R&D centers, possibly combining ESF with ERDF funding. Funding should remain competitive, and require private sector contributions or evolve towards performance-based funding contracts. This will require extended matching resources through multi-annual funding schemes (e.g. 4 years) subject to periodical monitoring and evaluation. It is also necessary to ensure centers abide by good governance practices: establishing a board of directors based on the triple-helix principle (academia-government-industry), defining innovation and research agendas and milestones, defining contributions and commitments through activity plans, establishing rules for collaboration and exploitation of results (IPR), pooling funding by combining regional/supra-national funding, and periodical evaluation (see OECD, 2016).
More organizations could be included in providing business advisory services. Business services related to non-technological innovation and business advisory could be provided by a new business innovation center of a more horizontal nature (serving all industries and types of companies), or by expanding the activities of existing providers. Existing institutions, such as polytechnics, could also be leveraged to provide technology extension services. A natural evolution of professional schools is enhancing their role in the provision of training and innovation services (see recent initiatives with companies in section 3.3), including technology extension and engineering services for clusters and priority sectors (especially agriculture and processing industries), and upgrading production and managerial practices. This could be complemented by enriching technology extension competences at PROs (for example at the Institute of Agriculture, this has already been identified as a priority line of action).
274 Currently, innovation service providers can be only ‘registered’ R&D organizations according to Croatian law, and the majority are PROs and large companies. In addition, the procedure needs to be more agile and less burdensome.

Diagnostic Report RAS Growth and Jobs in Slavonija, Baranja & Srijem
250
Improving technology transfer capabilities
Enhancing knowledge transfer and technology commercialization will require adjustments and improvements of the current institutional mechanism. The Technology Transfer Office (TTO) at the University of Osijek (TERA Tehnopolis) could be transformed into an industry-liaison office providing
more diverse industry-science linkages and articulating technology transfer activities. A regional support office for knowledge transfer can help PROs and firms in the process of technology transfer, assisting them in deploying training and infrastructure setting, and other supportive actions. This would cover challenging issues related to rules for commercialization, licensing, IPR, and ownership rights. For this support mechanism for technology transfer to work, funding must be carefully considered. The technology transfer team must have the competences and/or resources to learn about the management of research, intellectual property rights, commercialization practices, and applying for and maintaining patents, designs, copyrights, plant breeders’ rights, etc.
6.4. Upgrading Skills for Innovation
Improving governance in PROs
The leading local PROs involved in research activities (the University of Osijek and the Institute of Agriculture) should develop an institutional research strategy and corresponding action plan/agenda. This should be adapted to regional needs and balance basic and applied research to better respond to socio-economic challenges. The agenda should set objectives and milestones regarding advanced human capital formation, investment in research areas and infrastructure, guidelines for use of infrastructure, and evaluation mechanisms. The current strategy of the University of Osijek should be evaluated, particularly with respect to its alignment with the Action Plan (which appears to be in need of improvement). Institutions should also define a research infrastructure plan for the next 4 years, which should be reflected in the national/regional infrastructure roadmap. This will set the basis for an inventory and utilization code for PROs in Eastern Croatia, including rules for sharing equipment across faculties and institutions. The work on research planning and infrastructure should be supported by creating research management units, which would be in charge of organizing and supporting units to plan and deploy research and research infrastructure, setting up supportive platforms (e.g. open science and data platforms), and monitoring activities.
Ensuring provision of adequate skills and human capital supply
In order to address the mismatch in skills and supply of human capital, linking with industry would help to improve the design of programs and increase enrollment in HEIs. Curricula should be designed jointly by PROs and industry,275 including clusters and value-chain participants, and this collaboration should also extend to industry participation in the design of university strategies, impact assessments and participation on university/polytechnic boards. Company-led initiatives to establish ad-hoc specialized vocational and training programs jointly with education and training institutions should also be encouraged. In addition to current efforts to boost enrollment, additional financial support to students in the form of scholarships, particularly in STEM areas, could help attract young people to stay in the region, and possibly attract students from other regions (some scholarships already exist, but the challenge of a lagging region may require more to be done on this front).
275 See the example of FERIT, which recently developed a program for the automobile industry in cooperation with Rimac Automobili.

Diagnostic Report RAS Growth and Jobs in Slavonija, Baranja & Srijem
251
Providing job prospects by linking with employers through internships and training practices would also enhance the attractiveness of HEIs.
Further support should be provided to strengthen education programs in polytechnics, expand joint initiatives with industry, deploy innovation support actions, and leverage existing activities. Požega and Slavonski Brod serve as good examples of polytechnics with strong engagement in research, technological activities, and collaboration with other PROs and industry. To reinforce research competences, these institutions should establish and strengthen formal linkages with the university, as well as other pertinent PROs in the region.
Enhancing research and innovation competences
To improve research competences, PROs in Eastern Croatia should tackle the shortage in research personnel and improve incentive frameworks for existing researchers. Research teams should be strengthened by creating new research and post-doctoral positions for scientists and technologists in key scientific areas. This will entail lifting hiring restrictions, and funding support for human capital formation and new positions for both young (post-doctoral) and senior researchers. PROs should look to attract both national and foreign talent. In addition, the incentive framework for existing personnel should be updated, including policies for career promotion, technology transfer activities, intellectual property rights, and monitoring and evaluation procedures. To learn from the experiences of others, an in-depth study benchmarking the University of Osijek with several universities of similar size, such as the University of Rijeka, University of Debrecen, University of Maribor and University of Pecs might be considered. In line with international best practice, the incentives framework should acknowledge scientific performance, teaching quality, and contributions to regional economic development (e.g. through industry-science cooperation, training, mobility, entrepreneurial initiatives, participation on industry boards and at conferences, etc.) ESIF support for capacity development in research and internationalization combined with associated governance reforms could help grow more competitive research systems with a greater impact on regional economies.
To accelerate learning and catch-up, and adopt good practices in research and research project preparation, it is necessary to increase the internationalization of PROs. Existing efforts in internationalization at the University of Osijek should be further strengthened through a special funding mechanism. The University could establish an international board with prominent researchers, innovators and public sector representatives. Efforts should be invested in attracting prominent researchers to the University of Osijek with special packages and incentives, possibly leveraging the expertise of scholars in the diaspora. The attraction of foreign talent should be prioritized in the areas of the engineering, agri-business, ICT, and wood industries. Streamlined administrative procedures for highly qualified foreigners (e.g. for work permits), and income tax incentives for foreign professionals would facilitate this process. The development of international teaching programs in English and other foreign languages should be further stimulated. Special calls for PROs in Eastern Croatia to partner with international institutions with a strong innovation track record (twinning projects) would also contribute to internationalization efforts.
Cross-regional and international connectivity actions should be established in all education, research and innovation activities within the business and public sector. Eastern Croatia is well-positioned to strengthen connectivity with leading regions and cities, as well as with foreign partners, to maximize synergies with the rest of the national innovation system, and to speed up the process of catching up. Working and deploying joint projects with international partners would help to accelerate the convergence of the region in terms of quality of research and innovation projects and international best practices (e.g. managing new research and innovation centers, research excellence, etc.) Building regional innovation capacity in lagging regions entails working across regions and implementing mechanisms for policy collaboration, i.e. knowledge exchange, personnel mobility (cross-region
Diagnostic Report RAS Growth and Jobs in Slavonija, Baranja & Srijem
252
mobility), technology and regional funds, etc. Lagging regions should incorporate the development of interregional connections and relationships – so-called ‘pipelines’ (Bathelt et al. 2004) that help cross-fertilize efforts and accelerate capacity building and economic cooperation (Rodriguez-Ponce and Wilkie, 2017).
Chapter References Aprahamian, A; Correa, P.G. 2015. Smart Specialization in Croatia: Inputs from Trade, Innovation, and Productivity Analysis. Directions in Development--Countries and Regions. Washington, DC: World Bank Group. https://openknowledge.worldbank.org/handle/10986/22024
Bačić, K.; Aralica, Z. 2017. Regional Competitiveness in the Context of ‘New Industrial policy’ – The Case of Croatia. Zbornik radova Ekonomskog fakulteta Rijeka. 35:2, 551-582.
Bathelt, H., Malmberg, A., & Maskell, P. 2004. Clusters and Knowledge: Local Buzz, Global Pipelines and the Process of Knowledge Creation. Progress in Human Geography, 28(1), 31-56.
Božić, L., Rajh E. 2016. The Factors Constraining Innovation Performance of SMEs in Croatia. Economic Research-Ekonomska Istraživanja. 29:1, 314-324 http://dx.doi.org/10.1080/1331677X.2016.1168040
CEPOR 2017. Small and Medium Enterprises Report Croatia – 2016. CEPOR (SMEs and Entrepreneurship Policy Center), Zagreb May 2017. Available at: http://www.cepor.hr/wp-content/uploads/2015/04/Cepor-izvjesce-2016-ENG-web.pdf
Cirera, X., Maloney, W. F. 2017. The Innovation Paradox: Developing-Country Capabilities and the Unrealized Promise of Technological Catch-Up. Washington, DC: World Bank Group. https://openknowledge.worldbank.org/handle/10986/28341
European Commission. 2018. Country Report Croatia Including an In-Depth Review on the Prevention and Correction of Macroeconomic Imbalances, 7.3.2018, SWD(2018) 209 final, https://eur-lex.europa.eu/legal-content/EN/TXT/?uri=SWD:2018:209:FIN
Singer, S., Sarlija, N., Pfeifer, S., Oberman Peterka, S. 2017. GEM Croatia 2016 Report. https://www.gemconsortium.org/report/49832
Račić, D., Švarc, J., Testa, G., 2018. RIO Country Report 2017: Croatia. EUR 29155 EN, Publications Office of the European Union, Luxembourg.
Malekovic, S., Puljiz, J. and Keser, I. 2018. The Impact of Cohesion Policy on Croatia’s Regional Policy and Development. POLO-Cro28 Policy Paper, July 2018. http://polocro28.irmo.hr/wp-content/uploads/2018/07/The-Impact-of-Cohesion-Policies-on-Croatia%E2%80%99s-Regional-Policy-and-Development-1.pdf
OECD. 2013. OECD Reviews of Innovation Policy: Croatia 2013. OECD Publishing, Paris https://doi.org/10.1787/9789264204362-en
OECD. 2016. Strategic public/private partnerships in science, technology and innovation, in OECD Science, Technology and Innovation Outlook 2016, OECD Publishing, Paris. Available at: http://dx.doi.org/10.1787/sti_in_outlook-2016-10-en
Rodriguez-Pose, A; Wilkie, C. 2016. Revamping Local and Regional Development through Place-based Strategies. London School of Economics, Working paper.
Shapira, P., Youtie, J. Cox, D., Uyarra, E., Abullah, G., Rogers, J. and Downing, C. 2015. Institutions for Technology Diffusion, Inter-American Development Bank Technical Papers, Washington DC, June 2015.
World Bank Group. 2018. Croatia - Systematic Country Diagnostic (English). Washington, D.C.: World Bank Group. http://documents.worldbank.org/curated/en/452231526559636808/Croatia-Systematic-Country-Diagnostic

Diagnostic Report RAS Growth and Jobs in Slavonija, Baranja & Srijem
253
Chapter 6 Financial Instruments

Diagnostic Report RAS Growth and Jobs in Slavonija, Baranja & Srijem
254
Chapter 6: Summary In terms of business activity, Slavonia lags behind the rest of Croatia. Overall, Slavonia accounts for only 9 percent of the total number of firms in Croatia, despite having 18 percent of the total estimated population in 2017. Most firms in Slavonia are micro, small and medium-sized. Despite being the backbone of Slavonia’s economy, micro, small and medium-sized enterprises face difficulties in accessing finance, which impedes their growth. Agriculture, forestry and fishing is the most dominant sector in three of the five counties in Slavonia, and the second most dominant in the remaining two.
Micro firms and small and medium enterprises (SMEs) in Slavonia are characterized by low productivity, exports and profitability Even though employee productivity is above the national average in three sectors (agriculture; electricity, gas, steam and air-conditioning supply; transportation and storage), there are a large number of firms with very low productivity and few highly productive firms. Exports are correlated with firm size: over three-quarters of large firms and around two-thirds of medium-sized firms are exporters. In contrast, only a third of small firms and less than 10 percent of micro firms export their goods and services.
Firms in Slavonia, particularly large firms, are more indebted compared to the rest of Croatia, which hampers further investment. Large firms in Slavonia finance 62 percent of assets with long-term and short-term liabilities, 15 percentage points more than at the national level. This is particularly apparent in construction, electricity, gas, steam and air-conditioning supply, trade and agriculture. The share of high-debt firms increases with size, i.e. one out of ten micro firms are heavily indebted, and one in three medium-sized firms. In total, the share of heavily indebted firms (with debt-to assets ratios over 30 percent) at the national level is 9.2 percent, while in Slavonia it is 10.9 percent. Almost a third of firms in Slavonia have difficulties in covering even their interest expenses using their earnings.
However, pockets of good performance do exist. One example are the gazelles in Slavonia. One out of ten small firms in Slavonia with revenues ranging from HRK 1 to 50 million recorded an increase in total revenues of at least 50 percent or more. In total, there are almost 270 firms in the group of ‘fast growing’ small firms in Slavonia. These firms employ around 4,200 people, contribute 11.5 percent of overall revenues and almost one-fifth of export revenues. They are, by and large, small firms with less than 20 employees operating in construction, manufacturing (the production of meat and poultry meat products; machining) and trade.
Although micro firms and SMEs constitute a fundamental part of the economy in Slavonia, they experience limited access to the credit market. The financial sector is dominated by banks which are characterized by high levels of liquidity, strong risk aversion after the financial crisis, increasingly conservative policies which channel credit more towards large companies, and a lack of proper incentives or capacity to explore new and innovative approaches to finance. Provision of credit to the segment is further undermined by weak enforcement, inadequate or lack of collateral, and in some instances stringent customer-due diligence and documentary policies.
Besides having a limited access to the credit market, smaller businesses face obstacles in increasing their capital. The lack of alternative finance options mixed with the risk-averse nature of banks has made it difficult for micro firms and SMEs to get the finance they need. Financial leasing is limited mainly to motor vehicles, with a weak secondary market for repossessed equipment presenting the biggest constraint on its development. Venture capital funds and / or angel investor networks that would target start-up or scale-up existing micro, small and medium enterprises (MSMEs) are also missing. Accounts receivable based finance (e.g. factoring or invoice discounting) is barely practiced.
The financial sector can help leverage more EU funds by providing resources for pre-financing and co-financing. Commercial banks are more than intermediaries: through financial instruments, they are also a key partner in implementing policy objectives. However, less than a third of SMEs have used or
Diagnostic Report RAS Growth and Jobs in Slavonija, Baranja & Srijem
255
have experience with EU funds. Many micro firms and SMEs, especially in the agricultural sector, lack understanding of financial products and the potential benefits which various formal financial solutions might have for their businesses. Capacity-building programs, including those linked to financial support facilities, improved levels of consumer protection, as well as enhanced financial reporting practices are required to further strengthen the bankability of micro firms and SMEs.
The Government appears committed to improving access to finance and capital to support micro firms and SMEs’ contribution to economic growth, but better coordination and structure is needed to facilitate implementation. Financial support, backed by EU funding and usually implemented through development finance institutions, is central to the Government’s ambitions to ease access to credit for micro firms and SMEs. However, these initiatives are fairly small and could benefit from better targeting. An organized, transparent, and accountable public stakeholder coordination structure is needed for access to finance activities across all major sectors of the economy. Lack of data on Government support for access to finance, including its effectiveness, presents an obstacle to the efficient prioritization and implementation of micro firm and SME access to finance policies.
Both the Croatian Bank for Reconstruction and Development (HBOR) and the Croatian Agency for SMEs, Innovations and Investments (HAMAG-BICRO) are involved in the EU financial instruments program with the aim of facilitating financing for SMEs. They are involved in the management structure of European Structural and Investment (ESI) funds in Croatia as financial intermediaries. HAMAG-BICRO also has 3 EU-backed loan programs for regional development: Micro Investment Loans, Small Investment Loans and Micro Working Capital Loans. In addition to loans geared towards regional development, HAMAG-BICRO implements micro and small loans geared towards rural development. HBOR currently manages only one EU-funded financial instrument for SMEs – a loan program.
However, the uptake of financial instruments in Slavonia remains low. While the rationale for the use of financial instruments is sound, the challenges in practice reveal that more effort is needed to maximize their potential, given the different economic and geographic characteristics of the Slavonia region. The use of guarantees and loans offered by HAMAG-BICRO and HBOR to firms in Slavonia compares poorly with other parts of Croatia, which is unintentional. HAMAG-BICRO issues only 6 percent of its guarantees and 11 percent of its total loans to firms in Slavonia. Similarly, HBOR directs less than 15 percent of its overall support to firms in Slavonia, mostly in the construction and food industries, of which just a fraction relates to EU-funded financial instruments. Given the importance of Slavonia and the Government’s desire for its stronger regional development, this highlights the importance of appropriate program design, strategic management, and an adequate institutional framework. As essentially risk-financiers, both HBOR’s and HAMAG-BICRO’s risk strategy is the core of their businesses, and in the case of support to Slavonia, there is clearly room for taking more risk.
The model of utilizing EU funds through financial instruments to support specific underserved areas has to be shaped by local circumstances and needs. Circumstances in Slavonia are different compared to other parts of Croatia, so there may be scope for moving away from ‘one-size-fits-all’ approach. For example, as part of the broad goal of encouraging micro and SME growth or competitiveness, different approaches would be relevant to firms / individuals that have been identified as potential high-growth micro and SMEs in Slavonia, compared with those interested in undertaking routine investment but not on an expansion trajectory, or when supporting self-employment and micro-enterprises. These different requirements translate into the need for different financial products, with some of them involving accepting higher risk and implemented directly through development institutions, while others can be deployed on a relatively standardized basis through the retail banking sector. As part of the next phase of work, the World Bank team will propose modified or new investment strategies for financial instruments specifically targeting Slavonia.
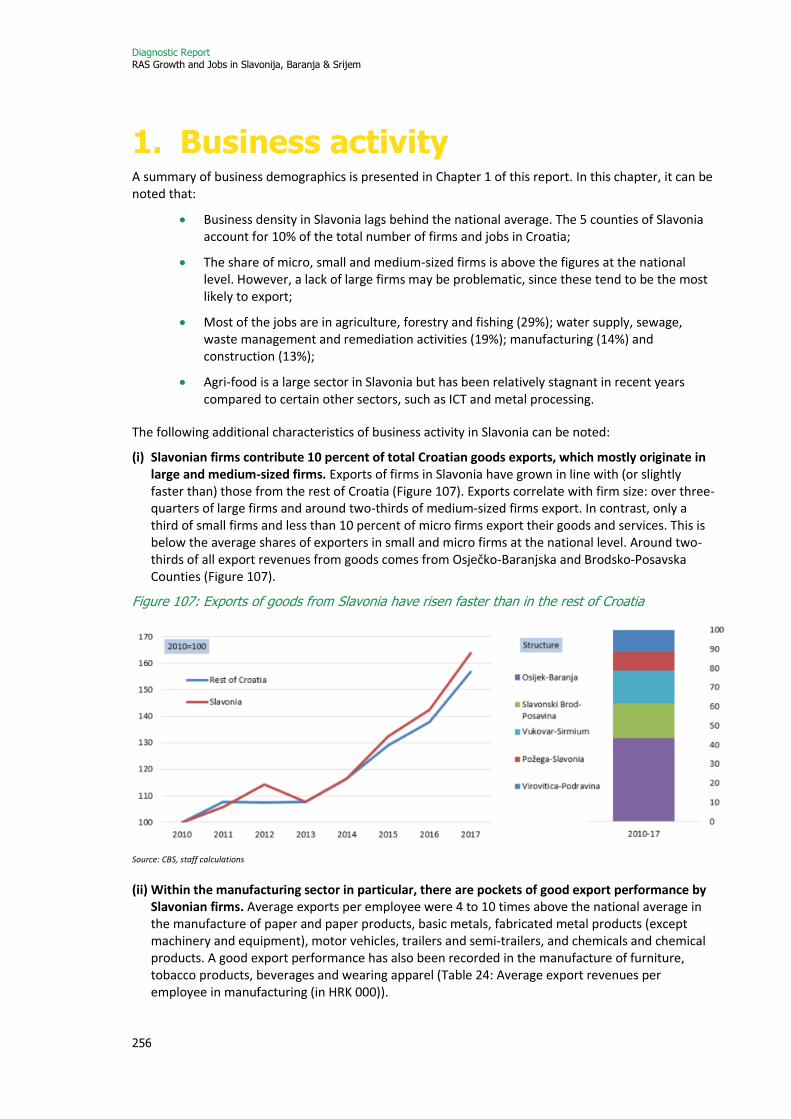
Diagnostic Report RAS Growth and Jobs in Slavonija, Baranja & Srijem
256
1. Business activity A summary of business demographics is presented in Chapter 1 of this report. In this chapter, it can be noted that:
• Business density in Slavonia lags behind the national average. The 5 counties of Slavonia account for 10% of the total number of firms and jobs in Croatia;
• The share of micro, small and medium-sized firms is above the figures at the national level. However, a lack of large firms may be problematic, since these tend to be the most likely to export;
• Most of the jobs are in agriculture, forestry and fishing (29%); water supply, sewage, waste management and remediation activities (19%); manufacturing (14%) and construction (13%);
• Agri-food is a large sector in Slavonia but has been relatively stagnant in recent years compared to certain other sectors, such as ICT and metal processing.
The following additional characteristics of business activity in Slavonia can be noted:
(i) Slavonian firms contribute 10 percent of total Croatian goods exports, which mostly originate in large and medium-sized firms. Exports of firms in Slavonia have grown in line with (or slightly faster than) those from the rest of Croatia (Figure 107). Exports correlate with firm size: over three-quarters of large firms and around two-thirds of medium-sized firms export. In contrast, only a third of small firms and less than 10 percent of micro firms export their goods and services. This is below the average shares of exporters in small and micro firms at the national level. Around two-thirds of all export revenues from goods comes from Osječko-Baranjska and Brodsko-Posavska Counties (Figure 107).
Figure 107: Exports of goods from Slavonia have risen faster than in the rest of Croatia
Source: CBS, staff calculations
(ii) Within the manufacturing sector in particular, there are pockets of good export performance by Slavonian firms. Average exports per employee were 4 to 10 times above the national average in the manufacture of paper and paper products, basic metals, fabricated metal products (except machinery and equipment), motor vehicles, trailers and semi-trailers, and chemicals and chemical products. A good export performance has also been recorded in the manufacture of furniture, tobacco products, beverages and wearing apparel (Table 24: Average export revenues per employee in manufacturing (in HRK 000)).
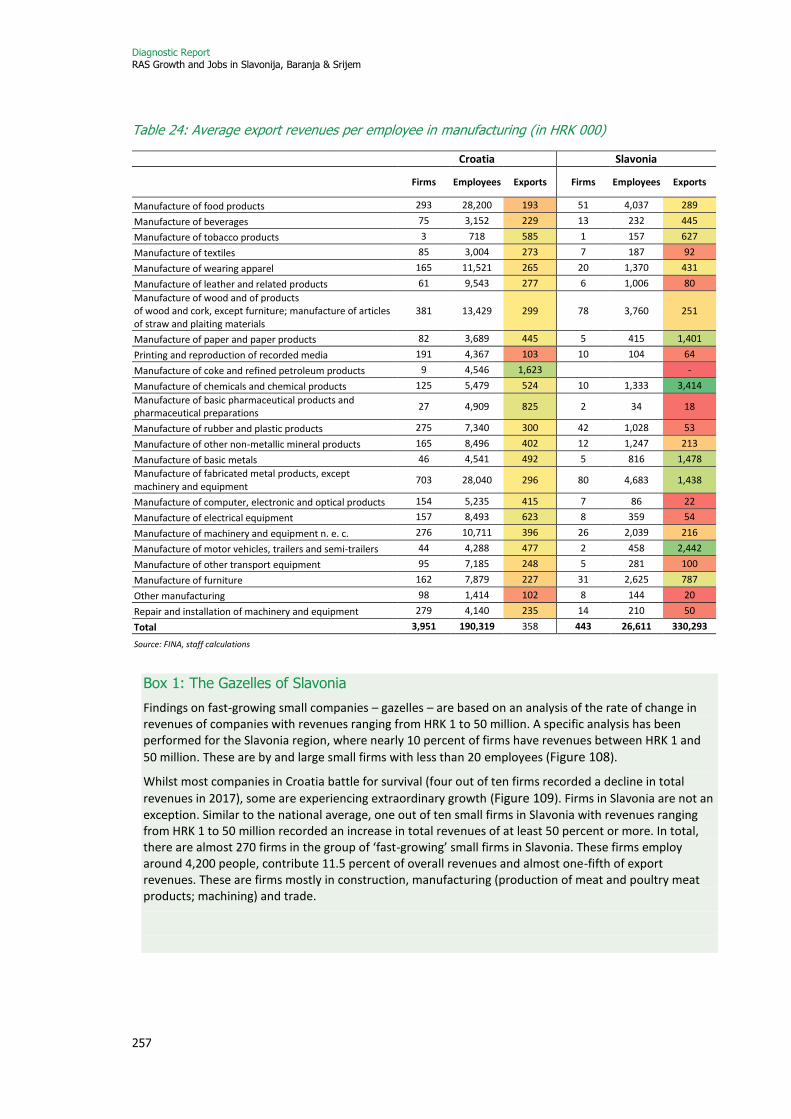
Diagnostic Report RAS Growth and Jobs in Slavonija, Baranja & Srijem
257
Table 24: Average export revenues per employee in manufacturing (in HRK 000)
Croatia Slavonia
Firms Employees Exports Firms Employees Exports
Manufacture of food products 293 28,200 193 51 4,037 289
Manufacture of beverages 75 3,152 229 13 232 445
Manufacture of tobacco products 3 718 585 1 157 627
Manufacture of textiles 85 3,004 273 7 187 92
Manufacture of wearing apparel 165 11,521 265 20 1,370 431
Manufacture of leather and related products 61 9,543 277 6 1,006 80
Manufacture of wood and of products of wood and cork, except furniture; manufacture of articles of straw and plaiting materials
381 13,429 299 78 3,760 251
Manufacture of paper and paper products 82 3,689 445 5 415 1,401
Printing and reproduction of recorded media 191 4,367 103 10 104 64
Manufacture of coke and refined petroleum products 9 4,546 1,623 -
Manufacture of chemicals and chemical products 125 5,479 524 10 1,333 3,414
Manufacture of basic pharmaceutical products and pharmaceutical preparations
27 4,909 825 2 34 18
Manufacture of rubber and plastic products 275 7,340 300 42 1,028 53
Manufacture of other non-metallic mineral products 165 8,496 402 12 1,247 213
Manufacture of basic metals 46 4,541 492 5 816 1,478
Manufacture of fabricated metal products, except machinery and equipment
703 28,040 296 80 4,683 1,438
Manufacture of computer, electronic and optical products 154 5,235 415 7 86 22
Manufacture of electrical equipment 157 8,493 623 8 359 54
Manufacture of machinery and equipment n. e. c. 276 10,711 396 26 2,039 216
Manufacture of motor vehicles, trailers and semi-trailers 44 4,288 477 2 458 2,442
Manufacture of other transport equipment 95 7,185 248 5 281 100
Manufacture of furniture 162 7,879 227 31 2,625 787
Other manufacturing 98 1,414 102 8 144 20
Repair and installation of machinery and equipment 279 4,140 235 14 210 50
Total 3,951 190,319 358 443 26,611 330,293
Source: FINA, staff calculations
Box 1: The Gazelles of Slavonia
Findings on fast-growing small companies – gazelles – are based on an analysis of the rate of change in revenues of companies with revenues ranging from HRK 1 to 50 million. A specific analysis has been performed for the Slavonia region, where nearly 10 percent of firms have revenues between HRK 1 and
50 million. These are by and large small firms with less than 20 employees (Figure 108).
Whilst most companies in Croatia battle for survival (four out of ten firms recorded a decline in total
revenues in 2017), some are experiencing extraordinary growth (Figure 109). Firms in Slavonia are not an exception. Similar to the national average, one out of ten small firms in Slavonia with revenues ranging from HRK 1 to 50 million recorded an increase in total revenues of at least 50 percent or more. In total, there are almost 270 firms in the group of ‘fast-growing’ small firms in Slavonia. These firms employ around 4,200 people, contribute 11.5 percent of overall revenues and almost one-fifth of export revenues. These are firms mostly in construction, manufacturing (production of meat and poultry meat products; machining) and trade.
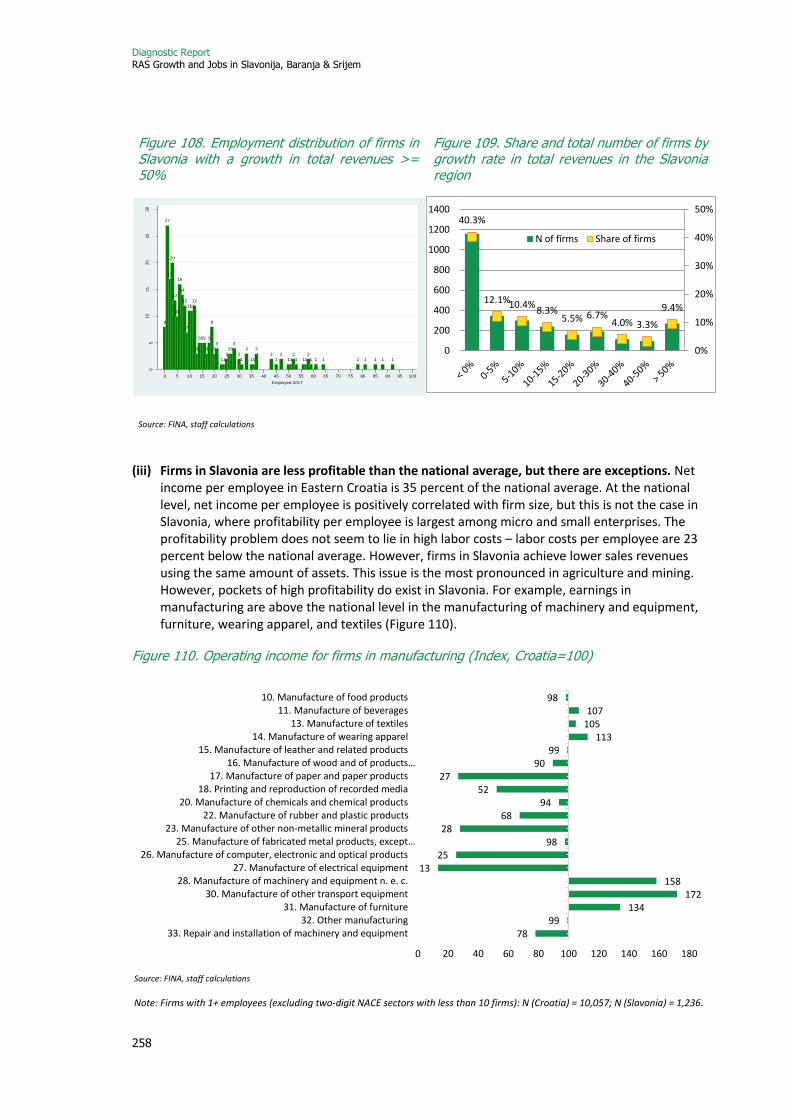
Diagnostic Report RAS Growth and Jobs in Slavonija, Baranja & Srijem
258
(iii) Firms in Slavonia are less profitable than the national average, but there are exceptions. Net income per employee in Eastern Croatia is 35 percent of the national average. At the national level, net income per employee is positively correlated with firm size, but this is not the case in Slavonia, where profitability per employee is largest among micro and small enterprises. The profitability problem does not seem to lie in high labor costs – labor costs per employee are 23 percent below the national average. However, firms in Slavonia achieve lower sales revenues using the same amount of assets. This issue is the most pronounced in agriculture and mining. However, pockets of high profitability do exist in Slavonia. For example, earnings in manufacturing are above the national level in the manufacturing of machinery and equipment, furniture, wearing apparel, and textiles (Figure 110).
Figure 110. Operating income for firms in manufacturing (Index, Croatia=100)
Source: FINA, staff calculations
7899
134172
15813
2598
2868
9452
2790
99113
105107
98
0 20 40 60 80 100 120 140 160 180
33. Repair and installation of machinery and equipment32. Other manufacturing
31. Manufacture of furniture30. Manufacture of other transport equipment
28. Manufacture of machinery and equipment n. e. c.27. Manufacture of electrical equipment
26. Manufacture of computer, electronic and optical products25. Manufacture of fabricated metal products, except…
23. Manufacture of other non-metallic mineral products22. Manufacture of rubber and plastic products
20. Manufacture of chemicals and chemical products18. Printing and reproduction of recorded media
17. Manufacture of paper and paper products16. Manufacture of wood and of products…
15. Manufacture of leather and related products14. Manufacture of wearing apparel
13. Manufacture of textiles11. Manufacture of beverages
10. Manufacture of food products
Figure 108. Employment distribution of firms in Slavonia with a growth in total revenues >= 50%
Figure 109. Share and total number of firms by growth rate in total revenues in the Slavonia region
Source: FINA, staff calculations
Note: Firms with 1+ employees (excluding two-digit NACE sectors with less than 10 firms): N (Croatia) = 10,057; N (Slavonia) = 1,236.
8
27
17
20
13
10
16
14
12
7
1111
12
3
555
3
5
8
3
4
11
2
33
4
2
1
3
11
3
2
1
2
11
2
1 11
2
1 1 1 1 1 1 1 1
05
10
15
20
25
30
Fre
qu
en
cy
0 5 10 15 20 25 30 35 40 45 50 55 60 65 70 75 80 85 90 95 100
Employed 2017
40.3%
12.1%10.4%8.3%
5.5% 6.7%4.0% 3.3%
9.4%
0%
10%
20%
30%
40%
50%
0
200
400
600
800
1000
1200
1400
N of firms Share of firms
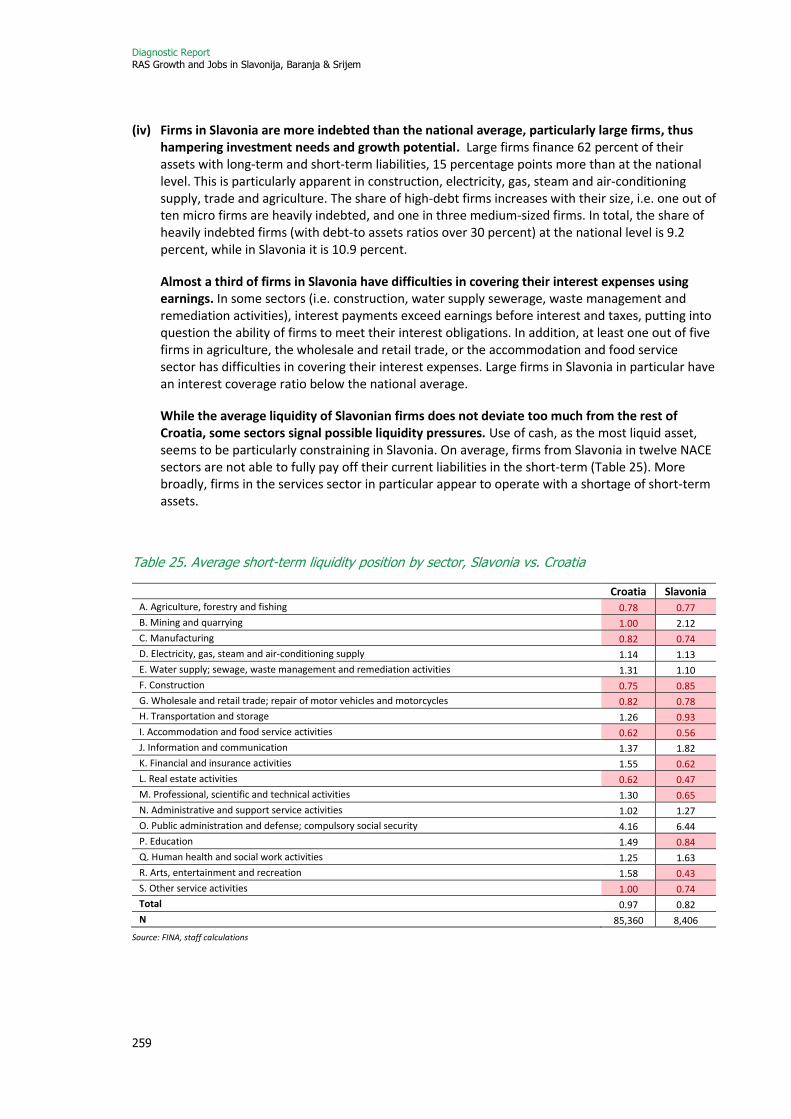
Diagnostic Report RAS Growth and Jobs in Slavonija, Baranja & Srijem
259
(iv) Firms in Slavonia are more indebted than the national average, particularly large firms, thus hampering investment needs and growth potential. Large firms finance 62 percent of their assets with long-term and short-term liabilities, 15 percentage points more than at the national level. This is particularly apparent in construction, electricity, gas, steam and air-conditioning supply, trade and agriculture. The share of high-debt firms increases with their size, i.e. one out of ten micro firms are heavily indebted, and one in three medium-sized firms. In total, the share of heavily indebted firms (with debt-to assets ratios over 30 percent) at the national level is 9.2 percent, while in Slavonia it is 10.9 percent.
Almost a third of firms in Slavonia have difficulties in covering their interest expenses using earnings. In some sectors (i.e. construction, water supply sewerage, waste management and remediation activities), interest payments exceed earnings before interest and taxes, putting into question the ability of firms to meet their interest obligations. In addition, at least one out of five firms in agriculture, the wholesale and retail trade, or the accommodation and food service sector has difficulties in covering their interest expenses. Large firms in Slavonia in particular have an interest coverage ratio below the national average.
While the average liquidity of Slavonian firms does not deviate too much from the rest of Croatia, some sectors signal possible liquidity pressures. Use of cash, as the most liquid asset, seems to be particularly constraining in Slavonia. On average, firms from Slavonia in twelve NACE sectors are not able to fully pay off their current liabilities in the short-term (Table 25). More broadly, firms in the services sector in particular appear to operate with a shortage of short-term assets.
Table 25. Average short-term liquidity position by sector, Slavonia vs. Croatia
Croatia Slavonia A. Agriculture, forestry and fishing 0.78 0.77
B. Mining and quarrying 1.00 2.12
C. Manufacturing 0.82 0.74
D. Electricity, gas, steam and air-conditioning supply 1.14 1.13
E. Water supply; sewage, waste management and remediation activities 1.31 1.10
F. Construction 0.75 0.85
G. Wholesale and retail trade; repair of motor vehicles and motorcycles 0.82 0.78
H. Transportation and storage 1.26 0.93
I. Accommodation and food service activities 0.62 0.56
J. Information and communication 1.37 1.82
K. Financial and insurance activities 1.55 0.62
L. Real estate activities 0.62 0.47
M. Professional, scientific and technical activities 1.30 0.65
N. Administrative and support service activities 1.02 1.27
O. Public administration and defense; compulsory social security 4.16 6.44
P. Education 1.49 0.84
Q. Human health and social work activities 1.25 1.63
R. Arts, entertainment and recreation 1.58 0.43
S. Other service activities 1.00 0.74
Total 0.97 0.82
N 85,360 8,406
Source: FINA, staff calculations
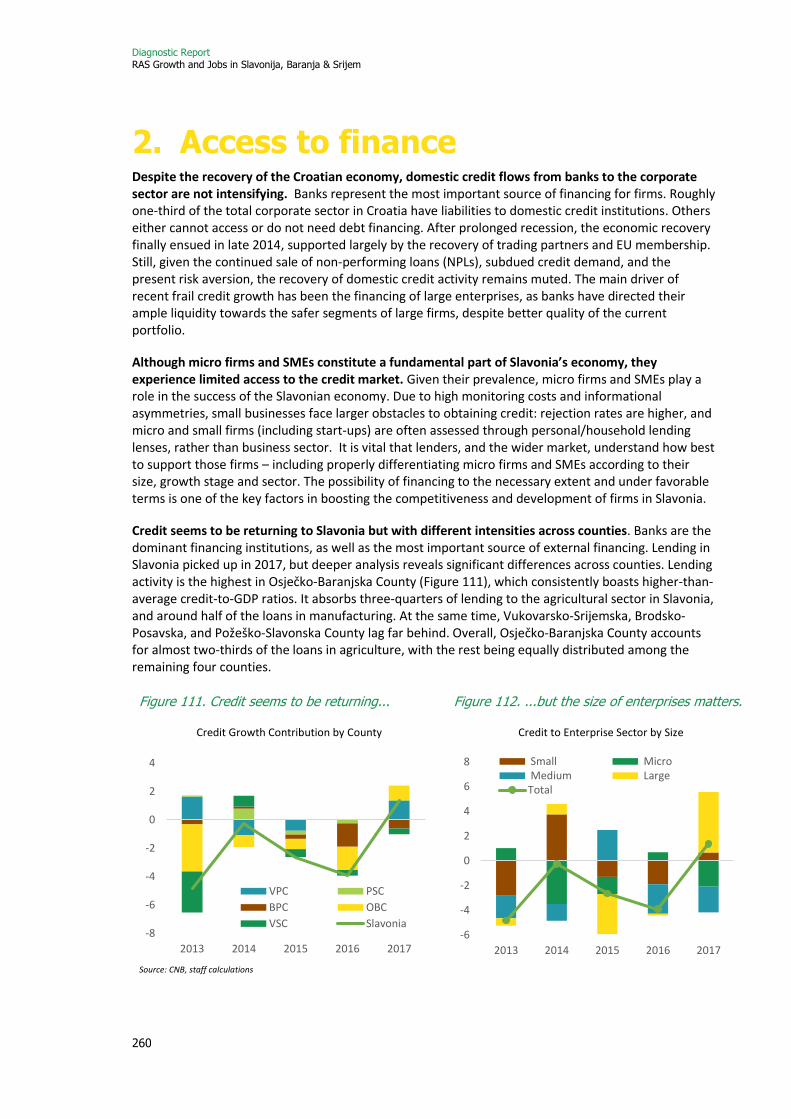
Diagnostic Report RAS Growth and Jobs in Slavonija, Baranja & Srijem
260
2. Access to finance Despite the recovery of the Croatian economy, domestic credit flows from banks to the corporate sector are not intensifying. Banks represent the most important source of financing for firms. Roughly one-third of the total corporate sector in Croatia have liabilities to domestic credit institutions. Others either cannot access or do not need debt financing. After prolonged recession, the economic recovery finally ensued in late 2014, supported largely by the recovery of trading partners and EU membership. Still, given the continued sale of non-performing loans (NPLs), subdued credit demand, and the present risk aversion, the recovery of domestic credit activity remains muted. The main driver of recent frail credit growth has been the financing of large enterprises, as banks have directed their ample liquidity towards the safer segments of large firms, despite better quality of the current portfolio.
Although micro firms and SMEs constitute a fundamental part of Slavonia’s economy, they experience limited access to the credit market. Given their prevalence, micro firms and SMEs play a role in the success of the Slavonian economy. Due to high monitoring costs and informational asymmetries, small businesses face larger obstacles to obtaining credit: rejection rates are higher, and micro and small firms (including start-ups) are often assessed through personal/household lending lenses, rather than business sector. It is vital that lenders, and the wider market, understand how best to support those firms – including properly differentiating micro firms and SMEs according to their size, growth stage and sector. The possibility of financing to the necessary extent and under favorable terms is one of the key factors in boosting the competitiveness and development of firms in Slavonia.
Credit seems to be returning to Slavonia but with different intensities across counties. Banks are the dominant financing institutions, as well as the most important source of external financing. Lending in Slavonia picked up in 2017, but deeper analysis reveals significant differences across counties. Lending activity is the highest in Osječko-Baranjska County (Figure 111), which consistently boasts higher-than-average credit-to-GDP ratios. It absorbs three-quarters of lending to the agricultural sector in Slavonia, and around half of the loans in manufacturing. At the same time, Vukovarsko-Srijemska, Brodsko-Posavska, and Požeško-Slavonska County lag far behind. Overall, Osječko-Baranjska County accounts for almost two-thirds of the loans in agriculture, with the rest being equally distributed among the remaining four counties.
Figure 111. Credit seems to be returning... Figure 112. ...but the size of enterprises matters.
Credit Growth Contribution by County Credit to Enterprise Sector by Size
Source: CNB, staff calculations
-8
-6
-4
-2
0
2
4
2013 2014 2015 2016 2017
VPC PSC
BPC OBC
VSC Slavonia-6
-4
-2
0
2
4
6
8
2013 2014 2015 2016 2017
Small Micro Medium LargeTotal

Diagnostic Report RAS Growth and Jobs in Slavonija, Baranja & Srijem
261
The main drivers of credit growth in Slavonia have been large enterprises, while loans to micro firms and SMEs have shrunk. Banks have directed their ample liquidity towards better-performing segments of the private sector (Figure 112). Both investment loans and loans for working capital are growing at a similar pace. However, in terms of structures, working capital loans are predominant in Slavonia. This partly reflects the substitution of long-term loans with continuously prolonged short-term debt (credit lines / overdrafts), which is a different trend than in the rest of Croatia, where the maturity profile has started changing in favor of longer term loans. ?
The share of lending to the agriculture sector is higher in Slavonia than at the national level, as would be expected from the structure of the economy in Slavonia. Around a quarter of lending to enterprises in Slavonia is in the agriculture sector (Figure 113), while nationally agriculture accounts for around five percent. About two-thirds of lending is long-term, and the rest is short-term. Credit is concentrated in mainly two sectors: pigs and poultry; field crops (cereals, oilseeds, protein crops, etc.) Other sectors, including horticulture, wine, milk, other grazing livestock, and other permanent crops, receive well below EUR 5,000 on average per farm. Surveys (European Investment Bank) suggest that many farmers (and agricultural households), particularly smaller ones, tend not to get sufficient external financing. According to the survey, the main reasons for not obtaining loans include the lack of equity capital and insufficient guarantees. Collateral for agricultural loans is an important issue, as rural land ownership is not always clear, and structures often do not have permits.
Figure 113. Loans in Slavonia tend to reflect the structure of Slavonia’s economy
Share of loans from banks to firms by sector of economic activity as a %
Source: CNB, staff calculations
The quality of loans to the corporate sector is generally better in Slavonia, with NPL ratios being 2 to 7 percentage points below the national average. Since its peak in 2015, the NPL ratio for the overall corporate sector has dropped more than 14 percentage points, amounting to 17.8 percent by end-2017 (Figure 114). The asset quality of bank loans to the corporate sector in Slavonia has been improving because of NPL sales, but NPLs remain concentrated in construction, manufacturing and trade. The portfolio is particularly poor in Brodsko-Posavska County, where the NPL ratio is above the national average. In terms of firm size, NPLs are concentrated mostly in micro enterprises, and the ratio is some five percentage points higher than the average NPL ratio of micro firms in Croatia. This suggests potential for more risk-sharing schemes through credit enhancement or guarantee programs or targeted risk-taking funding.

Diagnostic Report RAS Growth and Jobs in Slavonija, Baranja & Srijem
262
Figure 114. Corporate sector NPLs as a percentage of total loans
Source: CNB, staff calculations
What are the main constraints on access to finance in Slavonia? Three main constraints can be noted:
1. A high collateral requirement causes a constraint on bank lending in Slavonia. Banks skim deals from the market that have appropriate collateral, thus excluding micro firms and SMEs that do not have it. Providing finance is a heavy burden for small businesses, especially in the start-up phase. They are vulnerable and lack both collateral and reputation. Usually banks do not consider micro firms and SMEs to be sufficiently transparent or to have favorable profit-cost ratios compared to large companies or even households. This can also lead lenders to require large levels of collateral that micro firms and SMEs simply do not have. As a result, entrepreneurs perceive bank lending to micro firms and SMEs to be inaccessible due to excessive credit insurance.
2. Banks tend to be conservative in assessing risk, ruling out higher risks and lower rates of return on investment projects. Since the financial crisis, banks have become particularly risk averse. Riskier but viable micro firms and SMEs have therefore found it particularly difficult to obtain finance from banks. As far as business lending is considered, banks have a bias towards larger firms. Primarily, since default risk is higher for micro firms and SMEs than for larger firms, banks require higher equity capital as a precondition for lending to them. This is particularly pronounced in start-ups and scale-ups. This situation may be explained by the hypothesis of banks preferring transaction lending as opposed to relationship lending.
3. Smaller businesses tend not to consider alternative finance options. Bank lending is still the most common source of finance for many micro firms and SMEs to fulfil their start-up, cash flow and investment needs, but traditional bank finance may not be the most appropriate for certain types of business. This can pose a challenge to newer, innovative and fast-growing companies, with a higher risk-return profile. Entrepreneurs in general are not too familiar with other forms of financing and their advantages and disadvantages.
With many micro firms and SMEs lacking the collateral traditionally required to gain access to finance, invoice finance products can be particularly important. Invoice finance is a term used to describe funding against a range of business assets, including accounts receivable, inventory, plants and machinery, real property and even (sometimes) intellectual property and brands. The most common types include factoring and invoice discounting (collectively referred to as invoice finance). The key difference between factoring and discounting is who manages the sales ledger and collects payments. Factors - factoring finance providers - purchase the unpaid invoices of a business and advance most of the value of the invoices, with the balance less any charges paid when the invoices
5
10
15
20
25
30
35
40
45
50
2012 2013 2014 2015 2016 2017
Croatia
VPC
PSC
BPC
OBC
VSC
Slavonia
Diagnostic Report RAS Growth and Jobs in Slavonija, Baranja & Srijem
263
are paid by the end customer. Factors also manage the sales ledger and collect payment from the end customer, giving the finance provider greater visibility and control over the payment cycle. Invoice discounting is like factoring (indeed the legal mechanism by which it is typically provided - through debt purchase – is virtually identical) except the client business retains control over managing the sales ledger. In this way, the end-customers will not always be aware of the presence of the finance facility. While this type of financing is common in EU countries, the relevance of financing through invoice finance in Croatia, and Slavonia in particular, is low and its role has recently (further) diminished.
To support lending to micro firms, SMEs and mid-caps, capital relief products may be better suited than liquidity support. While banks’ liquidity is currently ample, capital is a scarce resource partly as a legacy of the crisis, and partly induced by the tightening of the regulatory environment. Risk sharing guarantees and securitization products add particular value. For the banks, they bring partial capital relief, decreased credit risk, and shorter recovery periods, and they also allow more efficient exposure management. Credit guarantee and securitization instruments bring significant and tangible benefits, but they could be further tailored in case of Slavonia. Further potential areas of improvement may include more flexible terms of guarantees, simplification and standardization of reporting, and broadening eligibility (e.g. mid-caps). Lastly, increased focus on risk sharing may be supported through new product adoption in commercial banks that mitigate credit risks. Some of the examples are credit cards issued by banks used by micro and small firms on the purchase of qualified inputs, credit lines for asset-based lending products, partial credit guarantees that guarantee the value of movable collateral, and funding or credit enhancements for value chain financing.
Providing finance using quasi‑equity products may be valuable in supporting employment and social inclusion. Quasi‑equity is often defined as a ‘patient’ capital, since it implies long‑term debt or financial investment with terms and conditions that do not require immediate repayment. Quasi‑equity is therefore particularly appropriate for social enterprises, which often have a financial‑social return gap. They provide goods and / or services to disadvantaged groups generating a high social impact but suffering from a lack of capital and low financial returns in their projects. The different forms of quasi‑equity (also known as mezzanine capital or mezzanine finance) are classified as closer to equity or debt capital, according to the level of ownership and the exposure to loss in the event of insolvency. In addition, there are mixed forms of financial product, defined as hybrid capital, which contain elements of grants, equity and debt capital.
However, supply of finance is just one side of the equation and other activities need to be undertaken to build capacity and capabilities amongst micro firms and SMEs. One such area is information, which is a fundamental building block for efficient, well-functioning markets. This is an aspect of smaller business finance markets that could be strengthened, as too often businesses either are not aware of or do not understand the variety of finance choices available to them. Lack of awareness and understanding of financial products can also reflect a more fundamental apathy and perceived absence of relevance to business owners.
ACCESS TO FINANCE SURVEY
As part of the World Bank Group support to the Ministry of Regional Development and EU Funds, a survey of firms in Slavonia is planned to help assess their financing needs. The survey would be implemented during 2019. This will be complemented with the results from the 2017 survey on access to finance. The results will help inform this study, and will be added to the report once available.

Diagnostic Report RAS Growth and Jobs in Slavonija, Baranja & Srijem
264
3. The Role of Government Several government policies and initiatives have aimed to address the lack of access to finance, especially for risky SMEs. Banks cannot be expected to design and provide products and services to meet the needs of all types of smaller business. Banks are not able to finance riskier SMEs, and the variety of products required by the smallest SMEs cannot be delivered efficiently by one type of financial institution. As credit institutions are not interested in providing finance for this segment of the economy due to the specific conditions of financing these activities, financial support has partially been taken over by the state through specialized credit and development institutions (Box 2).
Box 1: Croatian development finance institutions
The Croatian Bank for Reconstruction and Development (HBOR) is a state-owned development bank whose main role is to address market failures by providing financing either directly or together with commercial banks (credit institutions). Within the Croatian banking system, HBOR plays the role of a development and export bank established with the objective of financing the reconstruction and development of the Croatian economy. HBOR has an integral role in government economic policy as a state-owned specialized financier. Its footprint in the Croatian economy has been continuously growing. HBOR has a critical public policy role in implementing the government’s economic, social, and political policy, namely the sustainable development of the Croatian economy and the promotion of exports. The bank’s role has widened since its formation and has continued to evolve alongside the government’s strategic goals for the country’s social and economic development.
Lending facilities offered by HBOR are mostly extended to the broader SME sector. The credit lines offered by HBOR target specific groups and sectors of SMEs including agriculture, tourism, young entrepreneurs, women’s entrepreneurship, export-oriented SMEs, and innovations. There are a few different models of lending offered by HBOR: direct lending, indirect lending through banks / leasing houses, risk-sharing models with commercial banks, and subordinated debt lending facilities. Almost all credit lines offered by HBOR have interest rates discounted (subsidized) by 200 basis points for entities investing in areas of special state concern or supported areas – local government units located in specific regions, hill and mountain areas, or islands. Most local authorities in Slavonia are classified as one of the abovementioned groups.
Over the last few years in an environment of prolonged financial and economic crisis in the domestic market, HBOR has played an important role in supporting entrepreneurs and facilitating their access to finance. In addition, HBOR has been very active in supporting entrepreneurs in utilizing European Structural and Investment Funds (ESIF), both before and after Croatia’s EU accession, and in launching new financial instruments. HBOR plays a major role, as a national promotional bank, in the implementation of the Investment Plan for Europe (the ‘Juncker Plan’), utilizing both advisory as well as financing opportunities for investment promoters in Croatia.
The Croatian Agency for SMEs, Innovations and Investments (HAMAG-BICRO) was founded by the Croatian Government to deliver all type of support to SMEs, including grants, financial instruments, and non-financial support. HAMAG-BICRO is the main guarantee organization in Croatia supervised by the Ministry of Economy, Entrepreneurship and Crafts, and provides support to entrepreneurs through all development stages, starting from early-stage innovation (proof of concept) to commercialization and internationalization. HAMAG-BICRO guarantees are an important instrument in facilitating access to finance for SMEs and first-class collateral for financial institutions, since they cover losses on the first call. Guarantees are issued for loans approved by financial institutions (under the terms of the Credit Institutions Act) and other legal entities approving loans / leasing in Croatia. Depending on the guarantee program, HAMAG-BICRO charges or accrues guarantee
Diagnostic Report RAS Growth and Jobs in Slavonija, Baranja & Srijem
265
issuance fees. In addition to providing guarantees, HAMAG-BICRO also acts as a micro lending institution. It collaborates with almost all banks in Croatia, as well as with HBOR and leasing companies. Overall, the financial interventions of HAMAG-BICRO are funded from two sources: the national budget and EU funds.
HAMAG-BICRO still operates 3 budget-funded guarantee programs which are designed and adjusted to enterprise maturity (based on registration date and business activity) and harmonized with the offer of commercial banks and HBOR, and consequently allow easier access to loan funds for SME participants. These are as follows: (i) the beginners program, which targets SMEs which have been operating less than 5 years, with a maximum guarantee rate of 80 percent and a maximum guarantee amount of HRK 10 million for investments, working capital, leasing and innovations; (ii) the growth program, which targets SMEs which have been operating for more than 5 years, with a maximum guarantee rate of 80 percent and a maximum guarantee amount of HRK 18 million for investments, working capital, leasing, innovations (a guarantee rate up to 70 percent) and performance guarantees; and (iii) the farmers program with a maximum guarantee rate of 50 percent (for young farmers up to 80 percent) and a maximum guarantee amount of HRK 10 million for investments and working capital. These are being phased out with EU-funded sources.
HAMAG-BICRO also operated a microcredit program that was introduced in 2013 as a pilot scheme, prior to the introduction of the EU-funded loan scheme. Microcredits were offered at a subsidized interest rate of 0.99 percent with a 5-year-repayment period with the option of a 6 month-grace period. The program lasted for 3 years (2013-2015) and financed 32 SMEs. Eligible expenditures included fixed assets and working capital. The maximum loan amount was HRK 70,000 and later on was increased to HRK 120,000. Eligible applicants were start-ups in the first 2 years of operations.
The financial sector can help leverage more EU funds by providing resources for pre-financing and co-financing. EU membership allows Croatia to benefit from sizeable EU project-related transfers. However, less than a third of SMEs have used or have experience with EU funds (Figure 115). Under EU rules, projects need to be co-financed from own resources276 at rates ranging from 15 percent for cohesion funds to 25-50 percent for structural funds. Beneficiaries (both private and public) require funding for the co-financed portion, as the EU-funded project life cycle entails pre-financing (i.e. EU funded-projects are reimbursed) and co-financing. In addition to knowledge of project evaluation and selection, banks and development finance institutions can speed up project execution by providing pre-financing (in anticipation of the disbursement of EU grants) and co-financing of EU projects, in particular among SME recipients but also among local and regional governments.
276 Depending on the type of projects, this can range from 15 to 50 percent.
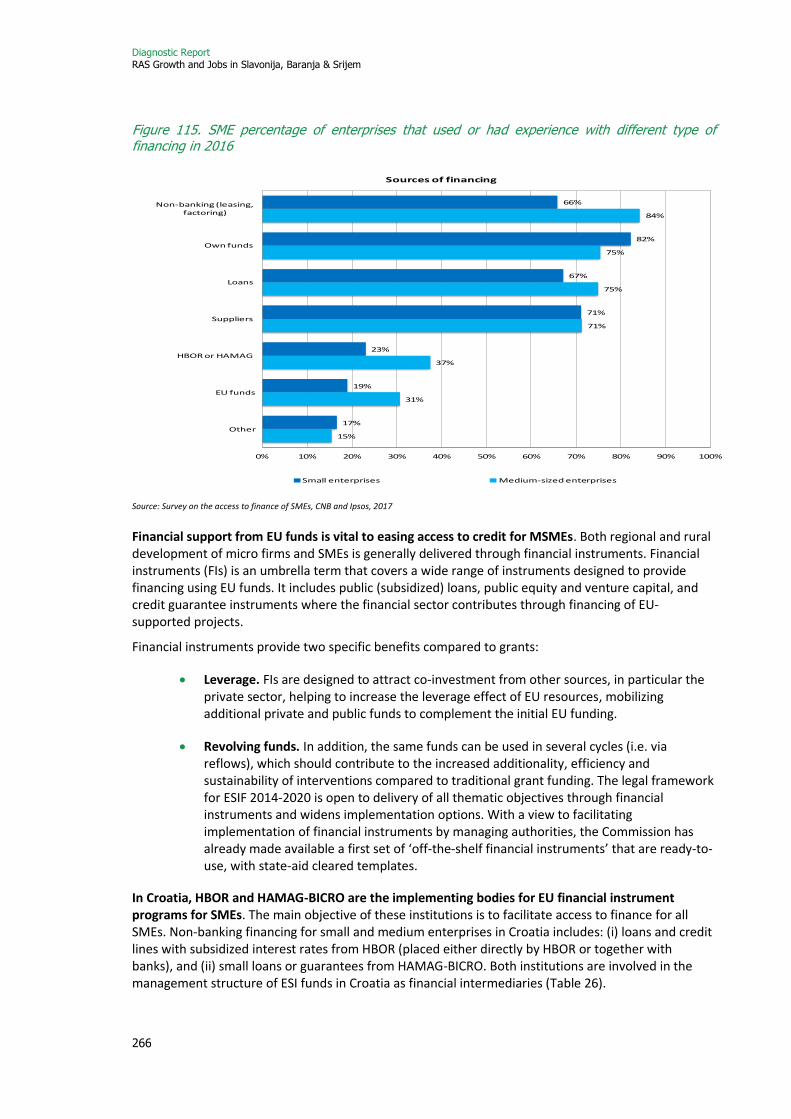
Diagnostic Report RAS Growth and Jobs in Slavonija, Baranja & Srijem
266
Figure 115. SME percentage of enterprises that used or had experience with different type of financing in 2016
Source: Survey on the access to finance of SMEs, CNB and Ipsos, 2017
Financial support from EU funds is vital to easing access to credit for MSMEs. Both regional and rural development of micro firms and SMEs is generally delivered through financial instruments. Financial instruments (FIs) is an umbrella term that covers a wide range of instruments designed to provide financing using EU funds. It includes public (subsidized) loans, public equity and venture capital, and credit guarantee instruments where the financial sector contributes through financing of EU-supported projects.
Financial instruments provide two specific benefits compared to grants:
• Leverage. FIs are designed to attract co-investment from other sources, in particular the private sector, helping to increase the leverage effect of EU resources, mobilizing additional private and public funds to complement the initial EU funding.
• Revolving funds. In addition, the same funds can be used in several cycles (i.e. via reflows), which should contribute to the increased additionality, efficiency and sustainability of interventions compared to traditional grant funding. The legal framework for ESIF 2014-2020 is open to delivery of all thematic objectives through financial instruments and widens implementation options. With a view to facilitating implementation of financial instruments by managing authorities, the Commission has already made available a first set of ‘off-the-shelf financial instruments’ that are ready-to-use, with state-aid cleared templates.
In Croatia, HBOR and HAMAG-BICRO are the implementing bodies for EU financial instrument programs for SMEs. The main objective of these institutions is to facilitate access to finance for all SMEs. Non-banking financing for small and medium enterprises in Croatia includes: (i) loans and credit lines with subsidized interest rates from HBOR (placed either directly by HBOR or together with banks), and (ii) small loans or guarantees from HAMAG-BICRO. Both institutions are involved in the management structure of ESI funds in Croatia as financial intermediaries (Table 26).
15%
31%
37%
71%
75%
75%
84%
17%
19%
23%
71%
67%
82%
66%
0% 10% 20% 30% 40% 50% 60% 70% 80% 90% 100%
Other
EU funds
HBOR or HAMAG
Suppliers
Loans
Own funds
Non-banking (leasing, factoring)
Sources of financing
Small enterprises Medium-sized enterprises
3%
2%
2%
2%
0%
6%
30%
33%
48%
0%
0%
0%
10%
7%
10%
23%
43%
53%
3%
3%
4%
13%
14%
26%
21%
25%
57%
0% 10% 20% 30% 40% 50% 60%
We applied for a loan, but the application was refused
Enterprise was recapitalised
We applied for a loan, but the bank officer unofficially
refused our application
Unacceptable loan collateral requirements
Loan application procedure was too complicated or too
long
Financing costs were too high
We did not apply for a loan due to other reasons
Sufficient other external sources
Sufficient own funds
Reasons for not using a bank loan
Small enterprises Medium-sized enterprises Large enterprises

Diagnostic Report RAS Growth and Jobs in Slavonija, Baranja & Srijem
267
Table 26. Financial Instruments under the existing 2004-20 Multiannual Financial Framework (MFF) in Croatia in millions of EUR
Financial instrument ESIF National
public co-financing
Contribution of financial
intermediaries TOTAL Purpose of financial instrument
HAMAG-BICRO
ESIF Micro Loans 12.5 0 0 12.5 Investments in tangible and intangible assets and working
capital for micro entrepreneurs and start-ups.
ESIF Small Loans 42.5 0 0 42.5 Investments in tangible and intangible assets and working
capital for small entrepreneurs.
ESIF Interest Rate Subsidy
10 0 0 10 Intended for specific target groups of entrepreneurs in
parallel with ESIF individual guarantees.
ESIF Limited Portfolio Guarantees
28 30 0 58 Guarantees intended for bank credit portfolios exclusively for
SMEs.
ESIF Individual Guarantees
42 15 0 57 Guarantees for investment and working capital.
Guarantees for Rural Development
15 2.65 0 17.65 Guarantees for investments and working capital in line with
acceptable purposes under specific sub-measures of the Program for Rural Development.
Micro and Small Loans for Rural Development
15 2.65 0 17.65 Investments in tangible and intangible assets and working capital in line with acceptable purposes under specific sub-
measures of the Program for Rural Development.
TOTAL 165 50.3 0 215.3
HBOR
ESIF Growth and Expansion Loans
110 0 110 220 Investments in tangible and intangible assets and working
capital in the processing industry, tourism (accommodation services), and information and communication.
ESIF Loans for Energy Efficiency of Public
Sector Buildings 25 0 0 25
Investments in energy efficiency and use of renewable energy sources in public sector buildings.
ESIF Loans for Public Lighting
20 0 0 20 Investment loans for saving energy in the public lighting system through the implementation of energy recovery
measures.
Upcoming: Investment Loans for Rural Development
30 5.3 35.3 70.6
Investments in long-term tangible and intangible assets and working capital in line with acceptable purposes under
specific sub-measures of the Program for Rural Development of the Republic of Croatia for 2014-2020.
Upcoming: ESIF Loans for Energy Efficiency in
the Private Sector 35 0 35 70
Investment loans intended for energy savings for entrepreneurs while investing in manufacturing and service
industries, trade and tourism.
TOTAL 220 5.3 180.3 400.3
Upcoming: Equity Instruments
35 0 7.5 42.5 Venture capital fund(s) with acceleration compartments
investing in SMEs primarily at their seed and start-up stages.
Diagnostic Report RAS Growth and Jobs in Slavonija, Baranja & Srijem
268
The ex-ante assessment of financial instruments in the field of employment and social enterprise within the framework of the Operational Program “Efficient Human Resources 2014-2020” was carried out in 2018, and suggested new financial instruments. The assessment found market problems and market failures in the areas of higher education and life-long learning, employment of persons with insufficient work experience, financial exclusion of disadvantaged groups, and financing of social infrastructure and social enterprise projects and entities. The assessment proposed four loan programs and a venture capital fund through a unified management structure (Fund of Funds, with exception of venture capital fund which would be implemented by EIF). HAMAG-BICRO was proposed as the body to implement these financial instruments. It remains unclear which of the suggested financial instruments will be endorsed and how they will be delineated from for instance micro and small loan programs that HAMAG-BICRO already operates.
3.1. HAMAG-BICRO
A large part of HAMAG BICRO’s guarantee portfolio includes EU-funded programs through allocations from both regional and rural development sources.
• ESIF Individual Guarantees. This instrument, targeting SMEs and newly established companies, has been designed based on previous experience with national schemes. The novelty is interest rate subsidies for identified industries (tourism, manufacturing). There are two measures: (i) Measure A – ESIF guarantees for investment loans (with the possibility of an interest subsidy) with a guarantee rate up to 80 percent, a minimum guarantee amount of EUR 150,000, and a maximum guarantee amount of EUR 2 million; (ii) Measure B – ESIF guarantees for working capital loans with guarantee rates up to 80 percent, a minimum guarantee amount of EUR 150,000, and a maximum guarantee amount of EUR 1 million.
• ESIF First Loss Portfolio (FLP) Guarantee. The goal of FLP guarantees is to encourage financial institutions to finance companies that have the biggest effect on the growth and development of the Croatian economy, and they have been set as a priority. The guarantee enables SMEs to have better access to financing: reduced collateral requirements, reduced loan interest rates (because of the lower risk profile), potentially longer grace periods, and deferred payment. The instrument covers the first loss of a portfolio of new loans on a loan-by-loan basis, covering up to 25 percent of the guarantee cap rate and 80 percent of the guarantee rate. The maximum amount of each guarantee in the portfolio is capped at EUR 150,000. The FLP guarantee provides credit risk coverage on a loan-by-loan basis for the creation of a portfolio of new loans targeting the final beneficiaries up to the maximum guarantee cap rate. Given that this scheme covers the first loss of the portfolio up to 80 percent, the risk exposure of the financial institutions is considerably reduced and should increase their willingness to provide loans to the targeted final beneficiaries.
• European Agricultural Fund for Rural Development (EAFRD) Guarantees. This guarantee instrument funded by the EAFRD has been designed as an individual guarantee, and the scheme should replace the current HAMAG-BICRO guarantee product for farmers. The maximum guarantee rate is 70 percent and covers only investment loans that can include up to 30 percent or EUR 200,000 of working capital. Young farmers and milk producers could get up to 80 percent of the guarantee.
HAMAG-BICRO also has 3 ESIF loan programs for regional development: micro investment loans, small investment loans and micro working capital loans. ESIF loan programs are aimed at providing easier access to loan funds for SMEs. ESIF loans are financial instruments designed for SMEs, including start-up companies and private individuals that aim to establish and run a business. Loans are granted

Diagnostic Report RAS Growth and Jobs in Slavonija, Baranja & Srijem
269
to micro, small and medium entrepreneurs, i.e. small business subjects, in compliance with the SME Development Promotion Act. No approval fees are charged for ESIF loans.
• ESIF Micro Investment Loans. These are micro investment loans with a maximum amount of EUR 25,000 and an interest rate from 0.5 to 1.5 percent, depending on the county of investment (less developed counties get 0.5 percent). The grace period if repayment is more than 2 years is up to 12 months, and the total repayment period is up to 5 years.
• ESIF Micro Working Capital Loans. Micro working capital loans are for a maximum amount of EUR 25,000 and have an interest rate from 1.5 to 3.5 percent, depending on the development of the county of investment (less developed counties get 1.5 percent). The grace period if repayment is more than 2 years is up to 6 months, and the total repayment period is up to 3 years.
• ESIF Small Investment Loans. Small investment loans are from EUR 25,000 to a maximum of EUR 50,000 and have an interest rate from 0.5 percent to 1.5 percent, depending on the county of investment (less developed counties get 0.5 percent). The grace period if repayment is more than 2 years is up to 12 months, and the total repayment period is up to 10 years.
In addition to loans geared towards regional development, HAMAG-BICRO implements micro and small loans aimed at rural development (financed through EAFRD). Micro and small loans for rural development are specially designed for agriculture. Micro loans can amount up to EUR 25,000, while small loans amount up to EUR 50,000. Both facilities offer an interest rate between 0.5 percent and 1 percent, depending on the type of beneficiary and county of investment (less developed counties get 0.5 percent, and milk producers 0.1 percent). The grace period if repayment is more than 12 months could be up to 12 months, and the total repayment period is up to 5 years for micro loans and up to 10 years for small loans.
3.2. HBOR
HBOR plays an important role in the Croatian economy and financial intermediation. At the end of 2017, HBOR’s assets amounted to EUR 3.8 billion, which is equivalent to 8 percent of the Croatian GDP and 7 percent of the Croatian banking sector’s assets (which is comparable to the sixth largest bank). In 2017 alone, HBOR was involved in almost two and a half thousand projects with a total value of more than HRK 7 billion, of which HRK 5.2 billion was in loans, HRK 1.7 billion in export credit insurances, and HRK 0.5 billion in guarantees. By the end of 2017, more than half of HBOR’s loan portfolio (53 percent) was placed directly to companies, and the share of loans to banks fell to 47 percent.
HBOR currently manages only one financial instrument for SMEs – a loan program. The fund was launched in October 2017 and three banks were chosen as financial intermediaries for this fund: Zagrebačka banka, Privredna banka Zagreb, and Erste & Steiermärkische Bank. The total allocation of the fund is EUR 200 million (50 percent provided by the European Regional Development Fund (ERDF) and 50 percent provided by financial intermediaries). The targeted beneficiaries are SMEs with a business track record of at least two years. The FI aims to finance investments in fixed assets, but up to 30 percent of the loan amount may be used for working capital financing. The loan amount can range from EUR 100,000 to EUR 3 million, while for the tourism sector the loan amount can reach EUR 10 million. The interest rate ranges from 1 to 2 percent, thanks to the ERDF contribution at a 0 percent interest rate and competitive pricing from the selected banks. As for maturity, the loans have a tenor up to 12 years, including a two-year grace period (with an exception for the tourism sector (a 17-year maturity with a 4-year grace period).

Diagnostic Report RAS Growth and Jobs in Slavonija, Baranja & Srijem
270
The possibility of financing micro firms and SMEs through venture capital (VC) funds is underdeveloped and negligible. Earlier strategic attempts to enhance the development of equity in Croatia yielded mixed results as investment funds’ strategies gravitated towards larger individual investments rather than innovative start-ups with high growth potential. The Ministry of Regional Development and EU Funds has allocated EUR 35 million for a VC Program in their Operational Program. Given the lack of capacity, the European Investment Fund (EIF) has been contracted as a fund-of-funds manager, which in turn is subcontracting a professional fund manager. The purpose of the program is to support SMEs by providing funding in the form of either equity or quasi-equity in Croatia. The financial intermediary (fund manager) is expected to allocate the total funds under the instrument under two sub-components: (i) an acceleration component (EUR 15 million) of initial financing supporting entrepreneurs in researching, assessing and developing an initial concept; and (ii) a VC component (EUR 17.5 million) providing follow-on financing to entrepreneurs supported in the acceleration stage and financing to other eligible SMEs. As part of the structure, the VC component requires an additional private capital allocation to the amount of EUR 7.5 million (as part of the state aid regulation).
3.3. Government interventions in the Slavonia region through HAMAG-BICRO and HBOR
3.3.1. Guarantees
The use of guarantees by firms in Slavonia compares poorly with other parts of Croatia. In the last three years, HAMAG-BICRO has received 55 guarantee applications from firms in Slavonia, of which they have approved 31 (Figure 116). This result is surprisingly low given the number of firms and craft companies, and the working-age population in this region.277 In comparison, in the rest of the country, out of 702 received applications, HAMAG-BICRO extended a total of 446 guarantees to Croatian firms. All counties in Slavonia have a lower-than-average number of applications, with a rejection rate 8 percentage points higher (44 percent) than the rest of Croatia.278 In terms of volume, only 6 percent of the total volume of issued guarantees (or around HRK 65 million out of HRK 1.1bn) went to Slavonia (Figure 117). In Slavonia, the manufacturing industry received the most guarantees (40 percent), followed by residential care services for the elderly (19 percent). In contrast, in the rest of Croatia the most guarantees were issued in tourism (including hotels, restaurants, other types of accommodation, charter boats, etc.), which had 55 percent of all issued guarantees, followed by manufacturing with a share of 17 percent.
277 The lower uptake of guarantees may also be the result of bank loan activity readiness, as well as project quality and investment readiness, as the process of issuing guarantees starts with the banks / leasing companies, and the financial institution is ultimately responsible for the initial selection and assessment of project applications without any influence from the HAMAG-BICRO side. 278 Double risk assessment (by financial institutions and HAMAG-BICRO) of individual guarantee instruments shows that a double selection process more than doubles the rejection rate. The guarantee call rate (less than 10%) is lower than the average default rate in the SME segment, which means that the risk taken by public intervention is lower than the average market credit risk. A simplified procedure can be found in the capped portfolio guarantee instrument which was contracted with financial institutions at the end of October 2018. The maximum individual guarantee is EUR 150,000, which means that larger investments cannot be included in such instruments.

Diagnostic Report RAS Growth and Jobs in Slavonija, Baranja & Srijem
271
Figure 116. Number of guarantee applications, 2016 - Sep. 2018
Figure 117. Approved guarantee amounts, 2016 - Sep. 2018
Source: HAMAG-BICRO, staff calculations
The new guarantee model offered to banks and leasing companies through the ESIF financial instruments includes some important changes compared to the previous nationally financed guarantees. Pari-passu modality is incorporated in the new guarantee model, which means that HAMAG-BICRO and financial institutions are equal with regard to both the risk-taking and profit ratio. Thus, when HAMAG-BICRO covers up to 80 percent of a loan principal, in the case of default they pay 80 percent of the amount of the unpaid principal to the bank. The guarantee is first-class collateral which acts almost the same as a cash deposit. In the collection process, banks should share the amount of collected money with HAMAG-BICRO according to the risk-taking ratio (the percentage of the guarantee). The other option for the bank is to collect the whole amount from the debtor and after that call for the guarantee payment. In the past, banks could collect the guarantee amount as well as other collaterals, after which HAMAG-BICRO had the opportunity to collect any remaining amount from the final beneficiary. However, anecdotal evidence suggests that guarantee instruments do not generate the expected results, because pari passu modality forces financial institutions to still opt for beneficiaries / investments with high collateral coverage besides the HAMAG-BICRO guarantee.
3.3.2. Loans
As guarantees, HAMAG-BICRO micro and small loans also have low utilization rates in Slavonia. In the last two years,279 HAMAG-BICRO has received (Figure 118) 270 micro and small loan applications from firms in Slavonia, of which it approved 121. In comparison, in the rest of the country, out of 2,342 received applications, HAMAG-BICRO extended 1,088 loans. The rejection rate of applications from the Slavonia region is 47 percent and is almost the same as the rejection rate in other parts of Croatia (46 percent). In terms of volume, firms in Slavonia performed better when compared to guarantees: 11 percent of the total volume of loans (a total of HRK 33 million out of HRK 306 million) went to the Eastern Croatia region (Figure 119). Most of the loans were extended to the manufacturing industry (41 percent), construction (14 percent), and accommodation and food service activities (13 percent). A similar structure is observed in the rest of the country. HAMAG-BICRO offers the lower interest rates for less developed counties, including Slavonia.
279 A 24-month period has been analyzed, as the micro and small lending scheme started during the last quarter of 2016.
0%2%4%6%8%10%12%14%16%18%20%
0102030405060708090
100
Split
sko
-dal
mat
insk
aG
rad
Zag
reb
Pri
mo
rsko
-go
ran
ska
Ista
rska
Zad
arsk
aZa
gre
bač
kaD
ub
rova
čko
-…V
araž
din
ska
Šib
ensk
o-k
nin
ska
Kra
pin
sko
-zag
ors
kaK
op
rivn
ičko
-kri
ževa
čka
Osj
ečko
-bar
anjs
kaLi
čko
-sen
jska
Me
đim
urs
kaV
iro
viti
čko
-po
dra
vska
Sisa
čko
-mo
slav
ačka
Po
žešk
o-s
lavo
nsk
aK
arlo
vačk
aV
uko
vars
ko-s
rije
msk
aB
rod
sko
-po
savs
kaB
jelo
vars
ko-b
ilogo
rska
2016
2017
Sep-18
% of working age population
0
50
100
150
200
250
300
350
400
450
500
2016 2017 Sep-18
in HRK millions
Slavonia region
Rest of Croatia
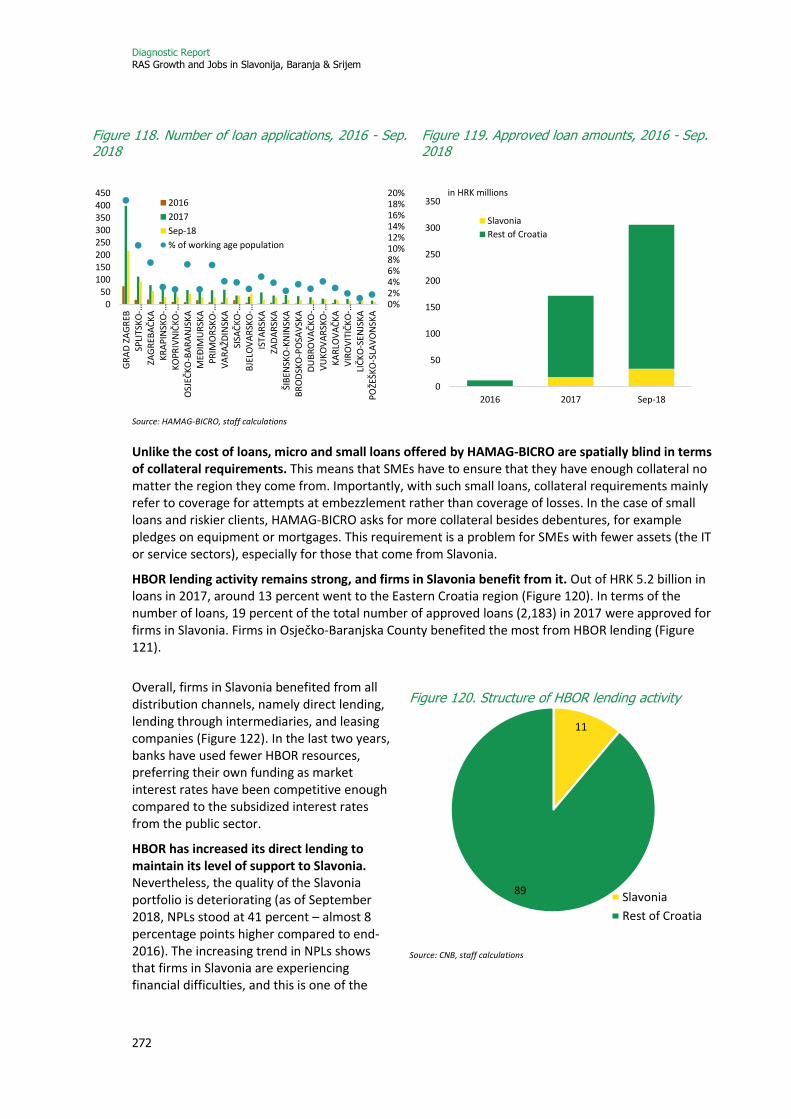
Diagnostic Report RAS Growth and Jobs in Slavonija, Baranja & Srijem
272
Source: HAMAG-BICRO, staff calculations
Unlike the cost of loans, micro and small loans offered by HAMAG-BICRO are spatially blind in terms of collateral requirements. This means that SMEs have to ensure that they have enough collateral no matter the region they come from. Importantly, with such small loans, collateral requirements mainly refer to coverage for attempts at embezzlement rather than coverage of losses. In the case of small loans and riskier clients, HAMAG-BICRO asks for more collateral besides debentures, for example pledges on equipment or mortgages. This requirement is a problem for SMEs with fewer assets (the IT or service sectors), especially for those that come from Slavonia.
HBOR lending activity remains strong, and firms in Slavonia benefit from it. Out of HRK 5.2 billion in loans in 2017, around 13 percent went to the Eastern Croatia region (Figure 120). In terms of the number of loans, 19 percent of the total number of approved loans (2,183) in 2017 were approved for firms in Slavonia. Firms in Osječko-Baranjska County benefited the most from HBOR lending (Figure 121).
Overall, firms in Slavonia benefited from all distribution channels, namely direct lending, lending through intermediaries, and leasing companies (Figure 122). In the last two years, banks have used fewer HBOR resources, preferring their own funding as market interest rates have been competitive enough compared to the subsidized interest rates from the public sector.
HBOR has increased its direct lending to maintain its level of support to Slavonia. Nevertheless, the quality of the Slavonia portfolio is deteriorating (as of September 2018, NPLs stood at 41 percent – almost 8 percentage points higher compared to end-2016). The increasing trend in NPLs shows that firms in Slavonia are experiencing financial difficulties, and this is one of the
Figure 118. Number of loan applications, 2016 - Sep. 2018
Figure 119. Approved loan amounts, 2016 - Sep. 2018
Figure 120. Structure of HBOR lending activity
Source: CNB, staff calculations
0%2%4%6%8%10%12%14%16%18%20%
050
100150200250300350400450
GR
AD
ZA
GR
EBSP
LITS
KO
-…ZA
GR
EBA
ČK
AK
RA
PIN
SKO
-…K
OP
RIV
NIČ
KO
-…O
SJEČ
KO
-BA
RA
NJS
KA
MEĐ
IMU
RSK
AP
RIM
OR
SKO
-…V
AR
AŽD
INSK
ASI
SAČ
KO
-…B
JELO
VA
RSK
O-…
ISTA
RSK
AZA
DA
RSK
AŠI
BEN
SKO
-KN
INSK
AB
RO
DSK
O-P
OSA
VSK
AD
UB
RO
VA
ČK
O-…
VU
KO
VA
RSK
O-…
KA
RLO
VA
ČK
AV
IRO
VIT
IČK
O-…
LIČ
KO
-SEN
JSK
AP
OŽE
ŠKO
-SLA
VO
NSK
A
2016
2017
Sep-18
% of working age population
0
50
100
150
200
250
300
350
2016 2017 Sep-18
in HRK millions
Slavonia
Rest of Croatia
11
89Slavonia
Rest of Croatia

Diagnostic Report RAS Growth and Jobs in Slavonija, Baranja & Srijem
273
reasons why commercial banks have been shy about extending loans through HBOR. In contrast, judging from the dynamics of direct lending, HBOR demonstrates no risk aversion to Slavonia. The rejection of loan applications is marginal and is usually a result of project quality and poor business planning, the lack of business and management knowledge of the owners, or poor company background.
Source: HBOR, staff calculations
HBOR support to Slavonia is focused on investment activities. On average, around three-quarters of loans to firms in Slavonia are granted for investment purposes. This is similar to the rest of the country, where on average 77 percent of HBOR lending (through all distribution channels) finances investment projects (Table 27). The average loan extended by HBOR amounts to around HRK 14.5 million, while the average amount of loans distributed by commercial banks is HRK 1.5 million. This suggests more capital-intensive investments are usually financed directly through HBOR.
Table 27. Overview of HBOR activity by loan purpose
September-2018 2017 2016
Number of loans
Amount in HRK
million
Number of loans
Amount in HRK million
Number of loans
Amount in HRK million
Directly 19 294,2 22 389,2 24 259,7
Investment loans 16 159,1 16 253,0 21 234,4
Working capital 3 135,2 6 136,2 3 25,3
Via commercial banks 96 128,9 210 240,7 190 366,1
Investment loans 62 119,0 89 178,3 86 282,5
Working capital 34 10,0 121 62,3 104 83,5
Via leasing companies 163 42,6 178 36,1 127 38,9
Investment loans 163 42,6 178 36,1 127 38,9
Total 278 465,7 410 666,1 341 664,6
Sectors that are supported by HBOR lending depend on the distribution channel. There are some sectoral differences when loans are approved directly through HBOR or through a commercial bank or leasing company (Figure 123). By and large, firms in agriculture and food production (agri-business)
Figure 121. Outstanding HBOR lending activity in Slavonia in HRK millions
Figure 122. Annual HBOR lending activity in Slavonia
0
500
1,000
1,500
2012 2013 2014 2015 2016 2017
VPC PSC BPC
OBC VSC
0
200
400
600
800
2016 2017 Sep-18
in HRK millions Direct HBORBanksLeasing

Diagnostic Report RAS Growth and Jobs in Slavonija, Baranja & Srijem
274
are supported the most. In contrast, the manufacturing of wood products is mostly represented in terms of lending activity by commercial banks.
3.3.3. Opportunities to improve the use of financial instruments
The success of FIs across the EU has greatly raised expectations, but challenges remain. While the rationale for the use of financial instruments is sound, the challenges in practice reveal that more effort is needed to maximize their potential, given the different economic and geographic characteristics of a region. The approaches ought to be tailored to the market segments being targeted, to the geographical area, which may have unique market characteristics, and to the country’s institutional framework. This highlights the importance of appropriate program design, strategic management and an adequate institutional framework. Better evidence-based decision-making, benefiting from well-prepared investment strategies, as well as the capacity of managing authorities and monitoring committees to engage in the complex process of what is essentially financial engineering, remains key.
The pricing policy of individual guarantee instruments does not recognize micro firms and SMEs from less developed counties / regions. Benefits are only available for those micro firms and SMEs oriented towards export activities. In addition, guarantees for investment loans are cheaper than the guarantees for working capital loans, but there is no benefit for micro firms and SMEs from Slavonia.
Credit guarantee products could be further improved to allow for guarantees for working capital financing, to enable the repricing of guarantees, and to simplify administrative procedures. First, allowing working capital to be eligible for a wider set of guarantee programs would increase the ability of banks to reach a wider set of SMEs. In many countries, there is a strong demand for such products, e.g. overdrafts, from small, credit-constrained firms. Second, authorities / development finance institutions could consider allowing the repricing of credit guarantees at least once mid-term. Market conditions change during the lifetime of a guarantee agreement, and changes in pricing may be necessary to keep the products attractive to SMEs in a rapidly changing interest rate environment.
Figure 123. Structure of loans by economic activity and distribution channel
Source: HBOR, staff calculations.

Diagnostic Report RAS Growth and Jobs in Slavonija, Baranja & Srijem
275
Third, further simplification is needed, as currently the additional administrative work, such as eligibility checks and reporting duties might outweigh the benefits, particularly in the case of smaller volume programs. The standardization and simplification of the reporting structure could significantly reduce compliance costs.
The effectiveness of HBOR and HAMAG-BICRO support mechanisms could be improved by eliminating overlaps and creating programs for underserved instruments. Three issues in the implementation of financial instruments in Croatia, including Slavonia, can be highlighted:
(i) There is a significant overlap in public interventions (ERDF grants, EAFRD grants, guarantees, soft loans, guarantees with interest rate subsidies, etc.), and SMEs are confused as to which source of funding to apply for / benefit from. The large number of programs and the lack of a ‘one-stop-shop’ organization to disseminate information and advise micro firms and SMEs on these programs makes it difficult for the corporate sector to determine which (if any) programs are suitable.
(ii) On the other hand, despite all the available financial instruments, neither working capital micro loans nor guarantees exist in agriculture. This may be an important issue, as agriculture is the most represented sector in Slavonia. Sometimes, repayable instruments are better options for investments than grant schemes (shorter approval period, no public procurement procedures, more flexibility, etc.)
(iii) In addition, improving the monitoring and evaluation of all state programs would yield much needed simplification in the complex ecosystem of subsidizing loans and issuing of guarantees and providing grants by different government institutions.
Although state aid280 issues are frequently raised as a problem in support schemes to firms, this should not prevent authorities from structuring a sound support mechanism. While state aid rules are relatively straightforward in relation to grants, they are much more complex for financial instruments, for which there must be an assessment of the presence of state aid at several levels – not just the final recipient but also financial intermediaries (Box 3). Most of the existing financial instruments in Croatia are tailor-made instruments. In general, interventions include de minimis aid which caps spending at EUR 200,000 over 3 fiscal years. Loans and guarantees for investments in some cases are structured under the GBER regulation in combination with de minimis aid. The option of direct notification to the European Commission (EC) regarding state aid (for developing tailor-made financial instruments for specific market needs under the relevant guidelines (e.g. Risk Finance Guidelines)) could be considered in Slavonia as well. One example could be support to existing investments (i.e. revitalization of production or abandoned farms, given that support for ongoing investment projects is not allowed according to the GBER regulation).
Box 3: EU state aid rules and financial instruments
There are three key points at which FIs as state aid can distort market competition: at the level of fund managers (management fee), at the level of the financial intermediary implementing the FI (better conditions for procurement or securitizing), and at the level of the final beneficiary (better financing conditions). The general principle states that if the conditions under which any of these three transactions take place are at the
280 Financial instruments, generally speaking, are public (state) resources deployed in the service of different policy objectives. However, from the state-aid perspective, there is a significant difference between whether they are managed at the EU level (centrally managed FIs) or at the member state level (shared management). The key purpose of the EU state aid rules is preventing distorted competition in the EU Single Market as a result of illicit support from the member states, regardless of whether it comes from the national or sub-national level. Therefore, when FIs are managed at the member state level (national or subnational), as in the case of ESI Funds, such activities are subject to EU state-aid rules. In contrast, when resources are designed and managed at the EU level, such as the Commission or its executive agency, they are considered a priori compatible with EU state aid rules. The latter applies not only to EU budgetary resources but also other funds invested in centrally managed FIs if the investment is not conditioned by any special requirement but is geographical.
Diagnostic Report RAS Growth and Jobs in Slavonija, Baranja & Srijem
276
market level, such intervention does not constitute state aid. In cases where the fund manager is a public body, such as a national development finance institution, and there is no spillover into its possible commercial activity, the fee is not considered state aid. However, when this is a private body, then its conformity is ensured through open competition, benchmark testing or other methods which can show that the fee paid to the fund manager is at the market level. Similar principles apply to the other two points of intervention. For example, public funding provided pari passu with private funds is considered market-conform. Other ways (when there are no private actors involved) include different benchmark tests, assessment methods, etc. FIs might have a purpose and / or scope which makes them either non-economic (investment in social infrastructure, for example) or local in nature. In this case, it is important to note they may still fall under the remits of EU state rules should they have an impact on the financial markets where the intermediaries implementing them operate.
In order qualify as state aid, the FI or any other state intervention must be significant enough to have an impact on trade between member states. Commission Regulation (1407/2013) sets out so-called de minimis rules, or the threshold for an intervention to be considered relevant for EU state aid rules. The general rule states that cumulative support cannot exceed EUR 200,000 over a 3-year period (consecutive). The Commission has also set out rules for general exemption from notification for certain types of support in its General Block Exemption Regulation (GBER) (651/2014). The Regulation covers certain forms of aid, including regional investment support, risk finance support, regional urban development support, energy efficiency investment support, support for broadband infrastructure, etc. In addition, there are also sector-specific block exemption regulations, such as the ones for support to the agricultural and forestry sectors and in rural areas (ABER), which are relevant for the FIs funded from EAFRD.
In order to facilitate the efforts of member states in setting up FIs in line with EU state aid regulations, the Commission has developed standard terms and conditions for certain types of FIs. These are called ‘off-the-shelf’ instruments, and if all terms and conditions are fulfilled, they are considered compliant with EU state aid rules.
Finally, if the FI qualifies as state aid and cannot benefit from any of the exemptions, the member state concerned must make a state aid notification. No support can be granted before the European Commission has adopted a decision granting state aid approval. However, most FIs do not constitute state aid in the sense of EU law, most frequently not passing de minimis thresholds or falling into a category of state aid exempted from notification under the General Block Exemption Regulation.
Some lessons from other EU countries, in particular on combining EU grants with financial instruments, could be useful in Slavonia’s case (Box 4). The state aid rules and EU fund rules stipulate maximum amounts and aid intensities as a percentage. In Estonia, for example, all institutions that provide any type of subsidy cooperate to reach a maximum intensity for each client. The combination of a subsidized loan with a grant for a single operation at the level of one final beneficiary is allowed under state aid rules. In Estonia, there is no restriction on prescribing that grants cannot be used for the same eligible cost as a loan or, in other words that a grant cannot be used to cover the loan principal, as long as both funding sources do not reach 100 percent of the investment. The viability and sustainability of some of the projects may be questionable if the financial structure of the project does not consist of a grant component.
Box 4: The potential for combining grants and financial instruments
Combinations of different forms of support exist in various forms. These are capital grants, loans with write-offs / capital rebates, interest rate subsidies, guarantee subsidies or technical assistance. The type of combination depends very strongly on the objective of the support.
The rationale for using capital grants in combination with financial instruments is that the investment does not generate sufficient net-revenue to repay the loan. This is used to support investments with high socio-economic impact.
Diagnostic Report RAS Growth and Jobs in Slavonija, Baranja & Srijem
277
In the case of loans with capital rebates (or write-offs), the grant is conditional on specific result indicators that go beyond eligibility. For example, a loan is written off when a higher energy performance class is reached than required or when people belonging to marginalized groups are employed.
Interest rate subsidies or guarantee subsidies are used to reduce the cost of financing and thus facilitate access to finance. This is a very common form of support in the SME or agricultural sector. These soft loans (or soft guarantees) are often used to provide aid to final beneficiaries that is significantly lower than in grant schemes.
Financial instruments combined with technical support / assistance are used to facilitate investment. This support can be used to support the preparation of business plans in the area of micro finance or also support project preparation in physical investments.
The combination of different forms of support aims to provide additional incentives to final beneficiaries. Nevertheless, often the instrument can also generate disincentives to final beneficiaries, financial intermediaries and public administration, and the results may be counterproductive. The most common problems are compliance with the EU regulatory framework for grants and financial instruments, state aid, and the problem of coordination.
The Common Provision Regulation (CPR) regulating the ESIF has specific rules regarding combination, and distinguishes combination in one operation from combination in two operations. In the first case, the financial instrument and the grant element are already combined at the level of the public authority or financial intermediary and come as a single product to the final beneficiary, while in the latter case the combination only happens at the level of the final beneficiary. The CPR establishes the basic principles that grants cannot be used to repay financial instruments and financial instruments cannot be used to pre-finance grants, and that there can be no double financing of the same operation from the EU budget.
Final beneficiaries often find themselves in the dilemma that without the grant the project is not viable and without the bank funding the project cannot be implemented. In an ideal situation, both forms of support should be in place at the same time. As grants are usually provided through calls, and bank financing follows its own procedures, there is a high level of uncertainty.
For financial intermediaries, the combination of support is associated with an additional administrative burden. There is the need to keep separate records for different forms of support, to check the cumulative state aid provided to final recipients, and in some cases also different eligibility or audit rules need to be observed. This is a significant administrative burden, resulting in higher management costs and higher complexities.
The complexity is even greater when ESIF support is combined with grants or financial instruments from the EU level, such as COSME, LIFE or Horizon 2020, or support from the European Fund for Strategic Investments. ESIF grants require national co-financing, which is often provided through bank lending to final recipients, but due to the rules described above it cannot come from EU financial instruments or EFSI. There have been several cases of double financing and subsequent financial corrections in the past.
It is recommended to move from the current form of combining two different forms of support to genuine blending. By blending, it is understood that the financial intermediary and the final beneficiary deal with a single financial product in which grants and FIs are already integrated. In addition, the eligibility rules and state aid rules between the different EU funds should be aligned in a single set of rules.
There should also be a higher degree of flexibility regarding the grant intensity of the blended product. The percentage of support should not be prescribed in a high-level document, such as the Operational Program, but it should be possible to adjust it to the current market situation, such as changing interest rates on the market.
In the post-2020 Common Provision Regulation, which was issued in May 2018, several of the above recommendations were taken up. Now, it is possible to have an auxiliary grant integrated in a financial product, which only needs to comply with the rules on financial instruments. This allows banks to be the single-entry point for combined / blended support. In addition, the CPR mentions an alignment of eligibility rules with Horizon Europe, which will facilitate support.
Uncertainty still exists about the possibility of using capital rebates post-2020. The principle that grants cannot be used to repay financial instruments and financial instruments cannot be used to pre-finance grants was retained in the new CPR. Regarding InvestEurope, the successor to the European Fund for Strategic
Diagnostic Report RAS Growth and Jobs in Slavonija, Baranja & Srijem
278
Investments (EFSI), it is still not clear if financing from this instrument can be used in the co-financing of ESIF grants.
As essentially risk-financiers, both HBOR and HAMAG-BICRO’s risk strategy is at the core of their businesses, and in the case of support to Slavonia, there is room for taking more risk. Both HBOR and HAMAG-BICRO set a risk threshold for the level of risk they are willing or able to take on a portfolio or single risk basis. This then informs their decisions on whether or not to support specific transactions. In the case of support to Slavonia, both of them could take more risk, but this can mean different things: either taking more risks that they understand and so moving into more known but higher risk areas (Scenario A); or taking unfamiliar risks where their knowledge, expertise and background may be less but where there is reason to believe that there is potential for a positive outcome (Scenario B). This implies bearing more uncertainty and even deliberately ‘failing forward’ if the case is considered to have high potential. Changing the risk formula will have different effects on their financial position and on how they interact with private-sector financial players. Therefore, the implications need to be carefully considered:
(A) In the case of Scenario A, there may be certain companies whose underlying credit risk is considered strong enough but which lack collateral or other forms of security, which therefore makes the risk unacceptable within the current risk appetite. Under guarantee instruments, a further increase in the risk-sharing portion with banks could be considered to an extent which is still significant enough to encourage the banks to undertake their own due diligence, but not so high as to create a moral hazard in which the banks make the deal because of the guarantee (proven additionality). In this instance, the banks might be more willing to finance transactions that they otherwise might not, i.e. the instrument changes the banks´ behavior. Where a guarantee is not the appropriate instrument to encourage banks to lend, HBOR or HAMAG-BICRO could offer a form of riskier direct financing, which would be subsidized by the Government but channeled in a transparent and non-distortionary way.
(B) In Scenario B, where the risks are more unfamiliar, the Government could consider, for example, loss compensation or ‘tolerating’ less profits. This instrument would improve their financial position and may entice them to take new risks, i.e. it could change HBOR and HAMAG-BICRO’s behavior.
In addition to targeted risk-taking by funding projects that the market is not willing to fund, development institutions are increasingly focusing on crowding-in private sector funding through risk sharing schemes. HBOR and HAMAG-BICRO may also support innovative product adoption in private banks that mitigate credit risks. As two examples of innovative products: value chain financing could be provided in agricultural value chains; or credit enhancements could be made on securitizations of SME receivables, based on Spanish or Russian experiences.
Commercial banks are more than intermediaries. Through financial instruments, they are also key partners in implementing policy objectives. When designing instruments, the Government (together with development institutions) needs to be aware that not all policy objectives are suitable for implementation by means of instruments intermediated through banks. The objectives and eligibility criteria of the products should reflect the trade-off between reaching the highest possible leverage and targeting riskier segments of the corporate sector. In addition, the intervention of development institutions should respect the principle of additionality: they should act as the commercial banks’ partner rather as their competitor.

Diagnostic Report RAS Growth and Jobs in Slavonija, Baranja & Srijem
279
4. Conclusions Financial access is critical for firms’ growth. It allows firms to innovate, improve efficiency, expand into new markets (both internal and external), and create jobs. A survey on access to finance in Croatia was conducted in 2017. It found that SMEs rated a lack of access to finance as being less important than several other obstacles but nevertheless found that a significantly higher proportion of SMEs rated it as a concern in Croatia than on average in the EU. Access to finance is the most important concern for 7 percent of SMEs in the EU. In Croatia, this share is 18 percent in the case of small companies, and 13 percent with medium-sized ones.
SMEs’ access to finance took a dramatic hit during the financial crisis and subsequent recession. Lending to micro, small, and medium enterprises continues to be bleak. Banks have become particularly risk averse, ruling out higher risk and a medium rate of return on investments. Viable SMEs have therefore found it particularly difficult to obtain finance from banks. When business lending is considered, banks prefer lending to large firms over SMEs. Since the default risk is higher for SMEs than for larger firms, banks require higher equity capital as a precondition for lending to SMEs. These problems apply to SMEs at all stages of development, whether they are a start-up, scale-up or seeking finance to stay-ahead.
Where a business is based can be an important factor in their search for finance. Although financial intermediation broadly matches the business population across Croatia, some areas, such as the Slavonia region, have a proportionately lower share of lending compared to the share of businesses in more developed parts of Croatia. This mainly stems from the availability and accessibility of finance from both banks and development institutions, as well as asymmetric information (or lack thereof) on various resources firms have at their disposal.
Financing as a key factor in sustainable regional development requires specific forms, ways and combinations of various sources of financing. The financial instrument model must be shaped by local circumstances and needs. Framework conditions relevant to the implementation of financial instruments include the existing financial ecosystem / economic context, institutional capacity, the regulatory framework, and a range of more operational issues. Circumstances vary not only between countries but also regions, and there is no ‘one-size-fits-all’ approach.
As financial instrument models are rarely transferable without modification to take local, regional or national conditions into account, financial instruments specifically targeting Slavonia may prove to be different from those targeting broadly Croatia-wide socio-economic specificities. For example, even within the broad goal of encouraging SME growth or competitiveness, different approaches would be relevant to firms / individuals that have been identified as potential high-growth micro and SMEs, compared with those interested in undertaking routine investment but not on an expansion trajectory, or in supporting self-employment and micro-enterprises. These different requirements translate not only into needs for different financial products but also need to correspond with Slavonia specificities. These different requirements translate into the need for different financial products, with some of them involving accepting higher risk and implemented directly through development institutions, while others can be deployed on a relatively standardized basis through the retail banking sector.
As part of the next phase, the World Bank team will propose modified or new investment strategies for financial instruments specifically targeting Slavonia. This will be based both on modification of existing financial instruments and on proposing some new financial instruments that are a better fit for Slavonia’s socio-economic characteristics. In addition, more efforts may be needed to raise awareness among entrepreneurs in Slavonia about adequate financing and the opportunities of using financial instruments and financial products. Finally, targeted business support programs may be useful to increase the use of relevant external financing.

Diagnostic Report RAS Growth and Jobs in Slavonija, Baranja & Srijem
280
Table 28. Linking objectives, target recipients, market imperfections and financial products
Goal Target
recipient
Market imperfection/
finance gap
Financial products
Examples
SME competitiveness Promoting entrepreneurship
Start-ups / individuals
Lack of collateral; track record; transaction costs; credit rationing
Loans, guarantees, microfinance
Germany: NRW Micro Loan Fund (ERDF); Hungary: Combined Microcredit Scheme (ERDF); United Kingdom: Start-up loans (Nat)
Supporting SME growth High-growth firms
Difficulty of risk assessment; credit rationing
Loans, guarantees, equity; mezzanine finance
France: JEREMIE Languedoc-Roussillon (ERDF); Sweden: Regional venture capital funds (ERDF); United Kingdom: Scottish Co-Investment Fund (ERDF)
Supporting SME growth Mainstream SMEs
Credit rationing; asymmetric information
Loans, guarantees
Austria: ERP loan fund (Nat); France: JEREMIE Languedoc-Roussillon (ERDF); Lithuania: INVEGA Guarantee Fund (ERDF); Portugal: Venture capital funds under the COMPETE (ERDF) OP; Spain: ICO Guarantee Fund (ERDF); United Kingdom: Enterprise Guarantee Fund (Nat)
Employment
Supporting self-employment, micro-enterprises
Individuals, especially in disadvantaged groups – unemployed, women, minorities
Lack of collateral; track record; transaction costs; credit rationing
Loans, guarantees, microfinance
Belgium: BRUSOC (ERDF)
Social inclusion
Regenerating deprived communities Supporting social enterprise
Public authorities, public-private partnerships, property developers, firms New and existing social enterprises
Externalities; risk Risk; lack of collateral; credit rationing
Loans, guarantees, equity Loans, guarantees, microfinance
France: Bpi – Prêt entreprises et quartiers (Nat) France: Bpi – Prêt économie sociale et solidaire (Nat)
Source: OECD, and World Bank Group elaboration

Diagnostic Report RAS Growth and Jobs in Slavonija, Baranja & Srijem
281
Objective: Inclusion

Diagnostic Report RAS Growth and Jobs in Slavonija, Baranja & Srijem
282
Chapter 7 Jobs, Skills & Inclusion
Diagnostic Report RAS Growth and Jobs in Slavonija, Baranja & Srijem
283
Chapter 7: Summary Slavonia’s labor market exhibits high rates of outmigration, unemployment and inactivity. Slavonia was a thriving region until the early 1990s, but since then has been confronted with stagnation and decline, ageing and outmigration, as well as impoverishment. More recently, coinciding with an economic upswing since 2014 in Croatia and the EU, Slavonia’s labor market has started to tighten, with registered vacancies now exceeding the number of job seekers for highly-educated occupations and some unskilled and semi-skilled occupations. However, inactivity and unemployment remain high. In 2017, the share of the working-age population in work was only 51 percent, 10 percentage points below the rest of Croatia (61 percent) and 17 percentage points below the 2017 EU28 average. A legacy of war, limited availability of care services, and especially lower education levels explain an important part of Slavonia’s much higher inactivity and unemployment.
Labor productivity in Slavonia’s firms is systematically lower than in the rest of the country (except in agriculture and forestry), consistent with Slavonia’s sizeable wage gap. This, together with general disenchantment of the Slavonian population with the economic and business environment, has prompted substantial outmigration, especially in recent years. At the same time, a small number of firms also outperform their sectoral competitors elsewhere in Croatia, signaling Slavonia’s potential.
Private-sector job creation remains a top priority, especially focusing on Slavonia’s lower educated, who make up the bulk of the unemployed and inactive. This especially requires a reduction in the regulatory burden and an increase in Slavonian firms’ competitiveness, including to close their substantial wage gap with the rest of Croatia. Given the large share of its population in agriculture and forestry-related activities (close to 30 percent), Program Slavonia’s current focus on agriculture and forestry is clearly warranted. With Slavonia’s longstanding history and labor force experience in manufacturing and the rising number of vacancies in this sector, so is attention to manufacturing.
The chapter outlines four main potential instruments of intervention:
• Training programs to address skills mismatch. To address the emerging skills mismatch in the short-run, the emphasis in active labor market programs should shift from employment provision through public work programs to training, including on-the-job training, which will require adequate public funding at the local level. Currently in Slavonia, each year approximately 3 percent of unemployed persons attend a training course, while 6.3 percent participate in public works programs. Public works are instrumental to the delivery of menal, social and communal services, and may be appropriate for the most vulnerable populations, but they have limited, if any, impact on building skills. Training programs can be improved through multi-year arrangements with training providers, the active involvement of beneficiaries in the choice of programs, and broad multipartite ownership of the scope of training supplied (by county, economic, and social councils). Additionally, enrollments in ALMPs can be increased, from their current rate of only 17.5 percent of jobseekers, which is lower than the Croatian average. Participation targets should be set by type of ALMP, and the delivery capacity of the Croatian Employment Service (HZZ) should be strengthened to implement these programs. Recipients of Guaranteed Minimum Benefits (GMBs) face several barriers to enter the labor market, and addressing these requires cooperation between social welfare centers, HZZ branches, and local government, with provision of care and support services.
• Improving the performance of the education system in Slavonia. The current education system ill-prepares Slavonia’s workforce for the future. This starts with a delay in skills acquisition through a lack of early childhood education and care. It continues into secondary
Diagnostic Report RAS Growth and Jobs in Slavonija, Baranja & Srijem
284
school, as evidenced by poor PISA scores. It culminates in lower participation and higher failure rates in the Matura exam and lower participation in higher education. In 2016, only 33 percent of kindergarten age children in Slavonia were enrolled, compared to 75 percent in Zagreb and 68 percent on the coast. Expenditures on education for each young person up to 24 years old are almost three times higher in Zagreb (HRK 6,356) than in Slavonia (HRK 2,344), particularly because of a reliance on the fiscal capacity of local governments rather than through national standardization of spending per young person. There are also important opportunities to increase the relevance and attractiveness of the current TVET system, to help resolve the skills mismatch in the more immediate future.
• Bringing vulnerable populations to enter the workforce. Such groups include youth, older workers, rural women, and the less educated. In Slavonia, only 42 percent of women are employed, compared to 57 percent of women in the rest of Croatia. Only 21 percent of Slavonia’s population with less than an upper-secondary education are employed, compared to 61 percent of those with an upper-secondary education or higher. Inclusion and employment programs can be increased in effectiveness, through a better understanding of the needs of vulnerable populations, and a better link to growth opportunities such as family farms and community-based tourism. Programs can also be increased in quality through standardization and quality control of initiatives such as Zaželi. Self employment could further be promoted through business collectives (for example in agro-tourism and care provision), building on good international experience. Performance of these programs can be improved through monitoring performance with program feedback.
• Increasing access to affordable care services. Access to affordable, quality care services (for children and elderly alike) must be developed. Affordable childcare can assist more females to enter the labor force, especially in the most remove areas where childcare is costly, and for the most disadvantaged children whose parents find fees prohibitive.
Lastly, to address labor shortages in Slavonia, the work permit quota system could be better aligned with labor market needs. Immigrant workers can help to fill the gaps in Slavonia’s workforce that remain in unfilled despite education and training reform. Slavonia faces a notable skills shortage in some high-skilled occupations (such as ICT occupations), and other skills shortages in lower-skilled occupations such as welders, waiters, agricultural workers, and carpenters. Yet the quota of work permits available remains low in some of these: only 180 permits are available nationwide in ICT in 2019, compared to 300 in 2018. The application process is somewhat cumbersome, and is not available online.
Diagnostic Report RAS Growth and Jobs in Slavonija, Baranja & Srijem
285

Diagnostic Report RAS Growth and Jobs in Slavonija, Baranja & Srijem
286
Introduction
Setting. Slavonia, the eastern region of Croatia,281 was an agricultural and industrial heartland in former Yugoslavia up until the early 1990s. Since then, it has struggled with economic stagnation and decline, aging, outmigration, and impoverishment. This followed Croatia’s war of independence from 1991 to 1995, in which Slavonia was one of the front lines, economic restructuring of its state-led economy, and the global economic crisis of the late 2000s. The remnants of this legacy have still not been overcome and Slavonia is now one of Europe’s most lagging regions. However, following the recent recovery of the Croatian and EU-28 economies, green shoots are also emerging in Slavonia. Its labor market has started to tighten for the highly-educated and certain occupations carried out by un- and semi-skilled workers, and unemployment is declining.
Scope and purpose. This chapter focuses on the functioning of Slavonia’s labor market and its labor force, i.e. the supply side of the labor market. Special attention is paid to the human capital stock and skills set of its labor force, as well as the extent of inclusion. The previous chapters in this report focus on the demand side of Slavonia’s labor market, in particular the constraints on increasing exports, foreign direct investment and domestic firm productivity, including through innovation and better access to finance. Together, these chapters provide an in-depth analysis of the constraints on more inclusive growth and job creation for Slavonia. The focus each time is on identifying specific constraints in Slavonia that can be addressed at the local level. Nationally determined investments and policies are considered to the extent that they influence the performance of Slavonia’s firms and labor force disproportionally.
Study approach. A heavily data-driven approach is pursued to provide a sound empirical baseline of Slavonia’s labor market. More particularly, the chapter draws on Croatia’s national labor force (LFS), employer, and household budget surveys (HBS), as well as information on the population’s perceptions from the European Bank for Reconstruction and Development (EBRD) Life in Transition surveys (LITS), and also administrative data on firms (FINA) and craft companies (Croatia, Chamber of Trade and Crafts). Several key informant interviews and focus group discussions help contextualize the insights from these data. The sectoral background papers prepared by the World Bank Group for Croatia’s National Development Strategy (NDS) were further consulted for the broader policy and institutional context. Annex D provides a short description of the data sources.
Chapter structure. The chapter starts off by reviewing the characteristics of Slavonia’s labor market and identifying the underlying forces and policies shaping its performance in more detail.
• Section 1 describes the defining features of its labor force, the jobs they occupy, and the proximate reasons for their employment status;
• Section 2 presents an analysis of Slavonia’s current labor market dynamics, which continues to display high unemployment and inactivity in the face of rising vacancies and emerging labor market shortages in certain segments;
• Section 3 proposes policy entry points to resolve this conundrum, including assessments of the effectiveness of current measures;
• Section 4 concludes with recommendations on the way forward.
281 Throughout the report, Slavonia is used to mean Slavonia, Baranja and Srijem. The following 5 counties are included: Brodsko-Posavska, Osječko-Baranjska, Požeško-Slavonska, Virovitičko-Podravska, and Vukovarsko-Srijemska.
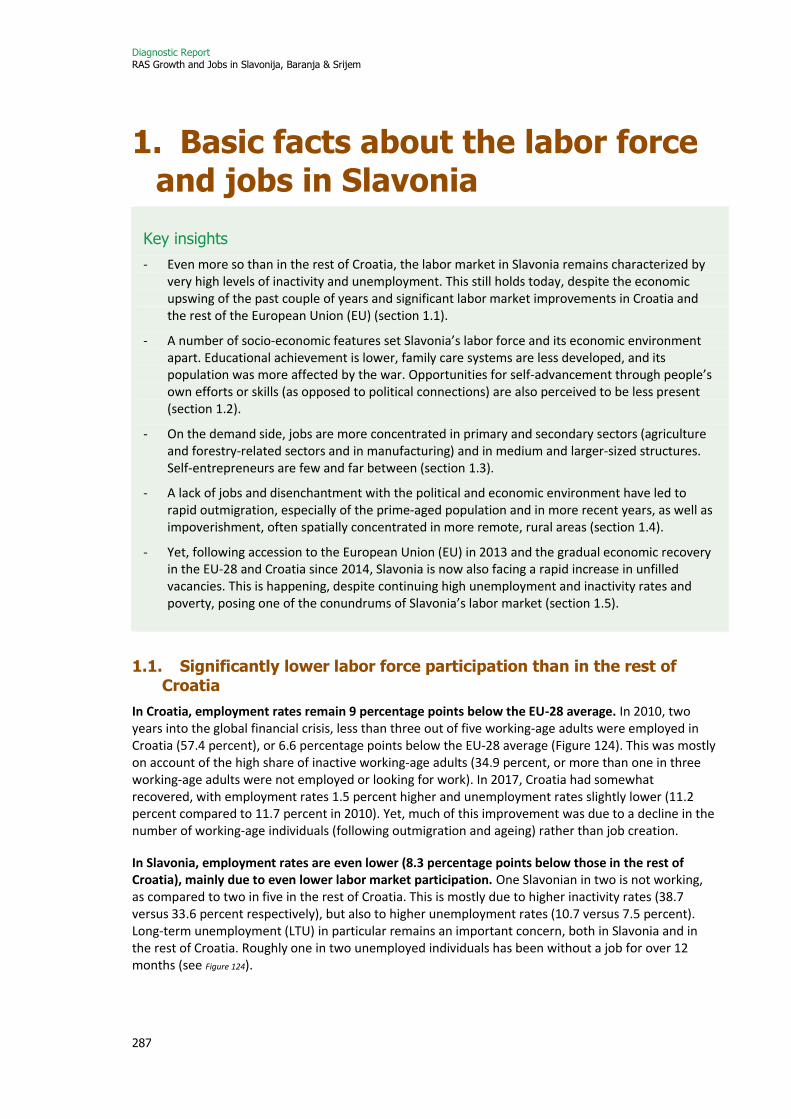
Diagnostic Report RAS Growth and Jobs in Slavonija, Baranja & Srijem
287
1. Basic facts about the labor force and jobs in Slavonia
Key insights
- Even more so than in the rest of Croatia, the labor market in Slavonia remains characterized by very high levels of inactivity and unemployment. This still holds today, despite the economic upswing of the past couple of years and significant labor market improvements in Croatia and the rest of the European Union (EU) (section 1.1).
- A number of socio-economic features set Slavonia’s labor force and its economic environment apart. Educational achievement is lower, family care systems are less developed, and its population was more affected by the war. Opportunities for self-advancement through people’s own efforts or skills (as opposed to political connections) are also perceived to be less present (section 1.2).
- On the demand side, jobs are more concentrated in primary and secondary sectors (agriculture and forestry-related sectors and in manufacturing) and in medium and larger-sized structures. Self-entrepreneurs are few and far between (section 1.3).
- A lack of jobs and disenchantment with the political and economic environment have led to rapid outmigration, especially of the prime-aged population and in more recent years, as well as impoverishment, often spatially concentrated in more remote, rural areas (section 1.4).
- Yet, following accession to the European Union (EU) in 2013 and the gradual economic recovery in the EU-28 and Croatia since 2014, Slavonia is now also facing a rapid increase in unfilled vacancies. This is happening, despite continuing high unemployment and inactivity rates and poverty, posing one of the conundrums of Slavonia’s labor market (section 1.5).
1.1. Significantly lower labor force participation than in the rest of Croatia
In Croatia, employment rates remain 9 percentage points below the EU-28 average. In 2010, two years into the global financial crisis, less than three out of five working-age adults were employed in Croatia (57.4 percent), or 6.6 percentage points below the EU-28 average (Figure 124). This was mostly on account of the high share of inactive working-age adults (34.9 percent, or more than one in three working-age adults were not employed or looking for work). In 2017, Croatia had somewhat recovered, with employment rates 1.5 percent higher and unemployment rates slightly lower (11.2 percent compared to 11.7 percent in 2010). Yet, much of this improvement was due to a decline in the number of working-age individuals (following outmigration and ageing) rather than job creation.
In Slavonia, employment rates are even lower (8.3 percentage points below those in the rest of Croatia), mainly due to even lower labor market participation. One Slavonian in two is not working, as compared to two in five in the rest of Croatia. This is mostly due to higher inactivity rates (38.7 versus 33.6 percent respectively), but also to higher unemployment rates (10.7 versus 7.5 percent). Long-term unemployment (LTU) in particular remains an important concern, both in Slavonia and in the rest of Croatia. Roughly one in two unemployed individuals has been without a job for over 12 months (see Figure 124).
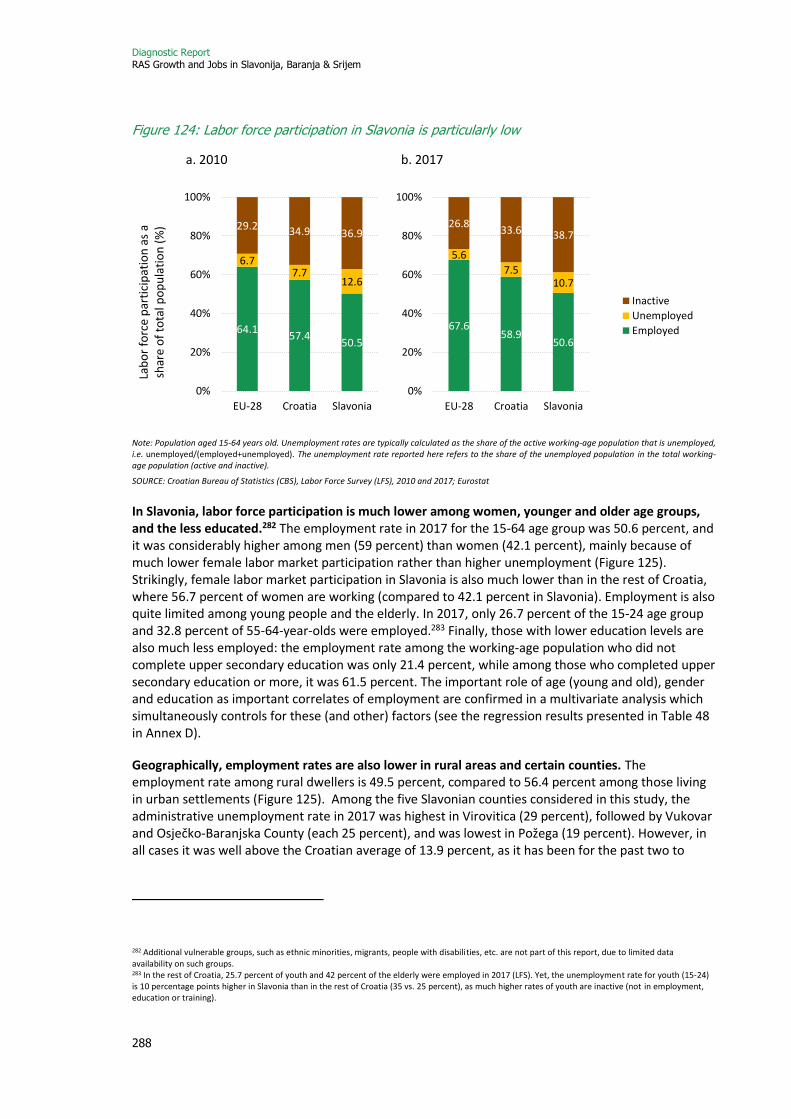
Diagnostic Report RAS Growth and Jobs in Slavonija, Baranja & Srijem
288
Figure 124: Labor force participation in Slavonia is particularly low
a. 2010 b. 2017
Note: Population aged 15-64 years old. Unemployment rates are typically calculated as the share of the active working-age population that is unemployed, i.e. unemployed/(employed+unemployed). The unemployment rate reported here refers to the share of the unemployed population in the total working-age population (active and inactive).
SOURCE: Croatian Bureau of Statistics (CBS), Labor Force Survey (LFS), 2010 and 2017; Eurostat
In Slavonia, labor force participation is much lower among women, younger and older age groups, and the less educated.282 The employment rate in 2017 for the 15-64 age group was 50.6 percent, and it was considerably higher among men (59 percent) than women (42.1 percent), mainly because of much lower female labor market participation rather than higher unemployment (Figure 125). Strikingly, female labor market participation in Slavonia is also much lower than in the rest of Croatia, where 56.7 percent of women are working (compared to 42.1 percent in Slavonia). Employment is also quite limited among young people and the elderly. In 2017, only 26.7 percent of the 15-24 age group and 32.8 percent of 55-64-year-olds were employed.283 Finally, those with lower education levels are also much less employed: the employment rate among the working-age population who did not complete upper secondary education was only 21.4 percent, while among those who completed upper secondary education or more, it was 61.5 percent. The important role of age (young and old), gender and education as important correlates of employment are confirmed in a multivariate analysis which simultaneously controls for these (and other) factors (see the regression results presented in Table 48 in Annex D).
Geographically, employment rates are also lower in rural areas and certain counties. The employment rate among rural dwellers is 49.5 percent, compared to 56.4 percent among those living in urban settlements (Figure 125). Among the five Slavonian counties considered in this study, the administrative unemployment rate in 2017 was highest in Virovitica (29 percent), followed by Vukovar and Osječko-Baranjska County (each 25 percent), and was lowest in Požega (19 percent). However, in all cases it was well above the Croatian average of 13.9 percent, as it has been for the past two to
282 Additional vulnerable groups, such as ethnic minorities, migrants, people with disabilities, etc. are not part of this report, due to limited data availability on such groups. 283 In the rest of Croatia, 25.7 percent of youth and 42 percent of the elderly were employed in 2017 (LFS). Yet, the unemployment rate for youth (15-24) is 10 percentage points higher in Slavonia than in the rest of Croatia (35 vs. 25 percent), as much higher rates of youth are inactive (not in employment, education or training).
64.157.4
50.5
6.77.7
12.6
29.2 34.9 36.9
0%
20%
40%
60%
80%
100%
EU-28 Croatia Slavonia
Lab
or
forc
e p
arti
cip
atio
n a
s a
shar
e o
f to
tal p
op
ula
tio
n (
%)
67.658.9
50.6
5.6
7.510.7
26.833.6 38.7
0%
20%
40%
60%
80%
100%
EU-28 Croatia Slavonia
Inactive
Unemployed
Employed

Diagnostic Report RAS Growth and Jobs in Slavonija, Baranja & Srijem
289
three decades,284 and much higher than in Zagreb and Istria, where the unemployment rate in 2017 was only 6 percent. The difference in labor market performance across these different geographic areas follows partly from their different demographic composition and income, and not just from the geographic characteristics themselves. For instance, controlling for a person’s income, their demographic characteristics (age, gender, marital status, education and household composition), and the county they live in, the likelihood of being employed is the same in rural and urban areas. Similarly, compared to Osijek, rural (and urban) citizens with the same income and demographic characteristics are only more likely to be employed when living in Požega (by 13.5 percentage points) and less likely to be employed when living in Vukovar (by 11.5 percentage points), but equally likely to be employed when living in the other two counties (see the Probit regression results presented in Annex D, Table 48).
Figure 125: Labor force participation is lower among women, the youngest and oldest age groups, the less educated, and in rural areas
SOURCE: Croatian Bureau of Statistics (CBS), Labor Force Surveys (LFS), 2017
1.2. Shaped by a legacy of war, lower education and limited availability of care
Slavonia’s much higher inactivity and unemployment rates than in the rest of Croatia (by 10 percentage points in total) beg the question as to what is so different about its labor force and economy. It is especially puzzling given that Slavonia was a thriving region up until the early 1990s, with Osijek, the largest city in the region, the second largest industrial center in former Yugoslavia. At the same time, being on the front line, Slavonia was particularly affected by the 1991-95 Homeland War. However, there are other factors at play as well. Comparison of the shares of the different socio-economic groups among the inactive and unemployed populations with those in the rest of Croatia provide a first entry point in addressing this question (Figure 126).
284 At the onset of the crisis, the counties in the region recorded as much as 20 to 30 percent of their active population as registered unemployed (compared to a country average of 15 percent). Registered unemployment rates peaked at 30 to 40 percent of the active population in 2014, but the labor market situation, like in the rest of the country, improved substantially thereafter, bringing unemployment rates back to pre-crisis levels.
50.659
42.126.7
66
32.821.4
61.5 56.4 49.5
10.79.4
12
14.6
11.2
5.69.1
11.311
10.6
38.7 31.645.9
58.8
22.8
61.6 69.5
27.2 32.6 39.9
0%
20%
40%
60%
80%
100%
Slavonia Men Women 15-24y.o.
25-54y.o.
55-64y.o.
< upper-secondaryeducation
>= upper-secondaryeducation
Urban Rural
Lab
or
forc
e p
arti
cip
atio
n a
s a
shar
e o
f to
tal p
op
ula
tio
n a
ged
15
-64
(%
)
Employed Unemployed Inactive

Diagnostic Report RAS Growth and Jobs in Slavonija, Baranja & Srijem
290
Figure 126: More of Slavonia’s labor force is inactive at home and in early retirement
SOURCE: Croatian Bureau of Statistics (CBS), Labor Force Survey (LFS), 2017
First, the labor force in Slavonia is characterized by low levels of education and skills, which is often a powerful predictor of unemployment and inactivity. The share of the Slavonian working-age population that is short and long-term unemployed is one percentage point higher than in the rest of Croatia (each time 4 instead of 3 percent), thereby accounting for a fifth of the 10-percentage point employment gap between Slavonia and the rest of Croatia. Many labor supply and demand factors affect unemployment, but it typically declines with education. In 2017, 55 percent of the working-age population in Slavonia had at most completed 3 years of vocational school (half of whom had not completed upper-secondary school) (Figure 127). This picture is quite different from the rest of Croatia, where the majority of the working-age population has completed at least 4 years of vocational school (higher-vocational), and more than 20 percent has completed tertiary education (professional or university studies). The poorer educational attainment of Slavonia’s labor force is cause for concern, both from an absolute and comparative perspective. The challenge is deep rooted. It goes well beyond the interruption of Slavonians’ education careers during the war285 and possible selective outmigration of the more educated and younger populations. The factors behind Slavonia’s cumulative educational lag are discussed in more detail in section 3.
Second, a much larger share of Slavonia’s working-age population is inactive at home, largely due to a lower share of female labor participation and a much less developed system of childcare provision. At 7 percent, the share of inactive people at home is 4 percentage points higher than in the rest of Croatia (accounting for two-fifths of the employment gap, i.e. four out of 10 percentage points)—see Figure 126. This is consistent with the lower female labor market participation and much less developed system of family care than in the rest of Croatia. While other factors than access to childcare are obviously at work in explaining the female employment gap, comparison of the female employment rate gap for the 25-39 age group in Slavonia (18.2 percentage points) with the rest of Croatia (6.7 percent) suggests that up to 11.5 percentage points may be due to lower access to care (LFS, 2017).
Coincidentally, enrollment in early childhood education and care (ECEC) is also much less prevalent in Slavonia than in the rest of Croatia. In 2016-2017, only 8 percent of Slavonian children below three years old were enrolled in nurseries, and about a third of the 3-to-6-year-olds were enrolled in regular
285 This lower educational attainment cuts across age groups, while war effects would mainly manifest themselves among the 30-45-year-olds, i.e. the cohort of school-age children (set at 6-21 years old) during the 1991-1995 war.
45%
6%1%4%4%
11%
7%
13%
2%7%
55%
6%1%3%
3%
11%
3%
11%
2%5% Employed - employee
Employed - self-employed
Employed - unpaid family worker
Unemployed - < 12months
Unemployed - > 12 months
Inactive - in school
Inactive - at home
Inactive - early retirement
Inactive - not able to work
Inactive - other
Slavonia Rest of Croatia
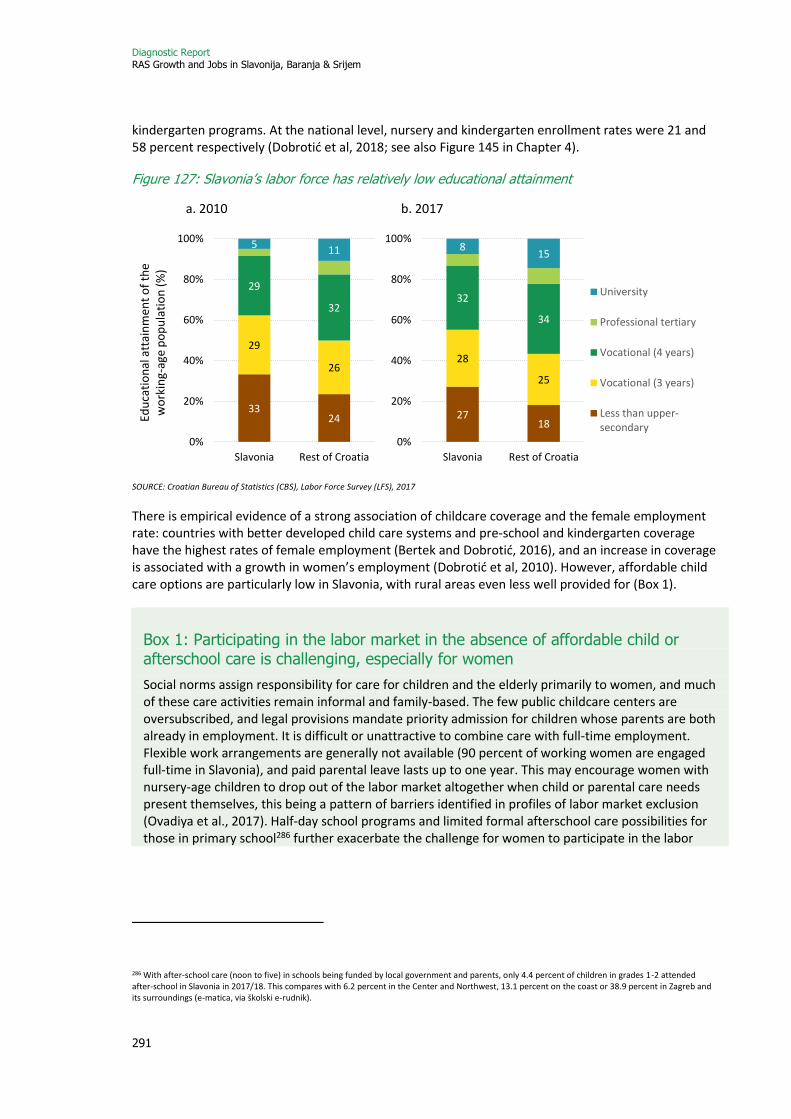
Diagnostic Report RAS Growth and Jobs in Slavonija, Baranja & Srijem
291
kindergarten programs. At the national level, nursery and kindergarten enrollment rates were 21 and 58 percent respectively (Dobrotić et al, 2018; see also Figure 145 in Chapter 4).
Figure 127: Slavonia’s labor force has relatively low educational attainment
a. 2010 b. 2017
SOURCE: Croatian Bureau of Statistics (CBS), Labor Force Survey (LFS), 2017
There is empirical evidence of a strong association of childcare coverage and the female employment rate: countries with better developed child care systems and pre-school and kindergarten coverage have the highest rates of female employment (Bertek and Dobrotić, 2016), and an increase in coverage is associated with a growth in women’s employment (Dobrotić et al, 2010). However, affordable child care options are particularly low in Slavonia, with rural areas even less well provided for (Box 1).
Box 1: Participating in the labor market in the absence of affordable child or afterschool care is challenging, especially for women
Social norms assign responsibility for care for children and the elderly primarily to women, and much of these care activities remain informal and family-based. The few public childcare centers are oversubscribed, and legal provisions mandate priority admission for children whose parents are both already in employment. It is difficult or unattractive to combine care with full-time employment. Flexible work arrangements are generally not available (90 percent of working women are engaged full-time in Slavonia), and paid parental leave lasts up to one year. This may encourage women with nursery-age children to drop out of the labor market altogether when child or parental care needs present themselves, this being a pattern of barriers identified in profiles of labor market exclusion (Ovadiya et al., 2017). Half-day school programs and limited formal afterschool care possibilities for those in primary school286 further exacerbate the challenge for women to participate in the labor
286 With after-school care (noon to five) in schools being funded by local government and parents, only 4.4 percent of children in grades 1-2 attended after-school in Slavonia in 2017/18. This compares with 6.2 percent in the Center and Northwest, 13.1 percent on the coast or 38.9 percent in Zagreb and its surroundings (e-matica, via školski e-rudnik).
3324
29
26
29
32
511
0%
20%
40%
60%
80%
100%
Slavonia Rest of Croatia
Edu
cati
on
al a
ttai
nm
ent
of
the
wo
rkin
g-ag
e p
op
ula
tio
n (
%)
2718
28
25
32
34
815
0%
20%
40%
60%
80%
100%
Slavonia Rest of Croatia
University
Professional tertiary
Vocational (4 years)
Vocational (3 years)
Less than upper-secondary
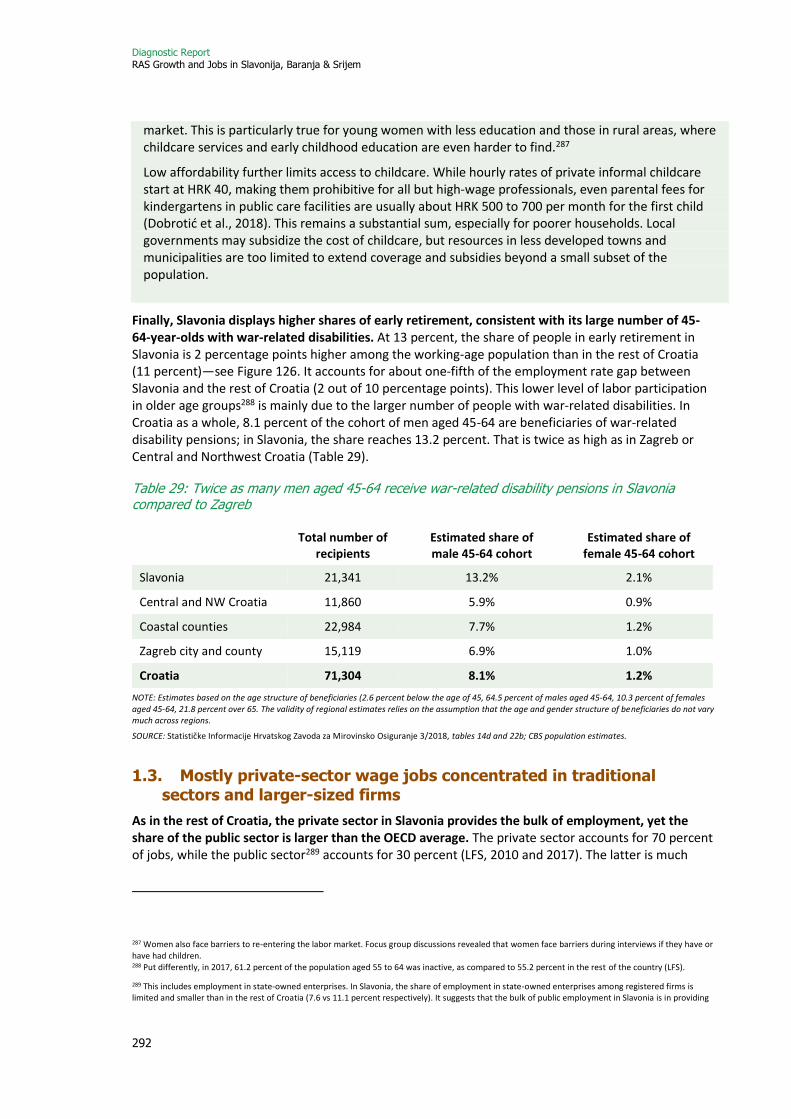
Diagnostic Report RAS Growth and Jobs in Slavonija, Baranja & Srijem
292
market. This is particularly true for young women with less education and those in rural areas, where childcare services and early childhood education are even harder to find.287
Low affordability further limits access to childcare. While hourly rates of private informal childcare start at HRK 40, making them prohibitive for all but high-wage professionals, even parental fees for kindergartens in public care facilities are usually about HRK 500 to 700 per month for the first child (Dobrotić et al., 2018). This remains a substantial sum, especially for poorer households. Local governments may subsidize the cost of childcare, but resources in less developed towns and municipalities are too limited to extend coverage and subsidies beyond a small subset of the population.
Finally, Slavonia displays higher shares of early retirement, consistent with its large number of 45-64-year-olds with war-related disabilities. At 13 percent, the share of people in early retirement in Slavonia is 2 percentage points higher among the working-age population than in the rest of Croatia (11 percent)—see Figure 126. It accounts for about one-fifth of the employment rate gap between Slavonia and the rest of Croatia (2 out of 10 percentage points). This lower level of labor participation in older age groups288 is mainly due to the larger number of people with war-related disabilities. In Croatia as a whole, 8.1 percent of the cohort of men aged 45-64 are beneficiaries of war-related disability pensions; in Slavonia, the share reaches 13.2 percent. That is twice as high as in Zagreb or Central and Northwest Croatia (Table 29).
Table 29: Twice as many men aged 45-64 receive war-related disability pensions in Slavonia compared to Zagreb
Total number of
recipients Estimated share of male 45-64 cohort
Estimated share of female 45-64 cohort
Slavonia 21,341 13.2% 2.1%
Central and NW Croatia 11,860 5.9% 0.9%
Coastal counties 22,984 7.7% 1.2%
Zagreb city and county 15,119 6.9% 1.0%
Croatia 71,304 8.1% 1.2%
NOTE: Estimates based on the age structure of beneficiaries (2.6 percent below the age of 45, 64.5 percent of males aged 45-64, 10.3 percent of females aged 45-64, 21.8 percent over 65. The validity of regional estimates relies on the assumption that the age and gender structure of beneficiaries do not vary much across regions.
SOURCE: Statističke Informacije Hrvatskog Zavoda za Mirovinsko Osiguranje 3/2018, tables 14d and 22b; CBS population estimates.
1.3. Mostly private-sector wage jobs concentrated in traditional sectors and larger-sized firms
As in the rest of Croatia, the private sector in Slavonia provides the bulk of employment, yet the share of the public sector is larger than the OECD average. The private sector accounts for 70 percent of jobs, while the public sector289 accounts for 30 percent (LFS, 2010 and 2017). The latter is much
287 Women also face barriers to re-entering the labor market. Focus group discussions revealed that women face barriers during interviews if they have or have had children. 288 Put differently, in 2017, 61.2 percent of the population aged 55 to 64 was inactive, as compared to 55.2 percent in the rest of the country (LFS).
289 This includes employment in state-owned enterprises. In Slavonia, the share of employment in state-owned enterprises among registered firms is limited and smaller than in the rest of Croatia (7.6 vs 11.1 percent respectively). It suggests that the bulk of public employment in Slavonia is in providing
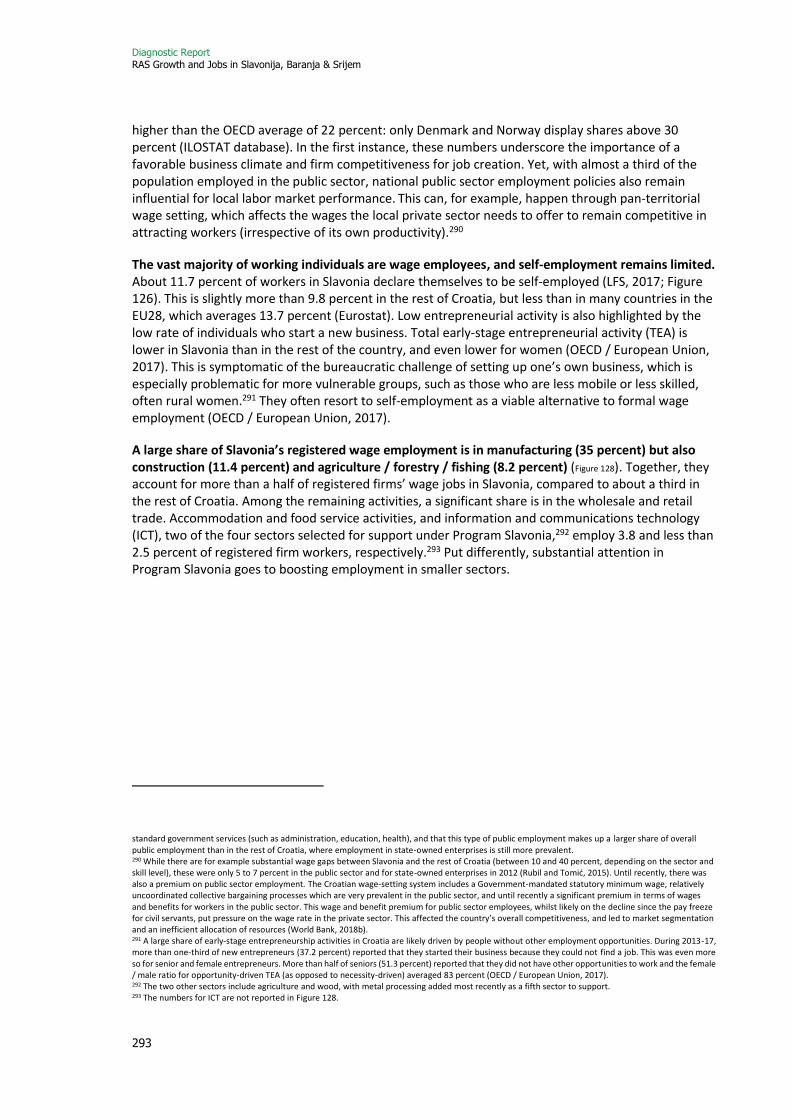
Diagnostic Report RAS Growth and Jobs in Slavonija, Baranja & Srijem
293
higher than the OECD average of 22 percent: only Denmark and Norway display shares above 30 percent (ILOSTAT database). In the first instance, these numbers underscore the importance of a favorable business climate and firm competitiveness for job creation. Yet, with almost a third of the population employed in the public sector, national public sector employment policies also remain influential for local labor market performance. This can, for example, happen through pan-territorial wage setting, which affects the wages the local private sector needs to offer to remain competitive in attracting workers (irrespective of its own productivity).290
The vast majority of working individuals are wage employees, and self-employment remains limited. About 11.7 percent of workers in Slavonia declare themselves to be self-employed (LFS, 2017; Figure 126). This is slightly more than 9.8 percent in the rest of Croatia, but less than in many countries in the EU28, which averages 13.7 percent (Eurostat). Low entrepreneurial activity is also highlighted by the low rate of individuals who start a new business. Total early-stage entrepreneurial activity (TEA) is lower in Slavonia than in the rest of the country, and even lower for women (OECD / European Union, 2017). This is symptomatic of the bureaucratic challenge of setting up one’s own business, which is especially problematic for more vulnerable groups, such as those who are less mobile or less skilled, often rural women.291 They often resort to self-employment as a viable alternative to formal wage employment (OECD / European Union, 2017).
A large share of Slavonia’s registered wage employment is in manufacturing (35 percent) but also construction (11.4 percent) and agriculture / forestry / fishing (8.2 percent) (Figure 128). Together, they account for more than a half of registered firms’ wage jobs in Slavonia, compared to about a third in the rest of Croatia. Among the remaining activities, a significant share is in the wholesale and retail trade. Accommodation and food service activities, and information and communications technology (ICT), two of the four sectors selected for support under Program Slavonia,292 employ 3.8 and less than 2.5 percent of registered firm workers, respectively.293 Put differently, substantial attention in Program Slavonia goes to boosting employment in smaller sectors.
standard government services (such as administration, education, health), and that this type of public employment makes up a larger share of overall public employment than in the rest of Croatia, where employment in state-owned enterprises is still more prevalent. 290 While there are for example substantial wage gaps between Slavonia and the rest of Croatia (between 10 and 40 percent, depending on the sector and skill level), these were only 5 to 7 percent in the public sector and for state-owned enterprises in 2012 (Rubil and Tomić, 2015). Until recently, there was also a premium on public sector employment. The Croatian wage-setting system includes a Government-mandated statutory minimum wage, relatively uncoordinated collective bargaining processes which are very prevalent in the public sector, and until recently a significant premium in terms of wages and benefits for workers in the public sector. This wage and benefit premium for public sector employees, whilst likely on the decline since the pay freeze for civil servants, put pressure on the wage rate in the private sector. This affected the country’s overall competitiveness, and led to market segmentation and an inefficient allocation of resources (World Bank, 2018b). 291 A large share of early-stage entrepreneurship activities in Croatia are likely driven by people without other employment opportunities. During 2013-17, more than one-third of new entrepreneurs (37.2 percent) reported that they started their business because they could not find a job. This was even more so for senior and female entrepreneurs. More than half of seniors (51.3 percent) reported that they did not have other opportunities to work and the female / male ratio for opportunity-driven TEA (as opposed to necessity-driven) averaged 83 percent (OECD / European Union, 2017). 292 The two other sectors include agriculture and wood, with metal processing added most recently as a fifth sector to support. 293 The numbers for ICT are not reported in Figure 128.
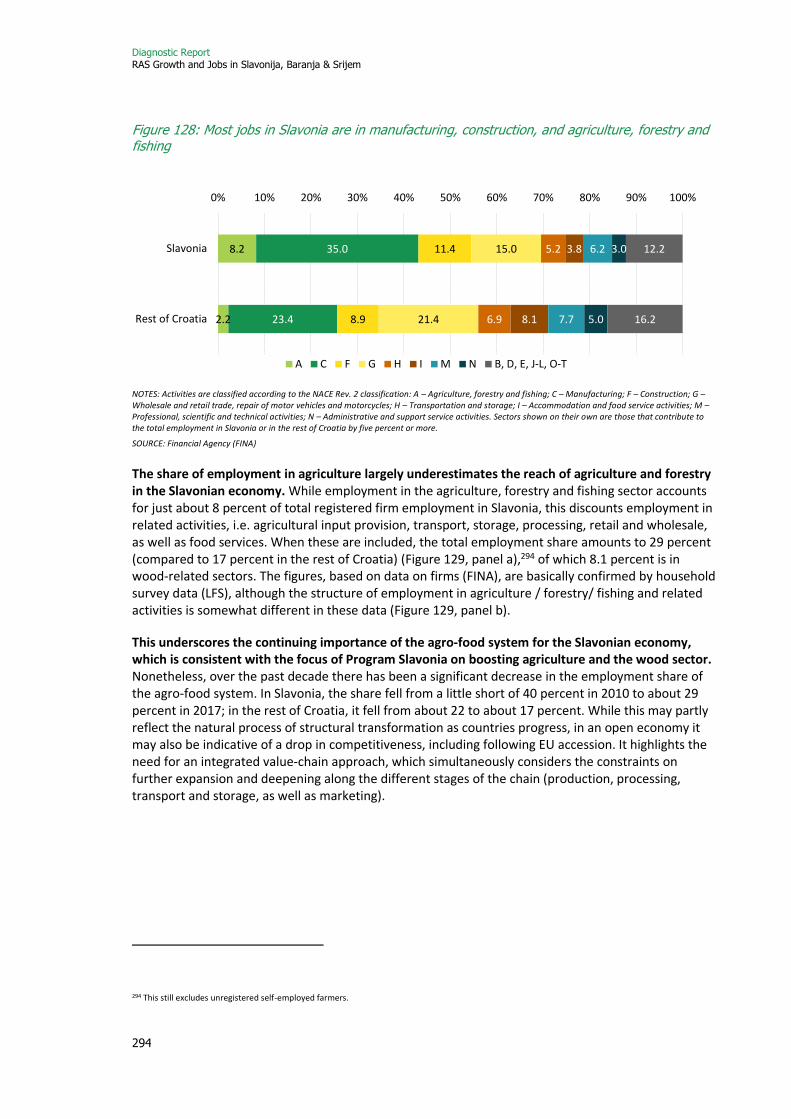
Diagnostic Report RAS Growth and Jobs in Slavonija, Baranja & Srijem
294
Figure 128: Most jobs in Slavonia are in manufacturing, construction, and agriculture, forestry and fishing
NOTES: Activities are classified according to the NACE Rev. 2 classification: A – Agriculture, forestry and fishing; C – Manufacturing; F – Construction; G – Wholesale and retail trade, repair of motor vehicles and motorcycles; H – Transportation and storage; I – Accommodation and food service activities; M – Professional, scientific and technical activities; N – Administrative and support service activities. Sectors shown on their own are those that contribute to the total employment in Slavonia or in the rest of Croatia by five percent or more.
SOURCE: Financial Agency (FINA)
The share of employment in agriculture largely underestimates the reach of agriculture and forestry in the Slavonian economy. While employment in the agriculture, forestry and fishing sector accounts for just about 8 percent of total registered firm employment in Slavonia, this discounts employment in related activities, i.e. agricultural input provision, transport, storage, processing, retail and wholesale, as well as food services. When these are included, the total employment share amounts to 29 percent (compared to 17 percent in the rest of Croatia) (Figure 129, panel a),294 of which 8.1 percent is in wood-related sectors. The figures, based on data on firms (FINA), are basically confirmed by household survey data (LFS), although the structure of employment in agriculture / forestry/ fishing and related activities is somewhat different in these data (Figure 129, panel b).
This underscores the continuing importance of the agro-food system for the Slavonian economy, which is consistent with the focus of Program Slavonia on boosting agriculture and the wood sector. Nonetheless, over the past decade there has been a significant decrease in the employment share of the agro-food system. In Slavonia, the share fell from a little short of 40 percent in 2010 to about 29 percent in 2017; in the rest of Croatia, it fell from about 22 to about 17 percent. While this may partly reflect the natural process of structural transformation as countries progress, in an open economy it may also be indicative of a drop in competitiveness, including following EU accession. It highlights the need for an integrated value-chain approach, which simultaneously considers the constraints on further expansion and deepening along the different stages of the chain (production, processing, transport and storage, as well as marketing).
294 This still excludes unregistered self-employed farmers.
8.2
2.2
35.0
23.4
11.4
8.9
15.0
21.4
5.2
6.9
3.8
8.1
6.2
7.7
3.0
5.0
12.2
16.2
0% 10% 20% 30% 40% 50% 60% 70% 80% 90% 100%
Slavonia
Rest of Croatia
A C F G H I M N B, D, E, J-L, O-T

Diagnostic Report RAS Growth and Jobs in Slavonija, Baranja & Srijem
295
Figure 129: About one in three jobs in Croatia is related to agriculture
a. 2017, based on firm data
b. 2010 and 2017, based on household data
NOTES: ag production – NACE Rev. 2 activities A1; wood – NACE Rev. 2 activities A2; fishing – NACE Rev. 2 activities A3.; ag / food-related – NACE Rev. 2 activities C10-C12, G46.17, G46.3, G47.11, G47.2, G47.81 and I56; wood-related – NACE Rev. 2 activities C16-C17, C31, G46.13, G46.15, G46.47, G47.59 and G47.82; other ag / non-food – NACE Rev. 2 activities C13-C14, G36.11, G46.16, G46.2, G47.51 and G47.82. Total employment refers to total employment in Slavonia or in the rest of Croatia, and not in Croatia as a whole.
SOURCE: Financial Agency (FINA) in panel (a); Labor Force Surveys (LFS) 2010 and 2017 in panel (b)
Wage employment in registered legal entities is concentrated in large and medium-sized firms. The structure of employment by firm size in Slavonia differs only a little from that in the rest of Croatia. In both cases somewhat less than half of all registered wage employment is in relatively large firms, i.e. those with more than 50 employees (Figure 130). When firms with 11 to 50 employees are added, about 70 percent of employment is accounted for. Neither in Slavonia nor in the rest of Croatia does the share of employment in the smallest firms, those with one or two employees, exceed 10 percent. However, while most people are employed in medium and large firms, more than half of the firms in Slavonia are in fact unincorporated, such as freelancers and craft companies, as compared to less than 40 percent in the rest of the country (Croatian Chamber of Trades and Crafts and CBS).295
295 In Slavonia, half of the craft companies are in services and hospitality / tourism (40.5 and 11.1 percent of all firms, respectively), as compared to 41.6 and 16.3 percent in the rest of Croatia), with most of the rest roughly equally distributed across four other activities (trade (12.3 percent), manufacturing
7.7
1.0
9.6
10.1
8.1
2.9
3.0
1.9
0 5 10 15 20 25 30
Slavonia
Rest of Croatia
Share of total employment (in %)
ag production wood fishing ag/food related wood related other ag/nonfood
23.3
9.113.1
3.6
7.4
7.7
7.4
8.9
4.9
2.1
5.0
2.3
1.2
2.3
1.6
1.5
0
5
10
15
20
25
30
35
40
SLA RoC SLA RoC
2010 2017
Shar
e o
f to
tal e
mp
loym
ent
(in
%)
ag production wood fishing ag/food related wood related other ag/nonfood
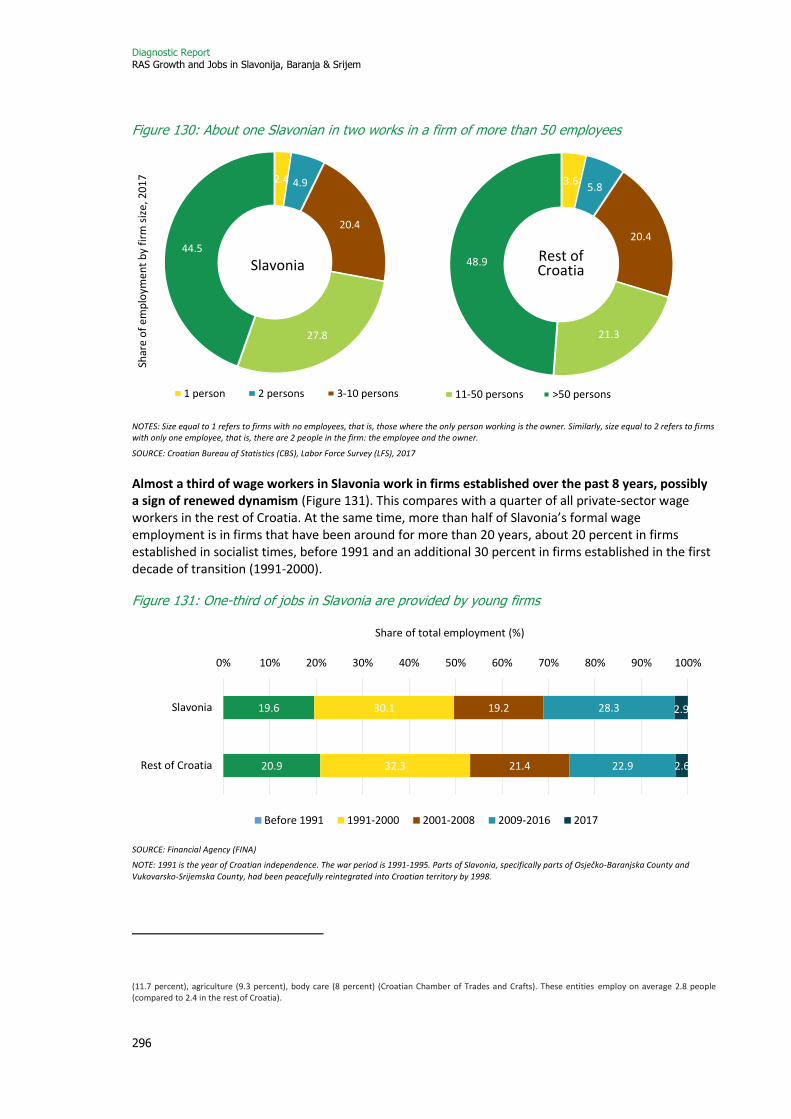
Diagnostic Report RAS Growth and Jobs in Slavonija, Baranja & Srijem
296
Figure 130: About one Slavonian in two works in a firm of more than 50 employees
NOTES: Size equal to 1 refers to firms with no employees, that is, those where the only person working is the owner. Similarly, size equal to 2 refers to firms with only one employee, that is, there are 2 people in the firm: the employee and the owner.
SOURCE: Croatian Bureau of Statistics (CBS), Labor Force Survey (LFS), 2017
Almost a third of wage workers in Slavonia work in firms established over the past 8 years, possibly a sign of renewed dynamism (Figure 131). This compares with a quarter of all private-sector wage workers in the rest of Croatia. At the same time, more than half of Slavonia’s formal wage employment is in firms that have been around for more than 20 years, about 20 percent in firms established in socialist times, before 1991 and an additional 30 percent in firms established in the first decade of transition (1991-2000).
Figure 131: One-third of jobs in Slavonia are provided by young firms
SOURCE: Financial Agency (FINA)
NOTE: 1991 is the year of Croatian independence. The war period is 1991-1995. Parts of Slavonia, specifically parts of Osječko-Baranjska County and
Vukovarsko-Srijemska County, had been peacefully reintegrated into Croatian territory by 1998.
(11.7 percent), agriculture (9.3 percent), body care (8 percent) (Croatian Chamber of Trades and Crafts). These entities employ on average 2.8 people (compared to 2.4 in the rest of Croatia).
2.4 4.9
20.4
27.8
44.5
1 person 2 persons 3-10 persons
Slavonia
3.65.8
20.4
21.3
48.9
11-50 persons >50 persons
Rest of Croatia
19.6
20.9
30.1
32.3
19.2
21.4
28.3
22.9
2.9
2.6
0% 10% 20% 30% 40% 50% 60% 70% 80% 90% 100%
Slavonia
Rest of Croatia
Share of total employment (%)
Before 1991 1991-2000 2001-2008 2009-2016 2017
Shar
e o
f em
plo
yme
nt
by
firm
siz
e, 2
01
7

Diagnostic Report RAS Growth and Jobs in Slavonija, Baranja & Srijem
297
Labor productivity in Slavonian firms is systematically lower than in the rest of Croatia. Profit or value added per employee296 among registered firms in Slavonia is on average less than half that in the rest of Croatia. This holds across firm size but it is most pronounced among larger firms (those with more than 50 employees). Their labor productivity is only 30 percent of the labor productivity in large firms elsewhere in Croatia, compared with 72 percent among medium-sized firms (11-50 employees). The large gap in labor productivity also holds across sectors, with agricultural production forestry and fishery a notable exception (NACE Rev 2 activity A). This proves more than twice as productive. Yet, when the whole food system is considered, the advantage no longer holds. These figures suggest the much lower competitiveness of Slavonian firms. This bears on Slavonia’s labor market performance, both in terms of the demand for labor, and thus job creation, and also the wages offered. This will be discussed further in section 0.
Figure 132: Firm labor productivity is systematically lower in Slavonia
NOTES: Based on the average profit per employee ((sales - material costs - staff costs - other operating costs) / number of employees) per firm, weighted by firm size (number of employees per firm). ‘AFF’ refers to ‘agriculture, forestry and fishing’, i.e. NACE Rev. 2 activities A. ‘Related’ activities are NACE Rev. 2 activities C10-C12, G46.17, G46.3, G47.11, G47.2, G47.81, I56, C16-C17, C31, G46.13, G46.15, G46.47, G47.59, G47.82, C13-C14, G36.11, G46.16, G46.2, G47.51 and G47.82. Size equal to 1 refers to firms with no employees, that is, those where the only person working is the owner. Similarly, size equal to 2 refers to firms with only one employee, that is, there are 2 people in the firm: the employee and the owner.
SOURCE: Financial Agency (FINA).
However, while a large number of firms in Slavonia display low labor productivity, labor productivity is very high in some others. Although average labor productivity in Slavonian firms is much lower, there is also great heterogeneity among firms within sectors, with some even outperforming many of those elsewhere in Croatia. The presence of such highly competitive firms holds hope. It indicates that high performance is also possible in Slavonia. Understanding the reasons behind their performance deserves further attention.
296 FINA, 2017. Value added or profit per employee is used as a proxy for labor productivity. It is calculated as (gross sales - material costs - staff costs - other operating costs) / number of employees. This corresponds to the EBITDA approach
of measuring profit, i.e. earnings before interest, taxes, depreciation and amortization.
0
1
2
ove
rall 1 2
3-1
0
11
-50
>50
By firm size
Yes
No
AFF and related
activities
A B C D E F G H I J L M N Q S T
By sector
Res
t o
f C
roat
ia =
10
0
100 %
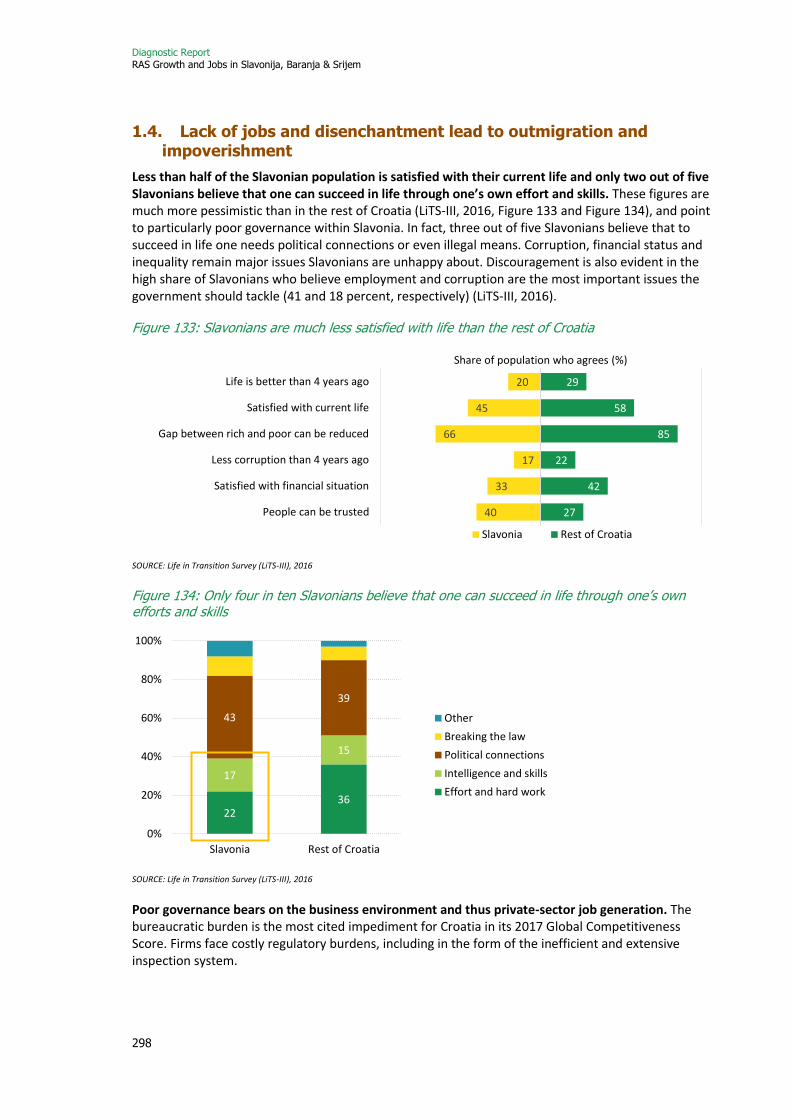
Diagnostic Report RAS Growth and Jobs in Slavonija, Baranja & Srijem
298
1.4. Lack of jobs and disenchantment lead to outmigration and impoverishment
Less than half of the Slavonian population is satisfied with their current life and only two out of five Slavonians believe that one can succeed in life through one’s own effort and skills. These figures are much more pessimistic than in the rest of Croatia (LiTS-III, 2016, Figure 133 and Figure 134), and point to particularly poor governance within Slavonia. In fact, three out of five Slavonians believe that to succeed in life one needs political connections or even illegal means. Corruption, financial status and inequality remain major issues Slavonians are unhappy about. Discouragement is also evident in the high share of Slavonians who believe employment and corruption are the most important issues the government should tackle (41 and 18 percent, respectively) (LiTS-III, 2016).
Figure 133: Slavonians are much less satisfied with life than the rest of Croatia
SOURCE: Life in Transition Survey (LiTS-III), 2016
Figure 134: Only four in ten Slavonians believe that one can succeed in life through one’s own efforts and skills
SOURCE: Life in Transition Survey (LiTS-III), 2016
Poor governance bears on the business environment and thus private-sector job generation. The bureaucratic burden is the most cited impediment for Croatia in its 2017 Global Competitiveness Score. Firms face costly regulatory burdens, including in the form of the inefficient and extensive inspection system.
20
45
66
17
33
40
29
58
85
22
42
27
Life is better than 4 years ago
Satisfied with current life
Gap between rich and poor can be reduced
Less corruption than 4 years ago
Satisfied with financial situation
People can be trusted
Share of population who agrees (%)
Slavonia Rest of Croatia
2236
17
15
43
39
0%
20%
40%
60%
80%
100%
Slavonia Rest of Croatia
Other
Breaking the law
Political connections
Intelligence and skills
Effort and hard work
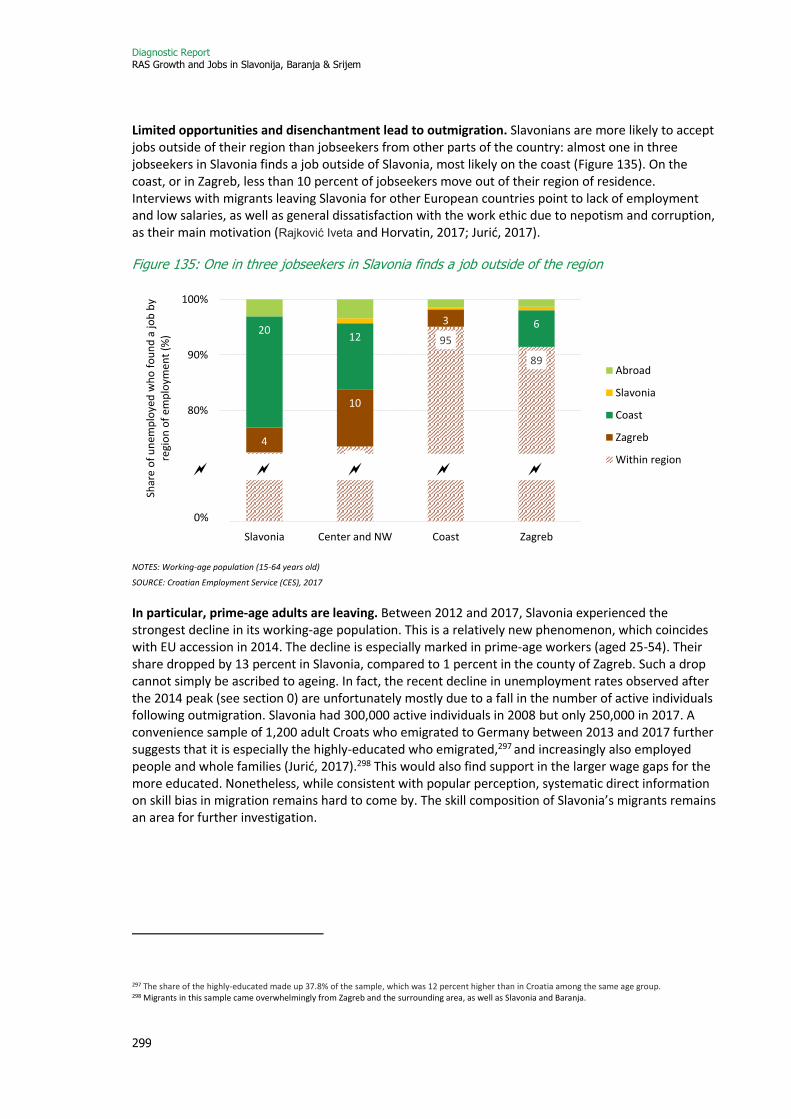
Diagnostic Report RAS Growth and Jobs in Slavonija, Baranja & Srijem
299
Limited opportunities and disenchantment lead to outmigration. Slavonians are more likely to accept jobs outside of their region than jobseekers from other parts of the country: almost one in three jobseekers in Slavonia finds a job outside of Slavonia, most likely on the coast (Figure 135). On the coast, or in Zagreb, less than 10 percent of jobseekers move out of their region of residence. Interviews with migrants leaving Slavonia for other European countries point to lack of employment and low salaries, as well as general dissatisfaction with the work ethic due to nepotism and corruption, as their main motivation (Rajković Iveta and Horvatin, 2017; Jurić, 2017).
Figure 135: One in three jobseekers in Slavonia finds a job outside of the region
NOTES: Working-age population (15-64 years old)
SOURCE: Croatian Employment Service (CES), 2017
In particular, prime-age adults are leaving. Between 2012 and 2017, Slavonia experienced the strongest decline in its working-age population. This is a relatively new phenomenon, which coincides with EU accession in 2014. The decline is especially marked in prime-age workers (aged 25-54). Their share dropped by 13 percent in Slavonia, compared to 1 percent in the county of Zagreb. Such a drop cannot simply be ascribed to ageing. In fact, the recent decline in unemployment rates observed after the 2014 peak (see section 0) are unfortunately mostly due to a fall in the number of active individuals following outmigration. Slavonia had 300,000 active individuals in 2008 but only 250,000 in 2017. A convenience sample of 1,200 adult Croats who emigrated to Germany between 2013 and 2017 further suggests that it is especially the highly-educated who emigrated,297
and increasingly also employed people and whole families (Jurić, 2017).298 This would also find support in the larger wage gaps for the more educated. Nonetheless, while consistent with popular perception, systematic direct information on skill bias in migration remains hard to come by. The skill composition of Slavonia’s migrants remains an area for further investigation.
297 The share of the highly-educated made up 37.8% of the sample, which was 12 percent higher than in Croatia among the same age group. 298 Migrants in this sample came overwhelmingly from Zagreb and the surrounding area, as well as Slavonia and Baranja.
7174
95
89
4
10
320
126
60%
70%
80%
90%
100%
Slavonia Center and NW Coast Zagreb
Shar
e o
f u
nem
plo
yed
wh
o f
ou
nd
a jo
b b
y re
gio
n o
f em
plo
ymen
t (%
)
Abroad
Slavonia
Coast
Zagreb
Within region
0%

Diagnostic Report RAS Growth and Jobs in Slavonija, Baranja & Srijem
300
Figure 136: Outmigration and population decline in Slavonia has intensified since 2012
SOURCE: Croatian Bureau of Statistics (CBS), mid-year population estimates
Those remaining behind are at risk of unemployment and poverty. Employment is the principal channel to avoid and escape poverty. In the poorest quintile (Q1), only one in four working-age individuals is employed, in the richest quintile, 6 out of 10 (Figure 137). Unemployment rates are much higher too, with one in two active individuals from the bottom quintile in Slavonia unemployed. Households in the poorest quintile derive only about 40 percent of their income from employment, relying on pensions and social transfers for another 40 percent. This suggests an important overlap among the profiles of the poor and those excluded from the labor market.
Figure 137: Employment is the main channel out of poverty
a. Labor force participation by quintile b. Source of income by quintile
SOURCE: Croatian Bureau of Statistics (CBS), Household Budget Survey (HBS), 2014
In particular, the young and elderly, those with lower educational attainment, those with young children to take care of, and those living in rural areas are excluded and poor. The importance of employment in fighting poverty and the overlap between poverty and labor market exclusion is further confirmed in a multivariate analysis (the Probit regression results of the correlates of being
-9
-7
-5
-2
-13
-10
-6
-1
-14
-12
-10
-8
-6
-4
-2
0
2
Slavonia Center and NW Coast Zagreb
Five
-yea
r p
op
ula
tio
n c
han
ge (
%)
Working-age, 2007-12 Working-age (15-64 y.o.), 2012-17 Prime-age (25-54 y.o.), 2012-17
0%
20%
40%
60%
80%
100%
Q1(poorest)
Q2 Q3 Q4 Q5(richest)
Employed UnemployedNot looking for work Pupil/studentDomestic tasks RetiredOther inactive
0%
20%
40%
60%
80%
100%
Q1 Q2 Q3 Q4 Q5
Employment Self-employmentPensions TransfersRents CapitalOther
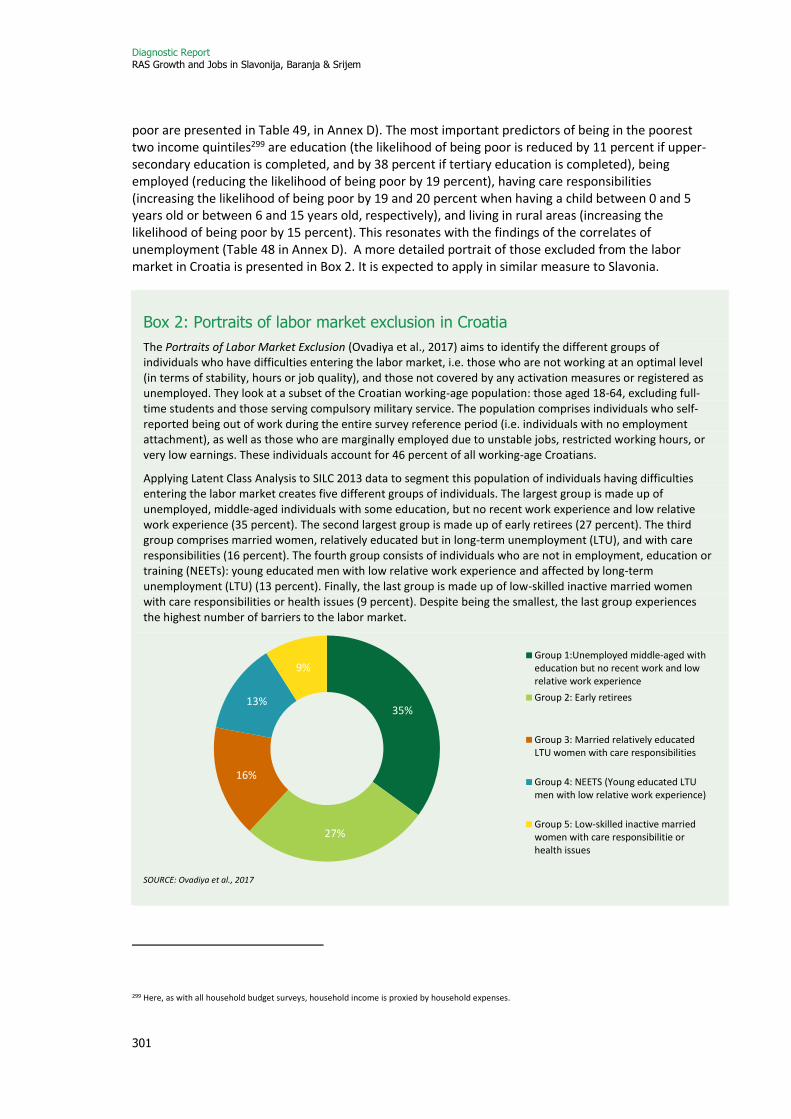
Diagnostic Report RAS Growth and Jobs in Slavonija, Baranja & Srijem
301
poor are presented in Table 49, in Annex D). The most important predictors of being in the poorest two income quintiles299 are education (the likelihood of being poor is reduced by 11 percent if upper-secondary education is completed, and by 38 percent if tertiary education is completed), being employed (reducing the likelihood of being poor by 19 percent), having care responsibilities (increasing the likelihood of being poor by 19 and 20 percent when having a child between 0 and 5 years old or between 6 and 15 years old, respectively), and living in rural areas (increasing the likelihood of being poor by 15 percent). This resonates with the findings of the correlates of unemployment (Table 48 in Annex D). A more detailed portrait of those excluded from the labor market in Croatia is presented in Box 2. It is expected to apply in similar measure to Slavonia.
Box 2: Portraits of labor market exclusion in Croatia
The Portraits of Labor Market Exclusion (Ovadiya et al., 2017) aims to identify the different groups of individuals who have difficulties entering the labor market, i.e. those who are not working at an optimal level (in terms of stability, hours or job quality), and those not covered by any activation measures or registered as unemployed. They look at a subset of the Croatian working-age population: those aged 18-64, excluding full-time students and those serving compulsory military service. The population comprises individuals who self-reported being out of work during the entire survey reference period (i.e. individuals with no employment attachment), as well as those who are marginally employed due to unstable jobs, restricted working hours, or very low earnings. These individuals account for 46 percent of all working-age Croatians.
Applying Latent Class Analysis to SILC 2013 data to segment this population of individuals having difficulties entering the labor market creates five different groups of individuals. The largest group is made up of unemployed, middle-aged individuals with some education, but no recent work experience and low relative work experience (35 percent). The second largest group is made up of early retirees (27 percent). The third group comprises married women, relatively educated but in long-term unemployment (LTU), and with care responsibilities (16 percent). The fourth group consists of individuals who are not in employment, education or training (NEETs): young educated men with low relative work experience and affected by long-term unemployment (LTU) (13 percent). Finally, the last group is made up of low-skilled inactive married women with care responsibilities or health issues (9 percent). Despite being the smallest, the last group experiences the highest number of barriers to the labor market.
SOURCE: Ovadiya et al., 2017
299 Here, as with all household budget surveys, household income is proxied by household expenses.
35%
27%
16%
13%
9%Group 1:Unemployed middle-aged witheducation but no recent work and lowrelative work experience
Group 2: Early retirees
Group 3: Married relatively educatedLTU women with care responsibilities
Group 4: NEETS (Young educated LTUmen with low relative work experience)
Group 5: Low-skilled inactive marriedwomen with care responsibilitie orhealth issues

Diagnostic Report RAS Growth and Jobs in Slavonija, Baranja & Srijem
302
In addition to affecting different socio-economic groups, unemployment and poverty are also deeply spatial, concentrated in smaller and more remote municipalities. Slavonian municipalities where unemployment rates are highest are also among the poorest in Croatia, especially the smallest and most remote municipalities. Municipalities in Slavonia display higher-than-median poverty rates, as well as higher-than-median Index of Multiple Deprivation (IMD) scores (see left panel of Figure 138). Within Slavonia, this is particularly true for smaller and more remote municipalities. The ten biggest municipalities display poverty rates below the regional median of 12 percent, and IMD scores roughly below the regional median, while municipalities with less than 5,000 inhabitants are both poorer and more deprived (see right panel of Figure 138).
Figure 138: Poverty and social exclusion are highest in Slavonian municipalities, especially smaller ones
SOURCE: Croatian Bureau of Statistics (CBS), Index of Multiple Deprivation (IMD) database
Finally, not only is the population in Slavonia poorer and more deprived than in the rest of Croatia, it is also poorer at similar activity levels. As displayed in Figure 139, low levels of activity in Slavonia are correlated with higher levels of poverty than in municipalities outside of Slavonia with similar activity rates. This suggests that sources of income other than wages (unemployment benefits, social transfers, income from rent, etc.) are much lower than elsewhere. Slavonians are poorer, more deprived, and less likely to be able to draw on additional sources of income to make ends meet.
Figure 139: At similar levels of employment, Slavonian municipalities are among the poorest
SOURCE: Croatian Bureau of Statistics (CBS), Index of Multiple Deprivation (IMD) database
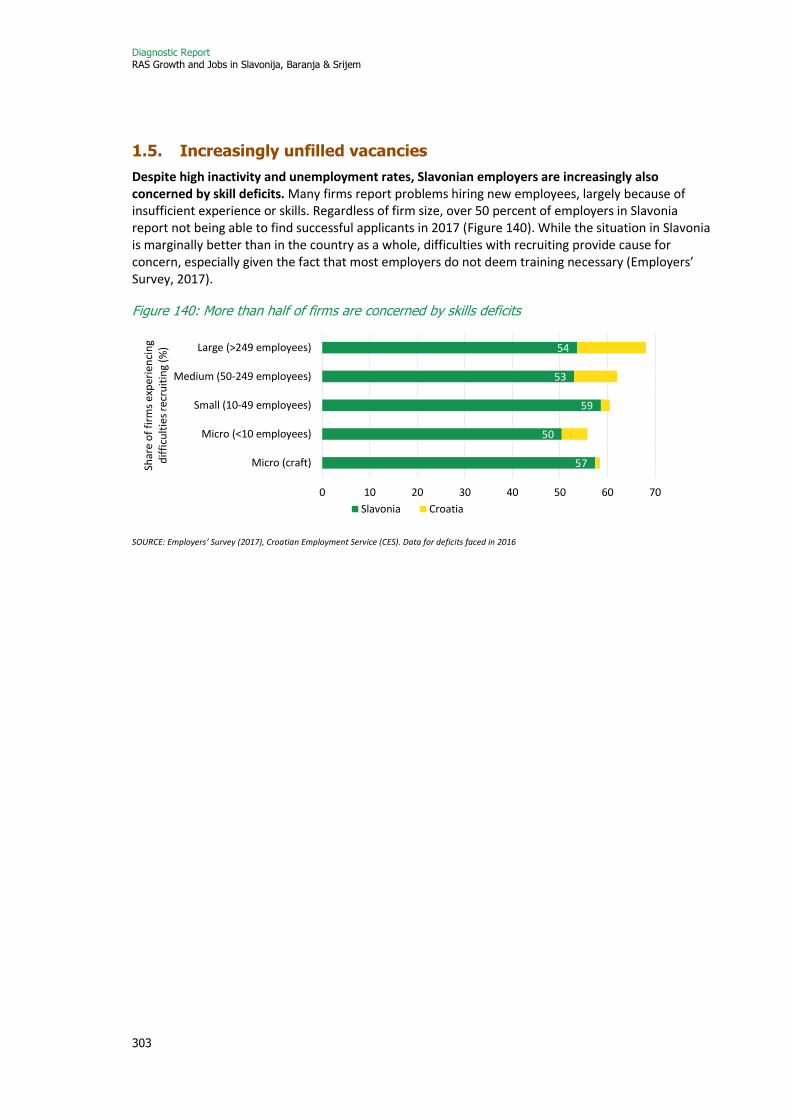
Diagnostic Report RAS Growth and Jobs in Slavonija, Baranja & Srijem
303
1.5. Increasingly unfilled vacancies
Despite high inactivity and unemployment rates, Slavonian employers are increasingly also concerned by skill deficits. Many firms report problems hiring new employees, largely because of insufficient experience or skills. Regardless of firm size, over 50 percent of employers in Slavonia report not being able to find successful applicants in 2017 (Figure 140). While the situation in Slavonia is marginally better than in the country as a whole, difficulties with recruiting provide cause for concern, especially given the fact that most employers do not deem training necessary (Employers’ Survey, 2017).
Figure 140: More than half of firms are concerned by skills deficits
SOURCE: Employers’ Survey (2017), Croatian Employment Service (CES). Data for deficits faced in 2016
57
50
59
53
54
0 10 20 30 40 50 60 70
Micro (craft)
Micro (<10 employees)
Small (10-49 employees)
Medium (50-249 employees)
Large (>249 employees)
Shar
e o
f fi
rms
exp
erie
nci
ng
dif
ficu
ltie
s re
cru
itin
g (%
)
Slavonia Croatia

Diagnostic Report RAS Growth and Jobs in Slavonija, Baranja & Srijem
304
2. Labor market dynamics
Key insights
- Job creation remains the top priority. In the aggregate, there are still many more jobseekers and inactive people than available jobs (section 2.1).
- At the same time, there are also rising labor shortages for high-skilled professionals and some semi-skilled occupations (sections 2.2 and 2.3).
- Slavonia’s phenomenon of unfilled vacancies is partly explained by substantial wage gaps with more competitive firms elsewhere in Croatia (as well as the EU). However, Slavonia’s lack of family care services, which reduce female labor participation, and its lower human capital stock likely play a part as well.
- Current social security provisions, however, do not pose major disincentives for the inactive and unemployed to take up work (section 2.4).
2.1. Job creation remains the top priority
Despite substantial progress, labor supply still largely exceeds demand in Slavonia, and since 2014 the divergence with the rest of Croatia has widened substantially. Between 2004 and 2014, there were about 4 vacancies for about every 10 jobseekers registered with the Croatian Employment Services (CES), and 3 vacancies for about 10 jobseekers in Slavonia (Figure 141, panel a). Coinciding with the economic recovery in the EU since 2014, as well as Croatia’s accession to the EU in July 2013, the ratio of vacancies to jobseekers in Croatia as a whole has increased, with the number of registered vacancies now even exceeding the number of registered jobseekers.300
Slavonia did not benefit to the same extent from the broader economic recovery in Croatia and the EU, at least not in terms of job creation. In Slavonia, in 2016 three in five jobseekers believed they had not found jobs because of scarce opportunities, as compared to 40 percent in the rest of Croatia (LiTS 2016; Figure 141, panel b). Add to this the high and rising share of working-age Slavonians that are inactive (36.9 percent in 2010, increasing to 38.7 percent in 2017; Figure 124), many of whom have probably simply dropped out of the labor market due to lack of opportunities, and it becomes clear that the labor supply in Slavonia still exceeds demand. There are now about 7 vacancies for every 10 registered jobseekers.
300 There are reasons to believe that the CES register data may slightly underestimate unemployment. LFS based unemployment rates are slightly higher. In 2017, about 27% of people meeting the ILO criteria of unemployment were not registered with CES, while at the same time, about 22% of those reporting to be registered by CES did not meet all three ILO unemployment criteria (LFS, 2017). Similarly, using Public Employment Service vacancy data might underestimate labor demand, as some employers advertise their vacancies via private agencies or informally, though the vacancy numbers from private providers are consistent with those shown here (OVI – online vacancy index, compiled by Institute of Economics in Zagreb with MojPosao portal data).
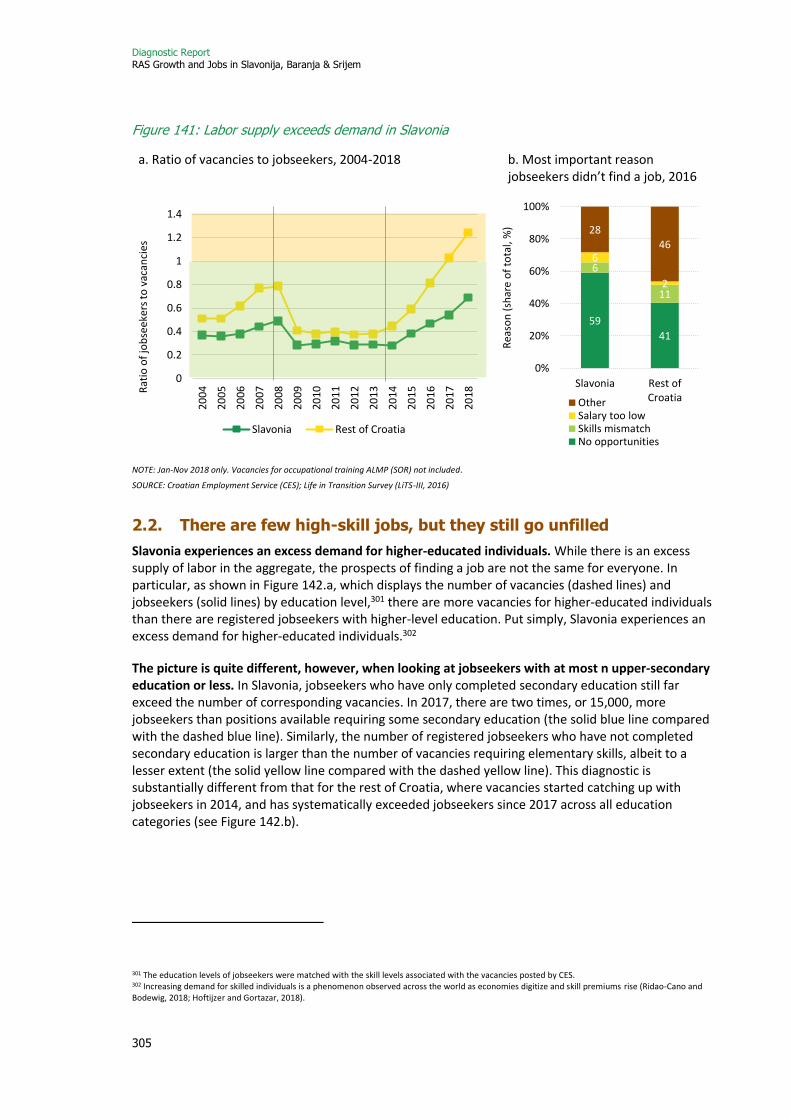
Diagnostic Report RAS Growth and Jobs in Slavonija, Baranja & Srijem
305
Figure 141: Labor supply exceeds demand in Slavonia
a. Ratio of vacancies to jobseekers, 2004-2018 b. Most important reason jobseekers didn’t find a job, 2016
NOTE: Jan-Nov 2018 only. Vacancies for occupational training ALMP (SOR) not included.
SOURCE: Croatian Employment Service (CES); Life in Transition Survey (LiTS-III, 2016)
2.2. There are few high-skill jobs, but they still go unfilled
Slavonia experiences an excess demand for higher-educated individuals. While there is an excess supply of labor in the aggregate, the prospects of finding a job are not the same for everyone. In particular, as shown in Figure 142.a, which displays the number of vacancies (dashed lines) and jobseekers (solid lines) by education level,301 there are more vacancies for higher-educated individuals than there are registered jobseekers with higher-level education. Put simply, Slavonia experiences an excess demand for higher-educated individuals.302
The picture is quite different, however, when looking at jobseekers with at most n upper-secondary education or less. In Slavonia, jobseekers who have only completed secondary education still far exceed the number of corresponding vacancies. In 2017, there are two times, or 15,000, more jobseekers than positions available requiring some secondary education (the solid blue line compared with the dashed blue line). Similarly, the number of registered jobseekers who have not completed secondary education is larger than the number of vacancies requiring elementary skills, albeit to a lesser extent (the solid yellow line compared with the dashed yellow line). This diagnostic is substantially different from that for the rest of Croatia, where vacancies started catching up with jobseekers in 2014, and has systematically exceeded jobseekers since 2017 across all education categories (see Figure 142.b).
301 The education levels of jobseekers were matched with the skill levels associated with the vacancies posted by CES. 302 Increasing demand for skilled individuals is a phenomenon observed across the world as economies digitize and skill premiums rise (Ridao-Cano and Bodewig, 2018; Hoftijzer and Gortazar, 2018).
0
0.2
0.4
0.6
0.8
1
1.2
1.420
04
2005
2006
2007
2008
2009
2010
2011
2012
2013
2014
2015
2016
2017
2018R
atio
of
job
seek
ers
to v
acan
cies
Slavonia Rest of Croatia
59
41
6
11
6
2
28
46
0%
20%
40%
60%
80%
100%
Slavonia Rest ofCroatia
Rea
son
(sh
are
of
tota
l, %
)
OtherSalary too lowSkills mismatchNo opportunities
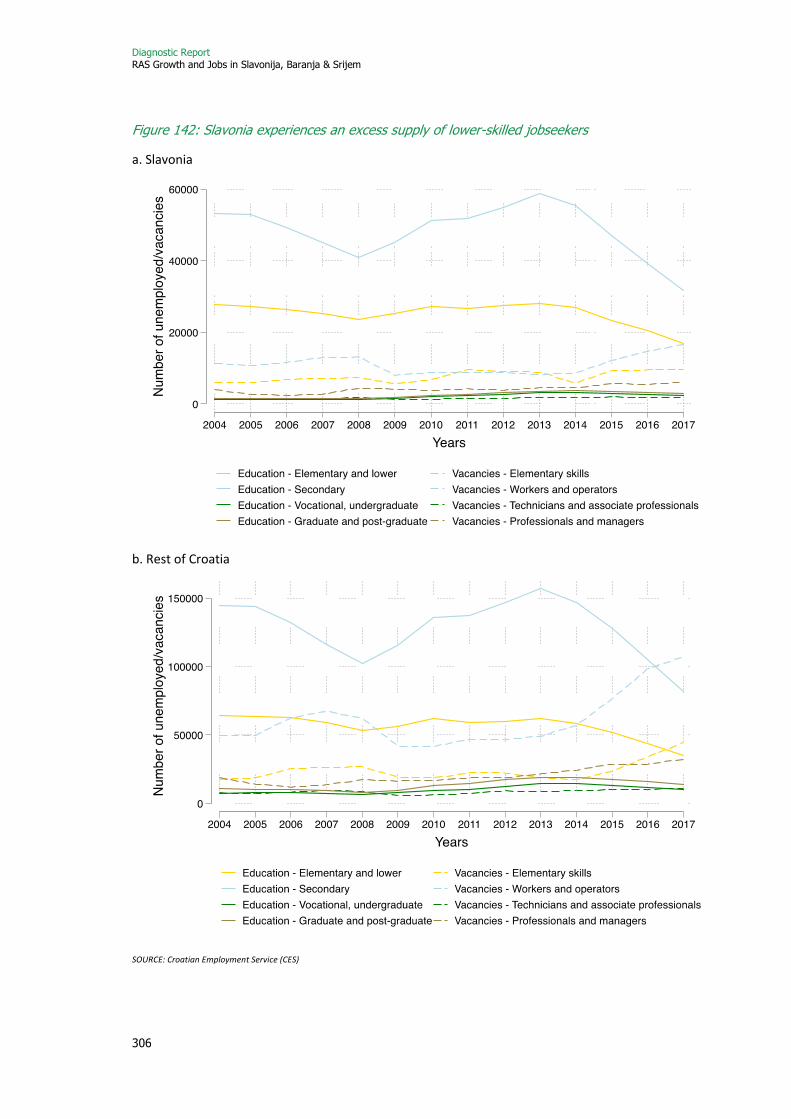
Diagnostic Report RAS Growth and Jobs in Slavonija, Baranja & Srijem
306
Figure 142: Slavonia experiences an excess supply of lower-skilled jobseekers
a. Slavonia
b. Rest of Croatia
SOURCE: Croatian Employment Service (CES)

Diagnostic Report RAS Growth and Jobs in Slavonija, Baranja & Srijem
307
High wage gaps with the rest of Croatia (and the EU) can explain much of the excess demand for the highly educated. Individuals with tertiary education face (nominal) wage gaps with the rest of Croatia as high as 25 to 30 percent of their gross salary in ICT, transportation and storage, wholesale and retail and manufacturing (Figure 143). This wage gap can be twice as large as it is for upper-secondary educated workers, highlighting a bigger wage premium for highly skilled individuals, and thus great incentives to leave the region.303 Indeed, if you live in Slavonia, the return on having higher education is lower than in the rest of Croatia, prompting highly educated workers to move out of the region.304 This comes in addition to the more general disenchantment with the economic environment and the perceived inability to achieve self-realization without political connections (LiTS, 2016).
Figure 143: The large wage gap between Slavonia and the rest of Croatia
SOURCE: Calculated from the CBS statistical report ‘Employment and Wages’, Tables 2.5 and 3.4, 2016
Increasing Slavonian firms’ competitiveness and reforming the education system to increase the number of higher-education graduates will be important. Wage gaps between Slavonia and the rest of Croatia have been substantial and persistent over the last decade (Figure 23, CBS statistical reports ‘Employment and Wages’). However, only more recently have they also resulted in a shortage of higher-educated individuals in Slavonia, as the economy and the demand for higher-skilled workers picked up faster in the rest of Croatia (as well as the EU). This has increased the competitive pressures on Slavonian firms, including increasing their wages to attract / retain their workers, especially the higher-educated. These pressures find themselves, for example, reflected in the increasing wage gap for workers with tertiary education (by 2.3 percentage points on average between 2013 and 2016). In the long-run, Slavonia will also need to reform its education system and increase its number of higher-education graduates as part of a broader need to increase its human capital stock. This is an important long-term policy agenda to which we return in section 3.
However, addressing the excess demand for higher-educated individuals still leaves many of Slavonia’s labor market challenges unresolved. The excess demand only concerns a small part of the Slavonian labor force. In 2017, there were only 5,243 registered highly educated jobseekers (vocational undergraduates and higher education) and 2,564 excess vacancies for high-skilled jobseekers (CES, 2017). These numbers are small compared to the total number of registered
303 Wages gaps are nominal and do not account for regional differences in the cost of living. Indications are, however, that the gaps remain significant even after correcting for these differences. 304 Men with lower educational attainment are also more likely to move out of Slavonia. Their returns to education are much lower than in the rest of Croatia, while women are more likely to stay, as the differential in returns to education is lower than in the rest of the country. These results were obtained using Mincer equations separately for Slavonia and the rest of Croatia (LFS, 2017).
-35 -30 -25 -20 -15 -10 -5 0
Public administration
Private sector
Manufacturing
Wholesale/retail
Transportation and storage
ICT
Total (public and private)
Wage gap between Slavonia and rest of Croatia (%)
Upper Secondary Tertiary
Diagnostic Report RAS Growth and Jobs in Slavonija, Baranja & Srijem
308
unemployed (53,872) and inactive, most of whom have only some secondary or even only elementary education. Given the high education levels required, they cannot be retrained to take up these positions. They would only benefit from the positions for the highly educated being filled in that this would generate new jobs for the un- / semi-skilled i.e. to the extent that these jobs are complementary, or to the extent that there are positive spillovers onto the local economy through greater demand for locally produced goods and services that can be produced by the local un- / semi-skilled labor force. Clearly, other measures that more directly improve the employment status of the lesser educated will also be needed.
2.3. Many lower-skilled vacancies, but even more low-skilled workers with the wrong qualifications
Importantly, Slavonian firms also report important labor shortages in a number of occupations at lower-education levels. Findings from an employers’ survey and CES data reveal that employers have a hard time finding applicants with the right type of specialization, especially among low- and middle-skilled workers: welders (517 unfilled positions in 2017), locksmiths (357), waiters (933), chefs and cooks (230), agricultural workers and pickers (790), carpenters (237), freight drivers (232). For most positions, employers mention two reasons for being unsuccessful: applicants lack the adequate specialization and / or the adequate experience. Only in the case of agricultural workers is the main reason for skills mismatch different (low wages). 305
The main reason for skills mismatch seems again to be the availability of better opportunities elsewhere. In the case of manufacturing, accommodation and food, and wholesale and retail, three sectors where the labor supply is three times larger than demand, many similar vacancies are available in the rest of the country (or abroad). The wage gaps between Slavonia and the rest of the country in these occupations are also substantial (even though less than for the highly educated) (15 to 25 percent for low and middle skills, but sometimes as high as 40 percent) (Figure 144). Slavonians with these demanded backgrounds are better off accepting positions outside of Slavonia, which is evident from the large employment outmigration from Slavonia to other regions of Croatia (Figure 13). In the case of agriculture, forestry and fishing, this concerns seasonal wage work, and wages offered by employers are very low (on average less than a third of the average wage for low-educated workers (LFS, 2017)), which deters Slavonians from working in these fields.306 Finally, in the construction sector, the number of jobs offered is on a par with the number of jobseekers, and the wage gap between Slavonia and the rest of Croatia is relatively small (only about 8 percent). However, labor markets for construction workers have cleared and the workforce lacks the skills needed by employers.
305 Two sources of information are used to look at excess vacancies. First, the database of registered vacancies and registered jobseekers (previous paragraph). The net difference between the two registers gives an estimate of the number of unfilled vacancies. Second, the employers’ survey asks sampled firms to list all the positions for which they had problems hiring workers. These two statistics will not match. 306 Wages for full-time agricultural employees are not lower than those in other professions in Slavonia.

Diagnostic Report RAS Growth and Jobs in Slavonija, Baranja & Srijem
309
Figure 144: The labor shortage is mostly due to better-paid opportunities elsewhere
SOURCE: Croatian Employment Services (CES), * comes from Employers’ Survey (2017)
The large number of vacancies in lower-skilled occupations suggest important opportunities for employment expansion in the short-run through reskilling but will also need greater firm competitiveness and accompanying measures. Contrary to the longer-term educational investment needed to bring people up to the undergraduate or graduate level, many of the skills in demand can be obtained through retraining of the current workforce. Given Slavonia’s longstanding experience in manufacturing, it also has a workforce experienced in the manufacturing sector (as illustrated by the large number of jobseekers in that sector). The large number of vacancies in the manufacturing sector thus requires special attention. Greater firm competitiveness is further needed to enable the necessary wage increase to attract and retain workers of certain qualifications, especially in certain sectors. Finally, accompanying measures, in particular better access to family care provision, can further help increase female labor participation, especially in terms of lesser-educated rural women.
2.4. There are no major work disincentives from social security except for war-related disability pensions
Individuals may also face work disincentives when the income they receive from other sources than their own work is high. Married individuals may be disincentivized from working if their partner earns enough money. Women may be disincentivized from working if daycare or kindergarten costs are close to the wage they would earn while working. Poor households may be disincentivized from working if their expected wage is close to what they would otherwise receive from social protection transfers.
Disincentives for highly educated workers are low, as in the rest of Croatia. Only 25 percent of working men and 29 percent of working women who have completed higher education have disincentives to work due to high non-labor income,307 as compared to 23 and 17 percent for men and women in the rest of Croatia, respectively.
It is likely that poorer households’ labor force participation rates are not much affected by the level of the guaranteed minimum benefit (GMB) either. While the marginal effective tax rate for some family configurations is high, it does not seem to factor much in transitions to employment in Slavonia
307 If household income (excluding that from the individual’s work-related activities) is more than 1.6 times higher than the median value in the reference population.
2,508
1,308
1,001
1,406
2,451
7,094
6,608
4,983
3,234
2,926
Manufacturing
Accomodation and food
Wholesale and retail trade
Agriculture, forestry and fishing
Construction
5 s
ecto
rs w
ith
hig
hes
t n
um
ber
o
f u
nfi
lled
vac
anci
es
Unfilled positions* Secondary or less Vocational Tertiary
Low wages for agriculture
Better opportunities elsewhere (15 to 25% wage gap with rest of country)
Skills mismatch (no major wage difference)
Diagnostic Report RAS Growth and Jobs in Slavonija, Baranja & Srijem
310
(Matković and Caha, 2017). Repeated increases in minimum wages since 2016 have reduced this inactivity trap, as benefits have not been indexed (Matković 2018b). However, despite low benefit levels, lower wages in Slavonia might make paid employment less attractive to beneficiaries, particularly when a possibility exists to grow food, work in the informal sector, or participate in paid-for public works without losing the right to guaranteed minimum benefits (GMB).
On the other hand, recipients of war-related disability pensions may face disincentives to work. The veteran pension is on average HRK 5,753 per month, which is above the average regional wage. In addition, among cohorts aged 45-64, 13.2 percent of men are already receiving war-related disability pensions in Slavonia, as compared to 8.1 percent in the rest of the country, suggesting that disincentives to work because of war-related disability benefits might be quantitatively more important for Slavonia’s labor market than in the rest of Croatia.
Diagnostic Report RAS Growth and Jobs in Slavonija, Baranja & Srijem
311
3. Policy entry points for an inclusive labor market
Key insights
Based on the defining features of Slavonia’s labor market identified in the two previous sections, a number of key challenges emerge:
- First, skills mismatches are substantial. Is the education system providing the right skills?
- Second, unemployment rates remain high despite the availability of jobs. Is the Croatian Employment Service (CES) equipped to identify employers’ needs, and address supply and demand mismatches through active labor market programs (ALMPs)?
- Third, certain working-age groups are further away from the labor market, and need additional support in finding and securing a job: youth and the elderly, women with care responsibilities, low-skilled individuals (low level of education and limited work experience), and those living in remote areas. Are labor and social protection measures providing opportunities to include the most vulnerable?
This section takes up these three policy questions in turn. The policy challenge of job creation, especially for the unskilled and semi-skilled, is addressed in other chapters of this report. They address issues related to Slavonia’s foreign direct investment and the business environment, and its productivity, innovation and financial sector, respectively.
3.1. The education system in Slavonia: worse outcomes at all stages
One major challenge facing Croatia is providing its workers with stronger foundation and technical skills. In 2016, less than 30 percent of Croatians aged between 30 and 34 had completed tertiary education, which is below the EU average of 39 percent. Furthermore, almost one-third of the country’s 15-year-olds fail to demonstrate basic-level308 mathematics skills in the Program for International Student Assessment (PISA), which is above the EU average. Weak skills foundations among young Croatians have negative long-term consequences for both individuals and for the economy overall. They limit the ability to learn throughout the education system, and later to find and retain a productive job.
3.1.1. Delays in skills acquisition start early
Slavonia records the lowest participation rates in early childhood education and care (ECEC), and the early years of primary education do not offer equal learning opportunities. In 2016, only 33 percent of children aged 3 to 6 were enrolled in a regular kindergarten program. These enrollment rates are not only very low, they are also well below the rest of the country. 75 percent of children aged 3 to 6 attend kindergarten in the Zagreb region, 68 percent on the coast, and 43 percent in the center and northwest (Figure 145). In addition, there has been little improvement, as there has only been a 10 percent increase since 2006. This has dire consequences for children’s school readiness (Heckman,
308 Pisa ‘grade band’ (2 – basic skill level) is considered ‘basic’ and set as an EU education and training 2020 indicator.
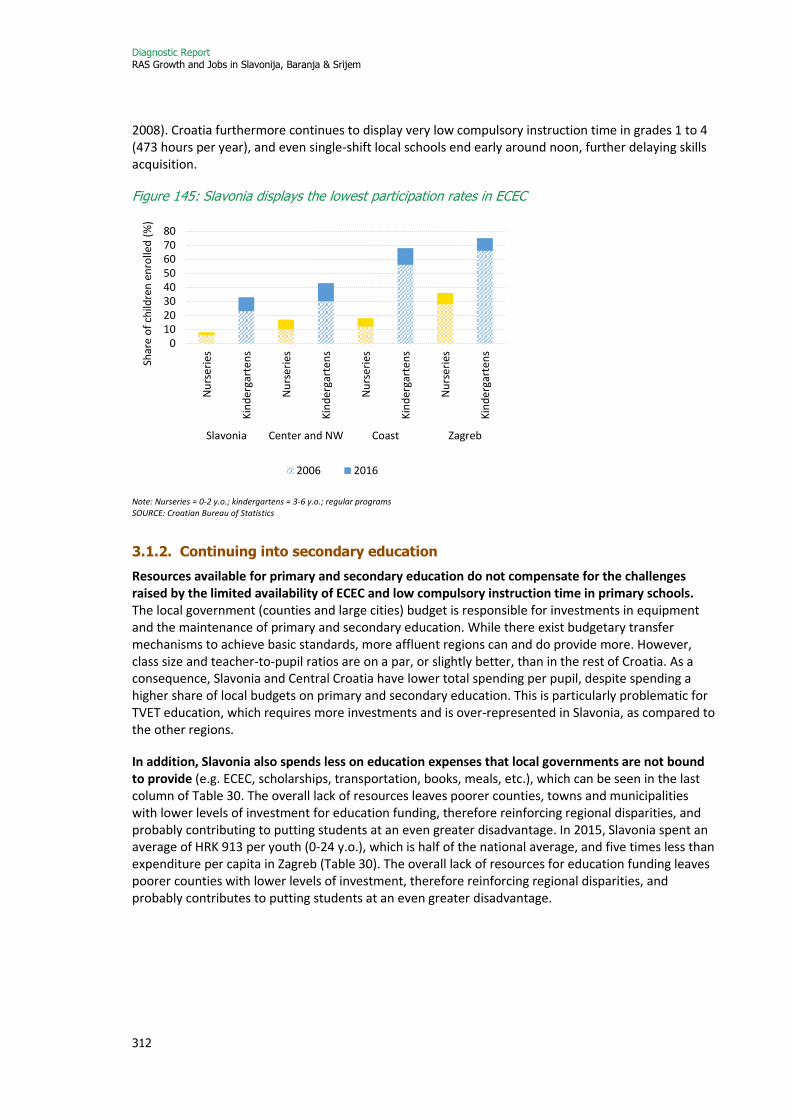
Diagnostic Report RAS Growth and Jobs in Slavonija, Baranja & Srijem
312
2008). Croatia furthermore continues to display very low compulsory instruction time in grades 1 to 4 (473 hours per year), and even single-shift local schools end early around noon, further delaying skills acquisition.
Figure 145: Slavonia displays the lowest participation rates in ECEC
Note: Nurseries = 0-2 y.o.; kindergartens = 3-6 y.o.; regular programs SOURCE: Croatian Bureau of Statistics
3.1.2. Continuing into secondary education
Resources available for primary and secondary education do not compensate for the challenges raised by the limited availability of ECEC and low compulsory instruction time in primary schools. The local government (counties and large cities) budget is responsible for investments in equipment and the maintenance of primary and secondary education. While there exist budgetary transfer mechanisms to achieve basic standards, more affluent regions can and do provide more. However, class size and teacher-to-pupil ratios are on a par, or slightly better, than in the rest of Croatia. As a consequence, Slavonia and Central Croatia have lower total spending per pupil, despite spending a higher share of local budgets on primary and secondary education. This is particularly problematic for TVET education, which requires more investments and is over-represented in Slavonia, as compared to the other regions.
In addition, Slavonia also spends less on education expenses that local governments are not bound to provide (e.g. ECEC, scholarships, transportation, books, meals, etc.), which can be seen in the last column of Table 30. The overall lack of resources leaves poorer counties, towns and municipalities with lower levels of investment for education funding, therefore reinforcing regional disparities, and probably contributing to putting students at an even greater disadvantage. In 2015, Slavonia spent an average of HRK 913 per youth (0-24 y.o.), which is half of the national average, and five times less than expenditure per capita in Zagreb (Table 30). The overall lack of resources for education funding leaves poorer counties with lower levels of investment, therefore reinforcing regional disparities, and probably contributes to putting students at an even greater disadvantage.
01020304050607080
Nu
rse
ries
Kin
der
gart
ens
Nu
rse
ries
Kin
der
gart
ens
Nu
rse
ries
Kin
der
gart
ens
Nu
rse
ries
Kin
der
gart
ens
Slavonia Center and NW Coast Zagreb
Shar
e o
f ch
ildre
n e
nro
lled
(%
)
2006 2016
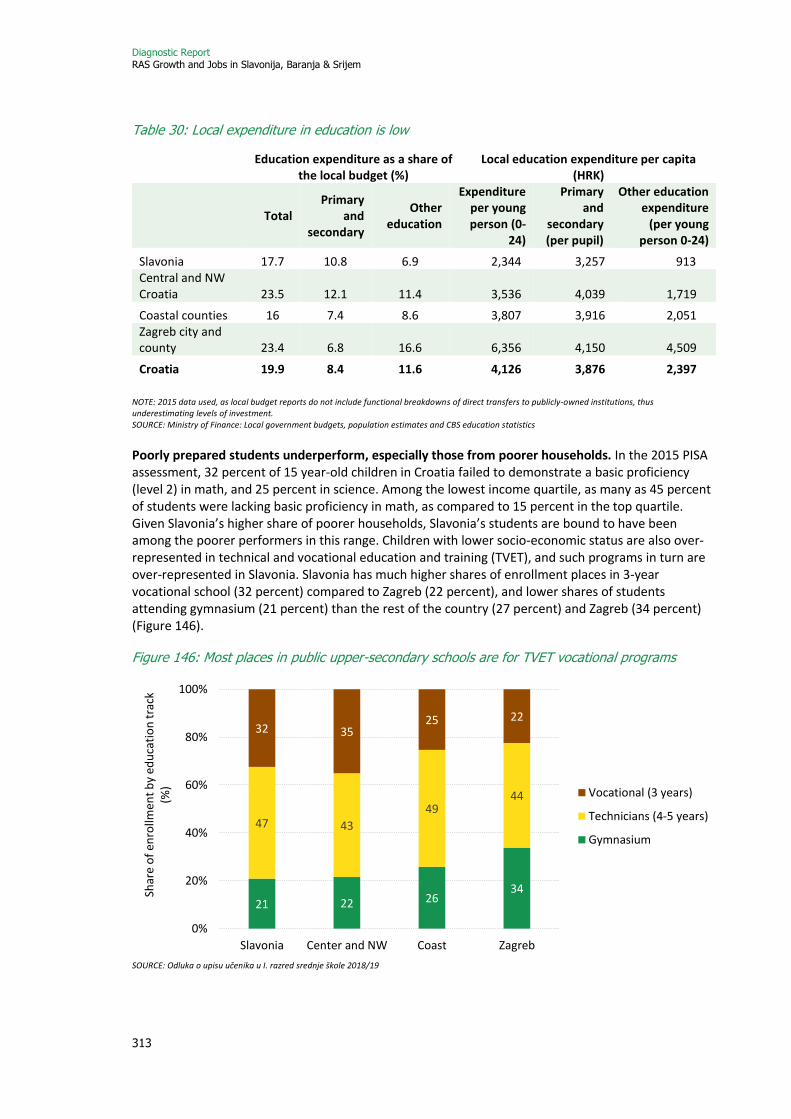
Diagnostic Report RAS Growth and Jobs in Slavonija, Baranja & Srijem
313
Table 30: Local expenditure in education is low
Education expenditure as a share of
the local budget (%) Local education expenditure per capita
(HRK)
Total Primary
and secondary
Other education
Expenditure per young person (0-
24)
Primary and
secondary (per pupil)
Other education expenditure
(per young person 0-24)
Slavonia 17.7 10.8 6.9 2,344 3,257 913 Central and NW Croatia 23.5 12.1 11.4 3,536 4,039 1,719
Coastal counties 16 7.4 8.6 3,807 3,916 2,051 Zagreb city and county 23.4 6.8 16.6 6,356 4,150 4,509
Croatia 19.9 8.4 11.6 4,126 3,876 2,397
NOTE: 2015 data used, as local budget reports do not include functional breakdowns of direct transfers to publicly-owned institutions, thus underestimating levels of investment. SOURCE: Ministry of Finance: Local government budgets, population estimates and CBS education statistics
Poorly prepared students underperform, especially those from poorer households. In the 2015 PISA assessment, 32 percent of 15 year-old children in Croatia failed to demonstrate a basic proficiency (level 2) in math, and 25 percent in science. Among the lowest income quartile, as many as 45 percent of students were lacking basic proficiency in math, as compared to 15 percent in the top quartile. Given Slavonia’s higher share of poorer households, Slavonia’s students are bound to have been among the poorer performers in this range. Children with lower socio-economic status are also over-represented in technical and vocational education and training (TVET), and such programs in turn are over-represented in Slavonia. Slavonia has much higher shares of enrollment places in 3-year vocational school (32 percent) compared to Zagreb (22 percent), and lower shares of students attending gymnasium (21 percent) than the rest of the country (27 percent) and Zagreb (34 percent) (Figure 146).
Figure 146: Most places in public upper-secondary schools are for TVET vocational programs
SOURCE: Odluka o upisu učenika u I. razred srednje škole 2018/19
21 22 2634
47 43
4944
32 3525 22
0%
20%
40%
60%
80%
100%
Slavonia Center and NW Coast Zagreb
Shar
e o
f en
rollm
ent
by
edu
cati
on
tra
ck
(%) Vocational (3 years)
Technicians (4-5 years)
Gymnasium
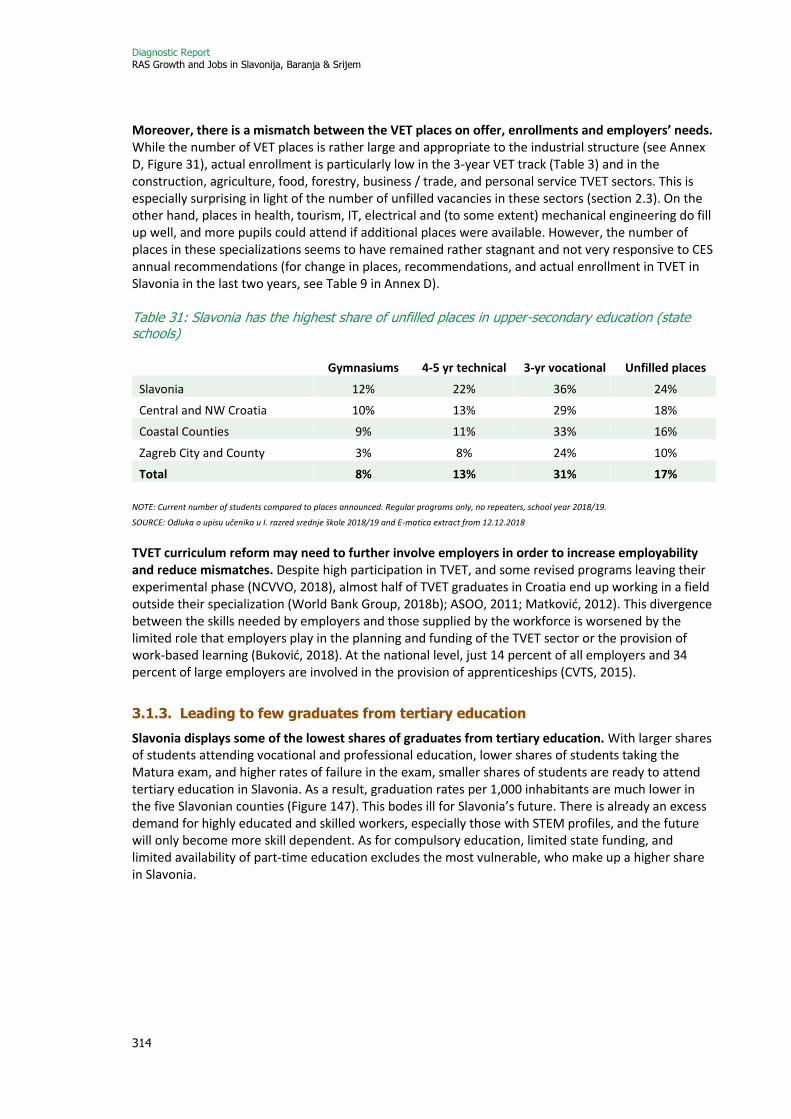
Diagnostic Report RAS Growth and Jobs in Slavonija, Baranja & Srijem
314
Moreover, there is a mismatch between the VET places on offer, enrollments and employers’ needs. While the number of VET places is rather large and appropriate to the industrial structure (see Annex D, Figure 31), actual enrollment is particularly low in the 3-year VET track (Table 3) and in the construction, agriculture, food, forestry, business / trade, and personal service TVET sectors. This is especially surprising in light of the number of unfilled vacancies in these sectors (section 2.3). On the other hand, places in health, tourism, IT, electrical and (to some extent) mechanical engineering do fill up well, and more pupils could attend if additional places were available. However, the number of places in these specializations seems to have remained rather stagnant and not very responsive to CES annual recommendations (for change in places, recommendations, and actual enrollment in TVET in Slavonia in the last two years, see Table 9 in Annex D). Table 31: Slavonia has the highest share of unfilled places in upper-secondary education (state schools)
Gymnasiums 4-5 yr technical 3-yr vocational Unfilled places
Slavonia 12% 22% 36% 24%
Central and NW Croatia 10% 13% 29% 18%
Coastal Counties 9% 11% 33% 16%
Zagreb City and County 3% 8% 24% 10%
Total 8% 13% 31% 17%
NOTE: Current number of students compared to places announced. Regular programs only, no repeaters, school year 2018/19.
SOURCE: Odluka o upisu učenika u I. razred srednje škole 2018/19 and E-matica extract from 12.12.2018
TVET curriculum reform may need to further involve employers in order to increase employability and reduce mismatches. Despite high participation in TVET, and some revised programs leaving their experimental phase (NCVVO, 2018), almost half of TVET graduates in Croatia end up working in a field outside their specialization (World Bank Group, 2018b); ASOO, 2011; Matković, 2012). This divergence between the skills needed by employers and those supplied by the workforce is worsened by the limited role that employers play in the planning and funding of the TVET sector or the provision of work-based learning (Buković, 2018). At the national level, just 14 percent of all employers and 34 percent of large employers are involved in the provision of apprenticeships (CVTS, 2015).
3.1.3. Leading to few graduates from tertiary education
Slavonia displays some of the lowest shares of graduates from tertiary education. With larger shares of students attending vocational and professional education, lower shares of students taking the Matura exam, and higher rates of failure in the exam, smaller shares of students are ready to attend tertiary education in Slavonia. As a result, graduation rates per 1,000 inhabitants are much lower in the five Slavonian counties (Figure 147). This bodes ill for Slavonia’s future. There is already an excess demand for highly educated and skilled workers, especially those with STEM profiles, and the future will only become more skill dependent. As for compulsory education, limited state funding, and limited availability of part-time education excludes the most vulnerable, who make up a higher share in Slavonia.
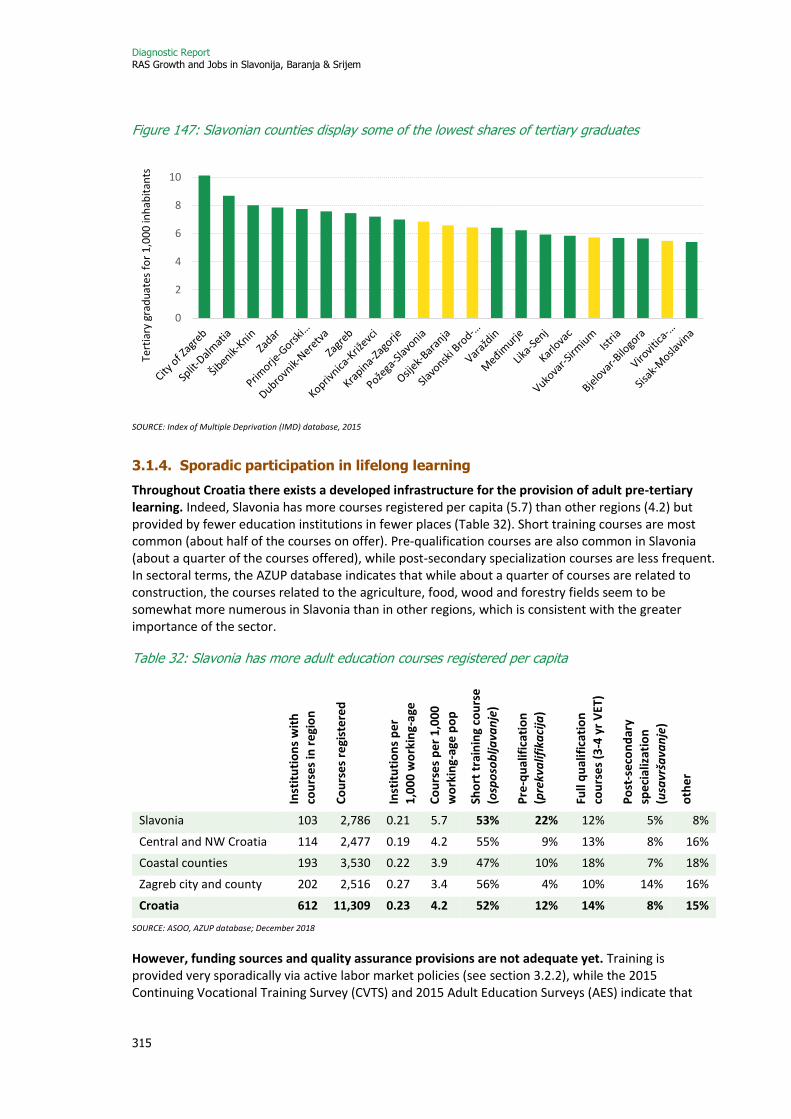
Diagnostic Report RAS Growth and Jobs in Slavonija, Baranja & Srijem
315
Figure 147: Slavonian counties display some of the lowest shares of tertiary graduates
SOURCE: Index of Multiple Deprivation (IMD) database, 2015
3.1.4. Sporadic participation in lifelong learning
Throughout Croatia there exists a developed infrastructure for the provision of adult pre-tertiary learning. Indeed, Slavonia has more courses registered per capita (5.7) than other regions (4.2) but provided by fewer education institutions in fewer places (Table 32). Short training courses are most common (about half of the courses on offer). Pre-qualification courses are also common in Slavonia (about a quarter of the courses offered), while post-secondary specialization courses are less frequent. In sectoral terms, the AZUP database indicates that while about a quarter of courses are related to construction, the courses related to the agriculture, food, wood and forestry fields seem to be somewhat more numerous in Slavonia than in other regions, which is consistent with the greater importance of the sector.
Table 32: Slavonia has more adult education courses registered per capita
Inst
itu
tio
ns
wit
h
cou
rse
s in
re
gio
n
Co
urs
es
regi
ste
red
Inst
itu
tio
ns
pe
r
1,0
00
wo
rkin
g-a
ge
po
p
Co
urs
es
pe
r 1
,00
0
wo
rkin
g-ag
e p
op
Sho
rt t
rain
ing
cou
rse
(osp
oso
blja
van
je)
Pre
-qu
alif
icat
ion
(pre
kva
lifik
aci
ja)
Full
qu
alif
icat
ion
cou
rse
s (3
-4 y
r V
ET)
Po
st-s
eco
nd
ary
spe
cial
izat
ion
(usa
vrša
van
je)
oth
er
Slavonia 103 2,786 0.21 5.7 53% 22% 12% 5% 8%
Central and NW Croatia 114 2,477 0.19 4.2 55% 9% 13% 8% 16%
Coastal counties 193 3,530 0.22 3.9 47% 10% 18% 7% 18%
Zagreb city and county 202 2,516 0.27 3.4 56% 4% 10% 14% 16%
Croatia 612 11,309 0.23 4.2 52% 12% 14% 8% 15%
SOURCE: ASOO, AZUP database; December 2018
However, funding sources and quality assurance provisions are not adequate yet. Training is provided very sporadically via active labor market policies (see section 3.2.2), while the 2015 Continuing Vocational Training Survey (CVTS) and 2015 Adult Education Surveys (AES) indicate that
0
2
4
6
8
10
Tert
iary
gra
du
ates
fo
r 1
,00
0 in
hab
itan
ts

Diagnostic Report RAS Growth and Jobs in Slavonija, Baranja & Srijem
316
employers (in particular small employers) or trade unions are not very involved in training the workforce compared to the EU average (World Bank Group, 2018c). According to the 2015 CES employer survey (HZZ, 2015, p.67), employers in Slavonian counties have reported training a smaller share of their employees during the previous year (14.0 to 16.7 percent) than the national average (20.5 percent). Among the overall population, there seems to be no notable difference between Slavonia and the rest of Croatia, with only about 3 percent of those aged 25-64 participating in some form of workforce education or training course in any given month (LFS, 2017).
3.2. Croatian employment services (CES / HZZ): correcting supply and demand mismatches
If working-age individuals do not present the right set of skills after they have gone through the education system, then correcting remaining mismatches on the labor market is the role of CES. The institution, much as in other countries, carries out three main responsibilities: (i) forecasting and advising on the skills that are needed on the labor market through its yearly employers’ survey; (ii) matching registered jobseekers and available vacancies; and (iii) correcting skills mismatches via active labor market programs (ALMPs).
3.2.1. Addressing skills mismatches through better forecasting
The Croatian Employment Services (CES) has recently put a lot of effort into addressing the mismatch between employers’ needs and jobseekers’ skills and expectations. First, to identify the needs of the demand-side, CES collects information on labor demand, shortages and oversupply from the employers’ survey, and has published its results at the national level yearly since 2008. Second, to guide students’ education choices, CES publishes regional brochures on secondary education options,309 strengthening collaboration between CES and the education system. In addition, the ‘From Measures to a Career’ publication attempts to bring labor market integration measures closer to their intended beneficiaries by advertising success stories among the public, while the ‘Get Employed in Croatia’ campaign aims to inform the unemployed, employers and other interested parties on currently available ALMPs co-financed by the European Social Fund.
Despite such positive practices, collaboration between CES, the education system, and the private sector remains limited. Employers continue to complain about the lack of a workforce with adequate training and experience. Recent school-leavers still experience above-average unemployment rates, and some sectors offer more vacancies than there are jobseekers in Slavonia, as evidenced above (Figure 142).
3.2.2. Correcting current skills mismatches through ALMPs
The number and variety of ALMPs implemented by CES has increased substantially since 2010, and has not declined much since the unemployment peak of 2013. Over the past eight years, 23 to 32 percent of ALMP allocations have been directed to Slavonia. However, due to the large number of unemployed people, this has translated into below-average ALMP participation rates in Slavonia since 2014 (Figure 148).
309 Brošure za upis učenika u srednju školu, 2018/19

Diagnostic Report RAS Growth and Jobs in Slavonija, Baranja & Srijem
317
Figure 148: The ALMP participation rate in Slavonia is lagging behind the national average
SOURCE: Croatian Employment Service (CES)
ALMPs in Slavonia are as effective as in other regions of Croatia according to the comprehensive 2015 ALMP evaluation (Bejaković et al., 2016). In Slavonia, PWP participants were more likely to demonstrate initiative to enter a program and were more satisfied with the compensation compared to participants from other regions, which is consistent with the findings on employment and wage levels presented in this chapter. As for education programs, participants in Slavonia were less satisfied with available courses than participants in other regions but more satisfied with the process of counselling for training (Bagić, Burić, & Bejaković, 2016). As for ALMP effectiveness, a 2015 impact evaluation identified a positive effect on continued labor market participation (not becoming inactive) a year after graduating from PWPs (8 and 9 percent for Slavonia and the rest of Croatia, respectively), as well as some effect of training on subsequent employment (5 and 7 percent for Slavonia and the rest of Croatia, respectively) (Kotnarowski, Bagić, & Burić, 2016).310
ALMP participation rates are higher in regions where unemployment rates are lower, suggesting poor targeting of Croatia’s ALMPs. Counties with lower unemployment rates, and hence low shares of the active population needing support to find a job, are likely to display higher participation in ALMPs (Figure 149). This may be due to both supply and demand-side factors. On the supply side, the capacity of local public employment services (PES), employers, training providers and local government shapes the delivery and uptake of labor market interventions. Understaffed PES (with higher-than-average loads per caseworker), local government with few resources, struggling employers and a lack of training providers to partner with mean that large numbers of the unemployed are less likely to be enrolled in ALMPs. On the demand side, high unemployment rates are correlated with lower-than-average skills levels, and jobseekers with lower skills sets may not be enrolled in ALMPs, as they are more likely to face barriers to participating (poor learning skills, lack of available transportation, care responsibilities, chronic illnesses, etc.), and / or be considered as potentially less successful candidates by employers or PES caseworkers making the selection.
310 International evidence gathered mostly on Europe and the US by Card et al. (2015) shows negative returns in the short-run for training programs and positive returns in the longer-run (at most 10 percent). Public works programs are shown to have very limited impact in the short-run, a negative impact in the longer-run, and large displacement effects during programs.
0%
5%
10%
15%
20%
25%
2011 2012 2013 2014 2015 2016 2017
Shar
e o
f re
gist
ered
job
seek
ers
enro
lled
in
ALM
Ps
(%)
Slavonia Rest of Croatia
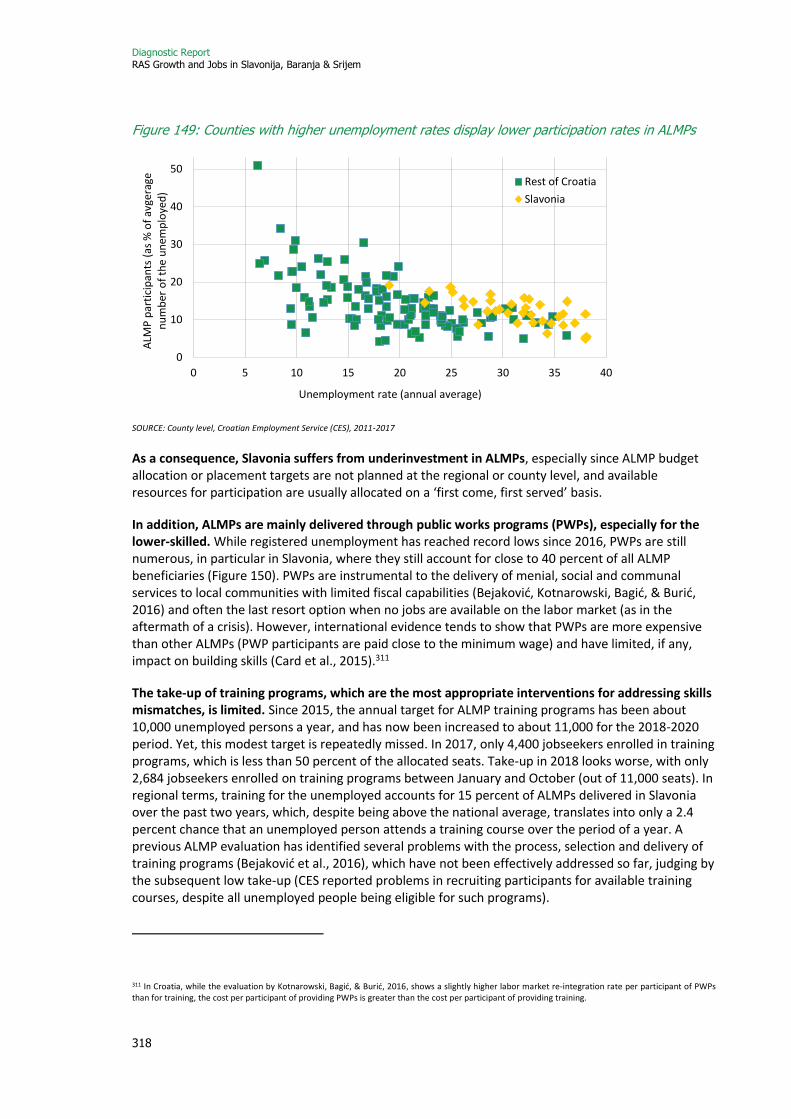
Diagnostic Report RAS Growth and Jobs in Slavonija, Baranja & Srijem
318
Figure 149: Counties with higher unemployment rates display lower participation rates in ALMPs
SOURCE: County level, Croatian Employment Service (CES), 2011-2017
As a consequence, Slavonia suffers from underinvestment in ALMPs, especially since ALMP budget allocation or placement targets are not planned at the regional or county level, and available resources for participation are usually allocated on a ‘first come, first served’ basis.
In addition, ALMPs are mainly delivered through public works programs (PWPs), especially for the lower-skilled. While registered unemployment has reached record lows since 2016, PWPs are still numerous, in particular in Slavonia, where they still account for close to 40 percent of all ALMP beneficiaries (Figure 150). PWPs are instrumental to the delivery of menial, social and communal services to local communities with limited fiscal capabilities (Bejaković, Kotnarowski, Bagić, & Burić, 2016) and often the last resort option when no jobs are available on the labor market (as in the aftermath of a crisis). However, international evidence tends to show that PWPs are more expensive than other ALMPs (PWP participants are paid close to the minimum wage) and have limited, if any, impact on building skills (Card et al., 2015).311
The take-up of training programs, which are the most appropriate interventions for addressing skills mismatches, is limited. Since 2015, the annual target for ALMP training programs has been about 10,000 unemployed persons a year, and has now been increased to about 11,000 for the 2018-2020 period. Yet, this modest target is repeatedly missed. In 2017, only 4,400 jobseekers enrolled in training programs, which is less than 50 percent of the allocated seats. Take-up in 2018 looks worse, with only 2,684 jobseekers enrolled on training programs between January and October (out of 11,000 seats). In regional terms, training for the unemployed accounts for 15 percent of ALMPs delivered in Slavonia over the past two years, which, despite being above the national average, translates into only a 2.4 percent chance that an unemployed person attends a training course over the period of a year. A previous ALMP evaluation has identified several problems with the process, selection and delivery of training programs (Bejaković et al., 2016), which have not been effectively addressed so far, judging by the subsequent low take-up (CES reported problems in recruiting participants for available training courses, despite all unemployed people being eligible for such programs).
311 In Croatia, while the evaluation by Kotnarowski, Bagić, & Burić, 2016, shows a slightly higher labor market re-integration rate per participant of PWPs than for training, the cost per participant of providing PWPs is greater than the cost per participant of providing training.
0
10
20
30
40
50
0 5 10 15 20 25 30 35 40
ALM
P p
arti
cip
ants
(as
% o
f av
gera
ge
nu
mb
er o
f th
e u
nem
plo
yed
)
Unemployment rate (annual average)
Rest of Croatia
Slavonia

Diagnostic Report RAS Growth and Jobs in Slavonija, Baranja & Srijem
319
Figure 150: In Slavonia, there are more ALMP beneficiaries enrolled in public works programs
SOURCE: Croatian Employment Service (CES), 2017/18
In addition, the take-up of employment and start-up subsidies is limited in Slavonia but accounts for about a quarter of all ALMP placements. As these interventions are driven by market demand, and conditional on the sound health of businesses (in compliance with EU state aid regulations), there might be a limit to regional absorption capacity. Furthermore, while the share of beneficiaries that continue working after the intervention is very high, these measures might have a considerable deadweight effect (Bejaković et al., 2016), as employers use subsidies for people they would hire anyway (or businesses they were about to start up without subsidies).
3.2.3. Activating Guaranteed Minimum Benefit (GMB) beneficiaries
As the labor market recovers, recipients of the guaranteed minimum benefit (GMB)312 are becoming a major part of the unemployed workforce, particularly in less affluent Slavonia and Central Croatia (Table 5). Beneficiaries able to work are legally required to register with CES, except those less than five years from retirement or those with care responsibilities. In Slavonia, among GMB recipients, there is a slightly higher share of people able to work than in other regions (most other beneficiaries being children or people with disabilities, often from the same household).
Table 33: About one in four registered unemployed people in Slavonia receive the guaranteed minimum benefit (GMB)
Total available for work GMB recipients
As a share of the total registered unemployed (%)
Slavonia 12,785 25.5
Central and NW Croatia 11,222 31.1
Coast 8,704 13.8
Zagreb city and county 7,138 25.0
Croatia 39,849 22.4 Note: shares may vary throughout the year due to seasonal oscillation in the number of unemployed.
SOURCES: Ministry of Demography, Family, Youth and Social Policy (unemployed recipients) and CES data on unemployment, as of March 2018
312 Zajamčena Minimalna Naknada (ZMN)
0%
20%
40%
60%
80%
100%
Slavonija Center andNW
Coast Zagreb
Shar
e o
f p
arti
cip
ants
per
pro
gram
(%
)
Other ALMPsSelf-employment incentivesEmployment incentivesDirect job creation (public works)Occupational training (SOR)Training
Diagnostic Report RAS Growth and Jobs in Slavonija, Baranja & Srijem
320
Recipients of the GMB who are unemployed, face several barriers that hinder transition towards the labor market, including low education, care responsibility (towards children, spouses and the elderly) and low mobility (car ownership disqualifies someone from the GMB program if there is any public transport), resulting in annual transitions to employment of only about 20 percent (Matković and Caha, 2017). However, beneficiaries are seldom exclusively targeted by ALMPs, training or social services, and no such record is kept. Since 2014, there has been a push to activate able GMB recipients by forcing them to perform non-compensated part-time community services. They were further encouraged to take up work by facilitating the transition to the labor market through a 3-month gradual withdrawal of benefits for long-term beneficiaries when taking up work, as opposed to the loss of GMB upon acceptance of a job. However, so far, this does not seem to have had much effect on employment patterns among GMB beneficiaries (Matković, 2018b).
Coordination between social welfare centers, employment services and local government to activate GMB beneficiaries is still lacking. Each stakeholder is responsible for a different part of activation, there are no integrated information systems, coordination between counselors and institutions is largely absent, and integrated employment / activation plans do not exist (Matković, 2018a). A more coordinated approach among the different institutions to enable the joint removal of the different barriers to labor market integration that each beneficiary faces is needed.
3.3. Towards better labor market inclusion of the most vulnerable
Due to the limited impact of ALMPs on the most vulnerable, additional measures are needed to ensure their inclusion in the labor market. Section 3.2 shows that current labor market interventions have a limited impact on the most vulnerable population besides acting as an employer of last resort through PWPs. This section focuses on the economic inclusion of low-income and less educated rural women in Slavonia313 (an important subgroup of Slavonia’s vulnerable population) through two lenses: programs that increase labor force participation of older rural women, and entrepreneurship initiatives.
The European Social Fund (ESF) is the main source of funding for social inclusion programs in Slavonia (Figure 151). ESF covers education, social entrepreneurship, and various types of labor market inclusion initiatives in the current programming period (30 June 2017 to 31 December 2018) as part of the operational program ‘Efficient Human Resources’ 2014-2020, Priority Axis 2 – Social Inclusion. Zaželi (make a wish) is the main program funded by ESF (taking up about three-quarters of ESF’s total allocation). It offers women of 55 years or older jobs in the provision of homecare for the elderly and infirm in local communities (Box 3).
313 More than two-thirds of women who have not completed secondary education in Slavonia are in the bottom 40 percent of income distribution (HBS, 2014).
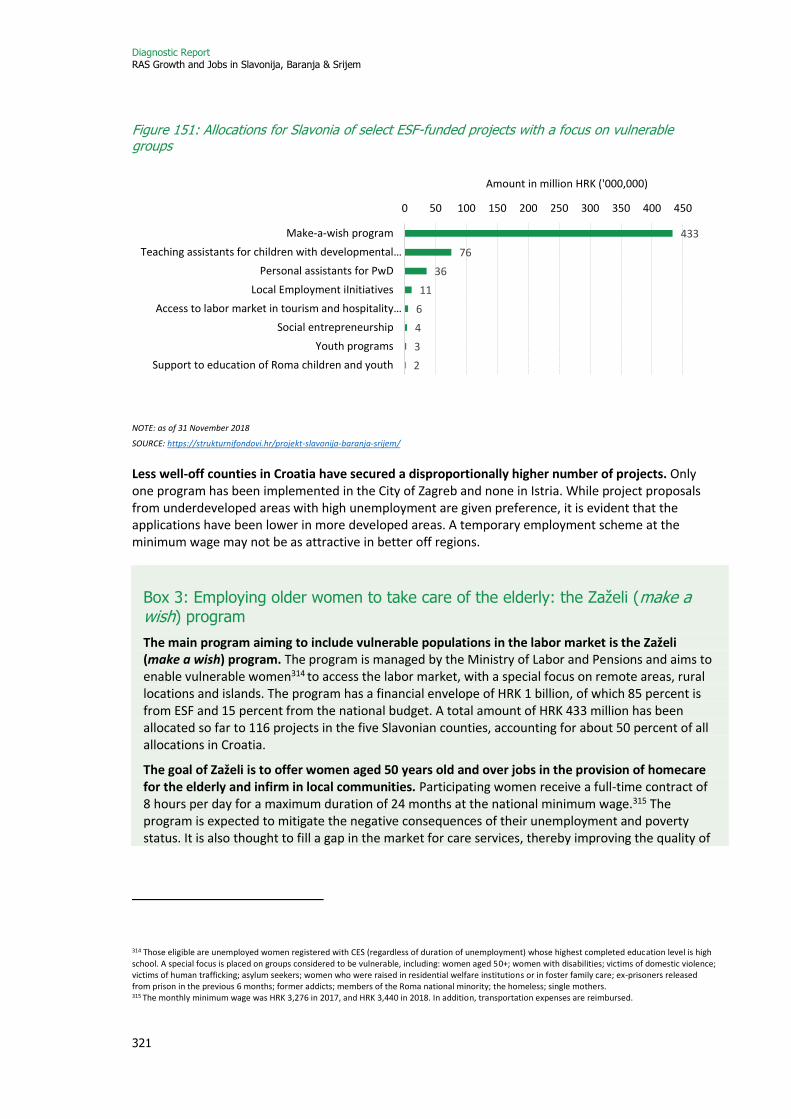
Diagnostic Report RAS Growth and Jobs in Slavonija, Baranja & Srijem
321
Figure 151: Allocations for Slavonia of select ESF-funded projects with a focus on vulnerable groups
NOTE: as of 31 November 2018
SOURCE: https://strukturnifondovi.hr/projekt-slavonija-baranja-srijem/
Less well-off counties in Croatia have secured a disproportionally higher number of projects. Only one program has been implemented in the City of Zagreb and none in Istria. While project proposals from underdeveloped areas with high unemployment are given preference, it is evident that the applications have been lower in more developed areas. A temporary employment scheme at the minimum wage may not be as attractive in better off regions.
Box 3: Employing older women to take care of the elderly: the Zaželi (make a wish) program
The main program aiming to include vulnerable populations in the labor market is the Zaželi (make a wish) program. The program is managed by the Ministry of Labor and Pensions and aims to enable vulnerable women314 to access the labor market, with a special focus on remote areas, rural locations and islands. The program has a financial envelope of HRK 1 billion, of which 85 percent is from ESF and 15 percent from the national budget. A total amount of HRK 433 million has been allocated so far to 116 projects in the five Slavonian counties, accounting for about 50 percent of all allocations in Croatia.
The goal of Zaželi is to offer women aged 50 years old and over jobs in the provision of homecare for the elderly and infirm in local communities. Participating women receive a full-time contract of 8 hours per day for a maximum duration of 24 months at the national minimum wage.315 The program is expected to mitigate the negative consequences of their unemployment and poverty status. It is also thought to fill a gap in the market for care services, thereby improving the quality of
314 Those eligible are unemployed women registered with CES (regardless of duration of unemployment) whose highest completed education level is high school. A special focus is placed on groups considered to be vulnerable, including: women aged 50+; women with disabilities; victims of domestic violence; victims of human trafficking; asylum seekers; women who were raised in residential welfare institutions or in foster family care; ex-prisoners released from prison in the previous 6 months; former addicts; members of the Roma national minority; the homeless; single mothers. 315 The monthly minimum wage was HRK 3,276 in 2017, and HRK 3,440 in 2018. In addition, transportation expenses are reimbursed.
433
76
36
11
6
4
3
2
0 50 100 150 200 250 300 350 400 450
Make-a-wish program
Teaching assistants for children with developmental…
Personal assistants for PwD
Local Employment iInitiatives
Access to labor market in tourism and hospitality…
Social entrepreneurship
Youth programs
Support to education of Roma children and youth
Amount in million HRK ('000,000)
Diagnostic Report RAS Growth and Jobs in Slavonija, Baranja & Srijem
322
life of the end users of these services. It is expected to reduce the need for institutional care for the elderly by enabling them to age at home.
Unlike most PWPs, Zaželi includes a mandatory training component with the aim of increasing the future employability of participating women. It is covered up to a cost of HRK 7,000 per women. However, the nature and quality of the training component may vary greatly. The choice of the type and area of the training is at the discretion of the employed women. It varies in duration with a minimum duration of 2 months up to a maximum of 6 months. It can be taken up during or after the employment period. Some of the implementing partners provide training in communication and psycho-social counseling, but this is not a requirement.
Collaboration between different institutions, CES, Centers of Social Welfare (CSWs), local government, and non-governmental organizations (NGOs), is central to Zaželi. Eligible applicants are local and regional self-governments, NGOs and institutions certified to provide social services to the elderly and infirm. They are required to work in partnership with CSWs and CES offices to identify beneficiaries and select the care provider. In Slavonia, the majority of contracts were given to local government (municipalities in rural areas (67) and towns (16)). It was found during field visits that in many cases they in turn partner with local NGOS to implement the program, as they lack the implementation capacity. Funding is provided on a full cost-recovery basis with a minimum of HRK 900,000 and a maximum of HRK 10 million for individual projects for a duration of 30 months (24 months’ employment and 6 months of training).
Zaželi faces many implementation challenges, however, which are symptomatic of social inclusion employment programs more generally. First, the sustainability of the program once ESF funding is over is not ensured. Zaželi, like the majority of inclusion initiatives financed through ESF, is a self-standing program, and highlights the general lack of long-term policies addressing vulnerable groups. Second, Zaželi remains a fragmented program, due to the large number of implementing agencies. As of December 2018, 131 agencies were implementing Zaželi at the national level, which poses problems of standardization, as well as economies of scale.316 Indeed, in Slavonia cost-efficiency ratios vary widely, with costs per caregiver ranging from HRK 121 to HRK 298 thousand, and costs per end user varying from HRK 23 to HRK 60 thousand.317 Third, Zaželi lacks systematic program-level monitoring and quality control of service delivery. Fourth, Zaželi lacks relevant labor-market oriented skills development, certification, and support services, which may confine the program to being a social welfare initiative rather than an activation measure. At the same time, training opportunities provided by CES through ALMPs and Zaželi may overlap, questioning the added value of the Zaželi training component. Entrepreneurship support programs for vulnerable groups offer a second route. This is especially important for hard-to-reach population groups, who often resort to self-employment due to a lack of formal employment opportunities. However, self-employment has remained somewhat underdeveloped in Croatia. The Strategy for the Development of Women Entrepreneurship in the Republic of Croatia 2014-2020 identified three priority areas: long-term activities to address prevailing stereotypes (e.g. regarding education choices and gender roles), improvements for institutional and regulatory environments (e.g. availability of child and elderly care), and increased access to finance, as well as access to training and business development services and programs. The survey on the Status of Rural Women in Croatia (Ministry of Agriculture, 2011) recommended that rural women be
316 Training can vary in quality and nature, as it is not necessarily certified, and does not rely on a baseline assessment of what is needed by the women who participate in the program or what is needed by the elderly who benefit from the program. 317 These are estimates from project proposals and not actual figures.
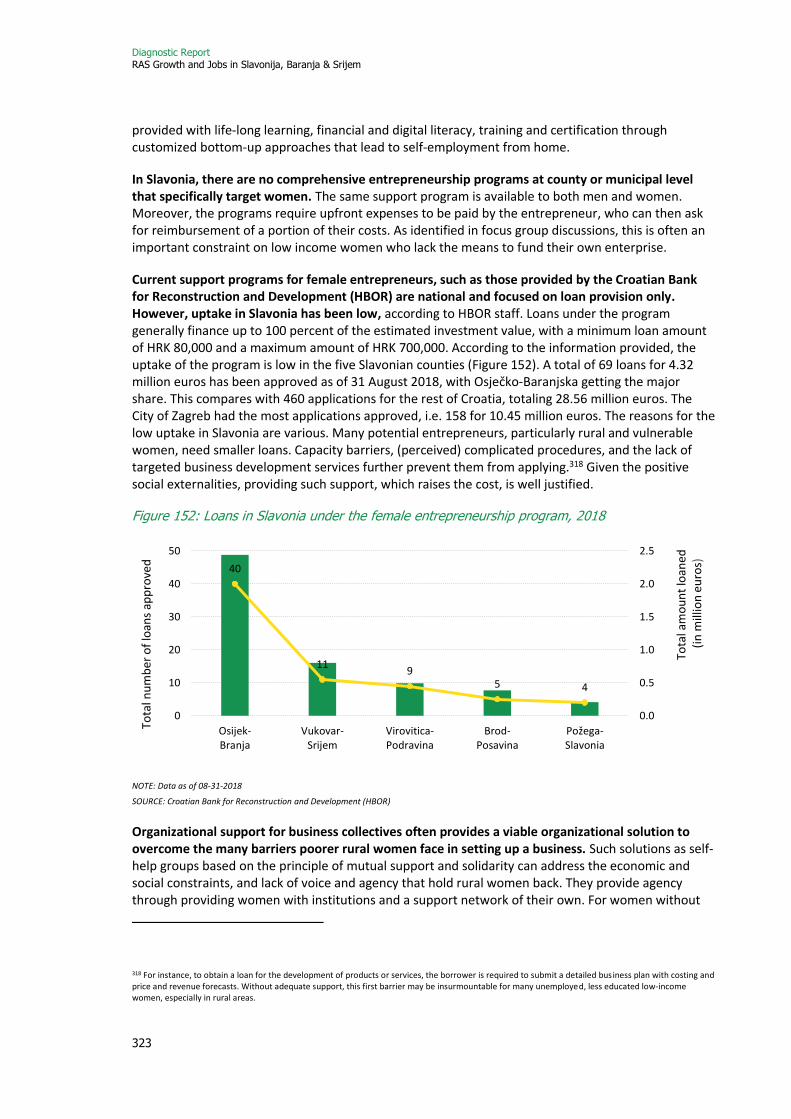
Diagnostic Report RAS Growth and Jobs in Slavonija, Baranja & Srijem
323
provided with life-long learning, financial and digital literacy, training and certification through customized bottom-up approaches that lead to self-employment from home.
In Slavonia, there are no comprehensive entrepreneurship programs at county or municipal level that specifically target women. The same support program is available to both men and women. Moreover, the programs require upfront expenses to be paid by the entrepreneur, who can then ask for reimbursement of a portion of their costs. As identified in focus group discussions, this is often an important constraint on low income women who lack the means to fund their own enterprise.
Current support programs for female entrepreneurs, such as those provided by the Croatian Bank for Reconstruction and Development (HBOR) are national and focused on loan provision only. However, uptake in Slavonia has been low, according to HBOR staff. Loans under the program generally finance up to 100 percent of the estimated investment value, with a minimum loan amount of HRK 80,000 and a maximum amount of HRK 700,000. According to the information provided, the uptake of the program is low in the five Slavonian counties (Figure 152). A total of 69 loans for 4.32 million euros has been approved as of 31 August 2018, with Osječko-Baranjska getting the major share. This compares with 460 applications for the rest of Croatia, totaling 28.56 million euros. The City of Zagreb had the most applications approved, i.e. 158 for 10.45 million euros. The reasons for the low uptake in Slavonia are various. Many potential entrepreneurs, particularly rural and vulnerable women, need smaller loans. Capacity barriers, (perceived) complicated procedures, and the lack of targeted business development services further prevent them from applying.318 Given the positive social externalities, providing such support, which raises the cost, is well justified.
Figure 152: Loans in Slavonia under the female entrepreneurship program, 2018
NOTE: Data as of 08-31-2018
SOURCE: Croatian Bank for Reconstruction and Development (HBOR)
Organizational support for business collectives often provides a viable organizational solution to overcome the many barriers poorer rural women face in setting up a business. Such solutions as self-help groups based on the principle of mutual support and solidarity can address the economic and social constraints, and lack of voice and agency that hold rural women back. They provide agency through providing women with institutions and a support network of their own. For women without
318 For instance, to obtain a loan for the development of products or services, the borrower is required to submit a detailed business plan with costing and price and revenue forecasts. Without adequate support, this first barrier may be insurmountable for many unemployed, less educated low-income women, especially in rural areas.
40
119
5 4
0.0
0.5
1.0
1.5
2.0
2.5
0
10
20
30
40
50
Osijek-Branja
Vukovar-Srijem
Virovitica-Podravina
Brod-Posavina
Požega-Slavonia
Tota
l am
ou
nt
loan
ed(i
n m
illio
n e
uro
s)
Tota
l nu
mb
er o
f lo
ans
app
rove
d
Diagnostic Report RAS Growth and Jobs in Slavonija, Baranja & Srijem
324
collateral and credit history, they enable access to finance through group savings, which are then used to access loans and credit on more favorable terms. They facilitate the setting up of group enterprises. They also provide ongoing capacity building, including financial literacy, business and life skills, as well as the technical skills needed to succeed. They lower the risk of entering the market by spreading it across the group, and allow rural women to have a collective voice in the marketplace and the ability to link to value chains in a more competitive manner. They allow for the development of financial products that are customized for vulnerable women and also the adoption of technology both for financial and market access. They are particularly relevant to Slavonia, as pointed out by a key country official during discussions highlighting the importance of the trust deficit as a legacy of the war.319
Box 4. From Voices to Choices: Empowering Rural Women through Business Collectives
Through a bottom up approach where women in a neighborhood come together in groups of 15 to 20 every week to save and to discuss and address issues in the community, trust is carefully built over time. Women take on an active role to identify gaps in service provision and develop action plans to address these gaps. Groups have thus provided care services, trash collection services, etc. The challenge of access to finance for women with no collateral and credit history is met through group savings that are used to leverage credit from banks. This also enables financial discipline and prudence. These funds are used to start businesses and to access markets though collective enterprises. Groups are networked at the county level, which enables larger collectives for scale and scope. Ongoing capacity building for leadership, financial literacy, and business and life skills is key, as is linking to both the public and private sectors to access markets and services. Systematic reviews of both quantitative and qualitative evidence have shown that these groups have a positive effect on the social, economic and political empowerment of women. These include greater financial independence and prudence, improved solidarity and social networks, and respect and improved incomes (Brody and de Hopp, 2015). Networking mature groups and providing access to credit were found to have significant economic benefits over the long-term (Deininger and Liu, 2013).
Proven models that address the multiple challenges faced by vulnerable women while empowering them are few. One such model is of business collectives that operate on the basis of mutual trust and solidarity or self-help groups. In South Asia, for over three decades, they have brought together vulnerable women in groups of 15-20 for group savings that are then leveraged to access credit and to start women-led and owned enterprises. In India, where the model is supported by government, 55 million low-skilled and low-income women, including 3.5 million farmers, are members of 4.83 million business collectives. Together they have saved USD 789 million and raised USD 23.6 billion in bank loans in the last five years. They have started over 26,000 micro and small enterprises in the non-farm sector alone.320
The World Bank Group has funded projects in South Asia and Africa based on this model for over 20 years. The model is currently being piloted successfully in the Europe and Central Asia region. In rural areas of Azerbaijan, 800 women in 10 districts have been organized into 40 business collectives in just one year. These collectives have invested in a portfolio of businesses that cover farm, off-farm and non-farm enterprises. Local youth have been trained as community business promoters and business incubators have been set up to deliver on-site business incubation and development
319 Discussions with Regional Development Agency, Brodsko-Posavska County, Slavonia, December 2018. 320 Data from The National Rural Livelihood Mission, Government of India, 2018.

Diagnostic Report RAS Growth and Jobs in Slavonija, Baranja & Srijem
325
support to enterprises through this cadre of business-savvy youth. Partnerships have also been forged with the private sector for skills development, mentoring and for access to value chains.
A key lesson learnt is that a model which addresses issues faced by rural women in low-income countries is equally relevant for both middle- and high-income countries where rural areas lag behind. The second lesson learnt is that women in more developed countries can leapfrog the stages of the model rapidly due to better education, services and support systems. The women in Azerbaijan started their businesses in as little as two months, whereas in lower-income countries it takes much longer. Another point is the shorter learning curve when it comes to financial literacy and business skills training, and the ease with which women are using technology including social media to access markets. These lessons could be relevant for Slavonia, where a substantial portion of less skilled rural women are inactive and need to be brought into the labor market.
Recommendations and policy options
Diagnostic Report RAS Growth and Jobs in Slavonija, Baranja & Srijem
326
4. Recommendations and policy options
4.1. Job creation remains the top priority
• Strengthening the business environment and firm competitiveness is key. Given the very low employment rate of Slavonia’s working-age population (10 percentage points below the Croatian rate and 17 percentage points below the EU-28 average), creating jobs remains the top priority in resolving Slavonia’s labor market performance. The share of employment in Slavonia’s public sector (in government and publicly-owned enterprises combined) is on a par with the rest of Croatia (even though a smaller share of Slavonian firms are publicly owned, i.e. 7.6 percent versus 11.1 percent in the rest of Croatia). However, at 30 percent, employment in the public sector is nonetheless already sizeable. Job generation efforts should therefore be focused on private-sector expansion.
• In particular, this requires a reduction in the regulatory burden and an increase in Slavonian firms’ competitiveness. Inefficient government bureaucracy is by far the most important impediment to doing business in Croatia, identified by 21 percent of the respondents to the surveys underpinning the 2017-2018 Global Competitiveness Index. Policy instability, tax regulations, corruption and tax rates are mentioned by 10-13 percent of respondents. The importance of better governance also resonates with people’s perceptions, and the challenge is even more pronounced in Slavonia. An overwhelming majority of surveyed individuals (three in five) report that political connections (or even illegal means) are necessary to get ahead in life rather than one’s own efforts or intelligence, compared with 40 percent in the rest of Croatia.
• Labor productivity in Slavonian firms is also lower than in the rest of Croatia across most sectors and firm sizes, underscoring the need to innovate and increase their competitiveness to generate better-paying jobs. This is also needed to stem the current labor outflow, which has accelerated since the economy in Croatia and the EU started its recovery in 2014. For a number of concrete measures to reduce the regulatory burden, foster innovation and attract foreign direct investment, which is virtually absent in Slavonia, the reader is referred to the relevant chapters in this report.
• Sectors and activities that in particular generate jobs for unskilled and semi-skilled workers should be focused on. Inactivity and unemployment rates are especially high among those with some secondary education or less. Agriculture and forestry are key sectors of employment for the lower-skilled, both directly and in their related activities upstream (input supply, machinery services) and downstream (transport, processing, storage, wholesale and retail). This supports the current focus of Program Slavonia on making the agriculture and wood sectors more competitive through FDI attraction, innovation and regulatory and policy reforms. Slavonia also has a history of employment and a workforce experienced in manufacturing, a sector in which there are many unfilled vacancies.
• This would also support the recent addition of metal processing as another sector of focus in Program Slavonia. Given their size, the scope for significant job generation in the ICT and tourism sectors, two other focus sectors, may be more limited, though if focused on home tourism, the latter could well be effective in reaching the lower-educated and excluded.

Diagnostic Report RAS Growth and Jobs in Slavonija, Baranja & Srijem
327
Overall, in choosing the sectors and subsectors to support, as well as the mode of operational support, the direct and indirect or multiplier effects on the labor market, especially on unskilled and semi-skilled workers, will need to be an important consideration. While no exact metrics to quantify these effects exist as yet, careful reflection drawing on insights from the literature and international experience should be applied.
4.2. Correcting supply and demand mismatches in the short-run
• Adjust the ALMP portfolio towards the delivery of training programs for a more sustainable exit from unemployment. The provider infrastructure is largely in place in the Slavonia region but cannot deliver in full without adequate public funding, quality assurance provisions, multi-year arrangements with training providers for a flexible set of programs, the active involvement of beneficiaries in the choice of programs, and broad multipartite ownership of the scope of the training supplied (such as by county, economic and social councils (gospodarsko-socijalno vijeće), or local employment partnerships). Utilization of Croatian qualification framework grants might contribute to bringing qualification standards up to date.
• More effective ALMP planning and delivery mechanisms are needed, as current practices lead to underinvestment in ALMPs in the Slavonia region and a suboptimal mix of instruments. Participation targets by intervention type should be set up at the regional level, and CES delivery capacity at the regional level should be strengthened to implement the program and reach the targets. This requires, among other things, earmarked / reserved funding for training programs at the county level, set per number of unemployed persons.
• In employment provision, emphasis should shift from public works programs (PWPs) to more on-the-job training. PWPs are shown to be a less cost-effective measure to reintegrate low-skilled workers back into the labor market; they are appropriate in times of economic recession when jobs are not being created.
• Specific intensive interventions should be designed to cope with the increasing share of unemployed people that are guaranteed minimum benefit (GMB) recipients. They face several barriers to labor market entry, and addressing these requires intense cooperation between social welfare centers, CES branches and local government, with intensive individual and household-level casework, provision of care and support services (in particular for dependents), and a combination of ALMPs aimed at social integration via public works, capacity building through training, and job insertion via employment incentives. In order to ensure targeting, these resources should be reserved only for GMB recipients (who currently make up more than a quarter of all unemployed people). In the growing labor market, public works should only be directed towards the most vulnerable, and tied to relevant labor market training interventions.
4.3. Investing in human capital formation at all levels for the future
Weaknesses in the education system, as evidenced by weak PISA scores and high levels of failure in the Matura exam, may constrain the ability of formal education institutions to impart the skills necessary in the job market in Slavonia or elsewhere. Improving this is imperative to preparing Slavonia’s youth for the future, which will only become more skill-dependent as the global economy digitizes. However, even when education is available, with so few new jobs, it is still not sufficient for low-income households to improve their labor market outcomes. In addition, collaboration between

Diagnostic Report RAS Growth and Jobs in Slavonija, Baranja & Srijem
328
CES, employers, and the education system remains limited. In light of these findings, the following options can be recommended:
• Boost or supplement funding sources for local government to ensure adequate support for all levels of education. Currently, there are countrywide transfers only towards the decentralized functions of primary and upper-secondary education (school funding only), while all other levels are left to the good will and fiscal capacity of county, town and municipal governments, leading to large variations in education expenditure per young person. One approach would be to increase minimum funding standards for primary and secondary education to ensure less variation in investment (and provide more for VET schools, as they require more investment). Another would be to extend the decentralized function transfer model to ECEC and other education expenditure (e.g. scholarships, extracurricular activities). A third approach could supplement local efforts with national programs / grants being targeted / limited to regions with low investment or the most disadvantaged children.
• Increase the relevance and attractiveness of technical and vocational education and training (TVET), in particular, for vocations that are currently provided for via dead-end 3-year VET courses. The number of places in most priority sectors seems adequate, but interest is waning and there is negative selection. The intervention should not only include financial incentives for students but also provide students with key competences for lifelong learning to facilitate vertical mobility (and passing the state Matura exam), specialization later on, and also future career changes. As the student population size at the county level is too small to allow for opportunities for training in every specialization in every school or county (which is evident from the large number of unfilled places), economies of scale should be pursued, as they are emerging from the five regional competence centers recently established in Slavonia. They could serve as a vehicle to invest in high-quality specialized TVET training (including student accommodation). Cooperation with employers in TVET provision and work-based learning should also be strengthened, which will require more state support towards developing functional relationships. Curriculum reforms should be accelerated, moving away from a content-based approach to one that focuses more on competencies and that is more responsive to private sector needs.
• Provide opportunities for local youth to train in higher education programs. This includes providing more places in gymnasium programs (which currently considerably lag behind developed regions of Croatia) and financial instruments (funded either via local or national sources) for students to enroll in tertiary education. There are already sufficient places available (both full and part-time) in higher education institutions, in local polytechnics, local universities (Osijek, Slavonski Brod), or other Croatian higher education institutions (HEIs). Local HEIs should use existing instruments that support the development of qualification standards and work-based learning, and concentrate the provision of high-quality training in the fields they already excel in and for the industries that are relevant to the regional labor market.
4.4. Expand access to affordable care services
The analysis of care in Slavonia concludes that expanding formal family care services (for children and the elderly) would improve labor market opportunities for women. Evaluations of childcare interventions in Latin America and the Caribbean confirm the consistently positive effect of access to affordable childcare on female labor force participation. Even if different policies are needed to overcome the constraints women face with regard to accessing jobs, childcare emerges as the policy

Diagnostic Report RAS Growth and Jobs in Slavonija, Baranja & Srijem
329
that has the most consistently positive effect on women’s engagement in the labor force (Mateo Díaz and Rodriguez-Chamussy, 2016). In light of these findings, the following options can be recommended:
• Develop quality affordable early child education and care (ECEC) services. As evidenced internationally, access to childcare should have a positive effect on female labor force participation. Better ECEC access would also enhance the school readiness of children through better early childhood education. Given Slavonia’s poor performance in the Matura exam, and the wide recognition of early childhood education for longer-term human capital development, this is an important additional advantage. Improvements in eldercare at home can further improve the health of the elderly, and thus enable savings in the healthcare sector (World Bank Group, 2015). To improve the availability and use of childcare services, particularly in rural areas, priorities should include the expansion, improvement or repurposing of infrastructure to expand access to childcare (either in publicly owned institutions or via subsidies to private providers), and investments in the quality of childcare through intensifying education and certification programs for ECEC professionals.
• Prioritize the most vulnerable (remote areas and poorer households). While there are several ongoing efforts to improve ECEC infrastructure using budgetary and EU funding, a solution ought to be found to enable local governments to cover operational costs once capacity is upgraded, with the support provided prioritizing access to the most remote areas (where care provision is most costly) and the most disadvantaged children (whose parents might find fees prohibitive).
• Develop quality affordable at-home care for the elderly. As evidenced by the Zaželi program, vulnerable women, who usually have limited employment opportunities (older, less educated, rural women), can contribute to Slavonia’s labor market. Initiatives to link low female labor force participation and an aging population needing homecare should be pursued further and, if successful, funding for such programs should be earmarked in a sustainable way.
4.5. Towards including the most vulnerable in the labor market
Section 1 showed that the most vulnerable populations in Slavonia are women, youth, the elderly, low-skilled individuals, and people living in remote rural areas, while Section 2 highlighted Slavonia’s lower human capital attainment, which is particularly true for the most vulnerable. In light of these findings, the following options can be recommended:
• Target and concentrate efforts on the most vulnerable. Concerted efforts should be undertaken to include the most vulnerable and inactive populations, including youth, women and early retirees in the labor market, and thus promote inclusive growth in Slavonia. This would require a deeper understanding of the different categories of the inactive, the barriers they face, and the opportunities available, in particular through self-employment and entrepreneurship. A Slavonia-specific latent classification analysis of labor market exclusion, similar to the analysis undertaken for the ‘Portrait of Labor Market Exclusion in Croatia’ would provide a good entry point for doing so.
• Focus on skilling-up the most vulnerable and offer training and skill-development programs in potential growth sectors. Tailored approaches that consider the skill levels and needs of youth, women and retirees are needed so that they are not left behind. For sustainable employment, training and skill development programs should be offered in potential growth sectors and to meet service gaps in Slavonia. This would include improving productivity and
Diagnostic Report RAS Growth and Jobs in Slavonija, Baranja & Srijem
330
markets for family farms and non-farm sources of income, including through community-based tourism.
• Ensure high-quality labor inclusion programs. The targeting and impact of social inclusion programs including Zaželi should be improved by assessing needs both on the demand and supply side and also potential barriers for target groups. Current programs like Zaželi require standardization and quality control and monitoring and evaluation (M&E) to ensure smooth implementation and quality across the board, and to ensure that lessons learnt improve impact.
• Promote self-employment. In the short to medium-term, efforts should be made to support self-employment through entrepreneurship programs along with improvements in the enabling environment in the medium to long-term. A social inclusion policy needs to be developed which includes inclusive entrepreneurship strategies, and regional and local level action plans that are customized to specific vulnerable groups. These programs need to be adequately funded and implemented by staff with the right skills and experience. Self-entrepreneurs should be supported through access to finance and business support services to organize business collectives that focus on care services based on successful international experiences, in particular the three decades of efforts by women’s self-help groups. This would create an institutional model that can be scaled up across Slavonia and also that can cover multiple sectors within its scope.
Diagnostic Report RAS Growth and Jobs in Slavonija, Baranja & Srijem
331
Chapter References ASOO, 2011. ‘Planiranje Kvalifikacija. Priručnik Za Korištenje Profila Sektora Verzije 3.1 u Svrhu Planiranja Kvalifikacija u Srednjem Strukovnom Obrazovanju’, Zagreb: Agencija za Strukovno Obrazovanje i Obrazovanje Odraslih.
Bagić, D., Burić, I., and Bejaković P., 2016. ‘Vanjska Evaluacija Mjera Aktivne Politike Tržišta Rada 2010. - 2013. Analiza Anketnih Podataka’, Zagreb: Hrvatski Zavod za Zapošljavanje i IPSOS.
Bejaković, P., Kotnarowski, M., Bagić, D., & Burić, I., 2016. ‘External Evaluation of Active Labor-Market Policy Measures 2010 – 2013’. Summary Evaluation Report. Zagreb: Croatian Employment Service and IPSOS.
Bertek T., and Dobrotić I., 2016. ‘Žena, Majka, Radnica. Usklađivanje Obiteljskih Pbveza i Plaćenog Rada u Hrvatskoj (Women, Mother, Worker. Balancing Family and Work in Croatia)’, BaBe, Zagreb.
Brody, C. and de Hopp, T., 2015. ‘Economic Self-Help Group Programs for Improving Women’s Empowerment: A Systematic Review’, The Cambridge Collaboration.
Card, D., Kluve, J., and Weber, A., 2015. ‘What Works? A Meta-analysis of Recent Active Labor Market Program Evaluations.’ NBER Working Paper 21431.
Deininger, K. and Liu, Y., 2013. ‘Evaluating Program Impacts on Mature Self-Help Groups in India’, The World Bank Economic Review, Volume 27, Issue 2, 1 January 2013, 272-296.
Dobrotić, I., Matković, T., and Menger, V., 2018. ‘Analiza Dostupnosti, Kapaciteta i Financiranja Sustava Ranog i Predškolskog Odgoja i Obrazovanja’, Zagreb: Ministarstvo za Demografiju, Obitelj, Mlade i Socijalnu Politiku.
European Union, 2017. ‘Index of Multiple Deprivation Conceptual Framework for Identifying Lagging Municipalities and Towns in Croatia’.
Government of the Republic of Croatia, 2013. ‘Strategy of Women Entrepreneurship Development in the Republic of Croatia 2014-2020’.
Heckman, J.J., 2008. ‘Schools, Skills, and Synapses’, Economic Inquiry, 46(3): 289-324.
Hoftijzer, M. and Gortazar, L., 2018. ‘Skills and Europe’s Labor Market: How Technological Change and Other Drivers of Skill Demand and Supply are Shaping Europe’s Labor Market’, The World Bank, Washington, DC.
Kotnarowski, M., Bagić, D., and Burić, I., 2016. ‘Vanjska Evaluacija Mjera Aktivne Politike Tržišta Rada 2010. - 2013. Evaluacijski Izvještaj za PSM Dionicu’, Zagreb: Hrvatski Zavod za Zapošljavanje i IPSOS.
Matković, T., 2012. ‘Educational Origins and Occupational Destinations? Dissecting the Education-Job Mismatch in School to Work Transitions in Croatia’, in Arandarenko, M. & Bartlett, W. (Eds.), Labor Market and Skills in the Western Balkans (pp. 73-100), Belgrade: FREN - Foundation for the Advancement of Economics.
Matković, T., 2018a. ‘Coordinating Service Provisions for Social Service Beneficiaries in Croatia: Normative Optimism Meets Established Institutional Practices’, Peer Review on ‘Way to Work – Strengthening the Links Between Active Labor Market Policy Measures and Social Support Services’, The Hague: DG Employment, Social Affairs and Inclusion.
Matković, T., 2018b. ‘Reaching for More: Challenges of Adequacy and Coverage in Croatian Minimum Income System’, Peer Review on ‘Minimum Income Benefits – Securing a Life in Dignity, Enabling Access to Services and Integration into the Labor Market’, Berlin: DG Employment, Social Affairs and Inclusion.
Matković, T., and Caha, D., 2017. ‘Patterns of Welfare-to-employment Transitions of Croatian Guaranteed Minimum Benefit Recipients: A Preliminary Study’. Public Sector Economics, 41(3), 335-358.
Nestić, D., Rubil, I., and Tomić, I., 2015. ‘Analysis of the Difference in Wages between the Public Sector, State-Owned Enterprises and the Private Sector in Croatia in the Period 2000-2012’, Privredna Kretanja I Ekonoska Politika, Vol. 24 No.1(136), 7-51.
NCVVO, 2010. ‘Statističko Izvješće o Rezultatima Državne Mature’, Školska godina 2009/2010. Zagreb: NCVVO.
NCVVO, 2017. ‘Novi Horizonti Strukovnoga Obrazovanja’, Izvještaj Vanjskoga Vrednovanja Eksperimentalne Provedbe Novih Strukovnih Kurikuluma. Zagreb: Nacionalni Centar za Vanjsko Vrednovanje Obrazovanja.
OECD / European Union, 2017. ‘Inclusive Entrepreneurship Trends and Policies in Croatia’, in ‘The Missing Entrepreneurs 2017: Policies for Inclusive Entrepreneurship’.
Ovadiya, M., Vandeninden, F., Isik-Dekmelik, A., Karacsony, S., and Millan, N., 2017. ‘Portraits of Labor Market Exclusion 2.0: Country Policy Paper for Croatia’, The World Bank, Washington, DC.
Ridao-Cano, C., and Bodewig, C., 2018. ‘Growing United: Upgrading Europe’s Convergence Machine’, The World Bank, Washington, DC.
Rutkowski, J., and Madžarević-Šujster, S., 2010. ‘Croatia - Social Impact of the Crisis and Building Resilience’ (No. 55111- HR), Zagreb: The International Bank for Reconstruction and Development, The World Bank Office Croatia.
Tomić, I., 2014. ‘Regional Matching (In)efficiency on the Croatian Labor Market’, Acta Oeconomica, 64(3), 287-312.
World Bank, 2018a. ‘Systematic Country Diagnostic’, The World Bank, Washington, DC.
World Bank, 2018b. ‘Labor Markets in Croatia: Challenges and Opportunities’, Social Protection and Jobs Global Practice, The World Bank, Washington, DC.
World Bank, 2018c. ‘Policy Note Education and Skill’s, Croatia National Development Strategy RAS.
Diagnostic Report RAS Growth and Jobs in Slavonija, Baranja & Srijem
Annexes

Diagnostic Report RAS Growth and Jobs in Slavonija, Baranja & Srijem
333
Annex A
List of Company Consultations for FDI chapter
Company Sector Foreign or Domestic
Viro Agribusiness Domestic
Zvečevo Agribusiness Domestic
Croatian Food Agency Agribusiness Domestic
Perutnina Ptuj Agribusiness FDI
PKE Agribusiness FDI
AminoLabs Atlantic Agribusiness FDI
Adriatica Dunav Agribusiness FDI
Meggle Agribusiness FDI
Erste Bank Financial Services FDI
Im Comp Glass Domestic
Mono.hr ICT Domestic
Inchoo ICT Domestic
Osijek Software City / COBE ICT Domestic
Studio 33 ICT Domestic
BIOS ICT Domestic
Ofir ICT Domestic
Upchain ICT FDI
Transcom ICT FDI
IBM ICT FDI
Lagermax Logistics FDI
Plamen Ltd Manufacturing Domestic
Saint Jean Industries Metal FDI
Medical Intertrade / Yasenka Pharma Domestic
EcoCortec doo Plastics FDI
Olimpias Textiles FDI
Hotel Osijek Tourism Domestic
Lipik Hospital & Spa Tourism Domestic
Kopački rit Nature Park Tourism Domestic
Danubian Tours Tourism Domestic
Spin Valis Wood Domestic
CEKOM Vinkovci Wood Domestic
Spačva Wood Domestic
Nikola Adamović Wood FDI
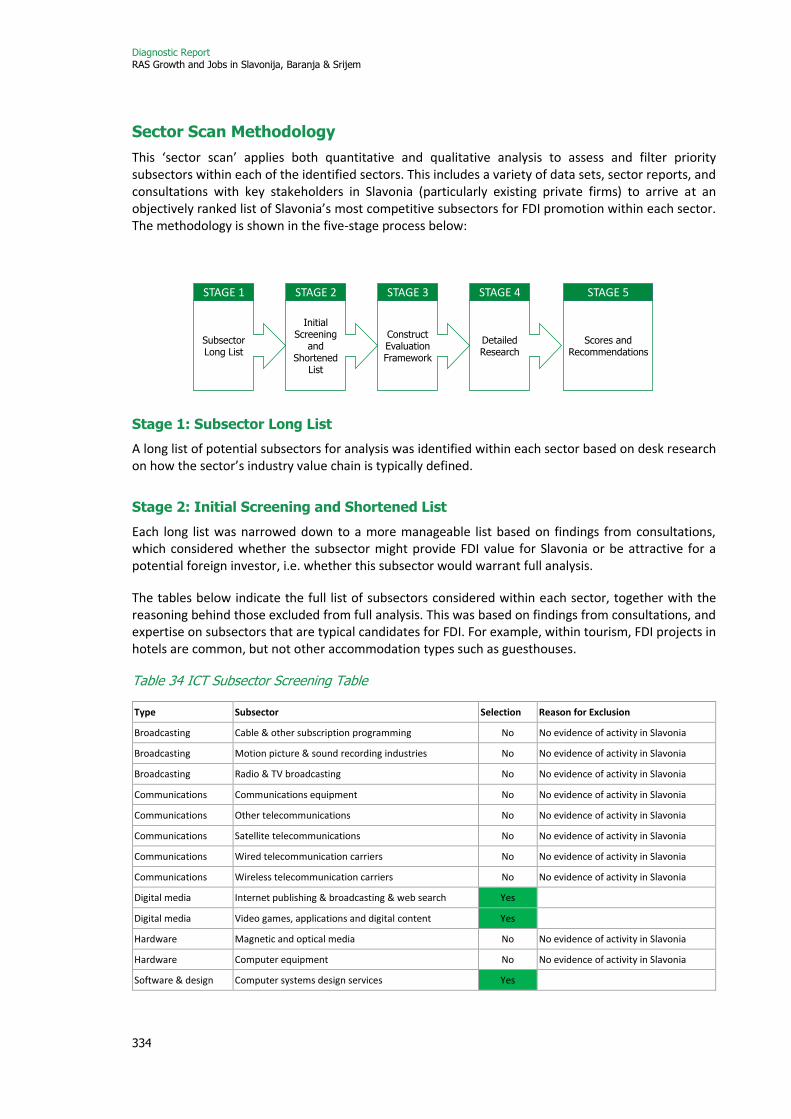
Diagnostic Report RAS Growth and Jobs in Slavonija, Baranja & Srijem
334
Sector Scan Methodology
This ‘sector scan’ applies both quantitative and qualitative analysis to assess and filter priority subsectors within each of the identified sectors. This includes a variety of data sets, sector reports, and consultations with key stakeholders in Slavonia (particularly existing private firms) to arrive at an objectively ranked list of Slavonia’s most competitive subsectors for FDI promotion within each sector. The methodology is shown in the five-stage process below:
Stage 1: Subsector Long List
A long list of potential subsectors for analysis was identified within each sector based on desk research on how the sector’s industry value chain is typically defined.
Stage 2: Initial Screening and Shortened List
Each long list was narrowed down to a more manageable list based on findings from consultations, which considered whether the subsector might provide FDI value for Slavonia or be attractive for a potential foreign investor, i.e. whether this subsector would warrant full analysis.
The tables below indicate the full list of subsectors considered within each sector, together with the reasoning behind those excluded from full analysis. This was based on findings from consultations, and expertise on subsectors that are typical candidates for FDI. For example, within tourism, FDI projects in hotels are common, but not other accommodation types such as guesthouses.
Table 34 ICT Subsector Screening Table
Type Subsector Selection Reason for Exclusion
Broadcasting Cable & other subscription programming No No evidence of activity in Slavonia
Broadcasting Motion picture & sound recording industries No No evidence of activity in Slavonia
Broadcasting Radio & TV broadcasting No No evidence of activity in Slavonia
Communications Communications equipment No No evidence of activity in Slavonia
Communications Other telecommunications No No evidence of activity in Slavonia
Communications Satellite telecommunications No No evidence of activity in Slavonia
Communications Wired telecommunication carriers No No evidence of activity in Slavonia
Communications Wireless telecommunication carriers No No evidence of activity in Slavonia
Digital media Internet publishing & broadcasting & web search Yes
Digital media Video games, applications and digital content Yes
Hardware Magnetic and optical media No No evidence of activity in Slavonia
Hardware Computer equipment No No evidence of activity in Slavonia
Software & design Computer systems design services Yes
STAGE 1
Subsector Long List
STAGE 2
Initial Screening
and Shortened
List
STAGE 3
Construct Evaluation Framework
STAGE 4
Detailed Research
STAGE 5
Scores and Recommendations

Diagnostic Report RAS Growth and Jobs in Slavonija, Baranja & Srijem
335
Software & design Custom computer programming services Yes
Software & design Data processing, hosting, & related services Yes
Software & design Other computer-related services Yes
Software & design Software publishing Yes
Table 35 Agribusiness Subsector Screening Table
Type Subsector Selection Reason for Exclusion
Other Pesticide, fertilizer, and other agricultural chemical manufacturing
No No evidence of existing activity in Slavonia
Other Agricultural machinery Yes
Other Transportation Yes
Other Warehousing & storage Yes
Processing Animal food No No evidence of existing activity in Slavonia
Processing Seafood products (aquaculture) No Landlocked. Products from rivers would not be sufficient supply
Processing Animal slaughtering & processing No No evidence of existing activity in Slavonia
Processing Bakeries and tortilla manufacturing No No evidence of existing activity in Slavonia
Processing Coffee & tea No No evidence of existing activity in Slavonia
Processing Sugar & confectionary products Yes
Processing Fruit and vegetable preserving and specialty food manufacturing
Yes
Processing Dairy product manufacturing Yes
Processing Snack food manufacturing No
No specific evidence of existing activity in Slavonia, while some snacks such as chocolate would be covered within other subsectors
Processing Other food manufacturing Yes
Processing Soft drinks & ice Yes
Processing Alcoholic drinks Yes
Production Fishing No Landlocked. Products from rivers would not be sufficient supply
Production Oilseed and grains Yes
Production Crop production Yes
Production Animal production Yes
Production Greenhouse / floriculture production Yes
Table 36 Tourism Subsector Screening Table
Type Subsector Selection Reason for Exclusion
Accommodation and Catering
Restaurants No Typically domestic activity or lower-value franchises
Accommodation and Catering
Other Accommodation No Covers guesthouses, camping etc., which will typically be a domestic activity
Accommodation and Catering
Hotels Yes
Ancillary Service Provision Car hire No Little added value
Ancillary Service Provision Currency exchange No No evidence of demand in Slavonia
Ancillary Service Provision Tourist information and guiding services
No Typically a domestic activity
Ancillary Service Provision Bookings / reservations Yes
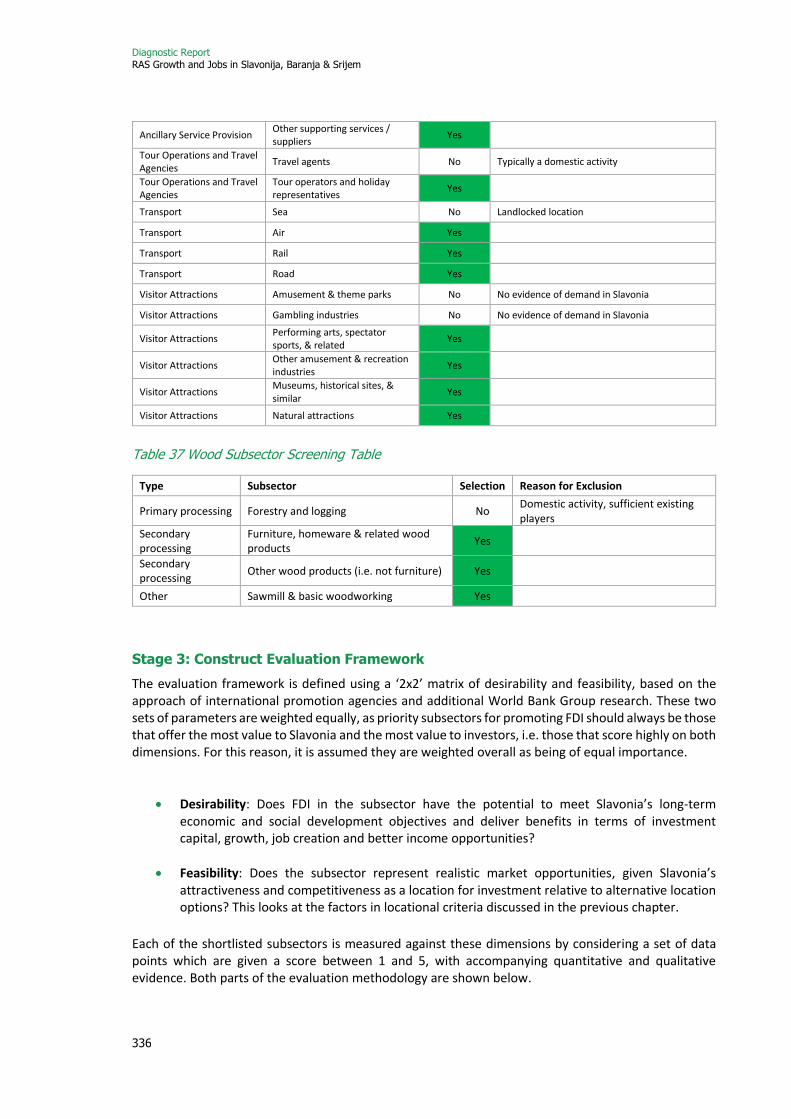
Diagnostic Report RAS Growth and Jobs in Slavonija, Baranja & Srijem
336
Ancillary Service Provision Other supporting services / suppliers
Yes
Tour Operations and Travel Agencies
Travel agents No Typically a domestic activity
Tour Operations and Travel Agencies
Tour operators and holiday representatives
Yes
Transport Sea No Landlocked location
Transport Air Yes
Transport Rail Yes
Transport Road Yes
Visitor Attractions Amusement & theme parks No No evidence of demand in Slavonia
Visitor Attractions Gambling industries No No evidence of demand in Slavonia
Visitor Attractions Performing arts, spectator sports, & related
Yes
Visitor Attractions Other amusement & recreation industries
Yes
Visitor Attractions Museums, historical sites, & similar
Yes
Visitor Attractions Natural attractions Yes
Table 37 Wood Subsector Screening Table
Type Subsector Selection Reason for Exclusion
Primary processing Forestry and logging No Domestic activity, sufficient existing players
Secondary processing
Furniture, homeware & related wood products
Yes
Secondary processing
Other wood products (i.e. not furniture) Yes
Other Sawmill & basic woodworking Yes
Stage 3: Construct Evaluation Framework
The evaluation framework is defined using a ‘2x2’ matrix of desirability and feasibility, based on the approach of international promotion agencies and additional World Bank Group research. These two sets of parameters are weighted equally, as priority subsectors for promoting FDI should always be those that offer the most value to Slavonia and the most value to investors, i.e. those that score highly on both dimensions. For this reason, it is assumed they are weighted overall as being of equal importance.
• Desirability: Does FDI in the subsector have the potential to meet Slavonia’s long-term
economic and social development objectives and deliver benefits in terms of investment capital, growth, job creation and better income opportunities?
• Feasibility: Does the subsector represent realistic market opportunities, given Slavonia’s attractiveness and competitiveness as a location for investment relative to alternative location options? This looks at the factors in locational criteria discussed in the previous chapter.
Each of the shortlisted subsectors is measured against these dimensions by considering a set of data points which are given a score between 1 and 5, with accompanying quantitative and qualitative evidence. Both parts of the evaluation methodology are shown below.
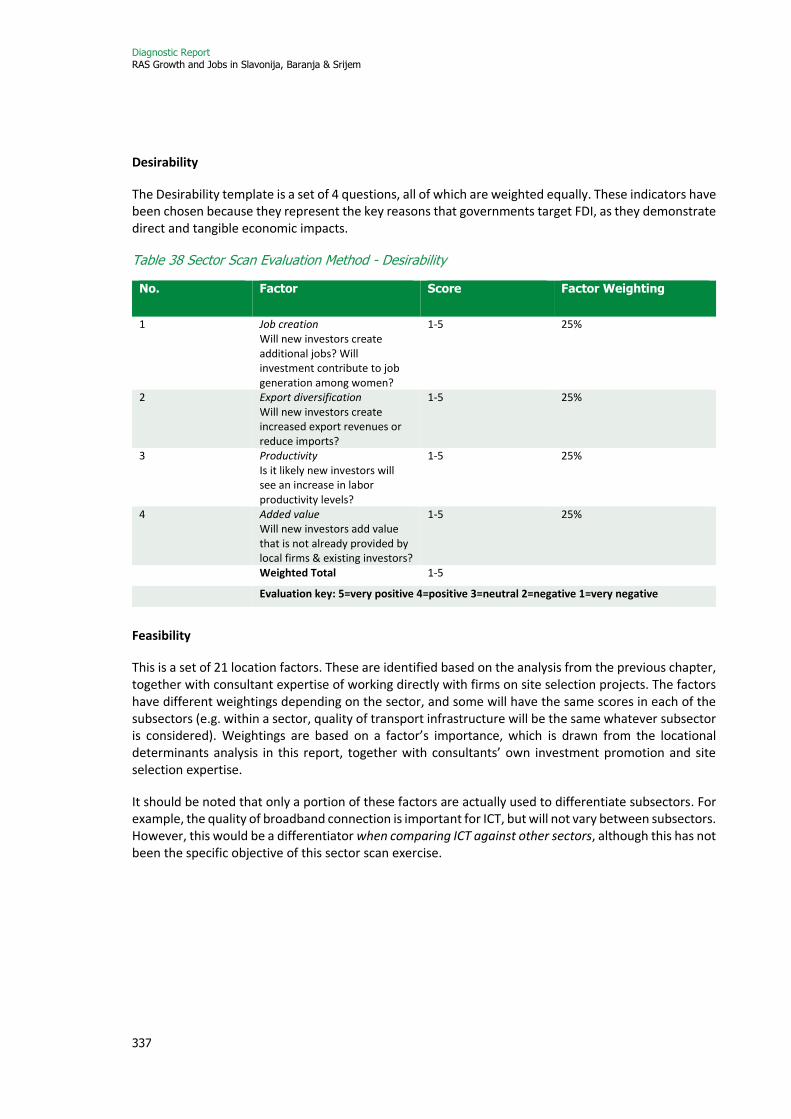
Diagnostic Report RAS Growth and Jobs in Slavonija, Baranja & Srijem
337
Desirability
The Desirability template is a set of 4 questions, all of which are weighted equally. These indicators have been chosen because they represent the key reasons that governments target FDI, as they demonstrate direct and tangible economic impacts.
Table 38 Sector Scan Evaluation Method - Desirability
No. Factor Score Factor Weighting
1 Job creation Will new investors create additional jobs? Will investment contribute to job generation among women?
1-5 25%
2 Export diversification Will new investors create increased export revenues or reduce imports?
1-5 25%
3 Productivity Is it likely new investors will see an increase in labor productivity levels?
1-5 25%
4 Added value Will new investors add value that is not already provided by local firms & existing investors?
1-5 25%
Weighted Total 1-5
Evaluation key: 5=very positive 4=positive 3=neutral 2=negative 1=very negative
Feasibility
This is a set of 21 location factors. These are identified based on the analysis from the previous chapter, together with consultant expertise of working directly with firms on site selection projects. The factors have different weightings depending on the sector, and some will have the same scores in each of the subsectors (e.g. within a sector, quality of transport infrastructure will be the same whatever subsector is considered). Weightings are based on a factor’s importance, which is drawn from the locational determinants analysis in this report, together with consultants’ own investment promotion and site selection expertise.
It should be noted that only a portion of these factors are actually used to differentiate subsectors. For example, the quality of broadband connection is important for ICT, but will not vary between subsectors. However, this would be a differentiator when comparing ICT against other sectors, although this has not been the specific objective of this sector scan exercise.
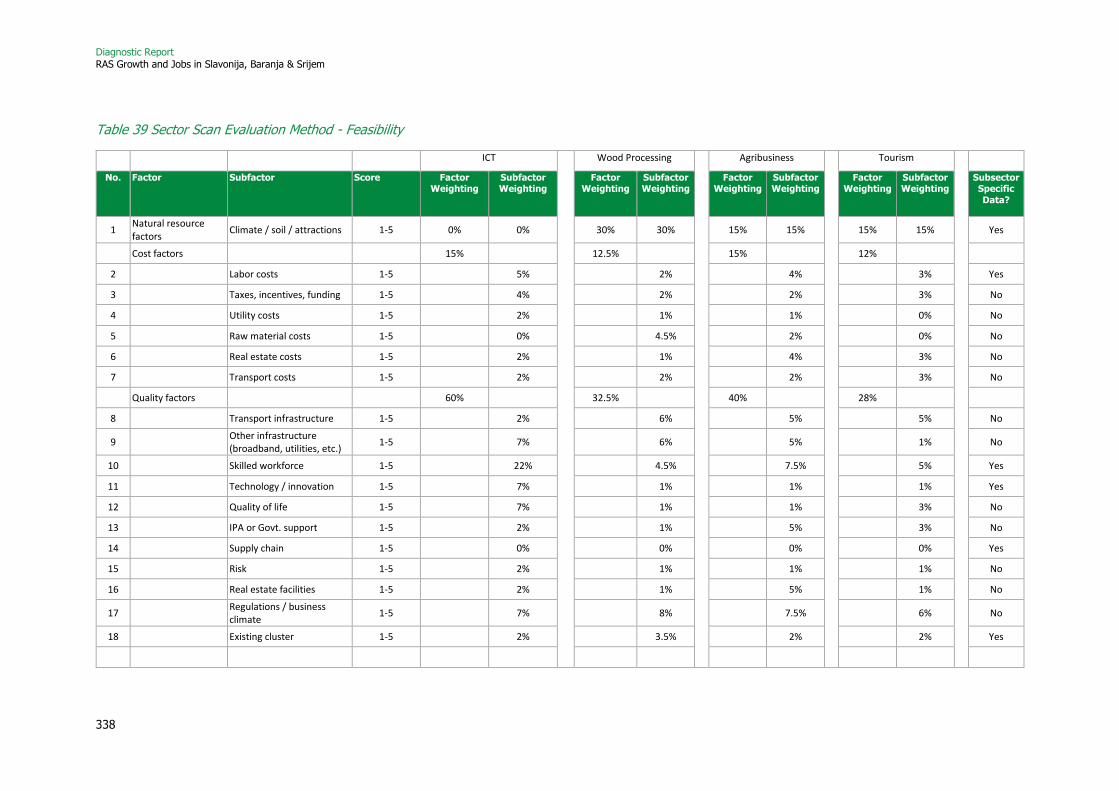
Diagnostic Report RAS Growth and Jobs in Slavonija, Baranja & Srijem
338
Table 39 Sector Scan Evaluation Method - Feasibility
ICT
Wood Processing
Agribusiness
Tourism
No. Factor Subfactor Score Factor Weighting
Subfactor Weighting
Factor Weighting
Subfactor Weighting
Factor Weighting
Subfactor Weighting
Factor Weighting
Subfactor Weighting
Subsector Specific
Data?
1 Natural resource factors
Climate / soil / attractions 1-5 0% 0% 30% 30% 15% 15% 15% 15% Yes
Cost factors 15% 12.5% 15% 12%
2 Labor costs 1-5 5% 2% 4% 3% Yes
3 Taxes, incentives, funding 1-5 4% 2% 2% 3% No
4 Utility costs 1-5 2% 1% 1% 0% No
5 Raw material costs 1-5 0% 4.5% 2% 0% No
6 Real estate costs 1-5 2% 1% 4% 3% No
7 Transport costs 1-5 2% 2% 2% 3% No
Quality factors 60% 32.5% 40% 28%
8 Transport infrastructure 1-5 2% 6% 5% 5% No
9 Other infrastructure (broadband, utilities, etc.)
1-5 7% 6% 5% 1% No
10 Skilled workforce 1-5 22% 4.5% 7.5% 5% Yes
11 Technology / innovation 1-5 7% 1% 1% 1% Yes
12 Quality of life 1-5 7% 1% 1% 3% No
13 IPA or Govt. support 1-5 2% 1% 5% 3% No
14 Supply chain 1-5 0% 0% 0% 0% Yes
15 Risk 1-5 2% 1% 1% 1% No
16 Real estate facilities 1-5 2% 1% 5% 1% No
17 Regulations / business climate
1-5 7% 8% 7.5% 6% No
18 Existing cluster 1-5 2% 3.5% 2% 2% Yes
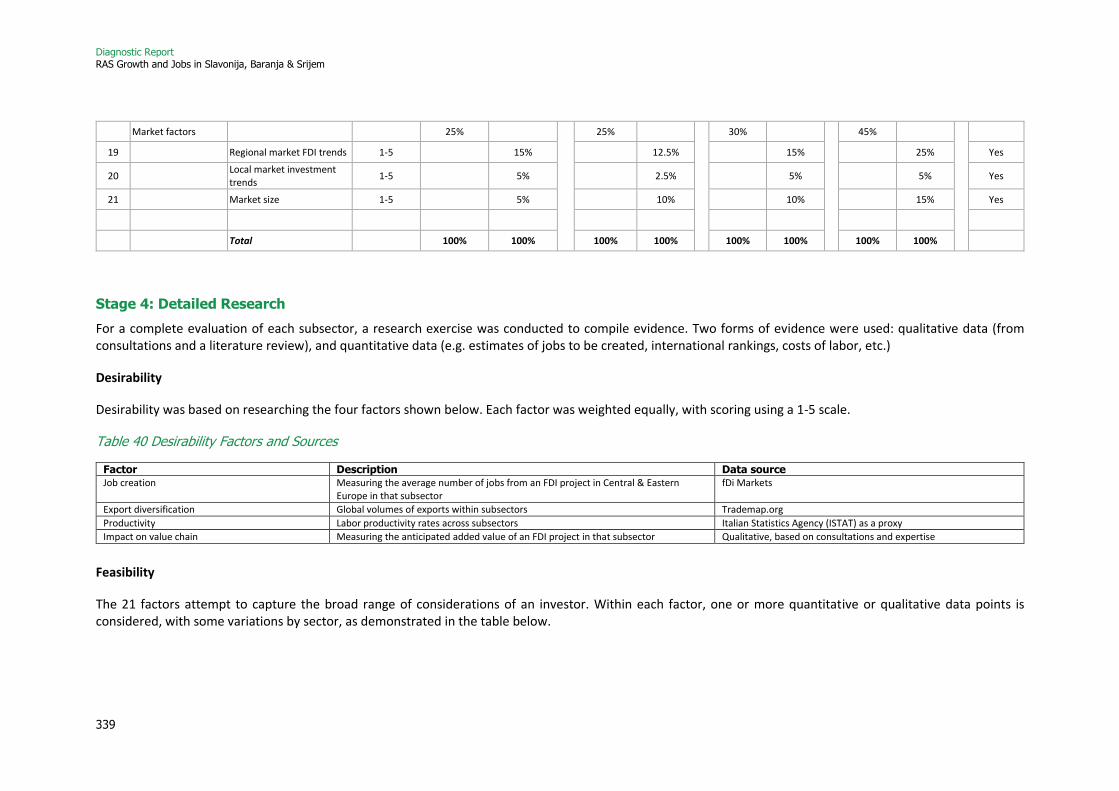
Diagnostic Report RAS Growth and Jobs in Slavonija, Baranja & Srijem
339
Market factors 25% 25% 30% 45%
19 Regional market FDI trends 1-5 15% 12.5% 15% 25% Yes
20 Local market investment trends
1-5 5% 2.5% 5% 5% Yes
21 Market size 1-5 5% 10% 10% 15% Yes
Total 100% 100% 100% 100% 100% 100% 100% 100%
Stage 4: Detailed Research
For a complete evaluation of each subsector, a research exercise was conducted to compile evidence. Two forms of evidence were used: qualitative data (from consultations and a literature review), and quantitative data (e.g. estimates of jobs to be created, international rankings, costs of labor, etc.)
Desirability
Desirability was based on researching the four factors shown below. Each factor was weighted equally, with scoring using a 1-5 scale.
Table 40 Desirability Factors and Sources
Factor Description Data source Job creation Measuring the average number of jobs from an FDI project in Central & Eastern
Europe in that subsector fDi Markets
Export diversification Global volumes of exports within subsectors Trademap.org
Productivity Labor productivity rates across subsectors Italian Statistics Agency (ISTAT) as a proxy
Impact on value chain Measuring the anticipated added value of an FDI project in that subsector Qualitative, based on consultations and expertise
Feasibility
The 21 factors attempt to capture the broad range of considerations of an investor. Within each factor, one or more quantitative or qualitative data points is considered, with some variations by sector, as demonstrated in the table below.
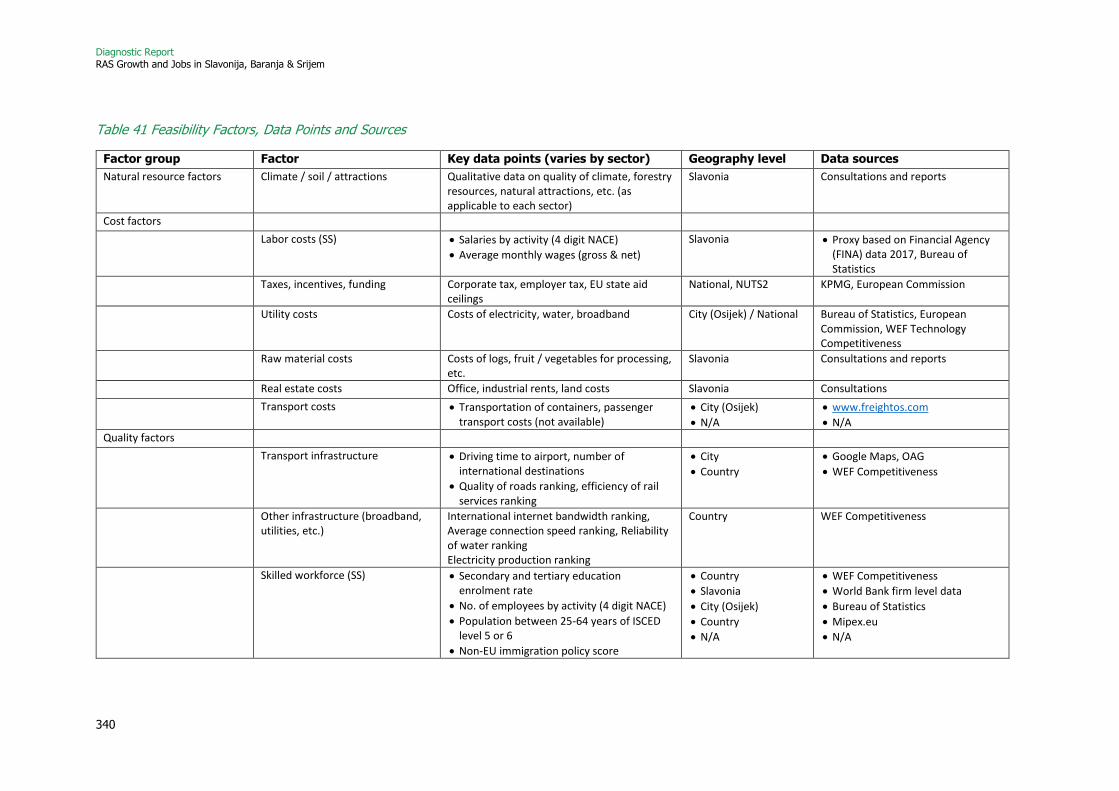
Diagnostic Report RAS Growth and Jobs in Slavonija, Baranja & Srijem
340
Table 41 Feasibility Factors, Data Points and Sources
Factor group Factor Key data points (varies by sector) Geography level Data sources
Natural resource factors Climate / soil / attractions Qualitative data on quality of climate, forestry resources, natural attractions, etc. (as applicable to each sector)
Slavonia Consultations and reports
Cost factors
Labor costs (SS) • Salaries by activity (4 digit NACE)
• Average monthly wages (gross & net)
Slavonia • Proxy based on Financial Agency (FINA) data 2017, Bureau of Statistics
Taxes, incentives, funding Corporate tax, employer tax, EU state aid ceilings
National, NUTS2 KPMG, European Commission
Utility costs Costs of electricity, water, broadband City (Osijek) / National Bureau of Statistics, European
Commission, WEF Technology Competitiveness
Raw material costs Costs of logs, fruit / vegetables for processing, etc.
Slavonia Consultations and reports
Real estate costs Office, industrial rents, land costs Slavonia Consultations
Transport costs • Transportation of containers, passenger
transport costs (not available) • City (Osijek)
• N/A
• www.freightos.com
• N/A
Quality factors
Transport infrastructure • Driving time to airport, number of international destinations
• Quality of roads ranking, efficiency of rail services ranking
• City
• Country
• Google Maps, OAG
• WEF Competitiveness
Other infrastructure (broadband, utilities, etc.)
International internet bandwidth ranking, Average connection speed ranking, Reliability of water ranking Electricity production ranking
Country WEF Competitiveness
Skilled workforce (SS) • Secondary and tertiary education
enrolment rate
• No. of employees by activity (4 digit NACE)
• Population between 25-64 years of ISCED level 5 or 6
• Non-EU immigration policy score
• Country
• Slavonia
• City (Osijek)
• Country
• N/A
• WEF Competitiveness
• World Bank firm level data
• Bureau of Statistics
• Mipex.eu
• N/A
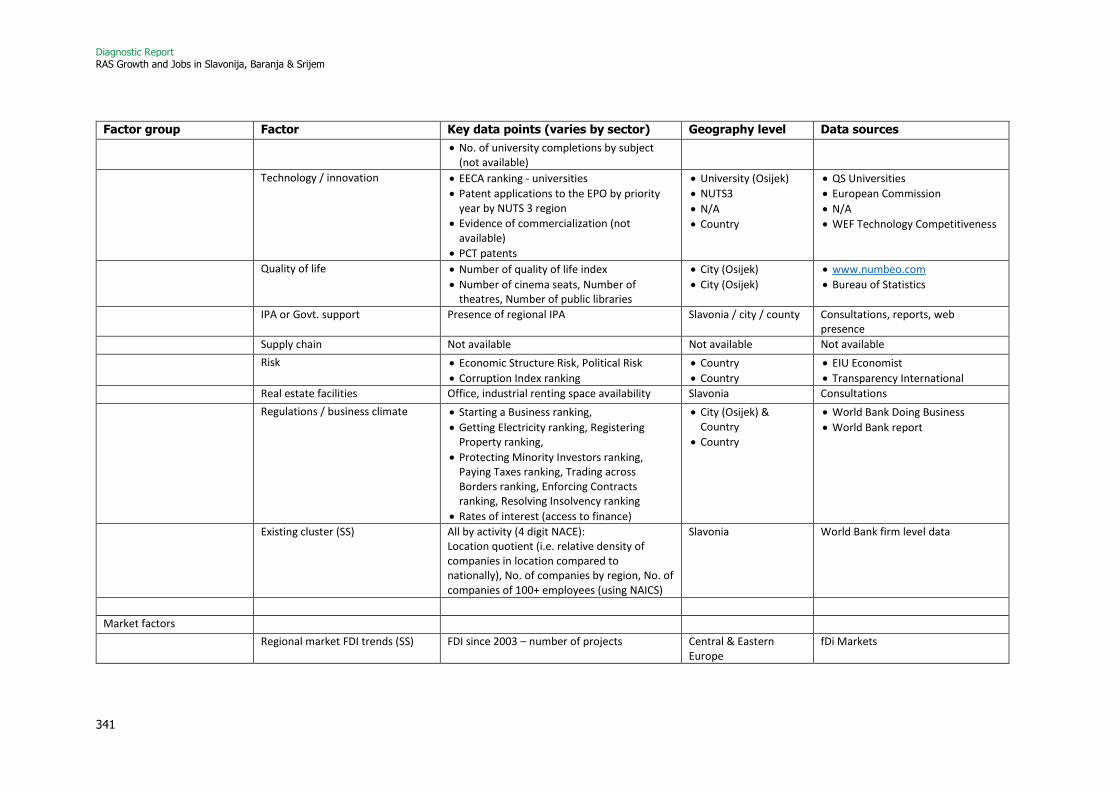
Diagnostic Report RAS Growth and Jobs in Slavonija, Baranja & Srijem
341
Factor group Factor Key data points (varies by sector) Geography level Data sources
• No. of university completions by subject (not available)
Technology / innovation • EECA ranking - universities
• Patent applications to the EPO by priority year by NUTS 3 region
• Evidence of commercialization (not available)
• PCT patents
• University (Osijek)
• NUTS3
• N/A
• Country
• QS Universities
• European Commission
• N/A
• WEF Technology Competitiveness
Quality of life • Number of quality of life index
• Number of cinema seats, Number of theatres, Number of public libraries
• City (Osijek)
• City (Osijek)
• www.numbeo.com
• Bureau of Statistics
IPA or Govt. support Presence of regional IPA Slavonia / city / county Consultations, reports, web
presence Supply chain Not available Not available Not available
Risk • Economic Structure Risk, Political Risk
• Corruption Index ranking
• Country
• Country
• EIU Economist
• Transparency International Real estate facilities Office, industrial renting space availability Slavonia Consultations
Regulations / business climate • Starting a Business ranking,
• Getting Electricity ranking, Registering Property ranking,
• Protecting Minority Investors ranking, Paying Taxes ranking, Trading across Borders ranking, Enforcing Contracts ranking, Resolving Insolvency ranking
• Rates of interest (access to finance)
• City (Osijek) & Country
• Country
• World Bank Doing Business
• World Bank report
Existing cluster (SS) All by activity (4 digit NACE):
Location quotient (i.e. relative density of companies in location compared to nationally), No. of companies by region, No. of companies of 100+ employees (using NAICS)
Slavonia World Bank firm level data
Market factors
Regional market FDI trends (SS) FDI since 2003 – number of projects Central & Eastern Europe
fDi Markets
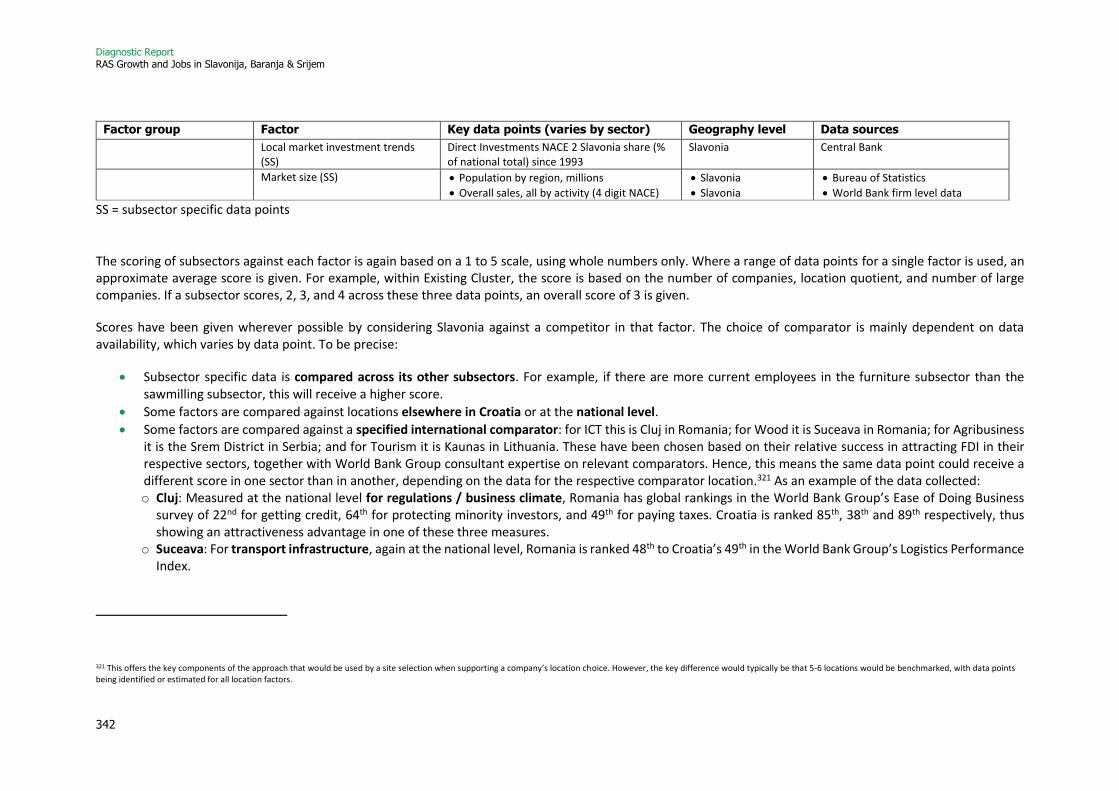
Diagnostic Report RAS Growth and Jobs in Slavonija, Baranja & Srijem
342
Factor group Factor Key data points (varies by sector) Geography level Data sources
Local market investment trends (SS)
Direct Investments NACE 2 Slavonia share (% of national total) since 1993
Slavonia Central Bank
Market size (SS) • Population by region, millions
• Overall sales, all by activity (4 digit NACE)
• Slavonia
• Slavonia
• Bureau of Statistics
• World Bank firm level data
SS = subsector specific data points
The scoring of subsectors against each factor is again based on a 1 to 5 scale, using whole numbers only. Where a range of data points for a single factor is used, an approximate average score is given. For example, within Existing Cluster, the score is based on the number of companies, location quotient, and number of large companies. If a subsector scores, 2, 3, and 4 across these three data points, an overall score of 3 is given.
Scores have been given wherever possible by considering Slavonia against a competitor in that factor. The choice of comparator is mainly dependent on data availability, which varies by data point. To be precise:
• Subsector specific data is compared across its other subsectors. For example, if there are more current employees in the furniture subsector than the sawmilling subsector, this will receive a higher score.
• Some factors are compared against locations elsewhere in Croatia or at the national level.
• Some factors are compared against a specified international comparator: for ICT this is Cluj in Romania; for Wood it is Suceava in Romania; for Agribusiness it is the Srem District in Serbia; and for Tourism it is Kaunas in Lithuania. These have been chosen based on their relative success in attracting FDI in their respective sectors, together with World Bank Group consultant expertise on relevant comparators. Hence, this means the same data point could receive a different score in one sector than in another, depending on the data for the respective comparator location.321 As an example of the data collected: o Cluj: Measured at the national level for regulations / business climate, Romania has global rankings in the World Bank Group’s Ease of Doing Business
survey of 22nd for getting credit, 64th for protecting minority investors, and 49th for paying taxes. Croatia is ranked 85th, 38th and 89th respectively, thus showing an attractiveness advantage in one of these three measures.
o Suceava: For transport infrastructure, again at the national level, Romania is ranked 48th to Croatia’s 49th in the World Bank Group’s Logistics Performance Index.
321 This offers the key components of the approach that would be used by a site selection when supporting a company’s location choice. However, the key difference would typically be that 5-6 locations would be benchmarked, with data points being identified or estimated for all location factors.

Diagnostic Report RAS Growth and Jobs in Slavonija, Baranja & Srijem
343
o Srem District: In other infrastructure, we found at the national level that Croatia’s reliability of water global ranking is 28th, compared to Serbia’s 54th, based on the World Economic Forum Competitiveness Report.
o Kaunas: Again in transport infrastructure, Kaunas’ international airport is 22 minutes’ drive away, serving 9 international cities. In contrast, Osijek’s airport is only 15 minutes away, but with just 1 international destination (based on searching a single day in November 2018).

Diagnostic Report RAS Growth and Jobs in Slavonija, Baranja & Srijem
344
Stage 5 – Scores & Recommendations
In Stage 5, overall scores across subsectors were compiled, and recommendations developed. The content below provides brief explanations of why each subsector receives its respective score, together with tables of overall scores.
ICT Sector
Full tables of metrics scores are provided below for ICT subsectors where a full analysis was undertaken.
On the desirability side, the scores show very little variation, which demonstrates that all ICT subsectors can be seen as relatively high value overall. Outside of value-add, there are minor differences in terms of average job creation and productivity.
On the feasibility side, all scores for costs are the same. The only potential difference would be in labor costs (i.e. there would no variation for real estate, etc.) However, for all subsectors, there is a clear saving compared to Zagreb. Hence, the intention is not to provide scores comparing each subsector in absolute terms but the costs of each relative to a competitor. Differences in quality factors are driven by the size of the existing skilled workforce, and to a lesser extent by the existing industry cluster. Hence, those subsectors where Osijek already has a strong track record score highly. In terms of market factors, software publishing scores highly, driven by the number of FDI projects that exist in the market which Slavonia could target. However, custom computer services scores higher overall, as it also has a large pool of potential projects, combined with evidence of significant sales already made by Slavonian companies.
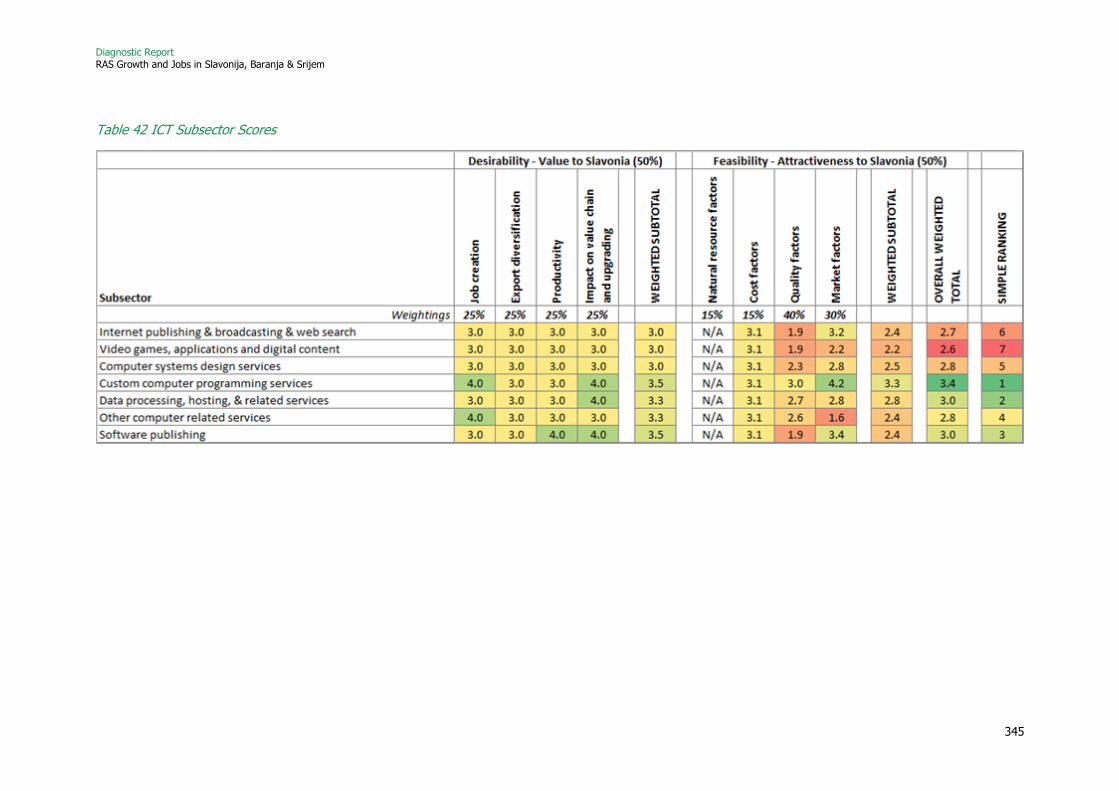
Diagnostic Report RAS Growth and Jobs in Slavonija, Baranja & Srijem
345
Table 42 ICT Subsector Scores
Diagnostic Report RAS Growth and Jobs in Slavonija, Baranja & Srijem
346
Wood Sector
Full tables of metrics scores are provided below for wood subsectors where a full analysis was undertaken.
On the desirability side, there is a clear variation between certain subsectors. Higher-value furniture manufacturing also comes with more significant job creation but is less export intensive compared to sawmilling. Overall, any activity that moves Slavonia up the value chain here would be seen as desirable.
For feasibility, each subsector scores highly in terms of natural resources (i.e. the quality of hardwood). As with ICT above, there are no real differences in cost factors across subsectors, as each is equally competitive compared to its peers. Quality factors also have quite limited differences, but the number of existing employees in furniture is higher than other subsectors, which is an important differentiator. However, it is the market factors where there are clear differences: firstly in terms of the number of available projects in which Slavonia would be able to compete, and secondly the value of sales of Slavonian firms already taking place.
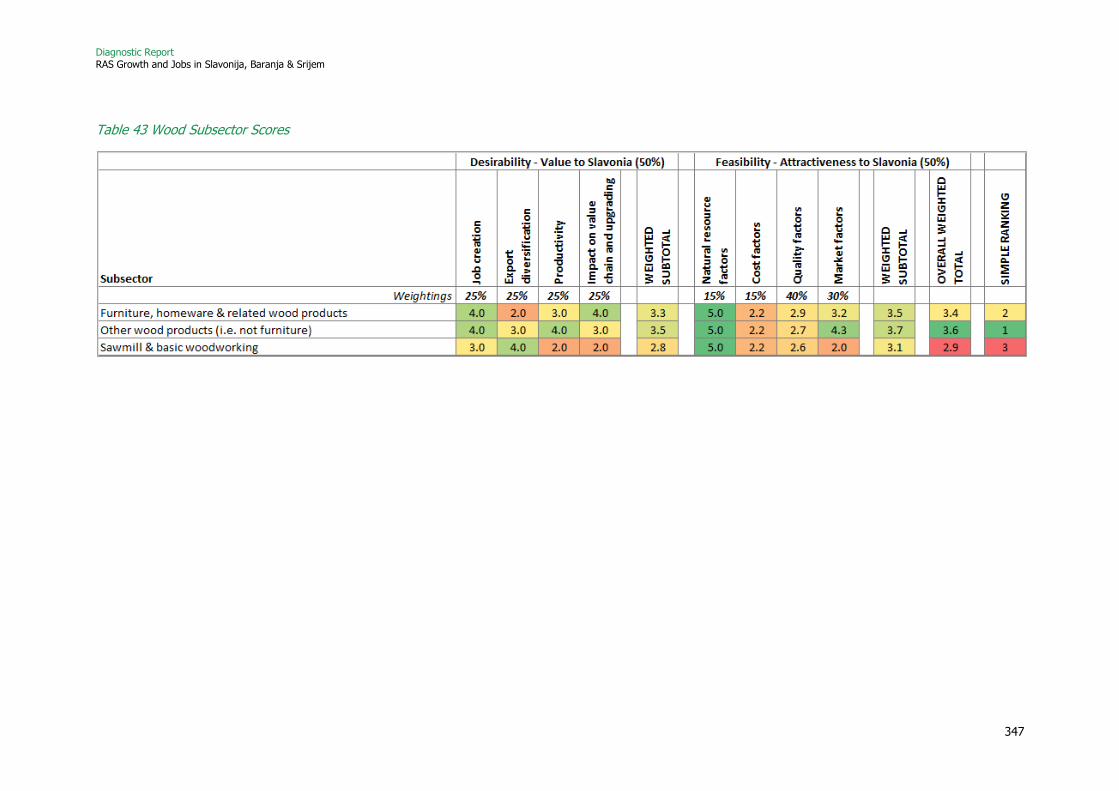
Diagnostic Report RAS Growth and Jobs in Slavonija, Baranja & Srijem
347
Table 43 Wood Subsector Scores
Diagnostic Report RAS Growth and Jobs in Slavonija, Baranja & Srijem
348
Agribusiness Sector
Full tables of metrics scores are provided below for the Agribusiness subsectors where a full analysis was undertaken.
For desirability, there is quite a significant variation in terms of job creation, with three subsectors particularly creating a high number of jobs on average. Export diversification and productivity are seen to be relatively similar according to the available data. Added value is then skewed towards processing activities, which means Slavonia’s main staples, oilseed and grains, have a low score by this measure.
In terms of feasibility, again high natural resource scores are given across all subsectors. Costs factors are largely similar, and low scores are due to the data suggesting labor costs are less competitive in these areas. Quality factor scores are relatively weak across subsectors, but the key differences are driven by existing available skills. Hence, the higher value-added processing activities generally do not score as highly here. However, the market factors show more variation: FDI at the European level is strong in fruit and vegetable processing, while it is the production sectors where there is strong evidence of actual investment in Slavonia. In terms of existing market size, as would be expected, oilseed and grains score highest.
While the matrix above was developed to identify ‘ready to go’ and aspirational subsectors, it is important to recognize that scores are quite similar, particularly on the feasibility side. This demonstrates that in reality, there is relatively little processing taking place. Hence, there is little to suggest certain subsectors have much more competitive offers than others.
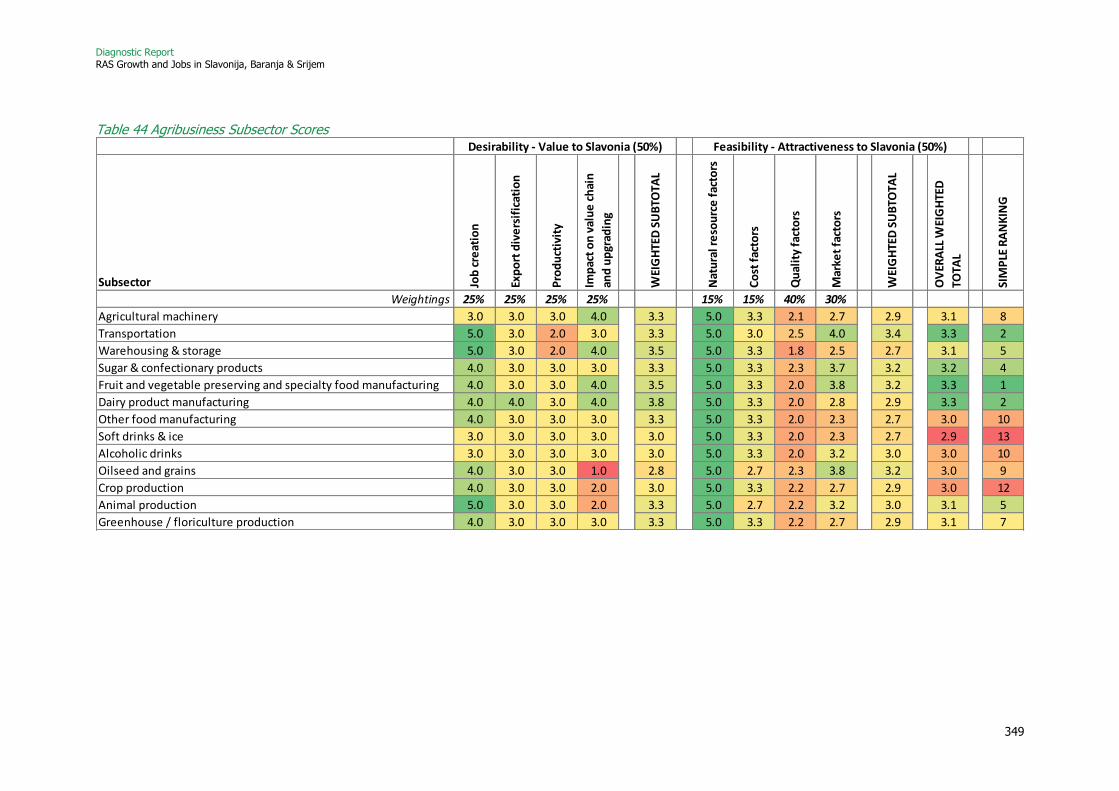
Diagnostic Report RAS Growth and Jobs in Slavonija, Baranja & Srijem
349
Table 44 Agribusiness Subsector Scores
Subsector Job
cre
atio
n
Exp
ort
div
ers
ific
atio
n
Pro
du
ctiv
ity
Imp
act
on
val
ue
ch
ain
and
up
grad
ing
WEI
GH
TED
SU
BTO
TAL
Nat
ura
l re
sou
rce
fac
tors
Co
st f
acto
rs
Qu
alit
y fa
cto
rs
Mar
ket
fact
ors
WEI
GH
TED
SU
BTO
TAL
OV
ERA
LL W
EIG
HTE
D
TOTA
L
SIM
PLE
RA
NK
ING
Weightings 25% 25% 25% 25% 15% 15% 40% 30%
Agricultural machinery 3.0 3.0 3.0 4.0 3.3 5.0 3.3 2.1 2.7 2.9 3.1 8
Transportation 5.0 3.0 2.0 3.0 3.3 5.0 3.0 2.5 4.0 3.4 3.3 2
Warehousing & storage 5.0 3.0 2.0 4.0 3.5 5.0 3.3 1.8 2.5 2.7 3.1 5
Sugar & confectionary products 4.0 3.0 3.0 3.0 3.3 5.0 3.3 2.3 3.7 3.2 3.2 4
Fruit and vegetable preserving and specialty food manufacturing 4.0 3.0 3.0 4.0 3.5 5.0 3.3 2.0 3.8 3.2 3.3 1
Dairy product manufacturing 4.0 4.0 3.0 4.0 3.8 5.0 3.3 2.0 2.8 2.9 3.3 2
Other food manufacturing 4.0 3.0 3.0 3.0 3.3 5.0 3.3 2.0 2.3 2.7 3.0 10
Soft drinks & ice 3.0 3.0 3.0 3.0 3.0 5.0 3.3 2.0 2.3 2.7 2.9 13
Alcoholic drinks 3.0 3.0 3.0 3.0 3.0 5.0 3.3 2.0 3.2 3.0 3.0 10
Oilseed and grains 4.0 3.0 3.0 1.0 2.8 5.0 2.7 2.3 3.8 3.2 3.0 9
Crop production 4.0 3.0 3.0 2.0 3.0 5.0 3.3 2.2 2.7 2.9 3.0 12
Animal production 5.0 3.0 3.0 2.0 3.3 5.0 2.7 2.2 3.2 3.0 3.1 5
Greenhouse / floriculture production 4.0 3.0 3.0 3.0 3.3 5.0 3.3 2.2 2.7 2.9 3.1 7
Desirability - Value to Slavonia (50%) Feasibility - Attractiveness to Slavonia (50%)
Diagnostic Report RAS Growth and Jobs in Slavonija, Baranja & Srijem
350
Tourism Sector
Full tables of metrics scores are provided below for the tourism subsectors where a full analysis was undertaken.
On the desirability side, there is quite significant variation within tourism subsectors. In terms of job creation, hotels are the most significant, although performing arts are also high (because an FDI project here would typically be quite large). Export levels are difficult to predict with available data, and productivity is quite low in many subsectors, which reflects the fact that many roles are relatively lower skilled.
For feasibility, natural resources are based on climate, and all subsectors score the same. Cost factors are also largely similar, with a slight variation due to labor rates relative to national rates. Quality factors are also mainly consistent across subsectors, where differences in scores are driven by numbers of existing employees, which is where road transport scores relatively highly. Market factors are again a key differentiator, and this shows the dominance of hotels as the main subsector for tourism investment. Other sectors, including types of attraction, represent in comparison a relatively small number of investments each year.

Diagnostic Report RAS Growth and Jobs in Slavonija, Baranja & Srijem
351
Table 45 Tourism Subsector Scores
Subsector Job
cre
atio
n
Exp
ort
div
ers
ific
atio
n
Pro
du
ctiv
ity
Imp
act
on
val
ue
ch
ain
and
up
grad
ing
WEI
GH
TED
SU
BTO
TAL
Nat
ura
l re
sou
rce
fac
tors
Co
st f
acto
rs
Qu
alit
y fa
cto
rs
Mar
ket
fact
ors
WEI
GH
TED
SU
BTO
TAL
OV
ERA
LL W
EIG
HTE
D
TOTA
L
SIM
PLE
RA
NK
ING
Weightings 25% 25% 25% 25% 15% 15% 40% 30%
Hotels 5.0 4.0 2.0 2.0 3.3 3.0 3.0 2.4 4.2 3.4 3.3 1
Bookings / reservations 1.0 3.0 3.0 4.0 2.8 3.0 3.0 2.0 2.4 2.5 2.6 6
Other supporting services / suppliers 3.0 2.0 3.0 3.0 2.8 3.0 3.0 2.6 2.3 2.6 2.7 5
Tour operators and holiday representatives 1.0 3.0 3.0 2.0 2.3 3.0 3.0 2.1 1.0 1.9 2.1 11
Air 4.0 4.0 2.0 3.0 3.3 3.0 3.0 2.0 3.3 2.9 3.1 3
Rail 2.0 2.0 2.0 1.0 1.8 3.0 3.0 2.0 2.8 2.6 2.2 10
Road 1.0 3.0 2.0 2.0 2.0 3.0 3.0 2.8 3.0 2.9 2.5 7
Performing arts, spectator sports, & related 5.0 2.0 5.0 4.0 4.0 3.0 2.5 2.3 2.8 2.6 3.3 2
Other amusement & recreation industries 3.0 3.0 5.0 3.0 3.5 3.0 3.0 2.1 1.7 2.2 2.8 4
Museums, historical sites, & similar 3.0 3.0 3.0 3.0 3.0 3.0 2.5 2.0 1.0 1.8 2.4 8
Natural attractions 3.0 3.0 2.0 4.0 3.0 3.0 2.5 2.0 1.0 1.8 2.4 8
Desirability - Value to Slavonia (50%) Feasibility - Attractiveness to Slavonia (50%)
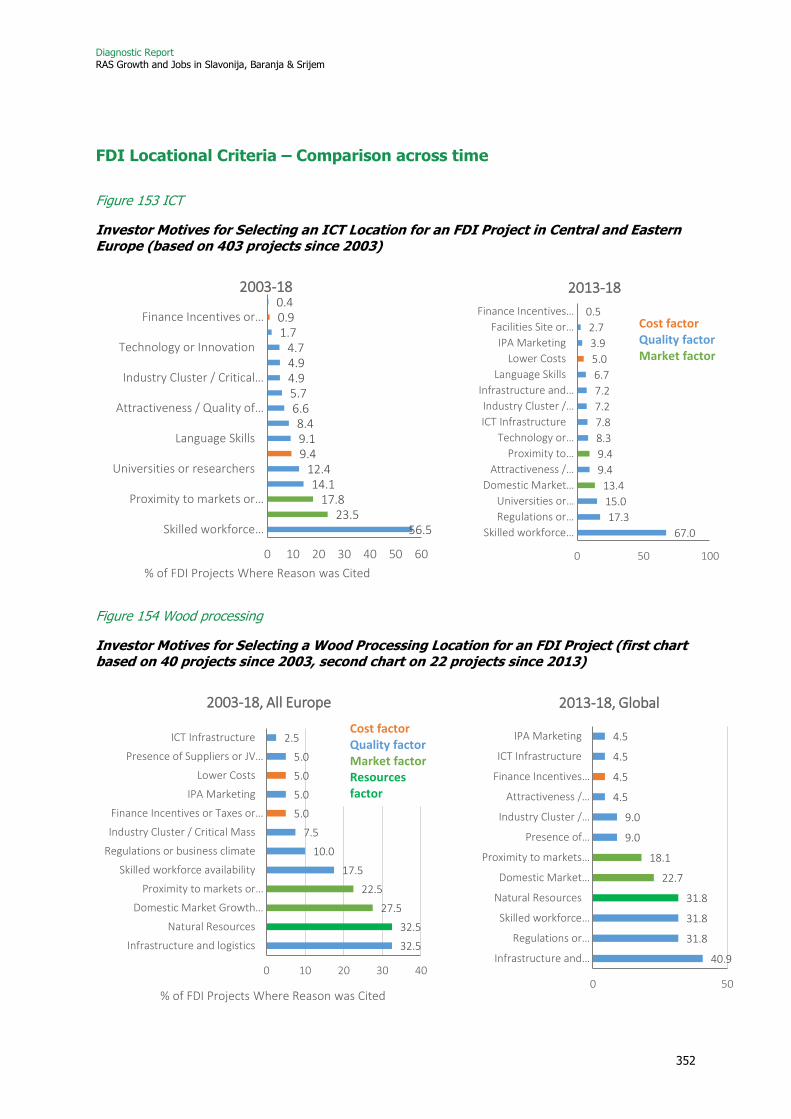
Diagnostic Report RAS Growth and Jobs in Slavonija, Baranja & Srijem
352
FDI Locational Criteria – Comparison across time
Figure 153 ICT
Investor Motives for Selecting an ICT Location for an FDI Project in Central and Eastern Europe (based on 403 projects since 2003)
Figure 154 Wood processing
Investor Motives for Selecting a Wood Processing Location for an FDI Project (first chart based on 40 projects since 2003, second chart on 22 projects since 2013)
56.523.5
17.814.1
12.49.49.18.4
6.65.74.94.94.7
1.70.90.4
0 10 20 30 40 50 60
Skilled workforce…
Proximity to markets or…
Universities or researchers
Language Skills
Attractiveness / Quality of…
Industry Cluster / Critical…
Technology or Innovation
Finance Incentives or…
% of FDI Projects Where Reason was Cited
2003-18
32.5
32.5
27.5
22.5
17.5
10.0
7.5
5.0
5.0
5.0
5.0
2.5
0 10 20 30 40
Infrastructure and logistics
Natural Resources
Domestic Market Growth…
Proximity to markets or…
Skilled workforce availability
Regulations or business climate
Industry Cluster / Critical Mass
Finance Incentives or Taxes or…
IPA Marketing
Lower Costs
Presence of Suppliers or JV…
ICT Infrastructure
% of FDI Projects Where Reason was Cited
2003-18, All Europe
Cost factor Quality factor Market factor
Cost factor Quality factor Market factor
67.0
17.3
15.0
13.4
9.4
9.4
8.3
7.8
7.2
7.2
6.7
5.0
3.9
2.7
0.5
0 50 100
Skilled workforce…
Regulations or…
Universities or…
Domestic Market…
Attractiveness /…
Proximity to…
Technology or…
ICT Infrastructure
Industry Cluster /…
Infrastructure and…
Language Skills
Lower Costs
IPA Marketing
Facilities Site or…
Finance Incentives…
2013-18
Cost factor Quality factor Market factor
Cost factor Quality factor Market factor Resources factor
40.9
31.8
31.8
31.8
22.7
18.1
9.0
9.0
4.5
4.5
4.5
4.5
0 50
Infrastructure and…
Regulations or…
Skilled workforce…
Natural Resources
Domestic Market…
Proximity to markets…
Presence of…
Industry Cluster /…
Attractiveness /…
Finance Incentives…
ICT Infrastructure
IPA Marketing
2013-18, Global
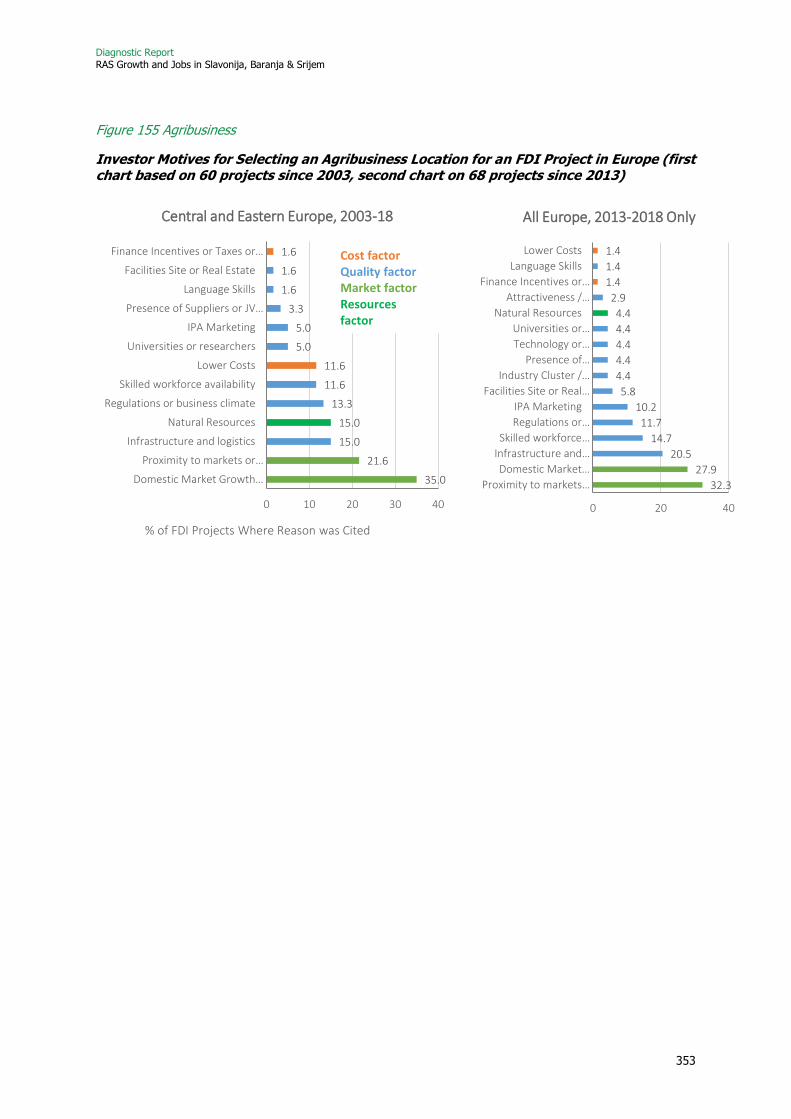
Diagnostic Report RAS Growth and Jobs in Slavonija, Baranja & Srijem
353
Figure 155 Agribusiness
Investor Motives for Selecting an Agribusiness Location for an FDI Project in Europe (first chart based on 60 projects since 2003, second chart on 68 projects since 2013)
35.0
21.6
15.0
15.0
13.3
11.6
11.6
5.0
5.0
3.3
1.6
1.6
1.6
0 10 20 30 40
Domestic Market Growth…
Proximity to markets or…
Infrastructure and logistics
Natural Resources
Regulations or business climate
Skilled workforce availability
Lower Costs
Universities or researchers
IPA Marketing
Presence of Suppliers or JV…
Language Skills
Facilities Site or Real Estate
Finance Incentives or Taxes or…
% of FDI Projects Where Reason was Cited
Central and Eastern Europe, 2003-18
Cost factor Quality factor Market factor Resources factor
32.3
27.9
20.5
14.7
11.7
10.2
5.8
4.4
4.4
4.4
4.4
4.4
2.9
1.4
1.4
1.4
0 20 40
Proximity to markets…
Domestic Market…
Infrastructure and…
Skilled workforce…
Regulations or…
IPA Marketing
Facilities Site or Real…
Industry Cluster /…
Presence of…
Technology or…
Universities or…
Natural Resources
Attractiveness /…
Finance Incentives or…
Language Skills
Lower Costs
All Europe, 2013-2018 Only

Diagnostic Report RAS Growth and Jobs in Slavonija, Baranja & Srijem
354
Figure 156 Tourism
Investor Motives for Selecting a Tourism Location for an FDI Project in Europe (first chart based on 52 projects since 2003, second chart on 94 projects since 2013)
Selling and locating the opportunities from the Sector Scan Results
ICT
Selling the ICT Opportunity
It is not recommended to target the ICT sector in terms of the NACE subsector definitions used here. These labels are not well understood, so is important to discuss relevant activities and have an overall value proposition for them, albeit with some specific sales messages. Thus, the value proposition would be focused on:
Osijek (not Slavonia in this case) as a central European Center of Excellence for ICT support services, covering software as a service, infrastructure as a service, and software development services. Key points include:
• A continuous pipeline of 1,000 STEM graduates from the University of Osijek’s ICT courses, developed and delivered in conjunction with existing ICT firms in the city.322
• 75% of all staff in Osijek’s ICT firms have a university degree.323
• A track record as a home for major ICT firms – IBM and Ericsson Nikola Tesla have service centers here employing more than 100 people.324
• A thriving and dynamic ecosystem, led by Osijek Software City’s network of more than 50 firms.
322 Osijek Software City, from World Bank Presentation document, February 2018. 323 Ibid. 324 Employee numbers are an estimate based on WBG interviews.
65.3
30.7
19.2
17.3
9.6
7.6
5.7
3.8
3.8
1.9
1.9
1.9
0 20 40 60 80
Domestic Market Growth…
Proximity to markets or…
Infrastructure and logistics
Skilled workforce availability
Regulations or business climate
ICT Infrastructure
Lower Costs
Attractiveness / Quality of Life
Language Skills
Finance Incentives or Taxes…
Presence of Suppliers or JV…
IPA Marketing
% of FDI Projects Where Reason was Cited
Central and Eastern Europe, 2003-18
Cost factor Quality factor Market factor
44.6
38.2
11.7
8.5
8.5
7.4
6.3
5.3
3.1
2.1
1.0
0 50
Domestic Market…
Proximity to markets or…
Skilled workforce…
Infrastructure and…
Attractiveness / Quality…
IPA Marketing
Regulations or business…
Industry Cluster /…
Language Skills
ICT Infrastructure
Facilities Site or Real…
All Europe, 2013-2018 Only
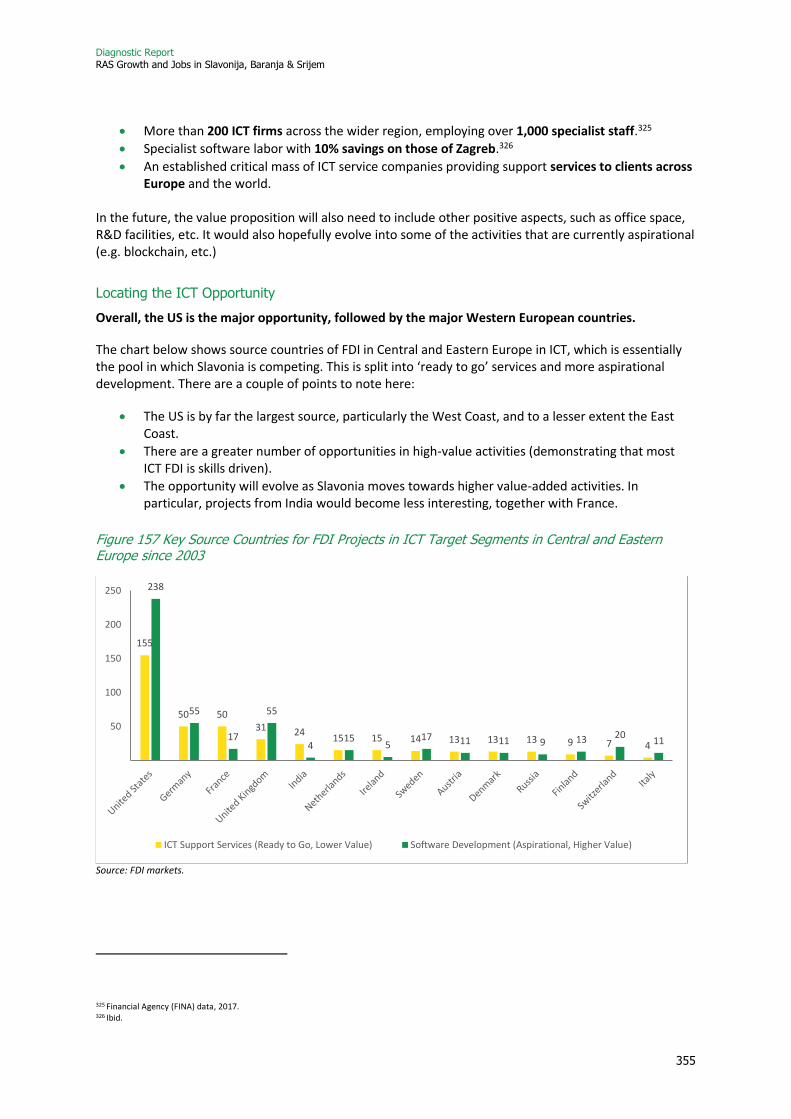
Diagnostic Report RAS Growth and Jobs in Slavonija, Baranja & Srijem
355
• More than 200 ICT firms across the wider region, employing over 1,000 specialist staff.325
• Specialist software labor with 10% savings on those of Zagreb.326
• An established critical mass of ICT service companies providing support services to clients across Europe and the world.
In the future, the value proposition will also need to include other positive aspects, such as office space, R&D facilities, etc. It would also hopefully evolve into some of the activities that are currently aspirational (e.g. blockchain, etc.)
Locating the ICT Opportunity
Overall, the US is the major opportunity, followed by the major Western European countries.
The chart below shows source countries of FDI in Central and Eastern Europe in ICT, which is essentially the pool in which Slavonia is competing. This is split into ‘ready to go’ services and more aspirational development. There are a couple of points to note here:
• The US is by far the largest source, particularly the West Coast, and to a lesser extent the East Coast.
• There are a greater number of opportunities in high-value activities (demonstrating that most ICT FDI is skills driven).
• The opportunity will evolve as Slavonia moves towards higher value-added activities. In particular, projects from India would become less interesting, together with France.
Figure 157 Key Source Countries for FDI Projects in ICT Target Segments in Central and Eastern Europe since 2003
Source: FDI markets.
325 Financial Agency (FINA) data, 2017. 326 Ibid.
155
50 5031 24
15 15 14 13 13 13 9 7 4
238
55
17
55
415
517 11 11 9 13 20
11
50
100
150
200
250
ICT Support Services (Ready to Go, Lower Value) Software Development (Aspirational, Higher Value)
Diagnostic Report RAS Growth and Jobs in Slavonija, Baranja & Srijem
356
In terms of targeting potential companies, it is important to note that IBM is the leading investor in terms of project numbers that Slavonia has already attracted. On the support services side, others include CapGemini (France), Accenture (Ireland / US), Endava (UK), Atos (France), CloudFlare (USA), and GTS Telecom (Germany). In the higher-value publishing segment, some of the same companies like IBM will be present, together with firms such as Oracle (USA), Microsoft (USA), and SAP (Germany). However, as with all targeting, a specific opportunity for a company needs to be identified and an understanding of how the Slavonian offer can match this. This may or may not mean the specific companies above are suitable candidates.
Wood
Selling the Wood Opportunity
Subject to the reforms described below, like ICT, the wood sector value proposition would need to be described as one overall set of sales messages rather than trying to differentiate between the two sectors (although this is all subject to moving the two subsectors into the ‘ready to go’ quadrant). The proposition would be described as:
The heart of Europe’s wood processing industry, combining quality raw materials, and high-quality manufacturing.
Key points include:
• The highest quality sustainable and accessible hardwood forests in all of Europe - approximately 2.6 million hectares of land in Croatia are forested.327
• Leading high-end furniture manufacturing from respected names such as Spačva and Spin Valis.
• An established wood ecosystem, including clusters such as Slavonian Oak in Vinkovci, Viridis in Virovitica, and Valis EU in Požega.
• Research and commercialization hand in hand: the Wood Competence Center and the University of Osijek are working together with wood industries.
• An integrated wood value chain covering manufacturing, logging, extraction, transport infrastructure and silviculture.
• A key part of Croatia’s almost USD 1 billion wood export business.328
• Sustainable opportunities, demonstrated by 10+ large wood manufacturers (i.e. employing 100+ staff).329
• A gateway to exporting to both EU markets and those of Eastern Europe, with access to a modern road network for easy transportation.
• Over 200 wood companies, employing more than 5,000 staff.330
Locating the Wood Opportunity
Given the global structure of the industry, which is represented by fewer large players, targeting in this sector is less likely to be on a geographical basis, and instead in terms of specific companies. One of the most significant investors such as Holzindustrie Schweighofer (Austria) produce a range of products at both the high and lower ends in terms of value added, while smaller investors such as Calligaris (Italy)
327 Ibid. 328 Trademap.org. 329 Financial Agency (FINA) data, 2017. 330 Ibid.

Diagnostic Report RAS Growth and Jobs in Slavonija, Baranja & Srijem
357
have fewer projects, but are more focused at the high end (which includes an existing site in Western Croatia).
For comprehensiveness, the chart below shows source countries of FDI in Central and Eastern Europe, combining the two wood aspirational subsectors in wood. As previously discussed, this is a much smaller sector opportunity than in ICT, and the leading target locations are very different. While Sweden leads here, this is largely Ikea (specifically, Swedwood) and, as discussed elsewhere, this will be flat pack furniture, of which the firm already has various manufacturing sites in the region, and is not the higher value that would be aspired to. Other opportunities come from across Europe.
Figure 158 Key Source Countries for FDI Projects in Wood Target Segments in Central and Eastern Europe since 2003
Source: FDI markets.
Agribusiness
Selling the Agribusiness Opportunity
The agribusiness sector would have some overall key sales messages but with certain specifics relevant to the three cited subsectors above. An overall tagline could be:
Croatia’s food basket, producing a range of fresh foods for quality processing, storage and distribution. Key points include:
General
• Agriculture accounts for 13.5% of GDP (compared to 2% to 9% in other regions of Croatia), and 33% of manufacturing in Eastern Croatia involves food and beverages.331
• A region favored by rich croplands, together with an ideal climate for food production and subsequent high-value processing.
• A number of private food certification bodies, including Cluster Slavonka for plum products, Cluster Roj for beekeeping, and Graševina Croatica for wine.
• Quality education, including an agriculture high school in Slavonski Brod, while Požega’s polytechnic has a strong program in agriculture and food technology.
331 World Bank Concept Note, RAS Growth and Jobs in Eastern Croatia, July 2018. Concept Note.
31
23 22
14 14 13 12
6
5
10
15
20
25
30
35

Diagnostic Report RAS Growth and Jobs in Slavonija, Baranja & Srijem
358
• At least 9 certified private laboratories operating in Croatia, such as the Faculty of Food & Biotechnology at the University of Zagreb.332
Fruit and vegetable processing
• Sustainable opportunities demonstrated by 26 existing fruit and vegetable manufacturers.333
• Low costs of water and electricity to support both food production and processing.334
• Mass volumes of cereal production, but recent growth in other crops such as sugar beet and potatoes, ideal for use in functional, convenience, and indulgence foods.
Warehousing and storage
• A gateway to exporting to both EU markets and those of Eastern Europe, with access to a modern road network for easy transportation.
• An integrated agribusiness value chain, but with scope for entrants delivering modern cold storage methods, plus bottling and packaging.
Locating the Agribusiness Opportunity
As with wood, fruit and vegetable processing would be a better target on a specific company basis, targeting those such as AB Foods (UK), Dr Oetker (Germany), and Unilever (UK / Netherlands).
The charts below show the opportunity in the ‘ready to go’ and aspirational target segments. In terms of fruit and vegetable processing (note this does not include specialist ingredients, etc.), there is no country with any clear opportunity over another.
Dairy manufacturing is located largely around France, Germany, Netherlands and Greece, although project numbers themselves are still not so high as to have clear indications. A key investor is Meggle, which is already in Slavonia. Therefore, aftercare activities are important to support this investment. Other potential firms include Danone (France), Tyras (Greece), and FrieslandCampina (Netherlands).
The warehousing and transportation sector is focused around Germany, although some of these projects would not be food specific. Many of these investments come from the Schwarz Group in the form of Lidl and Kaufland. Others include Metro and Rewe.
332 World Bank, Assessment of the Global Value Chain (GVC) in Croatia: Sustainable Food Production and Processing. Croatia Competitiveness Reinforcement Initiative, November 2016. 333 Financial Agency (FINA) data, 2017. 334 National data has been used in this sector scan analysis, but specific local data should be used here. However, considering that climate change is a factor in agriculture, low water and electricity costs may not be sustainable advantages in the longer term.

Diagnostic Report RAS Growth and Jobs in Slavonija, Baranja & Srijem
359
Figure 159 Key Source Countries for FDI Projects in Agribusiness Target Segments in Central and Eastern Europe since 2003
Source: FDI markets.
Tourism
Selling the Tourism Opportunity
Tourism’s value proposition would need to be particularly based around increasing the demand, i.e. the growth in tourists coming to the region. The current situation is below expectations, which is why many of the subsectors are aspirational. Thus, while the below is specific to hotels, elements of this would also be relevant to other subsectors as tourism numbers increase. Developing a tagline or brand for tourism investors is difficult at this stage, as it will largely depend on how the industry grows.
• Tourist overnights in Slavonia increased by 34% between 2010 and 2017, now outpacing the rest of the country.335 In 2017, more than one third of these were foreign tourists.
• A developing tourism product covering food and wine, nature, business tourism and other developing niches – with scope for high-end boutique hotel entrants across the region.
• Almost 500 high-quality hotel staff, just part of the region’s skilled hospitality workforce.336
• Central geographic location – located between Belgrade, Sarajevo, Budapest and Zagreb, with modern road infrastructure.
• Osijek airport offers summer European connections and year-round daily links to Zagreb.
335 Croatian Bureau of Statistics website, https://www.dzs.hr/default_e.htm. 336 Financial Agency (FINA) data, 2017.
8 8 8
6
5 5
4 4 4
10
9
5
1
7
0
11
1 12
4
6
8
10
12
Fruit and Vegetable Processing Dairy Manufacturing
75
16 15 14 1310 8
5
0
10
20
30
40
50
60
70
80
Warehousing / Transportation
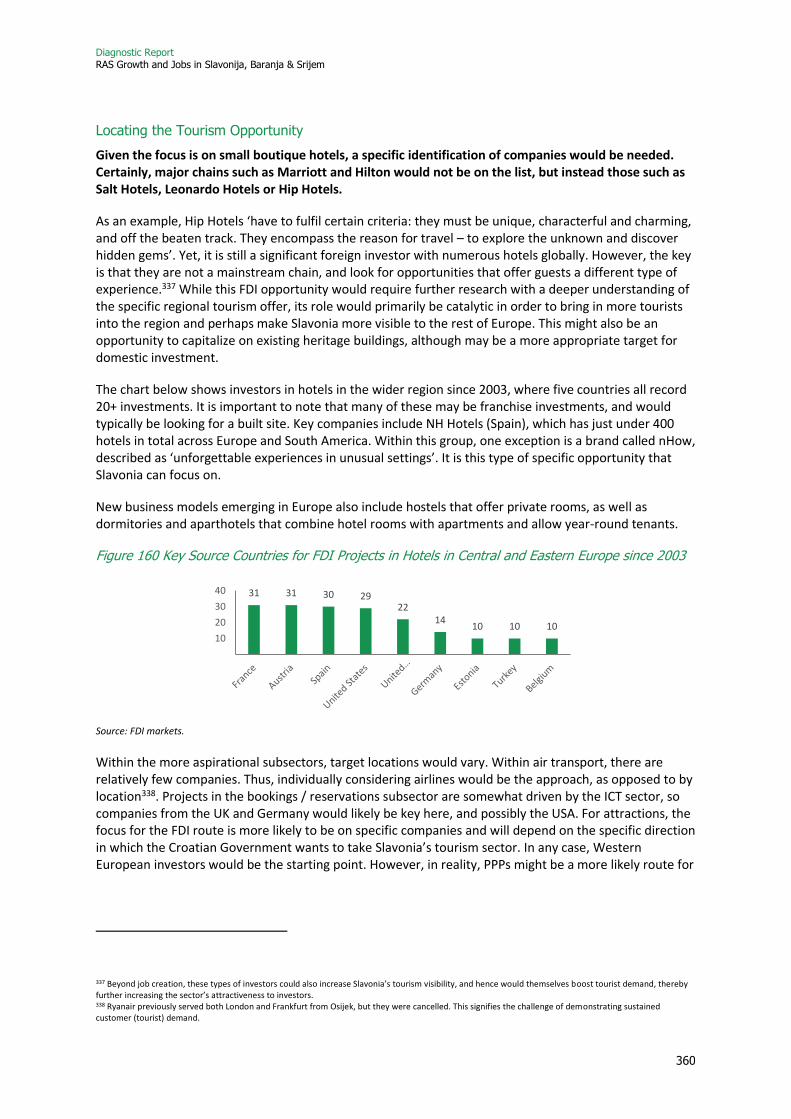
Diagnostic Report RAS Growth and Jobs in Slavonija, Baranja & Srijem
360
Locating the Tourism Opportunity
Given the focus is on small boutique hotels, a specific identification of companies would be needed. Certainly, major chains such as Marriott and Hilton would not be on the list, but instead those such as Salt Hotels, Leonardo Hotels or Hip Hotels.
As an example, Hip Hotels ‘have to fulfil certain criteria: they must be unique, characterful and charming, and off the beaten track. They encompass the reason for travel – to explore the unknown and discover hidden gems’. Yet, it is still a significant foreign investor with numerous hotels globally. However, the key is that they are not a mainstream chain, and look for opportunities that offer guests a different type of experience.337 While this FDI opportunity would require further research with a deeper understanding of the specific regional tourism offer, its role would primarily be catalytic in order to bring in more tourists into the region and perhaps make Slavonia more visible to the rest of Europe. This might also be an opportunity to capitalize on existing heritage buildings, although may be a more appropriate target for domestic investment.
The chart below shows investors in hotels in the wider region since 2003, where five countries all record 20+ investments. It is important to note that many of these may be franchise investments, and would typically be looking for a built site. Key companies include NH Hotels (Spain), which has just under 400 hotels in total across Europe and South America. Within this group, one exception is a brand called nHow, described as ‘unforgettable experiences in unusual settings’. It is this type of specific opportunity that Slavonia can focus on.
New business models emerging in Europe also include hostels that offer private rooms, as well as dormitories and aparthotels that combine hotel rooms with apartments and allow year-round tenants.
Figure 160 Key Source Countries for FDI Projects in Hotels in Central and Eastern Europe since 2003
Source: FDI markets.
Within the more aspirational subsectors, target locations would vary. Within air transport, there are relatively few companies. Thus, individually considering airlines would be the approach, as opposed to by location338. Projects in the bookings / reservations subsector are somewhat driven by the ICT sector, so companies from the UK and Germany would likely be key here, and possibly the USA. For attractions, the focus for the FDI route is more likely to be on specific companies and will depend on the specific direction in which the Croatian Government wants to take Slavonia’s tourism sector. In any case, Western European investors would be the starting point. However, in reality, PPPs might be a more likely route for
337 Beyond job creation, these types of investors could also increase Slavonia’s tourism visibility, and hence would themselves boost tourist demand, thereby further increasing the sector’s attractiveness to investors. 338 Ryanair previously served both London and Frankfurt from Osijek, but they were cancelled. This signifies the challenge of demonstrating sustained customer (tourist) demand.
31 31 30 2922
1410 10 10
10
20
30
40

Diagnostic Report RAS Growth and Jobs in Slavonija, Baranja & Srijem
361
attractions, at least in the short-term. It is notable that PPP activity has also been a role for AIK in recent times.339
Sector Scan Results: Policy and Regulatory Challenges by Sector
ICT
As discussed earlier, the attractiveness of a location for ICT investors, and indeed in developing an internationally known cluster, strongly lies with access to specialist talent. Slavonia is currently producing around 1,000 graduates a year across all STEM subjects,340 while the University of Osijek only last year started a degree in Computer Science, with 40 students per year.341 However, even these may still be lacking the knowledge and latest techniques which the existing private sector requires to grow.342 While companies themselves are working to upgrade skills, the University of Osijek will also need to be more agile in a rapidly evolving industry so that academic-private partnerships can be strengthened. Another way to address the skills gap would be through foreign labor, but the quota system on labor permits currently provides little scope for this.343
While skills are by far the most important issue, a number of other areas also contribute to FDI attractiveness in Slavonia and would need to be addressed. In particular:
• A lack of available office space for firms to choose from. While an IT technology park has been discussed for a number of years and would help further transform the sector into a cluster, tangible progress has not been made. Although Ericsson are expected to provide cutting-edge facilities for existing firms in Slavonia, and hence positively foster innovation,344 this does not replace the need for office space for new foreign entrants.
• A lack of international flights, which is important for visiting staff from investing company headquarters.
• Despite relatively low salaries, taxes and social charges on employment are high, and make Slavonia less cost competitive than it at first appears.345
Wood
For FDI to be viable in the wood sector, three key issues need to be addressed:
• First, the fundamental issue is the distortive government quota system for accessing wood,346 which essentially means any larger firm with the opportunity to grow is constrained, as it is unable to access raw materials – despite Slavonian forests offering a quantity and quality of wood as strong as anywhere in Europe. In effect, the sector is closed to foreign investors until this restrictive policy is addressed. Only then, do any of the subsectors actually become viable.
339 Agency for Investments and Competitiveness: https://vlada.gov.hr/UserDocsImages/ZPPI/Invest%20in%20Croatia/Catalogue-of-Investment-Opportunities-December-2017.pdf. At the same time, we are not aware of any specific PPP activity currently in Slavonia. 340 Growth Opportunities & Constraints in Slavonia, ICT Industry, February 2018. World Bank Presentation. 341 The polytechnic in Požega also has a program in ICT management that contributes to ICT skills. 342 Company consultations. 343 Only 50 permits were issued in 2017 for ICT professionals, although there is a slight improvement for 2018. Source: Ministry of Interior website in World Bank Presentation. 344 Company consultations. Innovation is another key issue: Croatia ranked 24 out of the 28 EU member states in 2017 and fell back one place compared to 2016 on Europe's Digital Economy and Society Index (DESI). 345 Moreover, new investors IBM and Ericsson state they are actually paying Zagreb salaries, and because of this may be finding recruitment easier. 346 2 million of an overall total of 2.6 hectares of Croatian forests are owned by the state-owned enterprise, Hrvatske Šume. Roundwood is mostly sold to industries through long-term (up to 10 years) contracts with ‘negotiated’ prices which are not based on any clear and impartial market information. It is suggested that the price level is up to 50% less than market prices (source: company consultations). Besides distorting the markets, this may also violate EU state aid rules. Private forests cover 22% of forests in Croatia but are generally in extremely small holdings. Any program to encourage enlargement of these holdings could be another route to creating a viable supply for incoming foreign investors.
Diagnostic Report RAS Growth and Jobs in Slavonija, Baranja & Srijem
362
• Second, investors would also need to identify a larger skilled workforce than is currently available in the region.347
• Third, the national subsidy system is allowing manufacturers to remain less innovative and maintain unprofitability.
If the above were addressed, then the sector would offer strong opportunities for investors in Slavonia. Resource-seeking foreign investors looking for opportunities in Europe are increasing and are willing to pay rising open-market prices to access Slavonian oak. Moreover, Croatian export values of wood and articles of wood have been increasing substantially as a result of joining the EU.348 While this may well displace existing local firms, the net effect would be a greater number of higher paid jobs, and genuine competition349. Without changes in this direction, the industry in the country will be increasingly less internationally competitive, which is unlikely to be sustainable in the long term.
Agribusiness
The dominance of wheat and corn350 in Slavonia is driven by the Croatian government’s policy priorities, which have led to a reliance on EU subsidies that incentivize large landholdings and disincentivize firms from diversifying into higher value-added crops351. The current policy demonstrates the impact of the move towards a market-led system in the 1990s. At the same time, demand for wheat and corn has been reduced by EU competition and become increasingly unprofitable. This, together with small landholdings, limited access to finance, weak logistics infrastructure, limited understanding of global food demand, scarcity of (young) labor, and weak irrigation systems, creates an agricultural investment climate that lacks dynamism, and has therefore become vulnerable. This comes despite the region offering highly fertile soils and water,352 and an advantageous climate.
While foreign investors will more typically be engaged in processing activities, the variety and quality of crops in terms of the natural resource supply is still important. This means that the investment opportunity in processing activities will be strengthened by agricultural production itself being strong. Hence, production and processing go hand in hand. However, even with a more diversified value-added agriculture, attractiveness in processing activities will still require:
• A broadening of skills, e.g. cold chain logistics experts and food technologists are needed to innovate new products.353
• Adaption of processing technologies - connections with the university do not currently function well.354
• Improvements in the regulatory environment, which is seen to be confusing, arbitrary, and costly.355
347 Technical secondary schools are lagging behind the carpentry standards present in countries like Austria, Germany or Switzerland. Source: Strategic Segmentation, Sustainable Wood Production and Processing, STPA Croatia Competitiveness Reinforcement Initiative, May 2017. 348 Global Value Chain Assessment for the Sustainable Wood Production and Processing Sector in Croatia, November 2016, World Bank. 349 Growth opportunities & constraints in Slavonia: Wood Production and Processing Industry. World Bank Presentation, February 2018. 350 Together with other low value ‘commodities’, such as sugar, which is the region’s largest export food product. Source: World Bank Presentation document, February 2018. 351 Note this report is not suggesting EU subsidies themselves are the problem, given that the Common Agricultural Policy applies to all 28 EU member states. 352 Multiple sources: Concept Note; https://www.jutarnji.hr/globus/Globus-zivot/jedan-od-najboljih-mladih-hrvatskih-poduzetnika-evo-kako-slavonija-moze-ponovno-postati-najbogatija-i-najrazvijenija-hrvatska-regija/6317440/; World Bank Presentation - Growth Opportunities & Constraints in Slavonia, Agribusiness Industry, February 2018; Company consultations. 353 Growth opportunities & constraints in Slavonia: Agriculture and Agribusiness. World Bank Presentation, February 2018. 354 World Bank, Back to Office report, Agribusiness, 2018. 355 Company consultations.
Diagnostic Report RAS Growth and Jobs in Slavonija, Baranja & Srijem
363
Tourism
The challenge in attracting tourism FDI lies with having a robust demand from tourists. Hence, if tourist numbers grow, then investors will follow. For this to happen, there needs to be a clear tourism ‘offer’. Therefore, while both leisure (rural tourism, gastronomy including wine,356 ecotourism, etc.) and business tourism357 have already shown viability, neither tourists nor tour operators are fully aware of these products, particularly foreigners. Creating and sustained marketing of a coherent set of niche tourism ‘products’ for all of Slavonia, so that the average of a 1.8-night stay in the region moves closer towards the national average of 5 nights, is therefore the first step in creating FDI opportunities.358 Some of the building blocks to support industry growth are also already in place, including relatively strong road connections, good public and private amenities, and good value for money across the tourism product.359
Tourism investment can become self-fulling, as tourism investors that create attractions360 themselves enhance the product and further boost tourist demand. Without such demand, tourism investment in Slavonia will remain risky and the wait for returns on investment will be too long for investors to commit.
356 As an example, the family-owned vineyard Sontachi Kutjevo produces 10,000 bottles a year, of which 15% are sold directly to tourists. 357 Business and leisure currently have similar numbers of tourists in Slavonia. Source: company consultations. 358 Growth opportunities & constraints in Slavonia: Tourism. World Bank Presentation, February 2018. 359 Ibid. 360 The number of attractions is currently described as ‘adequate’. Source: World Bank Presentation, February 2018.

Diagnostic Report RAS Growth and Jobs in Slavonija, Baranja & Srijem
364
Investor Protection Guarantees in Croatia’s Bilateral Investment Treaties
Table 46 Investor Protection Guarantees in International Investment Agreements (Checklist)
Core Investor Protection Guarantee Croatia – USA BIT
Croatia – Austria BIT
Croatia – Italy BIT Croatia – Canada BIT Croatia – Germany BIT
1. National Treatment (NT) ✓ ✓ ✓ ✓ ✓
a. Pre and Post-establishment ✓ ✓
b. Post-establishment Only ✓ ✓ ✓
c. Like Circumstances ✓ ✓
2. Most Favored Nation (MFN) ✓ ✓ ✓ ✓ ✓
a. Pre and Post-establishment ✓ ✓
b. Post-establishment Only ✓ ✓ ✓
c. Exceptions from MFN Obligation ✓ (Not for ISDS) ✓ (Not for ISDS) ✓ (Not for Tax Treaties and ISDS)
✓ (Not for ISDS)
3. Fair and Equitable Treatment (FET) ✓ ✓ ✓ ✓ ✓
4. Protection against Expropriation ✓ ✓ ✓ ✓ ✓
a. Direct Expropriation only
b. Direct and Indirect Expropriation ✓ ✓ ✓ ✓ ✓
5. Currency convertibility and transfer ✓ ✓ ✓ ✓ ✓
6. Investor-State Dispute Settlement Provision ✓ ✓ ✓ ✓ ✓
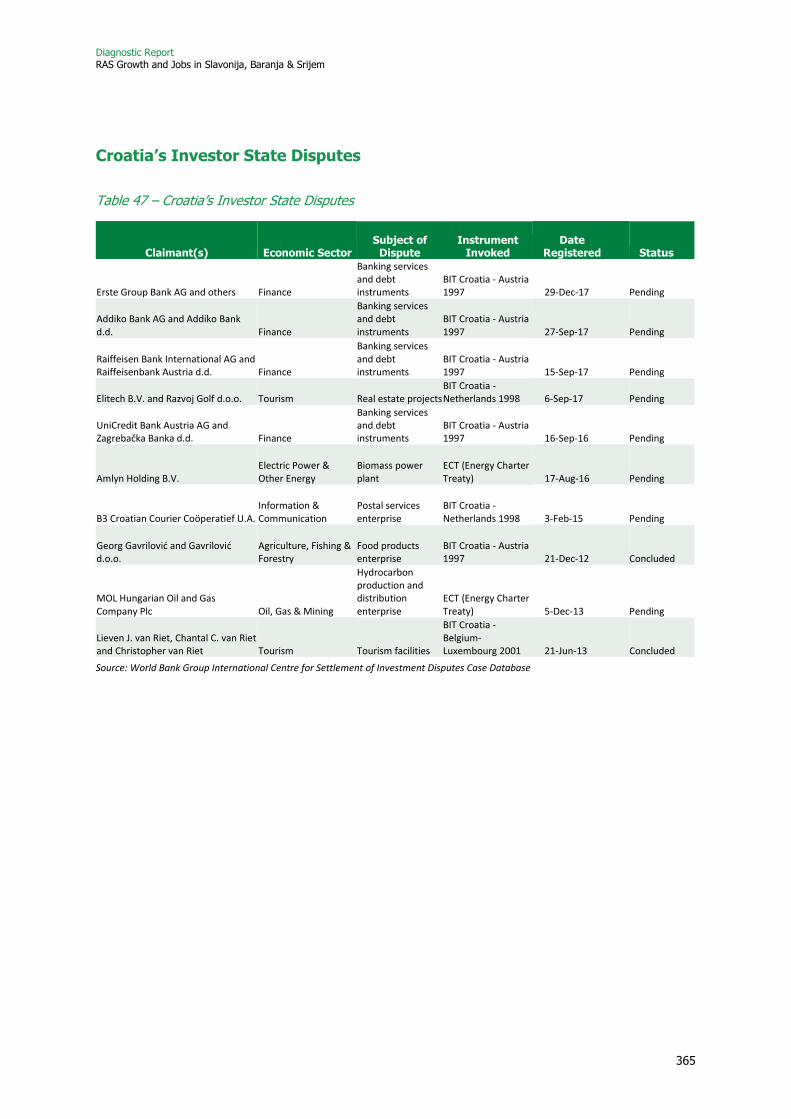
Diagnostic Report RAS Growth and Jobs in Slavonija, Baranja & Srijem
365
Croatia’s Investor State Disputes
Table 47 – Croatia’s Investor State Disputes
Claimant(s) Economic Sector Subject of
Dispute Instrument
Invoked Date
Registered Status
Erste Group Bank AG and others Finance
Banking services and debt instruments
BIT Croatia - Austria 1997 29-Dec-17 Pending
Addiko Bank AG and Addiko Bank d.d. Finance
Banking services and debt instruments
BIT Croatia - Austria 1997 27-Sep-17 Pending
Raiffeisen Bank International AG and Raiffeisenbank Austria d.d. Finance
Banking services and debt instruments
BIT Croatia - Austria 1997 15-Sep-17 Pending
Elitech B.V. and Razvoj Golf d.o.o. Tourism Real estate projects BIT Croatia - Netherlands 1998 6-Sep-17 Pending
UniCredit Bank Austria AG and Zagrebačka Banka d.d. Finance
Banking services and debt instruments
BIT Croatia - Austria 1997 16-Sep-16 Pending
Amlyn Holding B.V. Electric Power & Other Energy
Biomass power plant
ECT (Energy Charter Treaty) 17-Aug-16 Pending
B3 Croatian Courier Coöperatief U.A. Information & Communication
Postal services enterprise
BIT Croatia - Netherlands 1998 3-Feb-15 Pending
Georg Gavrilović and Gavrilović d.o.o.
Agriculture, Fishing & Forestry
Food products enterprise
BIT Croatia - Austria 1997 21-Dec-12 Concluded
MOL Hungarian Oil and Gas Company Plc Oil, Gas & Mining
Hydrocarbon production and distribution enterprise
ECT (Energy Charter Treaty) 5-Dec-13 Pending
Lieven J. van Riet, Chantal C. van Riet and Christopher van Riet Tourism Tourism facilities
BIT Croatia - Belgium-Luxembourg 2001 21-Jun-13 Concluded
Source: World Bank Group International Centre for Settlement of Investment Disputes Case Database
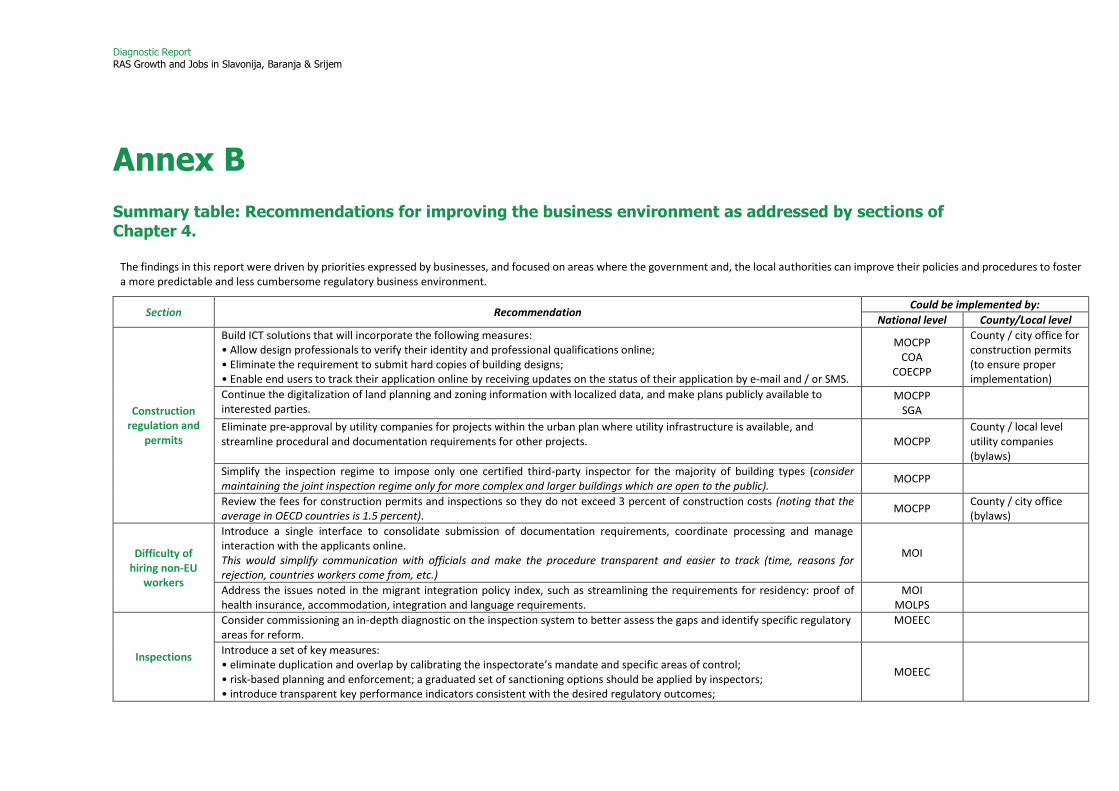
Diagnostic Report RAS Growth and Jobs in Slavonija, Baranja & Srijem
Annex B
Summary table: Recommendations for improving the business environment as addressed by sections of Chapter 4.
The findings in this report were driven by priorities expressed by businesses, and focused on areas where the government and, the local authorities can improve their policies and procedures to foster a more predictable and less cumbersome regulatory business environment.
Section Recommendation Could be implemented by:
National level County/Local level
Construction regulation and
permits
Build ICT solutions that will incorporate the following measures: • Allow design professionals to verify their identity and professional qualifications online; • Eliminate the requirement to submit hard copies of building designs; • Enable end users to track their application online by receiving updates on the status of their application by e-mail and / or SMS.
MOCPP COA
COECPP
County / city office for construction permits (to ensure proper implementation)
Continue the digitalization of land planning and zoning information with localized data, and make plans publicly available to interested parties.
MOCPP SGA
Eliminate pre-approval by utility companies for projects within the urban plan where utility infrastructure is available, and streamline procedural and documentation requirements for other projects. MOCPP
County / local level utility companies (bylaws)
Simplify the inspection regime to impose only one certified third-party inspector for the majority of building types (consider maintaining the joint inspection regime only for more complex and larger buildings which are open to the public).
MOCPP
Review the fees for construction permits and inspections so they do not exceed 3 percent of construction costs (noting that the average in OECD countries is 1.5 percent).
MOCPP County / city office (bylaws)
Difficulty of hiring non-EU
workers
Introduce a single interface to consolidate submission of documentation requirements, coordinate processing and manage interaction with the applicants online. This would simplify communication with officials and make the procedure transparent and easier to track (time, reasons for rejection, countries workers come from, etc.)
MOI
Address the issues noted in the migrant integration policy index, such as streamlining the requirements for residency: proof of health insurance, accommodation, integration and language requirements.
MOI MOLPS
Inspections
Consider commissioning an in-depth diagnostic on the inspection system to better assess the gaps and identify specific regulatory areas for reform.
MOEEC
Introduce a set of key measures: • eliminate duplication and overlap by calibrating the inspectorate’s mandate and specific areas of control; • risk-based planning and enforcement; a graduated set of sanctioning options should be applied by inspectors; • introduce transparent key performance indicators consistent with the desired regulatory outcomes;
MOEEC

Diagnostic Report RAS Growth and Jobs in Slavonija, Baranja & Srijem
367
• implement harmonized tools (e.g. checklists, guidelines for inspectors); • implement ICT systems to ensure adequate information sharing between inspectorates.
Parafiscal charges
Compile an inventory of all parafiscal charges (including their frequency and volume) that apply to all business forms in the Eastern Croatia region from all levels of government (central, county, local), including state-owned enterprises, as a support to local business budget planning.
RDA and / or entrepreneurship
centers
Review and rationalize the parafiscal charges system. MOEEC County / city office
Streamline the system for payment of parafiscal charges. MOEEC County / city office
Legal changes (regulatory
predictability and
transparency)
Compile and regularly update available information to serve as guidelines for businesses on start-up procedures, costs, timelines, and compliance issues for businesses.
RDA or entrepreneurship
center or county / city office for local
economic development
Facilitate the consultative process through a ‘promote and educate’ campaign to encourage businesses in Eastern Croatia to participate in public consultations, and to inform the business community of new regulatory requirements.
County / city office for local economic development
ICT specific
Commission a study to propose recommendations on designing fiscal incentives for the ICT sector, including identifying legal amendments necessary to reduce the tax burden and reviewing the available international experience in this area.
RDA and / or local ICT cluster /
association
Design a conducive framework for home-based businesses based on good practice from other countries (underpin this with a study). MOLPS
RDA and / or local ICT cluster /
association
Improve public-private dialogue by establishing a working group at the local or county government level to work closely with ICT sector clusters / associations with a mandate to address ad hoc problems and sector-specific issues locally.
Entrepreneurship center or
county / city office for local economic development
Wood sector quota system
Increase transparency in distribution of raw timber, including through a digital platform for tracking distribution and prices. MOA HS
Conduct a study to assess the impact of opening up the market for raw materials to new firms by removing the current restrictions. MOA
RDA or local wood cluster /
association
Diagnostic Report RAS Growth and Jobs in Slavonija, Baranja & Srijem
Annex C1
Croatia’s National Innovation Context
The innovation potential of Eastern Croatia is directly and largely affected by the overall performance of the national innovation system. Many of the constraints on innovation in Eastern Croatia are not region-specific but well-known issues observed at national level as well. These constraints are a reflection of the underperforming innovation system in Croatia as a whole. What would make the difference from a regional perspective would be to understand how to utilize the potential of Eastern Croatia, and the current resources and interests that exist there, which is exactly the aim of this analytical exercise.
The institutional responsibility for innovation policy is shared between the Ministry of Science and Education (MoSE), and the Ministry of Economy, Entrepreneurship and Crafts (MoEEC). Prior to EU accession, the MoSE played a dominant role in setting research and innovation policy in Croatia. However, since 2013 the MoEEC has become increasingly important, managing a large share of innovation-related financing, and taking the lead in setting the strategic direction of the R&I policy agenda (through the Smart Specialization Strategy). The responsibility for RDI policy is now shared, with the MoSE covering public RDI policy (including oversight of PROs), while the MoEEC deals with so-called private RDI. Since 2013, the Ministry of Regional Development and European Funds (MRDEUF) (the managing authority for ESIF) has also acquired an influential role because of the growing importance of ESIF in financing R&I activities. All these ministries work with many and different implementation agencies, so the institutional landscape is rather complex. Coordination is challenging in such a fragmented setting, and effectiveness varies as ministries employ different approaches in programming, evaluation, and implementation.
Croatia’s innovation performance has already been deteriorating for several years. According to the European Innovation Scoreboard, which quantifies innovation performance along 25 dimensions, Croatia is a ‘moderate’ innovator and ranks 32nd out of 36 countries.361 Croatian innovation performance is half that of the EU average and is deteriorating, while average EU performance has been improving. With the exception of certain indicators,362 Croatia performs below the EU average in key innovation components related to knowledge creation, especially in R&D investment.
Investments in R&D in Croatia have been contracting for more than a decade. In 2004, GERD amounted to 1.3 percent of GDP, while in 2017 the country only invested 0.86 percent of GDP in R&D. Compared to peer countries, Croatia is the only country that is diverging from its EU2020 target (Figure I.a). Both public and private sector expenditure in R&D have been decreasing (although private sector expenditure has recovered in recent years), with a more intense regression in the public sector. An exercise in decomposing business expenditures in R&D reveals interesting findings (Figure I.b). The sector of micro and small firms seems to be very neglected and by far invests the least in R&D compared to peer countries, which is counterintuitive if one considers that the small firms sector is the most productive in Croatia (Productivity Analysis, World Bank Group (2018), Systematic Country Diagnostic).
361 EU countries plus Norway, Iceland, FYR Macedonia, Serbia, Turkey, Ukraine, Switzerland, and Israel. 362 Two areas are an exception: human resources – Croatia is a leading country among the member states by percentage of young people with upper secondary education – and non-R&D innovation expenditure as a percentage of total turnover of companies.

Diagnostic Report RAS Growth and Jobs in Slavonija, Baranja & Srijem
369
Figure I.a Croatia has not made progress towards its EU 2020 target on R&D expenditure
Figure I.b The share of R&D investments of small enterprises is particularly low
Source: Eurostat Source: Eurostat
Croatia not only underinvests in knowledge assets, but also experiences difficulties in transforming knowledge inputs into outputs and economic results. Low investment in R&D and innovation has been attributed to a range of factors including slow economic recovery (since the 2008 crisis), structural factors (e.g. the importance of certain non-R&D sectors such as tourism), budget restrictions in recent years, and low entrepreneurship and innovation finance (Račić et al., 2018; EC 2018). The weak role of research and science in innovation activities reflects structural deficiencies related to fragmentation, limited scale, governance and regulatory inefficiencies that affect scientific performance and industry-science linkages. As stated in the recent 2018 RIO Report, building a coherent and integrated research and innovation policy framework remains an important challenge in Croatia. Strengthening private sector innovation capacity (and performance) and improving SME involvement in innovation activities remain major tasks. In economic terms, the lack of capability to transform inputs into outputs effectively is caused by low levels of productivity and results in weak export performance. Export competitiveness (as measured by export market share) is declining and the export basket and overall complexity of exports has not changed significantly over the last decade (Aprahamian and Correa, 2015). This situation reflects the difficulties of the national innovation system in effectively generating and using knowledge competences to address socio-economic challenges.
The availability of ESIF is an excellent opportunity to turn things around, but it is imperative to focus on the effectiveness of spending much more than on the efficiency. In theory, Croatia could reach the EU 2020 target of 1.4 percent for GERD if it could use and absorb all available funding from the Structural Funds committed for R&D through the existing operational programs.363 However, public expenditure has a low leverage of private investment and there are persistent structural challenges hindering the take-off of innovation activities: (i) the lack of enabling institutional conditions and incentives for research excellence and innovation; (ii) persistent barriers to firms to start investing in R&D, such as the need for skills and guidance in preparing innovation projects; and (iii) business environment frictions such as burdensome regulations and lack of competition. For all these reasons, in less developed regions with limited innovation capacity such as Eastern Croatia, it is even more of a challenge to use the opportunity presented with the available ESIF funding.
363 This could be possible (if funds are completely used) considering that the whole national investment in R&D in 2015 was EUR 375 million through OPCC, and ongoing investment through grants to universities and R&D companies would average EUR 100 million per year over a 7-year period.
3
1.5 1.41.8
3.76
1.7
3
1.2
0
1
2
3
4
EU Bulgaria Croatia Hungary Austria Poland Slovenia Slovakia
GER
D(%
of
GD
P)
2008 2017 Europe 2020 target
0%
10%
20%
30%
40%
50%
60%
70%
80%
Bulgaria Croatia Hungary Austria Poland Slovenia Slovakia
% o
f to
tal
BE
RD
Large companies Medium sized companies Small companies
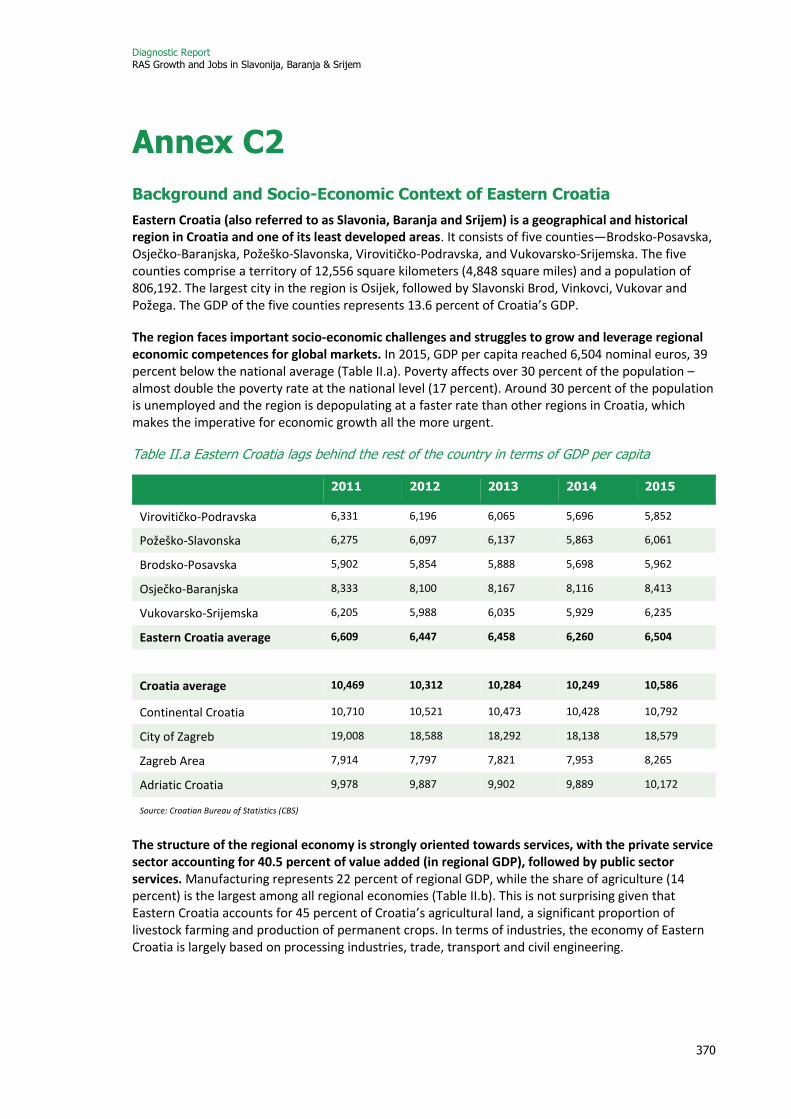
Diagnostic Report RAS Growth and Jobs in Slavonija, Baranja & Srijem
370
Annex C2
Background and Socio-Economic Context of Eastern Croatia
Eastern Croatia (also referred to as Slavonia, Baranja and Srijem) is a geographical and historical region in Croatia and one of its least developed areas. It consists of five counties—Brodsko-Posavska, Osječko-Baranjska, Požeško-Slavonska, Virovitičko-Podravska, and Vukovarsko-Srijemska. The five counties comprise a territory of 12,556 square kilometers (4,848 square miles) and a population of 806,192. The largest city in the region is Osijek, followed by Slavonski Brod, Vinkovci, Vukovar and Požega. The GDP of the five counties represents 13.6 percent of Croatia’s GDP.
The region faces important socio-economic challenges and struggles to grow and leverage regional economic competences for global markets. In 2015, GDP per capita reached 6,504 nominal euros, 39 percent below the national average (Table II.a). Poverty affects over 30 percent of the population – almost double the poverty rate at the national level (17 percent). Around 30 percent of the population is unemployed and the region is depopulating at a faster rate than other regions in Croatia, which makes the imperative for economic growth all the more urgent.
Table II.a Eastern Croatia lags behind the rest of the country in terms of GDP per capita
2011 2012 2013 2014 2015
Virovitičko-Podravska 6,331 6,196 6,065 5,696 5,852
Požeško-Slavonska 6,275 6,097 6,137 5,863 6,061
Brodsko-Posavska 5,902 5,854 5,888 5,698 5,962
Osječko-Baranjska 8,333 8,100 8,167 8,116 8,413
Vukovarsko-Srijemska 6,205 5,988 6,035 5,929 6,235
Eastern Croatia average 6,609 6,447 6,458 6,260 6,504
Croatia average 10,469 10,312 10,284 10,249 10,586
Continental Croatia 10,710 10,521 10,473 10,428 10,792
City of Zagreb 19,008 18,588 18,292 18,138 18,579
Zagreb Area 7,914 7,797 7,821 7,953 8,265
Adriatic Croatia 9,978 9,887 9,902 9,889 10,172
Source: Croatian Bureau of Statistics (CBS)
The structure of the regional economy is strongly oriented towards services, with the private service sector accounting for 40.5 percent of value added (in regional GDP), followed by public sector services. Manufacturing represents 22 percent of regional GDP, while the share of agriculture (14 percent) is the largest among all regional economies (Table II.b). This is not surprising given that Eastern Croatia accounts for 45 percent of Croatia’s agricultural land, a significant proportion of livestock farming and production of permanent crops. In terms of industries, the economy of Eastern Croatia is largely based on processing industries, trade, transport and civil engineering.

Diagnostic Report RAS Growth and Jobs in Slavonija, Baranja & Srijem
371
Table II.b Agriculture is more important in Eastern Croatia than in other regions364
Metropolitan region
Skilled Industrial Northern Region
Traditional Agriculture Region
Skilled Technology Coastal Region
Traditional Coastal Region
Percentage of value added in regional GDP
Agriculture 1.6 7.9 14.1 2.0 2.9
Industry 20.3 39.7 21.9 25.6 11.1
Market services 52.4 35.1 40.5 53.8 61.9
Public services 25.7 17.3 23.5 18.6 24.1
Source: CBS, Bačić and Aralica (2017): https://doi.org/10.18045/zbefri.2017.2.551
Food processing is one of the most important sectors within manufacturing, particularly meat packing, fruit and vegetable processing, sugar refining, confectionery and the dairy industry. Other types of processing sectors significant to Eastern Croatia are wood processing (including the production of furniture, cellulose, paper and cardboard), metalworking, the textile industry and glass production. Transport and civil engineering are also two significant economic activities. In the export basket, however, manufacturing is the dominant sector. Around 80 percent of exports are manufactured goods, while 10 percent come from the wholesale/retail trade and agriculture respectively.
Despite its good international transport connectivity and proximity to the capital cities of neighboring countries, the region is not well connected to international markets. The region only accounts for 10 percent of Croatia’s exports, although it has 19 percent of the population. More generally, Eastern Croatia is behind other regions in Croatia in terms of international integration through trade and foreign direct investment, and firms encounter difficulties in participating in global value chains. However, the region does have a strong regional value chain in agriculture and traditional low-technology industries, which could be further leveraged for regional competitiveness.
364 Metropolitan region: Krapina, City of Zagreb, County of Zagreb, Karlovac, Sisak-Moslavina; Northern region: Varaždin, Međimurje, Koprivnica-Križevci; Traditional Agriculture region: Bjelovar-Bilogora, Virovitica-Podravina, Požega-Slavonia, Brod-Posavina, Osijek-Baranja and Vukovar-Srijem; Traditional Coastal region: Zadar, Šibenik-Knin, Split-Dalmatia, Dubrovnik-Neretva; Skilled Technology Coastal region: Lika-Senj, Primorje-Gorski Kotar, Istria.
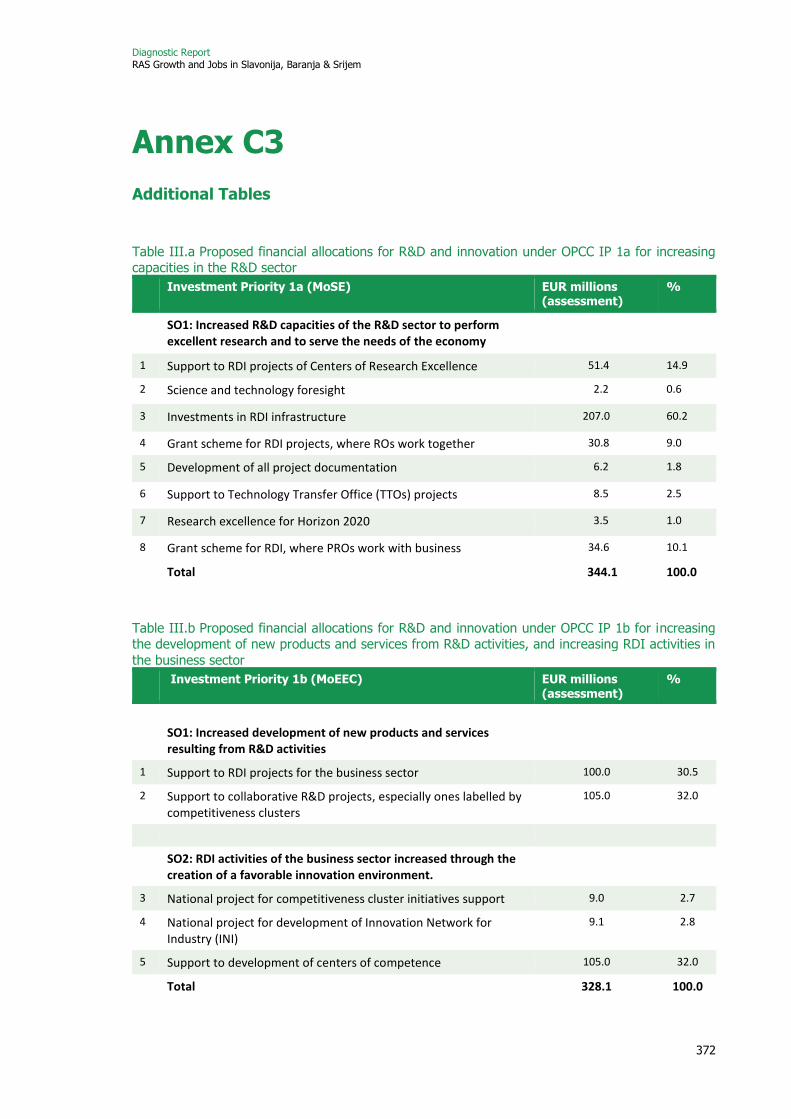
Diagnostic Report RAS Growth and Jobs in Slavonija, Baranja & Srijem
372
Annex C3
Additional Tables
Table III.a Proposed financial allocations for R&D and innovation under OPCC IP 1a for increasing capacities in the R&D sector
Investment Priority 1a (MoSE) EUR millions (assessment)
%
SO1: Increased R&D capacities of the R&D sector to perform excellent research and to serve the needs of the economy
1 Support to RDI projects of Centers of Research Excellence 51.4 14.9
2 Science and technology foresight 2.2 0.6
3 Investments in RDI infrastructure 207.0 60.2
4 Grant scheme for RDI projects, where ROs work together 30.8 9.0
5 Development of all project documentation 6.2 1.8
6 Support to Technology Transfer Office (TTOs) projects 8.5 2.5
7 Research excellence for Horizon 2020 3.5 1.0
8 Grant scheme for RDI, where PROs work with business 34.6 10.1
Total 344.1 100.0
Table III.b Proposed financial allocations for R&D and innovation under OPCC IP 1b for increasing the development of new products and services from R&D activities, and increasing RDI activities in
the business sector
Investment Priority 1b (MoEEC) EUR millions (assessment)
%
SO1: Increased development of new products and services resulting from R&D activities
1 Support to RDI projects for the business sector 100.0 30.5
2 Support to collaborative R&D projects, especially ones labelled by competitiveness clusters
105.0 32.0
SO2: RDI activities of the business sector increased through the creation of a favorable innovation environment.
3 National project for competitiveness cluster initiatives support 9.0 2.7
4 National project for development of Innovation Network for Industry (INI)
9.1 2.8
5 Support to development of centers of competence 105.0 32.0
Total 328.1 100.0
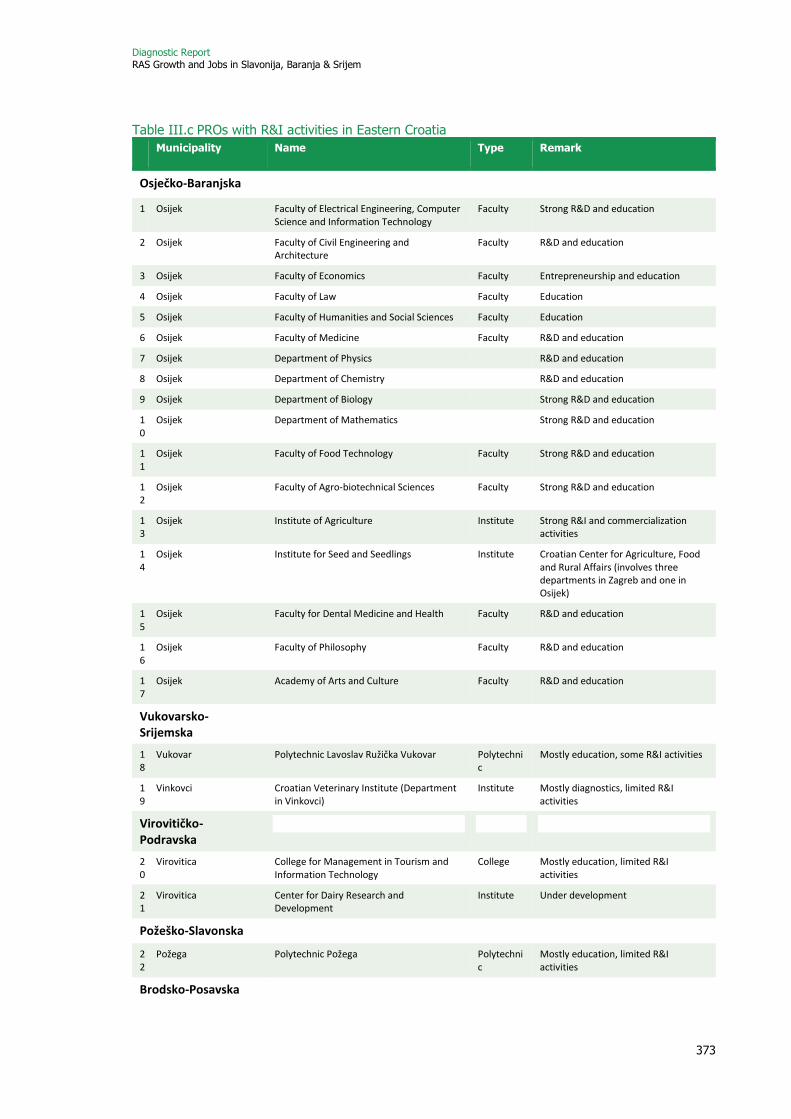
Diagnostic Report RAS Growth and Jobs in Slavonija, Baranja & Srijem
373
Table III.c PROs with R&I activities in Eastern Croatia Municipality Name Type Remark
Osječko-Baranjska
1 Osijek Faculty of Electrical Engineering, Computer Science and Information Technology
Faculty Strong R&D and education
2 Osijek Faculty of Civil Engineering and Architecture
Faculty R&D and education
3 Osijek Faculty of Economics Faculty Entrepreneurship and education
4 Osijek Faculty of Law Faculty Education
5 Osijek Faculty of Humanities and Social Sciences Faculty Education
6 Osijek Faculty of Medicine Faculty R&D and education
7 Osijek Department of Physics R&D and education
8 Osijek Department of Chemistry R&D and education
9 Osijek Department of Biology Strong R&D and education
10
Osijek Department of Mathematics Strong R&D and education
11
Osijek Faculty of Food Technology Faculty Strong R&D and education
12
Osijek Faculty of Agro-biotechnical Sciences Faculty Strong R&D and education
13
Osijek Institute of Agriculture Institute Strong R&I and commercialization activities
14
Osijek Institute for Seed and Seedlings Institute Croatian Center for Agriculture, Food and Rural Affairs (involves three departments in Zagreb and one in Osijek)
15
Osijek Faculty for Dental Medicine and Health Faculty R&D and education
16
Osijek Faculty of Philosophy Faculty R&D and education
17
Osijek Academy of Arts and Culture Faculty R&D and education
Vukovarsko-Srijemska
18
Vukovar Polytechnic Lavoslav Ružička Vukovar Polytechnic
Mostly education, some R&I activities
19
Vinkovci Croatian Veterinary Institute (Department in Vinkovci)
Institute Mostly diagnostics, limited R&I activities
Virovitičko-Podravska
20
Virovitica College for Management in Tourism and Information Technology
College Mostly education, limited R&I activities
21
Virovitica Center for Dairy Research and Development
Institute Under development
Požeško-Slavonska
22
Požega Polytechnic Požega Polytechnic
Mostly education, limited R&I activities
Brodsko-Posavska

Diagnostic Report RAS Growth and Jobs in Slavonija, Baranja & Srijem
374
Municipality Name Type Remark
23
Slavonski Brod Faculty of Mechanical Engineering Faculty R&D and education
24
Slavonski Brod Polytechnic of Slavonski Brod Polytechnic
Mostly education, limited R&I activities
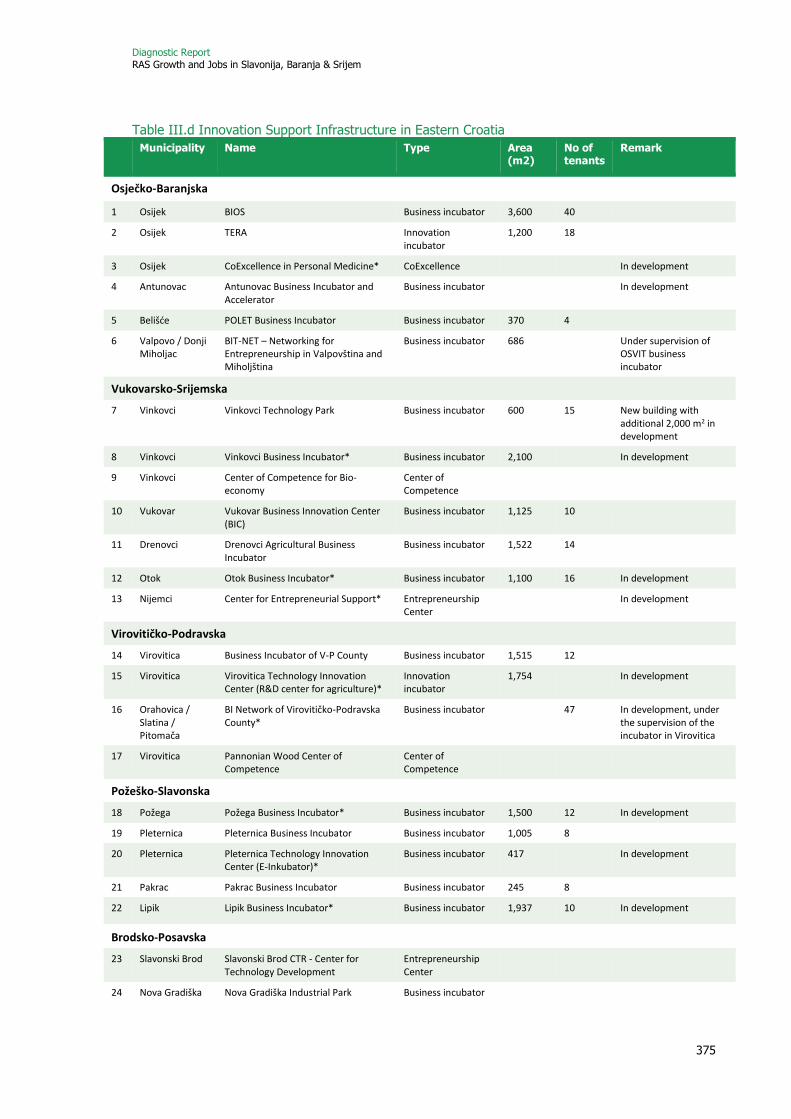
Diagnostic Report RAS Growth and Jobs in Slavonija, Baranja & Srijem
375
Table III.d Innovation Support Infrastructure in Eastern Croatia
Municipality Name Type Area (m2)
No of tenants
Remark
Osječko-Baranjska
1 Osijek BIOS Business incubator 3,600 40
2 Osijek TERA Innovation incubator
1,200 18
3 Osijek CoExcellence in Personal Medicine* CoExcellence In development
4 Antunovac Antunovac Business Incubator and Accelerator
Business incubator
In development
5 Belišće POLET Business Incubator Business incubator 370 4
6 Valpovo / Donji Miholjac
BIT-NET – Networking for Entrepreneurship in Valpovština and Miholjština
Business incubator 686 Under supervision of OSVIT business incubator
Vukovarsko-Srijemska
7 Vinkovci Vinkovci Technology Park Business incubator 600 15 New building with additional 2,000 m2 in development
8 Vinkovci Vinkovci Business Incubator* Business incubator 2,100 In development
9 Vinkovci Center of Competence for Bio-economy
Center of Competence
10 Vukovar Vukovar Business Innovation Center (BIC)
Business incubator 1,125 10
11 Drenovci Drenovci Agricultural Business Incubator
Business incubator 1,522 14
12 Otok Otok Business Incubator* Business incubator 1,100 16 In development
13 Nijemci Center for Entrepreneurial Support* Entrepreneurship Center
In development
Virovitičko-Podravska
14 Virovitica Business Incubator of V-P County Business incubator 1,515 12
15 Virovitica Virovitica Technology Innovation Center (R&D center for agriculture)*
Innovation incubator
1,754
In development
16 Orahovica / Slatina / Pitomača
BI Network of Virovitičko-Podravska County*
Business incubator 47 In development, under the supervision of the incubator in Virovitica
17 Virovitica Pannonian Wood Center of Competence
Center of Competence
Požeško-Slavonska
18 Požega Požega Business Incubator* Business incubator 1,500 12 In development
19 Pleternica Pleternica Business Incubator Business incubator 1,005 8
20 Pleternica Pleternica Technology Innovation Center (E-Inkubator)*
Business incubator 417 In development
21 Pakrac Pakrac Business Incubator Business incubator 245 8
22 Lipik Lipik Business Incubator* Business incubator 1,937 10 In development
Brodsko-Posavska
23 Slavonski Brod Slavonski Brod CTR - Center for Technology Development
Entrepreneurship Center
24 Nova Gradiška Nova Gradiška Industrial Park Business incubator

Diagnostic Report RAS Growth and Jobs in Slavonija, Baranja & Srijem
376
Municipality Name Type Area (m2)
No of tenants
Remark
25 Nova Gradiška Nova Gradiška Technology Incubator* Business incubator In development
26 Nova Gradiška Center of Competence for Advanced Engineering*
Center of Competence
In evaluation procedure
* In development, not yet operating.
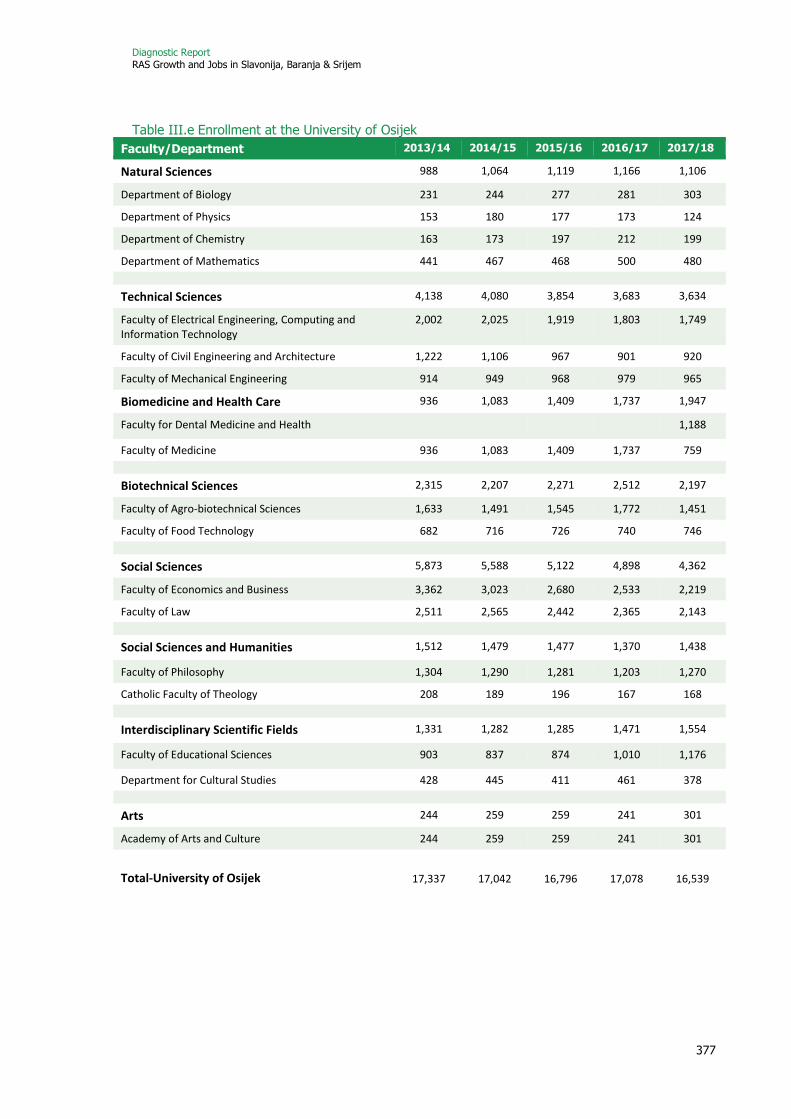
Diagnostic Report RAS Growth and Jobs in Slavonija, Baranja & Srijem
377
Table III.e Enrollment at the University of Osijek
Faculty/Department 2013/14 2014/15 2015/16 2016/17 2017/18
Natural Sciences 988 1,064 1,119 1,166 1,106
Department of Biology 231 244 277 281 303
Department of Physics 153 180 177 173 124
Department of Chemistry 163 173 197 212 199
Department of Mathematics 441 467 468 500 480
Technical Sciences 4,138 4,080 3,854 3,683 3,634
Faculty of Electrical Engineering, Computing and Information Technology
2,002 2,025 1,919 1,803 1,749
Faculty of Civil Engineering and Architecture 1,222 1,106 967 901 920
Faculty of Mechanical Engineering 914 949 968 979 965
Biomedicine and Health Care 936 1,083 1,409 1,737 1,947
Faculty for Dental Medicine and Health 1,188
Faculty of Medicine 936 1,083 1,409 1,737 759
Biotechnical Sciences 2,315 2,207 2,271 2,512 2,197
Faculty of Agro-biotechnical Sciences 1,633 1,491 1,545 1,772 1,451
Faculty of Food Technology 682 716 726 740 746
Social Sciences 5,873 5,588 5,122 4,898 4,362
Faculty of Economics and Business 3,362 3,023 2,680 2,533 2,219
Faculty of Law 2,511 2,565 2,442 2,365 2,143
Social Sciences and Humanities 1,512 1,479 1,477 1,370 1,438
Faculty of Philosophy 1,304 1,290 1,281 1,203 1,270
Catholic Faculty of Theology 208 189 196 167 168
Interdisciplinary Scientific Fields 1,331 1,282 1,285 1,471 1,554
Faculty of Educational Sciences 903 837 874 1,010 1,176
Department for Cultural Studies 428 445 411 461 378
Arts 244 259 259 241 301
Academy of Arts and Culture 244 259 259 241 301
Total-University of Osijek 17,337 17,042 16,796 17,078 16,539

Diagnostic Report RAS Growth and Jobs in Slavonija, Baranja & Srijem
378
Annex D
Data sources
European Union Labor Force Surveys (EU-LFS). The EU-LFS is a large household sample survey providing quarterly results on labor participation of people aged 15 and over, as well as on persons outside the labor force. The purpose of this survey is to observe both the structural and economic situation of people in the labor market and provide a measurement for the concepts of activity, unemployment, employment and inactivity as defined by the International Labor Organization (ILO). The survey was meant to be representative only at the national level, and in 2016, 2,581 observations out of 32,537 came from Slavonia.
Household Budget Survey (HBS). The HBS is focuses mainly on consumption and expenditures. The primary aim of the HBS is to calculate weights for the Consumer Price Index (CPI), but it is also widely used to calculate poverty rates. In 2014, 4,140 dwellings were selected in the final sample, but only 2,029 households were successfully interviewed, the number of households in Slavonia covered being 437.
Employers’ Survey (Anketa Poslodavaca). The employers’ survey is a labor market survey carried out by the Croatian Employment Service (CES) in cooperation with the Croatian Chamber of Economy, the Croatian Chamber of Commerce and the Croatian Employers’ Association. The main goal of the survey is to understand the difficulties faced by employers when recruiting, and to identify labor supply and demand mismatches. The questionnaire consisted of a set of approximately 15 questions split between general information on current employees, difficulties encountered in finding adequate candidates, future labor force needs, and future demand for services offered by CES. In 2017, 8,826 randomly selected firms participated in the survey, of which 1,575 came from Slavonia.
Life in Transition Survey (LiTS). LiTS is a household survey carried out by the European Bank for Reconstruction and Development (EBRD) to help understand how transition is affecting the daily lives of people across the former communist bloc and how it shapes their views on issues such as democracy and the market economy, as well as their satisfaction with life and their hopes for the future. The Croatian sample for LiTS-III (2016) is quite small, and includes 280 observations from Slavonia out of 1,503.
Index of Multiple Deprivation (IMD) database. The IMD database is a collaborative effort between the World Bank Group and various Croatian government bodies. It is a detailed geo-referenced database, constructed at the municipality level, which provides information regarding the geographic distribution of social exclusion using a range of actionable indicators of well-being, deprivation and the distribution of social services and infrastructure. Data is available yearly for 2009 through 2015. 127 municipalities out of 529 are located in Slavonia.
FINA data. 120,286 business entities’ (2017) data. It does not include the large number of craft companies in Croatia. According to the Croatian Chamber of Trades and Crafts (HOK) data, at the end of 2016 there were 75,861 active craft companies, with their share between counties differing significantly. On average, the share of craft companies at the national level was 40 percent, while the five Slavonian counties recorded shares above 50 percent.

Diagnostic Report RAS Growth and Jobs in Slavonija, Baranja & Srijem
379
Additional tables and graphs
Table 48: Probit regression - Employment, working-age population (15-64 y.o.), 2014
Marginal Effect
Standard Error p-value
2nd quintile 0.125 0.043 0.004
3rd quintile 0.237 0.045 0.000
4th quintile 0.297 0.048 0.000
5th quintile 0.327 0.056 0.000
Female -0.146 0.028 0.000
Married 0.074 0.042
0.078
Age 25-34 0.261 0.056 0.000
Age 35-44 0.429 0.060 0.000
Age 45-54 0.317 0.061 0.000
Age 55-64 0.076 0.063 0.228
Urban -0.026 0.042 0.536
Upper-secondary education 0.169 0.035 0.000
Tertiary education 0.203 0.062 0.001
Child aged 0-5 in household 0.045 0.043 0.296
Child aged 6-15 in household 0.098 0.033 0.003
Person aged 65+ in household 0.023 0.038 0.545
Other employed in household -0.042 0.035 0.230
Brodsko-Posavska -0.041 0.036 0.255
Požeško-Slavonska 0.135 0.056 0.016
Virovitičko-Podravska 0.006 0.053 0.910
Vukovarsko-Srijemska -0.115 0.039 0.003
log pseudo-likelihood -279455.19
Wald chi2 (d.f.=19) 258
p-value for Wald test 0.000
Pseudo R2 0.263
Observations 882
NOTE: omitted county: Osječko-Baranjska; omitted age category: 15-24 years old; omitted education category: <upper secondary; marginal effects are bolded and italicized if statistically significant at the 5 percent level or lower. SOURCE: Croatian Bureau of Statistics (CBS), Household Budget Survey (HBS) 2014
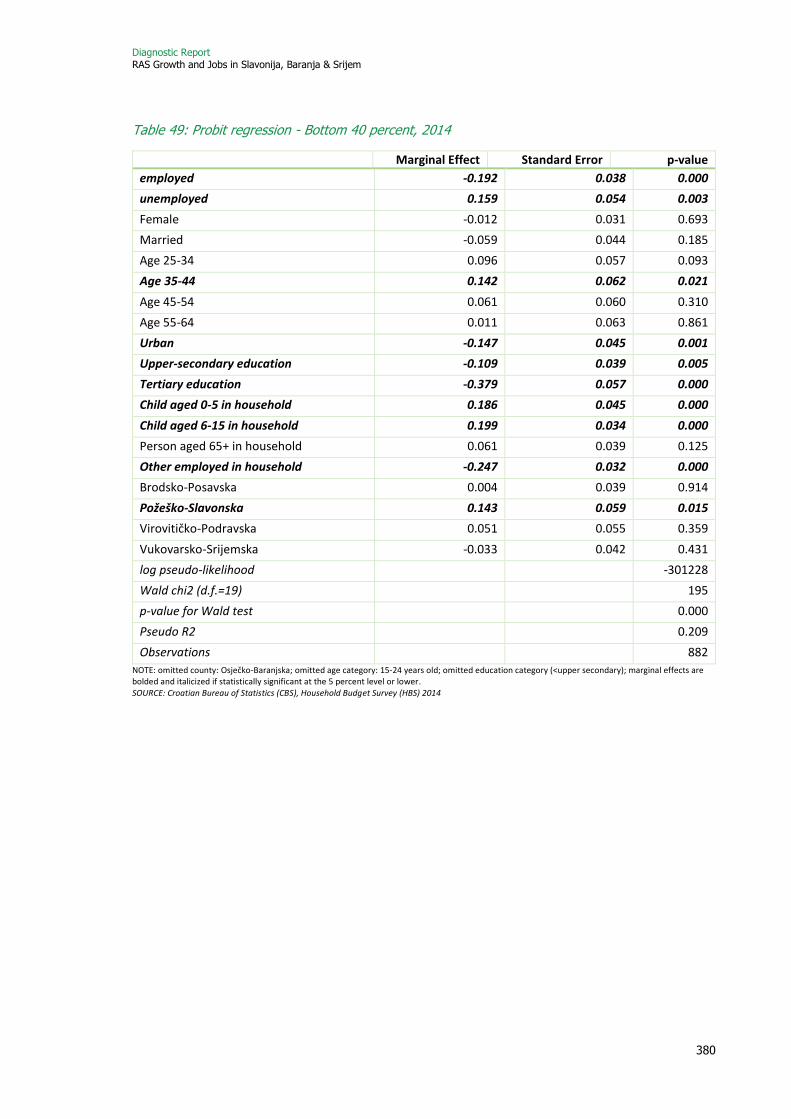
Diagnostic Report RAS Growth and Jobs in Slavonija, Baranja & Srijem
380
Table 49: Probit regression - Bottom 40 percent, 2014
Marginal Effect Standard Error p-value
employed -0.192 0.038 0.000
unemployed 0.159 0.054 0.003
Female -0.012 0.031 0.693
Married -0.059 0.044 0.185
Age 25-34 0.096 0.057 0.093
Age 35-44 0.142 0.062 0.021
Age 45-54 0.061 0.060 0.310
Age 55-64 0.011 0.063 0.861
Urban -0.147 0.045 0.001
Upper-secondary education -0.109 0.039 0.005
Tertiary education -0.379 0.057 0.000
Child aged 0-5 in household 0.186 0.045 0.000
Child aged 6-15 in household 0.199 0.034 0.000
Person aged 65+ in household 0.061 0.039 0.125
Other employed in household -0.247 0.032 0.000
Brodsko-Posavska 0.004 0.039 0.914
Požeško-Slavonska 0.143 0.059 0.015
Virovitičko-Podravska 0.051 0.055 0.359
Vukovarsko-Srijemska -0.033 0.042 0.431
log pseudo-likelihood -301228
Wald chi2 (d.f.=19) 195
p-value for Wald test 0.000
Pseudo R2 0.209
Observations 882
NOTE: omitted county: Osječko-Baranjska; omitted age category: 15-24 years old; omitted education category (<upper secondary); marginal effects are bolded and italicized if statistically significant at the 5 percent level or lower. SOURCE: Croatian Bureau of Statistics (CBS), Household Budget Survey (HBS) 2014

Diagnostic Report RAS Growth and Jobs in Slavonija, Baranja & Srijem
381
Table 50: Registered jobseekers, 2017
1 15-24 Y.O. 25-34 Y.O. 35-54 Y.O. 55+ Y.O.
Total 9,972 10,701 21,779 10,260
Gender
Women 55% 63% 66% 47%
Education level
No or primary education 11% 14% 41% 48%
Secondary education 82% 62% 54% 47%
Tertiary education 8% 24% 6% 5%
Duration of unemployment
< 6 months 74% 57% 37% 24%
6 months - 2 years 20% 26% 23% 18%
> 2 years 7% 18% 40% 58%
Experience
None 44% 15% 9% 6%
< 1 year 35% 20% 12% 5%
1-5 years 21% 49% 28% 9%
> 5 years 0% 16% 52% 80%
Skills level (last occupation)
Elementary skills 11% 16% 45% 54%
Workers and operators 58% 47% 44% 38%
SOURCE: Croatian Employment Services (CES)

Diagnostic Report RAS Growth and Jobs in Slavonija, Baranja & Srijem
382
Table 9: CES recommendations (+ -), places at disposal and actual enrollment in TVET programs in Slavonia, 2017 and 2018.
VET sector Duration
(type) Program
Places in public VET schools
Actually enrolled
2018
Places filled 2018 2017 2018 Change
Agriculture, food and veterinary
3 yr VET
Butchers 58 60 2 23 38%
Bakers 80 54 -26 32 59%
Florists 55 53 -2 12 23%
Fruit and wine-growers, winemakers 44 36 -8 7 19%
Agricultural smallholdings 38 19 -19 7 37%
Gardeners 11 17 6 0%
Millers 7 7 0%
4 yr VET
Agro-technician 166 192 26 111 58%
Agro-tourist technicians 116 140 24 116 83% Agricultural technician-Phytopharmaceutical 178 116 -62 70 60%
Veterinary technicians 70 68 -2 63 93%
Food technicians 46 46 0 13 28%
Forestry and wood processing
3 yr VET Joiners 90 95 5 66 69%
Coopers 8 8 0 0%
4 yr VET
Forestry technicians 66 84 18 69 82%
Carpentry technicians 31 20 -11 0%
Carpentry technicians - designers 25 20 -5 20 100%
Carpentry technicians – restorers 8 20 12 13 65%
Textiles and leather 3 yr VET Tailors 50 57 7 23 40%
4 yr VET Fashion technicians 44 68 24 23 34% Graphics and audiovisual design
4 yr VET Graphics technicians – preparation 26 26 10 38%
Mechanical engineering
3 yr VET
CNC operators 148 166 18 154 93%
Car mechanics 146 140 -6 113 81%
Locksmiths 58 67 9 48 72%
Machinists 38 50 12 32 64%
Auto-mechatronics 38 46 8 47 102%
Mechanics for agricultural machinery 56 44 -12 18 41%
Plumbers 45 44 -1 24 55% Air conditioning and heating mechanics 39 40 1 37 93%
Car bodyworkers 49 34 -15 23 68%
Home installation mechanics 18 17 -1 17 100%
Turners 34 16 -18 11 69%
Gas mechanics 28 12 -16 10 83%
Tin processing 10 10 3 30% Installation and processing by cutting and bending 40 8 -32 8 100%
Tinsmiths 6 6 0 0%
4 yr VET
Computing technicians in mechanical engineering 190 186 -4 153 82%
Technicians for energetics 24 24 0 24 100%
Vehicle technicians 72 24 -48 20 83%
Electrical engineering and computing
3 yr VET
Electricians 63 55 -8 41 75%
Car electricians 43 46 3 27 59%
Electro-mechanics 33 31 -2 22 71%
Electronics mechanics 14 20 6 16 80%
Electro fitters 7 8 1 4 50%
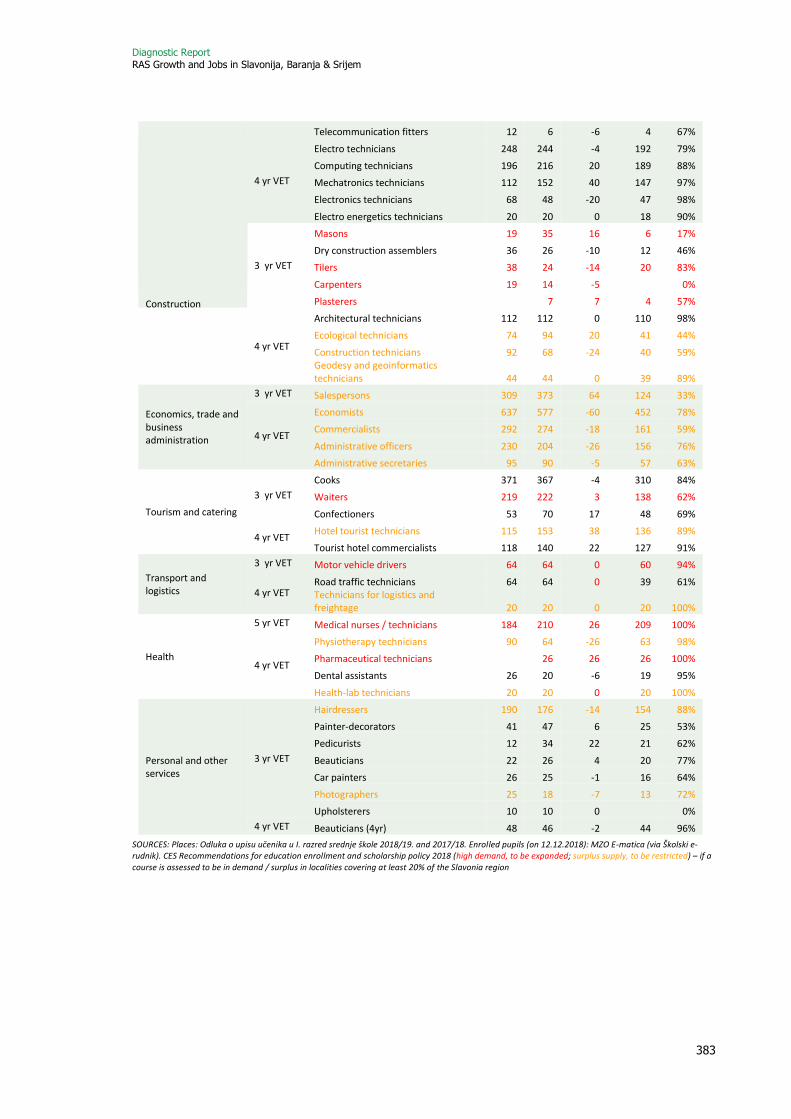
Diagnostic Report RAS Growth and Jobs in Slavonija, Baranja & Srijem
383
Telecommunication fitters 12 6 -6 4 67%
4 yr VET
Electro technicians 248 244 -4 192 79%
Computing technicians 196 216 20 189 88%
Mechatronics technicians 112 152 40 147 97%
Electronics technicians 68 48 -20 47 98%
Electro energetics technicians 20 20 0 18 90%
Construction
3 yr VET
Masons 19 35 16 6 17%
Dry construction assemblers 36 26 -10 12 46%
Tilers 38 24 -14 20 83%
Carpenters 19 14 -5 0%
Plasterers 7 7 4 57%
4 yr VET
Architectural technicians 112 112 0 110 98%
Ecological technicians 74 94 20 41 44%
Construction technicians 92 68 -24 40 59% Geodesy and geoinformatics technicians 44 44 0 39 89%
Economics, trade and business administration
3 yr VET Salespersons 309 373 64 124 33%
4 yr VET
Economists 637 577 -60 452 78%
Commercialists 292 274 -18 161 59%
Administrative officers 230 204 -26 156 76%
Administrative secretaries 95 90 -5 57 63%
Tourism and catering
3 yr VET
Cooks 371 367 -4 310 84%
Waiters 219 222 3 138 62%
Confectioners 53 70 17 48 69%
4 yr VET Hotel tourist technicians 115 153 38 136 89%
Tourist hotel commercialists 118 140 22 127 91%
Transport and logistics
3 yr VET Motor vehicle drivers 64 64 0 60 94%
4 yr VET Road traffic technicians 64 64 0 39 61% Technicians for logistics and freightage 20 20 0 20 100%
Health
5 yr VET Medical nurses / technicians 184 210 26 209 100%
4 yr VET
Physiotherapy technicians 90 64 -26 63 98%
Pharmaceutical technicians 26 26 26 100%
Dental assistants 26 20 -6 19 95%
Health-lab technicians 20 20 0 20 100%
Personal and other services
3 yr VET
Hairdressers 190 176 -14 154 88%
Painter-decorators 41 47 6 25 53%
Pedicurists 12 34 22 21 62%
Beauticians 22 26 4 20 77%
Car painters 26 25 -1 16 64%
Photographers 25 18 -7 13 72%
Upholsterers 10 10 0 0%
4 yr VET Beauticians (4yr) 48 46 -2 44 96%
SOURCES: Places: Odluka o upisu učenika u I. razred srednje škole 2018/19. and 2017/18. Enrolled pupils (on 12.12.2018): MZO E-matica (via Školski e-rudnik). CES Recommendations for education enrollment and scholarship policy 2018 (high demand, to be expanded; surplus supply, to be restricted) – if a course is assessed to be in demand / surplus in localities covering at least 20% of the Slavonia region

Diagnostic Report RAS Growth and Jobs in Slavonija, Baranja & Srijem
384
Figure 161: Profit per employee, select sectors, 2017
Density
-500 0 500Profit per employee (in thousands HRK)
Slavonia
Rest of Croatia
Overall
Density
-500 0 500Profit per employee (in thousands HRK)
Slavonia
Rest of Croatia
Agriculture, forestry & fishing
Density
-500 0 500Profit per employee (in thousands HRK)
Slavonia
Rest of Croatia
Agriculture, forestry, fishing & related activities
Density
-500 0 500Profit per employee (in thousands HRK)
Slavonia
Rest of Croatia
Manufacturing
Density
-500 0 500Profit per employee (in thousands HRK)
Slavonia
Rest of Croatia
Information & communication
Density
-500 0 500Profit per employee (in thousands HRK)
Slavonia
Rest of Croatia
Accommodation and food service
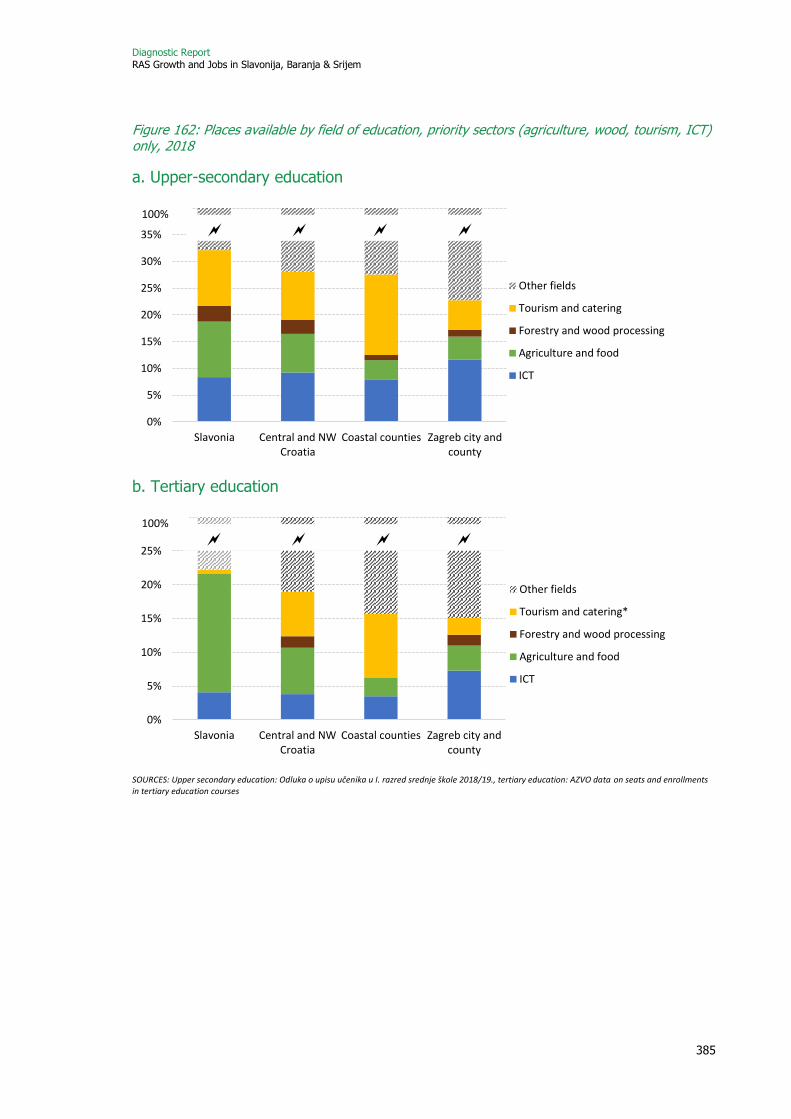
Diagnostic Report RAS Growth and Jobs in Slavonija, Baranja & Srijem
385
Figure 162: Places available by field of education, priority sectors (agriculture, wood, tourism, ICT) only, 2018
a. Upper-secondary education
b. Tertiary education
SOURCES: Upper secondary education: Odluka o upisu učenika u I. razred srednje škole 2018/19., tertiary education: AZVO data on seats and enrollments in tertiary education courses
0%
5%
10%
15%
20%
25%
30%
35%
40%
Slavonia Central and NWCroatia
Coastal counties Zagreb city andcounty
Other fields
Tourism and catering
Forestry and wood processing
Agriculture and food
ICT
100%
0%
5%
10%
15%
20%
25%
30%
Slavonia Central and NWCroatia
Coastal counties Zagreb city andcounty
Other fields
Tourism and catering*
Forestry and wood processing
Agriculture and food
ICT
100%