Growing inequality in black wages in the 1980s and the emergence of an African‐American middle...
19
Growing I neq u a I ity in Black Wages in the 1980s and the €mergence of an African-American Middle Class Bennett Harrison Lucy Gorham Abstract Much recent scholarship and popular discussion posits a substantial move- ment of African-American households into the “middle class.” Yet over the course of the I980s, the proportion of individual black wage-earners receiving “annualized” (work experience-adjusted) wages and salaries in excess of about $35,000-three times the poverty line-fell by 22 percent, even as the share of African-Americans earning below the poverty line increased by a fifth. This was true for all age groups, and even for persons within the black community who had completed four or mare years of college. The growth of low wage employment was most pronounced for black men between the ages of 25 and 34, among whom the incidence of below-poverty-level employment doubled. Black women aged 35-54 experienced relatively greaterprogress than any other part of the African-American community, but their gains lagged far behind those of comparable white women. We speculate on possible explanations for these developments, on the basis of which a potential public policy agenda is examined. The debate about class polarization within the African-Americancommunity in the United States dominates many contemporary discussions of the politi- cal economy of race. Leading the inquiry, University of Chicago sociologist William Julius Wilson [ 19871 writes of a growing black middle class, which is leaving a large black, mostly urban “underclass” behind, in terms of both social and geographic mobility. As relatively more affluent blacks suburban- ize and otherwise move into higher status situations, successful role models are systematically removed from the inner-city environment.’ In this article, drawing on material from a larger project recently completed for the Rural Economic Policy Program of the Aspen Institute and the Ford ’ This fracture in the community hypothetically contributes to the Myrdalian cumulative causa- tion of urban black poverty feeding on itself. For an early attempt to apply Myrdalian cumulative causation or positive feedback models to the study of inequality and labor market segmentation, see Vietorisz and Harrison [19731. Journal of Policy Analysis and Management, Vol. 11, No. 2, 235-253 (1992) 0 1992 b the Association for Public Policy Analysis and Management Publishedby John Wiley & Sons, Inc. CCC 0276-8739/92/020235-19$04.00
Transcript of Growing inequality in black wages in the 1980s and the emergence of an African‐American middle...
Growing I neq u a I ity in Black Wages in the 1980s a n d t h e €mergence of a n African-American Middle Class
Bennett Harrison Lucy Gorham
Abstract Much recent scholarship and popular discussion posits a substantial move- ment of African-American households into the “middle class.” Yet over the course of the I980s, the proportion of individual black wage-earners receiving “annualized” (work experience-adjusted) wages and salaries in excess of about $35,000-three times the poverty line-fell by 22 percent, even as the share of African-Americans earning below the poverty line increased by a fifth. This was true for all age groups, and even for persons within the black community who had completed four or mare years of college. The growth of low wage employment was most pronounced for black men between the ages of 25 and 34, among whom the incidence of below-poverty-level employment doubled. Black women aged 35-54 experienced relatively greaterprogress than any other part of the African-American community, but their gains lagged far behind those of comparable white women. W e speculate on possible explanations for these developments, on the basis of which a potential public policy agenda is examined.
The debate about class polarization within the African-American community in the United States dominates many contemporary discussions of the politi- cal economy of race. Leading the inquiry, University of Chicago sociologist William Julius Wilson [ 19871 writes of a growing black middle class, which is leaving a large black, mostly urban “underclass” behind, in terms of both social and geographic mobility. As relatively more affluent blacks suburban- ize and otherwise move into higher status situations, successful role models are systematically removed from the inner-city environment.’
In this article, drawing on material from a larger project recently completed for the Rural Economic Policy Program of the Aspen Institute and the Ford
’ This fracture in the community hypothetically contributes to the Myrdalian cumulative causa- tion of urban black poverty feeding on itself. For an early attempt to apply Myrdalian cumulative causation or positive feedback models to the study of inequality and labor market segmentation, see Vietorisz and Harrison [19731.
Journal of Policy Analysis and Management, Vol. 11, No. 2, 235-253 (1992) 0 1992 b the Association for Public Policy Analysis and Management Publishedby John Wiley & Sons, Inc. CCC 0276-8739/92/020235-19$04.00
236 1 Inequality of Black Wages
Foundation [Gorham and Harrison, 19901, we use the Census Bureau’s Cur- rent Population Survey (CPS) microdata tapes as the empirical basis for an investigation into the perception that the black (as well as the white) populations underwent family income polarization in the 1980s. We then proceed to examine the extent to which this may be traced to a similar polarization in the distribution of individual wages and salaries.
Our principal finding is that practically all the growth in the number of high-income black families since 1979 must be the result of the packaging of different forms of income (such as wages and rents) or from the wages of more than one family member. The reason for this inference is that the relative density of the upper tail of the distribution of individual black wage-earners has actually diminished since 1979, the last business-cycle peak year before 1989. That is, the incidence of well-paid black workers, both men and women, has faZZen during the 1980s. The same is true for white men, but there has been considerable growth in the number and incidence of relatively high- wage white women over this period?
In the political-economic climate of the past decade-characterized by extensive privatization, by the slowdown in the growth of permanent govern- ment employment and a decline in the number and percent of black recruits into the U.S. military, and by the continuing private sector shift from manu- facturing to services3-black families are less able than ever before to rely on the wages of one family member to propel them into the middle class. In the absence of a truly major national policy effort to promote affirmative action in hiring and promotion, comparable worth, higher hourly wage rates for part-time workers, more hours of work (especially in rural areas), extensive job training tied to well-paid stable employment opportunities, and subsi- dized child care, most black families-even more than white families-are going to need two or more earners to attain a middle-class standard of living. Black women who are single parents will find it particularly difficult to get along in this environment.
In that context, whatever one may think about the “underclass” thesis in its entirety-and we have our reservations-our research strongly validates the concern of Wilson and others about the critical importance of creating social and economic conditions in the inner city that facilitate the reproduc- tion of two-parent (or a t least two or more earner) African-American families or households.
* By the income indicator we use-to be explained momentarily-there was a 47 percent growth in the number of high-wage white women over this period, but a 3 percent decline in the absolute number of high-wage African-American women. For an analysis of racial differences in the labor market outcomes of women that poses a sobering challenge to the feminist movement, see Malveaux [1985].
On privatization, see Donahue [19891. Between the 1970s and the 1980s, the rate of growth of employment in government a t all levels fell by a factor of four [Council of Economic Advisers, 1989, p. 3.571. Moreover, in 1985 the typical probationary period prior to achieving permanent status in the Federal Civil Service was increased from one to up to four years. The Federal Office of Personnel Management ordered all government agencies to substitute temporary for permanent employees “whenever possible,” noting that “temporary employees are not eligible for federal health benefits, may be dismissed ‘at will,’ and have no appeal rights or other protection against adverse personnel actions” [Pear, 19851. Historically, permanent civil service employment has been a major source of upward mobility for blacks [Harrison and Osterman, 19741. On the decline in military recruitingof blacks,see U.S. Congressional Budget Office [1989]. The distributional impacts of interindustry shifts in labor demand have been explored at length by Harrison and Bluestone [1988, 19901 and Kasarda [1989].
Inequality of Black Wages / 237
POLARIZATION OF FAMILY INCOMES SINCE 1979
That the black population is experiencing polarization in family income is clear from a recent Census Bureau report on poverty. In 1979-the business- cycle peak prior to the recessions of 1980 and 1982-34.7 percent of all black families had annual incomes under $12,500 a year (in 1987 dollars), while 7.9 percent had incomes of $50,000 or more. By 1987, the low-income share had risen to 37.1 percent, the high-income share to 9.5 percent, and the middle had fallen from 57.4 percent to 53.4 percent of the population of black fami- lies,“ These data are consistent with recent research conducted by Robert Michel, showing increasing income polarization among black households during the post-recession period 1983-1987 [Michel, 19911.
This trend toward income polarization appears in the data on white families too, although with whites (as many researchers have recently noted), the growth at the top of the distribution has exceeded the growth at the bottom [e.g., Danziger et al., 19891. In 1979, 12.4 percent of white families received less than $12,500 in inflation-adjusted income from all sources, while 20.8 percent received $50,000 or more. By 1987, the low-income share among white families had risen slightly, to 13.5 percent, while the high income share increased to 24.4 percent? Clearly, the distributions of both black and white family income are undergoing polarization.
The question remains: Are the sources of this potentially socially disruptive trend different for blacks and whites? We know that black families are less likely to have two wage earners than white families. Between 1979 and 1987, the proportion of white families with two or more wage earners rose from 57 percent to 59 percent. But for black families, the change was in the opposite direction, from 50 percent in 1979 down to 46 percent in 1987.6
Moreover, it is generally thought that blacks possess fewer or less valuable income-bearing assets (businesses, rental properties, stocks and bonds) than do whites. Interracial wealth comparisons are notoriously difficult to make, but using one particular indicator (liquid assets), the Federal Reserve System has provided useful information on this question. In 1983, when the Fed last surveyed consumer finances, only 66 percent of “nonwhites and Hispanics” had any liquid assets at all, compared with 93 percent of whites. In that year, median total financial assets held by whites amounted to approximately $4500; for nonwhites and Hispanics the Comparable figures was only $1000 [“Survey of Consumer Finances,” 1984, Table 101. The Fed does not specifically identify the financial activity of African-Americans in its surveys. But from one of the Census Bureau’s occasional special household surveys, we do know that in the following year (1984), white families with $24,000-$48,000 in annual income had a median net work of about $50,000; for black families in the same income range, median net worth was just $15,000 [cited by Kane, 1990, p. 641.
Dramatic as they are, these differences do not rule out the possibility that
For black families, real median annual incomes (in 1987 dollars) have been essentially un- changed over this period. The Census Bureau reports values of $18,122 and $18,098 for 1979 and 1987, respectively. Real median annual family income for whites rose slightly, from $32,003 in 1979 to $32,274 by
1987. US. Department of Commerce, 1988, Table for 1987 data; U.S. Department of Commerce, 1981,
Table 20 for 1979 data.
238 1 Inequality of Black Wages
part of the emergence of a class of black families with high incomes-Wilson’s growing middle class-is the result of significant growth in the wages and sala- ries of individua2 black workers with “good jobs at good wages.” After all, me- dian years of black schooling have increased over time, the standardized test scores of young blacks and white men continued to converge through at least 1986 [Bound and Freeman, 1990, p. 191, and at least some equal employment opportunity and affirmative action hiring and promotion practices have be- come institutionalized in both the public and private sectors. Moreover, just as residence in the inner city may, according to Wilson’s thesis, cut poor blacks off from the social networks through which access to information about (and referrals to) good jobs are transmitted, the suburbanization of thousands of black households over the past 20 years plausibly increases employment access for the members of these more mobile households.’
In this study, we conduct a highly disaggregated analysis of the March 1980 and March 1988 CPS computer tapes to determine how many individual black workers with at least some wage income gained increased access during the 1980s to high-paying employment, or at least to jobs offering additional hours of work. The short and discouraging answer is that not many have.
CHANGES IN THE DISTRIBUTION OF INDIVIDUAL WAGES FOR ALL WORKERS: 1979-1987
We define “low-wage” earners to be individuals whose annual wage and salary incomes leave them below the official poverty line for a family of four persons, adjusted for inflation. “High-wage” earners are arbitrarily (but not, we think, unreasonably) defined as those earning at least three times poverty line. In 1987, these normative standards amounted to a bit under $12,000 a year and nearly $35,000 a year, respectively.”
’ According to former Census Bureau Director Vincent Barabba [1979], between 1970 and 1979 there was “an increase of 39 percent in the number of black suburbanites. This growth rate far overshadows the black growth rate in any other geographic area, and suburban blacks now represent 20 percent of all blacks instead of the 16 percent that we noted in 1970.”
Critics, however, argue that many of the “suburbs” to which central city blacks have moved are in fact still relatively segregated enclaves located on the urban fringe. Some of these communi- ties are indistinguishable from (if not actually identical to) the old white working-class towns that have been undergoing deindustrialization for decades. In other cases, newly relocating high- technology and producers’ services companies appear to systematically avoid placing facilities in suburban communities with large black populations. Either way, the black “suburbs” effec- tively pose similar problems of inadequate labor demand as the central cities from which most of those suburban blacks moved. For a literature review and new empirical results, see Schneider and Phelan [ 19901. * Nominal poverty thresholds for 1979 and 1987 are drawn from the U.S. Department of Com- merce [1981, 19881. In the larger research project of which this article is one part, in which we examine data over the period 1969-1987, all poverty thresholds were deflated by the CPI-U-XI. Prior to 1983, the standard Consumer Price Index for urban households (the CPI-U) “expensed” the entire purchase price of a person’s house in the year when it was purchased-a practice thought to systematically inflate the relative weight of housing in the average consumer’s market basket, a t least during the housing boom years following the late 1970s. In 1983, the“experimen- tal” index CPI-U-XI was introduced by the Bureau of Labor Statistics and the Bureau of the Census to correct for this overstatement, by substituting an imputed annual rental value for the housing component of the CPI. In 1979, the CPI-U-XI had a value 7 percent above that of the CPI-U. By construction, after 1983 the two series are identical.
Inequality of Black Wages / 239
There is of course nothing “objective” about using the official poverty index as the basis for evaluating the shape of the distribution of wage and salary income. This is an essentially normative exercise, and any set of intuitively sensible cutoffs will do-provided they are deployed systematically in making intertemporal or intergroup comparisons. The advantage of the poverty line is that it is directly related to judgments about adequate consumption, and that its history, properties, strengths, and weaknesses are by now well docu- mented. It is, in short, an “idea in good currency” in policymaking circles, one whose officially measured values from one year (or place) to another now legally condition a host of income transfer and other social and economic development programs [Ruggles, 19901 .9
People’s work experience varies enormously over the course of the year. Some people work year round and full time, often for the same employer. Others work regularly-by which is usually meant year round-but on part- time schedules. Still others (e.g., farm workers and people employed in other highly seasonal activities such as tourism, construction, and the fashion in- dustry) may well work full time (or even overtime) when they do work, but for considerably fewer than 50-52 weeks a year. Finally, especially the youngest and the oldest among us will often be employed “casually”-that is, both part-time and for only part of the year.
For many research and policy analysis purposes, it is relevant to explicitly recognize the growing heterogeneity of work schedules among U.S. employ- ees, and how these are distributed by gender and race [Appelbaum, 1987; Christopherson, 1989; Ehrenberg et al., 1988; Tilly, 19901. But for the present discussion, where annual wages from all sources are our concern rather than
We also adjusted our data to compensate for different earnings “top codes” in the CPS for different years. The values for Wage and Salary Income in the March 1980 CPS (referring to calendar 1979 income) range from $0 to $50,000. In the March 1988 CPS (referring to calendar 1987), the top code was set a t $99,000. In order to make a consistent comparison, we reset the 1987 top code at the 1979 level times the rate of inflation, or $76,757. In a widely cited review article published in The Journal of Economic Literature, Smith and
Welch [1989] claim to have demonstrated that the growth of the black male “middle class” since 1940 has been “spectacular” [p. 5251. As we remarked above, and as Ruggles explains in her comprehensive survey of the subject [1990], all distributional indicators reflect value judgments. That of Smith and Welch was designed to reflect mainly interracial wage differentials (with some interesting twists)-that is, relative income-rather than income inadequacy, per se. Specifically, Smith and Welch define a black male (no analysis of the data on women is offered) as having achieved a t least a “middle class” status if his personal income (wages plus self-employment income) exceeds two thirds of the median income of white men, with that benchmark adjusted each year by half the rate of change in white real median income [p. 5241.
Since all cutoffs are arbitrary, we have no purely technical criticism of this indicator. Rather, it is the definitions of “class” embodied in the Smith and Welch measure that seem problematic and possibly misleading to us, especially for policy purposes. In 1987, median annual white male personal income in the US. was just under $19,000 [Council of Economic Advisers, 1989, Table B-301. The official poverty line (also in 1987 dollars) was about $12,000. But then Smith and Welch’s lower bound for middle-class status lies barely a few hundred dollars above the poverty line. In other words, they implicitly ignore altogether the important (and commonly used) categories of “near-poor” or “working class,” preferring to treat anyone who even narrowly escapes poverty as “middle class.”
Analogously, Smith and Welch’s standard for membership in what they call the black male “elite”-four thirds of median white male personal income-is attainment of personal income of a t least $25,000 a year in 1987. Readers must decide for themselves whether and in what sense such a level of (mostly wage) income is usefully characterized as emblematic of “elite” status.
240 1 Inequality of Black Wages
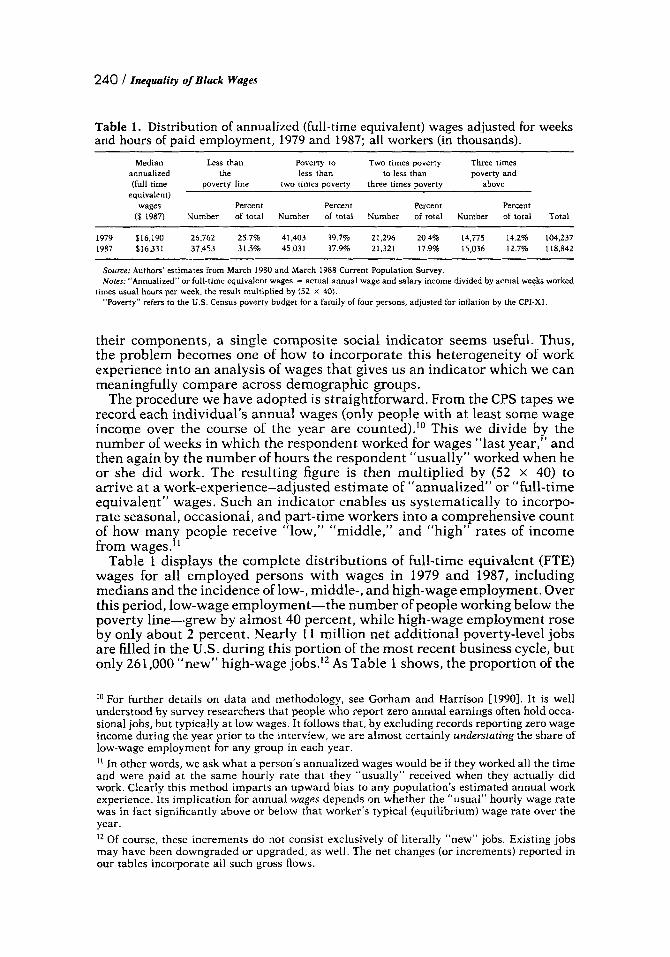
Table 1. Distribution of annualized (full-time equivalent) wages adjusted for weeks and hours of paid employment, 1979 and 1987; all workers (in thousands).
Median Less than Poveny to Two times poverty Three times annualized the less than lo less than poverty and (full-time poverty line two times poverty three times poverty above
equivalent) wages Percent Percent Percent Percent
($ 1987) Number a€ total Number of total Number of total Number of total Total
1979 $16.190 26.762 25.7% 41,403 39.7% 21,296 20.4% 14,775 14.2% 104,237 1987 $16.331 37,453 31.5% 45,031 37.9% 21,321 17.9% 15,036 12.7% 118.842
Source: Authors’ estimates from March 1980 and March 1988 Current Population Survey. Notes: ”Annualized” or Full-time equivalent wages = actual annual wage and salary income divided by actual weeks worked
“Poverty” refers to the US. Census poverty budget for a family of four persons. adjusted for inflarion by the CPI-XI. times usual hours per week, the result multiplied by (52 x 40).
their components, a single composite social indicator seems useful. Thus, the problem becomes one of how to incorporate this heterogeneity of work experience into an analysis of wages that gives us an indicator which we can meaningfully compare across demographic groups.
The procedure we have adopted is straightforward. From the CPS tapes we record each individual’s annual wages (only people with at least some wage income over the course of the year are counted).I0 This we divide by the number of weeks in which the respondent worked for wages “last year,” and then again by the number of hours the respondent “usually” worked when he or she did work. The resulting figure is then multiplied by (52 x 40) to arrive at a work-experience-adjusted estimate of “annualized” or “full-time equivalent” wages. Such an indicator enables us systematically to incorpo- rate seasonal, occasional, and part-time workers into a comprehensive count of how many people receive “low,” “middle,” and “high” rates of income from wages.”
Table 1 displays the complete distributions of full-time equivalent (FTE) wages for all employed persons with wages in 1979 and 1987, including medians and the incidence of low-, middle-, and high-wage employment. Over this period, low-wage employment-the number of people working below the poverty line-grew by almost 40 percent, while high-wage employment rose by only about 2 percent. Nearly 11 million net additional poverty-level jobs are filled in the U.S. during this portion of the most recent business cycle, but only 261,000 “new” high-wage jobs.” As Table 1 shows, the proportion of the
lo For further details on data and methodology, see Gorham and Harrison [1990]. It is well understood by survey researchers that people who report zero annual earnings often hold occa- sional jobs, but typically a t low wages. It follows that, by excluding records reporting zero wage income during the year prior to the interview, we are almost certainly understating the share of low-wage employment for any group in each year. I t In other words, we ask what a person’s annualized wages would be if they worked all the time and were paid at the same hourly rate that they “usually” received when they actually did work. Clearly this method imparts an upward bias to any population‘s estimated annual work experience. Its implication for annual wages depends on whether the “usual” hourly wage rate was in fact significantly above or below that worker’s typical (equilibrium) wage rate over the year. IZ Of course, these increments do not consist exclusively of literally “new” jobs. Existing jobs may have been downgraded or upgraded, as well. The net changes (or increments) reported in our tables incorporate all such gross flows.
Inequaiizy of Black Wuges / 241
work force earning poverty-level wages rose from 25.7 percent to 31.5 percent over this period, while the proportion earning three or more times poverty actually fell, from 14.2 percent to 12.7 percent.
Some scholars have suggested that this proliferation of low-wage employ- ment in the 1980s is mainly a consequence of the entry of the post-World War I1 “baby boom” generation into the labor market of the late 1970s [Lawrence, 19841. However, we find this argument inadequate to explain the proliferation of low-wage earners between 1979 and 1987. First, this time period occurs after the years when most of the baby boomers (born between 1945 and roughly 1960) entered the labor force for the first time. Indeed, the number of persons entering the labor pool each year actually declined in the 1980s, causing labor shortages in some areas of the country. If anything, we should have seen an increase in the percentage of low-wage earners during the 1970s, not the 1980s. Instead, the reverse was true [Gorham and Harrison, 1990; Harrison and Bluestone, 19881.
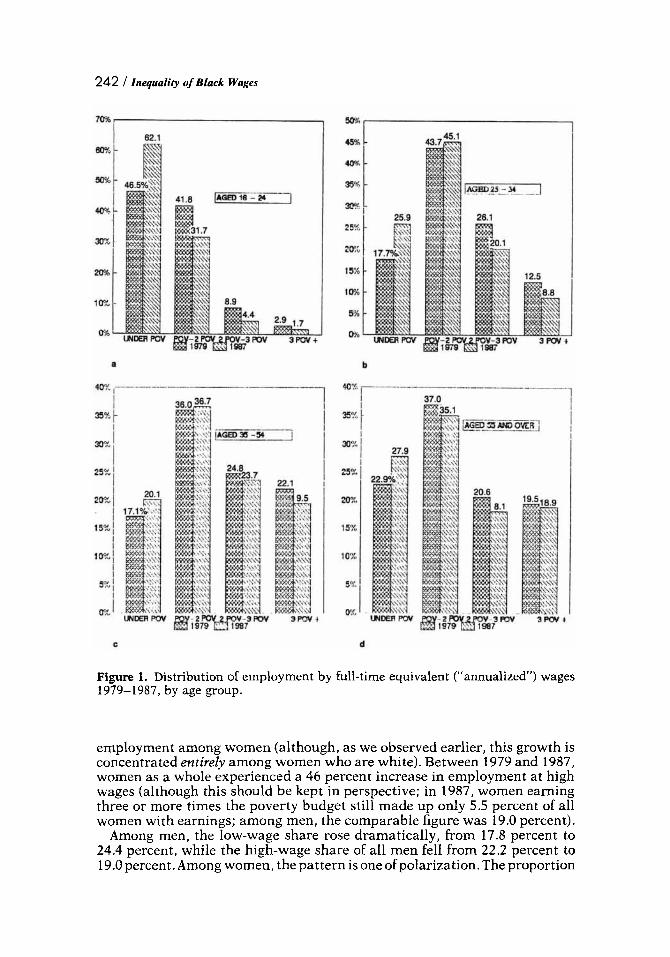
Second, if the problem of low wages were largely an outgrowth of the baby boom, we would not expect to find a significant increase in the percentage of low-wage workers among all age categories of employees. Yet Figure 1 clearly shows that during the 1980s the low end of the wage distribution became “thicker,” and the high end “thinner,” for every age group-a development which is also true for year-round, full-time employees [Harrison and Bluestone, 19881. Moreover, the data behind Figure 1 reveal that, of the overall 40 percent increase in working poverty since 1979, fully three fourths of this increase was among persons aged 25 and older (and three fifths was among persons over the age of 34). That findings such as these rather convincingly refute the baby boom hypothesis has now been generally acknowledged by other researchers [e.g., Burtless, 19891.
From a focus on age, we may now turn to gender. There has been much recent argument in policy research circles that the proliferation of low-wage employment is uniquely a problem for men. Also using CPS data, several researchers have suggested that-by any number of normative definitions of what constitutes “low” wages-the incidence of poverty-level employment among women has been declining during the 1980s [Burtless, 1989; Levy, 19881. But these studies do not adjust the data for work experience. Or if they do, it is by restricting the sample to year-round, usually full-time (YRFT) workers. This procedure clearly biases the results in favor of the highest-paid segment of the labor force, since wage rates and work experience (hours and weeks over the course of the year) are well-known to be positively correlated. But then restricting the samde to YRFT workers must also understate both gender and racial -wage digerentials CDarity and Myers, 1980; Heckman, 1989].13
Table 2 reports on changes over time in the distribution of annualized wages for men and women separately. There is certainly a strong gender difference in how the respective distributions have changed since the late 1970s. As do our predecessors, we also find a significant growth of high-wage
l 3 This criticism also applies to Harrison and Bluestone [1988, 19901. Working with a different unit of analysis-the roughly two thirds of the work force who were employed year round and (usually) full-time ( Y R R ) in 1979 and 1987-they have shown that, over this period, men experienced both a declining median anddownward redistribution. For YRFT women, downward redistribution was partly offset by a rising median [Harrison and Bluestone, 19901.
242 / Inequality of Black Wages
Figure 1. Distribution of employment by full-time equivalent (“annualized”) wages 1979-1987, by age group.
employment among women (although, as we observed earlier, this growth is concentrated entirely among women who are white). Between 1979 and 1987, women as a whole experienced a 46 percent increase in employment at high wages (although this should be kept in perspective; in 1987, women earning three or more times the poverty budget still made up only 5.5 percent of all women with earnings; among men, the comparable figure was 19.0 percent).
Among men, the low-wage share rose dramatically, from 17.8 percent to 24.4 percent, while the high-wage share of all men fell from 22.2 percent to 19.0 percent. Among women, the pattern is one of polarization. The proportion
Inequality of Black Wages 1 243
Table 2. Distribution of annualized (full-time equivalent) wages adjusted for weeks and hours of paid employment, 1979 and 1987; by gender (in thousands).
Median Less than Poverty to Two times poverty Three times annualized the less than to less than poverty and (full-time poverty line two times poverty three times poverty above
equivalent) wages Percent Percent Percent Percent
($ 1987) Number of total Number of total Number of total Number of total Total
Women 1979 $12,895 16,609 35.2% 22.456 47.6% 5,951 12.6% 2.112 4.5% 47.129 1987 $13,750 22,096 39.5% 23.315 41.7% 7,379 13.2% 3.084 5.5% 55,875
Men 1979 $20.878 10,153 17.6% 18.948 33.2% 15.345 26.9% 12,663 22.2% 57,110 1987 $20,000 15.357 24.4% 21.717 34.5% 13,943 22.1% 11,953 19.0% 62,971
Source: Authors’ estimates from March 1980 and March 1988 Current Population Survey. Notes: “Annualized” or full-time equivalent wages = actual annual wage and salary income divided by actual weeks worked
“Poverty” refers to the U S . Census poverty budget for a family of four persons, adjusted for inflation by the CPI-XI. times usual hours per week, the result multiplied by (52 x 40).
of women working under the poverty line rose, from 35.2 percent to 39.5 percent. But the proportion receiving wages and salaries at levels three or more times higher than poverty also increased, from4.5 percent to 5.5 percent. Finally, as for compositional effects on the growth in working poverty, Table 2 also shows that men accounted for almost half of the increment in aggregate low-wage employment since 1979. Just as we cannot dismiss the growth in the number and incidence of the working poor as primarily a problem of young persons recently entering the labor market, so the phenomenon cannot be said to be mainly associated with the increase in the labor-force participa- tion of women. These widely held “explanations” turn out to be simply in- correct.
RACIAL DIFFERENCES IN THE HISTORY OF EARNINGS INEQUALITY IN THE 19805
The results presented so far form a backdrop against which to evaluate our original question. We demonstrated earlier that there has indeed been a measurable increase in the number and proportion of African-American fami- lies with what are commonly considered to be “middle-class” incomes. The question now is this: To what extent have individual black workers gained increased access to high-level (and, for that matter, to middle-level) wage employment since 1979?
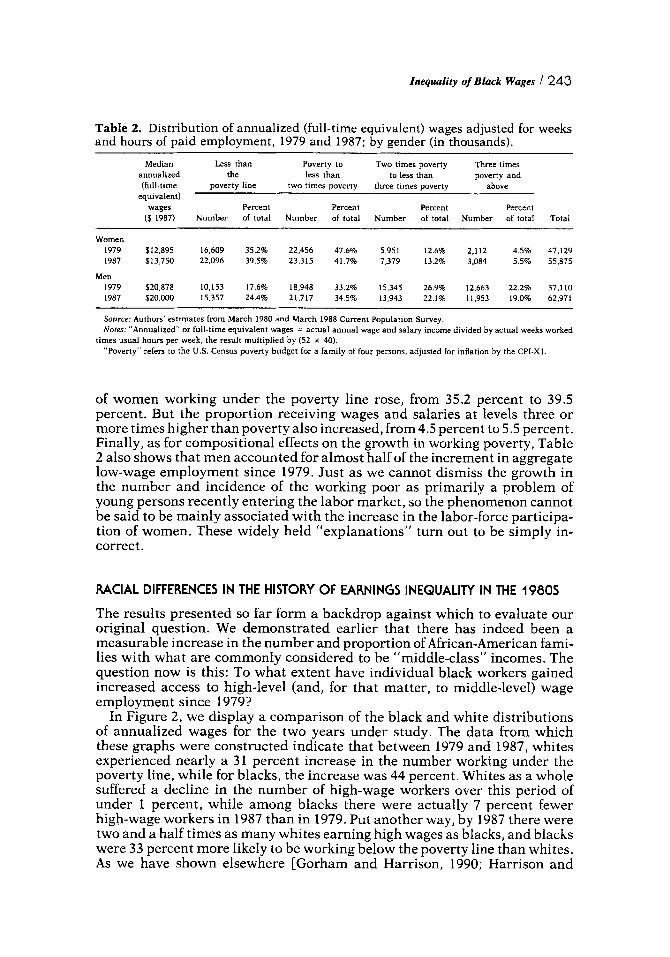
In Figure 2, we display a comparison of the black and white distributions of annualized wages for the two years under study. The data from which these graphs were constructed indicate that between 1979 and 1987, whites experienced nearly a 31 percent increase in the number working under the poverty line, while for blacks, the increase was 44 percent. Whites as a whole suffered a decline in the number of high-wage workers over this period of under 1 percent, while among blacks there were actually 7 percent fewer high-wage workers in 1987 than in 1979. Put another way, by 1987 there were two and a half times as many whites earning high wages as blacks, and blacks were 33 percent more likely to be working below the poverty line than whites. As we have shown elsewhere [Gorham and Harrison, 1990; Harrison and
244 Inequality of Black Wages
Figure 2. Distribution of employment by annualized wages, by race.
Bluestone, 1988,19901, these trends-especially at the low end of the distribu- tive spectrum-constitute a reversal of the pattern of the period 1963-1979, during which the proportion of jobs paying low wages was falling for all racial and demographic groups.
It has been suggested that these findings may be unacceptably sensitive to our choice of indicator, annualized wages. For example, if black hours of employment per week had risen substantially during the 1980s, actual black annual wage and salary income would exceed what we impute for annualized wages, since that index assumes that hours per week (along with wages per hour) are the same over the course of the year for all the weeks that people report having worked.
Unhappily, even when we look at actual annual wage and salary income of blacks, the proportion falling beneath the poverty line also increased (from 46.6 to 49.9 percent), while the number earning three times poverty declined (from 5.7 to 5.1 percent). The directions of change were the same for white workers [Gorham and Harrison, 19901. Apparently additional hours did not offset low hourly wage rates during the 1980s.
In searching for the existence of at least Some subset of the black population that has done well in the political-economic conditions of the last decade, we cross-tabulated age, race, and gender. The detailed statistics are not shown here, in the interest of brevity, but are available from the authors upon request. We will, however, briefly comment on them. Black women in their prime working years-ages 35-54-experienced greater progress than any other group in the African-American community, enjoying a 33 percent in- crease in the incidence of high-wage employment. But to put this into perspec-
Inequality of Black Wages 1 245
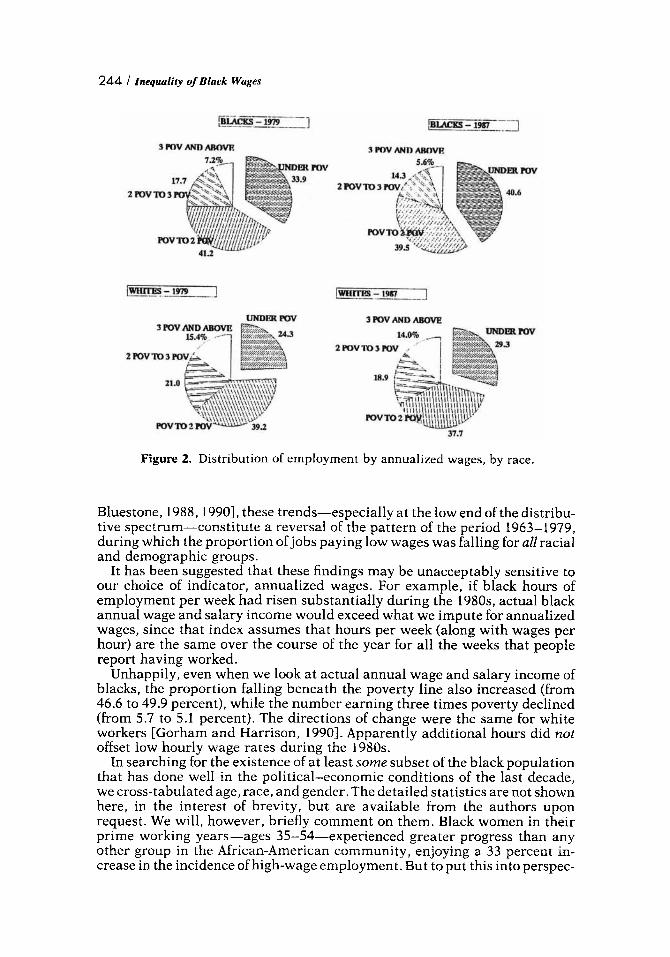
Figure 3. Distribution of employment by annualized wages, by race; men aged 25-34,
tive, there was also a 37 percent increase in poverty level employment among the same age-race-gender group. By comparison, white women in the same age bracket experienced an 88 percent increase in jos paying three or more times the poverty line, compared to a 38 percent increase in those earning poverty level wages.
In other words, even the demographic group with the greatest relative success in the 1980s underwent polarization in wages. Moreover, the high percentage increase in well-paying jobs for middle-age women is a classic example of growth from a low absolute base. For African-Americans in 1987, this relatively well-off group still constituted less than 5 percent of all black women aged 35-54.
But to us, the most stunning finding from this part of the Aspen-Ford study is the condition in the 1980s of black men in their late twenties and early thirties, depicted in Figure 3. The low annualized wages of the youngest group (aged 16-24) are no surprise. Both pathological and generally benign processes (such as the continuing sorting out of job and lifestyle opportunities and choices) are well known to explain the late “settling down” of this age group [Osterman, 19821. The statistics on white youths are not much different.
But consider what has happened in the past decade to black men aged 25-34. They have experienced a 161 percent increase in their numbers who work under the poverty line. Or, as Figure 3 expresses it, the share of all such persons earning below the poverty line nearly doubled in only eight years, from 18.4 percent to 34.0 percent. The share of black men in this age bracket who were successful enough to earn above three times the poverty line halved over the same period, from 10.8 percent of all such workers to 5.8 percent. And of course these statistics systematically understate the magnitude of the prob-
246 1 Inequality oJ Black Wages
lem by not counting those who have dropped out of the active labor force altogether and earn no (reported) wages. To discover such deprivation a full quarter century after the launching of the War on Poverty, in general, and the various programs targeted to black and other minority youth, in particular, is deeply disheartening.
RACIAL DIFFERENCES IN THE SCHOOLING-WAGES NEXUS
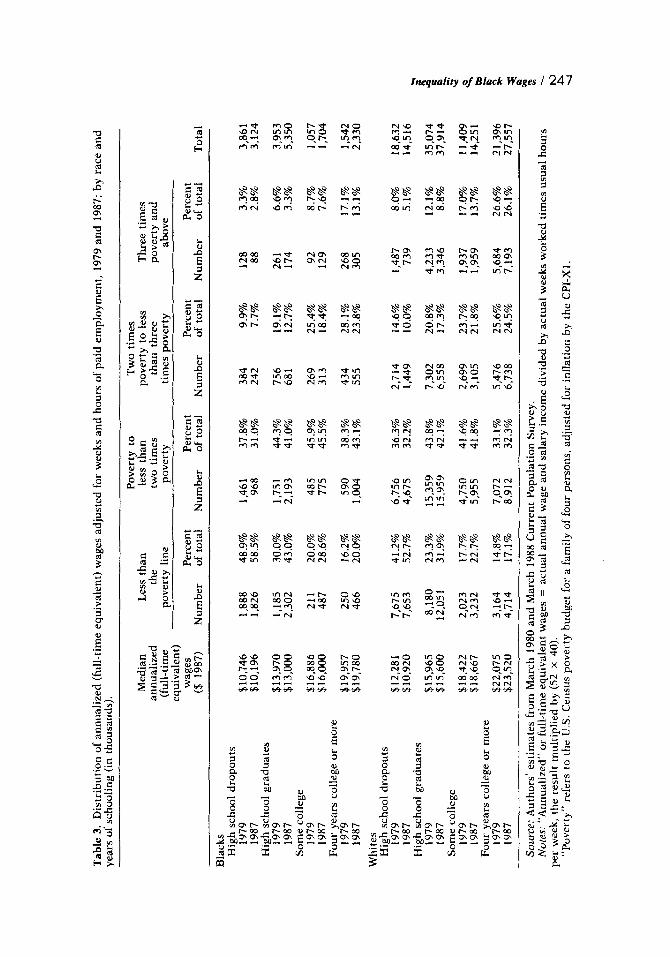
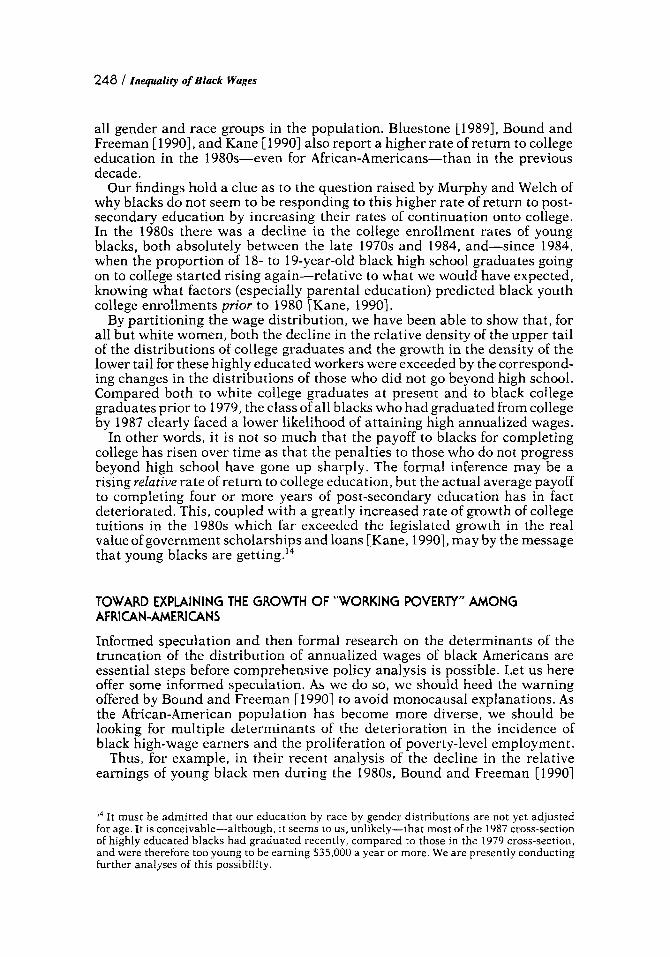
Our objective in this study was to seek evidence of growth since 1979 in the number and proportion of blacks earning more than $35,000 a year, adjusted for inflation. Such growth could account for the increasing proportion of high- income black families that we reported at the beginning of the paper. Instead, we found that the number and proportion of well-paid workers has actually fallen since 1979-even as the incidence of blacks working below the poverty line exploded. The question we address here is whether the experience of the most well-educated blacks, at least, has been qualitatively different. Table 3 displays the relevant statistics.
As is by now well known to the research community, continuing no farther than a high school diploma has hurt blacks seriously since 1979. Over the decade, African-Americans with no college education at all experienced a 34 percent increase in the number working below the poverty line (compared with a 24 percent increase among whites with the same amount of education). No surprise, here.
But now consider the comparative data on those who have completed four or more years of college. As the shaded columns of Table 3 indicate, in 1987 17.1 percent of whites with this much schooling still worked under the poverty line. Among blacks, the comparable proportion was 20 percent. Presumably these are mainly young people, still in university or just starting to work. But how shall we explain developments at the high end of the wage spectrum? Only a bit over one in eight African-American college graduates were earning as much as $35,000 a year in 1987. White college grads were twice as likely to be paid this much as were black with equivalent years of schooling (26.1 percent versus 13.1 percent).
Unpublished computations from the CPS on black men and black women taken separately show striking differences by gender. Let us compare the 1987 to the 1979 black CPS cross-sections. Over this period, the absolute number of African-American men with a four-year college education who received annualized wages of at least $35,000 did increase, by 467,000. But the number of well-educated African-American men receiving low wages grew even more, so that the fraction of all black male college graduates who had high wages actually fell-from 23.4 percent in 1979 to 19.5 percent in 1987.
Despite a net addition to the American labor force between 1979 and 1987 of 407,000 black women with at least four years of college, the number with high annualized wages actually declined absolutely, by 10,000. The share of such women who received high wages also fell, from 12.4 percent of all black women college graduates to 7.6 percent.
These results may explain a puzzle that recent research by others has brought to light. Murphy and Welch [1989] have documented the growth since the 1970s of the wage premium for college graduates, relative to those who do not go beyond high school. They find this gap to be growing across
Tab
le 3
. D
istr
ibut
ion
of a
nnua
lize
d (f
ull-
tim
e eq
uiva
lent
) w
ages
adj
uste
d fo
r w
eeks
and
hou
rs o
f pa
id e
mpl
oym
ent,
197
9 an
d 19
87; b
y ra
ce a
nd
year
s of s
choo
ling
(in
thou
sand
s).
Pove
rty
to
Tw
o ti
mes
T
hree
tim
es
annu
aliz
ed
the
two
tim
es
than
thr
ee
pove
rty
and
(ful
l-ti
me
pove
rty
line
po
vert
y ti
mes
pov
erty
ab
ove
equi
vale
nt)
Med
ian
Les
s th
an
less
tha
n po
vert
y to
les
s
Perc
ent
Perc
ent
wag
es
Perc
ent
Perc
ent
($ 1
987)
N
umbe
r of
tota
l N
umbe
r of
tot
al
Num
ber
of to
tal
Num
ber
of t
otal
T
otal
Bla
cks
Hig
h sc
hool
dro
pout
s
Hig
h sc
hool
gra
duat
es
1979
19
87
1979
19
87
1979
19
87
Som
e co
llege
Four
yea
rs c
olle
ge o
r m
ore
1979
19
87
Whi
tes
Hig
h sc
hool
dro
pout
s
Hig
h sc
hool
gra
duat
es
1979
19
87
1979
19
87
1979
19
87
1979
19
87
Som
e co
llege
Four
yea
rs c
olle
ge o
r m
ore
$10,
746
1,88
8 $1
0,19
6 1,
826
$13,
970
1,18
5 $1
3,00
0 2,
302
$16.
886
21 1
$16,
000
487
$19,
957
250
$19,
780
466
$12,
281
7,67
5 $1
0,92
0 7,
653
$15,
965
8,18
0 $1
5,60
0 12
,051
$18.
422
2,02
3 $1
8,66
7 3,
232
$22,
075
3,16
4 $2
3,52
0 4,
714
48.9
%
58.5
%
30.0
%
43.0
%
20.0
%
28.6
%
16.2
%
20.0
%
41.2
%
52.7
%
23.3
%
31.9
%
17.7
%
22.7
%
14.8
%
17.1
%
1,46
1 96
8
1,75
1 2,
193
485
775
5 90
1,00
4
6,75
6 4,
675
15,3
59
15.9
59
4,75
0 5,
955
7,07
2 8,
912
37.8
%
3 1 .O
%
44.3
%
4 1 .O
%
45.9
%
45.5
%
38.3
%
43.1
%
36.3
%
32.2
%
43.8
%
42.1
%
41.6
%
4 1.8
%
33.1
%
32.3
%
384
242
756
68 1
269
313
434
555
2,71
4 1,
449
7,30
2 6,
558
2,69
9 3,
105
5,47
6 6,
738
9.9%
7.
7%
19.1
%
12.7
%
25.4
%
18.4
%
28.1
%
23.8
%
14.6
%
10.0
%
20.8
%
17.3
%
23.7
%
2 1.
8%
25.6
%
24.5
%
128
3.3%
88
2.
8%
26 1
6.6%
17
4 3.
3%
92
8.7%
12
9 7 -
6%
268
17.1
%
305
13.1
%
1,48
7 8 .
O%
739
5.1%
4,23
3 12
.1%
3,
346
8.8%
1,93
7 17
.0%
1,
959
13.7
%
5,68
4 26
.6%
7,
193
26.1
%
3,86
1 3,
124
3,95
3 5,
350
1,05
7 1,
704
1,54
2 2,
330
18,6
32
14,5
16
2
35,0
74
$ s g
37,9
14
11,4
09
Q
14,2
5 1
2 1,
396
w 27
,557
= a’
2 la
P 4
Qa
Sour
ce: A
utho
rs’ e
stim
ates
fro
m M
arch
198
0 an
d M
arch
198
8 C
urre
nt P
opul
atio
n Su
rvey
. N
otes
: “A
nnua
lize
d” o
r fu
ll-t
ime
equi
vale
nt w
ages
= a
ctua
l an
nual
wag
e an
d sa
lary
inco
me
divi
ded
by a
ctua
l wee
ks w
orke
d ti
mes
usu
al h
ours
“Pov
erty
” re
fers
to
the
US
. Cen
sus
pove
rty
budg
et f
or a
fam
ily o
f fo
ur p
erso
ns, a
djus
ted
for
infl
atio
n by
the
CPI
-X1.
.
per
wee
k, t
he r
esul
t m
ulti
plie
d by
(52
x 4
0).
248 / Inequality of Black Wages
all gender and race groups in the population. Bluestone [1989], Bound and Freeman [ 19901, and Kane [ 19901 also report a higher rate of return to college education in the 1980s-even for African-Americans-than in the previous decade.
Our findings hold a clue as to the question raised by Murphy and Welch of why blacks do not seem to be responding to this higher rate of return to post- secondary education by increasing their rates of continuation onto college. In the 1980s there was a decline in the college enrollment rates of young blacks, both absolutely between the late 1970s and 1984, and-since 1984, when the proportion of 18- to 19-year-old black high school graduates going on to college started rising again-relative to what we would have expected, knowing what factors (especially parental education) predicted black youth college enrollments prior to 1980 [Kane, 19901.
By partitioning the wage distribution, we have been able to show that, for all but white women, both the decline in the relative density of the upper tail of the distributions of college graduates and the growth in the density of the lower tail for these highly educated workers were exceeded by the correspond- ing changes in the distributions of those who did not go beyond high school. Compared both to white college graduates at present and to black college graduates prior to 1979, the class of all blacks who had graduated from college by 1987 clearly faced a lower likelihood of attaining high annualized wages.
In other words, it is not so much that the payoff to blacks for completing college has risen over time as that the penalties to those who do not progress beyond high school have gone up sharply. The formal inference may be a rising da t i ve rate of return to college education, but the actual average payoff to completing four or more years of post-secondary education has in fact deteriorated. This, coupled with a greatly increased rate of growth of college tuitions in the 1980s which far exceeded the legislated growth in the real value of government scholarships and loans [Kane, 19901, may by the message that young blacks are getting.14
TOWARD EXPLAINING THE GROWTH OF "WORKING POVERTY" AMONG AFRICAN-AMERICANS
Informed speculation and then formal research on the determinants of the truncation of the distribution of annualized wages of black Americans are essential steps before comprehensive policy analysis is possible. Let us here offer some informed speculation. As we do so, we should heed the warning offered by Bound and Freeman [ 19901 to avoid monocausal explanations. As the African-American population has become more diverse, we should be looking for multiple determinants of the deterioration in the incidence of black high-wage earners and the proliferation of poverty-level employment.
Thus, for example, in their recent analysis of the decline in the relative earnings of young black men during the 1980s, Bound and Freeman [I9901
l 4 It must be admitted that our education by race by gender distributions are not yet adjusted for age. It is conceivable-although, i t seems to us, unlikely-that most of the 1987 cross-section of highly educated blacks had graduated recently, compared to those in the 1979 cross-section, and were therefore too young to be earning $35,000 a year or more. We are presently conducting further analyses of this possibility.
Inequaliq of Black Wages 1 249
account for the wage trends of midwestern blacks (vis-a-vis blacks in other regions) principally by changes in the industry and occupational structure of employment, by the decline in union membership, and by growth in the relative supply of blacks in the labor force. Shifts in interindustry demand, growth in the supply of other competing college graduates, and possibly the relaxation of equal protection laws are more important for explaining wage developments among African-American college graduates.
As we and others proceed toward developing a nuanced set of explanations for the dramatic reversals in the labor market status of African-Americans since 1979, further research might well investigate the racial impacts of the pronounced slowdown in the growth of government employment, in general, and of hiring and promotions associated with the administration of social welfare programs, in particular.’’ Moreover, given that, since at least the 1960s, unionization has been especially advantageous to blacks [Freeman and Medoff, 19841, the secular shift away from traditionally unionized sectors of the economy, the growing resistance of employers to trade unions, and the generally anti-labor tone of recent opinions by the U.S. Supreme Court [Clark, 1989; Freeman and Medoff, 19841 could be partly responsible for the trunca- tion of the black wage distribution by having eroded the black union wage premium [Blackburn, Bloom, and Freeman, 1989; Bluestone, 1989; Bound and Freeman, 19901.
Ongoing research by Barry Bluestone, Mary Stevenson, and Chris Tilly in Boston, and by John Kasarda in Chapel Hill, emphasizes the idea-central to Wilson’s own explanation for the growth of a black “underclass”-that the continuing structural shifts in the economy away from blue-collar manufac- turing have disproportionately reduced employers’ demands for the labor power of black workers, especially (but, as we have just seen, not exclusively) those with weak educational backgrounds and especially in the central cities of metropolitan areas. This is the so-called skills mismatch hypothesis, most recently associated with Kasarda [1989]. And we agree with Bound and Freeman that the relaxation of enforcement of equal protection laws and the sharply reduced funding of government-sponsored job training programs in the 1980s are also likely candidates for inclusion in the causal modeling that deserves the highest priority from the research community, in light of the descriptive findings presented here.
THE BLACK MIDDLE CLASS REVISITED
We have learned that, for all workers, between at least 1963 (the earliest year for which CPS microdata are available) and the late 1970s, the incidence of employment at poverty wages fell steadily, while the share of workers earning high wages rose. This was also true for “nonwhite” workers. l6 But since the late 1970s, these trends have been sharply reversed for most demograhic groups-what Harrison and Bluestone [ 1988, 19901 call the “Great U-Turn.”
l 5 For evidence that these sectors played a major role in advancing the economic position of blacks during the 1960s and early 1970s, see Brown and Erie [1981], Darity [1986], and Harrison and Osterman [ 19741. l6 Not until 1975 did the CPS permit a breakout of blacks from the superset “nonwhites.“ In the March 1980 CPS, blacks constituted 84 percent of all nonwhites who had some wages in 1979.
250 1 Inequality of Black Wages
In the course of the turn toward increasing polarization, blacks have suffered especially severe setbacks, so much so that the post-1979 black-white wage gap began to widen again [Bound and Freeman, 1990; Cotton, 19891.
Whatever the particular determinants of the changing parameters of these racial wage distributions, it seems likely that the recent expansion of the black middle class (as reflected in the data on family incomes) has been based neither on large increases in the number of high-wage individuals nor on the accumulation of personal wealth among blacks to levels remotely comparable to those attained by whites. And both because blacks tend to move to older working class “suburbs” and companies relocating to the urban ring may be deliberately avoiding areas with large black populations [Schneider and Phelan, 19901, African-American suburbanization has failed to provide the access to “good jobs at good wages” that has historically been part of the process of white social mobility. Thus, those black families that have attained middle-class status (at least in terms of income, if not of wealth) are likely to have done so mainly by “packaging” the typically substandard wages of several members of the family or household.
We do not claim to have invented the idea that certain groups must package incomes from multiple sources in order to (in Lee Rainwater’s felicitous expression) “get along.” Indeed, earlier research offered precisely this obser- vation on the condition of black Americans prior to the 1980s [Glasgow, 19801. What we have contributed to this ongoing assessment is the discovery that, since the late 1970s, the necessity for such a strategy for survival has in- creased-precisely at a time when it has become much more difficult for a great many African-American families to pursue it.
If single-earner households are to get along in the economic environment of the next decade, an ambitious social and economic development agenda must be reexamined. However difficult it may be to muster the organized political pressure (and to accept the inevitable public sector budgetary trade- offs), we are going to have to reconsider such policy elements as job-creation programs in both the private and public sectors, with designed-in opportuni- ties for upward mobility [Bluestone ahd Harrison, 19821; significant increases in the levels and coverage of income transfers, especially in the form of wage supplements [Ellwood, 19883; closer regulation of part-time work in order to progress toward the elimination of the systematic wage differential between part-time and full-time employees with equivalent schooling [Ehrenberg et al., 19881; and the provision of incentives to employers and schools to offer quality child care at affordable prices [Tilly, 19901. Perhaps the most radical policy intervention would be a combination of affirmative action in hiring and promotions, tighter government enforcement of the rights of workers in the service sector (where most women are employed) to organize collective representation, and substantially expanded transfers and greater hours of work that effectively allowed single mothers of any race to be paid something resembling the old “family wage“ once earned by white male factory workers and validated by the society at large.”
Virtually all existing policy proposals bearing on this subject-including those offered by Wilson himself-stress expansionary macroeconomic and
” On the related question of how and why society “forgives” certain forms of poverty but not others, see Katz [1989].
Inequali@ of Black Wages 1 25 1
government job-creation programs aimed at reducing the unemployment of black men, toward the objective of reunifying the black family. This is the element in Wilson’s contemporary version of underclass theory which most closely connects it to the (controversial) research and policy analysis of the 1960s, for example as embodied in the Moynihan Report on the status of black families [Katz, 19891. To the extent that such approaches can be successfully mounted, so much the better. And obviously the reduction of black male unemployment is a desirable social objective, in itself. But given the tenor (and the fiscal difficulties) of the times, it may be necessary to accept the growing incidence of black (as well as white) families with only a single female parent as a social “given,” and to work on devising policies for enabling such families to attain middle-class status, anyway.
The authors are grateful for comments, suggestions, criticism and data from Barry Bluestone, Philip Clay, Cecelia Conrad, William Darity, Jr., David Ellwood, Norman Fainstein, Robert Greenstein, Edward S . Hill, Christopher Jencks, Lawrence Kahn, Michael Katz, Lawrence Mishel, Isaac Shapiro, and Chris Tilly. Gordon MacInnes generously and constructively pointed out errors in an earlier draft. The editor of this Journal and his referees greatly helped us to clarify our main themes and to more closely relate our own research to the current literature in the field. Thanks, also, to Donna Dowd for preparing the original manuscript. The research was conducted under the auspices of the Rural Economic Policy Program of the Aspen Institute and the Ford Foundation, under Grant No. 880-041 1. The authors take full responsibility for the uses to which they have put this advice and these resources.
BENNETT HARRISON is Professor o f Political Economy at the School of Urban and Public Affairs, Carnegie Mellon University. LUCY GORHAM is on the staff of the U.S. Congressional Joint Economic Com- mittee, and is completing a doctoral dissertation at the Massachusetts Institute of Technology, analyzing the role of international trade in the declining economic position of workers with no college education.
REFERENCES
Appelbaum, Eileen (1987), “Restructuring Work: Temporary, Part Time, and At-home Employment,” in Heidi Hartmann (ed.), Computer Chips and Paper Clips: Technology and Women’s Employment (Washington DC: National Academy Press).
Barabba, Vincent P. (1979), “How Demograhic Changes Will Shape the ’80s.’’ Address before the annual meeting of the American Council of Life Insurance, December.
Blackburn, McKinley, David Bloom, and Richard Freeman (1989), “Why Has the Economic Position of Less-Skilled Male Workers Deteriorated in the United States?” in Gary Burtless (ed.), A Future ofLousy Jobs? (Washington, DC: The Brookings Institution).
Bluestone, Barry (1989), “Commentary on Blackburn, Bloom and Freeman,” in Gary Burtless (ed.), A Future ofLotlsy Jobs? (Washington, DC: The Brookings Institution).
Bluestone, Barry, and Bennett Harrison (1 982), The Deindustrialization of America (New York: Basic Books).
Bound, John, and Richard B. Freeman (1 990), “What Went Wrong? The Erosion of the Relative Earnings of Young Black Men in the 1980s.” Working paper. (Cambridge, MA: National Bureau of Economic Research), August.
Brown, Michael and Steven Erie (1981), “Blacks and the Legacy of the Great Society,” Public Policy (Summer).
252 1 Inequality of Black Wages
Burtless, Gary (1989), “Earnings Inequality over the Business Cycle,” in G. Burtless (ed.), A Future of Lousy Jobs? (Washington, DC: The Brookings Institution).
Christopherson, Susan (1 989). “Flexibility in the U .S. Service Economy and the Emerg- ing Spatial Division of Labour,” Transactions o f the British Institute of Geographers 14.
Clark, Gordon L. (1 989), Unions and Communities under Siege (Cambridge: Cambridge Univeristy Press).
Cotton, Jerimiah (1989), “Opening the Gap: The Decline in Black Economic Indicators in the 1980s,” Social Science Quarterly (Dec.), pp. 803-835.
Council of Economic Advisers (1989), Economic Report o f the President (Washington, DC: U.S. Government Printing Office), January.
Danziger, Sheldon, Peter Cottschalk, and Eugene Smolensky (1989), “How the Rich Have Fared: 1979- 1987.” American Economic Association, Papers and Proceedings 79, May.
Darity, William A., Jr. (1986), “The Managerial Class and Industrial Policy,” Industrial Relations, Spring, pp. 212-227.
Darity, William A., Jr. and Samuel L. Myers, Jr. (1980). “Changes in Black-White Inequality, 1968-78: A Decade of Progress?” Review of Black Political Economy, Summer.
Donahue, John (1989). Privatization (New York: Basic Books). Ehrenberg, Ronald, P. Rosenberg, and J. Li (1988), “Part-Time Employment in the
United States,” in R. Hart (ed.), Employment, Unemployment and Hours of Work (London: Allen and Unwin).
Ellwood, David (1988), Poor Support (New York: Basic Books). Freeman, Richard, and James Medoff (1984). What Do Unions Do? (New York: Basic
Books). Glasgow, Douglas G. (1980), The Black Underclass: Poverty, Unemployment, and Entrap-
ment of Ghetto Youth (New York: Random House). Gorham, Lucy, and Bennett Harrison (1990), Working below the Poverty Line (Washing-
ton, DC: Rural Economic Policy Program of the Aspen Institute), November. Harrison, Bennett, and Barry Bluestone (1 988), The Great U-Turn: Corporate Restructur-
ing and the Polarizing of America (New York: Basic Books). Harrison, Bennett, and Barry Bluestone (1990), “Wage Polarization in the U S . and the
‘Flexibility’ Debate,” Cambridge Journal ofEconornics 14 (September), pp. 351-373. Harrison, Bennett, and Paul Osterman (1974), “Public Employment and Urban Pov-
erty,” Urban Affairs Quarterly, March. Heckman, James (1989), “The Impact of Government on the Economic Status of Black
Americans,” in Steven Shulman and William A. Darity, Jr. (eds.), The Question of Discrimination: Racial Inequality in the U S . Labor Market (Middletown, CT: Wes- leyan University Press).
Kane, Thomas (1990), “College Entry by Blacks Since 1970: The Role of Tuition, Financial Aid, Local Economic Conditions and Family Background.” Working paper. John F. Kennedy School of Government, Harvard University.
Kasarda, John (1989), “Urban Industrial Transition and the Underclass,” Annals of the American Academy of Political and Social Science, January.
Katz, Michael (1989), The Undeserving Poor (New York: Panetheon). Lawrence, Robert Z. (1984), “Sectoral Shifts and the Size of the Middle Class,” The
Brookings Review, Fall. Levy, Frank (1988), “Incomes, Families, and Living Standards,” in Robert Litan,
Robert Z. Larence, and Charles L. Schultz (eds)., America’s Living Standards (Wash- ington, DC: The Brookings Institution).
lnequaliry of Black Wages 1 253
Malveaux, Julianne (1985), “The Economic Interests of Black and White Women: Are They Similar?” Review of Black Political Economy, (1) (Summer) pp. 5-28.
Michel, Robert C. (19911, “Economic Growth and Income Equality Since the 1982 Recession,” Journal of Policy Analysis and Management, 10(2), pp. 18 1-203.
Murphy, Kevin, and Finis Welch (1989), “Wage Premiums for College Graduates: Recent Growth and Possible Explanations,“ Educationai Researcher (May), pp.
Osterman, Paul (1982), Getting Started: The Youth LaborMarket(Cambridge, MA: M.I.T. Press).
Pear, Robert (1985), “Temporary Hiring by U.S. Is Pushed under New Policy,” New York Times, January 2, p. 1.
Ruggles, Patricia (1990), Drawing the Line: Alternative Poverty Measures and Their Implications for Public Policy (Washington, DC: The Urban Institute).
Schneider, Mark, and Thomas Phelan (1990), “Blacks and Jobs: Never the Twain Shall Meet?” Urban Afairs Quarterly 26(2) (December), pp. 299-312.
Smith, James P., and Finis R. Welch (1989), “Black Economic Progress After Myrdal,” Journal of Economic Literature 27 (June), pp. 519-564.
“Survey of Consumer Finances 1983” (1984), Federal Reserve Bulletin, 70(9), (Sep- tember).
Tilly, Chris (1990), “Short Hours, Short Shift: The Causes and Consequences of Part- Time Work,” (Washington, DC: Economic Policy Institute), December.
US. Congressional Budget Office (1989), “Social Representation in the U.S. Military,” Washington, DC, October.
US. Department of Commerce, Bureau of the Census (1981), Money Income of House- holds in the United States: I979 Current Population Reports, Series P-60, No. 126 (Washington, DC: U.S. Government Printing Office), June.
US. Department of Commerce, Bureau of the Census (1988), Money Income and Poverty Status in the United States: I987 (Advance Data from the March I988 Current Popula- tion Survey) Current Population Reports, Series P-60, No. 161 (Washington, DC: U.S. Government Printing Office), September.
Vietorisz, Thomas, and Bennett Harrison (1973), “Labor Market Segmentation: Posi- tive Feedback and Divergent Development,” American Economic AssociationlPro- ceedings, May.
17-26.


![No. 4.] APRIL, 1937. EMPLOYMENT, WAGES, COST OF ...](https://static.fdokumen.com/doc/165x107/63179b7c9076d1dcf80bdeec/no-4-april-1937-employment-wages-cost-of-.jpg)