GROW NG - ShareData Online
96
GROW NG BETTER BRANDS Annual Report 2013 Integrated Annual Report 2013
-
Upload
khangminh22 -
Category
Documents
-
view
0 -
download
0
Transcript of GROW NG - ShareData Online

Vision and mission
We boldly aim to double our earnings by February 2014 (from 1 March 2012)
OUR VISIONWe are clearly focused on becoming the preferred
verti cally integrated franchisor in Africa – not by size
but by excelling in our chosen areas of diversifi ed
operati on. We believe being the best means that
superior returns for franchisees and stakeholders
are just as important as responsible governance and
corporate citi zenship.
OUR MISSIONTaste is a South African-based management group that is invested in a portf olio of mostly franchised, category specialist and formula-driven, quick-service restaurant and retail brands that have the following characteristi cs:
They are sustainably and compellingly branded, where the brand itself is an important diff erenti ati ng factor.
They can reasonably be developed to be the South African customer’s fi rst choice in the categories in which they trade.
They maintain value leadership through operati onal excellence supported by high volumes relati ve to the category in which they trade.
They have common customers in the broad middle market and off er these customers strong value propositi ons relati ve to their segment.
The value propositi on and brand equity is driven by relati vely large marketi ng funds within their segment.
On balance, they off er sustainable returns to franchisees commensurate with the capital investment, risk and eff ort incurred to own and operate an individual outlet.
Each format is appropriately diff erenti ated but complementary, relati ve to the balance of the Taste portf olio.
Each format off ers opportuniti es for verti cal integrati on such that material profi t streams can reasonably be expected from sourcing and distributi on, franchise management royalti es and company store ownership.
Each format both adds and derives value from being part of the Taste portf olio greater than would be possible as a standalone enti ty.
G R O W N G
BETTER BRANDS
www.tasteholdings.co.za
Annual Report 2013
Food
STERLING
Jewellery
Integrated Annual Report 2013

Group at a glance
Food division
Taste’s food franchise division consists of the Scooters Pizza, Maxi’s, St Elmo’s and The Fish and Chip Co. brands (528 outlets)5. The portfolio of brands now targets consumers from LSM 4 – 10, each with strong value propositions and continuous product and promotional innovation.• Maxi’s (70 outlets) – An award-winning casual-dining restaurant format
serving breakfast, lunch and dinner. It competes in the same competitive set as Wimpy, Dulce and Mugg & Bean and is focused on adding value to consumers through a superior quality food offering; evolving promotions and contemporary appeal.
• Scooters Pizza (136 outlets) – The second-largest pizza delivery chain in South Africa. It competes in the same category as Debonairs Pizza, Romans Pizza and Pizza Perfect, focusing on delivery leadership and value for money; communicated in a brand that has attitude and humour.
• St Elmo’s (26 outlets) – This 26-year old brand has the Western Cape as its stronghold. Its premium pizza offering, supported through its Woodfired cooking method and diverse menu, distinguish this brand within the pizza category.
• The Fish and Chip Co. (296 outlets) – The largest take-away fish brand in South Africa by units. It competes in the same category as Old Fashioned Fish and Chips, focusing on good quality, affordable food. The low set-up costs make the brand the fastest growing mainstream franchise in South Africa.
Scooters Pizza – TakeawayMaxi’s – Restaurant – TakeawaySt Elmo’s – Restaurant – TakeawayThe Fish and Chip Co. – Takeaway
R850 000 – R950 000R1.8 million – R2.3 millionR850 000 – R1.3 millionR2.5 millionR950 000R483 000
Jewellery division
7%6%6%7%7%R550 ex VAT per week
NWJ (77 outlets)5 is the only vertically integrated, franchised jewellery chain in South Africa. It owns and operates approximately 23% of the outlets; provides franchise services to its franchisees; and distributes 100% of the goods sold through the NWJ outlets. Of these goods sold approximately 40% is produced by the in-house manufacturing facility. NWJ competes with American Swiss, Galaxy and Sterns and is the second-largest chain in South Africa by advertising spend; and the third-largest by sales and outlets. It competes on demonstrable value, guaranteed quality and a wide range.
As the only vertically integrated and franchised jewellery chain, it has a structural competitive difference in its competitive set. This allows for in-house innovation; fast routes to markets; and greater control over input costs. The franchise model empowers owners to attract and retain customers; produces large marketing funds and capital for growth is provided by franchisees.
nWJ
FOOD SERVICES
The food services division currently manufactures all pizza sauces, bastings and table sauces for all the brands within the food franchise division, as well as selected external customers. It does so from a SABS HACCP2 accredited facility located in Cape Town. Furthermore, it manufactures pizza toppings and other value-added meat products from a manufacturing facility in Pretoria which will be HACCP2 accredited in the future. It warehouses and distributes to over 500 franchises through two depots located in Johannesburg and Cape Town.
5%4%4%5%5% R550 ex VAT per week
90 m2 – 100 m2
180 m2 – 250 m2
40 m2 – 100 m2
250 m2 – 400 m2
80 m2 – 100 m2 60 m2 – 100 m2
MANuFACTuRING AND DISTRIBuTION
As a vertically integrated chain this division is responsible for group procurement, styling and design and distribution to franchisees. As the second-largest jewellery group in South Africa the group is able to source large volumes at lowest cost from both within and outside South Africa. Combined with in-house manufacturing this gives the group merchandise flexibility and relatively short lead times. The group owns a number of brands which it retails through its national network, spanning watches, male jewellery and gold products. All ring designs are conceptualised in-house and the group has more than 10 000 ring moulds and designs.
R1 450 000 5% 4% 60 m2
Notes:1. LSM – “Living standards measure”.2. HACCP – “Hazard Analysis Critical Control Point System”.3. This is approximate and excludes VAT.4. This is based on a percentage of turnover.5. All store numbers as at 31 May 2013.
EMPLOyEES
• Number of employees – 196.
EMPLOyEES
• Number of employees – 254.
www.nwj.co.za
HIGHLIGHTS • System-wide sales exceed
R1billion for the division, an increase of 70%.
• Same-store sales increase of re-imaged Scooters Pizza and St Elmo’s outlets.
• The Fish and Chip Co. exceed 300 outlets.
STRATEGIC PRIORITIES
• Plan to expand into two new sub-equatorial African countries.
• Improve same-store sales.• Revamp Scooters Pizza.
HIGHLIGHTS• Same-store sales for corporate
stores exceed 14% for the year.• Voted 1st place in the “Daily News
your Choice Awards” and 2nd place in the Times and sowetan Retail Awards for 2012.
• Launched NWJ-branded credit offering through a third party credit provider.
STRATEGIC PRIORITIES
• To focus on improving franchisees ability to mimic corporate store performance.
• New store growth.
SEGMENTAL INFORMATIONSegment revenue
% change
28 February 2013
ReviewedR’000
29 February 2012
AuditedR’000
Food 152 315 329 125 121Franchise 131 388 74 965Food services 183 681 47 679Retail 260 2 477
Segment operating profit
Food 22 30 944 25 428Franchise 30 735 22 479Food services 893 3 577Retail (684) (628)
Segment assets
Food 179 690 168 891Franchise 106 234 99 939Food services 73 316 67 553Retail 140 1 399
SEGMENTAL INFORMATIONSegment revenue
% change
28 February 2013
ReviewedR’000
29 February 2012
AuditedR’000
Jewellery 10 198 665 180 872Franchise and wholesale 121 484 123 946Retail 77 181 56 844Concession retail – 82
Segment operating profit
Jewellery 24 28 655 23 097Franchise and wholesale 10 404 13 778Retail 18 251 9 333Concession retail – (14)
Segment assets
Jewellery 116 241 99 511Franchise and wholesale 65 683 62 919Retail 50 558 36 592Concession retail – –
Country of incorporation and domicile South Africa
nature of business and principal activities The main object of the company is to carry on business as restaurateurs and franchisors.
Directors Carlo Ferdinando GonzagaDuncan John CrossonJay Bayne CurrieKevin UtianHylton Roy RabinowitzLuigi GonzagaRamsay L’Amy DalyEvangelos TsatsarolakisAnthony BermanWessel Petrus van der Merwe Sebastian Patel
Registered office 12 Gemini streetLinbro Business Parksandton2065
Business address 12 Gemini streetLinbro Business Parksandton2065
Postal address PO Box 1125FerndaleRandburg2160
Auditors BDO South Africa IncorporatedChartered Accountants (SA)Registered Auditors
secretary Monika Pretorius
Company registration number 2000/002239/06
Administration
Mid
nigh
t St
ar
Set-up cost3 Royalty4 Marketing fund contribution4 Average store size
Set-up cost3 Royalty4 Marketing fund contribution4 Average store size
iFC Group at a glance
1 Financial highlights
2 Seven-year review
4 Directorate
6 Executive committee
9 Store distribution
10 Business model
11 Investment proposition
14 Chairman’s report
15 Chief Executive Officer’s report
20t Performance
28 Corporate governance
37 Annual financial statements
iBC Administration
Contents
Divisional contribution to group
Revenue
Jewellery franchise and wholesale
Food franchise
Food services
Jewellery retail
24%
25%36%
15%
Operating profit
Jewellery franchise and wholesale
Food retail
Food franchise
Food services
Jewellery retail
17%
52%
1%
31% (1%)
System-wide sales
Food
Jewellery retail
81%
19%
Number of stores
Pizza
Maxi’s
FCC
nWJ
27%
12%49%
13%

Vision and mission
We boldly aim to double our earnings by February 2014 (from 1 March 2012)
OUR VisiOn We are clearly focused on becoming the preferred
vertically integrated franchisor in Africa – not by size
but by excelling in our chosen areas of diversified
operation. We believe being the best means that
superior returns for franchisees and stakeholders
are just as important as responsible governance and
corporate citizenship.
OUR missiOn Taste is a South African-based management group that is invested in a portfolio of mostly franchised, category specialist and formula-driven, quick-service restaurant and retail brands that have the following characteristics:
They are sustainably and compellingly branded, where the brand itself is an important differentiating factor.
They can reasonably be developed to be the south African customer’s first choice in the categories in which they trade.
They maintain value leadership through operational excellence supported by high volumes relative to the category in which they trade.
They have common customers in the broad middle market and offer these customers strong value propositions relative to their segment.
The value proposition and brand equity is driven by relatively large marketing funds within their segment.
On balance, they offer sustainable returns to franchisees commensurate with the capital investment, risk and effort incurred to own and operate an individual outlet.
Each format is appropriately differentiated but complementary, relative to the balance of the Taste portfolio.
Each format offers opportunities for vertical integration such that material profit streams can reasonably be expected from sourcing and distribution, franchise management royalties and company store ownership.
Each format both adds and derives value from being part of the Taste portfolio greater than would be possible as a standalone entity.
Integrated Annual Report 2013
G R O W N G
BETTER BRANDS
www.tasteholdings.co.za
Integrated Annual Report 2013
Food
STERLING
Jewellery

Group at a glance
Food division
Taste’s food franchise division consists of the Scooters Pizza, Maxi’s, St Elmo’s and The Fish and Chip Co. brands (528 outlets)5. The portfolio of brands now targets consumers from LSM 4 – 10, each with strong value propositions and continuous product and promotional innovation.• Maxi’s (70 outlets) – An award-winning casual-dining restaurant format
serving breakfast, lunch and dinner. It competes in the same competitive set as Wimpy, Dulce and Mugg & Bean and is focused on adding value to consumers through a superior quality food offering; evolving promotions and contemporary appeal.
• Scooters Pizza (136 outlets) – The second-largest pizza delivery chain in South Africa. It competes in the same category as Debonairs Pizza, Romans Pizza and Pizza Perfect, focusing on delivery leadership and value for money; communicated in a brand that has attitude and humour.
• St Elmo’s (26 outlets) – This 26-year old brand has the Western Cape as its stronghold. Its premium pizza offering, supported through its Woodfired cooking method and diverse menu, distinguish this brand within the pizza category.
• The Fish and Chip Co. (296 outlets) – The largest take-away fish brand in South Africa by units. It competes in the same category as Old Fashioned Fish and Chips, focusing on good quality, affordable food. The low set-up costs make the brand the fastest growing mainstream franchise in South Africa.
Scooters Pizza – TakeawayMaxi’s – Restaurant – TakeawaySt Elmo’s – Restaurant – TakeawayThe Fish and Chip Co. – Takeaway
R850 000 – R950 000R1.8 million – R2.3 millionR850 000 – R1.3 millionR2.5 millionR950 000R483 000
Jewellery division
7%6%6%7%7%R550 ex VAT per week
NWJ (77 outlets)5 is the only vertically integrated, franchised jewellery chain in South Africa. It owns and operates approximately 23% of the outlets; provides franchise services to its franchisees; and distributes 100% of the goods sold through the NWJ outlets. Of these goods sold approximately 40% is produced by the in-house manufacturing facility. NWJ competes with American Swiss, Galaxy and Sterns and is the second-largest chain in South Africa by advertising spend; and the third-largest by sales and outlets. It competes on demonstrable value, guaranteed quality and a wide range.
As the only vertically integrated and franchised jewellery chain, it has a structural competitive difference in its competitive set. This allows for in-house innovation; fast routes to markets; and greater control over input costs. The franchise model empowers owners to attract and retain customers; produces large marketing funds and capital for growth is provided by franchisees.
nWJ
FOOD SERVICES
The food services division currently manufactures all pizza sauces, bastings and table sauces for all the brands within the food franchise division, as well as selected external customers. It does so from a SABS HACCP2 accredited facility located in Cape Town. Furthermore, it manufactures pizza toppings and other value-added meat products from a manufacturing facility in Pretoria which will be HACCP2 accredited in the future. It warehouses and distributes to over 500 franchises through two depots located in Johannesburg and Cape Town.
5%4%4%5%5% R550 ex VAT per week
90 m2 – 100 m2
180 m2 – 250 m2
40 m2 – 100 m2
250 m2 – 400 m2
80 m2 – 100 m2 60 m2 – 100 m2
MANuFACTuRING AND DISTRIBuTION
As a vertically integrated chain this division is responsible for group procurement, styling and design and distribution to franchisees. As the second-largest jewellery group in South Africa the group is able to source large volumes at lowest cost from both within and outside South Africa. Combined with in-house manufacturing this gives the group merchandise flexibility and relatively short lead times. The group owns a number of brands which it retails through its national network, spanning watches, male jewellery and gold products. All ring designs are conceptualised in-house and the group has more than 10 000 ring moulds and designs.
R1 450 000 5% 4% 60 m2
Notes:1. LSM – “Living standards measure”.2. HACCP – “Hazard Analysis Critical Control Point System”.3. This is approximate and excludes VAT.4. This is based on a percentage of turnover.5. All store numbers as at 31 May 2013.
EMPLOyEES
• Number of employees – 196.
EMPLOyEES
• Number of employees – 254.
www.nwj.co.za
HIGHLIGHTS • System-wide sales exceed
R1billion for the division, an increase of 70%.
• Same-store sales increase of re-imaged Scooters Pizza and St Elmo’s outlets.
• The Fish and Chip Co. exceed 300 outlets.
STRATEGIC PRIORITIES
• Plan to expand into two new sub-equatorial African countries.
• Improve same-store sales.• Revamp Scooters Pizza.
HIGHLIGHTS• Same-store sales for corporate
stores exceed 14% for the year.• Voted 1st place in the “Daily News
your Choice Awards” and 2nd place in the Times and sowetan Retail Awards for 2012.
• Launched NWJ-branded credit offering through a third party credit provider.
STRATEGIC PRIORITIES
• To focus on improving franchisees ability to mimic corporate store performance.
• New store growth.
SEGMENTAL INFORMATIONSegment revenue
% change
28 February 2013
ReviewedR’000
29 February 2012
AuditedR’000
Food 152 315 329 125 121Franchise 131 388 74 965Food services 183 681 47 679Retail 260 2 477
Segment operating profit
Food 22 30 944 25 428Franchise 30 735 22 479Food services 893 3 577Retail (684) (628)
Segment assets
Food 179 690 168 891Franchise 106 234 99 939Food services 73 316 67 553Retail 140 1 399
SEGMENTAL INFORMATIONSegment revenue
% change
28 February 2013
ReviewedR’000
29 February 2012
AuditedR’000
Jewellery 10 198 665 180 872Franchise and wholesale 121 484 123 946Retail 77 181 56 844Concession retail – 82
Segment operating profit
Jewellery 24 28 655 23 097Franchise and wholesale 10 404 13 778Retail 18 251 9 333Concession retail – (14)
Segment assets
Jewellery 116 241 99 511Franchise and wholesale 65 683 62 919Retail 50 558 36 592Concession retail – –
Country of incorporation and domicile South Africa
nature of business and principal activities The main object of the company is to carry on business as restaurateurs and franchisors.
Directors Carlo Ferdinando GonzagaDuncan John CrossonJay Bayne CurrieKevin UtianHylton Roy RabinowitzLuigi GonzagaRamsay L’Amy DalyEvangelos TsatsarolakisAnthony BermanWessel Petrus van der Merwe Sebastian Patel
Registered office 12 Gemini streetLinbro Business Parksandton2065
Business address 12 Gemini streetLinbro Business Parksandton2065
Postal address PO Box 1125FerndaleRandburg2160
Auditors BDO South Africa IncorporatedChartered Accountants (SA)Registered Auditors
secretary Monika Pretorius
Company registration number 2000/002239/06
Administration
Mid
nigh
t St
ar
Set-up cost3 Royalty4 Marketing fund contribution4 Average store size
Set-up cost3 Royalty4 Marketing fund contribution4 Average store size
iFC Group at a glance
1 Financial highlights
2 Seven-year review
4 Directorate
6 Executive committee
9 Store distribution
10 Business model
11 Investment proposition
14 Chairman’s report
15 Chief Executive Officer’s report
20t Performance
28 Corporate governance
37 Annual financial statements
iBC Administration
Contents
Divisional contribution to group
Revenue
Jewellery franchise and wholesale
Food franchise
Food services
Jewellery retail
24%
25%36%
15%
Operating profit
Jewellery franchise and wholesale
Food retail
Food franchise
Food services
Jewellery retail
17%
52%
1%
31% (1%)
System-wide sales
Food
Jewellery retail
81%
19%
Number of stores
Pizza
Maxi’s
FCC
nWJ
27%
12%49%
13%

1
Integrated Annual Report 2013
Financial highlights
Non-financial highlightsExceeded
600 outlets
NWJ retail achieved 14% growth on same-store sales
GEARING2
(2012: 24%)26%
CAsh CoNvERsIoN3
(2012: 0.9:1)
(Target: 1:1)0.7:1
INtEREst CovER1
(2012: 9 times)10 times
DIvIDEND CovER
(2012: 3.1)
(Target: 2.5 – 3.0)2.5
opERAtING pRoFIt mARGIN
(2012: 12%)8%
Costs % oF REvENuE4
(2012: 32%)30%
Bedded down the Fish and Chip Co.
acquisition
Launched 2 food distribution depots
16 outlets outside sA
28% increase in the dividend per share
1 Earnings before interest, tax and depreciation (EBITDA), divided by net interest paid.2 Interest-bearing borrowings less cash, divided by total shareholder interest.
3 Cash generated by operations divided by EBITDA.4 Operating expenses expressed as a percentage of revenue.
66%
to R506.4 million(2012: R304.3 million)
to R51.8 million(2012: R41.7 million)
to R42.9 million(2012: R35.2 million)
to 5.1 cents per share(2012: 4 cents per share)
22%24% 28%
Revenue EBItDA Operating profit
to 13.3 cents(2012: R12.4 cents)
7%
headline earnings per share
to 15.1 cents(2012: 12.4 cents)
22%
Normalised headline earnings per share
to R1.38 billion(2012: R909 million)
52%
system-wide sales
Dividend per share
to 25.9 million(2012: R21.4 million)
21%
headline earnings

Integrated Annual Report 2013
2
Growing better brands
seven-year review
Key indicators
28 February 2006
R’000
28 February 2007
R’000
29 February 2008
R’000
28 February 2009
R’000
28 February 2010
R’000
28 February 2011
R’000
29 February 2012
R’000
28 February2013
R’0007-yearCAGR*
Revenue 20 916 29 507 33 793 136 345 199 706 233 751 304 264 506 431 58%Operating profit 4 418 10 649 11 715 25 585 26 927 30 768 35 181 42 892 38%total stores 120 147 161 260 275 329 543 602 26%system-wide sales 241 000 308 000 373 000 567 000 676 000 752 000 909 000 1 380 000 28%hEps (cents) 3.0 6.6 7.9 10.2 9.3 10.7 12.4 13.3 24%* Compound annual growth rate – this is calculated from audited figures from February 2006.
Syst
em-w
ide
sale
s* fr
om 2
000
– 20
13
* System-wide sales are sales from all stores to customers. ** For the year ended 28/29 February.
R’m
illio
n
1 400
1 300
1 200
1 100
1 000
900
800
700
600
500
400
300
200
100
02001 2002 2003 2004 2005 2006 2007 2008 2009 2010 2011 2012 2013
R4.3 mR34 m
R86 m
R121 mR170 m
R241 m
R373 m
R567 m
R676 m
R752 m
R909 m
R1.38 b
R308 m
**

3
Integrated Annual Report 2013
milestones
2000
2005
2010 2012 2013
2001
2006
2011
2002
2007
2003
2008
2004
2009
scooters pizza was the founding entity of taste holdings. the first store opened in september 2000, in Westville, Durban
scooters pizza opened seven outlets by December 2000
scooters pizza acquired Chess pizza and converted seven outlets scooters pizza expanded to Gauteng opening three stores in one day
scooters pizza won FAsA Newcomer Franchisor of the Year and the FAsA Brand Builder of the Year
scooters pizza opened their outlet in just 48 months
NWJ won FAsA Newcomer Franchisor of the year award
scooters pizza acquired maxi’s, with 28 stores
Builts maxi’s to third-largest player in its category
scooters pizza won FAsA Brand Builder of the Year, an award it won four times
scooters pizza renamed taste holdings to pursue the strategy of a diversified franchisor taste holdings listed on the Alternative Exchange of the JsE
scooters pizza voted best pizza in Jo’burg in the Leisure Options Readers’ Choice Award
scooters pizza won FAsA Brand Builder of the Year for the third time
Declared maiden dividend of three cents per share
moved to main board of JsE
opened over 100 the Fish and Chip Co. outlets in 12 months
Established two distribution depots servicing more than 500 of its food franchises
maxi’s and NWJ finalists in FASA Franchisor of the Year Awards
Launched Buon Gusto food services
Acquired NWJ Quality Jewellers with 58 outlets, built NWJ to second largest jewellery group in sA
Acquired strategic BJ’s sites and converted them to maxi’s
Acquired the Fish and Chip Co., a market leader in its segment
27% compound annual growth rate for last six years in hEps
Launched NWJ credit card facility
Acquired st Elmo’s Woodfired Pizza, a then 23-year old pizza brand
maxi’s won FAsA Franchisor of the Year
scooters pizza10-years young Exceeded R750 million
system-wide sales
scooters pizza won FAsA Brand builder of the year
scooters pizza became a member of the proudly south African campaign.
scooters pizza opened first outlet in Western Cape

Integrated Annual Report 2013
4
Board of directorsNon-executive directors
Kevin is the CEO of Coricraft (Pty) Ltd, having taken up this position in April 2012. prior to this he spent 16 years at Nandos formatively as Managing Director of Nando’s south Africa and thereafter as a director of the Nando’s global group. Kevin is a chartered accountant by profession, and has been a board member from the inception of scooters pizza in 2000. Kevin’s experience of the franchise model and exposure to international markets makes his contribution invaluable to the group.
BCom, BAcc, CA(SA) Independent Non-executive Director Member of the Social, Ethics and Remuneration Committee Appointed: September 2000
Bill is a BA LLB graduate of stellenbosch University. He was admitted as an attorney, notary and conveyancer and practiced as the Chairman of RL Daly Incorporated, an attorneys firm which specialises in the provision of call centre services to national corporates, retailers and banks. he was one of the founding shareholders and the Chairperson of scooters pizza (proprietary) Limited and has, since inception, been the Chairperson of taste holdings Limited. Bill is a director of a number of companies including a Director and the Deputy Chairperson of hBZ Bank Limited, and brings a wealth of business experience to the group which has proved invaluable, particularly in the last number of years.
BA, LLB Independent Non-executive Director Chairman of the BoardChairman of the Social, Ethics and Remuneration Committee Appointed: March 2000
As a Chartered Accountant (sA), tony practiced in Durban within the auditing profession his entire working life. Tony is also a FSB qualified Financial Planner being a director of and substantial shareholder in plexus Wealth, a financial planning business operating in Durban, stellenbosch, Johannesburg and Port Elizabeth. He served articles with G. hackner, Benn & Co, to which firm he returned after a few years on his own, remaining with them, now Grant Thornton, until 1 March 2009 when he retired as a partner. Tony was Managing Partner of the Durban office from 2003 for 5 years, and continues to consult for the firm when required. Tony has had extensive experience as tax partner, financial consulting, mergers and acquisitions, estate planning, valuations, exchange control and is an experienced consultant in corporate and general business.
CA(SA) Independent Non-executive Director Chairman of the Audit and Risk Committee Member of the Social, Ethics and Remuneration CommitteeAppointed: April 2009
KEVIN UTIAN (43) RAMSAY L’AMY (BILL) DALY (70) ANTHONY BERMAN (71)

5
Integrated Annual Report 2013
Non-executive directors
Jay started with the massdiscounters division of the listed south African retailer, massmart, in 1999. he joined the holding company, massmart holdings Limited as Group Commercial Executive in 2006 where he was responsible for all collaborative functions between the various subsidiaries of the group. In this position, he also held a non-executive position on each of the divisional boards of Game, makro, Builders Warehouse and massmart’s food wholesale businesses, masscash. In 2009, Jay, took up the challenge of leading and building, Cambridge food, a national retail food business focused on low-income customers, for massmart. since 2013, he has changed roles again and now owns the opportunity of facilitating and executing on an e-Commerce strategy for the massmart group. Jay is a member of the massmart Group Executive committee which led the sale of a controlling stake in massmart to the multinational giant Wal-Mart. Jay’s executive experience in a global, multi-branded, listed retailer is invaluable to the group. Jay will join the taste Holdings executive team in September 2013 and remain on the board of taste holdings
BSc Non-executive Director Member of the Audit and Risk Committee Member of the Social, Ethics and Remuneration Committee Appointed: March 2004
JAY BAYNE CURRIE (39)
hylton began his career in the jewellery industry when he first opened Hylton’s Jewellers in 1983. the second store followed in the same year and the name changed to Natal Wholesale Jewellers. In 1988, hylton went on to extend the brand when he purchased a share in one of the oldest jewellery manufacturers in Durban, Durban manufacturing Jewellers, which supplied NWJ with the majority of its locally manufactured jewellery giving NWJ the ability to offer excellent quality jewellery at competitive prices. Hylton has played a significant role in influencing the jewellery industry in South Africa. Hylton retired in November 2011, but still serves as a non-executive director and is focused on sharing his immeasurable wealth and experience with the team.
Non-executive Director Appointed: August 2008
HYLTON ROY RABINOWITZ (64)
Sebastian is a Managing Executive at Brimstone Investment Corporation Limited (“Brimstone”), which position he took up in July 2010. Sebastian focuses on evaluating prospective investment opportunities for Brimstone as well as helping to manage Brimstone’s current investments. prior to joining Brimstone, Sebastian spent six and a half years at Nedbank Capital primarily in the Corporate Finance division. Sebastian is a Fellow of the Institute of Actuaries
BBusSci (UCT)Independent Non-executive Director Appointed: March 2012
SEBASTIAN PATEL (32)
Before starting his own business in 1998, Wessel completed his articles in 1996 at Arthur Anderson and join Gensec Investment Bank for a period of two years. he gained valuable experience in investment banking, deal structuring, private equity and underwriting. During 1998 he started a corporate finance business and built it into one of the biggest advisory business for small and medium companies. the business has been ranked by dealmakers in the top ten corporate advisory firms for more than 5 years. he was involved in more than 30 listings, various corporate finance transactions and private equity transaction. He participated actively in more than 22 boards as a Designated Advisor or sponsor over the last few years and gained valuable experience as an advisor to the various boards . he sold his business during 2008 to a black- owned financial services group were he headed up the corporate advisory business. Wessel is now actively involved as a non-executive member in five listed companies and private equity transactions.
CA(SA)Independent Non-executive DirectorMember of the audit and risk committeeAppointed: November 2011
WESSEL PETRUS VAN DER MERWE (44)

Integrated Annual Report 2013
6
Board of directors continuedExecutive directors
Carlo completed a postgraduate LLB degree at the university of Natal after which he and his father, Luigi, owned four franchised pizza outlets in the Durban region. In 1999, Carlo sold his interests and commenced the groundwork to create a new pizza delivery concept which became scooters pizza in september 2000. since 2000 Carlo has headed up the team that has driven the scooters pizza chain to win many prestigious awards; to acquire the Maxi’s brand in 2005; the creation and listing of Taste Holdings in 2006 and the subsequent acquisition of NWJ Quality Jewellers in 2008, st Elmo’s in 2010 and the Fish and Chip Co. in 2012. Carlo guides the strategic direction of the company, its growth strategy and human capital development. He chairs the executive committee.
BSocSci, LLB Chief Executive Officer and Co-founderChairman of the executive committeeAppointed: March 2000
CARLO FERDINANDO GONZAGA (39)
Duncan obtained his BCompt (hons) while serving articles with Morrison murray in Durban. Duncan gained valuable experience in a manufacturing and distribution environment servicing the retail and fast-moving consumer goods industry. Duncan progressed to Chief Financial Officer and shareholder of the group of companies. Duncan joined scooters pizza in 2000 and has been a member of the board of directors of scooters pizza since 2001 and taste holdings Limited since inception. Duncan was appointed Chief Operating Officer of NWJ Fine Jewellery in september 2009 and subsequently Chief Executive Officer in April 2010. Duncan was appointed to the Board of the Jewellery Council of south Africa in April 2011 and has served on the Jewellery Council’s executive committee since February 2012. Duncan has been instrumental in the successful management and control of the significant growth of the group over the past 11 years. Duncan is a member of the executive committee and chairs the jewellery division management committee.
BCompt (Hons) Chief Excecutive Officer – Jewellery division Member of the executive committeeAppointed: November 2000
DUNCAN JOHN CROSSON (47)
Evan qualified as a chartered accountant in 2001 after completing his articles with pricewaterhouseCoopers (pWC). He left PWC and spent seven years with the JsE-listed spur Group where he gained extensive experience within the food franchising industry having been exposed to the financial, operational and supply chain aspects of the business. he then served as Financial Director within a logistics group of companies. Evan joined taste holdings in April 2009 and was appointed to the board in september 2009 as Group Financial Director. Evan acts in a non-executive capacity to the managements boards of the food and jewellery divisions and is a member of the executive committee.
CA(SA) Financial Director Member of the executive committeeAppointed: September 2009
EVANGELOS (EVAN) TSATSAROLAKIS (38)
In 1996, Luigi opened a pizza franchise with Carlo and in the four years owned four outlets in the Durban region. Luigi is a key member of the executive team and his years of experience have been invaluable as the company continues to grow. Luigi specifically ensures that strategies are implemented in the coastal region as well as strategically growing the region with site and franchisee recruitment. he is a vital contributor to the success of the group and currently owns eight of the group’s outlets. Luigi is a member of the executive committee.
Executive Director and Co-founderMember of the executive committeeAppointed: March 2000
LUIGI GONZAGA (69)

7
Integrated Annual Report 2013
Executive committee
Christo is equipped with a BA honours psychology degree from the university of pretoria and has over 30 years’ commercial experience including a nine-year position as CEO of Pleasure Foods. since joining taste holdings in 2006, Christo has headed up the food division of maxi’s, scooters pizza, St Elmo’s and the recent acquisition of the Fish and Chip Co.. Colossal passion and a clear understanding of the consumer and food industries has enabled Christo to positively contribute towards taste holdings and its overall brand expansion. Christo was responsible for the successful repositioning of Maxi’s, and has led scooters pizza and maxi’s to top honours at the Franchise Association of south Africa (FAsA) Awards with two victories and three finalist nominations. Christo has proved that his talent and unequalled skills for conceptualising a brand and strategically implementing strategies is the desired outcome for overall growth development.
BA (Hons) Psychology Chief Executive Officer –Food franchise division Appointed: December 2006
CHRISTO CALITZ (61)
Arvid obtained his mBA degree, specialising in vertical integration for food businesses in 2001, at the time when he was managing Director of Bull Brand Foods. he has been involved in the food business for 30 years, initially in procurement and supply chain functions, followed by manufacturing environments. he has worked predominantly in the fast-moving consumer goods environment servicing both retail and wholesale categories. Arvid joined taste holdings in March 2007 as Supply Chain Executive until April 2010. He now heads the recently formed Food services division of taste, with factories and depots in Cape town and pretoria. Arvid is a member of the executive committee and chairs the management committee of the food services division.
MBA Managing Director – Food services division Appointed: March 2007
ARVID SMEDSRUD (52)
Gregory has over 20 years’ experience in the Foodservice and Franchise industry commencing his career at the Fedics Group as Brand manager. In 1998 he joined pleasure Foods and gained exceptional experience, from Franchise manager, procurement Manager, National Operations Manager and finally heading up International Operations in Africa. Leaving Pleasure Foods in 2004 to take up the position of National Operations Manager for Southern Africa for Yum! International, for their KFC Brand. In 2008 Greg started his own company, consulting to KFC franchisees on operational and facilitated management training programmes. Greg now heads up the maxi’s brand as General manager, and brings with him a wealth of knowledge and understanding that he has acquired over the years in this industry.
BA (MBA) General Manager – Maxi’s Appointed: September 2011
GREG BINSTEAD (40)

Integrated Annual Report 2013
8
JEANNE GELDENHUYS (47)
Jeanne completed her (Dms) Dip Bus m diploma in 2000. she started her career in franchising at pizza hut in 1987 as a store manager and proceeded to spend 13 years in pizza hut and KFC (Yum!) in various senior manager positions such as National training manager and KFC Regional Operations Manager, supporting 130 KFCs. In 2001 Jeanne was appointed as Operations Manager at Famous Brands and got promoted to Operations Director-steers in the same year. In 2004 she was promoted to managing Director – Emerging Brands, driving the development of this basket of Brands. her entrepreneurial spirit compelled her in 2005 to embark on opening three of her own restaurants, which she successfully sold in 2006 when the lure of the corporate world and Brand management became too strong. In 2006 Jeanne was appointed as Chief Operational Officer for King Pie until May 2012, when she joined the dynamic team at taste holdings to head up the pizza division. Jeanne’s strong franchising, business and leadership skills is a great asset to the scooters pizza and st Elmo’s franchisees and employees.
Managing Executive – Scooters PizzaAppointed: May 2012
MARK MADEISKY (57)
mark is a Chartered Accountant with extensive experience in clothing and jewellery retail, manufacturing and media. he has worked in south Africa and Canada and his retail experience spans more than 25 years. he commenced his career at the Foschini Group in roles at American swiss and Pages and progressed to Operations Director and then merchandise Director at sterns. mark emigrated to Canada and held several executive positions across various industries including a chain of 140 jewellery stores similar to NWJ. on his return he has worked in an executive consulting capacity within the New Clicks Group and more recently on a project basis for the Foschini Group. mark brings with him extensive industry experience, and expertise across the retail disciplines and is an asset to our company further strengthening our management team and enhancing our internal capacity to continue to deliver and execute on our strategies.
CA(SA)General Manager – NWJAppointed: April 2012
MARCEL STRAUSS (45)
marcel started his retail career in Checkers in 1988 as trainee manager, became a sales and service Department Manager and during this time opened two stores, Brooklyn and Moreletta, some of the first scanning stores in south Africa in 1991 – 1992. he ran the family business until they sold it off. He moved to Botswana, started as Branch manager of pay-Less supermarket. From 1996 to 2006 he was part of spar in Botswana and of a team that grew the spar Brand to one of the strongest brands in Botswana. marcel moved back to south Africa in october 2006 and joined Glomail for a short period after moving to Rhame Guys as Financial Director. After completing his contract he joined Cashbuild as Operations manager for the Northern area of south Africa. In 2009, he became part of the Spar family again until May 2011 when he was appointed by taste holdings as Managing Executive of The Fish and Chip Co.
MBAManaging Executive – The Fish and Chip Co.Appointed: May 2012
Board of directors continuedExecutive committee continued

9
Integrated Annual Report 2013
Store distributionas at 31 may 2013
Northern Cape4 12
North West5 44
Lesotho1
Swaziland
Western Cape19 184 8
KwaZulu-Natal28 21
1
20
5
22
35
18
6
4
3
26
1
1
150
279
45 125
Botswana
Mozambique
Zimbabwe
Eastern Cape7 11 4
Free State
MpumalangaGauteng
Limpopo
27
1
Namibia2 1
3 1
1
5 1
9 27
6 10 4
Total outlets
Buon Gusto Food services
support offices
scooters pizza
maxi’s
st Elmo’s
NWJ
the Fish and Chip Co.
132
67
26
78
312
615
2
3
Total number of storesStores

Integrated Annual Report 2013
10
Business modelCollaboration and vertical integration
Foodsegment
VerticalIntegrationvalueChain
• Currently manufactures 40% of what NWJ stores sell
• Sources 60% of what stores sell and distributes 100% of what stores sell
• Development and maintenance of intellectual property specific to each brand
• Currently owns approximately 33% of the outlets. Will consolidate ownership into three metro areas in future
• Commissioned a food manufacturing facility in late 2009 to supply selected lines to the division
taste currently warehouses and distributes food products to some 500 franchisees across sA
• Development and maintenance of intellectual property specific to each brand
• Brand specific marketing
• Ownership of stores is not a core strategy in the medium term
• Planning and forecasting
• Quality assurance• Procurement
• Sourcing• Warehousing• Distribution
• Marketing and merchandise
• Operational management
• New site development• Property management
• Company-owned outlets located in metro areas and key sites
mANuFACtuRING LoGIstICs FRANChIsING REtAIL
Taste Holdings Group the taste management model empowers divisions to grow their profit and generate operating leverage through operational autonomy within an agreed strategic and operational framework.
the group is responsible for the approval of brand and divisional strategies and the accompanying operational framework; the identification, development and retention of human capital across the group; managing the cash flows and financial structures of the divisions to the best advantage of the group; and promoting and incentivising collaboration between the divisions across key business drivers and shared platforms, via the Taste Collaboration Channel.
the model is executed through a decentralised decision-making executive committee, chaired by the CEO. The committee comprises the CEO, Financial Director and Executive Directors of Taste Holdings as well as brand Managing Executives.
Taste Collaboration ChannelThe collaboration channel consists of forums where both best practice and collaboration ideas are shared between divisions and brands. Forums are focused on topics that relate to:• the key business drivers of the divisions; property portfolio
management; retail outlet design and image; marketing channels to common consumers in the LSM* 4 – 10 category;
• franchise best practice implementation and franchisee performance management;
• common cost centres across divisions that are not a differentiating factor in the consumer offering and that reduce costs to the division; and
• customer and franchisee satisfaction monitoring.
* LSM – “Living standards measure”.
Jewellerysegment

11
Integrated Annual Report 2013
Why invest in taste holdings
taste’s earnings are underpinned by great challenger brands trading across diverse categories, led by entrepreneurial people with established track records who are incentivised on both group and divisional performance. the group has strong internal growth levers, is underpinned by good quality earnings and cash flows, has a record of good governance and disclosure, and a 13-year track record.
Great brands
Diversification
Entrepreneurial people
track record
A record of good governance
Growth
Cash generative
underpinning the earnings are great south African brands – all with demonstrated ability to grow organically; promoted by large marketing funds; and led by entrepreneurial people with track records of success.
the portfolio of brands target consumers from Lsm 4 upwards with propositions that are underpinned by strong value-for-money offerings. Furthermore, the group trades in two distinct product categories with similar consumers, routes to market and key success factors; across diverse store formats.
the founding directors and divisional CEos are all shareholders, and have all owned and grown businesses in the past. the average age of the board and executive committee is 49 years.
Although the group has been listed for seven years, the brands that underlie the business have a combined trading history of over 93 years. scooters pizza is 13 years old, maxi’s 20 years, NWJ is 30 years old, st Elmo’s 26 years old and the Fish and Chip Co. is 4 years old.
the seven-year review clearly highlights the group’s ability to grow organically and through acquisition. A seven-year annual compound growth rate in hEps of 24% reflects this. the acquisition of the Fish and Chip Co. in 2012 adds substantial growth levers to the business and the take-on of distribution for the food division during the 2012 year will unlock significant value in the future.
the predominantly franchise model in both divisions yields high levels of cash generation with minimal capital expenditure required for growth due to franchisees funding new store growth.
the group has always had an independent non-executive chairperson, and sub-committees which are led by independent non-executive directors. taste has a good record of disclosure and shareholder communication.

Integrated Annual Report 2013
14
Chairman’s report
Stepping forward into growthLast year saw the group make substantial strides against its stated strategies – the acquisition and integration of the The Fish & Chip Co. as well as the establishment of its food distribution business. These were necessary investments to build solid foundations for future growth. More of this operational progress is detailed in the CEo report.
Good governance, which is essentially about effective, principled leadership, is at the heart of Taste Holding’s board and committee structure. Our objective as a board is to provide responsible leadership by directing the Group’s strategies and operations in a manner that will allow it to achieve sustainable economic, social and environmental performance. We are also committed to being responsible, accountable, transparent and fair in all that we do.
During the year the Board was involved in the development of new strategies and new projects which were presented to us for consideration. We were also involved in an assessment of the group’s external audit processes and the steps the group is taking to increase its level of internal control, including evaluating the establishment of an internal audit function during the next financial year.
While the board composition could better reflect the racial and gender diversity of South Africa, the group certainly benefits from the relevant expertise and perspectives that the current non-executives bring to our strategy, deliberations and risk management. I also believe that through the separation and clear definition of the roles and responsibilities of the Chairman and Chief Executive Officer, we have equipped our board not only to make decisions in the right way, but to make better decisions.
Corporate governance means much more than a set of rules and processes governing the running of a company. As Chairman of
taste holdings I aim to ensure not only that the group complies with all the relevant codes and regulations, but that we instil in our entire management team a commitment to achieving the best results in the most responsible, principled way.
During the year under review we made some changes to the composition of our board committees. These included combining our social, ethics and remuneration committee, originally under my chairmanship. Following the JSE Listings Requirements that the chairman of the board should not be the chairman of this committee, the board appointed Mr Anthony Berman chairman of our social, ethics and remuneration committee. Mr Jay Currie resigned as a member of the audit and risk and the social, ethics and remuneration committees to join Taste Holdings in an executive capacity in September 2013. Mr Sebastian Patel, an independent non-executive director of Taste Holdings has been appointed as the third member of our audit and risk committee.
ConclusionAs our Chief Executive Officer has said we expect trading conditions to remain challenging, but the board is confident that our management team’s proven ability to sell more for less, operating within a cash-generative business model, will allow us to achieve the challenging goals we have set ourselves.
My thanks go to the entire Taste Holdings board and team and our franchisees for their contribution to our success in the year under review.
Bill DalyChairman
BILL DALY

15
Integrated Annual Report 2013
A year of significant gainsLast year we stated that our aspirations have allowed us to envision a future and build on what we already have.
this year, our south African-based management group, which is invested in a portfolio of specialist restaurant and retail brands, stepped forward into the sort of growth that has allowed us to achieve a 58% compound annual growth rate (CAGR) in revenue over the past seven years.
We have always tried to expand in ways that are earnings enhancing in terms of headline earnings per share (hEps) and we believe this approach will allow us to achieve our bold goal of doubling our headline earnings between 1 march 2012 and 28 February 2014. this year we achieved a 37% increase in our normalised headline earnings in year one of a step change in our business, during which the issue of shares to fund our acquisition of the Fish & Chip Co. diluted hEps. We also increased our dividend by 27.5% to 5.1 cents a share.
Last year we reported to you that we had managed to overcome consumer caution to boost our profits before tax by 20%. this year, while consumers continued to be cautious about spending, we achieved a further 24% boost to our profits before tax year-on-year. this is despite buying a new business, funding the acquisition of five corporate-owned NWJ stores from internal resources and taking four under operational
control, and embarking on one of our most ambitious internal projects − launching our own food distribution business − which we also funded from our internal resources.
system-wide sales across the group exceeded R1 billion for the first time, when they increased by 52% to R1.38 billion. this increase in sales, combined with the establishment of the food distribution business increased overall group revenue by 66% to R504 million.
The quality of our brands continues to be recognised by their customers. During the year under review NWJ’s customers not only rewarded us with their purchases, but also with their votes when we received first place in the Daily News Best place to buy Jewellery and second place in the times and sowetan Retail Awards for 2012.
Divisional reviewsFood services divisionWe have described the establishment of our food distribution business, as the hardest thing we have done in a long time. We were building the engine that would drive the growth of our food division in the future, as well as provide our franchisees with a competitive advantage in the future. having assessed what would be the most economical and effective route to take, we made the decision to establish the business from the ground up, as opposed to acquiring an existing operation. This required a cash investment of nearly R12 million, R7 million of which was capital
CARLO GONZAGA
66%Revenue
Chief Executive Officer’s report
37%Normalised
headline earnings

Integrated Annual Report 2013
16
Chief Executive Officer’s report continued
expenditure and the remainder the investment in inventory and initial operating losses of R2.5 million. The business now includes national logistics, warehousing across two depots, and selected food manufacturing. The logistics capability allows us to control our route to market (we currently distribute to over 500 customers nationally every week) and manage our expansion, while the warehousing facility will over time provide our franchisees with the convenience of a one-stop shop. our manufacturing facilities now produce spices, dough premixes, sauces and added-value meat products required for the scooters pizza, st Elmo’s, maxi’s and the Fish & Chip Co. brands.
Pivotal to the distribution initiative was the establishment of two distribution depots in Gauteng and Cape Town. As expected, there were initial inefficiencies in inventory management, vehicle routing and staffing, which resulted in the business operating at a loss of R2.5 million for the first six months. these have since improved. our delivery times are now 63% faster, we have been able to reduce our fleet size by 33% and our service levels have improved more than 100%.
Future outlookEstablishing the warehousing and distribution capability has put in place an essential building block that will allow us to maximise the potential of our food division in the future. We expect that the continued improvement in efficiencies in the division will result in it being profitable in the next financial year. We also expect these improvements will allow us to offer our franchisees increased value through improvements in procurement and service levels.
Food franchise division our Food franchise division’s brands, which operate in the quick service restaurant (QsR) sector, appeal to consumers across the entire income range. they cater for the middle income market through scooters pizza, maxi’s and st Elmo’s and for the large lower living standard measures (LLsm) consumers through the Fish & Chip Co. All our food brands are built on strong value for money propositions, convenience and product innovation. They are all supported by relatively large marketing funds and contemporary, currently relevant store designs. the division has over 500 outlets spread throughout South Africa and five African countries.
During the year under review the division achieved a systems-wide sales increase of 70% year-on-year to R1.12 billion, mainly attributable to the acquisition of The Fish & Chip Co, which has now exceeded 300 outlets, making it the market leader in terms of number of outlets in its category. Same-store sales (the sales of our existing outlets) were marginally positive, with the same-store sales of re-imaged scooters pizza and st Elmo’s outlets continuing to grow above inflation.
Additionally, The Fish & Chip Co. is the cheapest entry level national brand for fast food franchisees.
Its simplicity of operation, low set-up costs, and fixed monthly royalties, differentiate its business model from other brands. Its more than 300 outlets offer consumers convenience and unparalleled value for money in an aspirational take-away environment. During the 2013 financial year the brand opened over 100 new outlets.
our steady and measured expansion into Africa continues. During the year we added further outlets in Namibia, and Botswana, bringing the number of outlets we have outside south Africa to 16 across five countries.
Future outlookWhile consumers will continue to be cash-strapped, it is our view that the value propositions of our food brands could play a positive role in countering these stresses. our focus in this segment of the business is on speeding up the roll-out for the rebranded scooters pizza outlets, improving same-store sales and on acquiring a complementary brand into this division.
Jewellery divisionNWJ, the third-largest jewellery brand in south Africa, with 77 outlets nationally (as at February 2013), is the only vertically-integrated franchised jewellery chain in south Africa. the franchise services offered by NWJ, which owns approximately 33% of the total outlets, include providing franchisees with operational, merchandise and marketing support, new site growth and development, and national brand-building strategies, through the largest marketing fund as a percentage of sales.
The benefits of this unique and differentiated structure are numerous. As the only national franchised jewellery chain NWJ spends 4% of its sales on marketing, more than double that of any national competitor on a per store basis. As the only vertically integrated national chain it has in-house innovation capacity to tailor products for the local market, shorter lead times for the introduction of products and relatively reduced input costs through purchasing economies of scale. All the goods sold through NWJ outlets are distributed by its distribution division.
During the year under review same-store sales at our corporate stores continued their outstanding performance, increasing 14.3% year-on-year. this increase is on the back of the 14.7% year-on-year increase they achieved in the previous financial year. The trend continues with the division’s same-store sales in corporate stores growing 15% in the last six months of the financial year.
Franchisee same-store sales improved substantially in the last six months to achieve an increase of 12% over the comparable period. this is a marked improvement on the first half of the year under review where comparable same store sales were unchanged. Across the NWJ brand same-store sales increased 8.2% for the full 12 months of the current period and, more recently, they increased 26% in march 2013, and 20% in April 2013.
24%EBItDA
28%Dividend per share
52%system-wide sales

17
Integrated Annual Report 2013
WE AppRECIAtE thAt ouR NEtWoRKPARTNERS AND SUPPLIERSCoNsIstENtLY INspIRE us to INNOVATE AND CREATE VALUE,RAthER thAN mERELY REDIstRIButE It
the nine franchised outlets that the group acquired, four of which it took operational control during the year under review, also made a positive contribution to operating profit. Under the division’s management same-store sales of these outlets grew 17% and operating profit margin increased from 6.4% to 23.6%. this performance highlights the group’s competence at operating its corporate-owned outlets.
While the group does not plan to deviate materially from its franchise ownership model, we will continue assessing the acquisition of outlets from franchisees in order to retain key sites.
Overall, NWJ’s operating profit increased 24% to R28.6 million year-on-year.
A new development in the 2013 financial year was the launch of a NWJ-branded credit offering. Since the launch of the credit offering, NWJ, who historically has not had a robust credit offering, is attracting new customers with a substantially higher spend per transaction than in its existing cash business. As a third party underwrites the credit, NWJ does not have any exposure to default or to its administration. Currently, credit sales are a very small percentage of NWJ’s total sales.
Future outlookNWJ’s focus on improving the ability of our franchisees to mimic the performance of our corporate stores has seen positive results. This will continue to be an area of focus in the coming year, together with our assessment of opportunities to grow our store footprint and leverage the existing scale of the division. Potentially constrained consumer spending and volatility in commodities and currencies continue to present challenges for the division. We are, however, of the view that in relative terms we are well-positioned to react appropriately to these challenges.
Future outlookWe have previously commented on the future outlook for each of our divisions. In terms of the outlook for the group as a whole, while we recognise that trading conditions remain challenging, we are set on achieving the goal we set ourselves of doubling our business at headline earnings level in three years by 1 march 2014.
Our proven ability to sell more for less, operating within a cash-generative business model, with motivated, skilled individuals
steering our brands and divisions, gives us confidence in the ability of the group to grow in the future.
AppreciationWe now employ 450 people directly within taste. In just the last 12 months we created over 1 250 new jobs, elevating the people employed directly and indirectly by the group to over 5 000.
We operate in a competitive environment where employees, franchisees, shareholders and customers can choose with whom they engage. I am humbled that each of these stakeholders chose Taste and its brands. I would particularly like to extend my thanks to all of those people who worked tirelessly to establish our food distribution business last year, as well as every single team member that made a contribution to expanding the group’s brands.
Our franchisees deserve special mention in that they are the front line to our customers and have invested more than time and energy in their businesses, but also capital. I am privileged to be a steward of our brands and together we will create enduring, respected brands.
We also appreciate that our network partners and suppliers consistently inspire us to innovate and create value, rather than merely redistribute it.
Lastly, I am personally indebted to the taste Board for their guidance, counsel and ultimately their support during a year in which we made significant progress.
taste holdings is what its very talented stakeholders make it. Your contributions make our dreams reality and make it possible for Taste to tackle fearlessly new challenges and opportunities that come our way in the future.
Carlo GonzagaChief Executive Officer

Integrated Annual Report 2013
20
performance
IntroductionAll organisations depend on various forms of capital (sometimes referred to as resources and relationships) for their success. These capitals are stores of value that, in one form or another, become inputs to an organisation’s business model. They are increased, decreased or transformed through the activities and outputs of the organisation. For example our financial capital increases when we make a profit and the quality of our human capital improves when we train our employees.
In this section of our report we provide you with information on our performance in terms of our human capital, our social and relationship capital and natural capital.
Human capitalOur peopleAt year-end taste holdings had 450 permanent employees on its south African workforce, 68% of whom are Black.
During the year under review Taste Holdings made a major contribution to job creation and enterprise development when it opened 125 new stores, which in turn created approximately 1 250 new jobs and increased our franchisee workforce by 14%.
The benefits we provide our fulltime employees, over and above the legally mandated employment benefits, include paying above minimum wages and salaries. We also pay additional bonuses annually, based on performance.
Taste Holdings – Group Direct
Male Female
Able-bodied Disabled Able-bodied Disabled
Afric
an
Colo
ured
Indi
an
Whi
te
Afric
an
Colo
ured
Indi
an
Whi
te
Afric
an
Colo
ured
Indi
an
Whi
te
Afric
an
Colo
ured
Indi
an
Whi
te
Tota
l SA
wor
kfor
ce
% b
lack
re
pres
enta
tion
% fe
mal
e bl
ack
repr
esen
tatio
n
senior and top management 23 1 2 6 32 6 6
middle management 1 1 11 1 12 26 11 3
Junior management 5 4 4 15 7 4 7 31 77 40 23
semi skilled and unskilled 74 17 11 9 1 91 33 46 33 315 86 53
total permanent workforce 79 22 16 58 1 0 0 1 98 37 56 82 0 0 0 0 450 68 42
African
Coloured
Indian
White
13%
Male
45%
9%
33%
Female
36%
13%21%
30%
40%
16%
31%
Total
450
Labour workforce
WE uNDERtAKE REGuLARCUSTOMER SATISFACTION SURVEYSAND REsEARCh thE RELEvANCE oF ouR pRoDuCts, sERvICEs AND BRAND pERCEptIoNs
13%

21
Integrated Annual Report 2013
Group franchisees
Male Female
Able-bodied Disabled Able-bodied Disabled
Afric
an
Colo
ured
Indi
an
Whi
te
Afric
an
Colo
ured
Indi
an
Whi
te
Afric
an
Colo
ured
Indi
an
Whi
te
Afric
an
Colo
ured
Indi
an
Whi
te
Tota
l SA
fran
chis
ees
% b
lack
re
pres
enta
tion
% fe
mal
e bl
ack
repr
esen
tatio
n
total 117 20 114 221 0 0 2 1 55 8 29 67 0 0 0 0 634 54 14
African
Coloured
Indian
White
Male
4%
25%
24%
47%
Female
35%
5%18%
42%
27%
4%
23%
46% 634
Total
Social and relationship capitalStakeholder engagementthe shareholder base of taste has increased from some 700 two years ago to 1 682 at 28 February 2013. stakeholder engagement is one of our key focal areas. the board is responsible for communicating effectively with our shareholders and does so mainly via several executives and department heads who are responsible for regularly engaging with analysts, investors and individual shareholders and potential investors. the CEo and Financial Director formally present to shareholders and analysts annually in each of Durban, Cape town and Johannesburg. Both the CEo and Financial Director make themselves available for telephonic and in-person interactions with shareholders and the CEo makes himself available to various media and press to ensure that the broader public have the companies point-of-view on matters.
Employeestaste now employs 450 people directly, an increase of 14% from the prior year. If our employees are to develop and contribute to our business we need to communicate with them on our strategy and performance. our CEo presents the group strategy and results to all our employees every year at the same time as our results are released to shareholders. the taste times, a quarterly newsletter, which is circulated to all our employees and franchisees provides easy to understand explanations of the group’s financial results, the reasons behind our strategy and what we need to do to achieve it. It also includes news, employees’ experiences and insights. to assess how well our employees understand our strategy and what is required from them to achieve it, we also draw on employee feedback during their personal assessments to gain insight into how our senior managers are translating our strategy to their direct reports.
FranchiseesEach division of taste holdings interacts with its franchisees.
However, we share certain common practises across all the divisions. these include:• conducting regular franchisee meetings throughout the year;• conducting a satisfaction survey among franchisees;• providing focused training to existing franchisees;• a franchisee marketing council and representative council;• annual awards presentation to high performing franchisee;• circulating The Taste Times to all franchisees and managers; and • encouraging feedback and news on local events for inclusion
in the taste times.
CustomersTaste is premised on exceeding our customer’s expectations. our call centre gets feedback from our customers regarding on time delivery and general overall service. This is then relayed back to us and we acted on it accordingly. We recently employed a customer liaison officer who liaises directly with our customers and provides us with feedback and suggestions for further improvements. We also undertake regular customer satisfaction surveys and research the relevance of our products, services and brand perceptions.
SuppliersWe recognise our interdependence with our suppliers and forge strong relationships with them. We manage supplier performance based on on-time delivery against specifications, price consistency and adherence to audits that ensure compliance with the latest best practice. We have adopted a transparent pricing policy which allows for mutual understanding of the key drivers of price, availability and quality. While we prefer to use local suppliers the group’s manufacturing division imports certain input products directly. We ensure that no individual has sole power to negotiate pricing or appoint new suppliers, which mitigates the risk of hidden costs in the supply chain and ensures fair and transparent procurement policies, which are conducted at arm’s length.
Franchisee representations

Integrated Annual Report 2013
22
performance continued
We use a supplier quality assurance questionnaire which requires our suppliers to provide us with information regarding their quality management system, prerequisite programmes, building structure, pest control and various other factors that could have an effect on the quality of the product they are supplying to us. We also visit our suppliers regularly.
suppliers must provide us with suppliers quality assurance certificates, certificates of Halaal approval if required and suppliers production specifications.
MediaWe recognise the importance of the role the media plays in reporting on social issues and providing a balanced view. The group is committed to being accessible to the media and includes members of the media in its presentation to shareholders.
A socially responsible businessJob creation and enterprise development are top of the list when it comes to what is required to develop the south African economy. our franchising business model not only provides enterprise development opportunities for small businesses that are likely to succeed and become sustainable because of the support a tried and tested franchising model provides the franchisee, but it also creates employment. over 1 250 people have been employed in our outlets over the past year. Not only have many of these people been employed for the first time, but they have also gained portable skills through the skills training they received in our outlets.
our corporate social responsibility programme focuses on establishing a social infrastructure and uplifting children suffering from life-threatening disease and life challenges. We do this by contributing to the Just Footprints Foundation, which is a registered non-profit organisation founded in 2008 with the aim of meeting the need for a unique safe and secure outdoor camping experience for children with serious health and life challenges. The Foundation supports charities such as ChoC, Reach for a Dream, Cotlands and Ithemba trust.
Safety and healthWe have a moral and legal obligation to safeguard and protect our employees and our customers against injury, disease and risks to their health and safety. Our health and safety committees hold health and safety meetings every month at which any risks and issues affecting the health and safety of our employees are addressed.
Taste Holdings is committed to providing safe food products to its affiliated franchise restaurants and pizza outlets. During the year under review we established two new state-of-the-art food distribution centres, which include high volume manufacturing facilities producing spices, dough premixes and added-value meat products. Our main objective is to operate under the hazard analysis and critical control point (HACCP) food safety management system which ensures the systematic assessment of all the steps involved in our food manufacturing centres, which are certified by the South African Bureau of Standards (sABs) against the hACCp. the system allows us to trace the origin of all our input products. In addition we monitor our fleet of vehicles in real time and receive alerts if the cold chain is broken. We apply basic hygiene principles throughout our manufacturing process and our food technologist ensures that all the products we produce comply with our specifications before they are despatched to customers. We have a number of good safety systems in place, all of which we regard as being high priority, these include employing good manufacturing principles and quality management in relation to our HACCP system.
there were no health or safety issues in any of our divisions during the year under review.
Training and developmentInvesting in the development of our people is a priority for taste holdings. We need to develop the appropriate skills to support our strategy, this includes developing future business unit leaders. Employees that we have identified as having leadership potential attend a range of external training courses, which they are then given the opportunity to apply in the workplace. these employees are also mentored in the workplace.
It is difficult to put a rand value to our investment in training as most of it is provided inhouse by our qualified employees.
To encourage our employees to undergo training we offer incentives and rewards to those who qualify at the end of their training.
our health and safety training includes training all our employees in basic hygiene and hACCp procedures. Employees also received training in:• first aid;• health and safety representative training;• forklift operation;• pest control;• standard operating procedures;
Two years ago Portia Mohlala joined Taste Holdings as a general worker. We soon saw that she had potential to go far in our business and invested in her development. She has been on training courses provided by the Food and Beverage SETA, and has also attended training provided by our SABS-certified laboratory. After receiving training in the management of the systems we use she was ready to take on the role of Production Coordinator reporting to the Production Manager. As production coordinator she is responsible for managing the supervisors in every function, HACPP verification and completing the mound of paperwork that goes with it.
Achieving through our investment in our people

23
Integrated Annual Report 2013
• critical control points (CCPs) and fire fighting;• hazard identification and risk analysis (HIRA) training; and• health and safety management training.
other training our employees received this year included:• temperature monitoring and control (both crucial in controlling
product quality);• food factory and personal hygiene;• training in the use of pastel evolution software;• standard operating procedures;• electrode boiler operation;• critical control point (CCPs) training; and• spectank training for all employees in basic chemical usage,
dilutions, chemical safety, basic hygiene and hand washing.
Natural capitalBecoming more energy efficientOur most material impact on natural capital is our consumption of energy, both in the form of electricity used in our outlets to cook and prepare food and manufacture jewellery and fuel in our fleet of vehicles.
Not only do we need to minimise our carbon footprint, we also need to contain costs as both fuel and electricity prices continue to increase above inflation. The high price of electricity has had an impact on the profitability of our stores. Over
the past four years we have focused on reducing our energy consumption, and while we set ourselves a target of 20% it proved difficult to measure due to non-standard metering from various municipalities and landlords.
Notwithstanding that we have taken the following steps to reduce electricity consumption in outlets:• installed light-emitting diode (LED) lights which consume only
6% of the power consumed by the halogen lamps we used previously;
• replaced air conditioning units with evaporative coolers which consume only 20% of the electricity air conditioners consume;
• reduced consumption by installing timers on geysers and external signage;
• imported energy-efficient ovens which have been installed in our new pizza outlets; and
• we have installed the latest in energy-efficient refrigeration in our new distribution centres and use large pre-refrigerated coolboxes instead of refrigerated trucks on short trips. To reduce our fuel consumption we:
– send bulk orders (12-15 pallets at a time) in one truck instead of sending three separate deliveries of 4-5 pallets at a time; and
– reduced the number of trucks we use for local deliveries by 50%.
hACCp is a food safety management system that enables food processing and catering industries to introduce and maintain a cost effective, ongoing and safety programme. HACCP involves the systematic assessment of all the main steps involved in a food manufacturing operation and the identification of those steps that are critical to the safety of the product.
hACCp is based on seven principles: 1. Analyse hazards Potential hazards associated with a food and the measures required to control those hazards are identified
including biological, chemical and physical contaminants. 2. Identifycriticalcontrolpoints These are points in a food’s production at which potential hazards can be controlled or eliminated. 3. Establishpreventivemeasureswithcriticallimitsforeachcontrolpoint These are minimum standards required for the safe preparation of food. 4. Establishprocedurestomonitorthecriticalcontrolpoints these procedures include determining how and by whom processing standards are to be monitored. 5. Establishcorrectiveactionstobetakenwhenmonitoringhasshownthatacriticallimithasnotbeenmet Either reprocessing or disposal of foods if the minimum processing standards have not been met. 6. Establishprocedurestoverifythatthesystemisworkingproperly Testing and calibrating equipment to ensure its proper functioning is but one typical requirement. 7. EstablisheffectiverecordkeepinginordertodocumenttheHACCPsystem this would include records of hazards and their control methods, monitoring of safety requirements and
corrective actions taken to either prevent problems or how non-conformances are to be prevented from recurring.
HACCP safety management system

Just Footprints Foundation is a registered non-profit organisation which was founded in 2008, specifically to meet the need for a unique outdoor camping experience that would provide safe and secure advertures for children. The Just Footprints Foundation supports charities such as CHOC, Reach for a Dream, Cotlands and Ithemba Trust. At these camps, disadvantaged, disabled and children with life threatening illness and life challenges learn new skills, develop confidence and enhance their self-esteem in a supportive ‘fun’ camp environment. A place where physical risks are managed appropriately and participants are cared for emotionally.
Our first camp was held in November 2010. We hosted four more camps since then and are looking forward to two more camps in september and November this year.
We recently implemented an outing as part of the programme for the children to an old age home at a nearby village. here they interact with the aged and provide them with a meal and entertain them with song and dance.
Taste Holdings’ corporate social responsibility activities focus on establishing social infrastructure and contributing to the upliftment of children with life-threatening diseases and life challenges of our community.
Integrated Annual Report 2013
24

• Just Footprints camp participant• ABF (Advertising Benevolent Fund) Gold Day• Robin Hood Foundation • Durban Beach Clean up• Westville Boys High Golf Champs• Shavathon• South Coast Hospice Sugar Challenge• WIZO Jewish New Year market• Jes Foord Foundation• CROW• Highway Amateur Radio Club
• Hout Bay Valley School Sandcastle Competition• Reach for a Dream Golf Day in Clovelly• World Hunger Day – we fed 2 000 children in Kuilsriver in three schools• St Luke’s Hospice: donated vouchers for their Online Auction• Cycle of Life Mitchells Plain Festival• Kuilsriver Biggest Pizza Sponsorship for the Nederduitse Gereformeerde Kerk Fundraiser
• Just Footprints camp participant • Mabopane Children’s Home• Soccer day at Cosmo City • Woza Soccer Skillz
this way the children also learn to give back to the community.
We are so happy and feel honoured to be involved with Just Footprints, as their cause is one that all members of taste holdings feel deeply passionate about, and committed to. Every event that we partner with Just Footprints is so rewarding. seeing the joy on the children’s faces is an experience that cannot be summed up in words.
• Grocery bags given out at the Hanna Charity and Empowerment Foundation soup kitchen (April)
• Sponsored pizza at Hanna Charity and Empowerment Foundation golf day at Zwartkop Country Club
• Mopani worm pizza surprise, delivered to Radio 2000’s studio, for the breakfast host, Just Ice (may)
• Whizzkids week, celebrating Youth day and week ( 16 – 21 June)• Bridge Cape Pioneer – Sponsored pizza (1 500 in total) and pasta (over 1 000 portions)
to about 440 people over the course of this six-day mountain bike race (oct)• Scooters Pizza Knysna sponsored pizza to Knysna Primary School learners• Just Footprints camp participant
Our brands support various charities and charity events such as:
WE CARE
• Thandanani School event x 2• Sonskyn Bejaarde Sorgsentrum Breakfast• Fun Run @ the Grove Mall• Donations to various schools and old-age homes• Just Footprints camp participant• Drakensburg Boys Choir Burgers• Prinshof school for the visually impaired – toys
25
Integrated Annual Report 2013

Integrated Annual Report 2013
28
Corporate governance
How we govern our business
Our board governance structure
Our approach to governancetaste holdings understands that a sound and robust approach to corporate governance standards throughout our organisation requires a focus on performance as well as conformance. We establish clear lines of accountability from board level down.
We are committed to transparency and accountability, which is essential if our group is to thrive and succeed in the short, medium and long term. the transparency and accountability that good governance provides, ensures shareholders have the information they require to assess the quality of the group’s overall performance and its commitment to good governance and ethical business practices.
Our application of King III in the year under reviewTo ensure that Taste Holdings consistently practices effective corporate governance throughout the group, our board materially applies the principles of King III. It also instils in our management team the need to achieve the best results in the most responsible way possible.
A table setting out our application of the principles can be found on our website in the Governance section. In our 2012 report we reported that while our board was satisfied that we had applied the majority of the King III principles, there were some instances where we had only partially applied some principles and application of some principles was under review.
An internal audit function for the whole group remains under review by the executive management team and the board.
We conducted self-evaluations of the board and its committees during the year under review. These evaluations confirmed that the members of both the board and its committees believed they are functioning effectively. Any suggestions that members made that they believed could further improve their functioning were acted on.
The board subscribes to a unitary board structure with a balance of executive and non-executive directors. There is a clear division of responsibilities between the executive responsibility for the running of the company’s business and the
Board of directors
Board committees
Audit and risk committeeExecutive committee
Three divisional management committees
Shareholders and other stakeholders
Social, ethics and remuneration committee
Company secretary
Executive directors Non-executive directors Independent non-executive directors
46%
18%
36%
Total
Taste Holdings board independence

29
Integrated Annual Report 2013
leadership of the board, such that no one individual has unfettered powers of decision-making. There are two tasks at the top of the business, namely, the running of the board and the executive responsibility of the day to day running of the business. The CEO is responsible for the efficient daily operations of the business, while the chairman provides leadership to the board.
Establishing materiality We determine our most material issues through board and executive level discussions during which we consider financial and non-financial information, the issues driving our sustainability and their possible impact. Currently the following issues are most material to taste holdings’ business:
Issue that could affect Taste Holdings’ sustainability Possible impact
How it could affect our stakeholders
Our mitigating action/opportunities this issues creates for the business and our response
Reputational risk A customer complaint on a social media site about one of our franchises could very quickly damage the particular brand’s reputation.
Negative brand publicity could impact sales, reduce franchisee profitability and the level of demand for products from our distribution centres. It would also reduce the taste holdings’ royalty income.
We employ live monitoring of all the social networks and we have dedicated customer complaint channels, with agreed resolution times and escalation protocols.
To ensure the systematic assessment of all the steps involved in our food manufacturing centres they are certified by the south African Bureau of standards (sABs) against the hazard analysis and critical control point (HACCP) food safety management system (see the health and safety section on page 22 of this report for more information on HACCP). This allows us to trace the origin of all our input products. In addition our fleet of vehicles is monitored in real time with alerts being received if the cold chain is broken.
The profitability of our franchisees
Franchised outlets not generating enough profit to settle their credits/and/or funders.
the closure of stores would result in lower royalty receipts and lower volumes through our distribution centres.
the daily uploading of each outlets’ sales provide taste holdings with the information it needs to identify poor sales performance and take rapid action. We also collate gross margins at franchisee level on a monthly basis. this allows us to assess actual performance against desired performance. Where there are negative variances our franchise consultants help franchisees identify the cause and rectify the situation. Finally, if needs be, our brands can offer support in the form of marketing assistance and/or a reduction in royalty for a period of time.
Governance and management systemsour board, which is responsible for the governance of the group on behalf of its shareholders, performs its duties within a framework of policies and controls which provide for effective risk assessment and management of our economic, environmental and social performance. It also has an important role to play in setting ethical standards of conduct.
The board’s responsibilities are outlined in its charter which is reviewed and adopted by the board annually. All the board committees operate under board-approved mandates and terms of reference, which are updated when necessary to keep them aligned with current best practice. All our board
committees are chaired by independent non-executive directors, whom attend the annual general meeting to respond to any shareholder queries. the mandates, charters and terms of reference governing the board and its committees are available from the Taste Holdings’ Company Secretary. The audit committee is a statutory committee in terms of the Companies Act as well as King III. shareholders are required to elect its members at the company’s annual general meeting. While the social, ethics and remuneration committee is also a statutory committee, its members are re-appointed every year by the board at the first board meeting following the annual general meeting.

Integrated Annual Report 2013
30
The boardthe taste holdings’ board charter, which details the responsibilities of the board, is closely aligned with the recommendations of King III and forms the basis of the board’s responsibilities and duties. Our memorandum of incorporation also addresses certain of the directors’ responsibilities.
The board convenes a minimum of three times a year. It also convenes additional meetings as necessary. Furthermore, the CEO and financial director meet with board members at least three times a year.
CompositionOur board membership at year-end comprised five independent non-executive directors, two non-executive directors and four executive directors.
Attendance at board and committee meetings during the year under review
Board membersMay 2012
August 2012
February 2013
Ramsay L’Amy (Bill) Daly (independent non-executive chairman)
3 3 3
Anthony Berman (independent non-executive director)
3 3 3
Kevin Utian (independent non-executive director)
3 3 3
Wessel van der merwe (independent non-executive director)
3 3 3
Sebastian Patel (independent non-executive director )
3 3 3
Jay Currie* (non-executive director)
3 3 3
hylton Rabinowitz (non-executive director)
3 3 3
Carlo Gonzaga (CEo) 3 3 3
Evan tsatsarolakis (CFo) 3 3 3
Duncan Crosson (executive director)
3 3 3
Luigi Gonzaga (executive director) 3 3 3
* Mr Currie’s status changed when he became an executive of the Taste Holdings Group in July 2013.
Role and responsibilities of the chairmanthe chairman ensures, among others:• the overall effectiveness of the board and its committees;• that the board provides effective leadership, maintains
ethical standards and is responsible, accountable, fair and transparent; and
• that strategies are developed and implemented with the objective of achieving sustainable economic, social and environmental performance.
To achieve this he fosters a culture of openness and constructive challenge within the board that allows for the expression of
a diversity of views in effective debates and discussions. He also makes himself available to shareholders for discussion on key corporate governance matters and matters of concern to shareholders, as well as other stakeholders.
Roles and responsibilities of the board:As fiduciaries, board members are accountable to shareholders as a whole and they also owe a duty of care and diligence to the company. they act in the best interests of the company and its shareholders. the board:• governs the company on behalf of its shareholders;• is responsible for strategy and strategic decision-making and
execution;• regularly assesses the company’s performance;• engages with stakeholders;• is responsible for Taste Holdings’ approach to corporate
citizenship, safety, health, the environment, ethics and risk;• takes responsibility for its own governance, including the
rotation of directors, training of directors, conflicts of interest and the appointment of directors; and
• regularly monitors and assesses Taste Holdings reputation in the market place.
To fulfil these responsibilities board members participate in rigorous and effective debate and discussion.
Company secretarythe taste holdings group company secretary is responsible for administering the proceedings and affairs of the directorate, the company and, where appropriate, owners of securities in the company, in accordance with the relevant laws. the company secretary is available to assist all our directors with advice on their responsibilities, their professional development and any other relevant assistance they may require.
ms monika pretorius is the duly appointed company secretary of taste holdings. she is neither a director nor a shareholder of taste holdings or any of its subsidiaries and on that basis the board is comfortable that ms pretorius maintains an independent relationship with the executive team, the board and the individual directors in terms of Section 3.84 (j) of the JSE Listings.
the company secretary has provided the board with documentary evidence of her levels of competence in terms of fulfilling her responsibilities as company secretary, which included her qualifications and experience. Ms Pretorius has over six years’ experience as the company secretary of a listed company and has a B Com LLB qualification. She has never been censured by the JSE or penalised or fined for any misconduct. The board, having assessed her abilities based on her qualifications, experience and the level of competence she has demonstrated as taste holdings’ company secretary as required in terms of Section of 3.84(i) of the JSE Listings Requirements, agreed that Ms Pretorius is sufficiently qualified, competent and experienced to act as taste holdings’ company secretary. This was endorsed and confirmed by the Taste Holdings board at its meeting held in May 2013. Ms Pretorius recused herself from that portion of the meeting while the board deliberated on her suitability to act and perform the role and duties of the Taste Holdings group company secretary.
our policies and terms of reference are available through the company secretary.
Corporate governance continued

31
Integrated Annual Report 2013
Audit and risk committeeCompositionSince the appointment of Mr Sebastian Patel the audit committee’s three members are all independent non-executive directors. The CEO and financial director attend committee meetings by invitation, but they do not have a vote. The external auditor also attends meetings by invitation.
Attendance
Board membersMay 2012
August 2012
February 2013
Anthony Berman (chairman – independent non-executive director)
3 3 3
Wessel van der merwe (independent non-executive director)
3 3 3
Jay Currie* (non-executive director)
3 3 3
* Mr Currie resigned in July 2013 to take up an executive position with the Group and Mr Sebastian Patel (independent non-executive director) was appointed in his place in July 2013.
The audit and risk committee meets a minimum of three times a year with special meetings called as and when required. It also meets periodically with the group’s external auditors and Taste Holdings’ executive management. Our board is satisfied that the committee’s members have the necessary qualifications and experience. Non-executive director Jay Currie has a shareholding in the company greater than 5% and therefore technically could not be considered to be an independent director in terms of King III requirements. Despite this, the board considered his input to this committee to be valuable and was satisfied that he had the ability to act independently and in the best interests of the company and all its stakeholders. Mr Currie will join the company in an executive capacity from 1 september 2013 in the newly created role of CEo of the Taste Food Division. He has been replaced by Mr Sebastian Patel, an independent non-executive director, effective 1 July 2013.
Audit committee roles and responsibilitiesThe audit and risk committee has a key role to play in ensuring the appropriate checks and balances are in place, which include robust, independent and efficient audit processes and that financial reporting throughout the group is accurate and reliable.
The committee reviewed and overseen Taste Holdings’ financial and integrated reporting and its system of internal controls:• currently reviews the findings of the external auditors and once
our internal audit function is established will review its findings and oversee the internal audit function;
• obtained external assurance on the financial statements included in taste holdings’ annual report and recommended to the Taste Holdings’ board the approval of the relevant financial statements and going concern of the company;
• carried out its statutory duties set out in Section 90 of the Companies Act, 2008;
• satisfied itself as to the expertise and experience of Taste Holdings’ financial director, Mr Evan Tsatsarolakis and the group’s financial function; and
• confirmed the independence of the external auditor and recommends the appointment of the external auditor.
Risk committee roles and responsibilitiesThe committee’s risk role is to consider risk in its widest sense; identify and assess strategic risks, their impact and the probability of them occurring, and monitor the perceived effectiveness of the group’s existing controls.
The committee:• assists the board with the discharge of its duties relating to
the identification of risk and the assessment of the effectiveness of risk management within the Taste Holdings group;
• establishes and maintains a common understanding of the body of risks that need to be addressed if the company is to achieve its corporate objectives;
• reviews and confirms the company’s levels of risk tolerance and its risk profile at least twice a year;
• co-ordinates Taste Holdings’ risk management efforts, reviews their results and ensures appropriate action is taken;
• reviews and assesses the integrity of the risk control systems and ensures that the risk policies and strategies are effectively managed;
• monitors external developments relating to corporate accountability including emerging and prospective impacts; and
• reviews and discusses the group risk register, which is aggregated from the risk registers prepared by the division, once a year in February.
External auditorThe Taste Holdings’ audit and risk committee formally evaluates the performance and effectiveness of its external auditor. The most recent evaluation was conducted in May 2013 when, in compliance with King III and the JSE Listings Requirements, the audit committee confirmed, among others, the suitability and effectiveness of the external auditor.
The committee determines and carefully monitors the use of the external auditor for non-audit-related services. It is guided by a formal policy that precludes the auditor from providing services, which could impair audit independence.
At its February 2013 meeting the committee nominated BDo south Africa Inc. for re-appointment as external auditor for the coming financial year and satisfied itself that the firm and its individual auditors are properly accredited. The committee also:• noted or ratified the summary of non-audit related services
performed during the period under review;• reviewed the expertise, resources and experience of the
group’s finance capability and agreed to an action plan in respect of those areas of the group where the finance skills and/or procedures are inadequate;
• satisfied itself that management regularly monitors compliance with the Franchise Association code of conduct; and
• evaluated the appropriateness of our financial director’s expertise and experience.
IT riskThe audit and risk committee assists the board with its responsibility for It governance by ensuring that the group manages its information assets effectively, that an IT governance framework is in place, and that management is implementing the framework. The committee also monitors and evaluates significant IT investments and expenditure.

Integrated Annual Report 2013
32
Statement of internal controlthe board acknowledges overall responsibility for the group’s system of internal controls. this includes the establishment of an appropriate control environment and framework, as well as reviewing the effectiveness, adequacy and integrity of this system.
our system of internal control is based on an ongoing process designed to identify the principal risks to the achievement of policies, aims and objectives, to evaluate the nature and extent of those risks and to manage them efficiently, effectively and economically. our system of internal controls is designed to manage rather than eliminate risk. Accordingly, the system can only provide reasonable and not absolute assurance against the occurrence of any material misstatement or loss.
The group has in place an ongoing process for identifying, evaluating, monitoring and managing the principal risks affecting the achievement of its business objectives, which is embedded in the group’s processes and structures.
Delegation of responsibilitiesThe group has in place clearly defined delegation of responsibilities for both executive and operating management, which includes authorisation levels for all aspects of the business. The delegation of these responsibilities is reviewed annually.
Policies and proceduresClearly documented policies and procedures are set out in the taste holdings’ policies which are subject to regular review and updating.
Divisional review meetingsDivisional and operating unit review meetings held monthly, are chaired by the divisional CEO and attended by the CEO and group financial director. Operational, financial and key management issues are identified, discussed and actioned at these meetings.
Monitoring of resultsSales from outlets and through the distribution centre are monitored daily and weekly. Monthly monitoring of financial results against budget takes place at both an operational level and at a board level. major variances against the budget are followed up by management and action is taken.
Code of ethicsThe group adheres to the stringent Franchise Association code of ethics which commits our employees to high standards of integrity, behaviour, good faith and accountability in dealing with our stakeholders.
We expect our directors, employees, employees of companies providing outsourced functions and our suppliers to comply with the principles of this code and to act in accordance with it. The social and ethics committee monitors ethical behaviour in the group (see below). Where there is any non-compliance with this code of conduct, disciplinary action is taken and consistently enforced across the group to discourage a recurrence.
the taste holdings group does not engage or accept the perpetration of any illegal acts in the conduct of its business. It is the policy of the Taste Holdings board to actively pursue and prosecute perpetrators of fraudulent or other illegal activities of which they become aware.
Social, ethics and remuneration committeeCompositionAll the members of our social, ethics and remuneration committee are independent non-executive directors. In terms of the JSE Listings Requirements 3.84 introduced in 2013 the chairman of the board should not be the chairman of the remuneration committee. As a result Anthony Berman has replaced our board chairman, Bill Daly, as committee chairman.
The CEO attends portions of the meeting by invitation, he cannot vote and does not participate in discussions concerning his remuneration. The committee may invite executives and senior managers of the group to attend meetings by invitation, in order to perform its mandate.
Attendance at the social, ethics and remuneration committee
MembershipMay 2012
August 2012
February 2013
Anthony Berman* (chairman – independent non-executive director)
3 3 3
Ramsay L’Amy (Bill) Daly (independent non-executive director)
3 3 3
Kevin Utian (independent non-executive director)
3 3 3
Jay Currie** (non-executive director)
3 3 3
* Mr Berman assumed the role of chairman in July 2013.** Mr Currie resigned as a member of the committee in July 2013.
Remuneration responsibilities of the committeeThe committee meets a minimum of twice a year. It calls additional meetings as and when they are required.
The committee:• consults with executive management to ensure that the
group’s directors and senior executives are fairly rewarded for their individual contributions to overall performance and that their remuneration is in line with Taste Holdings’ remuneration policy;
• assists the board by ensuring that Taste Holdings’ directors and executives are remunerated fairly and responsibly and that their remuneration is aligned with shareholders’ interests;
• ensures that group’s remuneration philosophy, strategies and policies are designed to attract, retain and motivate quality employees, directors and senior management, committed to achieving the overall goals of the company (see the remuneration report on page 34 for details of our remuneration philosophy, strategy and policies);
• makes recommendations to the board and shareholders for their consideration and final approval regarding remuneration strategy and policy ;
• ensures that the disclosure regarding the remuneration of directors and prescribed officers is accurate, complete and transparent; and
• benchmarks remuneration against competitor companies and third party salary surveys. Automatic increases are not implemented or contracted into with any employees.
Corporate governance continued

33
Integrated Annual Report 2013
Nomination responsibilities of the committeeIn addition to its remuneration responsibilities the committee’s responsibilities include setting the criteria for board nominations, identifying, evaluating and recommending to the board suitable candidates for appointment to the taste holdings board, as well as succession planning. It also sets the criteria for board nominations.
It also ensures that:• Taste Holdings’ leadership is representative of all race groups
and is in accordance with the spirit and targets set out in the dti Codes of Good Practice;
• the appointment of our directors is transparent and governed by the formal procedures set out in the committee’s mandate and terms of reference and the board charter;
• directors retire and are re-elected in accordance with the mandate and the company’s memorandum of incorporation; and
• succession planning is reviewed annually and as required through employee movements.
Social and ethics responsibilities of the committeeThe key function of this committee, which is a statutory committee in terms of the Companies Act, is to act as the social conscience of the business and to ensure that the company behaves like a responsible corporate citizen.
To fulfil its function the committee assists the board by performing an oversight and monitoring role in terms of:• the embedding of a culture of ethical behaviour in Taste
holdings, which is championed by the CEo and members of the Executive committee;
• activities with regard to social and economic development;• making recommendations on the group’s empowerment
credentials;
• monitoring the group’s corporate social responsibilities; and• monitoring social and economic development goals including: – United Nations Global Compact Principles; – Organisation for Economic Co-operation and Development
an international organisation assisting with government’s challenges regarding corruption;
– Employment Equities Act, and B-BBEE; – Good corporate citizenship; – The environment, health and public safety; – Consumer relationships including the company’s
advertising, public relations, investor relations and compliance with consumer protection laws; and
– Labour and employment.
The committee is giving additional impetus to our existing efforts to establish a culture of ethical behaviour.
Executive committeeThe executive committee, which is chaired by the CEO, is responsible for the operational activities of the Taste Holdings group and for monitoring its operating and financial performance. It meets monthly, with additional meetings held if required.
The committee assists the chief executive in the performance of his duties by, among others:• taking responsibility for the operational activities of the group;• developing strategy, operational plans, policies, procedures
and budgets;• assessing and controlling risk;• prioritising and allocating resources; and• monitoring competitive forces in each area of operation.
Details of the members of the executive committee are on pages 6 to 8 of this report.
Value and quality

Integrated Annual Report 2013
34
Board governance processesProcess Approach
Appointment of directors Directors are appointed by means of a transparent and formal procedure, which is governed by the mandate and terms of reference of the board charter and the Social, ethics and remuneration committee. A director’s skills, knowledge, experience in relevant sectors, qualifications, availability, number of external board appointments and what they bring to the diversity of the board are among the issues considered in the selection process against the backdrop of Taste Holdings’ strategies.
Rotation of directors In terms of the company’s memorandum of incorporation, at least one third of the directors retire by rotation every year and may offer themselves for re-election by shareholders at the annual general meeting.
Directors’ conflicts of interest In terms of the Companies’ Act, King III and the taste holdings board charter, a director of a company must avoid a situation in which he/she has, or can have, a direct or indirect personal financial interest that conflicts, or possibly may conflict, with the interests of the group. The board has established procedures to enable the directors to notify the company of any actual or potential conflict situations and to declare any personal financial interests.
If directors find that a conflict of interest is unavoidable then they must disclose it and recuse themselves from any decisions regarding matters where this interest may impair their judgement.
The group declaration of interests policy regulates the behaviour of all other group employees.
Induction and training of directors
When we appoint new directors they receive a formal induction to the group which includes their expected duties as directors of Taste Holdings. We recognise that even the most seasoned professionals may, on occasion, feel the need to seek advice from independent professionals regarding the discharge of their duties. Our board charter encourages our directors to seek independent advice funded by taste holdings.
Board effectiveness Last year, members performed self-evaluations of our board and its committees. These evaluations confirmed that the members of both the board and its committees believed they are functioning effectively. Any suggestions that members made that they believed could further improve their functioning were acted on.
Stakeholder engagement See the section on Social and relationship capital on pages 21 to 22.
Dealing in securities taste holdings has a policy in place to guide directors and designated employees on dealing in the company’s securities. The JSE Listings Requirements specifically prohibit directors or senior employees from buying or selling a company’s shares during a closed period.
Corporate governance continued
Prescribed officersIn accordance with the Companies Act, taste holdings has defined its prescribed officers, who exercise general control over the whole or a significant portion of the activities of our business or regularly participate to a material degree in the exercise of general executive control over and management of the whole or a significant portion of business activities in the group. Our prescribed officers are employed under normal employment contracts with notice periods ranging from one to three months.
Remuneration reportOur remuneration philosophyThe group’s remuneration policy is based on the premise that fair and competitive remuneration motivates individual achievement and enhances a company’s general performance. We achieve what we believe is fair and competitive remuneration through combining fixed and performance-enhancing incentives with the aim of attracting and retaining competent and experienced employees.
Our base pay for executive directors and senior management is benchmarked annually against direct industry peers, comparable listed companies and at least one salary survey specialist company. We also take into consideration the revenue, profit and number of employees and assets under that person’s control. Where no adjustment is due to an employee, salary increases are guided by a combination of the Consumer Price Index and then prevailing
trends among listed companies, based on surveys complied by specialist companies.
Base remuneration policyAs part of its strategy to attract and retain top individuals in their area of expertise Taste has a stated strategy to pay base salaries in the 75% percentile, as per external salary surveys. During the year no ex gratia payments were made to directors, executive committee or management committee members.
Retention and incentive policyThe main purpose of our remuneration structure is to align management and shareholder interests. At the core of this alignment is the retention of key employees and the linking of management performance measures to shareholder and enterprise value. to this end the group uses two structures to retain employees, reward increases in company profitability and reward increases in enterprise value, one being a short-term cash incentive programme and the other a long- term incentive scheme.
Short-term cash incentive programmeMembers of the executive committee are participants in a short-term cash incentive programme. This programme is based on an incentive pool in which members of the executive committee share proportionately to their cost to company. They are also incentivised on audited profit before tax growth

35
Integrated Annual Report 2013
targets over the previous year, and these incentives are paid annually in cash. Each brand further incentivises its team members in terms of their performance against targets, which contribute to the groups’ growth objectives.
While the short-term incentive pool scheme has served the group well during the past four years, it will be reviewed during the next financial year, to increase its alignment with the market value and cost to company of each individual.
Long-term share incentive scheme.there are currently two long-term schemes in place:
A share option scheme that was initiated in May 2010 for those who were members of the executive committee at that time. The scheme gave participants the right to acquire ordinary shares at a strike price of 43 cents per share (being the 30-day volume weighted average of taste shares on the grant date, being 6 May 2010). Options vest in three tranches from 2012 to 2014. Once vesting of a tranche has been triggered, a third of the options within the tranche can be exercised one year after vesting was triggered, a further third, two years after the vesting was triggered and the final third, three years after the vesting was triggered. The options must be exercised within five years of vesting being triggered. Upon cessation of employment, options that have been granted and accepted but not yet vested are forfeited unless approval for the employee to retain his/her options is obtained from the trustees. All options must be exercised no later than the eighth anniversary on which they were granted unless approval is obtained from trustees.
Due to various constraints in this long-term share incentive scheme, the remunerations committee approved a new share option scheme that is more principally driven during the year under review. the scheme is based on the following principles:• Share options are issued annually in a consistent, transparent
and principled manner linked to cost to company. • The quantum of options granted is linked to the market value
of the individual, being the cost to company and the short term incentive granted the previous year.
• The quantum is calculated as a multiple of the market value of an individual, taking into account seniority, responsibility and contribution to the group value.
• The qualifying factor for the issue of share options is currently cpi + 6% at the headline earnings per share (hEps) level.
• The options will vest over a five year period in 25% tranches and the first tranche can only be exercised after 24 months.
• All options must be exercised within five years.
The purpose of this long-term share incentive scheme is to motivate continuous improvement in enterprise value.
Disclosure of remunerationKing III recommends that a company should disclose the salaries paid to the top three executives, excluding executive directors. the taste holdings board has decided that because
of the value of these employee’s to the company and the highly competitive nature of the South African retail environment it is not in the interests of the company to disclose the individual salaries of these three executives. Instead, we are disclosing the combined salaries paid these three executives in the 2013 financial year. Including their basic salaries, motor vehicles and medical aid benefits they were paid a total of R4 157 000 (2012: R3 525 000). The remuneration paid to directors is disclosed on page 80 of the financial statements contained in this report.
Non-executive directors’ feesIn accordance with taste holdings’ policy of ensuring that non-executive directors’ fees are market related, the company benchmarks annually against direct competitors and comparable listed companies. The fees for our non-executive directors are paid in the context of good governance and in line with our strategy of attracting and retaining high calibre individuals as custodians of the company’s business.
the fees are based on a methodology which takes into account membership or chairmanship of a sub-committee. The fees vary according to the different roles, such as chairman, that non-executive directors undertake in the board sub-committees.
To avoid any conflict of interest, non-executive directors do not and will not participate in any share-based incentive scheme or any other incentive scheme that the company may implement.
Non-executive directors’ fees are tabled annually for approval by the company’s shareholders. The non-executive directors’ fees paid in the 2013 financial year are set out below, as are the proposed non-executive fees for 2014.
the increase in fees are retrenced to CpI and external surveys and are the same as those given to Executive Directors, being 7%.
2013Paid
2014proposed fee
R R
Board chairman 200 000 214 000Board members 100 000 107 000 Audit and risk committee chairman 200 000 214 000Audit and risk committee members 25 000 26 750 social, ethics and remuneration committee chairman 33 000 35 310social, ethics and remuneration committee members 25 000 26 750
thE mAIN puRposE oF ouRREMUNERATION STRUCTUREIs to ALIGN mANAGEmENt AND shAREhoLDER INtEREsts

37
Integrated Annual Report 2013
annual financial StatementS
These annual financial statements have been audited in compliance with the applicable requirements of the Companies Act No 71 of 2008.
These annual financial statements were authorised on 17 July 2013 by the board of directors.
contents38 Directors’ responsibility and approval
38 Declaration by company secretary
39 Report by audit and risk committee
40 Directors’ report
43 Report of the independent auditors
44 Statements of financial position
45 Statements of comprehensive income
46 Statements of changes in equity
47 Statements of cash flows
48 Notes to the annual financial statements
87 Shareholders’ analysis
88 Shareholders’ diary
88 JSE performance
89 Notice to annual general meeting
101 Form of proxy

Integrated Annual Report 2013
38
Directors’ responsibility and approvalfor the year ended february 2013
The directors are required by the Companies Act, No 71 of 2008 to maintain adequate accounting records and are responsible for the content and integrity of the annual financial statements and related financial information included in this report. It is their responsibility to ensure that the annual financial statements fairly present the state of affairs of the company and group as at the end of the financial year and the results of their operations and cash flows for the period then ended, in conformity with International Financial Reporting Standards, the SAICA Financial Reporting Guides as issued by the Accounting Practices Committee and Financial Reporting Pronouncements as issued by the Financial Reporting Standards Council, the requirements of the Companies Act, No 71 of 2008 and the Listing Requirements of the JSE Limited. The external auditors are engaged to express an independent opinion on the annual financial statements.
These annual financial statements are based upon appropriate accounting policies consistently applied and supported by reasonable and prudent judgements and estimates.
The directors acknowledge that they are ultimately responsible for the system of internal financial control established by the company and group and place considerable importance on maintaining a strong control environment. To enable the directors to meet these responsibilities, the board of directors set standards for internal control aimed at reducing the risk of error or loss in a cost‑effective manner. The standards include the proper delegation of responsibilities within a clearly defined framework, effective accounting procedures and adequate segregation of duties to ensure an acceptable level of risk. These controls are monitored throughout the company and group and all employees are required to maintain the highest ethical standards in ensuring the company and group’s business is conducted in a manner that in all reasonable circumstances is above reproach. The focus of risk management in the company and group is on identifying, assessing, managing and monitoring all known forms of risk across the company and group. While operating risk cannot be fully eliminated, the company and group endeavour to minimise it by ensuring that appropriate infrastructure, controls, systems and ethical behaviour are applied and managed within predetermined procedures and constraints.
The directors are of the opinion, based on the information and explanations given by management, that the system of internal control provides reasonable assurance that the annual financial records may be relied on for the preparation of the annual financial statements. However, any system of internal financial control can provide only reasonable, and not absolute, assurance against material misstatement or loss.
The directors have reviewed the group’s cash flow forecast for the year to 28 February 2013 and, in the light of this review and the current financial position, they are satisfied that the group has, or has access to, adequate resources to continue in operational existence for the foreseeable future.
Although the board of directors is primarily responsible for the financial affairs of the company and group, they are supported by the group’s external auditors.
The external auditors are responsible for independently reviewing and reporting on the group’s annual financial statements. The annual financial statements have been examined by the group’s external auditors and their report is presented on page 43.
The annual financial statements set out on pages 44 to 86, which have been prepared on the going‑concern basis, were approved by the board of directors on 17 July 2013 and were signed on its behalf by:
Ramsay l’amy Daly carlo ferdinando GonzagaNon-executive Chairman Chief Executive Officer
Sandton17 July 2013
In terms of section 88(2)(e) of the Companies Act, No 71 of 2008, I certify that to the best of my knowledge all returns and notices as are required by the Companies Act for a public company have been lodged with the Companies and Intellectual Properties Commission and that all such returns and notices are true, correct and up to date.
monika PretoriusCompany secretary
Sandton17 July 2013
Declaration by company secretary
Preparation of financial statementsThe financial statements set out on pages 44 to 86 have been prepared and supervised by the group financial director, Evangelos Tsatsarolakis CA(SA).

39
Integrated Annual Report 2013
Report by audit and risk committeefor the year ended february 2013
The composition of the audit and risk committee is in line with the provisions of the Companies Act, No 71 of 2008 and is chaired by Anthony Berman. During the financial year ended 28 February 2013, in addition to the duties set out on page 31, the audit and risk committee:• Has reviewed the quality and effectiveness of the scope of the external audit.• Has nominated BDO South Africa Incorporated (BDO) as the registered independent auditor after satisfying itself through enquiry
that BDO is independent as defined in terms of the Companies Act.• Has satisfied itself through enquiry that the audit partner, Mrs Jeanie Roberts, is independent.• Has approved the terms of engagement and fees paid to BDO.• Has reviewed the nature of non-audit services provided by the external auditors in order to ensure that the fees for such services
do not become so significant as to call to question their independence. BDO provides non-audit services to the company and the audit and risk committee has preapproved the contract for tax administration by BDO.
• No reportable irregularities were identified and reported by BDO to the committee.• There was no material weakness in financial controls which resulted in material financial loss during the year under review.• The audit committee has considered and satisfied itself of the appropriateness of the expertise and experience of the financial
director, Evangelos Tsatsarolakis, and is unanimously satisfied of his continuing suitability for the position. The committee has further assessed the appropriateness of the expertise and adequacy of resources of the finance function and experience of the senior members of management responsible for the finance function and concludes that these are adequate.
• The audit committee recommended the annual financial statements for the year ended 28 February 2013 for approval to the board. The board has subsequently approved the annual financial statements which will be open for discussion at the forthcoming annual general meeting.
anthony BermanChairman – audit and risk committee
Sandton17 July 2013

Integrated Annual Report 2013
40
Directors’ reportfor the year ended february 2013
The directors have pleasure in submitting their report which forms part of the audited financial statements of the company and of the group for the year ended 28 February 2013.
nature of businessTaste Holdings Limited is a South African‑based management group listed on the JSE Limited, the recognised securities exchange in South Africa. The group is invested in a portfolio of mostly franchised, category specialist restaurant and retail brands, represented in some 600 locations throughout Southern Africa. The company’s brand portfolio includes Scooters Pizza, Maxi’s, St Elmo’s, The Fish and Chip Co. and NWJ (Natal Wholesale Jewellers). The company is involved in the establishment of new business, marketing and advertising of the brands and the operational control of the franchised outlets to ensure consistency and compliance across the chains. The company also manufactures and supplies jewellery and selected food items to its jewellery and food brands respectively.
financial statements and results The company and group results and financial position are reflected in the financial statements on pages 44 to 86. The group recorded a profit after tax for the year ended 28 February 2013 of R24,8 million (2012: R21,1 million).
litigationAs per the sale agreement, the Fish and Chip Co. business was sold to a subsidiary of Taste Holdings Limited on 1 February 2012. The sellers handed over the business and full control thereof to Taste and the business has been fully integrated into the operations of Taste. During July 2012, a dispute arose between the parties as to the quantum of operational amounts to be settled between them resulting from the closing of the sale of business transaction. These operational amounts consisted primarily of deposits paid by prospective franchisees to the sellers. Taste referred this dispute to its auditors for determination in accordance with the provisions of the sale agreement. The sellers thereafter purported to cancel the agreement and have issued summons in this regard. Taste does not accept the purported cancellation and deems it to be entirely without foundation. It is defending the action and will file a counter claim in due course. It is furthermore considering instituting various other actions to safeguard its rights, including enforcing the restraint of trade against the sellers.
events subsequent to year-endThe directors are not aware of any other matter or circumstance arising since the end of the year up to the date of this report, not otherwise dealt with in this report. Refer to note 41.
Authorised and issued share capitalThe authorised and issued share capital of the company remained unchanged for the year ended 28 February 2013, details of which are set out in note 15 of the annual financial statements. At 28 February 2013, 1 720 000 ordinary shares were held by The Taste Holdings Share Trust. These are treated as treasury shares and have been eliminated on consolidation.
Staff share option schemeDetails are reflected in note 34 of the financial statements.
BorrowingsIn terms of the articles of association of the company, the directors may exercise all powers of the company to borrow money, as they consider appropriate.
DividendsThe directors declared a gross dividend of 5.1 cents per ordinary share, paid on 8 July 2013 to ordinary shareholders recorded in the company’s register at the close of business on 5 July 2013. As this dividend was declared after the reporting date, it will only be accounted for in the 2014 financial year. Further details are reflected in note 18 of the financial statements.
Capital expenditureThe significant capital expenditure incurred during the year is attributable to the set up and establishment of two distribution depots within the food services division situated in Cape Town and Gauteng respectively. The expenditure was funded from internal cash resources.

41
Integrated Annual Report 2013
DirectorsThe directors of the company during the year and to the date of this report are as follows:
nameCarlo Ferdinando Gonzaga Duncan John Crosson Jay Bayne Currie Kevin Utian Hylton Roy RabinowitzLuigi Gonzaga Ramsay L’Amy Daly (Bill) Anthony BermanEvangelos TsatsarolakisWessel Petrus van der Merwe Sebastian Patel – appointed 5 March 2012
In terms of the company’s articles of association, Ramsay L’Amy Daly and Anthony Berman retire at the forthcoming annual general meeting. These gentlemen, both being eligible, offer themselves for re‑election. Service agreements with the directors of Taste Holdings Limited at the date hereof do not impose any abnormal notice periods on the company.
Shareholders will be asked to confirm these reappointments at the forthcoming annual general meeting.
SecretaryThe secretary of the company is Monika Pretorius of:
Business address 12 Gemini Street Postal address PO Box 1125 Linbro Business Park Ferndale Sandton Randburg 2065 2160
SubsidiariesDetails of the company’s subsidiary companies are contained in note 6 of the financial statements. The company had an interest in its subsidiaries’ aggregate profit after taxation of R31 722 808 (2012: R23 450 770) and in their losses after taxation of R3 177 300
(2012: R131 102).
Special resolutionsAt a general meeting of the shareholders on 10 August 2012 the following resolutions were passed:– General authority to directors to acquire the company’s shares.– Approval of fees payable to the non‑executive directors for the year ended 28 February 2013.– Approval of authority to directors to provide financial assistance to all subsidiaries and their inter‑related companies within the Taste
Holdings group of companies.– Adoption Memorandum of Incorporation.
Special resolutions by trading subsidiaries:– Authority to provide financial assistance to inter‑related companies within the Taste Holdings group of companies.
Directors’ responsibilityThe responsibility of the company’s directors are detailed on page 38 of this report.

Integrated Annual Report 2013
42
Directors’ report continuedfor the year ended february 2013
Directors’ interestsNo contracts in which directors or officers of the company or group had an interest and that significantly affected the affairs or business of the company or any of its subsidiaries were entered into during the year.
number of shares held
DirectorBeneficially
directBeneficially
indirect total %
at 28 february 2013Carlo Ferdinando Gonzaga and associates – 6 385 000 6 385 000 3.26Duncan John Crosson 4 711 082 – 4 711 082 2.41Luigi Gonzaga and associates – 2 065 000 2 065 000 1.05Ramsay L’Amy Daly (Bill) and associates 40 000 5 019 200 5 059 200 2.58Jay Bayne Currie 14 561 768 – 14 561 768 7.43Hylton Roy Rabinowitz 357 999 29 039 954 29 397 953 15.01Kevin Utian and associates – 2 000 000 2 000 000 1.02Anthony Berman 1 350 000 – 1 350 000 0.69Wessel Petrus van der Merwe – 1 200 000 1 200 000 0.61Evangelos Tsatsarolakis 100 000 – 100 000 0.05
21 120 849 45 709 154 66 830 003 34.12at 29 february 2012Carlo Ferdinando Gonzaga and associates – 6 385 000 6 385 000 3.26Duncan John Crosson 4 711 082 – 4 711 082 2.41Luigi Gonzaga and associates – 2 865 000 2 865 000 1.46Ramsay L’Amy Daly (Bill) and associates 40 000 5 019 200 5 059 200 2.58Jay Bayne Currie 14 561 768 – 14 561 768 7.43Hylton Roy Rabinowitz 357 999 29 039 954 29 397 953 15.01Anthony Berman 1 350 000 – 1 350 000 0.69Wessel Petrus van der Merwe – 1 200 000 1 200 000 0.61Evangelos Tsatsarolakis 100 000 – 100 000 0.05
21 120 849 44 509 154 65 630 003 33.50
Subsequent to year end, after the company’s closed period, the following directors traded in the company’s shares:
name Date nature of transaction number of shares
Hylton Roy Rabinowitz 30 May 2013 Sale 28 000Duncan John Crosson 5 June 2013 Exercise and sale of options 158 000Carlo Ferdinando Gonzaga 5 June 2013 Purchase 158 000Kevin Utian 5 June 2013 Sale 1 000 000Jay Bayne Currie 12 June 2013 Sale 2 500 000
Corporate governance and sustainabilityThe corporate governance and sustainability report is set out on pages 28 to 35.
Shareholder spreadDetails of the company’s shareholder spread are recorded on page 87.
Going concernThe annual financial statements have been prepared on the going concern basis. Having reviewed the group’s financial projections, the directors believe that the group will continue trading as a going concern in the foreseeable future.
Ramsay l’amy Daly carlo ferdinando GonzagaNon-executive Chairman Chief Executive Officer

43
Integrated Annual Report 2013
Report of the independent auditorsfor the year ended february 2013
to the shareholders of taste Holdings limitedWe have audited the group annual financial statements and annual financial statements of Taste Holdings Limited, which comprise the consolidated and separate statement of financial position as at 28 February 2013, the consolidated and separate statements of comprehensive income, consolidated and separate statements of changes in equity, and consolidated and separate statement of cash flows for the year then ended, a summary of significant accounting policies and other explanatory notes, as set out on pages 44 to 86.
Directors’ responsibility for the financial statementsThe company’s directors are responsible for the preparation and fair presentation of these annual financial statements in accordance with International Financial Reporting Standards, the SAICA Financial Reporting Guides as issued by the Accounting Practices Committee and Financial Reporting Pronouncements as issued by the Financial Reporting Standards Council and in the manner required by the Companies Act, No 71 of 2008. This responsibility includes: designing, implementing and maintaining internal control relevant to the preparation and fair presentation of annual financial statements that are free from material misstatement, whether due to fraud or error; selecting and applying appropriate accounting policies; and making accounting estimates that are reasonable in the circumstances.
Auditors’ responsibilityOur responsibility is to express an opinion on these annual financial statements based on our audit. We conducted our audit in accordance with International Standards on Auditing. Those standards require that we comply with ethical requirements and plan and perform the audit to obtain reasonable assurance whether the annual financial statements are free from material misstatement.
An audit involves performing procedures to obtain audit evidence about the amounts and disclosures in the annual financial statements. The procedures selected depend on the auditor’s judgement, including the assessment of the risks of material misstatement of the annual financial statements, whether due to fraud or error. In making those risk assessments, the auditor considers internal control relevant to the entity’s preparation and fair presentation of the annual financial statements in order to design audit procedures that are appropriate in the circumstances, but not for the purpose of expressing an opinion on the effectiveness of the entity’s internal control. An audit also includes evaluating the appropriateness of accounting policies used and the reasonableness of accounting estimates made by the directors, as well as evaluating the overall presentation of the annual financial statements.
We believe that the audit evidence we have obtained is sufficient and appropriate to provide a basis for our audit opinion.
OpinionIn our opinion, the annual financial statements and group annual financial statements present fairly, in all material respects, the consolidated and separate financial position of the group and of the company as of 28 February 2013, and of their consolidated and separate financial performance and its consolidated and separate cash flows for the year then ended in accordance with International Financial Reporting Standards, the SAICA Financial Reporting Guides as issued by the Accounting Practices Committee and Financial Reporting Pronouncements as issued by the Financial Reporting Standards Council and its successor and in the manner required by the Companies Act, No 71 of 2008.
Other reports required by the Companies ActAs part of our audit of the financial statements for the year ended 28 February 2013, we have read the directors’ report, the audit and risk committee’s report and the company secretary’s declaration for the purpose of identifying whether there are material inconsistencies between these reports and the audited financial statements. These reports are the responsibility of the respective preparers. Based on reading these reports we have not identified material inconsistencies between these reports and the audited financial statements. However, we have not audited these reports and accordingly do not express an opinion on these reports.
BDO South Africa Incorporated
Registered AuditorsPer: Jeanie RobertsPartner
17 July 2013
22 Wellington RoadParktown2193

Integrated Annual Report 2013
44
Statements of financial positionfor the year ended february 2013
Group Company
Notes2013
R’0002012
R’0002013
R’0002012
R’000
aSSetSnon-current assetsProperty, plant and equipment 4 17 063 11 853 298 494Intangible assets 5 83 508 87 045 – –Goodwill 5 69 934 68 669 – –Investments in subsidiaries 6 – – 121 058 121 058Other financial assets 9 5 885 3 092 – –Deferred tax 10 1 354 755 215 433
177 744 171 414 121 571 121 985non-current assets held for sale 8 675 1 258 – –current assetsLoans to group companies 7 – – 37 151 42 271Other financial assets 9 4 430 3 631 – –Advertising levies 11 1 939 1 435 – –Inventories 12 94 029 70 576 – –Trade and other receivables 13 67 541 56 606 86 196Current tax receivables 2 978 1 137 – 5Cash and cash equivalents 14 20 331 35 308 2 818 16
191 248 168 693 40 055 42 488total assets 369 667 341 365 161 626 164 473equity anD liaBilitieSequityEquity attributable to equity holders of parentShare capital and share premium 15 80 103 80 103 91 586 91 586Retained earnings 108 171 91 162 11 635 14 257Equity‑settled share‑based payments reserve 34 972 575 972 575
189 246 171 840 104 193 106 418liabilitiesnon-current liabilitiesLong‑term employee benefits 16 126 252 126 252Borrowings 17 45 046 54 195 – –Deferred tax 10 21 591 21 873 – –
66 763 76 320 126 252current liabilitiesLoans from group companies 7 – – 53 035 54 606Current tax payable 3 55 3 –Bank overdrafts 14 13 163 9 770 – 815Borrowings 17 10 694 11 406 – –Balances due to vendors 17 1 000 1 000 – –Provisions 20 250 250 – –Dividends payable 38 17 38 17Trade and other payables 21 88 510 70 707 4 231 2 365
113 658 93 205 57 307 57 803total liabilities 180 421 169 525 57 433 58 055total equity and liabilities 369 667 341 365 161 626 164 473

45
Integrated Annual Report 2013
Statements of comprehensive incomefor the year ended february 2013
Group Company
Notes2013
R’0002012
R’0002013
R’0002012
R’000
Revenue 23 506 431 304 264 20 195 10 827Cost of sales 24 (311 367) (170 352) – –Gross profit 195 064 133 912 20 195 10 827Other income 496 9 – 3Operating expenses (152 668) (98 740) (15 118) (11 761)Operating profit/(loss) 25 42 892 35 181 5 077 (931)Investment revenue 26 1 956 884 752 272Finance costs 27 (7 162) (5 684) (352) (283)Profit/(loss) before taxation 37 686 30 381 5 477 (942)Taxation 28 (12 911) (9 310) (262) (204)Profit/(loss) for the year 24 775 21 071 5 215 (1 146)Other comprehensive income – – – –
Total comprehensive income/(loss) for the year 24 775 21 071 5 215 (1 146)Attributable to:Equity holders of company 24 775 21 071 5 215 (1 146)Earnings per share attributable to equity holders of companyBasic earnings per share (cents) 39 12.8 12.2 – –Fully diluted earnings per share (cents) 39 12.3 11.6 – –

Integrated Annual Report 2013
46
Statements of changes in equityfor the year ended february 2013
SharecapitalR’000
Sharepremium
R’000
equity-settledshare-based
payment reserve
R’000
Retainedearnings
R’000
totalequityR’000
GroupBalance at 28 february 2011 2 43 141 176 75 196 118 515Changes in equity:Total comprehensive income for the year – – – 21 071 21 071Share‑based payment – – 399 – 399Share issue – 36 960 – – 36 960Dividends paid (refer to note 18) – – – (5 105) (5 105)Total changes – 36 960 399 15 966 53 325Balance at 29 february 2012 2 80 101 575 91 162 171 840Changes in equity:Total comprehensive income for the year – – – 24 775 24 775Share‑based payment – – 397 – 397Dividends paid (refer to note 18) – – – (7 766) (7 766)Total changes – – 397 17 009 17 406Balance at 28 february 2013 2 80 101 972 108 171 189 246Note 15 15 34
CompanyBalance at 28 february 2011 2 54 624 176 20 559 75 361Changes in equity:Total comprehensive loss for the year – – – (1 146) (1 146)Share‑based payment – – 399 – 399Share issue – 36 960 – – 36 960Dividends paid (refer to note 18) – – – (5 156) (5 156)
Total changes – 36 960 399 (6 302) 31 057
Balance at 29 february 2012 2 91 584 575 14 257 106 418Changes in equity:Total comprehensive profit for the year – – – 5 214 5 214 Share‑based payment – – 397 – 397 Dividends paid (refer to note 18) – – – (7 836) (7 836)
Total changes – – 397 (2 622) (2 225)
Balance at 28 february 2013 2 91 584 972 11 635 104 193 Note 15 15 34

47
Integrated Annual Report 2013
Statements of cash flowsfor the year ended february 2013
Group Company
Notes2013
R’0002012
R’0002013
R’0002012
R’000
Cash flows from operating activitiesCash generated from/(used in) operations 30 36 118 39 132 7 790 (331)Investment revenue 26 1 956 884 752 272Dividends paid 18 (7 745) (5 088) (7 814) (5 139)Finance costs (7 162) (5 684) (352) (283)Income tax paid 31 (15 643) (8 832) (5) (516)
Net cash from operating activities 7 524 20 412 371 (5 997)cash flows from investing activitiesAcquisition of property, plant and equipment 4 (8 600) (2 954) (22) (342)Proceeds of property, plant and equipment 322 11 25 6Acquisition of intangible assets 5 (1 839) (2 150) – –Proceeds on disposal of non‑current assets held for sale – 211 – –Acquisition of business 22 (2 133) (55 000) – –Proceeds on disposal of retail store – 1 150 – –Loans advanced 9 (5 049) (1 856) – –Loans repaid 9 1 392 – – 1 150Loans advanced to group companies – – (1 751) (21 217)Loans repaid by/(to) group companies – – 5 120 (21 769)
net cash from investing activities (15 907) (60 588) 3 372 (42 172)cash flows from financing activitiesDecrease in long‑term employee benefits (126) (177) (126) (177)Proceeds from issue of shares – 36 960 – 36 960Loans raised 17 921 20 988 – –Loans repaid 17 (10 782) – – –
net cash from financing activities (9 987) 57 771 (126) 36 783change in cash and cash equivalents (18 370) 17 595 3 617 (11 386)Cash and cash equivalents at beginning of the year 25 538 7 943 (799) 10 587cash and cash equivalents at end of the year 14 7 168 25 538 2 818 (799)

Integrated Annual Report 2013
48
Notes to the annual financial statementsfor the year ended february 2013
1. Accounting policies Presentation of annual financial statements The group and company annual financial statements have been prepared in accordance with International Financial Reporting
Standards, the SAICA Financial Reporting Guides as issued by the Accounting Practices Committee and Financial Reporting Pronouncements as issued by the Financial Reporting Standards Council and its successor, and the Companies Act, No 71 of 2008. The group and company annual financial statements have been prepared on the historical cost basis, except for the measurement of certain financial instruments at fair value, and incorporate the principal accounting policies set out below.
These accounting policies are consistent with the previous period, except for changes set out in note 2 – new standards and interpretations.
Basis of consolidation The consolidated annual financial statements incorporate the annual financial statements of the company and entities (including
special‑purpose entities) controlled by the company or its subsidiaries. Control is achieved where the company has the power to govern the financial and operating policies of an entity so as to obtain benefits from its activities.
Where necessary, adjustments are made to the annual financial statements of subsidiaries to bring their accounting policies into line with those used by other members of the group.
All intra‑group transactions, balances, income and expenses are eliminated in full on consolidation.
Non‑controlling interests in the net assets, excluding goodwill of consolidated subsidiaries, are identified separately from the group’s equity therein. Non‑controlling interests consist of the amount of those interests at the date of the original business combination and the non‑controlling share of changes in equity since the date of the combination. Losses of subsidiaries attributable to the non‑controlling interests are allocated to the non‑controlling interests even if this results in a debit balance being recognised for the non‑controlling interest.
Business combinations Acquisitions of subsidiaries and businesses are accounted for using the purchase method. The cost of the business combination
is measured as the aggregate of the fair values (at the date of exchange) of assets given, liabilities incurred or assumed, and equity instruments issued by the group in exchange for control of the acquiree, plus any costs directly attributable to the business combination. The acquiree’s identifiable assets, liabilities and contingent liabilities that meet the conditions for recognition under IFRS 3 Business Combinations are recognised at their fair values at the acquisition date, except for non‑current assets (or disposal groups) that are classified as held for sale in accordance with IFRS 5 Non-current Assets Held for Sale and Discontinued Operations, which are recognised and measured at fair value less costs to sell.
The non‑controlling interest in the acquiree is initially measured at the minority’s proportion of the net fair value of the assets, liabilities and contingent liabilities recognised.
Goodwill arising on business combination Goodwill arising on acquisition is recognised as an asset and initially measured at cost, being the excess of the cost of the business
combination over the group’s interest in the net fair value of the identifiable assets, liabilities and contingent liabilities recognised. If the group’s interest in the net fair value of the acquiree’s identifiable assets, liabilities and contingent liabilities exceeds the cost of the business combination, the excess is recognised immediately in profit or loss.
Goodwill is not amortised but is subject to an annual impairment review (see note 1.3).
Trademarks recognised as part of a business combination Trademarks are recognised as an intangible asset where the trademark has a long‑term value. Acquired trademarks are only
recognised where title is clear or the trademark could be sold separately from the rest of the business and the earnings attributable to it are separately identifiable. The group typically arrives at the cost of such trademarks on a relief from royalty basis.
Where the acquired trademark is seen as having a finite useful economic life, it is subject to amortisation, which in respect of trademarks currently held is 10 to 40 years, being the period for which the group has exclusive rights to those trademarks. Where the acquired trademark is seen as having an indefinite useful economic life, it is not amortised and is carried at original cost.
Trademarks are reflected at cost less accumulated amortisation (see also note 1.4).
1.1 Significant estimates and judgements In preparing the annual financial statements, management is required to make estimates and assumptions that affect the
amounts represented in the annual financial statements and related disclosures. Use of available information and the application of judgement is inherent in the formation of estimates. Actual results in the future could differ from these estimates which may be material to the annual financial statements. Significant estimates include:

49
Integrated Annual Report 2013
1. accounting policies (continued) 1.1 Significant estimates and judgements (continued) Trade receivables, loans and other receivables The group assesses its trade receivables and loans and receivables for impairment at each reporting date. In determining
whether an impairment loss should be recorded in the statement of profit or loss and other comprehensive income, the group makes judgements as to whether there are observable data indicating a measurable decrease in the estimated future cash flows from a financial asset.
Impairment testing The company assesses at each reporting date whether there is any indication that an asset may be impaired. If any such
indication exists, the company estimates the recoverable amount of the asset.
Irrespective of whether there is any indication of impairment, the company also: • tests goodwill acquired in a business combination for impairment annually.
If there is any indication that an asset may be impaired, the recoverable amount is estimated for the individual asset. If it is not possible to estimate the recoverable amount of the individual asset, the recoverable amount of the cash‑generating unit to which the asset belongs is determined.
The recoverable amount of an asset or a cash‑generating unit is the higher of its fair value less costs to sell and its value in use. Key assumptions used in the calculation of the recoverable amounts are discount rates, terminal value growth rates and EBITDA growth rate.
If the recoverable amount of an asset is less than its carrying amount, the carrying amount of the asset is reduced to its recoverable amount. That reduction is an impairment loss.
An impairment loss of assets carried at cost less any accumulated depreciation or amortisation is recognised immediately in profit or loss. Any impairment loss of a revalued asset is treated as a revaluation decrease.
Goodwill acquired in a business combination is, from the acquisition date, allocated to each of the cash‑generating units, or groups of cash‑generating units, that are expected to benefit from the synergies of the combination.
An impairment loss is recognised for cash‑generating units if the recoverable amount of the unit is less than the carrying amount of the units. The impairment loss is allocated to reduce the carrying amount of the assets of the unit in the following order:
• first, to reduce the carrying amount of any goodwill allocated to the cash-generating unit; and • then, to the other assets of the unit, pro rata on the basis of the carrying amount of each asset in the unit.
An entity assesses at each reporting date whether there is any indication that an impairment loss recognised in prior periods for assets other than goodwill may no longer exist or may have decreased. If any such indication exists, the recoverable amounts of those assets are estimated.
The increased carrying amount of an asset other than goodwill attributable to a reversal of an impairment loss does not exceed the carrying amount that would have been determined had no impairment loss been recognised for the asset in prior periods.
A reversal of an impairment loss of assets carried at cost less accumulated depreciation or amortisation other than goodwill is recognised immediately in profit or loss. Any reversal of an impairment loss of a revalued asset is treated as a revaluation increase.
Taxation Judgement is required in determining the provision for income taxes due to the complexity of legislation. There are
many transactions and calculations for which the ultimate tax determination is uncertain during the ordinary course of business. The group recognises liabilities for anticipated tax issues based on estimates of whether additional taxes will be due. Where the final tax outcome of these matters is different from the amounts that were initially recorded, such differences will impact the income tax and deferred tax provisions in the period in which such determination is made.
The group recognises the net future tax benefit related to deferred income tax assets to the extent that it is probable that the deductible temporary differences will reverse in the foreseeable future. Assessing the recoverability of deferred income tax assets requires the group to make significant estimates related to expectations of future taxable income. Estimates of future taxable income are based on forecast cash flows from operations and the application of existing tax laws in each jurisdiction. To the extent that future cash flows and taxable income differ significantly from estimates, the ability of the group to realise the net deferred tax assets recorded at the reporting date could be impacted.
Allowance for slow-moving, damaged and obsolete stock Management has made estimates of the selling price and direct cost to sell on inventory items to write stock down to the
lower of cost and net realisable value. Any write‑down is included in operating profit. Any stock that is physically identified as slow moving, damaged or obsolete is written off when discovered.

Integrated Annual Report 2013
50
Notes to the annual financial statements continuedfor the year ended february 2013
1. Accounting policies (continued) 1.1 Significant estimates and judgements (continued) Provisions Provisions were raised and management determined an estimate based on the information available.
Estimated residual values and useful lives of property, plant and equipment Property, plant and equipment is depreciated to its estimated residual value over its estimated useful life.
Management has applied their judgement based on past experience to determine expected useful lives and residual values of property, plant and equipment. Refer to note 1.2.
The depreciation method applied to an asset shall be reviewed at least at each financial year‑end and, if there has been a significant change in the expected pattern of consumption of the future economic benefits embodied in the asset, the method shall be changed to reflect the changed pattern.
1.2 Property, plant and equipment Property, plant and equipment is carried at cost less accumulated depreciation and any impairment losses.
The cost of an item of property, plant and equipment is recognised as an asset when: • it is probable that future economic benefits associated with the item will flow to the company; and • the cost of the item can be measured reliably.
Costs include costs incurred initially to acquire an item of property, plant and equipment and costs incurred subsequently to add to it. If a replacement cost is recognised in the carrying amount of an item of property, plant and equipment, the carrying amount of the replaced part is derecognised.
Depreciation commences when an asset is available for use. Depreciation is charged so as to write off the depreciable amount of items, to their residual values over their estimated useful lives, on a straight‑line basis, being a method that reflects the pattern in which the asset’s future economic benefits are expected to be consumed by the group.
Where an item comprises major components with different useful lives, the components are accounted for as separate items of property, plant and equipment and depreciated over their estimated useful lives.
item average useful lifeComputer software 10 yearsFurniture and fixtures 6 yearsGeneral equipment 5 yearsIT equipment 3 yearsKitchen equipment 5 yearsLeasehold improvements 5 yearsMotor vehicles 5 yearsOffice equipment 5 – 6 yearsPlant and machinery 5 years
The residual value and the useful life of each asset, as well as the method of depreciation, are reviewed at each financial period‑end.
Each part of an item of property, plant and equipment with a cost that is significant in relation to the total cost of the item is depreciated separately.
The depreciation charge for each period is recognised in profit or loss unless it is included in the carrying amount of another asset.
The gain or loss arising from the derecognition of an item of property, plant and equipment is included in profit or loss when the item is derecognised. The gain or loss arising from the derecognition of an item of property, plant and equipment is determined as the difference between the net disposal proceeds, if any, and the carrying amount of the item.
An asset’s carrying amount is written down immediately to its recoverable amount if the asset’s carrying value is greater than its estimated recoverable amount.
1.3 Goodwill Goodwill arising on the acquisition of a subsidiary represents the excess of the cost of acquisition over the group’s interest
in the net fair value of the identifiable assets, liabilities and contingent liabilities of the subsidiary recognised at the date of acquisition. Goodwill is initially recognised as an asset at cost and is subsequently measured at cost less any accumulated impairment losses.

51
Integrated Annual Report 2013
1. Accounting policies (continued) 1.3 Goodwill (continued) For the purpose of impairment testing, goodwill is allocated to each of the group’s cash‑generating units expected to benefit
from the synergies of the combination. Cash‑generating units to which goodwill has been allocated are tested for impairment annually, or more frequently when there is an indication that the unit may be impaired. If the recoverable amount of the cash‑generating unit is less than the carrying amount of the unit, the impairment loss is allocated first to reduce the carrying amount of any goodwill allocated to the unit and then to the other assets of the unit pro rata on the basis of the carrying amount of each asset in the unit. An impairment loss recognised for goodwill is not reversed in a subsequent period.
On disposal of a subsidiary, the attributable amount of goodwill is included in the determination of the profit or loss on disposal.
Internally generated goodwill is not recognised as an asset. A gain on bargain purchase on acquisition is recognised directly in profit or loss.
1.4 intangible assets An intangible asset is recognised when: • it is probable that the expected future economic benefits that are attributable to the asset will flow to the entity; and • the cost of the asset can be measured reliably.
Intangible assets acquired in a business combination are identified and recognised separately from goodwill where they satisfy the definition of an intangible asset and their fair values can be measured reliably. The cost of such intangible assets is their fair value at the acquisition date.
Subsequent to initial recognition, intangible assets acquired in a business combination are reported at cost less accumulated amortisation and accumulated impairment losses, on the same basis as intangible assets acquired separately.
Intangible assets acquired separately are reported at cost less accumulated amortisation and accumulated impairment losses. Amortisation is charged on a straight‑line basis over their estimated useful lives. The estimated useful life and amortisation method are reviewed at the end of each annual reporting period, with the effect of any changes in estimate being accounted for on a prospective basis (note 1.1).
Franchise contributions represent the premium paid for the securing of key sites. Franchise contributions are carried at cost less accumulated amortisation less any impairment losses. Franchise contributions are amortised over the period of the underlying lease agreements. Franchise contributions are classified as intangible assets.
Amortisation is provided to write down the intangible assets, on a straight‑line basis, to nil as follows: item useful life Trademarks and intellectual property 10 – 40 years Franchise contributions Agreement period
1.5 investments in subsidiaries Group annual financial statements The group annual financial statements include those of the holding company and its subsidiaries. The results of the
subsidiaries are included from the date of acquisition or from the date control is achieved. The results of subsidiaries are included to the date of disposal or the date control is relinquished.
On acquisition the group recognises the subsidiary’s identifiable assets, liabilities and contingent liabilities at fair value, except for assets classified as held for sale, which are recognised at fair value less costs to sell.
Company annual financial statements In the company’s separate annual financial statements, investments in subsidiaries are carried at cost less any accumulated
impairment.
The cost of an investment in a subsidiary is the aggregate of: • the fair value, at the date of exchange, of assets given, liabilities incurred or assumed, and equity instruments issued by
the company; plus • any costs directly attributable to the purchase of the subsidiary.
An adjustment to the cost of a business combination contingent on future events is included in the cost of the combination if the adjustment is probable and can be measured reliably.
1.6 financial instruments Initial recognition The company classifies financial instruments, or their component parts, on initial recognition as a financial asset, a financial
liability or an equity instrument in accordance with the substance of the contractual arrangement.

Integrated Annual Report 2013
52
Notes to the annual financial statements continuedfor the year ended february 2013
1. Accounting policies (continued) 1.6 financial instruments (continued) The company classifies financial assets and financial liabilities into the following categories: • loans and receivables; and • financial liabilities measured at amortised cost.
Financial assets and financial liabilities are recognised on the company’s balance sheet when the company becomes party to the contractual provisions of the instrument.
Financial instruments are recognised initially at fair value. For financial instruments which are not at fair value through profit or loss, transaction costs are included in the initial measurement of the instrument.
Fair value determination The fair values of quoted investment are based on current bid prices. If the market for a financial asset is not active (and for
unlisted securities), the company establishes fair value by using valuation techniques. These include the use of recent arm’s length transactions, reference to other instruments that are substantially the same, discounted cash flow analysis, and option pricing models making maximum use of market inputs and relying as little as possible on entity‑specific inputs.
Non‑derivative financial instruments comprise loans, trade and other receivables, cash and cash equivalents, trade payables, borrowings, other financial liabilities and non‑current assets available for sale. The subsequent measurement of financial instruments is stated below:
Loans and receivables Loans and receivables are measured at initial recognition at fair value and are subsequently measured at amortised cost
using the effective interest rate method.
Loans to/(from) group companies These include loans to holding companies, fellow subsidiaries and subsidiaries and are recognised initially at fair value plus
direct transaction costs.
Subsequently these loans are measured at amortised cost using the effective interest rate method, less any impairment loss recognised to reflect irrecoverable amounts.
On loans receivable an impairment loss is recognised in profit or loss when there is objective evidence that it is impaired. The impairment is measured as the difference between the investment’s carrying amount and the present value of estimated future cash flows discounted at the effective interest rate computed at initial recognition.
Impairment losses are reversed in subsequent periods when an increase in the investment’s recoverable amount can be related objectively to an event occurring after the impairment was recognised, subject to the restriction that the carrying amount of the investment at the date the impairment is reversed shall not exceed what the amortised cost would have been had the impairment not been recognised.
Loans to group companies are classified as loans and receivables. Loans from group companies are classified as liabilities at amortised cost.
Trade and other receivables Trade and other receivables are measured at initial recognition at fair value, and are subsequently measured at amortised
cost using the effective interest rate method. Appropriate allowances for estimated irrecoverable amounts are recognised in profit or loss when there is objective evidence that the asset is impaired. Significant financial difficulties of the debtor, probability that the debtor will enter bankruptcy or financial reorganisation, and default or delinquency in payments (more than 30 days overdue) are considered indicators that the trade receivable is impaired. The allowance recognised is measured as the difference between the asset’s carrying amount and the present value of estimated future cash flows discounted at the effective interest rate computed at initial recognition.
The carrying amount of the asset is reduced through the use of an allowance account, and the amount of the loss is recognised in profit or loss within operating expenses. When a trade receivable is uncollectible, it is written off against the allowance account for trade receivables. Subsequent recoveries of amounts previously written off are credited in profit or loss against operating expenses.
Trade and other receivables are classified as loans and receivables.
Trade and other payables Trade and other payables are initially measured at fair value, and are subsequently measured at amortised cost, using the
effective interest rate method.
Cash and cash equivalents Cash and cash equivalents comprise cash on hand and demand deposits, and other short‑term highly liquid investments
that are readily convertible to a known amount of cash and are subject to an insignificant risk of changes in value. These are initially measured at fair value and subsequently recorded at amortised cost. Cash and cash equivalents are classified as loans and receivables.

53
Integrated Annual Report 2013
1. Accounting policies (continued) 1.6 financial instruments (continued) Bank overdrafts and borrowings Bank overdrafts and borrowings are initially measured at fair value, and are subsequently measured at amortised cost, using
the effective interest rate method. Any difference between the proceeds (net of transaction costs) and settlement or redemption of borrowings is recognised over the term of the borrowings in accordance with the company’s accounting policy for borrowing costs. Bank overdrafts and borrowings are classified as liabilities at amortised cost.
Other financial liabilities Other financial liabilities are measured initially at fair value and subsequently at amortised cost, using the effective interest
rate method. These include loans due to vendors and long‑term employee benefits.
Other financial assets Other financial assets classified as loans and receivables are initially recognised at fair value plus transaction costs, and are
subsequently carried at amortised cost less any accumulated impairment.
These financial assets are not quoted in an active market and have fixed or determinable payments.
1.7 Taxation Current tax assets and liabilities Current tax for current and prior periods is, to the extent unpaid, recognised as a liability. If the amount already paid in
respect of current and prior periods exceeds the amount due for those periods, the excess is recognised as an asset.
Current tax liabilities (assets) for the current and prior periods are measured at the amount expected to be paid to (recovered from) the tax authorities, using the tax rates (and tax laws) that have been enacted or substantively enacted by the balance sheet date.
Deferred tax assets and liabilities A deferred tax liability is recognised for all taxable temporary differences, except to the extent that the deferred tax liability
arises from: • the initial recognition of goodwill; or • the initial recognition of an asset or liability in a transaction which: – is not a business combination; and – at the time of the transaction, affects neither accounting profit nor taxable profit (tax loss).
A deferred tax liability is recognised for all taxable temporary differences associated with investments in subsidiaries, except to the extent that both of the following conditions are satisfied:
• the parent is able to control the timing of the reversal of the temporary difference; and • it is probable that the temporary difference will not reverse in the foreseeable future.
A deferred tax asset is recognised for all deductible temporary differences to the extent that it is probable that taxable profit will be available against which the deductible temporary difference can be utilised, unless the deferred tax asset arises from the initial recognition of an asset or liability in a transaction that:
• is not a business combination; and • at the time of the transaction, affects neither accounting profit nor taxable profit (tax loss).
A deferred tax asset is recognised for all deductible temporary differences arising from investments in subsidiaries, to the extent that it is probable that:
• the temporary difference will reverse in the foreseeable future; and • taxable profit will be available against which the temporary difference can be utilised.
A deferred tax asset is recognised for the carry forward of unused tax losses and unused STC credits to the extent that it is probable that future taxable profit will be available against which the unused tax losses and unused STC credits can be utilised.
Deferred tax assets and liabilities are measured at the tax rates that are expected to apply to the period when the asset is realised or the liability is settled, based on tax rates (and tax laws) that have been enacted or substantively enacted by the balance sheet date.
Tax expenses Current and deferred taxes are recognised as income or an expense and included in profit or loss for the period, except to
the extent that the tax arises from: • a transaction or event which is recognised, in the same or a different period, directly in equity; or • a business combination.
Current tax and deferred taxes are charged or credited directly to equity if the tax relates to items that are credited or charged, in the same or a different period, directly to equity.

Integrated Annual Report 2013
54
Notes to the annual financial statements continuedfor the year ended february 2013
1. Accounting policies (continued) 1.8 leases A lease is classified as a finance lease if it transfers substantially all the risks and rewards incidental to ownership. A lease is
classified as an operating lease if it does not transfer substantially all the risks and rewards incidental to ownership.
Operating leases – lessor Operating lease income is recognised on a straight-line basis over the lease term.
Initial direct costs incurred in negotiating and arranging operating leases are added to the carrying amount of the leased asset and recognised as an expense over the lease term on the same basis as the lease income.
Income for leases is disclosed under revenue in the income statement.
Operating leases – lessee Operating lease payments are recognised as an expense on a straight-line basis over the lease term. The difference between
the amounts recognised as an expense and the contractual payments is recognised as an operating lease asset or liability. This asset or liability is not discounted.
1.9 inventories Inventories are initially measured at cost Inventories are subsequently measured at the lower of cost and net realisable value on the weighted average basis.
Net realisable value is the estimated selling price in the ordinary course of business less the estimated costs of completion and the estimated costs necessary to make the sale.
The cost of inventories comprises all costs of purchase, costs of conversion and other costs incurred in bringing the inventories to their present location and condition.
The cost of inventories of items that are not ordinarily interchangeable and goods or services produced and segregated for specific projects is assigned using specific identification of the individual costs.
When inventories are sold, the carrying amount of those inventories are recognised as an expense in the period in which the related revenue is recognised. The amount of any write‑down of inventories to net realisable value and all losses of inventories are recognised as an expense in the period the write‑down or loss occurs. The amount of any reversal of any write‑down of inventories, arising from an increase in net realisable value, is recognised as a reduction in the amount of inventories recognised as an expense in the period in which the reversal occurs.
1.10 Non-current assets held for sale Non‑current assets are held for sale if their carrying amount will be recovered principally through a sale transaction rather
than through continuing use. This condition is regarded as met only when the sale is highly probable, the asset is available for immediate sale in its present condition, and management is committed to the sale.
Non‑current assets classified as held for sale are measured at the lower of their carrying amount and fair value less costs to sell.
Non‑current assets held for sale are not depreciated (or amortised) while they are classified as held for sale.
1.11 Research and development Expenditure on research activities, undertaken with the prospect of gaining new scientific or technical knowledge and
understanding, is recognised in profit or loss as incurred.
Expenditure on development activities, whereby research findings are applied to a plan or design for the production of new or substantially improved products and processes, is capitalised if the product or process is technically and commercially feasible, costs can be measured reliably, future economic benefits are probable and the group has sufficient resources to complete development in order to use or sell the asset. The expenditure capitalised includes the cost of materials, cost of equipment, direct labour and an appropriate proportion of overheads. Other development expenditure is recognised in profit or loss as incurred. Capitalised development expenditure is stated at cost less accumulated amortisation and accumulated impairment losses.
1.12 Share capital and equity An equity instrument is any contract that evidences a residual interest in the assets of an entity after deducting all of
its liabilities.
If the company reacquires its own equity instruments, the consideration paid, including any directly attributable incremental costs (net of income taxes) on those instruments are deducted from equity until the shares are cancelled or reissued. No gain or loss is recognised in profit or loss on the purchase, sale, issue or cancellation of the company’s own equity instruments. Consideration paid or received shall be recognised directly in equity.

55
Integrated Annual Report 2013
1. Accounting policies (continued) 1.12 Share capital and equity (continued) Ordinary shares are classified as equity.
Shares in the company held by The Taste Holdings Share Trust are classified as treasury shares. The number of shares held is deducted from the number of issued shares and the weighted average number of shares in the determination of earnings per share. Dividends received on treasury shares are eliminated on consolidation.
1.13 Equity-settled share-based payments reserve Where equity‑settled share options are awarded to employees, the fair value of the options at the date of grant is charged
to the profit or loss over the vesting period with a corresponding increase in equity recorded in a share option reserve. Non‑market vesting conditions are taken into account by adjusting the number of equity instruments expected to vest at each reporting date so that, ultimately, the cumulative amount recognised over the vesting period is based on the number of options that eventually vest. Non‑vesting conditions and market vesting conditions are factored into the fair value of the options granted. As long as all other vesting conditions are satisfied, a charge is made irrespective of whether the market vesting conditions are satisfied. The cumulative expense is not adjusted for failure to achieve a market vesting condition or where a non‑vesting condition is not satisfied.
Where the terms and conditions of options are modified before they vest, the increase in the fair value of the options, measured immediately before and after the modification, is also charged to the profit or loss over the remaining vesting period.
If the share‑based payments granted do not vest until the counterparty completes a specified period of service, the group accounts for those services as they are rendered by the counterparty during the vesting period (or on a straight‑line basis over the vesting period).
If the share‑based payments vest immediately, the services received are recognised in full.
1.14 Employee benefits Short-term employee benefits The cost of short‑term employee benefits (those payable within 12 months after the service is rendered, such as paid
vacation leave and sick leave, bonuses, and non‑monetary benefits such as medical care) is recognised in the period in which the services are rendered and is not discounted.
Post employment benefits – defined contribution plan A defined contribution plan is a post‑employment benefit plan under which the group pays a fixed percentage of employees’
remuneration as contributions into a separate entity (a fund) and has no further legal or constructive obligations to pay additional contributions if the fund does not hold sufficient assets to pay all employee benefits relating to employee service in the current and prior periods. Contributions to defined contribution plans in respect of services rendered during a period are recognised as an employee benefit expense when they are due.
1.15 Provisions and contingencies Provisions are recognised when: • the company has a present obligation as a result of a past event; • it is probable that an outflow of resources embodying economic benefits will be required to settle the obligation; and • a reliable estimate can be made of the obligation.
The amount of the provision is the present value of the expenditure expected to be required to settle the obligation.
Where some or all of the expenditure required to settle a provision is expected to be reimbursed by another party, the reimbursement shall be recognised when, and only when, it is virtually certain that reimbursement will be received if the entity settles the obligation. The reimbursement shall be treated as a separate asset. The amount recognised for the reimbursement shall not exceed the amount of the provision.
Provisions are not recognised for future operating losses.
If an entity has a contract that is onerous, the present obligation under the contract shall be recognised and measured as a provision.
After their initial recognition contingent liabilities recognised in business combinations that are recognised separately are subsequently measured at the higher of:
• the amount that would be recognised as a provision; and • the amount initially recognised less cumulative amortisation.

Integrated Annual Report 2013
56
Notes to the annual financial statements continuedfor the year ended february 2013
1. Accounting policies (continued) 1.16 Revenue Revenue from the sale of goods is recognised when all the following conditions have been satisfied: • the group has transferred to the buyer the significant risks and rewards of ownership of the goods; • the group retains neither continuing managerial involvement to the degree usually associated with ownership nor
effective control over the goods sold; • the amount of revenue can be measured reliably; • it is probable that the economic benefits associated with the transaction will flow to the group; and • the costs incurred or to be incurred in respect of the transaction can be measured reliably.
Revenue for services is recognised in the period when they are rendered.
When the outcome of a transaction involving the rendering of services can be estimated reliably, revenue associated with the transaction is recognised by reference to the stage of completion of the transaction at the balance sheet date. The outcome of a transaction can be estimated reliably when all the following conditions are satisfied:
• the amount of revenue can be measured reliably; • it is probable that the economic benefits associated with the transaction will flow to the group; • the stage of completion of the transaction at the balance sheet date can be measured reliably; and • the costs incurred for the transaction and the costs to complete the transaction can be measured reliably.
Revenue is measured at the fair value of the consideration received or receivable and represents the amounts receivable for goods and services provided in the normal course of business, net of trade discounts and volume rebates, and value‑added tax.
Franchise fees and advertising levies are recognised on the accrual basis as services are rendered or the rights used in accordance with the substance of the related franchise agreements. Advertising levies are recognised as revenue to the extent of the expenditure incurred.
Franchise joining fees are recognised in the month when the outlet opens for trading.
Retail outlet sales are recognised from sale of goods.
Development revenue is recognised as services rendered and ultimately in the month the outlet opens for trading.
Management fees are recognised as and when services are rendered.
Dividends are recognised in profit or loss, when the company’s right to receive payment has been established.
Interest is recognised in profit or loss, using the effective interest rate method.
1.17 cost of sales When inventories are sold, the carrying amount of those inventories is recognised as an expense in the period in which the
related revenue is recognised. The amount of any write‑down of inventories to net realisable value and all losses of inventories are recognised as an expense in the period the write‑down or loss occurs. The amount of any reversal of any write‑down of inventories, arising from an increase in net realisable value, is recognised as a reduction in the amount of inventories recognised as an expense in the period in which the reversal occurs.
The related cost of providing services recognised as revenue in the current period is included in cost of sales.
1.18 Borrowing costs Borrowing costs that are directly attributable to the acquisition, construction or acquisition of a qualifying asset are
capitalised as part of the cost of that asset.
All other borrowing costs are recognised as an expense in the period in which they are incurred.
1.19 advertising levies In terms of the group’s franchise agreements, the group receives advertising levies from franchisees which are held and
accounted for separately in marketing funds. These funds are utilised for the procurement of marketing and advertising services for the benefit of franchisees. Advertising expenditure incurred in excess of the levies received is carried forward as a prepaid expense in the group statement of financial position to be set off against future levies.
Any amounts not expended are carried forward as liabilities in the group statement of financial position to be set off against future advertising expenditure.
1.20 translation of foreign currencies Foreign currency transactions A foreign currency transaction is recorded, on initial recognition in rand, by applying to the foreign currency amount the spot
exchange rate between the functional currency and the foreign currency at the date of the transaction.

57
Integrated Annual Report 2013
1. Accounting policies (continued) 1.20 translation of foreign currencies (continued) At each balance sheet date: • foreign currency monetary items are translated using the closing rate; • non-monetary items that are measured in terms of historical cost in a foreign currency are translated using the exchange
rate at the date of the transaction; and • non-monetary items that are measured at fair value in a foreign currency are translated using the exchange rates at the
date when the fair value was determined.
Exchange differences arising on the settlement of monetary items or on translating monetary items at rates different from those at which they were translated on initial recognition during the period or in previous annual financial statements are recognised in profit or loss in the period in which they arise.
1.21 Segment reporting Operating segments are reported in a manner consistent with the internal reporting provided to the chief operating decision
maker. The chief operating decision maker, who is responsible for allocating resources and assessing performance of the operating segments, has been identified as the Taste executive committee. Intersegment revenues comprise of services rendered between entities within the group. Intersegment revenues are accounted for as if the sale were to third parties ie. at current market prices.
2. New standards and interpretations 2.1 Standards and interpretations effective and adopted in the current year The following amendments and revisions to issued accounting standards which are relevant to the group were adopted and
are effective 1 March 2012:
– Amendment to IFRS 7: Financial instruments – Disclosures The amendments to IFRS 7 increase the disclosure requirements for transactions involving transfers of financial assets.
These amendments are intended to provide greater transparency around risk exposures when a financial asset is transferred but the transferor retains some level of continuing exposure in the asset. The amendments also require disclosures where transfers of financial assets are not evenly distributed throughout the period. This amendment did not have a significant impact on the group’s disclosure for the year ended 28 February 2013.
2.2 New accounting standards and interpretations not yet adopted At reporting date, the following new standards, revisions and amendments to issued accounting standards and interpretations,
which are relevant to the group but not yet effective, have not been adopted by the group:
– IFRS 9: Financial Instruments – Classification and Measurement IFRS 9 is the first step in the process to replace IAS 39, ‘Financial Instruments: Recognition and Measurement’. IFRS 9
introduces new requirements for classifying and measuring financial assets, financial liabilities, derecognition and hedge accounting. The standard is not applicable until 1 January 2015 but is available for early adoption.
IFRS 9 requires all recognised financial assets that are within the scope of IAS 39 to be subsequently measured at amortised cost or fair value. With regards to financial liabilities, the accounting for changes in the fair value of a financial liability that is designated as at fair value through profit or loss and are attributable to changes in the credit risk of that liability are recognised in profit or loss, unless it creates or enlarges an accounting mismatch in profit or loss.
It is anticipated that IFRS 9 will be adopted in the group’s consolidated financial statements for the annual period beginning 1 March 2015. It is not anticipated that the application of the new standard will have a significant impact on amounts reported in respect of the group’s financial assets and financial liabilities as the majority of financial assets and financial liabilities are carried at amortised cost. However, it is not practicable to provide a reasonable estimate of that effect until a detailed review has been completed.
– IFRS 10: Consolidated financial statements This standard builds on existing principles by identifying the concept of control as the determining factor in whether an
entity should be included within the consolidated financial statements. The standard provides additional guidance to assist in determining control where this is difficult to assess. Further amendments to this standard include limiting the requirements to provide adjusted comparative information. The standard is effective for annual periods beginning on or after 1 January 2013.
It is anticipated that IFRS 10 will be adopted in the group’s consolidated financial statements for the annual period beginning 1 March 2013. It is not anticipated that the application of the new standard will have a significant impact on amounts reported in respect of the group’s financial statements. However, it is not practicable to provide a reasonable estimate of that effect until a detailed review has been completed.

Integrated Annual Report 2013
58
Notes to the annual financial statements continuedfor the year ended february 2013
2. new standards and interpretations (continued) 2.2 New accounting standards and interpretations not yet adopted (continued) – IFRS 12: Disclosures of interests in other entities This standard includes the disclosure requirements for all forms of interests in other entities, including joint arrangements,
associates, special purpose vehicles and other off‑balance sheet vehicles. Further amendments to this standard include limiting the requirements to provide adjusted comparative information. The standard is effective for annual periods beginning on or after 1 January 2013.
It is anticipated that IFRS 12 will be adopted in the group’s consolidated financial statements for the annual period beginning 1 March 2013. It is not anticipated that the application of the new standard will have a significant impact on amounts reported in respect of the group’s financial statements. However, it is not practicable to provide a reasonable estimate of that effect until a detailed review has been completed
– IFRS 13: Fair value measurement This standard aims to improve consistency and reduce complexity by providing a precise definition of fair value and a single
source of fair value measurement and disclosure requirements for use across IFRSs. The requirements do not extend the use of fair value accounting but provide guidance on how it should be applied where its use is already required or permitted by other standards within IFRS. The standard is effective for annual periods beginning on or after 1 January 2013.
It is anticipated that IFRS 13 will be adopted in the group’s consolidated financial statements for the annual period beginning 1 March 2013. It is not anticipated that the application of the new standard will have a significant impact on amounts reported in respect of the group’s financial statements. However, it is not practicable to provide a reasonable estimate of that effect until a detailed review has been completed.
– Amendment to IFRS 7: Financial Instruments – Disclosures This amendment requires entities to disclose gross amounts subject to rights of set off, amounts set off in accordance with
the accounting standards followed, and the related net credit exposure. This information will help investors understand the extent to which an entitity has set off in its balance sheet and the effect of rights of set off on the entities rights and obligations. The amendment is effective for periods beginning on or after 1 January 2013.
It is anticipated that the amendment to IFRS 7 will be adopted in the group’s consolidated financial statements for the annual period beginning 1 March 2013. It is not anticipated that the application of the amendment will have a significant impact on group’s disclosures.
– IAS 1: Presentation of financial statements Annual improvements 2009 – 2011 Cycle: Amendments clarifying the requirements for comparative information including
minimum and additional comparative information required. This amendment is effective for annual periods beginning on or after 1 January 2013.
It is anticipated that this amendment will be adopted in the group’s consolidated financial statements for the annual period beginning 1 March 2013. It is not anticipated that the application of the new standard will have a significant impact on amounts reported in respect of the group’s financial statements. However, it is not practicable to provide a reasonable estimate of that effect until a detailed review has been completed.
– IAS 27: Consolidated and separate financial statements Consequential amendments resulting from the issue of IFRS 10, 11 and 12. These amendments are effective for annual
periods beginning on or after 1 January 2013.
It is anticipated that these amendments will be adopted in the group’s consolidated financial statements for the annual period beginning 1 March 2013. It is not anticipated that the application of the new standard will have a significant impact on amounts reported in respect of the group’s financial statements. However, it is not practicable to provide a reasonable estimate of that effect until a detailed review has been completed.
– IAS 32: Financial instruments presentation Amendments require entities to disclose gross amounts subject to rights of set‑off, amounts set off in accordance with the
accounting standards followed, and the related net credit exposure. This information will help investors understand the extent to which an entity has set off in its balance sheet and the effects of rights of set‑off on the entitiy’s rights and obligations.
Annual Improvements 2009 – 2011 Cycle: Amendments to clarify the tax effect of distribution to holders of equity instruments.
These amendments are effective for annual periods beginning on or after 1 January 2013.
It is anticipated that these amendments will be adopted in the group’s consolidated financial statements for the annual period beginning 1 March 2013. It is not anticipated that the application of the new standard will have a significant impact on amounts reported in respect of the group’s financial statements. However, it is not practicable to provide a reasonable estimate of that effect until a detailed review has been completed.

59
Integrated Annual Report 2013
3. Segment reportingFor management purposes, the group is organised into three major operating divisions: – Food– Jewellery– Corporate services
Food consists of Scooters Pizza, St Elmo’s, Maxi’s and The Fish and Chip Co. franchise and retail divisions as well as the food services division. Jewellery consists of NWJ franchise and wholesale retail and concession retail divisions. Corporate services consists of the holding company of all the subsidiaries within the group.
Such structural organisation is determined by the nature of risks and returns associated to each business segment and is representative of the internal reporting structure used for management reporting.
Segment profit includes revenue and expenses directly attributable to a segment and the relevant portion of enterprise revenue and expenses that can be allocated on a reasonable basis to a segment.
Segment assets and liabilities comprise those operating assets and liabilities that are directly attributable to the segment or can be allocated to the segment on a reasonable basis.
Segment capex has been included in the segment report as the majority of this capex was incurred for the establishment of food distribution centres within the food services division.
The following tables present details of revenue, operating profit, assets, liabilities and depreciation and amortisation, finance costs, investment revenue and capex by business segment:
food franchise
food services
foodretail
Jewelleryfranchise
and wholesale
Jewelleryretail
Corporateservices
inter-segmentrevenues total
R’000 R’000 R’000 R’000 R’000 R’000 R’000 R’000
2013Revenue 131 388 183 681 260 121 484 77 181 12 360 (19 923) 506 431 Operating profit/(loss) 30 735 893 (684) 10 404 18 251 (16 707) – 42 892 Investment revenue 627 118 – 458 – 753 – 1 956 Finance costs (1 610) (2 312) – (2 887) – (353) – (7 162)Profit before taxation 29 752 (1 301) (684) 7 975 18 251 (16 307) – 37 686
Segment depreciation and amortisation (2 741) (1 887) – (835) (1 726) (1 747) – (8 936)Segment assets 106 234 73 316 140 65 683 50 558 73 736 – 369 667 Segment liabilities 61 079 54 085 1 44 389 932 19 935 – 180 421 Segment Capex 1 403 7 022 – 153 – 22 – 8 600
2012Revenue 74 965 47 679 2 477 123 946 56 926 10 827 (12 556) 304 264 Operating profit/(loss) 22 479 3 577 (628) 13 778 9 319 (13 344) – 35 181 Investment revenue 51 90 – 471 – 272 – 884 Finance costs (876) (566) – (3 959) – (283) – (5 684)Profit before taxation 21 654 3 101 (628) 10 290 9 319 (13 355) – 30 381 Segment depreciation and amortisation (1 020) (1 185) – (825) (1 789) (1 732) – (6 551)Segment assets* 99 939 67 553 1 399 62 919 36 592 72 963 – 341 365 Segment liabilities* 68 953 38 353 1 41 823 967 19 428 – 169 525 Segment Capex 283 996 – 347 986 342 – 2 954* Prior year balances have changed due to the finalisation of the purchase price allocation for the acquisition of The Fish Chip Co. in 2012. There
has been no effect on income as a result of these changes.

Integrated Annual Report 2013
60
Notes to the annual financial statements continuedfor the year ended february 2013
2013 2012
costR’000
accumulateddepreciation
R’000
carryingvalueR’000
CostR’000
Accumulateddepreciation
R’000
CarryingvalueR’000
4. Property, plant and equipment
GroupFurniture and fixtures 16 010 (10 377) 5 633 14 408 (8 709) 5 699Motor vehicles 886 (427) 459 567 (339) 228Office equipment 1 499 (926) 573 1 723 (1 020) 703IT equipment 3 813 (2 899) 914 4 628 (4 110) 518Kitchen equipment 6 485 (2 057) 4 428 4 254 (1 117) 3 137General equipment 406 (61) 345 50 (12) 38Leasehold improvements 4 255 (737) 3 518 743 (383) 360Computer software 1 653 (560) 1 093 1 463 (371) 1 092Plant and machinery 1 864 (1 764) 100 1 819 (1 741) 78
total 36 871 (19 808) 17 063 29 655 (17 802) 11 853
CompanyFurniture and fixtures 156 (87) 69 151 (60) 91Leasehold improvements 532 (346) 186 532 (240) 292IT equipment 89 (46) 43 645 (534) 111
total 777 (479) 298 1 328 (834) 494
Reconciliation of property, plant and equipment – Group 2013Openingbalance
R’000additions
R’000
acquisitionof business
R’000Disposals
R’000Depreciation
R’000total
R’000
Furniture and fixtures 5 699 861 992 (34) (1 885) 5 633Motor vehicles 228 327 – (5) (91) 459Office equipment 703 68 – (4) (194) 573IT equipment 518 839 – (50) (393) 914Kitchen equipment 3 137 2 373 – (81) (1 001) 4 428General equipment 38 356 – – (49) 345Leasehold improvements 360 3 525 – – (367) 3 518Computer software 1 092 197 – (5) (191) 1 093Plant and machinery 78 54 – – (32) 100
total 11 853 8 600 992 (179) (4 203) 17 063
Reconciliation of property, plant and equipment – Group 2012Openingbalance
R’000Additions
R’000
Acquisitionof business
R’000Disposals
R’000Depreciation
R’000Total
R’000
Furniture and fixtures 6 322 1 138 205 (203) (1 763) 5 699Motor vehicles 7 116 110 – (5) 228Office equipment 658 247 14 (14) (202) 703IT equipment 352 350 87 (9) (262) 518Kitchen equipment 2 978 760 150 – (751) 3 137General equipment – 44 – – (6) 38Leasehold improvements 229 241 – (2) (108) 360Computer software 1 235 – – – (143) 1 092Plant and machinery 32 58 – – (12) 78
total 11 813 2 954 566 (228) (3 252) 11 853

61
Integrated Annual Report 2013
4. Property, plant and equipment (continued)
Reconciliation of property, plant and equipment – Company 2013Openingbalance
R’000additions
R’000Disposals
R’000Depreciation
R’000total
R’000
Furniture and fixtures 91 5 – (27) 69Leasehold improvements 292 – – (106) 186IT equipment 111 17 (38) (47) 43total 494 22 (38) (180) 298
Reconciliation of property, plant and equipment – Company 2012Openingbalance
R’000Additions
R’000Disposals
R’000Depreciation
R’000Total
R’000
Furniture and fixtures 53 62 – (24) 91Leasehold improvements 182 198 – (88) 292IT equipment 87 82 (3) (55) 111total 322 342 (3) (167) 494
Property, plant and equipment is pledged in terms of a loan agreement (see note 17), to Rand Merchant Bank.
The carrying value of property, plant and equipment held under a finance lease is as follows:
R’000
Motor vehicles 270
Kitchen equipment 179
Furniture and fixtures 525
Group
2013 2012
costR’000
accumulatedamortisation
R’000
carryingvalueR’000
CostR’000
Accumulatedamortisation
R’000
CarryingvalueR’000
5. intangible assetsTrademarks and intellectual property 88 097 (9 361) 78 736 88 097 (6 281) 81 816Franchise contributions 11 603 (6 831) 4 772 10 407 (5 178) 5 229
total 99 700 (16 192) 83 508 98 504 (11 459) 87 045
Reconciliation of intangible assets – Group 2013Opening balance
R’000additions
R’000
acquisition of business
R’000Impairments
R’000amortisation
R’000total
R’000
Trademarks and intellectual property 81 816 – – – (3 080) 78 736Franchise contributions 5 229 1 839 – (643) (1 653) 4 772
total 87 045 1 839 – (643) (4 733) 83 508
Reconciliation of intangible assets – Group 2012Opening balance
R’000Additions
R’000
Acquisition of business
R’000Disposals
R’000Amortisation
R’000Total
R’000
Trademarks and intellectual property 62 713 600 20 624 – (2 121) 81 816Franchise contributions 4 857 1 550 – – (1 178) 5 229
total 67 570 2 150 20 624 – (3 299) 87 045

Integrated Annual Report 2013
62
Notes to the annual financial statements continuedfor the year ended february 2013
5. intangible assets (continued)2013
R’0002012
R’000
Trademarks and intellectual property consist of:NWJ trademark 55 492 57 059The Fish and Chip Co. trademark 19 507 20 538St Elmo’s trademark 537 607St Elmo’s recipes 2 706 3 058General recipes 494 554
78 736 81 816
Trademarks and intellectual propertyThe Natal Wholesale Jewellers (NWJ) trademark originated through the acquisition of the NWJ subsidiary during the 2009 financial year. This trademark is amortised on a straight‑line basis over its useful life of 40 years. The remaining amortisation period is 35.4 years.
The Fish and Chip Co. trademark originated through the purchase of the Fish and Chip Co. business on 1 February 2012. This trademark is amortised on a straight‑line basis over its useful life of 20 years. The remaining amortisation period is 18.9 years.
Both the St Elmo’s trademark and the St Elmo’s recipe intangible originated through the purchase of the St Elmo’s business during the 2011 financial year. They are both amortised, on a straight‑line basis over 10 years. Their remaining amortisation period is 7.7 years.
The general recipes trademark originated through the purchase of certain key recipes from a sauce supplier. This intangible is amortised over 10 years, on a straight‑line basis. The remaining amortisation period is 8.1 years.
franchise contributions These represent premiums paid for the securing of key sites and financial assistance given to franchisees in respect of store setup costs. These are amortised over the duration of the underlying lease or franchise agreements ranging between 1 to 10 years. The remaining amortisation period ranges between 2 to 5 years.
At year end there were indicators that the carrying amount of certain franchise contributions was less than their recoverable amount and subsequently impaired. This impairment loss has been recognised in profit and loss and included in the operating results of the food franchise segment as per note 3.
Goodwill
2013 2012
Groupcost
R’000
accumulatedimpairments
R’000
carryingvalueR’000
CostR’000
Accumulatedimpairments
R’000
CarryingvalueR’000
Goodwill 69 934 – 69 934 68 669 – 68 669
total 69 934 – 69 934 68 669 – 68 669
Reconciliation of goodwill – Group 2013
Opening balance
R’000additions
R’000
acquisition of business
R’000Disposals
R’000Impairment
R’000total
R’000
Goodwill 68 669 – 1 265 – – 69 934
total 68 669 – 1 265 – – 69 934

63
Integrated Annual Report 2013
5. intangible assets (continued)
Reconciliation of goodwill – Group 2012
Opening balance
R’000Additions
R’000
Acquisition of business
R’000Disposals
R’000Impairment
R’000Total
R’000
Goodwill 18 654 – 50 234 (219) – 68 669
total 18 654 – 50 234 (219) – 68 669
For the purposes of impairment testing, goodwill is allocated to the following cash‑ generating units:
2013R’000
2012R’000
Maxi’s 14 760 14 760The Fish and Chip Co. 50 234 50 234St Elmo’s 2 333 2 333Company‑owned stores – Jewellery 2 607 1 342total goodwill 69 934 68 669
On the 1 February 2012 the group acquired the assets and certain liabilities of The Fish & Chip Co. The purchase price allocation was provisionally accounted for in the prior year, as permitted by IFRS 3 Business Combinations, and has now been finalised. As a result, the goodwill acquired increased by R4.0 million to R50.2 million due to the accounting for a contingent consideration in anticipation of The Fish & Chip Co. legal dispute.
Between August and December 2012, the jewellery division acquired the assets of five franchised NWJ stores as these stores were located in key strategic sites. The goodwill acquired for these fives stores amounts to R1.265 million.
Maxi’sThe Maxi’s goodwill formed part of the Maxi’s assets acquired in the 2006 financial year. The recoverable amount has been calculated using the value in use valuation method, which discounts to present value, the future after tax cash flows, attributable to the Maxi’s business, using an applicable discount rate. Cash flows were determined using projections from financial budgets approved by directors covering a three‑year period, for revenue, gross profit and operating profit margin expectations. The key assumptions used in these budgets are a reflection of management’s past experience in the market in which the unit operates. Cash flows beyond the three‑year period have been extrapolated using a steady 5% per annum growth rate. These cash flows were discounted using a discount rate of 15%. The various sensitivity analyses performed by changing key variables by 1% in the calculation resulted in the recoverable amount exceeding the carrying amount in all instances.
The Fish and Chip Co.The goodwill on The Fish and Chip Co. formed part of the assets acquired in The Fish and Chip Co. and represents the excess of the purchase price paid over the fair value of acquired assets and liabilities. The recoverable amount has been calculated using the value in use valuation method, which discounts to present value, the future after tax cash flows, attributable to The Fish and Chip Co. business, using an applicable discount rate. Cash flows were determined using projections from financial budgets approved by directors covering a three‑year period, for gross profit and operating profit margin expectations. The key assumptions used in these budgets are a reflection of management’s past experience in the market in which the unit operates. Cash flows beyond the three‑year period have been extrapolated using a steady 5% per annum growth rate. These cash flows were discounted using a discount rate of 15%. The various sensitivity analyses performed by changing key variables by 1% in the calculation resulted in the recoverable amount exceeding the carrying amount in all instances.
St elmo’sThe St Elmo’s goodwill represents the excess of purchase price paid over the fair value of acquired assets and liabilities of the St Elmo’s business during the 2011 financial year. The recoverable amount has been calculated using the value in use valuation method, which discounts to the present value, the future after tax cash flows, attributable to the St Elmo’s business, using an applicable discount rate. Cash flows were determined using projections from financial budgets approved by directors covering a three‑year period for revenue, gross profit and operating profit margin expectations. The key assumptions used in these budgets are a reflection of management’s past experience in the market in which the unit operates. Cash flows beyond the three‑year period have been extrapolated using a steady 5% per annum growth rate. These cash flows were discounted using a discount rate of 15%. The various sensitivity analyses performed by changing key variables by 1% in the calculation resulted in the recoverable amount exceeding the carrying amount in all instances.

Integrated Annual Report 2013
64
Notes to the annual financial statements continuedfor the year ended february 2013
5. intangible assets (continued)
Company-owned stores – JewelleryThis amount represents the excess of the purchase price paid over the fair value of acquired assets and liabilities of jewellery stores purchased by the jewellery division. The recoverable amount has been calculated using the value in use valuation method, which discounts to present value, the future after tax cash flows, attributable to these stores, using an applicable discount rate. Cash flows were determined using projections from financial budgets approved by directors covering a three‑year period, for revenue, gross profit and operating profit margin expectations. The key assumptions used in these budgets are a reflection of management’s past experience in the market in which the unit operates. Cash flows beyond the three‑year period have been extrapolated using a steady 10% per annum growth rate. These cash flows were discounted using a discount rate of 16%. The various sensitivity analyses performed by changing key variables by 1% in the calculation resulted in the recoverable amount exceeding the carrying amount in all instances.
Name of company Directly held% holding
2013% holding
2012
carrying amount
2013
Carrying amount
2012
6. investments in subsidiariesNWJ Holdings Proprietary Limited – dormant Taste Holdings Limited 100 100 100 100NWJ Fine Jewellery Proprietary Limited Taste Holdings Limited 100 100 105 056 924 105 056 924Maxi’s Grill Marketing Proprietary Limited Taste Holdings Limited 100 100 16 000 000 16 000 000
Scooters Western Cape Retail Proprietary Limited – dormant Taste Holdings Limited 100 100 100 100
Scooters Pizza Retail Proprietary Limited – dormant Taste Holdings Limited 100 100 1 000 1 000
Scooters Pizza Wierda Park Proprietary Limited – dormant Taste Holdings Limited 100 100 100 100
Scooters Pizza Pietermaritzburg Proprietary Limited – dormant Taste Holdings Limited 51 51 51 51
Scooters Pizza Grosvenor Crossing Proprietary Limited – dormant Taste Holdings Limited 100 100 200 200
Taste Food Franchising Proprietary Limited(previously known as Scooters Pizza Proprietary Limited) Taste Holdings Limited 100 100 100 100Buon Gusto Cuisine Proprietary Limited Taste Holdings Limited 100 100 100 100Taste Holdings Share Trust Taste Holdings Limited 100 100 – –
121 058 675 121 058 675
The carrying amounts of subsidiaries are shown net of impairment losses of Rnil (2012: Rnil).

65
Integrated Annual Report 2013
Group Company
2013R’000
2012R’000
2013R’000
2012R’000
7. Loans to/(from) group companiesSubsidiariesNWJ Fine Jewellery Proprietary Limited – – 21 149 20 892NWJ Holdings Proprietary Limited – – (38 750) (38 750)Maxi’s Grill Marketing Proprietary Limited – – 272 (1 786)Taste Food Franchising Proprietary Limited (previously known as Scooters Pizza Proprietary Limited) – – (14 285) (13 760)Scooters Pizza Grosvenor Crossing Proprietary Limited – – – 100Scooters Pizza Wierda Park Proprietary Limited – – – (269)Scooters Pizza Pietermaritzburg Proprietary Limited – – – (41)Scooters Pizza Retail Proprietary Limited – – – 26Buon Gusto Cuisine Proprietary Limited – – 15 006 20 550Taste Holdings Share Trust – – 724 703All the above loans are unsecured, interest‑free and have no fixed terms of repayment.
– – (15 884) (12 335)Current assets – – 37 151 42 271Current liabilities – – (53 035) (54 606)
– – (15 884) (12 335)
Credit risk on loans to group companies is negligible due to the fact that all these group companies are commonly controlled.
2013 2012
Groupcost
R’000Impairment
R’000
carryingvalueR’000
CostR’000
ImpairmentR’000
CarryingvalueR’000
8. non-current assets held for saleMaxi’s stores – – – 491 (491) –Scooters stores 1 258 (583) 675 1 258 – 1 258total 1 258 (583) 675 1 749 (491) 1 258
Reconciliation of non-current assets held for sale – Group 2013
Opening balance
R’000
acquisitionof business
R’000Disposals
R’000Impairment
R’000total
R’000
Scooters stores 1 258 – – (583) 675total 1 258 – – (583) 675

Integrated Annual Report 2013
66
Notes to the annual financial statements continuedfor the year ended february 2013
8. non-current assets held for sale (continued)
Reconciliation of non‑current assets held for sale – Group 2012
Opening balance
R’000Additions
R’000Disposals
R’000Impairment
R’000Total
R’000
Maxi’s stores 491 – – (491) –Scooters stores 1 258 200 (200) – 1 258total 1 749 200 (200) (491) 1 258
The above represent stores that have been acquired from franchisees and have immediately been classified as non‑current assets held for sale in terms of the food division’s strategy to not hold retail stores. These assets are not in respect of discontinued operations. The carrying amount of these operating assets approximated their fair value at year‑end.
At year‑end, the group owned one Scooters Pizza store. The impairment relates to the existing Scooters outlet whose carrying value was more than its fair value at year‑end. This impairment loss has been recognised in profit or loss and included in the operating results of the food franchise segment as per note 3.
The actual underlying assets of the store and the operating results thereof are reported as the retail food segment as per note 3. It is management’s intention to dispose of this store to a potential new or existing franchisee as soon as a suitable franchisee is identified. There is no intention to provide financing for this disposal.
Non‑current assets held for sale are not depreciated while they are held for sale.
Group Company
2013R’000
2012R’000
2013R’000
2012R’000
9. Other financial assetsloans and receivablesloans to nWJ franchised storesThese loans are secured over the assets of these franchised stores, are interest‑bearing at prime +2% and are repayable over an average of six months.
2 118 2 062 – –
Extended terms to food franchise storesThese amounts represent extended payment terms given by the brands to certain franchisees. These amounts attract no interest, are secured and are repayable over an average of 24 months.
1 500 1 522 – –
Loans to The Fish & Chip Co. storesThese loans were given to certain franchisees to finance the shortfall of the new store cost. They attract interest at 8.5% per annum and are generally repayable over an average of 24 months.
506 – – –
nWJ marketing fundThis loan is unsecured, bears interest at prime and is repayable in equal instalments of R143 099 per month commencing 1 March 2012.
1 769 3 139 – –
Scooters Pizza marketing fundThis loan is unsecured, bears interest at 9% per annum and is repayable in 24 equal instalments of R121 972 per month commencing 1 March 2013.
2 670 – – –
Maxis marketing fundThis loan is unsecured, bears interest at 9% per annum and is repayable in 12 equal instalments of R59 737 per month commencing 1 March 2013.
684 – – –
loan to food franchise storeThis loan is secured over the assets of the store, bears interest linked to prime and is repayable in 60 monthly instalments of R15 000 per month commencing 31 May 2013, with a lumpsum payment of R681 000 on 31 May 2017.
1 068 – – –
10 315 6 723 – –Non‑current assets 5 885 3 092 – –Current assets 4 430 3 631 – –
10 315 6 723 – –

67
Integrated Annual Report 2013
9. Other financial assets (continued)
The directors consider that the carrying amount of interest‑bearing loans and other receivables approximate their fair value as these are linked to market interest rates. The recoverable amount of extended terms to food franchisees approximates the fair value, because of the short term nature of these loans. The directors consider other financial assets past due, on default of repayment.
The credit quality of other financial assets is as follows:
2013R’000
2012R’000
Not past due not impaired 9 688 5 824Past due not impaired 627 899
10 315 6 723Ageing of amounts past due not impaired:30 days – 11560 days 9 16990 days 31 3120 days 587 612
627 899
No formal credit ratings are available for any of these assets. The credit risk is lower due to the existence of security. The credit risk on the loans to the marketing funds is assessed as low due to management’s past experience and knowledge of business.
Group Company
2013R’000
2012R’000
2013R’000
2012R’000
10. Deferred taxNon‑deductible temporary differences (630) (578) 106 360Advertising levies and marketing funds (1 231) (899) – –Prepayments (10) (46) (10) (46)Provisions and accruals 1 981 1 935 – –Temporary differences relating to acquisition of business (21 415) (21 751) – –Lay‑bye deposits 234 211 – –Accelerated wear and tear 42 (109) – –Tax losses available for set off against future taxable income 792 119 119 119
(20 237) (21 118) 215 433Deferred tax asset 1 354 755 215 433Deferred tax liability (21 591) (21 873) – –
(20 237) (21 118) 215 433Reconciliation of deferred tax At beginning of the year (21 118) (15 420) 433 425Recognised through profit or loss 881 77 (218) 8Temporary differences relating to acquisition of business – (5 775) – –
(20 237) (21 118) 215 433
The deferred tax liability raised on the acquisition of business relates to the NWJ, St Elmo’s and The Fish and Chip Co. trademark intangibles. This liability will decrease as the intangibles are amortised over their expected useful lives.
Deferred tax assets have been recognised in respect of all tax losses and other temporary differences giving rise to deferred tax assets where the directors believe it is probable that these assets will be recovered, having reviewed the group’s financial projections, except for tax losses to the value of R72 264 relating to dormant companies.

Integrated Annual Report 2013
68
Notes to the annual financial statements continuedfor the year ended february 2013
Group Company
2013R’000
2012R’000
2013R’000
2012R’000
11. advertising leviesThis amount represents advertising expenditure incurred in excess of the levies received from franchisees (refer note 1.16). This amount is recovered through controlled underspending of marketing funds in subsequent years. 1 939 1 435 – –
12. inventoriesIngredients and promotional items – 28 – –Catering equipment 409 167 – –Raw materials, components – Jewellery 3 160 1 743 – –Finished goods – Jewellery 78 856 62 793 – –Packaging – Jewellery 2 928 2 332 – –Raw materials, components – Food services 2 426 1 752 – –Finished goods – Food services 6 450 1 961 – – 94 229 70 776 – –Inventory write‑downs (200) (200) – –Total 94 029 70 576 – –All inventories have been pledged to Rand Merchant Bank in terms of a loan agreement (see note 17).
13. trade and other receivablesGross trade receivables 61 467 47 158 – –Provisions for doubtful debt (16 760) (17 441) – –Net trade receivables 44 707 29 717 – –Prepayments 36 217 37 165Deposits 618 148 25 25Sundry debtors 13 551 24 137 24 6VAT 29 29 – –Store development in advance 8 600 2 358 – –
67 541 56 606 86 196GroupNo independent credit ratings are available for any of the trade receivables. The credit quality of trade receivables has been assessed based on the historical information of the counterparty and any evidence of financial distress, including non‑adherence to credit terms. Normal credit terms are within 30 days from statement.
The directors consider that the carrying amount of trade and other receivables approximates their fair value due to their short term nature.
The table below illustrates the ageing analysis of trade receivables impaired and provided for and trade receivables past due and not provided for:
2013 2012
R’000Gross tradereceivables
Provision fordoubtful debt
net tradereceivables
Gross tradereceivables
Provision fordoubtful debt
Net tradereceivables
GroupLess than 30 days 23 333 (419) 22 914 33 704 (14 560) 19 14431 to 60 days 6 835 (357) 6 478 3 283 (178) 3 10561 to 90 days 2 190 (332) 1 858 3 931 (220) 3 71191 to 120 days 2 041 (254) 1 787 2 920 (376) 2 544Over 120 days 27 068 (15 398) 11 670 3 320 (2 107) 1 213 61 467 (16 760) 44 707 47 158 (17 441) 29 717

69
Integrated Annual Report 2013
13. trade and other receivables (continued)As of 28 February 2013, trade and other receivables were impaired and provided for.The amount of the provision as of 28 February 2013 is R16 759 517 (2012: R17 441 093).
Group Company
2013R’000
2012R’000
2013R’000
2012R’000
Reconciliation of provision for doubtful debts of trade and other receivables is as follows:Opening balance 17 441 2 851 – –Provision for doubtful debts raised 2 614 1 286 – –Provision for doubtful debts reversed (175) – – –Acquisition of business – 14 380 – –Amounts written off as uncollectable (948) (1 076) – –Bad debts recovered (2 172) – – –
16 760 17 441 – –
The maximum exposure to credit risk at the reporting date is the fair value of each class of trade receivables mentioned above.
The group does not hold any collateral as security. All amounts receivable are denominated and recoverable in ZAR. The group debtors have been ceded, in terms of a loan agreement (see note 17), to Rand Merchant Bank.
Companycredit quality of trade and other receivablesNo independent credit ratings are available. The majority of the trade and other receivables are deposits paid to suppliers and lessors.
fair value of trade and other receivablesThere is no material difference between the fair value of trade and other receivables and their carrying amount.
Trade and other receivables past due and not impaired There are no trade and other receivables past due and not impaired.
Trade and other receivables impairedAt 28 February 2013, there were no trade and other receivables impaired or provided for.
The maximum exposure to credit risk at the reporting date is the fair value of each class of trade receivables mentioned above.
The company does not hold any collateral as security.
Group Company
2013R’000
2012R’000
2013R’000
2012R’000
14. cash and cash equivalentsCash and cash equivalents consist of:Bank balances 20 331 35 308 2 818 16Bank overdraft (13 163) (9 770) – (815)
7 168 25 538 2 818 (799)
A guarantee is in place over facilities to the amount of R149 700 (2012: R149 700) in favour of the lessor of a lease entered into by Taste Holdings Limited with the lessor.
A blanket guarantee is in place over facilities to the amount of R3 676 406 (2012: R2 837 210) in favour of the lessor for leases entered into by NWJ Fine Jewellery Proprietary Limited with these lessors.
A blanket guarantee is in place over facilities to the amount of R1 055 850 (2012: R1 362 959) in favour of the lessor for leases entered into by Maxi’s Grill Marketing Proprietary Limited with these lessors.
A blanket guarantee is in place over facilities to the amount of R173 900 (2012: R173 900) in favour of the lessor for leases entered into by Taste Food Franchising Proprietary Limited with these lessors.
The directors consider that the carrying value of cash and cash equivalents approximates their fair value.
There is a R39 million overdraft facility in place with Rand Merchant Bank. The facility may be temporarily increased to R59 million for the period 1 September to 7 January each year. The bank overdraft bears the same security as the loans by Rand Merchant Bank (see note 17).

Integrated Annual Report 2013
70
Notes to the annual financial statements continuedfor the year ended february 2013
Group Company
2013R’000
2012R’000
2013R’000
2012R’000
15. Share capital and share premiumauthorised500 000 000 ordinary shares of R0,00001 each 5 5 5 5issued at beginning of the year195 881 291 (2012: 171 881 291) ordinary shares of R0,00001 each 2 2 2 2
treasury shares included above1 720 000 (2012: 1 720 000) ordinary shares of R0,00001 each held by the Taste Holdings Share Trust – – – –issued at end of the year195 881 291 (2012: 195 881 291) ordinary shares of R0,00001 each 2 2 2 2Share premium 80 101 80 101 91 584 91 584Total share capital and share premium 80 103 80 103 91 586 91 586304 118 709 unissued ordinary shares are under the control of directors in terms of a resolution passed at the last annual general meeting. This authority remains in force until the next annual general meeting.
10 442 000 (2012: 9 434 000) of the unissued ordinary shares are specifically reserved for the share incentive scheme, of which 10 442 000 (2012: 9 434 000) options have already been offered to and accepted by employees.
16. Long-term employee benefitsHeld at amortised costLong‑term performance incentive scheme. This incentive scheme is awarded to eligible employees by the Remuneration Committee conditional upon certain performance targets and minimum employment periods 126 252 126 252non-current liabilitiesAt amortised cost 126 252 126 252

71
Integrated Annual Report 2013
Group Company
2013R’000
2012R’000
2013R’000
2012R’000
17. Borrowings
Rand Merchant Bank 54 601 65 149 – –The loan bears interest at the prime rate and is repayable in quarterly instalments within 5 years from 1 February 2012.These loans are secured by:– �cession�given�by�NWJ�Fine�Jewellery�(Pty)�Ltd�
(Reg�No�2007/033055/07)�(“NWJ”),�Taste�Holdings�Ltd� (Reg�No�2000/002239/06)�(“Taste�Holdings”),� Taste�Food�Franchising�(Pty)�Ltd�(Reg�No�2003/016093/07)� (“Taste�Food�Franchising”),�Maxi’s�Grill�Marketing�(Pty)�Ltd�(Reg�No�2000/030078/07)�(“Maxi’s�Grill”),�and�Buon�Gusto�Cuisine�(Pty)�Ltd�(Reg�No�2009/018602/07)�(“Buon�Gusto”)� in�form�and�substance�acceptable�to�the�bank,�in�favour�of� the�bank�of�any�and/or�all�rights,�title�and�interest�in�and�to�their debtors;
– �cession�given�by�NWJ,�Taste�Holdings,�Taste�Food�Franchising,�Maxi’s�Grill�and�Buon�Gusto�in�form�and�substance�acceptable�to�the�bank,�in�favour�of�the�bank�of�any�and/or�all�their�rights,�title�and�interest�in�and�to�their�credit�balances�held�with�the�bank;��
– �an�unlimited�cross�suretyship,�in�form�and�substance� acceptable�to�the�bank,�in�favour�of�the�bank,�for�the�joint�and�several�obligations�of�and�between�NWJ,�Taste�Holdings,�Taste�Food�Franchising,�Maxi’s�Grill�and�Buon�Gusto;�
– �registration�of�general�notarial�covering�bond�over�all�movable�assets�of�NWJ,�Taste�Holdings,�Taste�Food�Franchising,�Maxi’s�Grill�and�Buon�Gusto,�in�favour�of�the�bank,�in�the�aggregate�amount�of�R85�000�000�(eighty-five�million�rand)�plus�such�further�amounts�for�costs�as�may�be�cession�of�short-term�insurance�cover�over�the�said�movable�assets�and�noting�of�the�bank’s�interest�thereon.�
Wesbank 1 604 – – –This loan bears interest at the prime rate + 0.5% and is payable over�50�months�commencing�on�1�April�2013. –
Wesbank 2 317 – – –This loan bears interest at prime rate less 0.5% and is payable over�60�months�commencing�on�1�July�2012.
Purchase of intellectual property 218 452 – –This�loan�is�unsecured,�interest�free�and�is�repayable�in�quarterly�instalments in arrears within two years from August 2011 based on�sales�volumes�of�this�intellectual�property.
Balances due to vendors 1 000 1 000 – –Balances�due�to�The�Fish�and�Chip�Co.�vendors.�This�loan�represents�a�portion�of�the�purchase�price�that�is�due�to�the�vendor�for�stock�purchased.
56 740 66 601 – –

Integrated Annual Report 2013
72
Group Company
2013R’000
2012R’000
2013R’000
2012R’000
17. Borrowings (continued)
Non-current liabilitiesRand�Merchant�Bank 44 421 54 195 – –Wesbank 625 – – –
45 046 54 195 – –
The�carrying�value�of�the�non-current�liabilities�approximates� their�fair�value�because�these�are�linked�to�market�interest�rates.
Current liabilitiesRand�Merchant�Bank 10 180 10 954 – –Purchase�of�intellectual�property 218 452 – –Wesbank 296 – – –Balance�due�to�vendors 1 000 1 000 – –
11 694 12 406 – –56 740 66 601 – –
18. Dividends paid
Gross�dividends�–�Final�2012:�4.0�cents�paid�9�July�2012� (2011:�3.0�cents) 7 836 5 156 7 836 5 156Dividends�on�treasury�shares�held�through�the�share� incentive�scheme (70) (51) – –
7 766 5 105 7 836 5 156Less: shareholders for dividends (21) (17) (21) (17)
7 745 5�088 7 814 5�139In�respect�of�the�current�year,�a�gross�cash�dividend�of�5.1�cents�per�share�has�been�declared,�and�paid�on�8�July�2013,�to�shareholders recorded on the company’s register at the close of�business�on�5�July�2013.�The�total�dividend�amounts�to�R9�989�946.�The�gross�dividend�is�subject�to�15%�Dividends�Tax�resulting�in�a�net�dividend�of�4.335�cents.
The�company’s�tax�reference�number�is�9493089149P.
19. Employee benefitsThe�group�and�company�have�no�post-employment�obligations�to�any�employee�with�respect�to�medical�aid,�pension,�retirement�annuity�or�life�insurance�after�leaving�employment�of�Taste�Holdings�Limited�or�any�of�its�subsidiaries.
20. ProvisionsProduct�warranties 180 180 – –Provision�for�stock�guarantees 70 70 – –
250 250 – –
Notes�to�the�annual�financial�statements continuedfor the year ended February 2013

73
Integrated Annual Report 2013
Openingbalance
Utilisedduring
the yearClosing
balance
20. Provisions (continued)Reconciliation of provisions – 2013Product�warranties 180 – 180Provision�for�stock�guarantees 70 – 70
Total 250 – 250
Reconciliation�of�provisions�–�2012Product�warranties 180 – 180Provision�for�stock�guarantees 70 – 70Total 250 – 250All�these�provisions�relate�to�repairs�to�jewellery�and�watches�to�be�undertaken�during�the�guarantee�period�of�the�products�sold.�No�amounts�are�expected�to�be�reimbursed�from�suppliers.
Group Company
2013R’000
2012R’000
2013R’000
2012R’000
21. Trade and other payablesTrade payables 45 913 25 145 1 096 788Development�deposits 27 850 33�830 – –VAT 550 1�390 398 184Payroll�accruals 7 002 2�993 2 248 945Other�accrued�expenses*� 6 360 6�595* 489 448Lay-bye�deposits 835 754 – –
88 510 70�707 4 231 2�365*This includes R4 million due to the finalisation of the purchase price allocation for The Fish & Chip Co.
The�directors�consider�that�the�carrying�amount�of�trade�and�other�payables�approximates�their�fair�value�due�to�their�short�term�nature.
22. Acquisition of businessAcquisition of The Fish & Chip Co.On 1 February 2012 the group acquired the assets and certain liabilities of The Fish & Chip Co. The rationale for the transaction was as follows:
– the Fish & Chip Co. is an established brand and is one of the largest franchise chains of fish and chips outlets in South Africa;–�fish�is�the�fourth�largest�fast-food�category�and�has�shown�considerable�growth�in�the�last�five�years;–�it�provides�an�entry�into�the�significantly�lower�LSM�(LSM�4-6)�market�through�the�leader�in�the�fish�food�category;–��there�is�a�significant�opportunity�for�expansion�of�the�brand�within�South�Africa�and�Taste�believes�that�it�is�a�400-store�system�in� the� current� store� formats.� The� current� footprint� does� not� include� any�meaningful� penetration� into� the�Western� Cape� or�KwaZulu-Natal�provinces�and�Taste�envisages�significant�potential�for�the�Fish�&�Chip�Co.�to�accelerate�its�expansion�in�these�coastal areas by utilising the national property management infrastructure of Taste as well as its established regional offices;
–��as�the�Fish�&�Chip�Co.�business�doe�snot�manufacture�any�of�its�own�products�there�is�substantial�value�to�be�unlocked�by�adding�its�volume�to�existing�Taste�manufacturing�capabilities;�and
–��the�acquisition�will�increase�the�number�of�outlets�in�the�Taste�food�division�by�over�40%�and�could�increase�annualised�system-wide�sales�in�that�division�to�over�R800�million.
The acquisition consisted of:–�franchise�agreements�of�202�outlets,�associated�trademarks,�goodwill�and�intellectual�property;– a distribution facility; and– certain tangible assets and liabilities relating to the business including inter alia,� stock,� debtors� and� property,� plant� and�
equipment.

Integrated Annual Report 2013
74
22. Acquisition of business (continued)
The�fair�value�of�assets�and�liabilities�acquired�is�set�out�below: 2012Restated
adjustment 2013R’000 R’000 R’000
Property,�plant�and�equipment 566 – 566Intangible assets 20 264 – 20 264Trade�and�other�receivables 33�129 – 33 129 Contractual amount 50�073 (2�564) 47 509��Non-recoverable�amount* (16�944) 2 564 (14 380)Inventory 1 000 – 1 000Non-current�assets�held�for�sale 200 – 200Advertising�levies (960) – (960)Trade and other payables (39�018) – (39 018)Deferred�tax (5�775) – (5 775)Fair�value�of�assets�acquired 9�766 – 9 766Consideration paid (56�000) (4�000) (60 000) In cash (55�000) – (55 000) Contingent consideration – (4�000) (4 000)��Balance�owed�by�vendors (1�000) – (1 000)
Goodwill acquired 46�234 4 000 50 234* While these receivables formed part of the business they were not included in Taste’s valuation of the Fish & Chip Co. business.
The�purchase�consideration�was�discharged�in�cash.�The�purchase�price�allocation�has�been�provisionally�accounted�for�in�the�prior�year,�as�permitted�by�IFRS�3�Business�Combinations,�and�has�now�been�finalised.�As�a�result,�the�goodwill�acquired�has�increased�by R4.0 million to R50.2 million due to the accounting for a contingent consideration in anticipation of The Fish & Chip Co. legal dispute.�The�directors�consider�this�information�to�be�sensitive�and�accordingly�no�further�disclosure�has�been�made.�In�addition�to�this,�the�valuation�of�the�trade�and�other�receivables�has�been�finalised.
Acquisition of jewellery storesBetween�August�and�December�2012,� the� jewellery�division�acquired� the�assets�of� five� franchised�NWJ�stores�as� these�stores� were�located�in�key�strategic�sites.�The�acquisition�consisted�of�inventory�and�property,�plant�and�equipment.
The�fair�value�of�assets�and�liabilities�acquired�is�set�out�below:
R’000Property,�plant�and�equipment 992Inventory 1�513Fair�value�of�assets�acquired 2 505Consideration paid (3�770) In cash (2�133)��Balance�owed�by�vendors (1�637)
Goodwill acquired 1 265The� purchase� consideration� was� discharged� in� cash.� During� the� period� that� these� five� stores� were� owned/operated� by� the�jewellery�division,�they�contributed�R8.9�million�to�revenue�and�R2.5�million�to�operating�profit.�The�revenue�and�operating�profit�as if these stores were owned for the full year cannot be disclosed as complete and compliant financial records of these stores prior�to�the�dates�that�the�jewellery�division�acquired�control�of�these�stores,�could�not�be�obtained.
None�of�the�goodwill�recognised�is�expected�to�be�deductible�for�income�tax�purposes.
Notes�to�the�annual�financial�statements continuedfor the year ended February 2013

75
Integrated Annual Report 2013
Group Company
2013R’000
2012R’000
2013R’000
2012R’000
23. Revenue
Sale of goods 279 175 145 646 – –Services�rendered�and�franchise�revenue 149 815 99 214 – –Management�fees – – 12 360 10�827Dividends�received – – 7 835 –Retail outlet sales 77 441 59 404 – –
506 431* 304�264* 20 195 10�827* Refer to note 42.
24. Cost of salesCost�of�goods�sold�and�services�rendered 311 367* 170�352* – –
* Refer to note 42.
25. Operating profitOperating profit for the year is stated after accounting for the following:Income from subsidiariesAdministration and management fees – – 12 360 10�827
– – 12 360 10�827
Operating lease chargesPremises 15 759 13�539 – –Motor�vehicles 1 487 1�032 18 31Equipment 754 425 – –
18 000 14 996 18 31Profit�on�sale�of�property,�plant�and�equipment 120 165 13 3Depreciation�on�property,�plant�and�equipment 4 203 3�252 180 167Share-based�payment�expense 397 399 397 399Employee costs 81 012 60 409 9 595 8�197Defined�contribution�plan�expense 1 599 1 416 – –Research�and�development 402 542 – –Impairment of loans to group companies – – (180) –Profit�on�exchange�differences 159 56 – –Other impairment losses 1 226 491 – –Amortisation of intangibles 4 733 3�299 – –
26. Investment revenueInterest�revenue 1 956 884 752 272
1 956 884 752 272

Integrated Annual Report 2013
76
Group Company
2013R’000
2012R’000
2013R’000
2012R’000
27. Finance costsBank 7 162 5�684 352 283
7 162 5�684 352 283
28. TaxationMajor components of the tax expense/(income)CurrentSA�normal�income�tax�–�current�period� 12 706 9�113 3 –Secondary�tax�on�companies 784 516 – 516SA�normal�income�tax�–�recognised�in�current�year�for� prior periods 260 (245) – (304)
13 750 9�384 3 212DeferredCurrent period (1 076) (81) (3) (8)Recognised in current year for prior periods 237 7 262 –
(839) (74) 259 (8)12 911 9�310 262 204
Reconciliation of the tax expense % % % %Reconciliation�between�applicable�tax�rate�and�average� effective�tax�rateApplicable�tax�rate 28.00 28.00 28.00 28.00Prior�period�under/(over�provision) 0.69 (0.58) – 27.86Deferred�tax�asset�not�raised 0.19 – – –Exempt�income (0.07) – (40.06) –Disallowable�expenses 3.37 1.52 16.84 (22.80)Secondary�tax�on�companies 2.08 1.70 – (54.71)
Effective�rate 34.26 30.64 4.78 (21.65)
29. Auditors’ remuneration R’000 R’000 R’000 R’000Fees 1 302 1�139 238 198Other�services 143 54 44 31
1 445 1�193 282 229
30. Cash generated from/(used in) operationsProfit/(loss)�before�taxation 37 686 30�381 5 477 (942)Adjustments for:Depreciation and amortisation 8 937 6 551 180 167Profit�on�sale�of�property,�plant�and�equipment (120) (165) 13 (3)Investment�revenue (1 956) (884) (752) (272)Finance costs 7 162 5�684 352 283Impairment loss 1 226 491 180 –Share-based�payment�expense 397 399 397 399Changes in working capital:Inventories (21 940) (7�915) – –Trade�and�other�receivables (10 935) 9�395 110 72Advertising�levies� (504) (680) – –Trade and other payables 16 165 (4�125) 1 833 (35)
36 118 39�132 7 790 (331)
Notes�to�the�annual�financial�statements continuedfor the year ended February 2013

77
Integrated Annual Report 2013
33. Related parties
Related party Position in group Nature of interestCarlo�Gonzaga Executive�director Majority� shareholder� in� one� Taste� Food� Franchising�
outletLuigi�Gonzaga Executive�director Majority� shareholder� in� 10� Taste� Food� Franchising�
outletsHylton�Roy�Rabinowitz Non-executive�director Majority�shareholder�in�the�company�that�NWJ�rents�its�
premises fromArvid�Smedsrud CEO�–�Food�services�division Majority� shareholder� in� the� company� that� the� group�
rents its premises for its food production facility from. The group also procures certain food products from this company
Timothy�Fitzgerald Production�manager�–�NWJ Majority�shareholder�in�one�NWJ�outletKey management Refer�to�note�35Subsidiaries Refer to note 6
The�group,�in�the�ordinary�course�of�business,�entered�into�various�transactions�with�related�parties.�The�transactions�between�the�group�and�all�the�above�have�occurred�under�terms�and�conditions�that�are�no�more�favourable�than�those�entered�into�with�third parties in arm’s length transactions.
Group Company
2013R’000
2012R’000
2013R’000
2012R’000
31. Tax paidBalance�at�beginning�of�the�period 1 082 1�634 5 299Current�tax�for�the�period�recognised�in�income�statement (13 750) (9�384) (3) 212Balance�at�end�of�the�period (2 975) (1�082) 3 5
(15 643) (8�832) 5 516
32. Commitments
The�group�and�company�have�commitments�arising�from�property�leases�for�its�own�business�operations,�leases�entered�into�to�secure�key�sites�for�franchised�outlets�as�well�as�contracts�entered�into�to�lease�motor�vehicles�and�equipment.�With�regard�to�leases�entered�into�to�secure�sites,�it�is�the�group’s�policy to enter into sublease agreements with the franchisees on the same terms and conditions as those in the main lease.
Certain�property�leases�have�contingent�rental�payable�based�on�turnover�clauses.�Leases�are�subject�to�escalation�and�renewal�clauses along normal commercial terms.The net future minimum rentals due under operating leases are as follows:Amounts�due�for�motor�vehicles�and�equipment 2 155 3�582 392 1�258Gross�amounts�due�under�property�leases 47 851 40 101 418 1�710Property�leases�with�related�parties 11 293 5�844 – –Property�leases�–�other 36 558 34�257 418 1�710Less�amounts�recoverable�from�sub-lessees (10 727) (19�900) (239) (210)
39 279 23�783 571 2�758
The net future minimum rentals are repayable as follows:Payable�within�the�next�12�months 12 879 10�796 477 1�6832 to 5 years 26 400 12�987 94 1�075
39 279 23�783 571 2�758

Integrated Annual Report 2013
78
Group Company
2013R’000
2012R’000
2013R’000
2012R’000
33. Related parties (continued)
Loan�accounts�–�Owing�to�related�parties����Group�companies�–�Refer�to�note�7 – – (15 884) (12�335)Management�fees�received�from�related�parties – – 12 360 10�827Corporate�branding�services�to�related�parties – 109 – 109Franchise�income�received�from�related�parties 3 030 2�689 – –Rent paid to related party 2 417 3�399 – –Stock�sold�to�related�parties 5 396 34 – –Stock�purchased�from�related�parties 3 366 3�659 – –
34. Equity-settled share-based payments reserve
Taste�Holdings�Limited�operates�the�Taste�Holdings�Share�Trust�which�incorporates�among�other�things,�a�share�option�schemes,�which�enables�directors�and�executive�management�to�benefit�from�the�Taste�Holdings�share�price�performance�and�forms�part�of�the�retention�strategy�of�key�executive�management.�
Scheme 1This�scheme�confers�the�right�to�participants�to�acquire�ordinary�shares�at�a�strike�price�of�43�cents�per�share�(30-day�volume�weighted�average�of�Taste�shares�on�the�grant�date).�Options�vest�in�three�tranches�from�the�second�anniversary�of�the�option�grant�date.�Once�vesting�of�a�tranche�has�been�triggered,�a�third�of�the�options�within�the�tranche�can�be�exercised�one�year�after�vesting�was�triggered,�a�further�third�two�years�after�the�vesting�was�triggered�and�the�final�third�three�years�after�the�vesting�was�triggered.� The�options�must� be�exercised�within� five� years� of� vesting�having�been� triggered.�Upon� cessation�of� employment,�options� that�have�been�granted�and�accepted�but�not�yet�vested�are� forfeited�unless�approval� is�obtained� from�the� trustees.� All� options�must� be� exercised� no� later� that� the� eighth� anniversary� on�which� they�were� granted� unless� approval� is� obtained� from trustees.
Previously,� the�vesting�of�each�tranche�was�conditional�upon�the�achievement�by�Taste�Holdings�Limited�of�a�25%� increase� in�headline�earnings�per�share�(“HEPS”)�in�any�five�financial�years�from�2011�to�2015.�The�current�difficult�market�conditions�present�in�the�last�two�years�made�the�increase�of�25%�extremely�high�which�in�turn�resulted�in�the�scheme�failing�as�a�staff�retention�mechanism�because�of�unrealistic�high�performance�requirements.�As�a�result,�the�trustees�decided�to�remove�the�25%�hurdle.�The�trustees�felt�that�removing�the�hurdle�did�not�create�a�misalignment�in�their�objectives�of�retaining�participants�or�with�those�of�shareholders.�As�a�result�of�the�removal�of�the�hurdle,�the�share�options�were�revalued�in�2012�(see�page�80).
Scheme 2This scheme was introduced in the current financial year. This scheme confers the right to participants to acquire ordinary shares at�a�strike�price�determined�as�the�volume�weighted�average�price�of�an�ordinary�share�over�the�30�business�days�immediately�preceding�the�grant�of�option�date.�Options�vest�and�can�be�exercised�in�four�equal�tranches,�beginning�on�the�second�anniversary�of�option�grant�date�up�to�the�fifth�anniversary�of�the�option�grant�date.�Upon�cessation�of�employment,�options�that�have�been�granted�and�accepted�but�not�yet�vested�are�forfeited�unless�approval�is�obtained�from�the�trustees.�All�options�must�be�exercised��by�no�later�than�the�5th�anniversary�of�the�option�grant�date�unless�approval�is�obtained�from�trustees.
Notes�to�the�annual�financial�statements continuedfor the year ended February 2013

79
Integrated Annual Report 2013
2013 2012
Number
Weighted average exercise
price cents Number
Weightedaverageexercise
price cents
34. Equity-settled share-based payments reserve (continued)Scheme 1No�share�options�vested�or�were�exercised�during�the�year.�There�are�no�further�share�options�available�for�allocation.The number of share options granted and accepted are:Opening balance 9 434 000 43 9 654 000 43Granted�and�accepted 500 000 43 500 000 43Forfeited (917 000) 43 (720�000) 43Granted�and�accepted�–�shares�not�issued�yet 9 017 000 43 �9�434�000� 43Number�of�share�options�granted�to�and�accepted�by�directors�(see�note�35) 5 132 000 �4�632�000�Vesting period of options granted and acceptedNumber of options Latest vesting date 3�441�000 �Year�to�Feb�2013�2�704�667 Year to Feb 2014 2�704�667 Year to Feb 2015 166 666 Year to Feb 20169�017�000Scheme 2No�share�options�vested�or�were�exercised�during�the�year.� The number of share options granted and accepted are:Opening balance – – – –Granted�and�accepted 1 425 000 254 – –Forfeited – – – –Granted�and�accepted�–�shares�not�issued�yet 1 425 000 254 – –Number�of�share�options�granted�to�and�accepted�by�directors�(see�note�35) – – – –Vesting period of options granted and acceptedNumber of options Latest vesting date 356�250 Year to Feb 2015 356�250 Year to Feb 2016 356�250 �Year�to�Feb�2017356�250 �Year�to�Feb�2018�1 425 000IFRS�2�required�the�fair�value�of�equity-settled�share�based�payments�granted�to�employees�to�be�valued�at�the�grant�date�and�recognised�in�profit�and�loss�over�the�vesting�period.�The�fair�value�of�each�share�option�granted�has�been�valued�at�grant�date�using� the�widely� accepted�Black-Scholes-Merton�model�which� takes� into� account� vesting�periods.�All�market� conditions�were�assumed�to�be�met.�Expected�volatility�was�determined�by�using�the�daily�stock�volatility�of�the�stock�price�over�the�last�five�years.The�following�assumptions�were�applied�in�determining�the�value�of�the�share�options�granted�during�the�year:
Scheme 2 Scheme 1
Number�of�options�granted�and�accepted 1 425 000 500 000 Weighted�average�fair�value�of�options 291 cents 245 centsExercise�price 225 – 421 cents 43�centsClosing price of Taste share at grant date 230�–�400�cents 230�centsExpected�volatility�of�share�price�(%) 105.39%�–�110.24% 110.24%Risk�free�rate�for�the�life�of�the�option 5.29% – 6.94% 6.94%Expected�life�of�options 5 years 6 yearsExpected�dividend�yield 1.48% 1.48%
.

Integrated Annual Report 2013
80
Executive – Paid by CompanyYear ended 2013
BasicR’000
Allowances and
benefitsR’000
Incentivebonus*R’000
Long-termemployee
benefitsR’000
TotalR’000
35. Directors’ emolumentsCarlo Ferdinando�Gonzaga 1 658 142 400 33 2 233Luigi�Gonzaga 755 174 207 21 1 157Evangelos�Tsatsarolakis� 1 116 84 267 – 1 467
3 529 400 874 54 4 857Executive – Paid by subsidiaryYear ended 2013Duncan�John�Crosson� 1 370 88 324 26 1 808
1 370 88 324 26 1 808Prescribed officers – Paid by subsidiaryYear ended 2013Prescribed�officer�A 1 370 180 115 30 1 695Prescribed�officer�B 854 96 – 14 964
2 224 276 115 44 2 659Executive�–�Paid�by�CompanyYear ended 2012Carlo Ferdinando Gonzaga 1�380 160 229 52 1�821Luigi�Gonzaga 693 167 139 36 1�035Evangelos�Tsatsarolakis� 963 109 129 – 1 201
3�036 436 497 88 4�057Executive�–�Paid�by�subsidiaryYear ended 2012Duncan�John�Crosson� 1�277 93 44 44 1�458
1�277 93 44 44 1�458Prescribed�officers�–�Paid�by�subsidiaryYear ended 2012**Prescribed�officer�A 1 260 180 173 30 1�643Prescribed�officer�B 639 106 90 14 849
1�899 286 263 44 2 492* In order to match incentive awards with the performance to which they relate, incentive bonuses above reflect the amounts accrued in respect of each year and
not amounts paid in that year.** In the prior year, certain employees were incorrectly defined as prescribed officers. This has been corrected and the comparatives have been amended.
Share options held by executive directors are detailed below: 2013 2012
Carlo Ferdinando Gonzaga 2 006 000 1 506 000Evangelos�Tsatsarolakis 900 000 900 000Duncan�John�Crosson 1 224 000 1 224 000Luigi�Gonzaga 1 002 000 1 002 000
5 132 000 4�632�000These�share�options�have�been�granted�in�terms�of�the�Taste�Holdings�Share�Trust,�at�a�strike�price�of�43�cents,�details�of�which�are�in�note�34.
Notes�to�the�annual�financial�statements continuedfor the year ended February 2013
34. Equity-settled share-based payments reserve (continued)Reconciliation�of�share�based�payment�expense�charged�directly�to�profit�or�loss:
2013R’000
2012R’000
Balance�at�beginning�of�the�year 575 176Charge�to�profit�or�loss 397 399Incremental�charge�resulting�from�option�revaluation – 183Charge for the year 397 216
Balance�at�end�of�the�year 972 575

81
Integrated Annual Report 2013
Non-executive fees2013
R’0002012
R’000
35. Directors’ emoluments (continued)Ramsay�L’Amy�Daly�(Bill) 233 144Jay�Bayne�Currie 150 118Kevin�Utian 125 98Wessel�Petrus�van�der�Merwe� 125 57Anthony�Berman� 225 105Hylton�Roy�Rabinowitz� 100 79Brimstone�Investment�Corporation�Limited�–�S�Patel 100 –
1 058 601
Loans andreceivables
R’000Total
R’000
36. Financial assets and liabilities by categoryFinancial assets by categoryGroup 2013Trade�and�other�receivables 67 476 67 476Cash�and�cash�equivalents 20 331 20 331Advertising�levies 1 939 1 939Other financial assets 10 315 10 315
100 061 100 061Group�2012Trade�and�other�receivables 56�360 56�360Cash�and�cash�equivalents 35�308 35�308Advertising�levies 1�435 1�435Other financial assets 6�723 6�723
99�826 99�826Company 2013Loans�to�group�companies 37 151 37 151Trade�and�other�receivables 49 49Cash�and�cash�equivalents 2 818 2 818
40 018 40 018Company 2012Loans�to�group�companies 42�271 42�271Trade�and�other�receivables 31 31Cash�and�cash�equivalents 16 16
42�318 42�318

Integrated Annual Report 2013
82
Liabilitiesat amortised
costR’000
Total R’000
36. Financial assets and liabilities by category (continued)Financial liabilities by categoryGroup 2013Borrowings 55 740 55 740Balances�due�to�vendors 1 000 1 000Long-term�employee�benefits 126 126Bank�overdrafts 13 163 13 163Dividends�payable 38 38Trade and other payables 87 960 87 960
158 027 158 027
Group�2012Borrowings 65 601 65 601Balances�due�to�vendors 1 000 1 000Long-term�employee�benefits 252 252Bank�overdrafts 9�770 9�770Dividends�payable 17 17Trade and other payables 64 464 64 464
141 104 141 104
Company 2013Loans�from�group�companies 53 035 53 035Long-term�employee�benefits� 126 126Dividends�payable 38 38Trade and other payables 3 833 3 833
57 032 57 032
Company 2012Loans�from�group�companies 54 606 54 606Bank�overdrafts 815 815Long-term�employee�benefits 252 252Dividends�payable 17 17Trade and other payables 1 940 1 940
57�630 57�630
Notes�to�the�annual�financial�statements continuedfor the year ended February 2013

83
Integrated Annual Report 2013
37. Risk managementThe�group’s�activities�expose� it� to�a�variety�of� risks.�These�risks� include:� liquidity� risk,� interest� rate�risk,�credit� risk�and� foreign�exchange�risk.
Liquidity riskThe�group’s�exposure�to�liquidity�risk�is�that�insufficient�funds�will�be�available�to�meet�future�obligations�as�they�fall�due.�The�group�manages�liquidity�risk�through�an�ongoing�review�of�its�future�commitments�and�of�the�facilities�available�from�financial�institutions. Cash flow forecasts are prepared and adequate unutilised borrowing facilities are maintained. In terms of the liquidity risk�of�the�company,�the�company�will�be�able�to�meet�it’s�future�obligations�through�receipt�of�dividends�from�subsidiaries�and/or�repayment�of�inter-company�loan�accounts.�The�following�table�represents�the�group�and�company’s�outstanding�contractual�maturity profile. The analysis presented is based on the undiscounted contractual obligation:
GroupR’000 <1 year 1 – 2 years 2 – 5 years Total
2013Borrowings 11 694 12 886 31 160 55 740Balances�due�to�vendors 1 000 – – 1 000Long-term�employee�benefits 126 – – 126Bank�overdrafts 13 163 – – 13 163Trade and other payables 88 510 – – 88 510Dividends�payable 38 – – 38
114 531 12 886 31 160 158 577
2012Borrowings 11 406 10 694 43�501 65 601Balances�due�to�vendors 1 000 – – 1 000Long-term�employee�benefits – 252 – 252Bank�overdrafts 9�770 – – 9�770Trade and other payables 66�707 – – 66�707Dividends�payable 17 – – 17
88�900 10 946 43�501 143�347
CompanyR’000 <1 year 1 – 2 years 2 – 5 years Total
2013Loans�from�group�companies 53 035 – – 53 035Long-term�employee�benefits 126 – – 126Trade and other payables 4 231 – – 4 231Dividends�payable 38 – – 38
57 430 – – 57 430
2012Loans�from�group�companies 54 606 – – 54 606Long-term�employee�benefits – 252 – 252Trade and other payables 2�365 – – 2�365Dividends�payable 17 – – 17Bank�overdraft 815 – – 815
57�803 252 – 58�055
Interest rate riskThe�group�and�company’s�interest�rate�risk�arises�from�fixed�and�variable�rate�interest-bearing�assets�and�liabilities�described�in�the�table�below.�The�group�and�company�manage�their�interest�rate�exposure,�by�only�depositing�cash�and�cash�equivalents�with�major�banks�with�high-quality�credit�standing�and�by�limiting�exposures�to�any�one�counterparty.��A�hypothetical� increase/decrease� in� interest�rates�by�1%,�with�all�other�variables�remaining�constant�would� increase/decrease�profits�after�tax�by�R322�342�(2012:�R332�137)�for�the�group�and�R115�552�(2012:�R22�372)�for�the�company.At�reporting�date,�the�interest�rate�profile�of�the�group’s�interest-bearing�financial�instruments�was:

Integrated Annual Report 2013
84
37. Risk management (continued)Group Company
Interest rates applicable
2013R’000
2012R’000
2013R’000
2012R’000
Fixed rate instrumentsAssetsOther financial assets 9% 3 354 – – –Other financial assets 8.5% 506 – –
Variable rate instrumentsAssetsOther financial assets Prime 2 837 3�139 – –Other financial assets Prime�+�2% 2 118 2 062 – –Cash�and�cash�equivalents Daily call rates 20 331 35�308 2 818 16LiabilitiesBank�overdraft Prime 13 163 9�770 – 815Borrowings Prime�+�0.5% 604 – – –Borrowings Prime�less�0.5% 317 – – –Borrowings Prime 54 601 65 149 – –Foreign exchange riskThe�group� is�exposed�to�foreign�exchange�risk�only�to�the�extent�that� it� imports�raw�materials�used�to�manufacture� jewellery.�These� purchases� are� denominated�mainly� in�US� dollars� and� British� pounds.� The� liabilities� are� settled� in� one� of� these� foreign�currencies.�Management�does�not�make�use�of�forward�exchange�contracts�to�manage�foreign�exchange�risk�but�monitors�the�currencies on a regular basis.
As�at�28�February�2013,�the�group�had�the�following�foreign�currency�denominated�liabilities:
Group Company
2013R’000
2012R’000
2013R’000
2012R’000
Trade�and�other�payables�–�EURO (1) – – –Trade�and�other�payables�–�US�dollar (1 659) (2�770) – –Trade�and�other�payables�–�British�pounds – (2) – –Total (1 660) (2�772) – –Exchange�rates�used�for�conversion�of� foreign� items�were:�USD�9.075�(2012:�USD7.6239),�GBP�13.371�(2012:�GBP10.277),�and� EURO�12.20.If�the�foreign�exchange�rates�change�by�R1�and�were�applied�to�the�outstanding�balances�as�at�28�February�2013,�with�all�other�variables�held�constant,�the�impact�on�post-tax�profits�would�be�R131�660�(2012:�R261�725).�Credit riskCredit�risk�is�the�risk�of�financial�loss�to�the�group�if�a�counterparty�to�a�financial�asset�fails�to�meet�its�contractual�obligations.�Credit�risk�arises�on�cash�and�cash�equivalents,�trade�and�other�receivables,�other�financial�assets�and�loans�to�group�companies.�The�group�only�deposits�cash�with�major�banks�with�high-quality�credit�standing�and�limits�exposure�to�any�one�counterparty.�
Trade�and�other�receivables�comprise�stock�debtors,�royalties�and�marketing�fees�receivable�from�franchisees.��
Other�financial�assets�comprise�loans�and�extended�terms�offered�to�franchisees.�
Management�evaluates�credit�risk�relating�to�these�receivables�on�an�ongoing�basis.�The�credit�risk�on�loans�to�group�companies��is negligible due to the fact that all these group companies are commonly controlled.
The�granting�of�credit�is�made�on�application�and�is�approved�by�directors.�At�year-end,�the�group�and�company�did�not�consider�there�to�be�any�significant�concentration�of�risk.�
Carrying�amounts�of�financial�assets�and�trade�receivables�that�have�been�renegotiated:Group Company
2013R’000
2012R’000
2013R’000
2012R’000
Other financial assets 1 500 1 522 – –
Notes�to�the�annual�financial�statements continuedfor the year ended February 2013
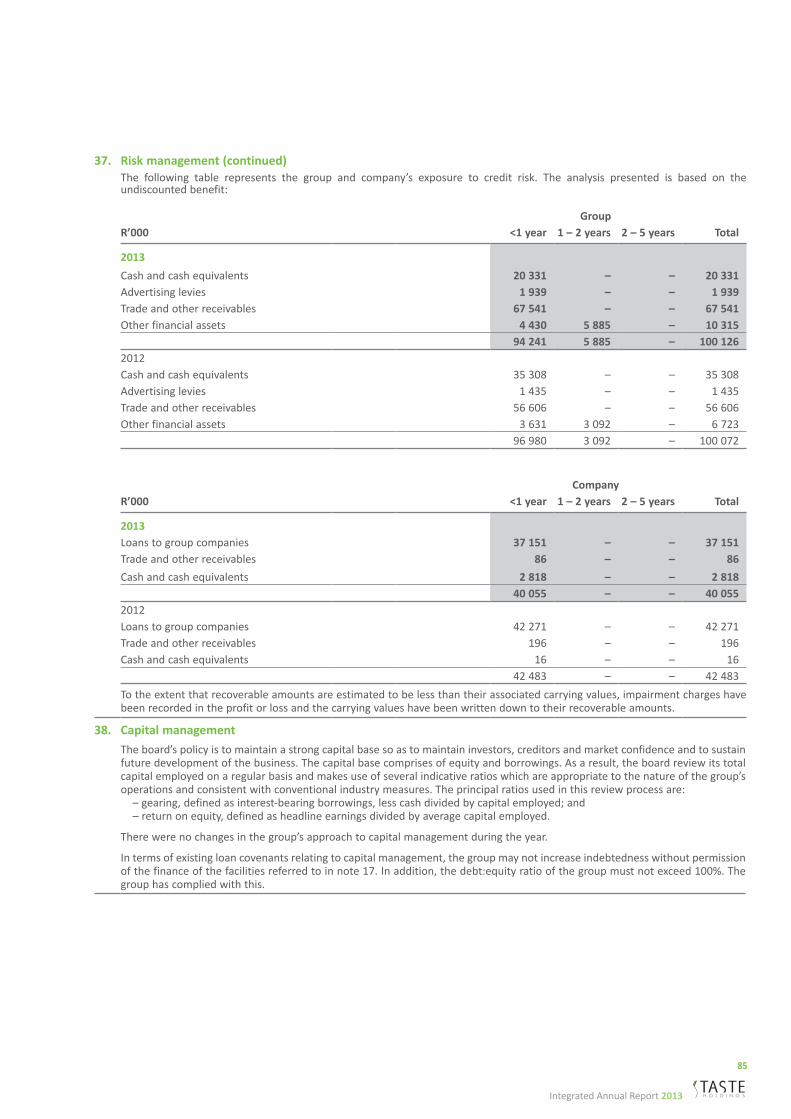
85
Integrated Annual Report 2013
37. Risk management (continued)The� following� table� represents� the� group� and� company’s� exposure� to� credit� risk.� The� analysis� presented� is� based� on� the�undiscounted benefit:
GroupR’000 <1 year 1 – 2 years 2 – 5 years Total
2013Cash�and�cash�equivalents� 20 331 – – 20 331Advertising�levies 1 939 – – 1 939Trade�and�other�receivables 67 541 – – 67 541Other financial assets 4 430 5 885 – 10 315
94 241 5 885 – 100 1262012Cash�and�cash�equivalents 35�308 – – 35�308Advertising�levies 1�435 – – 1�435Trade�and�other�receivables 56 606 – – 56 606Other financial assets 3�631 3�092 – 6�723
96�980 3�092 – 100�072
CompanyR’000 <1 year 1 – 2 years 2 – 5 years Total
2013Loans�to�group�companies 37 151 – – 37 151Trade�and�other�receivables 86 – – 86Cash�and�cash�equivalents 2 818 – – 2 818
40 055 – – 40 0552012Loans�to�group�companies 42�271 – – 42�271Trade�and�other�receivables 196 – – 196Cash�and�cash�equivalents 16 – – 16
42�483 – – 42�483To�the�extent�that�recoverable�amounts�are�estimated�to�be�less�than�their�associated�carrying�values,�impairment�charges�have�been�recorded�in�the�profit�or�loss�and�the�carrying�values�have�been�written�down�to�their�recoverable�amounts.
38. Capital managementThe�board’s�policy�is�to�maintain�a�strong�capital�base�so�as�to�maintain�investors,�creditors�and�market�confidence�and�to�sustain�future�development�of�the�business.�The�capital�base�comprises�of�equity�and�borrowings.�As�a�result,�the�board�review�its�total�capital�employed�on�a�regular�basis�and�makes�use�of�several�indicative�ratios�which�are�appropriate�to�the�nature�of�the�group’s�operations�and�consistent�with�conventional�industry�measures.�The�principal�ratios�used�in�this�review�process�are: –�gearing,�defined�as�interest-bearing�borrowings,�less�cash�divided�by�capital�employed;�and –��return�on�equity,�defined�as�headline�earnings�divided�by�average�capital�employed.
There were no changes in the group’s approach to capital management during the year.
In�terms�of�existing�loan�covenants�relating�to�capital�management,�the�group�may�not�increase�indebtedness�without�permission�of�the�finance�of�the�facilities�referred�to�in�note�17.�In�addition,�the�debt:equity�ratio�of�the�group�must�not�exceed�100%.�The�group has complied with this.

Integrated Annual Report 2013
86
Group Company
2013R’000
2012R’000
2013R’000
2012R’000
39. Earnings and headline earnings per shareEarnings�per�share�(cents)� 12.8 12.2 – –Diluted�earnings�per�share�(cents) 12.3 11.6 – –Headline�earnings�per�share�(cents)� 13.3 12.4 – –Diluted�headline�earnings�per�share�(cents) 12.8 11.8 – –The calculation of earnings per share is based on a profit for the group�of�R24�774�802�(2012:�R21�071�065)�and�a�weighted�average�number�of�ordinary�shares�of�194�161�291�(2012:�172�849�816).The calculation of headline earnings per share is based on headline earnings�of�R25�899�033�(2012:�R21�421�065)�and�a�weighted�average�number�of�ordinary�shares�of�194�161�291�(2012:�172�849�816).The�weighted�average�number�of�shares�is�calculated�after�taking�into�account�the�effect�of�setting�off�1�720�000��(2012:�1�720�000)�treasury�shares�held�by�the�Taste�Holdings�Share�Trust,�against�the�issued share capital.The calculation of diluted earnings per share and diluted headline earnings�per�share�is�based�on�basic�earnings�of�R24�774�802�(2012:�R21�071�065)�and�headline�earnings�of�R25�899�033�(2012:� R21�421�065)�respectively,�and�a�weighted�average�number�of�shares�in�issue�of�201�910�675�(2012:�182�283�816),�after�taking�into�account�the�effect�of�the�possible�issue�of�7�749�384�(2012:�9�434�000)�ordinary shares in the future relating to the share option scheme.Headline�earnings�have�been�computed�as�follows:Profit�attributable�to�ordinary�shareholders 24 775 21�071 – –Adjusted�for�profit�on�sale�of�property,�plant�and�equipment,�non-current assets held for sale and retail stores (120) (165) – –Impairment losses 1 226 491 – –Gross�measurements�excluded�from�headline�earnings 1 106 326 – –Tax�effect 18 24 – –Net�measurements�excluded�from�headline�earnings 1 124 350 – –Headline�earnings 25 899 21 421 – –
40. Going concernBased�on�positive�forward�financial�projections,�the�directors�are�confident�that�the�group�operates�a�highly�sustainable�business�model which will continue as a going concern in the years ahead.
41. Events subsequent to year endOn�12�June�2013�a�total�of�1�657�325�share�options�were�granted�and�accepted�in�terms�of�the�Taste�Holdings�Share�Trust�at�a�strike�price�of�386�cents,�of�which�Evangelos�Tsatsarolakis�and�Duncan�John�Crosson�accepted�475�000�and�577�126�share�options�respectively.The�directors�are�not�aware�of�any�other�matter�or�circumstance�arising�since�year�end�up�to�the�date�of�this�report,�not�otherwise�dealt with in this report.
42. ComparativesGroupThe�purchase�price�allocation�has�been�provisionally�accounted�for�in�the�prior�year�as�permitted�by�IFRS�3�Business�Combinations�and�has�now�been�finalised.�As�a�result�certain�balances�have�changed�(refer�to�note�5,�21�and�22).Contributions�to�marketing�funds�and�the�utilisation�thereof�were�previously�presented�as�recoveries�of�operating�costs�and�disclosed�in�the�operating�profit�note.�In�order�to�ensure�a�proper�and�meaningful�understanding�of�the�transactions�that�have�occurred�and�interpretation�of� IFRS,� these� contributions� are�now�presented� in� revenue�and� the�utilisation� thereof� in� cost�of� sales.�As�a� result�revenue�increased�with�R34�594�048�and�cost�of�sales�increased�with�R34�594�048�(refer�to�note�23).Included�in�development�revenue�are�services�provided�to�franchise�owners�of�a�certain�brand�to�assist�with�the�start-up�of�their�store.�In�the�comparative�year�revenue�was�presented�net�of�contributions�received�from�the�franchise�owners.�In�order�to�ensure�a�proper� and� more� meaningful� understanding� of� the� transactions� that� have� occurred� and� interpretation� of� IFRS,� revenue� and�contributions�that�represent�principal�transactions�are�represented�gross.�As�a�result�revenue�increased�with�R4�375�847�and�cost�of�sales�increased�with�R4�375�847�(refer�note�23).The�above�changes�in�presentation�have�had�no�effect�on�the�group’s�profits,�statement�of�changes�in�equity�or�statement�of�financial�position�except�for�the�effect�on�goodwill�and�trade�and�other�payables�noted�above.CompanyIn� the�prior� year,� cash� flow�movements� for� loans�advanced/repaid� to/by�group�companies�were�disclosed�on�a�net�basis.� In� the�current� financial� statements� these� comparative� balances� are� presented� on� a� gross� basis� in� terms� of� IFRS.� The� above� change� in�presentation�has�had�no�effect�on�the�company’s�profit,�statement�of�changes�in�equity�or�statement�of�financial�position.
Notes�to�the�annual�financial�statements continuedfor the year ended February 2013

87
Integrated Annual Report 2013
Number of shareholdings %
Number of shares %
Shareholder spread1 – 999 248 14.74 99�396 0.051 000 – 9 999 798 47.44 2�976�675 1.5210 000 – 99 999 525 31.21 12�679�197 6.47100�000�shares�and�over 111 6.61 180�126�023 91.96
Total 1�682 100.00 195�881�291 100.00
Distribution of shareholdersBanks 3 0.18 372�000 0.19Close corporations 34 2.00 1�309�423 0.67Endowment funds 4 0.24 5 016 020 2.56Individuals 1�471 87.46 52�427�318 26.76Investment�companies 4 0.24 1 259 640 0.65Mutual�funds 6 0.36 10�424�174 5.32Nominees�and�trusts 99 5.89 50�206�485 25.63Other corporations 14 0.83 268�155 0.14Private�companies 42 2.50 47�832�977 24.42Public�companies 3 0.18 25 040 099 12.78Retirement funds 1 0.06 5 000 0.00Share trusts 1 0.06 1�720�000 0.88Total 1�682 100.00 195�881�291 100.00
Beneficial shareholders holding 5% or more, other than directorsChickenland�Proprietary�Limited 26�227�632 13.39Brimstone�Investments�Corporation�Limited 24 540 099 12.53Total 50�767�731 25.92
Shareholder spreadNon-public shareholders 19 1.13 119�317�734 60.91Directors and their associates 16 0.95 66�830�003 34.11Own holdings 1 0.06 1�720�000 0.88Strategic holdings 2 0.12 50�767�731 25.92Public shareholders 1663 98.87 76�563�557 39.09
Total 1�682 100.00 195�881�291 100.00
Shareholders’ analysisfor the year ended February 2013

Integrated Annual Report 2013
88
Shareholders’ diaryfor the year ended February 2013
Annual�general�meeting� 22�August�2013Announcement of interim results OctoberFinancial�year-end� 28�FebruaryAnnouncement�of�final�results� May
JSE performanceat February 2013
Opening�price�(cents)� 221cClosing�price�(cents)� �400cHigh�for�the�year�(cents)� 460cLow�for�the�year�(cents)� �210cVolume�of�shares�traded�during�the�year� 23�749�477Value�of�shares�traded�during�the�year� R68�744�166Shares�in�issue� 195�881�291�Market�capitalisation� R783�525�164

89
Integrated Annual Report 2013
TASTE HOLDINGS LIMITED(Incorporated�in�the�Republic�of�South�Africa)(Registration�number�2000/002239/06)JSE�code:�TASISIN:�ZAE000081162)(“Taste”�or�“the�company”)
Notice is hereby given that the annual general meeting of shareholders of Taste will be held at the offices of the company at 12 Gemini Street, Linbro Business Park, Sandton, on Thursday, 22 August 2013 at 12h00 to present the annual financial statements to shareholders and to consider and, if deemed appropriate, pass the ordinary and special resolutions listed below, with or without modification.
Kindly note that in terms of section 63(1) of the Companies Act of 2008, meeting participants (including proxies) will be required to provide reasonably satisfactory identification before being entitled to participate in or vote at the annual general meeting. Forms of identification that will be accepted include original and valid identity documents, driver’s licenses and passports.
The�board�of�directors�of�the�company�has�determined�that�the�record�date�in�terms�of�section�59(1)�of�the�Companies�Act,�No�71�of�2008,�as�amended�(“the�Companies�Act”)�for�the�purpose�of�determining�which�shareholders�of�the�company�are�entitled�to�receive�notice�of�the�annual�general�meeting�is�Friday,�19�July�2013�and�the�record�date�for�purposes�of�determining�which�shareholders�of�the�company�are�entitled�to�participate�in�and�vote�at�the�annual�general�meeting�is�Friday,�16�August�2013.�
Shareholders�are�referred�to�the�explanatory�notes�as�attached�to�the�notice�of�the�annual�general�meeting�for�additional�information,�including�abbreviated�profiles�of�the�directors�standing�for�re-election.
Presentation of annual financial statementsThe�audited�annual� financial� statements�of� the�company� for� the�year�ended�28�February�2013,� including� the�directors’� report,� the�auditors’�report�and�the�report�of�the�audit�committee,�to�be�presented�as�required�in�terms�of�section�61(8)(a)�of�the�Companies�Act�of�2008.
Report from the Social, Ethics and Remuneration CommitteeIn�accordance�with�Companies�Regulation�43(5)(c),�issued�in�terms�of�the�Companies�Act�of�2008,�the�chairman�of�the�Social,�Ethics�and�Remuneration�Committee,�or�in�the�absence�of�the�chairman�any�member�of�the�Committee,�will�present�the�Committee’s�report�to shareholders at the annual general meeting.
Ordinary resolutions 1: Rotation of directorsMessrs�Anthony�Berman�and�Ramsay�L’amy�(Bill)�Daly�retire�by�rotation�and,�being�eligible,�offers�themselves�for�re-election�as�directors� of�the�company.�Accordingly,�shareholders�are�requested�to�consider�and,�if�deemed�fit,�approve�the�separate�ordinary�resolutions�set�out below.
Ordinary resolutions 1.1: RESOLVED� that� the� re-appointment� of�Mr� Anthony� Berman� as� an� independent� non-executive� director� of� the� company� be� and� is� hereby�approved.
Ordinary resolutions 1.2: RESOLVED�that� the�re-appointment�of�Mr�Ramsay�L’amy�(Bill)�Daly� �as�an� independent�non-executive�director�and�chairman�of� the�company�be�and�is�hereby�approved.”�Brief�biographies�of�the�above�directors�are�set�out�on�page�4.
Ordinary resolutions 2: Appointment of audit committeeIt�is�proposed�that�the�following�independent�non-executive�directors�be�appointed�as�members�of�the�Audit�Committee.
Ordinary resolutions 2.1:It�is�RESOLVED�that�Mr�Anthony�Berman�be�and�is�hereby�appointed�as�a�member�and�chairman�of�the�audit�committee�of�the�company�until�the�conclusion�of�the�next�annual�general�meeting�of�the�company�in�2014.�
Ordinary resolutions 2.2:It�is�RESOLVED�that�Mr�Wessel�Petrus�van�der�Merwe�be�and�is�hereby�appointed�as�a�member�of�the�audit�committee�of�the�company�until�the�conclusion�of�the�next�annual�general�meeting�of�the�company�in�2014.
Ordinary resolutions 2.3:It� is�RESOLVED�that�Mr�Sebastian�Patel�be�and� is�hereby�appointed�as�a�member�of� the�audit�committee�of� the�company�until� the�conclusion�of�the�next�annual�general�meeting�of�the�company�in�2014.�
Ordinary resolution 3: Re-appointment of auditorsIt�is�RESOLVED,�on�recommendation�of�the�audit�committee,�that�BDO�South�Africa�Inc.�be�and�is�hereby�reappointed�as�independent�auditors�of�the�company,�the�designated�auditor�meeting�the�requirements�of�S90�(2)�of�the�Companies�Act.��
Notice�to�annual�general�meetingfor the year ended February 2013

Integrated Annual Report 2013
90
Notice�to�annual�general�meeting�continuedfor the year ended February 2013
Ordinary resolution 4: Authority to issue authorised but unissued ordinary sharesIt� is� RESOLVED� that� the� directors� be� and� are� hereby� authorised� to� allot� and� issue� at� their� discretion� the� unissued� but� authorised�ordinary�shares�in�the�share�capital�of�the�company�and/or�grant�options�to�subscribe�for�the�unissued�shares,�for�such�purposes�and�on�such�terms�and�conditions�as�they�may�determine,�provided�that�such�transaction(s)�has/have�been�approved�by�the�JSE�Limited,�as�and�when�required,�and�are�subject�to�the�JSE�Listings�Requirements�and�the�Companies�Act�and,�shareholders�hereby�waive�any�pre-emptive�rights�thereto.
Ordinary resolution 5: Authority to issue shares for cashIt�is�RESOLVED�that,�in�terms�of�the�Listings�Requirements�of�the�JSE�Limited�(“JSE”),�the�mandate�given�to�the�directors�of�the�company�in� terms� of� a� general� authority� to� issue� securities� for� cash,� as� and�when� suitable� opportunities� arise,� be� renewed� subject� to� the�following conditions:•� �that�this�authority�shall�only�be�valid�until�the�next�annual�general�meeting�of�the�company�but�shall�not�extend�beyond�15�months�
from the date of this meeting;•� �the� allotment� and� issue� of� the� shares� must� be� made� to� persons� qualifying� as� public� shareholders� as� defined� in� the� Listings�Requirements�of�the�JSE;
•� �the�shares�which�are�the�subject�of�the�issue�for�cash�must�be�of�a�class�already�in�issue,�or�where�this�is�not�the�case,�must�be�limited�to�such�shares�or�rights�that�are�convertible�into�a�class�already�in�issue;
•� �that�a�paid�press�announcement�giving�full�details,� including�the�impact�of�the�issue�on�net�asset�value,�net�tangible�asset�value,�earnings�and�headline�earnings�per�share�and,�if�applicable,�diluted�earnings�and�diluted�headline�earnings�per�share,�be�published�after�any�issue�representing,�on�a�cumulative�basis�within�one�financial�year,�5%�of�the�number�of�shares�in�issue�prior�to�the�issue�concerned;
•� �that�the�issues�in�aggregate�in�any�one�financial�year�(including�the�number�of�any�shares�that�may�be�issued�in�future�arising�out�of�the�issue�of�options)�shall�not�exceed�15%�of�the�number�of�shares�of�the�company’s�issued�ordinary�share�capital;�and
•� �that�in�determining�the�price�at�which�an�issue�of�shares�for�cash�will�be�made�in�terms�of�this�authority,�the�maximum�discount�permitted�shall�be�10%�of�the�weighted�average�traded�price�of�the�ordinary�shares�on�the�JSE,�measured�over�the�30�business�days�prior to the date that the price of the issue is agreed between the company and the party subscribing for the securities.
Ordinary resolution 6: Advisory endorsement of the remuneration policyTo�approve,�as�a�non-binding�advisory�vote,� the�company’s� remuneration�policy� (excluding� the� remuneration�of� the�non-executive�directors�for�their�services�as�directors�and�members�of�board�committees)�as�set�out�in�the�Remuneration�Report�contained�in�the�Integrated�Report�on�page�34.
Ordinary resolution 7: Signing authorityTo authorise any one director or the secretary of the company to do all such things and sign all such documents as are deemed necessary�to�implement�the�resolutions�set�out�in�the�notice�convening�the�annual�general�meeting�at�which�this�ordinary�resolution�will�be�considered�and�approved�at�such�meeting.
Special resolution 1: Non-Executive directors’ remunerationIt�is�RESOLVED,�as�a�special�resolution:•� �that�the�company�be�and�is�hereby�authorised�to�pay�remuneration�to�its�non-executive�directors�for�their�services�as�non-executive�directors,�as�contemplated�in�S66(8)�and�S66(9)�of�the�Companies�Act,�No�71�of�2008;�and
•� �that�the�remuneration�structure�and�amounts�as�set�out�below,�be�and�are�hereby�approved�until�such�time�as�rescinded�or�amended�by shareholders by way of a special resolution:
Type of fee (annual fee)Proposed fee in R
2014
BoardChairman 214 000Board�member 107�000Audit and Risk CommitteeChairman 214 000Member 26�750Social, Ethics and Remuneration CommitteeChairman 35�310Member 26�750

91
Integrated Annual Report 2013
Special resolution 2: General authority to repurchase sharesIt� is� RESOLVED,� as� a� special� resolution,� that� the�mandate� given� to� the� company� in� terms� of� its�MOI� (or� one� of� its�wholly� owned�subsidiaries)�providing�authorisation,�by�way�of�a�general�approval,� to�acquire� the�company’s�own�securities,�upon�such� terms�and�conditions�and�in�such�amounts�as�the�directors�may�from�time�to�time�decide,�subject�to�the�Listings�Requirements�of�the�JSE�Limited�(“the�JSE”),�the�Companies�Act�and�the�company’s�MOI,�be�extended,�subject�to�the�following:•� �this�general�authority�be�valid�until�the�company’s�next�annual�general�meeting,�provided�that�it�shall�not�extend�beyond�15�(fifteen)�
months�from�the�date�of�passing�of�this�special�resolution�(whichever�period�is�shorter);•� the� repurchase� being� effected� through� the� order� book� operated� by� the� JSE� trading� system,�without� any� prior� understanding� or�
arrangement between the company and the counterparty;•� repurchases�may�not�be�made�at�a�price�greater�than�10%�(ten�percent)�above�the�weighted�average�of� the�market�value�of� the�
ordinary�shares�for�the�5�(five)�business�days�immediately�preceding�the�date�on�which�the�transaction�was�effected;•� �an�announcement�being�published�as�soon�as� the�company�has�repurchased�ordinary�shares�constituting,�on�a�cumulative�basis,�
3%�(three�percent)�of�the�initial�number�of�ordinary�shares,�and�for�each�3%�(three�percent)�in�aggregate�of�the�initial�number�of�ordinary�shares�repurchased�thereafter,�containing�full�details�of�such�repurchases;
•� the�number�of�shares�which�may�be�acquired�pursuant�to�this�authority�in�any�one�financial�year�may�not�in�the�aggregate�exceed�20%� (twenty� percent)� of� the� company’s� issued� share� capital� as� at� the� date� of� passing� of� this� special� resolution� or� 10%� of� the�company’s issued share capital in the case of an acquisition of shares in the company by a subsidiary of the company;
•� the�company’s�sponsor�confirming�the�adequacy�of�the�company’s�working�capital�for�purposes�of�undertaking�the�repurchase�of�ordinary�shares�in�writing�to�the�JSE�prior�to�the�company�entering�the�market�to�proceed�with�the�repurchase;
•� the�company�and/or�its�subsidiaries�not�repurchasing�securities�during�a�prohibited�period�as�defined�in�the�JSE�Listings�Requirements,�unless�it�has�in�place�a�repurchase�programme�where�the�dates�and�quantities�of�securities�to�be�traded�during�the�relevant�period�are�fixed�and�full�details�of�the�programme�have�been�disclosed�in�an�announcement�published�on�SENS�prior�to�the�commencement�of the prohibited period;
•� at�any�point�in�time�the�company�only�appointing�one�agent�to�effect�any�repurchases�on�its�behalf;�and•� the�board�of�directors�passing�a� resolution� that� they�authorised� the� repurchase�and� that� the� company�passed� the� solvency�and�
liquidity�test�set�out�in�section�4�of�the�Companies�Act�and�that�since�the�test�was�done�there�have�been�no�material�changes�to�the�financial position of the group.
The directors of the company and its subsidiaries will only utilise the general authority to purchase the company’s securities to the extent�that�they,�having�considered�the�effects�of�the�maximum�repurchase�permitted,�are�of�the�opinion�that�for�a�period�of�12�(twelve)�months after the date of the notice of the annual general meeting and at the actual date of the repurchase:•� the�company�and�the�group�will�be�able,�in�the�ordinary�course�of�business,�to�pay�its�debts;•� the�working�capital�of�the�company�and�the�group�will�be�adequate�for�ordinary�business�purposes;•� �the�assets�of�the�company�and�the�group,�fairly�valued�in�accordance�with�International�Financial�Reporting�Standards,�will�exceed�
the liabilities of the company and the group; •� the�company’s�and�the�group’s�ordinary�share�capital�and�reserves�will�be�adequate�for�ordinary�business�purposes;�and•� �the�directors�have�passed�a�resolution�authorising�the�repurchase,�resolving�that�the�company�has�satisfied�the�solvency�and�liquidity�test�as�defined�in�the�Companies�Act�and�resolving�that�since�the�solvency�and�liquidity�test�had�been�applied,�there�have�been�no�material changes to the financial position of the group.
Additional informationThe�following�additional�information,�some�of�which�may�appear�elsewhere�in�the�integrated�report,�is�provided�in�terms�of�the�JSE�Listings�Requirements�for�purposes�of�the�general�authority�to�repurchase�the�company’s�securities�set�out�in�special�resolution�number�2�above:•� directors�and�management��–�pages�4�to�8;•� major�shareholders�–�page�87;•� directors’�interests�in�ordinary�shares�–�page�42;�and�•� share�capital�of�the�company�–�page�70.�
Litigation statement The�directors�in�office�whose�names�appear�on�page�41�of�the�integrated�report,�are�not�aware�of�any�legal�or�arbitration�proceedings,�including�any�proceedings�that�are�pending�or�threatened,�that�may�have,�or�have�had,�in�the�recent�past,�being�at�least�the�previous�12�(twelve)�months�from�the�date�of�this�integrated�report,�a�material�effect�on�the�group’s�financial�position.�
Directors’ responsibility statement The�directors�in�office,�whose�names�appear�on�page�41 of�the�integrated�report,�collectively�and�individually�accept�full�responsibility�for�the�accuracy�of�the�information�pertaining�to�special�resolution�number�2�and�certify�that,�to�the�best�of�their�knowledge�and�belief,�there�are�no�facts�that�have�been�omitted�which�would�make�any�statement�false�or�misleading,�and�that�all�reasonable�enquiries�to�ascertain�such�facts�have�been�made�and�that�the�special�resolution�contains�all�information�required�by�the�JSE�Listings�Requirements.

Integrated Annual Report 2013
92
Noti ce to annual general meeti ng conti nuedfor the year ended February 2013
Material changes Other than the facts and developments reported on in the integrated report, there have been no material changes in the affairs or financial position of the company and its subsidiaries since the company’s financial year-end and the date of signature of the integrated report.
Directors’ intention regarding the general authority to repurchase the company’s sharesThe directors have no specific intention, at present, for the company to repurchase any of its securities but consider that such a general authority should be put in place should an opportunity present itself to do so during the year which is in the best interests of the company and its shareholders.
Special resolution 3: Financial assistance to related and inter-related companiesIt is RESOLVED, by way of a special resolution, that the directors of the company be and are hereby authorised to provide financial assistance to all related and inter-related companies within the Taste group of companies, at such times and on such terms and conditions as the directors in their sole discretion deem fit and subject to all relevant statutory and regulatory requirements being met, such authority to remain in place until rescinded by way of special resolution passed at a duly constituted annual general meeting of the company.
Electronic participationShould any shareholder of the company wish to participate in the annual general meeting by way of electronic participation, that shareholder shall be obliged to make application in writing (including details as to how the shareholder or its representative can be contacted) to so participate, to the company secretary at the applicable address set out below at least 5 (five) business days prior to the annual general meeting in order for the company secretary to arrange for the shareholder (and its representative) to provide reasonably satisfactory identification to the transfer secretaries for the purposes of section 63 (1) of the Companies Act and for the company secretary to provide the shareholder (or its representative) with details as to how to access any electronic participation to be provided. The company reserves the right not to provide for electronic participation at the annual general meeting in the event that it determines that it is not practical to do so. The costs of accessing any means of electronic participation provided by the company will be borne by the shareholder so accessing the electronic participation.
ProxiesAny shareholder holding shares in certificated form or recorded on the company’s subregister in electronic dematerialised form in “own name” and entitled to attend, speak and vote at the meeting is entitled to appoint a proxy to attend, speak and on a poll vote in their stead. A proxy need not be a member of the company.
Proxy forms must be lodged at the offices of the transfer secretaries, Computershare Investor Services 2004 (Proprietary) Limited (70 Marshall Street, Corner Sauer Street, Johannesburg; PO Box 61051, Marshalltown, 2107), by no later than 10h00 on 20 August 2013.
All beneficial owners whose shares have been dematerialised through a Central Securities Depository Participant (CSDP) or broker other than with “own name” registration, must provide the CSDP or broker with their voting instructions in terms of their custody agreement should they wish to vote at the annual general meeting. Alternatively, they may request the CSDP or broker to provide them with a letter of representation, in terms of their custody agreements, should they wish to attend the annual general meeting.
Shareholders and proxies of shareholders are advised that they will be required to present reasonably satisfactory identification in order to attend or participate in the annual general meeting as required in terms of S63(1) of the Companies Act.
Voting thresholdsOrdinary resolutions 1 to 3 and 7 are subject to a simple majority of votes.
In terms of the JSE Listings Requirements, the approval of a 75% majority of votes of all shareholders, present or represented by proxy, is required to approve ordinary resolution number 5.
The special resolutions must be supported by 75% or more of the voting rights exercised.
VotingIn terms of the JSE Listings Requirements any shares held by The Taste Share Incentive Scheme will not have its votes at the annual general meeting taken into account in determining the results of voting on ordinary resolution number 5 and special resolution number 2.
By order of the board
Monika PretoriusCompany secretary
Sandton15 July 2013

93
Integrated Annual Report 2013
VotingA�75%�majority�of�the�votes�cast�by�shareholders�present�or�represented�by�proxy�at�the�annual�general�meeting�must�be�cast�in�favour�of�special�resolutions�for�these�to�be�approved.�Ordinary�resolutions�are�approved�by�more�than�50%�of�the�votes�cast�by�shareholders�present�or�represented�by�proxy.
Presentation of annual financial statementsAt�the�annual�general�meeting,�the�directors�must�present�the�annual�financial�statements�for�the�year�ended�28�February�2013�to�shareholders,�together�with�the�reports�of�the�directors,�the�audit�and�risk�committee,�and�the�auditors.�These�are�contained�within�the integrated report.
Ordinary resolutions 1.1 to 1.2 – Rotation and appointment of directorsIn� accordance�with� the� company’s�memorandum�of� incorporation,�one-third�of� the�directors� are� required� to� retire�at�each�annual�general�meeting�and�may�offer�themselves�for�re-election.�In�addition,�any�person�appointed�to�the�board�of�directors�following�the�previous�annual�general�meeting�is�similarly�required�to�retire�and�is�eligible�for�re-election�at�the�next�annual�general�meeting.
The�purpose�of� these� resolutions� is� to�elect,�by�way�of� separate� resolutions,�directors� in� the�place�of� those� retiring� in� accordance� with�the�company’s�Memorandum�of�Incorporation.�The�directors�retiring�are�Mr�Anthony�Berman�and�Mr�Ramsay�L’amy�(Bill)�Daly,�both�of�whom�being�eligible�offer�themselves�for�re-election.�
Brief�biographical�details�of�each�of�the�above�directors�and�the�remaining�members�of�the�board�are�contained�on�pages�4�and�5�of�the integrated report of which this notice forms part.
Ordinary resolutions 2.1 to 2.3 – Appointment of audit committeeIn�terms�of�S94(2)�of�the�Companies�Act,�No�71�of�2008�(“the�Act”),�a�public�company�must�at�each�annual�general�meeting�elect�an�audit�committee�comprising�at�least�three�members�who�are�directors�and�who�meet�the�criteria�of�S94(4)�of�the�Act.�Regulation�42�to�the�Act�specifies�that�one-third�of�the�members�of�the�audit�committee�must�have�appropriate�academic�qualifications�or�experience�in the areas as listed in the regulation.
The�board�of�directors�of�the�company�is�satisfied�that�the�proposed�members�of�the�audit�committee�meet�all�relevant�requirements.��
The�purpose�of�these�resolutions�is�to�appoint,�by�way�of�separate�resolutions,�the�following�independent�non-executive�directors�as�members of the audit committee:•� Mr�Anthony�Berman�(Chairman)•� Mr�Wessel�Petrus�van�der�Merwe•� Mr�Sebastian�Patel
Ordinary resolution 3 – Appointment of auditorsBDO�South�Africa�Inc�has�indicated�its�willingness�to�continue�in�office�and�resolution�3�proposes�the�reappointment�of�that�firm�as�the�company’s�auditors�with�effect�from�1�March�2013.�S90(3)�of�the�Companies�Act,�No�71�of�2008�(“the�Act”)�requires�the�designated�auditor�to�meet�the�criteria�as�set�out�in�S90(2)�of�the�Act.
The�board�of�directors�of�the�company�is�satisfied�that�both�BDO�and�the�designated�auditor�meet�the�relevant�requirements.
Ordinary resolutions 4 and 5 – Placement and issue of shares for cashIn� terms�of� the� Companies�Act,�No� 71� of� 2008� (“the�Act”),� directors� are� authorised� to� allot� and� issue� the� unissued� shares� of� the�company,�unless�otherwise�provided�in�the�company’s�Memorandum�of�Incorporation�or�in�instances�as�listed�in�S41�of�the�Act.�The�JSE�requires�that�the�Memorandum�of�Incorporation�should�provide�that�shareholders�in�a�general�meeting�may�authorise�the�directors�to� issue� unissued� securities� and/or� grant� options� to� subscribe� for� unissued� securities� as� the� directors� in� their� discretion� think� fit,�provided�that�such�transaction(s)�has/have�been�approved�by�the�JSE�and�are�subject�to�the�JSE�Listings�Requirements.�In�the�absence�of� the�Memorandum� of� Incorporation� as� contemplated� in� the� Act,� ordinary� resolution� 4� has� been� included� to� confirm� directors’�authority�to�issue�shares.�Directors�confirm�that�there�is�no�specific�intention�to�issue�any�shares,�other�than�as�part�of�and�in�terms�of�the�rules�of�the�company’s�share�incentive�scheme,�as�at�the�date�of�this�notice.�
Also,�in�terms�of�the�JSE�Listings�Requirements,�the�authority�to�issue�shares�for�cash�as�set�out�in�ordinary�resolution�5�requires�the�approval� of� a� 75%�majority� of� the� votes� cast� by� shareholders� present� or� represented� by� proxy� at� the� annual� general�meeting� for�ordinary�resolution�number�5�to�become�effective.�
Ordinary resolution 6 – Remuneration policyThe�King�Report�on�Corporate�Governance�for�South�Africa,�2009�recommends�that�the�remuneration�philosophy�of�the�company�be�submitted� to� shareholders� for� consideration�and� for�an�advisory,�non-binding�vote� to�provide� shareholders�with�an�opportunity� to�indicate�should�they�not�be�in�support�of�the�material�provisions�of�the�remuneration�philosophy�and�policy�of�the�company.
Annual�general�meeting�–�Explanatory�notesfor the year ended February 2013

Integrated Annual Report 2013
94
Annual�general�meeting�–�Explanatory�notes�continuedfor the year ended February 2013
Ordinary resolution 7 – Signing authorityAuthority�is�required�to�do�all�such�things�and�sign�all�documents�and�take�all�such�action�as�necessary�to�implement�the�resolutions�set� out� in� the� notice� and� approved� at� the� annual� general�meeting.� It� is� proposed� that� the� company� secretary� and/or� director� be�authorised accordingly.
Special resolution 1 – Directors’ remunerationIn�terms�of�S66(8)�and�S66(9)�of�the�Companies�Act,�No�71�of�2008,�companies�may�pay�remuneration�to�directors�for�their�services�as�directors� unless� otherwise� provided� by� the�Memorandum� of� Incorporation� and� on� approval� of� shareholders� by� way� of� a� special�resolution.�Executive�directors�are�not�specifically�remunerated�for�their�services�as�directors�but�as�employees�of�the�company�and�as�such,�the�resolution�as�included�in�the�notice�requests�approval�of�the�remuneration�paid�to�non-executive�directors�for�their�services�as directors of the company.
Special resolution 2 – General authority to repurchase sharesS48�of�the�Companies�Act,�No�71�of�2008�(“the�Act”)�authorises�the�board�of�directors�of�a�company�to�approve�the�acquisition�of�its�own�shares�subject�to�the�provisions�of�S48�and�S46�having�been�met.�In�order�to�ensure�compliance�with�the�requirements�of�the�Act,�the� Listing� Requirements� of� the� JSE� Limited� and� the� provisions� of� the�Memorandum� of� Incorporation� of� the� company,� a� special�resolution�is�proposed�to�provide�authority�to�the�company�to�repurchase�its�shares.
Special resolution 3 – Financial assistance to related and inter-related companiesS45(2)� of� the� Companies� Act,� No� 71� of� 2008� (“the� Act”)� authorises� the� board� to� provide� direct� or� indirect� financial� assistance� to� a�related�or�inter-related�company,�subject�to�subsections�(3)�and�(4)�of�S45�of�the�Act�and�unless�otherwise�provided�in�the�company’s�Memorandum� of� Incorporation.� In� terms� of� S45(3)� of� the� Act,� a� special� resolution� of� shareholders� is� required� in� these� instances.� The�main�purpose�of�the�special�resolution�as�set�out�in�the�notice�of�the�meeting�is�to�approve�the�granting�of�inter-company�loans,� a�recognised�and�well�known�practice,�details�of�which�are�also�set�out�in�the�notes�to�the�annual�financial�statements.��
GeneralShareholders�and�proxies�attending�the�annual�general�meeting�on�behalf�of�shareholders�are�reminded�that�S63(1)�of�the�Companies�Act,�No�71�of�2008�requires�that�reasonably�satisfactory�identification�be�presented�in�order�for�such�shareholder�or�proxy�to�be�allowed�to attend or participate in the meeting.
Summary of the rights established in terms of section 58 of the Act as required by section 58(7)(b)For�purposes�of�this�summary,�“shareholder”�shall�have�the�meaning�ascribed�thereto�in�the�Act.
1.� �At�any�time,�a�shareholder�of�a�company�is�entitled�to�appoint�any�individual,�including�an�individual�who�is�not�a�shareholder�of�that�company,�as�a�proxy,� to�participate� in,�speak�and�vote�at�a�shareholders’�meeting�on�behalf�of� the�shareholder�or�give�or�withhold written consent on behalf of such shareholder in relation to a decision contemplated in section 60 of the Act.
2.�� �A�proxy�appointment�must�be�in�writing,�dated�and�signed�by�the�relevant�shareholder,�and�such�proxy�appointment�remains�valid�for�one�year�after�the�date�upon�which�the�proxy�was�signed�or�any�longer�or�shorter�period�expressly�set�out�in�the�appointment,�unless�it�is�revoked�in�a�manner�contemplated�in�section�58(4)(c)�of�the�Act�or�expires�earlier�as�contemplated�in�section�58(8)(d)�of the Act.
3.�� Except�to�the�extent�that�the�Memorandum�of�Incorporation�of�a�company�provides�otherwise:� 3.1� �a�shareholder�of�the�relevant�company�may�appoint�two�or�more�persons�concurrently�as�proxies,�and�may�appoint�more�than�
one�proxy�to�exercise�voting�rights�attached�to�different�securities�held�by�such�shareholder;� 3.2� �a�proxy�may�delegate�their�authority�to�act�on�behalf�of�a�shareholder�to�another�person,�subject�to�any�restriction�set�out�in�
the�instrument�appointing�the�proxy;�and� 3.3� �a�copy�of�the�instrument�appointing�a�proxy�must�be�delivered�to�the�company�or�to�any�other�person�on�behalf�of�the�relevant�
company�before�the�proxy�exercises�any�rights�of�the�shareholder�at�a�shareholders’�meeting.4.� �Irrespective�of�the�form�of�instrument�used�to�appoint�a�proxy,�the�appointment�of�the�proxy�is�suspended�at�any�time�and�to�the�
extent� that� the� shareholder�who�appointed� that�proxy�chooses� to�act�directly�and� in�person� in� the�exercise�of�any� rights�as�a�shareholder�of�the�relevant�company.
5.� �Unless�the�proxy�appointment�expressly�states�otherwise,�the�appointment�of�a�proxy�is�revocable.�If�the�appointment�of�a�proxy�is�revocable,�a�shareholder�may�revoke�the�proxy�appointment�by�cancelling�it�in�writing�or�making�a�later�inconsistent�appointment�of�a�proxy,�and�delivering�a�copy�of�the�revocation�instrument�to�the�proxy�and�the�company.
6.� �The�revocation�of�a�proxy�appointment�constitutes�a�complete�and�final�cancellation�of�the�proxy’s�authority�to�act�on�behalf�of�the�relevant�shareholder�as�of�the�later�of�the�date:�(a)�stated�in�the�revocation�instrument,�if�any;�or�(b)�upon�which�the�revocation�instrument�is�delivered�to�the�proxy�and�the�relevant�company�as�required�in�section�58(4)(c)(ii)�of�the�Act.

95
Integrated Annual Report 2013
7.� �If�the�instrument�appointing�a�proxy�or�proxies�has�been�delivered�to�the�relevant�company,�as�long�as�that�appointment�remains�in�effect,�any�notice�that�is�required�by�the�Act�or�the�relevant�company’s�Memorandum�of�Incorporation�to�be�delivered�by�such�company�to�the�shareholder,�must�be�delivered�by�such�company�to�the�shareholder�or�to�the�proxy�or�proxies,�if�the�shareholder�has�directed�the�relevant�company�to�do�so�in�writing�and�paid�any�reasonable�fee�charged�by�the�company�for�doing�so.
8.� �A�proxy�is�entitled�to�exercise�or�abstain�from�exercising�any�voting�right�of�the�relevant�shareholder�without�direction,�except�to�the�extent�that�the�Memorandum�of�Incorporation�or�the�instrument�appointing�the�proxy�provides�otherwise.
9.� �If�a�company�issues�an�invitation�to�shareholders�to�appoint�one�or�more�persons�named�by�such�company�as�a�proxy�or�supplies�a�form�of�instrument�for�appointing�a�proxy:
� 9.1� �such�invitation�must�be�sent�to�every�shareholder�who�is�entitled�to�notice�of�the�meeting�at�which�the�proxy�is�intended�to�be�exercised;
� 9.2� �the�invitation�or�form�of�instrument�supplied�by�the�relevant�company�must:�(a)�bear�a�reasonably�prominent�summary�of�the�rights�established�in�section�58�of�the�Act;�(b)�contain�adequate�blank�space,�immediately�preceding�the�name�or�names�of�any�person�or�persons�named�in�it,�to�enable�a�shareholder�to�write�in�the�name�and,�if�so�desired,�an�alternative�name�of�a�proxy�chosen�by�such�shareholder;�and�(c)�provide�adequate�space�for�the�shareholder�to� indicate�whether�the�appointed�proxy�is�to�vote�in�favour�or�against�the�applicable�resolution/s�to�be�put�at�the�relevant�meeting,�or�is�to�abstain�from�voting;
� 9.3� the�company�must�not�require�that�the�proxy�appointment�be�made�irrevocable;�and
� 9.4� �the� proxy� appointment� remains� valid� only� until� the� end� of� the� relevant� meeting� at� which� it� was� intended� to� be� used, unless�revoked�as�contemplated�in�section�58(5)�of�the�Act.
Salient datesRecord�date�for�determining�those�shareholders�entitled�to�vote�at�the�annual general meeting Friday,�16�August�2013
Last�day�to�lodge�forms�of�proxy�for�the�annual�general�meeting� By�10h00�on�20�August,�2013�

97
Integrated Annual Report 2013
TASTE HOLDINGS LIMITED(Incorporated in the Republic of South Africa)(Registration number 2000/002239/06)JSE code: TASISIN: ZAE000081162(“Taste” or “the company”)
Form of proxy for the annual general meeting of the company to be held at the company’s offices at 12 Gemini Street, Linbro Business Park, Sandton on Thursday, 22 August 2013 at 12h00 (“the annual general meeting”).Only for use by certificated shareholders, nominee companies of Central Securities Depository Participants (“CSDP”), brokers’ nominee companies and shareholders who have dematerialised their shares and who have elected own-name registration and who wish to vote on the special and ordinary resolutions per the notice of the annual general meeting to which this form is attached. Shareholders who have dematerialised their shares through a CSDP or broker must not complete this form of proxy and must provide their CSDP or broker with their voting instructions, except for shareholders who elected own-name registration in the subregister through a CSDP, which shareholders must complete this form of proxy and lodge it with Computershare Investor Services (Proprietary) Limited. Holders of dematerialised shares other than with own-name registration who wish to attend the annual general meeting, must inform their CSDP or broker of such intention and request their CSDP or broker to issue them with the necessary letter of representation.I/We (name in block letters)of (address)telephone number/sbeing the holder/s of ordinary shares in the company, do hereby appoint1. or failing him/her2. or failing him/her3. the chairperson of the annual general meeting,as my/our proxy to act for me/us and on my/our behalf at the annual general meeting of the company, or any adjournment thereof, which will be held for the purpose of considering and, if deemed fit, of passing, with or without modification, the ordinary and special resolutions as detailed in the notice of annual general meeting, and to vote for and/or against the resolutions and/or abstain from voting in respect of the ordinary shares registered in my/our name/s, in accordance with the following instructions:
Number of votes (one vote per ordinary share)
For Against AbstainOrdinary resolution 1.1 – Re-election of Mr Anthony Berman as an independent non-executive
directorOrdinary resolution 1.2 – Re-election of Mr Mr Ramsay L’amy (Bill) Daly as an independent non-
executive directorOrdinary resolution 2.1 – Election of Mr Anthony Berman as a member and chairman of the
audit committeeOrdinary resolution 2.2 – Election of Mr Mr Wessel Petrus van der Merwe as a member of the
audit committeeOrdinary resolution 2.3 – Election of Mr Sebastian Patel as a member of the audit committeeOrdinary resolution 3 – Appointment of BDO South Africa Inc as external auditorOrdinary resolution 4 – Control of authorised but unissued ordinary sharesOrdinary resolution 5 – Authority to issue unissued shares for cashOrdinary resolution 6 – Sanctioning of the remuneration policyOrdinary resolution 7 – Authority to effect the resolutionsSpecial resolution 1 – Approval of the fees payable to the non-executive directorsSpecial resolution 2 – Authority for the company to repurchase its own securitiesSpecial resolution 3 – Authority to provide financial assistance to related and inter-related
companies
Signature
Signed at on 2013
Assisted by (if applicable)
Please see notes on reverse.
Form of proxy

Integrated Annual Report 2013
98
Notes�to�the�form�of�proxy
1.� �Each�shareholder�is�entitled�to�appoint�one�or�more�proxies�(none�of�whom�need�be�a�shareholder�of�the�company)�to�attend,�speak�and�vote�in�place�of�that�shareholder�at�the�annual�general�meeting.
2.� �Shareholder(s)�that�are�certificated�or�own-name�dematerialised�shareholders�may�insert�the�name�of�a�proxy�or�the�names�of�two�alternative�proxies�of�the�member’s�choice�in�the�space/s�provided,�with�or�without�deleting�“the�chairperson�of�the�meeting”,�but�any�such�deletion�must�be�initialled�by�the�shareholder(s).�The�person�whose�name�stands�first�on�the�form�of�proxy�and�who�is�present�at�the�annual�general�meeting�will�be�entitled�to�act�as�proxy�to�the�exclusion�of�those�whose�names�follow.�If�no�proxy�is�named�on�a�lodged�form�of�proxy,�the�chairperson�shall�be�deemed�to�be�appointed�as�the�proxy.
3.� �A� shareholder’s� instructions� to� the� proxy� must� be� indicated� by� the� insertion� of� the� relevant� number� of� votes� exercisable� by� the�shareholder�in�the�appropriate�box�provided.�Failure�to�comply�with�the�above�will�be�deemed�to�authorise�the�proxy,�in�the�case�of�any�proxy�other�than�the�chairperson,�to�vote�or�abstain�from�voting�as�deemed�fit�and�in�the�case�of�the�chairperson�to�vote�in�favour�of the resolution.
4.� �A�shareholder�or�his/her�proxy� is�not�obliged�to�use�all�the�votes�exercisable�by�the�shareholders,�but�the�total�of�the�votes�cast�or�abstained�from�may�not�exceed�the�total�of�the�votes�exercisable�in�respect�of�the�shares�held�by�the�shareholder.
5.� �Forms� of� proxy�must� be� lodged� at� or� posted� to� Computershare� Investor� Services� (Pty)� Limited,� Ground� Floor,� 70�Marshall� Street,�Johannesburg,�2001�(PO�Box�61051,�Marshalltown,�2107),�to�be�received�no�later�than�10h00�on�20�August�2013.
6.� �The�completion�and�lodging�of�this�form�of�proxy�will�not�preclude�the�relevant�shareholder�from�attending�the�annual�general�meeting�and�speaking�and�voting�in�person�thereat�to�the�exclusion�of�any�proxy�appointed�in�terms�hereof,�should�such�shareholder�wish�to�do�so.�Where�there�are�joint�holders�of�shares,�the�vote�of�the�first�joint�holder�who�tenders�a�vote,�as�determined�by�the�order�in�which�the�names�stand�in�the�register�of�members,�will�be�accepted.
7.� �The�chairperson�of�the�annual�general�meeting�may�reject�or�accept�any�form�of�proxy�which�is�completed�and/or�received�otherwise�than�in�accordance�with�these�notes,�provided�that,�in�respect�of�acceptances,�the�chairperson�is�satisfied�as�to�the�manner�in�which�the�shareholder�concerned�wishes�to�vote.
8.� �Documentary�evidence�establishing�the�authority�of�a�person�signing�this�form�of�proxy�in�a�representative�capacity�must�be�attached�to�this�form�of�proxy�unless�previously�recorded�by�the�company�or�Computershare�Investor�Services�(Pty)�Limited�or�waived�by�the�chairperson of the annual general meeting.

Group at a glance
Food division
Taste’s food franchise division consists of the Scooters Pizza, Maxi’s, St Elmo’s and The Fish and Chip Co. brands (528 outlets)5. The portfolio of brands now targets consumers from LSM 4 – 10, each with strong value propositions and continuous product and promotional innovation.• Maxi’s (70 outlets) – An award-winning casual-dining restaurant format
serving breakfast, lunch and dinner. It competes in the same competitive set as Wimpy, Dulce and Mugg & Bean and is focused on adding value to consumers through a superior quality food offering; evolving promotions and contemporary appeal.
• Scooters Pizza (136 outlets) – The second-largest pizza delivery chain in South Africa. It competes in the same category as Debonairs Pizza, Romans Pizza and Pizza Perfect, focusing on delivery leadership and value for money; communicated in a brand that has attitude and humour.
• St Elmo’s (26 outlets) – This 26-year old brand has the Western Cape as its stronghold. Its premium pizza offering, supported through its Woodfired cooking method and diverse menu, distinguish this brand within the pizza category.
• The Fish and Chip Co. (296 outlets) – The largest take-away fish brand in South Africa by units. It competes in the same category as Old Fashioned Fish and Chips, focusing on good quality, affordable food. The low set-up costs make the brand the fastest growing mainstream franchise in South Africa.
Scooters Pizza – TakeawayMaxi’s – Restaurant – TakeawaySt Elmo’s – Restaurant – TakeawayThe Fish and Chip Co. – Takeaway
R850 000 – R950 000R1.8 million – R2.3 millionR850 000 – R1.3 millionR2.5 millionR950 000R483 000
Jewellery division
7%6%6%7%7%R550 ex VAT per week
NWJ (77 outlets)5 is the only vertically integrated, franchised jewellery chain in South Africa. It owns and operates approximately 23% of the outlets; provides franchise services to its franchisees; and distributes 100% of the goods sold through the NWJ outlets. Of these goods sold approximately 40% is produced by the in-house manufacturing facility. NWJ competes with American Swiss, Galaxy and Sterns and is the second-largest chain in South Africa by advertising spend; and the third-largest by sales and outlets. It competes on demonstrable value, guaranteed quality and a wide range.
As the only vertically integrated and franchised jewellery chain, it has a structural competitive difference in its competitive set. This allows for in-house innovation; fast routes to markets; and greater control over input costs. The franchise model empowers owners to attract and retain customers; produces large marketing funds and capital for growth is provided by franchisees.
nWJ
FOOD SERVICES
The food services division currently manufactures all pizza sauces, bastings and table sauces for all the brands within the food franchise division, as well as selected external customers. It does so from a SABS HACCP2 accredited facility located in Cape Town. Furthermore, it manufactures pizza toppings and other value-added meat products from a manufacturing facility in Pretoria which will be HACCP2 accredited in the future. It warehouses and distributes to over 500 franchises through two depots located in Johannesburg and Cape Town.
5%4%4%5%5% R550 ex VAT per week
90 m2 – 100 m2
180 m2 – 250 m2
40 m2 – 100 m2
250 m2 – 400 m2
80 m2 – 100 m2 60 m2 – 100 m2
MANuFACTuRING AND DISTRIBuTION
As a vertically integrated chain this division is responsible for group procurement, styling and design and distribution to franchisees. As the second-largest jewellery group in South Africa the group is able to source large volumes at lowest cost from both within and outside South Africa. Combined with in-house manufacturing this gives the group merchandise flexibility and relatively short lead times. The group owns a number of brands which it retails through its national network, spanning watches, male jewellery and gold products. All ring designs are conceptualised in-house and the group has more than 10 000 ring moulds and designs.
R1 450 000 5% 4% 60 m2
Notes:1. LSM – “Living standards measure”.2. HACCP – “Hazard Analysis Critical Control Point System”.3. This is approximate and excludes VAT.4. This is based on a percentage of turnover.5. All store numbers as at 31 May 2013.
EMPLOyEES
• Number of employees – 196.
EMPLOyEES
• Number of employees – 254.
www.nwj.co.za
HIGHLIGHTS • System-wide sales exceed
R1billion for the division, an increase of 70%.
• Same-store sales increase of re-imaged Scooters Pizza and St Elmo’s outlets.
• The Fish and Chip Co. exceed 300 outlets.
STRATEGIC PRIORITIES
• Plan to expand into two new sub-equatorial African countries.
• Improve same-store sales.• Revamp Scooters Pizza.
HIGHLIGHTS• Same-store sales for corporate
stores exceed 14% for the year.• Voted 1st place in the “Daily News
your Choice Awards” and 2nd place in the Times and sowetan Retail Awards for 2012.
• Launched NWJ-branded credit offering through a third party credit provider.
STRATEGIC PRIORITIES
• To focus on improving franchisees ability to mimic corporate store performance.
• New store growth.
SEGMENTAL INFORMATIONSegment revenue
% change
28 February 2013
ReviewedR’000
29 February 2012
AuditedR’000
Food 152 315 329 125 121Franchise 131 388 74 965Food services 183 681 47 679Retail 260 2 477
Segment operating profit
Food 22 30 944 25 428Franchise 30 735 22 479Food services 893 3 577Retail (684) (628)
Segment assets
Food 179 690 168 891Franchise 106 234 99 939Food services 73 316 67 553Retail 140 1 399
SEGMENTAL INFORMATIONSegment revenue
% change
28 February 2013
ReviewedR’000
29 February 2012
AuditedR’000
Jewellery 10 198 665 180 872Franchise and wholesale 121 484 123 946Retail 77 181 56 844Concession retail – 82
Segment operating profit
Jewellery 24 28 655 23 097Franchise and wholesale 10 404 13 778Retail 18 251 9 333Concession retail – (14)
Segment assets
Jewellery 116 241 99 511Franchise and wholesale 65 683 62 919Retail 50 558 36 592Concession retail – –
Country of incorporation and domicile South Africa
nature of business and principal activities The main object of the company is to carry on business as restaurateurs and franchisors.
Directors Carlo Ferdinando GonzagaDuncan John CrossonJay Bayne CurrieKevin UtianHylton Roy RabinowitzLuigi GonzagaRamsay L’Amy DalyEvangelos TsatsarolakisAnthony BermanWessel Petrus van der Merwe Sebastian Patel
Registered office 12 Gemini streetLinbro Business Parksandton2065
Business address 12 Gemini streetLinbro Business Parksandton2065
Postal address PO Box 1125FerndaleRandburg2160
Auditors BDO South Africa IncorporatedChartered Accountants (SA)Registered Auditors
secretary Monika Pretorius
Company registration number 2000/002239/06
Administration
Mid
nigh
t St
ar
Set-up cost3 Royalty4 Marketing fund contribution4 Average store size
Set-up cost3 Royalty4 Marketing fund contribution4 Average store size
iFC Group at a glance
1 Financial highlights
2 Seven-year review
4 Directorate
6 Executive committee
9 Store distribution
10 Business model
11 Investment proposition
14 Chairman’s report
15 Chief Executive Officer’s report
20t Performance
28 Corporate governance
37 Annual financial statements
iBC Administration
Contents
Divisional contribution to group
Revenue
Jewellery franchise and wholesale
Food franchise
Food services
Jewellery retail
24%
25%36%
15%
Operating profit
Jewellery franchise and wholesale
Food retail
Food franchise
Food services
Jewellery retail
17%
52%
1%
31% (1%)
System-wide sales
Food
Jewellery retail
81%
19%
Number of stores
Pizza
Maxi’s
FCC
nWJ
27%
12%49%
13%