Groundwater is more sustainable than surface water in India!
13
GROUNDWATER IS MORE SUSTAINABLE THAN SURFACE WATER IN INDIA! Dr. R. Jagadiswara Rao Professor of Geology Retired, Sri Venkateswara University, Tirupati, Andhra Pradesh 517502, India Email: [email protected] ; Mobile: +91-944-018-4012 & +91-986-693-6499 Based on the factual data collected by three premier Central Government Organisations summarised below, I conclude that groundwater is more sustainable than surface water in India. WORK OF THE CENTRAL GROUND WATER BOARD (CGWB): According to the CGWB, the annual replenishable groundwater resources of India as on 31 March 2009 was obtained as 431.03 billion cubic metres (bcm) by summing up recharge from rainfall and other sources in monsoon and non-monsoon seasons. Annual groundwater draft was obtained as 243.32 bcm by summing up draft from irrigation and domestic/industrial uses. On subtracting one figure from the other, the unutilised groundwater is obtained as 187.71 bcm (Table 1). For the purpose of calculating the stage of groundwater, the CGWB has recognised a portion of unutilised groundwater as “Natural discharge during non-monsoon season” for adding to the groundwater draft. The stage of groundwater development given in Table 1 is obtained as the percent groundwater draft for all uses to the annual groundwater available. As such, their values are a little lower than those obtained by the CGWB. TABLE 1: STATE-WISE GROUND WATER RESOURCES (GW) AVAILABILITY, UTILIZATION AND STAGE OF GROUNDWATER DEVELOPMENT IN INDIA (States arranged in the order of decreasing stage of GW development) (http://cgwb.gov.in/documents/Dynamic%20GW%20Resources%20-2009.pdf ) State/Union Territory Annual GW available (bcm) GW Draft for all uses (bcm) Unused GW (bcm) 1 Stage of GW Development% 2 Punjab 22.56 34.66 -12.1 154 Delhi 0.31 0.40 -0.09 129 Rajasthan 11.86 14.52 -2.66 122 Haryana 10.48 12.43 -1.95 119 Daman & Diu 0.012 0.011 0.001 91.7 Puducherry 0.171 0.150 0.021 87.7 Tamil Nadu 22.94 16.56 6.38 72.2 Gujarat 18.43 12.99 5.44 70.5 Uttar Pradesh 75.25 49.48 25.77 65.8 Karnataka 16.81 10.01 6.8 59.5 India as a whole 431.03 243.32 187.71 56.5 Madhya Pradesh 33.95 17.99 15.96 53.0 Himachal Pradesh 0.59 0.31 0.28 52.5 Uttarakhand 2.17 1.05 1.12 48.4 Maharashtra 35.73 16.95 18.78 47.4 Kerala 6.62 2.81 3.81 42.4 Andhra Pradesh 1 33.83 14.15 19.68 41.8
-
Upload
svuniversity -
Category
Documents
-
view
0 -
download
0
Transcript of Groundwater is more sustainable than surface water in India!

GROUNDWATER IS MORE SUSTAINABLE THAN SURFACE WATER IN INDIA!
Dr. R. Jagadiswara Rao
Professor of Geology Retired, Sri Venkateswara University, Tirupati, Andhra Pradesh 517502, India
Email: [email protected]; Mobile: +91-944-018-4012 & +91-986-693-6499
Based on the factual data collected by three premier Central Government Organisations summarised
below, I conclude that groundwater is more sustainable than surface water in India.
WORK OF THE CENTRAL GROUND WATER BOARD (CGWB):
According to the CGWB, the annual replenishable groundwater resources of India as on 31 March 2009
was obtained as 431.03 billion cubic metres (bcm) by summing up recharge from rainfall and other
sources in monsoon and non-monsoon seasons. Annual groundwater draft was obtained as 243.32 bcm
by summing up draft from irrigation and domestic/industrial uses. On subtracting one figure from the
other, the unutilised groundwater is obtained as 187.71 bcm (Table 1). For the purpose of calculating
the stage of groundwater, the CGWB has recognised a portion of unutilised groundwater as “Natural
discharge during non-monsoon season” for adding to the groundwater draft. The stage of groundwater
development given in Table 1 is obtained as the percent groundwater draft for all uses to the annual
groundwater available. As such, their values are a little lower than those obtained by the CGWB.
TABLE 1: STATE-WISE GROUND WATER RESOURCES (GW) AVAILABILITY, UTILIZATION
AND STAGE OF GROUNDWATER DEVELOPMENT IN INDIA
(States arranged in the order of decreasing stage of GW development)
(http://cgwb.gov.in/documents/Dynamic%20GW%20Resources%20-2009.pdf)
State/Union Territory Annual GW
available (bcm)
GW Draft for all
uses (bcm)
Unused GW
(bcm)1
Stage of GW
Development%2
Punjab 22.56 34.66 -12.1 154
Delhi 0.31 0.40 -0.09 129
Rajasthan 11.86 14.52 -2.66 122
Haryana 10.48 12.43 -1.95 119
Daman & Diu 0.012 0.011 0.001 91.7
Puducherry 0.171 0.150 0.021 87.7
Tamil Nadu 22.94 16.56 6.38 72.2
Gujarat 18.43 12.99 5.44 70.5
Uttar Pradesh 75.25 49.48 25.77 65.8
Karnataka 16.81 10.01 6.8 59.5
India as a whole 431.03 243.32 187.71 56.5
Madhya Pradesh 33.95 17.99 15.96 53.0
Himachal Pradesh 0.59 0.31 0.28 52.5
Uttarakhand 2.17 1.05 1.12 48.4
Maharashtra 35.73 16.95 18.78 47.4
Kerala 6.62 2.81 3.81 42.4
Andhra Pradesh1
33.83 14.15 19.68 41.8

Bihar 28.63 11.36 17.27 39.7
West Bengal 30.50 10.91 19.59 35.8
Chhattisgarh 12.22 3.60 8.62 29.5
Jharkhand 5.96 1.61 4.35 27.0
Lakshdweep 0.0105 0.0026 0.0079 24.8
Orissa 17.78 4.36 13.42 24.5
Goa 0.221 0.044 0.177 19.9
Assam 30.35 6.026 24.324 19.9
Jammu & Kashmir 3.70 0.73 2.97 19.7
Dadara & Nagar Haveli 0.059 0.009 0.05 15.3
Tripura 2.97 0.16 2.81 5.39
Andaman & Nicobar 0.310 0.011 0.299 3.55
Sikkim
0.46 0.010 0.45 2.17
Nagaland 0.42 0.008 0.412 1.90
Mizoram 0.044 0.0004 0.0436 0.91
Manipur 0.44 0.0040 0.436 0.91
Meghalaya 1.2343 0.0017 1.2326 0.14
Arunachal Pradesh 4.45 0.003 4.447 0.07
Chandigarh 0.022 0.0002 0.022 0.00 1Includes Telangana State formed on 2
nd Jun 2014
2 CGWB considers draft as zero on the basis the entire groundwater pumped is from confined aquifers
It is an established fact that any unutilised surface water on land has to join sea as surface/flood runoff.
In the same way, there is no other go for any unutilised groundwater except to join ultimately sea all
along the coast with over 90% leaving as base flow and underground runoff beneath rivers. The flow
rate of groundwater joining the sea is so slow that it could be harnessed more easily for human use by
taking advantage of the enormous storage capacity of groundwater in the underground natural
reservoirs. In contrast to this, surface water has to be stored in manmade reservoirs of varying sizes
resulting in submergence of forestland, cultivated land and human settlements leading to various
conflicts and environmental degradation. The work of the Environmental Engineering Division of
Department of Chemical Engineering of Indian Institute of Technology, Chennai with a project funded by
the Ministry of Urban Development of Govt of India during 1989-1992 has revealed that shallow fresh
groundwater flows all along the sea coast all the time at a rate of 4 to 30 cubic metres (m3) a day per
metre-width of sea coast accounting to a total of around 16 billion cubic metres (bcm) or km3 per year
along the entire Indian coast other than that joining through rivers. Millions of years of accumulation of
a portion of such groundwater that could not directly mix with seawater owing to lying beneath
confining clay formations account for the source of massive aquifers under the sea discovered recently
(http://www.scientificamerican.com/article/massive-aquifers-under-the-sea-could-sate-thirst/).
Based on the stage of groundwater development (SGD), the CGWB has classified states as safe when
SGD is not more than 70%, semi-critical when not more than 90%, critical when not more than 100% and
over-exploited when more than 100%. With an SGD of 56.5%, India as a whole still falls under safe
category with 10 states having higher SGD and the rest lower SGD. When the State/Union Territory is
taken as unit, 29 states (including Telangana) fall under safe category, Gujarat, Tamil Nadu and
Puduchhery under semi-critical category, Daman & Diu under critical category, and Haryana, Rajasthan,

Delhi and Punjab under overexploited category. Of the total assessed units of 5723 in the country, the
stage of groundwater development is safe in 71.3% units, semi-critical in 9.6% units, critical in 3.9%
units, and overexploited in 14.7% units with 0.5% units having water-quality problems. Even in the
overexploited states and units, the entire command area irrigated by surface water and some areas
under non-command areas have safe stage of groundwater development. This data dispels the oft-
repeated slogan that there is overexploitation of groundwater in India.
For formulating any irrigation project based on surface water, 75% dependable yield is necessary. That
means, the project is cleared if adequate water is available at least three out of four years. This is true
even with the recently-sanctioned Polavaram Irrigation Project to benefit both Andhra Pradesh and
Telangana as a Central project. Andhra Pradesh and Telangana have been already executing many
irrigation projects in the Krishna river basin with 50% dependable yield, meaning assured water
availability at least once in two years. Unlike this, groundwater development in areas falling under safe,
semi-critical and critical categories have 100% dependable yield. This dispels the oft-repeated statement
that construction of major irrigation reservoirs alone can make India to overcome water shortages.
WORK OF THE DEPARTMENT OF AGRICULTURE AND COOPERATION (DAC):
Year-wise data collected by the Department of Agriculture and Cooperation (DAC) of the Ministry of
Agriculture on state-wise net and gross areas irrigated by surface and groundwater resources from
1950-51 to 2010-11 is given in Table 2. The percent net area irrigated by groundwater to that irrigated
by the sum of surface and ground waters was 29% in 1950-51 and gradually increased to 61% in 2010-
11. Despite spending enormous amounts on the construction and maintenance of tanks and reservoirs,
there has been a gradual reduction in the use of surface water and a gradual increase in the use of
groundwater for irrigation. This indicate the unsustainable nature of surface water and sustainable
nature of groundwater.
TABLE 2: YEAR-WISE NET & GROSS AREAS IRRIGATED FROM SOURCES OF SURFACE AND
GROUND WATERS IN INDIA (Million Hectares)
(http://eands.dacnet.nic.in/LUS-2010-11/All-India-3.pdf)
Year
Irrigated by Surface Water Sources
Irrigated by
Groundwater
Net Area
Irrigated
Gross
Area
Irrigated
% Net
Area
Irrigated
by GW Canals Tanks Lift irrigation Total
1950-51 8.30 3.61 2.97 14.88 5.98 20.85 22.56 29
1951-52 8.68 3.49 2.36 14.53 6.52 21.05 23.18 31
1952-53 8.86 3.30 2.44 14.60 6.52 21.12 23.31 31
1953-54 8.86 4.23 2.10 15.18 6.69 21.87 24.36 31
1954-55 9.07 4.03 2.27 15.36 6.73 22.09 24.95 30
1955-56 9.39 4.42 2.21 16.02 6.74 22.76 25.64 30
1956-57 9.27 4.49 2.20 15.97 6.57 22.53 25.71 29
1957-58 9.65 4.54 2.15 16.34 6.82 23.16 26.63 29
1958-59 9.67 4.76 2.29 16.72 6.69 23.40 26.95 29
1959-60 10.11 4.63 2.21 16.95 7.08 24.04 27.45 29
1960-61 10.37 4.56 2.44 17.37 7.29 24.66 27.98 30

1961-62 10.50 4.61 2.42 17.53 7.35 24.88 28.46 30
1962-63 10.83 4.78 2.40 18.02 7.65 25.67 29.45 30
1963-64 11.02 4.60 2.48 18.10 7.78 25.89 29.71 30
1964-65 11.22 4.78 2.52 18.53 8.08 26.60 30.71 30
1965-66 10.96 4.26 2.48 17.69 8.65 26.34 30.90 33
1966-67 11.25 4.42 2.04 17.71 9.20 26.91 32.68 34
1967-68 11.24 4.49 2.35 18.08 9.11 27.19 33.21 34
1968-69 11.89 3.93 2.39 18.21 10.80 29.01 35.48 37
1969-70 12.61 4.06 2.36 19.02 11.18 30.20 36.97 37
1970-71 12.84 4.11 2.27 19.22 11.89 31.10 38.20 38
1971-72 13.12 3.73 2.42 19.27 12.28 31.55 38.43 39
1972-73 13.00 3.62 2.26 18.87 12.96 31.83 39.06 41
1973-74 13.07 3.90 2.30 19.26 13.28 32.55 40.28 41
1974-75 13.51 3.54 2.42 19.48 14.23 33.71 41.74 42
1975-76 13.79 3.97 2.39 20.15 14.44 34.59 43.36 42
1976-77 13.86 3.90 2.30 20.06 15.09 35.15 43.55 43
1977-78 14.58 3.90 2.48 20.96 15.58 36.55 46.08 43
1978-79 15.15 3.94 2.54 21.63 16.43 38.06 48.31 43
1979-80 14.77 3.48 2.41 20.66 17.86 38.52 49.21 46
1980-81 15.29 3.18 2.55 21.03 17.70 38.72 49.78 46
1981-82 15.95 3.38 2.44 21.77 18.74 40.50 51.41 46
1982-83 16.19 2.94 2.22 21.34 19.35 40.69 51.83 48
1983-84 16.76 3.53 2.26 22.56 19.39 41.95 53.82 46
1984-85 16.28 3.02 2.46 21.75 20.39 42.15 54.53 48
1985-86 16.18 2.77 2.50 21.45 20.42 41.87 54.28 49
1986-87 16.50 2.68 2.58 21.75 20.82 42.57 55.76 49
1987-88 15.75 2.52 2.83 21.10 21.80 42.89 56.04 51
1988-89 17.10 3.00 2.84 22.93 23.21 46.15 61.13 50
1989-90 17.12 2.94 2.75 22.82 23.89 46.70 61.85 51
1990-91 17.45 2.94 2.93 23.33 24.69 48.02 63.20 51
1991-92 17.79 2.99 3.05 23.83 26.04 49.87 65.68 52
1992-93 16.99 3.18 3.21 23.38 26.92 50.30 66.76 54
1993-94 17.14 3.17 3.44 23.74 27.60 51.34 68.25 54
1994-95 17.28 3.28 3.53 24.09 28.91 53.00 70.65 55
1995-96 17.12 3.12 3.47 23.71 29.70 53.40 71.35 56
1996-97 17.11 2.82 3.39 23.32 31.80 55.11 76.03 58
1997-98 17.40 2.60 3.11 23.10 32.11 55.21 75.67 58
1998-99 17.31 2.80 3.33 23.44 34.00 57.44 78.67 59
1999-00 17.44 2.54 2.91 22.89 34.64 57.53 79.22 60
2000-01 16.01 2.47 2.91 21.39 33.82 55.21 76.19 61
2001-02 15.20 2.20 4.34 21.74 35.20 56.94 78.37 62

2002-03 14.07 1.81 3.66 19.54 34.36 53.90 73.06 64
2003-04 14.46 1.92 4.30 20.67 36.39 57.06 78.04 64
2004-05 14.77 1.73 7.54 24.04 35.19 59.23 81.08 59
2005-06 16.72 2.08 5.97 24.77 36.07 60.84 84.28 59
2006-07 17.03 2.08 6.00 25.10 37.64 62.75 86.75 60
2007-08 16.75 1.97 6.11 24.83 38.36 63.19 88.06 61
2008-09 16.88 1.98 6.02 24.88 38.76 63.64 88.90 61
2009-10 14.98 1.59 7.01 23.58 38.36 61.94 85.09 62
2010-11 15.67 2.00 6.87 24.54 39.06 63.60 89.36 61
WORK OF THE MINISTRY OF WATER RESOURCES:
The Ministry of Water Resources of Govt of India has been taking up periodically minor irrigation census
on the gross land irrigated by minor irrigation sources from all over India using both surface water and
groundwater resources since a long time. Information on major and medium irrigation projects is
however not collected during this census. Unlike surface water resources restricted to some places only,
groundwater is dispersed to very large number of places. According to the 4th
minor irrigation census
(2006-07), there are around 19.8 million wells of various categories irrigating a gross land of over 57
million ha with an average yield per well of 1.7 ha for dug wells, 3.5 ha for shallow bore/tube wells, 5.8
ha for deep bore/tube wells and a mean of 2.8 ha for all types of wells (Table 3). Compared to USA
where mean discharge of irrigation wells is 500,000 cu m/well/year , irrigation wells in India have a
mean discharge 60 times less than that because the irrigation wells in India are tailored just to meet the
irrigation needs of the farmers’ small holdings. This wastage of constructing enormous number of low-
yielding wells can be avoided by constructing lesser number of high-yielding wells for equitable water
distribution to the multitude of small and marginal farmers.
Table 3 gives the state-wise gross land in hectares irrigated by groundwater in every sq km of land
arranged in descending order. It is seen that Punjab tops all other states with extreme groundwater
overexploitation, while several states particularly in the North East exploiting little or no groundwater.
While discouraging states such as Punjab from intensifying groundwater exploitation, a vigorous
campaign is necessary in most states for taking up intensive groundwater exploitation.
TABLE 3: STATE-WISE GROSS LAND IRRIGATED BY GROUNDWATER
(States arranged in the order of decreasing gross land irrigated by GW)
http://micensus.gov.in/index.html
State
Geographical Area
(sq km)
Gross GW Irrigated
Land (ha)
Gross Land Irrigated by GW in
ha/sq km of Geographical Area
Punjab 50,362 7,350,965 146.0
Uttar Pradesh 240,928 19,950,184 82.8
Haryana 44,212 2,385,075 53.9
Delhi 1,483 57,732 38.9
Bihar 94,163 3,241,997 34.4
West Bengal 88,752 2,456,718 27.7

Tamil Nadu 130,058 3,182,131 24.5
Madhya Pradesh 308,245 6,697,419 21.7
Gujarat 196,024 4,164,524 21.2
India as a whole 3,287,245 57,121,888 17.4
Rajasthan 342,239 5,851,024 17.1
Chandigarh 114 1,931 16.9
Maharashtra 307,713 4,640,790 15.1
Puducherry 479 6,287 13.1
Andhra Pradesh 275,045 3,406,682 12.4
Karnataka 191,791 1,702,061 8.87
Uttarakhand 53,483 343,974 6.43
Chhattisgarh 135,191 851,489 6.30
Dadra & Nagar Haveli 491 2,164 4.41
Assam 78,438 244,216 3.11
Kerala 38,863 113,720 2.93
Odisha 155,707 365,113 2.34
Jharkhand 79,714 172,906 2.17
Goa 3,702 5,055 1.37
Tripura 10,486 10,913 1.04
Himachal Pradesh 55,673 43,539 0.78
Andaman & Nicobars 8,249 1,166 0.14
Jammu & Kashmir 222,236 10,011 0.05
Meghalaya 22,429 853 0.04
Nagaland 16,579 175 0.01
Arunachal Pradesh 83,743 168 0.002
Manipur 22,327 0 0
Mizoram 21,081 0 0
Sikkim 7,096 0 0
Daman & Diu 112 0 0
Lakshadweep 37 0 0
NEED FOR CONJUNCTIVE USE OF SURFACE WATER AND GROUNDWATER TO ACHIEVE WATER
SECURITY:
Although the factual data collected by the three premier Central Government Organisations point out
that groundwater development is more sustainable than surface water development, this does not
mean that surface water is not important. It is only because of rainwater and surface water,
groundwater gets recharged. By taking advantage of the enormous storage capacity of the naturally-
occurring dynamic and static groundwater reservoirs in the underground, the large surface water
available through rainwater could be put to effective use for recharging groundwater. When
groundwater is overexploited, natural recharge or conventional methods of recharging groundwater will
not be adequate. It is necessary to emulate developed countries such as USA and Australia who have

taken up Managed Aquifer Recharge (MAR)/Aquifer Storage and Recovery (ASR) methods on an
intensive scale to recharge deep groundwater through deep bore (tube) wells.
OUR WORK ON WATER-RESOURCES DEVELOPMENT:
As part of a training programme for students, unemployed post-graduate degree holders, research
scholars, and less-educated youth being trained as barefoot scientists, we in the Department of Geology
of Sri Venkateswara University have taken up detailed geological, hydrological, geophysical, and
exploratory drilling/boring studies on water resources development in a cost-effective manner since
1965 to prove the availability of water of adequate quality and quantity besides taking up investigation,
design formulation, and supervision of construction of high-yielding wells for all those seeking our
expertise. Figure 1 is a high-yielding well constructed near Tirupati in a semiarid tract way back in 1974.
Figure 1: A high-yielding shallow infiltration well being constructed in the Swarnamukhi Riverbed under our supervision at
Gazulamandyam Industrial Development Area of A.P. Industrial Infrastructure Corporation Ltd near Tirupati in 1974. Water
from the well under construction had to be pumped using four centrifugal pumps to enable well diggers to deepen the well
manually. With the construction of a dam across Kalyani River, a tributary of Swarnamukhi River in the upstream in 1977,
there has been however substantial reduction in the well’s yield. We have been subsequently associated with T. Damadora
Rao of Tamilnadu Water Supply and Drainage (TWAD) Board in the improved design of high-yielding shallow wells fitted with
specially-made permeable blocks in riverbeds and radial collector wells fitted with specially-made permeable capsules to
exploit fresh water floating on seawater in coastal areas without saline water intrusion.
Although construction of wells of right design at right places is a specialised art requiring scientific
inputs, this is not understood by most groundwater users. They just construct wells where they need
water. When enough or no water comes, the NGOs make a big hue and cry that groundwater
overexploitation was responsible for well failure and demand for banning of groundwater exploitation.
The truth however is that well failures in most cases are not because of overexploitation of
groundwater, but because of constructing wells at wrong sites with wrong design. Failure to understand

the importance of scientific methods of groundwater exploration and development has led to enormous
wastage and inefficiency in well-sinking operations with occasional suicide deaths by farmers who got
into debt trap due to construction of too many dry wells. Had the well users provided with proper
scientific advice on well-site selection and well design, enormous wastage caused by faulty well-
construction could be avoided. There is urgent need to prepare large-scale maps of all parts of India
showing locations of all existing wells which are high-yielding, low-yielding, dry and abandoned due to
various reasons, and locations of sites suitable and unsuitable for well construction. If such maps are
made available in the public domain and well users are educated to make use of those maps effectively
in well citing and sinking, the enormous wastage being incurred in faulty well sinking operations could
be reduced to a great extent.
Concerned with the high failure rate of drinking-water wells constructed by the State Government
Departments to provide drinking water, the Ministry of Drinking Water and Sanitation has hired the
services of the National Remote Sensing Centre (NRSC), earlier called National Remote Sensing Agency
(NRSA), with funds made available by the Rajiv Gandhi National Drinking Water Mission (RGNDWM), to
prepare groundwater prospects maps using remote sensing and several other methods for selection of
well sites besides constructing artificial-recharge structures for groundwater on a scale of 1:50,000. For
the benefit of all groundwater users, these maps are now made available at
http://www.mdws.gov.in/node/2623 and http://www.indiawaterportal.org/articles/ministry-drinking-
water-and-sanitation-and-national-remote-sensing-agency-release.
One major limitation with these groundwater prospects maps is that they are prepared from satellite
images captured by Indian Remote Sensing (IRS) satellites with a coarse spatial resolution of 23.5 m.
Although these maps are quite useful to obtain a broad idea of the groundwater conditions of any area,
their coarse scale does not allow for using them to distinguish sites favourable and sites unfavourable
for well construction. There is a need to prepare large-scale groundwater prospects maps by making use
of the satellite images captured by DigitalGlobe – which took over GeoEye to become the only
commercial provider selling high-resolution satellite images of the entire world including India with a
resolution of as high as 0.5/0.25 m. With the ready availability of these high-resolution images in the
Google Earth public domain, hope has come now to evolve improved methods of pinpointing sites for
high-yielding wells with high success rate in a highly cost-effective manner. We have already made a
beginning in this direction in select places right from Bhutan in the north to Tirunelveli District of
Tamilnadu in the south by mapping all categories of existing wells including successful wells, dry wells
and abandoned wells together with locations of favourable and unfavourable sites arrived at through
remote sensing, geological, hydrological and geophysical studies. Some of our works have been
illustrated in Figures 2 to 10.

Figure 2: A Google Earth image on a scale of 1:5400 captured by DigitalGlobe satellite on 30 Nov 2011 showing a specially-
designed high-yielding shallow well constructed by Mr. T. Vedadri s/o Mr. T. Damadora Rao of the TWAD Board of Chennai in
1987 in the bed of the Tungabhadra River under our supervision to make water supply of M/s. Sree Rayalaseema Alkalis &
Allied Chemicals Pvt. Ltd, at Kurnool sustainable.
Figure 3: A Google Earth image on a scale of 1:3600 captured by DigitalGlobe satellite on 27 Aug 2010 showing construction
of rainwater harvesting structures and a specially-designed shallow well constructed by Mr. T. Vedadri under our supervision
in the beverages plant of M/s. Hindustan Coca-Cola Beverages Pvt. Ltd (HCCBPL), Sri Kalahasti. Despite intensive pumping of
groundwater in the vicinity, the rainwater harvesting structures along the eastern border of the factory remained perennial
due to lying along a buried river flowing in a northeast direction.

Figure 4: A Google Earth image on a scale of 1:6100 showing an 80-acre plot of Sai Gardens in Kesampet Mandal,
Mahaboobnagar District, Telangana captured by GeoEye satellite on 4 Apr 2012. The farm could get additional
water through construction of a productive well selected close to a dry bore well. To further enhance water
availability, recharge of deep groundwater by the Aquifer Storage & Recovery (ASR) method has been
advocated. The method consists in forcing surface water filtered through an assemblage of permeable capsules
to recharge an existing deep bore well.
Figure 5: A Google Earth image on a scale of 1:4100 showing a spinning mill in Balanagar Mandal, Mahaboobnagar District,
Telangana, once facing water shortages, has now enough water by adopting our recommendations for sinking bore wells and
construction of check dams at potential sites away from the factory.

Figure 6: A Google Earth image on a scale of 1:4500 captured by GeoEye satellite on 5 Oct 2012 showing a posh locality of
Sadashiva Nagar in Bangalore showing the location of a Problem Bore Well of a builder discharging excessive silty water
during drilling. Apart from helping him to obtain silt-free water from the bore well, our work has helped in the location of a
sand-bearing buried stream flowing in a northeast direction from Sankey Tank through an abandoned dug well close to the
Problem Bore Well. The builder now gets adequate water from the renovated dug well as well as the bore well.
Figure 7: A Google Earth image on a scale of 1:1000 showing a close-up view of Figure 6.

Figure 8: A Google Earth image on a scale of 1:6900 captured by DigitalGlobe satellite on 27 Nov 2012 showing an area in
Pasakha, Bhutan occupied by Bhutan Silicon Metal Pvt. Ltd (BSMPL) in the north and Bhutan Ferro Alloys Ltd (BFAL) in the
south where 48 vertical electric soundings in 2013. As no site for the construction of a successful bore well could be
obtained, we have recommended for the construction of a filtration plant using an assemblage of permeable capsules to
obtain clear potable water from the highly-turbid surface water of the perennial Barsa River bordering the factories.
Figure 9: A Google Earth image on a scale of 1:2400 captured by the DigitalGlobe satellite on 27 Nov 2012 showing the colony
of Bhutan Ferro Alloys Ltd (BFAL) showing the location of 21 sites where geoelectric soundings were taken in 2013. Sounding
Nos. 1 and 3 are found favourable for the construction of bore wells to meet the water needs of the colony.
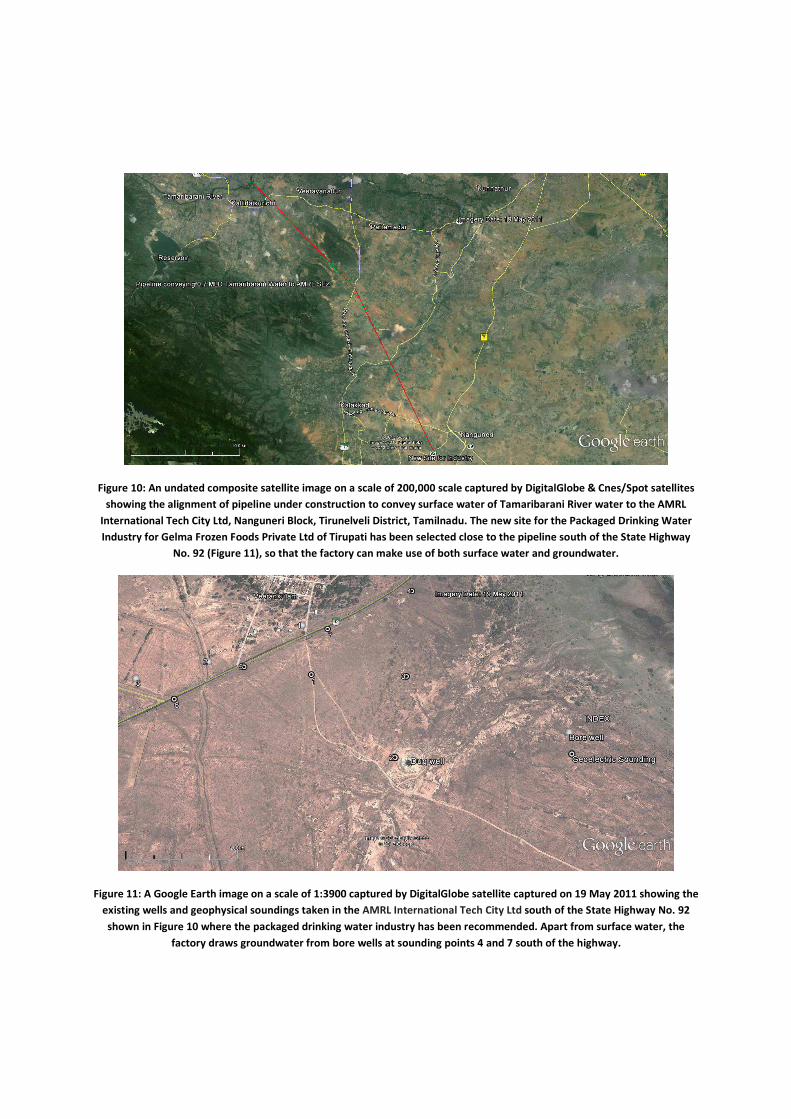
Figure 10: An undated composite satellite image on a scale of 200,000 scale captured by DigitalGlobe & Cnes/Spot satellites
showing the alignment of pipeline under construction to convey surface water of Tamaribarani River water to the AMRL
International Tech City Ltd, Nanguneri Block, Tirunelveli District, Tamilnadu. The new site for the Packaged Drinking Water
Industry for Gelma Frozen Foods Private Ltd of Tirupati has been selected close to the pipeline south of the State Highway
No. 92 (Figure 11), so that the factory can make use of both surface water and groundwater.
Figure 11: A Google Earth image on a scale of 1:3900 captured by DigitalGlobe satellite captured on 19 May 2011 showing the
existing wells and geophysical soundings taken in the AMRL International Tech City Ltd south of the State Highway No. 92
shown in Figure 10 where the packaged drinking water industry has been recommended. Apart from surface water, the
factory draws groundwater from bore wells at sounding points 4 and 7 south of the highway.