statement of immovable property return for the year ending 2016
Upload
khangminh22Category
view
0download
0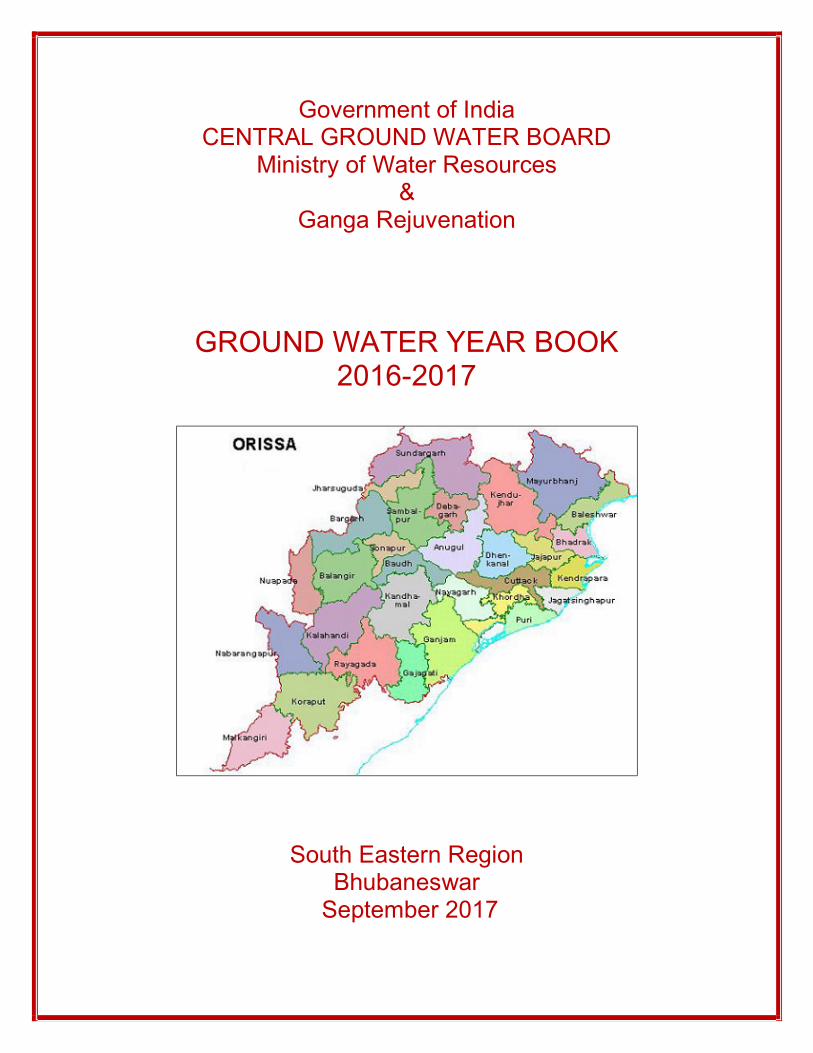
Government of India CENTRAL GROUND WATER BOARD
Ministry of Water Resources &
Ganga Rejuvenation
GROUND WATER YEAR BOOK 2016-2017
South Eastern Region
Bhubaneswar September 2017
F O R E W O R D Groundwater is a major natural replenishable resource to meet the water requirement for irrigation, domestic and industrial needs. It plays a key role in the agrarian economy of the state. Though richly endowed with various natural resources, the state of Orissa has a long way to go before it can call itself developed. Being heavily dependent on rain fed agriculture; the state is very often exposed to vagaries of monsoon like flood and drought. The importance of groundwater in mitigating the intermittent drought condition of a rain-fed economy cannot be overemphasized. To monitor the effect caused by indiscriminate use of this precious resource on groundwater regime, Central Ground Water Board, South Eastern Region, Bhubaneswar has established about 1606 National Hydrograph Network Stations (NHNS) (open / dug wells) and 89 purpose built piezometres under Hydrology Project in the state of Orissa. The water levels are being monitored four times a year. Besides, to study the change in chemical quality of groundwater in time and space, the water samples from these NHNS are being collected once a year (Pre-monsoon) and analysed in the Water Quality Laboratory of the Region. The data of both water level and chemical analysis are being stored in computers using industry standard Relational Database Management System (RDBMS) like Oracle and MS SQL Server. This is very essential for easy retrieval and long-term sustainability of data. Dissemination of technical information in a way that is very useful to the user agencies is an important aspect that plays a vital role in the safe and optimal development of groundwater resources of our country. As an effort in this direction, Central Ground Water Board is bringing out “Groundwater Year Book” each year. The present report contains the observations and results of water levels in the state of Orissa for the year 2016 (April) - 2017 (January). It is sincerely hoped that this report will be immensely useful to various user agencies, Engineers, Scientists, Administrators, Planners and others involved in groundwater planning, development and management. The present compilation is outcome of commendable efforts put in by Smt. Sandhya Mohapatra Scientist-D and Smt. Mausumi Sahoo, Scientist-B. The maps included in the reports have been computer generated by them using sophisticated GIS software like MapInfo Professional and dedicated software GEMS. Officers of the Region have collected the monitoring data and the chemist have analysed the water samples , which is presented in the reports. Their efforts are also thankfully acknowledged. Bhubaneswar (D.P. PATI)
REGIONAL DIRECTOR
EEXXEECCUUTT IIVV EE SSUUMM MMAARRYY
The State of Orissa spreading over an area of 1,55,707 sq. Km is bounded between North latitude 17049’ to 22034’ and East longitude 81024’ to 87029’. Success of agricultural operations and consequent economy of the state are related to the availability of water and its optimal utilization.
The average annual rainfall of the state is 1502.5mm. Nearly 86% of the annual rainfall is contributed by the southwest monsoon. From the departure data it is discerned that from 1980 to 2014, negative departures is seen in most of the years. During 2006 there was more rainfall than the normal in all most all the districts.
The state is underlain by diversified rock types which range in age from Precambrian to the Cenozoic age. The Precambrians occupy nearly 80% of the total geological area of the state.
A total number of 1606 Hydrograph Network Stations have so far been established and are being monitored in the state. Besides this 89 piezometers have been constructed under World Bank aided Hydrology Project and are being monitored manually.
During April 2016, the water level (meter below ground level) in the state varies from minimum of 0.2 mbgl in Baragarh district to a maximum of 18.8 mbgl in Anugul district and water levels mostly range from 2 to 10 mbgl. Some wells in the hilly districts recorded water level in 10-20 m range.
During August 2016, the depth to water level ranges from 0.05 to 11.4 mbgl and in majority (53%) of NHS wells level was in the range of 0-2 m below ground level and 38.4% of wells in 2-5 m below ground level.
.
During November 2016, the depth to water level ranges from 0.05 to 15.3 mbgl and in majority (50%) of NHS wells level was in the range of 2-5 m below ground level and 26% of wells in 0-2 m below ground level. . In general the water level in the state during November 2016 monitoring is found in the range of 0-2 m bgl especially in the coastal stretch and in parts of the hilly terrain, whereas 2-5 m bgl water level is found in the coastal and hard rock terrain.
During January 2017, that the depth to water level in majority (62%) of NHS wells was level in the range of 2-5 m below ground level and 25.6 % of wells in 5-10 m below ground level. In general the water level in the state during January 2017

monitoring is found in the range of 2-5 m bgl especially in the coastal stretch and in parts of the hilly terrain, whereas 0-2 m bgl water level is found in the coastal and command areas in the state.
The comparison of April 2016 water level with that of the decadal mean of the corresponding period shows that 8.4%, 0.5% and 0% of the total NHS wells recorded rise in water level in the range of 0-2, 2-4 and more than 4m respectively. Similarly, 43.8%, 37.4% and 9.9% recorded fall in water level in the range of 0-2, 2-4 and more than 4m respectively.
The comparison of August 2016 water level with that of the decadal mean of the corresponding period shows that 65.4%, 18.4% and 1.9% of the total NHS wells recorded rise in water level in the range of 0-2, 2-4 and more than 4m respectively. Similarly,12.4%, 1.7% and 0.1% recorded fall in water level in the range of 0-2, 2-4 and more than 4m respectively.
The comparison of November 2016 water level with that of the decadal mean of the corresponding period shows that 58.9%, 3.6% and 0.2 % of the total NHS wells recorded rise in water level in the range of 0-2, 2-4 and more than 4m respectively. Similarly, 35.4%, 1.9 % and 0.1% recorded fall in water level in the range of 0-2, 2-4 and more than 4m respectively.
The comparison of January 2017 water level with that of the decadal mean of the corresponding period shows that 23.4%, 0.8% and 0.1 % of the total NHS wells recorded rise in water level in the range of 0-2, 2-4 and more than 4m respectively. Similarly, 68.4%, 6.7% and 0.7% recorded fall in water level in the range of 0-2, 2-4 and more than 4m respectively.
The comparison of April 2016 water level with that of the same period of the previous year shows that 25.3%, 2.0% and 0.1% of the total NHS wells recorded rise in water level in the range of 0-2, 2-4 and more than 4m respectively. Similarly, 64.6%, 4.7%, 1.0% recorded fall in water level in the range of 0-2, 2-4 and more than 4m respectively.
The comparison of August 2016 water level with that of the same period of the previous year shows 35.7%, 3.7%, 0.5% of the total NHS wells recorded rise in water level in the range of 0-2, 2-4 and more than 4m respectively. Similarly, 53.3%, 3.1% recorded fall in water level in the range of 0-2, 2-4 respectively and 1.3%recorded more than 4m.

The comparison of November 2016 water level with that of the same period of the previous year shows that 50.4%, 3.5%, 0.4%of the total NHS wells recorded rise in water level in the range of 0-2, 2-4 and more than 4m respectively. Similarly, 41.4%, 1.6%, 0.3% recorded fall in water level in the range of 0-2, 2-4 and more than 4m respectively.
The comparison of January 2017 water level with that of the same period of the previous year shows that 39.3%, 2.3%, 0%of the total NHS wells recorded rise in water level in the range of 0-2, 2-4 and more than 4m respectively. Similarly, 52.9%, 2.9%, 0.4% recorded fall in water level in the range of 0-2, 2-4 and more than 4m respectively.
A comparison of August 2016 water level with that of April 2016 shows that 27.0%, 43.9%, 26.5 % of the total NHS wells recorded rise in water level in the range of 0-2, 2-4 and more than 4m respectively. Similarly only 1.8% , 0.2% and 0% recorded fall in water level in the range of 0-2, 2-4 and more than 4m respectively.
A comparison of November 2016 water level with that of April 2016 shows that 37.9%, 41.3%, 11.6% of the total NHS wells recorded rise in water level in the range of 0-2, 2-4 and more than 4m respectively. Similarly only 7.06% , 0.56% and 0.40% recorded fall in water level in the range of 0-2, 2-4 and more than 4m respectively.
A comparison of January 2017 water level with that of April 2016 shows that 60.3%, 23.0%, 3.06 % of the total NHS wells recorded rise in water level in the range of 0-2, 2-4 and more than 4m respectively. Similarly only 12.18% , 0.85% and 0.17% recorded fall in water level in the range of 0-2, 2-4 and more than 4m respectively.
The shallow aquifers of inland zone of the state are mostly fresh and dominated by Ca-Mg-HCO3 and mixed types of water. In the coastal plain where most of the wells are located in alluvium, the water is relatively saline. The shallow aquifers of the coastal plain are of NaHCO3 type with some isolated patches of NaCl and Ca-Mg-HCO3 types, which may be due to Base Exchange process and also due to the vicinity of the sea. These aquifers, at places, are of high Electrical Conductivity and high Chloride, Nitrate, and Fluoride content. In the coastal districts the Electrical Conductivity concentration ranges from 43 to 4240 S/cm.

CCEENNTTRRAALL GGRROOUUNNDD WWAATTEERR BBOOAARRDD SSOOUUTTHH EEAASSTTEERRNN RREEGGIIOONN
GGRROOUUNNDD WWAATTEERR YYEEAARR BBOOOOKK 22001166--22001177 _____________________________________________________________________
CONTENTS
SL.NO. ITEM PAGE NO FOREWORD EXECUTIVE SUMMARY 1.0 INTRODUCTION 1- 2 2.0 PHYSIOGRAPHIC FEATURES 2 - 4
3.0 DRAINAGE 4 - 4 4.0 CLIMATE AND RAINFALL 4 - 9 5.0 HYDROGEOLOGICAL CONDITION 9 - 12 5.1 Consolidated Formation 5.2 Semi Consolidated Formation 5.3 Unconsolidated Formation 6.0 GROUND WATER REGIME MONITORING 12 - 20 6.1 Distribution of National Hydrograph Network Stations 6.2 Analysis of Data 7.0 BEHAVIOUR OF WATER LEVEL DURING 2015-2016 21 - 76 7.1 Depth to Water Level 7.2 Water Level Fluctuation w.r.t Decade Mean 7.3 Water Level Fluctuation w.r.t corresponding period of pervious year. 7.4 Water Level Fluctuation w.r.t Pre-monsoon water level 8.0 HYDROCHEMISTRY 77 - 82
LIST OF TABLES
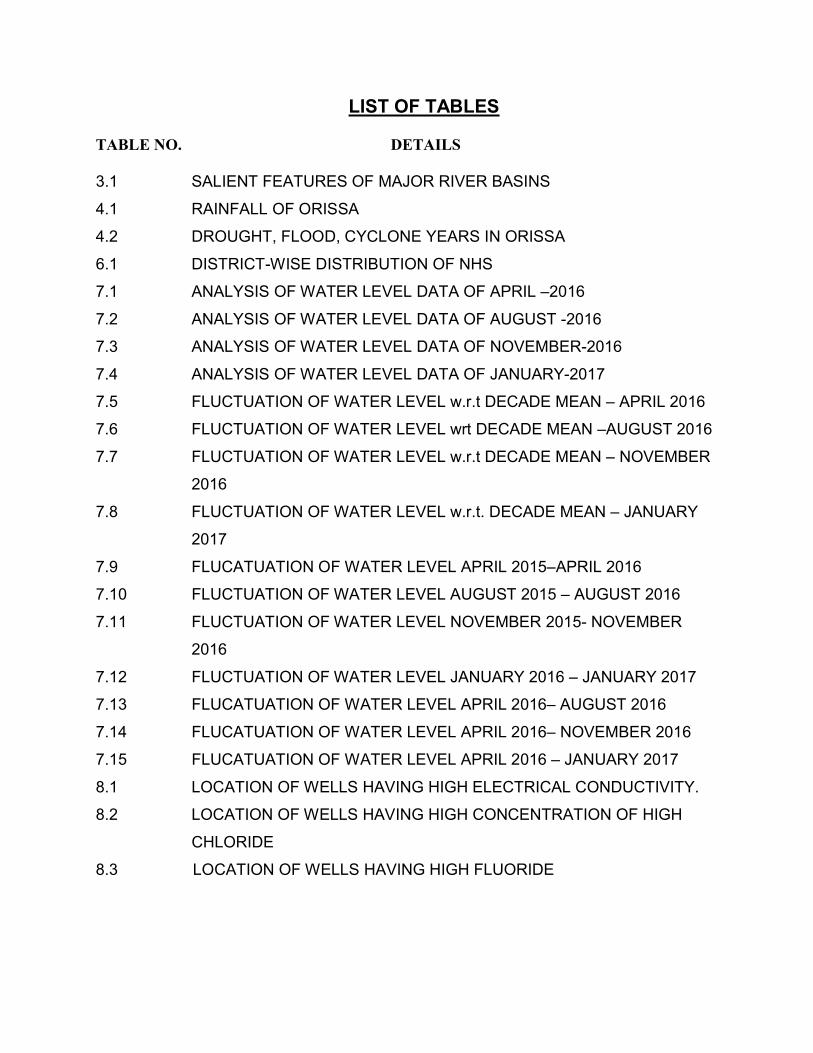
TABLE NO. DETAILS 3.1 SALIENT FEATURES OF MAJOR RIVER BASINS
4.1 RAINFALL OF ORISSA
4.2 DROUGHT, FLOOD, CYCLONE YEARS IN ORISSA
6.1 DISTRICT-WISE DISTRIBUTION OF NHS
7.1 ANALYSIS OF WATER LEVEL DATA OF APRIL –2016
7.2 ANALYSIS OF WATER LEVEL DATA OF AUGUST -2016
7.3 ANALYSIS OF WATER LEVEL DATA OF NOVEMBER-2016
7.4 ANALYSIS OF WATER LEVEL DATA OF JANUARY-2017
7.5 FLUCTUATION OF WATER LEVEL w.r.t DECADE MEAN – APRIL 2016
7.6 FLUCTUATION OF WATER LEVEL wrt DECADE MEAN –AUGUST 2016
7.7 FLUCTUATION OF WATER LEVEL w.r.t DECADE MEAN – NOVEMBER
2016
7.8 FLUCTUATION OF WATER LEVEL w.r.t. DECADE MEAN – JANUARY
2017
7.9 FLUCATUATION OF WATER LEVEL APRIL 2015–APRIL 2016
7.10 FLUCTUATION OF WATER LEVEL AUGUST 2015 – AUGUST 2016
7.11 FLUCTUATION OF WATER LEVEL NOVEMBER 2015- NOVEMBER
2016
7.12 FLUCTUATION OF WATER LEVEL JANUARY 2016 – JANUARY 2017
7.13 FLUCATUATION OF WATER LEVEL APRIL 2016– AUGUST 2016
7.14 FLUCATUATION OF WATER LEVEL APRIL 2016– NOVEMBER 2016
7.15 FLUCATUATION OF WATER LEVEL APRIL 2016 – JANUARY 2017
8.1 LOCATION OF WELLS HAVING HIGH ELECTRICAL CONDUCTIVITY.
8.2 LOCATION OF WELLS HAVING HIGH CONCENTRATION OF HIGH
CHLORIDE
8.3 LOCATION OF WELLS HAVING HIGH FLUORIDE
LIST OF PLATES
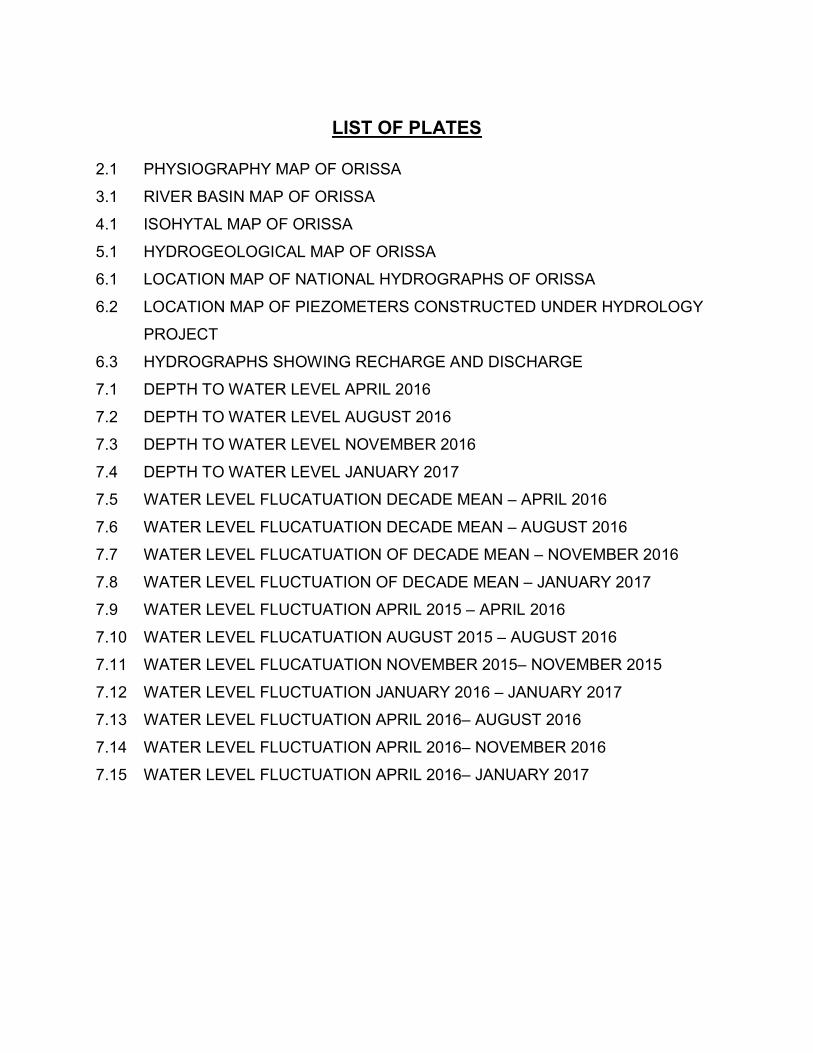
2.1 PHYSIOGRAPHY MAP OF ORISSA
3.1 RIVER BASIN MAP OF ORISSA
4.1 ISOHYTAL MAP OF ORISSA
5.1 HYDROGEOLOGICAL MAP OF ORISSA
6.1 LOCATION MAP OF NATIONAL HYDROGRAPHS OF ORISSA
6.2 LOCATION MAP OF PIEZOMETERS CONSTRUCTED UNDER HYDROLOGY
PROJECT
6.3 HYDROGRAPHS SHOWING RECHARGE AND DISCHARGE
7.1 DEPTH TO WATER LEVEL APRIL 2016
7.2 DEPTH TO WATER LEVEL AUGUST 2016
7.3 DEPTH TO WATER LEVEL NOVEMBER 2016
7.4 DEPTH TO WATER LEVEL JANUARY 2017
7.5 WATER LEVEL FLUCATUATION DECADE MEAN – APRIL 2016
7.6 WATER LEVEL FLUCATUATION DECADE MEAN – AUGUST 2016
7.7 WATER LEVEL FLUCATUATION OF DECADE MEAN – NOVEMBER 2016
7.8 WATER LEVEL FLUCTUATION OF DECADE MEAN – JANUARY 2017
7.9 WATER LEVEL FLUCTUATION APRIL 2015 – APRIL 2016
7.10 WATER LEVEL FLUCATUATION AUGUST 2015 – AUGUST 2016
7.11 WATER LEVEL FLUCATUATION NOVEMBER 2015– NOVEMBER 2015
7.12 WATER LEVEL FLUCTUATION JANUARY 2016 – JANUARY 2017
7.13 WATER LEVEL FLUCTUATION APRIL 2016– AUGUST 2016
7.14 WATER LEVEL FLUCTUATION APRIL 2016– NOVEMBER 2016
7.15 WATER LEVEL FLUCTUATION APRIL 2016– JANUARY 2017
ANNEXURES
1. GENERAL DETAILS OF NHS WELLS IN ORISSA
2. HYDROGEOLOGICAL DETAILS OF PIEZOMETERS CONSTRUCTED IN
ORISSA UNDER HYDROLOGY PROJECT
3. DISTRICT-WISE DEPTH TO WATER LEVEL DATA OF NHS IN ORISSA
(PRE-MONSOON, POST MONSOON and FLUCTUATION)
4. DISTRICT WISE CHEMICAL QUALITY OF NHS IN ORISSA ( APRIL- 2016)

1
1.0 INTRODUCTION
The State of Orissa with a geographical area of 1,55,707 sq. km is bounded between North latitudes 170 49' and
220 34' and East longitudes 810 24' and 870 29'. The State comprises of 3 revenue divisions, 30 districts, 58
subdivisions and 314 community development blocks. The state’s population largely depends on agriculture.
Success of agricultural operations and the consequent agrarian economy of the state are dependent on the
availability of water and its optimal utilization. The total population of the state as per 2011 census is 419.73
lakhs, out of which the rural population is 349.70 lakhs and the urban population is 70.03 lakhs. The rural
population is almost dependent on agriculture for their livelihood and the agriculture on availability of water. A
consistent ground water database is inevitable for planning of judicious and optimal utilization of ground water
through an efficient resource management system for which the prerequisite is a reliable monitoring system.
Keeping this perspective in view, Central Ground Water Board carries out the ground water monitoring through a
network of observation wells - the National Hydrograph Network Stations. The National Hydrograph stations set-
up is a system of spatially distributed observation points for ground water regime monitoring at which periodic
monitoring is carried out viz. recording of water levels, temperature and collection of water samples for chemical
quality analysis for building a robust database to cater to multitude of needs for ground water management.
Groundwater monitoring data so collected forms an important input for water management. One of the main
objectives is the prediction of future conditions or future scenarios, based on background samples of historical
data, which may consist of repeated measurements from a single monitoring well. Also the monitoring is being
carried out with a view to observe the rise or fall of the ground water levels and change in quality of water with
changing stress conditions.
The studies include periodic measurement of water levels, temperature, and collection of water samples for
determination of chemical constituents. Apart from evaluation of groundwater resources from time to time for
developmental planning, this also helps in forecasting groundwater regime behaviour with progressive
development of groundwater or effects of other recharge or discharge conditions, which helps in adopting
remedial measures when necessitated. For achieving these objectives 1695nos. of observation wells have so far
been established all over the state by CGWB, to serve as permanent Hydrograph Network Stations for the
purpose of monitoring of groundwater regime. In selecting hydrograph stations due consideration has been given
to the hydrogeological, hydrochemical aspects and their location in river Basin/ Sub basin/ Water shed etc.
To strengthen the water level monitoring network and to avoid the possibility of dug wells used as NHS being
filled up due to extraneous activities, some purpose built piezometer have been constructed by the Central
2
Ground Water Board under its normal activities as well as under World Bank Aided Hydrology Project. In course
of time it is proposed to replace all the dug wells used as observation wells with piezometers for better
monitoring.
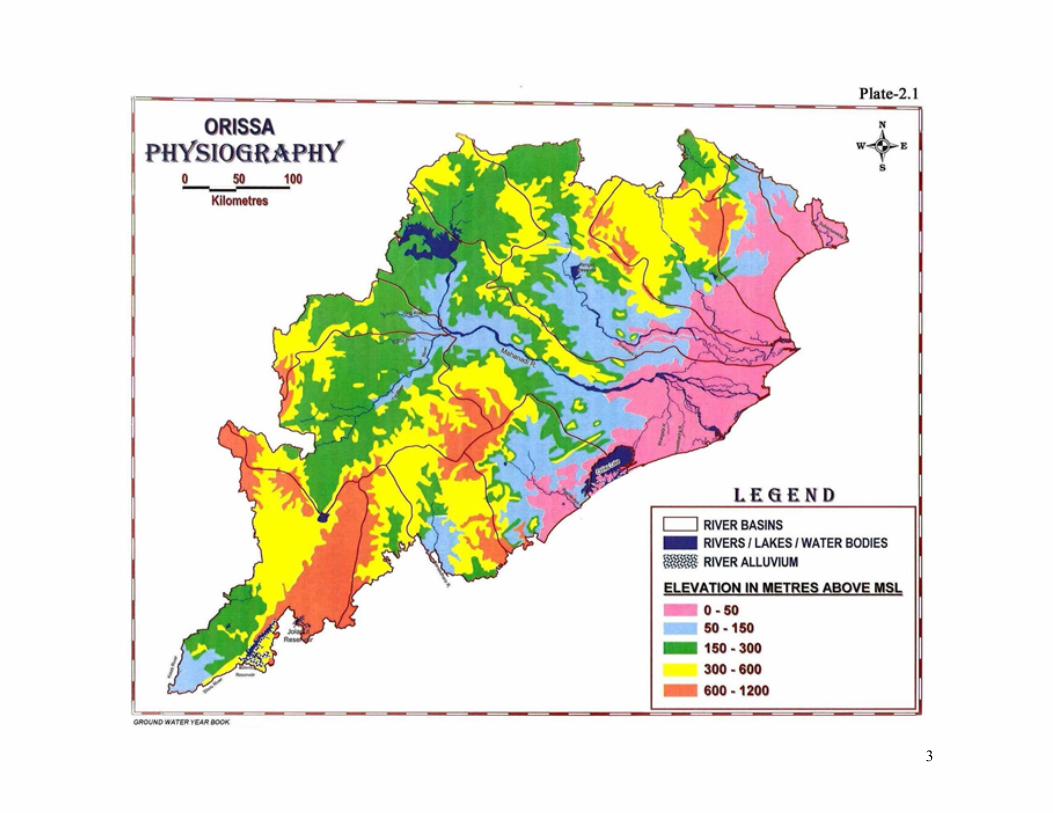
2.0 PHYSIOGRAPHIC FEATURES
The State presents varied and picturesque landforms. The Southern and Central parts of the State in Rayagada,
Kalahandi, Phulbani and Gajapati districts present a rugged hilly tract. Plateau occupies the Northern districts of
Sundergarh, Keonjhar and Mayurbhanj and parts of Nawarangpur district in the Southwest. Undulating plains
characterizes the major river valleys. A narrow coastal plain borders the Bay of Bengal.
Physiographically the state can be divided into five distinct units, namely (i) Coastal plains, (ii) Northern uplands,
(iii) The erosional plains of Mahanadi and other river valleys (iv) South Western hilly region and (v) Subdued
plateaus. Physiography of the state has been presented in Plate:-2.1
The coastal plains covering parts of Ganjam, Puri, Cuttack and Balasore districts from south to north form an
extensive flat alluvial tract between the hills in the west and the coast in the east. It presents a flat topography
gently sloping towards east with insignificant elevation difference. The general elevation of coastal plains varies
from 1 to 10m above mean sea level (amsl).
Northern uplands covering Mayurbhanj, Keonjhar and Sundergarh districts and Pallahara subdivision of
Dhenkanal district are undulating, frequently intersected by hill ranges with general slope from north to south.
The elevation in the central part of the upland generally varies between 300 to 600 m and forms watersheds of
Baitarani and Brahmani river systems. The erosional plains of Mahanadi river basin lie between the northern
uplands and southern hilly region of the Eastern Ghats. The tract covers major parts of undivided districts of
Sambalpur, Bolangir, Dhenkanal and northern parts of Phulbani (Khandamal) and Western part of Puri districts.
The altitude of this tract lies between 150 to 300 m above mean sea level (amsl).
3
4
Southwestern hilly region lies to the south and southwest of Mahanadi valley region stretching through Phulbani,
Ganjam districts and part of Koraput district. Major part of this region has an elevation over 600m, acting as the
watershed of the two sets of rivers, one set flowing directly to the Bay of Bengal, namely Rushikulya, Nagavali
and Vamsadhara and the others feeding the Godavari and Mahanadi river systems.
The plateaus extend throughout the western parts of Kalahandi, Nawapara, Koraput, Malkangiri , Rayagada and
Nawarangpur districts with an average elevation varying from 300 to 600m above mean sea level (amsl).
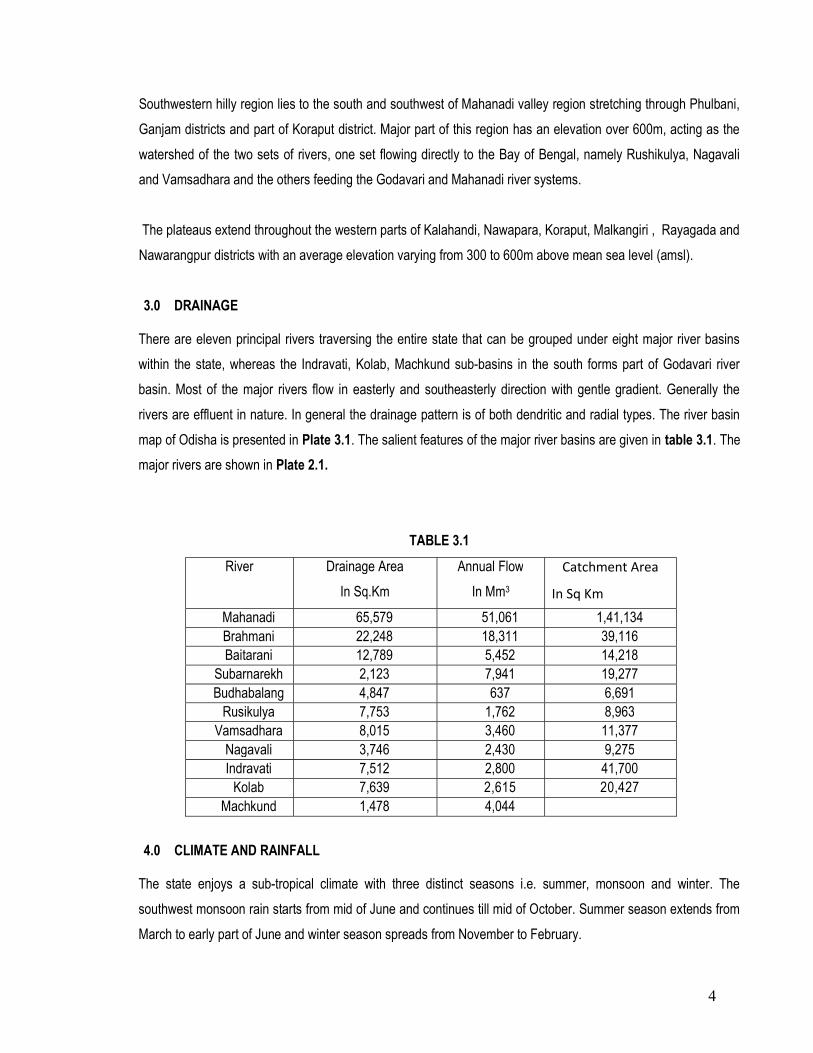
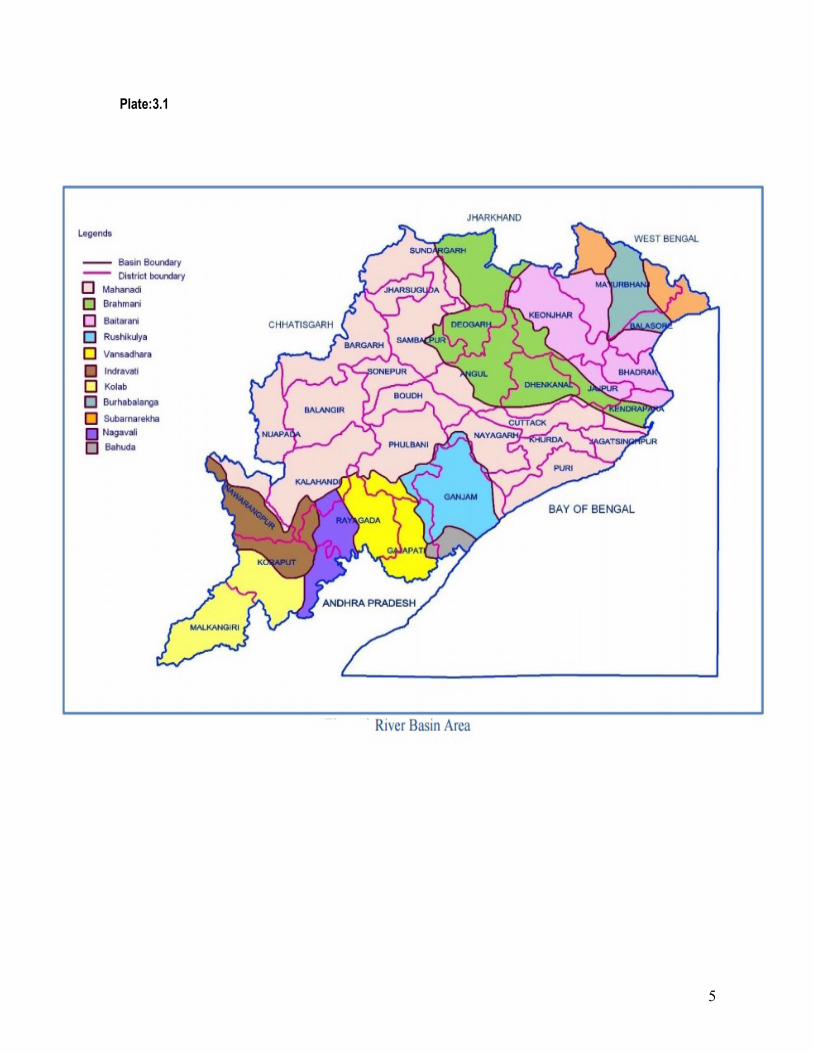
3.0 DRAINAGE
There are eleven principal rivers traversing the entire state that can be grouped under eight major river basins
within the state, whereas the Indravati, Kolab, Machkund sub-basins in the south forms part of Godavari river
basin. Most of the major rivers flow in easterly and southeasterly direction with gentle gradient. Generally the
rivers are effluent in nature. In general the drainage pattern is of both dendritic and radial types. The river basin
map of Odisha is presented in Plate 3.1. The salient features of the major river basins are given in table 3.1. The
major rivers are shown in Plate 2.1.
TABLE 3.1
River Drainage Area
In Sq.Km
Annual Flow
In Mm3
Catchment Area
In Sq Km
Mahanadi 65,579 51,061 1,41,134 Brahmani 22,248 18,311 39,116 Baitarani 12,789 5,452 14,218
Subarnarekh 2,123 7,941 19,277 Budhabalang 4,847 637 6,691
Rusikulya 7,753 1,762 8,963 Vamsadhara 8,015 3,460 11,377
Nagavali 3,746 2,430 9,275 Indravati 7,512 2,800 41,700
Kolab 7,639 2,615 20,427 Machkund 1,478 4,044
4.0 CLIMATE AND RAINFALL
The state enjoys a sub-tropical climate with three distinct seasons i.e. summer, monsoon and winter. The
southwest monsoon rain starts from mid of June and continues till mid of October. Summer season extends from
March to early part of June and winter season spreads from November to February.
5
Plate:3.1
6
Plate :- 4.1
7
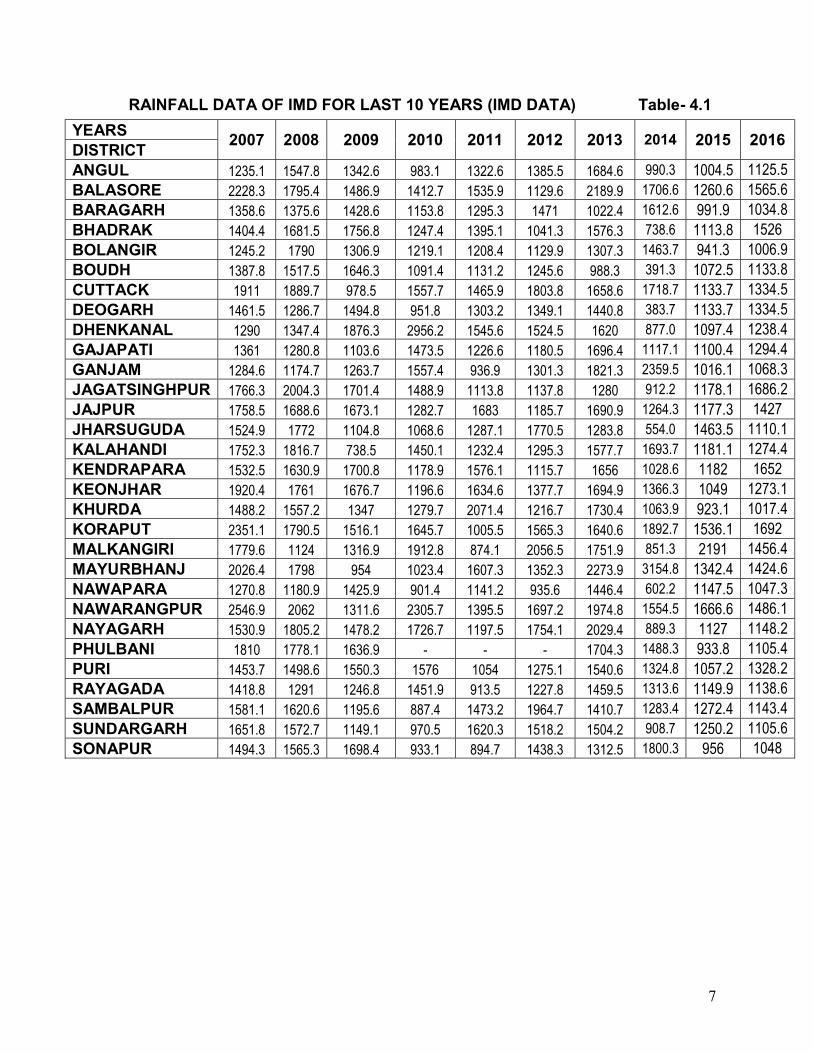
RAINFALL DATA OF IMD FOR LAST 10 YEARS (IMD DATA) Table- 4.1
YEARS 2007 2008 2009 2010 2011 2012 2013 2014 2015 2016
DISTRICT ANGUL 1235.1 1547.8 1342.6 983.1 1322.6 1385.5 1684.6 990.3 1004.5 1125.5 BALASORE 2228.3 1795.4 1486.9 1412.7 1535.9 1129.6 2189.9 1706.6 1260.6 1565.6 BARAGARH 1358.6 1375.6 1428.6 1153.8 1295.3 1471 1022.4 1612.6 991.9 1034.8 BHADRAK 1404.4 1681.5 1756.8 1247.4 1395.1 1041.3 1576.3 738.6 1113.8 1526 BOLANGIR 1245.2 1790 1306.9 1219.1 1208.4 1129.9 1307.3 1463.7 941.3 1006.9 BOUDH 1387.8 1517.5 1646.3 1091.4 1131.2 1245.6 988.3 391.3 1072.5 1133.8 CUTTACK 1911 1889.7 978.5 1557.7 1465.9 1803.8 1658.6 1718.7 1133.7 1334.5 DEOGARH 1461.5 1286.7 1494.8 951.8 1303.2 1349.1 1440.8 383.7 1133.7 1334.5 DHENKANAL 1290 1347.4 1876.3 2956.2 1545.6 1524.5 1620 877.0 1097.4 1238.4 GAJAPATI 1361 1280.8 1103.6 1473.5 1226.6 1180.5 1696.4 1117.1 1100.4 1294.4 GANJAM 1284.6 1174.7 1263.7 1557.4 936.9 1301.3 1821.3 2359.5 1016.1 1068.3 JAGATSINGHPUR 1766.3 2004.3 1701.4 1488.9 1113.8 1137.8 1280 912.2 1178.1 1686.2 JAJPUR 1758.5 1688.6 1673.1 1282.7 1683 1185.7 1690.9 1264.3 1177.3 1427 JHARSUGUDA 1524.9 1772 1104.8 1068.6 1287.1 1770.5 1283.8 554.0 1463.5 1110.1 KALAHANDI 1752.3 1816.7 738.5 1450.1 1232.4 1295.3 1577.7 1693.7 1181.1 1274.4 KENDRAPARA 1532.5 1630.9 1700.8 1178.9 1576.1 1115.7 1656 1028.6 1182 1652 KEONJHAR 1920.4 1761 1676.7 1196.6 1634.6 1377.7 1694.9 1366.3 1049 1273.1 KHURDA 1488.2 1557.2 1347 1279.7 2071.4 1216.7 1730.4 1063.9 923.1 1017.4 KORAPUT 2351.1 1790.5 1516.1 1645.7 1005.5 1565.3 1640.6 1892.7 1536.1 1692 MALKANGIRI 1779.6 1124 1316.9 1912.8 874.1 2056.5 1751.9 851.3 2191 1456.4 MAYURBHANJ 2026.4 1798 954 1023.4 1607.3 1352.3 2273.9 3154.8 1342.4 1424.6 NAWAPARA 1270.8 1180.9 1425.9 901.4 1141.2 935.6 1446.4 602.2 1147.5 1047.3 NAWARANGPUR 2546.9 2062 1311.6 2305.7 1395.5 1697.2 1974.8 1554.5 1666.6 1486.1 NAYAGARH 1530.9 1805.2 1478.2 1726.7 1197.5 1754.1 2029.4 889.3 1127 1148.2 PHULBANI 1810 1778.1 1636.9 - - - 1704.3 1488.3 933.8 1105.4 PURI 1453.7 1498.6 1550.3 1576 1054 1275.1 1540.6 1324.8 1057.2 1328.2 RAYAGADA 1418.8 1291 1246.8 1451.9 913.5 1227.8 1459.5 1313.6 1149.9 1138.6 SAMBALPUR 1581.1 1620.6 1195.6 887.4 1473.2 1964.7 1410.7 1283.4 1272.4 1143.4 SUNDARGARH 1651.8 1572.7 1149.1 970.5 1620.3 1518.2 1504.2 908.7 1250.2 1105.6 SONAPUR 1494.3 1565.3 1698.4 933.1 894.7 1438.3 1312.5 1800.3 956 1048
8
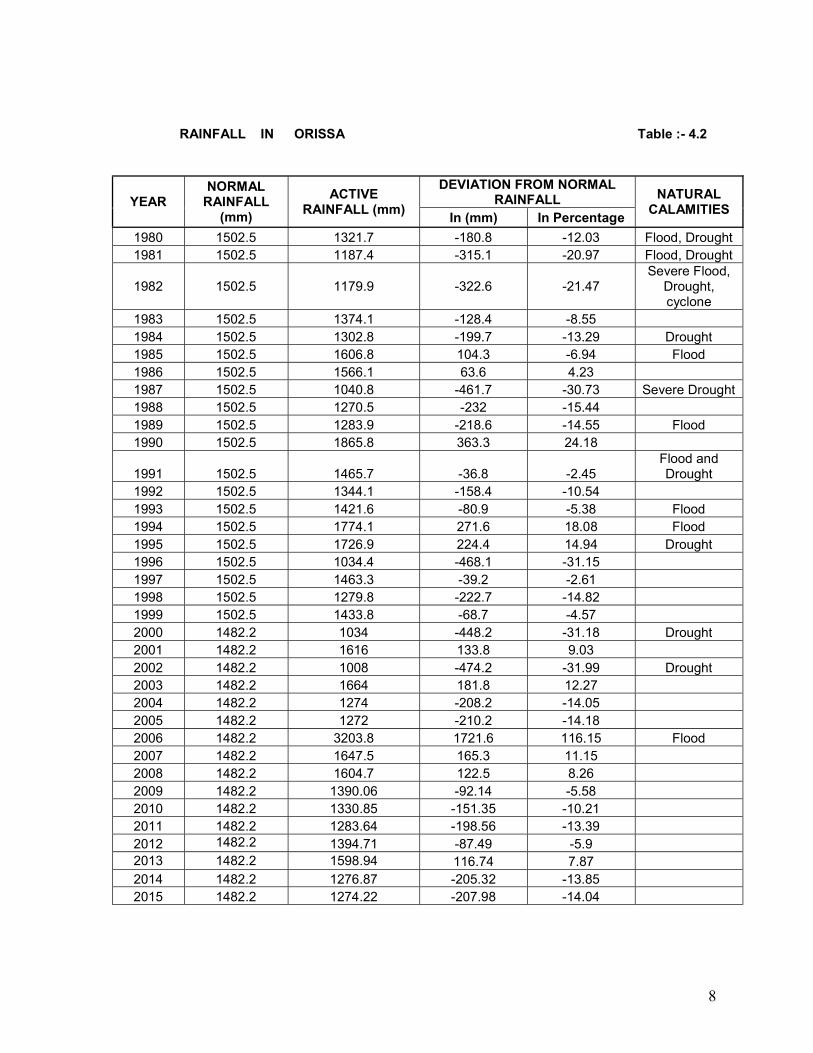
RAINFALL IN ORISSA
Table :- 4.2
YEAR NORMAL
RAINFALL (mm)
ACTIVE RAINFALL (mm)
DEVIATION FROM NORMAL RAINFALL NATURAL
CALAMITIES In (mm) In Percentage
1980 1502.5 1321.7 -180.8 -12.03 Flood, Drought 1981 1502.5 1187.4 -315.1 -20.97 Flood, Drought
1982 1502.5 1179.9 -322.6 -21.47 Severe Flood,
Drought, cyclone
1983 1502.5 1374.1 -128.4 -8.55 1984 1502.5 1302.8 -199.7 -13.29 Drought 1985 1502.5 1606.8 104.3 -6.94 Flood 1986 1502.5 1566.1 63.6 4.23 1987 1502.5 1040.8 -461.7 -30.73 Severe Drought 1988 1502.5 1270.5 -232 -15.44 1989 1502.5 1283.9 -218.6 -14.55 Flood 1990 1502.5 1865.8 363.3 24.18
1991 1502.5 1465.7 -36.8 -2.45 Flood and Drought
1992 1502.5 1344.1 -158.4 -10.54 1993 1502.5 1421.6 -80.9 -5.38 Flood 1994 1502.5 1774.1 271.6 18.08 Flood 1995 1502.5 1726.9 224.4 14.94 Drought 1996 1502.5 1034.4 -468.1 -31.15 1997 1502.5 1463.3 -39.2 -2.61 1998 1502.5 1279.8 -222.7 -14.82 1999 1502.5 1433.8 -68.7 -4.57 2000 1482.2 1034 -448.2 -31.18 Drought 2001 1482.2 1616 133.8 9.03 2002 1482.2 1008 -474.2 -31.99 Drought 2003 1482.2 1664 181.8 12.27 2004 1482.2 1274 -208.2 -14.05 2005 1482.2 1272 -210.2 -14.18 2006 1482.2 3203.8 1721.6 116.15 Flood 2007 1482.2 1647.5 165.3 11.15 2008 1482.2 1604.7 122.5 8.26 2009 1482.2 1390.06 -92.14 -5.58 2010 1482.2 1330.85 -151.35 -10.21 2011 1482.2 1283.64 -198.56 -13.39 2012 1482.2 1394.71 -87.49 -5.9 2013 1482.2 1598.94 116.74 7.87 2014 1482.2 1276.87 -205.32 -13.85 2015 1482.2 1274.22 -207.98 -14.04

9
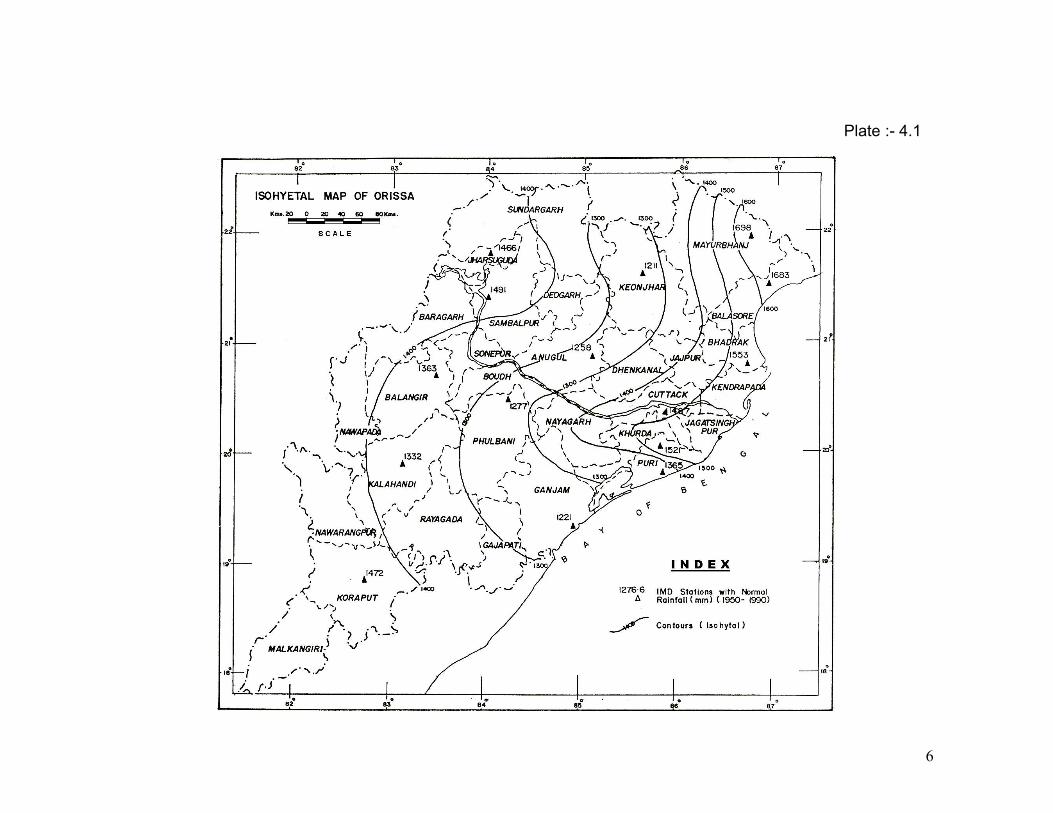
There are 15 rain gauge stations maintained by IMD in the State. The normal average rainfall of the state is
1482.2 mm . Nearly 86% of the annual rainfall is contributed by the southwest monsoon. The spatial distribution
of the rainfall in the State is uneven and erratic. A perusal of the Isohyetal map of the normal rainfall for the
period (Plate –4.1) shows that the rainfall is highest in the northern part of coastal tract, which ranges from
1520.32 to 1697.87 mm. The rainfall reduces westwards, from 1487.02 to 1211.08 mm in Phulbani, Angul,
Keonjhar districts and also southwards to 1221.14 mm around Gopalpur in Ganjam district.
The rainfall ranges from 1331.85 mm to 1491.89 mm in Koraput, Kalahandi, Bolangir, Sambalpur and
Sundergarh districts. The IMD rainfall data for nine years (2007-2016) has been given in table 4.1. From the
rainfall departure data, it can be observed that the year 1990, 1995 and 2003 indicate excess rainfall in the major
part of the state. Table 4.2 presents the drought, flood and cyclone years in the state from 1980 to 2015. A
perusal of the table indicates that every alternate year, the state experiences a natural calamity in the way of
drought or flood or cyclone. This has created a most unpredictable climate for any agricultural activity in the state.
4.1 TEMPERATURE
The state experiences hot summer with temperatures shooting up to 45°C in the east to 50°C in the west. During
winter season mornings and nights are cool. However the mean monthly winter temperature varies from 18°C to
22°C in different parts of the state. The mean monthly summer temperature is 37°C in western parts and 28°C in
southern parts. Humidity ranges from 70% to about 100% in the state. During monsoon period the humidity is
very high in the eastern parts and during summer it is dry in the western part of the state.
5.0 HYDROGEOLOGICAL CONDITION
Geological setting, climate and topography plays a vital role in occurrence and movement of groundwater. The
state is underlain by diverse rock types, which range in age from Precambrian to Cenozoic. The Precambrians
occupy nearly 80% of the total geographical area of the state. The Tertiary and the Quaternary formations are
restricted mainly to the narrow coastal tracts. The Gondwana group of rocks belonging to Paleozoic and
Mesozoic age occur in isolated patches in different parts of the state. These formations occur in Talcher area of
Angul district and Ib river valley area of Sambalpur and Sundergarh districts. Hydrogeologically, the state can
broadly be divided into 3 distinct geological units. The hydrogeology of the state has been depicted in Plate 5.1.
Area with Precambrian Consolidated Formations –
Sundergarh, Keonjhar, Mayurbhanj, Subarnapur, Bolangir, Phulbani, Boudh, Gajapati, Nuapara, Kalahandi and
parts of Nayagarh, Khurda, Balasore, Cuttack, Ganjam, Koraput, Kalahandi, Angul, Dhenkanal, Sambalpur and
Bargarh districts.
10
Area with Semi-consolidated Gondwana & Tertiary Formations –
Parts of Sundergarh, Mayurbhanj, Angul, Dhenkanal, Khurda, Sambalpur, Phulbani and Bolangir districts.
Area with Unconsolidated Quaternary Formations –
Coastal tracts of Puri, Khurda, Cuttack, Jagatsinghpur, Jajpur, Kendrapara, Balasore, Bhadrak, Ganjam districts
and inland river valleys.
5.1 CONSOLIDATED FORMATIONS
The consolidated formations include the hard crystalline and partly metamorphosed compact sedimentary
formations belonging to Pre-Cambrian. The rock types are mainly granites, granite gneisses, schistose rocks,
khondalites, charnockites, quartzites, calcsilicates, shale, phyllite, sandstone, limestone, marble etc. These rocks
are devoid of primary porosity. The ground water occurs in secondary porosity resulting from weathering
fracturing and jointing. The hard rock aquifers exhibit considerable variation laterally as also in depth. The
weathered mantle is composed of loose regolith with intergranular porosity, which facilitates free circulation of
ground water through deeper fractures and forms potential repository of ground water. In general the average
thickness of weathered residuum varies from 15 to 20 m. Ground water occurs under phreatic condition. The
water bearing fracture zones generally occur within 100m depth but deeper potential fractures have also been
encountered in some of the bore holes drilled by the Central Ground Water Board.
5.2 SEMI CONSOLIDATED FORMATIONS
The semi-consolidated formations include Gondwana sedimentaries ranging in age from Upper Carboniferous to
Cretaceous and the Baripada beds of Middle-Pliocene age. The Gondwanas include sandstones, shales,
siltstones and conglomeratic beds, while the Baripada beds consist of fossiliferous limestones, stratified semi-
consolidated sand beds with intercalated shales. The coarse to medium grained, weathered, fractured and friable
Gondwana sandstones and the semi-consolidated sand beds of Baripada formation form the aquifers. The
ground water occurs under water table condition in the shallow aquifers and under semi-confined to confined
conditions in the deeper aquifers. The depth of weathering in Gondwanas generally extends to a depth of 15m.

11
Plate :- 5.1
12
5.3 UNCONSOLIDATED FORMATIONS
The unconsolidated sediments include Pleistocene and Recent alluvium. The older alluvium, which forms
conspicuous and significant horizon, is generally overlain by laterites. The laterites are vesicular, essentially
ferruginous and form the shallow aquifer. Maximum development of alluvial formations occurs along the coastal
tract, with a maximum thickness of about 600m. Alluvium also occurs as discontinuous patches adjoining the
river courses, where the thickness is limited to about 45m. The sand and gravel layers act as good repository of
ground water. Groundwater occurs under unconfined condition in the shallow zone and under semi-confined to
confined condition in the deeper zone. The coastal tract holds potential for large- scale ground water
development as the sand zone forms prolific aquifers. But the coastal tract is beset with salinity problems both in
shallow as well as deeper aquifers at different locales at different levels.
6.0 GROUND WATER REGIME MONITORING
Ground water monitoring is carried out by CGWB through a network of observation wells (dug wells and
piezometers) spread all over the state. These wells serve as permanent National Hydrograph Stations (NHS).
The existing network provides an optimal spatial distribution of observation stations in the region, through which
necessary information on ground water regime is available with a fair degree of accuracy. Through interpolation
between data sets at different stations, it is possible to determine the characteristics of elements at any point in
the region. Under normal circumstances, the water level of the observation wells are being measured four times
in a year during fixed period of time as given below –
April – 20th to 30th of the month Represents water level situation in Pre-monsoon period
August – 20th to 30th of the month Represents peak water level of monsoon period.
November – 1st to 10th of the month Represents situation of water level in Post-monsoon
period.
January – 1st to 10th of the month Represents water level during irrigation period.
Water samples were collected from each of the network stations only during April (Pre-monsoon) every year, to
assess the chemical quality of ground water.
13
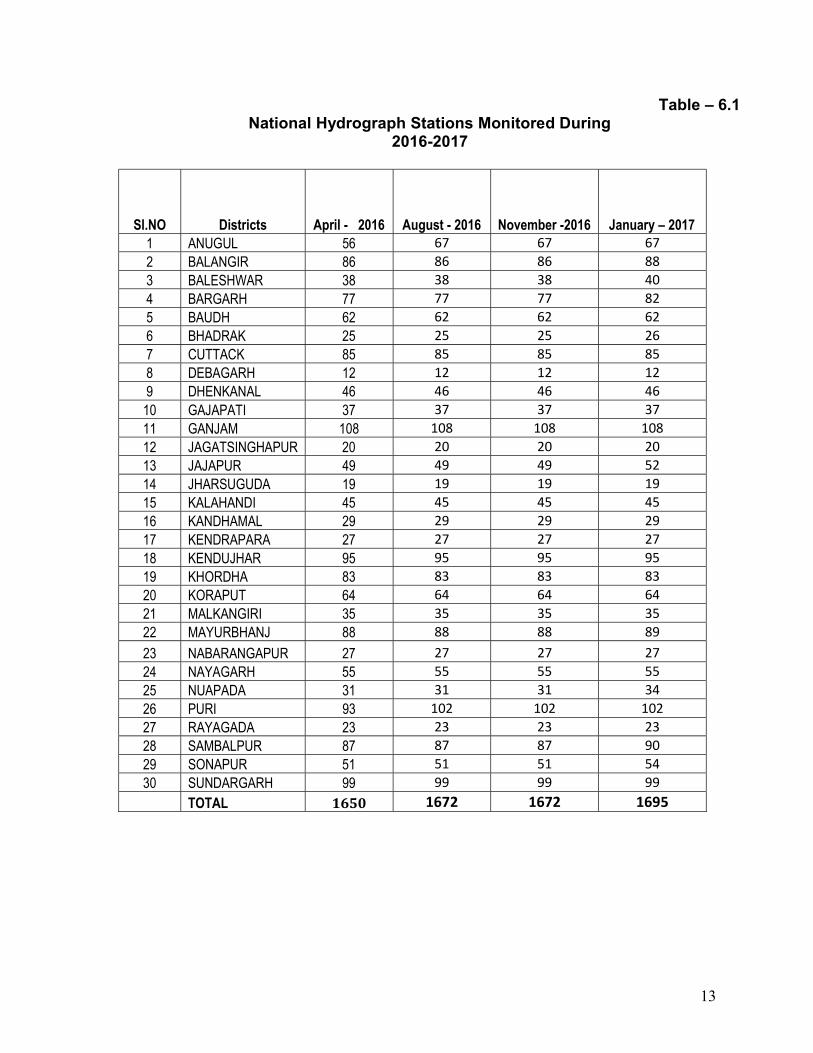
Table – 6.1 National Hydrograph Stations Monitored During
2016-2017
Sl.NO Districts April - 2016 August - 2016 November -2016 January – 2017 1 ANUGUL 56 67 67 67 2 BALANGIR 86 86 86 88 3 BALESHWAR 38 38 38 40 4 BARGARH 77 77 77 82 5 BAUDH 62 62 62 62 6 BHADRAK 25 25 25 26 7 CUTTACK 85 85 85 85 8 DEBAGARH 12 12 12 12 9 DHENKANAL 46 46 46 46
10 GAJAPATI 37 37 37 37 11 GANJAM 108 108 108 108 12 JAGATSINGHAPUR 20 20 20 20 13 JAJAPUR 49 49 49 52 14 JHARSUGUDA 19 19 19 19 15 KALAHANDI 45 45 45 45 16 KANDHAMAL 29 29 29 29 17 KENDRAPARA 27 27 27 27 18 KENDUJHAR 95 95 95 95 19 KHORDHA 83 83 83 83 20 KORAPUT 64 64 64 64 21 MALKANGIRI 35 35 35 35 22 MAYURBHANJ 88 88 88 89 23 NABARANGAPUR 27 27 27 27 24 NAYAGARH 55 55 55 55 25 NUAPADA 31 31 31 34 26 PURI 93 102 102 102 27 RAYAGADA 23 23 23 23 28 SAMBALPUR 87 87 87 90 29 SONAPUR 51 51 51 54 30 SUNDARGARH 99 99 99 99
TOTAL 1650 1672 1672 1695
14
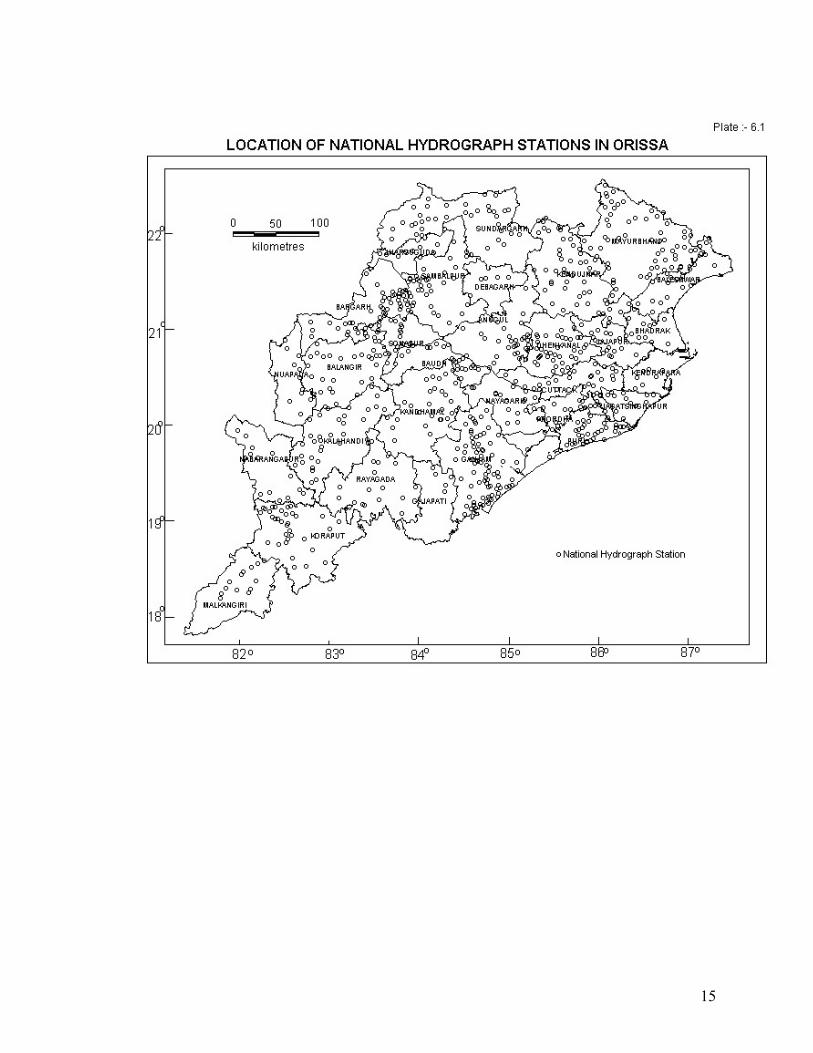
6.1 DISTRIBUTION OF NATIONAL HYDROGRAPH STATIONS
A total number of 1695 Hydrograph Network Stations have so far been established and are being monitored in
the state. Out of 1695 network hydrograph stations, open/dug wells are 1606 in numbers and 89 are Piezometers
in hard rock and coastal tract (including piezoemters under Hydrology Project) and are being monitored
manually. The district wise distribution of NHS wells is furnished in Table 6.1. Locations of hydrograph network
stations are shown in Plate-6.1 and the general details of hydrograph network stations are given in Annexure-1.
Locations of piezometers constructed under Hydrology Project have been given in Plate 6.2 and provided in
Annexure – 2
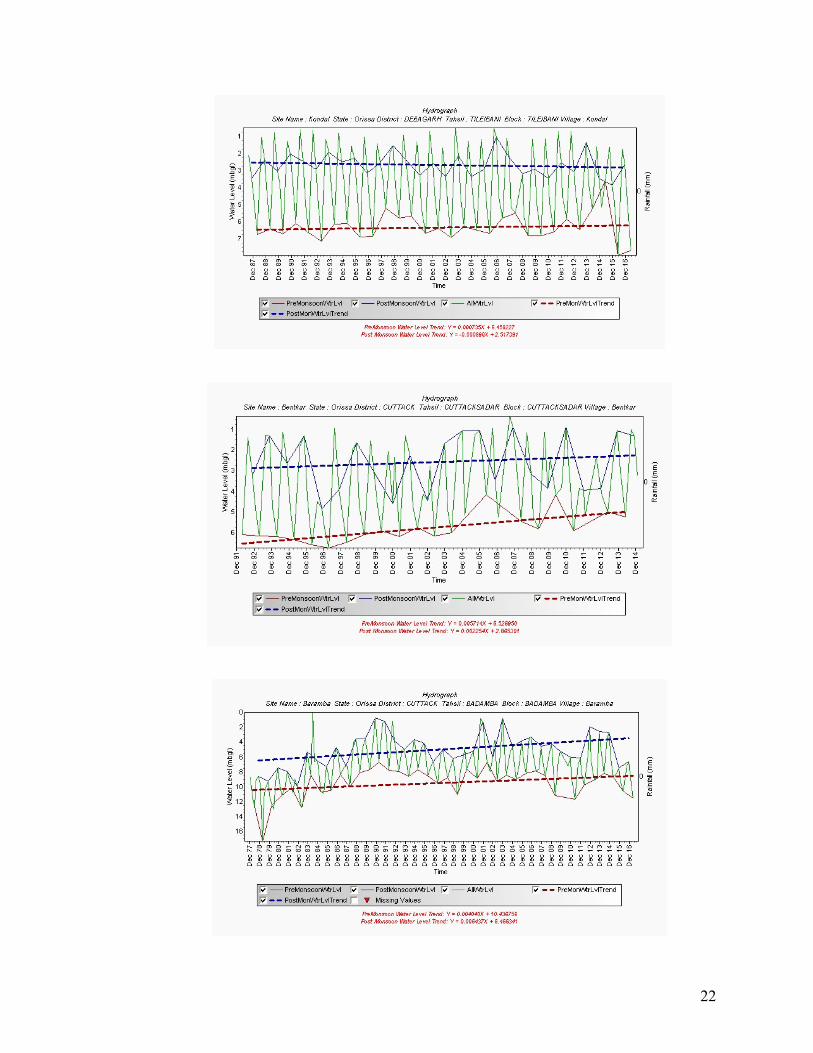
6.2 ANALYSIS OF DATA
The water levels reflect the cumulative effect of natural recharge discharge conditions and ground water draft on
the ground water regime. Where the draft exceeds the recharge, its manifestation is reflected by distinct decline
in normal water level and where recharge is more than the draft rising trend is seen in water levels. The
hydrographs given in Plate 6.3 show the periods of recharge and discharge. Water level data collected four times
a year is subjected to analysis for inferring the change in water levels i.e. rise/ fall and trend in water levels with
reference to time and space.
15

16

17
6.2.1 HYDROGRAPH ANALYSIS
Long Term Water Level Trend Analysis
Hydrographs with Long term water level trend and comparison is given in Plate 6.3
6.2.2 WATER LEVEL ANALYSIS
i) General range of water level fluctuation as compared with previous measurement.
ii) Water level data of specific period as compared with corresponding water level data of previous
year.
iii) Comparison of water level data with the mean water level data of the preceding decade.
iv) Comparison of water level data of different measurements with pre-monsoon (April) data.
7.0 BEHAVIOUR OF WATER LEVEL DURING 2016 - 2017 During 2016-2017 the existing 1695 ational Hydrograph stations were monitored four times and behaviour of the
ground water regime during the year was inferred comparing the same with the decade mean, corresponding
previous year data and pre-monsoon water level data. On the basis of water level data of NHS, for each
measurement the following maps have been prepared.
1. Depth to water level for each measurement
2. Water level fluctuation in comparison to decade average.
3. Comparison of water levels to Pre-monsoon water levels.
4. Water level fluctuation in comparison to corresponding period of previous year.

18
Plate-6.3 HYDROGRAPHS OF NATIONAL HYDROGRAPHS STATIONS

19

20

21
22
23
Plate:7.1
24
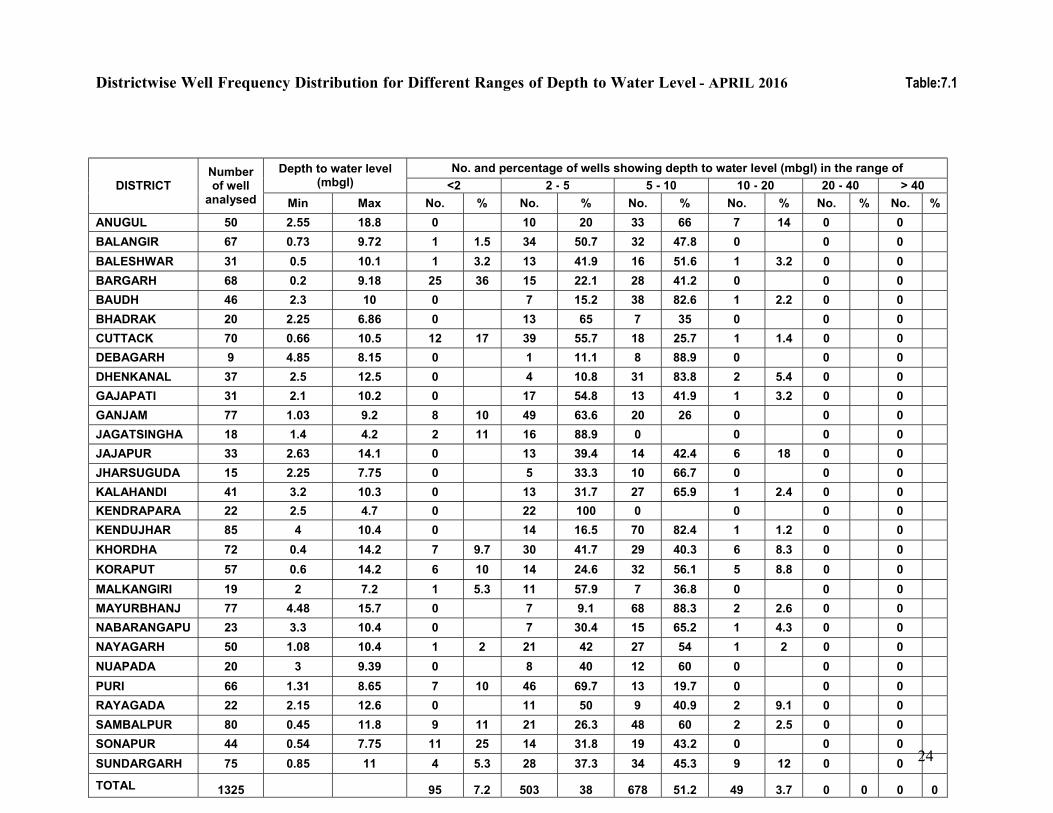
Districtwise Well Frequency Distribution for Different Ranges of Depth to Water Level - APRIL 2016 Table:7.1
DISTRICT Number of well
analysed
Depth to water level (mbgl)
No. and percentage of wells showing depth to water level (mbgl) in the range of
<2 2 - 5 5 - 10 10 - 20 20 - 40 > 40
Min Max No. % No. % No. % No. % No. % No. %
ANUGUL 50 2.55 18.8 0 10 20 33 66 7 14 0 0 BALANGIR 67 0.73 9.72 1 1.5 34 50.7 32 47.8 0 0 0 BALESHWAR 31 0.5 10.1 1 3.2 13 41.9 16 51.6 1 3.2 0 0 BARGARH 68 0.2 9.18 25 36 15 22.1 28 41.2 0 0 0 BAUDH 46 2.3 10 0 7 15.2 38 82.6 1 2.2 0 0 BHADRAK 20 2.25 6.86 0 13 65 7 35 0 0 0 CUTTACK 70 0.66 10.5 12 17 39 55.7 18 25.7 1 1.4 0 0 DEBAGARH 9 4.85 8.15 0 1 11.1 8 88.9 0 0 0 DHENKANAL 37 2.5 12.5 0 4 10.8 31 83.8 2 5.4 0 0 GAJAPATI 31 2.1 10.2 0 17 54.8 13 41.9 1 3.2 0 0 GANJAM 77 1.03 9.2 8 10 49 63.6 20 26 0 0 0 JAGATSINGHA 18 1.4 4.2 2 11 16 88.9 0 0 0 0 JAJAPUR 33 2.63 14.1 0 13 39.4 14 42.4 6 18 0 0 JHARSUGUDA 15 2.25 7.75 0 5 33.3 10 66.7 0 0 0 KALAHANDI 41 3.2 10.3 0 13 31.7 27 65.9 1 2.4 0 0 KENDRAPARA 22 2.5 4.7 0 22 100 0 0 0 0 KENDUJHAR 85 4 10.4 0 14 16.5 70 82.4 1 1.2 0 0 KHORDHA 72 0.4 14.2 7 9.7 30 41.7 29 40.3 6 8.3 0 0 KORAPUT 57 0.6 14.2 6 10 14 24.6 32 56.1 5 8.8 0 0 MALKANGIRI 19 2 7.2 1 5.3 11 57.9 7 36.8 0 0 0 MAYURBHANJ 77 4.48 15.7 0 7 9.1 68 88.3 2 2.6 0 0 NABARANGAPU 23 3.3 10.4 0 7 30.4 15 65.2 1 4.3 0 0 NAYAGARH 50 1.08 10.4 1 2 21 42 27 54 1 2 0 0 NUAPADA 20 3 9.39 0 8 40 12 60 0 0 0 PURI 66 1.31 8.65 7 10 46 69.7 13 19.7 0 0 0 RAYAGADA 22 2.15 12.6 0 11 50 9 40.9 2 9.1 0 0 SAMBALPUR 80 0.45 11.8 9 11 21 26.3 48 60 2 2.5 0 0 SONAPUR 44 0.54 7.75 11 25 14 31.8 19 43.2 0 0 0 SUNDARGARH 75 0.85 11 4 5.3 28 37.3 34 45.3 9 12 0 0
TOTAL 1325 95 7.2 503 38 678 51.2 49 3.7 0 0 0 0
25
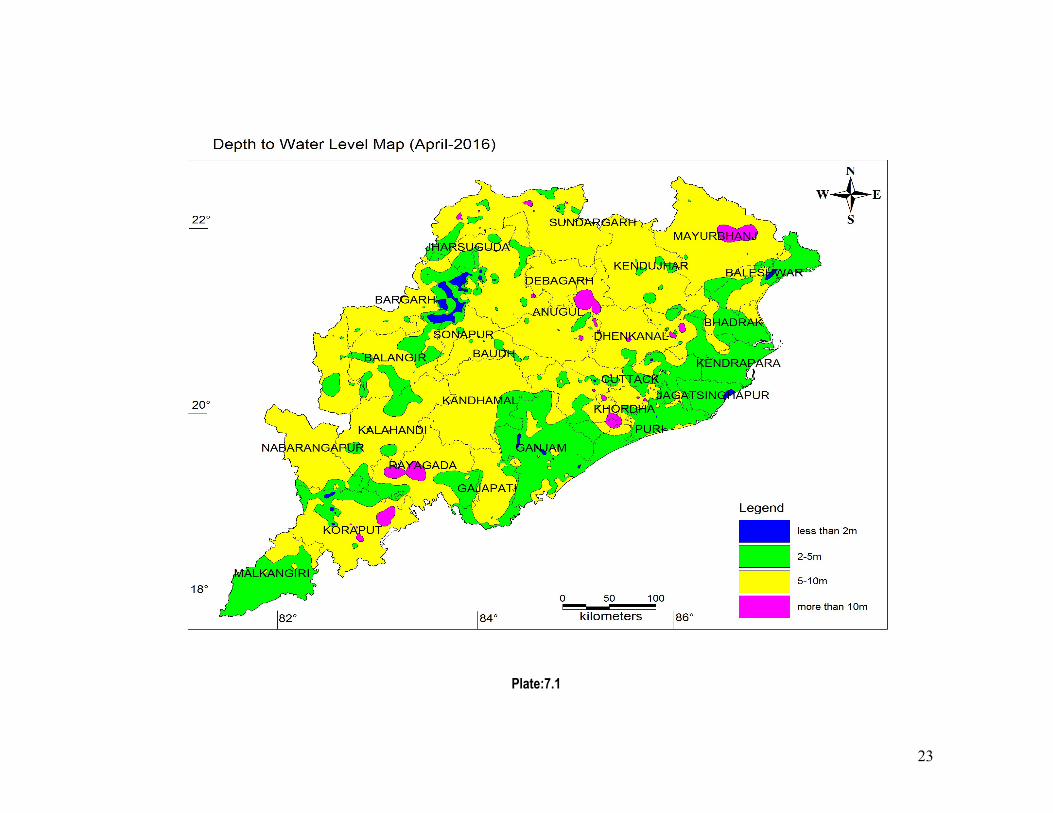
7.1 DEPTH TO WATER LEVEL
7.1.1 DEPTH TO WATER LEVEL OF APRIL 2016
During April 2016, the water level (meter below ground level) in the state varies from minimum of 0.2
magl in Baragarh district to a maximum of 18.8 mbgl in Anugul district district and water levels mostly
range from 2 to 10 mbgl. The depth to water level map has been shown in Plate-7.1 and district wise
well frequency for different ranges of depth to water level are given in Table- 7.1.
Water level between 0-2 m
Only 7.2 % of the NHS wells recorded water level in this range during April 2016. This range generally
appear as small and isolated patches. Also this range is seen in isolated patches in Canal command
areas of Bargarh, Sonapur, Cuttack, Koraput, and Sambalpur districts with maximum 36% of wells in
Bargarh district.
Water level between 2-5 m
38% of the total NHS wells recorded water level in this range during April 2016. The coastal districts of
the state has the maximum number of wells showing this range of water level i.e., Kendrapara (100%),
and Jagatsinghpur (88.9%) Bhadark (65%), Puri (69.7%), Cuttack (55.7%),. The major command areas
of the state like Hirakud, Mahanadi, delta stage I & II, Baitarani, Salandi and Anandpur have shown water
level in this range.
Water level between 5-10 m
51.2 % of the NHS wells have shown water level in this range of 5 –10 mbgl. All the districts have
recorded water level in this range, i.e., this range gives the general water level in the state for April 2016.
The hard rock and hilly terrains of the state has recorded water level in this range in majority of wells. The
maximum percentage of wells in this range is recorded in Debagarh (88.9%), Mayurbhanj (88.3%) Jajpur
(87.8%), Baudh(82.6%), Dhenkanal (83.8%), and minimum in Ganjam (26%) district. Partially all the
district of Orissa show this category.
26
Water level between 10-20 m
3.7% of the wells of the state fall in this category. It is mostly in the hilly districts like Koraput (8.8%),
Sundargarh (12%), Anugul (14%), Rayagada (9.1%), and minimum in Kendujhar (1.2%).
Water level more than 20m
No well have shown more than 20m of water level during April 2016.
In general, it can be said that during the month of April 2016, the state recorded water level in 2-10 m
range in almost all the districts. Some wells in the hilly districts recorded water level in 10-20 m range.
27
Plate:7.2

28
Districtwise Well Frequency Distribution for Different Ranges of Depth to Water Level - AUGUST 2016 Table:- 7.2
DISTRICT Number of well
analysed
Depth to water level
(mbgl)
No. and percentage of wells showing depth to water level (mbgl) in the range of
<2 2 - 5 5 - 10 10 - 20 20 - 40 > 40
Min Max No. % No. % No. % No. % No. % No. % ANUGUL 63 0.30 9.70 27 42 26 41.3 10 15.9 0 0 0 BALANGIR 77 0.50 9.00 34 44 33 42.9 10 13.0 0 0 0 BALESHWAR 30 0.05 4.65 25 83 5 16.7 0 - 0 0 0 BARGARH 69 0.05 7.41 49 71 12 17.4 8 11.6 0 0 0 BAUDH 59 0.50 8.00 32 54 25 42.4 2 3.4 0 0 0 BHADRAK 14 0.15 3.04 13 92 1 7.1 0 - 0 0 0 CUTTACK 73 0.26 7.20 51 69 20 27.4 2 2.7 0 0 0 DEBAGARH 12 1.35 3.55 7 58 5 41.7 0 - 0 0 0 DHENKANAL 44 0.15 5.80 27 61 16 36.4 1 2.3 0 0 0 GAJAPATI 32 0.27 7.13 11 34 17 53.1 4 12.5 0 0 0 GANJAM 92 0.19 6.81 63 68 26 28.3 3 3.3 0 0 0 JAGATSINGHA 19 0.55 1.45 19 100 0 0 - 0 0 0 JAJAPUR 34 0.41 8.75 22 64 10 29.4 2 5.9 0 0 0 JHARSUGUDA 19 0.85 6.35 9 47 8 42.1 2 10.5 0 0 0 KALAHANDI 42 0.50 8.00 15 35 21 50.0 6 14.3 0 0 0 KENDRAPARA 25 0.65 2.35 24 96 1 4.0 0 - 0 0 0 KENDUJHAR 90 0.60 5.09 13 14 76 84.4 1 1.1 0 0 0 KHORDHA 78 0.10 6.20 44 56 26 33.3 8 10.3 0 0 0 KORAPUT 61 0.05 11.4 34 55 18 29.5 8 13.1 1 1.6 0 0 MALKANGIRI 21 0.38 1.90 21 100 0 - 0 - 0 0 0 MAYURBHANJ 84 1.06 6.02 18 21 63 75.0 3 3.6 0 0 0 NABARANGAPU 24 0.55 4.25 16 66 8 33.3 0 - 0 0 0 NAYAGARH 54 0.50 6.50 32 59 20 37.0 2 3.7 0 0 0 NUAPADA 26 1.23 6.43 11 42 11 42.3 4 15.4 0 0 0 PURI 76 0.23 8.18 50 65 19 25.0 7 9.2 0 0 0 RAYAGADA 22 0.80 10.4 11 50 7 31.8 3 13.6 1 4.5 0 0 SAMBALPUR 83 0.26 7.42 41 49 35 42.2 7 8.4 0 0 0 SONAPUR 47 0.41 6.41 28 59 18 38.3 1 2.1 0 0 0 SUNDARGARH 90 0.25 10.9 44 48 29 32.2 15 16.7 2 2.2 0 0
TOTAL 1478 793 53 567 38.4 114 7.7 4 0.3 0 0 0 0
29
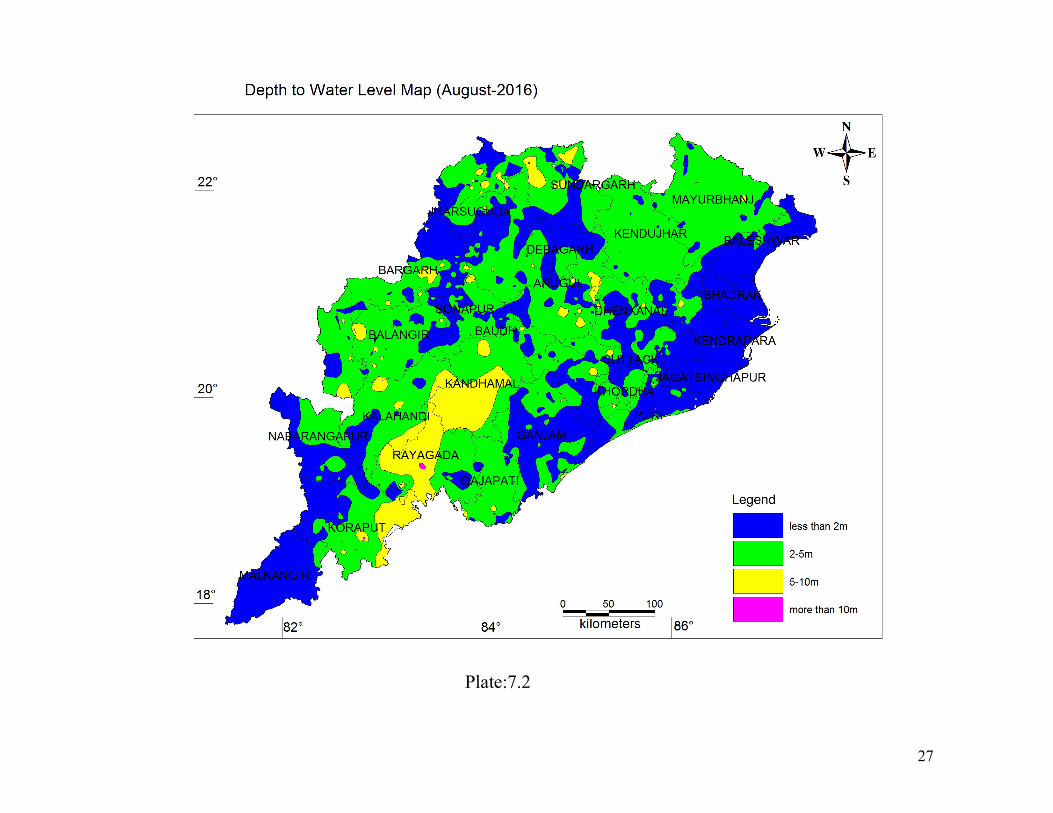
7.1.2 DEPTH TO WATER LEVEL OF AUGUST 2016
A perusal of data and maps pertaining to August 2016 shows that the depth to water level ranges from
0.05 to 11.4 mbgl and in majority (53.0%) of NHS wells level was in the range of 0-2 m below ground
level and 38.4% of wells in 2-5 m below ground level. The district-wise depth to water level of August
2016 is shown in Table 7.2 and the depth to water level map has been shown in Plate-7.2.
Water level between 0-2 m
53.0% of the wells monitored in the state has water level in this range. The districts like Jagatsinghpur
(100%), Malkangiri (100%), Kendrapara (96%), Bhadrak (92%) and Sonapur (59%) have majority of wells
with water level in this range. In most of the command areas of the state like the Hirakud, Rusikulya,
Mahanadi stage I & II, Upper Kolab and Potteru the water level is in this range.
Water level between 2-5 m
38.4 % of the wells monitored showed water level in this range. Among the coastal district Bhadrak (7.1
%), Jajapur (29.4%), Baleswar(16.7%)and parts of Puri, Ganjam and Gajapati had 2 to 5 mbgl of water
level. In the central and western Odisha, Nawapara (42.3%), Balangir (42.9%), Anugul (41.3%),
Mayurbhanj (75.0%) and Sundargarh (32.2%) showed water level in this range. All the districts of the
state have recorded in this range expect Jagatsingpur and Malkangiri, where all the wells fall in the
range of 0-2 m.
Water level between 5-10 m
Water level in this range was recorded in 7.9% of the wells in the state. Districts Like Anugul (15.9%),
Balangir(13.0%), Bargarh(11.6%), Gajapati(12.5%), Jharsuguda(10.5), Kalahandi (27.8%),
Koraput(13.1%, Nuapada( 15.4%) and Sundargarh(16.7%) showed water level in more than 10% of the
wells in this range. They occur as isolated patches in areas where the water level is generally in 2-5 m
range.

30
Water level between 10-20 m
Only a 4 well fall in this category and ie from 2 well in Sundaragarh,1 in Rayagada and 1 in Koraput
district.
Water level greater than 20 m
None of the wells monitored during August 2016 showed water level in this range.
In general the water level in the state during August 2016 monitoring is found in the range of 0-2 m bgl
especially in the coastal stretch and in parts of the hilly terrain, whereas 2-5 m bgl water level is found in
the coastal and hard rock terrain.
31
Plate:7.3
32
Districtwise Well Frequency Distribution for Different Ranges of Depth to Water Level - NOVEMBER 2016 Table:- 7.3
DISTRICT Number of well
analysed
Depth to water level
(mbgl)
No. and percentage of wells showing depth to water level (mbgl) in the range of
<2 2 - 5 5 - 10 10 - 20 20 - 40 > 40
Min Max No. % No. % No. % No. % No. % No. %
ANUGUL 63 0.6 15.3 9 14 38 60.3 14 22.2 2 3.2 0 0 BALANGIR 70 1.1 7.3 14 20 49 70 7 10 0 0 0 BALESHWAR 29 0.2 4.8 10 34 19 65.5 0 0 0 0 BARGARH 68 1.21 7.11 15 22 48 70.6 5 7.4 0 0 0 BAUDH 53 0.85 7.85 18 34 33 62.3 2 3.8 0 0 0 BHADRAK 12 1.08 6.75 10 83 1 8.3 1 8.3 0 0 0 CUTTACK 68 0.37 6.6 27 39 38 55.9 3 4.4 0 0 0 DEBAGARH 12 2.45 6.25 0 10 83.3 2 16.7 0 0 0 DHENKANAL 44 1.25 7.69 12 27 22 50 10 22.7 0 0 0 GAJAPATI 31 0.7 7.29 8 25 21 67.7 2 6.5 0 0 0 GANJAM 81 0.25 7.2 35 43 39 48.1 7 8.6 0 0 0 JAGATSINGHA 19 1.3 2.25 14 73 5 26.3 0 0 0 0 JAJAPUR 23 1.1 8.75 8 34 11 47.8 4 17.4 0 0 0 JHARSUGUDA 19 1.35 5.85 4 21 13 68.4 2 10.5 0 0 0 KALAHANDI 44 1 7.8 9 20 30 68.2 5 11.4 0 0 0 KANDHAMAL 16 3.1 10.5 0 10 62.5 5 31.3 1 6.3 0 0 KENDRAPARA 22 1.2 3.9 13 59 9 40.9 0 0 0 0 KENDUJHAR 89 1.48 7.01 4 4.5 78 87.6 7 7.9 0 0 0 KHORDHA 65 0.1 9.15 15 23 33 50.8 17 26.2 0 0 0 KORAPUT 61 0.05 11.3 16 26 26 42.6 18 29.5 1 1.6 0 0 MALKANGIRI 21 0.8 4.4 13 61 8 38.1 0 0 0 0 MAYURBHANJ 82 2.16 9.18 0 75 91.5 7 8.5 0 0 0 NABARANGAPU 26 1 5.2 8 30 17 65.4 1 3.8 0 0 0 NAYAGARH 55 0.7 7 15 27 37 67.3 3 5.5 0 0 0 NUAPADA 26 1.5 6.87 4 15 18 69.2 4 15.4 0 0 0 PURI 87 0.8 8.3 27 31 53 60.9 7 8 0 0 0 RAYAGADA 22 1.1 9.4 9 40 8 36.4 5 22.7 0 0 0 SAMBALPUR 84 0.6 9.25 19 22 53 63.1 12 14.3 0 0 0 SONAPUR 46 0.77 5.42 10 21 33 71.7 3 6.5 0 0 0 SUNDARGARH 89 0.45 10.1 26 29 41 46.1 21 23.6 1 1.1 0 0 TOTAL 1427 372 26 876 61.4 174 12.2 5 0.4 0 0 0 0
33
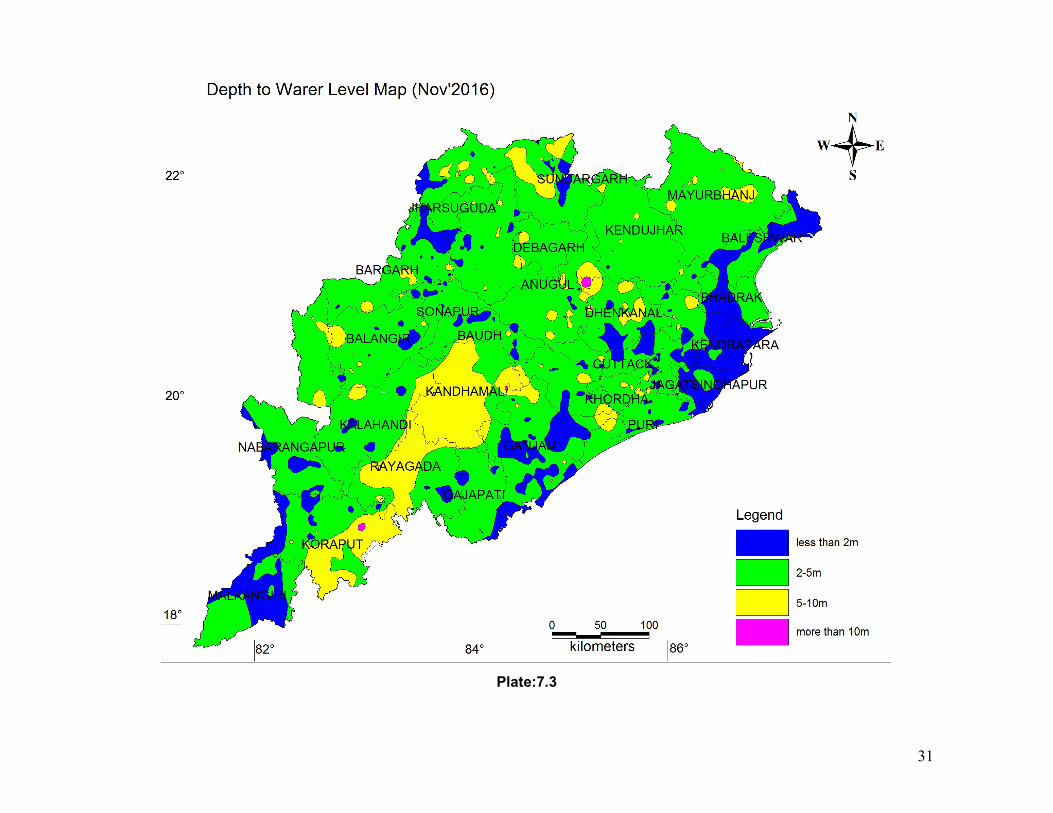
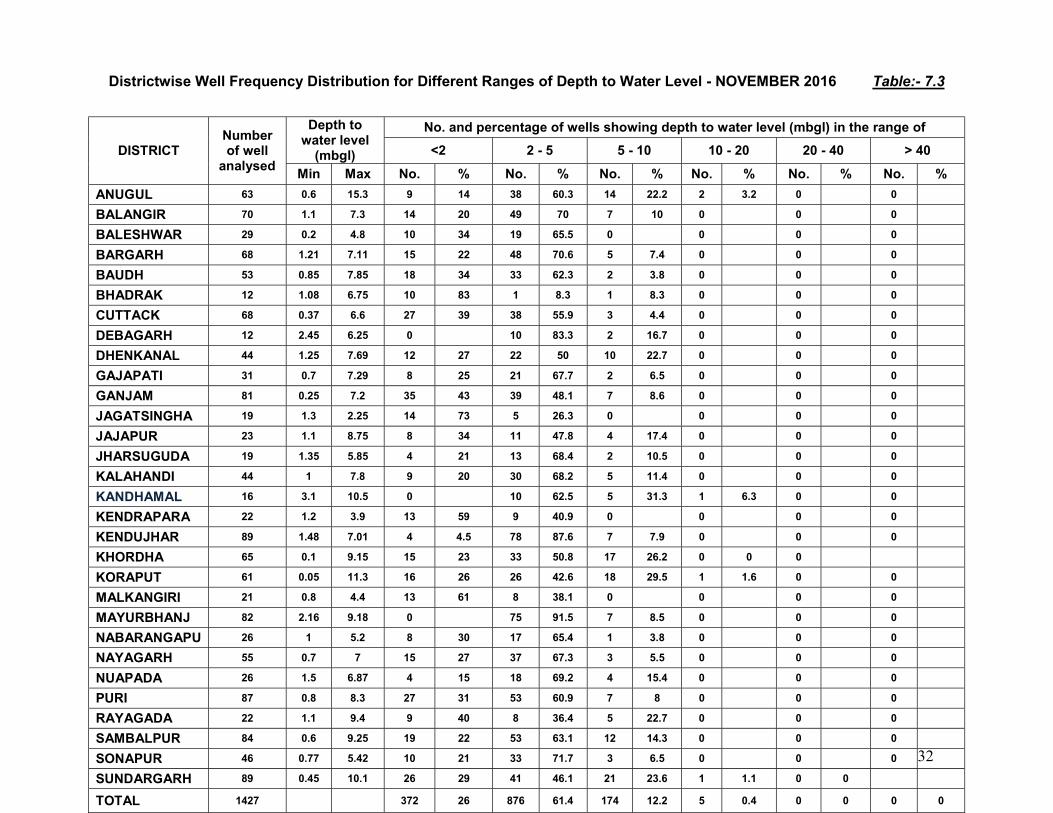
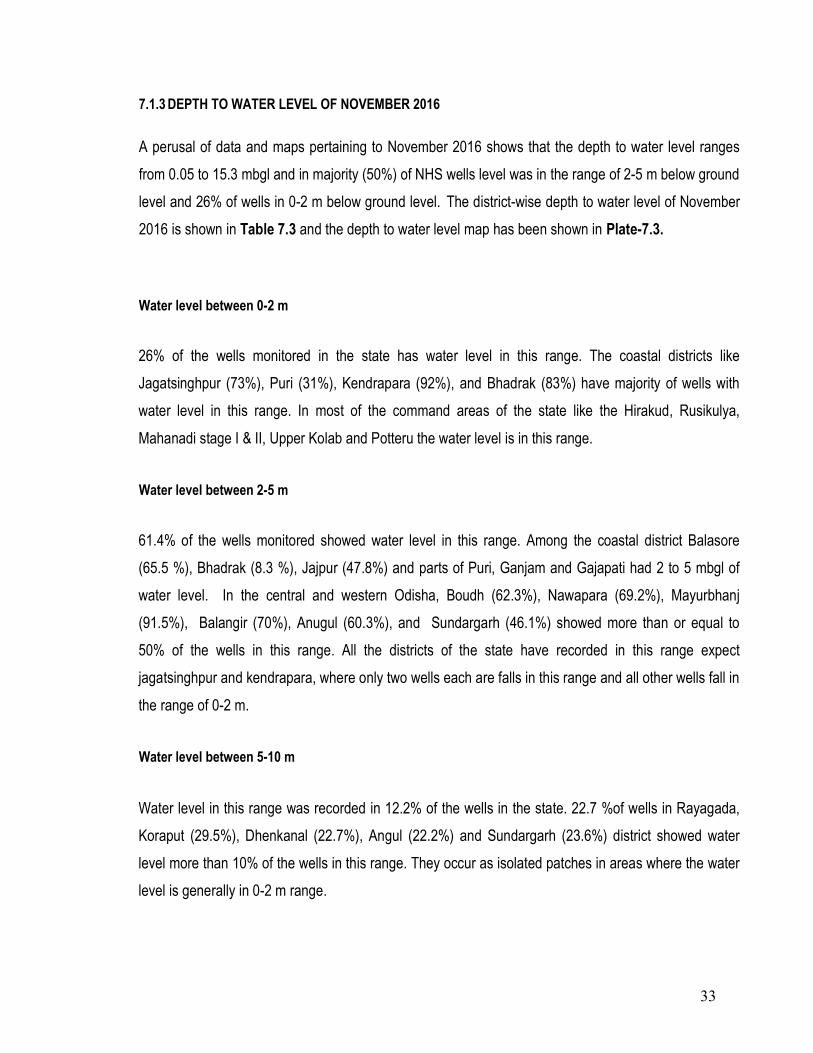
7.1.3 DEPTH TO WATER LEVEL OF NOVEMBER 2016
A perusal of data and maps pertaining to November 2016 shows that the depth to water level ranges
from 0.05 to 15.3 mbgl and in majority (50%) of NHS wells level was in the range of 2-5 m below ground
level and 26% of wells in 0-2 m below ground level. The district-wise depth to water level of November
2016 is shown in Table 7.3 and the depth to water level map has been shown in Plate-7.3.
Water level between 0-2 m
26% of the wells monitored in the state has water level in this range. The coastal districts like
Jagatsinghpur (73%), Puri (31%), Kendrapara (92%), and Bhadrak (83%) have majority of wells with
water level in this range. In most of the command areas of the state like the Hirakud, Rusikulya,
Mahanadi stage I & II, Upper Kolab and Potteru the water level is in this range.
Water level between 2-5 m
61.4% of the wells monitored showed water level in this range. Among the coastal district Balasore
(65.5 %), Bhadrak (8.3 %), Jajpur (47.8%) and parts of Puri, Ganjam and Gajapati had 2 to 5 mbgl of
water level. In the central and western Odisha, Boudh (62.3%), Nawapara (69.2%), Mayurbhanj
(91.5%), Balangir (70%), Anugul (60.3%), and Sundargarh (46.1%) showed more than or equal to
50% of the wells in this range. All the districts of the state have recorded in this range expect
jagatsinghpur and kendrapara, where only two wells each are falls in this range and all other wells fall in
the range of 0-2 m.
Water level between 5-10 m
Water level in this range was recorded in 12.2% of the wells in the state. 22.7 %of wells in Rayagada,
Koraput (29.5%), Dhenkanal (22.7%), Angul (22.2%) and Sundargarh (23.6%) district showed water
level more than 10% of the wells in this range. They occur as isolated patches in areas where the water
level is generally in 0-2 m range.
34
Water level between 10-20 m
Only 5 wells fall in this category and 2 in Anugul,1 in Kandhamal,1 in Koraput and 1 in Sundaragarh.
Water level more than 20m
None of the wells monitored during November 2016 showed water level in this range.
In general the water level in the state during November 2016 monitoring is found in the range of 0-2 m
bgl especially in the coastal stretch and in parts of the hilly terrain, whereas 2-5 m bgl water level is
found in the coastal and hard rock terrain.

35
Plate:7.4
36
Districtwise Well Frequency Distribution for Different Ranges of Depth to Water Level - JANUARY 2017 Table:- 7.4
DISTRICT Number of well
analysed
Depth to water level
(mbgl)
No. and percentage of wells showing depth to water level (mbgl) in the range of
<2 2 - 5 5 - 10 10 - 20 20 - 40 > 40
Min Max No. % No. % No. % No. % No. % No. %
ANUGUL 63 2.1 18.1 0 28 44.4 31 49.2 4 6.3 0 0 BALANGIR 77 1 7.85 7 9.1 56 72.7 14 18.2 0 0 0 BARGARH 73 0.32 8.43 21 28 42 57.5 10 13.7 0 0 0 BAUDH 54 1.5 7.3 9 16 41 75.9 4 7.4 0 0 0 CUTTACK 70 0.5 8.2 16 22 43 61.4 11 15.7 0 0 0 DEBAGARH 12 2.95 6.88 0 7 58.3 5 41.7 0 0 0 DHENKANAL 42 1.8 9 1 2.4 24 57.1 17 40.5 0 0 0 GAJAPATI 33 0.85 10.5 2 6.1 20 60.6 10 30.3 1 3 0 0 GANJAM 84 1.13 8.35 14 16 50 59.5 20 23.8 0 0 0 JAGATSINGHA 19 2.15 3.8 0 19 100 0 0 0 0 JAJAPUR 18 1.9 6.88 1 5.6 11 61.1 6 33.3 0 0 0 JHARSUGUDA 38 2.2 8.2 0 25 65.8 13 34.2 0 0 0 KALAHANDI 19 3.2 9.5 0 6 31.6 13 68.4 0 0 0 kandhamal 26 1.4 4.35 6 23 20 76.9 0 0 0 0 KENDRAPARA 83 2.69 8.8 0 70 84.3 13 15.7 0 0 0 KENDUJHAR 74 0.3 13.1 11 14 30 40.5 29 39.2 4 5.4 0 0 KHORDHA 62 0.06 12.6 7 11 25 40.3 28 45.2 2 3.2 0 0 KORAPUT 21 1.4 6.25 2 9.5 15 71.4 4 19 0 0 0 MAYURBHANJ 83 2.46 12.9 0 69 83.1 13 15.7 1 1.2 0 0 NABARANGAPU 24 2 7.9 1 4.2 16 66.7 7 29.2 0 0 0 NAYAGARH 53 1 8.5 7 13 36 67.9 10 18.9 0 0 0 NUAPADA 29 2.57 9.46 0 19 65.5 10 34.5 0 0 0 PURI 83 0.45 9.5 15 18 58 69.9 10 12 0 0 0 RAYAGADA 22 1.65 11 4 18 12 54.5 5 22.7 1 4.5 0 0 SAMBALPUR 84 0.41 10 13 15 43 51.2 27 32.1 1 1.2 0 0 SONAPUR 48 0.65 7.53 9 18 27 56.3 12 25 0 0 0 SUNDARGARH 87 0.98 12.1 10 11 44 50.6 31 35.6 2 2.3 0 0 TOTAL 1381 156 11 856 62 353 25.6 16 1.2 0 0 0 0
37
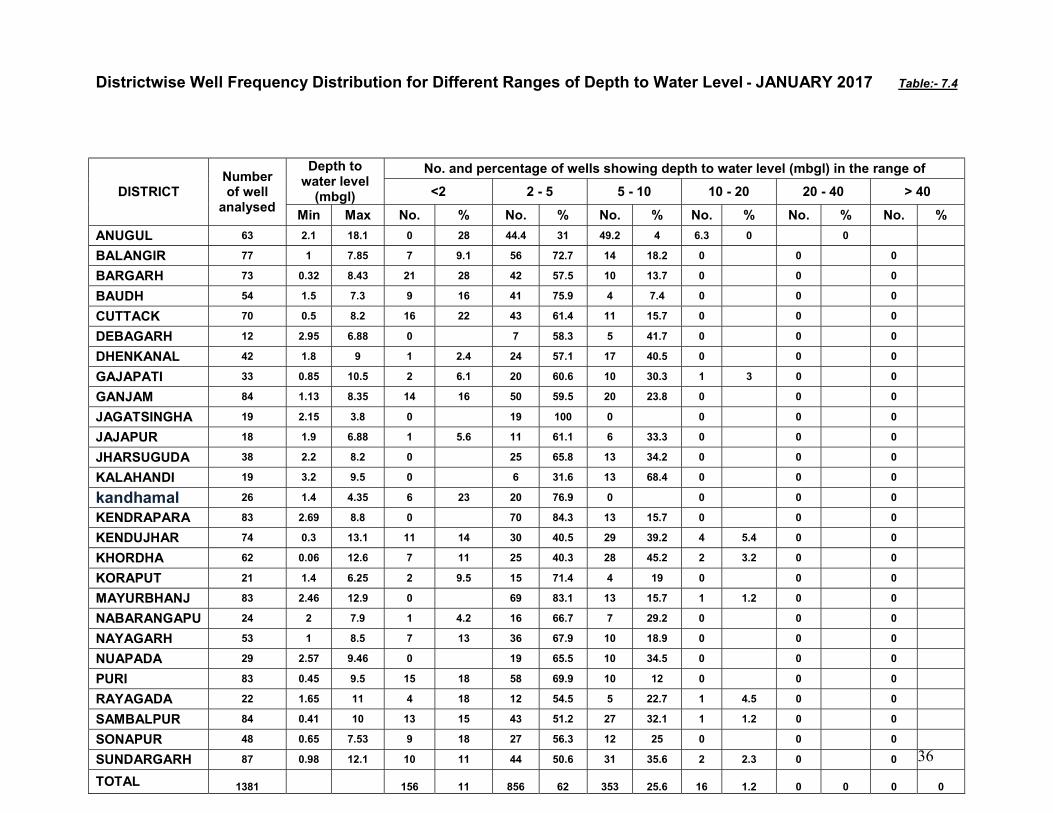
7.1.4. DEPTH TO WATER LEVEL OF JANUARY 2017
A perusal of data and maps pertaining to January 2017 shows that the depth to water level in majority
(62.0%) of NHS wells was level in the range of 2-5 m below ground level and 25.6 % of wells in 5-10 m
below ground level. The depth to water level map is presented in Plate-7.4 and the district wise frequency for
different ranges of depth to water level has been given in Table- 7.4.
Water level between 0-2m
11% of the wells monitored in the state has water level between 0-2 m. The districts like Ganjam 14%,
Bargarh (28%) , Cuttack (22%),Puri ,Sundargarh and Rayagada(18%) have majority of wells with
water level in this range. In most of the command areas of the state like the Hirakud, Rusikulya,
Mahanadi stage I & II, Upper Kolab and Potteru the water level is in this range shown in the plate as
isolated patches.
Water level between 2-5m
62% of the wells monitored showed water level in this range. Districts like Keonjhar (84.3%),
Mayurbhanj (83.1%), Kendrapara (76.9%),Jagatsingpur (100%), Baudh (75.9.5%),Balangir (72.7.%),
Kalahandi (65.8%) showed wells in this range. All the districts of the state have recorded in this range.
Water level between 5-10m
Water level in this range was recorded in 25.6% of the wells in the state. The districts namely
Dhenkanal (40.5%), Anugul (49.2%), Khordha (39.2%) and were having water level in this range in
majority of area. All the districts of the state except Jagatsingpur and Kendrapara have recorded in this
range.
Water level between 10-20m
Only a negligible 1.2% well measured in this category. There are 4 wells having deeper water level in
the ,Anugul and Khordha district , 2 wells in Sundargarh, Koraput district and 1 well in Gajapati,
Mayurbhanj, Rayagada and Sambalpur district.

38
Water level greater than 20m
None of the wells monitored during January 2017 showed water level in this range.
In general the water level in the state during January 2016 monitoring is found in the range of 2-5 m bgl
especially in the coastal stretch and in parts of the hilly terrain, whereas 0-2 m bgl water level is found in
the coastal and command areas in the state.
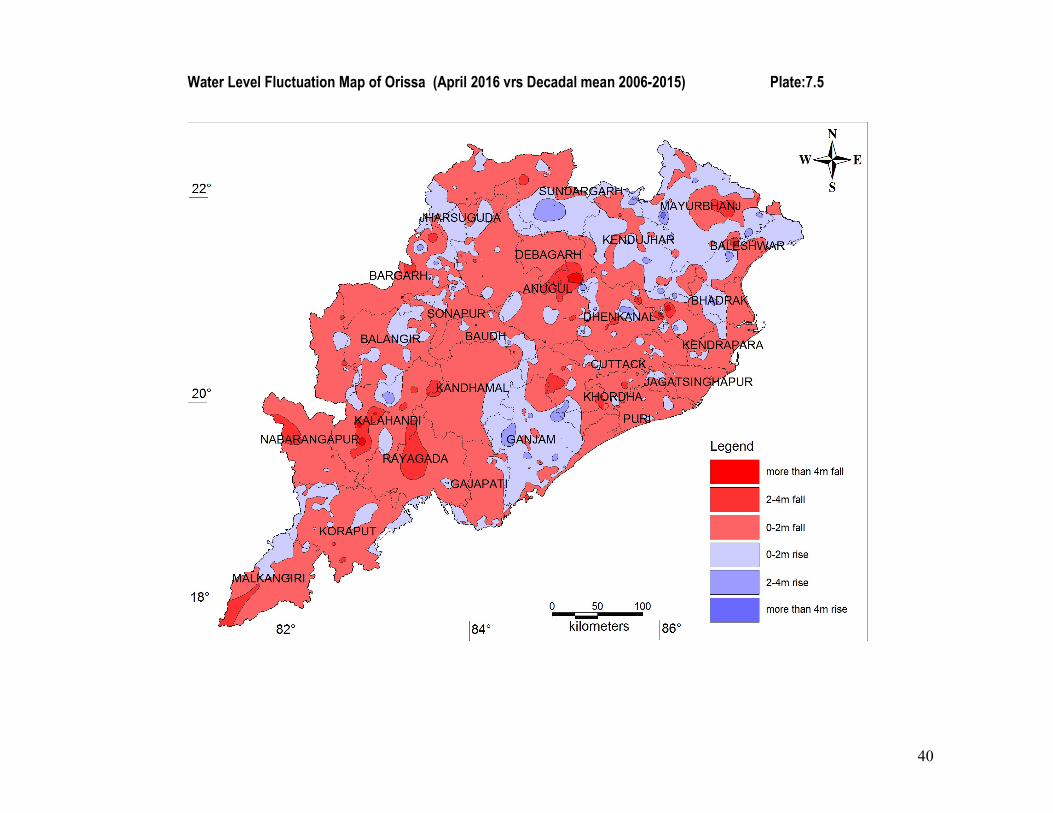
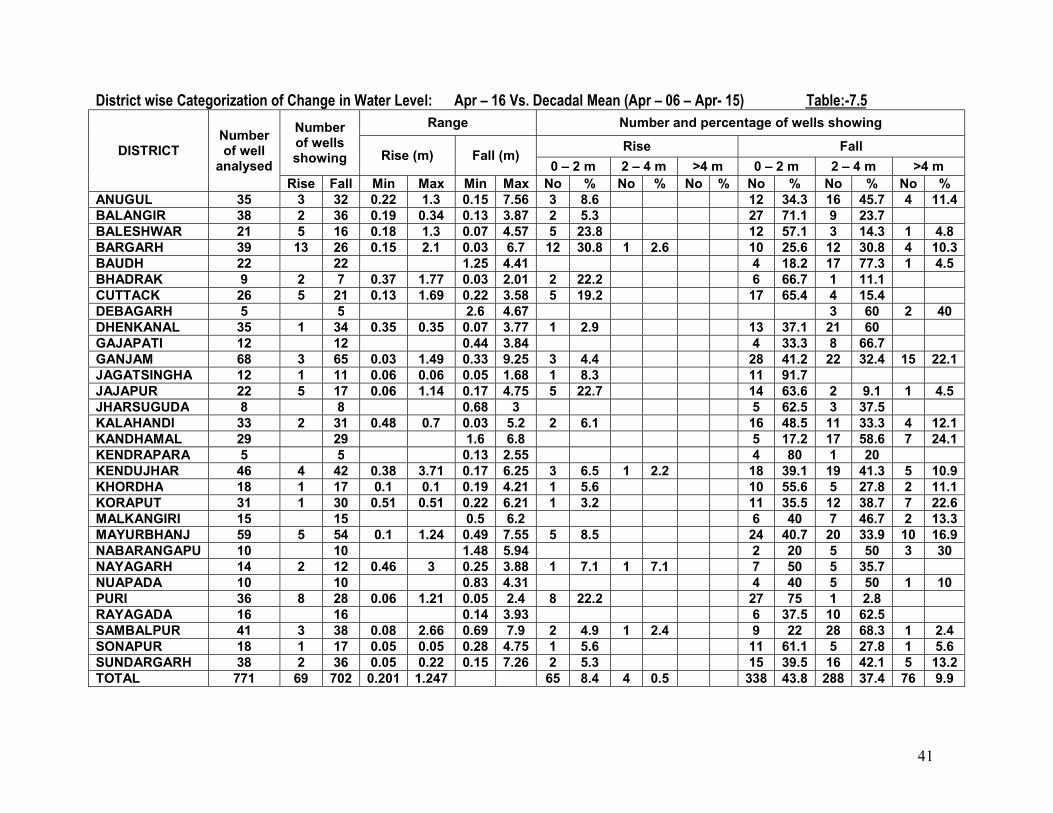
7.2 WATER LEVEL FLUCTUATION WITH RESTPECT TO DECADE MEAN 7.2.1 APRIL 2016 – DECADAL MAEN (Apr'06 - Apr'15)
The district-wise categorisation of change in water level in April-2016 with respect to the decade mean (April 06
to April 2015) has been given in Table-7.5 and rise and fall map has been presented in Plate-7.5.
Fall in water level
A perusal of the data and map pertaining to April 2016 with reference to Decadal mean (2006-2015)
shows fall in water level is observed in 91.05% of the total wells in the state. 43.8% of the wells have
shown fall in the 0-2m range. It varies from minimum of 17.2% of wells in Kandhamal district to a
maximum of 91.7% of wells in Jagatsinghpur district. The districts of Anugul, Bhadrak, Cuttack,
Dhenkanal, Gajapati, Ganjam, Jharsuguda, Kendrapara, Keonjhar, Khordha,Koraput, Malkangiri,
Nabarangpur, Puri and Rayagada have recorded have more than 50% of wells showing a fall in this
range. The range of 2-4m fall in water level has been observed in 37.4% of the state. The maximum is
in Sambalpur district (68.3%). A fall of more than 4m have been observed only in 9.9% of the total NHS
monitored in the state.
Rise in water level
A perusal of the data and map pertaining to April 2016 with reference to Decadal mean (2006-2015)
shows that 8.9% of total NHS wells in the state shows rise in water level. Rise in water level between 0-
2m has been observed in 8.4% of the network stations in the state. It varies from minimum of 2.9%
Dhenkanal to a maximum of 30.8% in Bargarh district. All the districts have recorded rise of water level

39
in some of the NHSs except Anugul, Baleshwar, Malkangiri and Nabarangpur where all the NHSs
shown fall in water level. The rise in water level between the range of 2-4m has been noticed in 0.5 %
of wells mainly in the districts of Bargarh (2.6%), Kendujhar(2.2%),Nayagarh(7.1%) and
Sambalpur(2.4%).
In general a fall has been recorded in water level of April 2016 when compared with the decadal
mean (April 2006-2015).
40
Water Level Fluctuation Map of Orissa (April 2016 vrs Decadal mean 2006-2015) Plate:7.5
41
District wise Categorization of Change in Water Level: Apr – 16 Vs. Decadal Mean (Apr – 06 – Apr- 15) Table:-7.5
DISTRICT Number of well
analysed
Number of wells showing
Range Number and percentage of wells showing
Rise (m) Fall (m) Rise Fall
0 – 2 m 2 – 4 m >4 m 0 – 2 m 2 – 4 m >4 m Rise Fall Min Max Min Max No % No % No % No % No % No %
ANUGUL 35 3 32 0.22 1.3 0.15 7.56 3 8.6 12 34.3 16 45.7 4 11.4 BALANGIR 38 2 36 0.19 0.34 0.13 3.87 2 5.3 27 71.1 9 23.7 BALESHWAR 21 5 16 0.18 1.3 0.07 4.57 5 23.8 12 57.1 3 14.3 1 4.8 BARGARH 39 13 26 0.15 2.1 0.03 6.7 12 30.8 1 2.6 10 25.6 12 30.8 4 10.3 BAUDH 22 22 1.25 4.41 4 18.2 17 77.3 1 4.5 BHADRAK 9 2 7 0.37 1.77 0.03 2.01 2 22.2 6 66.7 1 11.1 CUTTACK 26 5 21 0.13 1.69 0.22 3.58 5 19.2 17 65.4 4 15.4 DEBAGARH 5 5 2.6 4.67 3 60 2 40 DHENKANAL 35 1 34 0.35 0.35 0.07 3.77 1 2.9 13 37.1 21 60 GAJAPATI 12 12 0.44 3.84 4 33.3 8 66.7 GANJAM 68 3 65 0.03 1.49 0.33 9.25 3 4.4 28 41.2 22 32.4 15 22.1 JAGATSINGHA 12 1 11 0.06 0.06 0.05 1.68 1 8.3 11 91.7 JAJAPUR 22 5 17 0.06 1.14 0.17 4.75 5 22.7 14 63.6 2 9.1 1 4.5 JHARSUGUDA 8 8 0.68 3 5 62.5 3 37.5 KALAHANDI 33 2 31 0.48 0.7 0.03 5.2 2 6.1 16 48.5 11 33.3 4 12.1 KANDHAMAL 29 29 1.6 6.8 5 17.2 17 58.6 7 24.1 KENDRAPARA 5 5 0.13 2.55 4 80 1 20 KENDUJHAR 46 4 42 0.38 3.71 0.17 6.25 3 6.5 1 2.2 18 39.1 19 41.3 5 10.9 KHORDHA 18 1 17 0.1 0.1 0.19 4.21 1 5.6 10 55.6 5 27.8 2 11.1 KORAPUT 31 1 30 0.51 0.51 0.22 6.21 1 3.2 11 35.5 12 38.7 7 22.6 MALKANGIRI 15 15 0.5 6.2 6 40 7 46.7 2 13.3 MAYURBHANJ 59 5 54 0.1 1.24 0.49 7.55 5 8.5 24 40.7 20 33.9 10 16.9 NABARANGAPU 10 10 1.48 5.94 2 20 5 50 3 30 NAYAGARH 14 2 12 0.46 3 0.25 3.88 1 7.1 1 7.1 7 50 5 35.7 NUAPADA 10 10 0.83 4.31 4 40 5 50 1 10 PURI 36 8 28 0.06 1.21 0.05 2.4 8 22.2 27 75 1 2.8 RAYAGADA 16 16 0.14 3.93 6 37.5 10 62.5 SAMBALPUR 41 3 38 0.08 2.66 0.69 7.9 2 4.9 1 2.4 9 22 28 68.3 1 2.4 SONAPUR 18 1 17 0.05 0.05 0.28 4.75 1 5.6 11 61.1 5 27.8 1 5.6 SUNDARGARH 38 2 36 0.05 0.22 0.15 7.26 2 5.3 15 39.5 16 42.1 5 13.2 TOTAL 771 69 702 0.201 1.247 65 8.4 4 0.5 338 43.8 288 37.4 76 9.9

42
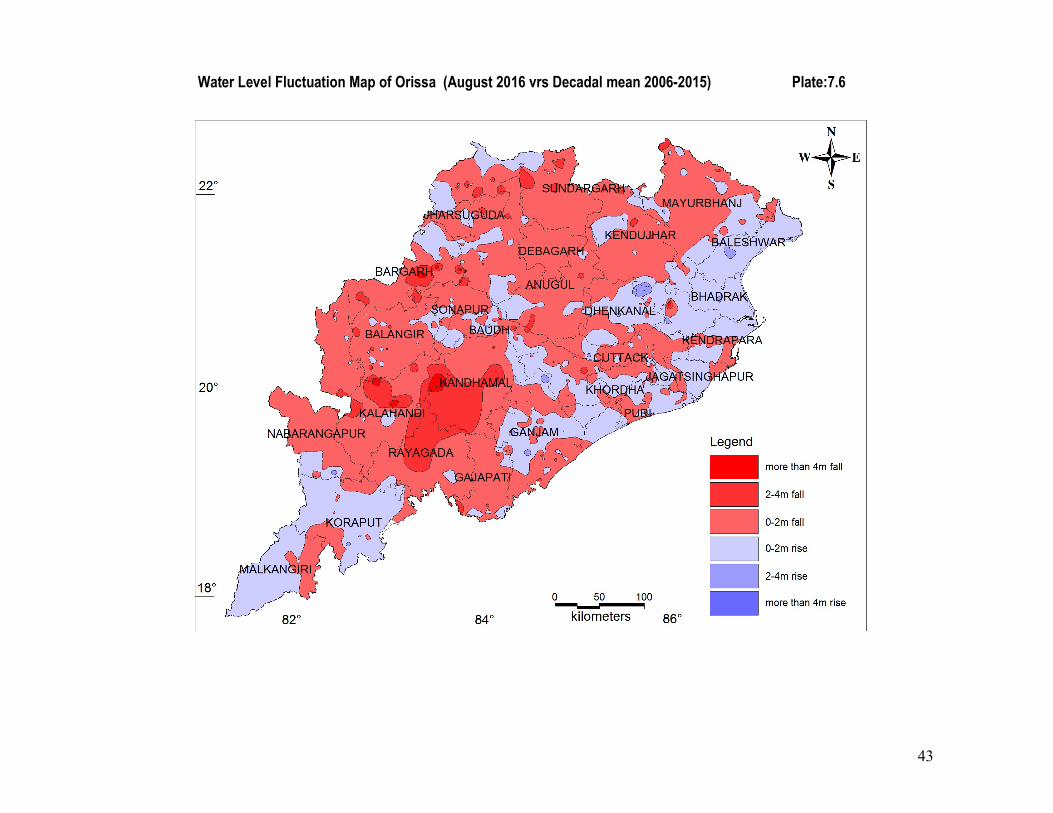
7.2.2 AUGUST 2016- DECADAL MEAN (AUGUST 2006- 2015)
The district-wise categorisation of change in water level of August-2016 with respect to the decadal mean
(August 2006 – August 2015) has been given in Table 7.6 and rise and fall map has been presented in Plate 7.6.
Rise in water level
A perusal of the data and map pertaining to August 2016 with reference to decadal mean (2006-15)
shows that rise in water level between 0-2m has been observed in 65.4% of the network stations in the
state. All the districts have recorded rise of water level in this range. Rise in water level between the
range of 2-4m has been noticed in 18.4% wells in isolated locations and more than 4m have been
observed in 1.9% of wells.
Fall in water level
Fall in water level is seen in patches mostly in the hard rock and hilly terrain of the state. Fall in water
level between 0-2 m has been observed in 12.4% of the network monitoring wells in the state. Fall in
water level between the range of 2-4m has been observed in 1.7% of network wells in the state. Fall in
water level of more 4m, is 0.1% of the total wells in the state.
In general a rise has been recorded in water level of August 2016 when compared with the decadal
mean (August 2006-2015). It can be safely concluded that variation in water level is not due to over
development; rather the water levels reflect the variation of rainfall in space and time.
43
Water Level Fluctuation Map of Orissa (August 2016 vrs Decadal mean 2006-2015) Plate:7.6
44
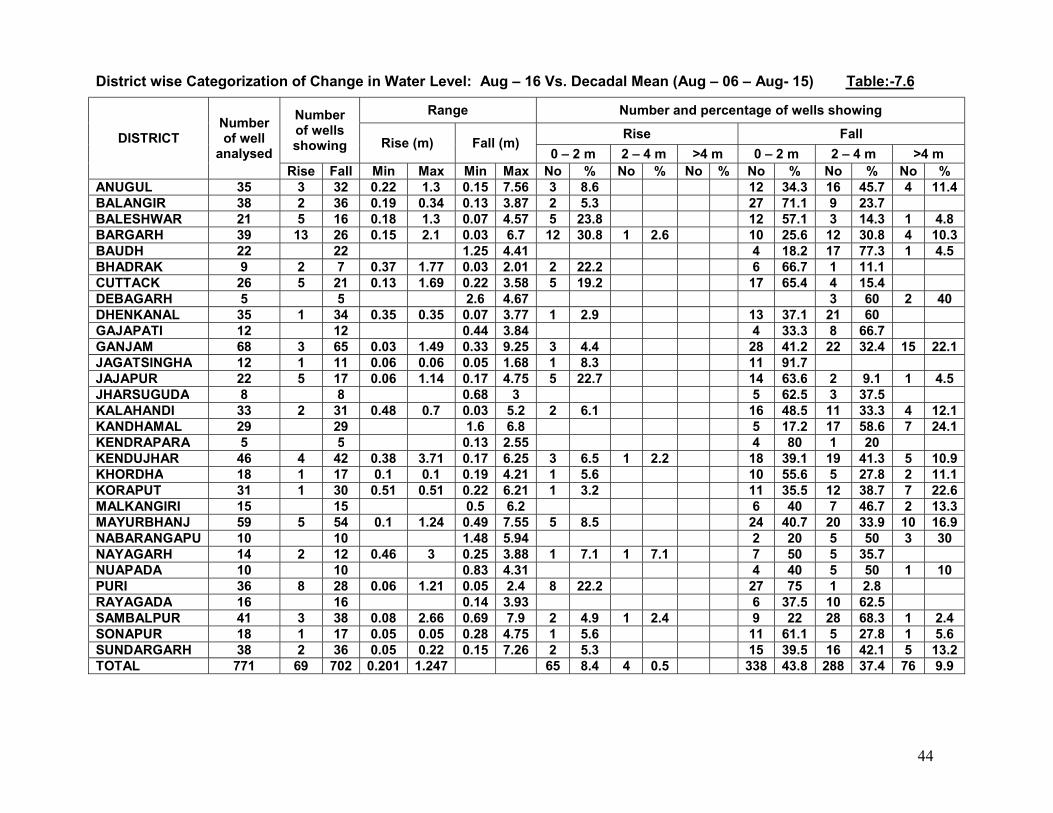
District wise Categorization of Change in Water Level: Aug – 16 Vs. Decadal Mean (Aug – 06 – Aug- 15) Table:-7.6
DISTRICT Number of well
analysed
Number of wells showing
Range Number and percentage of wells showing
Rise (m) Fall (m) Rise Fall
0 – 2 m 2 – 4 m >4 m 0 – 2 m 2 – 4 m >4 m Rise Fall Min Max Min Max No % No % No % No % No % No %
ANUGUL 35 3 32 0.22 1.3 0.15 7.56 3 8.6 12 34.3 16 45.7 4 11.4 BALANGIR 38 2 36 0.19 0.34 0.13 3.87 2 5.3 27 71.1 9 23.7 BALESHWAR 21 5 16 0.18 1.3 0.07 4.57 5 23.8 12 57.1 3 14.3 1 4.8 BARGARH 39 13 26 0.15 2.1 0.03 6.7 12 30.8 1 2.6 10 25.6 12 30.8 4 10.3 BAUDH 22 22 1.25 4.41 4 18.2 17 77.3 1 4.5 BHADRAK 9 2 7 0.37 1.77 0.03 2.01 2 22.2 6 66.7 1 11.1 CUTTACK 26 5 21 0.13 1.69 0.22 3.58 5 19.2 17 65.4 4 15.4 DEBAGARH 5 5 2.6 4.67 3 60 2 40 DHENKANAL 35 1 34 0.35 0.35 0.07 3.77 1 2.9 13 37.1 21 60 GAJAPATI 12 12 0.44 3.84 4 33.3 8 66.7 GANJAM 68 3 65 0.03 1.49 0.33 9.25 3 4.4 28 41.2 22 32.4 15 22.1 JAGATSINGHA 12 1 11 0.06 0.06 0.05 1.68 1 8.3 11 91.7 JAJAPUR 22 5 17 0.06 1.14 0.17 4.75 5 22.7 14 63.6 2 9.1 1 4.5 JHARSUGUDA 8 8 0.68 3 5 62.5 3 37.5 KALAHANDI 33 2 31 0.48 0.7 0.03 5.2 2 6.1 16 48.5 11 33.3 4 12.1 KANDHAMAL 29 29 1.6 6.8 5 17.2 17 58.6 7 24.1 KENDRAPARA 5 5 0.13 2.55 4 80 1 20 KENDUJHAR 46 4 42 0.38 3.71 0.17 6.25 3 6.5 1 2.2 18 39.1 19 41.3 5 10.9 KHORDHA 18 1 17 0.1 0.1 0.19 4.21 1 5.6 10 55.6 5 27.8 2 11.1 KORAPUT 31 1 30 0.51 0.51 0.22 6.21 1 3.2 11 35.5 12 38.7 7 22.6 MALKANGIRI 15 15 0.5 6.2 6 40 7 46.7 2 13.3 MAYURBHANJ 59 5 54 0.1 1.24 0.49 7.55 5 8.5 24 40.7 20 33.9 10 16.9 NABARANGAPU 10 10 1.48 5.94 2 20 5 50 3 30 NAYAGARH 14 2 12 0.46 3 0.25 3.88 1 7.1 1 7.1 7 50 5 35.7 NUAPADA 10 10 0.83 4.31 4 40 5 50 1 10 PURI 36 8 28 0.06 1.21 0.05 2.4 8 22.2 27 75 1 2.8 RAYAGADA 16 16 0.14 3.93 6 37.5 10 62.5 SAMBALPUR 41 3 38 0.08 2.66 0.69 7.9 2 4.9 1 2.4 9 22 28 68.3 1 2.4 SONAPUR 18 1 17 0.05 0.05 0.28 4.75 1 5.6 11 61.1 5 27.8 1 5.6 SUNDARGARH 38 2 36 0.05 0.22 0.15 7.26 2 5.3 15 39.5 16 42.1 5 13.2 TOTAL 771 69 702 0.201 1.247 65 8.4 4 0.5 338 43.8 288 37.4 76 9.9
45
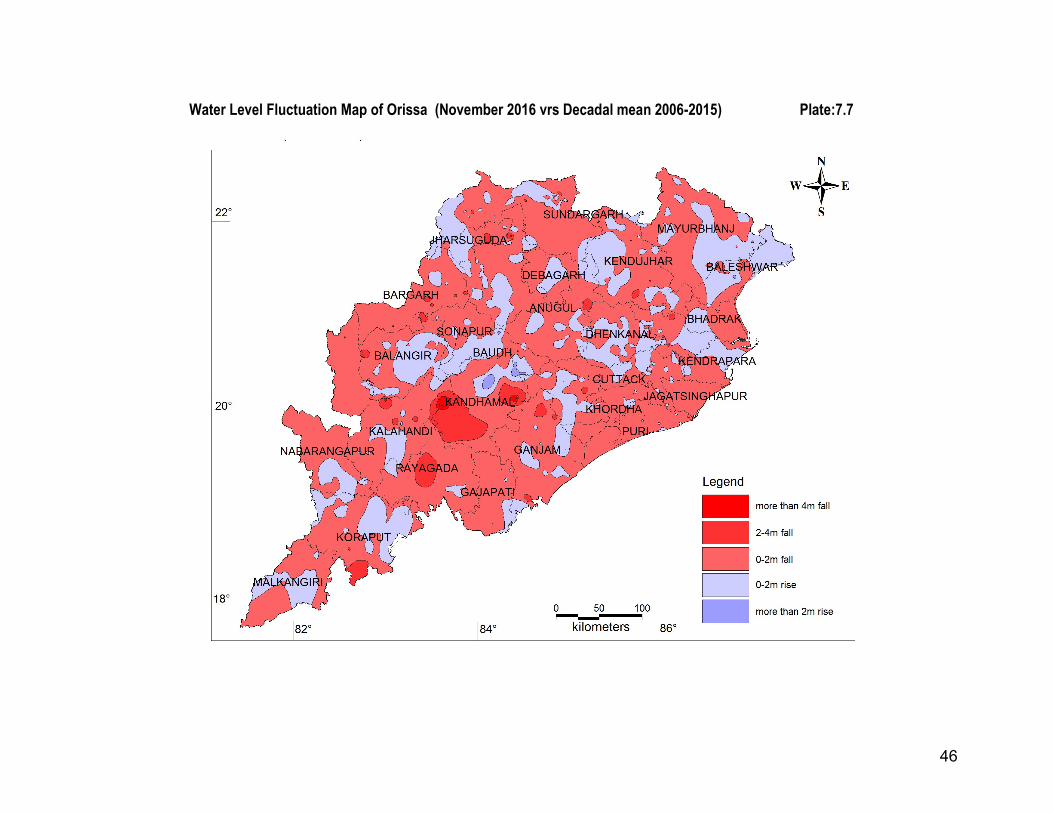
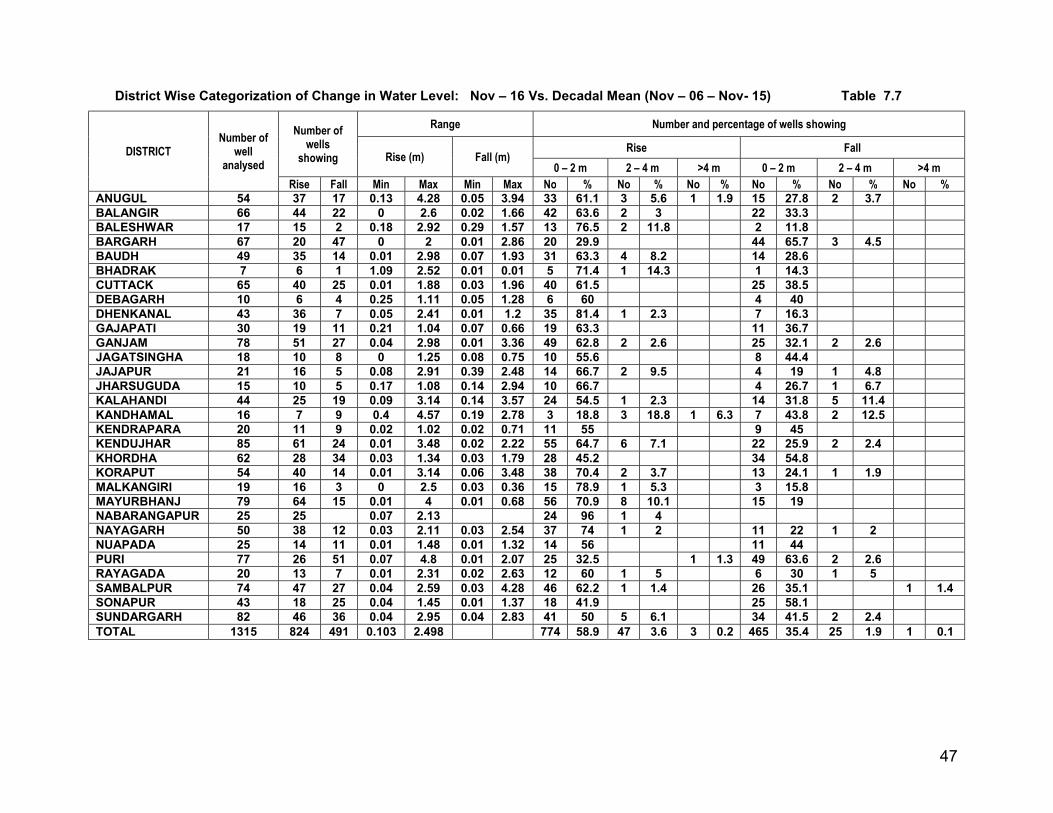
7.2.3 NOVEMBER 2016 - DECADAL MEAN (NOVEMBER 2006 - 2015)
The district-wise categorisation of change in water level during November-2016 with respect to the
decadal mean (November 2006- November-2015) has been given in Table 7.7 and presented in
Plate 7.7.
Rise in water level
A perusal of the data and map pertaining to November 2016 with reference to decadal
mean (2005-15) shows that rise in water level between 0-2m has been observed in 58.9%
of the network stations in the state. All the districts have recorded rise of water level in this
range. Rise in water level between the range of 2-4m has been noticed in 3.6% wells in
isolated locations and more than 4m have been observed in 0.2% of wells.
Fall in water level
Fall in water level is seen in patches mostly in the hard rock and hilly terrain of the state.
Fall in water level between 0-2 m has been observed in 35.4% of the network monitoring
wells in the state. Fall in water level between the range of 2-4m has been observed in 1.9%
of network wells in the state. Fall in water level of more 4m, is present in isolated areas with
0.1% of the total wells in the state.
In general a rise has been recorded in water level of November 2016 when compared with
the decadal mean (November 2005-2015). It can be safely concluded that variation in water
level is not due to over development; rather the water levels reflect the variation of rainfall in
space and time.
46
Water Level Fluctuation Map of Orissa (November 2016 vrs Decadal mean 2006-2015) Plate:7.7
47
District Wise Categorization of Change in Water Level: Nov – 16 Vs. Decadal Mean (Nov – 06 – Nov- 15) Table 7.7
DISTRICT Number of
well analysed
Number of wells
showing
Range Number and percentage of wells showing
Rise (m) Fall (m) Rise Fall
0 – 2 m 2 – 4 m >4 m 0 – 2 m 2 – 4 m >4 m Rise Fall Min Max Min Max No % No % No % No % No % No %
ANUGUL 54 37 17 0.13 4.28 0.05 3.94 33 61.1 3 5.6 1 1.9 15 27.8 2 3.7 BALANGIR 66 44 22 0 2.6 0.02 1.66 42 63.6 2 3 22 33.3 BALESHWAR 17 15 2 0.18 2.92 0.29 1.57 13 76.5 2 11.8 2 11.8 BARGARH 67 20 47 0 2 0.01 2.86 20 29.9 44 65.7 3 4.5 BAUDH 49 35 14 0.01 2.98 0.07 1.93 31 63.3 4 8.2 14 28.6 BHADRAK 7 6 1 1.09 2.52 0.01 0.01 5 71.4 1 14.3 1 14.3 CUTTACK 65 40 25 0.01 1.88 0.03 1.96 40 61.5 25 38.5 DEBAGARH 10 6 4 0.25 1.11 0.05 1.28 6 60 4 40 DHENKANAL 43 36 7 0.05 2.41 0.01 1.2 35 81.4 1 2.3 7 16.3 GAJAPATI 30 19 11 0.21 1.04 0.07 0.66 19 63.3 11 36.7 GANJAM 78 51 27 0.04 2.98 0.01 3.36 49 62.8 2 2.6 25 32.1 2 2.6 JAGATSINGHA 18 10 8 0 1.25 0.08 0.75 10 55.6 8 44.4 JAJAPUR 21 16 5 0.08 2.91 0.39 2.48 14 66.7 2 9.5 4 19 1 4.8 JHARSUGUDA 15 10 5 0.17 1.08 0.14 2.94 10 66.7 4 26.7 1 6.7 KALAHANDI 44 25 19 0.09 3.14 0.14 3.57 24 54.5 1 2.3 14 31.8 5 11.4 KANDHAMAL 16 7 9 0.4 4.57 0.19 2.78 3 18.8 3 18.8 1 6.3 7 43.8 2 12.5 KENDRAPARA 20 11 9 0.02 1.02 0.02 0.71 11 55 9 45 KENDUJHAR 85 61 24 0.01 3.48 0.02 2.22 55 64.7 6 7.1 22 25.9 2 2.4 KHORDHA 62 28 34 0.03 1.34 0.03 1.79 28 45.2 34 54.8 KORAPUT 54 40 14 0.01 3.14 0.06 3.48 38 70.4 2 3.7 13 24.1 1 1.9 MALKANGIRI 19 16 3 0 2.5 0.03 0.36 15 78.9 1 5.3 3 15.8 MAYURBHANJ 79 64 15 0.01 4 0.01 0.68 56 70.9 8 10.1 15 19 NABARANGAPUR 25 25 0.07 2.13 24 96 1 4 NAYAGARH 50 38 12 0.03 2.11 0.03 2.54 37 74 1 2 11 22 1 2 NUAPADA 25 14 11 0.01 1.48 0.01 1.32 14 56 11 44 PURI 77 26 51 0.07 4.8 0.01 2.07 25 32.5 1 1.3 49 63.6 2 2.6 RAYAGADA 20 13 7 0.01 2.31 0.02 2.63 12 60 1 5 6 30 1 5 SAMBALPUR 74 47 27 0.04 2.59 0.03 4.28 46 62.2 1 1.4 26 35.1 1 1.4 SONAPUR 43 18 25 0.04 1.45 0.01 1.37 18 41.9 25 58.1 SUNDARGARH 82 46 36 0.04 2.95 0.04 2.83 41 50 5 6.1 34 41.5 2 2.4 TOTAL 1315 824 491 0.103 2.498 774 58.9 47 3.6 3 0.2 465 35.4 25 1.9 1 0.1

48
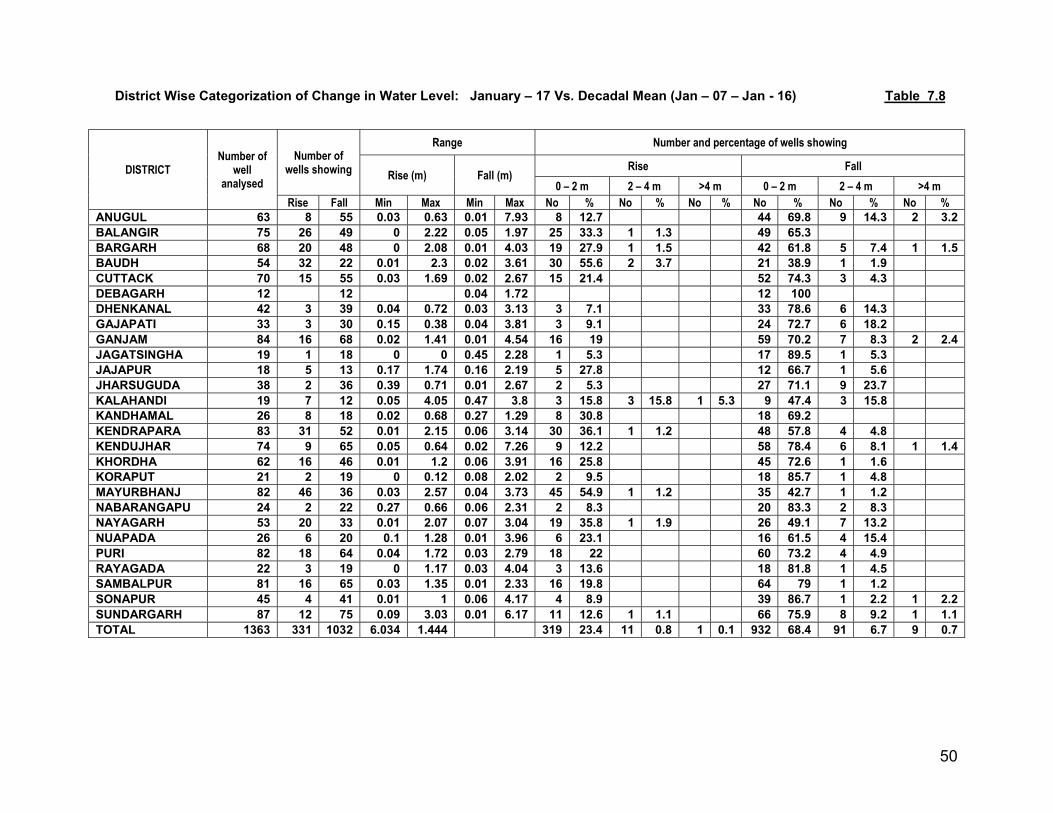
7.2.4 JANUARY’ 2017 - DECADAL MEAN (JANUARY 2007- 2016)
The district-wise categorisation of change in water level during January 2017 with respect to the decadal mean
(2007-2016) has been given in Table 7.8 and the fluctuation map in Plate 7.8.
Rise in water level
A perusal of the data and map pertaining to January 2017 with reference to Decadal mean (2007-2016)
shows that 24.28% of total NHS wells in the state shows rise in water level. Rise in water level between
0-2m has been observed in 23.4 % of the network stations in the state. All the districts have recorded
rise of water level in this range. It varies from a minimum of 5.3% in Kalahandi district to a maximum
rise of 54.9% in Mayaurbhanj district. The rise in water level between the range of 2-4m has observed
in 0.8%of the network station in the state.it varies from minimum of 1.1%in Sundargarh district and
maximum in 15.8% in Kandhamal district. one wells show more than 4m rise in water level in
Kandhamal districts.
Fall in water level
Fall in water level is seen in the 7.55 % of NHS wells of the state. Fall in water level between 0-2 m has
been observed in 68.4% of the network monitoring wells in the state. It ranges between 100% in
Debagarh to 38.9% in Baudh district. Almost all the districts of the state has recorded more than 50%
of wells in the range of 0-2m except Baudh,Kandhamal and Mayurbhanj district. The range of 2-4m fall
in water level has been observed in 6.7% of the state. The maximum is in Kalahandi district (23.7%). A
fall of more than 4m have been observed only in 0.7% of the total NHS monitored .
In general a fall has been recorded in water level of January 2017 when compared with the decadal
mean (January 2007-2016).

49
Water Level Fluctuation Map of Orissa (January 2017 vrs Decadal mean 2007-2016) Plate:7.8
50
District Wise Categorization of Change in Water Level: January – 17 Vs. Decadal Mean (Jan – 07 – Jan - 16) Table 7.8
DISTRICT Number of
well analysed
Number of wells showing
Range Number and percentage of wells showing
Rise (m) Fall (m) Rise Fall
0 – 2 m 2 – 4 m >4 m 0 – 2 m 2 – 4 m >4 m Rise Fall Min Max Min Max No % No % No % No % No % No %
ANUGUL 63 8 55 0.03 0.63 0.01 7.93 8 12.7 44 69.8 9 14.3 2 3.2 BALANGIR 75 26 49 0 2.22 0.05 1.97 25 33.3 1 1.3 49 65.3 BARGARH 68 20 48 0 2.08 0.01 4.03 19 27.9 1 1.5 42 61.8 5 7.4 1 1.5 BAUDH 54 32 22 0.01 2.3 0.02 3.61 30 55.6 2 3.7 21 38.9 1 1.9 CUTTACK 70 15 55 0.03 1.69 0.02 2.67 15 21.4 52 74.3 3 4.3 DEBAGARH 12 12 0.04 1.72 12 100 DHENKANAL 42 3 39 0.04 0.72 0.03 3.13 3 7.1 33 78.6 6 14.3 GAJAPATI 33 3 30 0.15 0.38 0.04 3.81 3 9.1 24 72.7 6 18.2 GANJAM 84 16 68 0.02 1.41 0.01 4.54 16 19 59 70.2 7 8.3 2 2.4 JAGATSINGHA 19 1 18 0 0 0.45 2.28 1 5.3 17 89.5 1 5.3 JAJAPUR 18 5 13 0.17 1.74 0.16 2.19 5 27.8 12 66.7 1 5.6 JHARSUGUDA 38 2 36 0.39 0.71 0.01 2.67 2 5.3 27 71.1 9 23.7 KALAHANDI 19 7 12 0.05 4.05 0.47 3.8 3 15.8 3 15.8 1 5.3 9 47.4 3 15.8 KANDHAMAL 26 8 18 0.02 0.68 0.27 1.29 8 30.8 18 69.2 KENDRAPARA 83 31 52 0.01 2.15 0.06 3.14 30 36.1 1 1.2 48 57.8 4 4.8 KENDUJHAR 74 9 65 0.05 0.64 0.02 7.26 9 12.2 58 78.4 6 8.1 1 1.4 KHORDHA 62 16 46 0.01 1.2 0.06 3.91 16 25.8 45 72.6 1 1.6 KORAPUT 21 2 19 0 0.12 0.08 2.02 2 9.5 18 85.7 1 4.8 MAYURBHANJ 82 46 36 0.03 2.57 0.04 3.73 45 54.9 1 1.2 35 42.7 1 1.2 NABARANGAPU 24 2 22 0.27 0.66 0.06 2.31 2 8.3 20 83.3 2 8.3 NAYAGARH 53 20 33 0.01 2.07 0.07 3.04 19 35.8 1 1.9 26 49.1 7 13.2 NUAPADA 26 6 20 0.1 1.28 0.01 3.96 6 23.1 16 61.5 4 15.4 PURI 82 18 64 0.04 1.72 0.03 2.79 18 22 60 73.2 4 4.9 RAYAGADA 22 3 19 0 1.17 0.03 4.04 3 13.6 18 81.8 1 4.5 SAMBALPUR 81 16 65 0.03 1.35 0.01 2.33 16 19.8 64 79 1 1.2 SONAPUR 45 4 41 0.01 1 0.06 4.17 4 8.9 39 86.7 1 2.2 1 2.2 SUNDARGARH 87 12 75 0.09 3.03 0.01 6.17 11 12.6 1 1.1 66 75.9 8 9.2 1 1.1 TOTAL 1363 331 1032 6.034 1.444 319 23.4 11 0.8 1 0.1 932 68.4 91 6.7 9 0.7
51
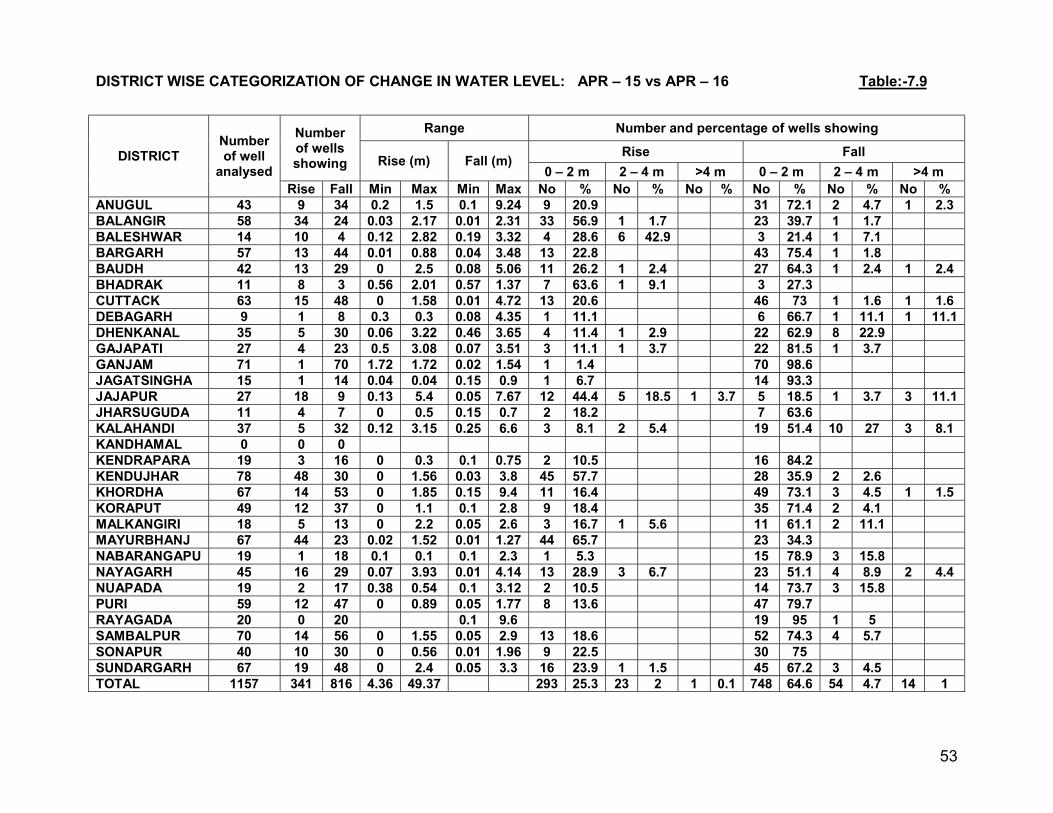
7.3 FLUCTUATION IN COMPARISON TO CORRESSPONDING PERIOD OF PREVIOUS YEAR
7.3.1 APRIL 2015 - APRIL 2016
The district-wise categorisation of change in water level during April-2016 with respect to that of April-2015 has been
given in Table 7.9 and has been presented in Plate 7.9.
Rise of water level
A perusal of data and map showing the variation in water level of April 2015 with respect to April 2016
shows that 29.47% of the wells recorded a rise in water level. Maximum number of wells have shown rise
in 0-2m range, i.e.,25.3% of the total wells analysed. All the districts show this range of rise. The command
areas of the state have recorded a rise in this range. Rise in 2-4m range is noticed only in 2% of the wells,
mainly in Baleswar, Gajapati, Bhadrak, Nayagarh ,Malkangiri and Sundaragarh districts. Rise of more than
4m is observed only in 0.1 % of the wells, which occur in isolated wells in the state.
Fall of water level
A perusal of data and map pertaining to the fluctuation of April 2015 with respect to April 2016 shows that
in 70.52% of wells there has been fall in water level. The fall in water level in the range of 0-2m have been
observed in 64.6 % of the wells in the state. It varies from minimum of 21.4 % in Baleswar district to
maximum of 98.6% in Ganjam district. Fall in 2-4m range is observed only in 4.7% of wells. More than 4 m
fall in water level has been observed in a minor 1% wells of the state.
In general a rise and fall in water level has been observed in April 2015 with respect to April 2016.

52
` Plate:7.9
53
DISTRICT WISE CATEGORIZATION OF CHANGE IN WATER LEVEL: APR – 15 vs APR – 16 Table:-7.9
DISTRICT Number of well
analysed
Number of wells showing
Range Number and percentage of wells showing
Rise (m) Fall (m) Rise Fall
0 – 2 m 2 – 4 m >4 m 0 – 2 m 2 – 4 m >4 m Rise Fall Min Max Min Max No % No % No % No % No % No %
ANUGUL 43 9 34 0.2 1.5 0.1 9.24 9 20.9 31 72.1 2 4.7 1 2.3 BALANGIR 58 34 24 0.03 2.17 0.01 2.31 33 56.9 1 1.7 23 39.7 1 1.7 BALESHWAR 14 10 4 0.12 2.82 0.19 3.32 4 28.6 6 42.9 3 21.4 1 7.1 BARGARH 57 13 44 0.01 0.88 0.04 3.48 13 22.8 43 75.4 1 1.8 BAUDH 42 13 29 0 2.5 0.08 5.06 11 26.2 1 2.4 27 64.3 1 2.4 1 2.4 BHADRAK 11 8 3 0.56 2.01 0.57 1.37 7 63.6 1 9.1 3 27.3 CUTTACK 63 15 48 0 1.58 0.01 4.72 13 20.6 46 73 1 1.6 1 1.6 DEBAGARH 9 1 8 0.3 0.3 0.08 4.35 1 11.1 6 66.7 1 11.1 1 11.1 DHENKANAL 35 5 30 0.06 3.22 0.46 3.65 4 11.4 1 2.9 22 62.9 8 22.9 GAJAPATI 27 4 23 0.5 3.08 0.07 3.51 3 11.1 1 3.7 22 81.5 1 3.7 GANJAM 71 1 70 1.72 1.72 0.02 1.54 1 1.4 70 98.6 JAGATSINGHA 15 1 14 0.04 0.04 0.15 0.9 1 6.7 14 93.3 JAJAPUR 27 18 9 0.13 5.4 0.05 7.67 12 44.4 5 18.5 1 3.7 5 18.5 1 3.7 3 11.1 JHARSUGUDA 11 4 7 0 0.5 0.15 0.7 2 18.2 7 63.6 KALAHANDI 37 5 32 0.12 3.15 0.25 6.6 3 8.1 2 5.4 19 51.4 10 27 3 8.1 KANDHAMAL 0 0 0 KENDRAPARA 19 3 16 0 0.3 0.1 0.75 2 10.5 16 84.2 KENDUJHAR 78 48 30 0 1.56 0.03 3.8 45 57.7 28 35.9 2 2.6 KHORDHA 67 14 53 0 1.85 0.15 9.4 11 16.4 49 73.1 3 4.5 1 1.5 KORAPUT 49 12 37 0 1.1 0.1 2.8 9 18.4 35 71.4 2 4.1 MALKANGIRI 18 5 13 0 2.2 0.05 2.6 3 16.7 1 5.6 11 61.1 2 11.1 MAYURBHANJ 67 44 23 0.02 1.52 0.01 1.27 44 65.7 23 34.3 NABARANGAPU 19 1 18 0.1 0.1 0.1 2.3 1 5.3 15 78.9 3 15.8 NAYAGARH 45 16 29 0.07 3.93 0.01 4.14 13 28.9 3 6.7 23 51.1 4 8.9 2 4.4 NUAPADA 19 2 17 0.38 0.54 0.1 3.12 2 10.5 14 73.7 3 15.8 PURI 59 12 47 0 0.89 0.05 1.77 8 13.6 47 79.7 RAYAGADA 20 0 20 0.1 9.6 19 95 1 5 SAMBALPUR 70 14 56 0 1.55 0.05 2.9 13 18.6 52 74.3 4 5.7 SONAPUR 40 10 30 0 0.56 0.01 1.96 9 22.5 30 75 SUNDARGARH 67 19 48 0 2.4 0.05 3.3 16 23.9 1 1.5 45 67.2 3 4.5 TOTAL 1157 341 816 4.36 49.37 293 25.3 23 2 1 0.1 748 64.6 54 4.7 14 1
54
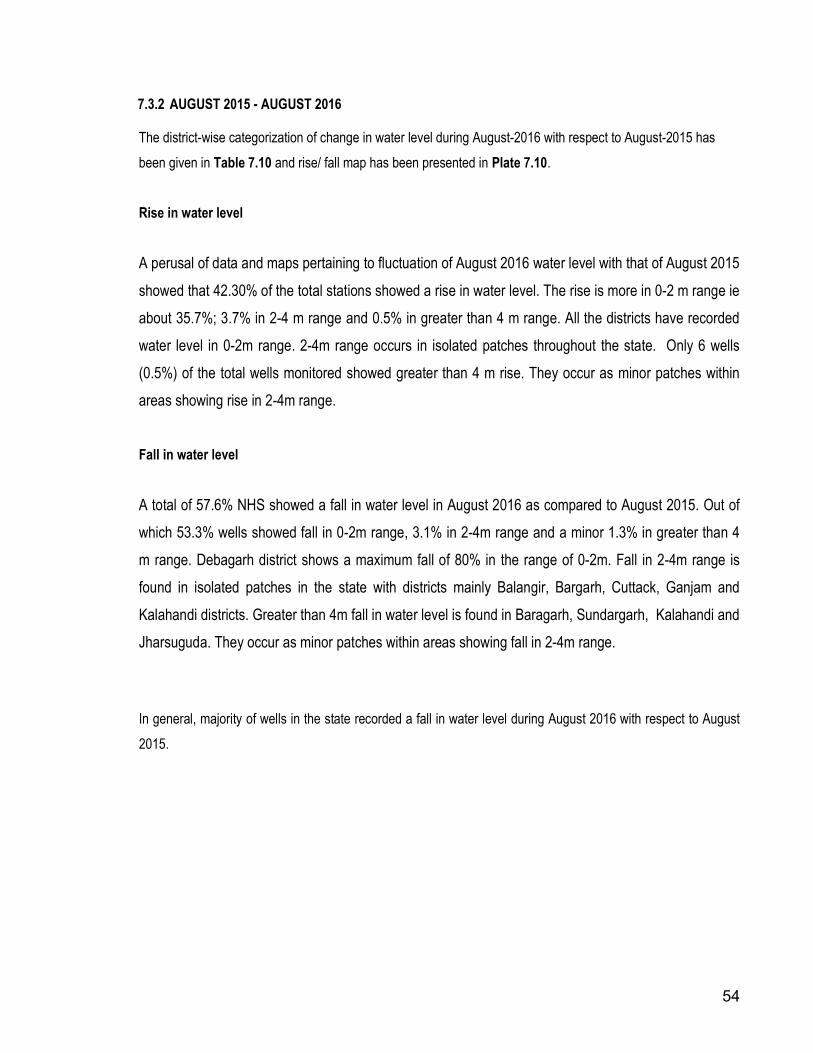
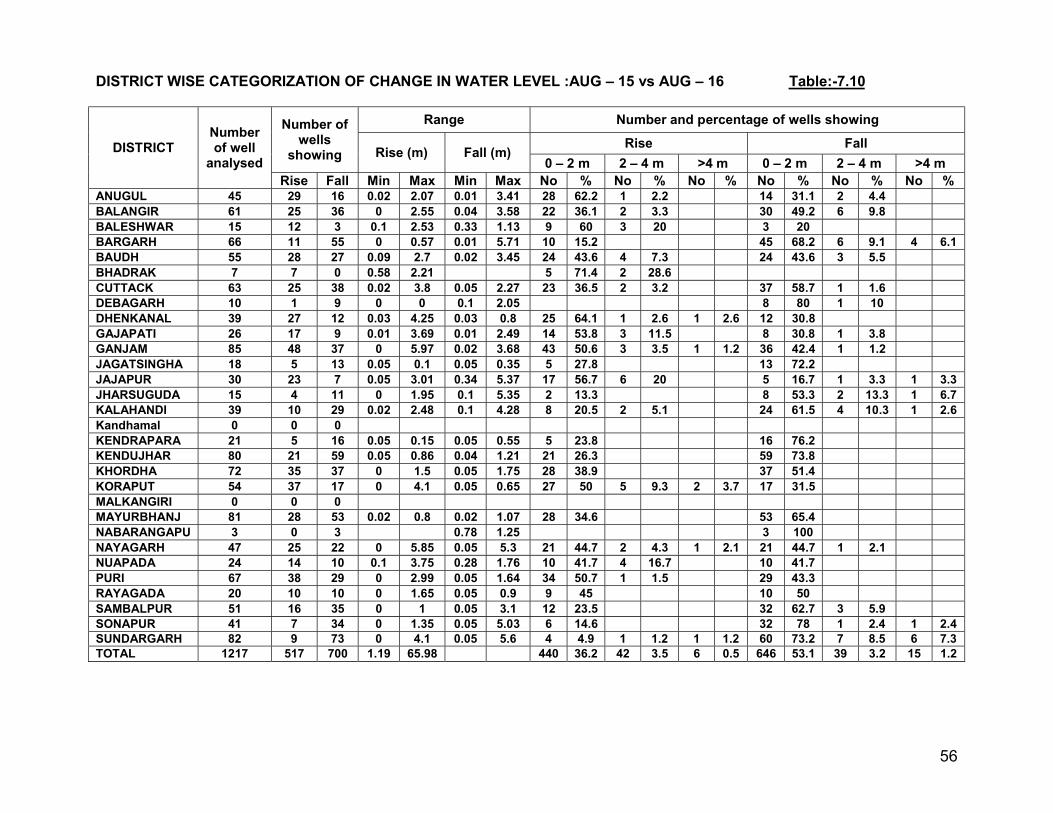
7.3.2 AUGUST 2015 - AUGUST 2016 The district-wise categorization of change in water level during August-2016 with respect to August-2015 has
been given in Table 7.10 and rise/ fall map has been presented in Plate 7.10.
Rise in water level
A perusal of data and maps pertaining to fluctuation of August 2016 water level with that of August 2015
showed that 42.30% of the total stations showed a rise in water level. The rise is more in 0-2 m range ie
about 35.7%; 3.7% in 2-4 m range and 0.5% in greater than 4 m range. All the districts have recorded
water level in 0-2m range. 2-4m range occurs in isolated patches throughout the state. Only 6 wells
(0.5%) of the total wells monitored showed greater than 4 m rise. They occur as minor patches within
areas showing rise in 2-4m range.
Fall in water level
A total of 57.6% NHS showed a fall in water level in August 2016 as compared to August 2015. Out of
which 53.3% wells showed fall in 0-2m range, 3.1% in 2-4m range and a minor 1.3% in greater than 4
m range. Debagarh district shows a maximum fall of 80% in the range of 0-2m. Fall in 2-4m range is
found in isolated patches in the state with districts mainly Balangir, Bargarh, Cuttack, Ganjam and
Kalahandi districts. Greater than 4m fall in water level is found in Baragarh, Sundargarh, Kalahandi and
Jharsuguda. They occur as minor patches within areas showing fall in 2-4m range.
In general, majority of wells in the state recorded a fall in water level during August 2016 with respect to August
2015.

55
Plate:7.10
56
DISTRICT WISE CATEGORIZATION OF CHANGE IN WATER LEVEL :AUG – 15 vs AUG – 16 Table:-7.10
DISTRICT Number of well
analysed
Number of wells
showing
Range Number and percentage of wells showing
Rise (m) Fall (m) Rise Fall
0 – 2 m 2 – 4 m >4 m 0 – 2 m 2 – 4 m >4 m Rise Fall Min Max Min Max No % No % No % No % No % No %
ANUGUL 45 29 16 0.02 2.07 0.01 3.41 28 62.2 1 2.2 14 31.1 2 4.4 BALANGIR 61 25 36 0 2.55 0.04 3.58 22 36.1 2 3.3 30 49.2 6 9.8 BALESHWAR 15 12 3 0.1 2.53 0.33 1.13 9 60 3 20 3 20 BARGARH 66 11 55 0 0.57 0.01 5.71 10 15.2 45 68.2 6 9.1 4 6.1 BAUDH 55 28 27 0.09 2.7 0.02 3.45 24 43.6 4 7.3 24 43.6 3 5.5 BHADRAK 7 7 0 0.58 2.21 5 71.4 2 28.6 CUTTACK 63 25 38 0.02 3.8 0.05 2.27 23 36.5 2 3.2 37 58.7 1 1.6 DEBAGARH 10 1 9 0 0 0.1 2.05 8 80 1 10 DHENKANAL 39 27 12 0.03 4.25 0.03 0.8 25 64.1 1 2.6 1 2.6 12 30.8 GAJAPATI 26 17 9 0.01 3.69 0.01 2.49 14 53.8 3 11.5 8 30.8 1 3.8 GANJAM 85 48 37 0 5.97 0.02 3.68 43 50.6 3 3.5 1 1.2 36 42.4 1 1.2 JAGATSINGHA 18 5 13 0.05 0.1 0.05 0.35 5 27.8 13 72.2 JAJAPUR 30 23 7 0.05 3.01 0.34 5.37 17 56.7 6 20 5 16.7 1 3.3 1 3.3 JHARSUGUDA 15 4 11 0 1.95 0.1 5.35 2 13.3 8 53.3 2 13.3 1 6.7 KALAHANDI 39 10 29 0.02 2.48 0.1 4.28 8 20.5 2 5.1 24 61.5 4 10.3 1 2.6 Kandhamal 0 0 0 KENDRAPARA 21 5 16 0.05 0.15 0.05 0.55 5 23.8 16 76.2 KENDUJHAR 80 21 59 0.05 0.86 0.04 1.21 21 26.3 59 73.8 KHORDHA 72 35 37 0 1.5 0.05 1.75 28 38.9 37 51.4 KORAPUT 54 37 17 0 4.1 0.05 0.65 27 50 5 9.3 2 3.7 17 31.5 MALKANGIRI 0 0 0 MAYURBHANJ 81 28 53 0.02 0.8 0.02 1.07 28 34.6 53 65.4 NABARANGAPU 3 0 3 0.78 1.25 3 100 NAYAGARH 47 25 22 0 5.85 0.05 5.3 21 44.7 2 4.3 1 2.1 21 44.7 1 2.1 NUAPADA 24 14 10 0.1 3.75 0.28 1.76 10 41.7 4 16.7 10 41.7 PURI 67 38 29 0 2.99 0.05 1.64 34 50.7 1 1.5 29 43.3 RAYAGADA 20 10 10 0 1.65 0.05 0.9 9 45 10 50 SAMBALPUR 51 16 35 0 1 0.05 3.1 12 23.5 32 62.7 3 5.9 SONAPUR 41 7 34 0 1.35 0.05 5.03 6 14.6 32 78 1 2.4 1 2.4 SUNDARGARH 82 9 73 0 4.1 0.05 5.6 4 4.9 1 1.2 1 1.2 60 73.2 7 8.5 6 7.3 TOTAL 1217 517 700 1.19 65.98 440 36.2 42 3.5 6 0.5 646 53.1 39 3.2 15 1.2
57
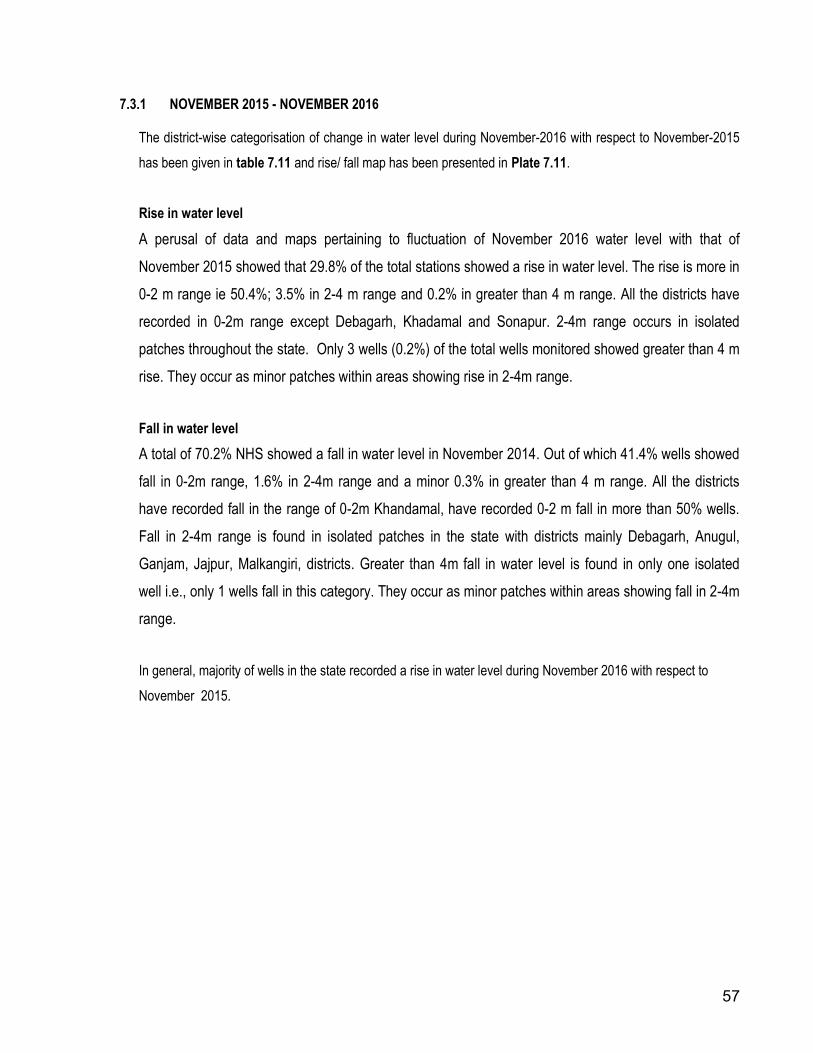
7.3.1 NOVEMBER 2015 - NOVEMBER 2016 The district-wise categorisation of change in water level during November-2016 with respect to November-2015
has been given in table 7.11 and rise/ fall map has been presented in Plate 7.11.
Rise in water level
A perusal of data and maps pertaining to fluctuation of November 2016 water level with that of
November 2015 showed that 29.8% of the total stations showed a rise in water level. The rise is more in
0-2 m range ie 50.4%; 3.5% in 2-4 m range and 0.2% in greater than 4 m range. All the districts have
recorded in 0-2m range except Debagarh, Khadamal and Sonapur. 2-4m range occurs in isolated
patches throughout the state. Only 3 wells (0.2%) of the total wells monitored showed greater than 4 m
rise. They occur as minor patches within areas showing rise in 2-4m range.
Fall in water level
A total of 70.2% NHS showed a fall in water level in November 2014. Out of which 41.4% wells showed
fall in 0-2m range, 1.6% in 2-4m range and a minor 0.3% in greater than 4 m range. All the districts
have recorded fall in the range of 0-2m Khandamal, have recorded 0-2 m fall in more than 50% wells.
Fall in 2-4m range is found in isolated patches in the state with districts mainly Debagarh, Anugul,
Ganjam, Jajpur, Malkangiri, districts. Greater than 4m fall in water level is found in only one isolated
well i.e., only 1 wells fall in this category. They occur as minor patches within areas showing fall in 2-4m
range.
In general, majority of wells in the state recorded a rise in water level during November 2016 with respect to
November 2015.

58
Plate:7.11

59
DISTRICT WISE CATEGORIZATION OF CHANGE IN WATER LEVEL NOV – 15 vs NOV – 16 Table:-7.11
DISTRICT Number of well
analysed
Number of wells
showing
Range Number and percentage of wells showing
Rise (m) Fall (m) Rise Fall
0 – 2 m 2 – 4 m >4 m 0 – 2 m 2 – 4 m >4 m Rise Fall Min Max Min Max No % No % No % No % No % No %
ANUGUL 50 41 9 0.06 3.55 0.3 1.7 36 72 5 10 9 18 BALANGIR 60 48 12 0 2.84 0.15 3.25 44 73.3 2 3.3 10 16.7 2 3.3 BALESHWAR 16 8 8 0.86 2.45 0.13 1.31 6 37.5 2 12.5 8 50 BARGARH 67 13 54 0 1.29 0.03 2.12 10 14.9 53 79.1 1 1.5 BAUDH 49 45 4 0.11 5.17 0.05 0.43 32 65.3 10 20.4 3 6.1 4 8.2 BHADRAK 7 4 3 0.01 1.81 0.61 1.63 4 57.1 3 42.9 CUTTACK 63 41 22 0 3.5 0.01 1.87 38 60.3 2 3.2 22 34.9 DEBAGARH 10 6 4 0.4 1.2 0.2 1.6 6 60 4 40 DHENKANAL 42 34 8 0 2.64 0.13 2.37 29 69 4 9.5 7 16.7 1 2.4 GAJAPATI 29 9 20 0.22 1.85 0.07 2.3 9 31 19 65.5 1 3.4 GANJAM 77 23 54 0.01 1.57 0.02 3.47 23 29.9 52 67.5 2 2.6 JAGATSINGHA 18 8 10 0 0.15 0.1 0.3 7 38.9 10 55.6 JAJAPUR 20 10 10 0.48 2.64 0.03 4.24 9 45 1 5 4 20 5 25 1 5 JHARSUGUDA 15 10 5 0.05 1.15 0.1 2.65 10 66.7 4 26.7 1 6.7 KALAHANDI 42 18 24 0.05 3.5 0.05 4.2 15 35.7 3 7.1 21 50 2 4.8 1 2.4 KANDHAMAL 0 0 0 KENDRAPARA 20 12 8 0 0.75 0.05 0.9 11 55 8 40 KENDUJHAR 85 22 63 0.02 1.72 0.01 2.23 22 25.9 62 72.9 1 1.2 KHORDHA 62 41 21 0.05 2.1 0.1 1.65 40 64.5 1 1.6 21 33.9 KORAPUT 54 36 18 0 1.95 0.05 3.7 31 57.4 17 31.5 1 1.9 MALKANGIRI 19 10 9 0 1.25 0.05 0.5 9 47.4 9 47.4 MAYURBHANJ 79 37 42 0 0.7 0.05 1.72 35 44.3 42 53.2 NABARANGAPU 24 17 7 0 1.65 0.05 0.95 16 66.7 7 29.2 NAYAGARH 48 45 3 0 3.07 0.02 4.77 38 79.2 5 10.4 2 4.2 1 2.1 NUAPADA 25 13 12 0 2.4 0.03 1.14 11 44 1 4 12 48 PURI 74 49 25 0 6.12 0.05 2.8 45 60.8 2 2.7 1 1.4 23 31.1 2 2.7 RAYAGADA 20 16 4 0 0.75 0.05 1.2 10 50 4 20 SAMBALPUR 70 38 32 0 2.95 0.08 4.35 33 47.1 2 2.9 31 44.3 1 1.4 SONAPUR 43 9 34 0.22 0.79 0.03 1.19 9 20.9 34 79.1 SUNDARGARH 79 56 23 0 6.2 0.05 2.05 50 63.3 4 5.1 1 1.3 22 27.8 1 1.3 TOTAL 1267 719 548 2.54 67.71 638 50.4 44 3.5 5 0.4 524 41.4 20 1.6 4 0.3
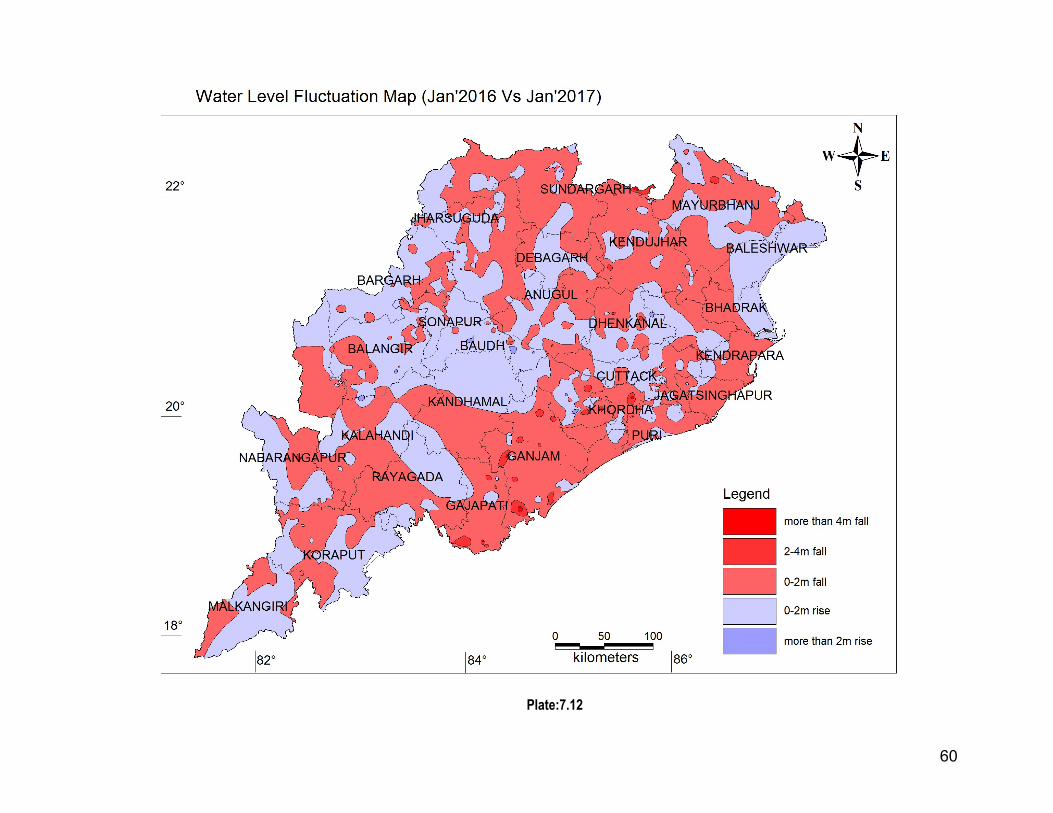
60
Plate:7.12
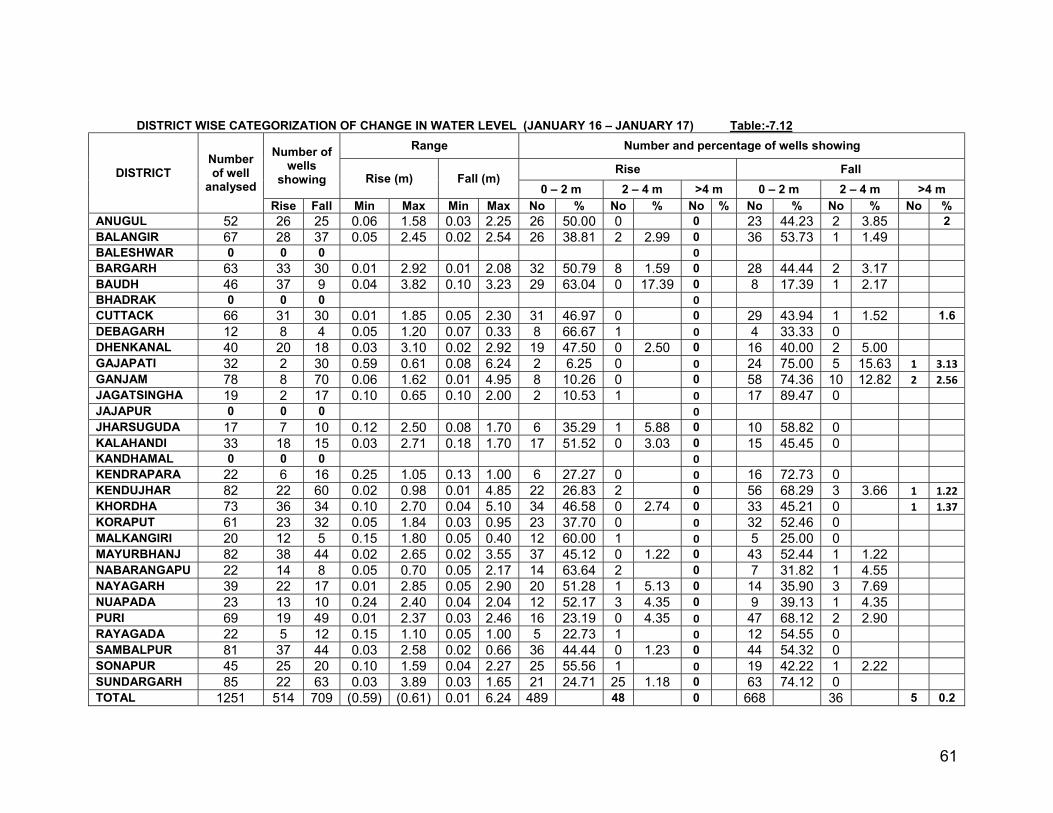
61
DISTRICT WISE CATEGORIZATION OF CHANGE IN WATER LEVEL (JANUARY 16 – JANUARY 17) Table:-7.12
DISTRICT Number of well
analysed
Number of wells
showing
Range Number and percentage of wells showing
Rise (m) Fall (m) Rise Fall
0 – 2 m 2 – 4 m >4 m 0 – 2 m 2 – 4 m >4 m Rise Fall Min Max Min Max No % No % No % No % No % No %
ANUGUL 52 26 25 0.06 1.58 0.03 2.25 26 50.00 0 0 23 44.23 2 3.85 2 BALANGIR 67 28 37 0.05 2.45 0.02 2.54 26 38.81 2 2.99 0 36 53.73 1 1.49 BALESHWAR 0 0 0 0 BARGARH 63 33 30 0.01 2.92 0.01 2.08 32 50.79 8 1.59 0 28 44.44 2 3.17 BAUDH 46 37 9 0.04 3.82 0.10 3.23 29 63.04 0 17.39 0 8 17.39 1 2.17 BHADRAK 0 0 0 0 CUTTACK 66 31 30 0.01 1.85 0.05 2.30 31 46.97 0 0 29 43.94 1 1.52 1.6 DEBAGARH 12 8 4 0.05 1.20 0.07 0.33 8 66.67 1 0 4 33.33 0 DHENKANAL 40 20 18 0.03 3.10 0.02 2.92 19 47.50 0 2.50 0 16 40.00 2 5.00 GAJAPATI 32 2 30 0.59 0.61 0.08 6.24 2 6.25 0 0 24 75.00 5 15.63 1 3.13 GANJAM 78 8 70 0.06 1.62 0.01 4.95 8 10.26 0 0 58 74.36 10 12.82 2 2.56 JAGATSINGHA 19 2 17 0.10 0.65 0.10 2.00 2 10.53 1 0 17 89.47 0 JAJAPUR 0 0 0 0 JHARSUGUDA 17 7 10 0.12 2.50 0.08 1.70 6 35.29 1 5.88 0 10 58.82 0 KALAHANDI 33 18 15 0.03 2.71 0.18 1.70 17 51.52 0 3.03 0 15 45.45 0 KANDHAMAL 0 0 0 0 KENDRAPARA 22 6 16 0.25 1.05 0.13 1.00 6 27.27 0 0 16 72.73 0 KENDUJHAR 82 22 60 0.02 0.98 0.01 4.85 22 26.83 2 0 56 68.29 3 3.66 1 1.22 KHORDHA 73 36 34 0.10 2.70 0.04 5.10 34 46.58 0 2.74 0 33 45.21 0 1 1.37 KORAPUT 61 23 32 0.05 1.84 0.03 0.95 23 37.70 0 0 32 52.46 0 MALKANGIRI 20 12 5 0.15 1.80 0.05 0.40 12 60.00 1 0 5 25.00 0 MAYURBHANJ 82 38 44 0.02 2.65 0.02 3.55 37 45.12 0 1.22 0 43 52.44 1 1.22 NABARANGAPU 22 14 8 0.05 0.70 0.05 2.17 14 63.64 2 0 7 31.82 1 4.55 NAYAGARH 39 22 17 0.01 2.85 0.05 2.90 20 51.28 1 5.13 0 14 35.90 3 7.69 NUAPADA 23 13 10 0.24 2.40 0.04 2.04 12 52.17 3 4.35 0 9 39.13 1 4.35 PURI 69 19 49 0.01 2.37 0.03 2.46 16 23.19 0 4.35 0 47 68.12 2 2.90 RAYAGADA 22 5 12 0.15 1.10 0.05 1.00 5 22.73 1 0 12 54.55 0 SAMBALPUR 81 37 44 0.03 2.58 0.02 0.66 36 44.44 0 1.23 0 44 54.32 0 SONAPUR 45 25 20 0.10 1.59 0.04 2.27 25 55.56 1 0 19 42.22 1 2.22 SUNDARGARH 85 22 63 0.03 3.89 0.03 1.65 21 24.71 25 1.18 0 63 74.12 0 TOTAL 1251 514 709 (0.59) (0.61) 0.01 6.24 489 48 0 668 36 5 0.2

62
7.3.4 JANUARY 2016 – JANUARY 2017
The district-wise categorisation of change in water level during January-2017 with respect to that of
January-2016 has been given in table 7.12 and has been presented in Plate 7.12.
Rise in water level
A perusal of data and maps pertaining to fluctuation of January 2017 water level with that of January
2016 showed that 41.08% of the total stations showed a rise in water level. The rise is more in 0-2 m
range i.e 39.08%.the district which has recorded a rise in the range of 0-2m are
Debagarh(66.67%),Baudh(63.04%)and Malkangiri(60%). 3.83% wells shows rise in 2- 4 m range, The
districts which has recorded rise in 2-4m range are Balangir (2.99%), Baudh(17.39%), Bargarh(1.59%),
Jharsuguda(5.88%), Nayagarh (5.13%) and no wells found in greater than 4 m rise. They occur as
minor patches within areas showing rise in 2- 4 m range.
Fall in water level
A total of 56.67% NHS showed a fall in water level in January 2017. Out of all stations, 53.39% wells
showed fall in 0-2m range, 2.87% in 2-4m range and a minor 0.39 % in greater than 4 m range. Fall in
0-2m range is maximum ie 84.2% in Jagatsinghpur district and minimum of 18.4% in Baudh district
showing water level fall in this range. Greater than 4m fall in water level is found in 2 wells of Ganjam
and 1 well of Gajapati,Kendujhar and Khordha district.
In general, more than 50% of wells in the state recorded a fall in water level during January 2017 with respect to
January 2016.
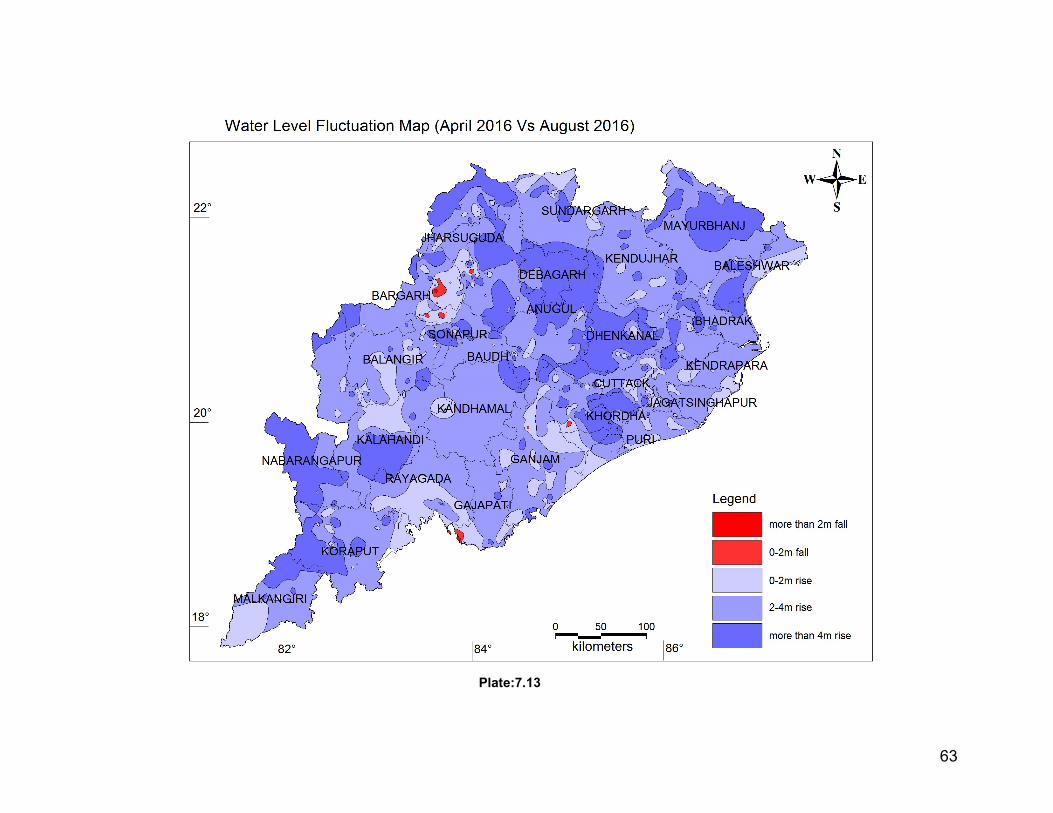
63
Plate:7.13
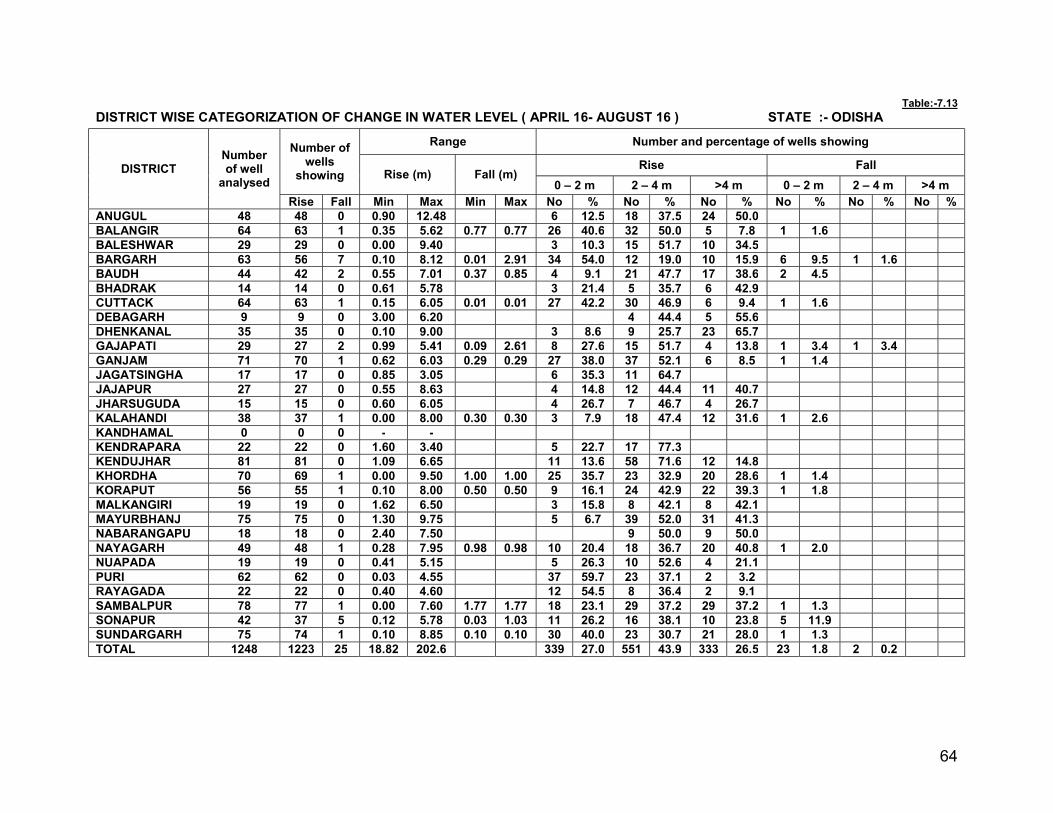
64
Table:-7.13 DISTRICT WISE CATEGORIZATION OF CHANGE IN WATER LEVEL ( APRIL 16- AUGUST 16 ) STATE :- ODISHA
DISTRICT Number of well
analysed
Number of wells
showing
Range Number and percentage of wells showing
Rise (m) Fall (m) Rise Fall
0 – 2 m 2 – 4 m >4 m 0 – 2 m 2 – 4 m >4 m Rise Fall Min Max Min Max No % No % No % No % No % No %
ANUGUL 48 48 0 0.90 12.48 6 12.5 18 37.5 24 50.0 BALANGIR 64 63 1 0.35 5.62 0.77 0.77 26 40.6 32 50.0 5 7.8 1 1.6 BALESHWAR 29 29 0 0.00 9.40 3 10.3 15 51.7 10 34.5 BARGARH 63 56 7 0.10 8.12 0.01 2.91 34 54.0 12 19.0 10 15.9 6 9.5 1 1.6 BAUDH 44 42 2 0.55 7.01 0.37 0.85 4 9.1 21 47.7 17 38.6 2 4.5 BHADRAK 14 14 0 0.61 5.78 3 21.4 5 35.7 6 42.9 CUTTACK 64 63 1 0.15 6.05 0.01 0.01 27 42.2 30 46.9 6 9.4 1 1.6 DEBAGARH 9 9 0 3.00 6.20 4 44.4 5 55.6 DHENKANAL 35 35 0 0.10 9.00 3 8.6 9 25.7 23 65.7 GAJAPATI 29 27 2 0.99 5.41 0.09 2.61 8 27.6 15 51.7 4 13.8 1 3.4 1 3.4 GANJAM 71 70 1 0.62 6.03 0.29 0.29 27 38.0 37 52.1 6 8.5 1 1.4 JAGATSINGHA 17 17 0 0.85 3.05 6 35.3 11 64.7 JAJAPUR 27 27 0 0.55 8.63 4 14.8 12 44.4 11 40.7 JHARSUGUDA 15 15 0 0.60 6.05 4 26.7 7 46.7 4 26.7 KALAHANDI 38 37 1 0.00 8.00 0.30 0.30 3 7.9 18 47.4 12 31.6 1 2.6 KANDHAMAL 0 0 0 - - KENDRAPARA 22 22 0 1.60 3.40 5 22.7 17 77.3 KENDUJHAR 81 81 0 1.09 6.65 11 13.6 58 71.6 12 14.8 KHORDHA 70 69 1 0.00 9.50 1.00 1.00 25 35.7 23 32.9 20 28.6 1 1.4 KORAPUT 56 55 1 0.10 8.00 0.50 0.50 9 16.1 24 42.9 22 39.3 1 1.8 MALKANGIRI 19 19 0 1.62 6.50 3 15.8 8 42.1 8 42.1 MAYURBHANJ 75 75 0 1.30 9.75 5 6.7 39 52.0 31 41.3 NABARANGAPU 18 18 0 2.40 7.50 9 50.0 9 50.0 NAYAGARH 49 48 1 0.28 7.95 0.98 0.98 10 20.4 18 36.7 20 40.8 1 2.0 NUAPADA 19 19 0 0.41 5.15 5 26.3 10 52.6 4 21.1 PURI 62 62 0 0.03 4.55 37 59.7 23 37.1 2 3.2 RAYAGADA 22 22 0 0.40 4.60 12 54.5 8 36.4 2 9.1 SAMBALPUR 78 77 1 0.00 7.60 1.77 1.77 18 23.1 29 37.2 29 37.2 1 1.3 SONAPUR 42 37 5 0.12 5.78 0.03 1.03 11 26.2 16 38.1 10 23.8 5 11.9 SUNDARGARH 75 74 1 0.10 8.85 0.10 0.10 30 40.0 23 30.7 21 28.0 1 1.3 TOTAL 1248 1223 25 18.82 202.6 339 27.0 551 43.9 333 26.5 23 1.8 2 0.2
65
7.3 FLUCTUATION WITH RESPECT TO PRE-MONSOON WATER LEVEL 7.4.1 APRIL 2016 - AUGUST 2016 The district-wise categorisation of water level fluctuation of April-2016 with respect to August-2016 has been
given in Table 7.13 and rise / fall map has been presented in Plate 7.13.
Rise in water level
97 % of the wells monitored in August 2016 showed a rise in water level when compared with that of
April 2016 (Pre-monsoon). 27% of wells showed rise in 0-2 m range, 43.9% in 2-4 m range and 26.5 %
rise in the range of more than 4m. A maximum of 59.7% of wells in Puri district and a minimum of 6.7%
in Mayurbhanj district recorded a rise in the range of 0-2m. A maximum of 77.3% of wells in Kendrapara
district and a minimum of 25.7% in Dhenkanal district recorded rise in the range of 2 – 4m with majority
of the districts in the state have more than 25% of the wells showing rise in this range.
Fall in water level
Only 2.0% of the wells monitored showed a fall in water level. 1.8% of wells showed fall in 0-2 m range.
The fall in 0-2m range is seen in Boudh, Bargarh,Gajapati, Kalahandi, Nayagarh and Sundaragarh
districts. 0.2% of wells in the state showed fall in water level in 2-4 m.
In general as it should be, a rise in water level is observed throughout the state during August 2016 with
respect to April 2016 and majority of wells recorded 0-4 m rise because of recharge of aquifer due to
monsoon rainfall.
66
7.4.2 APRIL 2016 - NOVEMBER 2016
The district-wise categorisation of water level fluctuation of November 2016 with respect to April-2016 has given in
Table 7.14 has been shown in Plate :- 7.14 .
Rise in water level
92.3% of the wells monitored in November 2016 showed a rise in water level when compared with that
of April 2016 (Pre-monsoon). 37.9% of wells showed rise in 0-2 m range, 41.3% in 2-4 m range and
11.6% rise in the range of more than 4m. A maximum of 88.2% of wells in Jagatsinghpur district and a
minimum of 9.1% in Nawarangpur district recorded a rise in the range of 0-2m. A maximum of 66.2% of
wells in Mayurbhanj and a minimum of 5.9% in Jagatsinghpur district recorded rise in the range of 2 –
4m with majority of the districts in the state have more than 25% of the wells showing rise in this range.
7.1 % of wells shows fall in the range of 0-2 m.
Fall in water level
Only 7.1% of the wells monitored showed a fall in water level. 7.1% of wells showed fall in 0-2 m range.
The fall in 0-2m range is seen in adequate number of wells in Bargarh, Kalahandi, Koraput and Sonapur
districts.
In general as it should be, a rise in water level is observed throughout the state during November 2016
with respect to April 2016 and majority of wells recorded 0-4 m rise because of recharge of aquifer due
to monsoon rainfall.
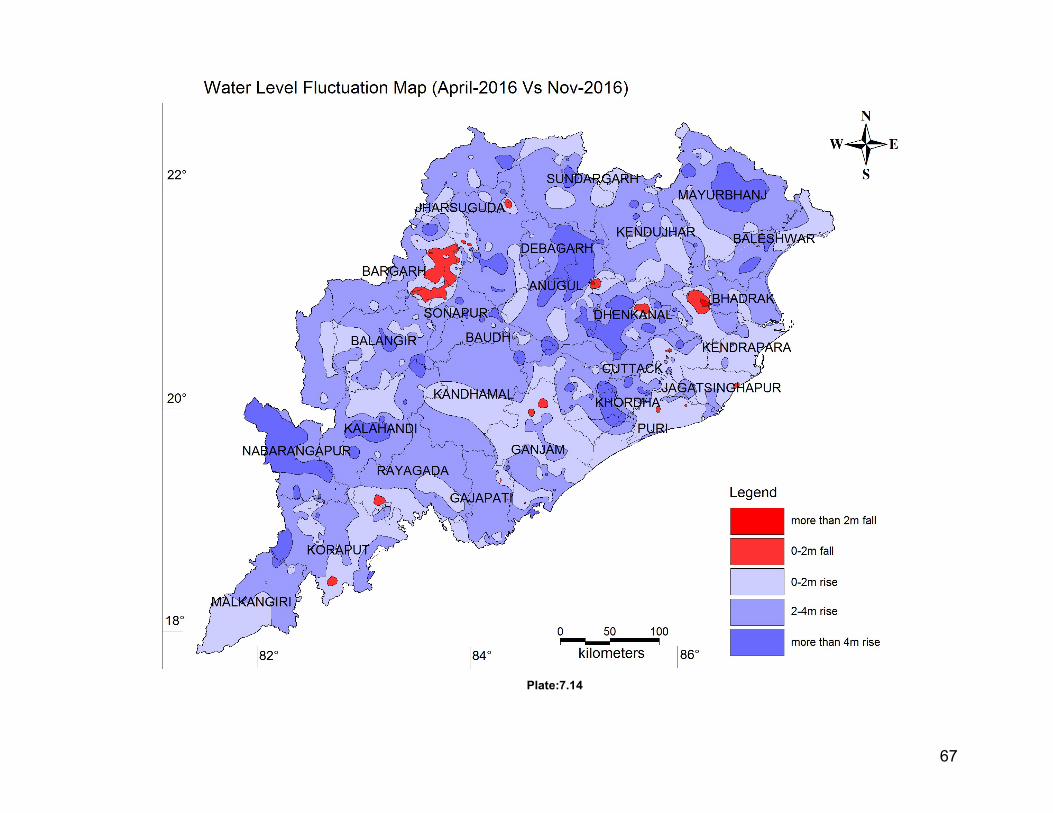
67
Plate:7.14
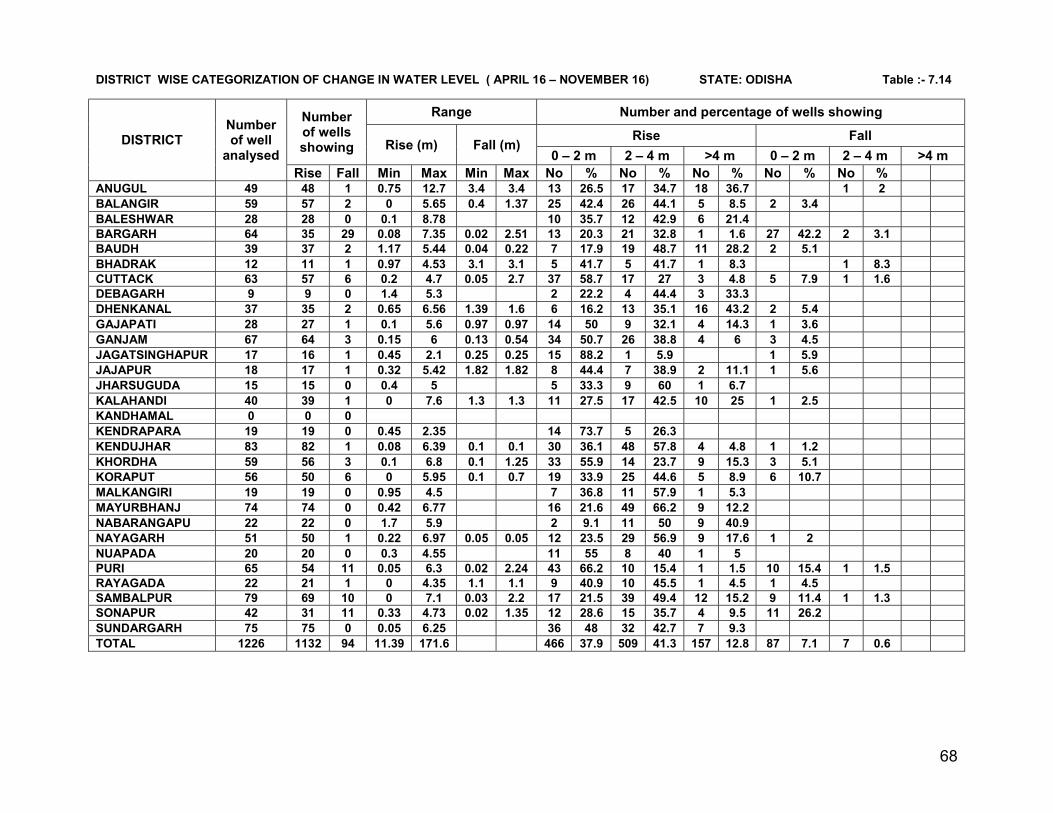
68
DISTRICT WISE CATEGORIZATION OF CHANGE IN WATER LEVEL ( APRIL 16 – NOVEMBER 16) STATE: ODISHA Table :- 7.14
DISTRICT Number of well
analysed
Number of wells showing
Range Number and percentage of wells showing
Rise (m) Fall (m) Rise Fall
0 – 2 m 2 – 4 m >4 m 0 – 2 m 2 – 4 m >4 m Rise Fall Min Max Min Max No % No % No % No % No %
ANUGUL 49 48 1 0.75 12.7 3.4 3.4 13 26.5 17 34.7 18 36.7 1 2 BALANGIR 59 57 2 0 5.65 0.4 1.37 25 42.4 26 44.1 5 8.5 2 3.4 BALESHWAR 28 28 0 0.1 8.78 10 35.7 12 42.9 6 21.4 BARGARH 64 35 29 0.08 7.35 0.02 2.51 13 20.3 21 32.8 1 1.6 27 42.2 2 3.1 BAUDH 39 37 2 1.17 5.44 0.04 0.22 7 17.9 19 48.7 11 28.2 2 5.1 BHADRAK 12 11 1 0.97 4.53 3.1 3.1 5 41.7 5 41.7 1 8.3 1 8.3 CUTTACK 63 57 6 0.2 4.7 0.05 2.7 37 58.7 17 27 3 4.8 5 7.9 1 1.6 DEBAGARH 9 9 0 1.4 5.3 2 22.2 4 44.4 3 33.3 DHENKANAL 37 35 2 0.65 6.56 1.39 1.6 6 16.2 13 35.1 16 43.2 2 5.4 GAJAPATI 28 27 1 0.1 5.6 0.97 0.97 14 50 9 32.1 4 14.3 1 3.6 GANJAM 67 64 3 0.15 6 0.13 0.54 34 50.7 26 38.8 4 6 3 4.5 JAGATSINGHAPUR 17 16 1 0.45 2.1 0.25 0.25 15 88.2 1 5.9 1 5.9 JAJAPUR 18 17 1 0.32 5.42 1.82 1.82 8 44.4 7 38.9 2 11.1 1 5.6 JHARSUGUDA 15 15 0 0.4 5 5 33.3 9 60 1 6.7 KALAHANDI 40 39 1 0 7.6 1.3 1.3 11 27.5 17 42.5 10 25 1 2.5 KANDHAMAL 0 0 0 KENDRAPARA 19 19 0 0.45 2.35 14 73.7 5 26.3 KENDUJHAR 83 82 1 0.08 6.39 0.1 0.1 30 36.1 48 57.8 4 4.8 1 1.2 KHORDHA 59 56 3 0.1 6.8 0.1 1.25 33 55.9 14 23.7 9 15.3 3 5.1 KORAPUT 56 50 6 0 5.95 0.1 0.7 19 33.9 25 44.6 5 8.9 6 10.7 MALKANGIRI 19 19 0 0.95 4.5 7 36.8 11 57.9 1 5.3 MAYURBHANJ 74 74 0 0.42 6.77 16 21.6 49 66.2 9 12.2 NABARANGAPU 22 22 0 1.7 5.9 2 9.1 11 50 9 40.9 NAYAGARH 51 50 1 0.22 6.97 0.05 0.05 12 23.5 29 56.9 9 17.6 1 2 NUAPADA 20 20 0 0.3 4.55 11 55 8 40 1 5 PURI 65 54 11 0.05 6.3 0.02 2.24 43 66.2 10 15.4 1 1.5 10 15.4 1 1.5 RAYAGADA 22 21 1 0 4.35 1.1 1.1 9 40.9 10 45.5 1 4.5 1 4.5 SAMBALPUR 79 69 10 0 7.1 0.03 2.2 17 21.5 39 49.4 12 15.2 9 11.4 1 1.3 SONAPUR 42 31 11 0.33 4.73 0.02 1.35 12 28.6 15 35.7 4 9.5 11 26.2 SUNDARGARH 75 75 0 0.05 6.25 36 48 32 42.7 7 9.3 TOTAL 1226 1132 94 11.39 171.6 466 37.9 509 41.3 157 12.8 87 7.1 7 0.6
69
7.4.3 APRIL 2016 – JANUARY 2017
The district-wise categorisation of water level fluctuation of January 2017 with respect to April-2016 has been
given in table 7.15 and has been presented in Plate 7.15.
Rise in water level
A perusal of the data and map pertaining to January 2017 with reference to April 2016 shows that rise
in water level between 0-2m has been observed in 60.3% of the wells with maximum of 95.5% of wells
in Kendrapara district and a minimum of 25.6% in Boudh district recorded. 23% of wells are in 2-4 m
range and 3.06% well shows rise in the range of more than 4m.
Fall in water level
13.20% of the wells monitored showed a fall in water level. 12.18% of wells showed fall in 0-2 m range.
District showing fall in this range are Nuapada (20%), Khurda (19.1%), Bargarh (31.3%) and minimum
of 4.5% fall in Kendrapara and Rayagada district. 0.9% of wells shows fall in 2-4m range. A maximum of
5.6% in Dhenkanal district and in minimum of 1.7% in Puri district recorded in this range .The
percentage of wells falling in greater than 4 m range is only 0.2% which is mostly in Jajpur district.
In general as it should be, a rise in water level is observed throughout the state during January 2017
with respect to April 2016 and majority of wells recorded 0-4 m rise because of recharge of aquifer due
to monsoon rainfall.
.
.
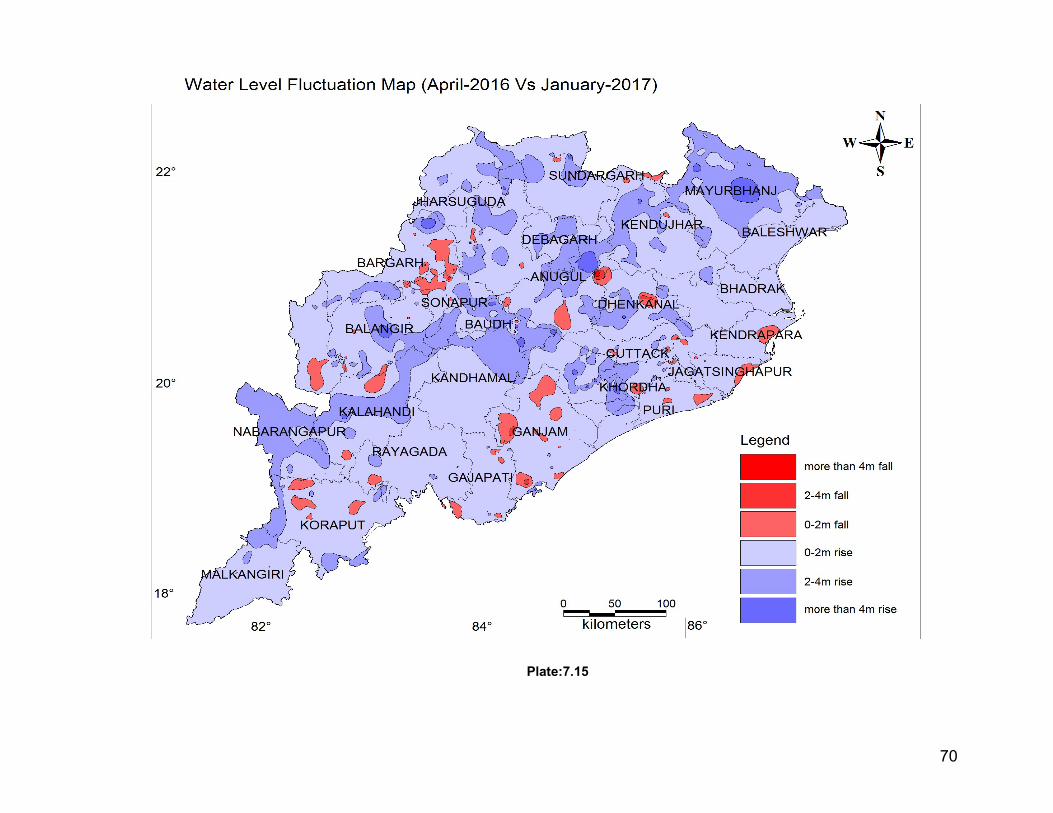
70
Plate:7.15

71
DISTRICT WISE CATEGORIZATION OF CHANGE IN WATER LEVEL ( APR 16 – JAN 17 ) Table:-7.15
DISTRICT Number of well
analysed
Number of wells
showing
Range Number and percentage of wells showing
Rise (m) Fall (m) Rise Fall
0 – 2 m 2 – 4 m >4 m 0 – 2 m 2 – 4 m >4 m Rise Fall Min Max Min Max No % No % No % No % No % No %
ANUGUL 49 45 4 0.2 8.98 0.1 6.15 27 55.1 15 30.6 3 6.1 3 6.1 1 2 BALANGIR 63 55 8 0.05 5.5 0.08 1.42 40 63.5 14 22.2 1 1.6 8 12.7 BALESHWAR 0 0 0 BARGARH 64 42 22 0 6.95 0.02 2.54 30 46.9 9 14.1 1 1.6 20 31.3 2 3.1 BAUDH 39 36 3 0.8 5.26 0.4 1.65 10 25.6 21 53.8 5 12.8 3 7.7 BHADRAK 0 0 0 CUTTACK 64 58 6 0.11 4.2 0.15 4.4 50 78.1 7 10.9 1 1.6 5 7.8 1 1.6 DEBAGARH 9 9 0 0.08 3.35 4 44.4 5 55.6 DHENKANAL 36 34 2 0.27 4.86 2.2 2.7 22 61.1 10 27.8 2 5.6 2 5.6 GAJAPATI 30 23 7 0.06 3.46 0.05 1.6 18 60 5 16.7 7 23.3 GANJAM 70 57 13 0.11 4.17 0.03 3.59 52 74.3 4 5.7 1 1.4 11 15.7 2 2.9 JAGATSINGHA 17 13 4 0.1 1.2 0.03 1.08 13 76.5 4 23.5 JAJAPUR 0 0 0 JHARSUGUDA 14 14 0 0.35 4.85 9 64.3 4 28.6 1 7.1 KALAHANDI 35 32 3 0 5.7 0.45 3.2 12 34.3 18 51.4 1 2.9 2 5.7 1 2.9 KANDHAMAL 0 0 0 KENDRAPARA 22 21 1 0.15 1.8 0.2 0.2 21 95.5 1 4.5 KENDUJHAR 77 71 6 0.08 4.6 0.01 1.79 46 59.7 23 29.9 2 2.6 6 7.8 KHORDHA 68 55 13 0.1 4.4 0.02 1.9 43 63.2 10 14.7 2 2.9 13 19.1 KORAPUT 57 44 13 0 3.6 0.1 2.3 31 54.4 12 21.1 12 21.1 1 1.8 MALKANGIRI 19 18 1 0.2 2.45 0.1 0.1 15 78.9 3 15.8 1 5.3 MAYURBHANJ 75 75 0 0.01 6.1 31 41.3 40 53.3 4 5.3 NABARANGAPU 21 21 0 0.45 4 12 57.1 8 38.1 1 4.8 NAYAGARH 50 47 3 0.02 5.6 0.02 1.82 29 58 12 24 6 12 3 6 NUAPADA 20 16 4 0.05 4.25 0.3 0.55 11 55 4 20 1 5 4 20 PURI 60 47 13 0.03 2.72 0.03 2.44 46 76.7 1 1.7 12 20 1 1.7 RAYAGADA 22 21 1 0 3.3 1 1 17 77.3 3 13.6 1 4.5 SAMBALPUR 77 69 8 0.04 5.42 0.04 0.68 48 62.3 19 24.7 2 2.6 8 10.4 SONAPUR 43 33 10 0.05 2.75 0.2 3.47 24 55.8 9 20.9 9 20.9 1 2.3 SUNDARGARH 73 63 10 0.2 6.89 0.05 1.83 47 64.4 14 19.2 2 2.7 10 13.7 TOTAL 1174 1019 155 3.51 116.3 708 60.3 270 23 36 3.1 143 12.2 10 0.9 2 0.2

72
8.0 HYDROCHEMISTRY The chemical quality of ground water has been evaluated by chemically analyzing water samples collected from
National Hydrograph Network Stations (NHNS) during the month of April . The water samples for these purposes
were collected in clean 1.0 litre plastic bottles after rinsing 2 to 3 times with the water samples to be collected.
Various chemical constituents present in ground water samples were analysed at Regional Chemical Laboratory,
Central Ground Water, Board, South Eastern Region, Bhubaneswar, as per standard methods available.
The chemical quality of ground water of shallow wells in the state is found to vary widely, depending upon the
physiography, soil texture and underlain soil formations. The shallow aquifer of inland zone is mostly fresh and
relatively saline for coastal plain where most of the wells are located in alluvium. These aquifers at places are of
high electrical conductivity (E.C.) and chloride concentration. Some of the locations having high values of E.C.
are incorporated in Table 8.1 and Some of the locations having high values of chloride are incorporated in Table
8.2.
Table 8.1 Location of wells having high electrical conductivity (E.C. > 2000µS/cm)
DISTRICT_NAME BLOCK_NAME SITE_NAME EC
BARGARH SOHELA Ghens 1 3710
BARGARH PAIKMAL Hirapur 2330
BARGARH BARGARH Adagaon 3130
BAUDH BAUDH SADAR Dahya 3710
BAUDH BAUDH SADAR Badhigan 2530
BAUDH HARBHANGA Nuapada 1 2030
GANJAM RANGILUNDA Gopalpur 2450
GANJAM JAGANATHPRASAD Baragam 3310
GANJAM GANJAM Huma 3290
KENDRAPARA KENDRAPARA Jajanga 2220
KENDRAPARA KENDRAPARA Kasoti 6490
NAYAGARH NAYAGARH Nayagarh 3980
SAMBALPUR MANESWAR Sahaspur 3120
SAMBALPUR JUJOMURA Maneswar 2210
SONAPUR BINIKA Koiramunda 4658
SONAPUR BINIKA Mahadevpali 2000
Table 8.2 Location of wells having high chloride (>250 mg/L)
DISTRICT_NAME BLOCK_NAME SITE_NAME CL
ANUGUL KISHORENAGAR Bamur 596
ANUGUL BANARPAL Kuio 301

73
ANUGUL TALACHER Tentulai 273
BALANGIR MURIBAHAL Haldia 269
BARGARH BHEDEN Bheden 1 273
BARGARH SOHELA Ghens 1 932
BARGARH PAIKMAL Hirapur 422
BARGARH BHEDEN Baghapalli 443
BARGARH BARGARH Adagaon 879
BARGARH BHATLI Dumalpali 372
BARGARH BHATLI Chadheigaon 308
BARGARH ATTABIRA Attabira1 280
BAUDH BAUDH SADAR Khajuripada 287
BAUDH HARBHANGA Tilesar 1 308
BAUDH BAUDH SADAR Dahya 886
BAUDH HARBHANGA Radha Nagar 262
BAUDH BAUDH SADAR Sangrampur 418
BAUDH BAUDH SADAR Anlapali 323
BAUDH BAUDH SADAR Badhigan 815
BAUDH KANTAMAL Damamunda 263
BAUDH KANTAMAL Palasaguda 277
BAUDH KANTAMAL Gudveli Padar 284
BAUDH HARBHANGA Udaypur 291
BAUDH HARBHANGA Kusang 266
BAUDH HARBHANGA Nuapada 1 337
BAUDH HARBHANGA Boudh 298
BAUDH HARBHANGA Tileswar 349
BAUDH BAUDH SADAR Bala Singha 307
BAUDH BAUDH SADAR Jahanapank 365
CUTTACK CUTTACKSADAR C-21 Bidyadharpur 351
CUTTACK CUTTACKSADAR Tangi1 316
DHENKANAL SADAR Bhapur2 397
DHENKANAL PARAJANG Kandarsingha 457
DHENKANAL ODAPADA Dhaulpur 379
GANJAM KUKUDAKHANDI Lathi 262
GANJAM RANGILUNDA Mantridi 277
GANJAM RANGILUNDA Gopalpur 410
GANJAM JAGANATHPRASAD Baragam 876
GANJAM GANJAM Huma 808
GANJAM RANGILUNDA Phulata 269
GANJAM RANGILUNDA Golanthara 404
GANJAM RANGILUNDA Berhampur1 373
GANJAM CHHATRAPUR Narendrapur 503
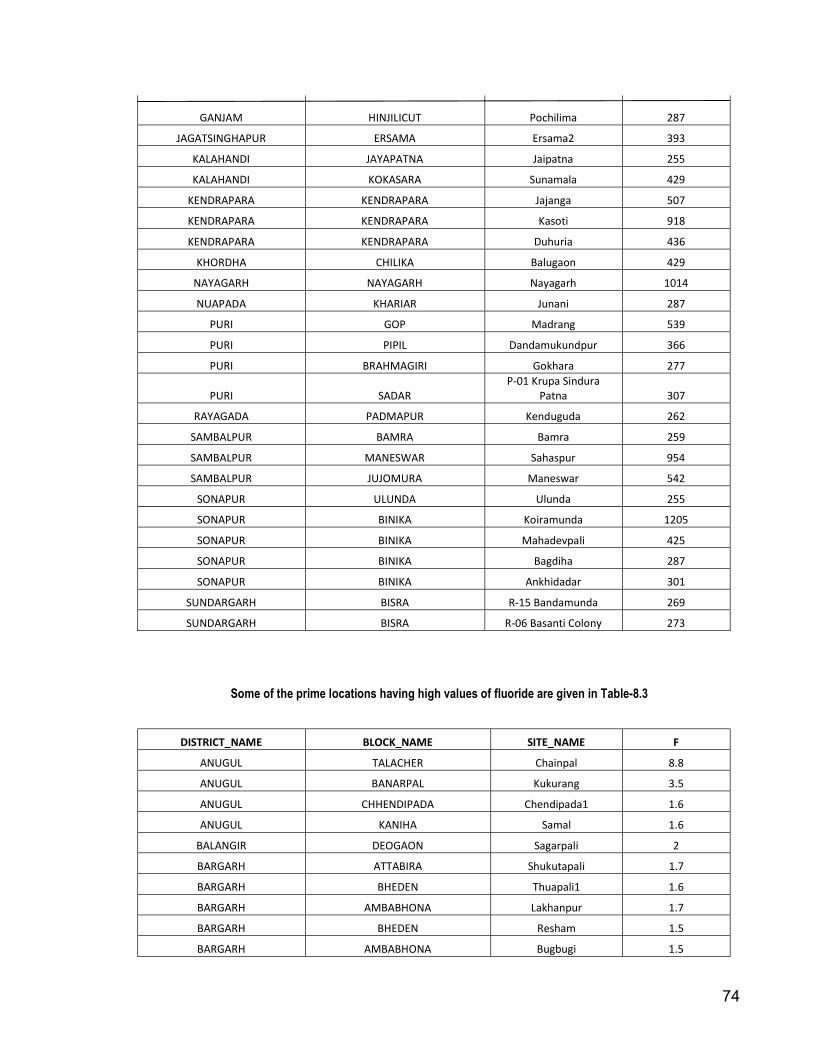
74
GANJAM HINJILICUT Pochilima 287
JAGATSINGHAPUR ERSAMA Ersama2 393
KALAHANDI JAYAPATNA Jaipatna 255
KALAHANDI KOKASARA Sunamala 429
KENDRAPARA KENDRAPARA Jajanga 507
KENDRAPARA KENDRAPARA Kasoti 918
KENDRAPARA KENDRAPARA Duhuria 436
KHORDHA CHILIKA Balugaon 429
NAYAGARH NAYAGARH Nayagarh 1014
NUAPADA KHARIAR Junani 287
PURI GOP Madrang 539
PURI PIPIL Dandamukundpur 366
PURI BRAHMAGIRI Gokhara 277
PURI SADAR P-01 Krupa Sindura
Patna 307
RAYAGADA PADMAPUR Kenduguda 262
SAMBALPUR BAMRA Bamra 259
SAMBALPUR MANESWAR Sahaspur 954
SAMBALPUR JUJOMURA Maneswar 542
SONAPUR ULUNDA Ulunda 255
SONAPUR BINIKA Koiramunda 1205
SONAPUR BINIKA Mahadevpali 425
SONAPUR BINIKA Bagdiha 287
SONAPUR BINIKA Ankhidadar 301
SUNDARGARH BISRA R-15 Bandamunda 269
SUNDARGARH BISRA R-06 Basanti Colony 273
Some of the prime locations having high values of fluoride are given in Table-8.3
DISTRICT_NAME BLOCK_NAME SITE_NAME F
ANUGUL TALACHER Chainpal 8.8
ANUGUL BANARPAL Kukurang 3.5
ANUGUL CHHENDIPADA Chendipada1 1.6
ANUGUL KANIHA Samal 1.6
BALANGIR DEOGAON Sagarpali 2
BARGARH ATTABIRA Shukutapali 1.7
BARGARH BHEDEN Thuapali1 1.6
BARGARH AMBABHONA Lakhanpur 1.7
BARGARH BHEDEN Resham 1.5
BARGARH AMBABHONA Bugbugi 1.5

75
BARGARH BHATLI Katapali 1.8
BARGARH ATTABIRA Top 1.5
BARGARH ATTABIRA Lastala 1.6
BARGARH AMBABHONA Uttam 1.7
BARGARH RAJBORASAMBAR Padampur2 1.5
BARGARH PAIKMAL Malada 1.8
BARGARH PAIKMAL Purena 1.6
BARGARH GAISILET Kantabahal 1.9
BARGARH BIJEPUR Kharmunda 1.5
BARGARH BARAPALI Puturipali 1.5
BARGARH BHEDEN Remenda 1.6
BARGARH BHEDEN Kumbhari 1.6
BARGARH BHEDEN Boipur 1.5
BARGARH BHEDEN Rusuda 1.7
BARGARH BARGARH Tora 1.6
BARGARH BHATLI Sulsulia 1.7
BARGARH BHATLI Sunajuri-Tukuria 1.6
BARGARH ATTABIRA Kulunda 1.7
BAUDH BAUDH SADAR Usbelika 1.7
BAUDH KANTAMAL Auinla Chua Chhak 2.04
BAUDH HARBHANGA Laxmanpur 1.62
BAUDH HARBHANGA Boudh 2.04
DEBAGARH TILEIBANI Rengalbeda 1.67
JAJAPUR DHARMASALA Senoi 1.8
JAJAPUR DHARMASALA Ragadiposi 1.6
JAJAPUR SUKINDA Sukinda 1.5
KALAHANDI JUNAGARH Badbasul 2.5
KALAHANDI GOLAMUNDA Golmunda 1.6
KENDUJHAR KENDUJHARGARH Padampur2 1.5
KENDUJHAR JHUMPURA Katalaposhi 2.4
KENDUJHAR GHASIPURA Ramchandrapur 2.7
MAYURBHANJ JAMDA Moranda 4
MAYURBHANJ KARANJIA Kendumundi 4.2
NAYAGARH GANIA Krushnapali 2.45
NAYAGARH NAYAGARH Sarak Sahi 2.55
NAYAGARH NUAGAON Nuagaon1 3.97
NAYAGARH DASAPALLA Kuanria 2.35
NUAPADA BODEN Boden 1.8
PURI BRAHMAGIRI Gokhara 1.6
SAMBALPUR JAMANKIRA Katar Kela 2
SAMBALPUR JAMANKIRA Badarama 2.2
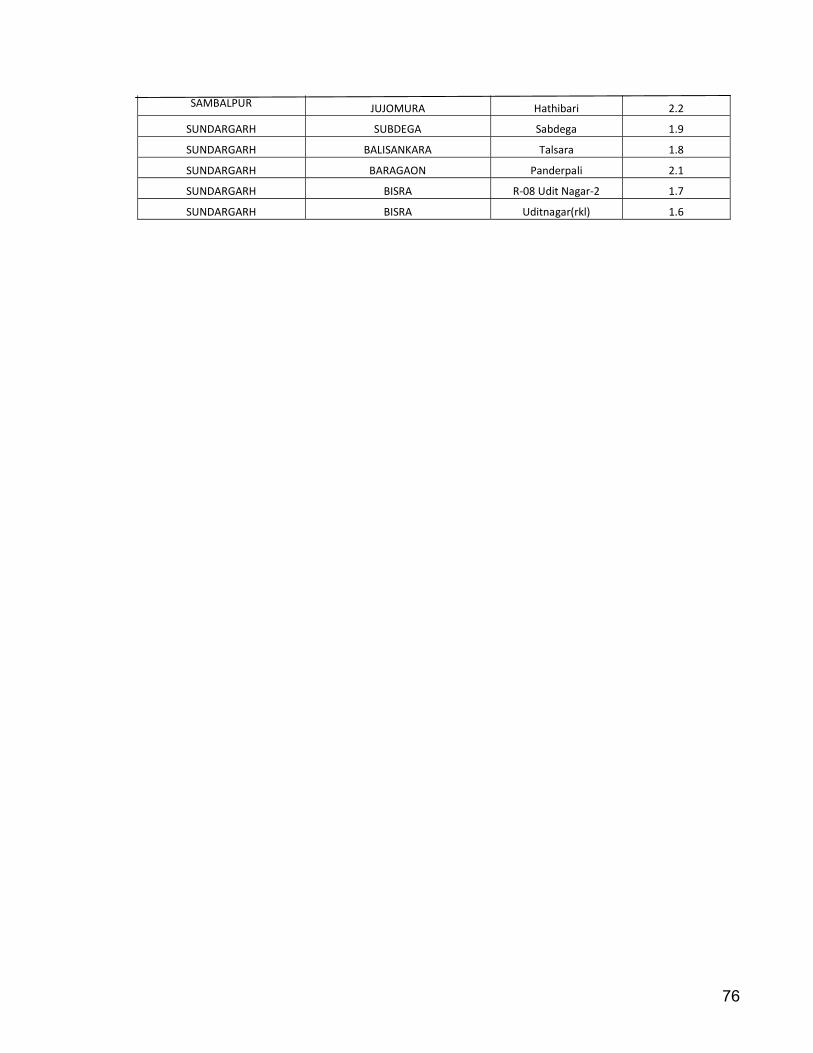
76
SAMBALPUR JUJOMURA Hathibari 2.2
SUNDARGARH SUBDEGA Sabdega 1.9
SUNDARGARH BALISANKARA Talsara 1.8
SUNDARGARH BARAGAON Panderpali 2.1
SUNDARGARH BISRA R-08 Udit Nagar-2 1.7
SUNDARGARH BISRA Uditnagar(rkl) 1.6

77
ANNEXURE - I

78
DISTRICT_NAME_ANUGUL BLOCK_NAME VILLAGE_NAME LATITUDE LONGITUDE SITE_TYPE BANARPAL Arahat 20°46'16" N 85°10'51" E Dug Well KANIHA Nialu 21°11'55" N 84°58'56" E Dug Well KANIHA Derang 21°6'55" N 84°59'3" E Dug Well KANIHA Balipeta 21°6'33" N 84°59'19" E Dug Well KANIHA Sana Santrabandha 21°5'25" N 84°57'9" E Dug Well KANIHA Luhamunda 21°5'24" N 84°59'52" E Dug Well TALACHER Bhalugadia 20°57'29" N 85°0'36" E Dug Well TALACHER Chauliakata 20°57'12" N 85°13'19" E Dug Well TALACHER Baghuabola 20°56'34" N 85°13'4" E Dug Well TALACHER Ghantapada 20°56'7" N 85°11'20" E Dug Well TALACHER Balanda 20°55'40" N 85°9'34" E Dug Well PALALAHADA Jamardihi 21°30'2" N 85°15'26" E Dug Well CHHENDIPADA Katada 20°54'24" N 84°49'14" E Dug Well ATHMALLIK Tileswar 20°53'7" N 84°37'22" E Dug Well KANIHA Seepur 21°10'32" N 85°9'23" E Bore Well KANIHA Pabitranagar 21°8'22" N 85°10'4" E Bore Well KANIHA Goribandha 21°1'3" N 85°10'28" E Bore Well KISHORENAGAR Bamur 21°0'42" N 84°29'10" E Dug Well KISHORENAGAR Boinda-Ii 20°58'8" N 84°39'3" E Bore Well KISHORENAGAR Handpa 20°57'2" N 84°41'20" E Dug Well KISHORENAGAR Boinda 20°54'37" N 84°44'1" E Dug Well TALACHER Chainpal 20°53'12" N 85°13'9" E Bore Well KISHORENAGAR Handpa-Ii 20°52'48" N 85°10'4" E Bore Well ANUGUL Jarpada 20°52'48" N 85°10'4" E Bore Well ANUGUL Purnakot 20°38'45" N 84°50'10" E Dug Well ANUGUL Tikarpara-ii 20°35'54" N 84°47'15" E Dug Well ANUGUL Tikarpara 20°35'54" N 84°47'15" E Dug Well ANUGUL Derjung 20°50'18" N 85°2'8" E Bore Well ANUGUL Maratira 20°49'31" N 84°58'25" E Bore Well ATHMALLIK Thakurgarh 20°48'48" N 84°38'5" E Dug Well ANUGUL Panchmahala-Ii 20°48'12" N 85°0'28" E Bore Well ANUGUL Bantala-Ii 20°44'30" N 85°3'56" E Bore Well ATHMALLIK Athamallik 20°43'19" N 84°31'53" E Dug Well ANUGUL Jagannathpur 20°43'16" N 84°52'10" E Dug Well PALALAHADA Khamar 21°15'58" N 85°11'48" E Dug Well PALALAHADA Khamar-Ii 21°15'58" N 85°12'4" E Bore Well PALALAHADA Srirampur 21°23'40" N 85°9'4" E Dug Well PALALAHADA Pallahara 21°25'45" N 85°11'33" E Dug Well

79
PALALAHADA Pallahara 21°25'54" N 85°11'45" E Bore Well KANIHA Sipur 21°10'0" N 85°9'25" E Dug Well CHHENDIPADA Bagharia 21°6'25" N 84°48'57" E Dug Well CHHENDIPADA Chendipada 21°4'54" N 84°52'18" E Dug Well KANIHA Samal 21°4'20" N 85°8'30" E Dug Well TALACHER Godibandha 21°1'10" N 85°10'10" E Dug Well CHHENDIPADA Kosala 21°0'27" N 84°56'56" E Dug Well TALACHER Kumunda 20°58'35" N 85°1'35" E Dug Well TALACHER Talcher 20°56'55" N 85°12'52" E Dug Well TALACHER Balanda 20°55'39" N 85°9'28" E Dug Well CHHENDIPADA Nisa 20°55'35" N 85°0'15" E Dug Well TALACHER Sendhogram 20°55'32" N 85°14'0" E Dug Well ANUGUL Barhabahal 20°45'18" N 85°6'0" E Dug Well ANUGUL Bantala 20°44'35" N 85°3'47" E Dug Well BANARPAL Banarpal 20°50'30" N 85°12'58" E Dug Well BANARPAL Angul 20°50'20" N 85°5'58" E Dug Well BANARPAL Kulnara 20°50'10" N 85°10'10" E Dug Well ANUGUL Panchmahala 20°49'22" N 85°3'33" E Dug Well ANUGUL Tubey 20°48'50" N 84°59'58" E Dug Well BANARPAL Tulsipal 20°48'13" N 85°11'12" E Dug Well BANARPAL Bhogabereni 20°53'30" N 85°12'50" E Dug Well BANARPAL Kuio 20°53'27" N 85°4'52" E Dug Well CHHENDIPADA Jharpada 20°52'35" N 84°52'55" E Dug Well BANARPAL Amna 20°50'56" N 85°10'8" E Dug Well CHHENDIPADA Ugi 20°50'48" N 84°52'45" E Dug Well TALACHER Tentulai 20°55'10" N 85°10'23" E Dug Well CHHENDIPADA Durgapur 20°55'5" N 84°52'58" E Dug Well BANARPAL Kukurang 20°53'50" N 85°8'54" E Dug Well BANARPAL Mahidharpur 20°41'15" N 85°11'8" E Dug Well
DISTRICT_NAME_BALANGIR BLOCK_NAME VILLAGE_NAME LATITUDE LONGITUDE SITE_TYPE DEOGAON Balukunda 20°35'3" N 83°13'12" E Dug Well SAINTALA Mahagaon 20°25'9" N 83°20'18" E Dug Well BALANGIR Harbhanga 20°58'11" N 83°34'52" E Dug Well TITLAGARH Tarasinga 20°17'11" N 83°16'13" E Dug Well BANGOMUNDA Konda-Bohal 20°16'32" N 82°55'48" E Dug Well TITLAGARH Regdol 20°16'27" N 83°14'33" E Dug Well TUREKELA Dhomana Donga 20°25'37" N 82°54'33" E Dug Well

80
SAINTALA Piprut 20°21'8" N 83°18'36" E Dug Well BANGOMUNDA Joyorpada 20°20'13" N 82°51'49" E Dug Well TITLAGARH Chormara 20°18'17" N 83°17'30" E Dug Well TITLAGARH Titlagarh 20°17'16" N 83°9'28" E Dug Well AGALPUR Agalpur 21°0'44" N 83°24'25" E Dug Well AGALPUR Patdamundai 21°0'7" N 83°26'30" E Dug Well BELPARA Dumabata 20°32'55" N 83°4'37" E Dug Well DEOGAON Kesaropali 20°32'42" N 83°25'0" E Dug Well BELPARA Fattamunda 20°32'9" N 83°6'32" E Dug Well MURIBAHAL Bandupali 20°28'20" N 83°5'37" E Dug Well LOISINGA Loisinga 20°50'57" N 83°30'41" E Dug Well KHAPRAKHOL Phulkimunda 20°42'38" N 82°49'4" E Dug Well AGALPUR Uchhabahal 21°1'44" N 83°26'43" E Dug Well AGALPUR Ichhapur 21°1'5" N 83°18'48" E Dug Well AGALPUR Duduka 20°58'48" N 83°29'28" E Dug Well AGALPUR Salebhata 20°58'15" N 83°32'27" E Dug Well AGALPUR Banjipalli 20°53'30" N 83°30'39" E Dug Well LOISINGA Jogisurda 20°52'42" N 83°33'10" E Dug Well LOISINGA Burda 20°52'29" N 83°30'51" E Dug Well BALANGIR Pudapalli 20°40'47" N 83°31'15" E Dug Well PUINTALA Kurul 20°40'4" N 83°31'31" E Dug Well PUINTALA Atgan 20°40'4" N 83°31'30" E Dug Well BALANGIR Bijakhaman 20°40'2" N 83°27'16" E Dug Well BALANGIR Sikachhira 20°37'33" N 83°24'7" E Dug Well BELPARA Lathor 20°37'30" N 82°45'55" E Dug Well BALANGIR Sinkhaman 20°37'9" N 83°25'35" E Dug Well MURIBAHAL Jamut 20°20'50" N 82°56'31" E Dug Well MURIBAHAL Haladia 20°20'33" N 83°2'42" E Dug Well MURIBAHAL Bongamunda 20°20'26" N 82°54'35" E Dug Well SAINTALA Belgaon 20°18'50" N 83°19'0" E Dug Well BANGOMUNDA Titisilet 20°18'1" N 82°55'30" E Dug Well TITLAGARH Titlagarh I 20°17'13" N 83°8'47" E Dug Well BELPARA Kapali 20°15'8" N 83°13'40" E Dug Well TITLAGARH Minapali 20°14'51" N 83°6'24" E Dug Well TITLAGARH Kholan 20°13'57" N 83°4'39" E Dug Well BANGOMUNDA Sindhikela 20°13'52" N 82°56'29" E Dug Well BANGOMUNDA Sindhikela 20°13'30" N 82°57'22" E Dug Well TITLAGARH Eachgaon 20°12'42" N 83°0'42" E Dug Well BELPARA Belpara 20°35'22" N 82°58'18" E Dug Well BELPARA Nunhad 20°35'1" N 82°57'17" E Dug Well PATNAGARH Sarmuhan 20°34'26" N 82°55'54" E Dug Well

81
DEOGAON Sagarpali 20°33'30" N 83°25'19" E Dug Well TUREKELA Salandi 20°31'24" N 82°55'38" E Dug Well SAINTALA Tikkarpada 20°30'14" N 83°8'5" E Dug Well TUREKELA Tureikela 20°30'10" N 82°48'27" E Dug Well TUREKELA Kurli 20°29'30" N 82°55'12" E Dug Well TENTULIKHUNTI Tusura 20°29'26" N 83°28'33" E Dug Well TUREKELA Kantabanji 20°28'45" N 82°55'40" E Dug Well TUREKELA Kantabhanji 20°28'45" N 82°55'40" E Bore Well KHAPRAKHOL Harisankar 20°50'55" N 82°51'55" E Dug Well LOISINGA Mandia Padar 20°49'53" N 83°30'19" E Dug Well BALANGIR Fasad 20°49'15" N 83°29'56" E Dug Well PUINTALA Chhatamakhan 20°47'10" N 83°29'57" E Dug Well PUINTALA Ledarbohal 20°47'9" N 83°30'8" E Dug Well LOISINGA Banjipali 20°45'57" N 83°20'41" E Dug Well BELPARA Baijal Sagar 20°44'47" N 82°56'41" E Dug Well PUINTALA Dumerbahal 20°44'42" N 83°37'25" E Dug Well PUINTALA Bairasar 20°44'28" N 83°40'11" E Dug Well BALANGIR Madiapali 20°44'28" N 83°29'44" E Dug Well BALANGIR Dudoka Sira 20°44'13" N 83°24'10" E Dug Well BALANGIR Padampur 20°44'4" N 83°34'45" E Dug Well BALANGIR Jhankar Pali 20°43'55" N 83°23'22" E Dug Well BALANGIR Hardatal 20°43'51" N 83°21'50" E Dug Well PATNAGARH Jogimunda 20°43'48" N 83°0'45" E Dug Well PUINTALA Randa 20°43'45" N 83°33'48" E Dug Well PUINTALA Gaintala 20°43'25" N 83°31'35" E Dug Well BALANGIR Dulusara 20°43'18" N 83°18'37" E Dug Well PATNAGARH Ghambari 20°43'17" N 82°56'36" E Dug Well BALANGIR Churapali 20°43'0" N 83°17'0" E Dug Well PATNAGARH Sarmohan-i 20°42'58" N 83°13'20" E Dug Well BALANGIR Dhumamara 20°42'50" N 83°26'27" E Dug Well PATNAGARH Banjari 20°42'33" N 83°5'7" E Dug Well PATNAGARH Rampur 20°42'24" N 83°9'3" E Dug Well BALANGIR Bolangir-1 20°41'55" N 83°28'53" E Dug Well PATNAGARH Patnagarh-ii 20°41'54" N 83°7'27" E Dug Well BALANGIR Bolangir-ii 20°41'52" N 83°28'48" E Dug Well BALANGIR Sikchira 20°41'32" N 83°28'23" E Dug Well MURIBAHAL Gudighat 20°27'55" N 83°3'10" E Dug Well SAINTALA Dumalpada 20°27'3" N 83°21'51" E Dug Well SAINTALA Saintala <New> 20°26'36" N 83°21'33" E Dug Well TITLAGARH Jagua 20°26'8" N 82°54'47" E Dug Well BANGOMUNDA Nekpada 20°26'8" N 82°54'47" E Dug Well

82
SAINTALA Bhadra 20°24'0" N 83°19'51" E Dug Well MURIBAHAL Muribahal 20°23'5" N 83°0'45" E Dug Well AGALPUR Agalpur I 20°22'43" N 83°24'22" E Dug Well
DISTRICT_NAME_BALESHWAR BLOCK_NAME VILLAGE_NAME LATITUDE LONGITUDE SITE_TYPE KHAIRA Kupari 21°16'18" N 86°25'0" E Dug Well SORO Champo 21°19'11" N 86°40'2" E Dug Well OUPADA Gaudasahi 21°21'25" N 86°29'32" E Dug Well NILAGIRI Matialli 21°33'45" N 86°42'9" E Dug Well REMUNA Sasanbar 21°31'44" N 86°54'21" E Dug Well BALESHWAR Sunhat 21°28'45" N 86°57'3" E Dug Well NILAGIRI Kushmi 21°28'38" N 86°43'35" E Dug Well NILAGIRI Tenda 21°28'11" N 86°42'36" E Dug Well NILAGIRI Nilgiri 21°27'43" N 86°45'39" E Dug Well JALESWAR Raibania 21°54'36" N 87°11'52" E Dug Well BASTA Basta 21°41'53" N 87°3'57" E Dug Well NILAGIRI Kansa 21°34'47" N 86°45'1" E Dug Well SORO Baghudi 21°20'15" N 86°39'34" E Dug Well NILAGIRI Jadibali 21°31'18" N 86°43'56" E Dug Well NILAGIRI Ayodhya 21°33'30" N 86°45'23" E Dug Well SORO Lingapada 21°16'45" N 86°41'8" E Dug Well BALIAPAL Baliapal 21°40'13" N 87°17'12" E Dug Well BALESHWAR Rupsa 21°37'42" N 87°1'0" E Dug Well NILAGIRI Nuaporhi 21°33'11" N 86°49'6" E Dug Well REMUNA Govindpur 21°32'55" N 86°55'45" E Dug Well NILAGIRI Mitrapur 21°32'43" N 86°47'50" E Dug Well REMUNA Remuna 21°31'24" N 86°52'12" E Dug Well NILAGIRI Kunchibenia 21°29'58" N 86°40'38" E Dug Well NILAGIRI Darkholi 21°29'55" N 86°35'40" E Dug Well NILAGIRI Bhagabondh 21°29'34" N 86°37'35" E Dug Well OUPADA Dasarathipur Sasan 21°24'43" N 86°44'43" E Dug Well REMUNA Kuligaon 21°22'51" N 86°52'17" E Dug Well NILAGIRI Bhalukasuni 21°29'30" N 86°42'0" E Dug Well NILAGIRI Benthiapada 21°28'34" N 86°43'3" E Dug Well OUPADA Sialghati 21°28'5" N 86°42'50" E Dug Well OUPADA Bankisial 21°28'1" N 86°43'28" E Dug Well NILAGIRI Siadimal 21°27'56" N 86°44'6" E Dug Well OUPADA Jhomghati 21°27'51" N 86°43'30" E Dug Well NILAGIRI Baband 21°27'32" N 86°43'47" E Dug Well

83
BALESHWAR Chandipur 21°27'15" N 87°1'15" E Dug Well REMUNA Shrijang 21°21'11" N 86°52'19" E Dug Well BAHANAGA Bahanga 21°20'22" N 86°45'54" E Dug Well OUPADA Oupada 21°19'42" N 86°30'38" E Dug Well NILAGIRI Chekamara 21°19'17" N 86°40'13" E Dug Well
DISTRICT_NAME_BARGARH BLOCK_NAME VILLAGE_NAME LATITUDE LONGITUDE SITE_TYPE BHEDEN Thuapali 21°16'0" N 83°47'28" E Dug Well BARGARH Kuruan 21°17'30" N 83°44'23" E Dug Well ATTABIRA Shukutapali 21°21'57" N 83°43'0" E Dug Well AMBABHONA Lakhanpur 21°38'31" N 83°36'38" E Dug Well BHEDEN Resham 21°8'10" N 83°41'1" E Dug Well BARGARH Kalapani 21°21'26" N 83°42'31" E Dug Well BARAPALI Remada 21°12'3" N 83°37'4" E Dug Well BHEDEN Bheden 21°11'46" N 83°45'3" E Dug Well SOHELA Ghens 21°11'23" N 83°17'7" E Dug Well SOHELA Batetarma 21°8'39" N 83°15'28" E Dug Well RAJBORASAMBAR Sargibahal 21°4'0" N 83°11'6" E Dug Well AMBABHONA Ambabhona 21°28'26" N 83°28'40" E Dug Well BHATLI Bhatli 21°28'2" N 83°32'5" E Dug Well BHATLI Purrakhai 21°27'23" N 83°29'2" E Dug Well BHATLI Kamagaon 21°26'47" N 83°38'11" E Dug Well BARGARH Sarala 21°23'56" N 83°39'20" E Dug Well BARGARH Kharmanda 21°26'21" N 83°40'55" E Dug Well AMBABHONA Bhukta 21°35'5" N 83°24'55" E Dug Well AMBABHONA Dungri 21°41'12" N 83°33'55" E Dug Well AMBABHONA Bugbugi 21°36'50" N 83°29'21" E Dug Well AMBABHONA Karla 21°36'11" N 83°34'29" E Dug Well BHATLI Katapali 21°35'6" N 83°25'14" E Dug Well BHEDEN Rusuda 21°10'20" N 83°51'20" E Dug Well BHEDEN Baghapalli 21°9'55" N 83°47'55" E Dug Well BHEDEN Sikirdi 21°9'35" N 83°37'35" E Dug Well BIJEPUR Burdapali 21°9'34" N 83°28'9" E Dug Well BHEDEN Satlama 21°8'35" N 83°37'5" E Dug Well BIJEPUR Kharmunda 21°8'7" N 83°29'23" E Dug Well BHEDEN Gondtarum 21°6'35" N 83°50'30" E Dug Well RAJBORASAMBAR Mahulpali 21°0'38" N 83°6'10" E Dug Well RAJBORASAMBAR Padampur 20°59'57" N 83°4'16" E Dug Well
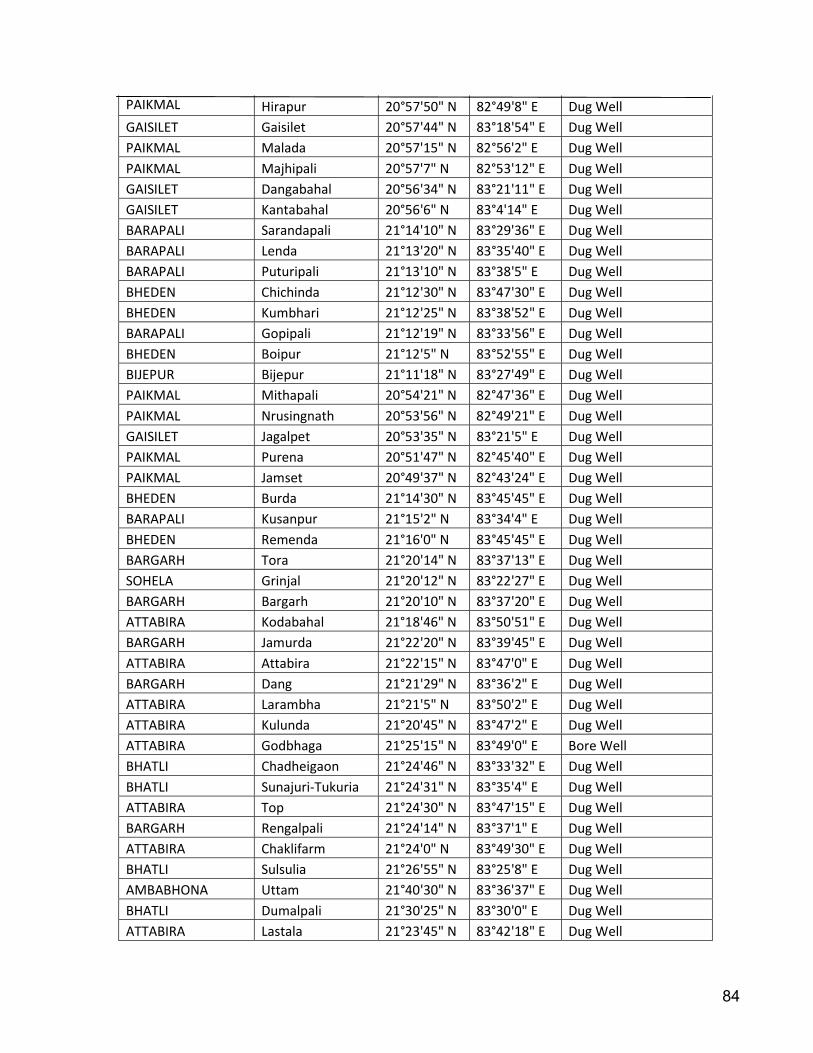
84
PAIKMAL Hirapur 20°57'50" N 82°49'8" E Dug Well GAISILET Gaisilet 20°57'44" N 83°18'54" E Dug Well PAIKMAL Malada 20°57'15" N 82°56'2" E Dug Well PAIKMAL Majhipali 20°57'7" N 82°53'12" E Dug Well GAISILET Dangabahal 20°56'34" N 83°21'11" E Dug Well GAISILET Kantabahal 20°56'6" N 83°4'14" E Dug Well BARAPALI Sarandapali 21°14'10" N 83°29'36" E Dug Well BARAPALI Lenda 21°13'20" N 83°35'40" E Dug Well BARAPALI Puturipali 21°13'10" N 83°38'5" E Dug Well BHEDEN Chichinda 21°12'30" N 83°47'30" E Dug Well BHEDEN Kumbhari 21°12'25" N 83°38'52" E Dug Well BARAPALI Gopipali 21°12'19" N 83°33'56" E Dug Well BHEDEN Boipur 21°12'5" N 83°52'55" E Dug Well BIJEPUR Bijepur 21°11'18" N 83°27'49" E Dug Well PAIKMAL Mithapali 20°54'21" N 82°47'36" E Dug Well PAIKMAL Nrusingnath 20°53'56" N 82°49'21" E Dug Well GAISILET Jagalpet 20°53'35" N 83°21'5" E Dug Well PAIKMAL Purena 20°51'47" N 82°45'40" E Dug Well PAIKMAL Jamset 20°49'37" N 82°43'24" E Dug Well BHEDEN Burda 21°14'30" N 83°45'45" E Dug Well BARAPALI Kusanpur 21°15'2" N 83°34'4" E Dug Well BHEDEN Remenda 21°16'0" N 83°45'45" E Dug Well BARGARH Tora 21°20'14" N 83°37'13" E Dug Well SOHELA Grinjal 21°20'12" N 83°22'27" E Dug Well BARGARH Bargarh 21°20'10" N 83°37'20" E Dug Well ATTABIRA Kodabahal 21°18'46" N 83°50'51" E Dug Well BARGARH Jamurda 21°22'20" N 83°39'45" E Dug Well ATTABIRA Attabira 21°22'15" N 83°47'0" E Dug Well BARGARH Dang 21°21'29" N 83°36'2" E Dug Well ATTABIRA Larambha 21°21'5" N 83°50'2" E Dug Well ATTABIRA Kulunda 21°20'45" N 83°47'2" E Dug Well ATTABIRA Godbhaga 21°25'15" N 83°49'0" E Bore Well BHATLI Chadheigaon 21°24'46" N 83°33'32" E Dug Well BHATLI Sunajuri-Tukuria 21°24'31" N 83°35'4" E Dug Well ATTABIRA Top 21°24'30" N 83°47'15" E Dug Well BARGARH Rengalpali 21°24'14" N 83°37'1" E Dug Well ATTABIRA Chaklifarm 21°24'0" N 83°49'30" E Dug Well BHATLI Sulsulia 21°26'55" N 83°25'8" E Dug Well AMBABHONA Uttam 21°40'30" N 83°36'37" E Dug Well BHATLI Dumalpali 21°30'25" N 83°30'0" E Dug Well ATTABIRA Lastala 21°23'45" N 83°42'18" E Dug Well
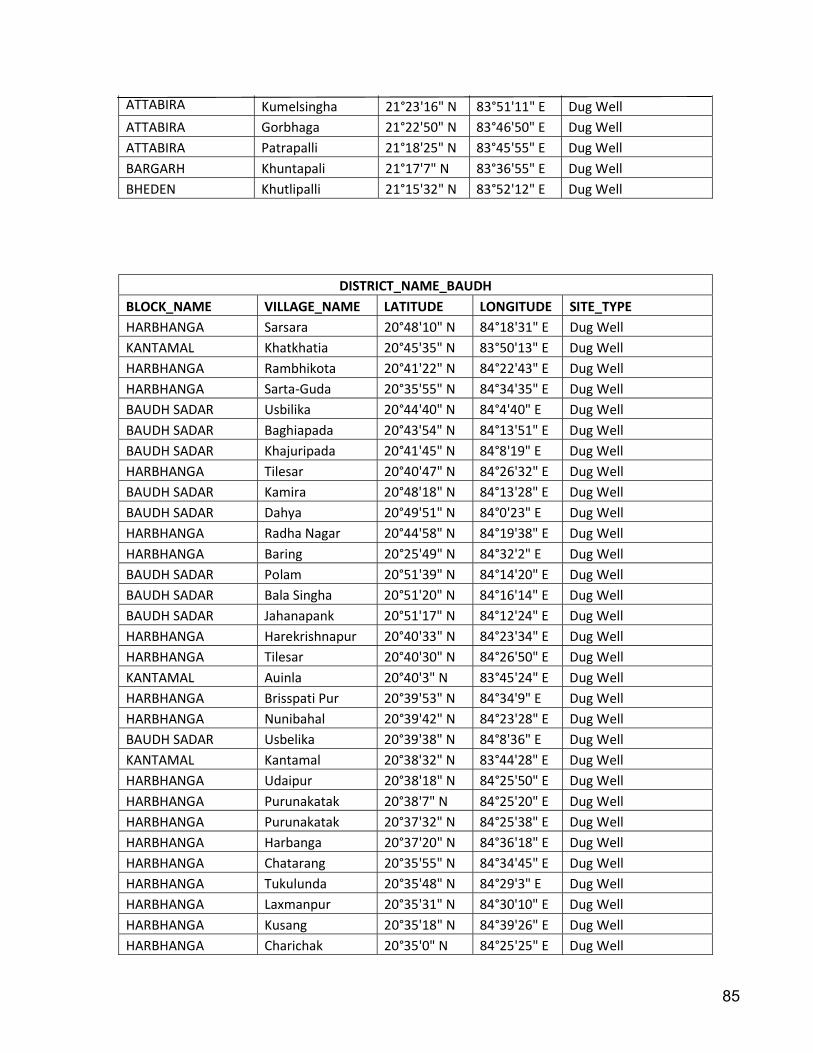
85
ATTABIRA Kumelsingha 21°23'16" N 83°51'11" E Dug Well ATTABIRA Gorbhaga 21°22'50" N 83°46'50" E Dug Well ATTABIRA Patrapalli 21°18'25" N 83°45'55" E Dug Well BARGARH Khuntapali 21°17'7" N 83°36'55" E Dug Well BHEDEN Khutlipalli 21°15'32" N 83°52'12" E Dug Well
DISTRICT_NAME_BAUDH BLOCK_NAME VILLAGE_NAME LATITUDE LONGITUDE SITE_TYPE HARBHANGA Sarsara 20°48'10" N 84°18'31" E Dug Well KANTAMAL Khatkhatia 20°45'35" N 83°50'13" E Dug Well HARBHANGA Rambhikota 20°41'22" N 84°22'43" E Dug Well HARBHANGA Sarta-Guda 20°35'55" N 84°34'35" E Dug Well BAUDH SADAR Usbilika 20°44'40" N 84°4'40" E Dug Well BAUDH SADAR Baghiapada 20°43'54" N 84°13'51" E Dug Well BAUDH SADAR Khajuripada 20°41'45" N 84°8'19" E Dug Well HARBHANGA Tilesar 20°40'47" N 84°26'32" E Dug Well BAUDH SADAR Kamira 20°48'18" N 84°13'28" E Dug Well BAUDH SADAR Dahya 20°49'51" N 84°0'23" E Dug Well HARBHANGA Radha Nagar 20°44'58" N 84°19'38" E Dug Well HARBHANGA Baring 20°25'49" N 84°32'2" E Dug Well BAUDH SADAR Polam 20°51'39" N 84°14'20" E Dug Well BAUDH SADAR Bala Singha 20°51'20" N 84°16'14" E Dug Well BAUDH SADAR Jahanapank 20°51'17" N 84°12'24" E Dug Well HARBHANGA Harekrishnapur 20°40'33" N 84°23'34" E Dug Well HARBHANGA Tilesar 20°40'30" N 84°26'50" E Dug Well KANTAMAL Auinla 20°40'3" N 83°45'24" E Dug Well HARBHANGA Brisspati Pur 20°39'53" N 84°34'9" E Dug Well HARBHANGA Nunibahal 20°39'42" N 84°23'28" E Dug Well BAUDH SADAR Usbelika 20°39'38" N 84°8'36" E Dug Well KANTAMAL Kantamal 20°38'32" N 83°44'28" E Dug Well HARBHANGA Udaipur 20°38'18" N 84°25'50" E Dug Well HARBHANGA Purunakatak 20°38'7" N 84°25'20" E Dug Well HARBHANGA Purunakatak 20°37'32" N 84°25'38" E Dug Well HARBHANGA Harbanga 20°37'20" N 84°36'18" E Dug Well HARBHANGA Chatarang 20°35'55" N 84°34'45" E Dug Well HARBHANGA Tukulunda 20°35'48" N 84°29'3" E Dug Well HARBHANGA Laxmanpur 20°35'31" N 84°30'10" E Dug Well HARBHANGA Kusang 20°35'18" N 84°39'26" E Dug Well HARBHANGA Charichak 20°35'0" N 84°25'25" E Dug Well
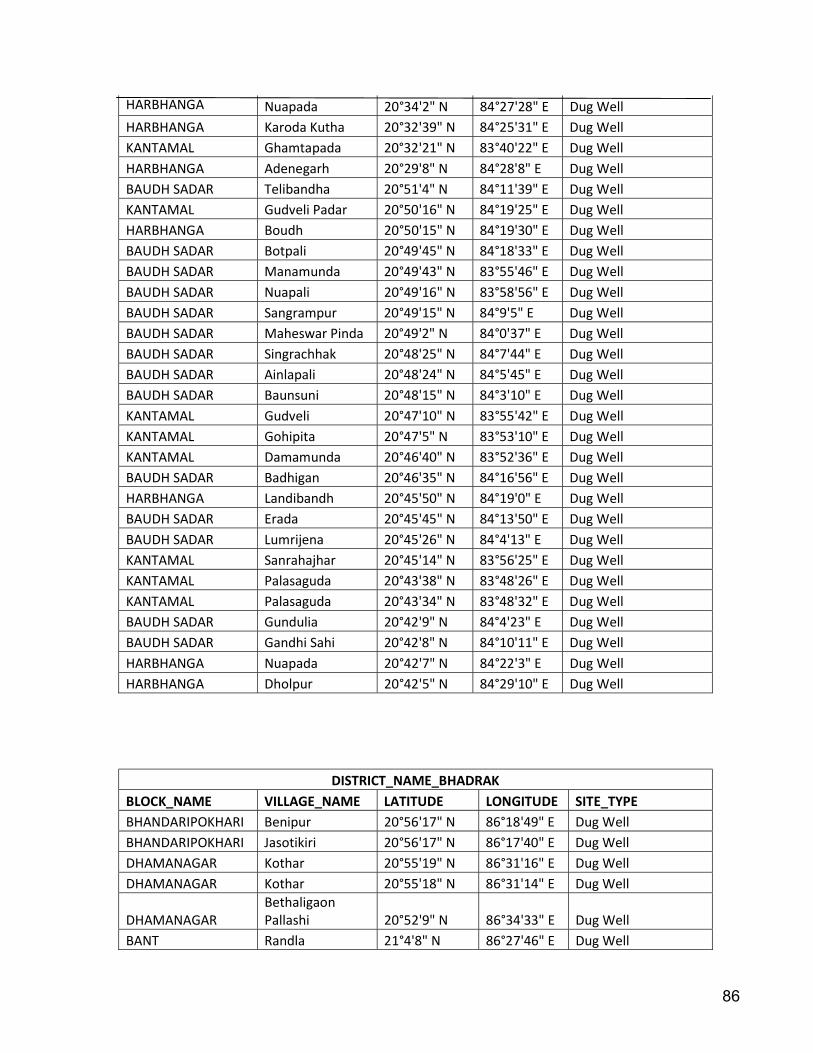
86
HARBHANGA Nuapada 20°34'2" N 84°27'28" E Dug Well HARBHANGA Karoda Kutha 20°32'39" N 84°25'31" E Dug Well KANTAMAL Ghamtapada 20°32'21" N 83°40'22" E Dug Well HARBHANGA Adenegarh 20°29'8" N 84°28'8" E Dug Well BAUDH SADAR Telibandha 20°51'4" N 84°11'39" E Dug Well KANTAMAL Gudveli Padar 20°50'16" N 84°19'25" E Dug Well HARBHANGA Boudh 20°50'15" N 84°19'30" E Dug Well BAUDH SADAR Botpali 20°49'45" N 84°18'33" E Dug Well BAUDH SADAR Manamunda 20°49'43" N 83°55'46" E Dug Well BAUDH SADAR Nuapali 20°49'16" N 83°58'56" E Dug Well BAUDH SADAR Sangrampur 20°49'15" N 84°9'5" E Dug Well BAUDH SADAR Maheswar Pinda 20°49'2" N 84°0'37" E Dug Well BAUDH SADAR Singrachhak 20°48'25" N 84°7'44" E Dug Well BAUDH SADAR Ainlapali 20°48'24" N 84°5'45" E Dug Well BAUDH SADAR Baunsuni 20°48'15" N 84°3'10" E Dug Well KANTAMAL Gudveli 20°47'10" N 83°55'42" E Dug Well KANTAMAL Gohipita 20°47'5" N 83°53'10" E Dug Well KANTAMAL Damamunda 20°46'40" N 83°52'36" E Dug Well BAUDH SADAR Badhigan 20°46'35" N 84°16'56" E Dug Well HARBHANGA Landibandh 20°45'50" N 84°19'0" E Dug Well BAUDH SADAR Erada 20°45'45" N 84°13'50" E Dug Well BAUDH SADAR Lumrijena 20°45'26" N 84°4'13" E Dug Well KANTAMAL Sanrahajhar 20°45'14" N 83°56'25" E Dug Well KANTAMAL Palasaguda 20°43'38" N 83°48'26" E Dug Well KANTAMAL Palasaguda 20°43'34" N 83°48'32" E Dug Well BAUDH SADAR Gundulia 20°42'9" N 84°4'23" E Dug Well BAUDH SADAR Gandhi Sahi 20°42'8" N 84°10'11" E Dug Well HARBHANGA Nuapada 20°42'7" N 84°22'3" E Dug Well HARBHANGA Dholpur 20°42'5" N 84°29'10" E Dug Well
DISTRICT_NAME_BHADRAK BLOCK_NAME VILLAGE_NAME LATITUDE LONGITUDE SITE_TYPE BHANDARIPOKHARI Benipur 20°56'17" N 86°18'49" E Dug Well BHANDARIPOKHARI Jasotikiri 20°56'17" N 86°17'40" E Dug Well DHAMANAGAR Kothar 20°55'19" N 86°31'16" E Dug Well DHAMANAGAR Kothar 20°55'18" N 86°31'14" E Dug Well
DHAMANAGAR Bethaligaon Pallashi 20°52'9" N 86°34'33" E Dug Well
BANT Randla 21°4'8" N 86°27'46" E Dug Well
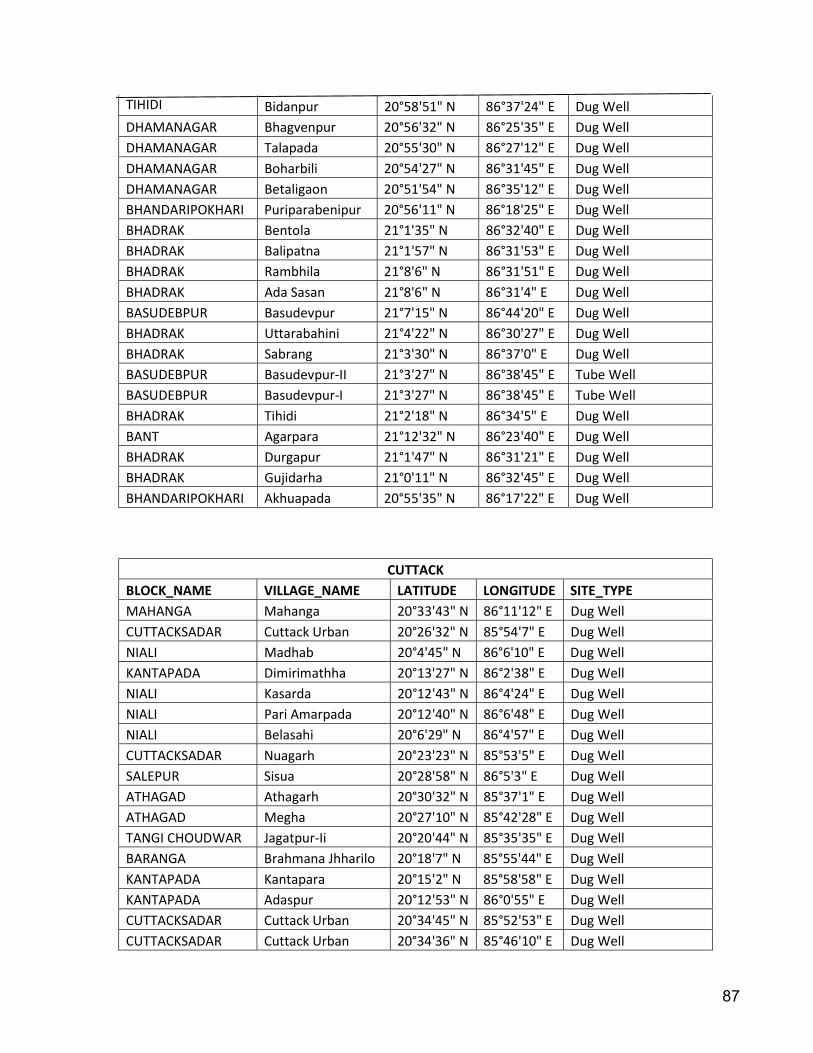
87
TIHIDI Bidanpur 20°58'51" N 86°37'24" E Dug Well DHAMANAGAR Bhagvenpur 20°56'32" N 86°25'35" E Dug Well DHAMANAGAR Talapada 20°55'30" N 86°27'12" E Dug Well DHAMANAGAR Boharbili 20°54'27" N 86°31'45" E Dug Well DHAMANAGAR Betaligaon 20°51'54" N 86°35'12" E Dug Well BHANDARIPOKHARI Puriparabenipur 20°56'11" N 86°18'25" E Dug Well BHADRAK Bentola 21°1'35" N 86°32'40" E Dug Well BHADRAK Balipatna 21°1'57" N 86°31'53" E Dug Well BHADRAK Rambhila 21°8'6" N 86°31'51" E Dug Well BHADRAK Ada Sasan 21°8'6" N 86°31'4" E Dug Well BASUDEBPUR Basudevpur 21°7'15" N 86°44'20" E Dug Well BHADRAK Uttarabahini 21°4'22" N 86°30'27" E Dug Well BHADRAK Sabrang 21°3'30" N 86°37'0" E Dug Well BASUDEBPUR Basudevpur-II 21°3'27" N 86°38'45" E Tube Well BASUDEBPUR Basudevpur-I 21°3'27" N 86°38'45" E Tube Well BHADRAK Tihidi 21°2'18" N 86°34'5" E Dug Well BANT Agarpara 21°12'32" N 86°23'40" E Dug Well BHADRAK Durgapur 21°1'47" N 86°31'21" E Dug Well BHADRAK Gujidarha 21°0'11" N 86°32'45" E Dug Well BHANDARIPOKHARI Akhuapada 20°55'35" N 86°17'22" E Dug Well
CUTTACK BLOCK_NAME VILLAGE_NAME LATITUDE LONGITUDE SITE_TYPE MAHANGA Mahanga 20°33'43" N 86°11'12" E Dug Well CUTTACKSADAR Cuttack Urban 20°26'32" N 85°54'7" E Dug Well NIALI Madhab 20°4'45" N 86°6'10" E Dug Well KANTAPADA Dimirimathha 20°13'27" N 86°2'38" E Dug Well NIALI Kasarda 20°12'43" N 86°4'24" E Dug Well NIALI Pari Amarpada 20°12'40" N 86°6'48" E Dug Well NIALI Belasahi 20°6'29" N 86°4'57" E Dug Well CUTTACKSADAR Nuagarh 20°23'23" N 85°53'5" E Dug Well SALEPUR Sisua 20°28'58" N 86°5'3" E Dug Well ATHAGAD Athagarh 20°30'32" N 85°37'1" E Dug Well ATHAGAD Megha 20°27'10" N 85°42'28" E Dug Well TANGI CHOUDWAR Jagatpur-Ii 20°20'44" N 85°35'35" E Dug Well BARANGA Brahmana Jhharilo 20°18'7" N 85°55'44" E Dug Well KANTAPADA Kantapara 20°15'2" N 85°58'58" E Dug Well KANTAPADA Adaspur 20°12'53" N 86°0'55" E Dug Well CUTTACKSADAR Cuttack Urban 20°34'45" N 85°52'53" E Dug Well CUTTACKSADAR Cuttack Urban 20°34'36" N 85°46'10" E Dug Well
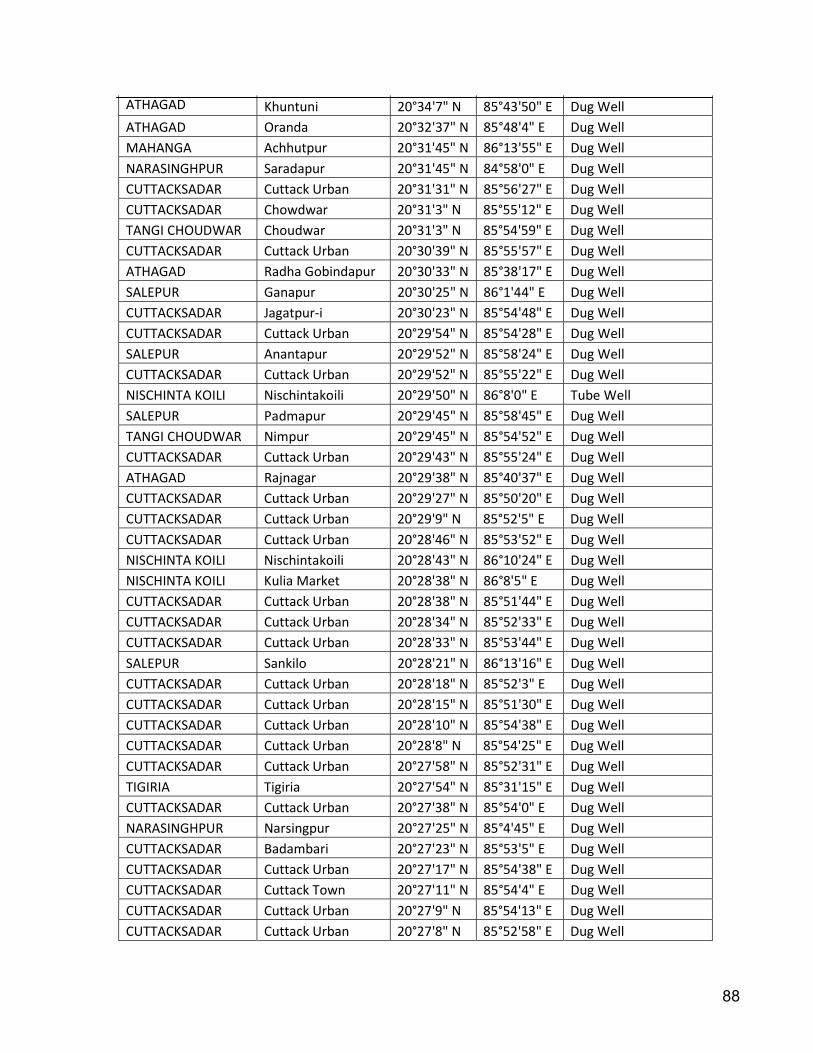
88
ATHAGAD Khuntuni 20°34'7" N 85°43'50" E Dug Well ATHAGAD Oranda 20°32'37" N 85°48'4" E Dug Well MAHANGA Achhutpur 20°31'45" N 86°13'55" E Dug Well NARASINGHPUR Saradapur 20°31'45" N 84°58'0" E Dug Well CUTTACKSADAR Cuttack Urban 20°31'31" N 85°56'27" E Dug Well CUTTACKSADAR Chowdwar 20°31'3" N 85°55'12" E Dug Well TANGI CHOUDWAR Choudwar 20°31'3" N 85°54'59" E Dug Well CUTTACKSADAR Cuttack Urban 20°30'39" N 85°55'57" E Dug Well ATHAGAD Radha Gobindapur 20°30'33" N 85°38'17" E Dug Well SALEPUR Ganapur 20°30'25" N 86°1'44" E Dug Well CUTTACKSADAR Jagatpur-i 20°30'23" N 85°54'48" E Dug Well CUTTACKSADAR Cuttack Urban 20°29'54" N 85°54'28" E Dug Well SALEPUR Anantapur 20°29'52" N 85°58'24" E Dug Well CUTTACKSADAR Cuttack Urban 20°29'52" N 85°55'22" E Dug Well NISCHINTA KOILI Nischintakoili 20°29'50" N 86°8'0" E Tube Well SALEPUR Padmapur 20°29'45" N 85°58'45" E Dug Well TANGI CHOUDWAR Nimpur 20°29'45" N 85°54'52" E Dug Well CUTTACKSADAR Cuttack Urban 20°29'43" N 85°55'24" E Dug Well ATHAGAD Rajnagar 20°29'38" N 85°40'37" E Dug Well CUTTACKSADAR Cuttack Urban 20°29'27" N 85°50'20" E Dug Well CUTTACKSADAR Cuttack Urban 20°29'9" N 85°52'5" E Dug Well CUTTACKSADAR Cuttack Urban 20°28'46" N 85°53'52" E Dug Well NISCHINTA KOILI Nischintakoili 20°28'43" N 86°10'24" E Dug Well NISCHINTA KOILI Kulia Market 20°28'38" N 86°8'5" E Dug Well CUTTACKSADAR Cuttack Urban 20°28'38" N 85°51'44" E Dug Well CUTTACKSADAR Cuttack Urban 20°28'34" N 85°52'33" E Dug Well CUTTACKSADAR Cuttack Urban 20°28'33" N 85°53'44" E Dug Well SALEPUR Sankilo 20°28'21" N 86°13'16" E Dug Well CUTTACKSADAR Cuttack Urban 20°28'18" N 85°52'3" E Dug Well CUTTACKSADAR Cuttack Urban 20°28'15" N 85°51'30" E Dug Well CUTTACKSADAR Cuttack Urban 20°28'10" N 85°54'38" E Dug Well CUTTACKSADAR Cuttack Urban 20°28'8" N 85°54'25" E Dug Well CUTTACKSADAR Cuttack Urban 20°27'58" N 85°52'31" E Dug Well TIGIRIA Tigiria 20°27'54" N 85°31'15" E Dug Well CUTTACKSADAR Cuttack Urban 20°27'38" N 85°54'0" E Dug Well NARASINGHPUR Narsingpur 20°27'25" N 85°4'45" E Dug Well CUTTACKSADAR Badambari 20°27'23" N 85°53'5" E Dug Well CUTTACKSADAR Cuttack Urban 20°27'17" N 85°54'38" E Dug Well CUTTACKSADAR Cuttack Town 20°27'11" N 85°54'4" E Dug Well CUTTACKSADAR Cuttack Urban 20°27'9" N 85°54'13" E Dug Well CUTTACKSADAR Cuttack Urban 20°27'8" N 85°52'58" E Dug Well
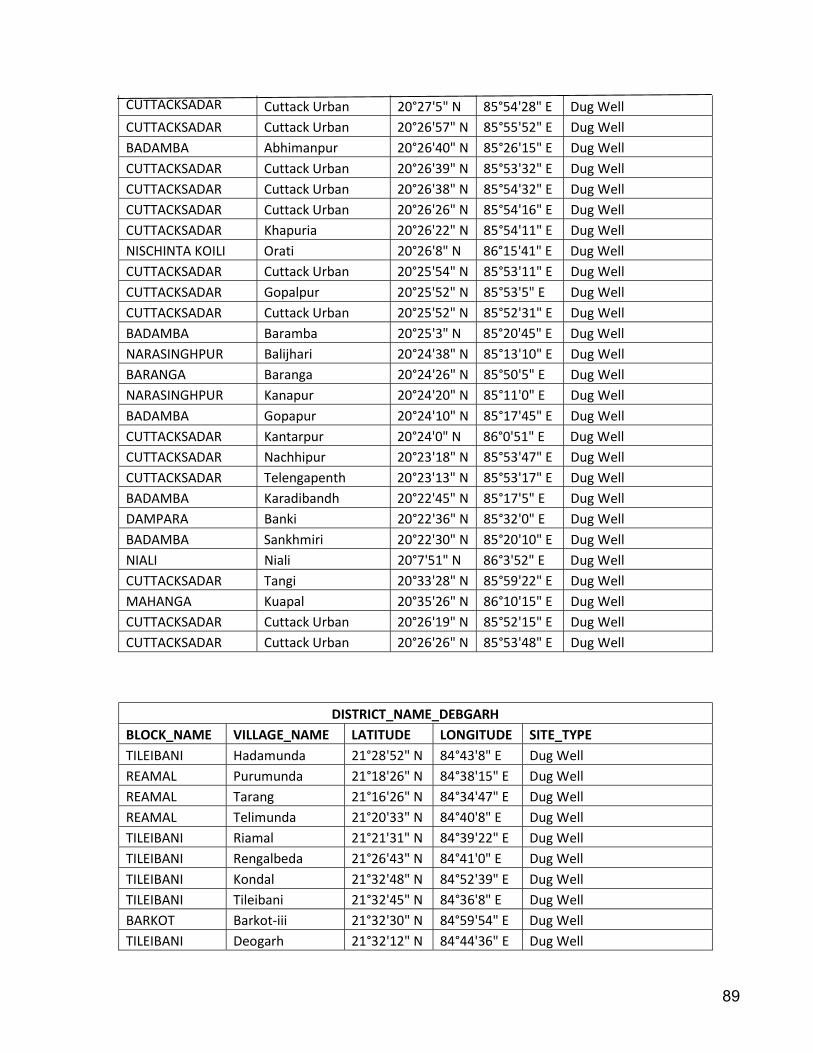
89
CUTTACKSADAR Cuttack Urban 20°27'5" N 85°54'28" E Dug Well CUTTACKSADAR Cuttack Urban 20°26'57" N 85°55'52" E Dug Well BADAMBA Abhimanpur 20°26'40" N 85°26'15" E Dug Well CUTTACKSADAR Cuttack Urban 20°26'39" N 85°53'32" E Dug Well CUTTACKSADAR Cuttack Urban 20°26'38" N 85°54'32" E Dug Well CUTTACKSADAR Cuttack Urban 20°26'26" N 85°54'16" E Dug Well CUTTACKSADAR Khapuria 20°26'22" N 85°54'11" E Dug Well NISCHINTA KOILI Orati 20°26'8" N 86°15'41" E Dug Well CUTTACKSADAR Cuttack Urban 20°25'54" N 85°53'11" E Dug Well CUTTACKSADAR Gopalpur 20°25'52" N 85°53'5" E Dug Well CUTTACKSADAR Cuttack Urban 20°25'52" N 85°52'31" E Dug Well BADAMBA Baramba 20°25'3" N 85°20'45" E Dug Well NARASINGHPUR Balijhari 20°24'38" N 85°13'10" E Dug Well BARANGA Baranga 20°24'26" N 85°50'5" E Dug Well NARASINGHPUR Kanapur 20°24'20" N 85°11'0" E Dug Well BADAMBA Gopapur 20°24'10" N 85°17'45" E Dug Well CUTTACKSADAR Kantarpur 20°24'0" N 86°0'51" E Dug Well CUTTACKSADAR Nachhipur 20°23'18" N 85°53'47" E Dug Well CUTTACKSADAR Telengapenth 20°23'13" N 85°53'17" E Dug Well BADAMBA Karadibandh 20°22'45" N 85°17'5" E Dug Well DAMPARA Banki 20°22'36" N 85°32'0" E Dug Well BADAMBA Sankhmiri 20°22'30" N 85°20'10" E Dug Well NIALI Niali 20°7'51" N 86°3'52" E Dug Well CUTTACKSADAR Tangi 20°33'28" N 85°59'22" E Dug Well MAHANGA Kuapal 20°35'26" N 86°10'15" E Dug Well CUTTACKSADAR Cuttack Urban 20°26'19" N 85°52'15" E Dug Well CUTTACKSADAR Cuttack Urban 20°26'26" N 85°53'48" E Dug Well
DISTRICT_NAME_DEBGARH BLOCK_NAME VILLAGE_NAME LATITUDE LONGITUDE SITE_TYPE TILEIBANI Hadamunda 21°28'52" N 84°43'8" E Dug Well REAMAL Purumunda 21°18'26" N 84°38'15" E Dug Well REAMAL Tarang 21°16'26" N 84°34'47" E Dug Well REAMAL Telimunda 21°20'33" N 84°40'8" E Dug Well TILEIBANI Riamal 21°21'31" N 84°39'22" E Dug Well TILEIBANI Rengalbeda 21°26'43" N 84°41'0" E Dug Well TILEIBANI Kondal 21°32'48" N 84°52'39" E Dug Well TILEIBANI Tileibani 21°32'45" N 84°36'8" E Dug Well BARKOT Barkot-iii 21°32'30" N 84°59'54" E Dug Well TILEIBANI Deogarh 21°32'12" N 84°44'36" E Dug Well
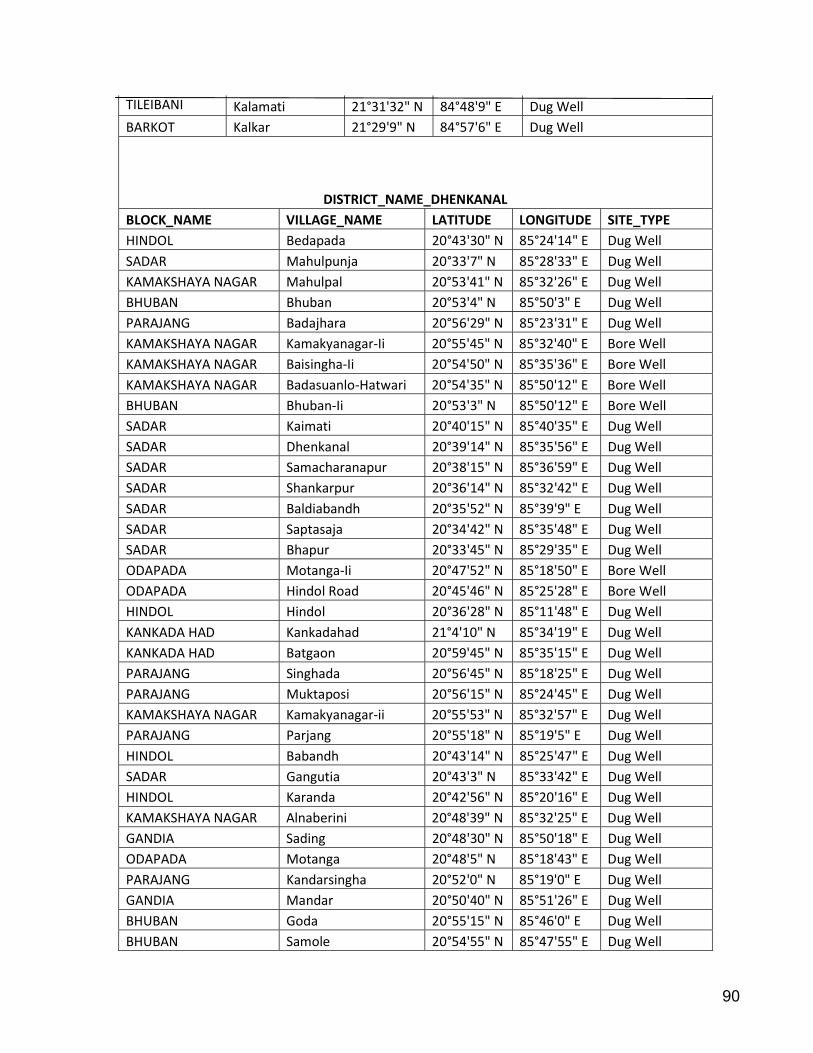
90
TILEIBANI Kalamati 21°31'32" N 84°48'9" E Dug Well BARKOT Kalkar 21°29'9" N 84°57'6" E Dug Well
DISTRICT_NAME_DHENKANAL BLOCK_NAME VILLAGE_NAME LATITUDE LONGITUDE SITE_TYPE HINDOL Bedapada 20°43'30" N 85°24'14" E Dug Well SADAR Mahulpunja 20°33'7" N 85°28'33" E Dug Well KAMAKSHAYA NAGAR Mahulpal 20°53'41" N 85°32'26" E Dug Well BHUBAN Bhuban 20°53'4" N 85°50'3" E Dug Well PARAJANG Badajhara 20°56'29" N 85°23'31" E Dug Well KAMAKSHAYA NAGAR Kamakyanagar-Ii 20°55'45" N 85°32'40" E Bore Well KAMAKSHAYA NAGAR Baisingha-Ii 20°54'50" N 85°35'36" E Bore Well KAMAKSHAYA NAGAR Badasuanlo-Hatwari 20°54'35" N 85°50'12" E Bore Well BHUBAN Bhuban-Ii 20°53'3" N 85°50'12" E Bore Well SADAR Kaimati 20°40'15" N 85°40'35" E Dug Well SADAR Dhenkanal 20°39'14" N 85°35'56" E Dug Well SADAR Samacharanapur 20°38'15" N 85°36'59" E Dug Well SADAR Shankarpur 20°36'14" N 85°32'42" E Dug Well SADAR Baldiabandh 20°35'52" N 85°39'9" E Dug Well SADAR Saptasaja 20°34'42" N 85°35'48" E Dug Well SADAR Bhapur 20°33'45" N 85°29'35" E Dug Well ODAPADA Motanga-Ii 20°47'52" N 85°18'50" E Bore Well ODAPADA Hindol Road 20°45'46" N 85°25'28" E Bore Well HINDOL Hindol 20°36'28" N 85°11'48" E Dug Well KANKADA HAD Kankadahad 21°4'10" N 85°34'19" E Dug Well KANKADA HAD Batgaon 20°59'45" N 85°35'15" E Dug Well PARAJANG Singhada 20°56'45" N 85°18'25" E Dug Well PARAJANG Muktaposi 20°56'15" N 85°24'45" E Dug Well KAMAKSHAYA NAGAR Kamakyanagar-ii 20°55'53" N 85°32'57" E Dug Well PARAJANG Parjang 20°55'18" N 85°19'5" E Dug Well HINDOL Babandh 20°43'14" N 85°25'47" E Dug Well SADAR Gangutia 20°43'3" N 85°33'42" E Dug Well HINDOL Karanda 20°42'56" N 85°20'16" E Dug Well KAMAKSHAYA NAGAR Alnaberini 20°48'39" N 85°32'25" E Dug Well GANDIA Sading 20°48'30" N 85°50'18" E Dug Well ODAPADA Motanga 20°48'5" N 85°18'43" E Dug Well PARAJANG Kandarsingha 20°52'0" N 85°19'0" E Dug Well GANDIA Mandar 20°50'40" N 85°51'26" E Dug Well BHUBAN Goda 20°55'15" N 85°46'0" E Dug Well BHUBAN Samole 20°54'55" N 85°47'55" E Dug Well

91
KAMAKSHAYA NAGAR Baisingha 20°54'50" N 85°35'35" E Dug Well KAMAKSHAYA NAGAR Hatwari 20°54'35" N 85°38'0" E Dug Well BHUBAN Mathakaragola 20°54'1" N 85°41'11" E Dug Well ODAPADA Dhaulpur 20°47'40" N 85°21'25" E Dug Well GANDIA Joranda 20°46'45" N 85°43'30" E Dug Well GANDIA Gondia 20°45'50" N 85°48'6" E Dug Well SADAR Bandhnuagaon 20°42'42" N 85°41'50" E Dug Well HINDOL Balmi 20°42'22" N 85°19'33" E Dug Well GANDIA Deogaon 20°41'48" N 85°44'54" E Dug Well ODAPADA Balrampur 20°40'56" N 85°29'48" E Dug Well HINDOL Rasol 20°37'55" N 85°19'2" E Dug Well
DISTRICT_NAME_GAJAPATI BLOCK_NAME VILLAGE_NAME LATITUDE LONGITUDE SITE_TYPE MOHANA Damadua 19°33'22" N 84°9'36" E Dug Well MOHANA Adaba 19°29'22" N 84°10'56" E Dug Well MOHANA Luhaguda 19°27'34" N 84°21'45" E Dug Well MOHANA Madhura-Amba 19°26'54" N 84°20'53" E Dug Well MOHANA Dantarinalo 19°26'50" N 84°21'37" E Dug Well MOHANA Mohana 19°26'18" N 84°16'6" E Dug Well MOHANA Kirama 19°26'16" N 84°18'41" E Dug Well MOHANA Lillygada 19°25'43" N 84°17'3" E Dug Well MOHANA Suklipadar 19°24'9" N 84°20'28" E Dug Well MOHANA Taramala 19°23'12" N 84°18'23" E Dug Well MOHANA Chandiput 19°21'54" N 84°18'2" E Dug Well MOHANA Zubagaon 19°19'36" N 84°18'10" E Dug Well MOHANA Chandragiri 19°18'21" N 84°17'11" E Dug Well NUAGADA Khajuripara 19°3'55" N 84°5'34" E Dug Well RAYAGADA Tumbagarh 18°56'28" N 84°14'10" E Dug Well PARLAKHEMUNDI Raygarh 18°53'15" N 84°9'40" E Dug Well RAYAGADA Sabarpur 18°52'47" N 84°10'29" E Dug Well PARLAKHEMUNDI Narayanpur 18°52'25" N 84°11'31" E Dug Well PARLAKHEMUNDI Kantragada 18°51'29" N 84°11'26" E Dug Well KASHINAGARA Kasinagar 18°51'22" N 83°52'48" E Dug Well PARLAKHEMUNDI Appalanaidu 18°50'26" N 83°55'9" E Dug Well PARLAKHEMUNDI Tattipati 18°49'54" N 84°12'36" E Dug Well PARLAKHEMUNDI Lavanya Khotta 18°49'11" N 84°17'11" E Dug Well KASHINAGARA K Sitarampur 18°49'3" N 84°0'13" E Dug Well GUMA Ranipetta 18°48'48" N 84°4'12" E Dug Well PARLAKHEMUNDI Gosani 18°48'45" N 84°14'44" E Dug Well
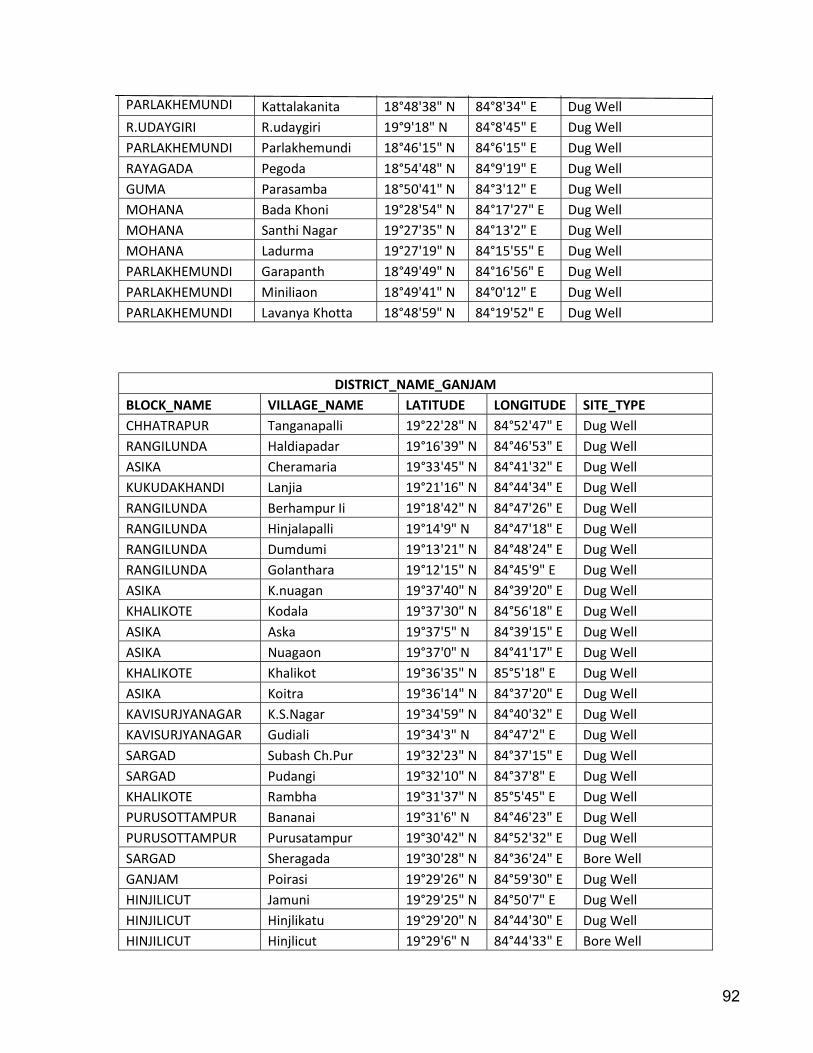
92
PARLAKHEMUNDI Kattalakanita 18°48'38" N 84°8'34" E Dug Well R.UDAYGIRI R.udaygiri 19°9'18" N 84°8'45" E Dug Well PARLAKHEMUNDI Parlakhemundi 18°46'15" N 84°6'15" E Dug Well RAYAGADA Pegoda 18°54'48" N 84°9'19" E Dug Well GUMA Parasamba 18°50'41" N 84°3'12" E Dug Well MOHANA Bada Khoni 19°28'54" N 84°17'27" E Dug Well MOHANA Santhi Nagar 19°27'35" N 84°13'2" E Dug Well MOHANA Ladurma 19°27'19" N 84°15'55" E Dug Well PARLAKHEMUNDI Garapanth 18°49'49" N 84°16'56" E Dug Well PARLAKHEMUNDI Miniliaon 18°49'41" N 84°0'12" E Dug Well PARLAKHEMUNDI Lavanya Khotta 18°48'59" N 84°19'52" E Dug Well
DISTRICT_NAME_GANJAM BLOCK_NAME VILLAGE_NAME LATITUDE LONGITUDE SITE_TYPE CHHATRAPUR Tanganapalli 19°22'28" N 84°52'47" E Dug Well RANGILUNDA Haldiapadar 19°16'39" N 84°46'53" E Dug Well ASIKA Cheramaria 19°33'45" N 84°41'32" E Dug Well KUKUDAKHANDI Lanjia 19°21'16" N 84°44'34" E Dug Well RANGILUNDA Berhampur Ii 19°18'42" N 84°47'26" E Dug Well RANGILUNDA Hinjalapalli 19°14'9" N 84°47'18" E Dug Well RANGILUNDA Dumdumi 19°13'21" N 84°48'24" E Dug Well RANGILUNDA Golanthara 19°12'15" N 84°45'9" E Dug Well ASIKA K.nuagan 19°37'40" N 84°39'20" E Dug Well KHALIKOTE Kodala 19°37'30" N 84°56'18" E Dug Well ASIKA Aska 19°37'5" N 84°39'15" E Dug Well ASIKA Nuagaon 19°37'0" N 84°41'17" E Dug Well KHALIKOTE Khalikot 19°36'35" N 85°5'18" E Dug Well ASIKA Koitra 19°36'14" N 84°37'20" E Dug Well KAVISURJYANAGAR K.S.Nagar 19°34'59" N 84°40'32" E Dug Well KAVISURJYANAGAR Gudiali 19°34'3" N 84°47'2" E Dug Well SARGAD Subash Ch.Pur 19°32'23" N 84°37'15" E Dug Well SARGAD Pudangi 19°32'10" N 84°37'8" E Dug Well KHALIKOTE Rambha 19°31'37" N 85°5'45" E Dug Well PURUSOTTAMPUR Bananai 19°31'6" N 84°46'23" E Dug Well PURUSOTTAMPUR Purusatampur 19°30'42" N 84°52'32" E Dug Well SARGAD Sheragada 19°30'28" N 84°36'24" E Bore Well GANJAM Poirasi 19°29'26" N 84°59'30" E Dug Well HINJILICUT Jamuni 19°29'25" N 84°50'7" E Dug Well HINJILICUT Hinjlikatu 19°29'20" N 84°44'30" E Dug Well HINJILICUT Hinjlicut 19°29'6" N 84°44'33" E Bore Well
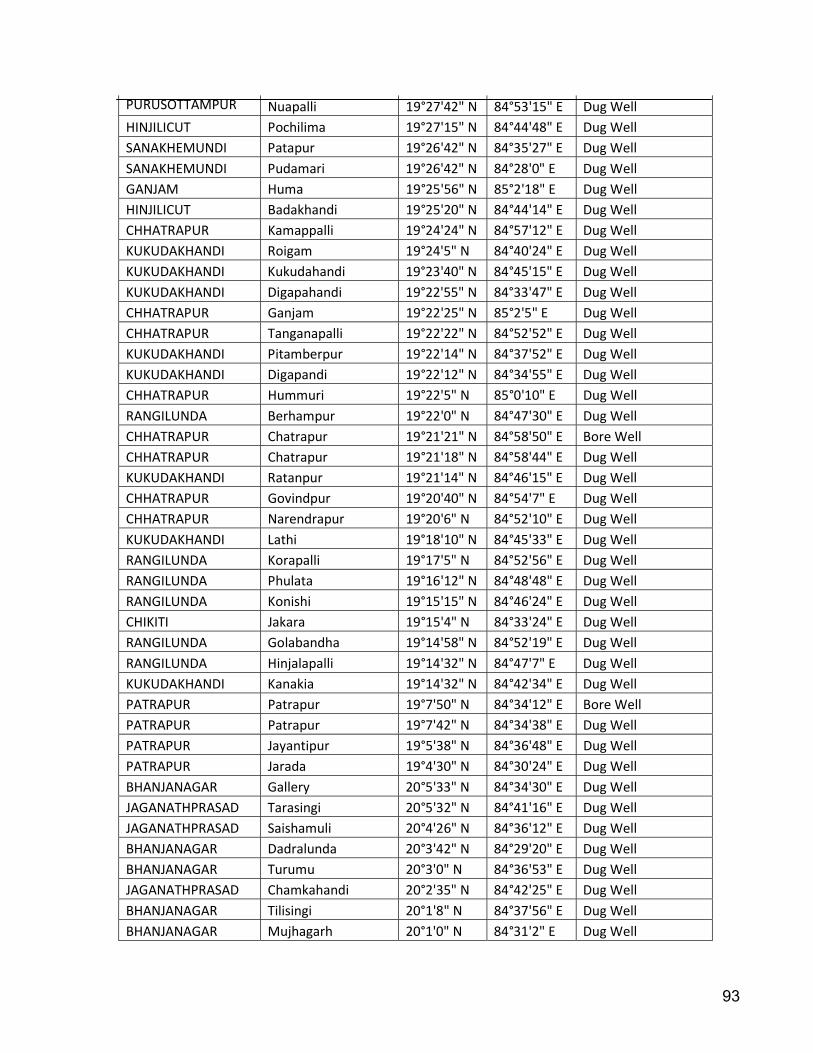
93
PURUSOTTAMPUR Nuapalli 19°27'42" N 84°53'15" E Dug Well HINJILICUT Pochilima 19°27'15" N 84°44'48" E Dug Well SANAKHEMUNDI Patapur 19°26'42" N 84°35'27" E Dug Well SANAKHEMUNDI Pudamari 19°26'42" N 84°28'0" E Dug Well GANJAM Huma 19°25'56" N 85°2'18" E Dug Well HINJILICUT Badakhandi 19°25'20" N 84°44'14" E Dug Well CHHATRAPUR Kamappalli 19°24'24" N 84°57'12" E Dug Well KUKUDAKHANDI Roigam 19°24'5" N 84°40'24" E Dug Well KUKUDAKHANDI Kukudahandi 19°23'40" N 84°45'15" E Dug Well KUKUDAKHANDI Digapahandi 19°22'55" N 84°33'47" E Dug Well CHHATRAPUR Ganjam 19°22'25" N 85°2'5" E Dug Well CHHATRAPUR Tanganapalli 19°22'22" N 84°52'52" E Dug Well KUKUDAKHANDI Pitamberpur 19°22'14" N 84°37'52" E Dug Well KUKUDAKHANDI Digapandi 19°22'12" N 84°34'55" E Dug Well CHHATRAPUR Hummuri 19°22'5" N 85°0'10" E Dug Well RANGILUNDA Berhampur 19°22'0" N 84°47'30" E Dug Well CHHATRAPUR Chatrapur 19°21'21" N 84°58'50" E Bore Well CHHATRAPUR Chatrapur 19°21'18" N 84°58'44" E Dug Well KUKUDAKHANDI Ratanpur 19°21'14" N 84°46'15" E Dug Well CHHATRAPUR Govindpur 19°20'40" N 84°54'7" E Dug Well CHHATRAPUR Narendrapur 19°20'6" N 84°52'10" E Dug Well KUKUDAKHANDI Lathi 19°18'10" N 84°45'33" E Dug Well RANGILUNDA Korapalli 19°17'5" N 84°52'56" E Dug Well RANGILUNDA Phulata 19°16'12" N 84°48'48" E Dug Well RANGILUNDA Konishi 19°15'15" N 84°46'24" E Dug Well CHIKITI Jakara 19°15'4" N 84°33'24" E Dug Well RANGILUNDA Golabandha 19°14'58" N 84°52'19" E Dug Well RANGILUNDA Hinjalapalli 19°14'32" N 84°47'7" E Dug Well KUKUDAKHANDI Kanakia 19°14'32" N 84°42'34" E Dug Well PATRAPUR Patrapur 19°7'50" N 84°34'12" E Bore Well PATRAPUR Patrapur 19°7'42" N 84°34'38" E Dug Well PATRAPUR Jayantipur 19°5'38" N 84°36'48" E Dug Well PATRAPUR Jarada 19°4'30" N 84°30'24" E Dug Well BHANJANAGAR Gallery 20°5'33" N 84°34'30" E Dug Well JAGANATHPRASAD Tarasingi 20°5'32" N 84°41'16" E Dug Well JAGANATHPRASAD Saishamuli 20°4'26" N 84°36'12" E Dug Well BHANJANAGAR Dadralunda 20°3'42" N 84°29'20" E Dug Well BHANJANAGAR Turumu 20°3'0" N 84°36'53" E Dug Well JAGANATHPRASAD Chamkahandi 20°2'35" N 84°42'25" E Dug Well BHANJANAGAR Tilisingi 20°1'8" N 84°37'56" E Dug Well BHANJANAGAR Mujhagarh 20°1'0" N 84°31'2" E Dug Well
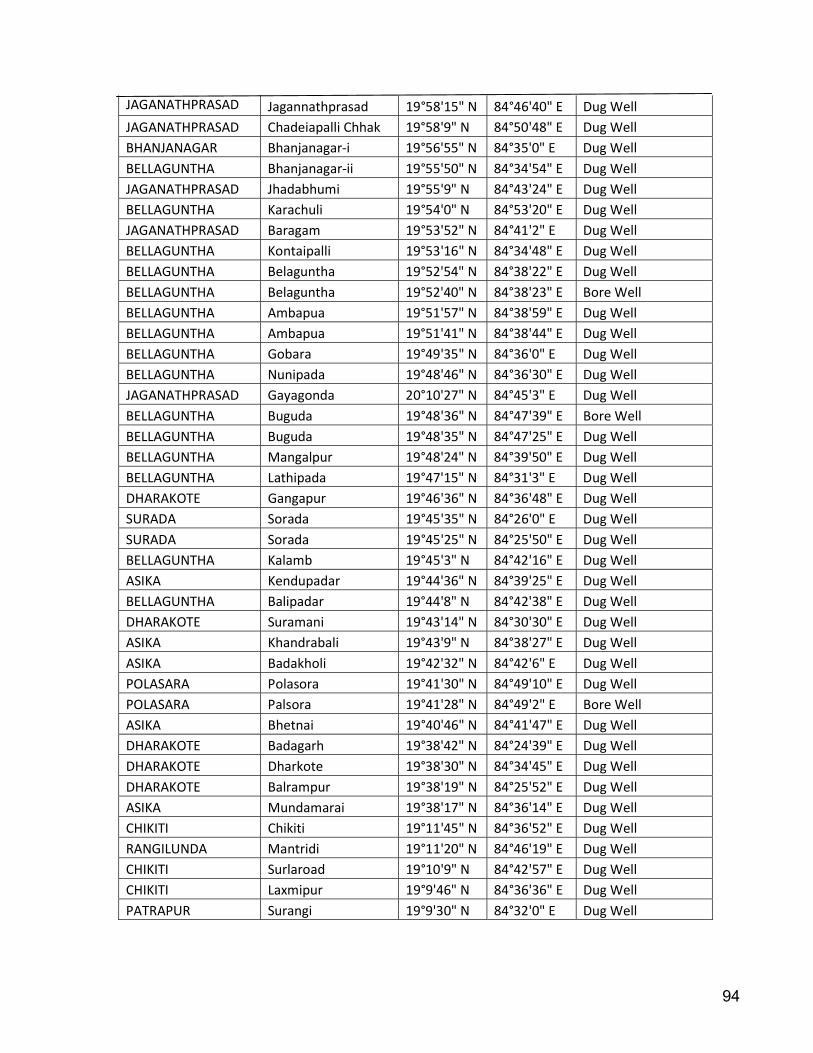
94
JAGANATHPRASAD Jagannathprasad 19°58'15" N 84°46'40" E Dug Well JAGANATHPRASAD Chadeiapalli Chhak 19°58'9" N 84°50'48" E Dug Well BHANJANAGAR Bhanjanagar-i 19°56'55" N 84°35'0" E Dug Well BELLAGUNTHA Bhanjanagar-ii 19°55'50" N 84°34'54" E Dug Well JAGANATHPRASAD Jhadabhumi 19°55'9" N 84°43'24" E Dug Well BELLAGUNTHA Karachuli 19°54'0" N 84°53'20" E Dug Well JAGANATHPRASAD Baragam 19°53'52" N 84°41'2" E Dug Well BELLAGUNTHA Kontaipalli 19°53'16" N 84°34'48" E Dug Well BELLAGUNTHA Belaguntha 19°52'54" N 84°38'22" E Dug Well BELLAGUNTHA Belaguntha 19°52'40" N 84°38'23" E Bore Well BELLAGUNTHA Ambapua 19°51'57" N 84°38'59" E Dug Well BELLAGUNTHA Ambapua 19°51'41" N 84°38'44" E Dug Well BELLAGUNTHA Gobara 19°49'35" N 84°36'0" E Dug Well BELLAGUNTHA Nunipada 19°48'46" N 84°36'30" E Dug Well JAGANATHPRASAD Gayagonda 20°10'27" N 84°45'3" E Dug Well BELLAGUNTHA Buguda 19°48'36" N 84°47'39" E Bore Well BELLAGUNTHA Buguda 19°48'35" N 84°47'25" E Dug Well BELLAGUNTHA Mangalpur 19°48'24" N 84°39'50" E Dug Well BELLAGUNTHA Lathipada 19°47'15" N 84°31'3" E Dug Well DHARAKOTE Gangapur 19°46'36" N 84°36'48" E Dug Well SURADA Sorada 19°45'35" N 84°26'0" E Dug Well SURADA Sorada 19°45'25" N 84°25'50" E Dug Well BELLAGUNTHA Kalamb 19°45'3" N 84°42'16" E Dug Well ASIKA Kendupadar 19°44'36" N 84°39'25" E Dug Well BELLAGUNTHA Balipadar 19°44'8" N 84°42'38" E Dug Well DHARAKOTE Suramani 19°43'14" N 84°30'30" E Dug Well ASIKA Khandrabali 19°43'9" N 84°38'27" E Dug Well ASIKA Badakholi 19°42'32" N 84°42'6" E Dug Well POLASARA Polasora 19°41'30" N 84°49'10" E Dug Well POLASARA Palsora 19°41'28" N 84°49'2" E Bore Well ASIKA Bhetnai 19°40'46" N 84°41'47" E Dug Well DHARAKOTE Badagarh 19°38'42" N 84°24'39" E Dug Well DHARAKOTE Dharkote 19°38'30" N 84°34'45" E Dug Well DHARAKOTE Balrampur 19°38'19" N 84°25'52" E Dug Well ASIKA Mundamarai 19°38'17" N 84°36'14" E Dug Well CHIKITI Chikiti 19°11'45" N 84°36'52" E Dug Well RANGILUNDA Mantridi 19°11'20" N 84°46'19" E Dug Well CHIKITI Surlaroad 19°10'9" N 84°42'57" E Dug Well CHIKITI Laxmipur 19°9'46" N 84°36'36" E Dug Well PATRAPUR Surangi 19°9'30" N 84°32'0" E Dug Well
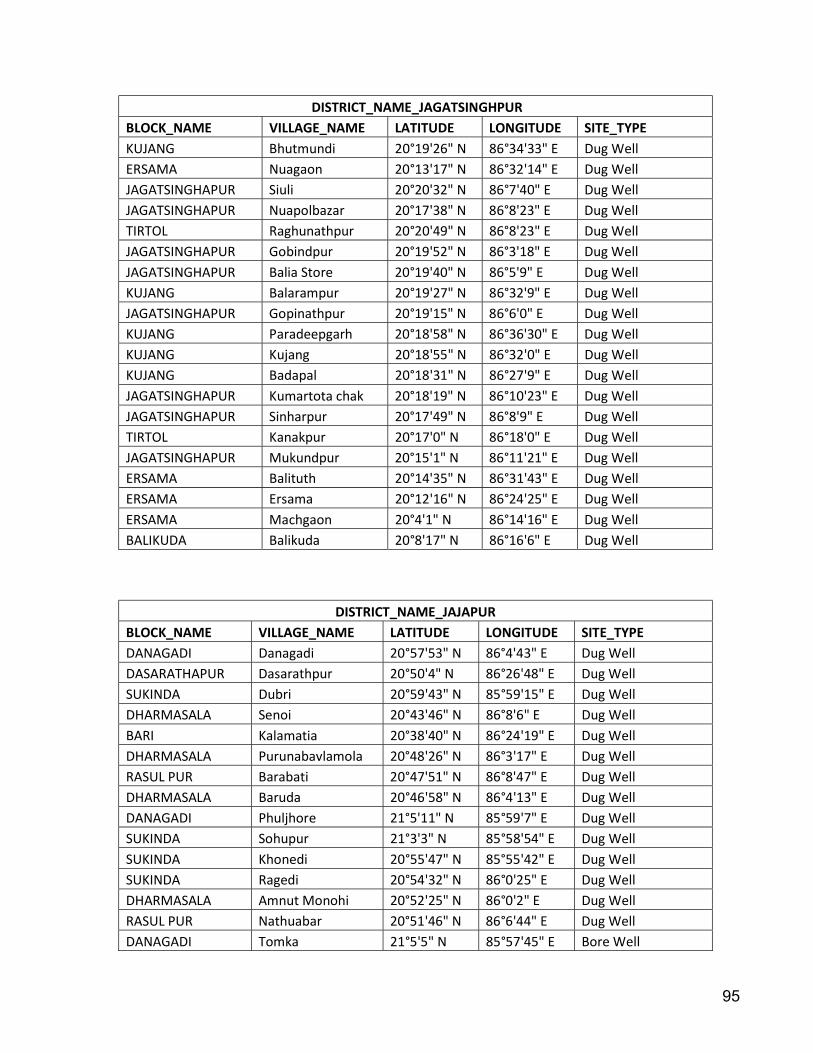
95
DISTRICT_NAME_JAGATSINGHPUR BLOCK_NAME VILLAGE_NAME LATITUDE LONGITUDE SITE_TYPE KUJANG Bhutmundi 20°19'26" N 86°34'33" E Dug Well ERSAMA Nuagaon 20°13'17" N 86°32'14" E Dug Well JAGATSINGHAPUR Siuli 20°20'32" N 86°7'40" E Dug Well JAGATSINGHAPUR Nuapolbazar 20°17'38" N 86°8'23" E Dug Well TIRTOL Raghunathpur 20°20'49" N 86°8'23" E Dug Well JAGATSINGHAPUR Gobindpur 20°19'52" N 86°3'18" E Dug Well JAGATSINGHAPUR Balia Store 20°19'40" N 86°5'9" E Dug Well KUJANG Balarampur 20°19'27" N 86°32'9" E Dug Well JAGATSINGHAPUR Gopinathpur 20°19'15" N 86°6'0" E Dug Well KUJANG Paradeepgarh 20°18'58" N 86°36'30" E Dug Well KUJANG Kujang 20°18'55" N 86°32'0" E Dug Well KUJANG Badapal 20°18'31" N 86°27'9" E Dug Well JAGATSINGHAPUR Kumartota chak 20°18'19" N 86°10'23" E Dug Well JAGATSINGHAPUR Sinharpur 20°17'49" N 86°8'9" E Dug Well TIRTOL Kanakpur 20°17'0" N 86°18'0" E Dug Well JAGATSINGHAPUR Mukundpur 20°15'1" N 86°11'21" E Dug Well ERSAMA Balituth 20°14'35" N 86°31'43" E Dug Well ERSAMA Ersama 20°12'16" N 86°24'25" E Dug Well ERSAMA Machgaon 20°4'1" N 86°14'16" E Dug Well BALIKUDA Balikuda 20°8'17" N 86°16'6" E Dug Well
DISTRICT_NAME_JAJAPUR BLOCK_NAME VILLAGE_NAME LATITUDE LONGITUDE SITE_TYPE DANAGADI Danagadi 20°57'53" N 86°4'43" E Dug Well DASARATHAPUR Dasarathpur 20°50'4" N 86°26'48" E Dug Well SUKINDA Dubri 20°59'43" N 85°59'15" E Dug Well DHARMASALA Senoi 20°43'46" N 86°8'6" E Dug Well BARI Kalamatia 20°38'40" N 86°24'19" E Dug Well DHARMASALA Purunabavlamola 20°48'26" N 86°3'17" E Dug Well RASUL PUR Barabati 20°47'51" N 86°8'47" E Dug Well DHARMASALA Baruda 20°46'58" N 86°4'13" E Dug Well DANAGADI Phuljhore 21°5'11" N 85°59'7" E Dug Well SUKINDA Sohupur 21°3'3" N 85°58'54" E Dug Well SUKINDA Khonedi 20°55'47" N 85°55'42" E Dug Well SUKINDA Ragedi 20°54'32" N 86°0'25" E Dug Well DHARMASALA Amnut Monohi 20°52'25" N 86°0'2" E Dug Well RASUL PUR Nathuabar 20°51'46" N 86°6'44" E Dug Well DANAGADI Tomka 21°5'5" N 85°57'45" E Bore Well

96
SUKINDA Sukurangi 21°2'38" N 85°48'22" E Bore Well SUKINDA Kaliapani 21°2'14" N 85°45'1" E Bore Well KORAI Ragadi 21°2'4" N 86°8'6" E Bore Well SUKINDA Kalarangi-Ii 21°1'3" N 85°45'30" E Bore Well KORAI Tolagarh 20°59'30" N 86°7'40" E Bore Well SUKINDA Garamian 20°59'10" N 85°47'55" E Bore Well SUKINDA Garamiandw 20°59'6" N 85°47'34" E Dug Well SUKINDA Mangalpur 20°57'58" N 85°51'40" E Bore Well DANAGADI Danagadi-Ii 20°57'45" N 86°4'45" E Bore Well KORAI Vyasnagar 20°57'30" N 86°6'45" E Bore Well SUKINDA Sukinda-Ii 20°57'30" N 85°55'0" E Bore Well DANAGADI Jakhpura-Ii 20°56'0" N 86°3'55" E Bore Well DANAGADI Pankpal 20°54'58" N 86°0'50" E Bore Well DHARMASALA Balrampur 20°51'35" N 86°0'15" E Bore Well BINJHARPUR Singhpur New 20°41'19" N 86°30'20" E Dug Well DHARMASALA Chadeidhara 20°48'30" N 86°3'45" E Bore Well DHARMASALA Darpani 20°42'45" N 86°4'41" E Bore Well DANAGADI Kotagaon 20°35'32" N 86°3'7" E Dug Well SUKINDA Saruabil(nuasah 21°3'15" N 85°48'19" E Dug Well SUKINDA Dubri 20°59'30" N 85°59'6" E Dug Well SUKINDA Sukinda 20°58'3" N 85°54'55" E Dug Well DANAGADI Jakhpura 20°55'56" N 86°3'48" E Dug Well DHARMASALA Pobala 20°44'45" N 86°4'30" E Dug Well DHARMASALA Jhargadia 20°44'2" N 86°5'58" E Dug Well BADACHANA Haridaspur 20°43'29" N 86°7'15" E Dug Well DHARMASALA Neulpur 20°42'44" N 86°8'54" E Dug Well DHARMASALA Hatibari 20°53'12" N 85°57'18" E Dug Well DHARMASALA Kabatabandha 20°52'20" N 86°1'30" E Dug Well SUKINDA Ambasar 20°54'50" N 85°56'6" E Dug Well DHARMASALA Ragadiposi 20°48'1" N 86°3'39" E Dug Well DHARMASALA Jamjhari 20°47'31" N 86°4'46" E Dug Well DHARMASALA Madhupurgarh 20°47'3" N 86°5'45" E Dug Well DHARMASALA Dharmsala 20°46'31" N 86°10'3" E Dug Well DHARMASALA Dankari 20°46'30" N 86°3'38" E Dug Well BINJHARPUR Singpur 20°41'40" N 86°30'40" E Dug Well BADACHANA Arkhapur 20°39'14" N 86°9'14" E Dug Well SUKINDA Chinguripal 21°3'15" N 85°45'0" E Dug Well JAJAPUR Jajpur 20°50'7" N 86°20'13" E Dug Well
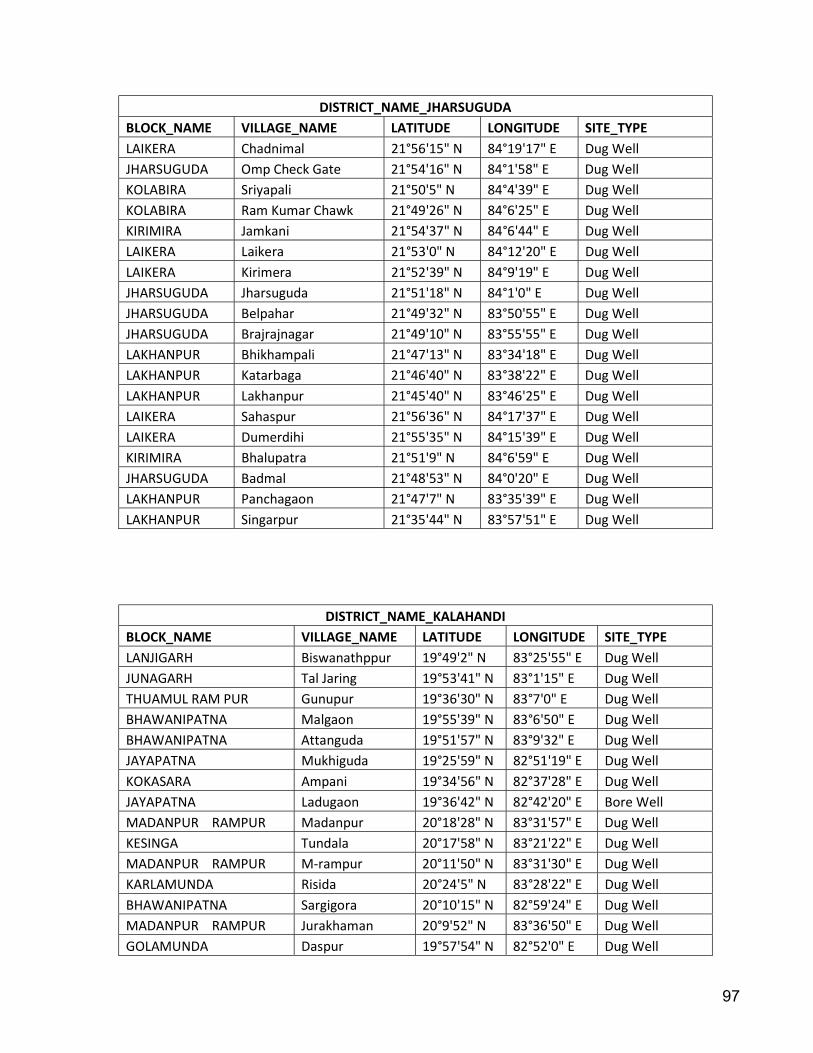
97
DISTRICT_NAME_JHARSUGUDA BLOCK_NAME VILLAGE_NAME LATITUDE LONGITUDE SITE_TYPE LAIKERA Chadnimal 21°56'15" N 84°19'17" E Dug Well JHARSUGUDA Omp Check Gate 21°54'16" N 84°1'58" E Dug Well KOLABIRA Sriyapali 21°50'5" N 84°4'39" E Dug Well KOLABIRA Ram Kumar Chawk 21°49'26" N 84°6'25" E Dug Well KIRIMIRA Jamkani 21°54'37" N 84°6'44" E Dug Well LAIKERA Laikera 21°53'0" N 84°12'20" E Dug Well LAIKERA Kirimera 21°52'39" N 84°9'19" E Dug Well JHARSUGUDA Jharsuguda 21°51'18" N 84°1'0" E Dug Well JHARSUGUDA Belpahar 21°49'32" N 83°50'55" E Dug Well JHARSUGUDA Brajrajnagar 21°49'10" N 83°55'55" E Dug Well LAKHANPUR Bhikhampali 21°47'13" N 83°34'18" E Dug Well LAKHANPUR Katarbaga 21°46'40" N 83°38'22" E Dug Well LAKHANPUR Lakhanpur 21°45'40" N 83°46'25" E Dug Well LAIKERA Sahaspur 21°56'36" N 84°17'37" E Dug Well LAIKERA Dumerdihi 21°55'35" N 84°15'39" E Dug Well KIRIMIRA Bhalupatra 21°51'9" N 84°6'59" E Dug Well JHARSUGUDA Badmal 21°48'53" N 84°0'20" E Dug Well LAKHANPUR Panchagaon 21°47'7" N 83°35'39" E Dug Well LAKHANPUR Singarpur 21°35'44" N 83°57'51" E Dug Well
DISTRICT_NAME_KALAHANDI BLOCK_NAME VILLAGE_NAME LATITUDE LONGITUDE SITE_TYPE LANJIGARH Biswanathppur 19°49'2" N 83°25'55" E Dug Well JUNAGARH Tal Jaring 19°53'41" N 83°1'15" E Dug Well THUAMUL RAM PUR Gunupur 19°36'30" N 83°7'0" E Dug Well BHAWANIPATNA Malgaon 19°55'39" N 83°6'50" E Dug Well BHAWANIPATNA Attanguda 19°51'57" N 83°9'32" E Dug Well JAYAPATNA Mukhiguda 19°25'59" N 82°51'19" E Dug Well KOKASARA Ampani 19°34'56" N 82°37'28" E Dug Well JAYAPATNA Ladugaon 19°36'42" N 82°42'20" E Bore Well MADANPUR RAMPUR Madanpur 20°18'28" N 83°31'57" E Dug Well KESINGA Tundala 20°17'58" N 83°21'22" E Dug Well MADANPUR RAMPUR M-rampur 20°11'50" N 83°31'30" E Dug Well KARLAMUNDA Risida 20°24'5" N 83°28'22" E Dug Well BHAWANIPATNA Sargigora 20°10'15" N 82°59'24" E Dug Well MADANPUR RAMPUR Jurakhaman 20°9'52" N 83°36'50" E Dug Well GOLAMUNDA Daspur 19°57'54" N 82°52'0" E Dug Well

98
BHAWANIPATNA Bawanipatna 19°54'29" N 83°9'33" E Dug Well BHAWANIPATNA Bhawanipatna 19°54'29" N 83°9'33" E Bore Well JUNAGARH Jaring 19°53'37" N 83°1'18" E Dug Well DHARAMAGARH Dharamgarh 19°52'12" N 82°46'47" E Dug Well JUNAGARH Junagarh 19°51'54" N 82°56'19" E Dug Well LANJIGARH Pokaribandh 19°51'10" N 83°25'15" E Dug Well JUNAGARH Baldiamal 19°50'38" N 82°54'25" E Dug Well LANJIGARH Bakatpur 19°50'36" N 83°25'26" E Dug Well BHAWANIPATNA Pastikudi 20°1'4" N 83°9'54" E Dug Well BHAWANIPATNA Pastikudi 20°1'4" N 83°9'54" E Bore Well NARALA Santapur 19°58'8" N 83°19'16" E Dug Well GOLAMUNDA Kegaon 20°6'15" N 82°53'45" E Dug Well LANJIGARH Narla 20°3'45" N 83°22'59" E Dug Well NARALA Tulapada 20°7'39" N 83°25'4" E Dug Well GOLAMUNDA Golmunda 20°3'20" N 82°47'18" E Dug Well GOLAMUNDA Golamunda 20°3'20" N 82°47'18" E Bore Well JUNAGARH Badbasul 19°50'8" N 82°50'15" E Dug Well BHAWANIPATNA Dalguma 19°49'0" N 83°7'15" E Dug Well JUNAGARH Mahichala 19°46'40" N 82°50'45" E Dug Well JUNAGARH Charbahal 19°44'27" N 82°48'41" E Dug Well JUNAGARH Chiliguda 19°43'57" N 82°54'38" E Dug Well KALAMPUR Moter 19°42'55" N 82°47'45" E Dug Well KOKASARA Koksara 19°40'32" N 82°41'42" E Dug Well KALAMPUR Kalampur 19°37'20" N 82°53'0" E Dug Well KOKASARA Sunamala 19°37'10" N 82°41'22" E Dug Well KALAMPUR Bandigaon 19°36'25" N 82°48'50" E Dug Well JAYAPATNA Bijamara 19°33'30" N 82°49'12" E Dug Well JAYAPATNA Jaipatna 19°28'14" N 82°48'39" E Dug Well JAYAPATNA Baner 19°31'52" N 82°48'50" E Dug Well
DISTRICT_NAME_KANDHAMAL BLOCK_NAME VILLAGE_NAME LATITUDE LONGITUDE SITE_TYPE DARINGBADI Daringbadi 19°54'35" N 84°7'20" E Dug Well KOTAGARH Kotgarh 19°50'17" N 83°43'40" E Dug Well G.UDAYAGIRI Kalinga 20°9'27" N 84°25'15" E Dug Well G.UDAYAGIRI G.udaigiri 20°7'22" N 84°22'18" E Dug Well G.UDAYAGIRI G-udaigiri 20°7'22" N 84°22'18" E Dug Well KOTAGARH Bandapipali 19°42'39" N 83°40'2" E Dug Well PHIRINGIA Phirinjia-ii 20°21'22" N 84°7'18" E Dug Well PHIRINGIA Phiringia-i 20°21'20" N 84°7'22" E Dug Well
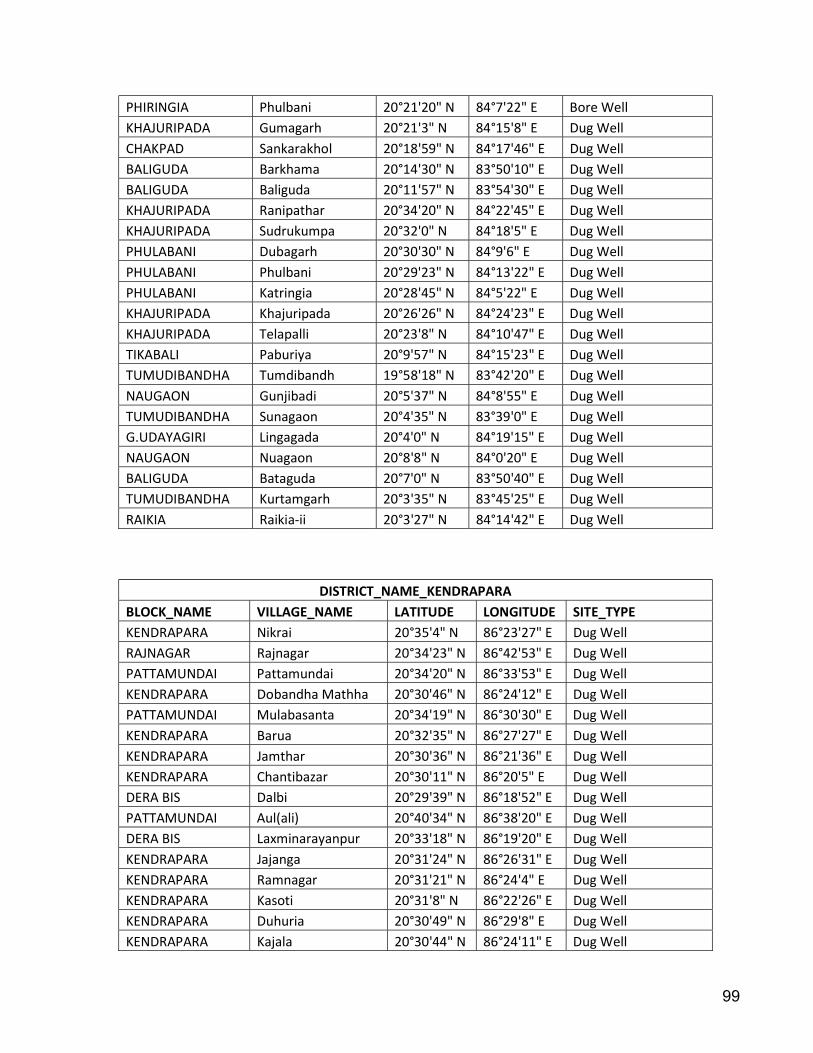
99
PHIRINGIA Phulbani 20°21'20" N 84°7'22" E Bore Well KHAJURIPADA Gumagarh 20°21'3" N 84°15'8" E Dug Well CHAKPAD Sankarakhol 20°18'59" N 84°17'46" E Dug Well BALIGUDA Barkhama 20°14'30" N 83°50'10" E Dug Well BALIGUDA Baliguda 20°11'57" N 83°54'30" E Dug Well KHAJURIPADA Ranipathar 20°34'20" N 84°22'45" E Dug Well KHAJURIPADA Sudrukumpa 20°32'0" N 84°18'5" E Dug Well PHULABANI Dubagarh 20°30'30" N 84°9'6" E Dug Well PHULABANI Phulbani 20°29'23" N 84°13'22" E Dug Well PHULABANI Katringia 20°28'45" N 84°5'22" E Dug Well KHAJURIPADA Khajuripada 20°26'26" N 84°24'23" E Dug Well KHAJURIPADA Telapalli 20°23'8" N 84°10'47" E Dug Well TIKABALI Paburiya 20°9'57" N 84°15'23" E Dug Well TUMUDIBANDHA Tumdibandh 19°58'18" N 83°42'20" E Dug Well NAUGAON Gunjibadi 20°5'37" N 84°8'55" E Dug Well TUMUDIBANDHA Sunagaon 20°4'35" N 83°39'0" E Dug Well G.UDAYAGIRI Lingagada 20°4'0" N 84°19'15" E Dug Well NAUGAON Nuagaon 20°8'8" N 84°0'20" E Dug Well BALIGUDA Bataguda 20°7'0" N 83°50'40" E Dug Well TUMUDIBANDHA Kurtamgarh 20°3'35" N 83°45'25" E Dug Well RAIKIA Raikia-ii 20°3'27" N 84°14'42" E Dug Well
DISTRICT_NAME_KENDRAPARA BLOCK_NAME VILLAGE_NAME LATITUDE LONGITUDE SITE_TYPE KENDRAPARA Nikrai 20°35'4" N 86°23'27" E Dug Well RAJNAGAR Rajnagar 20°34'23" N 86°42'53" E Dug Well PATTAMUNDAI Pattamundai 20°34'20" N 86°33'53" E Dug Well KENDRAPARA Dobandha Mathha 20°30'46" N 86°24'12" E Dug Well PATTAMUNDAI Mulabasanta 20°34'19" N 86°30'30" E Dug Well KENDRAPARA Barua 20°32'35" N 86°27'27" E Dug Well KENDRAPARA Jamthar 20°30'36" N 86°21'36" E Dug Well KENDRAPARA Chantibazar 20°30'11" N 86°20'5" E Dug Well DERA BIS Dalbi 20°29'39" N 86°18'52" E Dug Well PATTAMUNDAI Aul(ali) 20°40'34" N 86°38'20" E Dug Well DERA BIS Laxminarayanpur 20°33'18" N 86°19'20" E Dug Well KENDRAPARA Jajanga 20°31'24" N 86°26'31" E Dug Well KENDRAPARA Ramnagar 20°31'21" N 86°24'4" E Dug Well KENDRAPARA Kasoti 20°31'8" N 86°22'26" E Dug Well KENDRAPARA Duhuria 20°30'49" N 86°29'8" E Dug Well KENDRAPARA Kajala 20°30'44" N 86°24'11" E Dug Well

100
KENDRAPARA Jantilo 20°30'29" N 86°21'8" E Dug Well KENDRAPARA Shyamsundarpur 20°30'20" N 86°23'39" E Dug Well PATTAMUNDAI Jajang-II 20°30'10" N 86°27'15" E Tube Well PATTAMUNDAI Jajang-1 20°30'10" N 86°27'15" E Tube Well KENDRAPARA Kendrapara 20°30'6" N 86°25'20" E Dug Well DERA BIS Chandola 20°29'20" N 86°17'30" E Dug Well MARSA GHAI Hatia 20°27'11" N 86°27'7" E Dug Well PATTAMUNDAI Rajgarh 20°27'0" N 86°32'25" E Dug Well MAHAKALA PADA Mahakalpara 20°25'15" N 86°34'50" E Dug Well KENDRAPARA Indupur 20°36'0" N 86°24'6" E Tube Well PATTAMUNDAI Pattamundai 20°35'3" N 86°33'57" E Tube Well
DISTRICT_NAME_KENDUJHAR BLOCK_NAME VILLAGE_NAME LATITUDE LONGITUDE SITE_TYPE ANANDPUR Anandapur 21°13'3" N 86°7'11" E Dug Well KENDUJHARGARH Jhadbelda 21°40'53" N 85°40'13" E Dug Well KENDUJHARGARH Brahmandgram 21°39'44" N 85°36'26" E Dug Well KENDUJHARGARH Keonjhar-Ii Old Town 21°37'24" N 85°34'51" E Dug Well GHATGAON Rajpat 21°23'5" N 85°51'37" E Dug Well ANANDPUR Nuagaon 21°5'43" N 86°6'44" E Dug Well TELKOI Kuntapada 21°19'36" N 85°24'36" E Dug Well JODA Rugudi 22°0'3" N 85°19'35" E Dug Well JODA Guali 21°58'45" N 85°17'10" E Dug Well KENDUJHARGARH Naranpur 21°36'56" N 85°38'43" E Dug Well TELKOI Gonasika 21°29'51" N 85°32'5" E Dug Well TELKOI Pitanali 21°24'48" N 85°26'44" E Dug Well GHATGAON Melana 21°21'56" N 85°58'6" E Dug Well GHASIPURA Sainkula 21°7'8" N 86°7'52" E Bore Well GHASIPURA Ghasipura 21°12'40" N 86°6'30" E Bore Well ANANDPUR Balduan-I 21°12'31" N 86°11'15" E Bore Well HATADIHI Mathadai-Ii 21°11'15" N 86°14'46" E Bore Well HATADIHI Bidyadharpur 21°14'59" N 86°16'45" E Bore Well HARICHADANPUR Harichandanpur-Ii 21°20'45" N 85°47'25" E Bore Well TELKOI Jagmohanpur-Ii 21°26'6" N 85°20'6" E Bore Well HARICHADANPUR Jhangira 21°26'5" N 85°37'32" E Bore Well JHUMPURA Jhumpura-Ii 21°49'40" N 85°34'0" E Bore Well KENDUJHARGARH Padampur-Ii 21°45'50" N 85°35'15" E Bore Well SAHARAPADA Gajitangri 21°44'28" N 85°54'37" E Dug Well SAHARAPADA Udaipur-Ii 21°42'12" N 85°51'28" E Bore Well SAHARAPADA Badbil 21°40'42" N 85°56'19" E Dug Well KENDUJHARGARH Keonjhar Sadar 21°37'30" N 85°36'0" E Bore Well
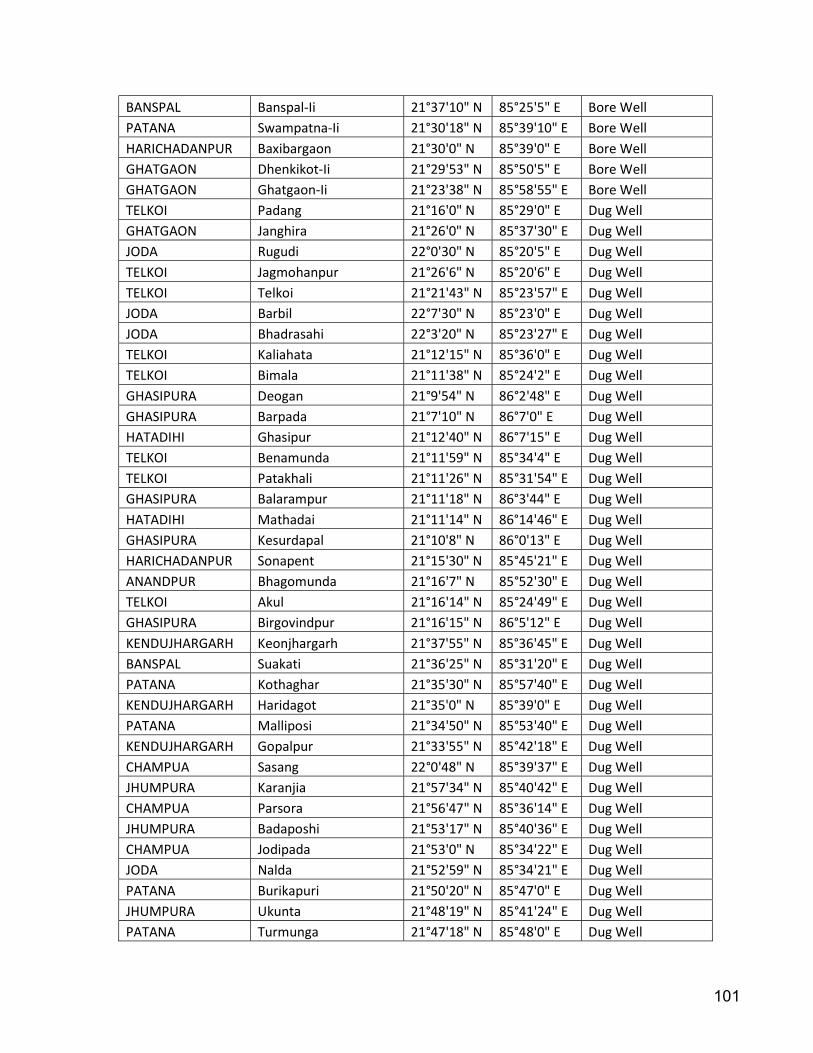
101
BANSPAL Banspal-Ii 21°37'10" N 85°25'5" E Bore Well PATANA Swampatna-Ii 21°30'18" N 85°39'10" E Bore Well HARICHADANPUR Baxibargaon 21°30'0" N 85°39'0" E Bore Well GHATGAON Dhenkikot-Ii 21°29'53" N 85°50'5" E Bore Well GHATGAON Ghatgaon-Ii 21°23'38" N 85°58'55" E Bore Well TELKOI Padang 21°16'0" N 85°29'0" E Dug Well GHATGAON Janghira 21°26'0" N 85°37'30" E Dug Well JODA Rugudi 22°0'30" N 85°20'5" E Dug Well TELKOI Jagmohanpur 21°26'6" N 85°20'6" E Dug Well TELKOI Telkoi 21°21'43" N 85°23'57" E Dug Well JODA Barbil 22°7'30" N 85°23'0" E Dug Well JODA Bhadrasahi 22°3'20" N 85°23'27" E Dug Well TELKOI Kaliahata 21°12'15" N 85°36'0" E Dug Well TELKOI Bimala 21°11'38" N 85°24'2" E Dug Well GHASIPURA Deogan 21°9'54" N 86°2'48" E Dug Well GHASIPURA Barpada 21°7'10" N 86°7'0" E Dug Well HATADIHI Ghasipur 21°12'40" N 86°7'15" E Dug Well TELKOI Benamunda 21°11'59" N 85°34'4" E Dug Well TELKOI Patakhali 21°11'26" N 85°31'54" E Dug Well GHASIPURA Balarampur 21°11'18" N 86°3'44" E Dug Well HATADIHI Mathadai 21°11'14" N 86°14'46" E Dug Well GHASIPURA Kesurdapal 21°10'8" N 86°0'13" E Dug Well HARICHADANPUR Sonapent 21°15'30" N 85°45'21" E Dug Well ANANDPUR Bhagomunda 21°16'7" N 85°52'30" E Dug Well TELKOI Akul 21°16'14" N 85°24'49" E Dug Well GHASIPURA Birgovindpur 21°16'15" N 86°5'12" E Dug Well KENDUJHARGARH Keonjhargarh 21°37'55" N 85°36'45" E Dug Well BANSPAL Suakati 21°36'25" N 85°31'20" E Dug Well PATANA Kothaghar 21°35'30" N 85°57'40" E Dug Well KENDUJHARGARH Haridagot 21°35'0" N 85°39'0" E Dug Well PATANA Malliposi 21°34'50" N 85°53'40" E Dug Well KENDUJHARGARH Gopalpur 21°33'55" N 85°42'18" E Dug Well CHAMPUA Sasang 22°0'48" N 85°39'37" E Dug Well JHUMPURA Karanjia 21°57'34" N 85°40'42" E Dug Well CHAMPUA Parsora 21°56'47" N 85°36'14" E Dug Well JHUMPURA Badaposhi 21°53'17" N 85°40'36" E Dug Well CHAMPUA Jodipada 21°53'0" N 85°34'22" E Dug Well JODA Nalda 21°52'59" N 85°34'21" E Dug Well PATANA Burikapuri 21°50'20" N 85°47'0" E Dug Well JHUMPURA Ukunta 21°48'19" N 85°41'24" E Dug Well PATANA Turmunga 21°47'18" N 85°48'0" E Dug Well

102
KENDUJHARGARH Palasponga 21°46'55" N 85°34'8" E Dug Well JHUMPURA Jhumpura 21°49'37" N 85°34'6" E Dug Well KENDUJHARGARH Padampur 21°43'50" N 85°35'15" E Dug Well SAHARAPADA Saharpara 21°43'30" N 85°57'30" E Dug Well PATANA Khiritangiri 21°42'55" N 85°41'24" E Dug Well SAHARAPADA Udaipur 21°42'12" N 85°51'28" E Dug Well PATANA Kendeiposhi 21°41'30" N 85°48'0" E Dug Well PATANA Balaniposi 21°41'4" N 85°46'20" E Dug Well ANANDPUR Belbahali 21°40'42" N 85°56'7" E Dug Well PATANA Tangarpada 21°39'24" N 85°50'48" E Dug Well KENDUJHARGARH Muktapur 21°39'12" N 85°37'54" E Dug Well TELKOI Balijhodi 21°38'22" N 85°36'19" E Dug Well SAHARAPADA Swampatna 21°38'18" N 85°54'2" E Dug Well GHATGAON Pipilia 21°33'46" N 85°46'18" E Dug Well GHATGAON Baxibarigan 21°30'0" N 85°39'0" E Dug Well BANSPAL Kanjipani 21°29'58" N 85°28'35" E Dug Well GHATGAON Dhenkikot 21°29'35" N 85°50'5" E Dug Well GHATGAON Gadadharpur 21°26'44" N 85°52'33" E Dug Well GHATGAON Patilo 21°25'28" N 85°42'48" E Dug Well JHUMPURA Katalaposhi 21°23'48" N 85°25'59" E Dug Well GHATGAON Ghatgaon 21°23'38" N 85°53'55" E Dug Well GHATGAON Dhangadiha 21°23'15" N 85°50'20" E Dug Well HARICHADANPUR Harichandanpur 21°20'25" N 85°47'25" E Dug Well HATADIHI Nuasahi 21°16'23" N 86°19'56" E Dug Well CHAMPUA Champua 22°3'54" N 85°39'27" E Dug Well JODA Joda 22°1'30" N 85°26'30" E Dug Well CHAMPUA Jaymangalpur 22°2'20" N 85°34'30" E Dug Well
DISTRICT_NAME_KHORDHA BLOCK_NAME VILLAGE_NAME LATITUDE LONGITUDE SITE_TYPE JATANI Jatni 20°9'50" N 85°41'55" E Dug Well BHUBANESWAR Bhubaneswar Urban 20°22'8" N 85°48'32" E Dug Well TANGI Jankia 20°1'54" N 85°31'18" E Dug Well TANGI Nirakarpur 19°59'38" N 85°32'24" E Dug Well TANGI Bhusundapur 19°57'10" N 85°28'50" E Dug Well TANGI Tangi 19°55'31" N 85°23'52" E Dug Well BHUBANESWAR Bhubaneswar Urban 20°19'48" N 85°54'3" E Dug Well BHUBANESWAR Bhubaneswar Urban 20°19'22" N 85°53'24" E Dug Well BHUBANESWAR Bhubaneswar Urban 20°19'19" N 85°47'45" E Dug Well

103
BHUBANESWAR Bhubaneswar Urban 20°18'3" N 85°49'51" E Dug Well BHUBANESWAR Bhubaneswar Urban 20°17'56" N 85°49'24" E Dug Well BHUBANESWAR Bhubaneswar Urban 20°17'48" N 85°49'28" E Dug Well BHUBANESWAR Bhubaneswar Urban 20°17'43" N 85°51'50" E Dug Well BHUBANESWAR Bhubaneswar Urban 20°17'42" N 85°49'55" E Dug Well BHUBANESWAR Bhubaneswar Urban 20°17'41" N 85°51'52" E Dug Well BHUBANESWAR Bhubaneswar Urban 20°17'21" N 85°51'12" E Dug Well BHUBANESWAR Bhubaneswar Urban 20°17'16" N 85°50'13" E Dug Well BHUBANESWAR Bhubaneswar Urban 20°17'14" N 85°51'18" E Dug Well BHUBANESWAR Bhubaneswar Urban 20°17'14" N 85°50'41" E Dug Well BHUBANESWAR Bhubaneswar Urban 20°17'12" N 85°46'52" E Dug Well BHUBANESWAR Bhubaneswar Urban 20°16'58" N 85°49'52" E Dug Well BHUBANESWAR Bhubaneswar Urban 20°16'53" N 85°49'41" E Dug Well BHUBANESWAR Bhubaneswar Urban 20°16'52" N 85°49'26" E Dug Well BHUBANESWAR Bhubaneswar Urban 20°16'38" N 85°45'21" E Dug Well BHUBANESWAR Bhubaneswar Urban 20°16'37" N 85°45'57" E Dug Well BHUBANESWAR Bhubaneswar Urban 20°16'19" N 85°51'27" E Dug Well BHUBANESWAR Bhubaneswar Urban 20°16'15" N 85°51'2" E Dug Well BHUBANESWAR Bhubaneswar Urban 20°16'2" N 85°47'59" E Dug Well BHUBANESWAR Bhubaneswar Urban 20°15'57" N 85°49'16" E Dug Well BHUBANESWAR Bhubaneswar Urban 20°15'55" N 85°50'19" E Dug Well BHUBANESWAR Bhubaneswar Urban 20°15'51" N 85°49'4" E Dug Well BHUBANESWAR Bhubaneswar Urban 20°15'37" N 85°43'31" E Dug Well BHUBANESWAR Bhubaneswar Urban 20°15'29" N 85°49'51" E Dug Well BHUBANESWAR Bhubaneswar Urban 20°15'25" N 85°49'9" E Dug Well BHUBANESWAR Bhubaneswar Urban 20°15'14" N 85°49'50" E Dug Well BHUBANESWAR Kesura 20°15'3" N 85°52'18" E Dug Well BHUBANESWAR Bhubaneswar Urban 20°15'1" N 85°48'24" E Dug Well BHUBANESWAR Bhubaneswar Urban 20°14'56" N 85°47'20" E Dug Well BALIPATANA Tolakpada 20°14'41" N 85°54'6" E Dug Well BHUBANESWAR Bhubaneswar Urban 20°14'41" N 85°49'40" E Dug Well BHUBANESWAR Bhubaneswar Urban 20°14'36" N 85°49'56" E Dug Well BHUBANESWAR Bhubaneswar Urban 20°14'35" N 85°51'17" E Dug Well BHUBANESWAR Bhubaneswar Urban 20°14'34" N 85°49'55" E Dug Well BHUBANESWAR Bhubaneswar Urban 20°14'16" N 85°48'24" E Dug Well BHUBANESWAR Bhubaneswar Urban 20°14'15" N 85°49'11" E Dug Well BHUBANESWAR Bhubaneswar Urban 20°14'13" N 85°49'16" E Dug Well BHUBANESWAR Bhubaneswar Urban 20°14'4" N 85°50'27" E Dug Well BHUBANESWAR Kuha 20°14'3" N 85°47'48" E Dug Well BHUBANESWAR Bhubaneswar Urban 20°13'41" N 85°50'18" E Dug Well BHUBANESWAR Bhubaneswar Urban 20°13'40" N 85°48'52" E Dug Well

104
BALIANTA Jagannathpur 20°13'35" N 85°56'54" E Dug Well BHUBANESWAR Sundaripada 20°13'31" N 85°48'49" E Dug Well BHUBANESWAR Bhubaneswar Urban 20°12'55" N 85°42'43" E Dug Well BHUBANESWAR Bhubaneswar Urban 20°12'44" N 85°40'43" E Dug Well JATANI Gobindpur 20°11'58" N 85°42'1" E Dug Well KHORDHA Khurda 20°10'55" N 85°37'3" E Dug Well JATANI Sandhapur 20°10'50" N 85°42'5" E Dug Well KHORDHA Khurda Industrial Area 20°10'32" N 85°38'18" E Dug Well JATANI Padanpur 20°10'22" N 85°40'32" E Dug Well JATANI Niranjanpur 20°9'31" N 85°45'25" E Dug Well JATANI Budhapada 20°8'43" N 85°44'55" E Dug Well CHILIKA Balugaon 19°44'50" N 85°12'28" E Dug Well BHUBANESWAR Menthasala 20°16'4" N 85°41'49" E Dug Well BHUBANESWAR Tamando 20°13'58" N 85°44'36" E Dug Well KHORDHA Jayamangal 20°12'48" N 85°32'44" E Dug Well BEGUNIA Begunia 20°12'12" N 85°27'15" E Dug Well BHUBANESWAR Chantaka 20°22'5" N 85°46'0" E Dug Well BEGUNIA Sarua 20°13'5" N 85°31'49" E Dug Well JATANI Janla 20°13'0" N 85°42'58" E Dug Well BALIPATANA Odakhanda 20°7'0" N 85°58'32" E Dug Well BALIANTA Kundaidarapatna 20°20'55" N 85°53'33" E Dug Well BHUBANESWAR Palasuni 20°20'39" N 85°45'15" E Dug Well BHUBANESWAR Raghunathpur 20°20'35" N 85°47'10" E Dug Well BHUBANESWAR Bhubaneswar-i 20°17'3" N 85°50'58" E Dug Well BHUBANESWAR Khandagiri 20°15'35" N 85°47'20" E Dug Well BHUBANESWAR Central Poultry Farm 20°14'3" N 85°49'6" E Dug Well BEGUNIA Baghmari 20°13'12" N 85°30'6" E Dug Well BALIPATANA Balipatna 20°12'18" N 85°57'49" E Dug Well BALIPATANA Balakati 20°12'3" N 85°52'8" E Dug Well BOLAGAD Pichkuli 20°11'0" N 85°23'0" E Dug Well BALIPATANA Panikata 20°10'42" N 85°54'12" E Dug Well BHUBANESWAR Patia 20°23'53" N 85°47'28" E Dug Well BOLAGAD Bolagarh 20°10'15" N 85°16'40" E Dug Well
DISTRICT_NAME_KORAPUT BLOCK_NAME VILLAGE_NAME LATITUDE LONGITUDE SITE_TYPE JEYPUR Umeri 18°54'0" N 82°34'11" E Dug Well JEYPUR Anta 18°51'55" N 82°31'20" E Dug Well JEYPUR Jeypore 18°51'10" N 82°34'53" E Dug Well JEYPUR Kantarkhal 18°50'55" N 82°32'24" E Dug Well

105
KORAPUT Deoghati 18°49'38" N 82°38'30" E Dug Well JEYPUR Panasaputbagh 18°48'47" N 82°32'52" E Dug Well BOIPARIGUDA Patraput 18°46'22" N 82°31'40" E Dug Well BOIPARIGUDA Baipariguda 18°45'30" N 82°26'18" E Dug Well SIMILIGUDA Similiguda 18°42'37" N 82°52'9" E Dug Well LAMPTAPUT Lamtaput 18°36'55" N 82°35'39" E Dug Well SIMILIGUDA Kunduli 18°36'36" N 82°53'30" E Dug Well POTTANGI Potangi 18°33'48" N 82°57'42" E Dug Well NANDAPUR Nandapur 18°32'0" N 82°44'30" E Dug Well BOIPARIGUDA Ramgiri 18°46'36" N 82°15'28" E Dug Well BOIPARIGUDA Dhaulapur 18°46'28" N 82°19'31" E Dug Well NANDAPUR Soguru 18°30'53" N 82°36'58" E Dug Well NANDAPUR Bheja 18°28'33" N 82°41'8" E Dug Well BORIGUMA Boriguma 19°3'5" N 82°32'48" E Dug Well DASAMANTAPUR Dasmanthapur 19°3'3" N 82°55'40" E Dug Well KUNDURA Bajiguda 19°2'24" N 82°22'13" E Dug Well JEYPUR C-kusumi-ii 19°1'34" N 82°26'3" E Dug Well JEYPUR C.kusimi-i 19°1'27" N 82°25'50" E Dug Well KUNDURA Ghatarala 19°1'26" N 82°24'0" E Dug Well JEYPUR Jayantigiri 19°0'23" N 82°34'0" E Dug Well JEYPUR Konga 18°59'53" N 82°28'30" E Dug Well JEYPUR Kenduguda 18°58'35" N 82°32'40" E Dug Well BORIGUMA Khaliaguda 19°8'48" N 82°32'45" E Dug Well KOTPAD Miriguda 19°8'46" N 82°24'1" E Dug Well KOTPAD Kotpad 19°8'30" N 82°16'20" E Dug Well KOTPAD Damanahandi 19°7'27" N 82°17'24" E Dug Well BORIGUMA Sasanhandi-ii 19°6'32" N 82°28'26" E Dug Well KOTPAD Gumur 19°6'1" N 82°20'25" E Dug Well KOTPAD Chandli 19°5'10" N 82°14'25" E Dug Well BORIGUMA Tikaguda 19°4'47" N 82°35'25" E Dug Well BORIGUMA Bijapur 19°4'21" N 82°31'31" E Dug Well BORIGUMA Jujari 19°9'12" N 82°34'40" E Dug Well KORAPUT Koraput-i 18°48'43" N 82°43'18" E Dug Well DASAMANTAPUR Podagada 18°51'20" N 82°52'12" E Dug Well LAKSHMIPUR Panchada 18°55'19" N 82°57'27" E Dug Well JEYPUR Ambaguda 18°58'0" N 82°33'45" E Dug Well LAKSHMIPUR Kakriguma 18°55'21" N 83°0'34" E Dug Well KORAPUT Koraput-ii 18°48'41" N 82°43'18" E Dug Well LAKSHMIPUR Dhamanaganda 19°5'41" N 83°11'36" E Dug Well LAKSHMIPUR Burja 19°0'51" N 83°7'59" E Dug Well BANDHUGAON Peddagadavalasa 18°56'30" N 83°1'35" E Dug Well
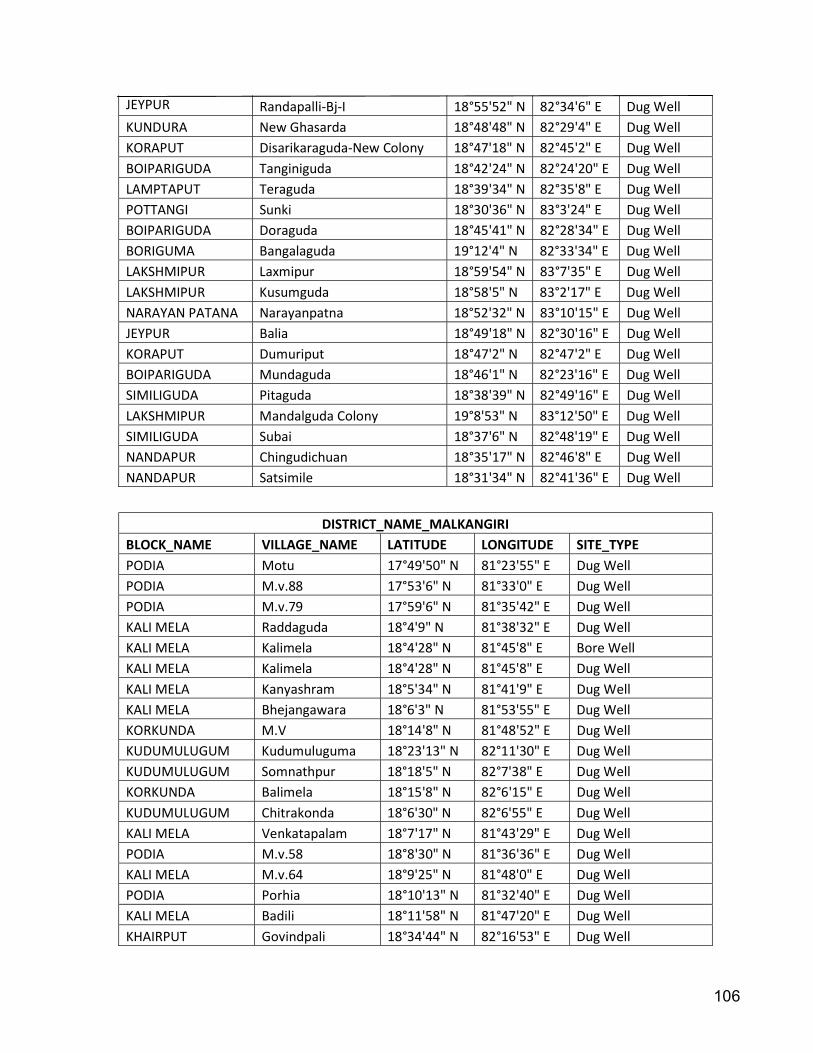
106
JEYPUR Randapalli-Bj-I 18°55'52" N 82°34'6" E Dug Well KUNDURA New Ghasarda 18°48'48" N 82°29'4" E Dug Well KORAPUT Disarikaraguda-New Colony 18°47'18" N 82°45'2" E Dug Well BOIPARIGUDA Tanginiguda 18°42'24" N 82°24'20" E Dug Well LAMPTAPUT Teraguda 18°39'34" N 82°35'8" E Dug Well POTTANGI Sunki 18°30'36" N 83°3'24" E Dug Well BOIPARIGUDA Doraguda 18°45'41" N 82°28'34" E Dug Well BORIGUMA Bangalaguda 19°12'4" N 82°33'34" E Dug Well LAKSHMIPUR Laxmipur 18°59'54" N 83°7'35" E Dug Well LAKSHMIPUR Kusumguda 18°58'5" N 83°2'17" E Dug Well NARAYAN PATANA Narayanpatna 18°52'32" N 83°10'15" E Dug Well JEYPUR Balia 18°49'18" N 82°30'16" E Dug Well KORAPUT Dumuriput 18°47'2" N 82°47'2" E Dug Well BOIPARIGUDA Mundaguda 18°46'1" N 82°23'16" E Dug Well SIMILIGUDA Pitaguda 18°38'39" N 82°49'16" E Dug Well LAKSHMIPUR Mandalguda Colony 19°8'53" N 83°12'50" E Dug Well SIMILIGUDA Subai 18°37'6" N 82°48'19" E Dug Well NANDAPUR Chingudichuan 18°35'17" N 82°46'8" E Dug Well NANDAPUR Satsimile 18°31'34" N 82°41'36" E Dug Well
DISTRICT_NAME_MALKANGIRI BLOCK_NAME VILLAGE_NAME LATITUDE LONGITUDE SITE_TYPE PODIA Motu 17°49'50" N 81°23'55" E Dug Well PODIA M.v.88 17°53'6" N 81°33'0" E Dug Well PODIA M.v.79 17°59'6" N 81°35'42" E Dug Well KALI MELA Raddaguda 18°4'9" N 81°38'32" E Dug Well KALI MELA Kalimela 18°4'28" N 81°45'8" E Bore Well KALI MELA Kalimela 18°4'28" N 81°45'8" E Dug Well KALI MELA Kanyashram 18°5'34" N 81°41'9" E Dug Well KALI MELA Bhejangawara 18°6'3" N 81°53'55" E Dug Well KORKUNDA M.V 18°14'8" N 81°48'52" E Dug Well KUDUMULUGUM Kudumuluguma 18°23'13" N 82°11'30" E Dug Well KUDUMULUGUM Somnathpur 18°18'5" N 82°7'38" E Dug Well KORKUNDA Balimela 18°15'8" N 82°6'15" E Dug Well KUDUMULUGUM Chitrakonda 18°6'30" N 82°6'55" E Dug Well KALI MELA Venkatapalam 18°7'17" N 81°43'29" E Dug Well PODIA M.v.58 18°8'30" N 81°36'36" E Dug Well KALI MELA M.v.64 18°9'25" N 81°48'0" E Dug Well PODIA Porhia 18°10'13" N 81°32'40" E Dug Well KALI MELA Badili 18°11'58" N 81°47'20" E Dug Well KHAIRPUT Govindpali 18°34'44" N 82°16'53" E Dug Well
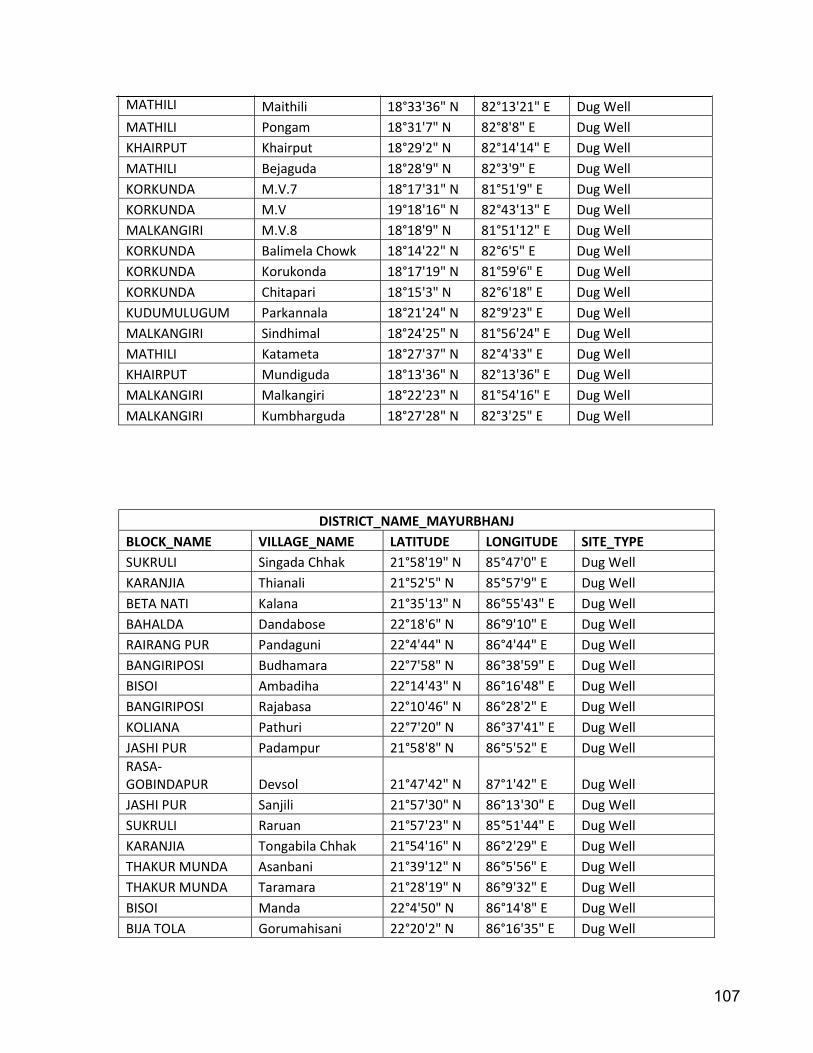
107
MATHILI Maithili 18°33'36" N 82°13'21" E Dug Well MATHILI Pongam 18°31'7" N 82°8'8" E Dug Well KHAIRPUT Khairput 18°29'2" N 82°14'14" E Dug Well MATHILI Bejaguda 18°28'9" N 82°3'9" E Dug Well KORKUNDA M.V.7 18°17'31" N 81°51'9" E Dug Well KORKUNDA M.V 19°18'16" N 82°43'13" E Dug Well MALKANGIRI M.V.8 18°18'9" N 81°51'12" E Dug Well KORKUNDA Balimela Chowk 18°14'22" N 82°6'5" E Dug Well KORKUNDA Korukonda 18°17'19" N 81°59'6" E Dug Well KORKUNDA Chitapari 18°15'3" N 82°6'18" E Dug Well KUDUMULUGUM Parkannala 18°21'24" N 82°9'23" E Dug Well MALKANGIRI Sindhimal 18°24'25" N 81°56'24" E Dug Well MATHILI Katameta 18°27'37" N 82°4'33" E Dug Well KHAIRPUT Mundiguda 18°13'36" N 82°13'36" E Dug Well MALKANGIRI Malkangiri 18°22'23" N 81°54'16" E Dug Well MALKANGIRI Kumbharguda 18°27'28" N 82°3'25" E Dug Well
DISTRICT_NAME_MAYURBHANJ BLOCK_NAME VILLAGE_NAME LATITUDE LONGITUDE SITE_TYPE SUKRULI Singada Chhak 21°58'19" N 85°47'0" E Dug Well KARANJIA Thianali 21°52'5" N 85°57'9" E Dug Well BETA NATI Kalana 21°35'13" N 86°55'43" E Dug Well BAHALDA Dandabose 22°18'6" N 86°9'10" E Dug Well RAIRANG PUR Pandaguni 22°4'44" N 86°4'44" E Dug Well BANGIRIPOSI Budhamara 22°7'58" N 86°38'59" E Dug Well BISOI Ambadiha 22°14'43" N 86°16'48" E Dug Well BANGIRIPOSI Rajabasa 22°10'46" N 86°28'2" E Dug Well KOLIANA Pathuri 22°7'20" N 86°37'41" E Dug Well JASHI PUR Padampur 21°58'8" N 86°5'52" E Dug Well RASA-GOBINDAPUR Devsol 21°47'42" N 87°1'42" E Dug Well JASHI PUR Sanjili 21°57'30" N 86°13'30" E Dug Well SUKRULI Raruan 21°57'23" N 85°51'44" E Dug Well KARANJIA Tongabila Chhak 21°54'16" N 86°2'29" E Dug Well THAKUR MUNDA Asanbani 21°39'12" N 86°5'56" E Dug Well THAKUR MUNDA Taramara 21°28'19" N 86°9'32" E Dug Well BISOI Manda 22°4'50" N 86°14'8" E Dug Well BIJA TOLA Gorumahisani 22°20'2" N 86°16'35" E Dug Well
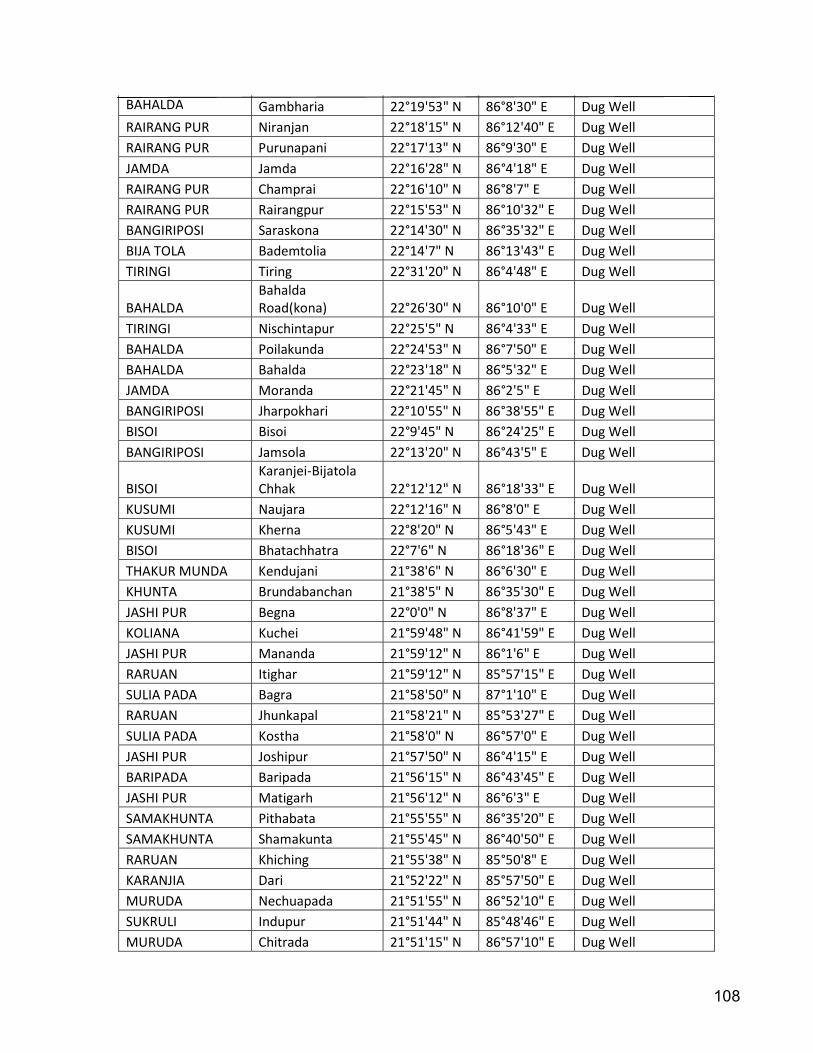
108
BAHALDA Gambharia 22°19'53" N 86°8'30" E Dug Well RAIRANG PUR Niranjan 22°18'15" N 86°12'40" E Dug Well RAIRANG PUR Purunapani 22°17'13" N 86°9'30" E Dug Well JAMDA Jamda 22°16'28" N 86°4'18" E Dug Well RAIRANG PUR Champrai 22°16'10" N 86°8'7" E Dug Well RAIRANG PUR Rairangpur 22°15'53" N 86°10'32" E Dug Well BANGIRIPOSI Saraskona 22°14'30" N 86°35'32" E Dug Well BIJA TOLA Bademtolia 22°14'7" N 86°13'43" E Dug Well TIRINGI Tiring 22°31'20" N 86°4'48" E Dug Well
BAHALDA Bahalda Road(kona) 22°26'30" N 86°10'0" E Dug Well
TIRINGI Nischintapur 22°25'5" N 86°4'33" E Dug Well BAHALDA Poilakunda 22°24'53" N 86°7'50" E Dug Well BAHALDA Bahalda 22°23'18" N 86°5'32" E Dug Well JAMDA Moranda 22°21'45" N 86°2'5" E Dug Well BANGIRIPOSI Jharpokhari 22°10'55" N 86°38'55" E Dug Well BISOI Bisoi 22°9'45" N 86°24'25" E Dug Well BANGIRIPOSI Jamsola 22°13'20" N 86°43'5" E Dug Well
BISOI Karanjei-Bijatola Chhak 22°12'12" N 86°18'33" E Dug Well
KUSUMI Naujara 22°12'16" N 86°8'0" E Dug Well KUSUMI Kherna 22°8'20" N 86°5'43" E Dug Well BISOI Bhatachhatra 22°7'6" N 86°18'36" E Dug Well THAKUR MUNDA Kendujani 21°38'6" N 86°6'30" E Dug Well KHUNTA Brundabanchan 21°38'5" N 86°35'30" E Dug Well JASHI PUR Begna 22°0'0" N 86°8'37" E Dug Well KOLIANA Kuchei 21°59'48" N 86°41'59" E Dug Well JASHI PUR Mananda 21°59'12" N 86°1'6" E Dug Well RARUAN Itighar 21°59'12" N 85°57'15" E Dug Well SULIA PADA Bagra 21°58'50" N 87°1'10" E Dug Well RARUAN Jhunkapal 21°58'21" N 85°53'27" E Dug Well SULIA PADA Kostha 21°58'0" N 86°57'0" E Dug Well JASHI PUR Joshipur 21°57'50" N 86°4'15" E Dug Well BARIPADA Baripada 21°56'15" N 86°43'45" E Dug Well JASHI PUR Matigarh 21°56'12" N 86°6'3" E Dug Well SAMAKHUNTA Pithabata 21°55'55" N 86°35'20" E Dug Well SAMAKHUNTA Shamakunta 21°55'45" N 86°40'50" E Dug Well RARUAN Khiching 21°55'38" N 85°50'8" E Dug Well KARANJIA Dari 21°52'22" N 85°57'50" E Dug Well MURUDA Nechuapada 21°51'55" N 86°52'10" E Dug Well SUKRULI Indupur 21°51'44" N 85°48'46" E Dug Well MURUDA Chitrada 21°51'15" N 86°57'10" E Dug Well
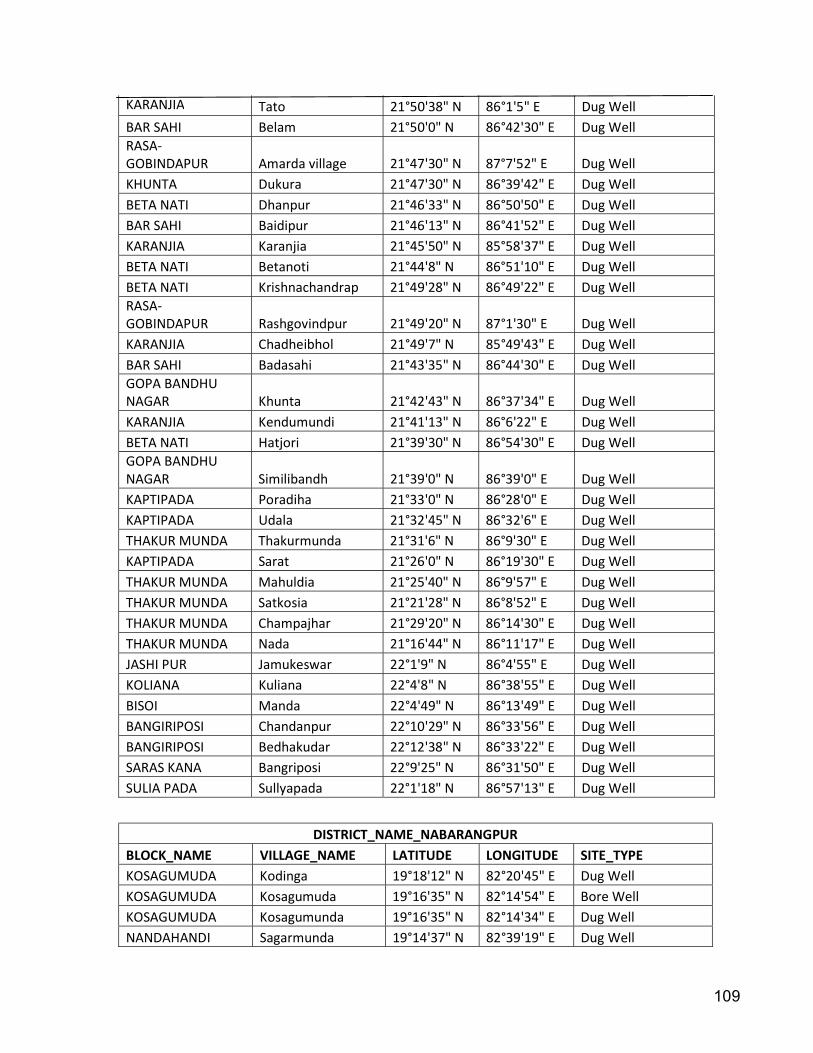
109
KARANJIA Tato 21°50'38" N 86°1'5" E Dug Well BAR SAHI Belam 21°50'0" N 86°42'30" E Dug Well RASA-GOBINDAPUR Amarda village 21°47'30" N 87°7'52" E Dug Well KHUNTA Dukura 21°47'30" N 86°39'42" E Dug Well BETA NATI Dhanpur 21°46'33" N 86°50'50" E Dug Well BAR SAHI Baidipur 21°46'13" N 86°41'52" E Dug Well KARANJIA Karanjia 21°45'50" N 85°58'37" E Dug Well BETA NATI Betanoti 21°44'8" N 86°51'10" E Dug Well BETA NATI Krishnachandrap 21°49'28" N 86°49'22" E Dug Well RASA-GOBINDAPUR Rashgovindpur 21°49'20" N 87°1'30" E Dug Well KARANJIA Chadheibhol 21°49'7" N 85°49'43" E Dug Well BAR SAHI Badasahi 21°43'35" N 86°44'30" E Dug Well GOPA BANDHU NAGAR Khunta 21°42'43" N 86°37'34" E Dug Well KARANJIA Kendumundi 21°41'13" N 86°6'22" E Dug Well BETA NATI Hatjori 21°39'30" N 86°54'30" E Dug Well GOPA BANDHU NAGAR Similibandh 21°39'0" N 86°39'0" E Dug Well KAPTIPADA Poradiha 21°33'0" N 86°28'0" E Dug Well KAPTIPADA Udala 21°32'45" N 86°32'6" E Dug Well THAKUR MUNDA Thakurmunda 21°31'6" N 86°9'30" E Dug Well KAPTIPADA Sarat 21°26'0" N 86°19'30" E Dug Well THAKUR MUNDA Mahuldia 21°25'40" N 86°9'57" E Dug Well THAKUR MUNDA Satkosia 21°21'28" N 86°8'52" E Dug Well THAKUR MUNDA Champajhar 21°29'20" N 86°14'30" E Dug Well THAKUR MUNDA Nada 21°16'44" N 86°11'17" E Dug Well JASHI PUR Jamukeswar 22°1'9" N 86°4'55" E Dug Well KOLIANA Kuliana 22°4'8" N 86°38'55" E Dug Well BISOI Manda 22°4'49" N 86°13'49" E Dug Well BANGIRIPOSI Chandanpur 22°10'29" N 86°33'56" E Dug Well BANGIRIPOSI Bedhakudar 22°12'38" N 86°33'22" E Dug Well SARAS KANA Bangriposi 22°9'25" N 86°31'50" E Dug Well SULIA PADA Sullyapada 22°1'18" N 86°57'13" E Dug Well
DISTRICT_NAME_NABARANGPUR BLOCK_NAME VILLAGE_NAME LATITUDE LONGITUDE SITE_TYPE KOSAGUMUDA Kodinga 19°18'12" N 82°20'45" E Dug Well KOSAGUMUDA Kosagumuda 19°16'35" N 82°14'54" E Bore Well KOSAGUMUDA Kosagumunda 19°16'35" N 82°14'34" E Dug Well NANDAHANDI Sagarmunda 19°14'37" N 82°39'19" E Dug Well
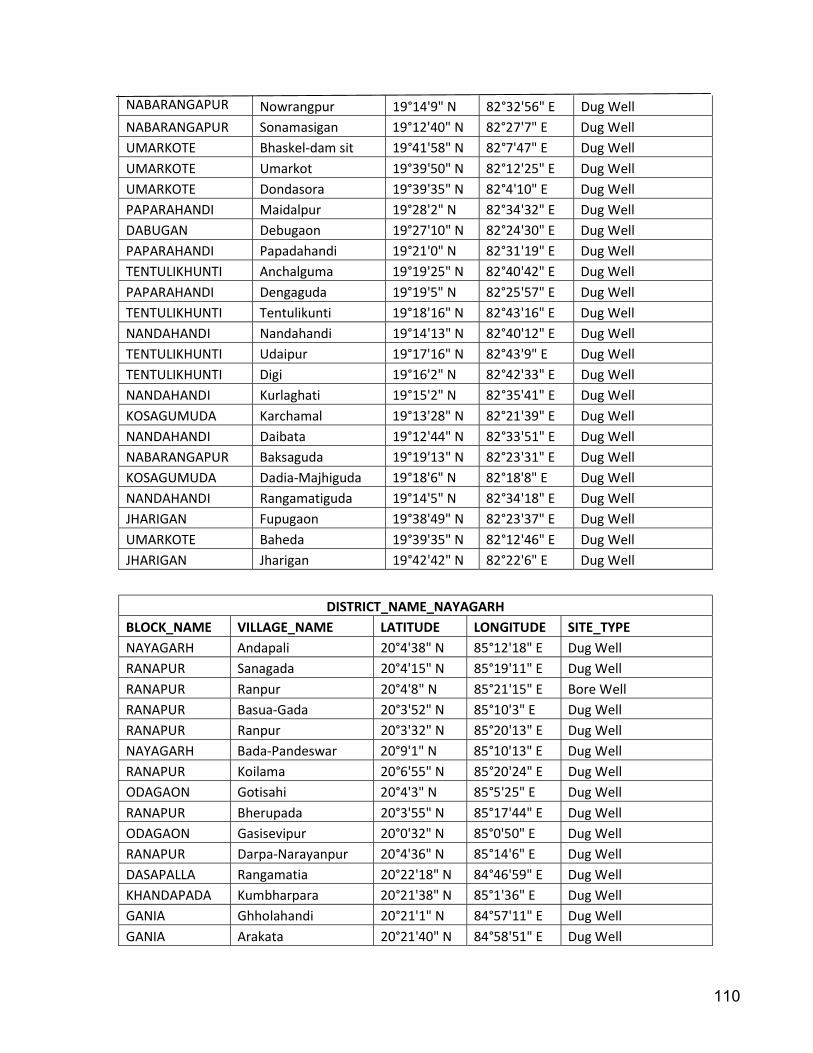
110
NABARANGAPUR Nowrangpur 19°14'9" N 82°32'56" E Dug Well NABARANGAPUR Sonamasigan 19°12'40" N 82°27'7" E Dug Well UMARKOTE Bhaskel-dam sit 19°41'58" N 82°7'47" E Dug Well UMARKOTE Umarkot 19°39'50" N 82°12'25" E Dug Well UMARKOTE Dondasora 19°39'35" N 82°4'10" E Dug Well PAPARAHANDI Maidalpur 19°28'2" N 82°34'32" E Dug Well DABUGAN Debugaon 19°27'10" N 82°24'30" E Dug Well PAPARAHANDI Papadahandi 19°21'0" N 82°31'19" E Dug Well TENTULIKHUNTI Anchalguma 19°19'25" N 82°40'42" E Dug Well PAPARAHANDI Dengaguda 19°19'5" N 82°25'57" E Dug Well TENTULIKHUNTI Tentulikunti 19°18'16" N 82°43'16" E Dug Well NANDAHANDI Nandahandi 19°14'13" N 82°40'12" E Dug Well TENTULIKHUNTI Udaipur 19°17'16" N 82°43'9" E Dug Well TENTULIKHUNTI Digi 19°16'2" N 82°42'33" E Dug Well NANDAHANDI Kurlaghati 19°15'2" N 82°35'41" E Dug Well KOSAGUMUDA Karchamal 19°13'28" N 82°21'39" E Dug Well NANDAHANDI Daibata 19°12'44" N 82°33'51" E Dug Well NABARANGAPUR Baksaguda 19°19'13" N 82°23'31" E Dug Well KOSAGUMUDA Dadia-Majhiguda 19°18'6" N 82°18'8" E Dug Well NANDAHANDI Rangamatiguda 19°14'5" N 82°34'18" E Dug Well JHARIGAN Fupugaon 19°38'49" N 82°23'37" E Dug Well UMARKOTE Baheda 19°39'35" N 82°12'46" E Dug Well JHARIGAN Jharigan 19°42'42" N 82°22'6" E Dug Well
DISTRICT_NAME_NAYAGARH BLOCK_NAME VILLAGE_NAME LATITUDE LONGITUDE SITE_TYPE NAYAGARH Andapali 20°4'38" N 85°12'18" E Dug Well RANAPUR Sanagada 20°4'15" N 85°19'11" E Dug Well RANAPUR Ranpur 20°4'8" N 85°21'15" E Bore Well RANAPUR Basua-Gada 20°3'52" N 85°10'3" E Dug Well RANAPUR Ranpur 20°3'32" N 85°20'13" E Dug Well NAYAGARH Bada-Pandeswar 20°9'1" N 85°10'13" E Dug Well RANAPUR Koilama 20°6'55" N 85°20'24" E Dug Well ODAGAON Gotisahi 20°4'3" N 85°5'25" E Dug Well RANAPUR Bherupada 20°3'55" N 85°17'44" E Dug Well ODAGAON Gasisevipur 20°0'32" N 85°0'50" E Dug Well RANAPUR Darpa-Narayanpur 20°4'36" N 85°14'6" E Dug Well DASAPALLA Rangamatia 20°22'18" N 84°46'59" E Dug Well KHANDAPADA Kumbharpara 20°21'38" N 85°1'36" E Dug Well GANIA Ghholahandi 20°21'1" N 84°57'11" E Dug Well GANIA Arakata 20°21'40" N 84°58'51" E Dug Well
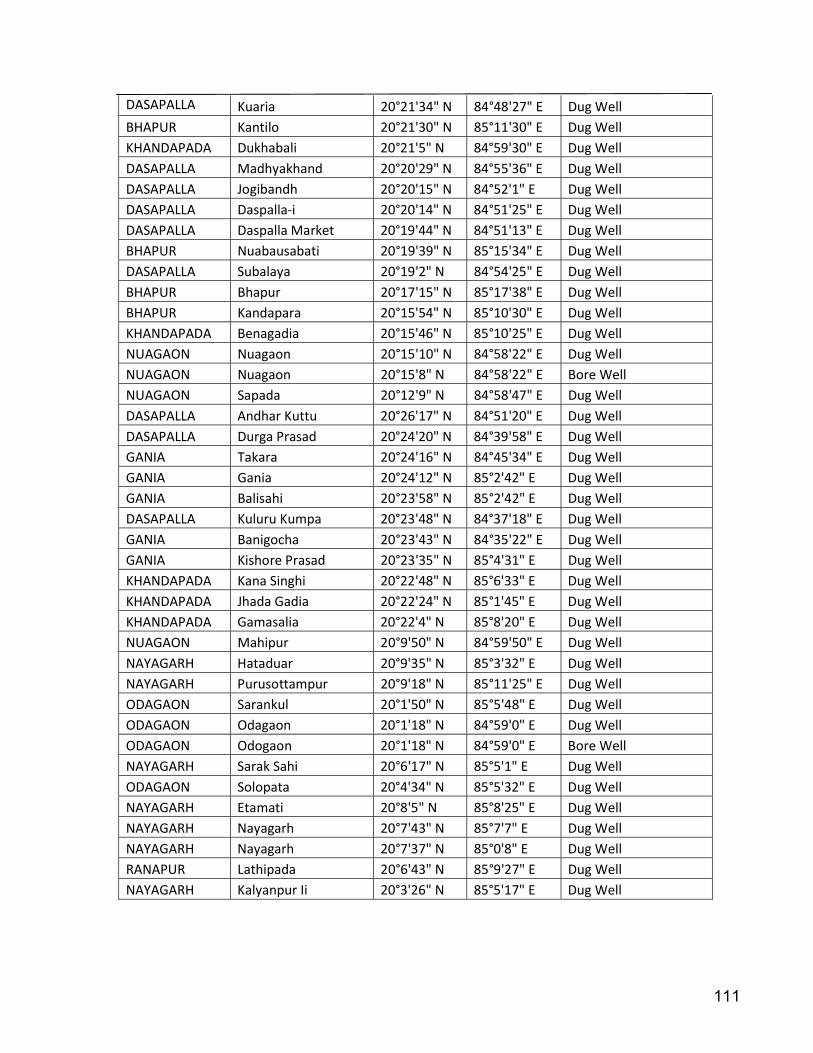
111
DASAPALLA Kuaria 20°21'34" N 84°48'27" E Dug Well BHAPUR Kantilo 20°21'30" N 85°11'30" E Dug Well KHANDAPADA Dukhabali 20°21'5" N 84°59'30" E Dug Well DASAPALLA Madhyakhand 20°20'29" N 84°55'36" E Dug Well DASAPALLA Jogibandh 20°20'15" N 84°52'1" E Dug Well DASAPALLA Daspalla-i 20°20'14" N 84°51'25" E Dug Well DASAPALLA Daspalla Market 20°19'44" N 84°51'13" E Dug Well BHAPUR Nuabausabati 20°19'39" N 85°15'34" E Dug Well DASAPALLA Subalaya 20°19'2" N 84°54'25" E Dug Well BHAPUR Bhapur 20°17'15" N 85°17'38" E Dug Well BHAPUR Kandapara 20°15'54" N 85°10'30" E Dug Well KHANDAPADA Benagadia 20°15'46" N 85°10'25" E Dug Well NUAGAON Nuagaon 20°15'10" N 84°58'22" E Dug Well NUAGAON Nuagaon 20°15'8" N 84°58'22" E Bore Well NUAGAON Sapada 20°12'9" N 84°58'47" E Dug Well DASAPALLA Andhar Kuttu 20°26'17" N 84°51'20" E Dug Well DASAPALLA Durga Prasad 20°24'20" N 84°39'58" E Dug Well GANIA Takara 20°24'16" N 84°45'34" E Dug Well GANIA Gania 20°24'12" N 85°2'42" E Dug Well GANIA Balisahi 20°23'58" N 85°2'42" E Dug Well DASAPALLA Kuluru Kumpa 20°23'48" N 84°37'18" E Dug Well GANIA Banigocha 20°23'43" N 84°35'22" E Dug Well GANIA Kishore Prasad 20°23'35" N 85°4'31" E Dug Well KHANDAPADA Kana Singhi 20°22'48" N 85°6'33" E Dug Well KHANDAPADA Jhada Gadia 20°22'24" N 85°1'45" E Dug Well KHANDAPADA Gamasalia 20°22'4" N 85°8'20" E Dug Well NUAGAON Mahipur 20°9'50" N 84°59'50" E Dug Well NAYAGARH Hataduar 20°9'35" N 85°3'32" E Dug Well NAYAGARH Purusottampur 20°9'18" N 85°11'25" E Dug Well ODAGAON Sarankul 20°1'50" N 85°5'48" E Dug Well ODAGAON Odagaon 20°1'18" N 84°59'0" E Dug Well ODAGAON Odogaon 20°1'18" N 84°59'0" E Bore Well NAYAGARH Sarak Sahi 20°6'17" N 85°5'1" E Dug Well ODAGAON Solopata 20°4'34" N 85°5'32" E Dug Well NAYAGARH Etamati 20°8'5" N 85°8'25" E Dug Well NAYAGARH Nayagarh 20°7'43" N 85°7'7" E Dug Well NAYAGARH Nayagarh 20°7'37" N 85°0'8" E Dug Well RANAPUR Lathipada 20°6'43" N 85°9'27" E Dug Well NAYAGARH Kalyanpur Ii 20°3'26" N 85°5'17" E Dug Well

112
DISTRICT_NAME_NUAPADA BLOCK_NAME VILLAGE_NAME LATITUDE LONGITUDE SITE_TYPE NUAPADA Gotama 20°52'18" N 82°30'3" E Dug Well NUAPADA Kalyanpur 20°51'45" N 82°31'56" E Dug Well NUAPADA Patparpali 20°50'44" N 82°32'34" E Dug Well SINAPALI Ghantiguda 20°5'51" N 82°41'49" E Dug Well KHARIAR Bada-Maheswar 20°23'0" N 82°41'12" E Dug Well NUAPADA Somarsingh 20°44'47" N 82°35'50" E Dug Well NUAPADA Nandanpur 20°50'46" N 82°29'18" E Dug Well NUAPADA Sahipala 20°49'41" N 82°40'40" E Dug Well NUAPADA Darlimunda 20°49'23" N 82°37'54" E Dug Well NUAPADA Sirthol 20°47'25" N 82°32'14" E Dug Well NUAPADA Khoksa 20°46'1" N 82°32'53" E Dug Well NUAPADA Tanwat 20°45'24" N 82°32'10" E Dug Well NUAPADA Bhajipala 20°49'38" N 82°29'22" E Dug Well NUAPADA Nawapara 20°47'52" N 82°32'10" E Dug Well NUAPADA Potora 20°44'23" N 82°26'34" E Dug Well NUAPADA Dharambandah 20°44'3" N 82°25'31" E Dug Well KHARIAR Junani 20°18'26" N 82°48'3" E Dug Well NUAPADA Khariar Road 20°53'22" N 82°30'42" E Bore Well KHARIAR Khariar 20°17'40" N 82°45'37" E Dug Well KHARIAR Ranipur 20°16'43" N 82°46'33" E Dug Well KHARIAR Loharapalli 20°18'57" N 82°44'12" E Dug Well KHARIAR Khudpej 20°18'40" N 82°41'21" E Dug Well KOMANA Tarbod 20°37'58" N 82°36'55" E Dug Well KHARIAR Bargaon-k 20°20'25" N 82°41'45" E Dug Well KHARIAR Padampur 20°17'49" N 82°46'34" E Dug Well KHARIAR Loharpalli 20°17'11" N 82°45'44" E Dug Well KHARIAR Lachhipur 20°16'8" N 82°47'33" E Dug Well KHARIAR Tukla 20°15'40" N 82°50'20" E Dug Well BODEN Boden 20°14'50" N 82°34'5" E Dug Well KOMANA Burkhiakomna 20°35'5" N 82°40'25" E Dug Well KOMANA Komna 20°30'5" N 82°40'22" E Dug Well NUAPADA Godphula 20°49'13" N 82°33'57" E Dug Well NUAPADA Nawapara 20°48'14" N 82°32'22" E Bore Well KOMANA Lakhna 20°43'53" N 82°40'37" E Bore Well KOMANA Kurumpuri 20°43'8" N 82°35'13" E Dug Well KHARIAR Rishigaon 20°22'53" N 82°49'12" E Dug Well KHARIAR Sanmaheswar 20°22'25" N 82°42'3" E Dug Well KOMANA Deobahal 20°21'41" N 82°42'16" E Dug Well SINAPALI Nilji 20°6'8" N 82°35'45" E Dug Well

113
DISTRICT_NAME_PURI BLOCK_NAME VILLAGE_NAME LATITUDE LONGITUDE SITE_TYPE PIPIL Bantalsingh 20°5'19" N 85°48'10" E Dug Well NIMAPADA Bisimatri 20°4'12" N 86°4'18" E Dug Well NIMAPADA Nimapara 20°3'40" N 86°1'44" E Tube Well NIMAPADA Charichhak 20°3'34" N 86°5'9" E Dug Well NIMAPADA Chhanijanga 20°2'30" N 86°4'30" E Dug Well DELANGA Delang 20°2'10" N 85°46'10" E Tube Well DELANGA Delang 20°2'10" N 85°46'10" E Dug Well GOP Bhanti 20°1'18" N 85°59'0" E Dug Well KAKAT PUR Kakatpur 20°0'22" N 86°11'33" E Dug Well KAKAT PUR Kakatpur 20°0'22" N 86°11'32" E Tube Well KAKAT PUR Kakatpur Ii 19°59'58" N 86°11'40" E Dug Well PIPIL Maunimatha 19°59'39" N 85°48'0" E Dug Well ASTARANGA Juinti 19°59'8" N 86°14'22" E Dug Well GOP Marad 19°58'20" N 86°4'45" E Dug Well SATYABADI Sadanandapur 19°58'20" N 85°49'20" E Dug Well SATYABADI Nuasamsarpur 19°57'15" N 85°46'45" E Dug Well SATYABADI Algum 19°56'58" N 85°44'52" E Dug Well SATYABADI Uansdiha 19°56'57" N 85°49'22" E Dug Well SATYABADI Sakhigopal-i 19°56'52" N 85°48'34" E Tube Well SATYABADI Sakhigopal 19°56'29" N 85°49'56" E Dug Well ASTARANGA Tikarpara 19°56'24" N 86°10'57" E Dug Well GOP Madrang 19°55'30" N 85°59'30" E Dug Well GOP Mahapur 19°54'17" N 85°57'52" E Dug Well SADAR Birapratappur 19°54'8" N 85°48'42" E Dug Well SADAR Pratapramchandr 19°53'56" N 85°46'47" E Dug Well SADAR Chandanpur 19°53'27" N 85°48'54" E Dug Well KAKAT PUR Konark 19°53'11" N 86°5'48" E Dug Well SADAR Tulasichoura-Malatipatapur 19°52'36" N 85°49'3" E Dug Well GOP Balighai 19°51'28" N 85°56'33" E Dug Well GOP Ramchandi 19°51'15" N 86°3'40" E Dug Well GOP Baleshwarpatna 19°50'40" N 85°54'41" E Dug Well SADAR Baliguari 19°49'56" N 85°52'22" E Dug Well SADAR Puri Urban 19°49'25" N 85°50'54" E Dug Well SADAR Totasahi 19°48'51" N 85°48'23" E Dug Well SADAR Puri Urban 19°48'47" N 85°48'53" E Dug Well BRAHMAGIRI Alipata 19°48'45" N 85°45'44" E Dug Well BRAHMAGIRI Girala 19°48'40" N 85°46'15" E Dug Well PIPIL Burhapara 20°8'31" N 85°45'18" E Dug Well
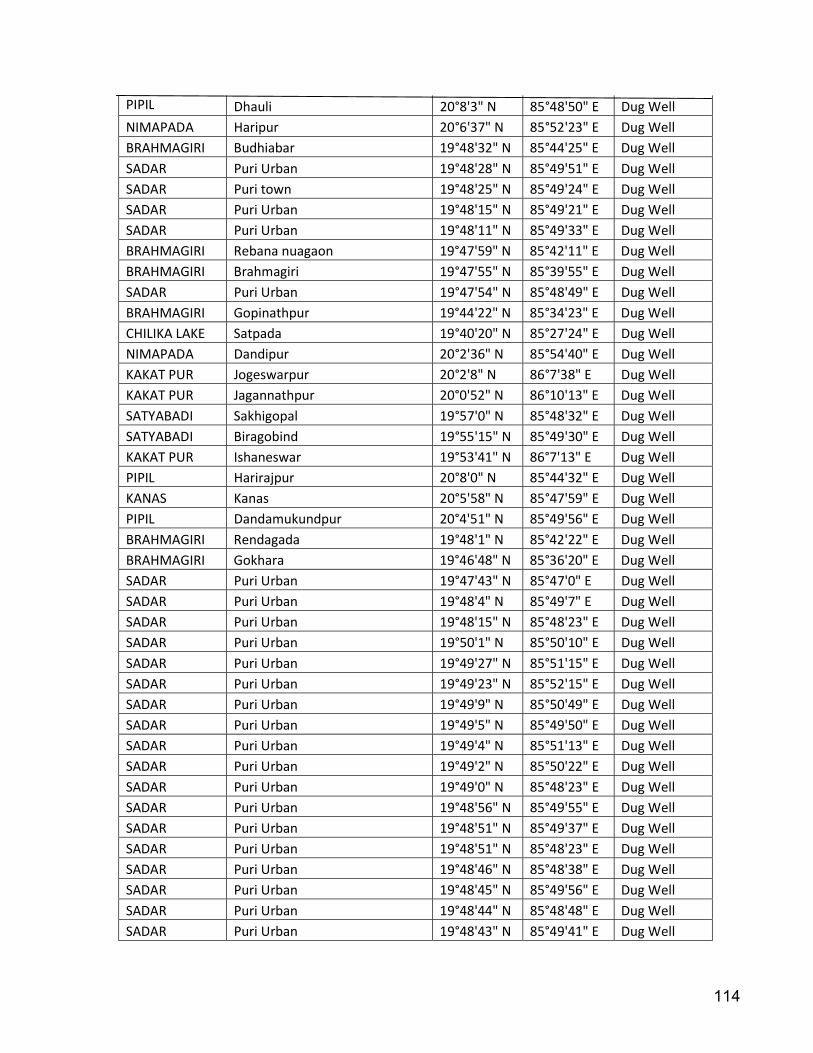
114
PIPIL Dhauli 20°8'3" N 85°48'50" E Dug Well NIMAPADA Haripur 20°6'37" N 85°52'23" E Dug Well BRAHMAGIRI Budhiabar 19°48'32" N 85°44'25" E Dug Well SADAR Puri Urban 19°48'28" N 85°49'51" E Dug Well SADAR Puri town 19°48'25" N 85°49'24" E Dug Well SADAR Puri Urban 19°48'15" N 85°49'21" E Dug Well SADAR Puri Urban 19°48'11" N 85°49'33" E Dug Well BRAHMAGIRI Rebana nuagaon 19°47'59" N 85°42'11" E Dug Well BRAHMAGIRI Brahmagiri 19°47'55" N 85°39'55" E Dug Well SADAR Puri Urban 19°47'54" N 85°48'49" E Dug Well BRAHMAGIRI Gopinathpur 19°44'22" N 85°34'23" E Dug Well CHILIKA LAKE Satpada 19°40'20" N 85°27'24" E Dug Well NIMAPADA Dandipur 20°2'36" N 85°54'40" E Dug Well KAKAT PUR Jogeswarpur 20°2'8" N 86°7'38" E Dug Well KAKAT PUR Jagannathpur 20°0'52" N 86°10'13" E Dug Well SATYABADI Sakhigopal 19°57'0" N 85°48'32" E Dug Well SATYABADI Biragobind 19°55'15" N 85°49'30" E Dug Well KAKAT PUR Ishaneswar 19°53'41" N 86°7'13" E Dug Well PIPIL Harirajpur 20°8'0" N 85°44'32" E Dug Well KANAS Kanas 20°5'58" N 85°47'59" E Dug Well PIPIL Dandamukundpur 20°4'51" N 85°49'56" E Dug Well BRAHMAGIRI Rendagada 19°48'1" N 85°42'22" E Dug Well BRAHMAGIRI Gokhara 19°46'48" N 85°36'20" E Dug Well SADAR Puri Urban 19°47'43" N 85°47'0" E Dug Well SADAR Puri Urban 19°48'4" N 85°49'7" E Dug Well SADAR Puri Urban 19°48'15" N 85°48'23" E Dug Well SADAR Puri Urban 19°50'1" N 85°50'10" E Dug Well SADAR Puri Urban 19°49'27" N 85°51'15" E Dug Well SADAR Puri Urban 19°49'23" N 85°52'15" E Dug Well SADAR Puri Urban 19°49'9" N 85°50'49" E Dug Well SADAR Puri Urban 19°49'5" N 85°49'50" E Dug Well SADAR Puri Urban 19°49'4" N 85°51'13" E Dug Well SADAR Puri Urban 19°49'2" N 85°50'22" E Dug Well SADAR Puri Urban 19°49'0" N 85°48'23" E Dug Well SADAR Puri Urban 19°48'56" N 85°49'55" E Dug Well SADAR Puri Urban 19°48'51" N 85°49'37" E Dug Well SADAR Puri Urban 19°48'51" N 85°48'23" E Dug Well SADAR Puri Urban 19°48'46" N 85°48'38" E Dug Well SADAR Puri Urban 19°48'45" N 85°49'56" E Dug Well SADAR Puri Urban 19°48'44" N 85°48'48" E Dug Well SADAR Puri Urban 19°48'43" N 85°49'41" E Dug Well

115
SADAR Puri Urban 19°48'38" N 85°49'47" E Dug Well GOP Gop 19°58'55" N 86°1'5" E Dug Well SATYABADI Kadua 19°57'32" N 85°49'31" E Dug Well SADAR Puri Urban 19°48'38" N 85°49'29" E Dug Well SADAR Puri Urban 19°48'36" N 85°49'50" E Dug Well SADAR Puri Urban 19°48'25" N 85°51'24" E Dug Well SADAR Puri Urban 19°48'21" N 85°50'32" E Dug Well SADAR Puri Urban 19°48'20" N 85°51'3" E Dug Well SADAR Puri Urban 19°48'20" N 85°50'23" E Dug Well SADAR Puri Urban 19°48'19" N 85°49'55" E Dug Well SADAR Puri Urban 19°48'18" N 85°49'58" E Dug Well PIPIL Pipli 20°6'56" N 85°50'2" E Dug Well NIMAPADA Garapada 20°5'30" N 85°55'11" E Dug Well SADAR Puri Urban 19°48'14" N 85°48'40" E Dug Well SADAR Puri Urban 19°47'56" N 85°49'33" E Dug Well SADAR Puri Urban 19°47'43" N 85°48'45" E Dug Well SATYABADI Kumareswar 20°0'5" N 85°50'25" E Dug Well ASTARANGA Astarang 19°58'50" N 86°16'30" E Dug Well NIMAPADA Nimapara 20°3'16" N 86°0'12" E Dug Well PIPIL Mangalpur 20°2'55" N 85°49'45" E Dug Well NIMAPADA Balanga 20°2'12" N 85°53'10" E Dug Well SADAR Puri Urban 19°48'23" N 85°49'8" E Dug Well SADAR Puri Urban 19°48'37" N 85°50'20" E Dug Well
DISTRICT_NAME_RAYAGADA BLOCK_NAME VILLAGE_NAME LATITUDE LONGITUDE SITE_TYPE KASHIPUR Gorakhpur 19°14'27" N 83°6'43" E Dug Well KASHIPUR Kashipur 19°21'15" N 83°7'11" E Dug Well PADMAPUR Padampur 19°14'27" N 83°49'20" E Dug Well KOLNARA Mukundpur 19°13'32" N 83°33'32" E Dug Well RAMANGUDA Ramnaguda 19°13'21" N 83°40'34" E Dug Well RAMANGUDA Chakunda 19°13'17" N 83°41'35" E Dug Well RAMANGUDA Gumda 19°13'12" N 83°46'18" E Dug Well PADMAPUR Narainpur 19°21'40" N 83°58'0" E Dug Well KOLNARA Minajhola 19°16'34" N 83°36'37" E Dug Well PADMAPUR Akhusingi 19°16'25" N 83°51'31" E Dug Well GUNUPUR Gunupur 19°4'46" N 83°48'42" E Dug Well MUNIGUDA Ambadola 19°50'7" N 83°27'29" E Dug Well KOLNARA Therabali 19°19'40" N 83°26'28" E Dug Well
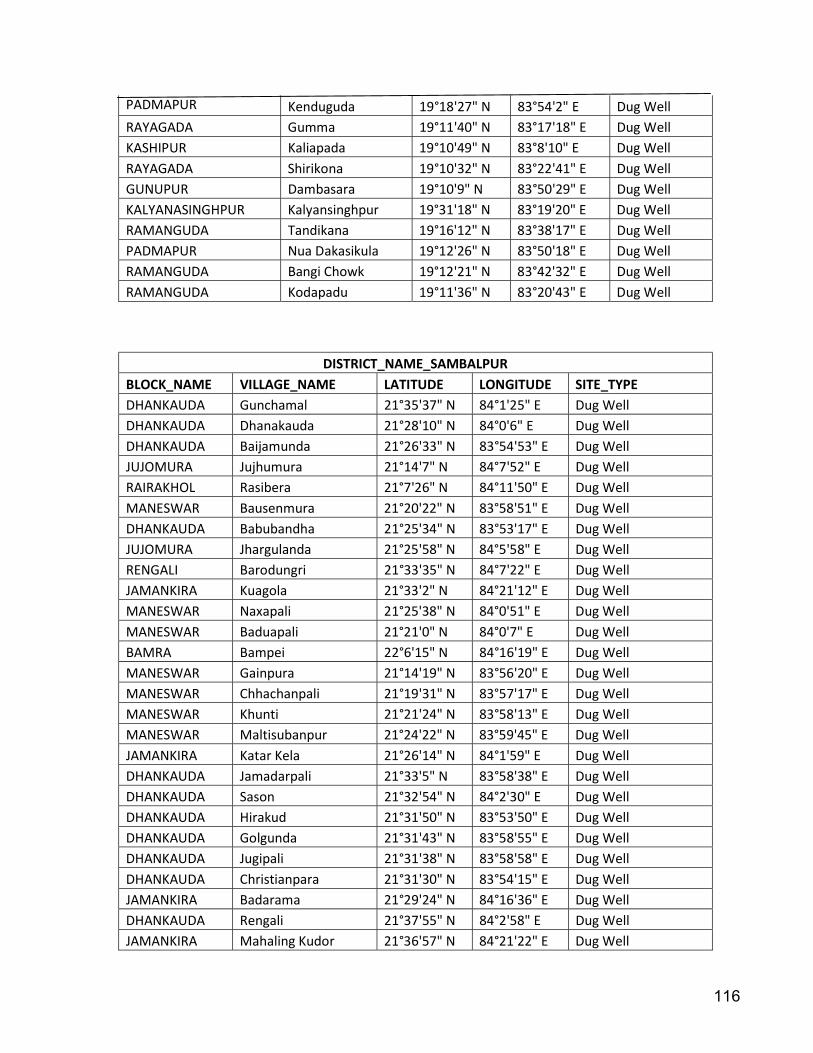
116
PADMAPUR Kenduguda 19°18'27" N 83°54'2" E Dug Well RAYAGADA Gumma 19°11'40" N 83°17'18" E Dug Well KASHIPUR Kaliapada 19°10'49" N 83°8'10" E Dug Well RAYAGADA Shirikona 19°10'32" N 83°22'41" E Dug Well GUNUPUR Dambasara 19°10'9" N 83°50'29" E Dug Well KALYANASINGHPUR Kalyansinghpur 19°31'18" N 83°19'20" E Dug Well RAMANGUDA Tandikana 19°16'12" N 83°38'17" E Dug Well PADMAPUR Nua Dakasikula 19°12'26" N 83°50'18" E Dug Well RAMANGUDA Bangi Chowk 19°12'21" N 83°42'32" E Dug Well RAMANGUDA Kodapadu 19°11'36" N 83°20'43" E Dug Well
DISTRICT_NAME_SAMBALPUR BLOCK_NAME VILLAGE_NAME LATITUDE LONGITUDE SITE_TYPE DHANKAUDA Gunchamal 21°35'37" N 84°1'25" E Dug Well DHANKAUDA Dhanakauda 21°28'10" N 84°0'6" E Dug Well DHANKAUDA Baijamunda 21°26'33" N 83°54'53" E Dug Well JUJOMURA Jujhumura 21°14'7" N 84°7'52" E Dug Well RAIRAKHOL Rasibera 21°7'26" N 84°11'50" E Dug Well MANESWAR Bausenmura 21°20'22" N 83°58'51" E Dug Well DHANKAUDA Babubandha 21°25'34" N 83°53'17" E Dug Well JUJOMURA Jhargulanda 21°25'58" N 84°5'58" E Dug Well RENGALI Barodungri 21°33'35" N 84°7'22" E Dug Well JAMANKIRA Kuagola 21°33'2" N 84°21'12" E Dug Well MANESWAR Naxapali 21°25'38" N 84°0'51" E Dug Well MANESWAR Baduapali 21°21'0" N 84°0'7" E Dug Well BAMRA Bampei 22°6'15" N 84°16'19" E Dug Well MANESWAR Gainpura 21°14'19" N 83°56'20" E Dug Well MANESWAR Chhachanpali 21°19'31" N 83°57'17" E Dug Well MANESWAR Khunti 21°21'24" N 83°58'13" E Dug Well MANESWAR Maltisubanpur 21°24'22" N 83°59'45" E Dug Well JAMANKIRA Katar Kela 21°26'14" N 84°1'59" E Dug Well DHANKAUDA Jamadarpali 21°33'5" N 83°58'38" E Dug Well DHANKAUDA Sason 21°32'54" N 84°2'30" E Dug Well DHANKAUDA Hirakud 21°31'50" N 83°53'50" E Dug Well DHANKAUDA Golgunda 21°31'43" N 83°58'55" E Dug Well DHANKAUDA Jugipali 21°31'38" N 83°58'58" E Dug Well DHANKAUDA Christianpara 21°31'30" N 83°54'15" E Dug Well JAMANKIRA Badarama 21°29'24" N 84°16'36" E Dug Well DHANKAUDA Rengali 21°37'55" N 84°2'58" E Dug Well JAMANKIRA Mahaling Kudor 21°36'57" N 84°21'22" E Dug Well
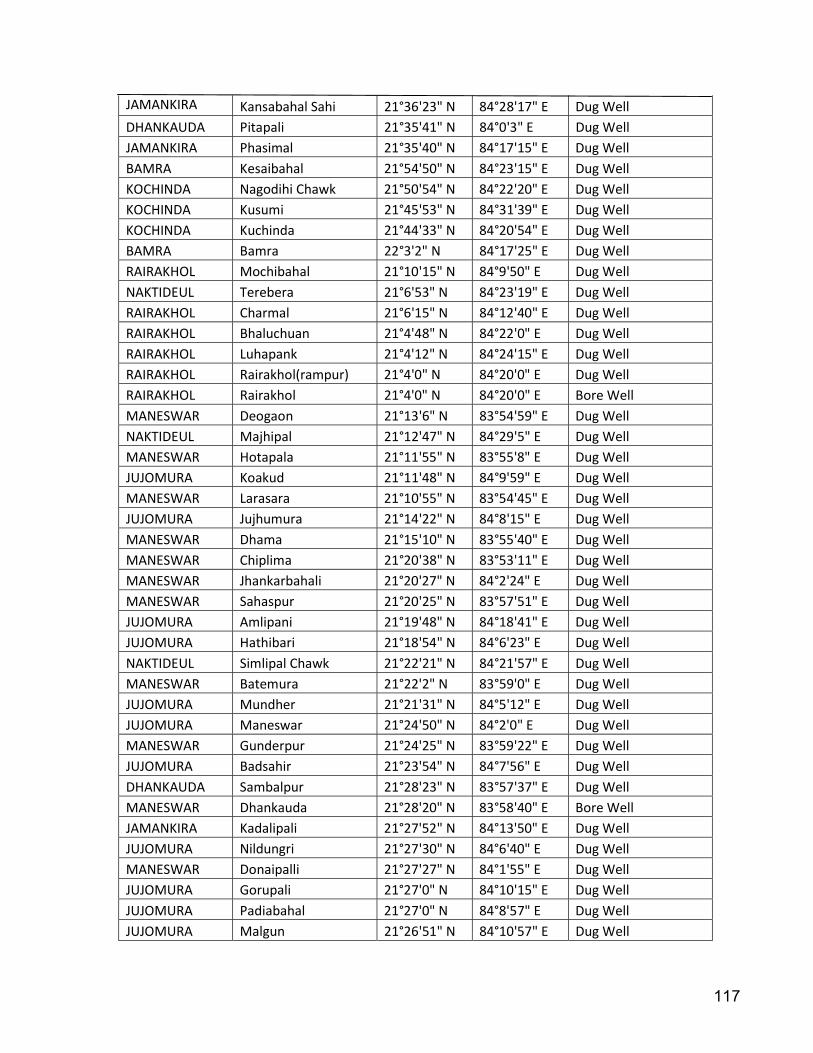
117
JAMANKIRA Kansabahal Sahi 21°36'23" N 84°28'17" E Dug Well DHANKAUDA Pitapali 21°35'41" N 84°0'3" E Dug Well JAMANKIRA Phasimal 21°35'40" N 84°17'15" E Dug Well BAMRA Kesaibahal 21°54'50" N 84°23'15" E Dug Well KOCHINDA Nagodihi Chawk 21°50'54" N 84°22'20" E Dug Well KOCHINDA Kusumi 21°45'53" N 84°31'39" E Dug Well KOCHINDA Kuchinda 21°44'33" N 84°20'54" E Dug Well BAMRA Bamra 22°3'2" N 84°17'25" E Dug Well RAIRAKHOL Mochibahal 21°10'15" N 84°9'50" E Dug Well NAKTIDEUL Terebera 21°6'53" N 84°23'19" E Dug Well RAIRAKHOL Charmal 21°6'15" N 84°12'40" E Dug Well RAIRAKHOL Bhaluchuan 21°4'48" N 84°22'0" E Dug Well RAIRAKHOL Luhapank 21°4'12" N 84°24'15" E Dug Well RAIRAKHOL Rairakhol(rampur) 21°4'0" N 84°20'0" E Dug Well RAIRAKHOL Rairakhol 21°4'0" N 84°20'0" E Bore Well MANESWAR Deogaon 21°13'6" N 83°54'59" E Dug Well NAKTIDEUL Majhipal 21°12'47" N 84°29'5" E Dug Well MANESWAR Hotapala 21°11'55" N 83°55'8" E Dug Well JUJOMURA Koakud 21°11'48" N 84°9'59" E Dug Well MANESWAR Larasara 21°10'55" N 83°54'45" E Dug Well JUJOMURA Jujhumura 21°14'22" N 84°8'15" E Dug Well MANESWAR Dhama 21°15'10" N 83°55'40" E Dug Well MANESWAR Chiplima 21°20'38" N 83°53'11" E Dug Well MANESWAR Jhankarbahali 21°20'27" N 84°2'24" E Dug Well MANESWAR Sahaspur 21°20'25" N 83°57'51" E Dug Well JUJOMURA Amlipani 21°19'48" N 84°18'41" E Dug Well JUJOMURA Hathibari 21°18'54" N 84°6'23" E Dug Well NAKTIDEUL Simlipal Chawk 21°22'21" N 84°21'57" E Dug Well MANESWAR Batemura 21°22'2" N 83°59'0" E Dug Well JUJOMURA Mundher 21°21'31" N 84°5'12" E Dug Well JUJOMURA Maneswar 21°24'50" N 84°2'0" E Dug Well MANESWAR Gunderpur 21°24'25" N 83°59'22" E Dug Well JUJOMURA Badsahir 21°23'54" N 84°7'56" E Dug Well DHANKAUDA Sambalpur 21°28'23" N 83°57'37" E Dug Well MANESWAR Dhankauda 21°28'20" N 83°58'40" E Bore Well JAMANKIRA Kadalipali 21°27'52" N 84°13'50" E Dug Well JUJOMURA Nildungri 21°27'30" N 84°6'40" E Dug Well MANESWAR Donaipalli 21°27'27" N 84°1'55" E Dug Well JUJOMURA Gorupali 21°27'0" N 84°10'15" E Dug Well JUJOMURA Padiabahal 21°27'0" N 84°8'57" E Dug Well JUJOMURA Malgun 21°26'51" N 84°10'57" E Dug Well
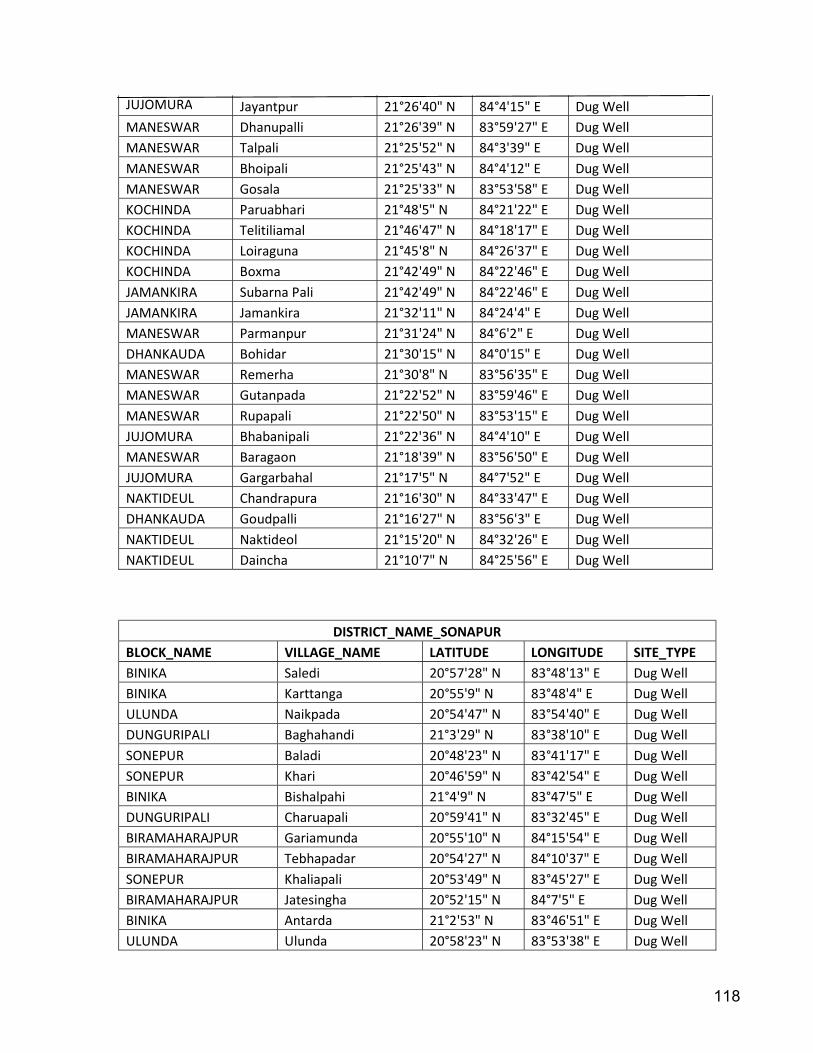
118
JUJOMURA Jayantpur 21°26'40" N 84°4'15" E Dug Well MANESWAR Dhanupalli 21°26'39" N 83°59'27" E Dug Well MANESWAR Talpali 21°25'52" N 84°3'39" E Dug Well MANESWAR Bhoipali 21°25'43" N 84°4'12" E Dug Well MANESWAR Gosala 21°25'33" N 83°53'58" E Dug Well KOCHINDA Paruabhari 21°48'5" N 84°21'22" E Dug Well KOCHINDA Telitiliamal 21°46'47" N 84°18'17" E Dug Well KOCHINDA Loiraguna 21°45'8" N 84°26'37" E Dug Well KOCHINDA Boxma 21°42'49" N 84°22'46" E Dug Well JAMANKIRA Subarna Pali 21°42'49" N 84°22'46" E Dug Well JAMANKIRA Jamankira 21°32'11" N 84°24'4" E Dug Well MANESWAR Parmanpur 21°31'24" N 84°6'2" E Dug Well DHANKAUDA Bohidar 21°30'15" N 84°0'15" E Dug Well MANESWAR Remerha 21°30'8" N 83°56'35" E Dug Well MANESWAR Gutanpada 21°22'52" N 83°59'46" E Dug Well MANESWAR Rupapali 21°22'50" N 83°53'15" E Dug Well JUJOMURA Bhabanipali 21°22'36" N 84°4'10" E Dug Well MANESWAR Baragaon 21°18'39" N 83°56'50" E Dug Well JUJOMURA Gargarbahal 21°17'5" N 84°7'52" E Dug Well NAKTIDEUL Chandrapura 21°16'30" N 84°33'47" E Dug Well DHANKAUDA Goudpalli 21°16'27" N 83°56'3" E Dug Well NAKTIDEUL Naktideol 21°15'20" N 84°32'26" E Dug Well NAKTIDEUL Daincha 21°10'7" N 84°25'56" E Dug Well
DISTRICT_NAME_SONAPUR BLOCK_NAME VILLAGE_NAME LATITUDE LONGITUDE SITE_TYPE BINIKA Saledi 20°57'28" N 83°48'13" E Dug Well BINIKA Karttanga 20°55'9" N 83°48'4" E Dug Well ULUNDA Naikpada 20°54'47" N 83°54'40" E Dug Well DUNGURIPALI Baghahandi 21°3'29" N 83°38'10" E Dug Well SONEPUR Baladi 20°48'23" N 83°41'17" E Dug Well SONEPUR Khari 20°46'59" N 83°42'54" E Dug Well BINIKA Bishalpahi 21°4'9" N 83°47'5" E Dug Well DUNGURIPALI Charuapali 20°59'41" N 83°32'45" E Dug Well BIRAMAHARAJPUR Gariamunda 20°55'10" N 84°15'54" E Dug Well BIRAMAHARAJPUR Tebhapadar 20°54'27" N 84°10'37" E Dug Well SONEPUR Khaliapali 20°53'49" N 83°45'27" E Dug Well BIRAMAHARAJPUR Jatesingha 20°52'15" N 84°7'5" E Dug Well BINIKA Antarda 21°2'53" N 83°46'51" E Dug Well ULUNDA Ulunda 20°58'23" N 83°53'38" E Dug Well
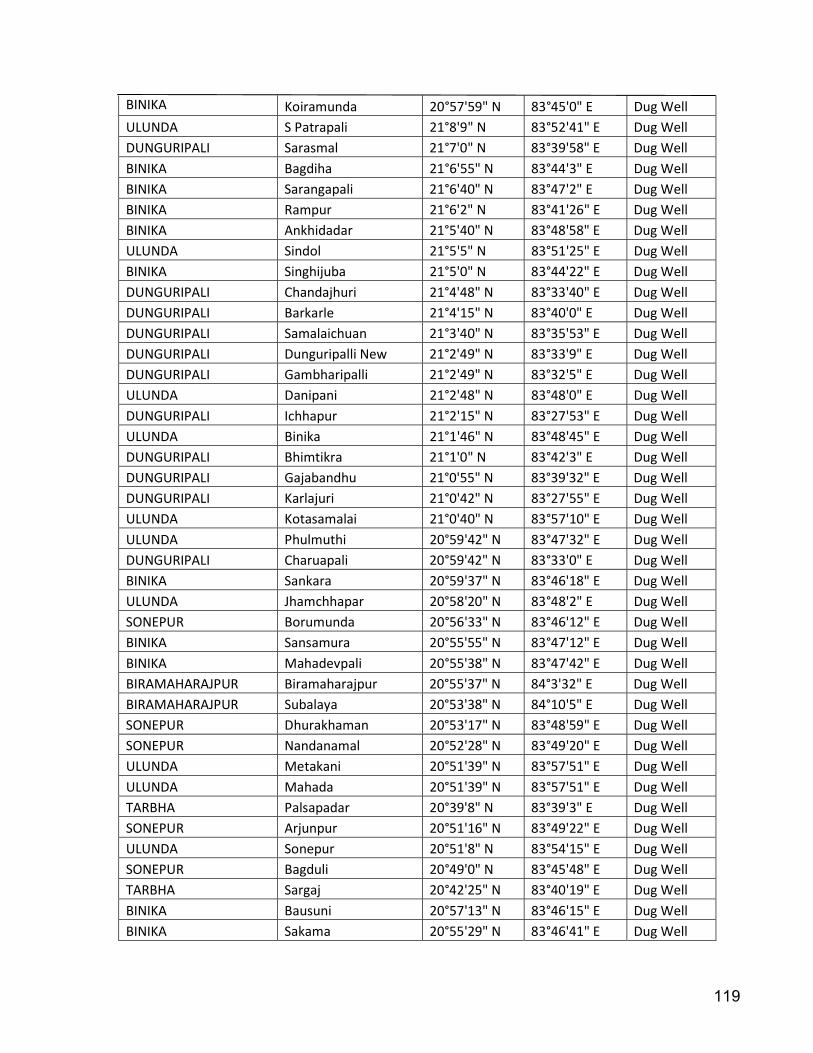
119
BINIKA Koiramunda 20°57'59" N 83°45'0" E Dug Well ULUNDA S Patrapali 21°8'9" N 83°52'41" E Dug Well DUNGURIPALI Sarasmal 21°7'0" N 83°39'58" E Dug Well BINIKA Bagdiha 21°6'55" N 83°44'3" E Dug Well BINIKA Sarangapali 21°6'40" N 83°47'2" E Dug Well BINIKA Rampur 21°6'2" N 83°41'26" E Dug Well BINIKA Ankhidadar 21°5'40" N 83°48'58" E Dug Well ULUNDA Sindol 21°5'5" N 83°51'25" E Dug Well BINIKA Singhijuba 21°5'0" N 83°44'22" E Dug Well DUNGURIPALI Chandajhuri 21°4'48" N 83°33'40" E Dug Well DUNGURIPALI Barkarle 21°4'15" N 83°40'0" E Dug Well DUNGURIPALI Samalaichuan 21°3'40" N 83°35'53" E Dug Well DUNGURIPALI Dunguripalli New 21°2'49" N 83°33'9" E Dug Well DUNGURIPALI Gambharipalli 21°2'49" N 83°32'5" E Dug Well ULUNDA Danipani 21°2'48" N 83°48'0" E Dug Well DUNGURIPALI Ichhapur 21°2'15" N 83°27'53" E Dug Well ULUNDA Binika 21°1'46" N 83°48'45" E Dug Well DUNGURIPALI Bhimtikra 21°1'0" N 83°42'3" E Dug Well DUNGURIPALI Gajabandhu 21°0'55" N 83°39'32" E Dug Well DUNGURIPALI Karlajuri 21°0'42" N 83°27'55" E Dug Well ULUNDA Kotasamalai 21°0'40" N 83°57'10" E Dug Well ULUNDA Phulmuthi 20°59'42" N 83°47'32" E Dug Well DUNGURIPALI Charuapali 20°59'42" N 83°33'0" E Dug Well BINIKA Sankara 20°59'37" N 83°46'18" E Dug Well ULUNDA Jhamchhapar 20°58'20" N 83°48'2" E Dug Well SONEPUR Borumunda 20°56'33" N 83°46'12" E Dug Well BINIKA Sansamura 20°55'55" N 83°47'12" E Dug Well BINIKA Mahadevpali 20°55'38" N 83°47'42" E Dug Well BIRAMAHARAJPUR Biramaharajpur 20°55'37" N 84°3'32" E Dug Well BIRAMAHARAJPUR Subalaya 20°53'38" N 84°10'5" E Dug Well SONEPUR Dhurakhaman 20°53'17" N 83°48'59" E Dug Well SONEPUR Nandanamal 20°52'28" N 83°49'20" E Dug Well ULUNDA Metakani 20°51'39" N 83°57'51" E Dug Well ULUNDA Mahada 20°51'39" N 83°57'51" E Dug Well TARBHA Palsapadar 20°39'8" N 83°39'3" E Dug Well SONEPUR Arjunpur 20°51'16" N 83°49'22" E Dug Well ULUNDA Sonepur 20°51'8" N 83°54'15" E Dug Well SONEPUR Bagduli 20°49'0" N 83°45'48" E Dug Well TARBHA Sargaj 20°42'25" N 83°40'19" E Dug Well BINIKA Bausuni 20°57'13" N 83°46'15" E Dug Well BINIKA Sakama 20°55'29" N 83°46'41" E Dug Well
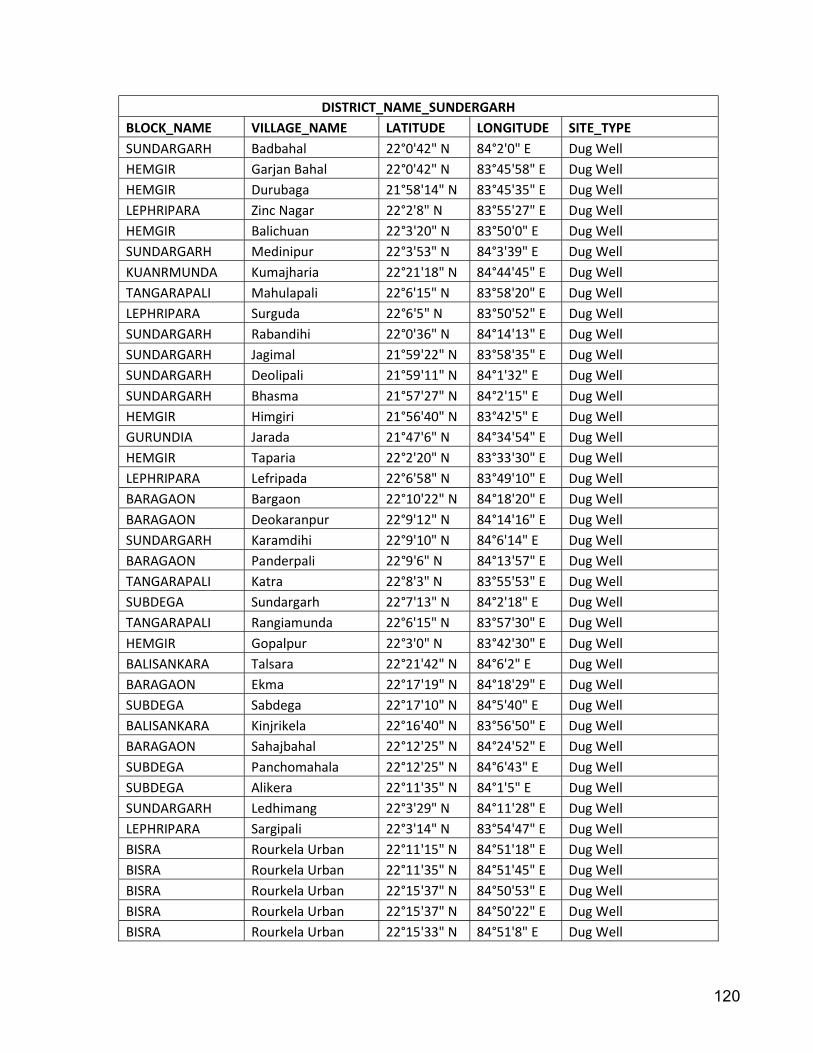
120
DISTRICT_NAME_SUNDERGARH BLOCK_NAME VILLAGE_NAME LATITUDE LONGITUDE SITE_TYPE SUNDARGARH Badbahal 22°0'42" N 84°2'0" E Dug Well HEMGIR Garjan Bahal 22°0'42" N 83°45'58" E Dug Well HEMGIR Durubaga 21°58'14" N 83°45'35" E Dug Well LEPHRIPARA Zinc Nagar 22°2'8" N 83°55'27" E Dug Well HEMGIR Balichuan 22°3'20" N 83°50'0" E Dug Well SUNDARGARH Medinipur 22°3'53" N 84°3'39" E Dug Well KUANRMUNDA Kumajharia 22°21'18" N 84°44'45" E Dug Well TANGARAPALI Mahulapali 22°6'15" N 83°58'20" E Dug Well LEPHRIPARA Surguda 22°6'5" N 83°50'52" E Dug Well SUNDARGARH Rabandihi 22°0'36" N 84°14'13" E Dug Well SUNDARGARH Jagimal 21°59'22" N 83°58'35" E Dug Well SUNDARGARH Deolipali 21°59'11" N 84°1'32" E Dug Well SUNDARGARH Bhasma 21°57'27" N 84°2'15" E Dug Well HEMGIR Himgiri 21°56'40" N 83°42'5" E Dug Well GURUNDIA Jarada 21°47'6" N 84°34'54" E Dug Well HEMGIR Taparia 22°2'20" N 83°33'30" E Dug Well LEPHRIPARA Lefripada 22°6'58" N 83°49'10" E Dug Well BARAGAON Bargaon 22°10'22" N 84°18'20" E Dug Well BARAGAON Deokaranpur 22°9'12" N 84°14'16" E Dug Well SUNDARGARH Karamdihi 22°9'10" N 84°6'14" E Dug Well BARAGAON Panderpali 22°9'6" N 84°13'57" E Dug Well TANGARAPALI Katra 22°8'3" N 83°55'53" E Dug Well SUBDEGA Sundargarh 22°7'13" N 84°2'18" E Dug Well TANGARAPALI Rangiamunda 22°6'15" N 83°57'30" E Dug Well HEMGIR Gopalpur 22°3'0" N 83°42'30" E Dug Well BALISANKARA Talsara 22°21'42" N 84°6'2" E Dug Well BARAGAON Ekma 22°17'19" N 84°18'29" E Dug Well SUBDEGA Sabdega 22°17'10" N 84°5'40" E Dug Well BALISANKARA Kinjrikela 22°16'40" N 83°56'50" E Dug Well BARAGAON Sahajbahal 22°12'25" N 84°24'52" E Dug Well SUBDEGA Panchomahala 22°12'25" N 84°6'43" E Dug Well SUBDEGA Alikera 22°11'35" N 84°1'5" E Dug Well SUNDARGARH Ledhimang 22°3'29" N 84°11'28" E Dug Well LEPHRIPARA Sargipali 22°3'14" N 83°54'47" E Dug Well BISRA Rourkela Urban 22°11'15" N 84°51'18" E Dug Well BISRA Rourkela Urban 22°11'35" N 84°51'45" E Dug Well BISRA Rourkela Urban 22°15'37" N 84°50'53" E Dug Well BISRA Rourkela Urban 22°15'37" N 84°50'22" E Dug Well BISRA Rourkela Urban 22°15'33" N 84°51'8" E Dug Well
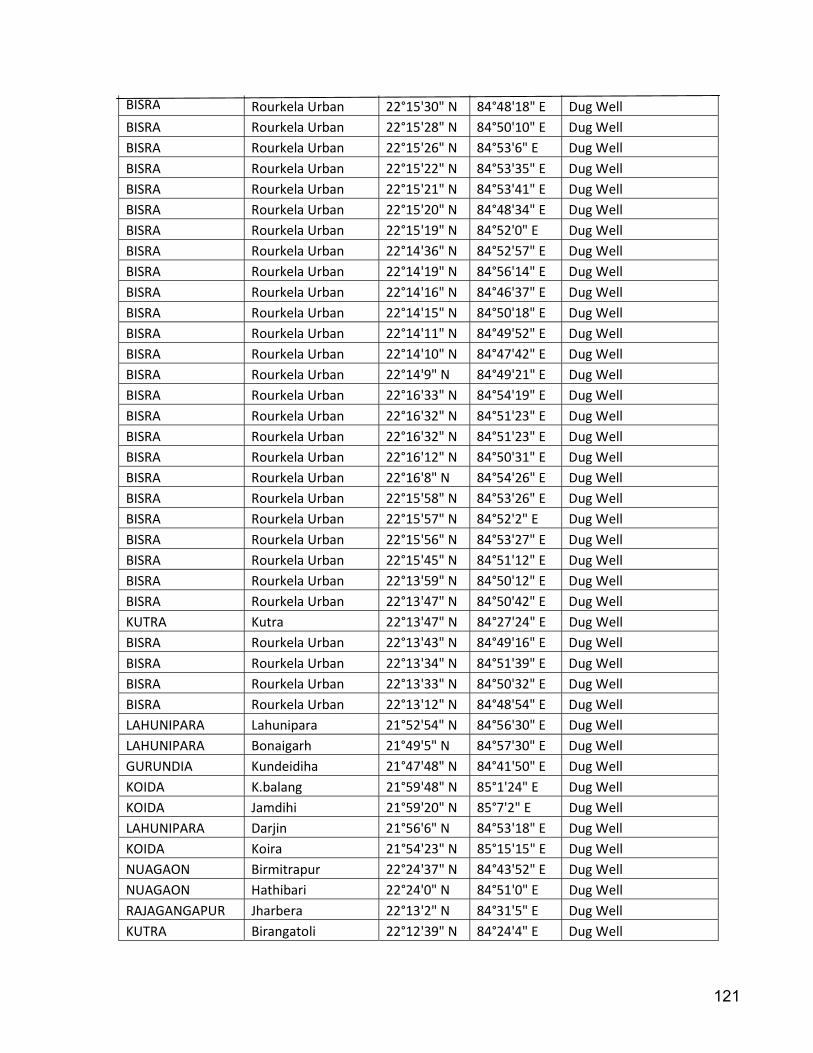
121
BISRA Rourkela Urban 22°15'30" N 84°48'18" E Dug Well BISRA Rourkela Urban 22°15'28" N 84°50'10" E Dug Well BISRA Rourkela Urban 22°15'26" N 84°53'6" E Dug Well BISRA Rourkela Urban 22°15'22" N 84°53'35" E Dug Well BISRA Rourkela Urban 22°15'21" N 84°53'41" E Dug Well BISRA Rourkela Urban 22°15'20" N 84°48'34" E Dug Well BISRA Rourkela Urban 22°15'19" N 84°52'0" E Dug Well BISRA Rourkela Urban 22°14'36" N 84°52'57" E Dug Well BISRA Rourkela Urban 22°14'19" N 84°56'14" E Dug Well BISRA Rourkela Urban 22°14'16" N 84°46'37" E Dug Well BISRA Rourkela Urban 22°14'15" N 84°50'18" E Dug Well BISRA Rourkela Urban 22°14'11" N 84°49'52" E Dug Well BISRA Rourkela Urban 22°14'10" N 84°47'42" E Dug Well BISRA Rourkela Urban 22°14'9" N 84°49'21" E Dug Well BISRA Rourkela Urban 22°16'33" N 84°54'19" E Dug Well BISRA Rourkela Urban 22°16'32" N 84°51'23" E Dug Well BISRA Rourkela Urban 22°16'32" N 84°51'23" E Dug Well BISRA Rourkela Urban 22°16'12" N 84°50'31" E Dug Well BISRA Rourkela Urban 22°16'8" N 84°54'26" E Dug Well BISRA Rourkela Urban 22°15'58" N 84°53'26" E Dug Well BISRA Rourkela Urban 22°15'57" N 84°52'2" E Dug Well BISRA Rourkela Urban 22°15'56" N 84°53'27" E Dug Well BISRA Rourkela Urban 22°15'45" N 84°51'12" E Dug Well BISRA Rourkela Urban 22°13'59" N 84°50'12" E Dug Well BISRA Rourkela Urban 22°13'47" N 84°50'42" E Dug Well KUTRA Kutra 22°13'47" N 84°27'24" E Dug Well BISRA Rourkela Urban 22°13'43" N 84°49'16" E Dug Well BISRA Rourkela Urban 22°13'34" N 84°51'39" E Dug Well BISRA Rourkela Urban 22°13'33" N 84°50'32" E Dug Well BISRA Rourkela Urban 22°13'12" N 84°48'54" E Dug Well LAHUNIPARA Lahunipara 21°52'54" N 84°56'30" E Dug Well LAHUNIPARA Bonaigarh 21°49'5" N 84°57'30" E Dug Well GURUNDIA Kundeidiha 21°47'48" N 84°41'50" E Dug Well KOIDA K.balang 21°59'48" N 85°1'24" E Dug Well KOIDA Jamdihi 21°59'20" N 85°7'2" E Dug Well LAHUNIPARA Darjin 21°56'6" N 84°53'18" E Dug Well KOIDA Koira 21°54'23" N 85°15'15" E Dug Well NUAGAON Birmitrapur 22°24'37" N 84°43'52" E Dug Well NUAGAON Hathibari 22°24'0" N 84°51'0" E Dug Well RAJAGANGAPUR Jharbera 22°13'2" N 84°31'5" E Dug Well KUTRA Birangatoli 22°12'39" N 84°24'4" E Dug Well
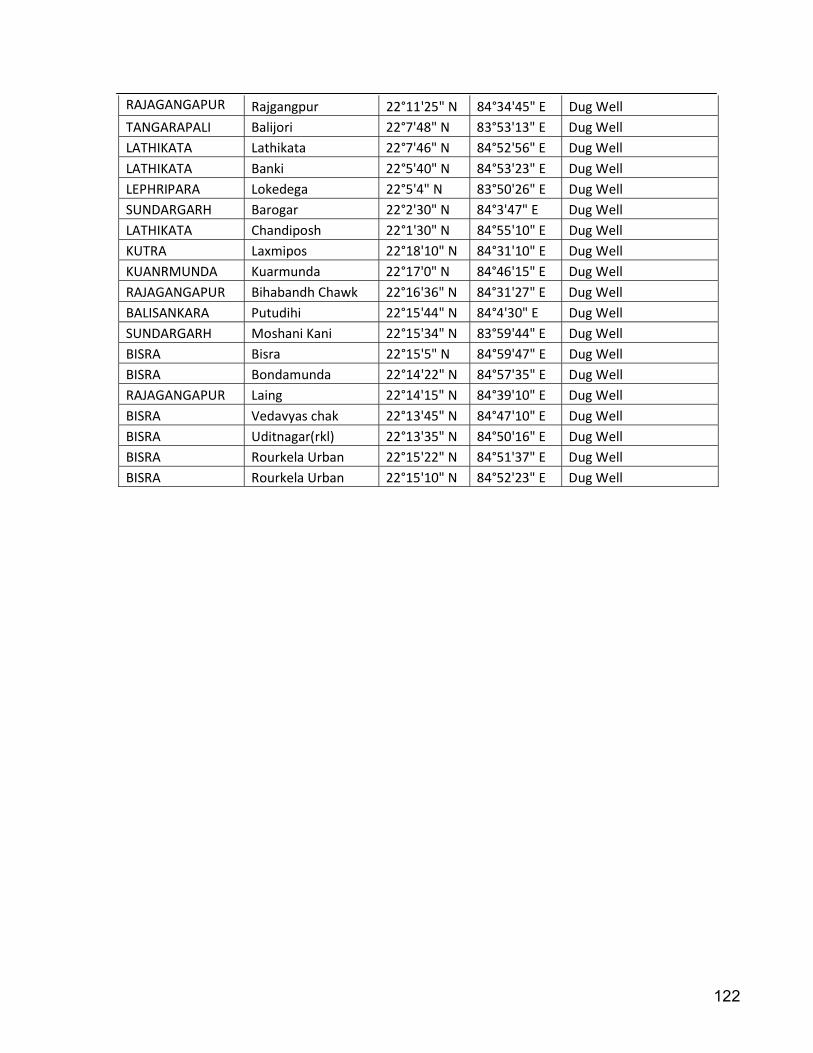
122
RAJAGANGAPUR Rajgangpur 22°11'25" N 84°34'45" E Dug Well TANGARAPALI Balijori 22°7'48" N 83°53'13" E Dug Well LATHIKATA Lathikata 22°7'46" N 84°52'56" E Dug Well LATHIKATA Banki 22°5'40" N 84°53'23" E Dug Well LEPHRIPARA Lokedega 22°5'4" N 83°50'26" E Dug Well SUNDARGARH Barogar 22°2'30" N 84°3'47" E Dug Well LATHIKATA Chandiposh 22°1'30" N 84°55'10" E Dug Well KUTRA Laxmipos 22°18'10" N 84°31'10" E Dug Well KUANRMUNDA Kuarmunda 22°17'0" N 84°46'15" E Dug Well RAJAGANGAPUR Bihabandh Chawk 22°16'36" N 84°31'27" E Dug Well BALISANKARA Putudihi 22°15'44" N 84°4'30" E Dug Well SUNDARGARH Moshani Kani 22°15'34" N 83°59'44" E Dug Well BISRA Bisra 22°15'5" N 84°59'47" E Dug Well BISRA Bondamunda 22°14'22" N 84°57'35" E Dug Well RAJAGANGAPUR Laing 22°14'15" N 84°39'10" E Dug Well BISRA Vedavyas chak 22°13'45" N 84°47'10" E Dug Well BISRA Uditnagar(rkl) 22°13'35" N 84°50'16" E Dug Well BISRA Rourkela Urban 22°15'22" N 84°51'37" E Dug Well BISRA Rourkela Urban 22°15'10" N 84°52'23" E Dug Well

123
ANNEXURE - II
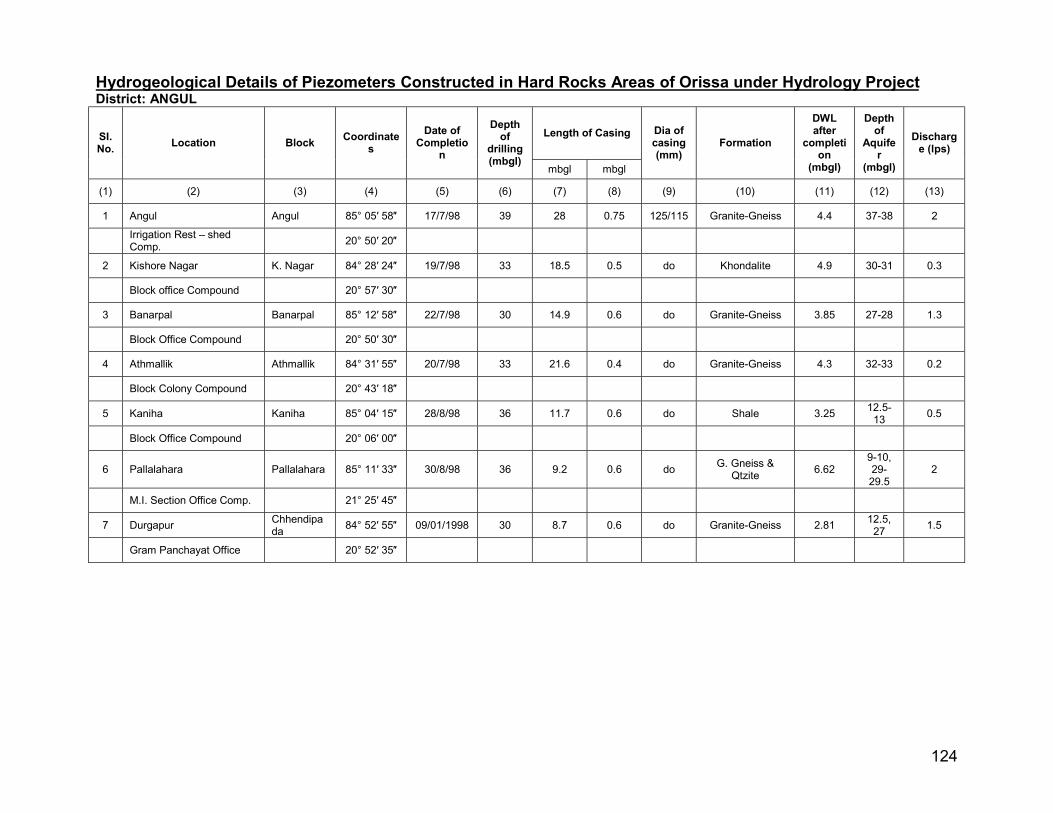
124
Hydrogeological Details of Piezometers Constructed in Hard Rocks Areas of Orissa under Hydrology Project District: ANGUL
SI. No.
Location Block Coordinate
s
Date of Completio
n
Depth of
drilling (mbgl)
Length of Casing Dia of casing (mm)
Formation
DWL after
completion
(mbgl)
Depth of
Aquifer
(mbgl)
Discharge (lps)
mbgl mbgl
(1) (2) (3) (4) (5) (6) (7) (8) (9) (10) (11) (12) (13)
1 Angul Angul 85° 05′ 58″ 17/7/98 39 28 0.75 125/115 Granite-Gneiss 4.4 37-38 2
Irrigation Rest – shed Comp.
20° 50′ 20″
2 Kishore Nagar K. Nagar 84° 28′ 24″ 19/7/98 33 18.5 0.5 do Khondalite 4.9 30-31 0.3
Block office Compound 20° 57′ 30″
3 Banarpal Banarpal 85° 12′ 58″ 22/7/98 30 14.9 0.6 do Granite-Gneiss 3.85 27-28 1.3
Block Office Compound 20° 50′ 30″
4 Athmallik Athmallik 84° 31′ 55″ 20/7/98 33 21.6 0.4 do Granite-Gneiss 4.3 32-33 0.2
Block Colony Compound 20° 43′ 18″
5 Kaniha Kaniha 85° 04′ 15″ 28/8/98 36 11.7 0.6 do Shale 3.25 12.5-
13 0.5
Block Office Compound 20° 06′ 00″
6 Pallalahara Pallalahara 85° 11′ 33″ 30/8/98 36 9.2 0.6 do G. Gneiss &
Qtzite 6.62
9-10, 29-29.5
2
M.I. Section Office Comp. 21° 25′ 45″
7 Durgapur Chhendipada
84° 52′ 55″ 09/01/1998 30 8.7 0.6 do Granite-Gneiss 2.81 12.5,
27 1.5
Gram Panchayat Office 20° 52′ 35″

125
District: BARGARH
SI. No.
Location Block Coordinate
s
Date of Completio
n
Depth of
drilling (mbgl)
Length of Casing Dia of casing (mm)
Formation
DWL after
completion
(mbgl)
Depth of
Aquifer
(mbgl)
Discharge (lps)
mbgl mbgl
(1) (2) (3) (4) (5) (6) (7) (8) (9) (10) (11) (12) (13)
1 Attabira Attabira 83° 47′ 00″ 22/02/99 29.90 10.10 0.6 125/115 Granite-Gneiss 6.11 29 0.2
Police Station Compund 21° 22′ 15″
2 Godbhaga Attabira 83° 49′ 00″ 19/3/99 34 19.2 0.6 do Granite-Gneiss 1.3 33-34 0.8
Canal Sub-division Office 21° 21′ 15″
3 Bargarh Bargarh 83° 37′ 20″ 23/2/99 38.35 14.6 0.6 do Granite-Gneiss 7.31 27 0.2
Police Station Compound 21° 20′ 10″
4 Ambabhona Ambabhona
83° 01′ 15″ 24/2/99 43.3 40.6 0.6 do Calc-Shale 5.65 42 0.4
Police Station Compound 21° 56′ 25″
5 Padampur Padampur 83° 04′ 02″ 24/2/99 33.35 12 0.6 do Granite-Gneiss 3.15 32 0.2
Police Station Compound 20° 59′ 48″
6 Paikmal Paikmal 82° 40′ 35″ 25/2/99 27.5 11.4 0.6 do Granite-Gneiss 6.2 26 0.4
Police Station Compound 20° 55′ 20″
7 Bijepur Bijepur 84° 27′ 49″ 13/5/99 33.55 21.6 0.6 do Quartzite 6.64 27, 33 0.41
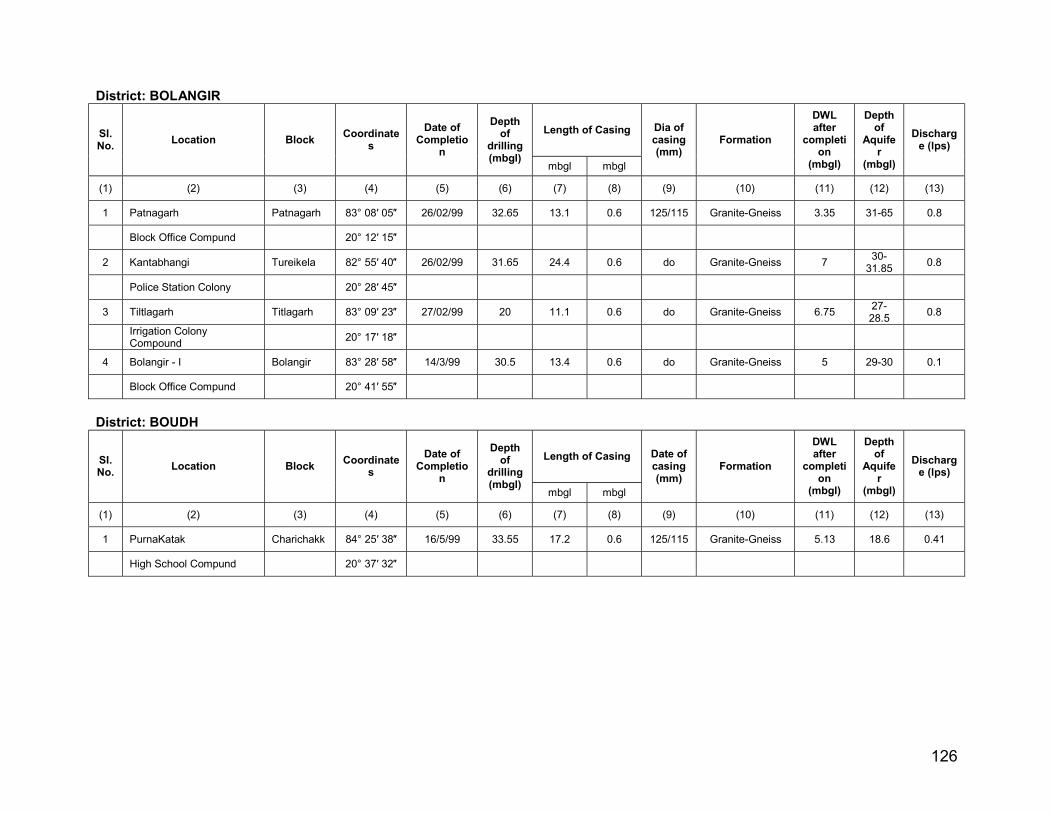
126
District: BOLANGIR
SI. No.
Location Block Coordinate
s
Date of Completio
n
Depth of
drilling (mbgl)
Length of Casing Dia of casing (mm)
Formation
DWL after
completion
(mbgl)
Depth of
Aquifer
(mbgl)
Discharge (lps)
mbgl mbgl
(1) (2) (3) (4) (5) (6) (7) (8) (9) (10) (11) (12) (13)
1 Patnagarh Patnagarh 83° 08′ 05″ 26/02/99 32.65 13.1 0.6 125/115 Granite-Gneiss 3.35 31-65 0.8
Block Office Compund 20° 12′ 15″
2 Kantabhangi Tureikela 82° 55′ 40″ 26/02/99 31.65 24.4 0.6 do Granite-Gneiss 7 30-
31.85 0.8
Police Station Colony 20° 28′ 45″
3 Tiltlagarh Titlagarh 83° 09′ 23″ 27/02/99 20 11.1 0.6 do Granite-Gneiss 6.75 27-28.5
0.8
Irrigation Colony Compound
20° 17′ 18″
4 Bolangir - I Bolangir 83° 28′ 58″ 14/3/99 30.5 13.4 0.6 do Granite-Gneiss 5 29-30 0.1
Block Office Compund 20° 41′ 55″
District: BOUDH
SI. No.
Location Block Coordinate
s
Date of Completio
n
Depth of
drilling (mbgl)
Length of Casing Date of casing (mm)
Formation
DWL after
completion
(mbgl)
Depth of
Aquifer
(mbgl)
Discharge (lps)
mbgl mbgl
(1) (2) (3) (4) (5) (6) (7) (8) (9) (10) (11) (12) (13)
1 PurnaKatak Charichakk 84° 25′ 38″ 16/5/99 33.55 17.2 0.6 125/115 Granite-Gneiss 5.13 18.6 0.41
High School Compund 20° 37′ 32″

127
District: CUTTACK
SI. No.
Location Block Coordinate
s
Date of Completio
n
Depth of
drilling
(mbgl)
Length of Casing Dia of casing (mm)
Formation
DWL after
completion
(mbgl)
Depth of
Aquifer
(mbgl)
Discharge (lps)
mbgl mbgl
(1) (2) (3) (4) (5) (6) (7) (8) (9) (10) (11) (12) (13)
1 Badamba Badamba 85° 20′ 35″ 27/05/98 39 9.5 0.5 125/115 Granite-Gneiss 9.1 37-38 0.3
Irrigation Section-office Comp.
20° 22′ 30″
2 Athagarh Athagarh 85° 38′ 12″ 28/7/98 39 33 0.8 do Granite-Gneiss 5.1 36-37 0.3
Irrigation S.D.O. Comp. 20° 31′ 06″
3 Tigiria / Panchogaon Tigiria 85° 31′ 15″ 28/7/98 30 16.1 0.6 do Granite-Gneiss 1.5 27-28 1.5
Block Office Compound 20° 27′ 54″
4 Narasinghpur Narasinghpur
85° 04′ 45″ 29/7/98 30 8.9 0.6 do Granite-Gneiss 3.2 27-28 3
Block Colony Compound 20° 27′ 25″
District: DEOGARH
SI. No.
Location Block Coordinate
s
Date of Completio
n
Depth of
drilling
(mbgl)
Length of Casing Date of casing (mm)
Formation
DWL after
completion
(mbgl)
Depth of
Aquifer
(mbgl)
Discharge (lps)
mbgl mbgl
(1) (2) (3) (4) (5) (6) (7) (8) (9) (10) (11) (12) (13)
1 Reamal Reamal 84° 34′ 27″ 23/4/99 30.5 14.29 0.5 125/115 Granite-Gneiss 3.32 16.5 1
High School Compound 21° 21′ 30″
2 Barkot Barkot 84° 59′ 54″ 25/4/99 33.55 19 0.6 do Granite-Gneiss 6.5 26 0.25
21° 32′ 30″

128
District: DHENKANAL
SI. No.
Location Block Coordinate
s
Date of Completio
n
Depth of
drilling
(mbgl)
Length of Casing Dia of casing (mm)
Formation
DWL after
completion
(mbgl)
Depth of
Aquifer
(mbgl)
Discharge (lps)
mbgl mbgl
(1) (2) (3) (4) (5) (6) (7) (8) (9) (10) (11) (12) (13)
1 Dhenkanal Dhenkanal 85° 36′ 10″ 14/7/98 33 20.85 0.65 125/115 Khodalite 1.8 30-31 1.5
Block Office Compound 20° 38′ 20″
2 Gondia Gondia 85° 48′ 06″ 15/7/98 36 17.35 0.65 do Granite-Gneiss 5.55 33-34 0.2
Block Office Compound 20° 45′ 50″
3 Hindol Hindol 85° 11′ 48″ 16/7/98 33 19.35 0.8 do Khodalite 3.8 32-33 0.2
Block Office Compound 20° 30′ 28″
4 Parjang Parjang 85° 01′ 50″ 27/8/98 36 21.4 0.6 do Granite-Gneiss 4.9
22-22.5, 34-34.5
1.5
Block Colony Compound 20° 52′ 45″
District: GAJAPATI
SI. No.
Location Block Coordinate
s
Date of Completio
n
Depth of
drilling
(mbgl)
Length of Casing Dia of casing (mm)
Formation
DWL after
completion
(mbgl)
Depth of
Aquifer
(mbgl)
Discharge (lps)
mbgl mbgl
(1) (2) (3) (4) (5) (6) (7) (8) (9) (10) (11) (12) (13)
1 Chandragiri Mohana 84° 17′ 17″ 08/06/1999 33 19.4 0.6 125/115 Granite-Gneiss 5.7 32-33 0.3
R.I Office Compound 19° 18′ 42″
2 Badapada Nuagarh 84° 05′ 34″ 08/08/1999 42 32.1 0.6 do Granite-Gneiss 4.1 41-42 0.5
High School Compound 19° 03′ 55″
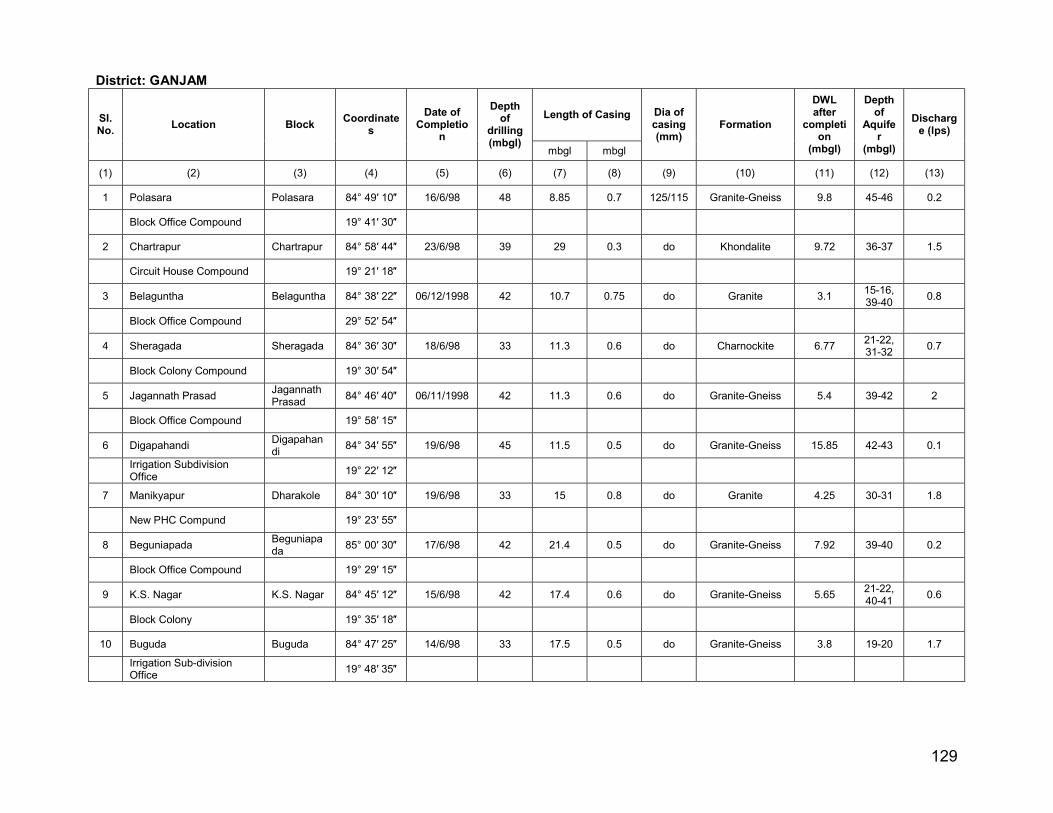
129
District: GANJAM
SI. No.
Location Block Coordinate
s
Date of Completio
n
Depth of
drilling (mbgl)
Length of Casing Dia of casing (mm)
Formation
DWL after
completion
(mbgl)
Depth of
Aquifer
(mbgl)
Discharge (lps)
mbgl mbgl
(1) (2) (3) (4) (5) (6) (7) (8) (9) (10) (11) (12) (13)
1 Polasara Polasara 84° 49′ 10″ 16/6/98 48 8.85 0.7 125/115 Granite-Gneiss 9.8 45-46 0.2
Block Office Compound 19° 41′ 30″
2 Chartrapur Chartrapur 84° 58′ 44″ 23/6/98 39 29 0.3 do Khondalite 9.72 36-37 1.5
Circuit House Compound 19° 21′ 18″
3 Belaguntha Belaguntha 84° 38′ 22″ 06/12/1998 42 10.7 0.75 do Granite 3.1 15-16, 39-40
0.8
Block Office Compound 29° 52′ 54″
4 Sheragada Sheragada 84° 36′ 30″ 18/6/98 33 11.3 0.6 do Charnockite 6.77 21-22, 31-32
0.7
Block Colony Compound 19° 30′ 54″
5 Jagannath Prasad Jagannath Prasad
84° 46′ 40″ 06/11/1998 42 11.3 0.6 do Granite-Gneiss 5.4 39-42 2
Block Office Compound 19° 58′ 15″
6 Digapahandi Digapahandi
84° 34′ 55″ 19/6/98 45 11.5 0.5 do Granite-Gneiss 15.85 42-43 0.1
Irrigation Subdivision Office
19° 22′ 12″
7 Manikyapur Dharakole 84° 30′ 10″ 19/6/98 33 15 0.8 do Granite 4.25 30-31 1.8
New PHC Compund 19° 23′ 55″
8 Beguniapada Beguniapada
85° 00′ 30″ 17/6/98 42 21.4 0.5 do Granite-Gneiss 7.92 39-40 0.2
Block Office Compound 19° 29′ 15″
9 K.S. Nagar K.S. Nagar 84° 45′ 12″ 15/6/98 42 17.4 0.6 do Granite-Gneiss 5.65 21-22, 40-41
0.6
Block Colony 19° 35′ 18″
10 Buguda Buguda 84° 47′ 25″ 14/6/98 33 17.5 0.5 do Granite-Gneiss 3.8 19-20 1.7
Irrigation Sub-division Office
19° 48′ 35″
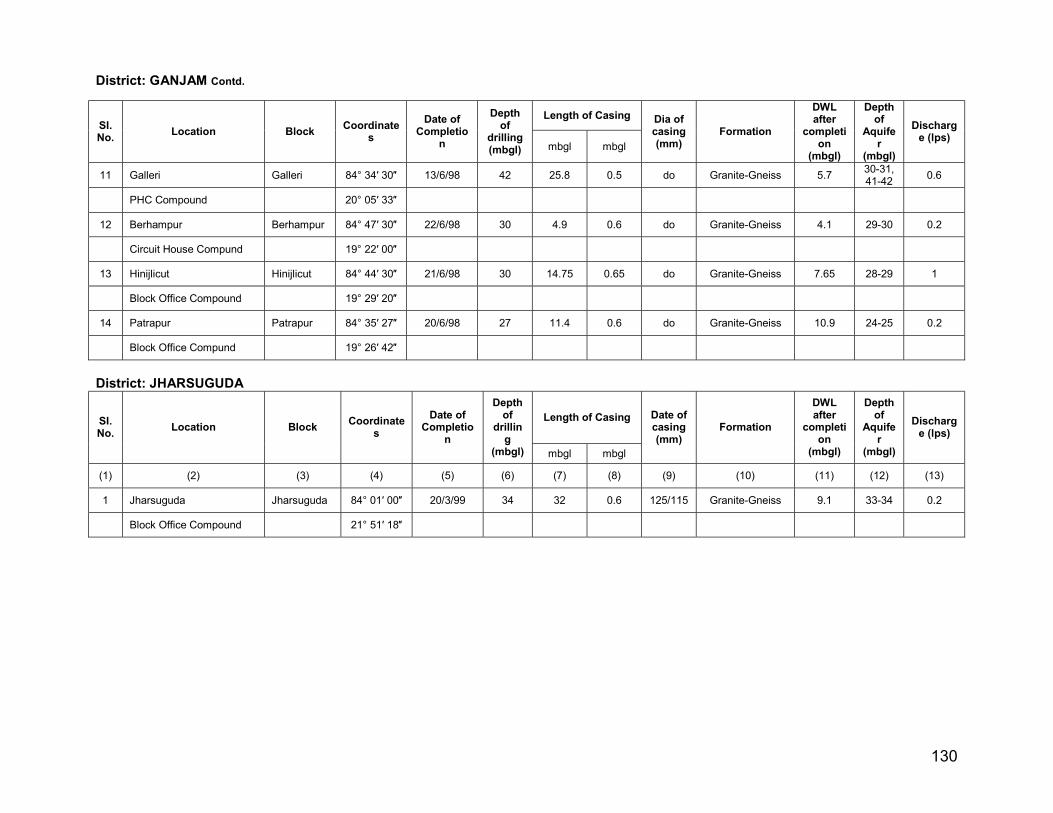
130
District: GANJAM Contd.
SI. No.
Location Block Coordinate
s
Date of Completio
n
Depth of
drilling (mbgl)
Length of Casing Dia of casing (mm)
Formation
DWL after
completion
(mbgl)
Depth of
Aquifer
(mbgl)
Discharge (lps)
mbgl mbgl
11 Galleri Galleri 84° 34′ 30″ 13/6/98 42 25.8 0.5 do Granite-Gneiss 5.7 30-31, 41-42
0.6
PHC Compound 20° 05′ 33″
12 Berhampur Berhampur 84° 47′ 30″ 22/6/98 30 4.9 0.6 do Granite-Gneiss 4.1 29-30 0.2
Circuit House Compund 19° 22′ 00″
13 Hinijlicut Hinijlicut 84° 44′ 30″ 21/6/98 30 14.75 0.65 do Granite-Gneiss 7.65 28-29 1
Block Office Compound 19° 29′ 20″
14 Patrapur Patrapur 84° 35′ 27″ 20/6/98 27 11.4 0.6 do Granite-Gneiss 10.9 24-25 0.2
Block Office Compund 19° 26′ 42″
District: JHARSUGUDA
SI. No.
Location Block Coordinate
s
Date of Completio
n
Depth of
drilling
(mbgl)
Length of Casing Date of casing (mm)
Formation
DWL after
completion
(mbgl)
Depth of
Aquifer
(mbgl)
Discharge (lps)
mbgl mbgl
(1) (2) (3) (4) (5) (6) (7) (8) (9) (10) (11) (12) (13)
1 Jharsuguda Jharsuguda 84° 01′ 00″ 20/3/99 34 32 0.6 125/115 Granite-Gneiss 9.1 33-34 0.2
Block Office Compound 21° 51′ 18″

131
District: KORAPUT
SI. No.
Location Block Coordinate
s
Date of Completio
n
Depth of
drilling
(mbgl)
Length of Casing Dia of casing (mm)
Formation
DWL after
completion
(mbgl)
Depth of
Aquifer
(mbgl)
Discharge (lps)
mbgl mbgl
(1) (2) (3) (4) (5) (6) (7) (8) (9) (10) (11) (12) (13)
1 Jeypore Jeypore 82° 34′ 53″ 20/7/99 39 22.95 0.6 125/115 Granite-Gneiss 7 38-39 0.5
Block Colony 18° 51′ 40″
2 Laxmipur Laxmipur 83° 06′ 58″ 24/7/99 49 24.8 0.6 do Granite-Gneiss 13.8 48-49 0.1
Block Colony 18° 59′ 31″
District: MALKANGIRI
SI. No.
Location Block Coordinate
s
Date of Completio
n
Depth of
drilling
(mbgl)
Length of Casing Dia of casing (mm)
Formation
DWL after
completion
(mbgl)
Depth of
Aquifer
(mbgl)
Discharge (lps)
mbgl mbgl
(1) (2) (3) (4) (5) (6) (7) (8) (9) (10) (11) (12) (13)
1 Maithili Maithli 82° 12′ 34″ 15/7/98 48 13.4 0.6 125/115 Granite-Gneiss 10.5 48-49 0.1
Block Colony 18° 33′ 16″
2 Pandripani Malkangiri 82° 07′ 20″ 16/7/98 48 31.75 0.6 do Granite-Gneiss 10.37 47-48 0.1
R.I Office Compound 18° 26′ 29″
3 Kalimela Kalimela 81° 45′ 08″ 17/7/98 42 11.8 0.6 do Granite-Gneiss 3.69 41-42 1
Block Office Compound 18° 04′ 28″
4 Balimela Korukonda 82° 06′ 43″ 18/7/99 42 19.3 0.6 do Granite-Gneiss 3.8 41-42 0.3
R.I Colony Compound 18° 15′ 32″
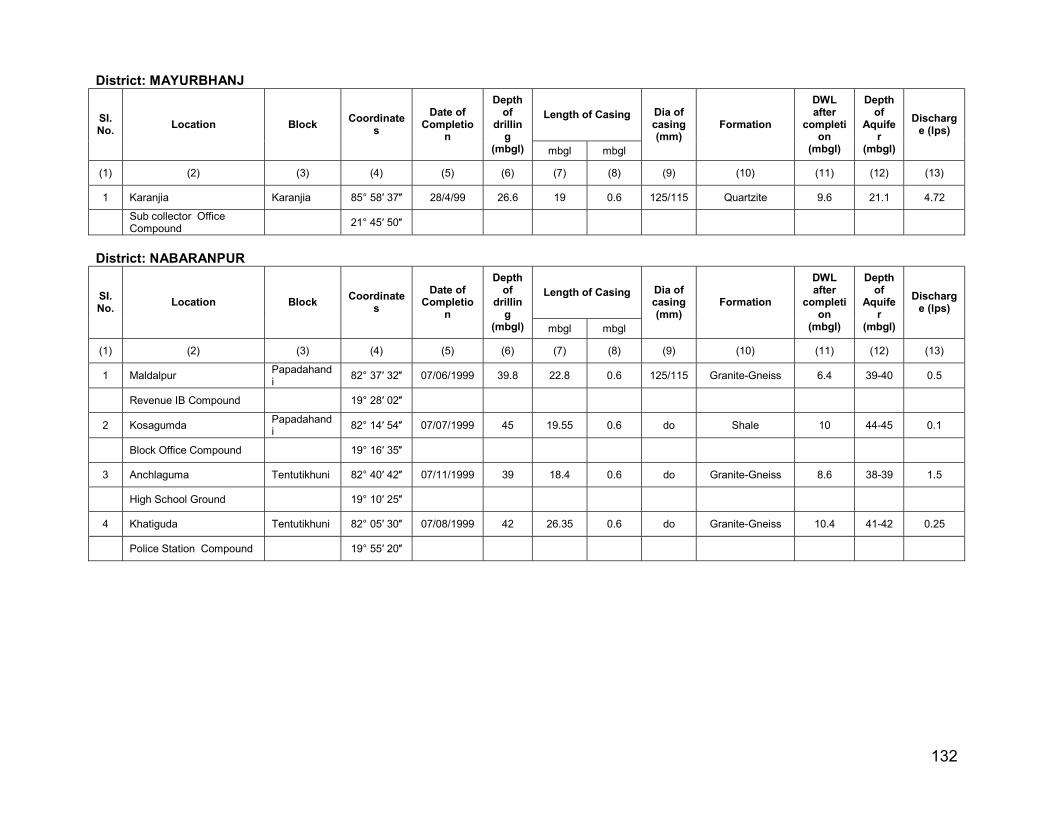
132
District: MAYURBHANJ
SI. No.
Location Block Coordinate
s
Date of Completio
n
Depth of
drilling
(mbgl)
Length of Casing Dia of casing (mm)
Formation
DWL after
completion
(mbgl)
Depth of
Aquifer
(mbgl)
Discharge (lps)
mbgl mbgl
(1) (2) (3) (4) (5) (6) (7) (8) (9) (10) (11) (12) (13)
1 Karanjia Karanjia 85° 58′ 37″ 28/4/99 26.6 19 0.6 125/115 Quartzite 9.6 21.1 4.72
Sub collector Office Compound
21° 45′ 50″
District: NABARANPUR
SI. No.
Location Block Coordinate
s
Date of Completio
n
Depth of
drilling
(mbgl)
Length of Casing Dia of casing (mm)
Formation
DWL after
completion
(mbgl)
Depth of
Aquifer
(mbgl)
Discharge (lps)
mbgl mbgl
(1) (2) (3) (4) (5) (6) (7) (8) (9) (10) (11) (12) (13)
1 Maldalpur Papadahandi
82° 37′ 32″ 07/06/1999 39.8 22.8 0.6 125/115 Granite-Gneiss 6.4 39-40 0.5
Revenue IB Compound 19° 28′ 02″
2 Kosagumda Papadahandi
82° 14′ 54″ 07/07/1999 45 19.55 0.6 do Shale 10 44-45 0.1
Block Office Compound 19° 16′ 35″
3 Anchlaguma Tentutikhuni 82° 40′ 42″ 07/11/1999 39 18.4 0.6 do Granite-Gneiss 8.6 38-39 1.5
High School Ground 19° 10′ 25″
4 Khatiguda Tentutikhuni 82° 05′ 30″ 07/08/1999 42 26.35 0.6 do Granite-Gneiss 10.4 41-42 0.25
Police Station Compound 19° 55′ 20″

133
District: NAYAGARH
SI. No.
Location Block Coordinate
s
Date of Completio
n
Depth of
drilling
(mbgl)
Length of Casing Dia of casing (mm)
Formation
DWL after
completion
(mbgl)
Depth of
Aquifer
(mbgl)
Discharge (lps)
mbgl mbgl
(1) (2) (3) (4) (5) (6) (7) (8) (9) (10) (11) (12) (13)
1 Nayagarh Nayagarh 85° 07′ 00″ 06/03/1998 40.5 14.9 0.1 125/115 Granite-Gneiss 3.2 5-
5.5,8-8.5
1.5
Block Office Compound 20° 08′ 00″
2 Ranapur Ranapur 85° 21′ 15″ 06/07/1998 39 27.24 0.76 do Granite 5.49 15, 37.8
0.5
IB Compound 20° 04′ 08″
3 Bhapur Bhapur 85° 17′ 40″ 06/04/1998 39 14.63 37 do Charnockite &
Granite 5.7 9, 38.5 2.5
Block Office Compound 20° 17′005″
4 Odogaon Odogaon 84° 59′ 00″ 06/06/1998 39 24 0 do Charnockite 9 24, 38.5
3.2
Block Office Compound 20° 01′ 18″
5 Nuagaon Nuagoan 84° 58′ 22″ 06/05/1998 42 22.75 0.6 Charnockite &
Granite 8.75
38.5, 41.5
0.5
Block Office Compound 20° 15′ 08″
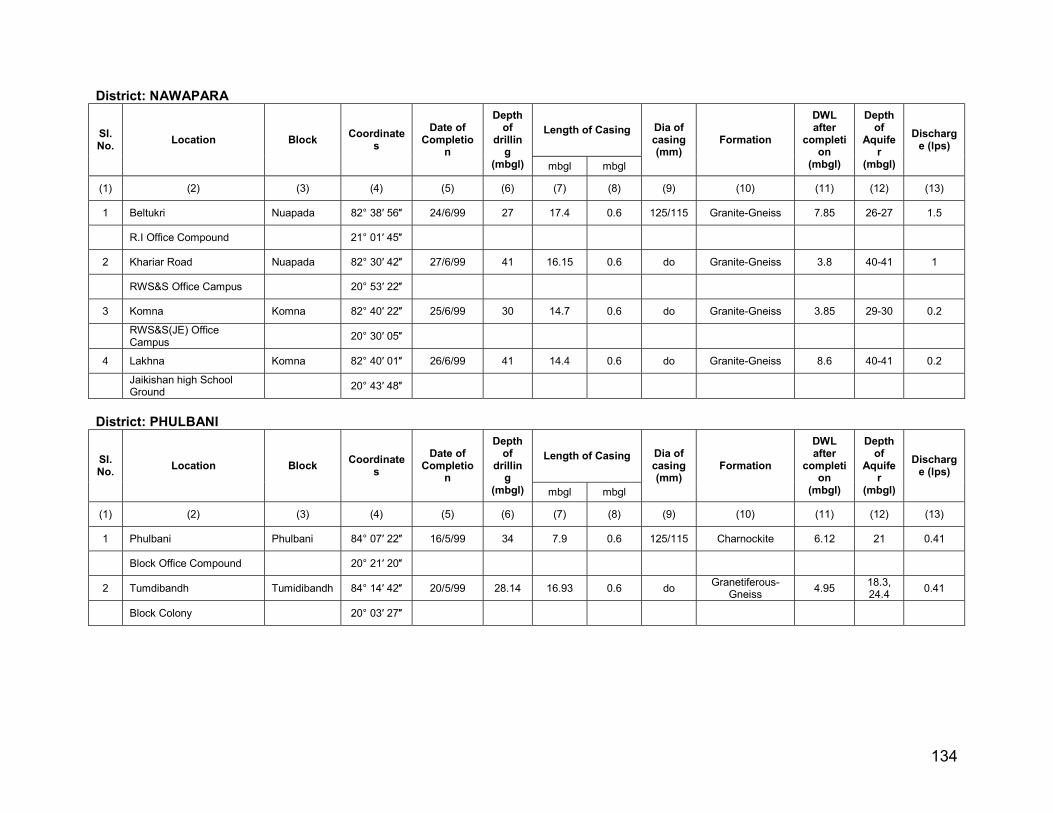
134
District: NAWAPARA
SI. No.
Location Block Coordinate
s
Date of Completio
n
Depth of
drilling
(mbgl)
Length of Casing Dia of casing (mm)
Formation
DWL after
completion
(mbgl)
Depth of
Aquifer
(mbgl)
Discharge (lps)
mbgl mbgl
(1) (2) (3) (4) (5) (6) (7) (8) (9) (10) (11) (12) (13)
1 Beltukri Nuapada 82° 38′ 56″ 24/6/99 27 17.4 0.6 125/115 Granite-Gneiss 7.85 26-27 1.5
R.I Office Compound 21° 01′ 45″
2 Khariar Road Nuapada 82° 30′ 42″ 27/6/99 41 16.15 0.6 do Granite-Gneiss 3.8 40-41 1
RWS&S Office Campus 20° 53′ 22″
3 Komna Komna 82° 40′ 22″ 25/6/99 30 14.7 0.6 do Granite-Gneiss 3.85 29-30 0.2
RWS&S(JE) Office Campus
20° 30′ 05″
4 Lakhna Komna 82° 40′ 01″ 26/6/99 41 14.4 0.6 do Granite-Gneiss 8.6 40-41 0.2
Jaikishan high School Ground
20° 43′ 48″
District: PHULBANI
SI. No.
Location Block Coordinate
s
Date of Completio
n
Depth of
drilling
(mbgl)
Length of Casing Dia of casing (mm)
Formation
DWL after
completion
(mbgl)
Depth of
Aquifer
(mbgl)
Discharge (lps)
mbgl mbgl
(1) (2) (3) (4) (5) (6) (7) (8) (9) (10) (11) (12) (13)
1 Phulbani Phulbani 84° 07′ 22″ 16/5/99 34 7.9 0.6 125/115 Charnockite 6.12 21 0.41
Block Office Compound 20° 21′ 20″
2 Tumdibandh Tumidibandh 84° 14′ 42″ 20/5/99 28.14 16.93 0.6 do Granetiferous-
Gneiss 4.95
18.3, 24.4
0.41
Block Colony 20° 03′ 27″

135
District: RAYAGADA
SI. No.
Location Block Coordinate
s
Date of Completio
n
Depth of
drilling
(mbgl)
Length of Casing Dia of casing (mm)
Formation
DWL after
completion
(mbgl)
Depth of
Aquifer
(mbgl)
Discharge (lps)
mbgl mbgl
(1) (2) (3) (4) (5) (6) (7) (8) (9) (10) (11) (12) (13)
1 Rayagada Rayagada 83° 24′ 00″ 27/7/99 48 45.2 0.6 125/115 River Alluvium 16 47-48 1
R.I Office Compound 19° 10′ 00″
2 Muniguda Munigada 83° 29′ 35″ 28/7/99 30 30.55 0.6 do Granite-Gneiss 8.6 49-50 0.2
Block Colony 19° 37′ 30″
3 Therubalti Kolnara 83° 26′ 28″ 30/7/99 50 29.7 0.6 do Alluvium 5 29-30 0.5
Police Out Post Compound
19° 19′ 40″
4 Kenduguda Padampur 82° 32′ 40″ 08/03/99 41 37.4 0.6 do Alluvium 7.6 40-41 1
Police Station Compound 18° 58′ 35″
District: SAMBALPUR
SI. No.
Location Block Coordinate
s
Date of Completio
n
Depth of
drilling
(mbgl)
Length of Casing Dia of casing (mm)
Formation
DWL after
completion
(mbgl)
Depth of
Aquifer
(mbgl)
Discharge (lps)
mbgl mbgl
(1) (2) (3) (4) (5) (6) (7) (8) (9) (10) (11) (12) (13)
1 Sasan Dhankauda 84° 02′ 30″ 19/3/99 33.5 13.4 0.6 125/115 Sandstone 10.4 32-33.5
0.1
Irrigation Compound 21° 32′ 54″
2 Dhankauda Dhankauda 83° 58′ 40″ 20/3/99 30.5 17.8 0.6 do Granite-Gneiss 8.5 29-30 0.4
Block Colony 21° 28′ 20″
3 Rairakhol Dhankauda 84° 20′ 00″ 21/3/99 30.5 9.6 0.6 do Granite-Gneiss - 29-30.5
0.4
RWS&S Office Campus 21° 04′ 00″

136
District: SONEPUR
SI. No.
Location Block Coordinate
s
Date of Completio
n
Depth of
drilling
(mbgl)
Length of Casing Dia of casing (mm)
Formation
DWL after
completion
(mbgl)
Depth of
Aquifer
(mbgl)
Discharge (lps)
mbgl mbgl
(1) (2) (3) (4) (5) (6) (7) (8) (9) (10) (11) (12) (13)
1 S. Rampur Dengripalli 83° 41′ 26″ 13/5/99 33.55 17.4 0.6 125/115 Granite-Gneiss 3.4 19 0.3
Canal Colony 21° 06′ 02″
District: SUNDARGARH
SI. No.
Location Block Coordinate
s
Date of Completio
n
Depth of
drilling
(mbgl)
Length of Casing Dia of casing (mm)
Formation
DWL after
completion
(mbgl)
Depth of
Aquifer
(mbgl)
Discharge (lps)
mbgl mbgl
(1) (2) (3) (4) (5) (6) (7) (8) (9) (10) (11) (12) (13)
1 Gurundiha Gurudiha 84° 46′ 04″ 05/06/1999 34.4 18.6 0.6 125/115 Granite-Gneiss 5.72 25 1.48
Block Office Compound 21° 50′ 48″
2 Tangarpali Tangarpali 83° 58′ 22″ 05/07/1999 39.63 23.6 0.6 do Mica-Schist 6.18 24.5,
36 0.5
Block Office Compound 22° 08′ 15″
3 Birmitrapur Municipality 84° 43′ 52″ 05/06/1999 36.6 8.6 0.6 do Limestone 5.2 11.2,
34 1.48
Govt. high School Hostel Ground
22° 24′ 37″
4 Talasara Balisankara 84° 06′ 02″ 05/06/1999 46.2 8.64 0.6 do Pegmatite 15.84 42 0.2
Irrigation Colony 22° 21′ 42″
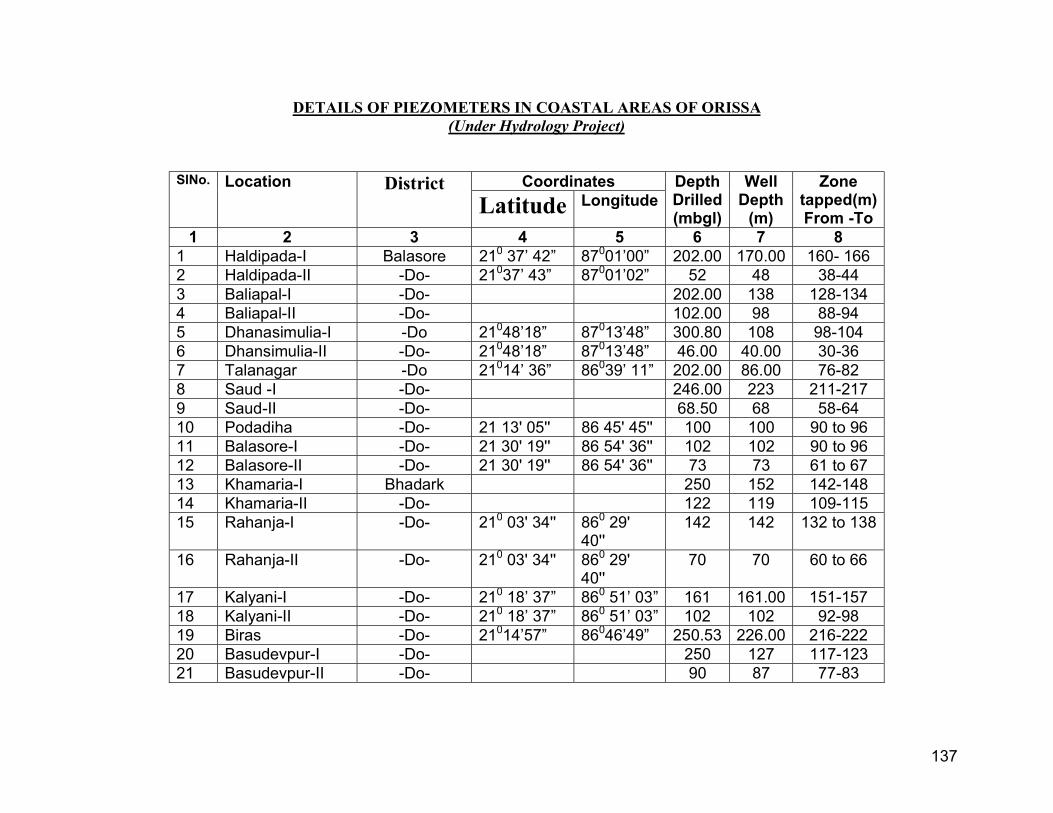
137
DETAILS OF PIEZOMETERS IN COASTAL AREAS OF ORISSA (Under Hydrology Project)
SlNo. Location District Coordinates Depth Drilled (mbgl)
Well Depth
(m)
Zone tapped(m) From -To
Latitude Longitude
1 2 3 4 5 6 7 8 1 Haldipada-I Balasore 210 37’ 42” 87001’00” 202.00 170.00 160- 166 2 Haldipada-II -Do- 21037’ 43” 87001’02” 52 48 38-44 3 Baliapal-I -Do- 202.00 138 128-134 4 Baliapal-II -Do- 102.00 98 88-94 5 Dhanasimulia-I -Do 21048’18” 87013’48” 300.80 108 98-104 6 Dhansimulia-II -Do- 21048’18” 87013’48” 46.00 40.00 30-36 7 Talanagar -Do 21014’ 36” 86039’ 11” 202.00 86.00 76-82 8 Saud -I -Do- 246.00 223 211-217 9 Saud-II -Do- 68.50 68 58-64 10 Podadiha -Do- 21 13' 05'' 86 45' 45'' 100 100 90 to 96 11 Balasore-I -Do- 21 30' 19'' 86 54' 36'' 102 102 90 to 96 12 Balasore-II -Do- 21 30' 19'' 86 54' 36'' 73 73 61 to 67 13 Khamaria-I Bhadark 250 152 142-148 14 Khamaria-II -Do- 122 119 109-115 15 Rahanja-I -Do- 210 03' 34'' 860 29'
40'' 142 142 132 to 138
16 Rahanja-II -Do- 210 03' 34'' 860 29' 40''
70 70 60 to 66
17 Kalyani-I -Do- 210 18’ 37” 860 51’ 03” 161 161.00 151-157 18 Kalyani-II -Do- 210 18’ 37” 860 51’ 03” 102 102 92-98 19 Biras -Do- 21014’57” 86046’49” 250.53 226.00 216-222 20 Basudevpur-I -Do- 250 127 117-123 21 Basudevpur-II -Do- 90 87 77-83
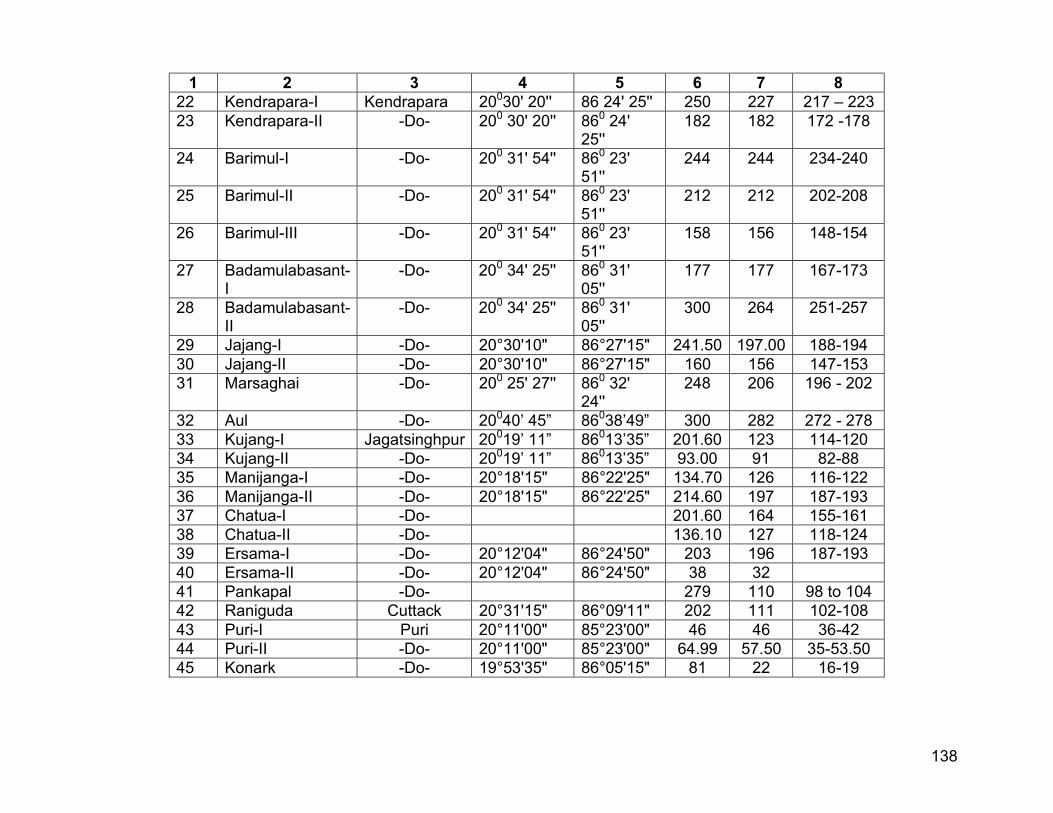
138
1 2 3 4 5 6 7 8 22 Kendrapara-I Kendrapara 20030' 20'' 86 24' 25'' 250 227 217 – 223 23 Kendrapara-II -Do- 200 30' 20'' 860 24'
25'' 182 182 172 -178
24 Barimul-I -Do- 200 31' 54'' 860 23' 51''
244 244 234-240
25 Barimul-II -Do- 200 31' 54'' 860 23' 51''
212 212 202-208
26 Barimul-III -Do- 200 31' 54'' 860 23' 51''
158 156 148-154
27 Badamulabasant-I
-Do- 200 34' 25'' 860 31' 05''
177 177 167-173
28 Badamulabasant-II
-Do- 200 34' 25'' 860 31' 05''
300 264 251-257
29 Jajang-I -Do- 20°30'10" 86°27'15" 241.50 197.00 188-194 30 Jajang-II -Do- 20°30'10" 86°27'15" 160 156 147-153 31 Marsaghai -Do- 200 25' 27'' 860 32'
24'' 248 206 196 - 202
32 Aul -Do- 20040’ 45” 86038’49” 300 282 272 - 278 33 Kujang-I Jagatsinghpur 20019’ 11” 86013’35” 201.60 123 114-120 34 Kujang-II -Do- 20019’ 11” 86013’35” 93.00 91 82-88 35 Manijanga-I -Do- 20°18'15" 86°22'25" 134.70 126 116-122 36 Manijanga-II -Do- 20°18'15" 86°22'25" 214.60 197 187-193 37 Chatua-I -Do- 201.60 164 155-161 38 Chatua-II -Do- 136.10 127 118-124 39 Ersama-I -Do- 20°12'04" 86°24'50" 203 196 187-193 40 Ersama-II -Do- 20°12'04" 86°24'50" 38 32 41 Pankapal -Do- 279 110 98 to 104 42 Raniguda Cuttack 20°31'15" 86°09'11" 202 111 102-108 43 Puri-I Puri 20°11'00" 85°23'00" 46 46 36-42 44 Puri-II -Do- 20°11'00" 85°23'00" 64.99 57.50 35-53.50 45 Konark -Do- 19°53'35" 86°05'15" 81 22 16-19
139
ANNEXURE - III
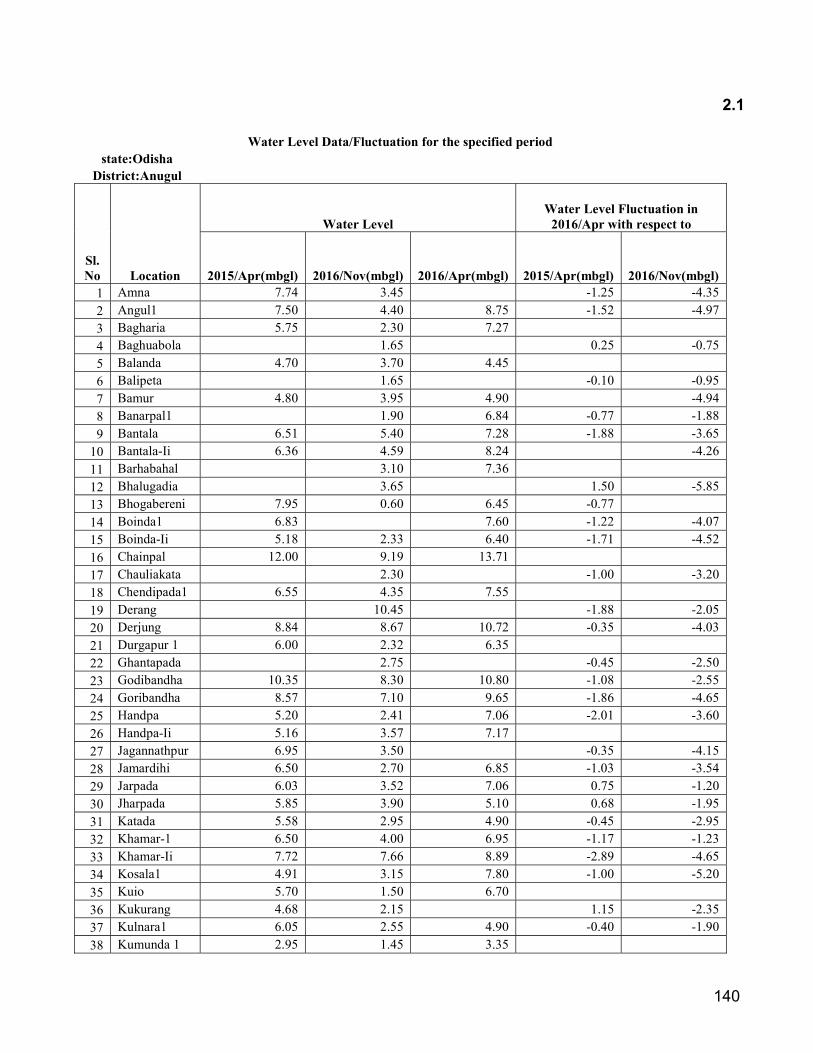
140
2.1
Water Level Data/Fluctuation for the specified period state:Odisha
District:Anugul
Sl. No Location
Water Level Water Level Fluctuation in
2016/Apr with respect to
2015/Apr(mbgl) 2016/Nov(mbgl) 2016/Apr(mbgl) 2015/Apr(mbgl) 2016/Nov(mbgl) 1 Amna 7.74 3.45 -1.25 -4.35
2 Angul1 7.50 4.40 8.75 -1.52 -4.97
3 Bagharia 5.75 2.30 7.27 4 Baghuabola 1.65 0.25 -0.75
5 Balanda 4.70 3.70 4.45 6 Balipeta 1.65 -0.10 -0.95
7 Bamur 4.80 3.95 4.90 -4.94
8 Banarpal1 1.90 6.84 -0.77 -1.88
9 Bantala 6.51 5.40 7.28 -1.88 -3.65
10 Bantala-Ii 6.36 4.59 8.24 -4.26
11 Barhabahal 3.10 7.36 12 Bhalugadia 3.65 1.50 -5.85
13 Bhogabereni 7.95 0.60 6.45 -0.77 14 Boinda1 6.83 7.60 -1.22 -4.07
15 Boinda-Ii 5.18 2.33 6.40 -1.71 -4.52
16 Chainpal 12.00 9.19 13.71 17 Chauliakata 2.30 -1.00 -3.20
18 Chendipada1 6.55 4.35 7.55 19 Derang 10.45 -1.88 -2.05
20 Derjung 8.84 8.67 10.72 -0.35 -4.03
21 Durgapur 1 6.00 2.32 6.35 22 Ghantapada 2.75 -0.45 -2.50
23 Godibandha 10.35 8.30 10.80 -1.08 -2.55
24 Goribandha 8.57 7.10 9.65 -1.86 -4.65
25 Handpa 5.20 2.41 7.06 -2.01 -3.60
26 Handpa-Ii 5.16 3.57 7.17 27 Jagannathpur 6.95 3.50 -0.35 -4.15
28 Jamardihi 6.50 2.70 6.85 -1.03 -3.54
29 Jarpada 6.03 3.52 7.06 0.75 -1.20
30 Jharpada 5.85 3.90 5.10 0.68 -1.95
31 Katada 5.58 2.95 4.90 -0.45 -2.95
32 Khamar-1 6.50 4.00 6.95 -1.17 -1.23
33 Khamar-Ii 7.72 7.66 8.89 -2.89 -4.65
34 Kosala1 4.91 3.15 7.80 -1.00 -5.20
35 Kuio 5.70 1.50 6.70 36 Kukurang 4.68 2.15 1.15 -2.35
37 Kulnara1 6.05 2.55 4.90 -0.40 -1.90
38 Kumunda 1 2.95 1.45 3.35

141
39 Luhamunda 6.10 -0.24 -6.28
40 Mahidharpur 9.44 3.40 9.68 -3.16
41 Maratira 2.19 5.35 42 Nialu 5.10 -0.11 -1.45
43 Nisa 3.89 2.55 4.00 3.40
44 Pabitranagar pz
15.35 11.95 -0.65 -3.50
45 Pallahara1 5.05 2.20 5.70 -1.25 -6.53
46 Panchmahala 9.73 4.45 10.98 -1.32 -4.66
47 Panchmahala-Ii
8.58 5.24 9.90
-0.85
48 Purnakot 6.50 7.35 0.72 -1.20
49 Samal 3.27 1.35 2.55
50 Sana Santrabandha
2.45
-9.24 -12.70
51 Seepur 9.56 6.10 18.80 -0.42 -1.20
52 Sendhogram 5.83 5.05 6.25 0.75 -3.15
53 Sipur 7.90 4.00 7.15 -0.70 -6.25
54 Srirampur 8.30 2.75 9.00 -3.24
55 Talcher1 7.75 10.99 -1.15 -1.50
56 Tentulai 3.75 3.40 4.90 -0.26 -2.20
57 Thakurgarh 1 5.74 3.80 6.00 -6.75
58 Tikarpara 2.60 9.35 59 Tikarpara-ii 5.92 3.75 -0.98 -3.55
60 Tileswar 4.87 2.30 5.85 0.93 -2.15
61 Tubey 4.15 1.07 3.22 -0.75 -3.90
62 Tulsipal 6.15 3.00 6.90 63 Ugi 10.50 8.40
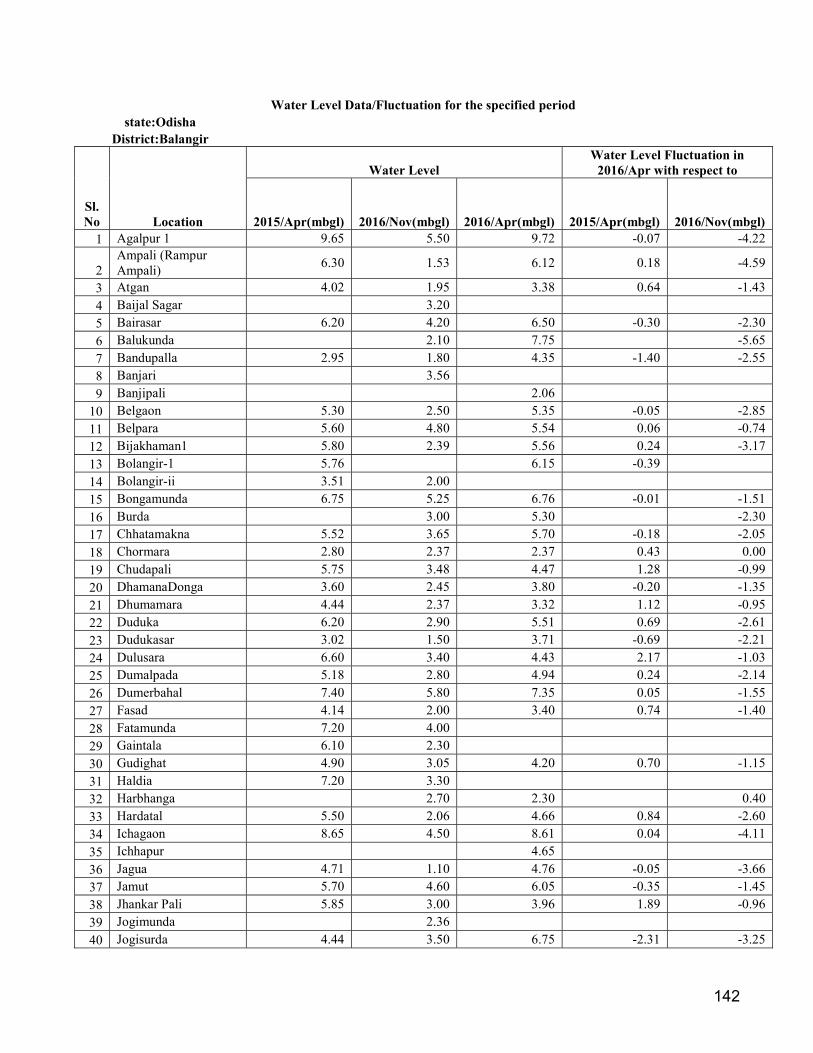
142
Water Level Data/Fluctuation for the specified period state:Odisha
District:Balangir
Sl. No Location
Water Level Water Level Fluctuation in
2016/Apr with respect to
2015/Apr(mbgl) 2016/Nov(mbgl) 2016/Apr(mbgl) 2015/Apr(mbgl) 2016/Nov(mbgl) 1 Agalpur 1 9.65 5.50 9.72 -0.07 -4.22
2 Ampali (Rampur Ampali)
6.30 1.53 6.12 0.18 -4.59
3 Atgan 4.02 1.95 3.38 0.64 -1.43
4 Baijal Sagar 3.20 5 Bairasar 6.20 4.20 6.50 -0.30 -2.30
6 Balukunda 2.10 7.75 -5.65
7 Bandupalla 2.95 1.80 4.35 -1.40 -2.55
8 Banjari 3.56 9 Banjipali 2.06
10 Belgaon 5.30 2.50 5.35 -0.05 -2.85
11 Belpara 5.60 4.80 5.54 0.06 -0.74
12 Bijakhaman1 5.80 2.39 5.56 0.24 -3.17
13 Bolangir-1 5.76 6.15 -0.39 14 Bolangir-ii 3.51 2.00 15 Bongamunda 6.75 5.25 6.76 -0.01 -1.51
16 Burda 3.00 5.30 -2.30
17 Chhatamakna 5.52 3.65 5.70 -0.18 -2.05
18 Chormara 2.80 2.37 2.37 0.43 0.00
19 Chudapali 5.75 3.48 4.47 1.28 -0.99
20 DhamanaDonga 3.60 2.45 3.80 -0.20 -1.35
21 Dhumamara 4.44 2.37 3.32 1.12 -0.95
22 Duduka 6.20 2.90 5.51 0.69 -2.61
23 Dudukasar 3.02 1.50 3.71 -0.69 -2.21
24 Dulusara 6.60 3.40 4.43 2.17 -1.03
25 Dumalpada 5.18 2.80 4.94 0.24 -2.14
26 Dumerbahal 7.40 5.80 7.35 0.05 -1.55
27 Fasad 4.14 2.00 3.40 0.74 -1.40
28 Fatamunda 7.20 4.00 29 Gaintala 6.10 2.30 30 Gudighat 4.90 3.05 4.20 0.70 -1.15
31 Haldia 7.20 3.30 32 Harbhanga 2.70 2.30 0.40
33 Hardatal 5.50 2.06 4.66 0.84 -2.60
34 Ichagaon 8.65 4.50 8.61 0.04 -4.11
35 Ichhapur 4.65 36 Jagua 4.71 1.10 4.76 -0.05 -3.66
37 Jamut 5.70 4.60 6.05 -0.35 -1.45
38 Jhankar Pali 5.85 3.00 3.96 1.89 -0.96
39 Jogimunda 2.36 40 Jogisurda 4.44 3.50 6.75 -2.31 -3.25

143
41 Jorpada 4.45 3.40 4.07 0.38 -0.67
42 Kantabanji 6.81 5.34 43 Kesaropali 5.70 4.74 0.96 44 Kholan 7.90 3.70 7.02 0.88 -3.32
45 Konda-Bohal 2.30 6.78 -4.48
46 Kurli 6.12 4.10 6.08 0.04 -1.98
47 Kurul 4.75 1.40 3.27 1.48 -1.87
48 Lathor 5.61 7.30 49 Ledarbohal 6.25 3.30 6.65 -0.40 -3.35
50 Loisinga 5.23 3.35 5.37 -0.14 -2.02
51 Madhiapali 5.30 3.92 5.22 0.08 -1.30
52 Mahagaon 8.10 53 Mandia Padar 6.31 54 Minapali 5.90 3.70 6.30 -0.40 -2.60
55 Muribahal 9.02 5.60 8.27 0.75 -2.67
56 Nekpada 5.82 2.85 3.94 1.88 -1.09
57 Nunhad 3.10 4.17 -1.07
58 Padampur 5.51 4.30 59 Patnagarh-Ii 7.95 5.00 8.23 -0.28 -3.23
60 Phulkimunda 2.98 61 Piprut 4.15 2.00 4.42 -0.27 -2.42
62 Pudapalli 4.32 1.67 3.05 1.27 -1.38
63 Randa 4.56 1.90 4.89 -0.33 -2.99
64 Rigdol 4.80 2.75 3.02 1.78 -0.27
65 Sagarpali 4.10 1.80 4.33 -0.23 -2.53
66 Saintala 1 5.70 3.80 5.17 0.53 -1.37
67 Salandi 5.05 2.65 5.87 -0.82 -3.22
68 Salebhata 5.16 3.80 4.27 0.89 -0.47
69 Sarmohan-I 5.41 2.40 4.35 1.06 -1.95
70 Sikachhida 1 3.90 2.00 3.96 -0.06 -1.96
71 Sindhikela (new) 5.60 3.90 5.57 0.03 -1.67
72 Sindhikela1 5.02 2.82 5.32 -0.30 -2.50
73 Sinkhaman 3.50 3.62 -0.12 74 Tarasingi 1.70 5.33 -3.63
75 Tikrapada 4.65 2.45 4.57 0.08 -2.12
76 Titisilet 7.60 5.30 8.14 -0.54 -2.84
77 Titlagarh (new) 5.02 3.76 1.26 78 Uchchabahal 1.75 2.10 0.73 1.02 1.37
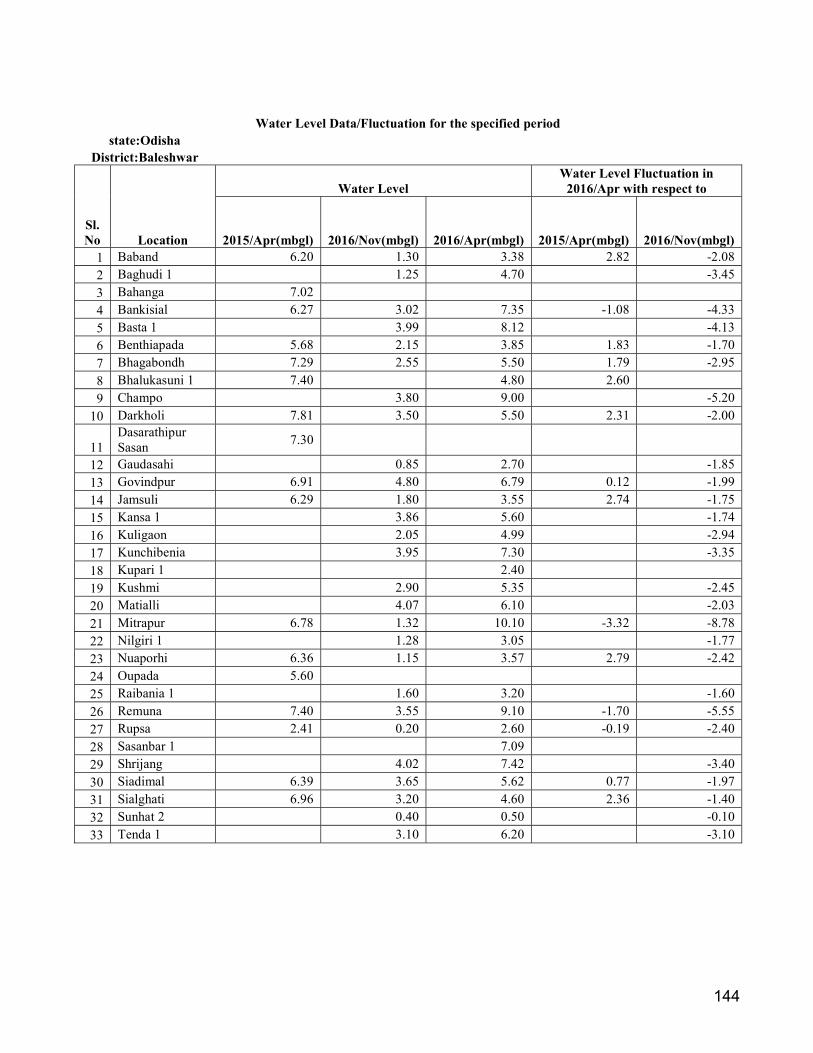
144
Water Level Data/Fluctuation for the specified period
state:Odisha District:Baleshwar
Sl. No Location
Water Level Water Level Fluctuation in
2016/Apr with respect to
2015/Apr(mbgl) 2016/Nov(mbgl) 2016/Apr(mbgl) 2015/Apr(mbgl) 2016/Nov(mbgl) 1 Baband 6.20 1.30 3.38 2.82 -2.08
2 Baghudi 1 1.25 4.70 -3.45
3 Bahanga 7.02 4 Bankisial 6.27 3.02 7.35 -1.08 -4.33
5 Basta 1 3.99 8.12 -4.13
6 Benthiapada 5.68 2.15 3.85 1.83 -1.70
7 Bhagabondh 7.29 2.55 5.50 1.79 -2.95
8 Bhalukasuni 1 7.40 4.80 2.60 9 Champo 3.80 9.00 -5.20
10 Darkholi 7.81 3.50 5.50 2.31 -2.00
11 Dasarathipur Sasan
7.30
12 Gaudasahi 0.85 2.70 -1.85
13 Govindpur 6.91 4.80 6.79 0.12 -1.99
14 Jamsuli 6.29 1.80 3.55 2.74 -1.75
15 Kansa 1 3.86 5.60 -1.74
16 Kuligaon 2.05 4.99 -2.94
17 Kunchibenia 3.95 7.30 -3.35
18 Kupari 1 2.40 19 Kushmi 2.90 5.35 -2.45
20 Matialli 4.07 6.10 -2.03
21 Mitrapur 6.78 1.32 10.10 -3.32 -8.78
22 Nilgiri 1 1.28 3.05 -1.77
23 Nuaporhi 6.36 1.15 3.57 2.79 -2.42
24 Oupada 5.60 25 Raibania 1 1.60 3.20 -1.60
26 Remuna 7.40 3.55 9.10 -1.70 -5.55
27 Rupsa 2.41 0.20 2.60 -0.19 -2.40
28 Sasanbar 1 7.09 29 Shrijang 4.02 7.42 -3.40
30 Siadimal 6.39 3.65 5.62 0.77 -1.97
31 Sialghati 6.96 3.20 4.60 2.36 -1.40
32 Sunhat 2 0.40 0.50 -0.10
33 Tenda 1 3.10 6.20 -3.10
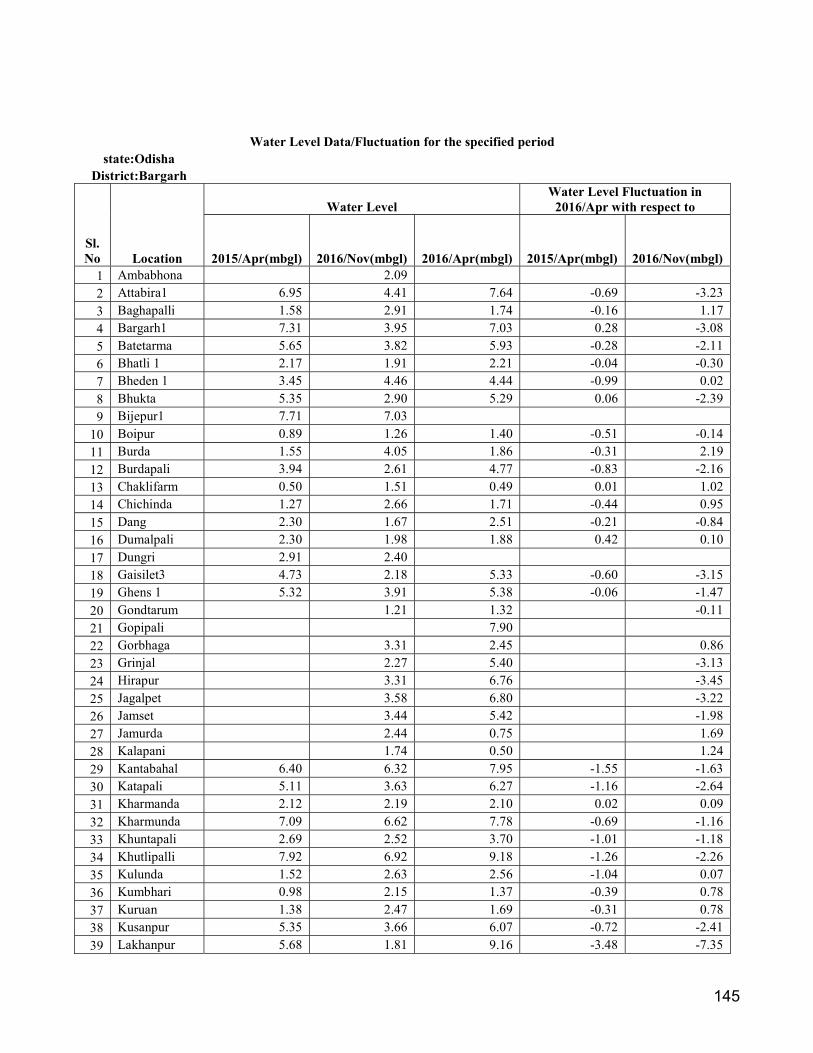
145
Water Level Data/Fluctuation for the specified period state:Odisha
District:Bargarh
Sl. No Location
Water Level Water Level Fluctuation in
2016/Apr with respect to
2015/Apr(mbgl) 2016/Nov(mbgl) 2016/Apr(mbgl) 2015/Apr(mbgl) 2016/Nov(mbgl) 1 Ambabhona 2.09 2 Attabira1 6.95 4.41 7.64 -0.69 -3.23
3 Baghapalli 1.58 2.91 1.74 -0.16 1.17
4 Bargarh1 7.31 3.95 7.03 0.28 -3.08
5 Batetarma 5.65 3.82 5.93 -0.28 -2.11
6 Bhatli 1 2.17 1.91 2.21 -0.04 -0.30
7 Bheden 1 3.45 4.46 4.44 -0.99 0.02
8 Bhukta 5.35 2.90 5.29 0.06 -2.39
9 Bijepur1 7.71 7.03 10 Boipur 0.89 1.26 1.40 -0.51 -0.14
11 Burda 1.55 4.05 1.86 -0.31 2.19
12 Burdapali 3.94 2.61 4.77 -0.83 -2.16
13 Chaklifarm 0.50 1.51 0.49 0.01 1.02
14 Chichinda 1.27 2.66 1.71 -0.44 0.95
15 Dang 2.30 1.67 2.51 -0.21 -0.84
16 Dumalpali 2.30 1.98 1.88 0.42 0.10
17 Dungri 2.91 2.40 18 Gaisilet3 4.73 2.18 5.33 -0.60 -3.15
19 Ghens 1 5.32 3.91 5.38 -0.06 -1.47
20 Gondtarum 1.21 1.32 -0.11
21 Gopipali 7.90 22 Gorbhaga 3.31 2.45 0.86
23 Grinjal 2.27 5.40 -3.13
24 Hirapur 3.31 6.76 -3.45
25 Jagalpet 3.58 6.80 -3.22
26 Jamset 3.44 5.42 -1.98
27 Jamurda 2.44 0.75 1.69
28 Kalapani 1.74 0.50 1.24
29 Kantabahal 6.40 6.32 7.95 -1.55 -1.63
30 Katapali 5.11 3.63 6.27 -1.16 -2.64
31 Kharmanda 2.12 2.19 2.10 0.02 0.09
32 Kharmunda 7.09 6.62 7.78 -0.69 -1.16
33 Khuntapali 2.69 2.52 3.70 -1.01 -1.18
34 Khutlipalli 7.92 6.92 9.18 -1.26 -2.26
35 Kulunda 1.52 2.63 2.56 -1.04 0.07
36 Kumbhari 0.98 2.15 1.37 -0.39 0.78
37 Kuruan 1.38 2.47 1.69 -0.31 0.78
38 Kusanpur 5.35 3.66 6.07 -0.72 -2.41
39 Lakhanpur 5.68 1.81 9.16 -3.48 -7.35
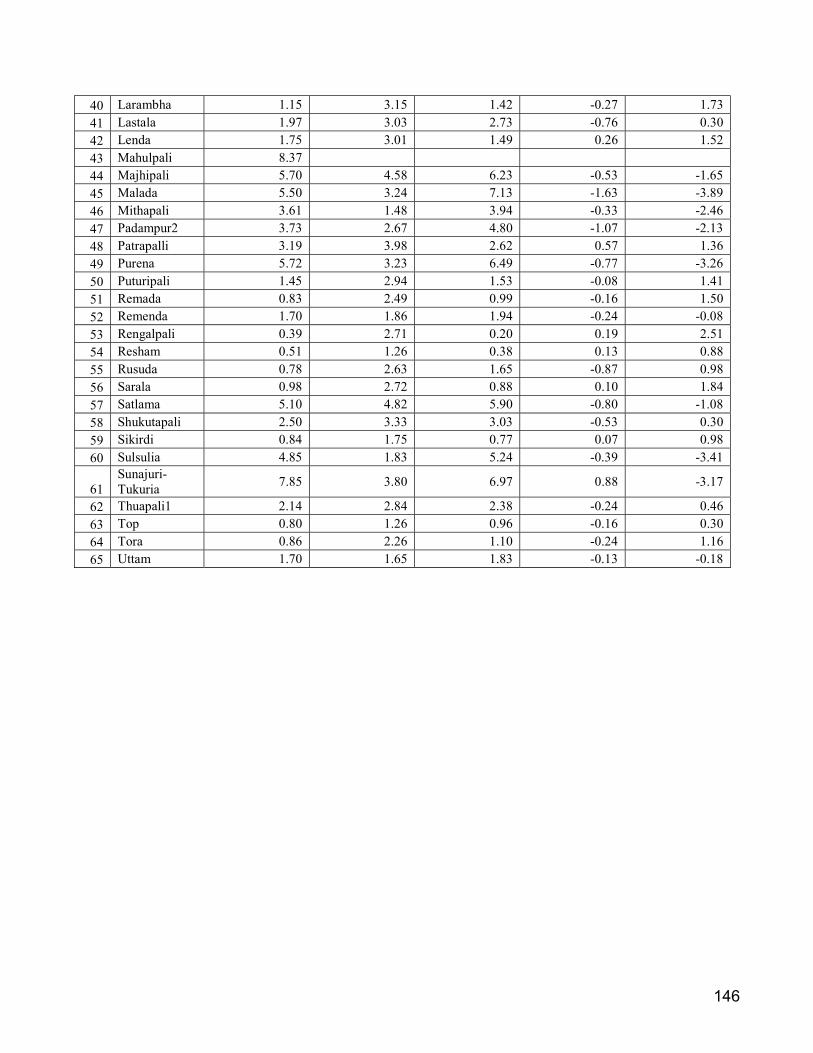
146
40 Larambha 1.15 3.15 1.42 -0.27 1.73
41 Lastala 1.97 3.03 2.73 -0.76 0.30
42 Lenda 1.75 3.01 1.49 0.26 1.52
43 Mahulpali 8.37 44 Majhipali 5.70 4.58 6.23 -0.53 -1.65
45 Malada 5.50 3.24 7.13 -1.63 -3.89
46 Mithapali 3.61 1.48 3.94 -0.33 -2.46
47 Padampur2 3.73 2.67 4.80 -1.07 -2.13
48 Patrapalli 3.19 3.98 2.62 0.57 1.36
49 Purena 5.72 3.23 6.49 -0.77 -3.26
50 Puturipali 1.45 2.94 1.53 -0.08 1.41
51 Remada 0.83 2.49 0.99 -0.16 1.50
52 Remenda 1.70 1.86 1.94 -0.24 -0.08
53 Rengalpali 0.39 2.71 0.20 0.19 2.51
54 Resham 0.51 1.26 0.38 0.13 0.88
55 Rusuda 0.78 2.63 1.65 -0.87 0.98
56 Sarala 0.98 2.72 0.88 0.10 1.84
57 Satlama 5.10 4.82 5.90 -0.80 -1.08
58 Shukutapali 2.50 3.33 3.03 -0.53 0.30
59 Sikirdi 0.84 1.75 0.77 0.07 0.98
60 Sulsulia 4.85 1.83 5.24 -0.39 -3.41
61 Sunajuri-Tukuria
7.85 3.80 6.97 0.88 -3.17
62 Thuapali1 2.14 2.84 2.38 -0.24 0.46
63 Top 0.80 1.26 0.96 -0.16 0.30
64 Tora 0.86 2.26 1.10 -0.24 1.16
65 Uttam 1.70 1.65 1.83 -0.13 -0.18
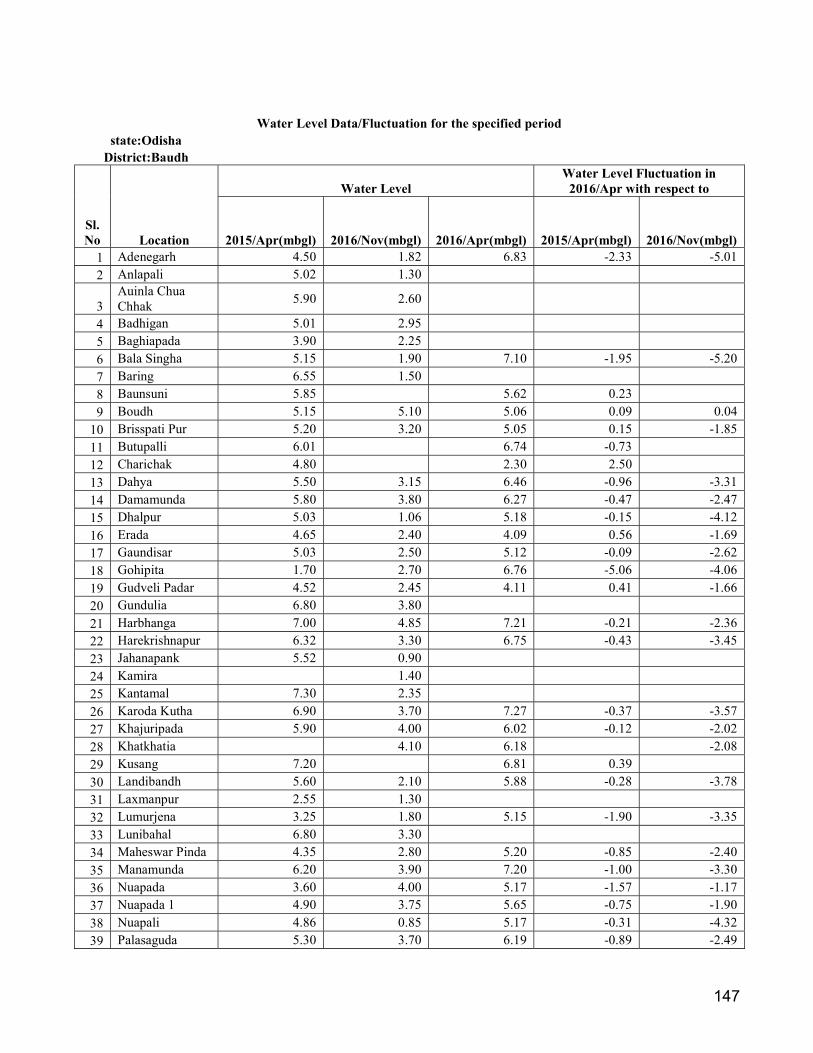
147
Water Level Data/Fluctuation for the specified period
state:Odisha District:Baudh
Sl. No Location
Water Level Water Level Fluctuation in
2016/Apr with respect to
2015/Apr(mbgl) 2016/Nov(mbgl) 2016/Apr(mbgl) 2015/Apr(mbgl) 2016/Nov(mbgl) 1 Adenegarh 4.50 1.82 6.83 -2.33 -5.01
2 Anlapali 5.02 1.30
3 Auinla Chua Chhak
5.90 2.60
4 Badhigan 5.01 2.95 5 Baghiapada 3.90 2.25 6 Bala Singha 5.15 1.90 7.10 -1.95 -5.20
7 Baring 6.55 1.50 8 Baunsuni 5.85 5.62 0.23 9 Boudh 5.15 5.10 5.06 0.09 0.04
10 Brisspati Pur 5.20 3.20 5.05 0.15 -1.85
11 Butupalli 6.01 6.74 -0.73 12 Charichak 4.80 2.30 2.50 13 Dahya 5.50 3.15 6.46 -0.96 -3.31
14 Damamunda 5.80 3.80 6.27 -0.47 -2.47
15 Dhalpur 5.03 1.06 5.18 -0.15 -4.12
16 Erada 4.65 2.40 4.09 0.56 -1.69
17 Gaundisar 5.03 2.50 5.12 -0.09 -2.62
18 Gohipita 1.70 2.70 6.76 -5.06 -4.06
19 Gudveli Padar 4.52 2.45 4.11 0.41 -1.66
20 Gundulia 6.80 3.80 21 Harbhanga 7.00 4.85 7.21 -0.21 -2.36
22 Harekrishnapur 6.32 3.30 6.75 -0.43 -3.45
23 Jahanapank 5.52 0.90 24 Kamira 1.40 25 Kantamal 7.30 2.35 26 Karoda Kutha 6.90 3.70 7.27 -0.37 -3.57
27 Khajuripada 5.90 4.00 6.02 -0.12 -2.02
28 Khatkhatia 4.10 6.18 -2.08
29 Kusang 7.20 6.81 0.39 30 Landibandh 5.60 2.10 5.88 -0.28 -3.78
31 Laxmanpur 2.55 1.30 32 Lumurjena 3.25 1.80 5.15 -1.90 -3.35
33 Lunibahal 6.80 3.30 34 Maheswar Pinda 4.35 2.80 5.20 -0.85 -2.40
35 Manamunda 6.20 3.90 7.20 -1.00 -3.30
36 Nuapada 3.60 4.00 5.17 -1.57 -1.17
37 Nuapada 1 4.90 3.75 5.65 -0.75 -1.90
38 Nuapali 4.86 0.85 5.17 -0.31 -4.32
39 Palasaguda 5.30 3.70 6.19 -0.89 -2.49
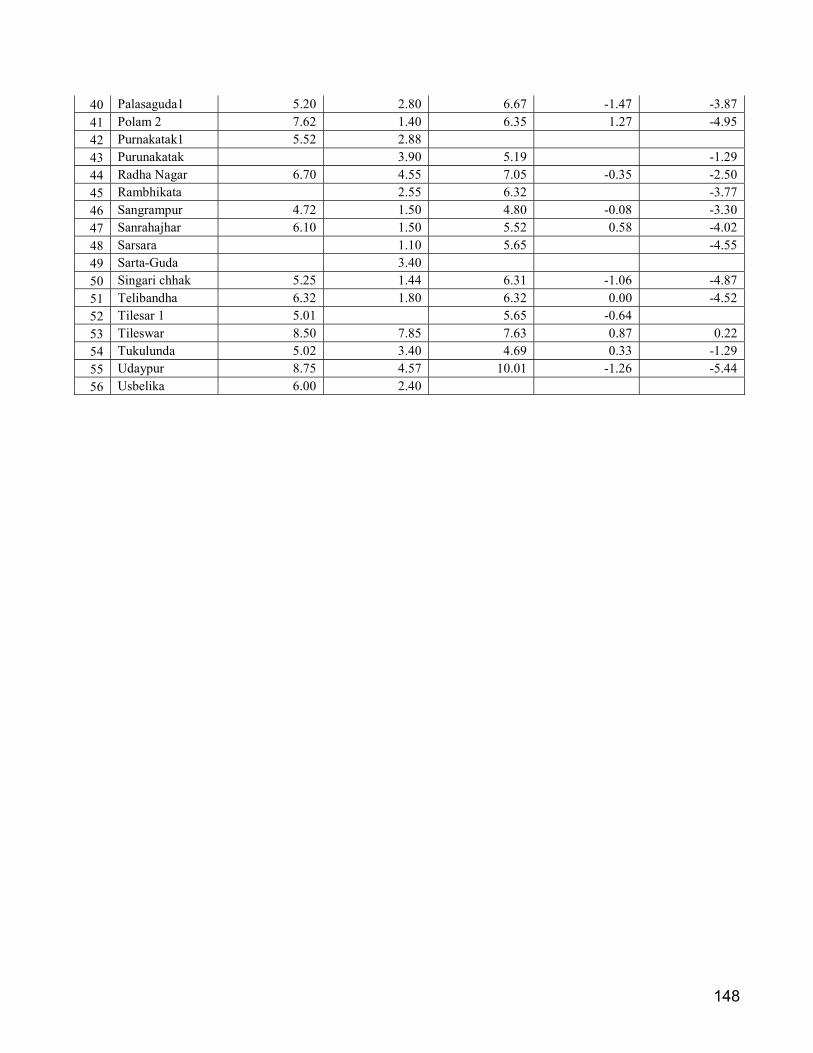
148
40 Palasaguda1 5.20 2.80 6.67 -1.47 -3.87
41 Polam 2 7.62 1.40 6.35 1.27 -4.95
42 Purnakatak1 5.52 2.88 43 Purunakatak 3.90 5.19 -1.29
44 Radha Nagar 6.70 4.55 7.05 -0.35 -2.50
45 Rambhikata 2.55 6.32 -3.77
46 Sangrampur 4.72 1.50 4.80 -0.08 -3.30
47 Sanrahajhar 6.10 1.50 5.52 0.58 -4.02
48 Sarsara 1.10 5.65 -4.55
49 Sarta-Guda 3.40 50 Singari chhak 5.25 1.44 6.31 -1.06 -4.87
51 Telibandha 6.32 1.80 6.32 0.00 -4.52
52 Tilesar 1 5.01 5.65 -0.64 53 Tileswar 8.50 7.85 7.63 0.87 0.22
54 Tukulunda 5.02 3.40 4.69 0.33 -1.29
55 Udaypur 8.75 4.57 10.01 -1.26 -5.44
56 Usbelika 6.00 2.40
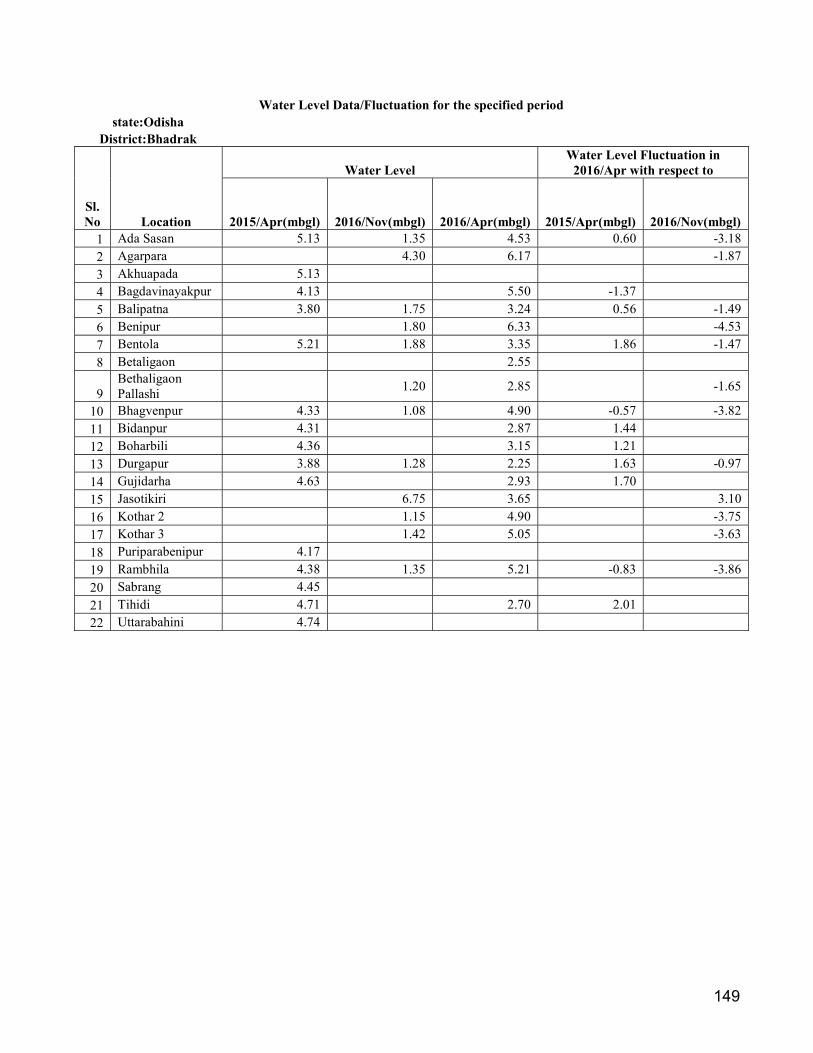
149
Water Level Data/Fluctuation for the specified period state:Odisha
District:Bhadrak
Sl. No Location
Water Level Water Level Fluctuation in
2016/Apr with respect to
2015/Apr(mbgl) 2016/Nov(mbgl) 2016/Apr(mbgl) 2015/Apr(mbgl) 2016/Nov(mbgl) 1 Ada Sasan 5.13 1.35 4.53 0.60 -3.18
2 Agarpara 4.30 6.17 -1.87
3 Akhuapada 5.13 4 Bagdavinayakpur 4.13 5.50 -1.37 5 Balipatna 3.80 1.75 3.24 0.56 -1.49
6 Benipur 1.80 6.33 -4.53
7 Bentola 5.21 1.88 3.35 1.86 -1.47
8 Betaligaon 2.55
9 Bethaligaon Pallashi
1.20 2.85
-1.65
10 Bhagvenpur 4.33 1.08 4.90 -0.57 -3.82
11 Bidanpur 4.31 2.87 1.44 12 Boharbili 4.36 3.15 1.21 13 Durgapur 3.88 1.28 2.25 1.63 -0.97
14 Gujidarha 4.63 2.93 1.70 15 Jasotikiri 6.75 3.65 3.10
16 Kothar 2 1.15 4.90 -3.75
17 Kothar 3 1.42 5.05 -3.63
18 Puriparabenipur 4.17 19 Rambhila 4.38 1.35 5.21 -0.83 -3.86
20 Sabrang 4.45 21 Tihidi 4.71 2.70 2.01 22 Uttarabahini 4.74
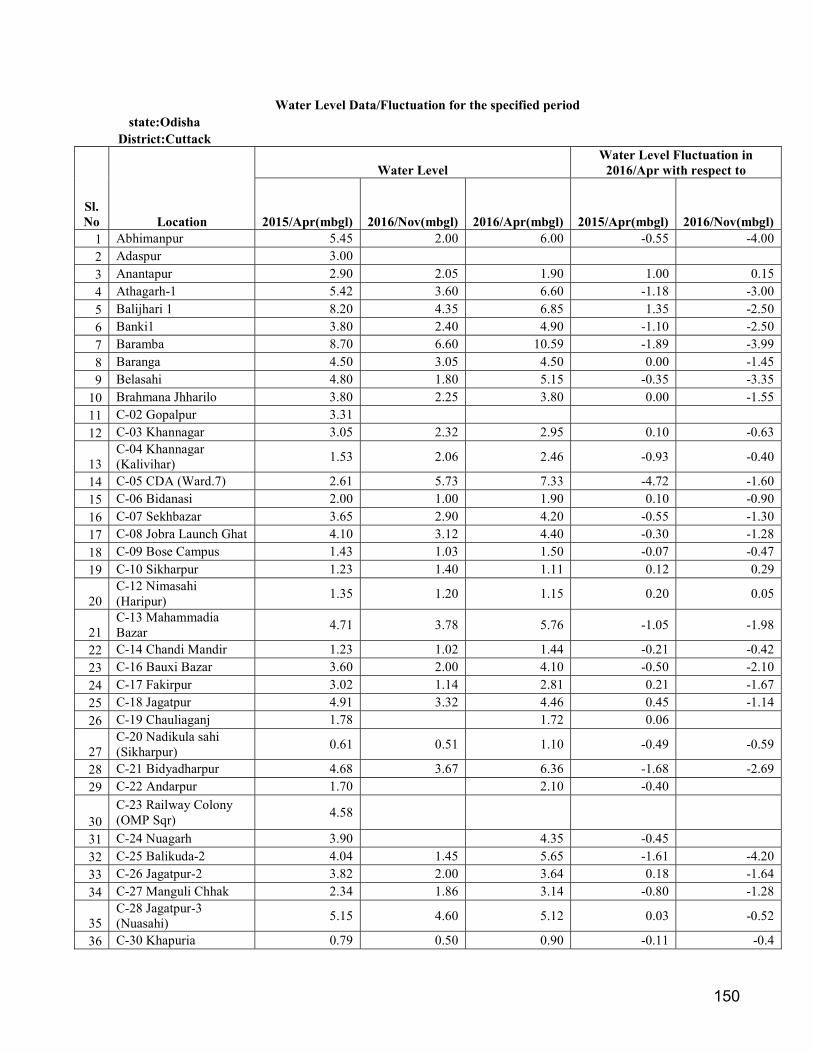
150
Water Level Data/Fluctuation for the specified period state:Odisha
District:Cuttack
Sl. No Location
Water Level Water Level Fluctuation in
2016/Apr with respect to
2015/Apr(mbgl) 2016/Nov(mbgl) 2016/Apr(mbgl) 2015/Apr(mbgl) 2016/Nov(mbgl) 1 Abhimanpur 5.45 2.00 6.00 -0.55 -4.00
2 Adaspur 3.00 3 Anantapur 2.90 2.05 1.90 1.00 0.15
4 Athagarh-1 5.42 3.60 6.60 -1.18 -3.00
5 Balijhari 1 8.20 4.35 6.85 1.35 -2.50
6 Banki1 3.80 2.40 4.90 -1.10 -2.50
7 Baramba 8.70 6.60 10.59 -1.89 -3.99
8 Baranga 4.50 3.05 4.50 0.00 -1.45
9 Belasahi 4.80 1.80 5.15 -0.35 -3.35
10 Brahmana Jhharilo 3.80 2.25 3.80 0.00 -1.55
11 C-02 Gopalpur 3.31 12 C-03 Khannagar 3.05 2.32 2.95 0.10 -0.63
13 C-04 Khannagar (Kalivihar)
1.53 2.06 2.46 -0.93 -0.40
14 C-05 CDA (Ward.7) 2.61 5.73 7.33 -4.72 -1.60
15 C-06 Bidanasi 2.00 1.00 1.90 0.10 -0.90
16 C-07 Sekhbazar 3.65 2.90 4.20 -0.55 -1.30
17 C-08 Jobra Launch Ghat 4.10 3.12 4.40 -0.30 -1.28
18 C-09 Bose Campus 1.43 1.03 1.50 -0.07 -0.47
19 C-10 Sikharpur 1.23 1.40 1.11 0.12 0.29
20 C-12 Nimasahi (Haripur)
1.35 1.20 1.15 0.20 0.05
21 C-13 Mahammadia Bazar
4.71 3.78 5.76 -1.05 -1.98
22 C-14 Chandi Mandir 1.23 1.02 1.44 -0.21 -0.42
23 C-16 Bauxi Bazar 3.60 2.00 4.10 -0.50 -2.10
24 C-17 Fakirpur 3.02 1.14 2.81 0.21 -1.67
25 C-18 Jagatpur 4.91 3.32 4.46 0.45 -1.14
26 C-19 Chauliaganj 1.78 1.72 0.06
27 C-20 Nadikula sahi (Sikharpur)
0.61 0.51 1.10 -0.49 -0.59
28 C-21 Bidyadharpur 4.68 3.67 6.36 -1.68 -2.69
29 C-22 Andarpur 1.70 2.10 -0.40
30 C-23 Railway Colony (OMP Sqr)
4.58
31 C-24 Nuagarh 3.90 4.35 -0.45 32 C-25 Balikuda-2 4.04 1.45 5.65 -1.61 -4.20
33 C-26 Jagatpur-2 3.82 2.00 3.64 0.18 -1.64
34 C-27 Manguli Chhak 2.34 1.86 3.14 -0.80 -1.28
35 C-28 Jagatpur-3 (Nuasahi)
5.15 4.60 5.12 0.03 -0.52
36 C-30 Khapuria 0.79 0.50 0.90 -0.11 -0.4

151
37 C-31 Pithapur 1.21 1.00 1.22 -0.01 -0.22
38 C-32Khapuria 4.90
39 C-33 Lakshmi Mandap (Badambari)
0.30 2.40 0.66 -0.36 1.74
40 C-34 Chakuli 0.40 41 C-35 Netaji Nagar 3.03 2.72 0.31
42 C-36 Khapuria1 3.20 4.74 -1.54
43 Choudwar 2.45 2.00 44 Chowdwar 5.55 2.85 2.70
45 Cuttack Town 5.20 5.70 -0.50 46 Dimirimathha 3.15 6.10 -2.95
47 Gopalpur2 3.10 2.20 3.40 -0.30 -1.20
48 Gopapur 4.38 2.40 2.80 1.58 -0.40
49 Jagatpur-i 4.30 2.60 5.00 -0.70 -2.40
50 Jagatpur-ll 1.95 2.30 -0.35 51 Kanapur 2.68 1.70 4.70 -2.02 -3.00
52 Kandarpur 3.60 2.40 3.80 -0.20 -1.40
53 Kantapara1 2.50 4.00 -1.50
54 Karadibandh 5.40 4.00 6.86 -1.46 -2.86
55 Kasarda west side 2.05 5.20 -3.15
56 Khuntuni 3.35 1.45 3.40 -0.05 -1.95
57 Kulia Market 3.00 2.10 3.10 -0.10 -1.00
58 Madhab 3.80 2.80 3.95 -0.15 -1.15
59 Mahanga1 2.90 2.25 3.85 -0.95 -1.60
60 Megha 3.75 2.48 5.50 -1.75 -3.02
61 Nachhipur 3.80 2.10 4.00 -0.20 -1.90
62 Narsingpur 6.15 3.60 7.30 -1.15 -3.70
63 Niali 4.50 2.90 4.95 -0.45 -2.05
64 Nimpur 4.40 3.00 4.90 -0.50 -1.90
65 Nischintakoili (new) 1.90 1.90 2.10 -0.20 -0.20
66 Nuagarh 3.50 2.35 3.70 -0.20 -1.35
67 Oranda 8.45 9.80 -1.35 68 Radha Gobindapur 6.72 1.90 69 Rajnagar 1.55 1.40 70 Sankhmiri 3.00 1.65 2.00 1.00 -0.35
71 Saradapur 6.13 3.15 6.25 -0.12 -3.10
72 Sisua 3.10 1.50 3.40 -0.30 -1.90
73 Tangi1 6.52 3.60 8.30 -1.78 -4.70
74 Telengapenth 3.40 2.45 3.75 -0.35 -1.30
75 Tigiria 2.00 0.37 3.07 -1.07 -2.70
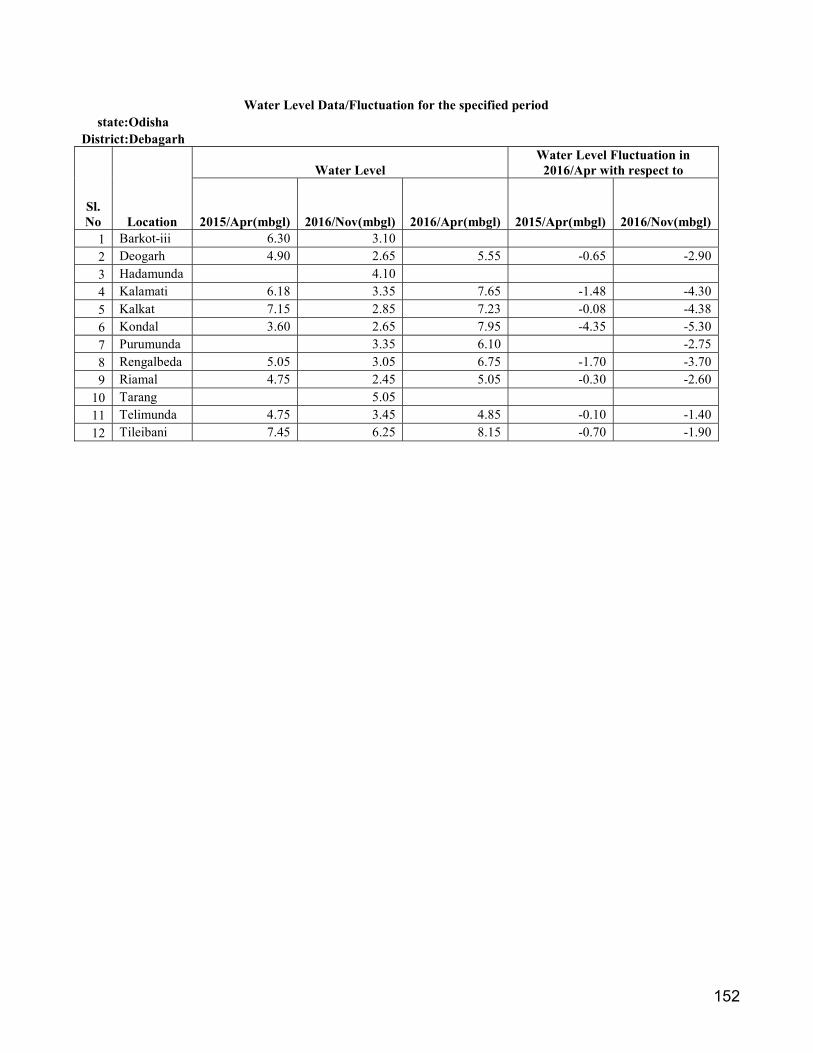
152
Water Level Data/Fluctuation for the specified period state:Odisha
District:Debagarh
Sl. No Location
Water Level Water Level Fluctuation in
2016/Apr with respect to
2015/Apr(mbgl) 2016/Nov(mbgl) 2016/Apr(mbgl) 2015/Apr(mbgl) 2016/Nov(mbgl) 1 Barkot-iii 6.30 3.10 2 Deogarh 4.90 2.65 5.55 -0.65 -2.90
3 Hadamunda 4.10 4 Kalamati 6.18 3.35 7.65 -1.48 -4.30
5 Kalkat 7.15 2.85 7.23 -0.08 -4.38
6 Kondal 3.60 2.65 7.95 -4.35 -5.30
7 Purumunda 3.35 6.10 -2.75
8 Rengalbeda 5.05 3.05 6.75 -1.70 -3.70
9 Riamal 4.75 2.45 5.05 -0.30 -2.60
10 Tarang 5.05 11 Telimunda 4.75 3.45 4.85 -0.10 -1.40
12 Tileibani 7.45 6.25 8.15 -0.70 -1.90

153
Water Level Data/Fluctuation for the specified period
state:Odisha District:Dhenkanal
Sl. No Location
Water Level Water Level Fluctuation in
2016/Apr with respect to
2015/Apr(mbgl) 2016/Nov(mbgl) 2016/Apr(mbgl) 2015/Apr(mbgl) 2016/Nov(mbgl) 1 Alnaberini 1 7.97 5.75 10.85 -2.88 -5.10
2 Babandh 4.00 1.25 7.65 -3.65 -6.40
3 Badajhara 4.47 2.45 6.86 -2.39 -4.41
4 Badasuanlo-Hatwari
5.01 2.50 6.30 -1.29 -3.80
5 Baisingha 10.00 6.52 6 Baisingha-Ii 7.69 6.30 1.39
7 Baldiabandh 7.45 5.28 8.20 -0.75 -2.92
8 Balmi 8.42 5.20 9 Balrampur 1.80 3.07 -1.27
10 Bandhnuagaon 5.98 1.65 7.65 -1.67 -6.00
11 Batgaon 5.44 3.05 6.03 -0.59 -2.98
12 Bhapur2 4.67 1.45 5.60 -0.93 -4.15
13 Bhuban 5.75 4.40 6.40 -0.65 -2.00
14 Bhuban-Ii 3.59 2.10 5.17 -1.58 -3.07
15 Deogaon 4.03 1.27 5.92 -1.89 -4.65
16 Dhaulpur 5.60 2.20 6.80 -1.20 -4.60
17 Dhenkanal 1.78 1.85 2.50 -0.72 -0.65
18 Gangutia 5.70 5.00 6.70 -1.00 -1.70
19 Goda 9.56 5.00 9.50 0.06 -4.50
20 Gondia1 4.00 1.50 5.10 -1.10 -3.60
21 Hatwari 5.57 2.50 22 Hindol1 6.05 4.90 8.05 -2.00 -3.15
23 Joranda 8.83 5.55 24 Kaimati 5.15 3.82 5.81 -0.66 -1.99
25 Kamakyanagar 5.25
26 Kamakyanagar-Ii
7.85 3.50 9.71 -1.86 -6.21
27 Kandarsingha 5.65 3.05 5.35 0.30 -2.30
28 Kankadahad 6.68 6.60 7.80 -1.12 -1.20
29 Karanda 5.07 2.55 30 Mahulpal 5.73 1.75 5.00 0.73 -3.25
31 Mahulpunja 1.25 32 Mandar 6.40 4.10 6.30 0.10 -2.20
33 Mathakaragola 9.12 7.50 5.90 3.22 1.60
34 Motanga 5.90 3.55 7.00 -1.10 -3.45
35 Motanga-Ii 5.65 4.35 7.22 -1.57 -2.87
36 Muktaposi 5.53 1.25 7.60 -2.07 -6.35
37 Parjang1 6.45 2.40 6.91 -0.46 -4.51
38 Rasol 4.79 1.95 6.60 -1.81 -4.65
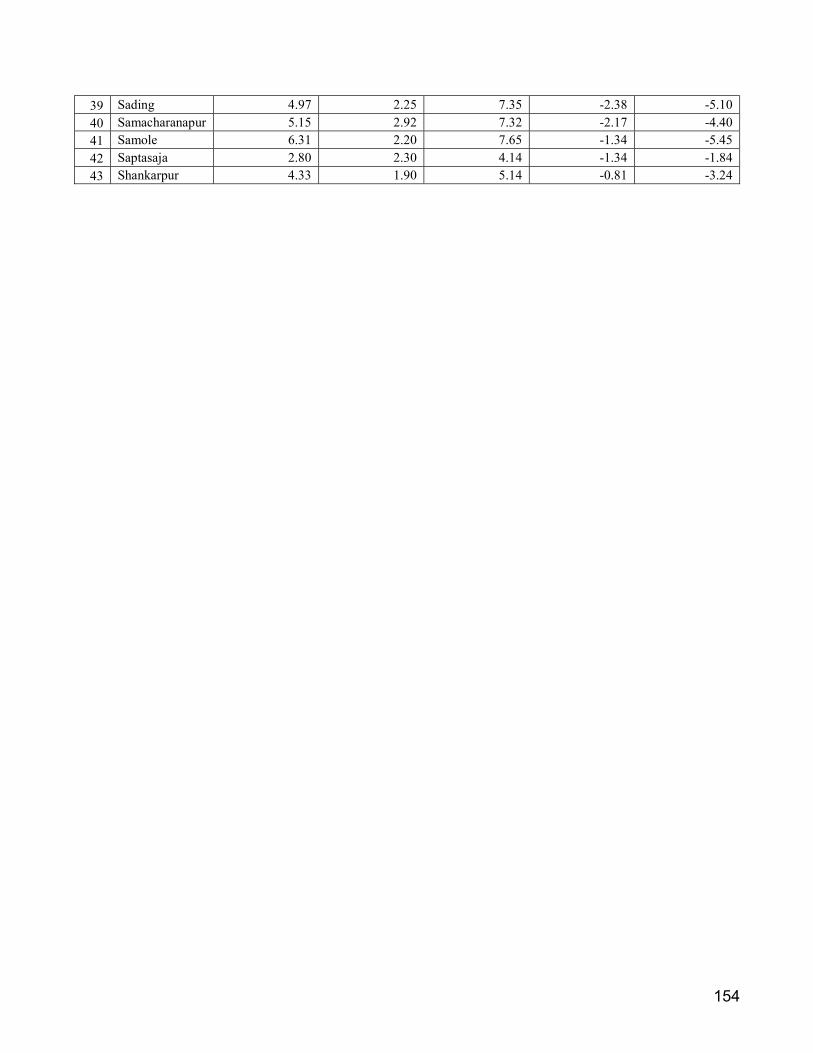
154
39 Sading 4.97 2.25 7.35 -2.38 -5.10
40 Samacharanapur 5.15 2.92 7.32 -2.17 -4.40
41 Samole 6.31 2.20 7.65 -1.34 -5.45
42 Saptasaja 2.80 2.30 4.14 -1.34 -1.84
43 Shankarpur 4.33 1.90 5.14 -0.81 -3.24
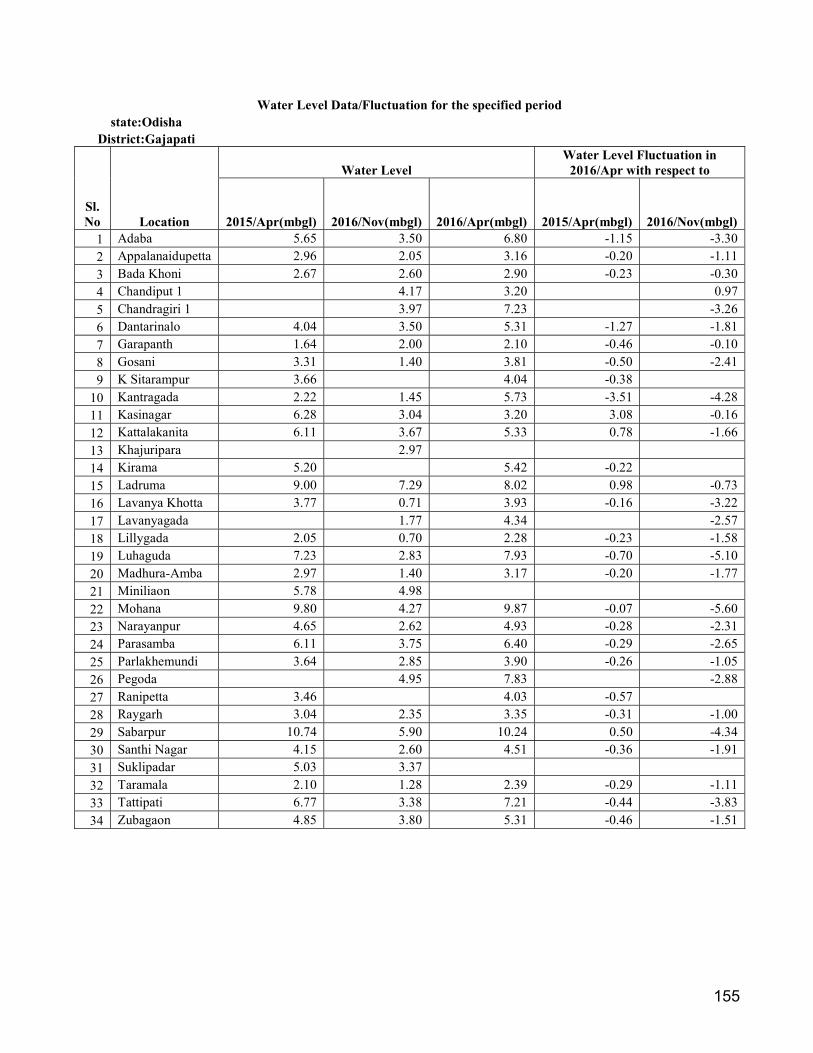
155
Water Level Data/Fluctuation for the specified period state:Odisha
District:Gajapati
Sl. No Location
Water Level Water Level Fluctuation in
2016/Apr with respect to
2015/Apr(mbgl) 2016/Nov(mbgl) 2016/Apr(mbgl) 2015/Apr(mbgl) 2016/Nov(mbgl) 1 Adaba 5.65 3.50 6.80 -1.15 -3.30
2 Appalanaidupetta 2.96 2.05 3.16 -0.20 -1.11
3 Bada Khoni 2.67 2.60 2.90 -0.23 -0.30
4 Chandiput 1 4.17 3.20 0.97
5 Chandragiri 1 3.97 7.23 -3.26
6 Dantarinalo 4.04 3.50 5.31 -1.27 -1.81
7 Garapanth 1.64 2.00 2.10 -0.46 -0.10
8 Gosani 3.31 1.40 3.81 -0.50 -2.41
9 K Sitarampur 3.66 4.04 -0.38 10 Kantragada 2.22 1.45 5.73 -3.51 -4.28
11 Kasinagar 6.28 3.04 3.20 3.08 -0.16
12 Kattalakanita 6.11 3.67 5.33 0.78 -1.66
13 Khajuripara 2.97 14 Kirama 5.20 5.42 -0.22 15 Ladruma 9.00 7.29 8.02 0.98 -0.73
16 Lavanya Khotta 3.77 0.71 3.93 -0.16 -3.22
17 Lavanyagada 1.77 4.34 -2.57
18 Lillygada 2.05 0.70 2.28 -0.23 -1.58
19 Luhaguda 7.23 2.83 7.93 -0.70 -5.10
20 Madhura-Amba 2.97 1.40 3.17 -0.20 -1.77
21 Miniliaon 5.78 4.98 22 Mohana 9.80 4.27 9.87 -0.07 -5.60
23 Narayanpur 4.65 2.62 4.93 -0.28 -2.31
24 Parasamba 6.11 3.75 6.40 -0.29 -2.65
25 Parlakhemundi 3.64 2.85 3.90 -0.26 -1.05
26 Pegoda 4.95 7.83 -2.88
27 Ranipetta 3.46 4.03 -0.57 28 Raygarh 3.04 2.35 3.35 -0.31 -1.00
29 Sabarpur 10.74 5.90 10.24 0.50 -4.34
30 Santhi Nagar 4.15 2.60 4.51 -0.36 -1.91
31 Suklipadar 5.03 3.37 32 Taramala 2.10 1.28 2.39 -0.29 -1.11
33 Tattipati 6.77 3.38 7.21 -0.44 -3.83
34 Zubagaon 4.85 3.80 5.31 -0.46 -1.51
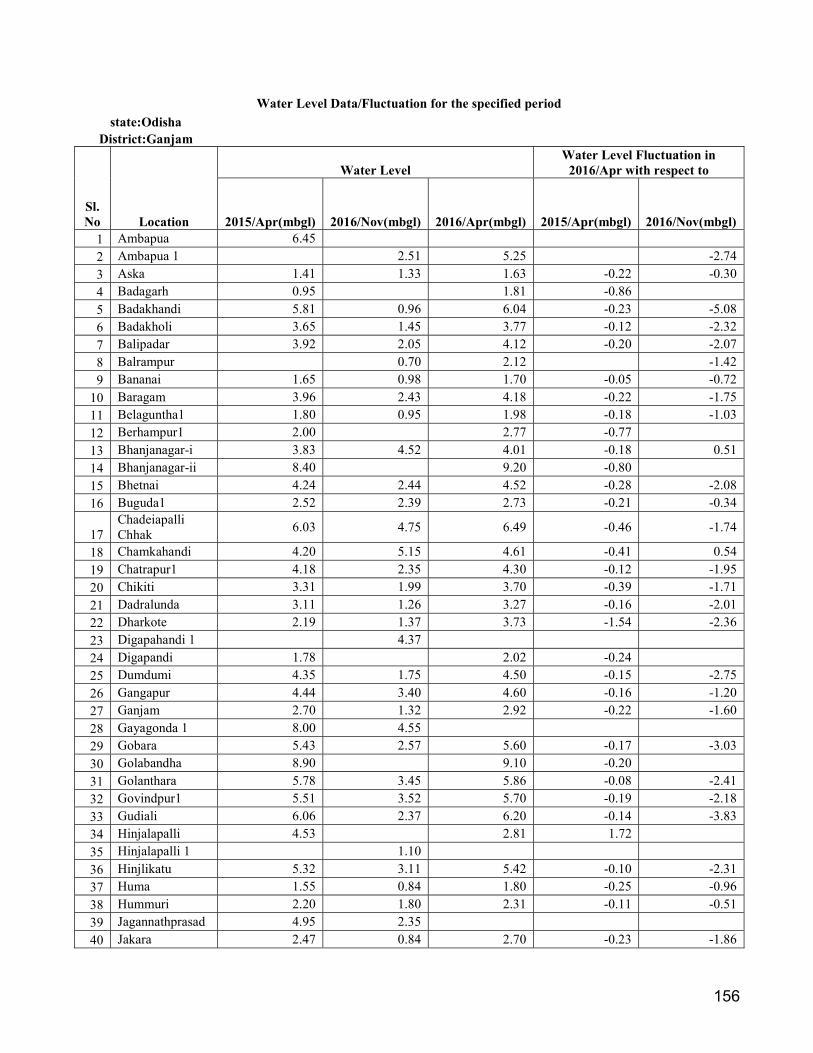
156
Water Level Data/Fluctuation for the specified period
state:Odisha District:Ganjam
Sl. No Location
Water Level Water Level Fluctuation in
2016/Apr with respect to
2015/Apr(mbgl) 2016/Nov(mbgl) 2016/Apr(mbgl) 2015/Apr(mbgl) 2016/Nov(mbgl) 1 Ambapua 6.45 2 Ambapua 1 2.51 5.25 -2.74
3 Aska 1.41 1.33 1.63 -0.22 -0.30
4 Badagarh 0.95 1.81 -0.86 5 Badakhandi 5.81 0.96 6.04 -0.23 -5.08
6 Badakholi 3.65 1.45 3.77 -0.12 -2.32
7 Balipadar 3.92 2.05 4.12 -0.20 -2.07
8 Balrampur 0.70 2.12 -1.42
9 Bananai 1.65 0.98 1.70 -0.05 -0.72
10 Baragam 3.96 2.43 4.18 -0.22 -1.75
11 Belaguntha1 1.80 0.95 1.98 -0.18 -1.03
12 Berhampur1 2.00 2.77 -0.77 13 Bhanjanagar-i 3.83 4.52 4.01 -0.18 0.51
14 Bhanjanagar-ii 8.40 9.20 -0.80 15 Bhetnai 4.24 2.44 4.52 -0.28 -2.08
16 Buguda1 2.52 2.39 2.73 -0.21 -0.34
17 Chadeiapalli Chhak
6.03 4.75 6.49 -0.46 -1.74
18 Chamkahandi 4.20 5.15 4.61 -0.41 0.54
19 Chatrapur1 4.18 2.35 4.30 -0.12 -1.95
20 Chikiti 3.31 1.99 3.70 -0.39 -1.71
21 Dadralunda 3.11 1.26 3.27 -0.16 -2.01
22 Dharkote 2.19 1.37 3.73 -1.54 -2.36
23 Digapahandi 1 4.37 24 Digapandi 1.78 2.02 -0.24 25 Dumdumi 4.35 1.75 4.50 -0.15 -2.75
26 Gangapur 4.44 3.40 4.60 -0.16 -1.20
27 Ganjam 2.70 1.32 2.92 -0.22 -1.60
28 Gayagonda 1 8.00 4.55 29 Gobara 5.43 2.57 5.60 -0.17 -3.03
30 Golabandha 8.90 9.10 -0.20 31 Golanthara 5.78 3.45 5.86 -0.08 -2.41
32 Govindpur1 5.51 3.52 5.70 -0.19 -2.18
33 Gudiali 6.06 2.37 6.20 -0.14 -3.83
34 Hinjalapalli 4.53 2.81 1.72 35 Hinjalapalli 1 1.10 36 Hinjlikatu 5.32 3.11 5.42 -0.10 -2.31
37 Huma 1.55 0.84 1.80 -0.25 -0.96
38 Hummuri 2.20 1.80 2.31 -0.11 -0.51
39 Jagannathprasad 4.95 2.35 40 Jakara 2.47 0.84 2.70 -0.23 -1.86
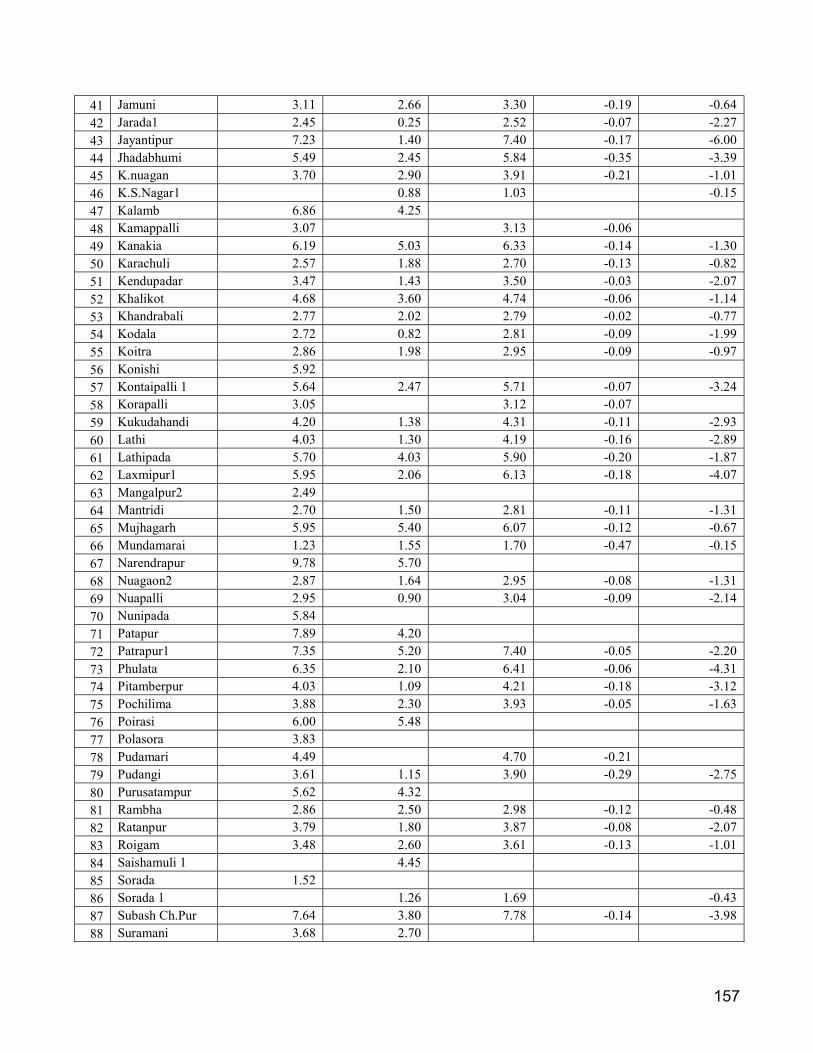
157
41 Jamuni 3.11 2.66 3.30 -0.19 -0.64
42 Jarada1 2.45 0.25 2.52 -0.07 -2.27
43 Jayantipur 7.23 1.40 7.40 -0.17 -6.00
44 Jhadabhumi 5.49 2.45 5.84 -0.35 -3.39
45 K.nuagan 3.70 2.90 3.91 -0.21 -1.01
46 K.S.Nagar1 0.88 1.03 -0.15
47 Kalamb 6.86 4.25 48 Kamappalli 3.07 3.13 -0.06 49 Kanakia 6.19 5.03 6.33 -0.14 -1.30
50 Karachuli 2.57 1.88 2.70 -0.13 -0.82
51 Kendupadar 3.47 1.43 3.50 -0.03 -2.07
52 Khalikot 4.68 3.60 4.74 -0.06 -1.14
53 Khandrabali 2.77 2.02 2.79 -0.02 -0.77
54 Kodala 2.72 0.82 2.81 -0.09 -1.99
55 Koitra 2.86 1.98 2.95 -0.09 -0.97
56 Konishi 5.92 57 Kontaipalli 1 5.64 2.47 5.71 -0.07 -3.24
58 Korapalli 3.05 3.12 -0.07 59 Kukudahandi 4.20 1.38 4.31 -0.11 -2.93
60 Lathi 4.03 1.30 4.19 -0.16 -2.89
61 Lathipada 5.70 4.03 5.90 -0.20 -1.87
62 Laxmipur1 5.95 2.06 6.13 -0.18 -4.07
63 Mangalpur2 2.49 64 Mantridi 2.70 1.50 2.81 -0.11 -1.31
65 Mujhagarh 5.95 5.40 6.07 -0.12 -0.67
66 Mundamarai 1.23 1.55 1.70 -0.47 -0.15
67 Narendrapur 9.78 5.70 68 Nuagaon2 2.87 1.64 2.95 -0.08 -1.31
69 Nuapalli 2.95 0.90 3.04 -0.09 -2.14
70 Nunipada 5.84 71 Patapur 7.89 4.20 72 Patrapur1 7.35 5.20 7.40 -0.05 -2.20
73 Phulata 6.35 2.10 6.41 -0.06 -4.31
74 Pitamberpur 4.03 1.09 4.21 -0.18 -3.12
75 Pochilima 3.88 2.30 3.93 -0.05 -1.63
76 Poirasi 6.00 5.48 77 Polasora 3.83 78 Pudamari 4.49 4.70 -0.21 79 Pudangi 3.61 1.15 3.90 -0.29 -2.75
80 Purusatampur 5.62 4.32 81 Rambha 2.86 2.50 2.98 -0.12 -0.48
82 Ratanpur 3.79 1.80 3.87 -0.08 -2.07
83 Roigam 3.48 2.60 3.61 -0.13 -1.01
84 Saishamuli 1 4.45 85 Sorada 1.52 86 Sorada 1 1.26 1.69 -0.43
87 Subash Ch.Pur 7.64 3.80 7.78 -0.14 -3.98
88 Suramani 3.68 2.70
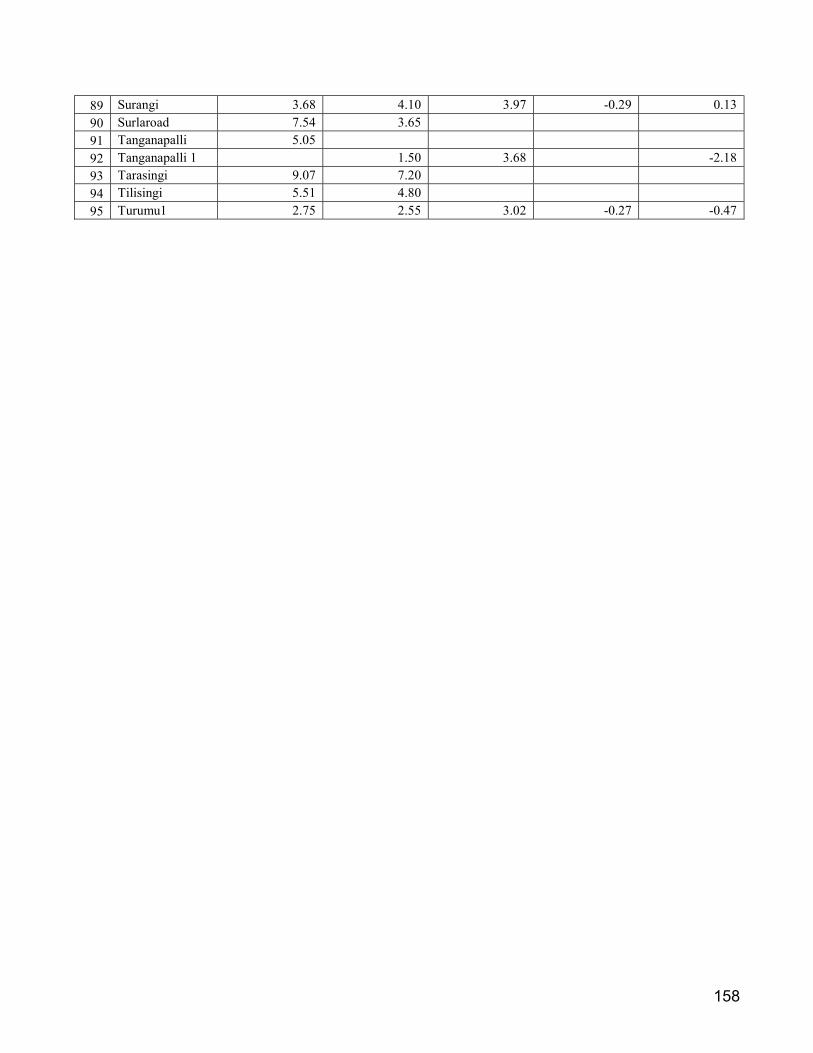
158
89 Surangi 3.68 4.10 3.97 -0.29 0.13
90 Surlaroad 7.54 3.65 91 Tanganapalli 5.05 92 Tanganapalli 1 1.50 3.68 -2.18
93 Tarasingi 9.07 7.20 94 Tilisingi 5.51 4.80 95 Turumu1 2.75 2.55 3.02 -0.27 -0.47

159
Water Level Data/Fluctuation for the specified period
state:Odisha District:Jagatsinghpur
Sl. No Location
Water Level Water Level Fluctuation in
2016/Apr with respect to
2015/Apr(mbgl) 2016/Nov(mbgl) 2016/Apr(mbgl) 2015/Apr(mbgl) 2016/Nov(mbgl) 1 Badapal 3.60 1.95 3.90 -0.30 -1.95
2 Balarampur 2.80 2.05 3.15 -0.35 -1.10
3 Balia Store 2.10 2.00 2.45 -0.35 -0.45
4 Balikuda2 3.00 1.80 3.90 -0.90 -2.10
5 Balituth 1.25 1.30 1.90 -0.65 -0.60
6 Bhutmundi1 2.60 1.65 2.90 -0.30 -1.25
7 Ersama2 3.60 2.25 4.20 -0.60 -1.95
8 Gopinathpur 3.70 9 Govindpur 2.80 2.15 3.20 -0.40 -1.05
10 Kanakpur 2.15 3.85 -1.70
11 Kujang 2.90 1.80 3.10 -0.20 -1.30
12 Kumartota chak 3.24 2.00 3.20 0.04 -1.20
13 Machgaon 3.45 2.00 3.60 -0.15 -1.60
14 Mukundpur 2.30 1.65 2.95 -0.65 -1.30
15 Nuagaon 1.00 1.65 1.40 -0.40 0.25
16 Nuapolbazar 2.30 1.75 2.60 -0.30 -0.85
17 Paradeepgarh1 2.00 1.50 2.60 -0.60 -1.10
18 Raghunathpur 2.05 4.00 -1.95
19 Sinharpur 2.00 20 Siuli 1.90

160
Water Level Data/Fluctuation for the specified period
state:Odisha District:Jajpur
Sl. No Location
Water Level Water Level Fluctuation in
2016/Apr with respect to
2015/Apr(mbgl) 2016/Nov(mbgl) 2016/Apr(mbgl) 2015/Apr(mbgl) 2016/Nov(mbgl) 1 Ambasar 6.05 2.35 4.45 1.60 -2.10
2 Amnut Monohi 5.98 1.27 2.77 3.21 -1.50
3 Arkhapur 1.10 4.55 -3.45
4 Balrampur 6.43 14.10 -7.67 5 Baruda 1.80 3.15 -1.35
6 Chandeidhara 5.79 7 Chinguripal 6.42 4.78 7.45 -1.03 -2.67
8 Danagadi 1 4.42 9 Danagadi-Ii 6.08 12.29 -6.21
10 Dankari 7.12 2.57 3.45 3.67 -0.88
11 Darpani 6.92 12 Dubri 5.72 5.43 0.29 13 Dubri 1 1.70 14 Garamian 7.21 15 Haridaspur 3.05 1.35 3.10 -0.05 -1.75
16 Hatibari 5.03 10.45 -5.42
17 Jajpur 5.78 5.18 0.60 18 Jakhpura 7.08 19 Jakhpura-Ii 7.89 13.85 -5.96 20 Jamjhari 8.38 5.75 10.35 -1.97 -4.60
21 Jhargadia 8.21 8.75 9.35 -1.14 -0.60
22 Kabatabandha 1.87 4.60 -2.73
23 Kalarangi-Ii 7.48 10.38 -2.90 24 Kaliapani 7.31 5.98 1.33 25 Khonedi 2.19 26 Kotagaon 6.67 27 Madhupurgarh 7.12 2.73 6.16 0.96 -3.43
28 Mangalpur 6.38 4.60 1.78 29 Neulpur 1.75 30 Pankpal 7.28 5.07 2.21 31 Phuljhore 7.58 1.55 4.15 3.43 -2.60
32 Pobala 6.00 3.22 5.35 0.65 -2.13
33 Purunabavlamola 6.91 5.88 7.05 -0.14 -1.17
34 Ragadi 8.03 4.45 2.63 5.40 1.82
35 Ragadiposi 8.13 7.55 0.58 36 Ragedi 1 4.75 4.55 0.20 37 Senoi 6.28 2.58 2.90 3.38 -0.32
38 Singpur 5.90 39 Sohupur 4.56 2.05 3.72 0.84 -1.67
40 Sukinda 5.00 2.02

161
41 Sukinda-Ii 6.38 42 Sukurangi 6.16 43 Tolagarh 6.15 6.02 0.13 44 Tomka 7.59

162
Water Level Data/Fluctuation for the specified period
state:Odisha District:Jharsuguda
Sl. No Location
Water Level Water Level Fluctuation in
2016/Apr with respect to
2015/Apr(mbgl) 2016/Nov(mbgl) 2016/Apr(mbgl) 2015/Apr(mbgl) 2016/Nov(mbgl) 1 Badmal 4.85 2.25 4.85 0.00 -2.60
2 Belpahar 5.80 3.90 6.15 -0.35 -2.25
3 Bhalupatra 5.85 4 Bhikhampali 4.45 2.75 4.45 0.00 -1.70
5 Brajrajnagar 9.10 4.95 6 Chadnimal 2.10 7.10 -5.00
7 Dumerdihi 4.30 8 Jharsuguda1 7.10 5.35 7.55 -0.45 -2.20
9 Katarbaga 3.10 1.55 3.30 -0.20 -1.75
10 Kirimera 3.75 2.70 3.90 -0.15 -1.20
11 Laikera 5.15 2.65 12 Lakhanpur 5.70 3.45 5.40 0.30 -1.95
13 Omp Check Gate 4.05 6.25 -2.20
14 Panchagaon 4.85 1.35 5.15 -0.30 -3.80
15 Ram Kumar Chawk
4.05 7.75
-3.70
16 Sahaspur 5.05 1.85 5.75 -0.70 -3.90
17 Singarpur 2.05 1.85 2.25 -0.20 -0.40
18 Sriyapali 4.65 7.65 -3.00
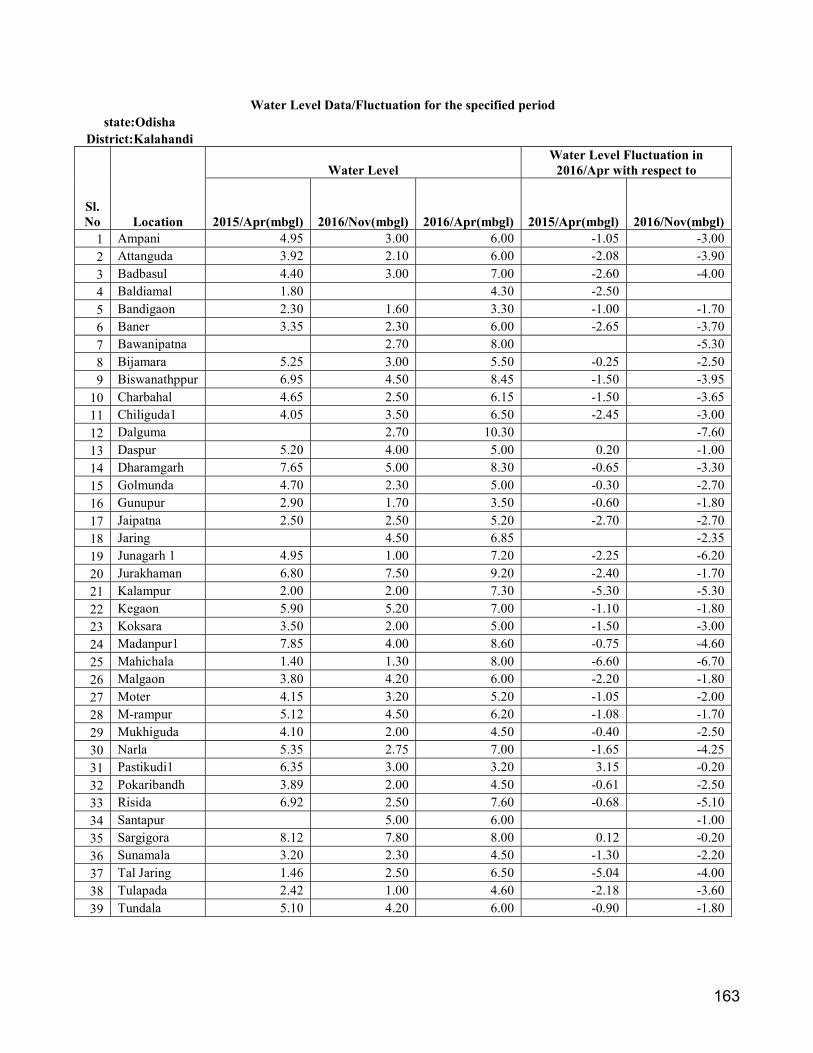
163
Water Level Data/Fluctuation for the specified period state:Odisha
District:Kalahandi
Sl. No Location
Water Level Water Level Fluctuation in
2016/Apr with respect to
2015/Apr(mbgl) 2016/Nov(mbgl) 2016/Apr(mbgl) 2015/Apr(mbgl) 2016/Nov(mbgl) 1 Ampani 4.95 3.00 6.00 -1.05 -3.00
2 Attanguda 3.92 2.10 6.00 -2.08 -3.90
3 Badbasul 4.40 3.00 7.00 -2.60 -4.00
4 Baldiamal 1.80 4.30 -2.50 5 Bandigaon 2.30 1.60 3.30 -1.00 -1.70
6 Baner 3.35 2.30 6.00 -2.65 -3.70
7 Bawanipatna 2.70 8.00 -5.30
8 Bijamara 5.25 3.00 5.50 -0.25 -2.50
9 Biswanathppur 6.95 4.50 8.45 -1.50 -3.95
10 Charbahal 4.65 2.50 6.15 -1.50 -3.65
11 Chiliguda1 4.05 3.50 6.50 -2.45 -3.00
12 Dalguma 2.70 10.30 -7.60
13 Daspur 5.20 4.00 5.00 0.20 -1.00
14 Dharamgarh 7.65 5.00 8.30 -0.65 -3.30
15 Golmunda 4.70 2.30 5.00 -0.30 -2.70
16 Gunupur 2.90 1.70 3.50 -0.60 -1.80
17 Jaipatna 2.50 2.50 5.20 -2.70 -2.70
18 Jaring 4.50 6.85 -2.35
19 Junagarh 1 4.95 1.00 7.20 -2.25 -6.20
20 Jurakhaman 6.80 7.50 9.20 -2.40 -1.70
21 Kalampur 2.00 2.00 7.30 -5.30 -5.30
22 Kegaon 5.90 5.20 7.00 -1.10 -1.80
23 Koksara 3.50 2.00 5.00 -1.50 -3.00
24 Madanpur1 7.85 4.00 8.60 -0.75 -4.60
25 Mahichala 1.40 1.30 8.00 -6.60 -6.70
26 Malgaon 3.80 4.20 6.00 -2.20 -1.80
27 Moter 4.15 3.20 5.20 -1.05 -2.00
28 M-rampur 5.12 4.50 6.20 -1.08 -1.70
29 Mukhiguda 4.10 2.00 4.50 -0.40 -2.50
30 Narla 5.35 2.75 7.00 -1.65 -4.25
31 Pastikudi1 6.35 3.00 3.20 3.15 -0.20
32 Pokaribandh 3.89 2.00 4.50 -0.61 -2.50
33 Risida 6.92 2.50 7.60 -0.68 -5.10
34 Santapur 5.00 6.00 -1.00
35 Sargigora 8.12 7.80 8.00 0.12 -0.20
36 Sunamala 3.20 2.30 4.50 -1.30 -2.20
37 Tal Jaring 1.46 2.50 6.50 -5.04 -4.00
38 Tulapada 2.42 1.00 4.60 -2.18 -3.60
39 Tundala 5.10 4.20 6.00 -0.90 -1.80
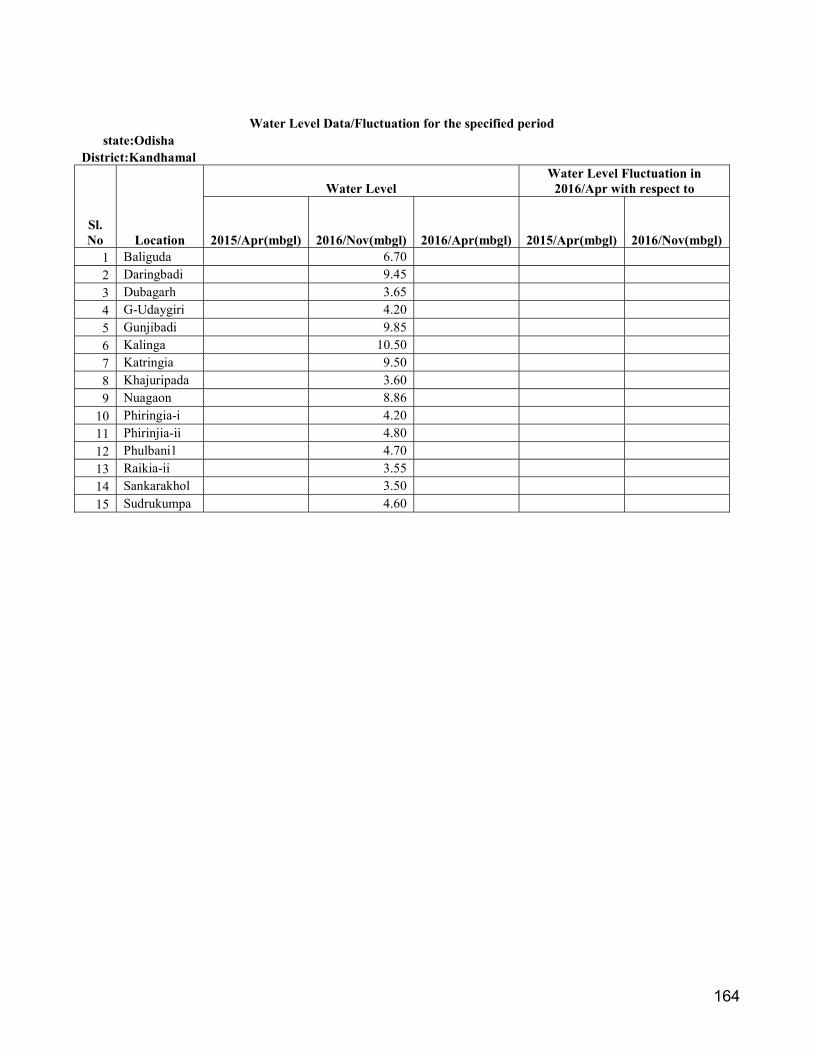
164
Water Level Data/Fluctuation for the specified period
state:Odisha District:Kandhamal
Sl. No Location
Water Level Water Level Fluctuation in
2016/Apr with respect to
2015/Apr(mbgl) 2016/Nov(mbgl) 2016/Apr(mbgl) 2015/Apr(mbgl) 2016/Nov(mbgl) 1 Baliguda 6.70 2 Daringbadi 9.45 3 Dubagarh 3.65 4 G-Udaygiri 4.20 5 Gunjibadi 9.85 6 Kalinga 10.50 7 Katringia 9.50 8 Khajuripada 3.60 9 Nuagaon 8.86
10 Phiringia-i 4.20 11 Phirinjia-ii 4.80 12 Phulbani1 4.70 13 Raikia-ii 3.55 14 Sankarakhol 3.50 15 Sudrukumpa 4.60

165
Water Level Data/Fluctuation for the specified period state:Odisha
District:Kendrapara
Sl. No Location
Water Level Water Level Fluctuation in
2016/Apr with respect to
2015/Apr(mbgl) 2016/Nov(mbgl) 2016/Apr(mbgl) 2015/Apr(mbgl) 2016/Nov(mbgl) 1 Aul(Ali) 3.40 1.60 3.80 -0.40 -2.20
2 Barua 1.20 3.20 -2.00
3 Chandibazar 2.05 2.60 -0.55 4 Chandola 2.10 2.50 -0.40 5 Dalbi 2.60 1.40 3.00 -0.40 -1.60
6 Dobandha Mathha
2.80 1.80 3.15 -0.35 -1.35
7 Duhuria 3.00 2.20 2.90 0.10 -0.70
8 Hatia 3.90 2.05 4.30 -0.40 -2.25
9 Jajanga 3.20 1.85 3.30 -0.10 -1.45
10 Jamdhar 2.40 2.05 2.50 -0.10 -0.45
11 Kajala 4.80 3.00 4.50 0.30 -1.50
12 Kasoti 2.90 1.60 3.10 -0.20 -1.50
13 Kendrapara1 4.25 3.90 4.70 -0.45 -0.80
14 Laxminarayanpur 2.80 4.15 -1.35
15 Mahakalpara 1.60 1.30 16 Mulabasanta 1.30 3.35 -2.05
17 Nikrai1 3.10 2.05 3.50 -0.40 -1.45
18 Pattamundai3 3.00 1.90 3.40 -0.40 -1.50
19 Rajgarh 3.00 3.00 0.00 20 Rajnagar 2.80 1.60 3.05 -0.25 -1.45
21 Ramnagar 2.45 1.90 3.20 -0.75 -1.30
22 Shyamsundarpur 3.50 1.65 4.00 -0.50 -2.35
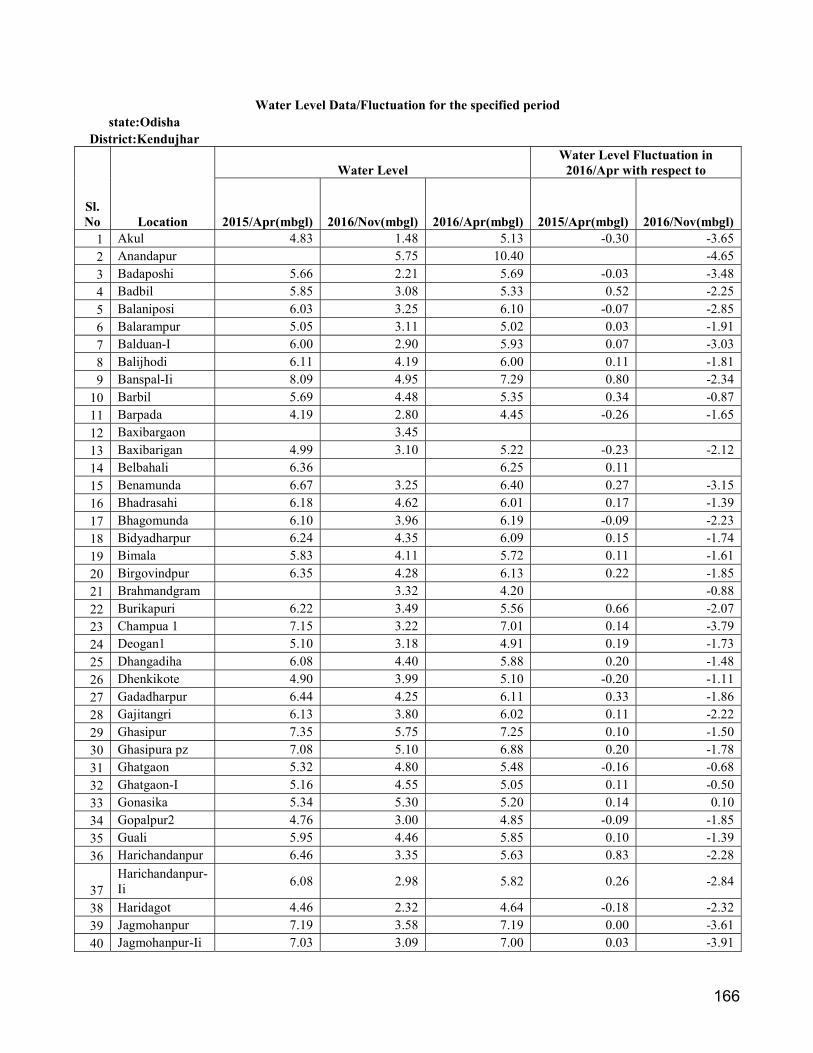
166
Water Level Data/Fluctuation for the specified period state:Odisha
District:Kendujhar
Sl. No Location
Water Level Water Level Fluctuation in
2016/Apr with respect to
2015/Apr(mbgl) 2016/Nov(mbgl) 2016/Apr(mbgl) 2015/Apr(mbgl) 2016/Nov(mbgl) 1 Akul 4.83 1.48 5.13 -0.30 -3.65
2 Anandapur 5.75 10.40 -4.65
3 Badaposhi 5.66 2.21 5.69 -0.03 -3.48
4 Badbil 5.85 3.08 5.33 0.52 -2.25
5 Balaniposi 6.03 3.25 6.10 -0.07 -2.85
6 Balarampur 5.05 3.11 5.02 0.03 -1.91
7 Balduan-I 6.00 2.90 5.93 0.07 -3.03
8 Balijhodi 6.11 4.19 6.00 0.11 -1.81
9 Banspal-Ii 8.09 4.95 7.29 0.80 -2.34
10 Barbil 5.69 4.48 5.35 0.34 -0.87
11 Barpada 4.19 2.80 4.45 -0.26 -1.65
12 Baxibargaon 3.45 13 Baxibarigan 4.99 3.10 5.22 -0.23 -2.12
14 Belbahali 6.36 6.25 0.11 15 Benamunda 6.67 3.25 6.40 0.27 -3.15
16 Bhadrasahi 6.18 4.62 6.01 0.17 -1.39
17 Bhagomunda 6.10 3.96 6.19 -0.09 -2.23
18 Bidyadharpur 6.24 4.35 6.09 0.15 -1.74
19 Bimala 5.83 4.11 5.72 0.11 -1.61
20 Birgovindpur 6.35 4.28 6.13 0.22 -1.85
21 Brahmandgram 3.32 4.20 -0.88
22 Burikapuri 6.22 3.49 5.56 0.66 -2.07
23 Champua 1 7.15 3.22 7.01 0.14 -3.79
24 Deogan1 5.10 3.18 4.91 0.19 -1.73
25 Dhangadiha 6.08 4.40 5.88 0.20 -1.48
26 Dhenkikote 4.90 3.99 5.10 -0.20 -1.11
27 Gadadharpur 6.44 4.25 6.11 0.33 -1.86
28 Gajitangri 6.13 3.80 6.02 0.11 -2.22
29 Ghasipur 7.35 5.75 7.25 0.10 -1.50
30 Ghasipura pz 7.08 5.10 6.88 0.20 -1.78
31 Ghatgaon 5.32 4.80 5.48 -0.16 -0.68
32 Ghatgaon-I 5.16 4.55 5.05 0.11 -0.50
33 Gonasika 5.34 5.30 5.20 0.14 0.10
34 Gopalpur2 4.76 3.00 4.85 -0.09 -1.85
35 Guali 5.95 4.46 5.85 0.10 -1.39
36 Harichandanpur 6.46 3.35 5.63 0.83 -2.28
37 Harichandanpur-Ii
6.08 2.98 5.82 0.26 -2.84
38 Haridagot 4.46 2.32 4.64 -0.18 -2.32
39 Jagmohanpur 7.19 3.58 7.19 0.00 -3.61
40 Jagmohanpur-Ii 7.03 3.09 7.00 0.03 -3.91
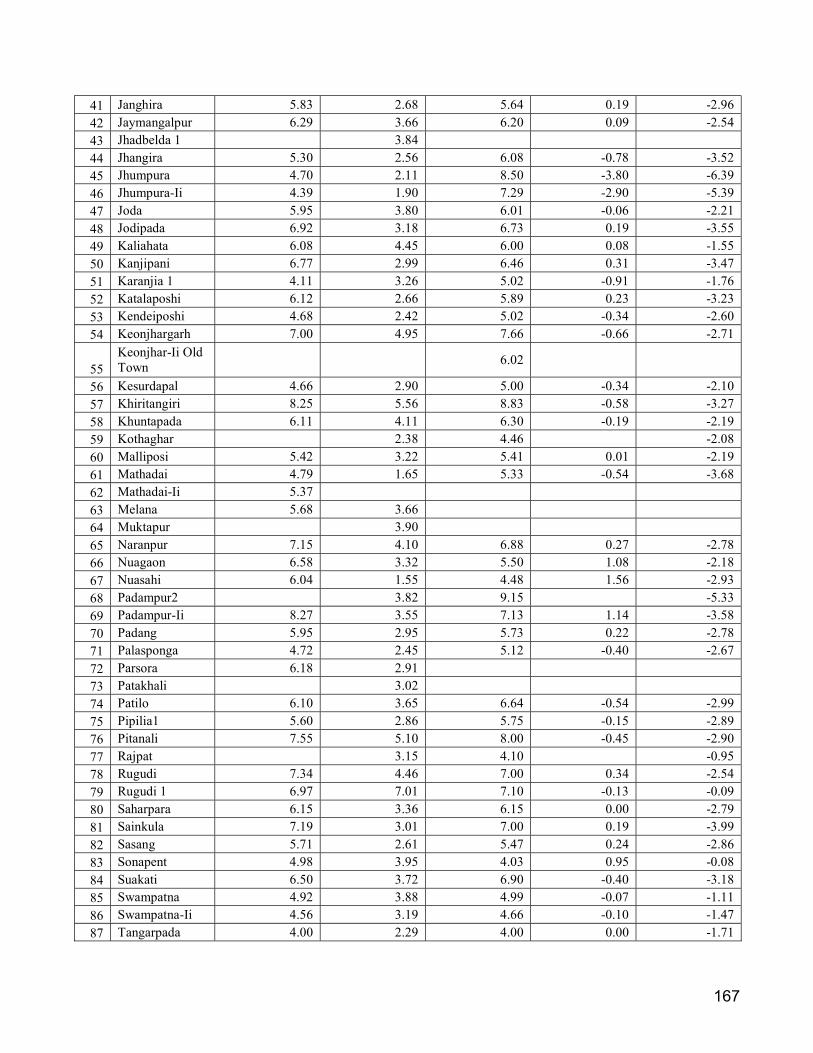
167
41 Janghira 5.83 2.68 5.64 0.19 -2.96
42 Jaymangalpur 6.29 3.66 6.20 0.09 -2.54
43 Jhadbelda 1 3.84 44 Jhangira 5.30 2.56 6.08 -0.78 -3.52
45 Jhumpura 4.70 2.11 8.50 -3.80 -6.39
46 Jhumpura-Ii 4.39 1.90 7.29 -2.90 -5.39
47 Joda 5.95 3.80 6.01 -0.06 -2.21
48 Jodipada 6.92 3.18 6.73 0.19 -3.55
49 Kaliahata 6.08 4.45 6.00 0.08 -1.55
50 Kanjipani 6.77 2.99 6.46 0.31 -3.47
51 Karanjia 1 4.11 3.26 5.02 -0.91 -1.76
52 Katalaposhi 6.12 2.66 5.89 0.23 -3.23
53 Kendeiposhi 4.68 2.42 5.02 -0.34 -2.60
54 Keonjhargarh 7.00 4.95 7.66 -0.66 -2.71
55 Keonjhar-Ii Old Town
6.02
56 Kesurdapal 4.66 2.90 5.00 -0.34 -2.10
57 Khiritangiri 8.25 5.56 8.83 -0.58 -3.27
58 Khuntapada 6.11 4.11 6.30 -0.19 -2.19
59 Kothaghar 2.38 4.46 -2.08
60 Malliposi 5.42 3.22 5.41 0.01 -2.19
61 Mathadai 4.79 1.65 5.33 -0.54 -3.68
62 Mathadai-Ii 5.37 63 Melana 5.68 3.66 64 Muktapur 3.90 65 Naranpur 7.15 4.10 6.88 0.27 -2.78
66 Nuagaon 6.58 3.32 5.50 1.08 -2.18
67 Nuasahi 6.04 1.55 4.48 1.56 -2.93
68 Padampur2 3.82 9.15 -5.33
69 Padampur-Ii 8.27 3.55 7.13 1.14 -3.58
70 Padang 5.95 2.95 5.73 0.22 -2.78
71 Palasponga 4.72 2.45 5.12 -0.40 -2.67
72 Parsora 6.18 2.91 73 Patakhali 3.02 74 Patilo 6.10 3.65 6.64 -0.54 -2.99
75 Pipilia1 5.60 2.86 5.75 -0.15 -2.89
76 Pitanali 7.55 5.10 8.00 -0.45 -2.90
77 Rajpat 3.15 4.10 -0.95
78 Rugudi 7.34 4.46 7.00 0.34 -2.54
79 Rugudi 1 6.97 7.01 7.10 -0.13 -0.09
80 Saharpara 6.15 3.36 6.15 0.00 -2.79
81 Sainkula 7.19 3.01 7.00 0.19 -3.99
82 Sasang 5.71 2.61 5.47 0.24 -2.86
83 Sonapent 4.98 3.95 4.03 0.95 -0.08
84 Suakati 6.50 3.72 6.90 -0.40 -3.18
85 Swampatna 4.92 3.88 4.99 -0.07 -1.11
86 Swampatna-Ii 4.56 3.19 4.66 -0.10 -1.47
87 Tangarpada 4.00 2.29 4.00 0.00 -1.71

168
88 Telkoi 7.66 4.02 7.18 0.48 -3.16
89 Turmunga 6.16 3.22 6.50 -0.34 -3.28
90 Udaipur 5.19 3.82 5.05 0.14 -1.23
91 Udaipur-Ii 5.00 3.15 4.85 0.15 -1.70
92 Ukunta 4.46 5.11 -0.65
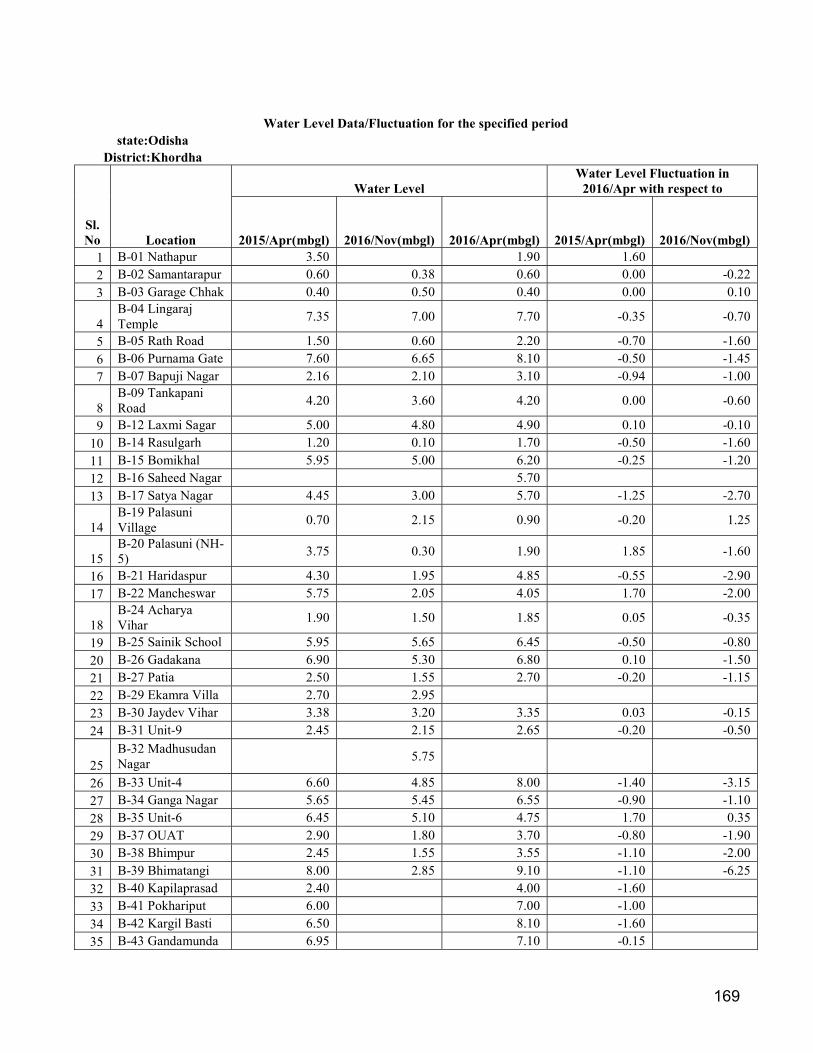
169
Water Level Data/Fluctuation for the specified period
state:Odisha District:Khordha
Sl. No Location
Water Level Water Level Fluctuation in
2016/Apr with respect to
2015/Apr(mbgl) 2016/Nov(mbgl) 2016/Apr(mbgl) 2015/Apr(mbgl) 2016/Nov(mbgl) 1 B-01 Nathapur 3.50 1.90 1.60 2 B-02 Samantarapur 0.60 0.38 0.60 0.00 -0.22
3 B-03 Garage Chhak 0.40 0.50 0.40 0.00 0.10
4 B-04 Lingaraj Temple
7.35 7.00 7.70 -0.35 -0.70
5 B-05 Rath Road 1.50 0.60 2.20 -0.70 -1.60
6 B-06 Purnama Gate 7.60 6.65 8.10 -0.50 -1.45
7 B-07 Bapuji Nagar 2.16 2.10 3.10 -0.94 -1.00
8 B-09 Tankapani Road
4.20 3.60 4.20 0.00 -0.60
9 B-12 Laxmi Sagar 5.00 4.80 4.90 0.10 -0.10
10 B-14 Rasulgarh 1.20 0.10 1.70 -0.50 -1.60
11 B-15 Bomikhal 5.95 5.00 6.20 -0.25 -1.20
12 B-16 Saheed Nagar 5.70 13 B-17 Satya Nagar 4.45 3.00 5.70 -1.25 -2.70
14 B-19 Palasuni Village
0.70 2.15 0.90 -0.20 1.25
15 B-20 Palasuni (NH-5)
3.75 0.30 1.90 1.85 -1.60
16 B-21 Haridaspur 4.30 1.95 4.85 -0.55 -2.90
17 B-22 Mancheswar 5.75 2.05 4.05 1.70 -2.00
18 B-24 Acharya Vihar
1.90 1.50 1.85 0.05 -0.35
19 B-25 Sainik School 5.95 5.65 6.45 -0.50 -0.80
20 B-26 Gadakana 6.90 5.30 6.80 0.10 -1.50
21 B-27 Patia 2.50 1.55 2.70 -0.20 -1.15
22 B-29 Ekamra Villa 2.70 2.95 23 B-30 Jaydev Vihar 3.38 3.20 3.35 0.03 -0.15
24 B-31 Unit-9 2.45 2.15 2.65 -0.20 -0.50
25 B-32 Madhusudan Nagar
5.75
26 B-33 Unit-4 6.60 4.85 8.00 -1.40 -3.15
27 B-34 Ganga Nagar 5.65 5.45 6.55 -0.90 -1.10
28 B-35 Unit-6 6.45 5.10 4.75 1.70 0.35
29 B-37 OUAT 2.90 1.80 3.70 -0.80 -1.90
30 B-38 Bhimpur 2.45 1.55 3.55 -1.10 -2.00
31 B-39 Bhimatangi 8.00 2.85 9.10 -1.10 -6.25
32 B-40 Kapilaprasad 2.40 4.00 -1.60 33 B-41 Pokhariput 6.00 7.00 -1.00 34 B-42 Kargil Basti 6.50 8.10 -1.60 35 B-43 Gandamunda 6.95 7.10 -0.15
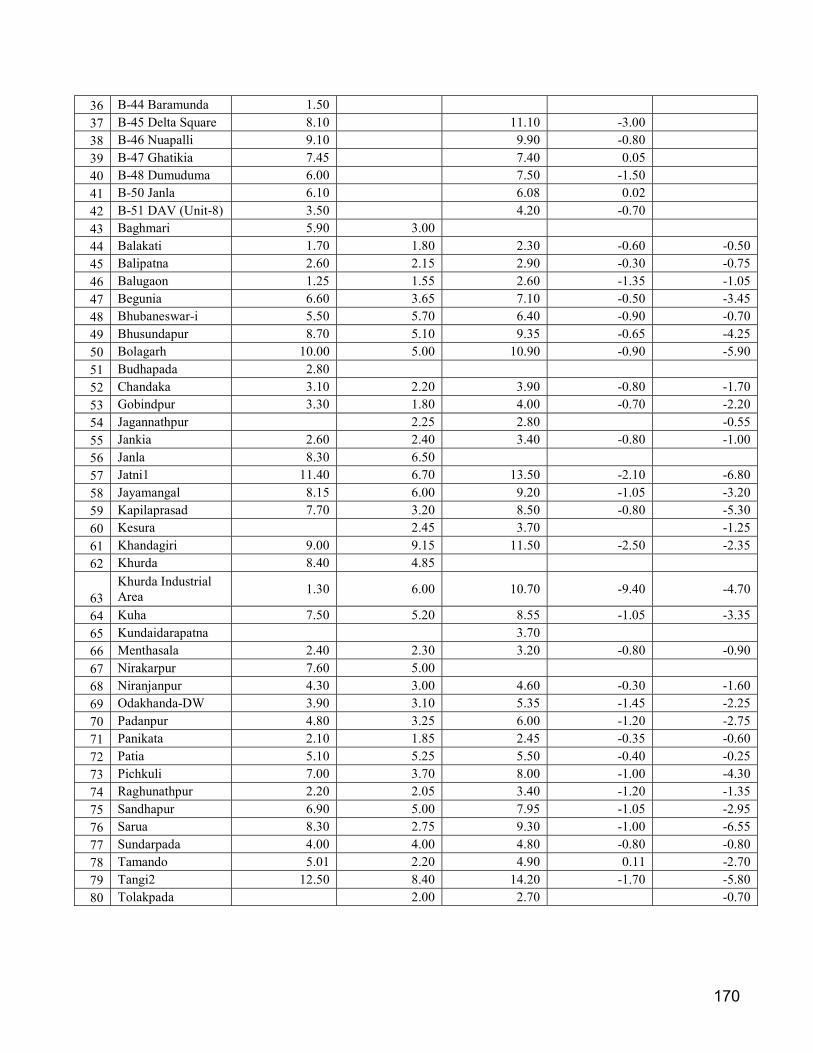
170
36 B-44 Baramunda 1.50 37 B-45 Delta Square 8.10 11.10 -3.00 38 B-46 Nuapalli 9.10 9.90 -0.80 39 B-47 Ghatikia 7.45 7.40 0.05 40 B-48 Dumuduma 6.00 7.50 -1.50 41 B-50 Janla 6.10 6.08 0.02 42 B-51 DAV (Unit-8) 3.50 4.20 -0.70 43 Baghmari 5.90 3.00 44 Balakati 1.70 1.80 2.30 -0.60 -0.50
45 Balipatna 2.60 2.15 2.90 -0.30 -0.75
46 Balugaon 1.25 1.55 2.60 -1.35 -1.05
47 Begunia 6.60 3.65 7.10 -0.50 -3.45
48 Bhubaneswar-i 5.50 5.70 6.40 -0.90 -0.70
49 Bhusundapur 8.70 5.10 9.35 -0.65 -4.25
50 Bolagarh 10.00 5.00 10.90 -0.90 -5.90
51 Budhapada 2.80 52 Chandaka 3.10 2.20 3.90 -0.80 -1.70
53 Gobindpur 3.30 1.80 4.00 -0.70 -2.20
54 Jagannathpur 2.25 2.80 -0.55
55 Jankia 2.60 2.40 3.40 -0.80 -1.00
56 Janla 8.30 6.50 57 Jatni1 11.40 6.70 13.50 -2.10 -6.80
58 Jayamangal 8.15 6.00 9.20 -1.05 -3.20
59 Kapilaprasad 7.70 3.20 8.50 -0.80 -5.30
60 Kesura 2.45 3.70 -1.25
61 Khandagiri 9.00 9.15 11.50 -2.50 -2.35
62 Khurda 8.40 4.85
63 Khurda Industrial Area
1.30 6.00 10.70 -9.40 -4.70
64 Kuha 7.50 5.20 8.55 -1.05 -3.35
65 Kundaidarapatna 3.70 66 Menthasala 2.40 2.30 3.20 -0.80 -0.90
67 Nirakarpur 7.60 5.00 68 Niranjanpur 4.30 3.00 4.60 -0.30 -1.60
69 Odakhanda-DW 3.90 3.10 5.35 -1.45 -2.25
70 Padanpur 4.80 3.25 6.00 -1.20 -2.75
71 Panikata 2.10 1.85 2.45 -0.35 -0.60
72 Patia 5.10 5.25 5.50 -0.40 -0.25
73 Pichkuli 7.00 3.70 8.00 -1.00 -4.30
74 Raghunathpur 2.20 2.05 3.40 -1.20 -1.35
75 Sandhapur 6.90 5.00 7.95 -1.05 -2.95
76 Sarua 8.30 2.75 9.30 -1.00 -6.55
77 Sundarpada 4.00 4.00 4.80 -0.80 -0.80
78 Tamando 5.01 2.20 4.90 0.11 -2.70
79 Tangi2 12.50 8.40 14.20 -1.70 -5.80
80 Tolakpada 2.00 2.70 -0.70

171
Water Level Data/Fluctuation for the specified period state:Odisha
District:Koraput
Sl. No Location
Water Level Water Level Fluctuation in
2016/Apr with respect to
2015/Apr(mbgl) 2016/Nov(mbgl) 2016/Apr(mbgl) 2015/Apr(mbgl) 2016/Nov(mbgl) 1 Ambaguda1 5.10 4.00 5.30 -0.20 -1.30
2 Anta 3.60 2.30 4.10 -0.50 -1.80
3 Baipariguda 7.50 4.20 7.25 0.25 -3.05
4 Bajiguda 6.75 5.05 8.00 -1.25 -2.95
5 Balia 1.75 0.55 2.35 -0.60 -1.80
6 Bangalaguda 5.10 2.70 7.00 -1.90 -4.30
7 Bheja 1 3.95 6.90 6.20 -2.25 0.70
8 Bijapur 3.95 1.25 4.05 -0.10 -2.80
9 Boriguma 8.35 2.60 8.55 -0.20 -5.95
10 Burja 5.00 8.30 -3.30
11 C.kusimi-i 5.80 2.00 6.10 -0.30 -4.10
12 Chandli 3.20 0.50 3.45 -0.25 -2.95
13 Chingudichuan 3.70 3.80 3.80 -0.10 0.00
14 C-kusumi-ii 4.30 2.70 6.10 -1.80 -3.40
15 Damanahandi 1.05 0.70 3.85 -2.80 -3.15
16 Dasmanthapur 3.75 1.85 3.95 -0.20 -2.10
17 Deoghati 6.15 4.03 6.35 -0.20 -2.32
18 Dhamanaganda 0.05 3.00 -2.95
19 Dhaulapur 8.80 5.45 8.80 0.00 -3.35
20
Disarikaraguda-New Colony
7.00 8.40
-1.40
21 Doraguda 7.25 6.05 7.55 -0.30 -1.50
22 Dumuriput 9.60 7.00 10.20 -0.60 -3.20
23 Ghatarala 1.55 2.20 2.00 -0.45 0.20
24 Gumur 3.35 2.90 4.00 -0.65 -1.10
25 Jayantigiri 4.40 2.80 5.70 -1.30 -2.90
26 Jeypore1 8.55 5.60 8.85 -0.30 -3.25
27 Jujari 2.40 0.85 2.50 -0.10 -1.65
28 Kakriguma 12.00 11.35 12.15 -0.15 -0.80
29 Kantarkhal 1 3.40 2.50 3.60 -0.20 -1.10
30 Kenduguda 0.70 0.80 0.70 0.00 0.10
31 Khaliaguda 1.30 1.40 1.10 0.20 0.30
32 Konga 3.10 2.90 3.25 -0.15 -0.35
33 Koraput-i 10.80 7.00 10.30 0.50 -3.30
34 Koraput-ii 1.60 35 Kotpad 2.40 0.60 2.80 -0.40 -2.20
36 Kunduli 5.75 3.95 5.85 -0.10 -1.90
37 Kusumguda 7.40 6.50 7.50 -0.10 -1.00
38 Lamtaput 9.70 6.60 9.90 -0.20 -3.30
39 Laxmipur1 10.15 9.03 10.85 -0.70 -1.82
40 Mandalguda 8.50 7.90
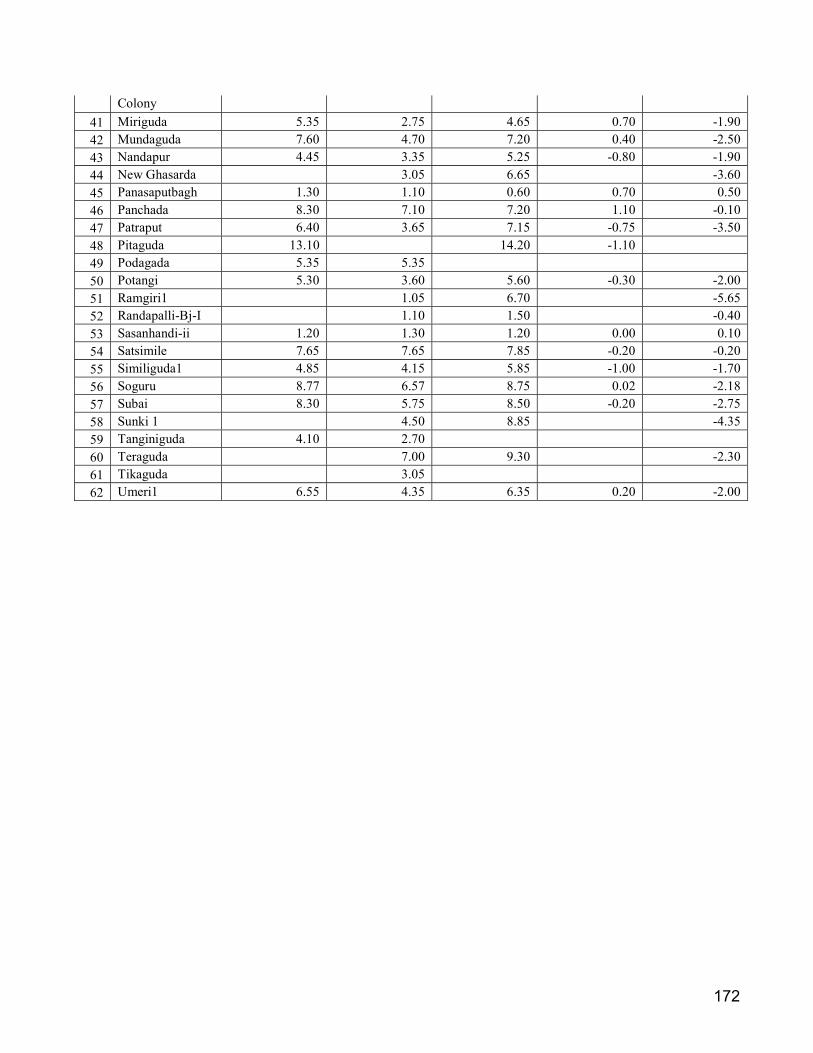
172
Colony
41 Miriguda 5.35 2.75 4.65 0.70 -1.90
42 Mundaguda 7.60 4.70 7.20 0.40 -2.50
43 Nandapur 4.45 3.35 5.25 -0.80 -1.90
44 New Ghasarda 3.05 6.65 -3.60
45 Panasaputbagh 1.30 1.10 0.60 0.70 0.50
46 Panchada 8.30 7.10 7.20 1.10 -0.10
47 Patraput 6.40 3.65 7.15 -0.75 -3.50
48 Pitaguda 13.10 14.20 -1.10 49 Podagada 5.35 5.35 50 Potangi 5.30 3.60 5.60 -0.30 -2.00
51 Ramgiri1 1.05 6.70 -5.65
52 Randapalli-Bj-I 1.10 1.50 -0.40
53 Sasanhandi-ii 1.20 1.30 1.20 0.00 0.10
54 Satsimile 7.65 7.65 7.85 -0.20 -0.20
55 Similiguda1 4.85 4.15 5.85 -1.00 -1.70
56 Soguru 8.77 6.57 8.75 0.02 -2.18
57 Subai 8.30 5.75 8.50 -0.20 -2.75
58 Sunki 1 4.50 8.85 -4.35
59 Tanginiguda 4.10 2.70 60 Teraguda 7.00 9.30 -2.30
61 Tikaguda 3.05 62 Umeri1 6.55 4.35 6.35 0.20 -2.00

173
Water Level Data/Fluctuation for the specified period state:Odisha
District:Malkangiri
Sl. No Location
Water Level Water Level Fluctuation in
2016/Apr with respect to
2015/Apr(mbgl) 2016/Nov(mbgl) 2016/Apr(mbgl) 2015/Apr(mbgl) 2016/Nov(mbgl) 1 Balimela 2.00 1.80 3.50 -1.50 -1.70
2 Balimela Chowk 1.20 3 Bejaguda 8.25 4.10 7.20 1.05 -3.10
4 Chitapari 4.75 1.65 5.05 -0.30 -3.40
5 Govindpali 1 6.50 4.40 6.20 0.30 -1.80
6 Katameta 3.90 1.10 3.95 -0.05 -2.85
7 Khairput1 3.55 1.85 3.95 -0.40 -2.10
8 Korukonda 1 0.90 2.00 -1.10
9 Kudumuluguma1 2.95 1.45 3.45 -0.50 -2.00
10 Kumbharguda 2.75 1.15 2.75 0.00 -1.60
11 M.V 37 3.20 2.30 3.80 -0.60 -1.50
12 M.V.7 8.89 2.50 13 M.V.9 7.90 1.20 5.70 2.20 -4.50
14 M.V1- 19 1.25 2.35 3.30 -2.05 -0.95
15 Maithili1 3.80 1.20 4.50 -0.70 -3.30
16 Malkangiri 1 3.70 0.80 3.45 0.25 -2.65
17 Mundiguda 3.30 1.60 4.10 -0.80 -2.50
18 Parkannala 5.70 2.25 6.10 -0.40 -3.85
19 Pongam 6.60 3.00 6.70 -0.10 -3.70
20 Sindhimal 4.95 1.70 5.50 -0.55 -3.80
21 Somnathpur 1 1.40 2.20 4.00 -2.60 -1.80

174
Water Level Data/Fluctuation for the specified period state:Odisha
District:Mayurbhanj
Sl. No Location
Water Level Water Level Fluctuation in
2016/Apr with respect to
2015/Apr(mbgl) 2016/Nov(mbgl) 2016/Apr(mbgl) 2015/Apr(mbgl) 2016/Nov(mbgl) 1 Amarda village 4.88 2.68 4.95 -0.07 -2.27
2 Ambadiha 5.05 3.81 5.08 -0.03 -1.27
3 Asanbani 5.83 3.66 5.80 0.03 -2.14
4 Badampahad-1 9.88 5.98 9.90 -0.02 -3.92
5 Badasahi 4.60 2.55 4.98 -0.38 -2.43
6 Bademtolia 5.80 5.00 5.82 -0.02 -0.82
7 Bagra 7.32 3.18 7.35 -0.03 -4.17
8 Bahalda 6.13 3.22 6.42 -0.29 -3.20
9 Bahalda Road(kona)
3.15 6.13
-2.98
10 Baidipur 2.65 5.12 -2.47
11 Bangriposi 8.89 5.17 12 Baripada 14.50 9.18 15.77 -1.27 -6.59
13 Bedhakudar 6.75 3.82 6.77 -0.02 -2.95
14 Begna 7.55 5.11 7.13 0.42 -2.02
15 Belam 6.13 3.55 7.19 -1.06 -3.64
16 Betanoti 5.96 2.65 5.44 0.52 -2.79
17 Bhatachhatra 5.65 2.74 5.41 0.24 -2.67
18 Bisoi 10.22 4.00 9.11 1.11 -5.11
19 Brundabanchan 6.88 3.62 20 Chadheibhol 5.72 3.01 5.60 0.12 -2.59
21 Champajhar 5.09 3.28 22 Champrai 5.52 2.88 5.72 -0.20 -2.84
23 Chandanpur 6.44 3.32 6.00 0.44 -2.68
24 Chitrada 6.28 4.10 6.29 -0.01 -2.19
25 Dandabose 3.80 4.48 -0.68
26 Dari 6.02 4.16 6.00 0.02 -1.84
27 Devsol 6.65 3.15 6.18 0.47 -3.03
28 Dhanpur 5.82 3.28 5.73 0.09 -2.45
29 Dukura 7.33 2.86 7.25 0.08 -4.39
30 Gambharia 5.52 3.22 5.41 0.11 -2.19
31 Gorumahisani 9.65 8.13 1.52 32 Hatjori 5.78 2.73 5.11 0.67 -2.38
33 Indupur 5.97 3.15 5.85 0.12 -2.70
34 Itighar 6.80 3.75 6.73 0.07 -2.98
35 Jamda 6.62 3.64 6.15 0.47 -2.51
36 Jamsola 8.11 5.88 8.01 0.10 -2.13
37 Jamukeswar 2.92 5.14 -2.22
38 Jharpokhari 7.41 3.66 7.10 0.31 -3.44
39 Jhunkapal 8.68 4.18 8.03 0.65 -3.85
40 Joshipur 5.88 4.02 5.95 -0.07 -1.93
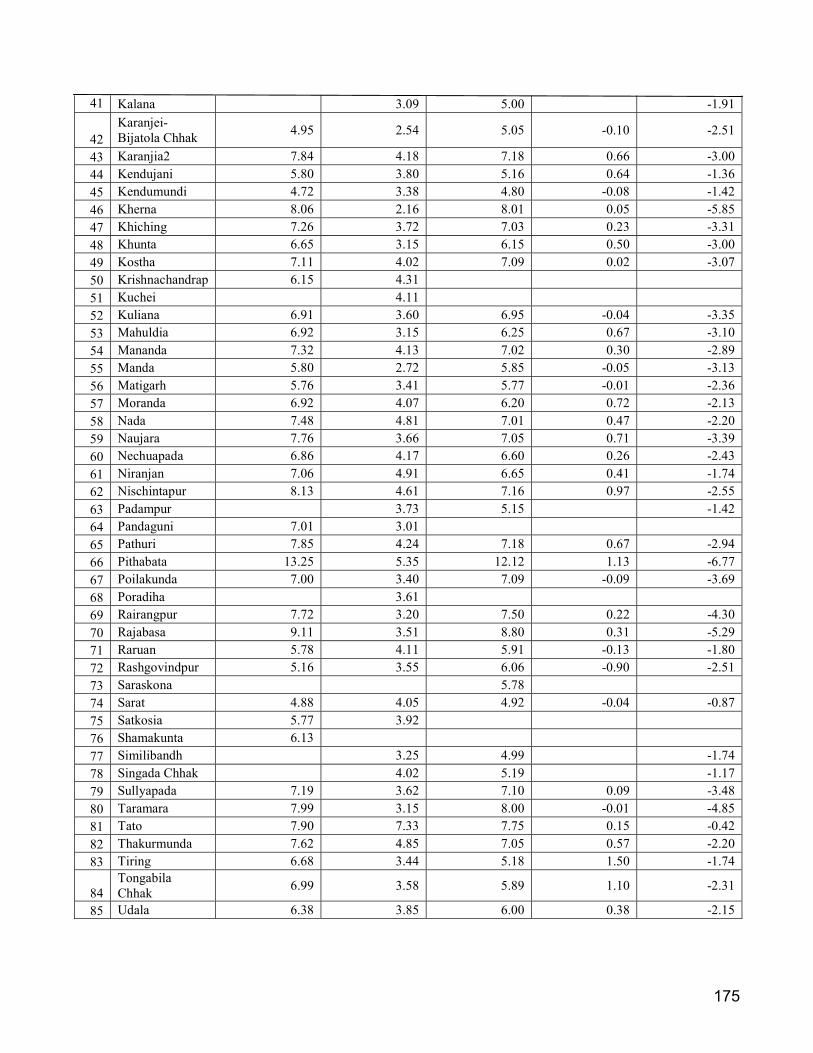
175
41 Kalana 3.09 5.00 -1.91
42 Karanjei-Bijatola Chhak
4.95 2.54 5.05 -0.10 -2.51
43 Karanjia2 7.84 4.18 7.18 0.66 -3.00
44 Kendujani 5.80 3.80 5.16 0.64 -1.36
45 Kendumundi 4.72 3.38 4.80 -0.08 -1.42
46 Kherna 8.06 2.16 8.01 0.05 -5.85
47 Khiching 7.26 3.72 7.03 0.23 -3.31
48 Khunta 6.65 3.15 6.15 0.50 -3.00
49 Kostha 7.11 4.02 7.09 0.02 -3.07
50 Krishnachandrap 6.15 4.31 51 Kuchei 4.11 52 Kuliana 6.91 3.60 6.95 -0.04 -3.35
53 Mahuldia 6.92 3.15 6.25 0.67 -3.10
54 Mananda 7.32 4.13 7.02 0.30 -2.89
55 Manda 5.80 2.72 5.85 -0.05 -3.13
56 Matigarh 5.76 3.41 5.77 -0.01 -2.36
57 Moranda 6.92 4.07 6.20 0.72 -2.13
58 Nada 7.48 4.81 7.01 0.47 -2.20
59 Naujara 7.76 3.66 7.05 0.71 -3.39
60 Nechuapada 6.86 4.17 6.60 0.26 -2.43
61 Niranjan 7.06 4.91 6.65 0.41 -1.74
62 Nischintapur 8.13 4.61 7.16 0.97 -2.55
63 Padampur 3.73 5.15 -1.42
64 Pandaguni 7.01 3.01 65 Pathuri 7.85 4.24 7.18 0.67 -2.94
66 Pithabata 13.25 5.35 12.12 1.13 -6.77
67 Poilakunda 7.00 3.40 7.09 -0.09 -3.69
68 Poradiha 3.61 69 Rairangpur 7.72 3.20 7.50 0.22 -4.30
70 Rajabasa 9.11 3.51 8.80 0.31 -5.29
71 Raruan 5.78 4.11 5.91 -0.13 -1.80
72 Rashgovindpur 5.16 3.55 6.06 -0.90 -2.51
73 Saraskona 5.78 74 Sarat 4.88 4.05 4.92 -0.04 -0.87
75 Satkosia 5.77 3.92 76 Shamakunta 6.13 77 Similibandh 3.25 4.99 -1.74
78 Singada Chhak 4.02 5.19 -1.17
79 Sullyapada 7.19 3.62 7.10 0.09 -3.48
80 Taramara 7.99 3.15 8.00 -0.01 -4.85
81 Tato 7.90 7.33 7.75 0.15 -0.42
82 Thakurmunda 7.62 4.85 7.05 0.57 -2.20
83 Tiring 6.68 3.44 5.18 1.50 -1.74
84 Tongabila Chhak
6.99 3.58 5.89 1.10 -2.31
85 Udala 6.38 3.85 6.00 0.38 -2.15

176
Water Level Data/Fluctuation for the specified period state:Odisha
District:Nabarangpur
Sl. No Location
Water Level Water Level Fluctuation in
2016/Apr with respect to
2015/Apr(mbgl) 2016/Nov(mbgl) 2016/Apr(mbgl) 2015/Apr(mbgl) 2016/Nov(mbgl) 1 Anchalguma1 4.25 2.15 6.05 -1.80 -3.90
2 Baheda 3.00 8.70 -5.70
3 Baksaguda 6.30 4.10 6.50 -0.20 -2.40
4 Bhaskel-dam sit 2.40
5 Dadia-Majhiguda
5.50 2.60 6.10 -0.60 -3.50
6 Daibata 7.50 4.20 8.40 -0.90 -4.20
7 Debugaon 1.30 5.50 -4.20
8 Dengaguda 5.40 3.30 6.00 -0.60 -2.70
9 Digi 3.80 2.30 4.50 -0.70 -2.20
10 Dondasora 1.30 11 Fufugaon 4.35 3.00 6.20 -1.85 -3.20
12 Jharigan 4.40 2.00 6.50 -2.10 -4.50
13 Karchamal 9.00 4.95 9.70 -0.70 -4.75
14 Kodinga 5.45 2.55 7.75 -2.30 -5.20
15 Kosagumunda 4.20 3.65 16 Kurlaghati 3.70 1.20 3.80 -0.10 -2.60
17 Maidalpur1 6.55 1.80 7.70 -1.15 -5.90
18 Nandahandi 4.00 3.00 5.90 -1.90 -2.90
19 Nowrangpur 1 2.30 1.60 3.30 -1.00 -1.70
20 Papadahandi1 7.00 4.80 6.90 0.10 -2.10
21 Rangamatiguda 10.00 5.20 10.40 -0.40 -5.20
22 Sagarmunda 3.70 2.15 4.20 -0.50 -2.05
23 Sonamasigan 1.75 24 Tentulikunti 1 3.80 2.15 5.85 -2.05 -3.70
25 Udaipur 2.30 4.20 -1.90
26 Umarkot 4.25 1.00 5.00 -0.75 -4.00
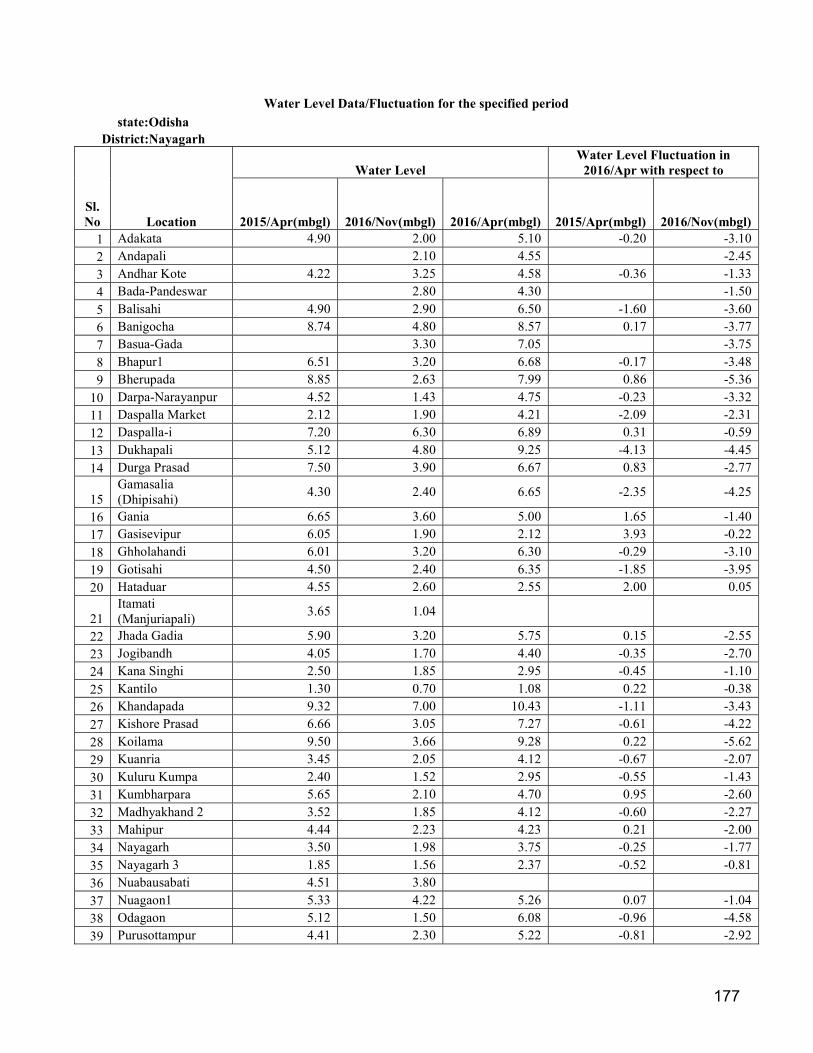
177
Water Level Data/Fluctuation for the specified period
state:Odisha District:Nayagarh
Sl. No Location
Water Level Water Level Fluctuation in
2016/Apr with respect to
2015/Apr(mbgl) 2016/Nov(mbgl) 2016/Apr(mbgl) 2015/Apr(mbgl) 2016/Nov(mbgl) 1 Adakata 4.90 2.00 5.10 -0.20 -3.10
2 Andapali 2.10 4.55 -2.45
3 Andhar Kote 4.22 3.25 4.58 -0.36 -1.33
4 Bada-Pandeswar 2.80 4.30 -1.50
5 Balisahi 4.90 2.90 6.50 -1.60 -3.60
6 Banigocha 8.74 4.80 8.57 0.17 -3.77
7 Basua-Gada 3.30 7.05 -3.75
8 Bhapur1 6.51 3.20 6.68 -0.17 -3.48
9 Bherupada 8.85 2.63 7.99 0.86 -5.36
10 Darpa-Narayanpur 4.52 1.43 4.75 -0.23 -3.32
11 Daspalla Market 2.12 1.90 4.21 -2.09 -2.31
12 Daspalla-i 7.20 6.30 6.89 0.31 -0.59
13 Dukhapali 5.12 4.80 9.25 -4.13 -4.45
14 Durga Prasad 7.50 3.90 6.67 0.83 -2.77
15 Gamasalia (Dhipisahi)
4.30 2.40 6.65 -2.35 -4.25
16 Gania 6.65 3.60 5.00 1.65 -1.40
17 Gasisevipur 6.05 1.90 2.12 3.93 -0.22
18 Ghholahandi 6.01 3.20 6.30 -0.29 -3.10
19 Gotisahi 4.50 2.40 6.35 -1.85 -3.95
20 Hataduar 4.55 2.60 2.55 2.00 0.05
21 Itamati (Manjuriapali)
3.65 1.04
22 Jhada Gadia 5.90 3.20 5.75 0.15 -2.55
23 Jogibandh 4.05 1.70 4.40 -0.35 -2.70
24 Kana Singhi 2.50 1.85 2.95 -0.45 -1.10
25 Kantilo 1.30 0.70 1.08 0.22 -0.38
26 Khandapada 9.32 7.00 10.43 -1.11 -3.43
27 Kishore Prasad 6.66 3.05 7.27 -0.61 -4.22
28 Koilama 9.50 3.66 9.28 0.22 -5.62
29 Kuanria 3.45 2.05 4.12 -0.67 -2.07
30 Kuluru Kumpa 2.40 1.52 2.95 -0.55 -1.43
31 Kumbharpara 5.65 2.10 4.70 0.95 -2.60
32 Madhyakhand 2 3.52 1.85 4.12 -0.60 -2.27
33 Mahipur 4.44 2.23 4.23 0.21 -2.00
34 Nayagarh 3.50 1.98 3.75 -0.25 -1.77
35 Nayagarh 3 1.85 1.56 2.37 -0.52 -0.81
36 Nuabausabati 4.51 3.80 37 Nuagaon1 5.33 4.22 5.26 0.07 -1.04
38 Odagaon 5.12 1.50 6.08 -0.96 -4.58
39 Purusottampur 4.41 2.30 5.22 -0.81 -2.92
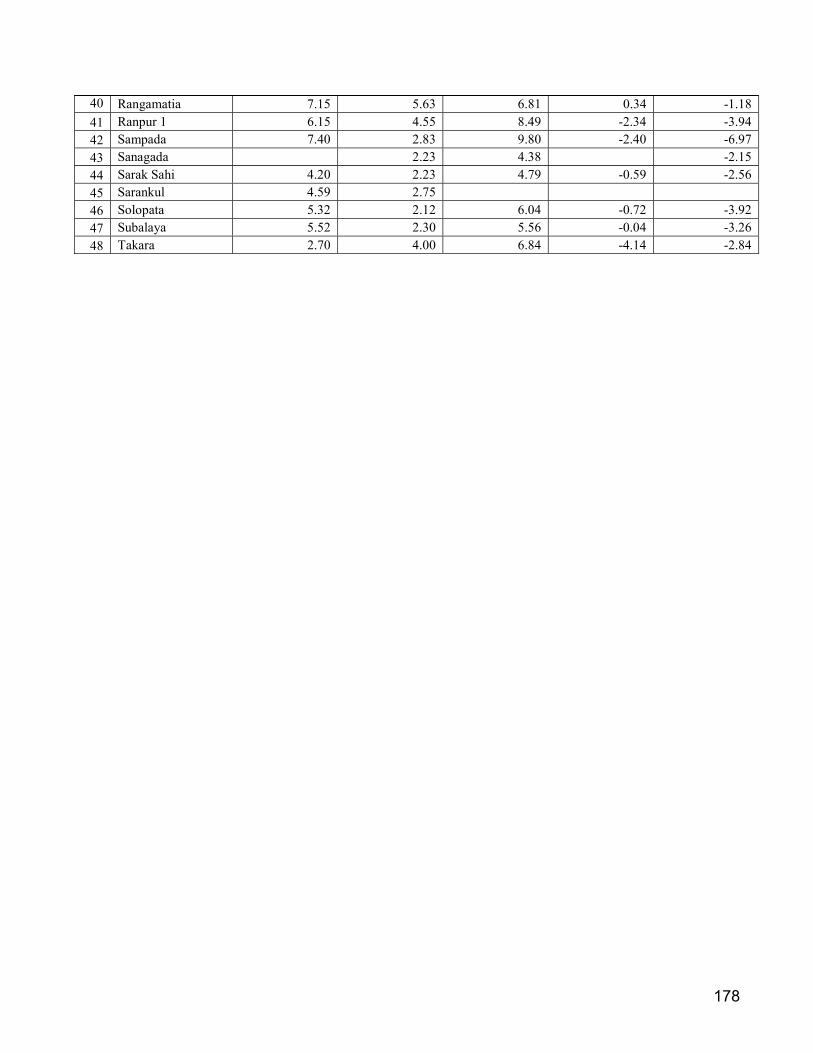
178
40 Rangamatia 7.15 5.63 6.81 0.34 -1.18
41 Ranpur 1 6.15 4.55 8.49 -2.34 -3.94
42 Sampada 7.40 2.83 9.80 -2.40 -6.97
43 Sanagada 2.23 4.38 -2.15
44 Sarak Sahi 4.20 2.23 4.79 -0.59 -2.56
45 Sarankul 4.59 2.75 46 Solopata 5.32 2.12 6.04 -0.72 -3.92
47 Subalaya 5.52 2.30 5.56 -0.04 -3.26
48 Takara 2.70 4.00 6.84 -4.14 -2.84

179
Water Level Data/Fluctuation for the specified period
state:Odisha District:Nuapada
Sl. No Location
Water Level Water Level Fluctuation in
2016/Apr with respect to
2015/Apr(mbgl) 2016/Nov(mbgl) 2016/Apr(mbgl) 2015/Apr(mbgl) 2016/Nov(mbgl)
1 Bada-Maheswar
4.90 6.41
-1.51
2 Bargaon-k 6.20 4.00 5.66 0.54 -1.66
3 Boden 3.30 2.00 4.50 -1.20 -2.50
4 Darlimunda 3.60 2.31 4.52 -0.92 -2.21
5 Deobahal 3.70 3.50 3.80 -0.10 -0.30
6 Godphula 6.35 3.29 7.23 -0.88 -3.94
7 Gotama 4.55 3.77 8 Junani 5.45 2.60 6.00 -0.55 -3.40
9 Kalyanpur 4.87 3.51 6.61 -1.74 -3.10
10 Khariar 8.95 5.50 9.39 -0.44 -3.89
11 Khudpej 5.25 4.00 5.70 -0.45 -1.70
12 Komna1 6.02 3.83 5.64 0.38 -1.81
13 Lachhipur 2.45 1.80 14 Loharapalli 2.90 1.80 3.33 -0.43 -1.53
15 Nawapara 6.87 16 Nilji 6.75 6.00 7.80 -1.05 -1.80
17 Padampur 4.54 2.15 18 Patparpali 3.55 2.01 4.16 -0.61 -2.15
19 Ranipur 5.60 2.50 20 Sahipala 2.20 2.41 5.32 -3.12 -2.91
21 Sanmaheswar 5.86 3.80 8.35 -2.49 -4.55
22 Sirthol 3.15 23 Somarsingh 7.08 6.30 7.80 -0.72 -1.50
24 Tarbod 4.57 3.53 4.94 -0.37 -1.41
25 Tukla 0.85 1.50 3.00 -2.15 -1.50
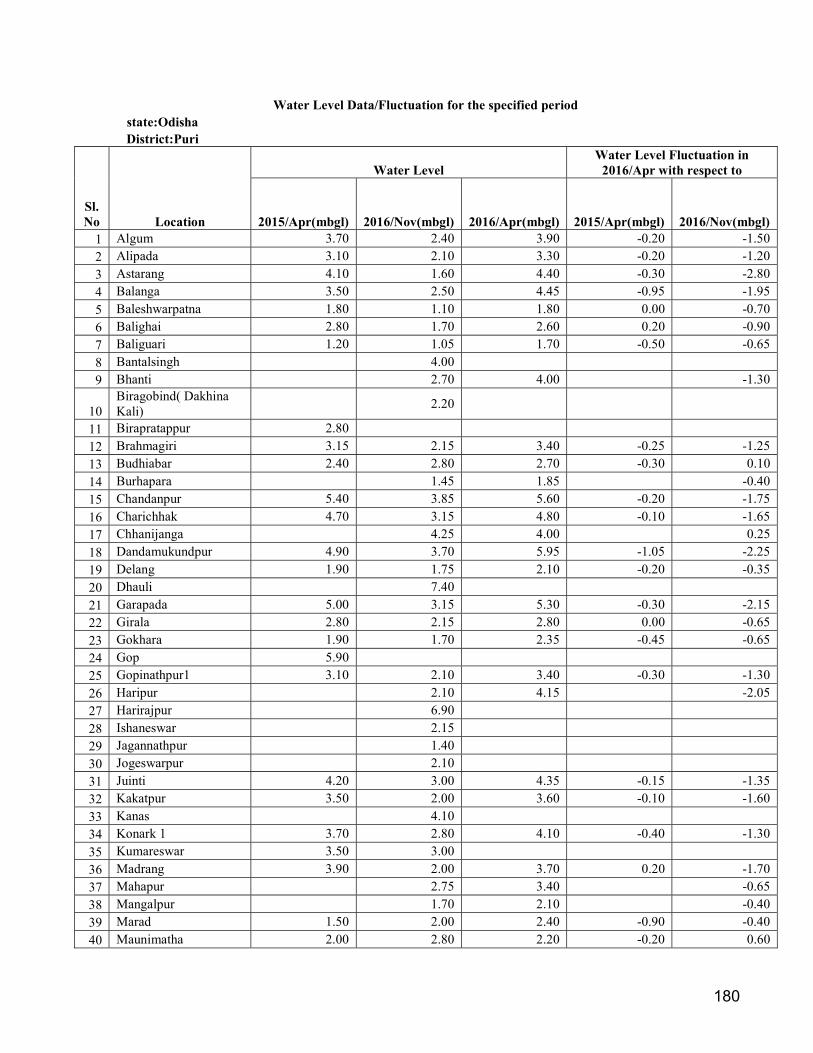
180
Water Level Data/Fluctuation for the specified period state:Odisha District:Puri
Sl. No Location
Water Level Water Level Fluctuation in
2016/Apr with respect to
2015/Apr(mbgl) 2016/Nov(mbgl) 2016/Apr(mbgl) 2015/Apr(mbgl) 2016/Nov(mbgl) 1 Algum 3.70 2.40 3.90 -0.20 -1.50
2 Alipada 3.10 2.10 3.30 -0.20 -1.20
3 Astarang 4.10 1.60 4.40 -0.30 -2.80
4 Balanga 3.50 2.50 4.45 -0.95 -1.95
5 Baleshwarpatna 1.80 1.10 1.80 0.00 -0.70
6 Balighai 2.80 1.70 2.60 0.20 -0.90
7 Baliguari 1.20 1.05 1.70 -0.50 -0.65
8 Bantalsingh 4.00 9 Bhanti 2.70 4.00 -1.30
10 Biragobind( Dakhina Kali)
2.20
11 Birapratappur 2.80 12 Brahmagiri 3.15 2.15 3.40 -0.25 -1.25
13 Budhiabar 2.40 2.80 2.70 -0.30 0.10
14 Burhapara 1.45 1.85 -0.40
15 Chandanpur 5.40 3.85 5.60 -0.20 -1.75
16 Charichhak 4.70 3.15 4.80 -0.10 -1.65
17 Chhanijanga 4.25 4.00 0.25
18 Dandamukundpur 4.90 3.70 5.95 -1.05 -2.25
19 Delang 1.90 1.75 2.10 -0.20 -0.35
20 Dhauli 7.40 21 Garapada 5.00 3.15 5.30 -0.30 -2.15
22 Girala 2.80 2.15 2.80 0.00 -0.65
23 Gokhara 1.90 1.70 2.35 -0.45 -0.65
24 Gop 5.90 25 Gopinathpur1 3.10 2.10 3.40 -0.30 -1.30
26 Haripur 2.10 4.15 -2.05
27 Harirajpur 6.90 28 Ishaneswar 2.15 29 Jagannathpur 1.40 30 Jogeswarpur 2.10 31 Juinti 4.20 3.00 4.35 -0.15 -1.35
32 Kakatpur 3.50 2.00 3.60 -0.10 -1.60
33 Kanas 4.10 34 Konark 1 3.70 2.80 4.10 -0.40 -1.30
35 Kumareswar 3.50 3.00 36 Madrang 3.90 2.00 3.70 0.20 -1.70
37 Mahapur 2.75 3.40 -0.65
38 Mangalpur 1.70 2.10 -0.40
39 Marad 1.50 2.00 2.40 -0.90 -0.40
40 Maunimatha 2.00 2.80 2.20 -0.20 0.60
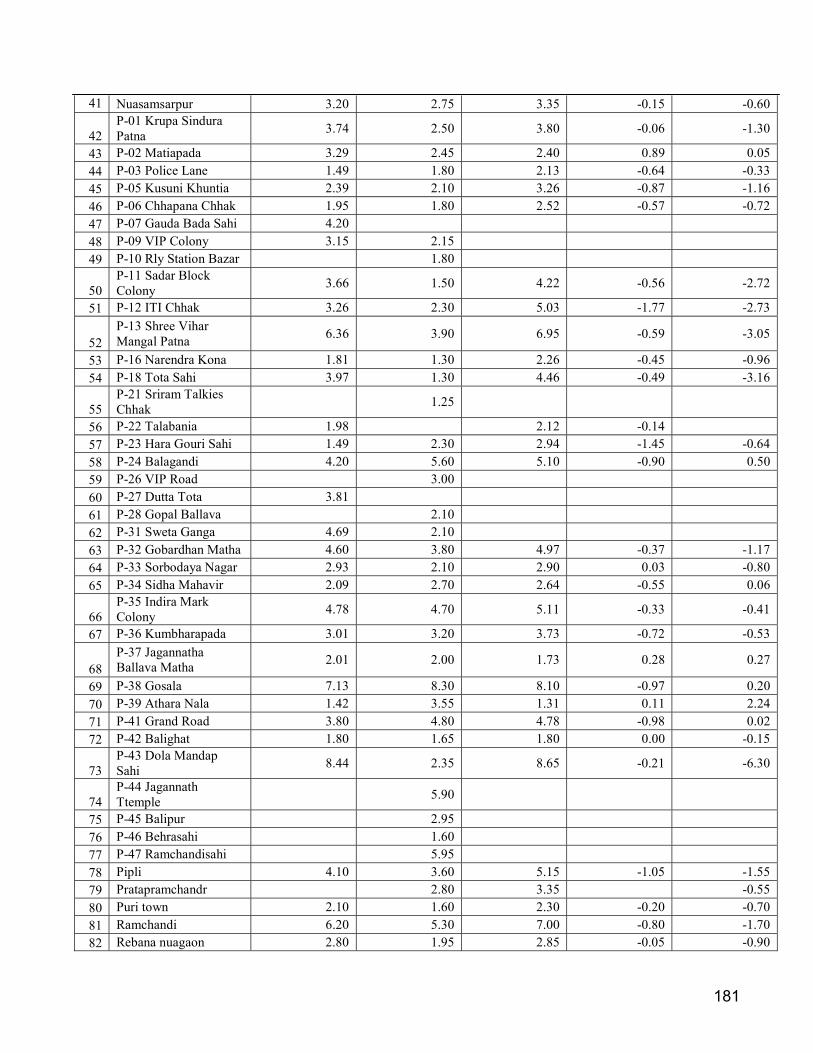
181
41 Nuasamsarpur 3.20 2.75 3.35 -0.15 -0.60
42 P-01 Krupa Sindura Patna
3.74 2.50 3.80 -0.06 -1.30
43 P-02 Matiapada 3.29 2.45 2.40 0.89 0.05
44 P-03 Police Lane 1.49 1.80 2.13 -0.64 -0.33
45 P-05 Kusuni Khuntia 2.39 2.10 3.26 -0.87 -1.16
46 P-06 Chhapana Chhak 1.95 1.80 2.52 -0.57 -0.72
47 P-07 Gauda Bada Sahi 4.20 48 P-09 VIP Colony 3.15 2.15 49 P-10 Rly Station Bazar 1.80
50 P-11 Sadar Block Colony
3.66 1.50 4.22 -0.56 -2.72
51 P-12 ITI Chhak 3.26 2.30 5.03 -1.77 -2.73
52 P-13 Shree Vihar Mangal Patna
6.36 3.90 6.95 -0.59 -3.05
53 P-16 Narendra Kona 1.81 1.30 2.26 -0.45 -0.96
54 P-18 Tota Sahi 3.97 1.30 4.46 -0.49 -3.16
55 P-21 Sriram Talkies Chhak
1.25
56 P-22 Talabania 1.98 2.12 -0.14 57 P-23 Hara Gouri Sahi 1.49 2.30 2.94 -1.45 -0.64
58 P-24 Balagandi 4.20 5.60 5.10 -0.90 0.50
59 P-26 VIP Road 3.00 60 P-27 Dutta Tota 3.81 61 P-28 Gopal Ballava 2.10 62 P-31 Sweta Ganga 4.69 2.10 63 P-32 Gobardhan Matha 4.60 3.80 4.97 -0.37 -1.17
64 P-33 Sorbodaya Nagar 2.93 2.10 2.90 0.03 -0.80
65 P-34 Sidha Mahavir 2.09 2.70 2.64 -0.55 0.06
66 P-35 Indira Mark Colony
4.78 4.70 5.11 -0.33 -0.41
67 P-36 Kumbharapada 3.01 3.20 3.73 -0.72 -0.53
68 P-37 Jagannatha Ballava Matha
2.01 2.00 1.73 0.28 0.27
69 P-38 Gosala 7.13 8.30 8.10 -0.97 0.20
70 P-39 Athara Nala 1.42 3.55 1.31 0.11 2.24
71 P-41 Grand Road 3.80 4.80 4.78 -0.98 0.02
72 P-42 Balighat 1.80 1.65 1.80 0.00 -0.15
73 P-43 Dola Mandap Sahi
8.44 2.35 8.65 -0.21 -6.30
74 P-44 Jagannath Ttemple
5.90
75 P-45 Balipur 2.95 76 P-46 Behrasahi 1.60 77 P-47 Ramchandisahi 5.95 78 Pipli 4.10 3.60 5.15 -1.05 -1.55
79 Pratapramchandr 2.80 3.35 -0.55
80 Puri town 2.10 1.60 2.30 -0.20 -0.70
81 Ramchandi 6.20 5.30 7.00 -0.80 -1.70
82 Rebana nuagaon 2.80 1.95 2.85 -0.05 -0.90

182
83 Rendagada 0.80 84 Sadanandapur 1.70 1.80 1.85 -0.15 -0.05
85 Sakhigopal 2.00 2.20 2.90 -0.90 -0.70
86 Satpada 4.70 87 Tikarpara1 3.10 2.20 3.10 0.00 -0.90
88 Totasahi 3.80 2.20 5.40 -1.60 -3.20
89 Tulasichoura-Malatipatapur
2.10 2.30 2.20 -0.10 0.10
90 Uansdiha 2.90 0.80 2.40 0.50 -1.60
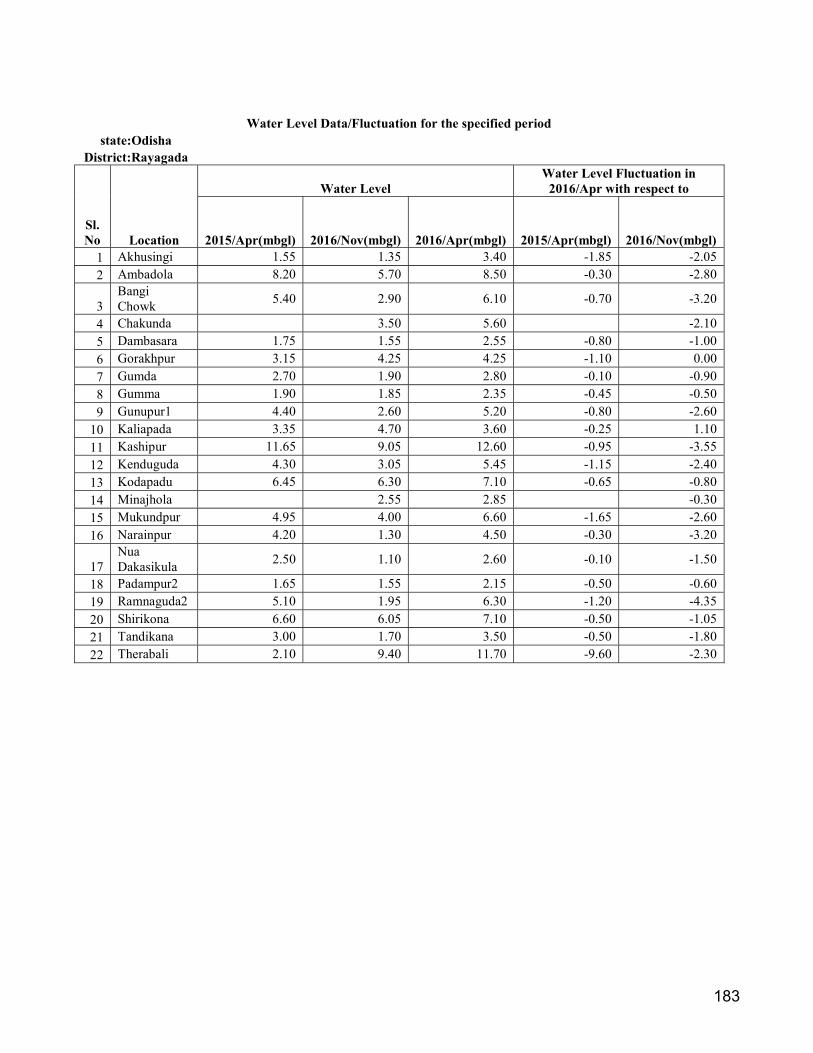
183
Water Level Data/Fluctuation for the specified period
state:Odisha District:Rayagada
Sl. No Location
Water Level Water Level Fluctuation in
2016/Apr with respect to
2015/Apr(mbgl) 2016/Nov(mbgl) 2016/Apr(mbgl) 2015/Apr(mbgl) 2016/Nov(mbgl) 1 Akhusingi 1.55 1.35 3.40 -1.85 -2.05
2 Ambadola 8.20 5.70 8.50 -0.30 -2.80
3 Bangi Chowk
5.40 2.90 6.10 -0.70 -3.20
4 Chakunda 3.50 5.60 -2.10
5 Dambasara 1.75 1.55 2.55 -0.80 -1.00
6 Gorakhpur 3.15 4.25 4.25 -1.10 0.00
7 Gumda 2.70 1.90 2.80 -0.10 -0.90
8 Gumma 1.90 1.85 2.35 -0.45 -0.50
9 Gunupur1 4.40 2.60 5.20 -0.80 -2.60
10 Kaliapada 3.35 4.70 3.60 -0.25 1.10
11 Kashipur 11.65 9.05 12.60 -0.95 -3.55
12 Kenduguda 4.30 3.05 5.45 -1.15 -2.40
13 Kodapadu 6.45 6.30 7.10 -0.65 -0.80
14 Minajhola 2.55 2.85 -0.30
15 Mukundpur 4.95 4.00 6.60 -1.65 -2.60
16 Narainpur 4.20 1.30 4.50 -0.30 -3.20
17 Nua Dakasikula
2.50 1.10 2.60 -0.10 -1.50
18 Padampur2 1.65 1.55 2.15 -0.50 -0.60
19 Ramnaguda2 5.10 1.95 6.30 -1.20 -4.35
20 Shirikona 6.60 6.05 7.10 -0.50 -1.05
21 Tandikana 3.00 1.70 3.50 -0.50 -1.80
22 Therabali 2.10 9.40 11.70 -9.60 -2.30
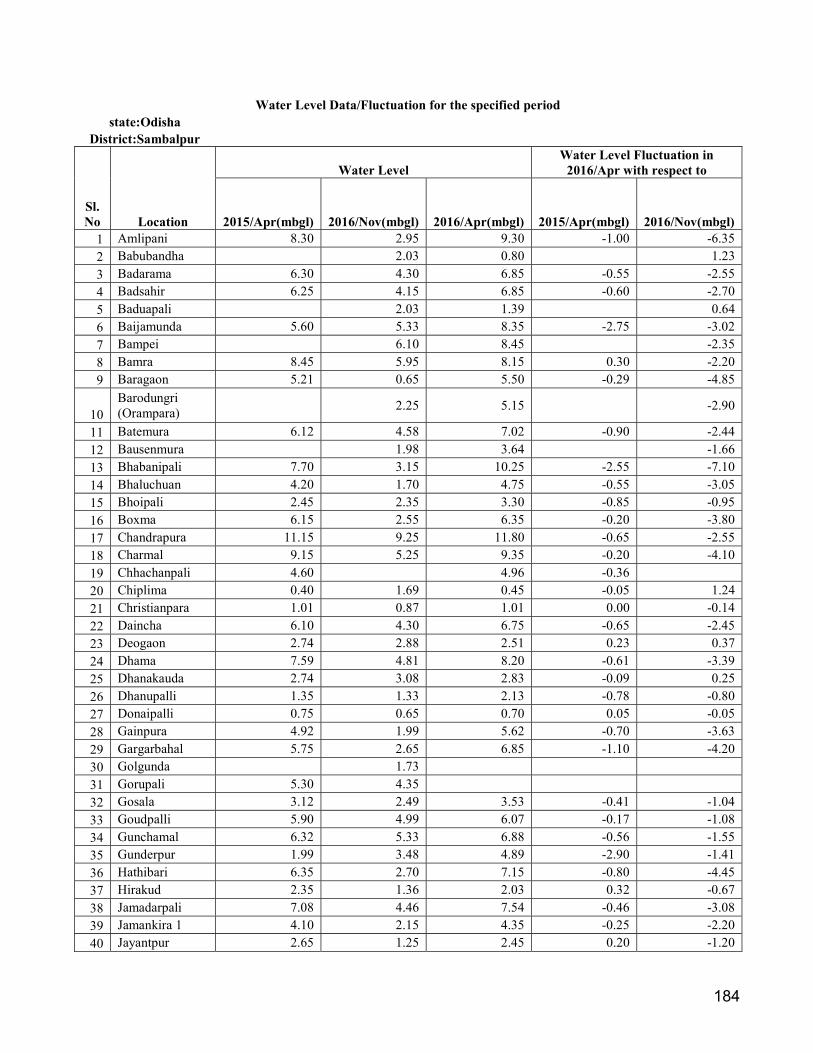
184
Water Level Data/Fluctuation for the specified period state:Odisha
District:Sambalpur
Sl. No Location
Water Level Water Level Fluctuation in
2016/Apr with respect to
2015/Apr(mbgl) 2016/Nov(mbgl) 2016/Apr(mbgl) 2015/Apr(mbgl) 2016/Nov(mbgl) 1 Amlipani 8.30 2.95 9.30 -1.00 -6.35
2 Babubandha 2.03 0.80 1.23
3 Badarama 6.30 4.30 6.85 -0.55 -2.55
4 Badsahir 6.25 4.15 6.85 -0.60 -2.70
5 Baduapali 2.03 1.39 0.64
6 Baijamunda 5.60 5.33 8.35 -2.75 -3.02
7 Bampei 6.10 8.45 -2.35
8 Bamra 8.45 5.95 8.15 0.30 -2.20
9 Baragaon 5.21 0.65 5.50 -0.29 -4.85
10 Barodungri (Orampara)
2.25 5.15
-2.90
11 Batemura 6.12 4.58 7.02 -0.90 -2.44
12 Bausenmura 1.98 3.64 -1.66
13 Bhabanipali 7.70 3.15 10.25 -2.55 -7.10
14 Bhaluchuan 4.20 1.70 4.75 -0.55 -3.05
15 Bhoipali 2.45 2.35 3.30 -0.85 -0.95
16 Boxma 6.15 2.55 6.35 -0.20 -3.80
17 Chandrapura 11.15 9.25 11.80 -0.65 -2.55
18 Charmal 9.15 5.25 9.35 -0.20 -4.10
19 Chhachanpali 4.60 4.96 -0.36 20 Chiplima 0.40 1.69 0.45 -0.05 1.24
21 Christianpara 1.01 0.87 1.01 0.00 -0.14
22 Daincha 6.10 4.30 6.75 -0.65 -2.45
23 Deogaon 2.74 2.88 2.51 0.23 0.37
24 Dhama 7.59 4.81 8.20 -0.61 -3.39
25 Dhanakauda 2.74 3.08 2.83 -0.09 0.25
26 Dhanupalli 1.35 1.33 2.13 -0.78 -0.80
27 Donaipalli 0.75 0.65 0.70 0.05 -0.05
28 Gainpura 4.92 1.99 5.62 -0.70 -3.63
29 Gargarbahal 5.75 2.65 6.85 -1.10 -4.20
30 Golgunda 1.73 31 Gorupali 5.30 4.35 32 Gosala 3.12 2.49 3.53 -0.41 -1.04
33 Goudpalli 5.90 4.99 6.07 -0.17 -1.08
34 Gunchamal 6.32 5.33 6.88 -0.56 -1.55
35 Gunderpur 1.99 3.48 4.89 -2.90 -1.41
36 Hathibari 6.35 2.70 7.15 -0.80 -4.45
37 Hirakud 2.35 1.36 2.03 0.32 -0.67
38 Jamadarpali 7.08 4.46 7.54 -0.46 -3.08
39 Jamankira 1 4.10 2.15 4.35 -0.25 -2.20
40 Jayantpur 2.65 1.25 2.45 0.20 -1.20
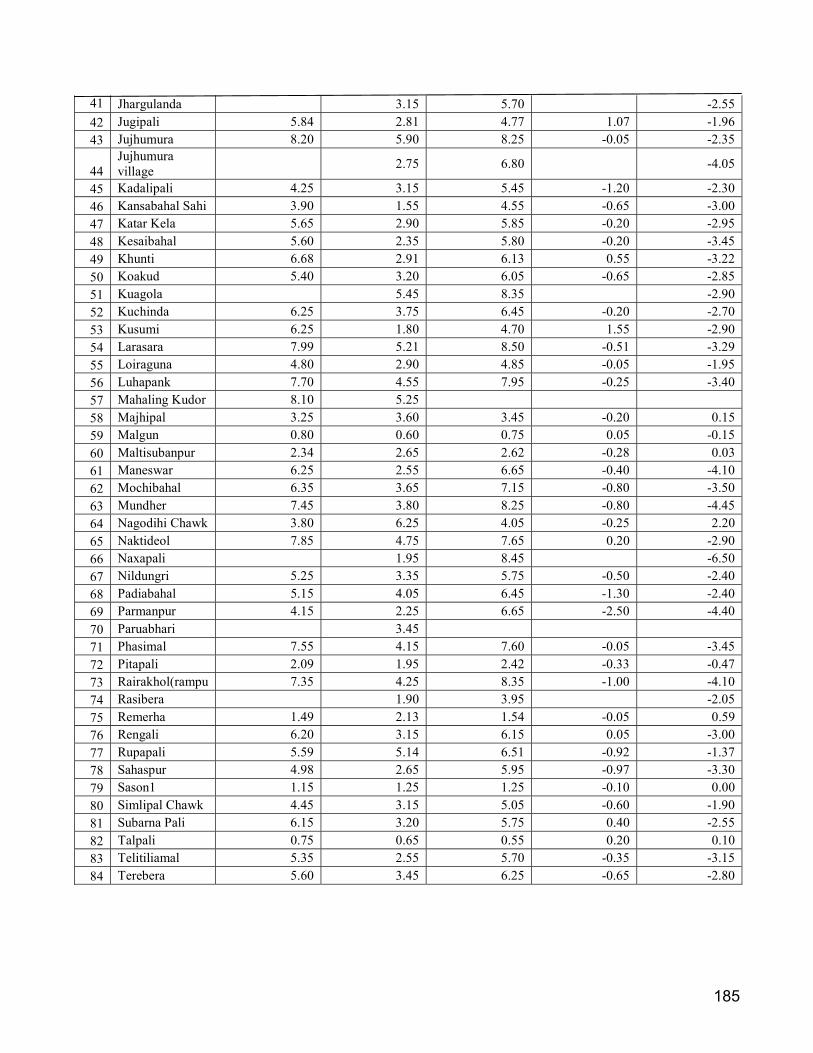
185
41 Jhargulanda 3.15 5.70 -2.55
42 Jugipali 5.84 2.81 4.77 1.07 -1.96
43 Jujhumura 8.20 5.90 8.25 -0.05 -2.35
44 Jujhumura village
2.75 6.80
-4.05
45 Kadalipali 4.25 3.15 5.45 -1.20 -2.30
46 Kansabahal Sahi 3.90 1.55 4.55 -0.65 -3.00
47 Katar Kela 5.65 2.90 5.85 -0.20 -2.95
48 Kesaibahal 5.60 2.35 5.80 -0.20 -3.45
49 Khunti 6.68 2.91 6.13 0.55 -3.22
50 Koakud 5.40 3.20 6.05 -0.65 -2.85
51 Kuagola 5.45 8.35 -2.90
52 Kuchinda 6.25 3.75 6.45 -0.20 -2.70
53 Kusumi 6.25 1.80 4.70 1.55 -2.90
54 Larasara 7.99 5.21 8.50 -0.51 -3.29
55 Loiraguna 4.80 2.90 4.85 -0.05 -1.95
56 Luhapank 7.70 4.55 7.95 -0.25 -3.40
57 Mahaling Kudor 8.10 5.25 58 Majhipal 3.25 3.60 3.45 -0.20 0.15
59 Malgun 0.80 0.60 0.75 0.05 -0.15
60 Maltisubanpur 2.34 2.65 2.62 -0.28 0.03
61 Maneswar 6.25 2.55 6.65 -0.40 -4.10
62 Mochibahal 6.35 3.65 7.15 -0.80 -3.50
63 Mundher 7.45 3.80 8.25 -0.80 -4.45
64 Nagodihi Chawk 3.80 6.25 4.05 -0.25 2.20
65 Naktideol 7.85 4.75 7.65 0.20 -2.90
66 Naxapali 1.95 8.45 -6.50
67 Nildungri 5.25 3.35 5.75 -0.50 -2.40
68 Padiabahal 5.15 4.05 6.45 -1.30 -2.40
69 Parmanpur 4.15 2.25 6.65 -2.50 -4.40
70 Paruabhari 3.45 71 Phasimal 7.55 4.15 7.60 -0.05 -3.45
72 Pitapali 2.09 1.95 2.42 -0.33 -0.47
73 Rairakhol(rampu 7.35 4.25 8.35 -1.00 -4.10
74 Rasibera 1.90 3.95 -2.05
75 Remerha 1.49 2.13 1.54 -0.05 0.59
76 Rengali 6.20 3.15 6.15 0.05 -3.00
77 Rupapali 5.59 5.14 6.51 -0.92 -1.37
78 Sahaspur 4.98 2.65 5.95 -0.97 -3.30
79 Sason1 1.15 1.25 1.25 -0.10 0.00
80 Simlipal Chawk 4.45 3.15 5.05 -0.60 -1.90
81 Subarna Pali 6.15 3.20 5.75 0.40 -2.55
82 Talpali 0.75 0.65 0.55 0.20 0.10
83 Telitiliamal 5.35 2.55 5.70 -0.35 -3.15
84 Terebera 5.60 3.45 6.25 -0.65 -2.80
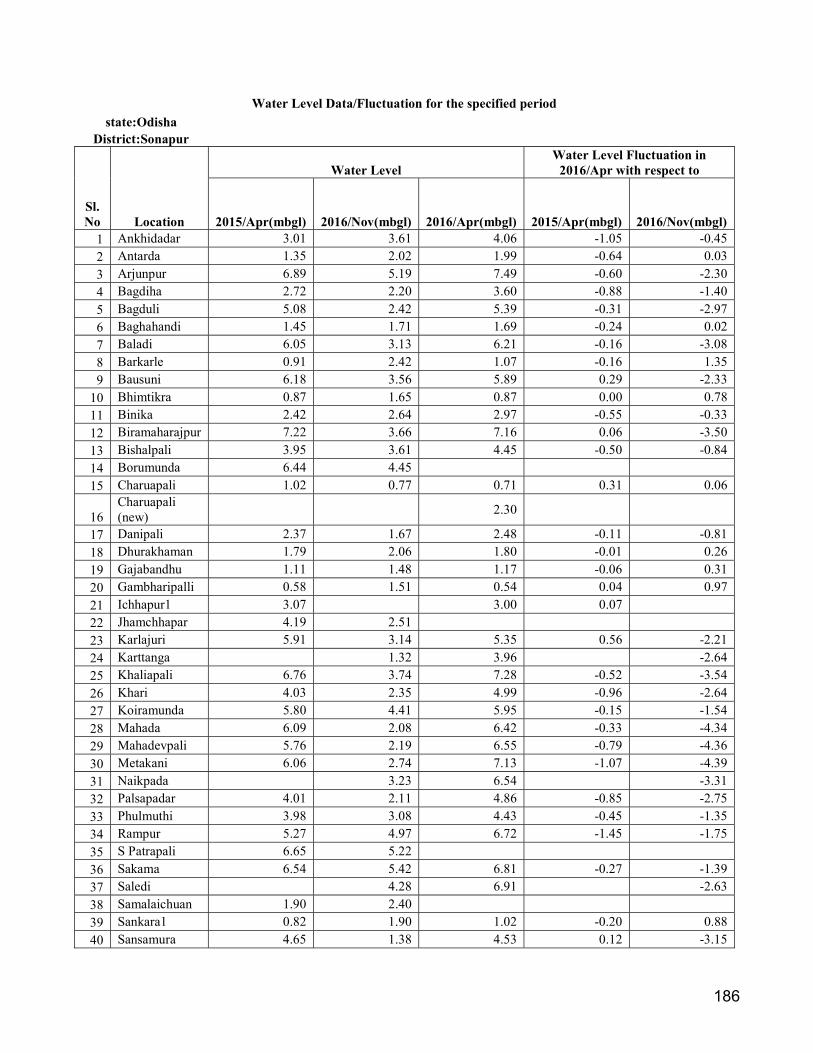
186
Water Level Data/Fluctuation for the specified period
state:Odisha District:Sonapur
Sl. No Location
Water Level Water Level Fluctuation in
2016/Apr with respect to
2015/Apr(mbgl) 2016/Nov(mbgl) 2016/Apr(mbgl) 2015/Apr(mbgl) 2016/Nov(mbgl) 1 Ankhidadar 3.01 3.61 4.06 -1.05 -0.45
2 Antarda 1.35 2.02 1.99 -0.64 0.03
3 Arjunpur 6.89 5.19 7.49 -0.60 -2.30
4 Bagdiha 2.72 2.20 3.60 -0.88 -1.40
5 Bagduli 5.08 2.42 5.39 -0.31 -2.97
6 Baghahandi 1.45 1.71 1.69 -0.24 0.02
7 Baladi 6.05 3.13 6.21 -0.16 -3.08
8 Barkarle 0.91 2.42 1.07 -0.16 1.35
9 Bausuni 6.18 3.56 5.89 0.29 -2.33
10 Bhimtikra 0.87 1.65 0.87 0.00 0.78
11 Binika 2.42 2.64 2.97 -0.55 -0.33
12 Biramaharajpur 7.22 3.66 7.16 0.06 -3.50
13 Bishalpali 3.95 3.61 4.45 -0.50 -0.84
14 Borumunda 6.44 4.45 15 Charuapali 1.02 0.77 0.71 0.31 0.06
16 Charuapali (new)
2.30
17 Danipali 2.37 1.67 2.48 -0.11 -0.81
18 Dhurakhaman 1.79 2.06 1.80 -0.01 0.26
19 Gajabandhu 1.11 1.48 1.17 -0.06 0.31
20 Gambharipalli 0.58 1.51 0.54 0.04 0.97
21 Ichhapur1 3.07 3.00 0.07 22 Jhamchhapar 4.19 2.51 23 Karlajuri 5.91 3.14 5.35 0.56 -2.21
24 Karttanga 1.32 3.96 -2.64
25 Khaliapali 6.76 3.74 7.28 -0.52 -3.54
26 Khari 4.03 2.35 4.99 -0.96 -2.64
27 Koiramunda 5.80 4.41 5.95 -0.15 -1.54
28 Mahada 6.09 2.08 6.42 -0.33 -4.34
29 Mahadevpali 5.76 2.19 6.55 -0.79 -4.36
30 Metakani 6.06 2.74 7.13 -1.07 -4.39
31 Naikpada 3.23 6.54 -3.31
32 Palsapadar 4.01 2.11 4.86 -0.85 -2.75
33 Phulmuthi 3.98 3.08 4.43 -0.45 -1.35
34 Rampur 5.27 4.97 6.72 -1.45 -1.75
35 S Patrapali 6.65 5.22 36 Sakama 6.54 5.42 6.81 -0.27 -1.39
37 Saledi 4.28 6.91 -2.63
38 Samalaichuan 1.90 2.40 39 Sankara1 0.82 1.90 1.02 -0.20 0.88
40 Sansamura 4.65 1.38 4.53 0.12 -3.15
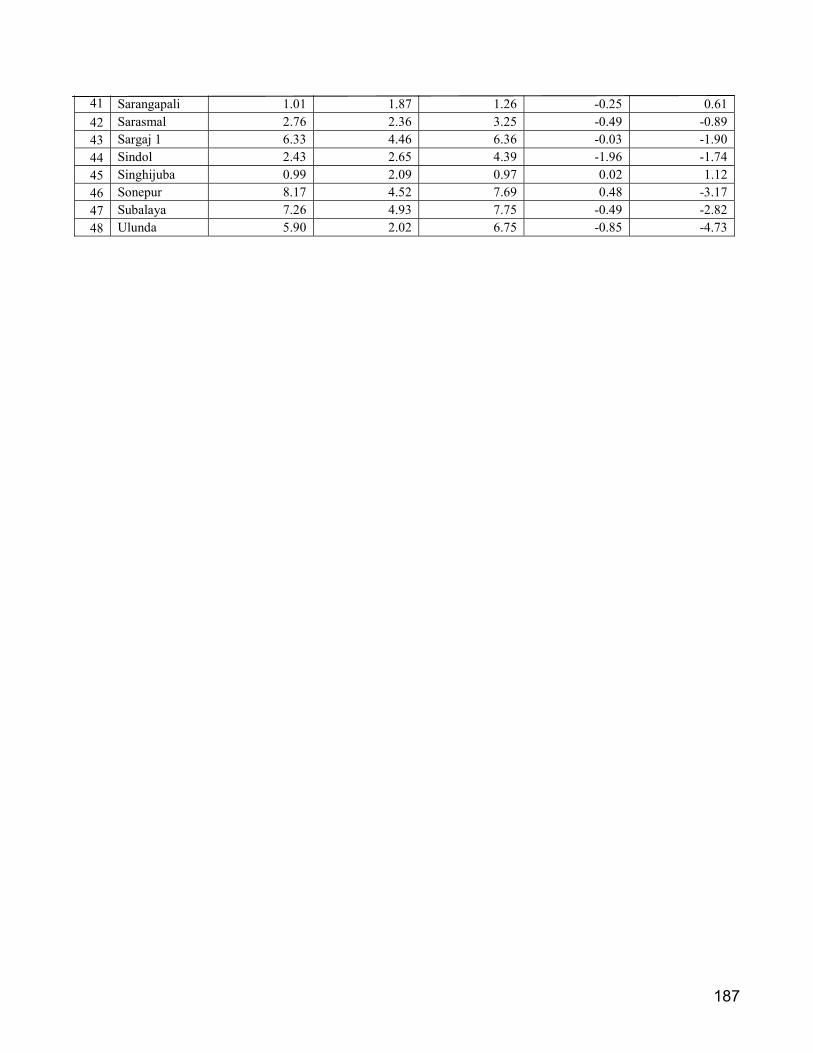
187
41 Sarangapali 1.01 1.87 1.26 -0.25 0.61
42 Sarasmal 2.76 2.36 3.25 -0.49 -0.89
43 Sargaj 1 6.33 4.46 6.36 -0.03 -1.90
44 Sindol 2.43 2.65 4.39 -1.96 -1.74
45 Singhijuba 0.99 2.09 0.97 0.02 1.12
46 Sonepur 8.17 4.52 7.69 0.48 -3.17
47 Subalaya 7.26 4.93 7.75 -0.49 -2.82
48 Ulunda 5.90 2.02 6.75 -0.85 -4.73

188
Water Level Data/Fluctuation for the specified period
state:Odisha District:Sundergarh
Sl. No Location
Water Level Water Level Fluctuation in
2016/Apr with respect to
2015/Apr(mbgl) 2016/Nov(mbgl) 2016/Apr(mbgl) 2015/Apr(mbgl) 2016/Nov(mbgl) 1 Alikera 10.15 8.10 10.60 -0.45 -2.50
2 Badbahal 4.15 4.80 -0.65
3 Balichuan 1.05 3.05 -2.00
4 Balijori 4.35 2.90 5.10 -0.75 -2.20
5 Banki 7.75 10.65 -2.90
6 Bargaon 4.30 1.85
7 Barogar 6.45 5.20 6.15 0.30 -0.95
8 Bhasma 5.15 3.65 6.10 -0.95 -2.45
9 Bihabandh Chawk 9.45 9.45 11.05 -1.60 -1.60
10 Birangatoli 9.55 3.65 9.90 -0.35 -6.25
11 Birmitrapur 2.75 1.75 3.05 -0.30 -1.30
12 Bondamunda 4.05 0.45 4.25 -0.20 -3.80
13 Chandiposh 5.40 1.35 7.25 -1.85 -5.90
14 Darjin 7.30 5.90 6.75 0.55 -0.85
15 Deokaranpur 5.55 3.20 6.15 -0.60 -2.95
16 Durubaga 3.15 4.05 -0.90
17 Ekma 6.05 3.25
18 Garjan Bahal 0.75 5.05 -4.30
19 Himgiri 12.35 3.15
20 Jagimal 6.25 3.65 7.10 -0.85 -3.45
21 Jharbera 8.35 6.95
22 Karamdihi 6.60 2.95 6.85 -0.25 -3.90
23 Kinjrikela 6.35 3.40 6.75 -0.40 -3.35
24 Kuarmunda 6.65 3.20 6.90 -0.25 -3.70
25 Kumajharia 2.25 4.10 -1.85
26 Kutra 5.35 4.25 5.80 -0.45 -1.55
27 Lahunipara 1.75
28 Laing 6.35 3.90 7.20 -0.85 -3.30
29 Lathikata 4.10 0.90 5.35 -1.25 -4.45
30 Laxmipos 7.85
31 Ledhimang 6.85 3.35 7.05 -0.20 -3.70
32 Lefripada 11.25 7.35 10.80 0.45 -3.45
33 Lokedega 6.90 4.70 7.05 -0.15 -2.35
34 Mahulapali 3.80 1.65 3.75 0.05 -2.10
35 Medinipur 8.90 10.15 -1.25
36 Moshani Kani 4.65 2.85 4.55 0.10 -1.70
37 Panchomahala 1 4.35 2.55 4.65 -0.30 -2.10
38 Panderpali 8.30 6.20 8.25 0.05 -2.05
39 Putudihi 6.00 3.90
40 R-01 Jalda C-Block 4.65 2.75 5.15 -0.50 -2.40
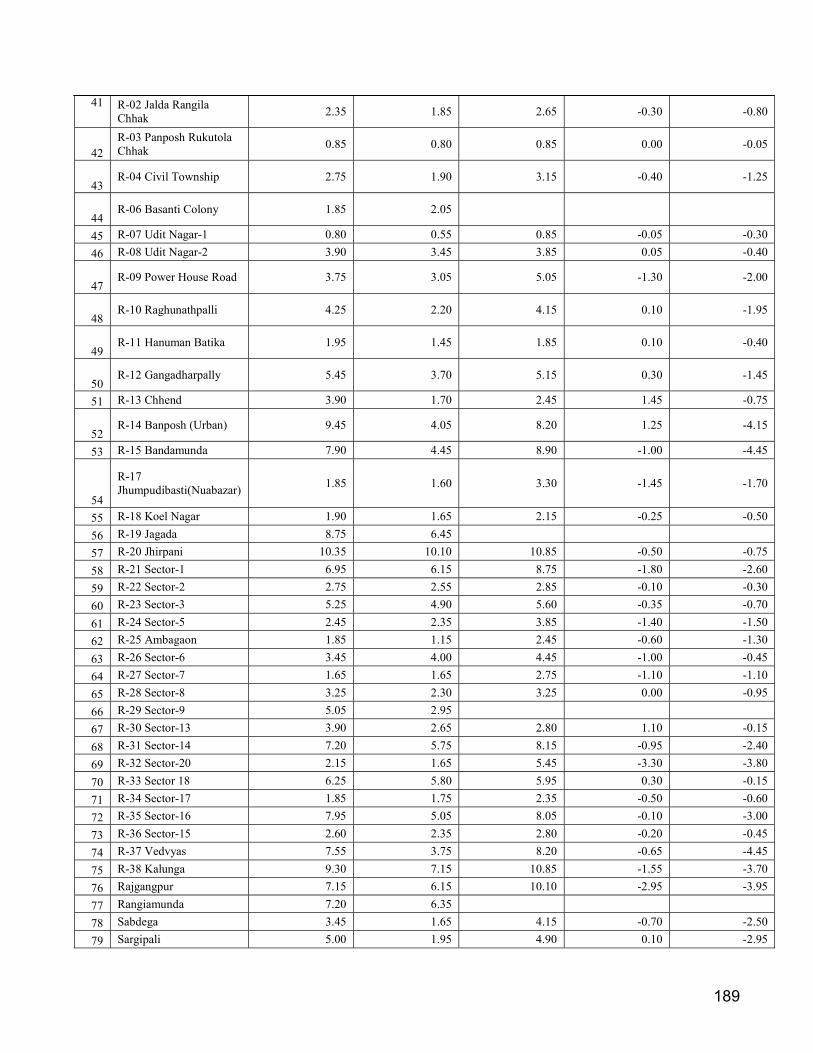
189
41 R-02 Jalda Rangila Chhak
2.35 1.85 2.65 -0.30 -0.80
42 R-03 Panposh Rukutola Chhak
0.85 0.80 0.85 0.00 -0.05
43 R-04 Civil Township 2.75 1.90 3.15 -0.40 -1.25
44 R-06 Basanti Colony 1.85 2.05
45 R-07 Udit Nagar-1 0.80 0.55 0.85 -0.05 -0.30
46 R-08 Udit Nagar-2 3.90 3.45 3.85 0.05 -0.40
47 R-09 Power House Road 3.75 3.05 5.05 -1.30 -2.00
48 R-10 Raghunathpalli 4.25 2.20 4.15 0.10 -1.95
49 R-11 Hanuman Batika 1.95 1.45 1.85 0.10 -0.40
50 R-12 Gangadharpally 5.45 3.70 5.15 0.30 -1.45
51 R-13 Chhend 3.90 1.70 2.45 1.45 -0.75
52 R-14 Banposh (Urban) 9.45 4.05 8.20 1.25 -4.15
53 R-15 Bandamunda 7.90 4.45 8.90 -1.00 -4.45
54
R-17 Jhumpudibasti(Nuabazar)
1.85 1.60 3.30 -1.45 -1.70
55 R-18 Koel Nagar 1.90 1.65 2.15 -0.25 -0.50
56 R-19 Jagada 8.75 6.45
57 R-20 Jhirpani 10.35 10.10 10.85 -0.50 -0.75
58 R-21 Sector-1 6.95 6.15 8.75 -1.80 -2.60
59 R-22 Sector-2 2.75 2.55 2.85 -0.10 -0.30
60 R-23 Sector-3 5.25 4.90 5.60 -0.35 -0.70
61 R-24 Sector-5 2.45 2.35 3.85 -1.40 -1.50
62 R-25 Ambagaon 1.85 1.15 2.45 -0.60 -1.30
63 R-26 Sector-6 3.45 4.00 4.45 -1.00 -0.45
64 R-27 Sector-7 1.65 1.65 2.75 -1.10 -1.10
65 R-28 Sector-8 3.25 2.30 3.25 0.00 -0.95
66 R-29 Sector-9 5.05 2.95
67 R-30 Sector-13 3.90 2.65 2.80 1.10 -0.15
68 R-31 Sector-14 7.20 5.75 8.15 -0.95 -2.40
69 R-32 Sector-20 2.15 1.65 5.45 -3.30 -3.80
70 R-33 Sector 18 6.25 5.80 5.95 0.30 -0.15
71 R-34 Sector-17 1.85 1.75 2.35 -0.50 -0.60
72 R-35 Sector-16 7.95 5.05 8.05 -0.10 -3.00
73 R-36 Sector-15 2.60 2.35 2.80 -0.20 -0.45
74 R-37 Vedvyas 7.55 3.75 8.20 -0.65 -4.45
75 R-38 Kalunga 9.30 7.15 10.85 -1.55 -3.70
76 Rajgangpur 7.15 6.15 10.10 -2.95 -3.95
77 Rangiamunda 7.20 6.35
78 Sabdega 3.45 1.65 4.15 -0.70 -2.50
79 Sargipali 5.00 1.95 4.90 0.10 -2.95
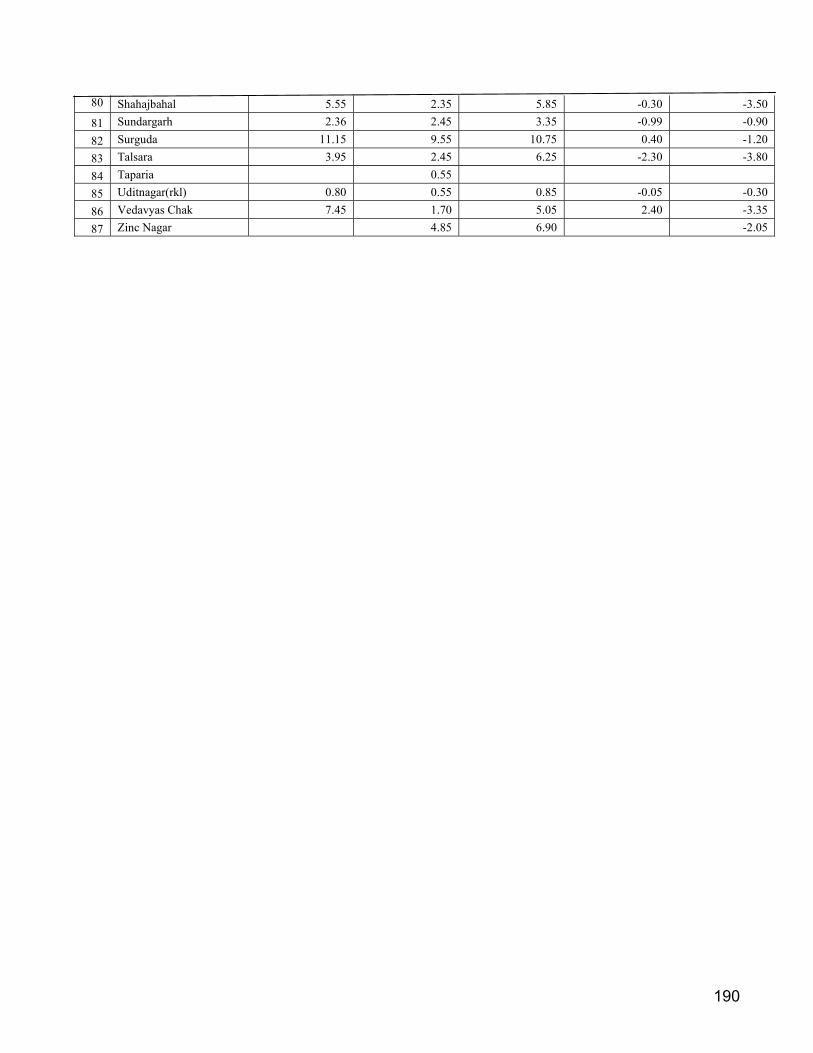
190
80 Shahajbahal 5.55 2.35 5.85 -0.30 -3.50
81 Sundargarh 2.36 2.45 3.35 -0.99 -0.90
82 Surguda 11.15 9.55 10.75 0.40 -1.20
83 Talsara 3.95 2.45 6.25 -2.30 -3.80
84 Taparia 0.55
85 Uditnagar(rkl) 0.80 0.55 0.85 -0.05 -0.30
86 Vedavyas Chak 7.45 1.70 5.05 2.40 -3.35
87 Zinc Nagar 4.85 6.90 -2.05

191
ANNEXURE – IV

192
DETAILS OF CHEMICAL QUALITY OF THE NHS STATIONS OF ORISSA (APRIL-2015)
DISTRICT_NAME BLOCK_NAME SITE_NAME EC PH HCO3 CA CL F K MG NA SO4 TDS TH TA
mg/l
ANUGUL ATHMALLIK Tileswar 300 8 85 36 71 0.4 3 10.98 23 6 190 135 69.67
ANUGUL CHHENDIPADA Katada 850 7.5 275 66 35 0.2 9 46.03 59 72 516 354 225.41
ANUGUL PALALAHADA Jamardihi 50 7.5 31 8 4 0 1 0.01 5 0 33 20 25.41
ANUGUL KISHORENAGAR Bamur 1900 7.6 104 120 596 0.3 15 139.22 93 122 1122 872 85.25
ANUGUL KISHORENAGAR Boinda1 800 7 153 48 184 0.7 8 18.05 120 69 516 194 125.41
ANUGUL ATHMALLIK Thakurgarh 1 700 7.9 317 18 85 0.7 11 46.95 81 41 431 238 259.84
ANUGUL ANUGUL Jagannathpur 550 7.9 165 28 99 0.4 16 26.05 75 51 362 177 135.25
ANUGUL ANUGUL Tikarpara 450 7.9 201 40 50 0.8 27 19.01 30 31 271 178 164.75
ANUGUL PALALAHADA Khamar-1 350 7.7 146 34 71 0.1 10 10.01 38 0 226 126 119.67
ANUGUL PALALAHADA Srirampur 400 7.9 177 28 50 0.3 12 15.11 40 4 226 132 145.08
ANUGUL ANUGUL Bantala-Ii 650 8.2 366 10 60 0.9 3 63.96 45 19 381 288 300
ANUGUL ANUGUL Purnakot 300 7.9 214 28 18 0.1 1 18.03 29 10 210 144 175.41
ANUGUL ANUGUL Panchmahala-Ii 1050 7.8 244 42 230 0.5 17 33.12 142 77 646 241 200
ANUGUL ATHMALLIK Athamallik 2 450 8 207 56 60 0.3 1 3.96 63 23 310 156 169.67
ANUGUL TALACHER Chainpal 700 8 73 16 202 8.8 2 0.99 130 1 387 44 59.84
ANUGUL KANIHA Sipur 300 8.2 165 22 28 0.3 12 12.91 24 0 170 108 135.25
ANUGUL BANARPAL Amna 600 8.1 372 12 50 1.3 3 71.98 43 21 384 326 304.92
ANUGUL PALALAHADA Pallahara1 350 7.8 128 32 50 0.1 6 6.12 38 9 199 105 104.92
ANUGUL CHHENDIPADA Durgapur 1 950 7.7 146 50 188 0.4 73 46.01 36 79 472 314 119.67
ANUGUL ANUGUL Tubey 600 8 256 38 71 0.3 70 28.98 29 36 372 214 209.84
ANUGUL BANARPAL Mahidharpur 350 7.6 153 38 57 0.1 1.53 7.1 56 31 266 124 125.41
ANUGUL BANARPAL Tulsipal 850 8.1 336 16 110 1.3 11 57.16 87 66 504 275 275.41
ANUGUL BANARPAL Kukurang 1800 8.3 598 18 245 3.5 5 54.97 320 136 1073 271 490.16
ANUGUL BANARPAL Bhogabereni 950 7.1 250 14 195 1.4 2 45 140 54 573 220 204.92
ANUGUL BANARPAL Kuio 1300 7.6 238 94 301 1.2 46 70.14 55 83 722 523 195.08
ANUGUL BANARPAL Angul1 750 7.6 116 54 188 0.1 8 32.16 58 61 451 267 95.08

193
ANUGUL CHHENDIPADA Chendipada1 600 7.9 317 24 57 1.6 2 23.13 93 25 381 155 259.84
ANUGUL CHHENDIPADA Kosala1 300 7.9 134 30 39 0.2 8 9.03 26 10 181 112 109.84
ANUGUL CHHENDIPADA Ugi 400 8 238 28 21 0.3 11 10.97 62 27 268 115 195.08
ANUGUL CHHENDIPADA Paranga 450 8.1 293 8 39 0.7 20 35.02 53 11 293 164 240.16
ANUGUL CHHENDIPADA Jharpada 1700 8 543 20 220 0.7 4 119.16 180 120 931 540 445.08
ANUGUL CHHENDIPADA Nisa 200 8 122 26 21 0.7 18 6.11 13 3 130 90 100
ANUGUL KANIHA Samal 250 8.3 122 14 25 1.6 1 11.93 24 136 84 100
ANUGUL TALACHER Sendhogram 1200 7.8 360 38 184 1.1 3 53.05 160 106 721 313 295.08
ANUGUL TALACHER Tentulai 1400 7.8 256 32 273 1.2 10 100.21 150 164 847 492 209.84
ANUGUL TALACHER Balanda 200 7.9 110 16 25 0.1 8 0.02 30 0 126 40 90.16
ANUGUL TALACHER Godibandha 150 7.9 92 18 11 0.4 4 7.32 5 0 87 75 75.41
ANUGUL TALACHER Kumunda 1 550 8.1 250 20 89 0.1 49 32.12 45 0 311 182 204.92
ANUGUL TALACHER Talcher1 100 7.9 73 16 11 0.3 1 6.1 4 0 74 65 59.84
BALANGIR BALANGIR Harbhanga 1100 7.53 117 42 178 0.1 87.8 43.96 95 79 582 286 95.9
BALANGIR DEOGAON Kesaropali 1310 8.16 376 26 136 0.3 178 30.11 105 54 712 189 308.2
BALANGIR SAINTALA Piprut 460 7.95 191 36 33 0.4 0.5 32.14 13 22 230 222 156.56
BALANGIR TUREKELA DhamanaDonga 390 7.44 209 26 12 0.3 2.3 18.95 28 10 199 143 171.31
BALANGIR TITLAGARH Chormara 970 7.64 271 24 103 0.2 124 36.28 40 52 511 209 222.13
BALANGIR TITLAGARH Titlagarh (new) 480 8.18 209 42 14 0.5 23.2 18.04 16 28 244 179 171.31
BALANGIR AGALPUR Agalpur 1 770 7.47 123 84 115 0.1 19.4 12.28 49 43 382 260 100.82
BALANGIR TITLAGARH Rigdol 1100 7.86 154 64 162 0.3 113 28.04 61 64 567 275 126.23
BALANGIR BANGOMUNDA Jorpada 490 8.17 265 38 16 0.6 2.1 27.79 24 9 246 209 217.21
BALANGIR MURIBAHAL Bandupalla 530 7.42 179 32 35 0.3 71.3 12.83 19 22 279 133 146.72
BALANGIR LOISINGA Loisinga 650 8.49 253 10 51 0.5 0.6 47.25 55 11 322 219 247.38
BALANGIR BALANGIR Sinkhaman 1010 8.11 228 42 124 0.7 0.7 63.02 68 61 470 364 186.89
BALANGIR BALANGIR Bolangir-1 860 7.68 191 30 126 0.3 1.7 41.32 88 49 428 245 156.56
BALANGIR BALANGIR Dhumamara 640 7.46 203 34 56 0.4 19.3 31.45 44 49 332 214 166.39 BALANGIR BALANGIR Chudapali 530 7.48 166 32 56 0.2 12.5 22.75 39 21 264 173 136.07
BALANGIR BALANGIR Hardatal 600 7.72 296 12 37 0.2 2.3 34.88 64 3 297 173 242.62
BALANGIR BALANGIR Padampur 530 8.14 283 32 23 0.3 3.7 31.43 34 4 265 209 231.97
BALANGIR PATNAGARH Patnagarh 300 8.18 160 24 12 0.6 1 12.72 21 1 149 112 131.15
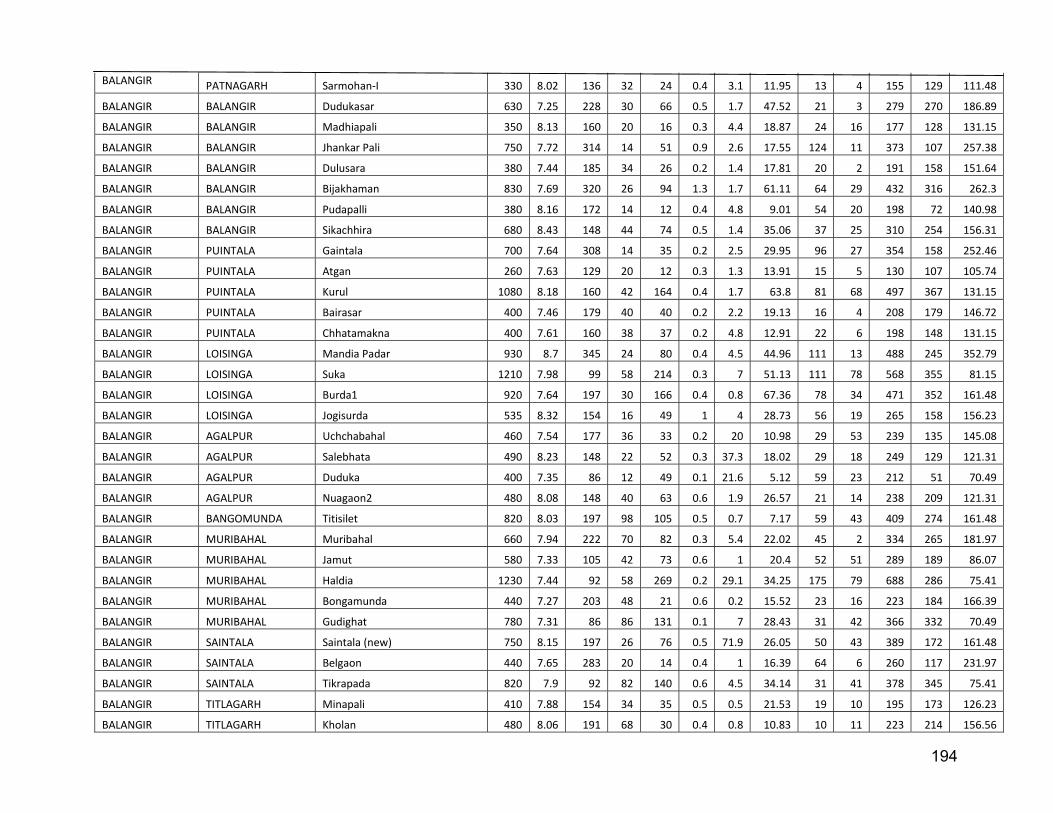
194
BALANGIR PATNAGARH Sarmohan-I 330 8.02 136 32 24 0.4 3.1 11.95 13 4 155 129 111.48
BALANGIR BALANGIR Dudukasar 630 7.25 228 30 66 0.5 1.7 47.52 21 3 279 270 186.89
BALANGIR BALANGIR Madhiapali 350 8.13 160 20 16 0.3 4.4 18.87 24 16 177 128 131.15
BALANGIR BALANGIR Jhankar Pali 750 7.72 314 14 51 0.9 2.6 17.55 124 11 373 107 257.38
BALANGIR BALANGIR Dulusara 380 7.44 185 34 26 0.2 1.4 17.81 20 2 191 158 151.64
BALANGIR BALANGIR Bijakhaman 830 7.69 320 26 94 1.3 1.7 61.11 64 29 432 316 262.3
BALANGIR BALANGIR Pudapalli 380 8.16 172 14 12 0.4 4.8 9.01 54 20 198 72 140.98
BALANGIR BALANGIR Sikachhira 680 8.43 148 44 74 0.5 1.4 35.06 37 25 310 254 156.31
BALANGIR PUINTALA Gaintala 700 7.64 308 14 35 0.2 2.5 29.95 96 27 354 158 252.46
BALANGIR PUINTALA Atgan 260 7.63 129 20 12 0.3 1.3 13.91 15 5 130 107 105.74
BALANGIR PUINTALA Kurul 1080 8.18 160 42 164 0.4 1.7 63.8 81 68 497 367 131.15
BALANGIR PUINTALA Bairasar 400 7.46 179 40 40 0.2 2.2 19.13 16 4 208 179 146.72
BALANGIR PUINTALA Chhatamakna 400 7.61 160 38 37 0.2 4.8 12.91 22 6 198 148 131.15
BALANGIR LOISINGA Mandia Padar 930 8.7 345 24 80 0.4 4.5 44.96 111 13 488 245 352.79
BALANGIR LOISINGA Suka 1210 7.98 99 58 214 0.3 7 51.13 111 78 568 355 81.15
BALANGIR LOISINGA Burda1 920 7.64 197 30 166 0.4 0.8 67.36 78 34 471 352 161.48
BALANGIR LOISINGA Jogisurda 535 8.32 154 16 49 1 4 28.73 56 19 265 158 156.23
BALANGIR AGALPUR Uchchabahal 460 7.54 177 36 33 0.2 20 10.98 29 53 239 135 145.08
BALANGIR AGALPUR Salebhata 490 8.23 148 22 52 0.3 37.3 18.02 29 18 249 129 121.31
BALANGIR AGALPUR Duduka 400 7.35 86 12 49 0.1 21.6 5.12 59 23 212 51 70.49
BALANGIR AGALPUR Nuagaon2 480 8.08 148 40 63 0.6 1.9 26.57 21 14 238 209 121.31
BALANGIR BANGOMUNDA Titisilet 820 8.03 197 98 105 0.5 0.7 7.17 59 43 409 274 161.48
BALANGIR MURIBAHAL Muribahal 660 7.94 222 70 82 0.3 5.4 22.02 45 2 334 265 181.97
BALANGIR MURIBAHAL Jamut 580 7.33 105 42 73 0.6 1 20.4 52 51 289 189 86.07
BALANGIR MURIBAHAL Haldia 1230 7.44 92 58 269 0.2 29.1 34.25 175 79 688 286 75.41
BALANGIR MURIBAHAL Bongamunda 440 7.27 203 48 21 0.6 0.2 15.52 23 16 223 184 166.39
BALANGIR MURIBAHAL Gudighat 780 7.31 86 86 131 0.1 7 28.43 31 42 366 332 70.49
BALANGIR SAINTALA Saintala (new) 750 8.15 197 26 76 0.5 71.9 26.05 50 43 389 172 161.48
BALANGIR SAINTALA Belgaon 440 7.65 283 20 14 0.4 1 16.39 64 6 260 117 231.97
BALANGIR SAINTALA Tikrapada 820 7.9 92 82 140 0.6 4.5 34.14 31 41 378 345 75.41
BALANGIR TITLAGARH Minapali 410 7.88 154 34 35 0.5 0.5 21.53 19 10 195 173 126.23
BALANGIR TITLAGARH Kholan 480 8.06 191 68 30 0.4 0.8 10.83 10 11 223 214 156.56

195
BALANGIR TITLAGARH Kurusur 910 8.44 0.98 0 0
BALANGIR TITLAGARH Jagua 1000 7.27 111 96 154 0.2 35.3 29.8 68 79 515 362 90.98
BALANGIR BANGOMUNDA Sindhikela1 400 8.2 203 26 14 0.8 1.6 10.97 40 10 202 110 166.39
BALANGIR BANGOMUNDA Sindhikela (new) 720 7.88 179 68 78 0.5 36.1 23.18 23 48 364 265 146.72
BALANGIR SAINTALA Dumalpada 940 7.74 487 24 26 0.9 4 59.84 79 5 435 306 399.18
BALANGIR TUREKELA Kurli 550 7.91 123 46 59 0.4 3.3 11.77 40 46 266 163 100.82
BALANGIR TUREKELA Salandi 400 7.99 136 36 40 0.3 2.7 18.04 197 19 201 164 111.48
BALANGIR TUREKELA Kantabanji 800 7.78 129 84 115 0.5 0.4 32.12 32 56 381 342 105.74
BALANGIR DEOGAON Sagarpali 910 8.2 308 30 78 2 6.8 55.96 70 59 451 305 252.46
BALANGIR BELPARA Belpara 530 7.36 160 50 51 0.3 3.4 15.55 32 33 263 189 131.15
BALANGIR PUINTALA Ledarbohal 270 8.21 136 28 14 0.3 1.3 14.01 11 5 139 128 111.48
BALANGIR PUINTALA Dumerbahal 530 7.64 283 78 14 0.2 7.7 12.2 11 9 269 245 231.97
BALESHWAR NILAGIRI Tenda 1 380 8.09 110 20 57 0.3 2.7 16.07 31 12 193 116 90.16
BALESHWAR NILAGIRI Nilgiri 1 600 8.15 195 30 64 0.2 4.6 18.03 61 41 314 149 159.84
BALESHWAR NILAGIRI Khantapada 340 8.08 92 24 57 0.3 0.5 18.02 13 10 168 134 75.41
BALESHWAR BALIAPAL Jamsuli 300 8.05 92 24 43 0.5 0.7 12.92 13 3 142 113 75.41
BALESHWAR JALESWAR Raibania 560 8.13 171 20 67 0.3 4.6 24.09 57 40 296 149 140.16
BALESHWAR BASTA Basta 300 8.01 92 24 46 0.7 15.1 13 3 147 122 75.41
BALESHWAR BALESHWAR Rupsa 1310 8.33 177 26 216 0.4 6.5 29.94 207 145 729 188 165.08
BALESHWAR BALESHWAR Balasore Town 370 8.14 146 18 39 0.4 1.4 20.93 21 6 178 131 119.67
BALESHWAR BALESHWAR Chandipur 550 8.24 165 20 64 0.3 4.3 12.91 75 39 296 103 135.25
BALESHWAR REMUNA Govindpur 1360 8.31 195 26 241 0.3 6 16.08 246 163 794 131 159.84
BALESHWAR REMUNA Remuna 390 8.26 195 22 18 2.7 11.94 37 5 192 104 159.84
BALESHWAR NILAGIRI Chekamara 350 8.19 153 28 32 0.4 8.6 11.95 17 1 174 119 125.41
BALESHWAR NILAGIRI Baband 560 8.08 183 20 57 0.3 4.1 17.04 70 39 297 120 150
BALESHWAR NILAGIRI Darkholi 360 8.06 128 24 46 0.3 0.6 20.94 15 5 174 146 104.92
BALESHWAR NILAGIRI Mitrapur 340 8.19 140 18 35 0.4 1.7 3.91 46 4 177 61 114.75
BALESHWAR NILAGIRI Bhalukasuni 1 310 7.9 92 20 50 0.2 0.8 12.91 23 7 159 103 75.41
BALESHWAR NILAGIRI Nuaporhi 340 7.87 122 18 43 0.3 1 15.1 25 6 168 107 100
BALESHWAR NILAGIRI Siadimal 530 8.27 55 18 149 0.8 2.6 12.91 74 4 288 98 45.08
BALESHWAR NILAGIRI Benthiapada 340 8.07 92 18 53 0.3 2.5 12.91 32 10 174 98 75.41
BALESHWAR NILAGIRI Bhagabondh 1370 8.33 238 28 213 0.7 4.5 17.05 240 168 796 140 210.08

196
BALESHWAR OUPADA Oupada 350 8.04 146 24 35 0.2 0.9 7.08 33 5 176 89 119.67
BALESHWAR OUPADA Sialghati 1300 8.31 201 22 216 0.4 6 18.02 224 171 755 129 164.75
BALESHWAR OUPADA Dasarathipur Sasan 470 8.09 146 30 50 0.2 1 26.05 19 43 241 182 119.67
BALESHWAR OUPADA Bankisial 250 7.8 67 20 43 0.1 0.7 6 22 6 131 75 54.92
BALESHWAR BAHANAGA Bahanga 350 8.12 153 18 32 0.4 1.2 7.07 47 5 185 74 125.41
BALESHWAR SORO Baghudi 330 8.01 134 16 35 0.3 0.6 17.04 25 6 165 110 109.84
BALESHWAR KHAIRA Kupari 570 8.23 177 20 67 0.2 1 11.94 82 41 310 99 145.08
BALESHWAR SIMILIA Markona 370 8.07 98 18 60 0.3 2.6 12.91 35 11 188 98 80.33
BARGARH ATTABIRA Shukutapali 820 7.93 250 58 64 1.7 2 58.18 7 77 389 384 204.92
BARGARH BARGARH Kuruan 400 8.15 159 60 39 1.4 1.1 10.04 2 3 193 191 130.33
BARGARH BHEDEN Thuapali1 280 8.24 104 48 28 1.6 0.2 2 2 1 132 128 85.25
BARGARH AMBABHONA Lakhanpur 640 8.16 256 68 67 1.7 3.7 34.12 1 5 304 310 209.84
BARGARH BHEDEN Resham 460 8.18 232 60 21 1.5 0.3 19.04 1 2 217 228 190.16
BARGARH BHATLI Bhatli 1 630 7.88 171 44 96 1.4 7 22.18 46 14 313 201 140.16
BARGARH AMBABHONA Ambabhona 440 8.15 165 30 39 1.2 3.8 23.13 14 1 204 170 155.25
BARGARH RAJBORASAMBAR Sargibahal 1 540 8.33 201 50 57 0.3 0.2 34.1 2 7 255 265 174.75
BARGARH BARAPALI Remada 590 8.07 262 50 46 1 0.2 41.15 41 6 272 294 214.75
BARGARH BHEDEN Bheden 1 1330 7.49 226 82 273 0.8 2.2 77.17 52 19 616 522 185.25
BARGARH SOHELA Ghens 1 3710 7.61 311 42 932 1.4 16.1 173.16 466 116 1897 817 254.92
BARGARH SOHELA Batetarma 530 7.96 171 36 92 0.5 11.8 12.93 46 12 295 143 140.16
BARGARH AMBABHONA Dungri 570 7.54 189 32 74 0.9 1.6 33.1 25 5 263 216 154.92
BARGARH AMBABHONA Bugbugi 270 8.05 92 16 43 1.5 3 16.07 13 3 139 106 75.41
BARGARH AMBABHONA Karla 820 8.56 293 44 103 0.8 1.6 70.08 3 11 391 398 265.16
BARGARH AMBABHONA Bhukta 790 7.79 207 36 110 0.6 8.6 41.13 46 11 354 259 169.67
BARGARH BARGARH Kharmanda 730 8.01 104 54 177 0.4 15 38.97 22 16 374 295 85.25
BARGARH BARGARH Sarala 360 8.18 153 30 18 1 0.3 24.11 2 12 161 174 125.41
BARGARH BHATLI Katapali 370 7.93 98 22 67 1.8 0 28.96 5 2 173 174 80.33
BARGARH ATTABIRA Top 500 8.21 220 40 35 1.5 0 36.03 1 11 231 248 180.33
BARGARH ATTABIRA Chaklifarm 460 8.24 177 26 57 0.7 5.2 27.02 25 1 243 176 170.08
BARGARH ATTABIRA Lastala 500 8.32 146 42 39 1.6 1.9 33.12 2 16 226 241 154.67
BARGARH AMBABHONA Uttam 570 7.85 195 62 60 1.7 1.8 24.15 5 8 256 254 159.84
BARGARH RAJBORASAMBAR Mahulpali 640 8.29 256 52 57 1.3 0.8 45.04 3 3 289 315 214.84
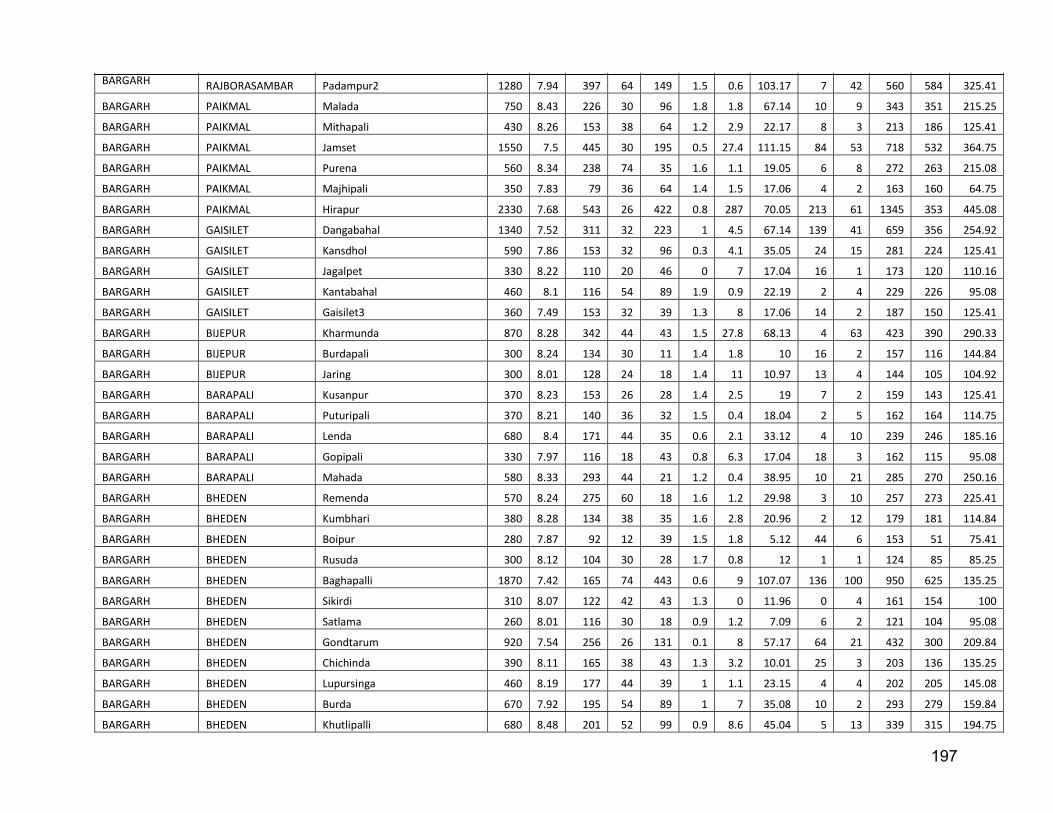
197
BARGARH RAJBORASAMBAR Padampur2 1280 7.94 397 64 149 1.5 0.6 103.17 7 42 560 584 325.41
BARGARH PAIKMAL Malada 750 8.43 226 30 96 1.8 1.8 67.14 10 9 343 351 215.25
BARGARH PAIKMAL Mithapali 430 8.26 153 38 64 1.2 2.9 22.17 8 3 213 186 125.41
BARGARH PAIKMAL Jamset 1550 7.5 445 30 195 0.5 27.4 111.15 84 53 718 532 364.75
BARGARH PAIKMAL Purena 560 8.34 238 74 35 1.6 1.1 19.05 6 8 272 263 215.08
BARGARH PAIKMAL Majhipali 350 7.83 79 36 64 1.4 1.5 17.06 4 2 163 160 64.75
BARGARH PAIKMAL Hirapur 2330 7.68 543 26 422 0.8 287 70.05 213 61 1345 353 445.08
BARGARH GAISILET Dangabahal 1340 7.52 311 32 223 1 4.5 67.14 139 41 659 356 254.92
BARGARH GAISILET Kansdhol 590 7.86 153 32 96 0.3 4.1 35.05 24 15 281 224 125.41
BARGARH GAISILET Jagalpet 330 8.22 110 20 46 0 7 17.04 16 1 173 120 110.16
BARGARH GAISILET Kantabahal 460 8.1 116 54 89 1.9 0.9 22.19 2 4 229 226 95.08
BARGARH GAISILET Gaisilet3 360 7.49 153 32 39 1.3 8 17.06 14 2 187 150 125.41
BARGARH BIJEPUR Kharmunda 870 8.28 342 44 43 1.5 27.8 68.13 4 63 423 390 290.33
BARGARH BIJEPUR Burdapali 300 8.24 134 30 11 1.4 1.8 10 16 2 157 116 144.84
BARGARH BIJEPUR Jaring 300 8.01 128 24 18 1.4 11 10.97 13 4 144 105 104.92
BARGARH BARAPALI Kusanpur 370 8.23 153 26 28 1.4 2.5 19 7 2 159 143 125.41
BARGARH BARAPALI Puturipali 370 8.21 140 36 32 1.5 0.4 18.04 2 5 162 164 114.75
BARGARH BARAPALI Lenda 680 8.4 171 44 35 0.6 2.1 33.12 4 10 239 246 185.16
BARGARH BARAPALI Gopipali 330 7.97 116 18 43 0.8 6.3 17.04 18 3 162 115 95.08
BARGARH BARAPALI Mahada 580 8.33 293 44 21 1.2 0.4 38.95 10 21 285 270 250.16
BARGARH BHEDEN Remenda 570 8.24 275 60 18 1.6 1.2 29.98 3 10 257 273 225.41
BARGARH BHEDEN Kumbhari 380 8.28 134 38 35 1.6 2.8 20.96 2 12 179 181 114.84
BARGARH BHEDEN Boipur 280 7.87 92 12 39 1.5 1.8 5.12 44 6 153 51 75.41
BARGARH BHEDEN Rusuda 300 8.12 104 30 28 1.7 0.8 12 1 1 124 85 85.25
BARGARH BHEDEN Baghapalli 1870 7.42 165 74 443 0.6 9 107.07 136 100 950 625 135.25
BARGARH BHEDEN Sikirdi 310 8.07 122 42 43 1.3 0 11.96 0 4 161 154 100
BARGARH BHEDEN Satlama 260 8.01 116 30 18 0.9 1.2 7.09 6 2 121 104 95.08
BARGARH BHEDEN Gondtarum 920 7.54 256 26 131 0.1 8 57.17 64 21 432 300 209.84
BARGARH BHEDEN Chichinda 390 8.11 165 38 43 1.3 3.2 10.01 25 3 203 136 135.25
BARGARH BHEDEN Lupursinga 460 8.19 177 44 39 1 1.1 23.15 4 4 202 205 145.08
BARGARH BHEDEN Burda 670 7.92 195 54 89 1 7 35.08 10 2 293 279 159.84
BARGARH BHEDEN Khutlipalli 680 8.48 201 52 99 0.9 8.6 45.04 5 13 339 315 194.75
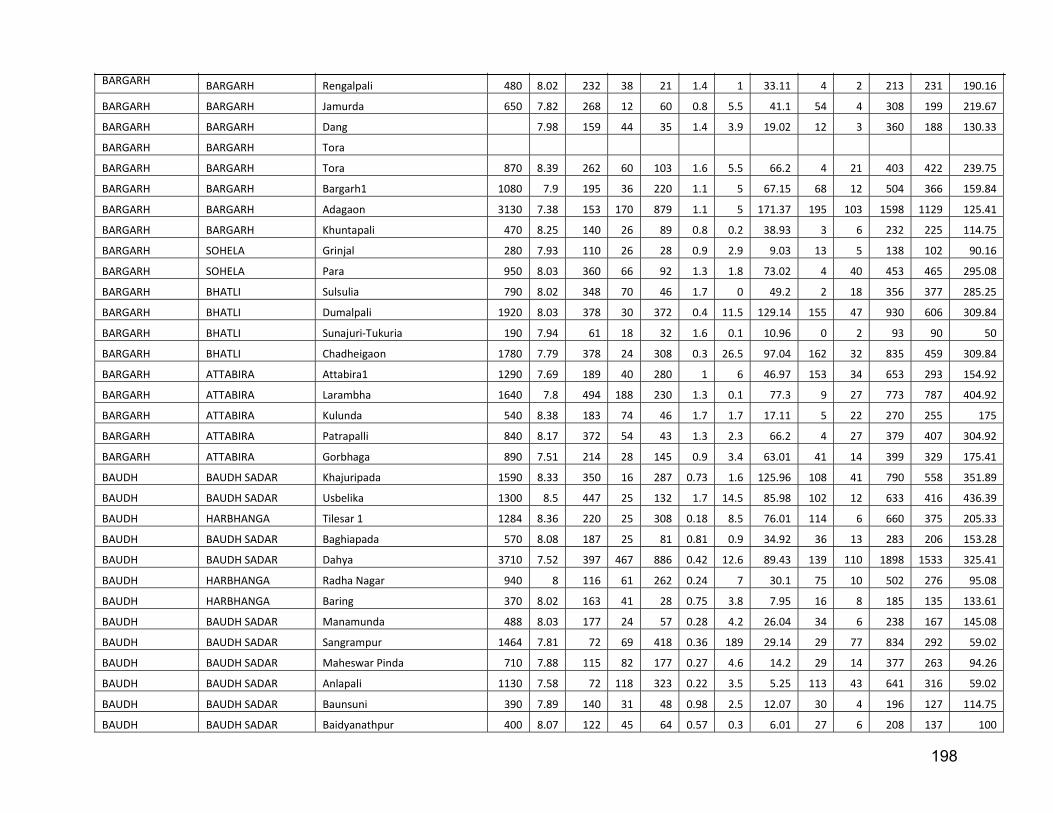
198
BARGARH BARGARH Rengalpali 480 8.02 232 38 21 1.4 1 33.11 4 2 213 231 190.16
BARGARH BARGARH Jamurda 650 7.82 268 12 60 0.8 5.5 41.1 54 4 308 199 219.67
BARGARH BARGARH Dang 7.98 159 44 35 1.4 3.9 19.02 12 3 360 188 130.33
BARGARH BARGARH Tora
BARGARH BARGARH Tora 870 8.39 262 60 103 1.6 5.5 66.2 4 21 403 422 239.75
BARGARH BARGARH Bargarh1 1080 7.9 195 36 220 1.1 5 67.15 68 12 504 366 159.84
BARGARH BARGARH Adagaon 3130 7.38 153 170 879 1.1 5 171.37 195 103 1598 1129 125.41
BARGARH BARGARH Khuntapali 470 8.25 140 26 89 0.8 0.2 38.93 3 6 232 225 114.75
BARGARH SOHELA Grinjal 280 7.93 110 26 28 0.9 2.9 9.03 13 5 138 102 90.16
BARGARH SOHELA Para 950 8.03 360 66 92 1.3 1.8 73.02 4 40 453 465 295.08
BARGARH BHATLI Sulsulia 790 8.02 348 70 46 1.7 0 49.2 2 18 356 377 285.25
BARGARH BHATLI Dumalpali 1920 8.03 378 30 372 0.4 11.5 129.14 155 47 930 606 309.84
BARGARH BHATLI Sunajuri-Tukuria 190 7.94 61 18 32 1.6 0.1 10.96 0 2 93 90 50
BARGARH BHATLI Chadheigaon 1780 7.79 378 24 308 0.3 26.5 97.04 162 32 835 459 309.84
BARGARH ATTABIRA Attabira1 1290 7.69 189 40 280 1 6 46.97 153 34 653 293 154.92
BARGARH ATTABIRA Larambha 1640 7.8 494 188 230 1.3 0.1 77.3 9 27 773 787 404.92
BARGARH ATTABIRA Kulunda 540 8.38 183 74 46 1.7 1.7 17.11 5 22 270 255 175
BARGARH ATTABIRA Patrapalli 840 8.17 372 54 43 1.3 2.3 66.2 4 27 379 407 304.92
BARGARH ATTABIRA Gorbhaga 890 7.51 214 28 145 0.9 3.4 63.01 41 14 399 329 175.41
BAUDH BAUDH SADAR Khajuripada 1590 8.33 350 16 287 0.73 1.6 125.96 108 41 790 558 351.89
BAUDH BAUDH SADAR Usbelika 1300 8.5 447 25 132 1.7 14.5 85.98 102 12 633 416 436.39
BAUDH HARBHANGA Tilesar 1 1284 8.36 220 25 308 0.18 8.5 76.01 114 6 660 375 205.33
BAUDH BAUDH SADAR Baghiapada 570 8.08 187 25 81 0.81 0.9 34.92 36 13 283 206 153.28
BAUDH BAUDH SADAR Dahya 3710 7.52 397 467 886 0.42 12.6 89.43 139 110 1898 1533 325.41
BAUDH HARBHANGA Radha Nagar 940 8 116 61 262 0.24 7 30.1 75 10 502 276 95.08
BAUDH HARBHANGA Baring 370 8.02 163 41 28 0.75 3.8 7.95 16 8 185 135 133.61
BAUDH BAUDH SADAR Manamunda 488 8.03 177 24 57 0.28 4.2 26.04 34 6 238 167 145.08
BAUDH BAUDH SADAR Sangrampur 1464 7.81 72 69 418 0.36 189 29.14 29 77 834 292 59.02
BAUDH BAUDH SADAR Maheswar Pinda 710 7.88 115 82 177 0.27 4.6 14.2 29 14 377 263 94.26
BAUDH BAUDH SADAR Anlapali 1130 7.58 72 118 323 0.22 3.5 5.25 113 43 641 316 59.02
BAUDH BAUDH SADAR Baunsuni 390 7.89 140 31 48 0.98 2.5 12.07 30 4 196 127 114.75
BAUDH BAUDH SADAR Baidyanathpur 400 8.07 122 45 64 0.57 0.3 6.01 27 6 208 137 100
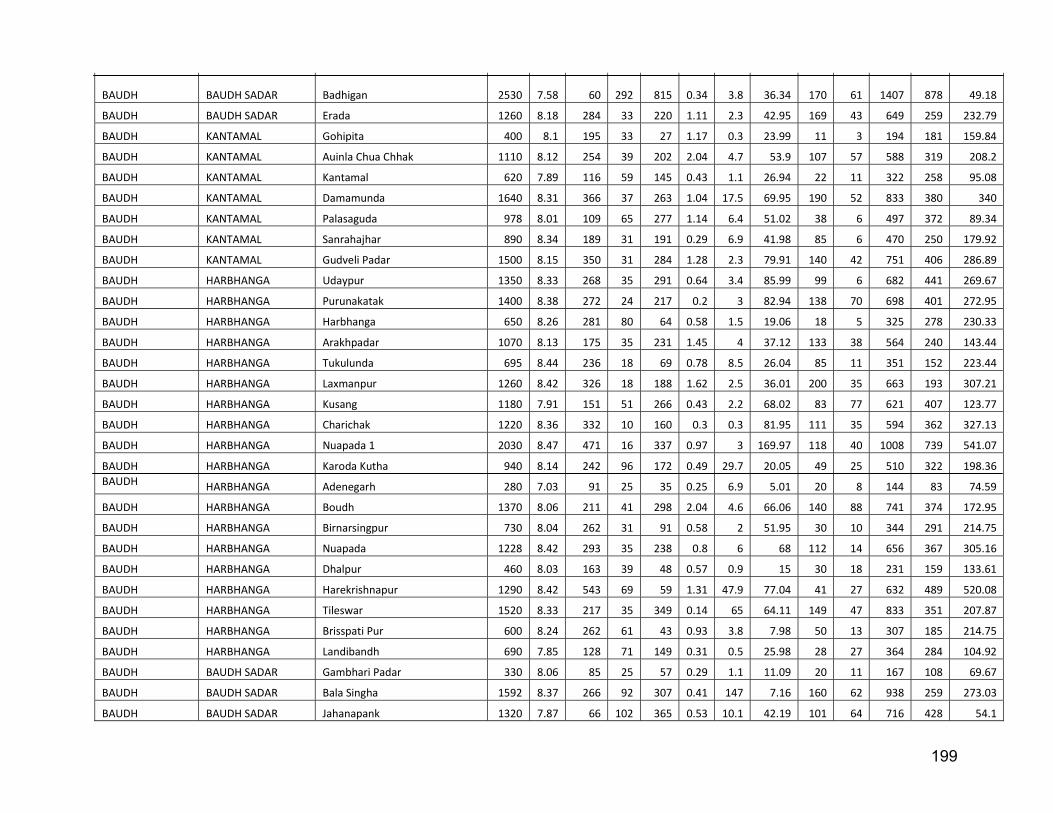
199
BAUDH BAUDH SADAR Badhigan 2530 7.58 60 292 815 0.34 3.8 36.34 170 61 1407 878 49.18
BAUDH BAUDH SADAR Erada 1260 8.18 284 33 220 1.11 2.3 42.95 169 43 649 259 232.79
BAUDH KANTAMAL Gohipita 400 8.1 195 33 27 1.17 0.3 23.99 11 3 194 181 159.84
BAUDH KANTAMAL Auinla Chua Chhak 1110 8.12 254 39 202 2.04 4.7 53.9 107 57 588 319 208.2
BAUDH KANTAMAL Kantamal 620 7.89 116 59 145 0.43 1.1 26.94 22 11 322 258 95.08
BAUDH KANTAMAL Damamunda 1640 8.31 366 37 263 1.04 17.5 69.95 190 52 833 380 340
BAUDH KANTAMAL Palasaguda 978 8.01 109 65 277 1.14 6.4 51.02 38 6 497 372 89.34
BAUDH KANTAMAL Sanrahajhar 890 8.34 189 31 191 0.29 6.9 41.98 85 6 470 250 179.92
BAUDH KANTAMAL Gudveli Padar 1500 8.15 350 31 284 1.28 2.3 79.91 140 42 751 406 286.89
BAUDH HARBHANGA Udaypur 1350 8.33 268 35 291 0.64 3.4 85.99 99 6 682 441 269.67
BAUDH HARBHANGA Purunakatak 1400 8.38 272 24 217 0.2 3 82.94 138 70 698 401 272.95
BAUDH HARBHANGA Harbhanga 650 8.26 281 80 64 0.58 1.5 19.06 18 5 325 278 230.33
BAUDH HARBHANGA Arakhpadar 1070 8.13 175 35 231 1.45 4 37.12 133 38 564 240 143.44
BAUDH HARBHANGA Tukulunda 695 8.44 236 18 69 0.78 8.5 26.04 85 11 351 152 223.44
BAUDH HARBHANGA Laxmanpur 1260 8.42 326 18 188 1.62 2.5 36.01 200 35 663 193 307.21
BAUDH HARBHANGA Kusang 1180 7.91 151 51 266 0.43 2.2 68.02 83 77 621 407 123.77
BAUDH HARBHANGA Charichak 1220 8.36 332 10 160 0.3 0.3 81.95 111 35 594 362 327.13
BAUDH HARBHANGA Nuapada 1 2030 8.47 471 16 337 0.97 3 169.97 118 40 1008 739 541.07
BAUDH HARBHANGA Karoda Kutha 940 8.14 242 96 172 0.49 29.7 20.05 49 25 510 322 198.36 BAUDH HARBHANGA Adenegarh 280 7.03 91 25 35 0.25 6.9 5.01 20 8 144 83 74.59
BAUDH HARBHANGA Boudh 1370 8.06 211 41 298 2.04 4.6 66.06 140 88 741 374 172.95
BAUDH HARBHANGA Birnarsingpur 730 8.04 262 31 91 0.58 2 51.95 30 10 344 291 214.75
BAUDH HARBHANGA Nuapada 1228 8.42 293 35 238 0.8 6 68 112 14 656 367 305.16
BAUDH HARBHANGA Dhalpur 460 8.03 163 39 48 0.57 0.9 15 30 18 231 159 133.61
BAUDH HARBHANGA Harekrishnapur 1290 8.42 543 69 59 1.31 47.9 77.04 41 27 632 489 520.08
BAUDH HARBHANGA Tileswar 1520 8.33 217 35 349 0.14 65 64.11 149 47 833 351 207.87
BAUDH HARBHANGA Brisspati Pur 600 8.24 262 61 43 0.93 3.8 7.98 50 13 307 185 214.75
BAUDH HARBHANGA Landibandh 690 7.85 128 71 149 0.31 0.5 25.98 28 27 364 284 104.92
BAUDH BAUDH SADAR Gambhari Padar 330 8.06 85 25 57 0.29 1.1 11.09 20 11 167 108 69.67
BAUDH BAUDH SADAR Bala Singha 1592 8.37 266 92 307 0.41 147 7.16 160 62 938 259 273.03
BAUDH BAUDH SADAR Jahanapank 1320 7.87 66 102 365 0.53 10.1 42.19 101 64 716 428 54.1

200
BAUDH BAUDH SADAR Telibandha 460 8.07 122 29 67 0.47 17.8 5.99 50 17 247 97 100
BAUDH BAUDH SADAR Lumurjena 930 8.24 393 16 79 0.95 14.5 69.07 55 36 462 324 322.13
BAUDH BAUDH SADAR Gundulia 460 8.12 165 25 54 0.82 2.5 25.92 26 14 228 169 135.25
BAUDH BAUDH SADAR Butupalli 590 7.79 133 53 113 0.52 0.4 26.93 22 10 291 243 109.02
BHADRAK DHAMANAGAR Boharbili 350 8.2 128 20 46 0.5 1.4 15.1 28 4 177 112 104.92
BHADRAK DHAMANAGAR Kothar 1 270 8.23 20 122 0.5 8.7 3.91 27 21 140 66 0
BHADRAK DHAMANAGAR Bhagvenpur 240 8.03 79 16 35 0.7 0.5 15.09 11 4 120 102 64.75
BHADRAK TIHIDI Bidanpur 270 8.05 98 16 39 0.3 0.7 12.91 20 1 138 93 80.33
BHADRAK BHADRAK Bentola 250 8.07 122 14 18 0.4 0.7 12.9 19 2 126 88 100
BHADRAK BHADRAK Uttarabahini 310 8.16 122 18 35 0.4 1 15.1 23 2 154 107 100
BHADRAK BHADRAK Sabrang 270 8.16 122 16 21 0.3 1.8 10.96 20 3 133 85 100
BHADRAK BHADRAK Balipatna 310 8.21 146 18 28 0.5 1.4 15.1 29 1 164 107 119.67
BHADRAK BHADRAK Gujidarha 300 8.19 134 16 28 0.5 1.4 5.13 37 2 155 61 109.84
BHADRAK BHADRAK Durgapur 320 8.23 116 20 43 0.5 1.1 16.07 22 3 162 116 95.08
BHADRAK BHADRAK Tihidi 230 8.05 85 16 32 0.3 0.5 11.93 11 2 115 89 69.67
BHADRAK BHADRAK Rambhila 300 8.2 146 14 18 0.4 1.5 15.09 28 3 151 97 119.67
BHADRAK BHADRAK Ada Sasan 340 8.11 128 22 43 0.4 1.1 16.07 23 2 170 121 104.92
BHADRAK BASUDEBPUR Bagdavinayakpur 220 8.01 85 14 28 0.5 0.6 12.9 11 0 108 88 69.67
BHADRAK DHAMANAGAR Kothar 360 8.2 128 24 46 0.6 1.9 10 37 3 185 101 104.92 BHADRAK DHAMANAGAR Betaligaon 340 8.18 165 18 28 0.5 1.4 17.04 29 2 176 115 135.25
BHADRAK TIHIDI Khamaria-II 370 8.28 171 14 25 0.5 2.8 0.99 64 5 196 39 140.16
BHADRAK BHANDARIPOKHARI Akhuapada 250 8.04 104 16 25 0.7 0.8 15.09 12 1 121 102 85.25
CUTTACK NIALI Madhab 950 8.6 302 34 106 0.15 133 23.14 63 50 439 180 267.54
CUTTACK NIALI Belasahi 1000 8.4 320 28 130 0.56 62 58.39 68 56 503 310 267.3
CUTTACK CUTTACKSADAR Nuagarh 150 8.15 92 26 7 0.19 0.93 2.46 7 6 94 75 75.41
CUTTACK SALEPUR Sisua 435 7.99 181 32 49 0.44 6.53 17.06 30 2 220.5 150 148.36
CUTTACK NISCHINTA KOILI Kulia 1 230 8 145 26 15 0.45 0.68 15.84 7 9 145.5 130 118.85
CUTTACK ATHAGAD Athagarh-1 60 7.5 37 8 4 0.13 0.98 2.44 3 1 36.5 30 30.33
CUTTACK ATHAGAD Megha 495 8.81 146 40 21 0.2 2.66 17.07 32.3 2.8 255 170 229.67
CUTTACK TANGI CHOUDWAR Nimpur 530 8.4 254 68 52 0.25 7.54 17.1 32 23 322 240 213.2
CUTTACK KANTAPADA Kandarpur 1 450 7.9 226 58 71 0.25 9.48 29.25 22 25 318 265 185.25
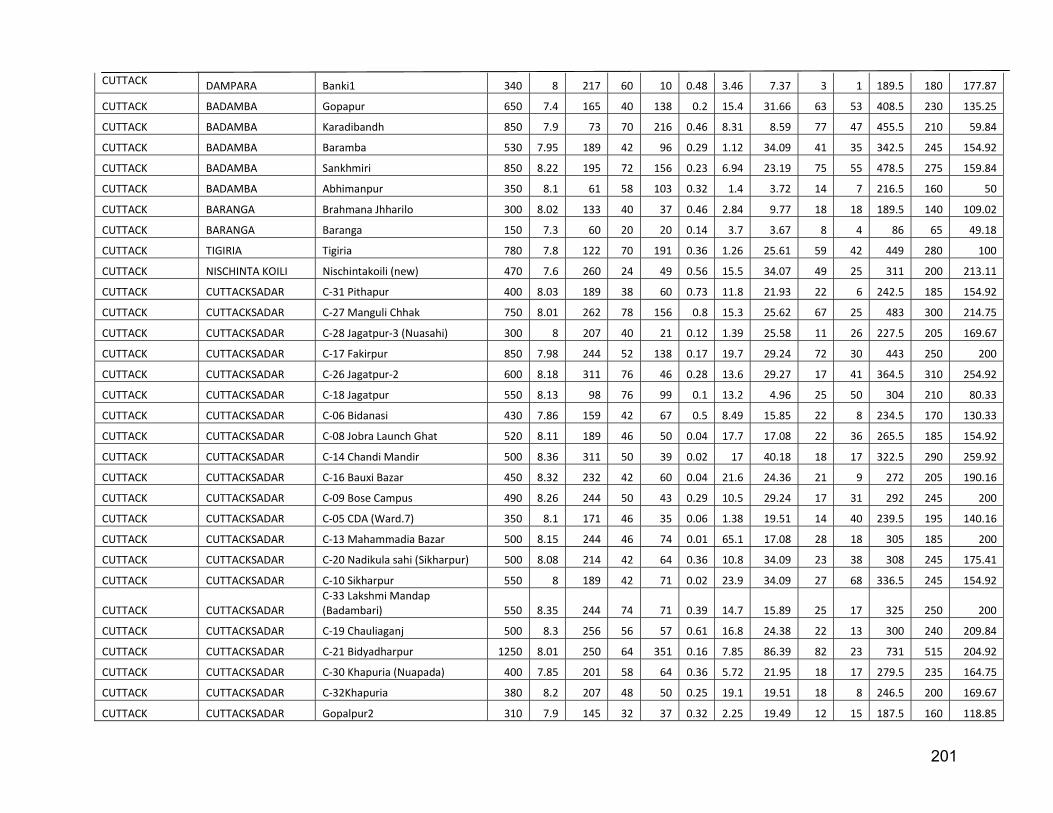
201
CUTTACK DAMPARA Banki1 340 8 217 60 10 0.48 3.46 7.37 3 1 189.5 180 177.87
CUTTACK BADAMBA Gopapur 650 7.4 165 40 138 0.2 15.4 31.66 63 53 408.5 230 135.25
CUTTACK BADAMBA Karadibandh 850 7.9 73 70 216 0.46 8.31 8.59 77 47 455.5 210 59.84
CUTTACK BADAMBA Baramba 530 7.95 189 42 96 0.29 1.12 34.09 41 35 342.5 245 154.92
CUTTACK BADAMBA Sankhmiri 850 8.22 195 72 156 0.23 6.94 23.19 75 55 478.5 275 159.84
CUTTACK BADAMBA Abhimanpur 350 8.1 61 58 103 0.32 1.4 3.72 14 7 216.5 160 50
CUTTACK BARANGA Brahmana Jhharilo 300 8.02 133 40 37 0.46 2.84 9.77 18 18 189.5 140 109.02
CUTTACK BARANGA Baranga 150 7.3 60 20 20 0.14 3.7 3.67 8 4 86 65 49.18
CUTTACK TIGIRIA Tigiria 780 7.8 122 70 191 0.36 1.26 25.61 59 42 449 280 100
CUTTACK NISCHINTA KOILI Nischintakoili (new) 470 7.6 260 24 49 0.56 15.5 34.07 49 25 311 200 213.11
CUTTACK CUTTACKSADAR C-31 Pithapur 400 8.03 189 38 60 0.73 11.8 21.93 22 6 242.5 185 154.92
CUTTACK CUTTACKSADAR C-27 Manguli Chhak 750 8.01 262 78 156 0.8 15.3 25.62 67 25 483 300 214.75
CUTTACK CUTTACKSADAR C-28 Jagatpur-3 (Nuasahi) 300 8 207 40 21 0.12 1.39 25.58 11 26 227.5 205 169.67
CUTTACK CUTTACKSADAR C-17 Fakirpur 850 7.98 244 52 138 0.17 19.7 29.24 72 30 443 250 200
CUTTACK CUTTACKSADAR C-26 Jagatpur-2 600 8.18 311 76 46 0.28 13.6 29.27 17 41 364.5 310 254.92
CUTTACK CUTTACKSADAR C-18 Jagatpur 550 8.13 98 76 99 0.1 13.2 4.96 25 50 304 210 80.33
CUTTACK CUTTACKSADAR C-06 Bidanasi 430 7.86 159 42 67 0.5 8.49 15.85 22 8 234.5 170 130.33
CUTTACK CUTTACKSADAR C-08 Jobra Launch Ghat 520 8.11 189 46 50 0.04 17.7 17.08 22 36 265.5 185 154.92
CUTTACK CUTTACKSADAR C-14 Chandi Mandir 500 8.36 311 50 39 0.02 17 40.18 18 17 322.5 290 259.92
CUTTACK CUTTACKSADAR C-16 Bauxi Bazar 450 8.32 232 42 60 0.04 21.6 24.36 21 9 272 205 190.16
CUTTACK CUTTACKSADAR C-09 Bose Campus 490 8.26 244 50 43 0.29 10.5 29.24 17 31 292 245 200
CUTTACK CUTTACKSADAR C-05 CDA (Ward.7) 350 8.1 171 46 35 0.06 1.38 19.51 14 40 239.5 195 140.16
CUTTACK CUTTACKSADAR C-13 Mahammadia Bazar 500 8.15 244 46 74 0.01 65.1 17.08 28 18 305 185 200
CUTTACK CUTTACKSADAR C-20 Nadikula sahi (Sikharpur) 500 8.08 214 42 64 0.36 10.8 34.09 23 38 308 245 175.41
CUTTACK CUTTACKSADAR C-10 Sikharpur 550 8 189 42 71 0.02 23.9 34.09 27 68 336.5 245 154.92
CUTTACK CUTTACKSADAR C-33 Lakshmi Mandap (Badambari) 550 8.35 244 74 71 0.39 14.7 15.89 25 17 325 250 200
CUTTACK CUTTACKSADAR C-19 Chauliaganj 500 8.3 256 56 57 0.61 16.8 24.38 22 13 300 240 209.84
CUTTACK CUTTACKSADAR C-21 Bidyadharpur 1250 8.01 250 64 351 0.16 7.85 86.39 82 23 731 515 204.92
CUTTACK CUTTACKSADAR C-30 Khapuria (Nuapada) 400 7.85 201 58 64 0.36 5.72 21.95 18 17 279.5 235 164.75
CUTTACK CUTTACKSADAR C-32Khapuria 380 8.2 207 48 50 0.25 19.1 19.51 18 8 246.5 200 169.67
CUTTACK CUTTACKSADAR Gopalpur2 310 7.9 145 32 37 0.32 2.25 19.49 12 15 187.5 160 118.85
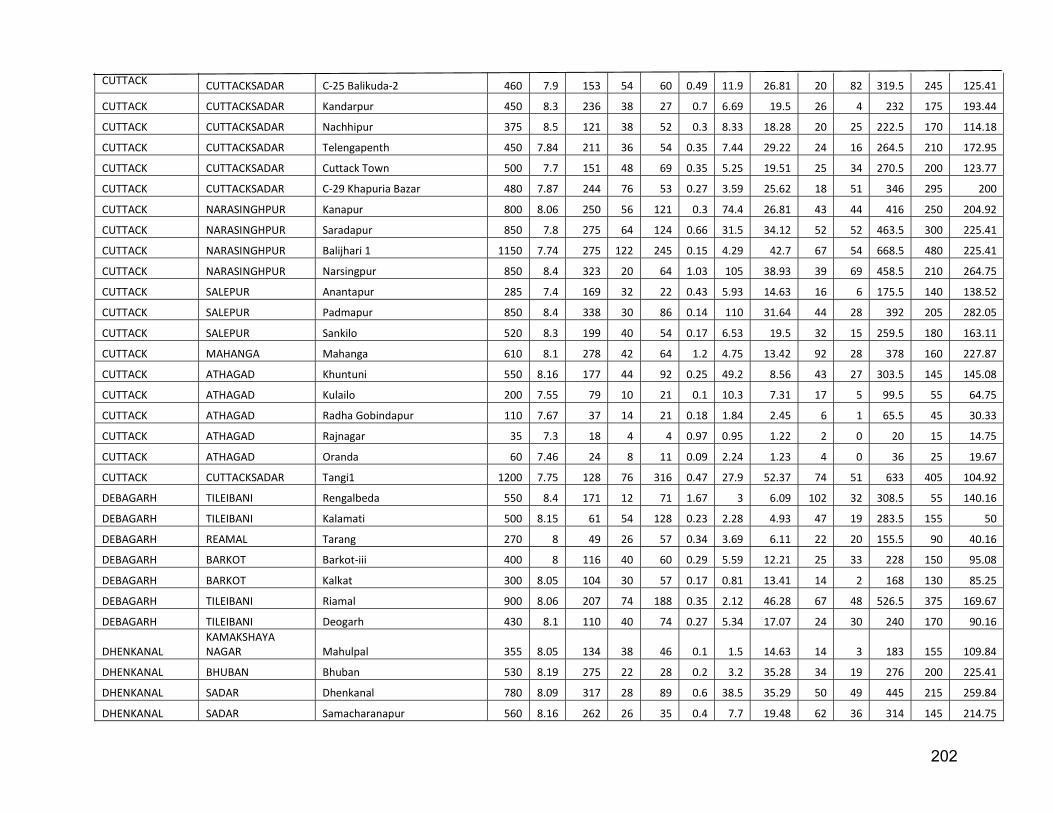
202
CUTTACK CUTTACKSADAR C-25 Balikuda-2 460 7.9 153 54 60 0.49 11.9 26.81 20 82 319.5 245 125.41
CUTTACK CUTTACKSADAR Kandarpur 450 8.3 236 38 27 0.7 6.69 19.5 26 4 232 175 193.44
CUTTACK CUTTACKSADAR Nachhipur 375 8.5 121 38 52 0.3 8.33 18.28 20 25 222.5 170 114.18
CUTTACK CUTTACKSADAR Telengapenth 450 7.84 211 36 54 0.35 7.44 29.22 24 16 264.5 210 172.95
CUTTACK CUTTACKSADAR Cuttack Town 500 7.7 151 48 69 0.35 5.25 19.51 25 34 270.5 200 123.77
CUTTACK CUTTACKSADAR C-29 Khapuria Bazar 480 7.87 244 76 53 0.27 3.59 25.62 18 51 346 295 200
CUTTACK NARASINGHPUR Kanapur 800 8.06 250 56 121 0.3 74.4 26.81 43 44 416 250 204.92
CUTTACK NARASINGHPUR Saradapur 850 7.8 275 64 124 0.66 31.5 34.12 52 52 463.5 300 225.41
CUTTACK NARASINGHPUR Balijhari 1 1150 7.74 275 122 245 0.15 4.29 42.7 67 54 668.5 480 225.41
CUTTACK NARASINGHPUR Narsingpur 850 8.4 323 20 64 1.03 105 38.93 39 69 458.5 210 264.75
CUTTACK SALEPUR Anantapur 285 7.4 169 32 22 0.43 5.93 14.63 16 6 175.5 140 138.52
CUTTACK SALEPUR Padmapur 850 8.4 338 30 86 0.14 110 31.64 44 28 392 205 282.05
CUTTACK SALEPUR Sankilo 520 8.3 199 40 54 0.17 6.53 19.5 32 15 259.5 180 163.11
CUTTACK MAHANGA Mahanga 610 8.1 278 42 64 1.2 4.75 13.42 92 28 378 160 227.87
CUTTACK ATHAGAD Khuntuni 550 8.16 177 44 92 0.25 49.2 8.56 43 27 303.5 145 145.08
CUTTACK ATHAGAD Kulailo 200 7.55 79 10 21 0.1 10.3 7.31 17 5 99.5 55 64.75
CUTTACK ATHAGAD Radha Gobindapur 110 7.67 37 14 21 0.18 1.84 2.45 6 1 65.5 45 30.33
CUTTACK ATHAGAD Rajnagar 35 7.3 18 4 4 0.97 0.95 1.22 2 0 20 15 14.75
CUTTACK ATHAGAD Oranda 60 7.46 24 8 11 0.09 2.24 1.23 4 0 36 25 19.67
CUTTACK CUTTACKSADAR Tangi1 1200 7.75 128 76 316 0.47 27.9 52.37 74 51 633 405 104.92
DEBAGARH TILEIBANI Rengalbeda 550 8.4 171 12 71 1.67 3 6.09 102 32 308.5 55 140.16
DEBAGARH TILEIBANI Kalamati 500 8.15 61 54 128 0.23 2.28 4.93 47 19 283.5 155 50
DEBAGARH REAMAL Tarang 270 8 49 26 57 0.34 3.69 6.11 22 20 155.5 90 40.16
DEBAGARH BARKOT Barkot-iii 400 8 116 40 60 0.29 5.59 12.21 25 33 228 150 95.08
DEBAGARH BARKOT Kalkat 300 8.05 104 30 57 0.17 0.81 13.41 14 2 168 130 85.25
DEBAGARH TILEIBANI Riamal 900 8.06 207 74 188 0.35 2.12 46.28 67 48 526.5 375 169.67
DEBAGARH TILEIBANI Deogarh 430 8.1 110 40 74 0.27 5.34 17.07 24 30 240 170 90.16
DHENKANAL KAMAKSHAYA NAGAR Mahulpal 355 8.05 134 38 46 0.1 1.5 14.63 14 3 183 155 109.84
DHENKANAL BHUBAN Bhuban 530 8.19 275 22 28 0.2 3.2 35.28 34 19 276 200 225.41
DHENKANAL SADAR Dhenkanal 780 8.09 317 28 89 0.6 38.5 35.29 50 49 445 215 259.84
DHENKANAL SADAR Samacharanapur 560 8.16 262 26 35 0.4 7.7 19.48 62 36 314 145 214.75

203
DHENKANAL SADAR Shankarpur 365 8.12 153 16 35 0.2 2 27.98 16 20 192 155 125.41
DHENKANAL SADAR Saptasaja 470 7.94 177 28 39 0.3 24.2 14.62 41 48 282 130 145.08
DHENKANAL SADAR Bhapur2 1390 7.74 73 172 397 0.1 4.1 23.31 53 20 705 525 59.84
DHENKANAL SADAR Baldiabandh 195 7.56 37 16 46 0 1.7 6.1 16 2 106 65 30.33
DHENKANAL SADAR Kaimati 355 7.97 110 26 50 0.1 10.9 10.97 22 9 183 110 90.16
DHENKANAL KAMAKSHAYA NAGAR Baisingha 380 8.06 214 26 21 0.4 5.2 18.27 25 0.1 199 140 175.41
DHENKANAL KAMAKSHAYA NAGAR Hatwari 160 8.06 67 18 14 0.1 2 4.88 6 3 81 65 54.92
DHENKANAL BHUBAN Samole 530 8.16 177 40 43 0.2 60 8.56 14 31 284 135 145.08
DHENKANAL BHUBAN Mathakaragola 670 8.19 305 22 25 0.1 3.6 38.93 45 59 343 215 250
DHENKANAL PARAJANG Kandarsingha 1720 7.97 122 156 457 0.4 3.5 69.48 67 82 894 675 100
DHENKANAL PARAJANG Parjang1 630 8.03 177 52 71 0.5 1.8 15.87 49 70 347 195 145.08
DHENKANAL PARAJANG Muktaposi 675 8.19 189 40 103 0.3 1.8 26.79 59 14 337 210 154.92
DHENKANAL KAMAKSHAYA NAGAR Alnaberini 1 135 7.81 43 6 25 0 2.1 4.87 12 0.3 68 35 35.25
DHENKANAL KANKADA HAD Batgaon 365 8.07 195 26 25 0.2 0.5 25.56 13 0.1 185 170 159.84
DHENKANAL KANKADA HAD Kankadahad 410 8.13 183 46 39 0.4 2.9 7.35 35 0 220 145 150
DHENKANAL HINDOL Hindol1 520 7.96 171 44 50 0.1 4.8 26.8 20 48 278 220 140.16
DHENKANAL HINDOL Rasol 770 7.78 140 54 121 0.1 19.3 32.89 40 64 400 270 114.75
DHENKANAL HINDOL Balmi 270 8.16 140 36 21 0.2 1.2 7.34 12 0.1 145 120 114.75
DHENKANAL HINDOL Karanda 450 8.01 134 38 71 0.2 1.7 12.2 35 28 251 145 109.84
DHENKANAL HINDOL Babandh 995 7.71 165 223 0.1 2.8 31 24 494 135 135.25
DHENKANAL SADAR Gangutia 130 7.93 37 12 25 0 2.4 1.23 9 0.1 68 35 30.33
DHENKANAL SADAR Bandhnuagaon 310 7.94 79 30 46 0.1 12.8 9.76 13 16 167 115 64.75
DHENKANAL GANDIA Deogaon 200 8.02 73 14 25 0.1 9.9 8.53 9 3 106 70 59.84
DHENKANAL GANDIA Joranda 305 8.16 140 26 43 0.1 0.8 17.05 10 0 165 135 114.75
DHENKANAL GANDIA Mandar 730 8.03 165 72 121 0.1 19.7 12.24 46 20 372 230 135.25
DHENKANAL GANDIA Gondia1 820 7.94 189 54 121 0.1 59 18.3 57 61 463 210 154.92
DHENKANAL ODAPADA Dhaulpur 1730 8.19 110 166 379 0.1 3.3 84.08 40 181 907 760 90.16
DHENKANAL ODAPADA Motanga 960 7.71 323 18 117 0.3 5.6 69.31 73 90 531 330 264.75
DHENKANAL ODAPADA Baulpur 580 8.35 201 22 53 0.6 0.4 18.26 70 24 307 130 199.75
GAJAPATI RAYAGADA Tumbagarh 180 7.88 73 10 14 0.1 6.5 3.9 19 5 94 41 59.84

204
GAJAPATI PARLAKHEMUNDI Lavanyagada 510 7.98 214 20 50 0.4 9 15.1 62 9 270 112 175.41
GAJAPATI PARLAKHEMUNDI Kattalakanita 1110 7.83 214 44 238 1 12 28.01 143 41 611 225 175.41
GAJAPATI PARLAKHEMUNDI Tattipati 950 7.81 159 52 209 0.2 31 29 86 46 531 249 130.33
GAJAPATI PARLAKHEMUNDI Gosani 1150 7.89 214 56 248 0.4 23 19.03 146 17 614 218 175.41
GAJAPATI KASHINAGARA Kasinagar 1120 8.06 281 14 220 0.5 3 52.05 148 20 595 249 230.33
GAJAPATI KASHINAGARA K Sitarampur 1140 7.91 256 16 213 0.4 101 20.93 143 56 675 126 209.84
GAJAPATI GUMA Ranipetta 200 7.68 49 12 35 0.1 0.9 10.96 11 11 105 75 40.16
GAJAPATI RAYAGADA Sabarpur 1180 8.33 348 70 163 0.2 32 22.21 120 53 631 266 285.25
GAJAPATI MOHANA Taramala 550 8.12 177 58 60 0.4 5.6 12.96 31 32 286 198 145.08
GAJAPATI MOHANA Chandiput 700 7.59 183 50 89 0.1 28.3 32.15 24 69 382 257 150
GAJAPATI MOHANA Damadua 260 7.64 67 16 50 0.4 1.5 9.02 26 4 139 77 54.92
GAJAPATI MOHANA Madhura-Amba 1190 8.11 421 24 124 0.2 56 32.12 153 65 660 192 345.08
GAJAPATI MOHANA Mohana 370 8.13 171 30 28 0.3 3.7 10.98 29 4 189 120 140.16
GAJAPATI MOHANA Dantarinalo 640 7.9 293 20 46 0.4 20.2 22.15 74 11 337 141 240.16
GAJAPATI MOHANA Adaba 280 6.67 98 18 32 0.1 15.9 6.1 22 7 149 70 80.33
GAJAPATI MOHANA Suklipadar 390 7.67 61 34 78 0.1 27 7.09 7 21 209 114 50
GAJAPATI MOHANA Lillygada 590 8.15 238 38 57 0.3 5 10.99 63 17 308 140 195.08
GAJAPATI MOHANA Zubagaon 150 7.62 43 8 25 0.1 10.7 3.9 14 7 90 36 35.25
GAJAPATI PARLAKHEMUNDI Raygarh 350 7.92 116 32 46 0.1 20.6 3.93 27 11 197 96 95.08
GAJAPATI PARLAKHEMUNDI Narayanpur 610 7.87 171 16 74 0.1 40 9.02 85 63 371 77 140.16
GAJAPATI PARLAKHEMUNDI Kantragada 950 7.89 207 24 184 0.4 37.5 20.94 125 35 528 146 169.67
GAJAPATI PARLAKHEMUNDI Appalanaidupetta 680 7.84 244 16 74 0.4 19.5 26.03 78 37 370 147 200
GAJAPATI MOHANA Ladruma 430 7.96 159 50 53 0.2 13 0.06 33 5 232 125 130.33
GAJAPATI MOHANA Santhi Nagar 280 8.33 67 20 50 0.2 11.2 6.1 21 11 152 75 54.92
GAJAPATI PARLAKHEMUNDI Miniliaon 260 7.88 73 20 39 0.3 11 1 27 12 146 54 59.84
GAJAPATI PARLAKHEMUNDI Garapanth 450 8.02 207 40 35 0.1 4.8 10.99 34 6 232 145 169.67
GAJAPATI PARLAKHEMUNDI Lavanya Khotta 430 7.91 183 30 28 0.3 7.2 18.03 15 12 200 149 150
GAJAPATI GUMA Parasamba 250 7.8 92 18 28 0.2 5.8 6.1 20 2 125 70 75.41
GAJAPATI RAYAGADA Pegoda 400 8.04 134 26 53 0.2 12.4 10 35 13 215 106 109.84
GANJAM BHANJANAGAR Dadralunda 730 7.75 244 14 64 0.2 40.2 9.99 103 49 400 76 200
GANJAM DHARAKOTE Gangapur 530 7.62 177 40 50 0.1 30.6 11.96 36 51 294 149 145.08
GANJAM POLASARA Polasora 1010 8.21 317 92 142 0.3 17.7 24.18 64 38 533 329 259.84
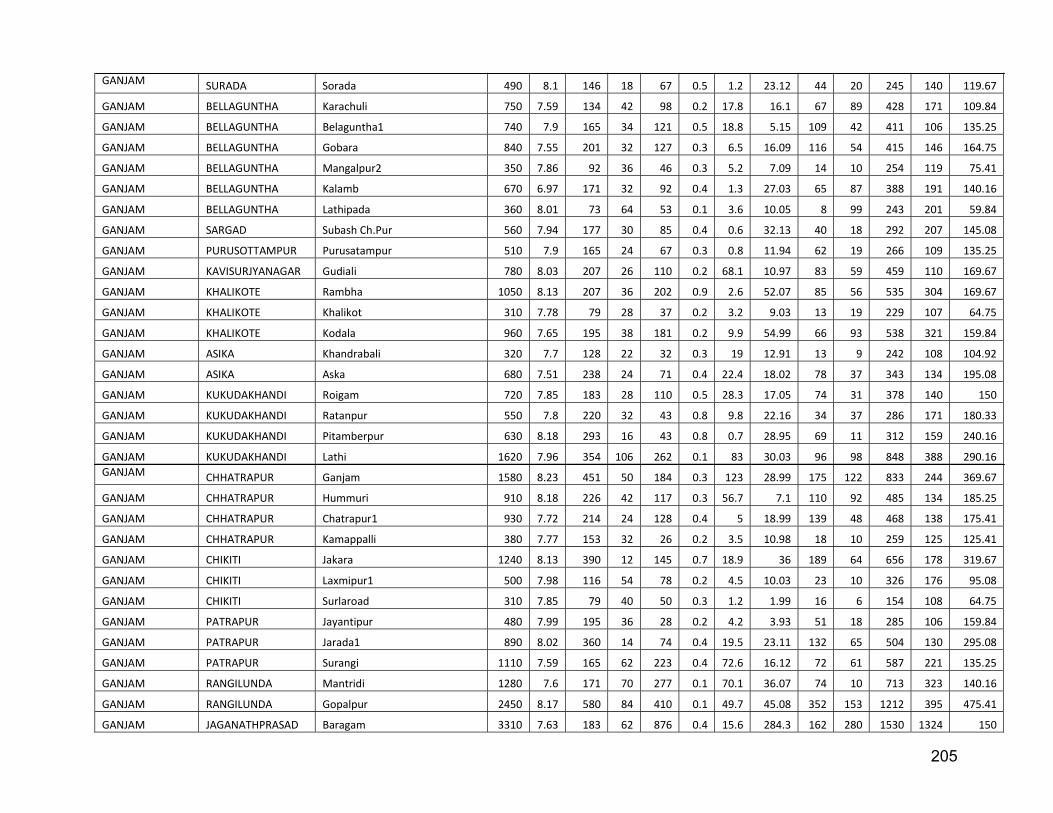
205
GANJAM SURADA Sorada 490 8.1 146 18 67 0.5 1.2 23.12 44 20 245 140 119.67
GANJAM BELLAGUNTHA Karachuli 750 7.59 134 42 98 0.2 17.8 16.1 67 89 428 171 109.84
GANJAM BELLAGUNTHA Belaguntha1 740 7.9 165 34 121 0.5 18.8 5.15 109 42 411 106 135.25
GANJAM BELLAGUNTHA Gobara 840 7.55 201 32 127 0.3 6.5 16.09 116 54 415 146 164.75
GANJAM BELLAGUNTHA Mangalpur2 350 7.86 92 36 46 0.3 5.2 7.09 14 10 254 119 75.41
GANJAM BELLAGUNTHA Kalamb 670 6.97 171 32 92 0.4 1.3 27.03 65 87 388 191 140.16
GANJAM BELLAGUNTHA Lathipada 360 8.01 73 64 53 0.1 3.6 10.05 8 99 243 201 59.84
GANJAM SARGAD Subash Ch.Pur 560 7.94 177 30 85 0.4 0.6 32.13 40 18 292 207 145.08
GANJAM PURUSOTTAMPUR Purusatampur 510 7.9 165 24 67 0.3 0.8 11.94 62 19 266 109 135.25
GANJAM KAVISURJYANAGAR Gudiali 780 8.03 207 26 110 0.2 68.1 10.97 83 59 459 110 169.67
GANJAM KHALIKOTE Rambha 1050 8.13 207 36 202 0.9 2.6 52.07 85 56 535 304 169.67
GANJAM KHALIKOTE Khalikot 310 7.78 79 28 37 0.2 3.2 9.03 13 19 229 107 64.75
GANJAM KHALIKOTE Kodala 960 7.65 195 38 181 0.2 9.9 54.99 66 93 538 321 159.84
GANJAM ASIKA Khandrabali 320 7.7 128 22 32 0.3 19 12.91 13 9 242 108 104.92
GANJAM ASIKA Aska 680 7.51 238 24 71 0.4 22.4 18.02 78 37 343 134 195.08
GANJAM KUKUDAKHANDI Roigam 720 7.85 183 28 110 0.5 28.3 17.05 74 31 378 140 150
GANJAM KUKUDAKHANDI Ratanpur 550 7.8 220 32 43 0.8 9.8 22.16 34 37 286 171 180.33
GANJAM KUKUDAKHANDI Pitamberpur 630 8.18 293 16 43 0.8 0.7 28.95 69 11 312 159 240.16
GANJAM KUKUDAKHANDI Lathi 1620 7.96 354 106 262 0.1 83 30.03 96 98 848 388 290.16 GANJAM CHHATRAPUR Ganjam 1580 8.23 451 50 184 0.3 123 28.99 175 122 833 244 369.67
GANJAM CHHATRAPUR Hummuri 910 8.18 226 42 117 0.3 56.7 7.1 110 92 485 134 185.25
GANJAM CHHATRAPUR Chatrapur1 930 7.72 214 24 128 0.4 5 18.99 139 48 468 138 175.41
GANJAM CHHATRAPUR Kamappalli 380 7.77 153 32 26 0.2 3.5 10.98 18 10 259 125 125.41
GANJAM CHIKITI Jakara 1240 8.13 390 12 145 0.7 18.9 36 189 64 656 178 319.67
GANJAM CHIKITI Laxmipur1 500 7.98 116 54 78 0.2 4.5 10.03 23 10 326 176 95.08
GANJAM CHIKITI Surlaroad 310 7.85 79 40 50 0.3 1.2 1.99 16 6 154 108 64.75
GANJAM PATRAPUR Jayantipur 480 7.99 195 36 28 0.2 4.2 3.93 51 18 285 106 159.84
GANJAM PATRAPUR Jarada1 890 8.02 360 14 74 0.4 19.5 23.11 132 65 504 130 295.08
GANJAM PATRAPUR Surangi 1110 7.59 165 62 223 0.4 72.6 16.12 72 61 587 221 135.25
GANJAM RANGILUNDA Mantridi 1280 7.6 171 70 277 0.1 70.1 36.07 74 10 713 323 140.16
GANJAM RANGILUNDA Gopalpur 2450 8.17 580 84 410 0.1 49.7 45.08 352 153 1212 395 475.41
GANJAM JAGANATHPRASAD Baragam 3310 7.63 183 62 876 0.4 15.6 284.3 162 280 1530 1324 150

206
GANJAM JAGANATHPRASAD Jhadabhumi 410 7.93 134 42 57 0.2 8.5 6.13 27 20 273 130 109.84
GANJAM JAGANATHPRASAD Chamkahandi 830 7.86 250 14 112 0.6 7.2 7.07 154 47 434 64 204.92
GANJAM JAGANATHPRASAD Gayagonda 1 750 7.84 214 18 71 0.5 12.4 15.1 109 53 383 107 175.41
GANJAM GANJAM Poirasi 990 7.8 177 70 209 0.1 4.3 35.1 61 45 511 319 145.08
GANJAM GANJAM Huma 3290 7.74 327 42 808 0.8 199 89.04 399 157 1665 471 268.03
GANJAM RANGILUNDA Berhampur1 1010 8.12 292 12 138 0.3 84.1 23.11 119 43 533 125 239.34
GANJAM RANGILUNDA Konishi 710 7.7 244 28 10.6 0.3 4.6 27.99 66 95 447 185 200
GANJAM RANGILUNDA Phulata 1030 7.64 85 44 269 0.4 2.8 51.11 70 62 540 320 69.67
GANJAM RANGILUNDA Golanthara 1940 7.85 299 20 404 0.7 16.2 40.14 329 56 1012 215 245.08
GANJAM RANGILUNDA Berhampur1 1804 373 0.21 97.25 400 0
GANJAM RANGILUNDA Golabandha 1090 7.69 275 28 149 0.5 9.5 27.02 137 55 498 181 225.41
GANJAM RANGILUNDA Hinjalapalli 410 8.2 177 28 18 0.3 4.7 12.92 31 27 241 123 145.08
GANJAM RANGILUNDA Dumdumi 760 7.78 256 12 85 0.2 19.5 3.9 138 50 434 46 209.84
GANJAM CHHATRAPUR Narendrapur 1690 7.62 73 156 503 0.1 15.4 67.05 77 44 862 665 59.84
GANJAM CHHATRAPUR Govindpur1 1880 7.83 543 22 234 0.3 381 1.97 177 106 1134 63 445.08
GANJAM SANAKHEMUNDI Pudamari 810 7.8 189 92 135 0.3 14.7 23.21 19 51 427 325 154.92
GANJAM SANAKHEMUNDI Patapur 590 7.72 171 26 96 0.2 12.5 28.96 31 17 295 184 140.16
GANJAM HINJILICUT Pochilima 1730 8.28 427 112 287 0 310 5.24 53 84 1060 301 350
GANJAM HINJILICUT Badakhandi 610 7.89 220 16 57 0.5 5.2 41.11 40 39 306 209 180.33
GANJAM SARGAD Sheragada1 590 8.04 201 20 53 0.4 1.4 17.04 70 41 301 120 164.75
GANJAM ASIKA Koitra 670 8.18 323 24 25 0.5 1.4 33.1 62 32 398 196 264.75
GANJAM ASIKA Nuagaon2 760 8.13 195 18 124 0.5 2.8 36.01 75 31 382 193 159.84
GANJAM ASIKA Mundamarai 530 7.76 140 30 67 0.4 2.2 11.95 62 36 278 124 114.75
GANJAM ASIKA Badakholi 440 7.95 134 44 50 0.2 3 10.99 25 40 239 155 109.84
GANJAM ASIKA Kendupadar 680 7.72 195 30 91 0.7 1.9 45.99 31 42 400 264 159.84
GANJAM DHARAKOTE Suramani 460 7.8 98 42 85 0.3 8.9 6.13 29 20 239 130 80.33
GANJAM DHARAKOTE Badagarh 380 8.01 104 36 43 0.2 2.2 11.96 19 38 229 139 85.25
GANJAM DHARAKOTE Balrampur 320 8.06 146 40 25 0.2 1.9 9.04 10 3 160 137 119.67
GANJAM BELLAGUNTHA Buguda1 660 7.57 207 28 64 0.2 26 5.14 91 46 361 91 169.67
GANJAM BELLAGUNTHA Kontaipalli 750 8.01 232 70 89 0.2 11.1 12 61 48 453 224 190.16
GANJAM BELLAGUNTHA Kontaipalli 1 970 7.56 189 108 188 0.2 2 17.15 63 97 568 340 154.92
GANJAM BELLAGUNTHA Bhanjanagar-ii 340 7.57 110 22 24 0.1 3.8 10 26 30 196 96 90.16
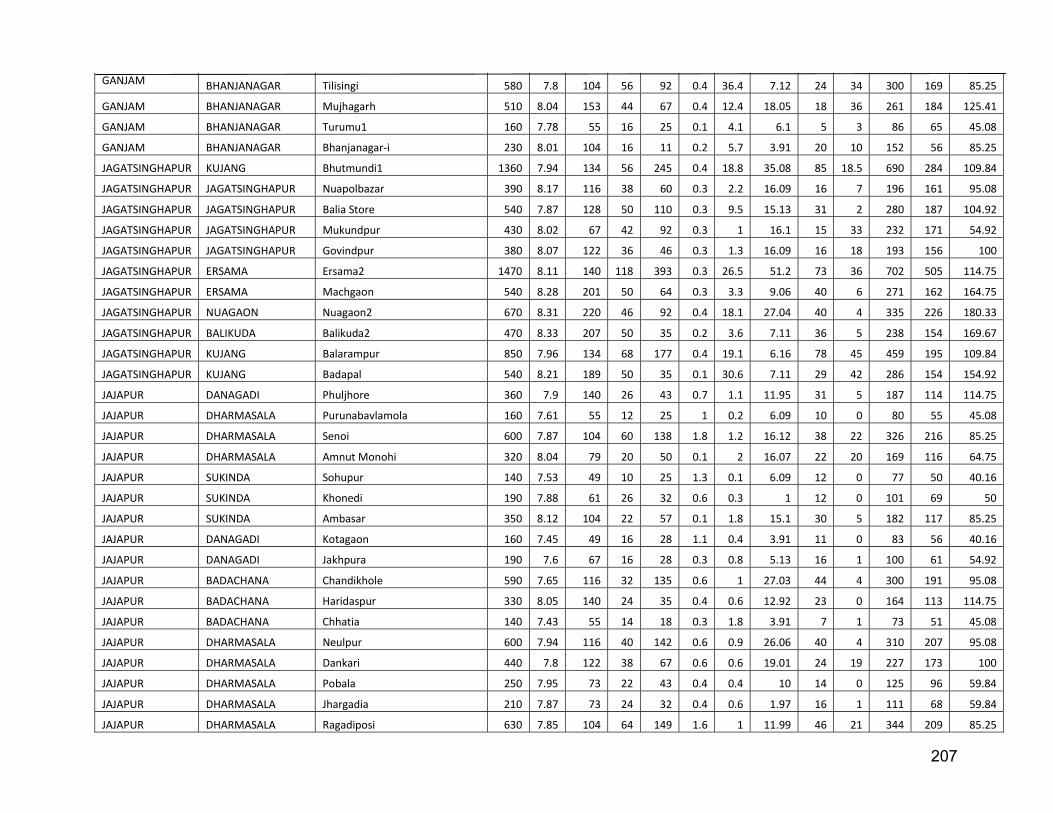
207
GANJAM BHANJANAGAR Tilisingi 580 7.8 104 56 92 0.4 36.4 7.12 24 34 300 169 85.25
GANJAM BHANJANAGAR Mujhagarh 510 8.04 153 44 67 0.4 12.4 18.05 18 36 261 184 125.41
GANJAM BHANJANAGAR Turumu1 160 7.78 55 16 25 0.1 4.1 6.1 5 3 86 65 45.08
GANJAM BHANJANAGAR Bhanjanagar-i 230 8.01 104 16 11 0.2 5.7 3.91 20 10 152 56 85.25
JAGATSINGHAPUR KUJANG Bhutmundi1 1360 7.94 134 56 245 0.4 18.8 35.08 85 18.5 690 284 109.84
JAGATSINGHAPUR JAGATSINGHAPUR Nuapolbazar 390 8.17 116 38 60 0.3 2.2 16.09 16 7 196 161 95.08
JAGATSINGHAPUR JAGATSINGHAPUR Balia Store 540 7.87 128 50 110 0.3 9.5 15.13 31 2 280 187 104.92
JAGATSINGHAPUR JAGATSINGHAPUR Mukundpur 430 8.02 67 42 92 0.3 1 16.1 15 33 232 171 54.92
JAGATSINGHAPUR JAGATSINGHAPUR Govindpur 380 8.07 122 36 46 0.3 1.3 16.09 16 18 193 156 100
JAGATSINGHAPUR ERSAMA Ersama2 1470 8.11 140 118 393 0.3 26.5 51.2 73 36 702 505 114.75
JAGATSINGHAPUR ERSAMA Machgaon 540 8.28 201 50 64 0.3 3.3 9.06 40 6 271 162 164.75
JAGATSINGHAPUR NUAGAON Nuagaon2 670 8.31 220 46 92 0.4 18.1 27.04 40 4 335 226 180.33
JAGATSINGHAPUR BALIKUDA Balikuda2 470 8.33 207 50 35 0.2 3.6 7.11 36 5 238 154 169.67
JAGATSINGHAPUR KUJANG Balarampur 850 7.96 134 68 177 0.4 19.1 6.16 78 45 459 195 109.84
JAGATSINGHAPUR KUJANG Badapal 540 8.21 189 50 35 0.1 30.6 7.11 29 42 286 154 154.92
JAJAPUR DANAGADI Phuljhore 360 7.9 140 26 43 0.7 1.1 11.95 31 5 187 114 114.75
JAJAPUR DHARMASALA Purunabavlamola 160 7.61 55 12 25 1 0.2 6.09 10 0 80 55 45.08
JAJAPUR DHARMASALA Senoi 600 7.87 104 60 138 1.8 1.2 16.12 38 22 326 216 85.25
JAJAPUR DHARMASALA Amnut Monohi 320 8.04 79 20 50 0.1 2 16.07 22 20 169 116 64.75
JAJAPUR SUKINDA Sohupur 140 7.53 49 10 25 1.3 0.1 6.09 12 0 77 50 40.16
JAJAPUR SUKINDA Khonedi 190 7.88 61 26 32 0.6 0.3 1 12 0 101 69 50
JAJAPUR SUKINDA Ambasar 350 8.12 104 22 57 0.1 1.8 15.1 30 5 182 117 85.25
JAJAPUR DANAGADI Kotagaon 160 7.45 49 16 28 1.1 0.4 3.91 11 0 83 56 40.16
JAJAPUR DANAGADI Jakhpura 190 7.6 67 16 28 0.3 0.8 5.13 16 1 100 61 54.92
JAJAPUR BADACHANA Chandikhole 590 7.65 116 32 135 0.6 1 27.03 44 4 300 191 95.08
JAJAPUR BADACHANA Haridaspur 330 8.05 140 24 35 0.4 0.6 12.92 23 0 164 113 114.75
JAJAPUR BADACHANA Chhatia 140 7.43 55 14 18 0.3 1.8 3.91 7 1 73 51 45.08
JAJAPUR DHARMASALA Neulpur 600 7.94 116 40 142 0.6 0.9 26.06 40 4 310 207 95.08
JAJAPUR DHARMASALA Dankari 440 7.8 122 38 67 0.6 0.6 19.01 24 19 227 173 100
JAJAPUR DHARMASALA Pobala 250 7.95 73 22 43 0.4 0.4 10 14 0 125 96 59.84
JAJAPUR DHARMASALA Jhargadia 210 7.87 73 24 32 0.4 0.6 1.97 16 1 111 68 59.84
JAJAPUR DHARMASALA Ragadiposi 630 7.85 104 64 149 1.6 1 11.99 46 21 344 209 85.25

208
JAJAPUR DHARMASALA Jamjhari 340 8 153 26 32 0.4 1.2 9.03 31 1 175 102 125.41
JAJAPUR DHARMASALA Madhupurgarh 460 8.04 140 42 53 0.7 1 7.1 39 25 236 134 114.75
JAJAPUR DHARMASALA Dharmsala 440 7.78 153 32 64 0.7 1.3 18.03 31 5 226 154 125.41
JAJAPUR JAJAPUR Kabirpur 630 7.8 110 60 138 1.4 1.3 16.12 41 30 340 216 90.16
JAJAPUR SUKINDA Dubri 130 7.54 43 10 21 1 0.6 3.9 13 0 70 41 35.25
JAJAPUR SUKINDA Sukinda 630 7.85 128 56 124 1.5 1.4 19.03 43 23 329 218 104.92
JAJAPUR BADACHANA Barchana 330 7.01 122 26 43 0.8 1.1 15.11 19 5 169 127 100
JAJAPUR JAJAPUR Jajpur 590 7.88 122 40 138 0.6 1 23.15 46 4 312 195 100
JAJAPUR SUKINDA Chinguripal 360 7.84 116 36 57 0.4 0.9 11.96 18 5 186 139 95.08
JAJAPUR SUKINDA Kalarangi 350 8.06 146 20 35 0.8 0.8 16.07 29 1 173 116 119.67
JHARSUGUDA LAIKERA Kirimera 140 7.64 98 24 7 0.25 0.46 3.68 5 1 90 75 80.33
JHARSUGUDA LAKHANPUR Katarbaga 150 7.81 85 16 7 0.41 0.62 6.1 9 0 80.5 65 69.67
JHARSUGUDA LAKHANPUR Lakhanpur 400 7.7 98 38 64 0.26 4.85 9.77 29 36 226 135 80.33
JHARSUGUDA JHARSUGUDA Jharsuguda1 920 7.59 110 76 195 0.53 6.97 23.19 67 80 496 285 90.16
JHARSUGUDA JHARSUGUDA Belpahar 220 7.24 31 16 53 0.06 4.16 7.31 18 12 121.5 70 25.41
JHARSUGUDA KIRIMIRA Jamkani (arda) 900 7.55 104 72 195 0.51 7.26 21.97 67 82 490 270 85.25
JHARSUGUDA LAIKERA Sahaspur 120 7.65 73 22 11 0.25 0.48 2.46 5 0 76.5 65 59.84
JHARSUGUDA LAKHANPUR Singarpur 50 7.37 28 10 4 0.1 0.56 0.01 1 0 30.5 25 22.95
JHARSUGUDA LAKHANPUR Panchagaon 130 7.78 85 18 4 0.4 0.6 3.67 9 1 78.5 60 69.67
JHARSUGUDA JHARSUGUDA Badmal 50 7.07 31 6 4 0.06 3.52 2.44 2 0 32.5 25 25.41
KALAHANDI LANJIGARH Biswanathppur 440 8.03 116 54 60 0.4 0.4 11.01 19 21 222 180 95.08
KALAHANDI JUNAGARH Tal Jaring 300 8.07 140 32 21 0.5 1 15.11 8 9 155 142 114.75
KALAHANDI THUAMUL RAM PUR Gunupur 340 8 116 32 46 0.2 0.6 23.14 5 11 174 175 95.08
KALAHANDI BHAWANIPATNA Attanguda 880 7.75 55 106 245 0.3 0.7 27.12 29 33 468 376 45.08
KALAHANDI BHAWANIPATNA Malgaon 420 8 159 24 43 0.7 1.3 27.02 13 27 213 171 130.33
KALAHANDI KARLAMUNDA Risida 530 8.05 220 70 43 0.3 0.2 20.99 7 16 265 261 180.33
KALAHANDI JAYAPATNA Baner 570 8.05 201 46 53 0.3 19.1 22.18 19 39 297 206 164.75
KALAHANDI JAYAPATNA Jaipatna 990 7.67 110 82 255 0.3 1.2 56.02 17 63 528 435 90.16
KALAHANDI JAYAPATNA Mukhiguda 570 7.82 281 58 43 0.4 2.5 32.16 8 2 283 277 230.33
KALAHANDI KALAMPUR Kalampur 330 8.08 134 38 28 0.1 0.8 10.01 15 8 165 136 109.84
KALAHANDI KOKASARA Sunamala 1840 8.04 268 50 429 0.9 0.5 147.16 82 74 914 730 219.67
KALAHANDI KOKASARA Koksara 900 8.06 275 36 106 0.7 2.4 51.1 63 68 461 300 225.41

209
KALAHANDI JUNAGARH Baldiamal 770 7.96 153 42 131 0.5 21 36.03 54 73 432 253 125.41
KALAHANDI JUNAGARH Badbasul 1490 8.24 281 20 135 2.5 1.4 84.15 140 315 833 396 230.33
KALAHANDI JUNAGARH Mahichala 1110 7.74 116 56 241 0.2 10.4 63.04 60 146 633 399 95.08
KALAHANDI JUNAGARH Chiliguda1 760 7.99 79 84 206 0.2 4.2 16.15 30 25 404 276 64.75
KALAHANDI DHARAMAGARH Dharamgarh 590 7.84 195 40 50 0.2 1 29.95 32 53 302 223 159.84
KALAHANDI LANJIGARH Narla 880 7.64 104 76 202 0.4 3.4 50.18 15 52 449 396 85.25
KALAHANDI GOLAMUNDA Kegaon 380 7.99 128 50 43 0.2 1.3 9.06 8 19 193 162 104.92
KALAHANDI GOLAMUNDA Golmunda 650 8.18 317 58 35 1.6 2.2 22.2 42 7 322 236 259.84
KALAHANDI BHAWANIPATNA Sargigora 380 7.99 116 40 57 0.6 0.4 12.93 19 10 196 153 95.08
KALAHANDI BHAWANIPATNA Pastikudi1 680 7.73 61 80 160 0.3 1.5 22.22 14 48 355 291 50
KALAHANDI KESINGA Tundala 930 7.95 250 32 131 0.7 0.5 89.03 24 65 464 446 204.92
KALAHANDI NARALA Tulapada 280 7.97 110 28 35 0.3 0.4 4.9 9 2 143 90 90.16
KALAHANDI MADANPUR RAMPUR M-rampur 290 7.81 92 40 46 0.1 1.3 10.02 6 2 150 141 75.41
KALAHANDI MADANPUR RAMPUR Madanpur1 260 8.14 128 26 21 0.3 2.2 10 11 3 136 106 104.92
KENDRAPARA KENDRAPARA Chandibazar 870 7.74 250 38 113 0.25 6.5 30.44 92 64 466 220 204.92
KENDRAPARA KENDRAPARA Jamdhar 1180 8.25 305 50 156 0.43 6.5 25.59 160 70 618 230 250
KENDRAPARA MAHAKALA PADA Mahakalpara 1100 8.46 250 50 177 0.1 15.5 18.3 151 42 597 200 239.92
KENDRAPARA MARSA GHAI Hatia 890 8.19 189 50 160 0.14 32.6 31.67 61 59 487 255 154.92
KENDRAPARA DERA BIS Chandola 680 8.04 134 18 121 0.19 5.8 26.77 74 54 365 155 109.84
KENDRAPARA DERA BIS Indupur2 430 7.95 110 30 78 0.09 3.2 14.62 32 11 223 135 90.16
KENDRAPARA KENDRAPARA Jajanga 2220 8.23 342 26 507 0.24 2.5 29.21 412 106 1250 185 280.33
KENDRAPARA KENDRAPARA Kasoti 6490 7.77 1379 250 918 0.09 47.5 164.42 860 596 3511 1300 1130.33
KENDRAPARA KENDRAPARA Kajala 500 8.13 92 44 64 0.1 3.6 23.15 18 76 274 205 75.41
KENDRAPARA KENDRAPARA Shyamsundarpur 640 8.06 122 28 103 0.08 2.3 42.58 31 62 329 245 100
KENDRAPARA KENDRAPARA Jantilo 420 8.1 61 44 67 0.17 3.1 13.43 18 56 231 165 50
KENDRAPARA KENDRAPARA Duhuria 1830 7.91 183 64 436 0.13 1.5 29.25 286 136 1042 280 150
KENDRAPARA KENDRAPARA Ramnagar 1250 8.1 226 36 241 0.12 15 32.87 173 97 706 225 185.25
KENDRAPARA KENDRAPARA Nikrai 490 8.06 128 50 60 0.18 4 14.65 19 47 258 185 104.92
KENDRAPARA PATTAMUNDAI Pattamundai1 1020 8.37 244 48 135 0.16 58.3 35.31 71 109 585 265 215
KENDRAPARA KENDRAPARA Gogua 470 8.12 214 42 40 0.27 12.2 13.42 20 3 235 160 175.41
KENDUJHAR JODA Rugudi 1 300 8.03 110 24 35 0.4 2 9.03 22 3 149 97 90.16
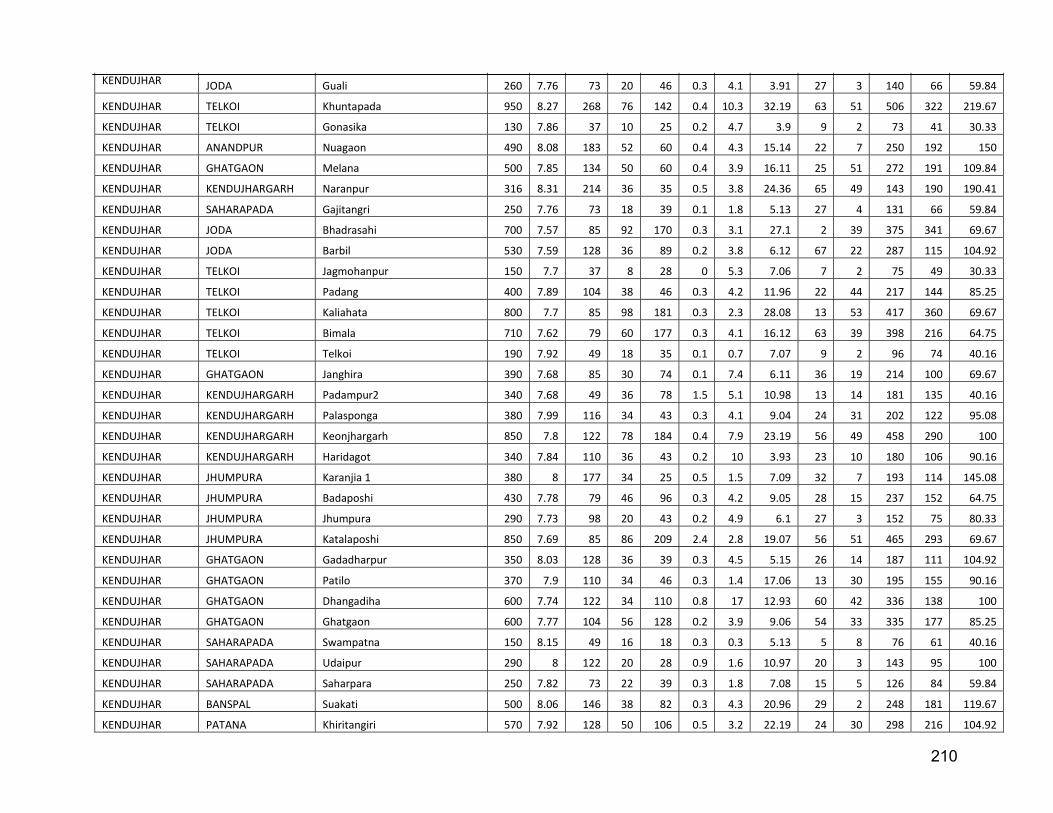
210
KENDUJHAR JODA Guali 260 7.76 73 20 46 0.3 4.1 3.91 27 3 140 66 59.84
KENDUJHAR TELKOI Khuntapada 950 8.27 268 76 142 0.4 10.3 32.19 63 51 506 322 219.67
KENDUJHAR TELKOI Gonasika 130 7.86 37 10 25 0.2 4.7 3.9 9 2 73 41 30.33
KENDUJHAR ANANDPUR Nuagaon 490 8.08 183 52 60 0.4 4.3 15.14 22 7 250 192 150
KENDUJHAR GHATGAON Melana 500 7.85 134 50 60 0.4 3.9 16.11 25 51 272 191 109.84
KENDUJHAR KENDUJHARGARH Naranpur 316 8.31 214 36 35 0.5 3.8 24.36 65 49 143 190 190.41
KENDUJHAR SAHARAPADA Gajitangri 250 7.76 73 18 39 0.1 1.8 5.13 27 4 131 66 59.84
KENDUJHAR JODA Bhadrasahi 700 7.57 85 92 170 0.3 3.1 27.1 2 39 375 341 69.67
KENDUJHAR JODA Barbil 530 7.59 128 36 89 0.2 3.8 6.12 67 22 287 115 104.92
KENDUJHAR TELKOI Jagmohanpur 150 7.7 37 8 28 0 5.3 7.06 7 2 75 49 30.33
KENDUJHAR TELKOI Padang 400 7.89 104 38 46 0.3 4.2 11.96 22 44 217 144 85.25
KENDUJHAR TELKOI Kaliahata 800 7.7 85 98 181 0.3 2.3 28.08 13 53 417 360 69.67
KENDUJHAR TELKOI Bimala 710 7.62 79 60 177 0.3 4.1 16.12 63 39 398 216 64.75
KENDUJHAR TELKOI Telkoi 190 7.92 49 18 35 0.1 0.7 7.07 9 2 96 74 40.16
KENDUJHAR GHATGAON Janghira 390 7.68 85 30 74 0.1 7.4 6.11 36 19 214 100 69.67
KENDUJHAR KENDUJHARGARH Padampur2 340 7.68 49 36 78 1.5 5.1 10.98 13 14 181 135 40.16
KENDUJHAR KENDUJHARGARH Palasponga 380 7.99 116 34 43 0.3 4.1 9.04 24 31 202 122 95.08
KENDUJHAR KENDUJHARGARH Keonjhargarh 850 7.8 122 78 184 0.4 7.9 23.19 56 49 458 290 100
KENDUJHAR KENDUJHARGARH Haridagot 340 7.84 110 36 43 0.2 10 3.93 23 10 180 106 90.16
KENDUJHAR JHUMPURA Karanjia 1 380 8 177 34 25 0.5 1.5 7.09 32 7 193 114 145.08
KENDUJHAR JHUMPURA Badaposhi 430 7.78 79 46 96 0.3 4.2 9.05 28 15 237 152 64.75
KENDUJHAR JHUMPURA Jhumpura 290 7.73 98 20 43 0.2 4.9 6.1 27 3 152 75 80.33
KENDUJHAR JHUMPURA Katalaposhi 850 7.69 85 86 209 2.4 2.8 19.07 56 51 465 293 69.67
KENDUJHAR GHATGAON Gadadharpur 350 8.03 128 36 39 0.3 4.5 5.15 26 14 187 111 104.92
KENDUJHAR GHATGAON Patilo 370 7.9 110 34 46 0.3 1.4 17.06 13 30 195 155 90.16
KENDUJHAR GHATGAON Dhangadiha 600 7.74 122 34 110 0.8 17 12.93 60 42 336 138 100
KENDUJHAR GHATGAON Ghatgaon 600 7.77 104 56 128 0.2 3.9 9.06 54 33 335 177 85.25
KENDUJHAR SAHARAPADA Swampatna 150 8.15 49 16 18 0.3 0.3 5.13 5 8 76 61 40.16
KENDUJHAR SAHARAPADA Udaipur 290 8 122 20 28 0.9 1.6 10.97 20 3 143 95 100
KENDUJHAR SAHARAPADA Saharpara 250 7.82 73 22 39 0.3 1.8 7.08 15 5 126 84 59.84
KENDUJHAR BANSPAL Suakati 500 8.06 146 38 82 0.3 4.3 20.96 29 2 248 181 119.67
KENDUJHAR PATANA Khiritangiri 570 7.92 128 50 106 0.5 3.2 22.19 24 30 298 216 104.92
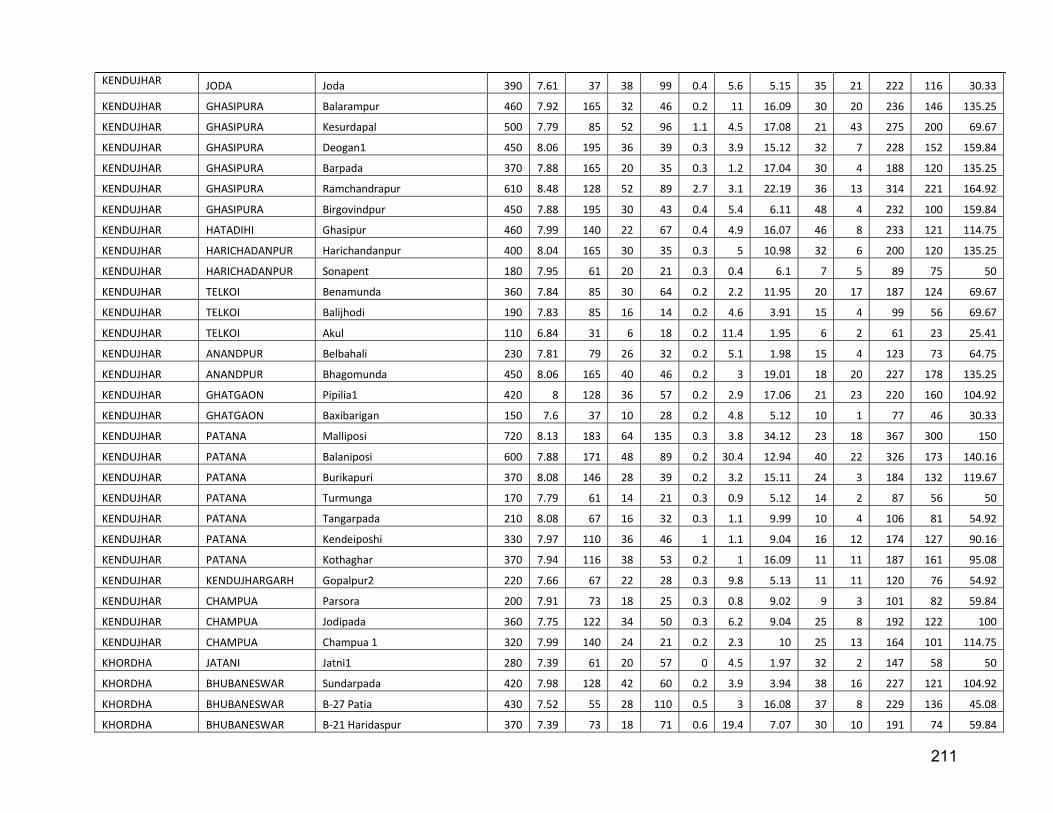
211
KENDUJHAR JODA Joda 390 7.61 37 38 99 0.4 5.6 5.15 35 21 222 116 30.33
KENDUJHAR GHASIPURA Balarampur 460 7.92 165 32 46 0.2 11 16.09 30 20 236 146 135.25
KENDUJHAR GHASIPURA Kesurdapal 500 7.79 85 52 96 1.1 4.5 17.08 21 43 275 200 69.67
KENDUJHAR GHASIPURA Deogan1 450 8.06 195 36 39 0.3 3.9 15.12 32 7 228 152 159.84
KENDUJHAR GHASIPURA Barpada 370 7.88 165 20 35 0.3 1.2 17.04 30 4 188 120 135.25
KENDUJHAR GHASIPURA Ramchandrapur 610 8.48 128 52 89 2.7 3.1 22.19 36 13 314 221 164.92
KENDUJHAR GHASIPURA Birgovindpur 450 7.88 195 30 43 0.4 5.4 6.11 48 4 232 100 159.84
KENDUJHAR HATADIHI Ghasipur 460 7.99 140 22 67 0.4 4.9 16.07 46 8 233 121 114.75
KENDUJHAR HARICHADANPUR Harichandanpur 400 8.04 165 30 35 0.3 5 10.98 32 6 200 120 135.25
KENDUJHAR HARICHADANPUR Sonapent 180 7.95 61 20 21 0.3 0.4 6.1 7 5 89 75 50
KENDUJHAR TELKOI Benamunda 360 7.84 85 30 64 0.2 2.2 11.95 20 17 187 124 69.67
KENDUJHAR TELKOI Balijhodi 190 7.83 85 16 14 0.2 4.6 3.91 15 4 99 56 69.67
KENDUJHAR TELKOI Akul 110 6.84 31 6 18 0.2 11.4 1.95 6 2 61 23 25.41
KENDUJHAR ANANDPUR Belbahali 230 7.81 79 26 32 0.2 5.1 1.98 15 4 123 73 64.75
KENDUJHAR ANANDPUR Bhagomunda 450 8.06 165 40 46 0.2 3 19.01 18 20 227 178 135.25
KENDUJHAR GHATGAON Pipilia1 420 8 128 36 57 0.2 2.9 17.06 21 23 220 160 104.92
KENDUJHAR GHATGAON Baxibarigan 150 7.6 37 10 28 0.2 4.8 5.12 10 1 77 46 30.33
KENDUJHAR PATANA Malliposi 720 8.13 183 64 135 0.3 3.8 34.12 23 18 367 300 150
KENDUJHAR PATANA Balaniposi 600 7.88 171 48 89 0.2 30.4 12.94 40 22 326 173 140.16
KENDUJHAR PATANA Burikapuri 370 8.08 146 28 39 0.2 3.2 15.11 24 3 184 132 119.67
KENDUJHAR PATANA Turmunga 170 7.79 61 14 21 0.3 0.9 5.12 14 2 87 56 50
KENDUJHAR PATANA Tangarpada 210 8.08 67 16 32 0.3 1.1 9.99 10 4 106 81 54.92
KENDUJHAR PATANA Kendeiposhi 330 7.97 110 36 46 1 1.1 9.04 16 12 174 127 90.16
KENDUJHAR PATANA Kothaghar 370 7.94 116 38 53 0.2 1 16.09 11 11 187 161 95.08
KENDUJHAR KENDUJHARGARH Gopalpur2 220 7.66 67 22 28 0.3 9.8 5.13 11 11 120 76 54.92
KENDUJHAR CHAMPUA Parsora 200 7.91 73 18 25 0.3 0.8 9.02 9 3 101 82 59.84
KENDUJHAR CHAMPUA Jodipada 360 7.75 122 34 50 0.3 6.2 9.04 25 8 192 122 100
KENDUJHAR CHAMPUA Champua 1 320 7.99 140 24 21 0.2 2.3 10 25 13 164 101 114.75
KHORDHA JATANI Jatni1 280 7.39 61 20 57 0 4.5 1.97 32 2 147 58 50
KHORDHA BHUBANESWAR Sundarpada 420 7.98 128 42 60 0.2 3.9 3.94 38 16 227 121 104.92
KHORDHA BHUBANESWAR B-27 Patia 430 7.52 55 28 110 0.5 3 16.08 37 8 229 136 45.08
KHORDHA BHUBANESWAR B-21 Haridaspur 370 7.39 73 18 71 0.6 19.4 7.07 30 10 191 74 59.84
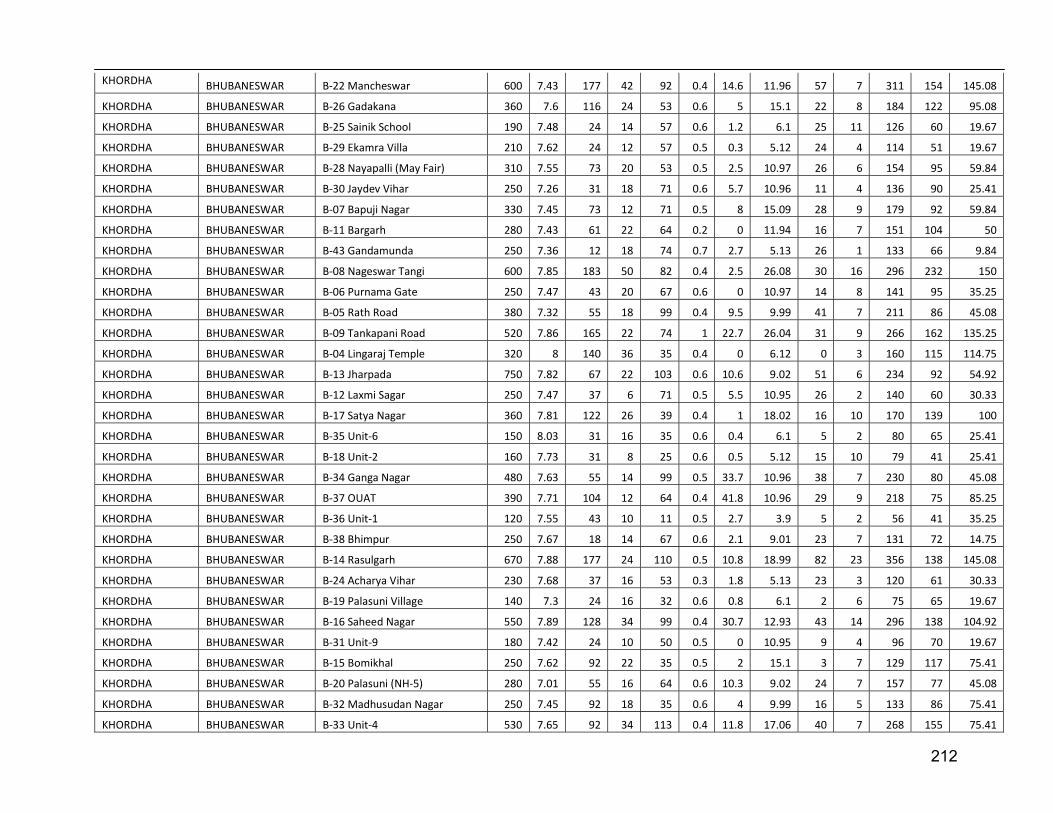
212
KHORDHA BHUBANESWAR B-22 Mancheswar 600 7.43 177 42 92 0.4 14.6 11.96 57 7 311 154 145.08
KHORDHA BHUBANESWAR B-26 Gadakana 360 7.6 116 24 53 0.6 5 15.1 22 8 184 122 95.08
KHORDHA BHUBANESWAR B-25 Sainik School 190 7.48 24 14 57 0.6 1.2 6.1 25 11 126 60 19.67
KHORDHA BHUBANESWAR B-29 Ekamra Villa 210 7.62 24 12 57 0.5 0.3 5.12 24 4 114 51 19.67
KHORDHA BHUBANESWAR B-28 Nayapalli (May Fair) 310 7.55 73 20 53 0.5 2.5 10.97 26 6 154 95 59.84
KHORDHA BHUBANESWAR B-30 Jaydev Vihar 250 7.26 31 18 71 0.6 5.7 10.96 11 4 136 90 25.41
KHORDHA BHUBANESWAR B-07 Bapuji Nagar 330 7.45 73 12 71 0.5 8 15.09 28 9 179 92 59.84
KHORDHA BHUBANESWAR B-11 Bargarh 280 7.43 61 22 64 0.2 0 11.94 16 7 151 104 50
KHORDHA BHUBANESWAR B-43 Gandamunda 250 7.36 12 18 74 0.7 2.7 5.13 26 1 133 66 9.84
KHORDHA BHUBANESWAR B-08 Nageswar Tangi 600 7.85 183 50 82 0.4 2.5 26.08 30 16 296 232 150
KHORDHA BHUBANESWAR B-06 Purnama Gate 250 7.47 43 20 67 0.6 0 10.97 14 8 141 95 35.25
KHORDHA BHUBANESWAR B-05 Rath Road 380 7.32 55 18 99 0.4 9.5 9.99 41 7 211 86 45.08
KHORDHA BHUBANESWAR B-09 Tankapani Road 520 7.86 165 22 74 1 22.7 26.04 31 9 266 162 135.25
KHORDHA BHUBANESWAR B-04 Lingaraj Temple 320 8 140 36 35 0.4 0 6.12 0 3 160 115 114.75
KHORDHA BHUBANESWAR B-13 Jharpada 750 7.82 67 22 103 0.6 10.6 9.02 51 6 234 92 54.92
KHORDHA BHUBANESWAR B-12 Laxmi Sagar 250 7.47 37 6 71 0.5 5.5 10.95 26 2 140 60 30.33
KHORDHA BHUBANESWAR B-17 Satya Nagar 360 7.81 122 26 39 0.4 1 18.02 16 10 170 139 100
KHORDHA BHUBANESWAR B-35 Unit-6 150 8.03 31 16 35 0.6 0.4 6.1 5 2 80 65 25.41
KHORDHA BHUBANESWAR B-18 Unit-2 160 7.73 31 8 25 0.6 0.5 5.12 15 10 79 41 25.41
KHORDHA BHUBANESWAR B-34 Ganga Nagar 480 7.63 55 14 99 0.5 33.7 10.96 38 7 230 80 45.08
KHORDHA BHUBANESWAR B-37 OUAT 390 7.71 104 12 64 0.4 41.8 10.96 29 9 218 75 85.25
KHORDHA BHUBANESWAR B-36 Unit-1 120 7.55 43 10 11 0.5 2.7 3.9 5 2 56 41 35.25
KHORDHA BHUBANESWAR B-38 Bhimpur 250 7.67 18 14 67 0.6 2.1 9.01 23 7 131 72 14.75
KHORDHA BHUBANESWAR B-14 Rasulgarh 670 7.88 177 24 110 0.5 10.8 18.99 82 23 356 138 145.08
KHORDHA BHUBANESWAR B-24 Acharya Vihar 230 7.68 37 16 53 0.3 1.8 5.13 23 3 120 61 30.33
KHORDHA BHUBANESWAR B-19 Palasuni Village 140 7.3 24 16 32 0.6 0.8 6.1 2 6 75 65 19.67
KHORDHA BHUBANESWAR B-16 Saheed Nagar 550 7.89 128 34 99 0.4 30.7 12.93 43 14 296 138 104.92
KHORDHA BHUBANESWAR B-31 Unit-9 180 7.42 24 10 50 0.5 0 10.95 9 4 96 70 19.67
KHORDHA BHUBANESWAR B-15 Bomikhal 250 7.62 92 22 35 0.5 2 15.1 3 7 129 117 75.41
KHORDHA BHUBANESWAR B-20 Palasuni (NH-5) 280 7.01 55 16 64 0.6 10.3 9.02 24 7 157 77 45.08
KHORDHA BHUBANESWAR B-32 Madhusudan Nagar 250 7.45 92 18 35 0.6 4 9.99 16 5 133 86 75.41
KHORDHA BHUBANESWAR B-33 Unit-4 530 7.65 92 34 113 0.4 11.8 17.06 40 7 268 155 75.41
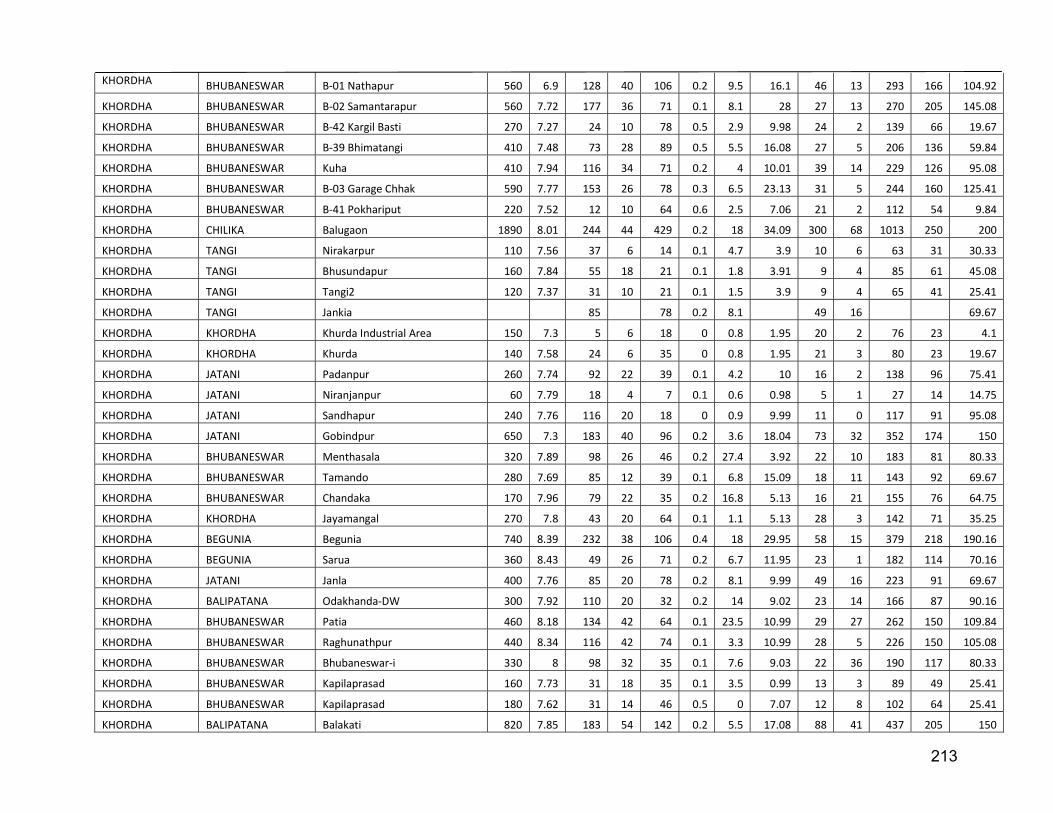
213
KHORDHA BHUBANESWAR B-01 Nathapur 560 6.9 128 40 106 0.2 9.5 16.1 46 13 293 166 104.92
KHORDHA BHUBANESWAR B-02 Samantarapur 560 7.72 177 36 71 0.1 8.1 28 27 13 270 205 145.08
KHORDHA BHUBANESWAR B-42 Kargil Basti 270 7.27 24 10 78 0.5 2.9 9.98 24 2 139 66 19.67
KHORDHA BHUBANESWAR B-39 Bhimatangi 410 7.48 73 28 89 0.5 5.5 16.08 27 5 206 136 59.84
KHORDHA BHUBANESWAR Kuha 410 7.94 116 34 71 0.2 4 10.01 39 14 229 126 95.08
KHORDHA BHUBANESWAR B-03 Garage Chhak 590 7.77 153 26 78 0.3 6.5 23.13 31 5 244 160 125.41
KHORDHA BHUBANESWAR B-41 Pokhariput 220 7.52 12 10 64 0.6 2.5 7.06 21 2 112 54 9.84
KHORDHA CHILIKA Balugaon 1890 8.01 244 44 429 0.2 18 34.09 300 68 1013 250 200
KHORDHA TANGI Nirakarpur 110 7.56 37 6 14 0.1 4.7 3.9 10 6 63 31 30.33
KHORDHA TANGI Bhusundapur 160 7.84 55 18 21 0.1 1.8 3.91 9 4 85 61 45.08
KHORDHA TANGI Tangi2 120 7.37 31 10 21 0.1 1.5 3.9 9 4 65 41 25.41
KHORDHA TANGI Jankia 85 78 0.2 8.1 49 16 69.67
KHORDHA KHORDHA Khurda Industrial Area 150 7.3 5 6 18 0 0.8 1.95 20 2 76 23 4.1
KHORDHA KHORDHA Khurda 140 7.58 24 6 35 0 0.8 1.95 21 3 80 23 19.67
KHORDHA JATANI Padanpur 260 7.74 92 22 39 0.1 4.2 10 16 2 138 96 75.41
KHORDHA JATANI Niranjanpur 60 7.79 18 4 7 0.1 0.6 0.98 5 1 27 14 14.75
KHORDHA JATANI Sandhapur 240 7.76 116 20 18 0 0.9 9.99 11 0 117 91 95.08
KHORDHA JATANI Gobindpur 650 7.3 183 40 96 0.2 3.6 18.04 73 32 352 174 150
KHORDHA BHUBANESWAR Menthasala 320 7.89 98 26 46 0.2 27.4 3.92 22 10 183 81 80.33
KHORDHA BHUBANESWAR Tamando 280 7.69 85 12 39 0.1 6.8 15.09 18 11 143 92 69.67
KHORDHA BHUBANESWAR Chandaka 170 7.96 79 22 35 0.2 16.8 5.13 16 21 155 76 64.75
KHORDHA KHORDHA Jayamangal 270 7.8 43 20 64 0.1 1.1 5.13 28 3 142 71 35.25
KHORDHA BEGUNIA Begunia 740 8.39 232 38 106 0.4 18 29.95 58 15 379 218 190.16
KHORDHA BEGUNIA Sarua 360 8.43 49 26 71 0.2 6.7 11.95 23 1 182 114 70.16
KHORDHA JATANI Janla 400 7.76 85 20 78 0.2 8.1 9.99 49 16 223 91 69.67
KHORDHA BALIPATANA Odakhanda-DW 300 7.92 110 20 32 0.2 14 9.02 23 14 166 87 90.16
KHORDHA BHUBANESWAR Patia 460 8.18 134 42 64 0.1 23.5 10.99 29 27 262 150 109.84
KHORDHA BHUBANESWAR Raghunathpur 440 8.34 116 42 74 0.1 3.3 10.99 28 5 226 150 105.08
KHORDHA BHUBANESWAR Bhubaneswar-i 330 8 98 32 35 0.1 7.6 9.03 22 36 190 117 80.33
KHORDHA BHUBANESWAR Kapilaprasad 160 7.73 31 18 35 0.1 3.5 0.99 13 3 89 49 25.41
KHORDHA BHUBANESWAR Kapilaprasad 180 7.62 31 14 46 0.5 0 7.07 12 8 102 64 25.41
KHORDHA BALIPATANA Balakati 820 7.85 183 54 142 0.2 5.5 17.08 88 41 437 205 150

214
KHORDHA BALIPATANA Panikata 660 7.86 165 34 106 0.1 4.6 12.93 81 41 360 138 135.25
KHORDHA BALIPATANA Balipatna 300 8.08 92 20 39 0.2 12.5 7.08 25 19 168 79 75.41
KHORDHA BOLAGAD Bolagarh 520 7.79 140 40 78 0.3 2.2 22.17 34 25 270 191 114.75
KHORDHA BOLAGAD Pichkuli 320 7.78 73 26 67 0.1 4.3 7.08 28 4 172 94 59.84
KHORDHA BEGUNIA Baghmari 1030 7.49 195 96 248 0.4 12.7 18.11 86 5 561 314 159.84
KHORDHA BALIANTA Kundaidarapatna 990 7.88 153 26 181 0.2 1 50.12 103 80 516 271 125.41
KORAPUT POTTANGI Potangi 145 7.64 61 18 14 0.1 2.7 3.67 6 5 80 60 50
KORAPUT LAMPTAPUT Lamtaput 290 7.71 79 50 0 1.7 12 6 152 65 64.75
KORAPUT SIMILIGUDA Similiguda 160 7.33 37 16 32 0 2.5 2.45 11 2 84 50 30.33
KORAPUT SIMILIGUDA Kunduli 230 7.9 55 26 43 0.1 2.1 6.11 10 3 117 90 45.08
KORAPUT BOIPARIGUDA Baipariguda 90.71 7.74 31 10 14 0.1 1.5 1.23 7 1 50 30 25.41
KORAPUT BOIPARIGUDA Patraput 160 7.58 61 18 18 0.1 5.5 4.88 5 5 86 65 50
KORAPUT BOIPARIGUDA Dhaulapur 85 7.84 31 10 11 0.1 2.1 2.44 2 2 44 35 25.41
KORAPUT KORAPUT Deoghati 140 7.77 55 20 14 0.1 1.4 2.46 5 2 71 60 45.08
KORAPUT JEYPUR Panasaputbagh 75 7.49 24 6 11 0.1 0.8 3.65 3 1 38 30 19.67
KORAPUT NANDAPUR Bheja 1 60 7.34 18 8 11 0 0.7 1.23 2 1 33 25 14.75
KORAPUT NANDAPUR Nandapur 40 7.15 12 4 7 0 1 2.44 2 1 21 20 9.84
KORAPUT NANDAPUR Soguru 200 7.1 55 18 35 0.1 3.6 7.32 9 2 102 75 45.08
KORAPUT JEYPUR Anta 630 7.65 140 46 117 0.1 27 29.23 22 32 342 235 114.75
KORAPUT JEYPUR Jeypore1 570 7.79 140 40 99 0.1 0.8 10.99 62 19 300 145 114.75
KORAPUT BORIGUMA Khaliaguda 70 7.6 12 14 0 4 2 1 38 25 9.84
KORAPUT BORIGUMA Sasanhandi-ii 100 7.68 24 10 21 0.1 1 3.66 5 2 55 40 19.67
KORAPUT JEYPUR Ambaguda 280 6.87 31 24 71 0.1 11.2 8.54 12 2 144 95 25.41
KORAPUT JEYPUR Jayantigiri 340 7.31 92 46 0.1 1.5 13 20 178 75 75.41
KORAPUT KOTPAD Kotpad 340 7.82 92 32 60 0.1 6.5 10.98 16 4 175 125 75.41
KORAPUT KOTPAD Damanahandi 110 7.39 18 14 25 0 5.9 0.02 5 3 62 35 14.75
KORAPUT KOTPAD Chandli 280 7.69 61 30 57 0.1 10.2 4.9 14 7 153 95 50
KORAPUT KOTPAD Gumur 135 7.47 24 20 28 0 2.4 0.02 6 1 69 50 19.67
KORAPUT KOTPAD Miriguda 190 7.27 31 16 43 0 7.1 6.1 9 4 100 65 25.41
KORAPUT KORAPUT Koraput-i 380 7.46 104 44 67 0.1 1.1 17.07 9 11 200 180 85.25
KORAPUT KUNDURA Ghatarala 90 7.75 24 12 14 0 5.4 0.01 3 2 48 30 19.67
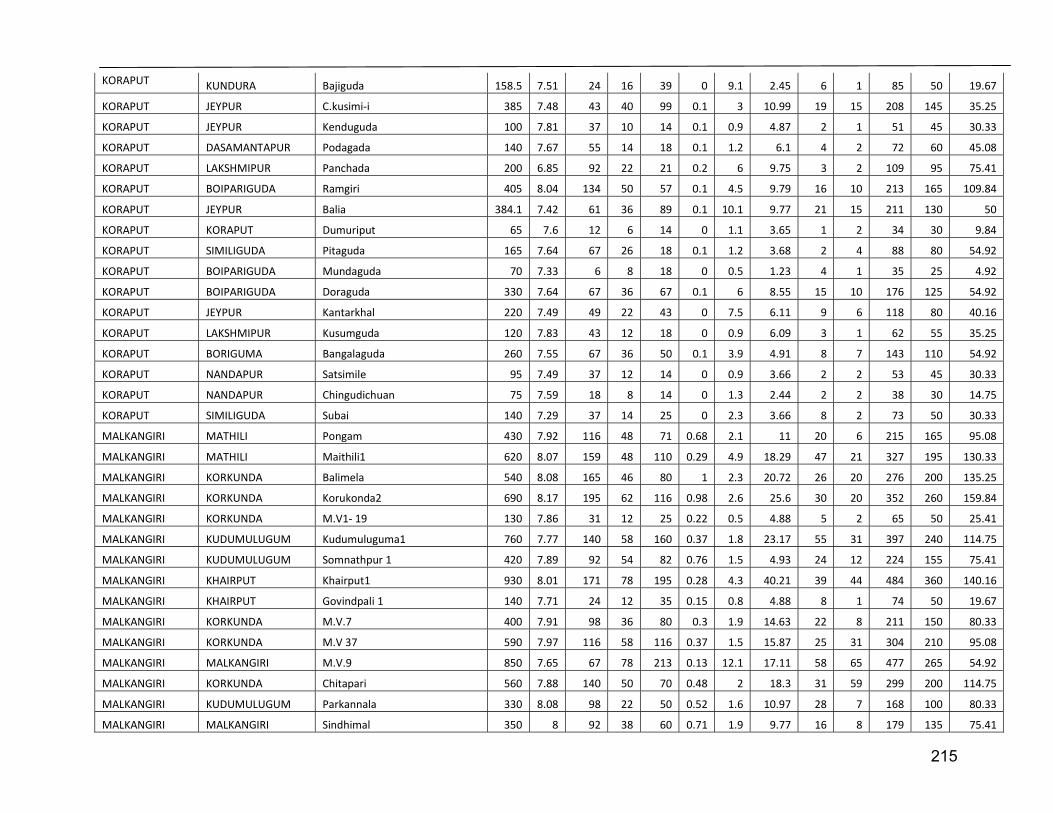
215
KORAPUT KUNDURA Bajiguda 158.5 7.51 24 16 39 0 9.1 2.45 6 1 85 50 19.67
KORAPUT JEYPUR C.kusimi-i 385 7.48 43 40 99 0.1 3 10.99 19 15 208 145 35.25
KORAPUT JEYPUR Kenduguda 100 7.81 37 10 14 0.1 0.9 4.87 2 1 51 45 30.33
KORAPUT DASAMANTAPUR Podagada 140 7.67 55 14 18 0.1 1.2 6.1 4 2 72 60 45.08
KORAPUT LAKSHMIPUR Panchada 200 6.85 92 22 21 0.2 6 9.75 3 2 109 95 75.41
KORAPUT BOIPARIGUDA Ramgiri 405 8.04 134 50 57 0.1 4.5 9.79 16 10 213 165 109.84
KORAPUT JEYPUR Balia 384.1 7.42 61 36 89 0.1 10.1 9.77 21 15 211 130 50
KORAPUT KORAPUT Dumuriput 65 7.6 12 6 14 0 1.1 3.65 1 2 34 30 9.84
KORAPUT SIMILIGUDA Pitaguda 165 7.64 67 26 18 0.1 1.2 3.68 2 4 88 80 54.92
KORAPUT BOIPARIGUDA Mundaguda 70 7.33 6 8 18 0 0.5 1.23 4 1 35 25 4.92
KORAPUT BOIPARIGUDA Doraguda 330 7.64 67 36 67 0.1 6 8.55 15 10 176 125 54.92
KORAPUT JEYPUR Kantarkhal 220 7.49 49 22 43 0 7.5 6.11 9 6 118 80 40.16
KORAPUT LAKSHMIPUR Kusumguda 120 7.83 43 12 18 0 0.9 6.09 3 1 62 55 35.25
KORAPUT BORIGUMA Bangalaguda 260 7.55 67 36 50 0.1 3.9 4.91 8 7 143 110 54.92
KORAPUT NANDAPUR Satsimile 95 7.49 37 12 14 0 0.9 3.66 2 2 53 45 30.33
KORAPUT NANDAPUR Chingudichuan 75 7.59 18 8 14 0 1.3 2.44 2 2 38 30 14.75
KORAPUT SIMILIGUDA Subai 140 7.29 37 14 25 0 2.3 3.66 8 2 73 50 30.33
MALKANGIRI MATHILI Pongam 430 7.92 116 48 71 0.68 2.1 11 20 6 215 165 95.08
MALKANGIRI MATHILI Maithili1 620 8.07 159 48 110 0.29 4.9 18.29 47 21 327 195 130.33
MALKANGIRI KORKUNDA Balimela 540 8.08 165 46 80 1 2.3 20.72 26 20 276 200 135.25
MALKANGIRI KORKUNDA Korukonda2 690 8.17 195 62 116 0.98 2.6 25.6 30 20 352 260 159.84
MALKANGIRI KORKUNDA M.V1- 19 130 7.86 31 12 25 0.22 0.5 4.88 5 2 65 50 25.41
MALKANGIRI KUDUMULUGUM Kudumuluguma1 760 7.77 140 58 160 0.37 1.8 23.17 55 31 397 240 114.75
MALKANGIRI KUDUMULUGUM Somnathpur 1 420 7.89 92 54 82 0.76 1.5 4.93 24 12 224 155 75.41
MALKANGIRI KHAIRPUT Khairput1 930 8.01 171 78 195 0.28 4.3 40.21 39 44 484 360 140.16
MALKANGIRI KHAIRPUT Govindpali 1 140 7.71 24 12 35 0.15 0.8 4.88 8 1 74 50 19.67
MALKANGIRI KORKUNDA M.V.7 400 7.91 98 36 80 0.3 1.9 14.63 22 8 211 150 80.33
MALKANGIRI KORKUNDA M.V 37 590 7.97 116 58 116 0.37 1.5 15.87 25 31 304 210 95.08
MALKANGIRI MALKANGIRI M.V.9 850 7.65 67 78 213 0.13 12.1 17.11 58 65 477 265 54.92
MALKANGIRI KORKUNDA Chitapari 560 7.88 140 50 70 0.48 2 18.3 31 59 299 200 114.75
MALKANGIRI KUDUMULUGUM Parkannala 330 8.08 98 22 50 0.52 1.6 10.97 28 7 168 100 80.33
MALKANGIRI MALKANGIRI Sindhimal 350 8 92 38 60 0.71 1.9 9.77 16 8 179 135 75.41

216
MALKANGIRI MALKANGIRI Malkangiri 1 560 7.99 116 46 106 0.85 1.9 18.29 38 32 299 190 95.08
MALKANGIRI MALKANGIRI Kumbharguda 380 7.91 122 36 60 0.61 0.9 13.42 16 6 192 145 100
MALKANGIRI KHAIRPUT Mundiguda 80 7.84 128 62 181 0.43 10.5 19.53 61 40 436 235 104.92
MAYURBHANJ RASA-GOBINDAPUR Devsol 340 8.24 92 24 64 0.2 1.5 17.05 16 6 174 130 75.41
MAYURBHANJ KOLIANA Pathuri 720 7.84 232 86 110 0.3 1.2 27.09 10 7 355 326 190.16
MAYURBHANJ BISOI Ambadiha 360 8.12 146 36 39 0.4 1.3 15.12 11 5 179 152 119.67
MAYURBHANJ RAIRANG PUR Pandaguni 300 7.9 116 30 35 0.4 1.5 9.03 15 4 151 112 95.08
MAYURBHANJ BANGIRIPOSI Rajabasa 290 7.45 34 6.7 6.12 12 149 110
MAYURBHANJ BIJA TOLA Gorumahisani 230 7.93 49 16 53 0.2 1.1 15.09 10 2 121 102 40.16
MAYURBHANJ RAIRANG PUR Rairangpur 120 7.55 37 8 18 0.1 1.4 1.95 12 1 61 28 30.33
MAYURBHANJ RAIRANG PUR Niranjan 760 7.97 122 78 82 0.5 10.1 22.22 29 156 437 286 100
MAYURBHANJ RAIRANG PUR Champrai 130 7.71 31 6 25 0.1 5.3 1.95 14 4 71 23 25.41
MAYURBHANJ JAMDA Moranda 270 7.87 85 32 39 4 2.4 6.12 13 7 141 105 69.67
MAYURBHANJ JAMDA Jamda 380 8.39 122 22 57 0.4 3.7 22.15 19 5 188 146 100
MAYURBHANJ BANGIRIPOSI Jamsola 210 7.87 67 18 32 0.1 1 5.13 16 2 107 66 54.92
MAYURBHANJ BANGIRIPOSI Jharpokhari 410 8.21 165 52 43 0.4 1.5 11 13 8 209 175 135.25
MAYURBHANJ BIJA TOLA Bademtolia 110 7.55 31 8 18 0.1 0.8 5.12 6 2 55 41 25.41
MAYURBHANJ TIRINGI Nischintapur 460 7.81 92 56 92 0.3 1.6 12.95 15 15 238 193 75.41
MAYURBHANJ TIRINGI Tiring 300 7.78 98 26 39 0.2 2 10.97 15 4 145 110 80.33
MAYURBHANJ THAKUR MUNDA Asanbani 270 7.96 92 24 35 0.2 3.6 10 13 9 140 101 75.41
MAYURBHANJ THAKUR MUNDA Taramara 290 7.87 98 28 39 0.3 2.1 9.03 16 4 146 107 80.33
MAYURBHANJ KARANJIA Tongabila Chhak 300 7.85 104 28 39 0.1 4.1 9.03 17 4 152 107 85.25
MAYURBHANJ SUKRULI Raruan 320 7.84 104 38 53 0.3 2 9.04 17 2 172 132 85.25
MAYURBHANJ KUSUMI Naujara 260 7.69 92 18 35 0.1 8.9 9.02 16 5 137 82 75.41
MAYURBHANJ BISOI Bhatachhatra 220 7.8 73 14 32 0.1 1.3 9.99 14 4 111 76 59.84
MAYURBHANJ BISOI Bisoi 200 8.03 73 24 25 0.1 0.5 5.13 9 0 99 81 59.84
MAYURBHANJ BISOI Badampahad-1 220 7.92 61 20 39 0.2 6.7 7.08 8 2 113 79 50
MAYURBHANJ BAHALDA Bahalda 190 7.89 61 22 28 0.3 1.2 3.92 11 3 99 71 50
MAYURBHANJ BAHALDA Gambharia 400 8.42 128 24 35 0.4 5.3 22.15 19 11 197 151 134.92
MAYURBHANJ BAHALDA Poilakunda 160 7.95 31 8 28 0.2 4.4 1.95 17 12 87 28 25.41
MAYURBHANJ SULIA PADA Sullyapada 370 7.68 116 42 50 0.5 1.1 10.99 13 8 182 150 95.08
MAYURBHANJ KOLIANA Kuliana 150 7.12 61 12 18 0.1 1.5 5.12 11 1 78 51 50
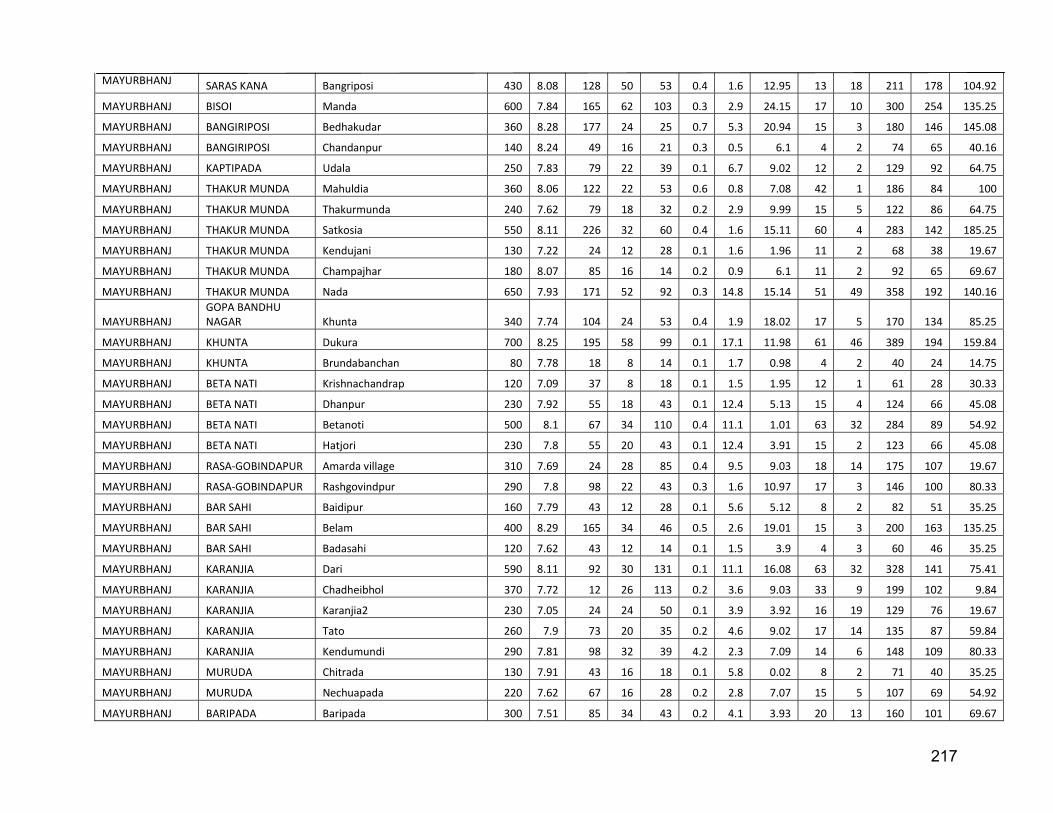
217
MAYURBHANJ SARAS KANA Bangriposi 430 8.08 128 50 53 0.4 1.6 12.95 13 18 211 178 104.92
MAYURBHANJ BISOI Manda 600 7.84 165 62 103 0.3 2.9 24.15 17 10 300 254 135.25
MAYURBHANJ BANGIRIPOSI Bedhakudar 360 8.28 177 24 25 0.7 5.3 20.94 15 3 180 146 145.08
MAYURBHANJ BANGIRIPOSI Chandanpur 140 8.24 49 16 21 0.3 0.5 6.1 4 2 74 65 40.16
MAYURBHANJ KAPTIPADA Udala 250 7.83 79 22 39 0.1 6.7 9.02 12 2 129 92 64.75
MAYURBHANJ THAKUR MUNDA Mahuldia 360 8.06 122 22 53 0.6 0.8 7.08 42 1 186 84 100
MAYURBHANJ THAKUR MUNDA Thakurmunda 240 7.62 79 18 32 0.2 2.9 9.99 15 5 122 86 64.75
MAYURBHANJ THAKUR MUNDA Satkosia 550 8.11 226 32 60 0.4 1.6 15.11 60 4 283 142 185.25
MAYURBHANJ THAKUR MUNDA Kendujani 130 7.22 24 12 28 0.1 1.6 1.96 11 2 68 38 19.67
MAYURBHANJ THAKUR MUNDA Champajhar 180 8.07 85 16 14 0.2 0.9 6.1 11 2 92 65 69.67
MAYURBHANJ THAKUR MUNDA Nada 650 7.93 171 52 92 0.3 14.8 15.14 51 49 358 192 140.16
MAYURBHANJ GOPA BANDHU NAGAR Khunta 340 7.74 104 24 53 0.4 1.9 18.02 17 5 170 134 85.25
MAYURBHANJ KHUNTA Dukura 700 8.25 195 58 99 0.1 17.1 11.98 61 46 389 194 159.84
MAYURBHANJ KHUNTA Brundabanchan 80 7.78 18 8 14 0.1 1.7 0.98 4 2 40 24 14.75
MAYURBHANJ BETA NATI Krishnachandrap 120 7.09 37 8 18 0.1 1.5 1.95 12 1 61 28 30.33
MAYURBHANJ BETA NATI Dhanpur 230 7.92 55 18 43 0.1 12.4 5.13 15 4 124 66 45.08
MAYURBHANJ BETA NATI Betanoti 500 8.1 67 34 110 0.4 11.1 1.01 63 32 284 89 54.92
MAYURBHANJ BETA NATI Hatjori 230 7.8 55 20 43 0.1 12.4 3.91 15 2 123 66 45.08
MAYURBHANJ RASA-GOBINDAPUR Amarda village 310 7.69 24 28 85 0.4 9.5 9.03 18 14 175 107 19.67
MAYURBHANJ RASA-GOBINDAPUR Rashgovindpur 290 7.8 98 22 43 0.3 1.6 10.97 17 3 146 100 80.33
MAYURBHANJ BAR SAHI Baidipur 160 7.79 43 12 28 0.1 5.6 5.12 8 2 82 51 35.25
MAYURBHANJ BAR SAHI Belam 400 8.29 165 34 46 0.5 2.6 19.01 15 3 200 163 135.25
MAYURBHANJ BAR SAHI Badasahi 120 7.62 43 12 14 0.1 1.5 3.9 4 3 60 46 35.25
MAYURBHANJ KARANJIA Dari 590 8.11 92 30 131 0.1 11.1 16.08 63 32 328 141 75.41
MAYURBHANJ KARANJIA Chadheibhol 370 7.72 12 26 113 0.2 3.6 9.03 33 9 199 102 9.84
MAYURBHANJ KARANJIA Karanjia2 230 7.05 24 24 50 0.1 3.9 3.92 16 19 129 76 19.67
MAYURBHANJ KARANJIA Tato 260 7.9 73 20 35 0.2 4.6 9.02 17 14 135 87 59.84
MAYURBHANJ KARANJIA Kendumundi 290 7.81 98 32 39 4.2 2.3 7.09 14 6 148 109 80.33
MAYURBHANJ MURUDA Chitrada 130 7.91 43 16 18 0.1 5.8 0.02 8 2 71 40 35.25
MAYURBHANJ MURUDA Nechuapada 220 7.62 67 16 28 0.2 2.8 7.07 15 5 107 69 54.92
MAYURBHANJ BARIPADA Baripada 300 7.51 85 34 43 0.2 4.1 3.93 20 13 160 101 69.67
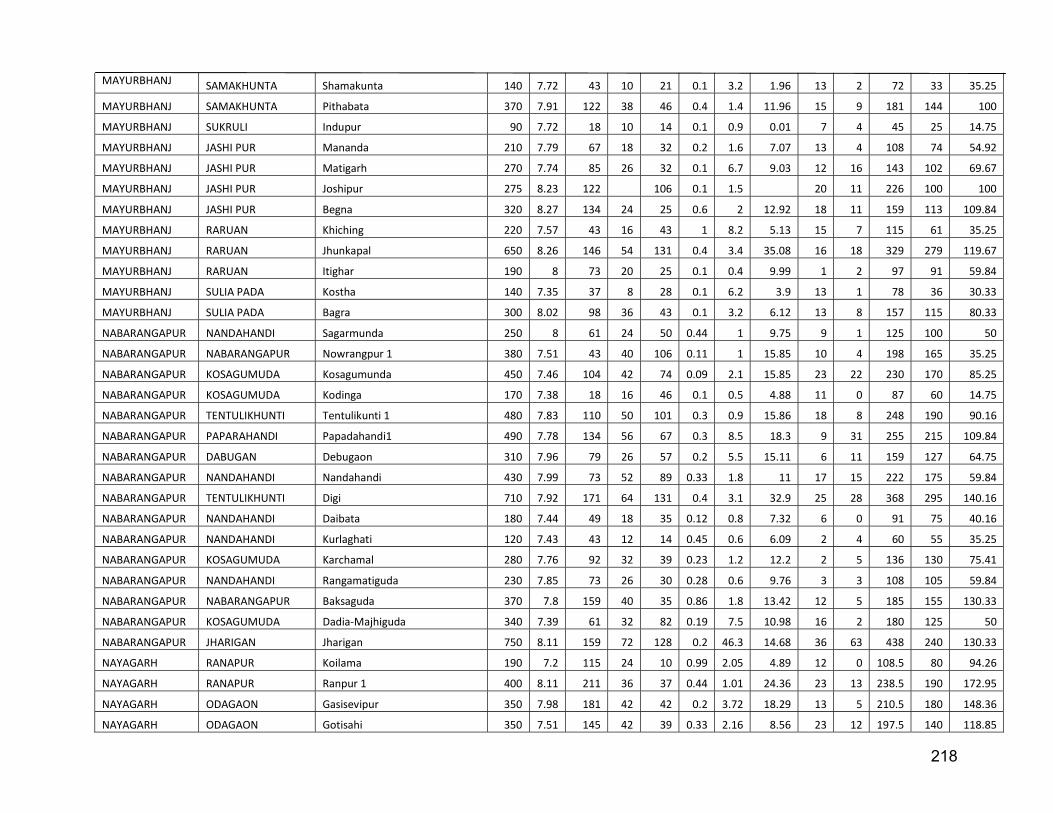
218
MAYURBHANJ SAMAKHUNTA Shamakunta 140 7.72 43 10 21 0.1 3.2 1.96 13 2 72 33 35.25
MAYURBHANJ SAMAKHUNTA Pithabata 370 7.91 122 38 46 0.4 1.4 11.96 15 9 181 144 100
MAYURBHANJ SUKRULI Indupur 90 7.72 18 10 14 0.1 0.9 0.01 7 4 45 25 14.75
MAYURBHANJ JASHI PUR Mananda 210 7.79 67 18 32 0.2 1.6 7.07 13 4 108 74 54.92
MAYURBHANJ JASHI PUR Matigarh 270 7.74 85 26 32 0.1 6.7 9.03 12 16 143 102 69.67
MAYURBHANJ JASHI PUR Joshipur 275 8.23 122 106 0.1 1.5 20 11 226 100 100
MAYURBHANJ JASHI PUR Begna 320 8.27 134 24 25 0.6 2 12.92 18 11 159 113 109.84
MAYURBHANJ RARUAN Khiching 220 7.57 43 16 43 1 8.2 5.13 15 7 115 61 35.25
MAYURBHANJ RARUAN Jhunkapal 650 8.26 146 54 131 0.4 3.4 35.08 16 18 329 279 119.67
MAYURBHANJ RARUAN Itighar 190 8 73 20 25 0.1 0.4 9.99 1 2 97 91 59.84
MAYURBHANJ SULIA PADA Kostha 140 7.35 37 8 28 0.1 6.2 3.9 13 1 78 36 30.33
MAYURBHANJ SULIA PADA Bagra 300 8.02 98 36 43 0.1 3.2 6.12 13 8 157 115 80.33
NABARANGAPUR NANDAHANDI Sagarmunda 250 8 61 24 50 0.44 1 9.75 9 1 125 100 50
NABARANGAPUR NABARANGAPUR Nowrangpur 1 380 7.51 43 40 106 0.11 1 15.85 10 4 198 165 35.25
NABARANGAPUR KOSAGUMUDA Kosagumunda 450 7.46 104 42 74 0.09 2.1 15.85 23 22 230 170 85.25
NABARANGAPUR KOSAGUMUDA Kodinga 170 7.38 18 16 46 0.1 0.5 4.88 11 0 87 60 14.75
NABARANGAPUR TENTULIKHUNTI Tentulikunti 1 480 7.83 110 50 101 0.3 0.9 15.86 18 8 248 190 90.16
NABARANGAPUR PAPARAHANDI Papadahandi1 490 7.78 134 56 67 0.3 8.5 18.3 9 31 255 215 109.84
NABARANGAPUR DABUGAN Debugaon 310 7.96 79 26 57 0.2 5.5 15.11 6 11 159 127 64.75
NABARANGAPUR NANDAHANDI Nandahandi 430 7.99 73 52 89 0.33 1.8 11 17 15 222 175 59.84
NABARANGAPUR TENTULIKHUNTI Digi 710 7.92 171 64 131 0.4 3.1 32.9 25 28 368 295 140.16
NABARANGAPUR NANDAHANDI Daibata 180 7.44 49 18 35 0.12 0.8 7.32 6 0 91 75 40.16
NABARANGAPUR NANDAHANDI Kurlaghati 120 7.43 43 12 14 0.45 0.6 6.09 2 4 60 55 35.25
NABARANGAPUR KOSAGUMUDA Karchamal 280 7.76 92 32 39 0.23 1.2 12.2 2 5 136 130 75.41
NABARANGAPUR NANDAHANDI Rangamatiguda 230 7.85 73 26 30 0.28 0.6 9.76 3 3 108 105 59.84
NABARANGAPUR NABARANGAPUR Baksaguda 370 7.8 159 40 35 0.86 1.8 13.42 12 5 185 155 130.33
NABARANGAPUR KOSAGUMUDA Dadia-Majhiguda 340 7.39 61 32 82 0.19 7.5 10.98 16 2 180 125 50
NABARANGAPUR JHARIGAN Jharigan 750 8.11 159 72 128 0.2 46.3 14.68 36 63 438 240 130.33
NAYAGARH RANAPUR Koilama 190 7.2 115 24 10 0.99 2.05 4.89 12 0 108.5 80 94.26
NAYAGARH RANAPUR Ranpur 1 400 8.11 211 36 37 0.44 1.01 24.36 23 13 238.5 190 172.95
NAYAGARH ODAGAON Gasisevipur 350 7.98 181 42 42 0.2 3.72 18.29 13 5 210.5 180 148.36
NAYAGARH ODAGAON Gotisahi 350 7.51 145 42 39 0.33 2.16 8.56 23 12 197.5 140 118.85

219
NAYAGARH RANAPUR Bherupada 250 7.73 127 36 34 0.27 13.2 8.55 11 13 166.5 125 104.1
NAYAGARH RANAPUR Darpa-Narayanpur 350 7.93 181 38 34 0.27 0.46 20.71 10 3 196.5 180 148.36
NAYAGARH DASAPALLA Rangamatia 400 8.17 169 40 49 0.58 0.96 24.36 19 22 238.5 200 138.52
NAYAGARH GANIA Ghholahandi 800 7.79 260 108 123 0.25 8.4 13.5 45 34 453 325 213.11
NAYAGARH KHANDAPADA Kumbharpara 750 8.15 242 16 84 1.15 16.3 31.63 84 44 381 170 198.36
NAYAGARH GANIA Takara 420 6.91 181 48 20 0.67 16 14.65 11 39 223.5 180 148.36
NAYAGARH GANIA Banigocha 600 8.13 332 38 37 0.18 6.33 47.46 27 15 330 290 272.13
NAYAGARH GANIA Khalisar 400 8.16 230 48 54 0.28 8.25 29.23 19 11 276 240 188.52
NAYAGARH GANIA Balisahi 475 7.82 46 1.07 24.37 23 270 215
NAYAGARH GANIA Gania 200 7.81 97 20 22 0.23 4.65 9.75 10 4 114.5 90 79.51
NAYAGARH GANIA Adakata 700 7.83 217 80 103 0.33 0.92 14.69 48 22 376.5 260 177.87
NAYAGARH GANIA Krushnapali 550 8.2 272 16 42 2.45 1.41 12.18 95 10 311 90 222.95
NAYAGARH ODAGAON Sarankul 550 8.2 193 20 74 0.93 17.6 24.34 55 18 287.5 150 158.2
NAYAGARH ODAGAON Odagaon 400 8.18 181 40 44 0.54 5.82 21.93 19 20 235.5 190 148.36
NAYAGARH ODAGAON Solopata 460 8.2 205 32 49 1.24 0.54 29.21 27 13 252.5 200 168.03
NAYAGARH NAYAGARH Sarak Sahi 730 8.3 387 28 49 2.55 8 14.62 136 43 464.5 130 317.21
NAYAGARH NAYAGARH Hataduar 400 7.92 2.48 46 47 1.32 0.76 19.51 45 9 290 195 2.03
NAYAGARH NAYAGARH Nayagarh 3980 7.63 368 304 1014 1.01 14.5 153.54 221 135 2011 1390 301.64
NAYAGARH NAYAGARH Purusottampur 1200 8.28 272 30 197 0.5 89.5 52.31 95 80 590 290 222.95
NAYAGARH NAYAGARH Kalyanpur 550 8.28 266 20 42 0.26 0.94 38.93 56 44 334 210 218.03
NAYAGARH NUAGAON Sampada 230 7.99 103 20 39 0.43 15.1 14.61 9 2 136.5 110 84.43
NAYAGARH NUAGAON Mahipur 600 7.76 272 36 39 0.39 20 31.65 31 32 306 220 222.95
NAYAGARH NUAGAON Nuagaon1 1350 8.6 652 30 62 3.97 2 42.58 193 24 687 250 549.43
NAYAGARH BHAPUR Bhapur1 350 8.14 211 24 30 0.5 1.37 36.5 8 1 204.5 210 172.95
NAYAGARH BHAPUR Khandapada 300 8.12 205 34 15 0.37 4.3 19.49 14 6 190.5 165 168.03
NAYAGARH BHAPUR Kantilo 350 8.05 254 28 25 0.24 0.64 37.72 17 12 247 225 208.2
NAYAGARH DASAPALLA Andhar Kote 400 7.52 205 26 30 0.31 10 30.42 9 11 208.5 190 168.03
NAYAGARH DASAPALLA Kuluru Kumpa 330 8.1 217 24 15 0.89 1.06 27.99 17 5 197.5 175 177.87
NAYAGARH DASAPALLA Kuanria 660 8.1 278 20 69 2.35 1.15 38.93 68 23 358 210 227.87
NAYAGARH DASAPALLA Madhyakhand 300 8.08 199 16 10 0.92 7 26.76 15 9 176.5 150 163.11
NAYAGARH DASAPALLA Daspalla-i 1250 8.15 471 22 160 0.43 4.7 23.12 230 2 672.5 150 386.07
NAYAGARH DASAPALLA Subalaya 740 8.14 302 28 101 1.17 6 68.11 36 28 412 350 247.54

220
NAYAGARH DASAPALLA Daspalla Market 300 7.86 121 36 42 0.17 5.27 6.12 25 19 188.5 115 99.18
NAYAGARH DASAPALLA Jogibandh 350 8.28 242 24 7 0.93 0.39 25.56 22 2 202 165 198.36
NAYAGARH DASAPALLA Durga Prasad 100 7.75 66 12 5 0.09 0.83 4.88 5 0 60 50 54.1
NAYAGARH KHANDAPADA Kana Singhi 100 7.66 54 18 15 0.1 2.38 2.45 5 0 67 55 44.26
NAYAGARH KHANDAPADA Dukhapali 300 7.43 133 46 44 0.68 0.48 8.57 13 1 179.5 150 109.02
NAYAGARH KHANDAPADA Jhada Gadia 700 8.25 399 50 59 0.96 4.68 54.77 33 15 411.5 350 327.05
NAYAGARH KHANDAPADA Gamasalia (Dhipisahi) 250 7.88 115 22 25 0.61 0.58 13.4 15 9 141.5 110 94.26
NUAPADA NUAPADA Patparpali 180 8 73 18 14 0.2 12 3.91 7 4 84 61 59.84
NUAPADA NUAPADA Kalyanpur 500 8.3 214 62 78 0.1 31 11.02 32 8 298 200 175.41
NUAPADA NUAPADA Gotama 900 8 226 106 160 0.2 19 28.09 38 89 534 380 185.25
NUAPADA NUAPADA Sahipala 850 7.9 128 38 170 0.2 41 35.06 47 62 416 239 104.92
NUAPADA NUAPADA Darlimunda 350 8 177 28 25 1.3 1 15.11 39 20 216 132 145.08
NUAPADA NUAPADA Sirthol 400 8.16 262 32 32 0.4 50 1.98 55 14 266 88 214.75
NUAPADA NUAPADA Somarsingh 270 8.3 177 26 11 1.1 2 10 33 8 177 106 145.08
NUAPADA NUAPADA Nawapara 250 7.8 55 22 39 0.3 1 5.13 29 33 156 76 45.08
NUAPADA KHARIAR Junani 1450 7.6 232 186 287 0.2 2 35.24 92 200 916 609 190.16
NUAPADA KHARIAR Ranipur 350 7.9 238 46 11 0.9 8 7.11 32 6 221 144 195.08
NUAPADA KHARIAR Khariar 900 8 153 42 142 0.5 33 36.03 79 124 500 253 125.41
NUAPADA KHARIAR Khudpej 680 8.22 128 30 152 0.3 16.9 29.21 56 30 377 195 104.92
NUAPADA KHARIAR Loharapalli 400 8.2 256 44 18 1.2 7 26.07 9 12 237 217 209.84
NUAPADA NUAPADA Saipala 350 8.12 61 26 92 0.5 4 18.02 26 20 213 139 50
NUAPADA NUAPADA Godphula 550 7.9 220 42 53 0.8 3 37.98 29 59 331 261 180.33
NUAPADA SINAPALI Nilji 740 8.26 159 28 142 0.6 42.5 31.64 53 33 408 200 130.33
NUAPADA KHARIAR Sanmaheswar 400 8.1 226 42 35 0.3 4 24.12 32 31 277 204 185.25
NUAPADA KHARIAR Bargaon-k 300 8 171 38 28 0.5 5 7.1 38 38 235 124 140.16
NUAPADA KHARIAR Padampur 450 7.9 116 36 85 0.4 0.6 24.11 36 50 289 189 95.08
NUAPADA KHARIAR Tukla 440 8.27 140 32 74 0.4 2 24.35 19 5 225 180 114.75
NUAPADA KHARIAR Lachhipur 740 8.06 128 34 149 0.6 1.4 36.51 64 49 396 235 104.92
NUAPADA BODEN Boden 690 8.33 195 22 74 1.8 3.2 34.07 70 52 366 195 184.84
NUAPADA KOMANA Tarbod 1000 8.1 238 84 199 0.2 15 32.2 71 26 531 342 195.08
NUAPADA KOMANA Deobahal 400 8.1 183 26 7 0.4 11 9.03 32 11 177 102 150
NUAPADA KOMANA Komna1 950 7.9 275 54 131 0.3 7 69.12 54 122 568 419 225.41

221
NUAPADA KOMANA Kurumpuri 350 8 201 24 18 0.6 2 12.92 38 17 211 113 164.75
PURI PIPIL Maunimatha 400 7.87 146 32 50 0.5 1.6 18.03 21 4 198 154 119.67
PURI BRAHMAGIRI Budhiabar 1010 8.03 250 16 163 1.1 132 10.96 115 32 592 85 204.92
PURI BRAHMAGIRI Brahmagiri 350 7.95 128 24 43 0.1 5.4 16.08 16 6 173 126 104.92
PURI BRAHMAGIRI Gopinathpur1 1530 8.2 445 20 227 1 54.5 10.97 275 34 840 95 364.75
PURI BRAHMAGIRI Rebana nuagaon 930 8.06 195 38 195 0.9 59.1 23.14 92 48 551 190 159.84
PURI BRAHMAGIRI Girala 350 7.92 128 20 43 1.3 3.7 7.08 41 12 189 79 104.92
PURI BRAHMAGIRI Alipada 1123 7.96 171 36 227 1.3 91 12.93 140 54 645 143 140.16
PURI SADAR Chandanpur 1160 8.13 305 32 188 0.5 35 26.05 160 29 619 187 250
PURI SADAR P-07 Gauda Bada Sahi 880 8.09 329.5 72 98 0.05 45.1 19.54 52.5 38 486 260 270.04
PURI SADAR P-43 Dola Mandap Sahi 700 7.86 256.2 54 71 0.03 36.1 21.95 34.6 36 379 225 210.03
PURI SADAR Puri town 1020 8.16 348 62 160 0.3 53.1 27.06 94 15 582 266 285.25
PURI SADAR P-42 Balighat 930 7.83 323.4 36 119 0.11 34.4 38.94 76.7 30 493 250 265.04
PURI SADAR Totasahi 940 8.02 189 36 191 0.4 2 18.04 139 27 506 164 154.92
PURI SADAR Baliguari 350 7.99 110 8 53 0.4 0.3 1.95 66 2 185 28 90.16
PURI SADAR Tulasichoura-Malatipatapur 1450 8.24 445 50 184 0.6 15.2 16.11 237 47 767 191 364.75
PURI SADAR Birapratappur 740 7.63 183 16 145 0.1 0.6 49.13 59 5 364 242 150
PURI SATYABADI Nuasamsarpur 530 7.95 153 16 82 1.3 76.9 7.07 44 9 310 69 125.41
PURI SATYABADI Uansdiha 1420 8.13 250 24 227 0.5 12.2 43.06 210 156 795 237 204.92
PURI SATYABADI Sakhigopal 760 7.89 311 14 85 0.6 15.6 35.03 83 15 400 179 254.92 PURI SATYABADI Algum 1150 8.34 299 24 223 1.1 114 7.08 152 23 689 89 245.08
PURI SATYABADI Sadanandapur 710 7.85 232 14 78 0.5 19 27.98 82 34 369 150 190.16
PURI KAKAT PUR Konark 1 240 7.83 98 18 21 1 8.9 15.1 1 2 114 107 80.33
PURI KAKAT PUR Kakatpur 590 8 165 36 103 1 61.4 7.09 44 20 352 119 135.25
PURI ASTARANGA Tikarpara1 380 7.68 140 28 46 0.3 2.5 11.95 30 12 199 119 114.75
PURI ASTARANGA Juinti 430 7.77 128 18 64 1.4 35.5 15.1 30 8 233 107 104.92
PURI GOP Ramchandi 400 8 98 20 50 0.2 21.9 1.97 27 3 172 58 80.33
PURI GOP Baleshwarpatna 490 8.09 214 22 57 0.1 2.3 10.97 66 4 267 100 175.41
PURI GOP Balighai 300 7.82 92 14 46 0.3 14.8 18.98 10 3 152 113 75.41
PURI GOP Madrang 1770 7.77 61 84 539 0.2 0.1 39 237 21 950 370 50
PURI DELANGA Delang 590 7.95 183 20 85 0.4 3 12.91 85 15 311 103 150

222
PURI NIMAPADA Bisimatri 410 7.98 159 22 53 0.3 9.3 15.1 35 5 217 117 130.33
PURI PIPIL Dandamukundpur 1150 8.24 0 52 366 0.7 104 17.08 17 167 658 200 190.83
PURI BRAHMAGIRI Gokhara 1400 8.05 275 40 277 1.6 43.5 12.93 225 35 768 153 225.41
PURI SADAR P-31 Sweta Ganga 1130 8.16 378.3 60 138 0.03 86.9 45.05 45 59 609 335 310.05
PURI SADAR P-06 Chhapana Chhak 670 7.99 237.9 78 76 0.16 10.3 18.33 24.7 32 356 270 195.03
PURI SADAR P-12 ITI Chhak 380 8.19 158.6 52 33 0.08 8.64 8.57 8.65 12 201 165 130.02
PURI SADAR P-13 Shree Vihar Mangal Patna 220 8.11 91.52 16 21 0.05 2.02 14.61 3.53 4 106 100 75.01
PURI SADAR P-37 Jagannatha Ballava Matha 850 8.11 292.8 50 109 0.03 23.5 29.24 68.6 18 442 245 240.04
PURI SADAR P-38 Gosala 1450 8.21 549.1 84 152 0.07 86.1 62.1 72.7 33 759 465 450.07
PURI SADAR P-41 Grand Road 1230 7.89 408.8 102 159 0.05 62.8 18.36 93.8 18 654 330 335.05
PURI SADAR P-33 Sorbodaya Nagar 860 7.89 292.8 64 90 0.06 21.1 28.04 56.8 50 453 275 240.04
PURI SADAR P-34 Sidha Mahavir 1080 8.16 427.1 102 109 0.08 2.8 35.38 68.1 33 559 400 350.06
PURI SADAR P-35 Indira Mark Colony 740 8.23 347.8 84 50 0.07 15.8 20.77 26.6 9 376 295 285.05
PURI SADAR P-22 Talabania 660 7.73 225.7 52 74 0.09 10.3 24.38 34.1 40 345 230 185.03
PURI SADAR P-36 Kumbharapada 830 8.18 268.4 40 114 0.03 87.2 23.15 23.1 26 455 195 220.04
PURI SADAR P-16 Narendra Kona 740 7.86 268.4 54 88 0.04 26 19.52 55.1 22 396 215 220.04
PURI SADAR P-18 Tota Sahi 1090 7.82 231.8 60 221 0.15 6.34 49.91 84 44 579 355 190.03
PURI SADAR P-24 Balagandi 890 7.95 305.1 58 107 0.03 61.5 19.52 63.7 38 497 225 250.04
PURI SADAR P-01 Krupa Sindura Patna 1670 7.86 402.7 76 307 0.23 101 48.72 142 72 944 390 330.05
PURI SADAR P-23 Hara Gouri Sahi 840 7.75 237.9 64 114 0.04 30 21.96 61.2 44 452 250 195.03
PURI SADAR P-03 Police Lane 1230 8.15 323.4 84 193 0.14 20.8 48.73 83 75 663 410 265.04
PURI SADAR P-11 Sadar Block Colony 1000 8.25 360 76 105 0.15 22.3 35.235 62.9 58 536 335 295.05
PURI SADAR P-09 VIP Colony 1180 8.24 494.2 88 133 0.1 8.63 41.44 80.4 1 594 390 405.07
PURI SADAR P-04 Marine Parade Lane 500 8.02 189.1 30 52 0.07 10.3 28 22.4 22 257 190 155.03
PURI SADAR P-32 Gobardhan Matha 1000 7.89 353.9 72 112 0.03 21.4 29.26 72.6 52 533 300 290.05
PURI NIMAPADA Balanga 340 8.06 110 18 43 0.1 0 12.91 31 8 167 98 90.16
RAYAGADA KASHIPUR Kashipur 280 7.8 116 24 25 0.1 19 9.03 8 9 133 97 95.08
RAYAGADA KASHIPUR Gorakhpur 40 7.4 24 4 4 0.4 2 0.98 3 0 24 14 19.67
RAYAGADA MUNIGUDA Ambadola 140 7.83 43 12 21 0.1 7.3 6.09 4 4 75 55 35.25
RAYAGADA GUNUPUR Gunupur1 220 8.1 116 24 11 0.3 2 6.11 15 7 121 85 95.08
RAYAGADA RAMANGUDA Ramnaguda1 700 8.1 171 22 82 0.2 37 18.99 66 66 341 133 140.16
RAYAGADA KOLNARA Mukundpur 200 8 98 22 21 0.2 3 6.11 11 0 109 80 80.33
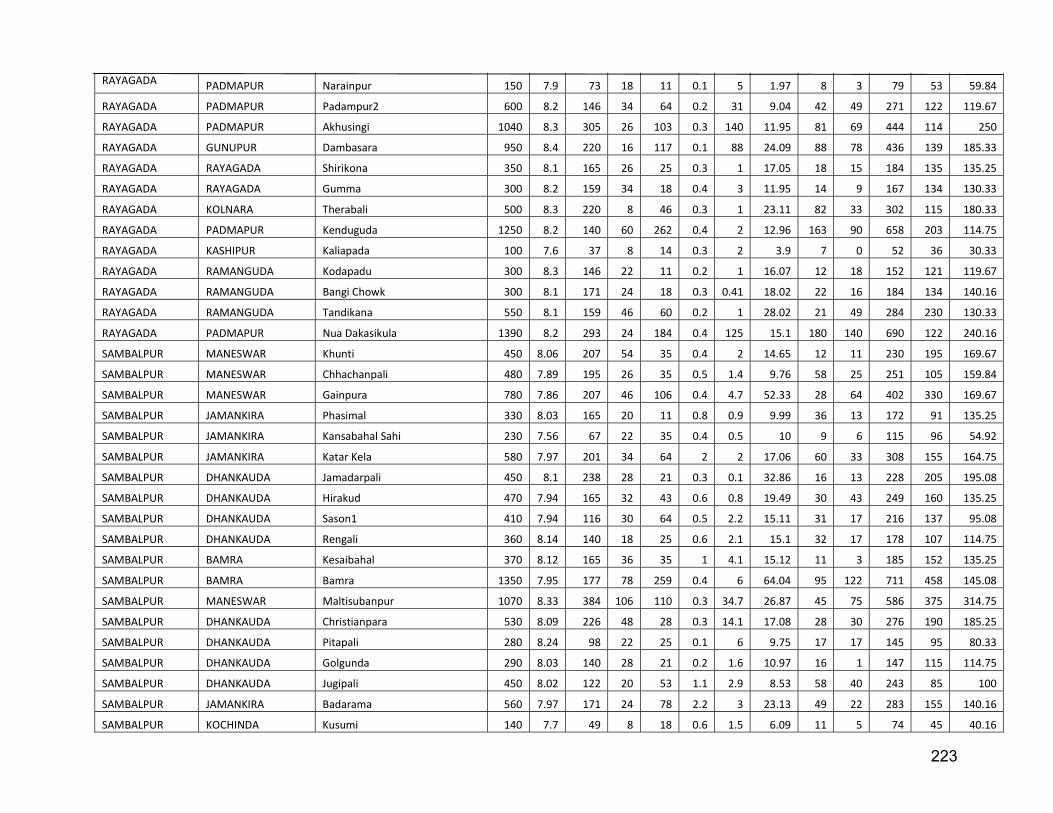
223
RAYAGADA PADMAPUR Narainpur 150 7.9 73 18 11 0.1 5 1.97 8 3 79 53 59.84
RAYAGADA PADMAPUR Padampur2 600 8.2 146 34 64 0.2 31 9.04 42 49 271 122 119.67
RAYAGADA PADMAPUR Akhusingi 1040 8.3 305 26 103 0.3 140 11.95 81 69 444 114 250
RAYAGADA GUNUPUR Dambasara 950 8.4 220 16 117 0.1 88 24.09 88 78 436 139 185.33
RAYAGADA RAYAGADA Shirikona 350 8.1 165 26 25 0.3 1 17.05 18 15 184 135 135.25
RAYAGADA RAYAGADA Gumma 300 8.2 159 34 18 0.4 3 11.95 14 9 167 134 130.33
RAYAGADA KOLNARA Therabali 500 8.3 220 8 46 0.3 1 23.11 82 33 302 115 180.33
RAYAGADA PADMAPUR Kenduguda 1250 8.2 140 60 262 0.4 2 12.96 163 90 658 203 114.75
RAYAGADA KASHIPUR Kaliapada 100 7.6 37 8 14 0.3 2 3.9 7 0 52 36 30.33
RAYAGADA RAMANGUDA Kodapadu 300 8.3 146 22 11 0.2 1 16.07 12 18 152 121 119.67
RAYAGADA RAMANGUDA Bangi Chowk 300 8.1 171 24 18 0.3 0.41 18.02 22 16 184 134 140.16
RAYAGADA RAMANGUDA Tandikana 550 8.1 159 46 60 0.2 1 28.02 21 49 284 230 130.33
RAYAGADA PADMAPUR Nua Dakasikula 1390 8.2 293 24 184 0.4 125 15.1 180 140 690 122 240.16
SAMBALPUR MANESWAR Khunti 450 8.06 207 54 35 0.4 2 14.65 12 11 230 195 169.67
SAMBALPUR MANESWAR Chhachanpali 480 7.89 195 26 35 0.5 1.4 9.76 58 25 251 105 159.84
SAMBALPUR MANESWAR Gainpura 780 7.86 207 46 106 0.4 4.7 52.33 28 64 402 330 169.67
SAMBALPUR JAMANKIRA Phasimal 330 8.03 165 20 11 0.8 0.9 9.99 36 13 172 91 135.25
SAMBALPUR JAMANKIRA Kansabahal Sahi 230 7.56 67 22 35 0.4 0.5 10 9 6 115 96 54.92
SAMBALPUR JAMANKIRA Katar Kela 580 7.97 201 34 64 2 2 17.06 60 33 308 155 164.75
SAMBALPUR DHANKAUDA Jamadarpali 450 8.1 238 28 21 0.3 0.1 32.86 16 13 228 205 195.08
SAMBALPUR DHANKAUDA Hirakud 470 7.94 165 32 43 0.6 0.8 19.49 30 43 249 160 135.25
SAMBALPUR DHANKAUDA Sason1 410 7.94 116 30 64 0.5 2.2 15.11 31 17 216 137 95.08
SAMBALPUR DHANKAUDA Rengali 360 8.14 140 18 25 0.6 2.1 15.1 32 17 178 107 114.75
SAMBALPUR BAMRA Kesaibahal 370 8.12 165 36 35 1 4.1 15.12 11 3 185 152 135.25
SAMBALPUR BAMRA Bamra 1350 7.95 177 78 259 0.4 6 64.04 95 122 711 458 145.08
SAMBALPUR MANESWAR Maltisubanpur 1070 8.33 384 106 110 0.3 34.7 26.87 45 75 586 375 314.75
SAMBALPUR DHANKAUDA Christianpara 530 8.09 226 48 28 0.3 14.1 17.08 28 30 276 190 185.25
SAMBALPUR DHANKAUDA Pitapali 280 8.24 98 22 25 0.1 6 9.75 17 17 145 95 80.33
SAMBALPUR DHANKAUDA Golgunda 290 8.03 140 28 21 0.2 1.6 10.97 16 1 147 115 114.75
SAMBALPUR DHANKAUDA Jugipali 450 8.02 122 20 53 1.1 2.9 8.53 58 40 243 85 100
SAMBALPUR JAMANKIRA Badarama 560 7.97 171 24 78 2.2 3 23.13 49 22 283 155 140.16
SAMBALPUR KOCHINDA Kusumi 140 7.7 49 8 18 0.6 1.5 6.09 11 5 74 45 40.16
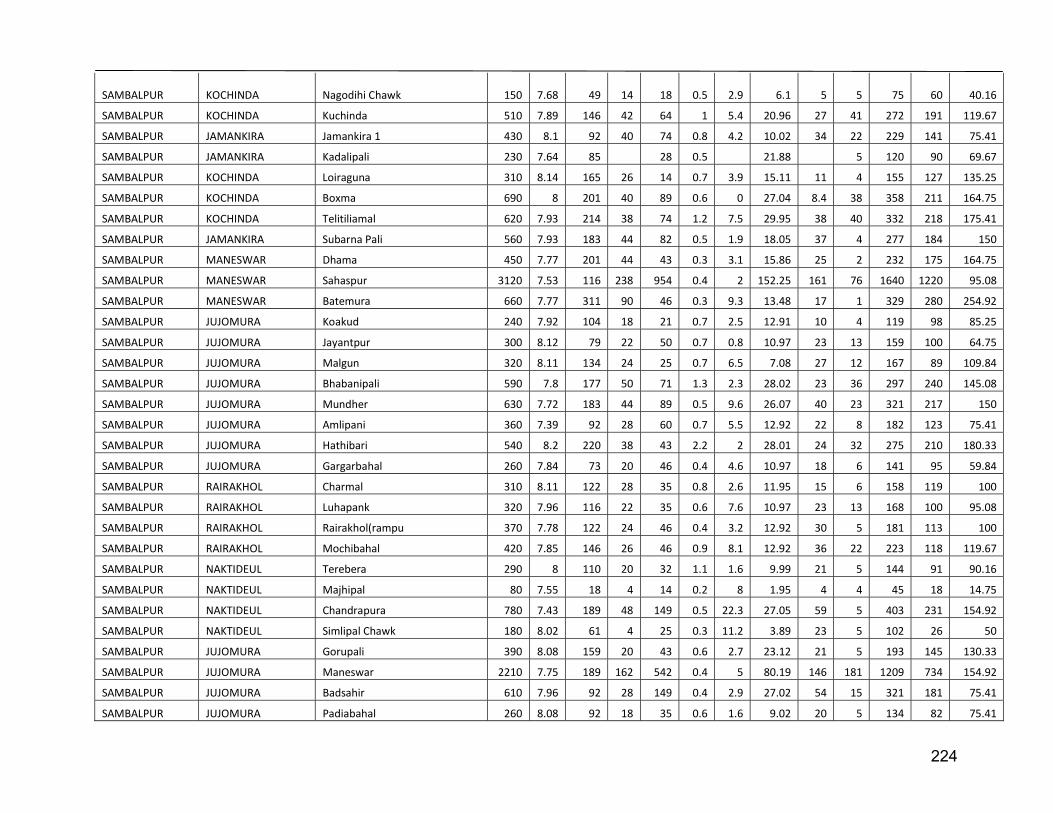
224
SAMBALPUR KOCHINDA Nagodihi Chawk 150 7.68 49 14 18 0.5 2.9 6.1 5 5 75 60 40.16
SAMBALPUR KOCHINDA Kuchinda 510 7.89 146 42 64 1 5.4 20.96 27 41 272 191 119.67
SAMBALPUR JAMANKIRA Jamankira 1 430 8.1 92 40 74 0.8 4.2 10.02 34 22 229 141 75.41
SAMBALPUR JAMANKIRA Kadalipali 230 7.64 85 28 0.5 21.88 5 120 90 69.67
SAMBALPUR KOCHINDA Loiraguna 310 8.14 165 26 14 0.7 3.9 15.11 11 4 155 127 135.25
SAMBALPUR KOCHINDA Boxma 690 8 201 40 89 0.6 0 27.04 8.4 38 358 211 164.75
SAMBALPUR KOCHINDA Telitiliamal 620 7.93 214 38 74 1.2 7.5 29.95 38 40 332 218 175.41
SAMBALPUR JAMANKIRA Subarna Pali 560 7.93 183 44 82 0.5 1.9 18.05 37 4 277 184 150
SAMBALPUR MANESWAR Dhama 450 7.77 201 44 43 0.3 3.1 15.86 25 2 232 175 164.75
SAMBALPUR MANESWAR Sahaspur 3120 7.53 116 238 954 0.4 2 152.25 161 76 1640 1220 95.08
SAMBALPUR MANESWAR Batemura 660 7.77 311 90 46 0.3 9.3 13.48 17 1 329 280 254.92
SAMBALPUR JUJOMURA Koakud 240 7.92 104 18 21 0.7 2.5 12.91 10 4 119 98 85.25
SAMBALPUR JUJOMURA Jayantpur 300 8.12 79 22 50 0.7 0.8 10.97 23 13 159 100 64.75
SAMBALPUR JUJOMURA Malgun 320 8.11 134 24 25 0.7 6.5 7.08 27 12 167 89 109.84
SAMBALPUR JUJOMURA Bhabanipali 590 7.8 177 50 71 1.3 2.3 28.02 23 36 297 240 145.08
SAMBALPUR JUJOMURA Mundher 630 7.72 183 44 89 0.5 9.6 26.07 40 23 321 217 150
SAMBALPUR JUJOMURA Amlipani 360 7.39 92 28 60 0.7 5.5 12.92 22 8 182 123 75.41
SAMBALPUR JUJOMURA Hathibari 540 8.2 220 38 43 2.2 2 28.01 24 32 275 210 180.33
SAMBALPUR JUJOMURA Gargarbahal 260 7.84 73 20 46 0.4 4.6 10.97 18 6 141 95 59.84
SAMBALPUR RAIRAKHOL Charmal 310 8.11 122 28 35 0.8 2.6 11.95 15 6 158 119 100
SAMBALPUR RAIRAKHOL Luhapank 320 7.96 116 22 35 0.6 7.6 10.97 23 13 168 100 95.08
SAMBALPUR RAIRAKHOL Rairakhol(rampu 370 7.78 122 24 46 0.4 3.2 12.92 30 5 181 113 100
SAMBALPUR RAIRAKHOL Mochibahal 420 7.85 146 26 46 0.9 8.1 12.92 36 22 223 118 119.67
SAMBALPUR NAKTIDEUL Terebera 290 8 110 20 32 1.1 1.6 9.99 21 5 144 91 90.16
SAMBALPUR NAKTIDEUL Majhipal 80 7.55 18 4 14 0.2 8 1.95 4 4 45 18 14.75
SAMBALPUR NAKTIDEUL Chandrapura 780 7.43 189 48 149 0.5 22.3 27.05 59 5 403 231 154.92
SAMBALPUR NAKTIDEUL Simlipal Chawk 180 8.02 61 4 25 0.3 11.2 3.89 23 5 102 26 50
SAMBALPUR JUJOMURA Gorupali 390 8.08 159 20 43 0.6 2.7 23.12 21 5 193 145 130.33
SAMBALPUR JUJOMURA Maneswar 2210 7.75 189 162 542 0.4 5 80.19 146 181 1209 734 154.92
SAMBALPUR JUJOMURA Badsahir 610 7.96 92 28 149 0.4 2.9 27.02 54 15 321 181 75.41
SAMBALPUR JUJOMURA Padiabahal 260 8.08 92 18 35 0.6 1.6 9.02 20 5 134 82 75.41

225
SAMBALPUR JUJOMURA Nildungri 440 8.07 171 30 53 0.5 3.4 18.03 31 5 224 149 140.16
SAMBALPUR MANESWAR Donaipalli 240 7.75 61 20 39 0.5 3.9 9.99 13 17 133 91 50
SAMBALPUR MANESWAR Dhanupalli 480 7.86 116 38 57 0.5 7 18.28 27 54 258 170 95.08
SAMBALPUR MANESWAR Talpali 390 7.99 128 26 46 0.6 1.1 16.08 30 14 196 131 104.92
SAMBALPUR MANESWAR Bhoipali 650 7.87 195 44 89 1 3.4 23.15 55 26 336 205 159.84
SAMBALPUR MANESWAR Gosala 420 7.87 189 30 25 0.5 1 20.7 27 25 222 160 154.92
SAMBALPUR MANESWAR Gunderpur 650 7.76 134 66 117 0.4 2.2 15.88 32 45 344 230 109.84
SAMBALPUR MANESWAR Rupapali 420 7.94 128 28 64 0.8 1.3 15.84 35 10 217 135 104.92
SAMBALPUR MANESWAR Chiplima 200 7.75 73 18 18 0.3 3 6.1 10 17 108 70 59.84
SAMBALPUR MANESWAR Baragaon 380 6.93 189 54 21 0.5 7.5 7.36 8 2 192 165 154.92
SAMBALPUR MANESWAR Deogaon 450 7.97 201 28 50 1.2 1.6 35.29 10 6 229 215 164.75
SAMBALPUR DHANKAUDA Goudpalli 1060 7.94 305 36 181 1.1 7.3 32.87 132 1 540 225 250
SAMBALPUR MANESWAR Remerha 430 8.07 183 26 21 0.6 2.5 23.13 26 30 218 160 150
SAMBALPUR MANESWAR Parmanpur 240 8.02 61 16 32 1 0.5 7.07 22 20 127 69 50
SAMBALPUR NAKTIDEUL Daincha 150 7.59 43 10 21 0.2 1.1 5.12 14 6 78 46 35.25
SAMBALPUR NAKTIDEUL Naktideol 1070 7.76 244 64 170 0.6 3 36.06 89 49 531 308 200
SONAPUR SONEPUR Khaliapali 640.8 7.77 226 18 85 0.4 8.8 43.79 38 21 326 225 185.25
SONAPUR SONEPUR Khari 570 7.93 262 36 46 0.4 3.2 35.3 22 13 284 235 214.75
SONAPUR ULUNDA Ulunda 1953 7.86 256 124 255 0.5 18.7 84.03 137 392 1136 655 209.84
SONAPUR BINIKA Antarda 620 8.24 201 52 82 0.3 0.3 29.97 25 16 304 253 164.75 SONAPUR BINIKA Koiramunda 4658 7.58 555 480 1205 1 5.1 207.25 38 195 2402 2050 454.92
SONAPUR BINIKA Sarangapali 443.6 7.58 146 36 60 0.2 5.4 20.71 20 8 222 175 119.67
SONAPUR BINIKA Sankara1 570 7.98 238 62 60 0.5 5.8 18.31 21 5 288 230 195.08
SONAPUR BINIKA Mahadevpali 2000 8.06 311 96 425 0.6 145 75.49 140 84 1117 550 254.92
SONAPUR BINIKA Sansamura 1154 7.69 287 68 188 0.7 4.1 48.71 95 52 597 370 235.25
SONAPUR TARBHA Palsapadar 690.6 7.86 336 66 43 0.6 17.5 23.18 28 2 344 260 275.41
SONAPUR TARBHA Sargaj 984.1 7.83 360 56 117 0.4 1.2 57.2 54 27 489 375 295.08
SONAPUR SONEPUR Bagduli 910 7.88 195 50 174 0.2 7.2 51.12 50 16 444 335 159.84
SONAPUR SONEPUR Arjunpur 920 8 384 54 78 0.2 26.5 41.15 55 13 456 304 314.75
SONAPUR BIRAMAHARAJPUR Subalaya 560 7.77 85 48 60 0.1 5.3 21.94 26 130 333 210 69.67
SONAPUR BIRAMAHARAJPUR Biramaharajpur 510 8.13 220 50 28 0.3 4.6 15.13 26 6 237 187 180.33
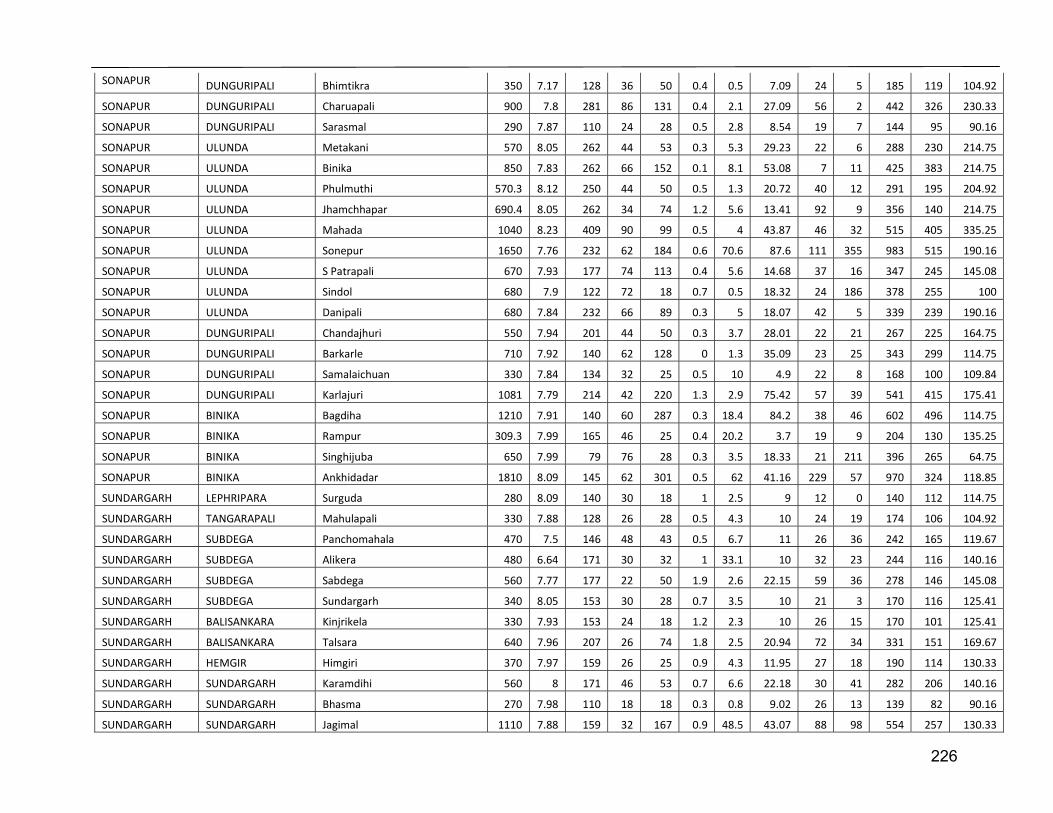
226
SONAPUR DUNGURIPALI Bhimtikra 350 7.17 128 36 50 0.4 0.5 7.09 24 5 185 119 104.92
SONAPUR DUNGURIPALI Charuapali 900 7.8 281 86 131 0.4 2.1 27.09 56 2 442 326 230.33
SONAPUR DUNGURIPALI Sarasmal 290 7.87 110 24 28 0.5 2.8 8.54 19 7 144 95 90.16
SONAPUR ULUNDA Metakani 570 8.05 262 44 53 0.3 5.3 29.23 22 6 288 230 214.75
SONAPUR ULUNDA Binika 850 7.83 262 66 152 0.1 8.1 53.08 7 11 425 383 214.75
SONAPUR ULUNDA Phulmuthi 570.3 8.12 250 44 50 0.5 1.3 20.72 40 12 291 195 204.92
SONAPUR ULUNDA Jhamchhapar 690.4 8.05 262 34 74 1.2 5.6 13.41 92 9 356 140 214.75
SONAPUR ULUNDA Mahada 1040 8.23 409 90 99 0.5 4 43.87 46 32 515 405 335.25
SONAPUR ULUNDA Sonepur 1650 7.76 232 62 184 0.6 70.6 87.6 111 355 983 515 190.16
SONAPUR ULUNDA S Patrapali 670 7.93 177 74 113 0.4 5.6 14.68 37 16 347 245 145.08
SONAPUR ULUNDA Sindol 680 7.9 122 72 18 0.7 0.5 18.32 24 186 378 255 100
SONAPUR ULUNDA Danipali 680 7.84 232 66 89 0.3 5 18.07 42 5 339 239 190.16
SONAPUR DUNGURIPALI Chandajhuri 550 7.94 201 44 50 0.3 3.7 28.01 22 21 267 225 164.75
SONAPUR DUNGURIPALI Barkarle 710 7.92 140 62 128 0 1.3 35.09 23 25 343 299 114.75
SONAPUR DUNGURIPALI Samalaichuan 330 7.84 134 32 25 0.5 10 4.9 22 8 168 100 109.84
SONAPUR DUNGURIPALI Karlajuri 1081 7.79 214 42 220 1.3 2.9 75.42 57 39 541 415 175.41
SONAPUR BINIKA Bagdiha 1210 7.91 140 60 287 0.3 18.4 84.2 38 46 602 496 114.75
SONAPUR BINIKA Rampur 309.3 7.99 165 46 25 0.4 20.2 3.7 19 9 204 130 135.25
SONAPUR BINIKA Singhijuba 650 7.99 79 76 28 0.3 3.5 18.33 21 211 396 265 64.75
SONAPUR BINIKA Ankhidadar 1810 8.09 145 62 301 0.5 62 41.16 229 57 970 324 118.85
SUNDARGARH LEPHRIPARA Surguda 280 8.09 140 30 18 1 2.5 9 12 0 140 112 114.75
SUNDARGARH TANGARAPALI Mahulapali 330 7.88 128 26 28 0.5 4.3 10 24 19 174 106 104.92
SUNDARGARH SUBDEGA Panchomahala 470 7.5 146 48 43 0.5 6.7 11 26 36 242 165 119.67
SUNDARGARH SUBDEGA Alikera 480 6.64 171 30 32 1 33.1 10 32 23 244 116 140.16
SUNDARGARH SUBDEGA Sabdega 560 7.77 177 22 50 1.9 2.6 22.15 59 36 278 146 145.08
SUNDARGARH SUBDEGA Sundargarh 340 8.05 153 30 28 0.7 3.5 10 21 3 170 116 125.41
SUNDARGARH BALISANKARA Kinjrikela 330 7.93 153 24 18 1.2 2.3 10 26 15 170 101 125.41
SUNDARGARH BALISANKARA Talsara 640 7.96 207 26 74 1.8 2.5 20.94 72 34 331 151 169.67
SUNDARGARH HEMGIR Himgiri 370 7.97 159 26 25 0.9 4.3 11.95 27 18 190 114 130.33
SUNDARGARH SUNDARGARH Karamdihi 560 8 171 46 53 0.7 6.6 22.18 30 41 282 206 140.16
SUNDARGARH SUNDARGARH Bhasma 270 7.98 110 18 18 0.3 0.8 9.02 26 13 139 82 90.16
SUNDARGARH SUNDARGARH Jagimal 1110 7.88 159 32 167 0.9 48.5 43.07 88 98 554 257 130.33
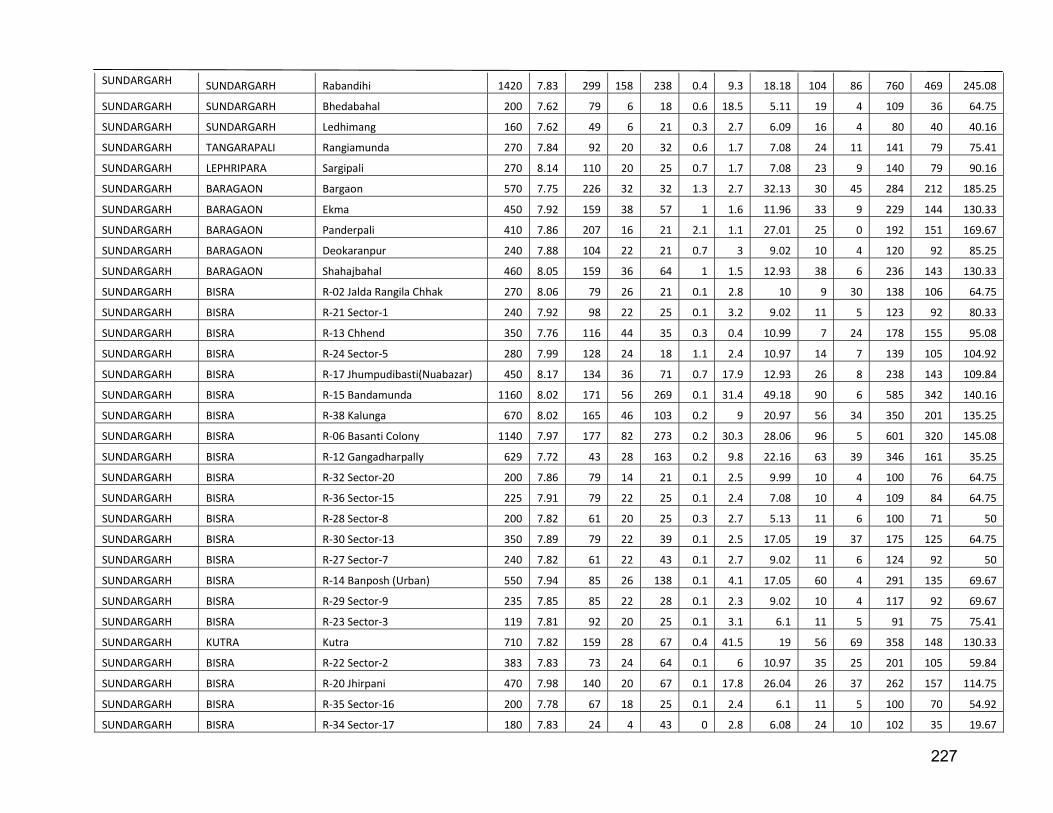
227
SUNDARGARH SUNDARGARH Rabandihi 1420 7.83 299 158 238 0.4 9.3 18.18 104 86 760 469 245.08
SUNDARGARH SUNDARGARH Bhedabahal 200 7.62 79 6 18 0.6 18.5 5.11 19 4 109 36 64.75
SUNDARGARH SUNDARGARH Ledhimang 160 7.62 49 6 21 0.3 2.7 6.09 16 4 80 40 40.16
SUNDARGARH TANGARAPALI Rangiamunda 270 7.84 92 20 32 0.6 1.7 7.08 24 11 141 79 75.41
SUNDARGARH LEPHRIPARA Sargipali 270 8.14 110 20 25 0.7 1.7 7.08 23 9 140 79 90.16
SUNDARGARH BARAGAON Bargaon 570 7.75 226 32 32 1.3 2.7 32.13 30 45 284 212 185.25
SUNDARGARH BARAGAON Ekma 450 7.92 159 38 57 1 1.6 11.96 33 9 229 144 130.33
SUNDARGARH BARAGAON Panderpali 410 7.86 207 16 21 2.1 1.1 27.01 25 0 192 151 169.67
SUNDARGARH BARAGAON Deokaranpur 240 7.88 104 22 21 0.7 3 9.02 10 4 120 92 85.25
SUNDARGARH BARAGAON Shahajbahal 460 8.05 159 36 64 1 1.5 12.93 38 6 236 143 130.33
SUNDARGARH BISRA R-02 Jalda Rangila Chhak 270 8.06 79 26 21 0.1 2.8 10 9 30 138 106 64.75
SUNDARGARH BISRA R-21 Sector-1 240 7.92 98 22 25 0.1 3.2 9.02 11 5 123 92 80.33
SUNDARGARH BISRA R-13 Chhend 350 7.76 116 44 35 0.3 0.4 10.99 7 24 178 155 95.08
SUNDARGARH BISRA R-24 Sector-5 280 7.99 128 24 18 1.1 2.4 10.97 14 7 139 105 104.92
SUNDARGARH BISRA R-17 Jhumpudibasti(Nuabazar) 450 8.17 134 36 71 0.7 17.9 12.93 26 8 238 143 109.84
SUNDARGARH BISRA R-15 Bandamunda 1160 8.02 171 56 269 0.1 31.4 49.18 90 6 585 342 140.16
SUNDARGARH BISRA R-38 Kalunga 670 8.02 165 46 103 0.2 9 20.97 56 34 350 201 135.25
SUNDARGARH BISRA R-06 Basanti Colony 1140 7.97 177 82 273 0.2 30.3 28.06 96 5 601 320 145.08
SUNDARGARH BISRA R-12 Gangadharpally 629 7.72 43 28 163 0.2 9.8 22.16 63 39 346 161 35.25
SUNDARGARH BISRA R-32 Sector-20 200 7.86 79 14 21 0.1 2.5 9.99 10 4 100 76 64.75
SUNDARGARH BISRA R-36 Sector-15 225 7.91 79 22 25 0.1 2.4 7.08 10 4 109 84 64.75
SUNDARGARH BISRA R-28 Sector-8 200 7.82 61 20 25 0.3 2.7 5.13 11 6 100 71 50
SUNDARGARH BISRA R-30 Sector-13 350 7.89 79 22 39 0.1 2.5 17.05 19 37 175 125 64.75
SUNDARGARH BISRA R-27 Sector-7 240 7.82 61 22 43 0.1 2.7 9.02 11 6 124 92 50
SUNDARGARH BISRA R-14 Banposh (Urban) 550 7.94 85 26 138 0.1 4.1 17.05 60 4 291 135 69.67
SUNDARGARH BISRA R-29 Sector-9 235 7.85 85 22 28 0.1 2.3 9.02 10 4 117 92 69.67
SUNDARGARH BISRA R-23 Sector-3 119 7.81 92 20 25 0.1 3.1 6.1 11 5 91 75 75.41
SUNDARGARH KUTRA Kutra 710 7.82 159 28 67 0.4 41.5 19 56 69 358 148 130.33
SUNDARGARH BISRA R-22 Sector-2 383 7.83 73 24 64 0.1 6 10.97 35 25 201 105 59.84
SUNDARGARH BISRA R-20 Jhirpani 470 7.98 140 20 67 0.1 17.8 26.04 26 37 262 157 114.75
SUNDARGARH BISRA R-35 Sector-16 200 7.78 67 18 25 0.1 2.4 6.1 11 5 100 70 54.92
SUNDARGARH BISRA R-34 Sector-17 180 7.83 24 4 43 0 2.8 6.08 24 10 102 35 19.67
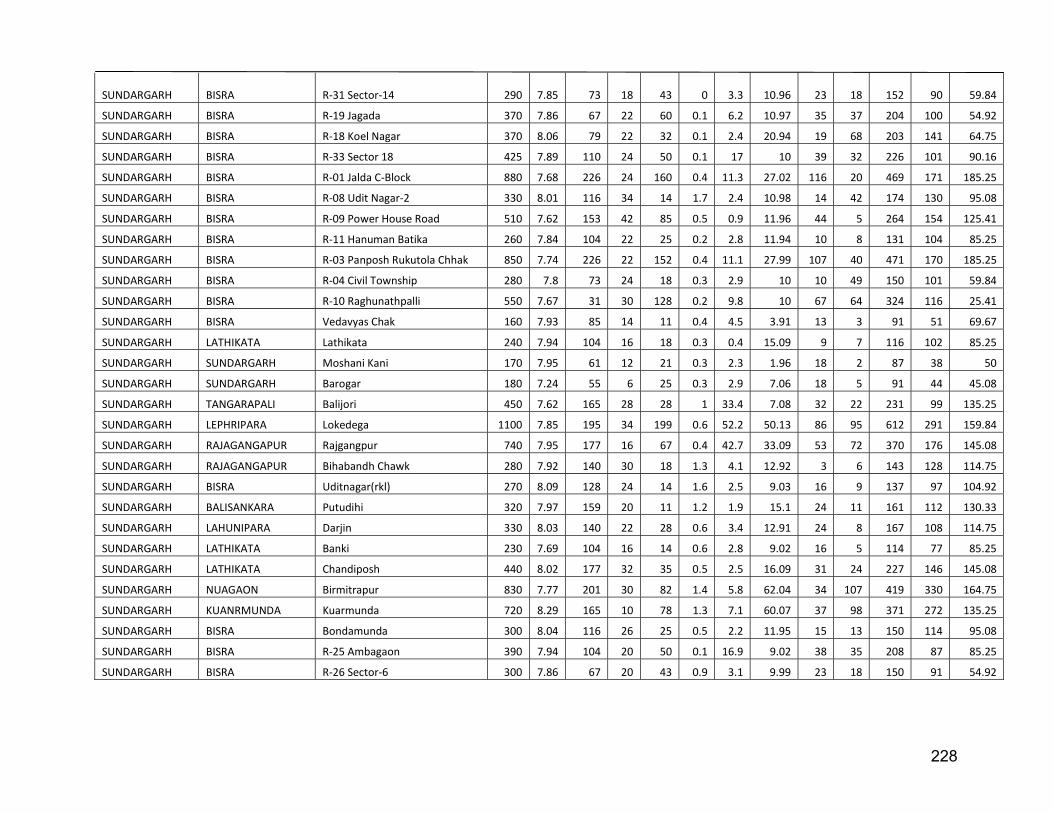
228
SUNDARGARH BISRA R-31 Sector-14 290 7.85 73 18 43 0 3.3 10.96 23 18 152 90 59.84
SUNDARGARH BISRA R-19 Jagada 370 7.86 67 22 60 0.1 6.2 10.97 35 37 204 100 54.92
SUNDARGARH BISRA R-18 Koel Nagar 370 8.06 79 22 32 0.1 2.4 20.94 19 68 203 141 64.75
SUNDARGARH BISRA R-33 Sector 18 425 7.89 110 24 50 0.1 17 10 39 32 226 101 90.16
SUNDARGARH BISRA R-01 Jalda C-Block 880 7.68 226 24 160 0.4 11.3 27.02 116 20 469 171 185.25
SUNDARGARH BISRA R-08 Udit Nagar-2 330 8.01 116 34 14 1.7 2.4 10.98 14 42 174 130 95.08
SUNDARGARH BISRA R-09 Power House Road 510 7.62 153 42 85 0.5 0.9 11.96 44 5 264 154 125.41
SUNDARGARH BISRA R-11 Hanuman Batika 260 7.84 104 22 25 0.2 2.8 11.94 10 8 131 104 85.25
SUNDARGARH BISRA R-03 Panposh Rukutola Chhak 850 7.74 226 22 152 0.4 11.1 27.99 107 40 471 170 185.25
SUNDARGARH BISRA R-04 Civil Township 280 7.8 73 24 18 0.3 2.9 10 10 49 150 101 59.84
SUNDARGARH BISRA R-10 Raghunathpalli 550 7.67 31 30 128 0.2 9.8 10 67 64 324 116 25.41
SUNDARGARH BISRA Vedavyas Chak 160 7.93 85 14 11 0.4 4.5 3.91 13 3 91 51 69.67
SUNDARGARH LATHIKATA Lathikata 240 7.94 104 16 18 0.3 0.4 15.09 9 7 116 102 85.25
SUNDARGARH SUNDARGARH Moshani Kani 170 7.95 61 12 21 0.3 2.3 1.96 18 2 87 38 50
SUNDARGARH SUNDARGARH Barogar 180 7.24 55 6 25 0.3 2.9 7.06 18 5 91 44 45.08
SUNDARGARH TANGARAPALI Balijori 450 7.62 165 28 28 1 33.4 7.08 32 22 231 99 135.25
SUNDARGARH LEPHRIPARA Lokedega 1100 7.85 195 34 199 0.6 52.2 50.13 86 95 612 291 159.84
SUNDARGARH RAJAGANGAPUR Rajgangpur 740 7.95 177 16 67 0.4 42.7 33.09 53 72 370 176 145.08
SUNDARGARH RAJAGANGAPUR Bihabandh Chawk 280 7.92 140 30 18 1.3 4.1 12.92 3 6 143 128 114.75
SUNDARGARH BISRA Uditnagar(rkl) 270 8.09 128 24 14 1.6 2.5 9.03 16 9 137 97 104.92
SUNDARGARH BALISANKARA Putudihi 320 7.97 159 20 11 1.2 1.9 15.1 24 11 161 112 130.33
SUNDARGARH LAHUNIPARA Darjin 330 8.03 140 22 28 0.6 3.4 12.91 24 8 167 108 114.75
SUNDARGARH LATHIKATA Banki 230 7.69 104 16 14 0.6 2.8 9.02 16 5 114 77 85.25
SUNDARGARH LATHIKATA Chandiposh 440 8.02 177 32 35 0.5 2.5 16.09 31 24 227 146 145.08
SUNDARGARH NUAGAON Birmitrapur 830 7.77 201 30 82 1.4 5.8 62.04 34 107 419 330 164.75
SUNDARGARH KUANRMUNDA Kuarmunda 720 8.29 165 10 78 1.3 7.1 60.07 37 98 371 272 135.25
SUNDARGARH BISRA Bondamunda 300 8.04 116 26 25 0.5 2.2 11.95 15 13 150 114 95.08
SUNDARGARH BISRA R-25 Ambagaon 390 7.94 104 20 50 0.1 16.9 9.02 38 35 208 87 85.25
SUNDARGARH BISRA R-26 Sector-6 300 7.86 67 20 43 0.9 3.1 9.99 23 18 150 91 54.92
Copyright © 2022 FDOKUMEN