
DB3: Installation Guide. 2007 Toyota Yaris. 403.TL11 1.06 - NET
Upload
independentCategory
view
2download
0
Ground-state absorption saturation and thermo-lensingeffect as main sources of refractive index non-linear change
in Cr4þ:YAG at CW 1.06 lm excitation
A.V. Kir�yanov*, Yu.O. Barmenkov, M. del Rayo, V.N. Filippov
Centro de Investigaciones en Optica A.C., Apartado Postal 948, Leon 37000, Gto, Mexico
Received 3 June 2002; received in revised form 15 September 2002; accepted 16 September 2002
Abstract
Non-linear change of refractive index in Cr4þ:YAG is investigated experimentally by the Z-scan technique (CW
case) at wavelength 1.06 lm. Theoretical analysis of the processes resulting in non-linear refraction in Cr4þ:YAG allows
one to conclude that the main contributions in non-linear change of the crystal refractive index are the effect of Cr4þ
centers� population perturbation due to ground-state (GS) absorption saturation and the thermo-lensing effect.
� 2002 Published by Elsevier Science B.V.
Keywords: Cr4þ:YAG; Z-scans technique; Absorption saturation; Thermo-lensing effect
1. Introduction
During the last decade, Cr4þ:YAG became a
routine passive Q-switch component in neodymium
and ytterbium lasers ðk � 1 lmÞ allowing their re-
liable giant-pulsed operation [1–3]. Cr4þ:YAG isalso used as an active laser medium for near-IR
spectral range, k � 1.4–1.5 lm [4].
Cr4þ:YAG possesses of some interesting non-
linear features; one of them is the latent anisotropy
of Cr4þ centers [5–8], which appears due to
ground-state (GS) absorption saturation under the
action of powerful resonant ðk � 1 lmÞ radiation.The latter stems from the fact that a linearly po-
larized pump wave interacts, during propagation
along the crystal, with three equivalent resonantly
absorbing linear dipoles (Cr4þ centers) oriented
along the main crystallographic axes of YAG lat-tice [8,9] (Fig. 1). Another interesting phenomenon
found recently in Cr4þ:YAG is anomalously slow
extra-bleaching under CW pumping of moderate
power [10].
Meanwhile, there are points of the Cr4þ:YAG
physics, which were not, to the best of our
knowledge, addressed in literature. One of them
concerns the non-linear change of refractive index,Dn, in Cr4þ:YAG at CW pumping. Only [5,8]
touch this problem, but in both cases short-pulse
(ns) excitation of Cr4þ:YAG is treated. However,
*Corresponding author. Tel.: +52-477-717-5823; fax: +52-
477-717- 5000.
E-mail address: [email protected] (A.V. Kir�yanov).
Optics Communications 213 (2002) 151–162
www.elsevier.com/locate/optcom
0030-4018/02/$ - see front matter � 2002 Published by Elsevier Science B.V.
PII: S0030-4018 (02 )02016-3

in conditions of CW pumping the two main con-
tributions in non-linear refraction should be pres-
ent: (1) the refractive index change caused by Cr4þ
centers� GS population perturbation (PP) (owing
to GS absorption saturation) and (2) the thermal-
lensing (TL) effect caused by the sample inhomo-
geneous heating [11,12]. Therefore, an analysis ofnon-linear refraction in Cr4þ:YAG and possible
discrimination of their parts answering to the PP
and TL contributions is of great importance. Ad-
dressing of this problem may bring more clarity in
circumstances, where, say, a CW-pumped
Cr4þ:YAG crystal is used as a lasing medium for
femtosecond pulses� generation and account for all
sources of the cavity dispersion change is critical[13].
Experimentally, non-linear change in refractive
index Dn in Cr4þ:YAG (k¼ 1.064 lm) may be
performed applying the Z-scan technique [14].
This technique is well-known method applicable
for measuring non-linear change of refractive in-
dex for a wide class of mechanisms (Kerr non-
linearity, two-photon absorption, etc.). Howeverthe Z-scan technique suffers from definite limita-
tions in some particular cases. For instance, as
shown in [15], there are evident obstacles for sim-
ple interpretation of so-called Z-scans in a me-
dium, where non-linear refraction is accompanied
by notable saturating of resonant absorption.
Moreover, an absorbing medium, even without
taking into account of the saturation effect, issubjected to significant thermal loading in cir-
cumstances of CW irradiation, which leads to
formation of a thermal lens in it. The correspon-
dent change in refractive index, as shown in [16],
can be analyzed with the Z-scan technique at se-
rious limitations only.
Study of non-linear change of refractive index
in Cr4þ:YAG is, therefore, a complicate task.
These crystals are characterized by significant
saturable GS absorption, which obviously leads todeviations of the probe beam shape from Gauss-
ian. The latter inserts uncertainties in the corre-
spondent Z-scans� interpretation [15]. In addition,
GS absorption in Cr4þ:YAG itself (as well as
possible excited-state (ES) absorption and/or re-
sidual losses) results, via the sample heating, to
non-linear TL effect [12,13,17]. Thus, one might
expect mixing of the PP and TL effects inCr4þ:YAG, which complicates the analysis of the
overall Dn. Let us also note that the time-resolved
Z-scans method [16,25] cannot, unfortunately, be
reliably applied in case of Cr4þ:YAG crystal, since
the characteristic response times of the PP and TL
effects are too close (�4 and �13 ls, respectively)in this case; see Section 3.4.
Misunderstanding of the latter features was acause of uncertainties and even errors occurred in
[18,19], where the Z-scan technique is applied for
study of Cr4þ:YAG. Ref. [18] addresses evaluation
of GS and ES absorption cross-sections in
Cr4þ:YAG using the open-aperture Z-scans. How-
ever, authors of [18] tried to fit their experimental
Z-scans traces, a priori supposing presence of ES
absorption in Cr4þ:YAG and ignoring the provenfact [20] that its cross-section (at k¼ 1.06 lm) tends
to be zero; in addition, they ignored the role of
Cr4þ:YAGnon-linear anisotropy [5–8]. Besides, the
experiment [18] was performed with a CW train of
femtosecond pulses as the probe, thus leading to the
sample heating, whichwas not taken into account in
the numerical modeling. The mentioned causes led
to misestimating of Cr4þ:YAG GS absorptioncross-section and overestimating of ES absorption
cross-section and also to the doubtful conclusion
that these parameters depend on pump intensity
and Cr4þ:YAG preparation. One more luck of [18]
is absence of any information about the probe beam
waist and focusing features of the Z-scan experi-
ment, which does not allow any check of the results.
There was also an attempt [19] to estimate non-linear refractive index change in Cr4þ:YAG from
the closed-aperture Z-scans. However, in that
Fig. 1. Schematic of interaction of probe radiation with
Cr4þ:YAG. Ep gives orientation of probe beam polarization
azimuth with respect to linear resonant dipoles (Cr4þ centers).
152 A.V. Kir�yanov et al. / Optics Communications 213 (2002) 151–162
preliminary study we, unfortunately, ignored the
same important features: estimation of Dn in
Cr4þ:YAG was done without taking into account
of the TL effect and slow extra-bleaching. Besides,
a probe beam in that investigation was not purely
Gaussian, which also led to additional overesti-mating of Dn (see, for instance [21]).
An aim of the present paper is to report on a
thorough experimental study and modeling of
non-linear change of refractive index in Cr4þ:YAG
by its probing with CW radiation at wavelength
1.06 lm applying the Z-scan technique and to
correct the results [19]. The study was performed
for a special orientation of the probe beam po-larization azimuth (Ep), which coincides with ori-
entation of one of the Cr4þ centers� group in YAG
(Fig. 1, h ¼ 0Þ. Such geometry allows one to avoid
the role of non-linear absorption anisotropy (and
birefringence) in Cr4þ:YAG. Comparison of the
data obtained experimentally with the PP and TL
effects� modeling allowed us to conclude that
contributions in overall refractive index change ofboth effects are of the same sign (a positive non-
linear lens is formed in Cr4þ:YAG as their ap-
pearance). The modeling analysis showed that the
TL effect in Cr4þ:YAG at CW pumping is com-
patible (or dominant, incidence power exceeding
�1 W) with the PP effect.
2. Experimental
2.1. Experimental set-up
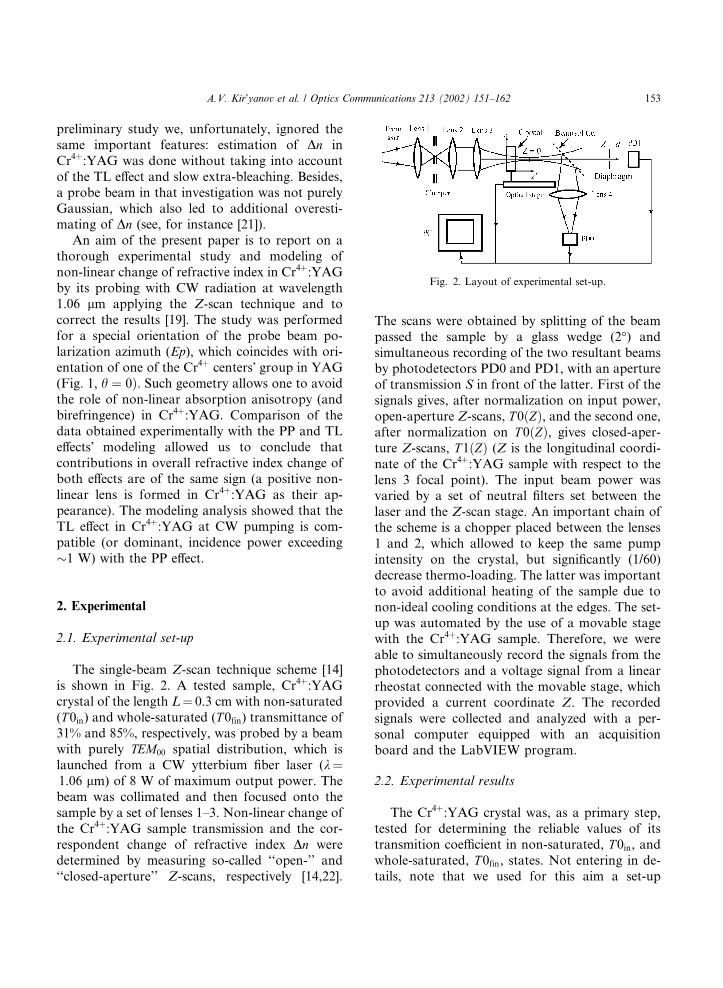
The single-beam Z-scan technique scheme [14]
is shown in Fig. 2. A tested sample, Cr4þ:YAG
crystal of the length L¼ 0.3 cm with non-saturated
(T0in) and whole-saturated (T0fin) transmittance of31% and 85%, respectively, was probed by a beam
with purely TEM00 spatial distribution, which is
launched from a CW ytterbium fiber laser (k¼1.06 lm) of 8 W of maximum output power. The
beam was collimated and then focused onto the
sample by a set of lenses 1–3. Non-linear change of
the Cr4þ:YAG sample transmission and the cor-
respondent change of refractive index Dn weredetermined by measuring so-called ‘‘open-’’ and
‘‘closed-aperture’’ Z-scans, respectively [14,22].
The scans were obtained by splitting of the beam
passed the sample by a glass wedge (2�) and
simultaneous recording of the two resultant beamsby photodetectors PD0 and PD1, with an aperture
of transmission S in front of the latter. First of the
signals gives, after normalization on input power,
open-aperture Z-scans, T0ðZÞ, and the second one,
after normalization on T0ðZÞ, gives closed-aper-
ture Z-scans, T1ðZÞ (Z is the longitudinal coordi-
nate of the Cr4þ:YAG sample with respect to the
lens 3 focal point). The input beam power wasvaried by a set of neutral filters set between the
laser and the Z-scan stage. An important chain of
the scheme is a chopper placed between the lenses
1 and 2, which allowed to keep the same pump
intensity on the crystal, but significantly (1/60)
decrease thermo-loading. The latter was important
to avoid additional heating of the sample due to
non-ideal cooling conditions at the edges. The set-up was automated by the use of a movable stage
with the Cr4þ:YAG sample. Therefore, we were
able to simultaneously record the signals from the
photodetectors and a voltage signal from a linear
rheostat connected with the movable stage, which
provided a current coordinate Z. The recorded
signals were collected and analyzed with a per-
sonal computer equipped with an acquisitionboard and the LabVIEW program.
2.2. Experimental results
The Cr4þ:YAG crystal was, as a primary step,
tested for determining the reliable values of its
transmition coefficient in non-saturated, T0in, andwhole-saturated, T0fin, states. Not entering in de-tails, note that we used for this aim a set-up
Fig. 2. Layout of experimental set-up.
A.V. Kir�yanov et al. / Optics Communications 213 (2002) 151–162 153

described in [8,23], where a tested sample is irra-
diated by a pulsed (10 ns) neodymium laser (k ¼1:06 lm) with a practically rectangular beam
shape inside the crystal. From this experiment, we
determined T0in � 31% and T 0fin � 85%. Let us
mention that Z-scan experiments have to be donewith a purely Gaussian probe beam, thus resulting,
at high pump power, in integral saturated trans-
mittance a bit less than 85% (owing to non-whole
GS absorption saturation at the wings of Gaussian
distribution).
The Z-scan measurements were done with a
probe beam from the ytterbium fiber laser, which
profiles, at the place of the lens 3, are shown in
Fig. 3 for two incidence powers, P ¼ 0:5 and 5 W.It is seen that a purely Gaussian distribution of the
beam is kept with high accuracy within the pump
interval (it is quite important to ensure validity of
the Z-scan technique to estimate Dn [21]). Apply-
ing the Gaussian beam algebra we determined the
beam waist at focus to be x0 ¼ 14:5 lm.
Fig. 4 shows the open-aperture Z-scans, T 0ðZÞ,for different incidence powers, P ¼ 0:8, 1.45, 3.2,and 6.4 W. The data of non-normalized trans-
mittance, T0max, corresponding to the open-aper-
ture Z-scans� maxima versus incidence power is
shown in Fig. 5 by curve 1.
Fig. 6 demonstrates the closed-aperture
Z-scans, T 1ðP ; ZÞ, where a pinhole (S¼ 0.1)
diaphragm is set before the photodiode PD1, for
P¼ 0.8, 1.45, 3.2, and 6.4 W. It is seen that anoscillation between the T1ðP ; ZÞ extrema is of the
‘‘valley-peak’’ type, ensuring the correspondent
non-linear lens being positive. One can also note
more asymmetry of the latter scans at input powerFig. 3. Experimental probe beam profiles at P ¼ 0:5 W (full
circles) and 5 W (empty circles) W. Solid line – Gaussian fit.
Fig. 4. Experimental open-aperture Z-scans T0ðZÞ for different incidence powers P.
154 A.V. Kir�yanov et al. / Optics Communications 213 (2002) 151–162
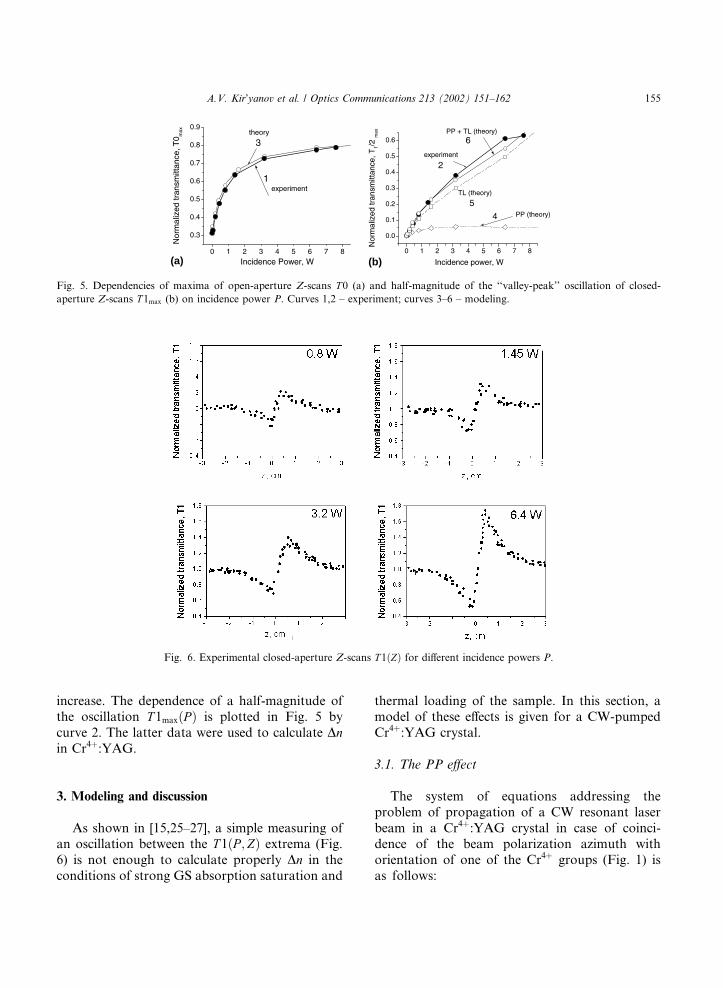
increase. The dependence of a half-magnitude ofthe oscillation T 1maxðP Þ is plotted in Fig. 5 by
curve 2. The latter data were used to calculate Dnin Cr4þ:YAG.
3. Modeling and discussion
As shown in [15,25–27], a simple measuring ofan oscillation between the T 1ðP ; ZÞ extrema (Fig.
6) is not enough to calculate properly Dn in the
conditions of strong GS absorption saturation and
thermal loading of the sample. In this section, amodel of these effects is given for a CW-pumped
Cr4þ:YAG crystal.
3.1. The PP effect
The system of equations addressing the
problem of propagation of a CW resonant laser
beam in a Cr4þ:YAG crystal in case of coinci-dence of the beam polarization azimuth with
orientation of one of the Cr4þ groups (Fig. 1) is
as follows:
(a) (b)
Fig. 5. Dependencies of maxima of open-aperture Z-scans T0 (a) and half-magnitude of the ‘‘valley-peak’’ oscillation of closed-
aperture Z-scans T1max (b) on incidence power P. Curves 1,2 – experiment; curves 3–6 – modeling.
Fig. 6. Experimental closed-aperture Z-scans T1ðZÞ for different incidence powers P.
A.V. Kir�yanov et al. / Optics Communications 213 (2002) 151–162 155

oIoz0
¼ � rpN0I1þ ðI=IsÞ
�þ c
�I ; ð1Þ
owoz0
¼ � drpN0I2 1þ ðI=IsÞð Þ : ð2Þ
Set of Eqs. (1) and (2) is the reducing to the CW
case and the particular geometry accepted of the
system derived in [8]. In Eqs. (1) and (2), I and ware, respectively, the intensity and phase of CW
radiation propagating along Cr4þ:YAG (z0 is the
current coordinate inside the sample and it should
not be confused with the sample coordinate Z);
Is ¼ hv=rps is the characteristic saturating intensity(hv is the energy quanta at wavelength kexc ¼1:06 lm, rp is the Cr
4þ:YAG GS absorption cross-
section (transition 3B1–3A2), and s is the lifetime of
Cr4þ centers in the ES); N0 is the concentration of
Cr4þ centers of one of the three allowed orienta-
tions; c is the coefficient of residual (non-satu-
rated) losses, and d is the atomic resonance
detuning parameter connected with the ratio
between real and imaginary parts of Cr4þ:YAG
polarizability (i.e., with presence of Cr4þ centers in
YAG lattice).
The steady-state population of Cr4þ centers in
the GS, N, is connected with the ratio of the
incidence and saturating intensities (I ; Is) as
N ¼ N0
1þ ðI=IsÞ: ð3Þ
The values of the model basic parameters are
listed in Table 1. It should be noted that data forrp available in literature vary by more than an
order of magnitude (from 3:5 10�19 to 6 10�18
cm2 [28–31]). We use in Table 1 the value, which
allows the best fitting of the experimental depen-
dence T0maxðP Þ by theory (see curve 1, Fig. 5). The
parameter d is taken to be 0.2 [8,24,32,33]. Con-
centration N0 of Cr4þ centers in YAG is calculated
as
N0 ¼ � ln T0in=T 0finð ÞrpL
; ð4Þ
where L is sample length.
Table 1
Cr4þ:YAG (##1–20) and characteristic setup (##21–25) parameters
1 Refractive index n0 ¼ 1:8
2 Thermal index gradient dn=dT ¼ 9:8 10�6 K�1
3 Thermal conductivity j ¼ 0:13 W=cm K
4 Specific heat C ¼ 600 J=kg K
5 Thermal expansion coefficient, [1 0 0] a ¼ 8:2 10�6 K�1
6 Poisson�s ratio m ¼ 0:3
7 Photoelastic coefficients Cr ¼ 0.017; Ct ¼ �0:0025
8 Density q ¼ 4:56 g=cm3
9 Concentration of Cr4þ centers N0 ¼ 4:5 1018 cm�3
10 Atomic resonance detuning parameter d ¼ 0:2
11 GS absorption cross-section rp ¼ 6:8 10�19 cm2
12 ES absorption cross-section rESA ¼ 0
13 Residual losses c ¼ 0:661
14 Length L¼ 0.3 cm
15 Diameter £ ¼ 1 cm
16 Initial and final transmittance T0in ¼ 0:31, T0fin ¼ 0:85
17 Cr4þ lifetime (30 �C) s ¼ 4:0 10�6 s
18 Saturation intensity Is ¼ 67 kW=cm2
19 Fluorescence quantum efficiency e ¼ 0:9
20 Stokes losses n ¼ 0:35
21 Incidence polarization azimuth orientation h ¼ 0�22 Incidence pump power P¼ 0.1–8.0 W
23 Energy of pump quanta ht ¼ 1:86 10�19 J
24 Pump wavelength kexc ¼ 1:06 10�4 cm
25 Beam waist x0 ¼ 14:5 10�4 cm
156 A.V. Kir�yanov et al. / Optics Communications 213 (2002) 151–162
Note that modeling of the PP effect is not
thorough, since it does not accounts for the ES
absorption in Cr4þ:YAG (which is negligible at
k ¼ 1:06 lm [20]) and some small part contribut-
ing the GS absorption due to the weak r-transi-tion 3B1–
3E (rr is shown [20] to be about 1/30 ofrp). The modeling does not also account for the
slow extra-bleaching of Cr4þ:YAG under CW ex-
citation (see [10] and discussion below, Section
3.4), since neither physical origin of the latter
process, nor its features are still clear.
Eqs. (1) and (2) may be numerically calculated
for a Gaussian beam as incidence with the initial
intensity and phase given as
I0 r; Zð Þ ¼ 2Ppx2 Zð Þ exp
�� 2r2
x2 Zð Þ
�; ð5Þ
w0 r; Zð Þ ¼ kr2
2R Zð Þ ; ð6Þ
where P is the input power (P ¼ 0–8 W), r is the
current beam radius along the Gaussian intensityenvelope, xðZÞ and RðZÞ are, respectively, the
spot-size and radius of curvature of the focused
beam; Z is the position of Cr4þ:YAG with respect
to the focal point (Z ¼ 0, R0 RðZ ¼ 0Þ ¼ 1 and
x0 xðZ ¼ 0Þ) and k ¼ 2p=kexc (kexc ¼ 1:06 lm is
the pump wavelength).
The closed-aperture Z-scans T 1ðP ; ZÞ are nu-
merically generated by using a formalism based onKirchhoff integral calculation over a pinhole S of
the radial size r1 [14,22,34]
EaðP ; ZÞ ¼ ikZ r1
0
EoutðP ; Z; rÞ2prdrðd � ZÞ ; ð7Þ
where
EoutðP ; Z; rÞ ¼ffiffiffiffiffiffiffiffiffiffiffiffiffiffiffiffiffiffiffiffiffiffiffiIoutðP ; Z; rÞ
pexp
�� r2
w2ðZÞ
�
þ ikr2
2RðzÞ þikr2
2ðd � ZÞ
��
exp f � iwoutðP ; Z; rÞg ð8Þ
is the laser beam electric field at the sample output.
The values IoutðP ; Z; rÞ and woutðP ; Z; rÞ dwPP
ðP ; Z; rÞ are the solutions of Eqs. (1) and (2). The
parameters xðZÞ and RðZÞ at the entrance are
governed by the well-known Gaussian beam
algebra; d is the distance between the diaphragm
and focal point.
One can easy calculate now the open- and
closed-aperture Z-scans, T0ðP ; ZÞ and T1ðP ; ZÞ.The dependence T0ðP ; ZÞ is found as an integrated(on r) transmittance of the Cr4þ:YAG crystal,
which is dependent on the incidence power and
sample coordinate only
T0ðP ;ZÞ ¼R10
IoutðP ; Z; rÞrdrR10
I0ðP ; Z; rÞrdr: ð9Þ
T1ðP ;ZÞ is written as
T1ðP ;ZÞ ¼ EaðP ; ZÞE�aðP ; ZÞ
EaðP ; 0ÞE�aðP ; 0ÞT0ðP ; ZÞ
: ð10Þ
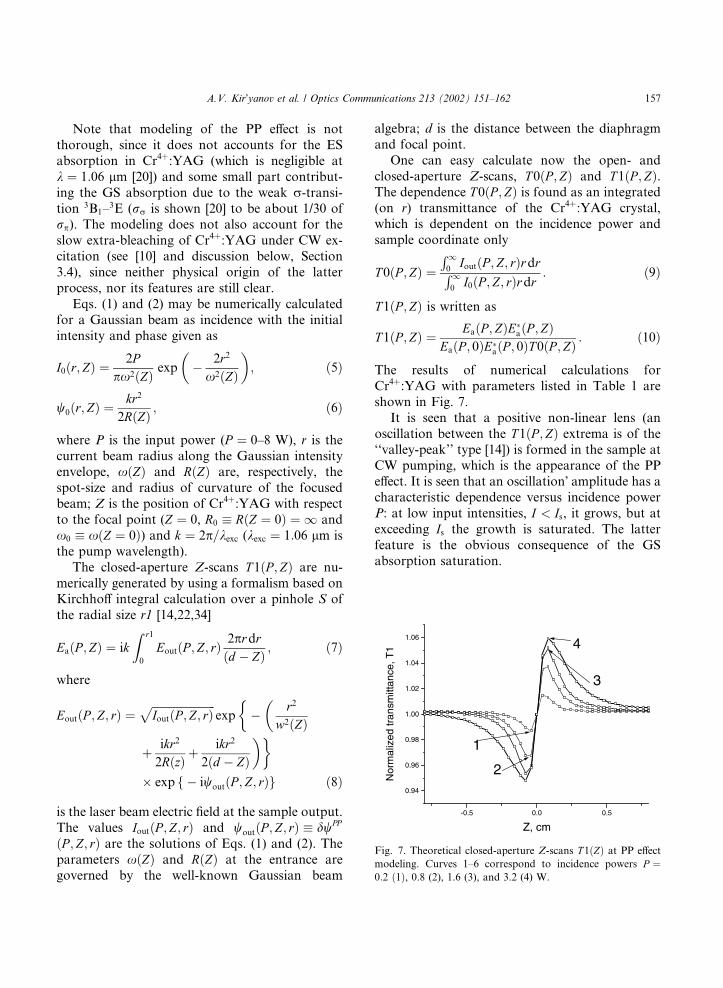
The results of numerical calculations for
Cr4þ:YAG with parameters listed in Table 1 are
shown in Fig. 7.
It is seen that a positive non-linear lens (an
oscillation between the T1ðP ; ZÞ extrema is of the
‘‘valley-peak’’ type [14]) is formed in the sample atCW pumping, which is the appearance of the PP
effect. It is seen that an oscillation� amplitude has a
characteristic dependence versus incidence power
P: at low input intensities, I < Is, it grows, but atexceeding Is the growth is saturated. The latter
feature is the obvious consequence of the GS
absorption saturation.
Fig. 7. Theoretical closed-aperture Z-scans T1ðZÞ at PP effect
modeling. Curves 1–6 correspond to incidence powers P ¼0:2 ð1Þ, 0.8 (2), 1.6 (3), and 3.2 (4) W.
A.V. Kir�yanov et al. / Optics Communications 213 (2002) 151–162 157
The dependences of T 0max and T 1max versus
pump power P are given in Fig. 5 by curves 3 and
4, correspondingly.
3.2. The TL effect
One can deduce from comparison of the ex-
perimental and theoretical dependencies T 1maxðP Þ(compare curves 2 and 4 in Fig. 5) that there is no
quantitative agreement between them.
Despite both dependencies T 1maxðP Þ demon-
strate a positive non-linear lens induced in
Cr4þ:YAG, neither amplitude of an oscillation
T1max, nor its characteristic dynamics versus P iscompatible. We supposed that such a discrepancy
is connected with prevailing, especially at high-
power CW excitation, of a thermal non-linear lens
(the TL effect) over the lens due to the GS ab-
sorption saturation (the PP effect).
The TL problem in a thermally loaded
Cr4þ:YAG crystal is treated usually [11,12,17] by
numerical solving the heat-transport equation,which allows one to get temperature distributions
across the Cr4þ:YAG sample and to evaluate a
thermal lens in the area, where the distributions
demonstrate a quadratic (versus radius r) depen-
dence. It is not our aim to give here a thorough
numerical modeling of the TL effect in Cr4þ:YAG.
Fortunately, it can be addressed by a simpler way.
Basing on the approach developed in [26,35,36],the focal length Fth of a thermal lens in a crystalline
absorbing sample at CW pumping is calculated as
FthðP ; ZÞ ¼4jpx2ðZÞ
nPabsðds=dT Þ; ð11Þ
where the optical path length change, ds=dT , is
determined as
dsdT
¼ dndT
þ ðn0 � 1Þð1þ tÞa þ n30aCr;t
: ð12Þ
Here, Pabs is the absorbed power, n is the fractional
heat load parameter (which gives the part of inci-
dent power transformed, due to non-radiative re-
laxation processes, to heat), n0 is the refractive
index of a ‘‘cold’’ sample, dn=dT , j, m, a, and Cr;t
are, correspondingly, the temperature gradient ofrefractive index, thermal conductivity, Poisson�s
ratio, thermal expansion coefficient, and photo-
elastic coefficients of the material (see Table 1).
It is seen from Eq. (12) that ds=dT is a sum of
three contributing terms. Equally with the evident
source of refractive index change given by thermaldispersion (dn=dT ), there are thermal expansion
(second term) and photoelastic (third term) con-
tributions. All the terms are present in the case of
CW pumped Cr4þ:YAG crystal, since YAG lattice
is subjected to thermally induced deformations.
Let us evaluate values of the parameters enter-
ing formulas (11) and (12).
Unfortunately, there are not reliable data inliterature for Cr4þ:YAG crystal; however, it may
be a good approximation the use of data for
Nd3þ:YAG, since in sense of the thermal loading
problem, these materials are virtually identical. As
it seen from Table 1, dn=dT � 9:8 10�6 K�1;
whereas the term characterizing the crystal thermal
expansion, ðn0 � 1Þð1þ tÞa, is estimated to be
�8:5 10�6 K�1 (YAG is very isotropic material,and coefficient a only slightly depends on its cut
orientation [37]; we took in Table 1 its value for
the [1 0 0] cut, which is the case of our study). One
can see that the first two terms in (12) are very
close in magnitude. Regarding the third term, let
us note that it is different for r- and t-possible
polarization orientation and also for different
propagations of light along the crystal, resulting inthermally induced birefringence in YAG. For the
[1 1 1] cut YAG, the correspondent values are
n30aCr � 0:8 10�6 K�1 and n30aCt � �0:1 10�6
K�1; and it is known that for the [1 0 0] cut YAG
these parameters are of the same order, differing
from the above values by 15–20% [38,39]. We
underlined in Section 1 that it is not the aim of this
study to investigate non-linear anisotropy and bi-refringence of Cr4þ:YAG; thus, we use further as
an estimate for the [1 0 0] cut Cr4þ:YAG the above
value n30aCr. In any case, it is clear that partial
weight of the last term in (12) is within �5% of a
sum of the first two terms and cannot lead to se-
rious errors in final results.
Hence, we can conclude that ds=dT � 19:310�6 K�1; and only thermal dispersion (dn=dT )and thermal expansion ðn0 � 1Þð1þ tÞa are the
important sources of thermally induced change of
refractive index in Cr4þ:YAG.
158 A.V. Kir�yanov et al. / Optics Communications 213 (2002) 151–162
The fractional heat load parameter n is deter-
mined by the Stokes losses in the sample, i.e., by the
ratio of exciting (pumping) and fluorescence wave-
length, kexc=kfluor, and fluorescence quantum effi-
ciency, e
n ¼ 1� ekexc
kfluor
: ð13Þ
In case of Cr4þ:YAG, e � 0:9 and kfluor ¼ 1.45–
1.5 lm [4], giving n � 0:35:In circumstances of GS absorption saturation,
formula (11) should be generalized for taking into
account of the dependence of absorption coeffi-
cient on input intensity
FthðP ; ZÞ ¼4jpx2ðZÞ
n 1� T0ðP ;ZÞð ÞP ðds=dT Þ ; ð14Þ
where T0ðP ; ZÞ is the transmittance of the sample,
which is automatically generated at numerical
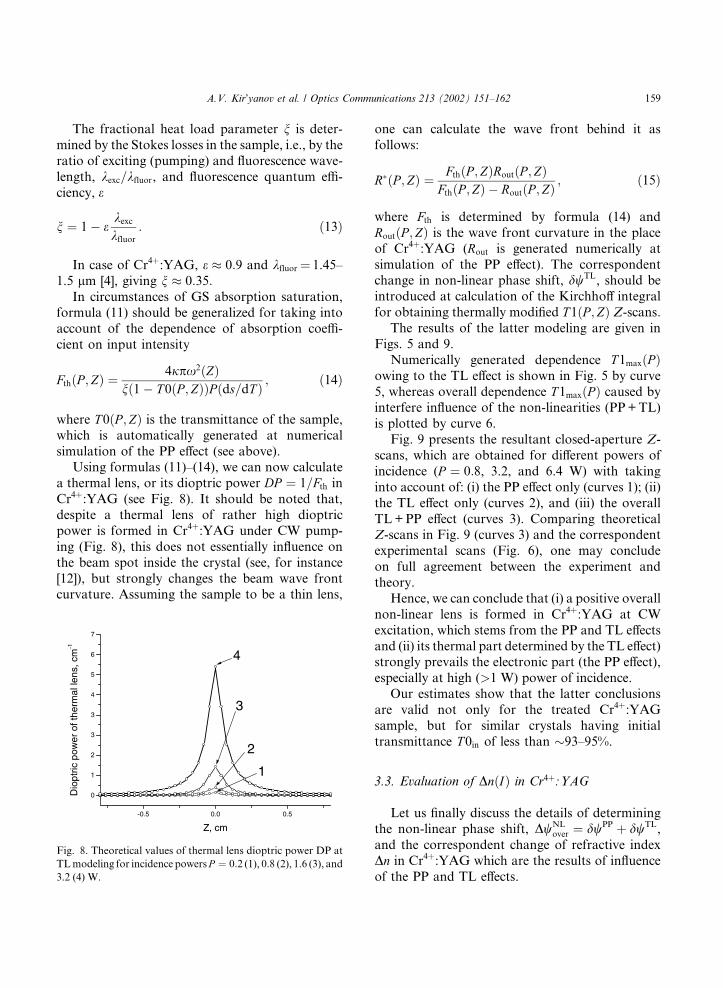
simulation of the PP effect (see above).Using formulas (11)–(14), we can now calculate
a thermal lens, or its dioptric power DP ¼ 1=Fth inCr4þ:YAG (see Fig. 8). It should be noted that,
despite a thermal lens of rather high dioptric
power is formed in Cr4þ:YAG under CW pump-
ing (Fig. 8), this does not essentially influence on
the beam spot inside the crystal (see, for instance
[12]), but strongly changes the beam wave frontcurvature. Assuming the sample to be a thin lens,
one can calculate the wave front behind it as
follows:
R�ðP ; ZÞ ¼ FthðP ; ZÞRoutðP ; ZÞFthðP ; ZÞ � RoutðP ; ZÞ
; ð15Þ
where Fth is determined by formula (14) and
RoutðP ; ZÞ is the wave front curvature in the place
of Cr4þ:YAG (Rout is generated numerically at
simulation of the PP effect). The correspondentchange in non-linear phase shift, dwTL, should be
introduced at calculation of the Kirchhoff integral
for obtaining thermally modified T1ðP ; ZÞ Z-scans.The results of the latter modeling are given in
Figs. 5 and 9.
Numerically generated dependence T1maxðPÞowing to the TL effect is shown in Fig. 5 by curve
5, whereas overall dependence T 1maxðP Þ caused byinterfere influence of the non-linearities (PP+TL)
is plotted by curve 6.
Fig. 9 presents the resultant closed-aperture Z-
scans, which are obtained for different powers of
incidence (P ¼ 0:8, 3.2, and 6.4 W) with taking
into account of: (i) the PP effect only (curves 1); (ii)
the TL effect only (curves 2), and (iii) the overall
TL+PP effect (curves 3). Comparing theoreticalZ-scans in Fig. 9 (curves 3) and the correspondent
experimental scans (Fig. 6), one may conclude
on full agreement between the experiment and
theory.
Hence, we can conclude that (i) a positive overall
non-linear lens is formed in Cr4þ:YAG at CW
excitation, which stems from the PP and TL effects
and (ii) its thermal part determined by the TL effect)strongly prevails the electronic part (the PP effect),
especially at high (>1 W) power of incidence.
Our estimates show that the latter conclusions
are valid not only for the treated Cr4þ:YAG
sample, but for similar crystals having initial
transmittance T0in of less than �93–95%.
3.3. Evaluation of DnðIÞ in Cr4þ:YAG
Let us finally discuss the details of determining
the non-linear phase shift, DwNLover ¼ dwPP þ dwTL,
and the correspondent change of refractive index
Dn in Cr4þ:YAG which are the results of influence
of the PP and TL effects.
Fig. 8. Theoretical values of thermal lens dioptric power DP at
TLmodeling for incidence powers P ¼ 0:2 (1), 0.8 (2), 1.6 (3), and
3.2 (4) W.
A.V. Kir�yanov et al. / Optics Communications 213 (2002) 151–162 159

Averaged (on input intensity) non-linear phase
shift DwNLover (when the sample is set at Z ¼ 0) is
calculated as
DwNLoverðP Þ ¼
Z 1
0
dwPPðP ; 0; rÞ��
þ dwTLðP ; 0; rÞ�I0ðP ; 0; rÞrdr
� Z 1
0
I0ðP ; 0; rÞrdr: ð16Þ
Therefore, overall change of refractive index Dnin Cr4þ:YAG at the beam waist is given as follows:
DnðPÞ ¼ DwNLoverðP ÞLeff
kexc
2p; ð17Þ
where Leff is the effective sample length
Leff ¼1� e�ðrN0þcÞL
rN0 þ c: ð18Þ
Since P ¼ I0px20=2 (I0 is the input intensity in
maximum of Gaussian distribution), formula (17)gives the wished dependence Dn ¼ DnðI0Þ.
The results of numerical calculations are given
in Fig. 10.
It is seen that non-linearities stemming from the
PP and TL effects are of a different nature (com-
pare curves 1 and 2). The part of Dn caused by the
PP effect (curve 1) obviously demonstrates satu-
ration, which is not surprising. Meanwhile, un-saturated character of overall Dn (curve 3) at high
pumps is because of the TL effect contribution
(curve 2), which partial weight increases due to
(a)
(b)
(c)
Fig. 9. Theoretical closed-aperture Z-scans T1ðZÞ for differentincidence powers P. Curves 1–3 correspond to modeling of:
PP effect only (1), TL effect only (2), and overall PP+TL ef-
fect (3).
Fig. 10. Dependencies of Dn versus normalized intensity (I=Is).Curves 1–3 correspond to modeling of: PP effect only (1), TL
effect only (2), and overall PP+TL effect (3).
160 A.V. Kir�yanov et al. / Optics Communications 213 (2002) 151–162
residual (non-saturated) losses (c) present in the
Cr4þ:YAG sample.
Therefore, in conditions of strong GS absorp-
tion saturation and high thermo-loading (as in the
case of CW-pumped Cr4þ:YAG), one should be
careful at evaluating DnðIÞ by a simple measuringof the T1p�v oscillation magnitude; otherwise,
definite mistakes might arise. Even though GS
absorption saturation [15] is accounted for, the TL
effect may cause additional (and big) phase shift in
the beam wave front, resulting in extra-deforma-
tions of the T1ðZÞ Z-scans (see, for instance
[40,41]).
3.4. Remaining questions
Comparing shapes of the experimental open-
aperture Z-scans T0ðP ; ZÞ (Fig. 4) and the theo-
retical ones (Fig. 7(a)), one may conclude that
widths of the first peaks are bigger than those
numerically calculated. Inspite of this feature, as
we cleared up, does not essentially influence on theshape and amplitude of the correspondent closed-
aperture Z-scans T1ðZÞ (compare Figs. 6 and 9)
and, therefore, does not result in notable uncer-
tainties in DnðIÞ measurement (the correspondent
error is within 15%), this fact should be addressed
in more detail.
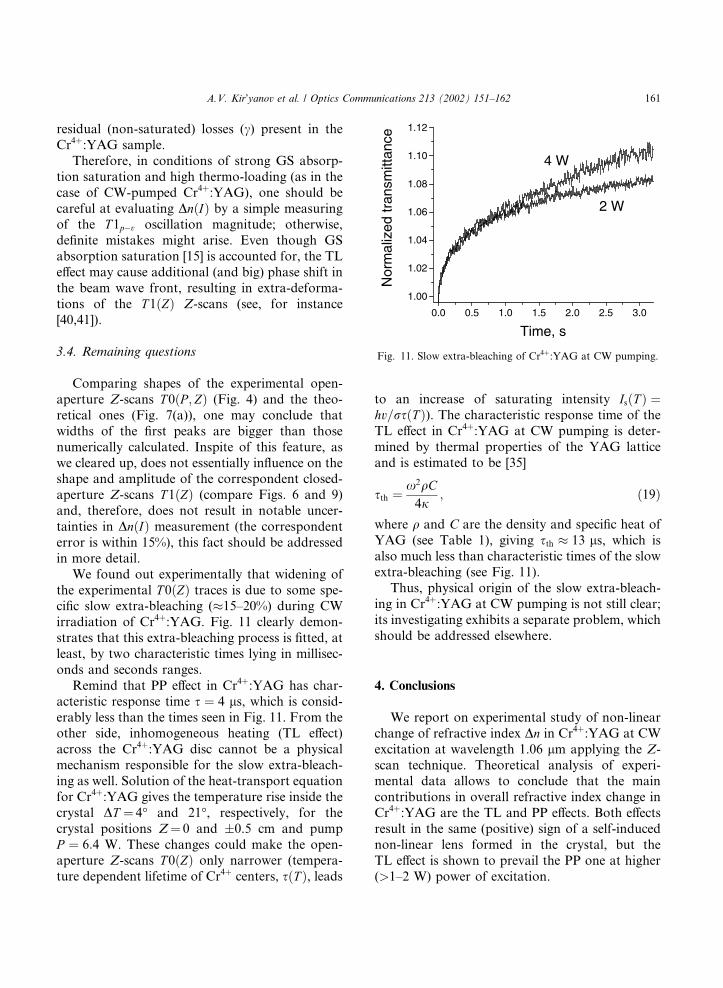
We found out experimentally that widening of
the experimental T 0ðZÞ traces is due to some spe-cific slow extra-bleaching (�15–20%) during CW
irradiation of Cr4þ:YAG. Fig. 11 clearly demon-
strates that this extra-bleaching process is fitted, at
least, by two characteristic times lying in millisec-
onds and seconds ranges.
Remind that PP effect in Cr4þ:YAG has char-
acteristic response time s ¼ 4 ls, which is consid-
erably less than the times seen in Fig. 11. From theother side, inhomogeneous heating (TL effect)
across the Cr4þ:YAG disc cannot be a physical
mechanism responsible for the slow extra-bleach-
ing as well. Solution of the heat-transport equation
for Cr4þ:YAG gives the temperature rise inside the
crystal DT ¼ 4� and 21�, respectively, for the
crystal positions Z¼ 0 and �0.5 cm and pump
P ¼ 6:4 W. These changes could make the open-aperture Z-scans T0ðZÞ only narrower (tempera-
ture dependent lifetime of Cr4þ centers, sðT Þ, leads
to an increase of saturating intensity IsðT Þ ¼hv=rsðT Þ). The characteristic response time of the
TL effect in Cr4þ:YAG at CW pumping is deter-
mined by thermal properties of the YAG lattice
and is estimated to be [35]
sth ¼x2qC4j
; ð19Þ
where q and C are the density and specific heat of
YAG (see Table 1), giving sth � 13 ls, which is
also much less than characteristic times of the slow
extra-bleaching (see Fig. 11).
Thus, physical origin of the slow extra-bleach-
ing in Cr4þ:YAG at CW pumping is not still clear;
its investigating exhibits a separate problem, which
should be addressed elsewhere.
4. Conclusions
We report on experimental study of non-linear
change of refractive index Dn in Cr4þ:YAG at CW
excitation at wavelength 1.06 lm applying the Z-
scan technique. Theoretical analysis of experi-mental data allows to conclude that the main
contributions in overall refractive index change in
Cr4þ:YAG are the TL and PP effects. Both effects
result in the same (positive) sign of a self-induced
non-linear lens formed in the crystal, but the
TL effect is shown to prevail the PP one at higher
(>1–2 W) power of excitation.
Fig. 11. Slow extra-bleaching of Cr4þ:YAG at CW pumping.
A.V. Kir�yanov et al. / Optics Communications 213 (2002) 151–162 161

Acknowledgements
A.V.K. and Yu.O.B. wish to thank CONACyT
(Mexico) for partial support of this work via
Projects #32269-E and #32195-E, respectively.
References
[1] H.J. Eichler, A. Haase, M.R. Kokta, R. Menzel, Appl.
Phys. B 58 (1994) 409.
[2] N.N. Il�ichev, A.V. Kir�yanov, P.P. Pashinin, Quant.
Electron. 28 (1998) 147.
[3] Y. Shimony, Z. Burshtein, A. Ben-Amar Baranga, Y.
Kalisky, M. Strauss, IEEE J. Quant. Electron. 32 (1996)
305.
[4] K. Spariosu, W. Chen, R. Stultz, M. Birnbaum, A.V.
Shestakov, Opt. Lett. 18 (1993) 814.
[5] S. Camacho-Lopez, R.P.M. Green, G.J. Crofts, M.J.
Damzen, J. Mod. Opt. 44 (1997) 209.
[6] H. Eilers, K.R. Hoffman, M. Dennis, S.M. Jacobsen, W.M.
Yen, Appl. Phys. Lett. 61 (1992) 2958.
[7] M.J. Damzen, S. Camacho-Lopez, R.P.M. Green, Phys.
Rev. Lett. 76 (1996) 2894.
[8] N.N. Il�ichev, A.V. Kir�yanov, P.P. Pashinin, S.M. Shpuga,
JETP 78 (1994) 768.
[9] N.N. Il�ichev, A.V. Kir�yanov, E.S. Gulyamova, P.P.
Pashinin, Quant. Electron. 28 (1998) 17.
[10] I.T. Sorokina, S. Naumov, E. Sorokin, A.G. Okhrimchuk,
Proc. SPIE 4350 (2001) 99.
[11] A. Sennaroglu, Appl. Opt. 36 (1997) 9528.
[12] A. Sennaroglu, A. Askar, F.M. Atay, JOSA B 14 (1997)
356.
[13] B.C. Collings, K. Bergman, W.H. Knox, Opt. Lett.
22 (1997) 1098.
[14] M. Sheik-Bahae, A.A. Said, T.H. Wei, D. Hagan, E.W.
VanStryland, IEEE J. Quant. Electron. 26 (1990) 760.
[15] L.C. Oliveira, T. Catunda, S.C. Zilio, Jpn. J. Appl. Phys.
35 (1996) 2649.
[16] L.C. Oliveira, S.C. Zilio, Appl. Phys. Lett. 65 (1994) 2121.
[17] J. Song, C. Li, K. Ueda, Opt. Commun. 177 (2000) 307.
[18] G. Xiao, J.H. Lim, S. Yang, E. VanStryland, M. Bass,
L. Weichman, IEEE J. Quant. Electron. 35 (1999) 1086.
[19] A.V. Kir�yanov, Yu.O. Barmenkov, V. Aboites, N.N.
Il�ichev, in: Advanced Solid-State Lasers-2001, Technical
Digest, Paper TuB6-1.
[20] A.G. Okhrimchuk, A.V. Shestakov, Phys. Rev. B 61 (2000)
988.
[21] S. Huges, J.M. Burzler, Phys. Rev. A 56 (1997) R1103.
[22] M. Sheik-Bahae, A.A. Said, E.W. VanStryland, Opt. Lett.
14 (1989) 995.
[23] N.N. Il�ichev, A.V. Kir�yanov, P.P. Pashinin, S.M. Shpuga,
Quant. Electron. 24 (1994) 771.
[24] A.G. Okhrimchuk, A.V. Shestakov, Opt. Mater. 3
(1994) 1.
[25] A.A. Andrade, T. Catunda, R. Lebullenger, A.C. Hernan-
des, M.L. Baesso, Electron. Lett. 34 (1998) 117.
[26] A.A. Andrade, E. Tenorio, T. Catunda, M.L. Baesso, A.
Cassanho, H.P. Jenssen, JOSA B 16 (1999) 395.
[27] V. Pilla, P.R. Impinnisi, T. Catunda, Appl. Phys. Lett. 70
(1997) 817.
[28] S. Kuck, K. Petermann, G. Huber, in: OSA Proc. Adv.
Solid State Lasers, vol. 10, 1991, p. 92.
[29] A.V. Shestakov, N.I. Borodin, V.A. Zhitnyuk, A.G.
Okhrimchuk, V.P. Gapontsev, in: CLEO�91, Technical
Digest, Paper CPDP 11-1.
[30] Z. Burshtein, P. Blau, Y. Kalisky, Y. Shimoni, M.R.
Kokta, IEEE J. Quant. Electron. 34 (1998) 292.
[31] Y. Shimony, Z. Burshtein, Y. Kalisky, IEEE J. Quant.
Electron. 31 (1995) 1738.
[32] A. Brignon, P. Sillard, J.-P. Huignard, Appl. Phys. B 63
(1996) 537.
[33] A. Brignon, JOSA B 13 (1996) 2154.
[34] C. Sifuentes, Yu.O. Barmenkov, A.V. Kir�yanov, Opt.
Mater. 19 (2002) 433.
[35] W. Koechner, Appl. Opt. 9 (1970) 2548.
[36] P.K. Mukhopadhyay, J. George, K. Ranghanatan, S.K.
Sharma, T.P.S. Nathan, Opt. Laser Technol. 34 (2002) 253.
[37] W. Koechner, Solid-State Laser Engineering, Springer,
Berlin, 1976, p. 54, 344.
[38] W. Koechner, D.K. Rice, IEEE J. Quant. Electron.
6 (1970) 557.
[39] L.N. Soms, A.A. Tarasov, V.V. Shashkin, Sov. J. Quant.
Electron. 10 (1980) 350.
[40] R. de Nalda, R. del Coso, J. Requeio-Isidro, J. Olivares, A.
Suarez-Garcia, J. Solis, C.N.Afonso, JOSAB19 (2002) 289.
[41] F.L.S. Cuppo, A.M.F. Neto, S.L. Gomez, P. Palffy-
Muhoray, JOSA B 19 (2002) 1342.
162 A.V. Kir�yanov et al. / Optics Communications 213 (2002) 151–162
Copyright © 2022 FDOKUMEN