Development and Preliminary Evaluation of the Measure of Understanding of Macroevolution:...
40
The Journal of Experimental Education, 2010, 78, 151–190 Copyright C Taylor & Francis Group, LLC ISSN: 0022-0973 print DOI: 10.1080/00220970903292983 MEASUREMENTS, STATISTICS AND RESEARCH DESIGN Development and Preliminary Evaluation of the Measure of Understanding of Macroevolution: Introducing the MUM Louis S. Nadelson Boise State University Sherry A. Southerland The Florida State University The challenges in teaching and learning of biological evolution continue to be docu- mented (NAS, 2008). Developers of science standards continue their work to increase emphasis on evolution. Although gains have been made, many K–12 science cur- ricula focus on microevolution (i.e., natural selection, genetic drift), and a more limited effort is in place to provide exposure to macroevolution (i.e., speciation). Many of the public’s fundamental questions concerning evolution actually stem from macroevolutionary changes. This research involved the development and psy- chometric evaluation of the Measure of Understanding of Macroevolution (MUM), an assessment of college undergraduate understanding of the scientific portrayal of macroevolution. The MUM comprises 27 multiple-choice items and 1 free-response item. The authors achieved content validity based on feedback from professional bi- ologists and evolution educators. The MUM was field tested with 3 unique cohorts of undergraduate students (N = 795). The validity and reliability analyses indicate that the MUM effectively, consistently, and accurately measures students’ understanding of macroevolution. Correspondence should be addressed to Louis S. Nadelson, Boise State University, Col- lege of Education, 1910 University Drive, Boise, ID 83725, USA. E-mail: louisnadelson@ boisestate.edu
Transcript of Development and Preliminary Evaluation of the Measure of Understanding of Macroevolution:...
The Journal of Experimental Education, 2010, 78, 151–190Copyright C© Taylor & Francis Group, LLCISSN: 0022-0973 printDOI: 10.1080/00220970903292983
MEASUREMENTS, STATISTICS AND RESEARCH DESIGN
Development and Preliminary Evaluationof the Measure of Understanding of
Macroevolution: Introducing the MUM
Louis S. NadelsonBoise State University
Sherry A. SoutherlandThe Florida State University
The challenges in teaching and learning of biological evolution continue to be docu-mented (NAS, 2008). Developers of science standards continue their work to increaseemphasis on evolution. Although gains have been made, many K–12 science cur-ricula focus on microevolution (i.e., natural selection, genetic drift), and a morelimited effort is in place to provide exposure to macroevolution (i.e., speciation).Many of the public’s fundamental questions concerning evolution actually stemfrom macroevolutionary changes. This research involved the development and psy-chometric evaluation of the Measure of Understanding of Macroevolution (MUM),an assessment of college undergraduate understanding of the scientific portrayal ofmacroevolution. The MUM comprises 27 multiple-choice items and 1 free-responseitem. The authors achieved content validity based on feedback from professional bi-ologists and evolution educators. The MUM was field tested with 3 unique cohorts ofundergraduate students (N = 795). The validity and reliability analyses indicate thatthe MUM effectively, consistently, and accurately measures students’ understandingof macroevolution.
Correspondence should be addressed to Louis S. Nadelson, Boise State University, Col-lege of Education, 1910 University Drive, Boise, ID 83725, USA. E-mail: [email protected]
152 NADELSON AND SOUTHERLAND
Keywords: conceptual change, postsecondary education, science education, surveyresearch, teacher preparation
BIOLOGICAL EVOLUTION is often described as a central organizing principleof the biological sciences (American Association for the Advancement of Science[AAAS], 1993; Dobzhansky, 1973; National Research Council [NRC], 1996).Indeed, in the Atlas of Science Literacy (AAAS, 2001), the AAAS describesevolution as one of the six major themes of all of biology. Thus, to becomescientifically literate in biology—that is, to grasp the fundamentals of biology ina manner that allows one to understand the biological phenomena in her or hislife—a deep understanding of biological evolution is vitally important (NationalAcademy of Sciences [NAS], 2008). Evolution is essential in understanding someof the most fundamental concepts of science, and, thus, it is a crucial aspect ofscientific literacy (NAS, 1998; NRC).
The importance of evolutionary theory to conceptualizing biology makes thelack of understanding of this construct problematic (Pigliucci & Kaplan, 2006).Pigliucci (2005) elaborated on the necessity to accurately grasp evolution to com-prehend many aspects of biology and societal implications of processes such asgenetic engineering, antibiotic resistant bacteria, climate change, and deforesta-tion. These and other processes have become important societal issues that involvepublic decisions and policy development and therefore necessitate an informedcitizenry. Given the technological and biological advances and their related impli-cations, there is a need to assure that citizens understand biological evolution ifthey are to make informed decisions (Bull, 2000; NAS, 2008).
The depth and breadth of scientific research influencing evolutionary theoryhas resulted in the development of lengthy and complex definitions of the process.However, Miller (1999) summarized these voluminous areas of scientific study,offering a concise and comprehensive definition of biological evolution. From hisperspective as a biologist, Miller wrote, “Evolutionary theory weighs the relativecontributions of mutation, variation, and natural selection, and tries to understandhow the interlocking actions of heredity, sex, chance, environment, cooperationand competition drive the fine details of descent with modification” (p. 54).
However, evolution continues to be a misconceived and widely debated sci-entific phenomenon by the American lay public (Alters, 2004; Alters & Alters,2001; Gallup, 2006; Miller, 1999, 2008). There is debate about evolution withinthe scientific community. However, the debate is not about whether evolution oc-curred, but rather about the details of the process of evolution itself (NAS, 2008).This is an important distinction, and a debate that is at the core of one of the mostpernicious misunderstandings held by the American public regarding evolution(Archibald, 1996).
The misconceptions and controversy surrounding biological evolution canrange from minor misunderstandings of components of the theory to complete

UNDERSTANDING OF MACROEVOLUTION 153
theory rejection (Alters & Alters, 2001; Dagher & Boujaoude, 2005; Evans 2001;Gallup, 2006; Mazur, 2004; McComas, 2006; Miller, 1999; Sadler, 2005; Sinatra,Brem, & Evans, 2008). Misconceptions of the theory of evolution may hinderthe ability to grasp related concepts or may lead to the development of additionalmisconceptions (Alters, 2004; McComas; Miller, 1999, 2008; Scott, 2004).
Microevolution and Macroevolution
Evolutionary theory is described as a continuous process influenced by naturalselection, environmental changes, adaptation, time, chance, and mutations (Miller,1999). Despite this concise description, some argue for the need to divide evolutioninto short-term (microevolutionary) and long-term (macroevolutionary) processes(Catley, 2006).
This division can be quite blurred and dynamic, adjusting to new evidence,different organisms, and unique situations or conditions (Hendry & Kinnison,2001; Simons, 2002). Alters and Alters (2001) defined microevolution as “merelychanges within the same ‘kinds’ of organisms” (p. 88) and defined macroevolu-tion as “evolution of taxa higher than the level of species” (p. 89). The artificialdivision of evolution into the relatively contrived categories of microevolution andmacroevolution may raise concerns among biologists. Yet, because the generalpublic and many biology curricula make this distinction in discussions of evolu-tion, there is pedagogical, curricular, and psychological justification for assessinglearners’ understanding and acceptance of the evolutionary process in both theshort term and the long term. This is not unique to evolution; Kazelskis et al.(2000) reported that the two seemingly similar constructs of mathematics anxietyand test anxiety have been found to be correlated but actually require separatemeasures for accurate assessment. Hence, consideration of student knowledge ofevolution in the context of the separate categories of micro- and macroevolutionmay prove to be educationally and psychologically important, if not biologically.
Research suggests that there are differences between individual acceptance andunderstanding of short-term microevolution and long-term macroevolution. Indi-viduals will frequently accept (i.e., accept as best current scientific explanation[Smith, in press]) microevolution (e.g. change in proportion of an allele in a pop-ulation of bacteria). At the same time, these individuals may reject some aspectof macroevolution as a valid scientific explanation (i.e., the close relationship be-tween dinosaurs and birds; Alters & Alters, 2001). Likewise, some learners canunderstand the microevolutionary processes of natural selection and random vari-ations but are unable to understand how new species arise from these processes(Ferrari & Chi, 1998). The public views evolution processes and patterns thatoperate over a short term as somehow different from evolutionary patterns andprocesses that operate and result in long-term events. Thus, gaining an understand-ing of learners’ knowledge of both may prove to be critical as researchers workto describe how individuals come to understand evolution. Simply put, although
154 NADELSON AND SOUTHERLAND
the distinction between short-term and long-term views of evolution may be ar-tificial biologically, this distinction may be important psychologically—that thisdistinction may shape how individuals learn and understand biological evolution.
Assessing the Understanding of Evolution
Most biology curricula, K–12 through the undergraduate level, focus on evo-lution from a microevolutionary perspective (Cately, 2006). Despite the inclusionof microevolution concepts into the curriculum and student exposure to these con-cepts in their coursework, many documented misconceptions of evolution remainprevalent. Alternative conceptions in this area include the teleological perspectivesin which individuals perceive evolution as being driving by desire or need of theorganism to change (Bishop & Anderson, 1990; Demastes-Southerland, Good, &Peebles, 1996; Southerland, Abrams, Cummins, & Anzelmo, 2001; Zaim-Idrissi,Desautels, & Larochelle, 1993), as evolution being goal oriented with organismsevolving to become more advanced or even more similar to humans (Ferrari &Chi, 1998), the idea of fitness applied to individuals and not populations in termsof the development, adaptation, and evolution of organisms (Alters & Nelson,2002; Bishop & Anderson), and the notion that all organisms appear much thesame as all their ancestors and essentially have not changed over time (Driver,Squires, Rushworth, & Wood-Robinson, 1994; Rutledge & Warden, 1999).
There have been many efforts to develop assessments of students’ knowledge ofevolution as well as detect alternative conceptions individuals might hold regardingthe theory (Anderson, Fisher, & Norman, 2002; Settlage & Odom, 1995). As withbiological evolution curricula, these assessments have focused on microevolution-ary processes. The instrument developed by Settlage and Odem, UnderstandingBiological Change (UBC), is intended to measure knowledge of natural selection.The UBC instrument uses contemporary species as a context for adaptation and ashort scenario detailing an adaption of the species. The UBC requests the readerto respond to the scenario by selecting one of two possible explanations for thedevelopment of some species characteristic. This is followed by a request for thelearner to pick one of three corresponding items to justify their selection of an ex-planation. The UBC includes common misconceptions as of evolution. Althoughthere are references in the UBC to ancestral species, all twelve of the scenariosin the survey focus on natural selection as a process leading to a single speciesgoing through a process of adaptation. Although it is possible that speciation (i.e.,the development of new species) could be applied to some of the items in theSettlage and Odem instrument, speciation is not explicitly addressed as part of theassessment.
Anderson et al. (2002) expanded on previous efforts to assess the understand-ing of evolution with their development of the Conceptual Inventory of NatureSelection (CINS). As with the UBC, the CINS provides scenarios and then asks
UNDERSTANDING OF MACROEVOLUTION 155
readers to respond to a series of related questions. Unlike the UBC, the CINShas longer, more complex scenarios and asks the reader to respond to a num-ber of questions related to these circumstances. Similar to the UBC, the CINSuses multiple-choice questions with common misconceptions as the distractors.Because of its strong reliability and validity, the CINS has been widely used inresearch (Butler, 2009; Nadelson & Sinatra, 2009; Tanner & Allen, 2005). Yet, thefocus of the instrument is on natural selection and adaptation, which are primarilyinterpreted as microevolutionary concepts. These instruments provide useful dataregarding the students’ understanding of microevolution. However, there is a gapin the literature in terms of assessing students’ understanding of macroevolution.
Measuring the Understanding of Macroevolution
Most of the general public in the United States have completed a least onecourse in high school biology (AAAS, 1989). Based on national recommenda-tions (AAAS, 1993; NRC, 1996), the biology curriculum should expose studentsto concepts associated with macroevolution during their K–12 preparation. Ourgoal was to develop an instrument that could be used to assess individual studentknowledge of macroevolution based on the assumption she or he has completed atleast one high school biology science course and is now enrolled as an undergrad-uate in a college or university. The K–12 science curriculum that most undergrad-uate students experience is dominated by the presentation of evolution conceptsfrom a microevolutionary, short-term, natural selection perspective (Catley, 2006).However, this singular curricular focus on microevolutionary concepts may sig-nificantly limit student development of understanding macroevolution (Catley,Lehrer, & Reiser, 2005; Dodick & Orion 2003b). The many concrete and widelypublicized examples of microevolution focus students’ attention on the small mod-ifications of organisms (e.g., antibiotic resistance in bacteria, pesticide resistancein weeds). Focus on microevolutionary concepts may lead learners to developthe conception that evolution is constrained to the short term, leading to minorchanges in a species appearance or the development of new, very similar varietiesof the same species. Yet, it is argued that microevolutionary processes extendedover long periods of time are the same processes that lead to macroevolution—thatis, the development of very different and seemingly unrelated species (Dodick,2007). Therefore, when assessing understanding of macroevolution, it is criticalto focus on long-term processes and the related principal concepts that, if mis-conceived, will influence understanding of macroevolutionary processes. Also ofimportance when constructing such an assessment is the findings of Chan, Leu,and Chen (2007), who reported that the assessment of understanding of a single,multifaceted, and complex concept may require multiple elements to fully capturethe nature of students’ understandings.
156 NADELSON AND SOUTHERLAND
Biological evolution is a rich area in terms of research because of both itssignificance in the discipline of biology and its potential to serve as a testing groundto examine the intersection of the acceptance and understanding of controversialissues (Sinatra, Southerland, McConaughy, & Demastes, 2003). But for this lineof research to continue to mature, we must also include students’ understandingof macroevolution (Cately, 2006) because extant measures largely focus on theunderstanding of microevolutionary events (e.g., CINS, UBC).
Research Objective
The objective of this research was to present the development and psychometricsof a new measure of students’ understanding of macroevolution. Specifically, theMeasure of Understanding of Macroevolution (MUM) was designed to measurethe degree to which students’ knowledge conformed to the scientific understandingof facets of macroevolution. As such, it should be recognized that the instrumentwas not intended to generate full portraits of what students know about macroevo-lution. Instead, our instrument was designed to fill the need for an appropriate toolfor use in large-scale studies to assess to what degree students’ understanding ofmacroevolution echoes that of the perspective of those in the biological sciences.
Instrument Development
On the basis of the work of Catley et al. (2005) and a review of the nationalscience standards for high school biology that an undergraduate student shouldhave attained (NRC, 1996), we identified deep time, phylogenetics, speciation,fossils, and the nature of science as five essential concepts necessary to compre-hend macroevolution. To further validate the selection of these five subscales, wereviewed several undergraduate biological evolution textbooks including Evolu-tion by Futuyma (2005), Evolution by Barton, Briggs, Eisen, Goldsten, and Nipam(2007), and Evolutionary Analysis by Freeman and Herron (2007). Our analysisof the contents of these textbooks revealed that our subscales were consistentwith those considered to be essential topics in undergraduate biological evolutioncurriculum, providing content validity for our subscale selection. This finding wasanticipated because there is an expectation in the science education reform com-munity that students exit high school and enter college already having knowledgeof these topics (NRC, 1996).
To obtain an additional layer of content validity for the selection of our sub-scales, we requested five university biology department faculty members whoteach courses that include a major emphasis on biological evolution review oursubscales. Each of the five faculty members considered our subscales to be rep-resentative of the major topics and concepts associated with macroevolution. Fol-lowing the validation of our subscales by the professional biologists, we reviewed

UNDERSTANDING OF MACROEVOLUTION 157
the educational research literature reporting students’ conceptions related to thesefive major facets of macroevolution.
Deep Time
Most individuals do not comprehend deep time or have detailed knowledge ofthe sequence of evolutionary events over the last half billion years; they just knowit is a very long period of time (Dodick & Orion, 2003b). Trend (1998) found that10- and 11-year-old students had some idea that deep time involves events thatoccurred far in the past and tended to group events into the ancient past and lessancient past. However, they lacked knowledge of the details of the sequence ofevents that occurred during these time periods. Trend (2001) also reported similarfindings from an investigation of in-service teachers who, when asked aboutdeep time, formed three time periods—extremely ancient, moderately ancient,and less ancient—but lacked a consensus on the time-of-occurrence details ofmacroevolutionary events. The lack of a clear understanding of the sequenceof deep time and the occurrence of events has been determined to significantlyinfluence individual understanding of macroevolution (Catley, Lehrer, & Reiser,2005; Dodick, 2007). The relation between deep time and macroevolution providesjustification for including time-related items when measuring understanding ofmacroevolution.
Phylogenetics
Phylogenetics, or the study of the relations between ancient and modern or-ganisms, can be a confusing concept and, yet, understanding the relation of taxais a central component of macroevolution (Catley, 2006). In macroevolutionarycontexts, cladograms or phylogenetic trees are graphic representations depictingthe relations to common ancestors and the development of the divisions of speciesover long periods of time. The classification of organisms and the ability to inter-pret phylogenetic trees or cladograms that depict these classifications are criticalto understanding how living and extinct organisms are related (Catley). Therefore,the scientific understanding of phylogenetics and the use of the methods to or-ganize species are key concepts to be included in a measure of understanding ofmacroevolution.
Speciation
Freeman and Herron (2007) defined species as “. . . the smallest evolution-ary independent unit” (p. 606). In biology, it is hypothesized that all species arerelated, having all descended from a common ancestor (Freeman & Herron; Gould,2002) and that the development of all organisms has resulted from combination
158 NADELSON AND SOUTHERLAND
of stochastic occurrence of mutations outcomes, natural selection, and chance(Futuyma, 2002). This is a challenging idea for learners to grasp because of thelack of representative models to aid in the conceptualization of macroevolution-ary views of common ancestry. The subtle yet distinguishable traits that separateclosely related species provide a concrete example that is useful for the conceptu-alization of microevolutionary processes (as with the Galapagos Island finches).The focus on these concepts in the curriculum further supports a microevolutionaryperspective of evolution (Catley, 2006). However, reliance on examples of closelyrelated species to understand evolution may lead to the development of a heuristicsupporting the conception that speciation always results in new but only subtlydifferent species. This heuristic is adequate for conceptualizing most microevolu-tionary situations but interferes with the recognition that phenotypically distinctspecies can be the result of a single speciation event that occurred in the distantpast. Also, the macroevolutionary view allows one to recognize that speciationcan result in the development of organisms that look very different but have beendetermined to be related at the order or family level of classification. For example,recent evidence supports the hypothesis that whales are relatively closely related tothe hippopotamus (for more details of this relation, see Freeman & Herron, p. 121).
The lack of easily attainable conceptual models for speciation over the longterm—a critical antecedent of macroevolution—suggests that student exposure tothis aspect of the theory of evolution may be limited. An understanding of specia-tion limited to microevolutionary perspectives and a lack of comprehension of thevery long-term outcomes of speciation, will impede understanding of macroevo-lution. Therefore, long-term speciation can be considered to be a key concept thatshould be included in a measure of macroevolution understanding.
Fossils
Fossils are a fundamental source of evidence used to support our understand-ing of macroevolution (Dodick & Orion, 2003a; Freeman & Herron, 2007; Gould,2002). Closely related to the understanding of deep time is the comprehension ofthe formation, location, discovery, and interpretation of fossils (Dodick & Orion).Although fossils are an important aspect of macroevolution, the concepts relatedto the fossil record are typically integrated into geoscience courses, not in biologycourses (Libarkin & Anderson, 2005). In their assessment of students’ perspectivesof fossils, Libarkin and Anderson reported that conceptions did not change uponposttesting, indicating students may form and hold alternative conceptions relatedto fossils even after exposure to instruction addressing fossil concepts. Althoughone might anticipate that the college-level students participating in Libarkin andAnderson’s study would have had exposure to some of the fundamental fossilconcepts in their high school science curriculum, the detection and retention offossil misconceptions among these students suggests that some learners exiting

UNDERSTANDING OF MACROEVOLUTION 159
high school biology courses and entering postsecondary education will have alimited understanding of fossils and their importance to explaining macroevolu-tion. Given the association between understanding fossils and understanding thebasis for the theory of macroevolution, there is justification for the inclusion ofitems related to fossils (formation, location, discovery, and interpretation) as keyto measuring understanding of macroevolution.
Nature of Science
The challenges that individuals encounter with their understanding of the na-ture of science (NOS) are well documented (Abd-El-Khalick & Lederman, 2000;Cooper, 2002; Johnson, 2005; McComas & Olson, 1998; Scharmann, Smith,James, & Jensen, 2005), which is significant given the inseparable relation be-tween knowledge of NOS and understanding biological evolution (NAS, 1998,2008). In Teaching About Evolution and the Nature of Science, the NAS (1998)presented the numerous links between the NOS and evolution and included manyexamples of how misconceptions of NOS can result in misconceptions or the lackof comprehension of evolution. The NAS reinforces the notion that it is criticalfor individuals to understand the use of evidence in science, the tentative nature ofscientific knowledge, the range of acceptable scientific methodologies, the role ofauthority, knowledge structures (e.g., the status awarded to a scientific theory), andthe process of forming scientific predictions. Evolution is a complex theory thatuses a wide range of evidence from multiple disciplines, evidence that may be in-terpreted in different ways. Understanding the multiple interpretations of evidenceand the tentative nature of all scientific conclusions is critical to comprehendingmacroevolution. Therefore, a measure of macroevolution should include itemsthat assess individual knowledge of NOS in the context of macroevolutionarytheory.
Following the initial determination of the five key antecedents comprisingthe comprehension of evolution and the examination of the format of extentmeasures of microevolution (UBC and CINS), we concluded that a scenario-basedinstrument would be more effective than a series of unrelated items for assessingmacroevolution understanding. Our intent was to develop a series of scenariosthat would provide the context for the creation of selected response multiple-choice items that utilize knowledge of our five key concepts. Examinations of thecurricular recommendations and topics for instruction suggested by the AAAS(1993), the NRC (1996), and the NAS (1998); consultation of an evolutionarybiology text (Freeman & Herron, 2007); and discussions with biologists whoteach evolution courses led to the selection and development of five scenarios,presented below in abridged form. The full scenarios can be found in the fullinstrument in the Appendix.
160 NADELSON AND SOUTHERLAND
“An exploration of the evolutionary process and the evidence for the transitionof the whale family from ancient shore-dwelling ancestors, using a proposedevolutionary tree of mammals including whales to explore the process of howland animals evolved into whales.” (Whale Evolution)
“An exploration of the evolution of the modern eye dating back to origins some 540million years, using the density of photoreceptors of the pigment cup and thecomplex eye, reveal a variation within the present day Nautilus and Octopus.”(Mollusks Eyes)
“An examination of extinction as represented by diagrams of lineages.” (Lineagesand Extinction)
“The understanding of the suggested evolutionary pathway of the African GreatApe and the development of diagram pathways.” (Primate Evolution)
“The knowledge of the mapped location depicting where the fossils of variousorganisms have been found on different continents.” (Fossil Map)
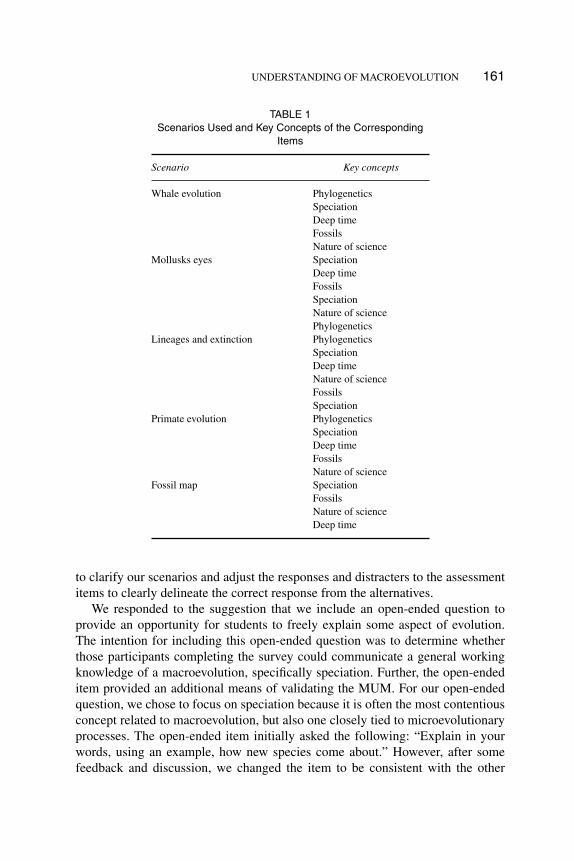
Following the development of these scenarios, we sought to create associateditems, one for each of the five key concepts identified as essential for understandinga scientific portrayal of macroevolution. As we began developing the items foreach of the scenarios, it quickly became apparent that the scenarios did not lendthemselves equally toward item development for each of the five essential concepts.For example, the Fossil Map scenario has a high association with items relating tofossils and the nature of science but is more distant to concepts related to speciation.Similarly, the Mollusks Eyes scenario is highly associated with nature of scienceand speciation but is more detached from the key concept of fossilization. As aresult, even though efforts were made to construct one item for each of the fivekey concepts for each scenario, the final distribution did not strictly conform tothis goal. The final distribution of questions is provided in Table 1.
Most of the items on the MUM were developed to assess conceptual understand-ing of the scientific portrayal of macroevolution. However, some of the items havea greater emphasis on the recognition of discrete facts, such as those associatedwith deep time. We did not view the combination of factually and conceptuallyframed items as an issue because understanding of macroevolution requires acombination of both applied facts and concepts.
We sought expert input to evaluate our instrument scenarios, item focus (factualor conceptual), and the targeted concept for each item. We distributed our first draftof the instrument to 20 evolution education experts (attending a national sympo-sium examining the issues associated with the teaching and learning of evolution),and requested their feedback. The feedback from these experts provided us withfurther verification of the content and an additional level of construct validity.On the basis of the experts’ feedback, we modified the instrument scenarios anditems. The consensus of the experts suggested that it was not necessary to modifythe general content and format of our first draft, but instead they encouraged us
UNDERSTANDING OF MACROEVOLUTION 161
TABLE 1Scenarios Used and Key Concepts of the Corresponding
Items
Scenario Key concepts
Whale evolution PhylogeneticsSpeciationDeep timeFossilsNature of science
Mollusks eyes SpeciationDeep timeFossilsSpeciationNature of sciencePhylogenetics
Lineages and extinction PhylogeneticsSpeciationDeep timeNature of scienceFossilsSpeciation
Primate evolution PhylogeneticsSpeciationDeep timeFossilsNature of science
Fossil map SpeciationFossilsNature of scienceDeep time
to clarify our scenarios and adjust the responses and distracters to the assessmentitems to clearly delineate the correct response from the alternatives.
We responded to the suggestion that we include an open-ended question toprovide an opportunity for students to freely explain some aspect of evolution.The intention for including this open-ended question was to determine whetherthose participants completing the survey could communicate a general workingknowledge of a macroevolution, specifically speciation. Further, the open-endeditem provided an additional means of validating the MUM. For our open-endedquestion, we chose to focus on speciation because it is often the most contentiousconcept related to macroevolution, but also one closely tied to microevolutionaryprocesses. The open-ended item initially asked the following: “Explain in yourwords, using an example, how new species come about.” However, after somefeedback and discussion, we changed the item to be consistent with the other

162 NADELSON AND SOUTHERLAND
scenario-based items. The open-ended question has been modified to the followingitem (see Figure 1).
Following the adjustments to the instrument, we again consulted five collegebiology faculty members for feedback. They indicated that our scenarios wereconsistent with the biology curriculum and that we had achieved an acceptablelevel of content validity and suggested no further modifications to the content orformat of the instrument (for the MUM, see the Appendix).
We piloted the instrument with four undergraduate education students, specif-ically seeking their feedback regarding clarity, grammar, and readability of theinstrument as a whole, and in particular how well they were able to comprehendthe five scenarios. We used their feedback to make grammatical and mechanicaladjustments to the text to increase instrument clarity and readability. Although allfour students confessed to a very limited understanding of evolution, the feedbackthey provided indicated that the scenarios were comprehensible and the relatedquestions were understandable. We deemed the feedback from these undergrad-uates to be sufficient for this process of the instrument development because wehad similar feedback from faculty and other educational experts familiar with theabilities of our targeted student population.
METHOD
Participants
Our field testing and analysis began with a determination of the appropriate sam-ples of undergraduate college students. Our intention was to administer our in-strument to students with a range of evolution knowledge to collect the range ofdata necessary to establish the validity and reliability of the MUM. This promptedus to identify undergraduate biology courses in which the enrolled students hadlimited knowledge of evolution because they had not studied the concept or hadtaken few, if any, college-level science courses. Similarly, we sought to identifyundergraduate biology courses in which the enrolled students would be predictedto have high levels of knowledge because they had studied evolution or takenseveral college-level biology courses. We examined the undergraduate biologycourse offerings at a large urban university and found two courses that met ourselection criteria: a first-year first-semester biology course and a capstone evolu-tionary biology course. Following a statement of commitment for cooperation byfaculty in the biology department, we requested the students in these two courses toparticipate in our study. We formed three cohorts of participants from the studentswe recruited to participate.
We recruited our Cohort 1 participants (n = 667) from a first-semester in-troductory biology course. We predicted that these participants had limited

UNDERSTANDING OF MACROEVOLUTION 163
college-level science coursework and, therefore, constrained knowledge of evolu-tion. We expected the macroevolution knowledge of our Cohort 1 participants tobe commensurate with most undergraduates entering postsecondary education.
We recruited two additional cohorts of participants from two sections of anevolutionary biology course. The prerequisite for this capstone course was at leastfour college-level biology courses (six semesters). Typically, students enrolled insuch evolutionary biology courses were nearing the completion of their under-graduate coursework and most were considering science-related careers. We wereable to recruit participants from one section in which the students were startingtheir coursework at the beginning of a semester, a group of students who we desig-nated as Cohort 2 (n = 74). The second section we recruited for participation wascomposed of students who were nearing the completion of the course at the endof a semester, a group of students who we designated as Cohort 3. Although thetwo sections had different instructors, they did use the same curricular materials,syllabus, and assessments.
For two reasons, we selected to limit our demographics measures to age, gen-der, the number of college-level science courses, and academic major. First, ourinstitutional review board guidelines required gathered demographics to minimizethe potential for the identification of specific individuals, which constrained therange of personal information data. Second, in our arrangement with the cooper-ating biology faculty, we agreed to limit our demographic questions to minimizethe time demand of our data collection. Our participants’ demographic data arepresented by cohort in Table 2.
Demographic Comparisons of Cohorts
We anticipated that the cohorts would have similar gender distributions. A chi-square analysis of gender by course confirmed that there were no significantdifferences in the proportions of male and female students between courses. Weanticipated that Cohort 1 participants who were just starting their study of biol-ogy would be significantly lower in age compared with their more experiencedpeers in the other two cohorts. An analysis of variance (ANOVA) confirmed
TABLE 2Demographic Data of the Three Study Cohorts
Male Female AgeNumber of college
science courses
Course n n M years SD years M SD
Cohort 1 256 411 19.21 2.17 0.45 0.74Cohort 2 22 55 22.23 2.27 7.69 4.50Cohort 3 16 38 23.31 4.19 10.59 5.23

164 NADELSON AND SOUTHERLAND
this prediction, revealing significant differences for age, F(2, 792) = 118.55,p < .01, with the post hoc analysis revealing the mean age of Cohort 1 participantsto be less than that of both Cohort 2 (p < .01) and Cohort 3 (p < .01) participants.It is interesting to note that the post hoc analysis also revealed a significant differ-ence in the ages of the two evolutionary biology course cohorts (p < .05). Thisis noteworthy because age was positively correlated with the number of college-level science courses, r(795) = .42, p < .01. This suggests that our participants’ages may be a proxy for contact with college-level science curriculum. This is animportant consideration because more college-level science courses could lead toincreased opportunities for engagement with evolution concepts.
In our continued analysis of demographics, we conducted an ANOVA usingcohorts as the factor and the number of college-level science courses as the depen-dent variable. Our results revealed a significant difference, F(2, 792) = 941.35,p < .01, with our post hoc analysis showing that Cohort 1 participants had sig-nificantly fewer number of college-level science courses that did Cohort 2 (p <
.01) and Cohort 3 (p < .01) participants. Our post hoc analysis also revealedthat Cohort 2 participants had significantly fewer number of college-level sciencecourses that did Cohort 3 (p < .01) participants. The number of college-levelbiology courses and age of the participants were important considerations in ourstudy because both are potentially representative of the distribution of evolutionknowledge. We sought to form a sample of undergraduate students with a range ofscience education experiences and knowledge, and our analysis of demographicssuggests we achieved our goal.
MUM Administration
We administered the MUM to the cohorts in three stages. First we administeredthe MUM to Cohort 3 participants, at the end of fall semester, in their classroom,using a paper form of the survey. All students present (n = 54) returned completedsurveys. Next, we administered the MUM to Cohort 2 participants at the begin-ning of spring semester, in their classroom, using a paper form of the instrument.Again, all students present (n = 74) returned completed surveys. We concludedour administration of the MUM with Cohort 1, at the beginning of spring semesterusing an online version of the instrument distributed through their course We-bCT site. There were approximately 850 students enrolled in this course—theactual number of students enrolled in this course fluctuated daily during ourdata collection, which took place early in the semester—and 667 completed thesurvey.
UNDERSTANDING OF MACROEVOLUTION 165
Analysis
Quantitative Analysis
We begin our data analysis with an examination of the quantitative outcomesand follow with a qualitative analysis of the responses to our open-ended item.Given that most evolution research occurs in classrooms or lab sections (Butler,2009; Demastes et al., 1995) there is a high possibility that the MUM will be usedwith homogeneous groups of students, which provided warrant for our examinationof outcome data by cohort. The cohort specific analysis provides references forhow groups of students with relatively homogeneous levels of evolution knowledgemight perform on the MUM. Thus, for our quantitative analysis, we briefly examinethe outcome data for each of our three cohorts separately and then concludewith an examination of the combined cohort data. The combined cohorts formeda composite sample that increased variability and statistical power (Crocker &Algina, 1991), both of which were necessary to support our ability to establish thevalidity and relativity of the MUM.
Once we collected the data and entered it into SPSS (version 16), we recodedthe 27 multiple-choice items as “1” for correct and “0” for incorrect, which allowedus to calculate instrument reliability and conduct our item analysis. We summedthe correct scores to form a composite score and percentage correct for eachparticipant. To determine the performance of the three cohorts and the combinedsample, we averaged the individual scores, calculated the percentage correct, andcomputed the proportion correct for each item. To determine instrument reliability,we calculated Cronbach’s alpha. Although it is appropriate to apply the Kruder-Richardson-20 (KR-20) test of reliability for dichotomous data (Gronlund, 1993),the outcome and process used in SPSS for the calculation of the KR-20 andCronbach’s alpha result in the same values.
Item Analysis
Our item and instrument reliability analysis began with a brief examinationof the outcomes for each of our three cohorts. Our examination by cohort isfollowed by analysis of the outcome for the combined sample. For our initialitem analysis, we used the percentage of correct responses for the questionsas indicators of students’ levels of understanding and the items performance.We identified those items with correct response percentages of less than or near33% correct as potentially anomalous questions warranting further examination(Nunnally & Bernstein, 1994). Although we calculated point-biserial correlationsfor each cohort, we determined this statistics was more meaningful as a gaugeof item discrimination when considered in the context of the combined sample.Therefore, we limited our item analysis of the cohorts to our percentage of correct
166 NADELSON AND SOUTHERLAND
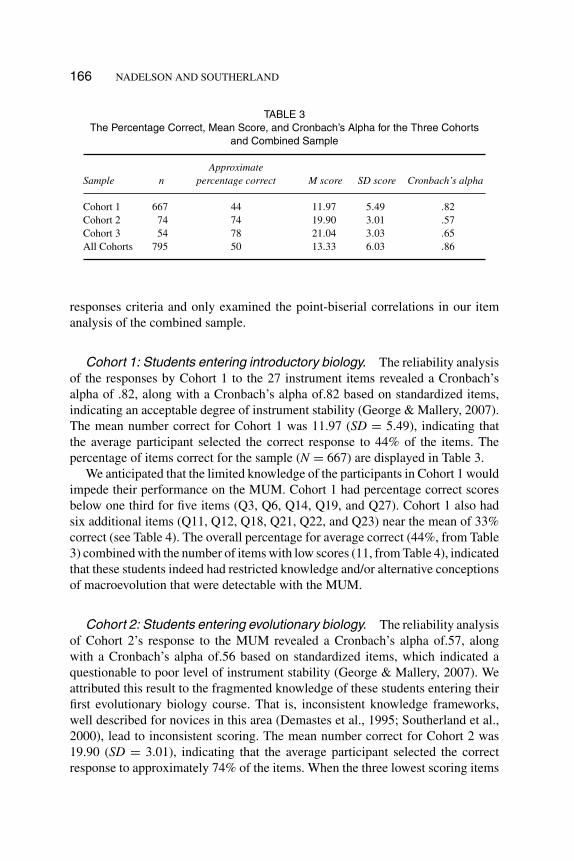
TABLE 3The Percentage Correct, Mean Score, and Cronbach’s Alpha for the Three Cohorts
and Combined Sample
Sample nApproximate
percentage correct M score SD score Cronbach’s alpha
Cohort 1 667 44 11.97 5.49 .82Cohort 2 74 74 19.90 3.01 .57Cohort 3 54 78 21.04 3.03 .65All Cohorts 795 50 13.33 6.03 .86
responses criteria and only examined the point-biserial correlations in our itemanalysis of the combined sample.
Cohort 1: Students entering introductory biology. The reliability analysisof the responses by Cohort 1 to the 27 instrument items revealed a Cronbach’salpha of .82, along with a Cronbach’s alpha of.82 based on standardized items,indicating an acceptable degree of instrument stability (George & Mallery, 2007).The mean number correct for Cohort 1 was 11.97 (SD = 5.49), indicating thatthe average participant selected the correct response to 44% of the items. Thepercentage of items correct for the sample (N = 667) are displayed in Table 3.
We anticipated that the limited knowledge of the participants in Cohort 1 wouldimpede their performance on the MUM. Cohort 1 had percentage correct scoresbelow one third for five items (Q3, Q6, Q14, Q19, and Q27). Cohort 1 also hadsix additional items (Q11, Q12, Q18, Q21, Q22, and Q23) near the mean of 33%correct (see Table 4). The overall percentage for average correct (44%, from Table3) combined with the number of items with low scores (11, from Table 4), indicatedthat these students indeed had restricted knowledge and/or alternative conceptionsof macroevolution that were detectable with the MUM.
Cohort 2: Students entering evolutionary biology. The reliability analysisof Cohort 2’s response to the MUM revealed a Cronbach’s alpha of.57, alongwith a Cronbach’s alpha of.56 based on standardized items, which indicated aquestionable to poor level of instrument stability (George & Mallery, 2007). Weattributed this result to the fragmented knowledge of these students entering theirfirst evolutionary biology course. That is, inconsistent knowledge frameworks,well described for novices in this area (Demastes et al., 1995; Southerland et al.,2000), lead to inconsistent scoring. The mean number correct for Cohort 2 was19.90 (SD = 3.01), indicating that the average participant selected the correctresponse to approximately 74% of the items. When the three lowest scoring items

UNDERSTANDING OF MACROEVOLUTION 167
TABLE 4The Percentage Correct and Point-Biserial Correlations for All Cohorts and the
Combined Sample
Percentage correctQuestionnumber Concept Cohort 1 Cohort 2 Cohort 3 All cohorts
Point-biserialcorrelation
Q1 Classification .61 .89 .98 .66 .32Q2 Speciation .50 .72 .78 .54 .34Q3 Deep time .33b .27b .31b .32b .10Q4 Fossils .68 .99 .98 .73 .51Q5 Nature of science .55 .96 .91 .62 .50Q6 Speciation .32b .45 .28b .33b .21Q7 Speciation .36a .65 .69 .41 .33Q8 Deep time .58 .95 .93 .64 .46Q9 Fossils .55 .99 .94 .62 .65
Q10 Speciation .54 .91 .96 .60 .49Q11 Nature of science .35a .82 .87 .43 .49Q12 Classification .34a .57 .74 .39a .30Q13 Classification .48 .95 .96 .56 .56Q14 Speciation .25b .39a .37a .27b .14Q15 Deep time .60 .88 .94 .65 .49Q16 Nature of science .58 .91 .96 .63 .49Q17 Fossils .42 .84 .76 .48 .46Q18 Speciation .39a .74 .85 .45 .48Q19 Classification .32b .43 .56 .35a .15Q20 Speciation .41 .84 .91 .48 .52Q21 Deep time .37a .49 .67 .40 .34Q22 Fossils .38a .70 .72 .43 .27Q23 Nature of science .34a .84 .94 .43 .57Q24 Speciation .43 .78 .91 .50 .46Q25 Fossils .60 .91 .96 .66 .54Q26 Nature of science .44 .76 .80 .49 .40Q27 Deep time .28b .31b .35a .28b .06c
aItems near 1/3 correct.bItems less than 1/3 correct.cNot Significant.
are removed from the analysis, an average of approximately 79% correct responseswere selected by the participants. The percentage of items correct for the sample(n = 74) are displayed in Table 3.
An examination of the percentage of items correct for Cohort 2 revealed threequestions (Q3, Q14, and Q27) to have a score of less than or near 33%, considerablyless than the 11 items detected with Cohort 1 (see Table 4). It is apparent that theincreased levels of biology coursework lead to increased knowledge of macroevo-lution overall, with the exception of deep time (Q3 and Q27). A discussion with

168 NADELSON AND SOUTHERLAND
the evolutionary biology instructors revealed that students have little exposure, ifany, to deep-time instruction in the biology curriculum. These students indicatedthat the history of life on Earth is rarely covered in depth in biology courses, ifat all. This explains why these more experienced participants still scored low onQ3 and Q27. For Q14, the participants selected the distractor that suggested thatthe number of species alive at any point in time is greater than in the past; theparticipants appeared to not take extinction into consideration. This is most likelybecause of a lack of knowledge about the number of known species at differenttimes and how the diversity of life decreases and increases with events such as themass extinctions and the subsequent explosions in species. We argue that theseconcepts are critical aspects of understanding the scientific portrayal of macroevo-lution and, even with the relatively low scores by these somewhat knowledgeablestudents, should be included in the MUM.
Cohort 3: Students completing evolutionary biology. The reliability anal-ysis of the responses by Cohort 3 to the 27 instrument items revealed a Cronbach’salpha of.65, along with a Cronbach’s alpha of.75 based on standardized items(see Table 3), indicating an acceptable level of instrument stability (George &Mallery, 2007). The mean number of correct responses for Cohort 3 was 21.04(SD = 3.03), indicating that the average participant selected the correct responseto approximately 78% of the items (see Table 3). When the four lowest scoringitems are removed from the analysis, an average of approximately 87% correctresponses were selected by the participants.
Our examination of the percentage of item correct calculations revealed fourquestions (Q3, Q6, Q14, and Q27) that had a mean correct score of less than ornear 33% (see Table 4). Three of these low-scoring items (Q3, Q14, and Q27) werealso detected with Cohort 2 and could be explained similarly. Further, deep-timeinstruction is largely absent from the biology curriculum in secondary schools(Dodick, 2007). Therefore, it is unlikely that undergraduate students will haveknowledge of the history of the life of Earth unless they explicitly study the content,which potentially explained the relatively low scores for Q3 and Q27. Again, therelatively low number of correct responses to Q14 may be a lack of understandingabout how the numbers of present species increases and decreases over time and alimited comprehension of population explosions and mass extinctions have takenplace over time.
Cohort 3 participants scored higher than 90% on 13 items, a score that wasfive items greater than that of Cohort 2 and 13 items greater than that of Cohort1. In addition, Cohort 3 participants scored an average of 80% correct or betteron two thirds of the items compared with about half the items for Cohort 2, andzero items for Cohort 1. Cohort 3 students were completing their course of studyof evolutionary biology, so we expected them to perform better than students
UNDERSTANDING OF MACROEVOLUTION 169
entering the course (Cohort 2) and significantly better than students beginningtheir course of study in biology (Cohort 1). Our results support the validity ofthe MUM for assessing macroevolution knowledge because the sample composedof more experienced and more knowledgeable students had significantly higherscores.
All cohorts—All students, the combined sample. We continued the eval-uation of the MUM’s performance with calculations of instrument reliability andan exanimation of item scores of the combined cohorts (N = 795). In addition tothe items scores, we also performed one more level of item analysis, the point-biserial correlation. The reliability analysis revealed a Cronbach’s alpha of.86 anda Cronbach’s alpha of.85 based on standardized items (see Table 3), indicatingthat the instrument had a good to excellent level of stability (George & Mallery,2007). The mean number of correct items for all cohorts was 13.33 (SD = 6.03),indicating that the average participant selected the correct response to approxi-mately 50% of the items (see Table 3), the same as the developmental goal for theCINS (Anderson et al., 2002). This also conforms to Gronlund’s (1993) suggestedaverage difficulty for ordinary classroom exams level to be about 50%.
For our item analysis, we again identified those items with percentage ofcorrect scores less than or near one third correct (see Table 4). This revealed sixitems: Q3, Q6, Q12, Q14, Q19, and Q27. Two of these items (Q12 and Q19)were identified as having low scores only for Cohort 1. The progressively higherscores by Cohort 2 and Cohort 3 on Q12 and Q19 indicate that performanceon the items increases with increased knowledge of biology and evolution. Wedetected low scores in all cohorts for three of the items (Q3, Q6, and Q27).Two of these items (Q3 and Q27) test knowledge of deep time, and we havepreviously discussed a possible reason for the low scores on these two items.It is interesting that such a large percentage of the participants picked the wronganswer for Q6. Most selected the distractor indicating that evolution is predictable,which makes the question a good indicator of this common misconception. Therelatively low scores on Q14 imply the students did not understand how to readthe linage diagram. However, all other questions related to the image were wellabove our one third correct evaluation criteria. An examination of the responses toQ14 indicated that the majority of participants selected the distractor suggestingthe image represents increasing number of species. As discussed previously, thissuggests that the students are not taking extinction into account and may beinferring the presence of the organisms means discernable differences in termsof physical form. The detection of different perspectives by these items justifiesretaining them as possible indicators of macroevolution knowledge.
Our analysis of the point-biserial correlations began with the determinationof the approximate critical value (α = .05) for our sample size (N = 795),
170 NADELSON AND SOUTHERLAND
which was calculated to be 0.07 (Sheskin, 2000). Using this critical value forcomparison, it is apparent that the point-biserial correlation for Q27 (r = .06)is not significant. The interpretation of the importance of the nonsignificanceof this point-biserial correlation is based on context and test philosophy. Onephilosophy of testing views point-biserial correlations as indicators of problem-atic items, contending that low values are useful for identifying faulty questionand recommend either rewording the item or eliminating it from the instru-ment (Crocker & Algina, 1986). However, an alternative philosophy of testingwould recognize that the MUM was designed to test the understanding or knowl-edge of macroevolution and not to discriminate among students, and therefore,would determine that the point-biserial values have limited importance in deter-mining item usefulness (Gronlund, 1993). Our position on the examination ofthe significance of the point-biserial correlations is a combination of these twophilosophies.
Q3 and Q27, two of our deep-time questions, had the lowest point biserial.As previously discussed, deep time is a concept that has been documented asbeing difficult for learners to grasp (Trend, 2001) and is not typically well ad-dressed in the biology curriculum. Therefore, it was not unexpected that ourparticipants communicated fragmented knowledge of the concept, which resultedin low point-biserial correlations. Yet, given the critical relation between deep timeand evolution, we feel these items are essential for measuring understanding ofmacroevolution.
For Q3, the correct answer of 50 million years was selected by about onethird of the participants. This suggests that in the context of the scenario thatthe majority of the participants did not have an understanding of the detailsof evolutionary change in relation to deep time. The geological reference inQ27 may have challenged the participants beyond their knowledge of deeptime. Q27 does necessitate the participants to infer the time required for bi-ological events on the basis of evidence of geologic events. Regardless, thegeological history of Earth is inextricably associated with the evidence forand understanding of macroevolution, a fact that strongly warrants retainingQ27.
It is interesting that Q15 and Q21 are also deep-time items with similar contextsand distractors to Q3 and Q27, but the participants performed very differently onthese questions. An examination of the responses to Q15 and Q21 in relation to thepercentage correct by cohort reveals a trend that suggests more science educationincreases understanding of the time needed for evolution to take place. A similarby not as dramatic of a trend was also apparent for Q27, which suggests that ifthe content of these questions is covered in a biology course, the students wouldperform better on the items. Therefore, we argue that the issues with Q3 and Q27are not the items, but instead the lack of coverage of the related deep-time contentin the curriculum that is exposed by these questions.
UNDERSTANDING OF MACROEVOLUTION 171
Qualitative Analysis of Our Open-Ended Question
To further evaluate the validity and consistency of the MUM, we analyzed thewritten responses of our participants to Q28. Recall that Q28 is an open-endedquestion that prompts participants to write about their understanding of speciation,a key process in macroevolution. Our goals were to assess the degree to which thequalitative assessment of student understanding of speciation was consistent withtheir overall understanding of macroevolution, as measured by the quantitativesection of the instrument.
Method of analysis. We sorted the participant (in their cohorts) by theirQ1–Q27 composite scores while retaining the relation to their response to Q28. Wethen arranged the cohort participants into three groups, one comprising those withthe lowest scores within the cohorts (lowest 20%), one comprising participantswith scores in the middle of the distribution within the cohorts (40–60%), and afinal group consisting of participants with the highest scores within each cohort(top 20%). Following the grouping, we pulled representative responses to Q28from each of the three groups from each cohort analysis. We aimed to exposetrends in the communication of conceptions, details, vocabulary, and scientificperspectives, by both cohort and scoring groups. Selected representative narrativeresponses to Q28 are reported with the corresponding cohort and the individual’squantitative score shown in parentheses.
Lowest scoring group responses. The responses to Q28 by the studentswith the lowest quantitative scores (lowest 20%) were revealed to lack detail and tobe incomplete. We determined the following responses to be representative of theparticipants in this group for each of the three cohorts (The participants’ cohortsand composite quantitative scores are provided at the end responses):
“Each frog’s ancestors lived in different climates and eventually adapted to itssurroundings.” (Cohort 1 score = 1)
“I have no idea.” (Cohort 1 score = 2)“The environment calls for different coloring in order to survive. Thus- those frogs
surviving their predators reproduced.” (Cohort 1 score = 2)“If a group of birds is separated from its population, a new species may appear
due to speciation in the new climate. For example, the group of seed eatingbirds lands on an island with nothing but clams. Only the biggest birds withlarge talons can pick up the clams and fly up and drop them to consume them.The environment selects for larger birds.” (Cohort 2 score = 13)
“New species develop when some small characteristic changes in them.” (Cohort2 score = 14)

172 NADELSON AND SOUTHERLAND
“Sometimes organisms breed in different places of earth with another organism ofdiff spp. This could be one of the reasons for a new species, also genetic drift,evo. and other factors contribute to it.” (Cohort 3 score = 10)
“Through speciation. They break off a current species. Occurs through allopatryor sympatry.” (Cohort 3 score = 18)
“3 steps—Physical isolation, genotype and phenotypic differences, reproductiveisolation.” (Cohort 3 score = 19)
The participants’ responses to the MUM qualitative question (Q28) appear tocorrespond with their quantitative scores and their experience studying biologyin college. The response stating “I have no idea” by many of the low-scoringCohort 1 participants shows their lack of a scientific perspective for the processof speciation. In addition, Cohort 1 responses such as “environment calls fordifferent coloring” revealed the presence of the misconception representative ofspecies drive for diversity.
The responses by Cohort 2 participants lacked both details and appropriatescientific vocabulary in explaining the process of speciation by natural selection.There are suggestions of a scientific perspective, but there is also communicationof the misconception that the environment can change organisms, similar to thatdetected in Cohort 1 responses.
The responses for Cohort 3 answers varied and most were not rich in detail. Yet,there was little indication of misconceptions or lack of knowledge of the processof speciation by natural selection. This was expected considering these studentshad just completed 15 weeks of an evolutionary biology course and had completedconsiderable related coursework.
Middle-scoring group responses. The participants in the middle of theircohort distributions (40–60% correct) had somewhat similar answers to their lowerscoring cohort peers, but provided more detail. Representative of those scoring inthe middle were responses such as the following:
“Different genes transfer over time.” (Cohort 1 score = 11)“Where they’re located. one might be closer to the sun so its darker and one might
be in less sunny parts so it would be lighter.” (Cohort 1 score = 11)“Many processes effect the evolutiofn of new species. Geographic separation
may play a role. Also, if an individual acquires a trait that aids him/her insurvival, this individual is more likely to be successful in reproducing andpassing on his/her genes. Famous example of evolution is Darwin’s Finches.Here the availability of different resources also aided in developing of newtraits.” (Cohort 2 score = 20)
UNDERSTANDING OF MACROEVOLUTION 173
“A group of some species of ground squirrel gets divided by some sort of habitatchange, say a mountain divides them. This mountain separates the two groupsfor such a long period and each group has its own pressures to deal with thatthere is a shift in one group that creates a new species.” (Cohort 2 score = 20)
“New species come about through several different mechanisms together such asgenetic drift, mutation, and natural selection. One example is when a naturalbarrier arises between a species, genetic drift has a large impact and the speciesbegins to diverge.” (Cohort 3 score = 21)
“New species come about when there is a change in allele frequency over time.This mutation cause different phenotypes which are probably better adaptedfor the changing environment.” (Cohort 3 score = 21)
Much similar to their lower scoring peers, these participants provided ex-planations for the speciation that were consistent with their quantitative scoresand coursework history. Given the relatively low scores of the Cohort 1 middlegroup, it was not unexpected that they would communicate restricted knowledgeof speciation similar to that of the Cohort 1 low-scoring group. Although therewas an increase in the use of scientific vocabulary in the responses, we detecteddeficiencies and naı̈ve conceptions of speciation.
Cohort 2 middle group responses were more detailed than those of their low-scoring cohort peers, but some naı̈ve perspectives persisted. The notions thatspecies create adaptations suggest that even though these participants scored rela-tively well on the quantitative part of the MUM, some continued to hold alternativeconceptions.
Much similar to their lower scoring cohort peers, Cohort 3 participants seem toprovide scientific explanations for speciation by natural selection applying vocab-ulary and processes they learned from their coursework. However, the responsesby the Cohort 3 middle group were more detailed and complete.
Top-scoring group responses. The responses by those participants scoringin the top 20% of their cohorts to Q28 reflected increased abilities to communicatescientific perspectives for the process of speciation. Representative of the top-scoring participants were passages such as the following:
“Natural selection basically. The frogs with the lighter color reproduced creatinga species of frog with a lighter color. The same thing probably happened wherepopulation B was located but there the darker color was more suited for theirenvironment.” (Cohort 1 score = 24)
“Frogs in population that have lighter coloration tend to out-survive and out-reproduce frogs with darker coloration due to camouflage from predators. So
174 NADELSON AND SOUTHERLAND
lighter frogs are naturally selected in population a. The reverse happens inpopulation b.” (Cohort 1 score = 27)
“New species are made using inter breeding of alike species ex. horses and zebra.”(Cohort 2 Score = 25)
“By allopatric/sympatric speciation. When something ‘separates’ a species . . . i.e.,continents moving, species a has now become species b + species c . . . Theyhave to adapt to new environments and eventually become a new species. It’sso complicated.” (Cohort 2 score = 25)
“New species arise from a shift in allele frequency, eventually resulting an organ-ism that is different enough or unable o mate with the original, thereby becominga new species, this can result from drift or, as well documented, at a physical di-vide, separating two populations of a species. Selection and other factors affect itas well. Take shrimp in the isthmus of Panama, for example. The divide createdtwo or more populations from an original, which started on their own evolu-tionary pathway to the point where each became its own species through the de-velopment of adaptations or other genetic/morphological/phenotypic changes.”(Cohort 3 score = 24)
“New species come about by changes in allele frequencies. When selection playson these alleles, ones that favor survival stay in existence and ones that do notbecome extinct. If a new allele confers an advantage to survival then it will befavored and may go on to yield mutated alleles that either survive or die off.”(Cohort 3 score = 25)
The responses of the top-scoring participants provided further evidence thattheir knowledge of speciation and course experience corresponded to their quan-titative scores. The responses by the top-scoring Cohort 1 participants were moredetailed and included more scientific perspectives of speciation. Although theirvocabulary was not as well developed as their more experienced peers in Cohort 2and Cohort 3, the responses by Cohort 1 participants revealed a greater level of un-derstanding of speciation compared with those of their lower scoring cohort peers.
Cohort 2 participants’ responses revealed a mixture of scientific explanationsand alternative conceptions of the process of speciation. Several of the Cohort2 responses included scientific vocabulary using terms such as allopatric andgeographic isolation. However, the passage containing the conception regardingthe interbreeding of horses and zebras indicates that a high quantitative score maystill be accompanied with alternative conceptions.
The responses by the top-scoring Cohort 3 participants reflected a scientificunderstanding of specification, which was made evident by their effective use ofexplanatory vocabulary and details in their descriptions of the process of spe-ciation. The responses certainly reflected a much greater grasp of the scientificexplanation for speciation than those of the participants in the other two cohorts,indicating the course of study for Cohort 3 increased their knowledge of evolution.

UNDERSTANDING OF MACROEVOLUTION 175
Summary. An examination of the participants’ responses to Q28 made ap-parent that the free-response item was effective at capturing the understandingof speciation by natural selection, a fundamental process in macroevolution. Theoccurrence of explanations of speciation that included scientific vocabulary, accu-rate and inaccurate details of speciation, and scientific and alternative conceptionswas not exposed through the MUM-selected response items. Our results indicatethat the open-ended item (Q28) served to confirm the quantitative aspect of theMUM as a valid assessment of macroevolution knowledge. Further, our analysisrevealed Q28 to be an effective means for triangulating student knowledge ofmacroevolution. Although Q28 provided useful qualitative insight into our partic-ipants’ understanding of evolution, it must be acknowledged that it is limited tospeciation via natural selection and does not assess students’ knowledge of otherpossible speciation mechanisms.
DISCUSSION
Macroevolution is a complex concept requiring knowledge of phylogenetics, thenature of science, deep time, speciation, and fossils. Assessing learner knowledgeof macroevolution is essential for developing and honing science curricula that areeffective in helping students develop an understanding of this fundamental aspectof biology (NAS, 2008). Extant instruments available for assessing knowledge ofevolution focus on microevolutionary concepts (Anderson et al., 2002; Settlage &Odem, 1995). Yet, as was discussed, laypeople tend to view macroevolution andmicroevolution as different processes (Alters & Alters, 2001; Gallup, 2006). Thetendency to view macroevolution and microevolution as different processes andthe lack of an instrument to assess general knowledge of macroevolution providedthe impetus for the development of the MUM.
Our goal was to develop an instrument that could effectively assess the degreeto which students’ understandings of macroevolution echoed those of biologists.We used the curricular recommendations of the AAAS (1993) and the NRC (1996)as a basis for predicting the average college or university undergraduate’s knowl-edge of macroevolution. Anticipating that an instrument measuring understandingof macroevolution would take place most effectively if concepts were assessed incontext (as is done in other similar instruments for microevolutionary processessuch as CINS), we used several scenarios each with items from the key domains.In concert with other concept inventories, we attempted to use common miscon-ceptions as distracters (Anderson et al., 2002; Hestenes, Wells, & Swackhamer,1992). However, our intention was to develop an instrument to be used to deter-mine not students’ alternative conceptions but rather their levels of knowledge.Our results revealed that participants with the most experience in biology coursesscored high, whereas the least experienced participants scored low, indicating that
176 NADELSON AND SOUTHERLAND
our instrument-development strategy led to an effective measure of understand-ing of macroevolution. Our analysis revealed that the MUM was successful atdescribing knowledge of macroevolution spanning from limited to extensive.
Our item analysis revealed all but one of the MUM multiple-choice items asstatistically effective at discriminating knowledge of macroevolution, yet we arguethat the content of this deep-time question is vital to understanding macroevolution.The integration of questions relating to the five domains throughout the instrumentincreased the range of understanding within each of the domains that could beassessed. A good example is the deep-time questions. Some of the deep-timequestions had relatively high mean scores, whereas others had the lowest meanscores. This indicates that the participants had limited or incomplete understandingof deep time. Our results support our goal in determining the MUM to being aneffective tool for exposing fragments of knowledge in relation to our five keydomains of macroevolution.
It is important to acknowledge that the MUM (similar to the CINS before it) isa reading-intensive test and should be used accordingly. We took steps to addressthe readability of the MUM, yet it could still be argued that the use of scenarios ismeasuring, among other skills, students’ reading abilities. To this critique, we agreein part, but given that this instrument is designed to measure beginning collegestudents’ knowledge of macroevolution, the literacy skills required to navigatethis instrument are no greater than those required to navigate most undergraduatecoursework. Hence, this requirement seems reasonable given the population weare targeting.
It may also be argued that the MUM assesses students’ abilities to interpretschematics such as cladograms. To this critique, we and others (Cately, 2006) agreethat cladograms can be difficult for students to interpret. However, discussions ofmacroevolution are almost commonly structured around the use of this pedagogicaltool (Baum, Smith, & Donovan, 2005). Therefore, it is difficult to foresee away in which to assess students’ knowledge of some aspects of macroevolutionwithout using the commonly used tools or illustrations used in such discussions.Further, students’ difficulty in interpreting cladograms may be reflective of theirknowledge of macroevolution; thus, we see cladograms as an ideal vehicle toevaluate the degree to which students are familiar with the scientific explanationsof macroevolution.
Limitations
Perhaps the greatest limitation to this study is the restricted population from whichthe samples were drawn. Although our final sample size was relatively large(N = 795), it was limited to undergraduate students who were studying biologyat a single university. A wider range of participants, including undergraduates nottaking science courses or graduate students, may provide additional insight intothe overall validity and reliability of the instrument.
UNDERSTANDING OF MACROEVOLUTION 177
Another potential limitation of our study is the lack of qualitative data specific tothe low-scoring items that could provide insight into why participants selected theirresponses. Although we feel justified speculating response selection on the basisof instructor comments and the literature, there may be additional explanationsthat may be revealed through additional data collection. This is an excellent ideafor future research.
Conclusion
We aimed to develop a new instrument of measuring understanding of macroevo-lution, using other concept inventories as models for design, research on under-standing of macroevolution for content, and feedback from experts for validation.The results of our analysis of the responses by the three unique cohorts indicatethat we have developed an effective instrument for measuring understanding ofmacroevolution, allowing us to meet our research objectives. We hope others willuse our instrument to determine curriculum effectiveness at achieving evolutioneducation goals, broadening the focus of evolution education past microevolution-ary processes (NAS, 1998, 2008). In addition, we hope that those who use ourinstrument will provide us with feedback as we seek to refine and increase theaccuracy of our tool for measuring understanding of macroevolution.
AUTHOR NOTES
Louis S. Nadelson is an assistant professor in the College of Education at BoiseState University. His scholarly interests include STEM education, inservice andpreservice teacher professional development, program evaluation, and multidisci-plinary research. Sherry A. Southerland is a professor and co-director of FSU-Teach program, a science and mathematics teacher education program at TheFlorida State University. In 2007 she was made a fellow of the American As-sociation for the Advancement of Science for her research into the barriers toeducational reform and describing the affective dimensions of science learning.
REFERENCES
Abd-El-Khalick, F., & Lederman, N. G. (2000). The influence of history of science courses on students’views of nature of science. Journal of Research in Science Teaching, 37, 1057–1095.
Alters, B. J. (2004). Teaching biological evolution in higher education: Methodological, religious, andnonreligious issues. Boston: Jones and Bartlett.
Alters, B. J., & Alters, S. M. (2001). Defending evolution: A guide to the creation/evolution controversy.Sudbury, MA: Jones and Bartlett.
Alters, B. J., & Nelson, C. E. (2002). Perspective: Teaching evolution in higher education. Evolution,56, 1891–1901.

178 NADELSON AND SOUTHERLAND
American Association for the Advancement of Science (AAAS). (1989). Science for all Americans.New York: Oxford University Press.
American Association for the Advancement of Science (AAAS). (1993). Benchmarks for scienceliteracy. New York: Oxford University Press.
American Association for the Advancement of Science (AAAS). (2001). Atlas of science literacy.Washington, DC: Author.
Anderson, D. L., Fisher, K. M., & Norman, G. J. (2002). Development and evaluation of the conceptualinventory of natural selection. Journal of Research in Science Teaching, 39, 952–978.
Archibald, J. D. (1996). Dinosaur extinction and the end of an era: What the fossils say. New York:Columbia University Press.
Barton, N. H., Briggs, D. E. G., Eisen, J. A., Goldsten, D. B., & Nipam, H. P. (2007). Evolution. NewYork: Cold Spring Harbor Laboratory Press.
Baum, D. A., Smith, S. D., & Donovan, S. S. (2005). The tree thinking challenge. Science, 310,979–980.
Bishop, B. A., & Anderson, C. W. (1990). Student conceptions of natural selection and its role inevolution. Journal of Research in Science Teaching, 27, 415–427.
Bull, J. J. (2000). Evolutionary biology: Technology for the 21st century. Retrieved December 21,2007, from http://www.actionbioscience.org/newfrontiers/bull.html
Butler, W. (2009). Does the nature of science influence college students’ learning of biological evolu-tion? Unpublished doctoral dissertation, Florida State University, Tallahassee, FL.
Catley, K. M. (2006). Darwin’s missing link: A novel paradigm for evolution education. ScienceEducation, 90, 767–783.
Catley, K. M., Lehrer, R., & Reiser, B. (2005). Tracing a prospective learning progression fordeveloping understanding of evolution. Paper commissioned by the National Academies Com-mittee on Test Design for K–12 Science Achievement. Retrieved February 5, 2008, fromhttp://www7.nationalacademies.org/bota/evolution.pdf
Chan, W., Leu, Y., & Chen, C. (2007). Exploring group-wise conceptual deficiencies of fractions forfifth and sixth graders in Taiwan. Journal of Experimental Education, 76, 26–57.
Cooper, R. A. (2002). Scientific knowledge of the past is possible: Confronting myths about evolution& scientific methods. American Biology Teacher, 64, 427–432.
Crocker, L., & Algina, J. (1991). Introduction to classical and modern test theory. New York: HarcourtBrace Jovanovich.
Dagher, Z. R., & Boujaoude, S. (2005). Students’ perceptions of the nature of evolutionary theory.Science Education, 89, 378–391.
Demastes-Southerland, S., Good, R., & Peebles, P. (1996). Patterns of conceptual change in evolution.Journal of Research in Science Teaching, 33(4), 407–431.
Dobzhansky, T. (1973). Nothing in biology makes sense except in the light of evolution. AmericanBiology Teacher, 35, 125–129.
Dodick, J. T. (2007). Understanding evolutionary change within the framework of geological time.McGill McGill, 42, 245–263.
Dodick, J. T., & Orion, N. (2003a). Cognitive factors affecting student understanding of geologicaltime. Journal of Research in Science Teaching, 40, 415–442.
Dodick, J. T., & Orion, N. (2003b). Measuring student understanding of “deep time.” Science Educa-tion, 87, 708–731.
Driver, R., Squires, A., Rushworth, P., & Wood-Robinson, V. (1994). Making sense of secondaryscience. New York: Routledge.
Evans, E. M. (2001). Cognitive and contextual factors in the emergence of diverse belief systems:Creation versus evolution. Cognitive Psychology, 42, 217–266.
Ferrari, M., & Chi, M. T. H. (1998). The nature of naive explanations of natural selection. InternationalJournal of Science Education, 20, 1231–1256.

UNDERSTANDING OF MACROEVOLUTION 179
Freeman, S., & Herron, J. C. (2007). Evolutionary analysis. Upper Saddle River, NJ: Pearson PrenticeHall.
Futuyma, D. J. (2002). Natural selection: How evolution works. Retrieved February 5, 2008, fromhttp://www.actionbioscience.org/evolution/futuyma.html
Futuyma, D. J. (2005). Evolution. Sunderland, MA: Sinauer Associates.Gallup, G. (2006). Evolution, creationism, and intelligent design. Retrieved October 29, 2006, from
http://institution.gallup.com.ezproxy2.library.unlv.edu/content/?ci = 21814George, D., & Mallery, P. (2007). SPSS for Windows step by step: A simple guide and reference. 15.0
update (8th ed.). Boston: Allyn & Bacon.Gould, S. J. (2002). The structure of evolutionary theory. Cambridge, MA: Harvard University Press.Gronlund, N. E. (1993). How to make achievement tests and assessments (5th ed.). Boston: Allyn &
Bacon.Hendry, A. P., & Kinnison, M. T. (2001). An introduction to microevolution: Rate, pattern, process.
Genetica, 112–113, 1–8.Hestenes, D., Wells, M., & Swackhamer, G. (1992). Force Concept Inventory. The Physics Teacher,
30, 141–158.Johnson, P. (2005). The development of children’s concept of a substance: A longitudinal study of
interaction between curriculum and learning. Research in Science Education, 35, 41–61.Kazelskis, R., Reeves, C., Kersh, M., Bailey, G., Cole, K., Larmon, M., et al. (2000). Mathematics
anxiety and test anxiety: Separate constructs? The Journal of Experimental Education, 68, 137–146.Libarkin, J. C., & Anderson, S. W. (2005). Assessment of learning in entry-level geoscience courses:
Results from the geoscience concept inventory. Journal of Geoscience Education, 53, 394–401.Mazur, A. (2004). Believers and disbelievers in evolution. Politics and the Life Sciences, 23, 55–61.McComas, W. F. (2006). Investigating evolutionary biology in the laboratory. Dubuque, WI:
Kendall/Hunt.McComas, W. F., & Olson, J. K. (1998). The nature of science in international science education
standards documents. In W. F. McComas (Ed.), The nature of science in science education rationalesand strategies (pp. 41–52). Boston: Kluwer Academic Publishers.
Miller, K. R. (1999). Finding Darwin’s God: A scientist’s search for common ground between Godand evolution. New York: Cliff Street Books/HarperCollins.
Miller, K. R. (2008). Only a theory: Evolution and the battle for America’s soul. New York: Penguin.Nadelson, L. S., & Sinatra, G. M. (2009). Educational professionals understanding and acceptance of
evolution. Journal of Evolutionary Psychology, 7(4), 490–516.National Academy of Sciences (NAS). (1998). Teaching about evolution and the nature of science.
Washington, DC: National Academy Press.National Academy of Sciences (NAS). (2008). Science, evolution, and creationism. Washington, DC:
National Academy Press.National Research Council (NRC). (1996). National science education standards. Washington, DC:
National Academy Press.Nunnally, J. C., & Bernstein, I. H. (1994). Psychometric theory. New York: McGraw-Hill.Pigliucci, M. (2005). Evolution’s importance to society: Interview with Massimo Pigliucci. Retrieved
December 21, 2007, from http://www.actionbioscience.org/evolution/pigliucci.htmlPigliucci, M., & Kaplan, J. (2006). Making sense of evolution: The conceptual foundations of evolu-
tionary biology. Chicago: University of Chicago Press.Rutledge, M. L., & Warden, M. A. (1999). The development and validation of the Measure of Accep-
tance of the Theory of Evolution instrument. School Science and Mathematics, 99(1), 13–18.Sadler, T. D. (2005). Evolutionary theory as a guide to socioscientific decision-making. Journal of
Biological Education, 39, 68–72.Scharmann, L. C., Smith, M. U., James, M. C., & Jensen, M. (2005). Explicit reflective nature of
science instruction: Evolution, intelligent design, and umbrellaology. Journal of Science TeacherEducation, 16, 27–41.
180 NADELSON AND SOUTHERLAND
Scott, E. C. (2004). Evolution vs. creationism: An introduction. Berkeley, CA: University of CaliforniaPress.
Settlage, J., & Odom, A. L. (1995, April). Natural selection conceptions assessment: Development ofthe two-tier test “Understanding Biological Change.” Paper presented at the National Associationof Research in Science Teaching Annual Meeting, San Francisco, CA.
Sheskin, D. J. (2000). Handbook of parametric and nonparametric statistical proceedures. London:Chapman & Hall.
Simons, A. M. (2002). The continuity of microevolution and macroevolution. Journal of EvolutionaryBiology, 15, 688–701.
Sinatra, G. M., Brem, S. K., & Evans, E. M. (2008). Changing minds? Implications of conceptualchange for teaching and learning about biological evolution. Evolution: Education and Outreach,1(2), 189–195.
Sinatra, G. M., Southerland, S. A., McConaughy, F., & Demastes, J. (2003). Intentions and beliefsin students’ understanding and acceptance of biological evolution. Journal of Research in ScienceTeaching, 40, 510–528.
Smith, M. U. (2009). Are we there yet? Current status of research in teaching and learningevolution. Science & Education. Retrieved November 18, 2009, from http://www.springerlink.com/content/a70110770r45h281/
Southerland, S. A., Abrams, E., Cummins, C. L., & Anzelmo, J. (2001). Understanding students’explanations of biological phenomena: Conceptual frameworks or P-prims? Science Education, 85,328–348.
Tanner, K., & Allen, D. (2005). Approaches to biology teaching and learning: Understanding thewrong answers—Teaching toward conceptual change. Cell Biology Education, 4, 112–117.
Trend, R. D. (1998). An investigation into understanding of geological time among 10- and 11-year-oldchildren. International Journal of Science Education, 20, 973–988.
Trend, R. D. (2001). Deep time framework: A preliminary study of U.K. primary teachers’ conceptionsof geological time and perceptions of geosciences. Journal of Research in Science Teaching, 38,191–221.
Zaim-Idrissi, K., Desautels, J., & Larochelle, M. (1993). “The map is the territory!” The viewpoints ofbiology students on the theory of evolution. Alberta Journal of Educational Research, 39, 59–72.
APPENDIX
Measure of Understanding of Macroevolution (MUM)
Directions: Read each of the passages. Select the best option for each of theassociated items that follow.
Questions 1–6: Consider the figure and passage below and answer thequestions that follow.
Consider the proposed evolutionary tree below. Mammals originated on land,yet whales are adapted to life in the sea and can never come onto the land.The exact process of how land animals evolved into whales has been difficultto understand. However, new discoveries in India, Afghanistan and Pakistan areproviding evidence for the transition of the whale family from ancient shore-dwelling ancestors.

UNDERSTANDING OF MACROEVOLUTION 181
FIGURE 1 The evolutionary tree of some mammals.
1. The whales are classified with a group of mammals which are called even-toed ungulates. Whales have been classified as part of this group along withtheir closest relative the hippopotamus because:
a. Whales and hippos are big, heavy, and have round bodies with largemouths.
b. ∗Whales and hippos share a more recent common ancestor.c. Whales and hippos have similar diets and need to live in water.d. Whales and hippos display similar social and parenting behaviors.
2. The chart above suggests that:a. The animals in this classification tree have four legs.b. Baleen Whales are not related to camels.c. Whales are more closely related to giraffes than to bison.d. ∗Whales are more closely related to deer than to pigs.
3. According to evolutionary theory, whales have evolved from land animalancestors over time. How much time do you think the evolution processmight have taken?a. ∗Fifty million years.b. Five million years.

182 NADELSON AND SOUTHERLAND
c. Five hundred thousand years.d. Five hundred million years.
4. The fossils that are being examined to determine the ancestor in theevolutionary pathway of whales have been found in areas of Pakistan,Afghanistan, and India, places that are now well above sea level. The mostscientifically reasonable explanation for the location of the fossils beingexamined is:a. Predators of whale ancestors carried their prey to this area to eat them.b. When the whales died their skeletons floated to the top of the ocean
where they drifted ashore and became fossils.c. ∗This area was most likely once covered with water and the shore
dwelling ancestors of whales once lived in these areas, died, and theirskeletons were fossilized.
d. The great meteor impact caused tidal wave that forced these animalsinto these areas trapping them causing them to die, and their skeletonswere fossilized.
5. The evolutionary history and development of whales has been hotly debated.Recently there has been a major shift in our understanding of the processesused to detail whale evolution. This indicates that:a. Gaps in the fossil records will never allow us to fully understand evo-
lution.b. Scientists studying evolution typically present ideas with very little
evidence, leaving it to others to find proof of their ideas.c. ∗Aspects of evolution are constantly being challenged and explored in
light of new evidence.d. Much of the science of evolution is based on speculation that can easily
be changed when scientists think of new ideas.6. The origins of the transformation from land animal to sea creature may be
observed among some wild sheep who have lived on the coast for hundredsof years. These sheep like to eat seaweed and kelp so much that they areoften observed swimming into the water to eat it. If we returned millions ofyears later to observe these animals, what might you see?a. Sheep who wanted to be better swimmers and so developed the ability
to swim great distanced to eat kelp.b. Two distinct but related sheep like organisms, one that lives in the water
and eats kelp, the other lives on land and eats plants.c. These sheep will become extinct because they will not be able to find
other food and only their fossil will remain.d. ∗There are so many possible outcomes that there is really no way to
predict what will be seen.

UNDERSTANDING OF MACROEVOLUTION 183
FIGURE 2 The different levels of eye complexity in mollusks.
Questions 7–12: Consider the two figures and passage below and answerthe questions that follow.
The evolution of the eye has been studied extensively. It is a good example ofan organ that at present has a wide range of forms in a wide variety of species(see Figure 2). Most experts think that all modern eyes have their origins datingback some 540 million years. An examination of the density of photoreceptors ofthe pigment cup and the complex eye reveal a variation within species as well asbetween species. The plots of the relative density of photoreceptors of the presentday Nautilus and Octopus are presented in Figure 3.
FIGURE 3 Variation in the relative density of photoreceptors in nautilus and octopus eyes.

184 NADELSON AND SOUTHERLAND
7. In the evolution of the molluscan eye, it is apparent that some fundamentalcharacteristics are retained. This supports the idea that:a. ∗The organisms displaying these fundamental characteristics all
have descended from an ancestor who most likely also hadeyes.
b. These are the only features that are effective for sight and thereforeanimals want to keep them so that they can see.
c. Eyes are essential for survival of species so organisms and struggleand work to retain these features.
d. Mollusk eyes have such similar features to all other seeing ma-rine organisms that none of these eyes could have developedindependently.
8. Some speculate that the eye is too complex to have resulted from evo-lution. Yet, evidence suggests organisms may have had eyes for nearly500 million years. What might scientists infer about the eyes of ancientorganisms?a. Only animals living in the bright sunlight develop eyes because they
need them and use them.b. Eyes would bear no resemblance to how eyes are structured today,
and would not be recognized as eyes.c. ∗The eyes of ancient organisms would have some characteristics that
are similar to eye found in organisms alive today.d. Only animals with bones would really be trying to develop useful
eyes.9. Most vertebrate fossils are the bones of these ancient organisms, and it is
unlikely that we will find fossils of their eyes. This is because:a. Animals close their eyes when they die and the eyes are buried under
layers of fossils.b. Primitive eyes were so small that they are easily overlooked as fossils.c. Primitive eyes were so different that scientists are not looking for the
right structures.d. ∗Eye tissue typically decays before it can form fossils.
10. There is a variation in the number and density of photoreceptors in theeyes (see Figure 3) within a population. This is an important considerationwhen trying to understand evolution because:a. Some individuals in a population are trying harder to see better than
others.b. ∗The variation in eye structure within a population can lead to the
development of new eye structures.c. There are variations happening within all populations and they have
no evolutionary significance.d. Variations indicate a species is no longer evolving but now stabilized.

UNDERSTANDING OF MACROEVOLUTION 185
11. Evidence for the evolution of the eye is based primarily on the observationsof organisms alive today. This means:a. Since present day animals have all developed very complex eyes,
useful inferences about changes in primitive eyes are very difficult tomake.
b. Scientists must assume that the eyes of organisms today are the sameas their extinct ancestors.
c. Eyes are a recent development, evolutionarily speaking, and scien-tist cannot understand the structure of the eyes in the past based onevidence of eyes today.
d. ∗The structure of the eyes in some organisms today support scientists’views of how eyes developed over time.
12. Different organisms are classified based on similar functions and forms.All of the eyes above in Figure 2 are from a group of animals referred toas mollusks. Yet, the eyes of these three species of organisms do not seemto be very similar in structure, which suggests that classification of theseorganisms has been based on evidence that indicates:a. ∗They can be traced back to a common ancestor that had a primitive
eye.b. That they all live in a similar location and need eyes that allow them
to see in the water.c. They want to be able to see in the water to catch prey and avoid
predators.d. Mollusks’ eyes are not considered when grouping these organisms
together.
Questions 13–18: Consider the figure and passage below and answer thequestions that follow.
Extinction is extremely important in the history of life. It can be a frequent orrare event within a lineage. Every lineage has some chance of becoming extinct.Over 99% of the species that have ever lived on Earth have gone extinct. Thisdiagram illustrates the evolution lineages of several animal species.
13. The diagram above indicates that all of the organisms originated from thesame:a. Kingdom.b. Relatives.c. Location on the planet.d. ∗Ancestor.
14. If each of the vertical lines in the diagram above represents a lineage, whatis being shown about the number of living species present over time?a. ∗Increases and decreases in the number of species present over time.

186 NADELSON AND SOUTHERLAND
FIGURE 4 The historical development of the lineages of several animal species.
b. Constantly diversified into a increased number of species with differ-ent body forms.
c. Mostly remained unchanged and stable and have experience littlechange over time.
d. Constant, yet gradual, decrease in number of species and body forms.15. The branching of the animal species as displayed above would happen:
a. Everyday.b. ∗Over relatively long periods of time—millions of years.c. Occur within a few generations.d. Within the life span of an organism.
16. The formation of branching diagrams like the one presented above is basedon:a. Common names of the organisms.b. ∗Genes and body structures.c. Habitat in which modern organisms are now naturally found.d. Elevation and location in which the ancient fossils were discovered.
17. A number of lineages in the diagram terminate prior to the top of the tree.This indicates that these species are now extinct. Our awareness of theirexistence is based on fossils and this suggests that they:a. ∗Were organisms with bones, exoskeletons, or left impressions.b. All had similar life cycles because they are all present in the fossil
record.c. Were thought to be primarily prey killed off by the surviving predators.d. Died in locations in which there was no more food.

UNDERSTANDING OF MACROEVOLUTION 187
FIGURE 5 A hypothesized evolutionary lineages of the African Great Apes.
18. The branching in the diagram above indicates the development of severalnew species. When new species arise:a. New species immediately appear different and that is why the branch
is created.b. The original species will no long have the need or desire to evolve.c. The original species will soon become extinct because the new species
is better adapted to the environment.d. ∗New species have characteristics that are similar to the original
species.
Questions 19–23: Consider the figure and passage below and answer thequestions that follow.
The graphic below is a suggested evolutionary pathway of the African GreatApes. The arrangement of this pathway is based on genetic information taken fromthe mitochondria of the various apes.
19. The diagram above suggests that:a. Gibbons and Orangutans are more closely related than Gibbons and
Humans.b. Humans are much more complex than the other apes.

188 NADELSON AND SOUTHERLAND
c. ∗Humans and Chimpanzees are the most closely related of all theGreat Apes.
d. Gibbons are unrelated to Humans.20. The diagram above suggests that:
a. Orangutans include the most recently evolved species and Gibbonsare the most ancient species of apes.
b. There has always been at least 5 species of Great Apes.c. Gorillas represent the most diverse of the different groups of Great
Apes.d. ∗Humans and Chimpanzees share a more recent common ancestor
than Gibbons and Orangutans.21. The African Great Apes are theorized to have evolved from a common
ancestor. Given that this process took place over time, how much timedo you think the process of evolution in this group of organisms mighttake?a. ∗Thirty million years.b. Three billion years.c. Thirty thousand years.d. Three million years.
22. The fossil record for early humans is very sparse compared to many otherorganisms. In the context of the Great Ape tree this means:a. Much of the evolutionary relationships of humans and the other Great
Apes is opinion and based on guess.b. ∗Analysis of genetic codes and anatomy are used to derive such rela-
tionships.c. The evolutionary relationships of humans are relative easy to deter-
mine based on the wide variety of humans alive today.d. Humans have not undergone many evolutionary changes and remain
at the top of the tree.23. In advanced discussions of the evolution of the Great Apes, one will see
a number of different evolutionary pathways, each suggesting a differentrelationship between the different groups of Apes. These discrepanciessuggest:a. Scientists remain uncertain if any of the Great Apes are really related
and are continuing to try to prove this.b. Scientists remain uncertain why humans would want to evolve and
are continued to be seen as the superior species.c. Anything aside from fossils is a weak form of evidence for the support
of evolutionary theory.d. ∗Processes and small differences in methods can produce very differ-
ent evidence that can be interpreted in different ways.
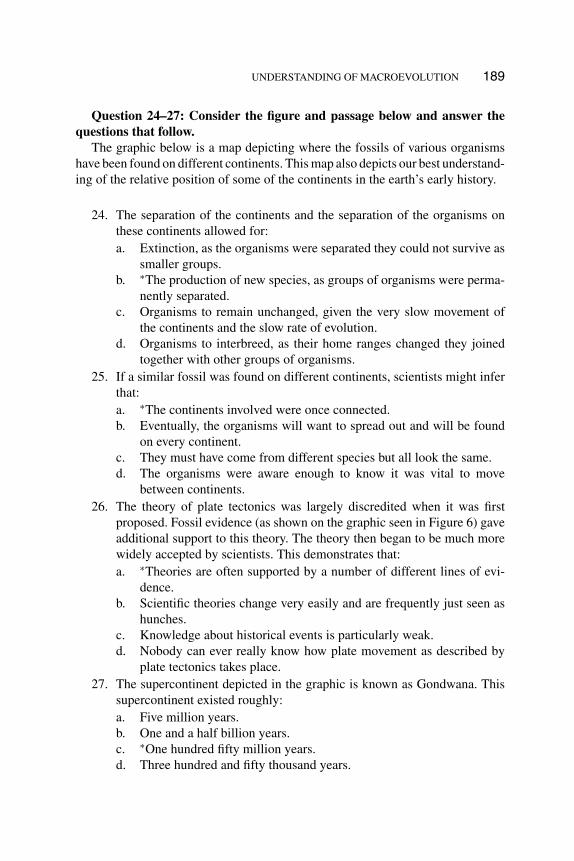
UNDERSTANDING OF MACROEVOLUTION 189
Question 24–27: Consider the figure and passage below and answer thequestions that follow.
The graphic below is a map depicting where the fossils of various organismshave been found on different continents. This map also depicts our best understand-ing of the relative position of some of the continents in the earth’s early history.
24. The separation of the continents and the separation of the organisms onthese continents allowed for:a. Extinction, as the organisms were separated they could not survive as
smaller groups.b. ∗The production of new species, as groups of organisms were perma-
nently separated.c. Organisms to remain unchanged, given the very slow movement of
the continents and the slow rate of evolution.d. Organisms to interbreed, as their home ranges changed they joined
together with other groups of organisms.25. If a similar fossil was found on different continents, scientists might infer
that:a. ∗The continents involved were once connected.b. Eventually, the organisms will want to spread out and will be found
on every continent.c. They must have come from different species but all look the same.d. The organisms were aware enough to know it was vital to move
between continents.26. The theory of plate tectonics was largely discredited when it was first
proposed. Fossil evidence (as shown on the graphic seen in Figure 6) gaveadditional support to this theory. The theory then began to be much morewidely accepted by scientists. This demonstrates that:a. ∗Theories are often supported by a number of different lines of evi-
dence.b. Scientific theories change very easily and are frequently just seen as
hunches.c. Knowledge about historical events is particularly weak.d. Nobody can ever really know how plate movement as described by
plate tectonics takes place.27. The supercontinent depicted in the graphic is known as Gondwana. This
supercontinent existed roughly:a. Five million years.b. One and a half billion years.c. ∗One hundred fifty million years.d. Three hundred and fifty thousand years.

190 NADELSON AND SOUTHERLAND
FIGURE 6 The distribution of fossils for 4 species across today’s continents. The map showshow the continents may have once been located.
28. Explain in as much detail as possible how the single species of frog foundin the graphic on the left could give rise to the two species of frog foundin the graphic on the right.
FIGURE 7 Frog ancestor related to two frogs from two different and distirct populations.