Gross Domestic Product (Third Quarter 2000) 本地生產總值 ...
41
這份刊物的 PDF 版本的文字是從印刷版掃描而成,再利用光學字符識別軟 件轉換成電子格式。由於原印刷版本已印製並保存多年,光學字符識別技 術未必能準確地識別某些文字或數字。因此,搜索或複製此 PDF 檔案內的 文字時應加以注意。 The text of this PDF publication was scanned from its printed version and then converted to electronic text using Optical Character Recognition (OCR) software. Because of the age and condition of the original printed copy, the OCR may not recognise certain characters or figures accurately. Caution should therefore be taken when searching or copying text from this PDF publication.
-
Upload
khangminh22 -
Category
Documents
-
view
0 -
download
0
Transcript of Gross Domestic Product (Third Quarter 2000) 本地生產總值 ...

這份刊物的 PDF 版本的文字是從印刷版掃描而成,再利用光學字符識別軟
件轉換成電子格式。由於原印刷版本已印製並保存多年,光學字符識別技
術未必能準確地識別某些文字或數字。因此,搜索或複製此 PDF 檔案內的
文字時應加以注意。 The text of this PDF publication was scanned from its printed version and then converted to electronic text using Optical Character Recognition (OCR) software. Because of the age and condition of the original printed copy, the OCR may not recognise certain characters or figures accurately. Caution should therefore be taken when searching or copying text from this PDF publication.

本地生產總值Gross Domestic Product
二零零零年第三季
運動中華人民共和國香港特別行政區政府統計處
Census and Statistics Department Hong Kong Special Administrative Region
People’s Republic of China

,_
本地生產總值
Gross Domestic Product
二零零零年第三季
Third Quarter 2000
有關以開支面鋪製的本地生產總值的查詢,請聯絡政府統計盧國民收入統計科(-)
地址:香港灣仔港灣道 12 號灣仔政府大樓 22 樓
電話: (852) 2582 5077
圖文傳真: (852) 2802 1192
電子郵遞: nil 1 _ [email protected]
Enquiries on Expenditure-based GDP can be directed to the National Income Branch (1)。f the Census and Statistics Department
Address: 22瓜, Wanchai Tower, 12 Harbour Road, Wan Ch訟, Hong Kong. Tel No. : (852) 2582 5077 Fax. No. : (852) 2802 1192
E-mail: [email protected]
有關以生產面鋪製的本地生產總值的查詢,請聯絡政府統計盧國民駛入統計科(二)
地址:九龍新蒲崗太子道東 698 號寶光商業中心 l O 樓 1006 室
電話: (852) 2116 5115
圖文傳真:(852) 2116 0370
電子郵遞: ni21_1@cens包.td.gov.hk
Enquiries on Production-based GDP can be directed to the National Income Branch (2)。f the Census and Statistics Department
Address : Unit 1006, 10瓜, Stelux House, 698 Prince Edward Road East, San Po Kong, Kowloon. Tel No. : (852) 2116 日的 Fax. No. : (852) 2116 0370
E-mail: ni21一l@censta世.gov.bk
有閱本地居民生產總值的查詢,請聯絡政府統計處國際收支平街統計科(二)
地址:九龍新蒲崗太子道東 698 號寶光商業中心 11 樓 1103 至 1106 室
電話:(852) 2116 5150
圖文傳真:(852) 2116 0370
電子郵遞: [email protected]
Enquiries on GNP can be directed to the Balance of Payments Branch (2)。f the Census and Statistics Department
Address : Unit 1103-11師, 11辰, Stelux House, 698 Prince Edward Road East, San Po Kong, Kowloon. Tel No. : (852) 2116 5150 Fax. No. : (852) 2116 0370
E-mail : bop21_2@cens他.td.gov.hk
政府統計處網站 Website of the Census and Statistics Department
ht甲://www.info.gov.hk/censtatd/

目錄
1. 概混
2. 以開支面搧製的本地生產總值
表一本地生產總值,按人口平均計算的本地生產總值及本地生產總值內含平減物價指數,一
九九零年至二零零零年第三季
表二經季節性調整的本地生產總值(以固定(一九九零年)市價計算)及內含平減物價指數,
一九九一年第一季至二零零零年第三季-與對上季度比較的變動百分率.
表三各組成部分在本地生產總值的按年實質變動百分率中所估的比率,一九九零年至二零零
零年第三季
表四按主要組成部分劃分的本地生產總值,一九
九零年至二零零零年第三季(甲) 以當時市價計算
(乙) 以價值計算的按年變動百分率(丙) 以固定(一九九零年)市價計算
(丁) 以實質計算的按年變動百分率
表五按食品、消費品及服務劃分的私人消費開
支,一九九零年至二零零零年第三季
(甲) 以當時市價計算
(乙) 以價值計算的按年變動百分率(丙) 以固定(一九九零年)市價計算
(丁) 以實質計算的按年變動百分率
表六按組成部分劃分的本地固定資本形成總額,一九九零年至二零零零年第三季(甲) 以當時市價計算
(乙) 以價值計算的按年變動百分率(丙) 以固定(一九九零年)市價計算
(了) 以實質計算的按年變動百分率
表七貨物出口及進口與服務輸出及輸入,一九九零年至二零零零年第三季(甲) 以當時市價計算
(乙) 以價值計算的按年變動百分率(丙) 以固定(一九九零年)市價計算
(丁) 以實質計算的按年變動百分率
3. 以生產面編製的本地生產總值
表八按經濟活動劃分的本地生產總值(以當時價格
計算),一九八零年至一九九九年
表九選定經濟活動的增加價值(以當時價格計
算),一九八零年至一九九八年
Contents
General Observations
Expenditure-based GDP
Table 1 GDP, per capi個 GDP and implicit price deflator of GDP, 1990 to 也irdqu訂ter2000
Table 2 Seasonally adjusted GDP ( at cons組nt (1990) market prices ) and implicit price deflator, first qu訂ter 1991 to 也irdqu訂ter2000- Percentage change over the preceding qu訂ter-
Table 3 Component contributions to ye訂﹒on-y臼rrate of change 訟 real terms of GDP, 1990 to 也ird
qu訂ter2000
Table 4 GDP by major component, 1990 t。由irdqu訂ter
2000 (吋 At current market prices (b) Ye訂-on明訂percentage changes in value terms ( c) At constant (1990) market prices (d) Ye訂﹒on-ye訂 percentage changes in real terms
Table 5 Private consumption expendi何時 on food, consumer goods and services, 1990 to third qu訂ter2000
(a) At current market prices (b) Ye訂﹒on-ye訂戶rcentage changes 姐 value terms (c) At cons阻t (1990) market prices (e) Ye訂﹒on-ye訂 percentage changes in real terms
Table 6 Gross domestic fixed capital formation by component, 1990 to third qu訂ter2000
(a) At current market prices (b) Ye訂-on明前percentage changes in value terms ( c) At constant (1990) market prices (d) Year-on明訂percentage changes in real terms
Table 7 Exports and imports of goods and services, 1990 to third qu訂ter 2000
(a) At current market prices (b) Year-on-year percentage changes in value terms (c) At constant (1990) market prices (d) Ye訂叫啊訂percen個ge changes 函 real terms
Production-based GDP
Table 8 GDP at current prices by economic activity, 1980 - 1999
Table 9 Value added at current prices for selected economic activities, 1980 - 1998
頁數
Page
3
5
5
6
7
。onyhυti
z
且,
i
2345 1A1
.a ... s1EA
fO司Joany
---A
’,a&唔,-A
’..
nu--
7M司3
7H弓血勻缸勻,B
24
24
26

4. 本地居民生產總值
表十 本地居民生產總值、按人口平均計算的本地居民生產總值及本地居民可支配總收
入,一九九三年至二零零零年第二季
表十一按收益組成部分的對外要素收益流動以當時市價計算,一九九七年至二零零零年第
二季
表十二以一九九零為基年計算的實質本地總收
入、實質本地居民總收入及以固定(一九九零年)市價計算的本地居民生產總值,
一九九三年至二零零零年第二季
5. 詮釋
Gross National Product
Table 10 Gross National Product (GNP), per capita GNP and Gross National Disposable Income (GNDI), 1993 to second qu訂ter2000
Table 11 External Factor Income Flows (EFIF) by income component at current market prices, 1997 to second quarter 2000
Table 12 Real Gross Domestic Income (1990-based), Real Gross National Income (1990-based) and Gross National Product at constant (1990) market prices, 1993 to second qu訂ter2000
Explanatory Notes
2
27
28
29
30
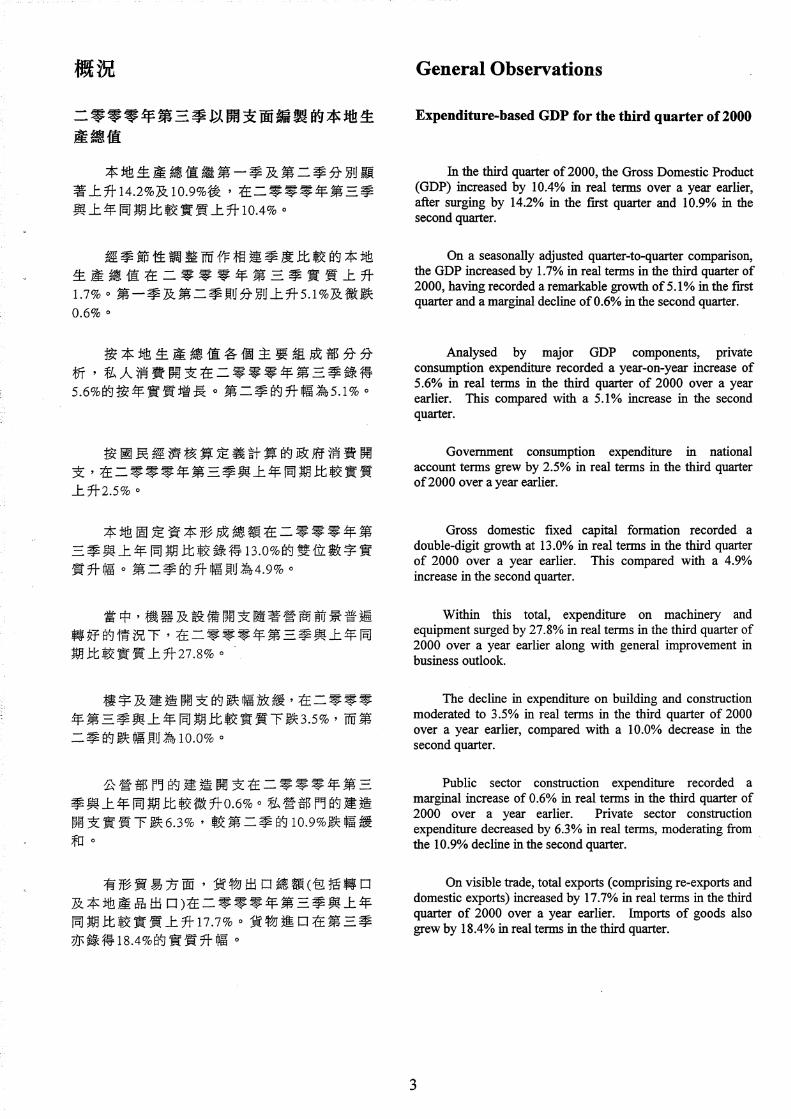
概況
二零零零年第三季以開支面編製的本地生
產總值
本地生產總值繼第一季及第二季分別顯
著上升14.2%及 10.9%後,在二零零零年第三季
與上年同期比較實質上升10.4% 。
經季節性調整而作相連季度比較的本地
生產總值在二零零零年第三季實質上升
1.79忘。第一季及第二季則分別上升5.1%及微跌
0.6% 。
按本地生產總值各個主要組成部分分
析,私人消費開支在二零零零年第三季錄得
5.6%的按年實質增長。第二季的升幅為5.1% 。
按國民經濟核算定義計算的政府消費開
支,在二零零零年第三季與上年同期比較實質
上升2.5% 。
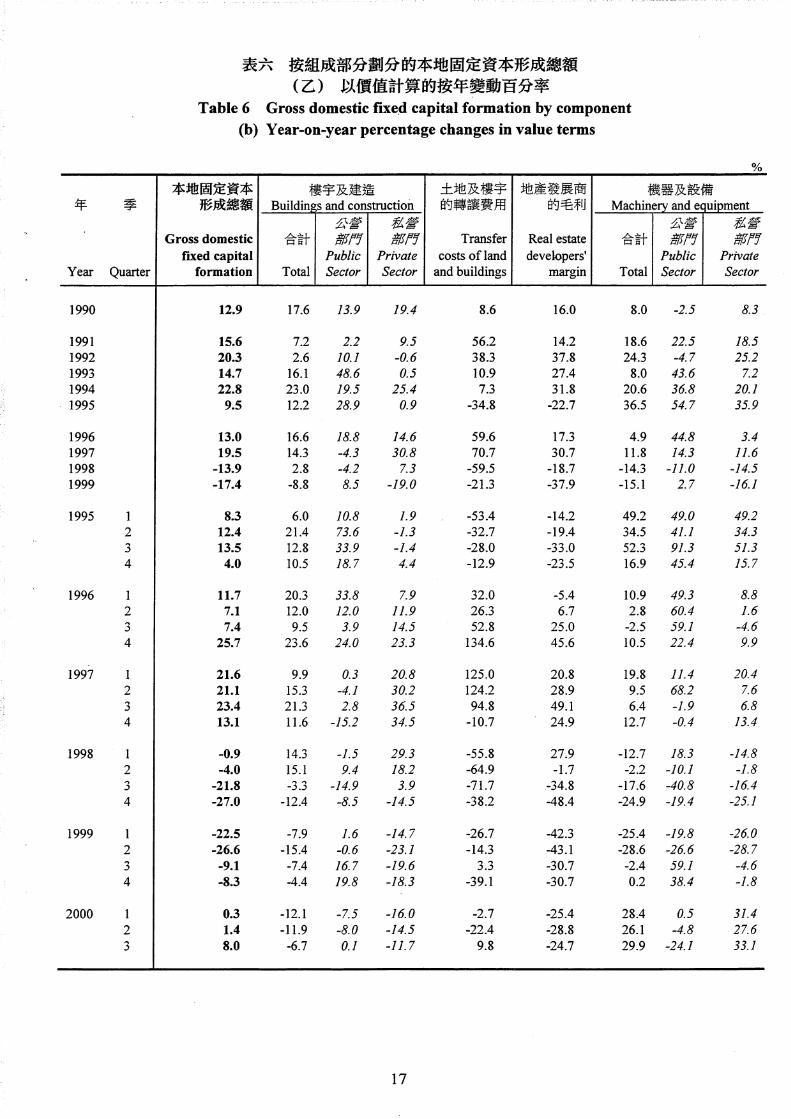
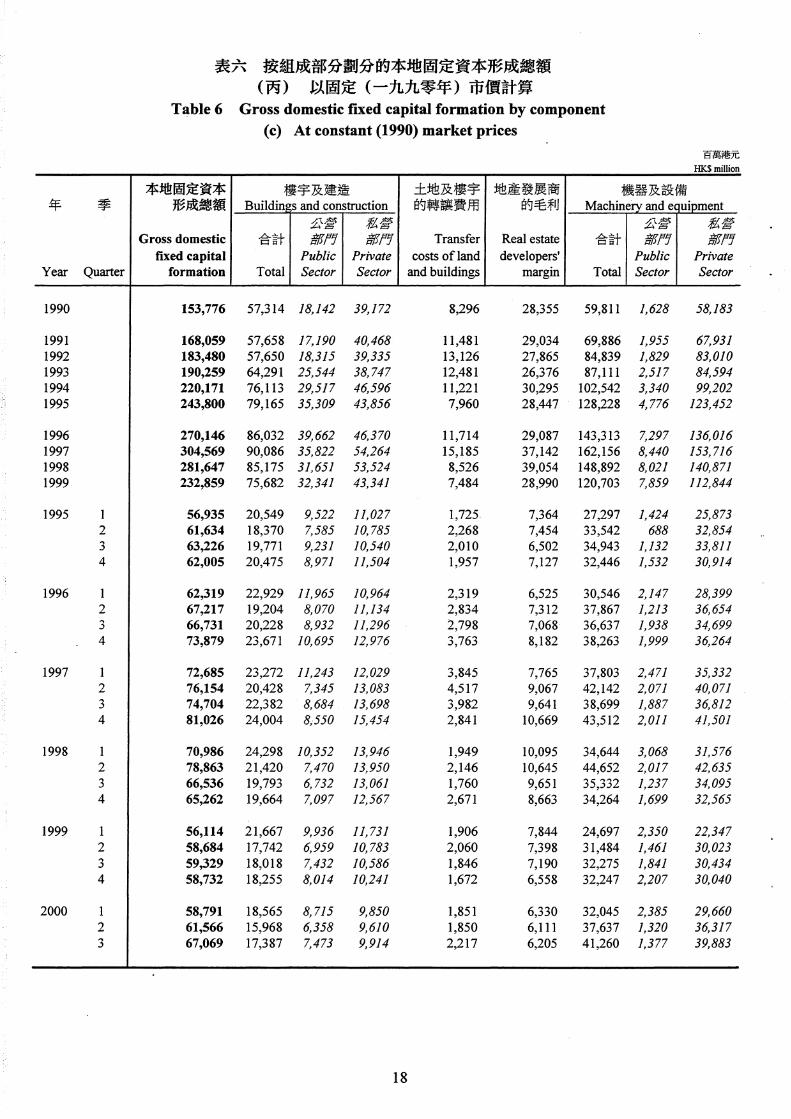
本地固定資本形成總額在二零零零年第
三季與上年同期比較錄得 13.0%的雙位數字實
質升幅。第二季的升幅則為4.9% 。
當中,機器及設備開支隨著營商前景普遍
轉好的情況下,在二零零零年第三季與上年同
期比較實質上升27.8% 。
樓宇及建造開支的跌幅放搓,在二零零零
年第三季與上年同期比較實質下跌3.59忌,而第
二季的跌幅則為 10.0% 。
公營部門的建造開支在二零零零年第三
季與上年同期比較微升0.6% 。私營部門的建造
開支實質下跌6.39忘,較第二季的 10.9%跌幅艦
和。
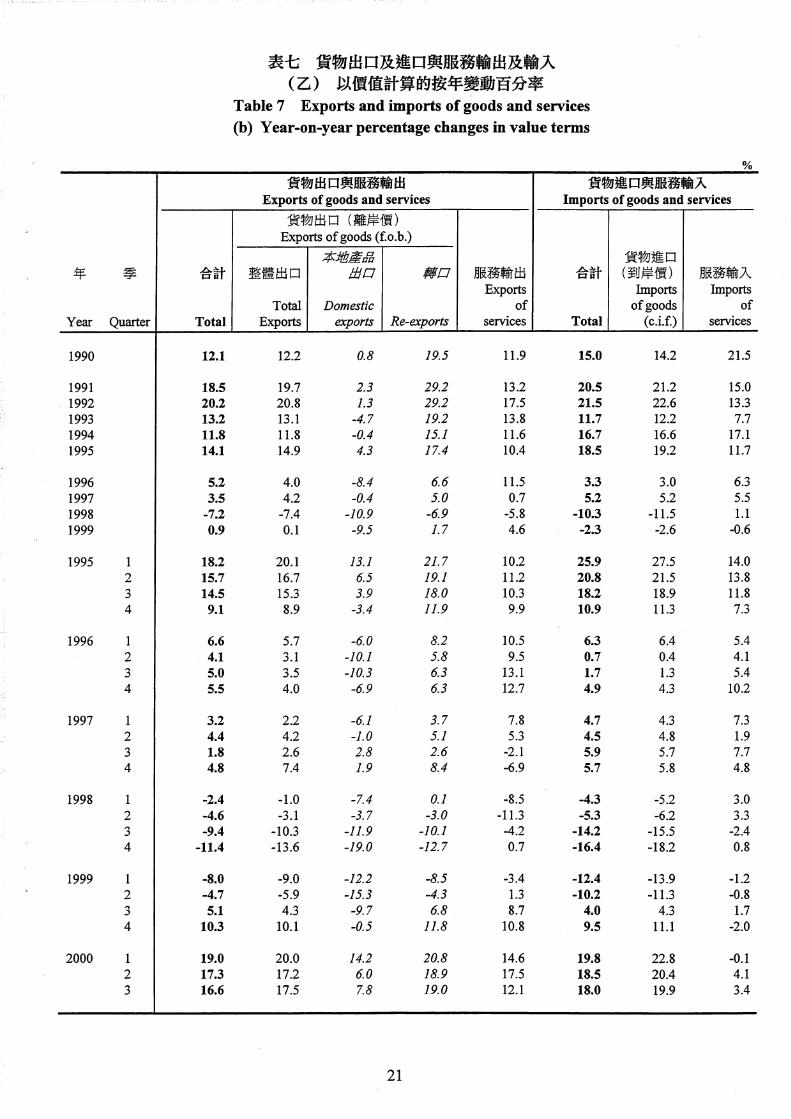
有形質易方面,貨物出口總額(包括轉口
及本地產品出口)在二零零零年第三季與上年
同期比較實質上升 17.79志。貨物進口在第三季
亦錄得18.4%的實質升幅。
General Observations
Expenditure-based GDP for the third quarter of2000
In the third qu訂ter of 2000, the Gross Domestic Product (GDP) increased by 10.的迦 real terms over a ye訂閱'Ii仗,after surging by 14.2% in the first qu訂ter and 10.9% 扭曲esecondqu訂ter.
On a seasonally a甸回ted qu甜er-to-qu甜er comp訂ison,
也e GDP increased by 1.7% in real terms in the 也ird qu訂ter of 2000, having recorded a remarkable growth of5.1% in the first qu訂ter and a marginal decline of0.6% in the second qu訂ter.
Analysed by major GDP components, private consumption expenditure recorded a ye訂﹒on-ye訂 increase of 5.6% in real terms 詛 the third quarter of 2000 over a ye缸earlier. This comp訂ed with a 5.1% 詛crease in the second qu訂ter.
Government consumption expendi個扭扭 national
account terms grew by 2.5% 血 real terms in the third qu訂ter
of2000 over a ye訂 earlier.
Gross domestic fixed capital formation recorded a double-digit grow也 at 13.0% in real terms in the third qu訂terof 2000 over a ye訂 earlier. This compared with a 4.9% 詛crease 扭曲e second qu訂ter.
Within this total, expenditure on machine可 and
equipment surged by 27 .8% in real terms in the third qu訂ter of 2000 over a ye訂 earlier along with general improvement in business outlook.
The decline in expenditure on building and construction moderated to 3 .5% in real terms 扭曲e third qu訂ter of 2000 over a year earlier, comp訂ed with a 10.0% decrease in the second qu訂ter.
Public sector construction expenditure recorded a marginal increase of 0.6% 姐 real terms in 也e third qu訂ter of 2000 over a ye訂 earlier. Private sector construction expenditure decreased by 6.3% 姐 real terms, moderating 企om也e 10.9% decline in the second qu訂ter.
On visible trade, total exports (comprising re-exports and domestic exports) increased by 17. 7% 垣 real terms in the third qu訂ter of 2000 over a year earlier. Imports of goods also grew by 18 .4 % in real terms 扭曲e也ird quarter.
3

無形質易方面,服務輸出持續強勁,在二
零零零年第三季與上年同期比較實質上升
12.6%。服務輸入在第三季亦錄得3.2%的溫和升幅。
用作概括量度整體通脹的本地生產總值
內含平減物價指數,在二零零零年第三季較上
年同期下跌6.6% 。而第一季及第二季則分別下
跌7.0%及7.6% 。
經納入最新資料後,二零零零年第一季本
地生產總值的按年實質變動率由 14.3%輕微向
下修訂至14.2% ’而第二季的則由 10.8%輕微向
上修訂至 10.9% 。
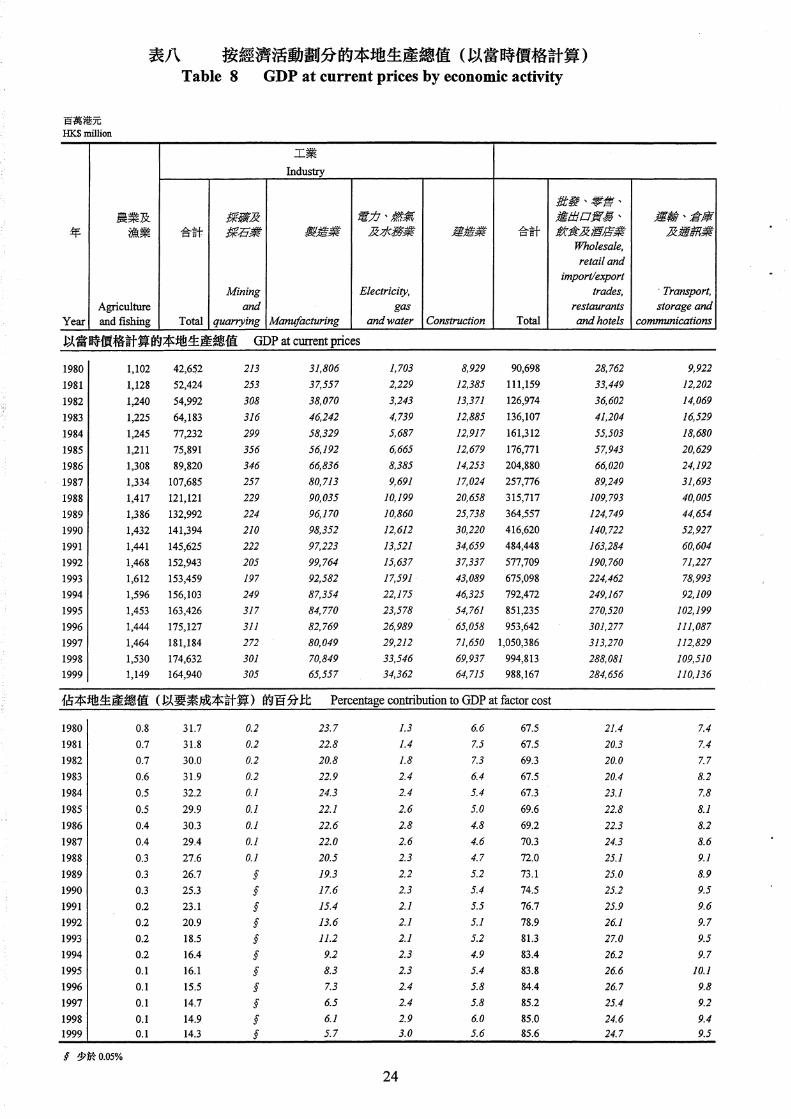
一九九九年以生產面編製的本地生產總值
(以當時價格計算)
一九九九年以生產面編製的本地生產總
值初步數字亦同時發表。以生產面編製的本
地生產總值統計數字,主要是根據按年經濟
統計調查所得的資料而編製,作為分析不同
經濟活動對於整體本地生產總值的貢獻十分
有用。在一九九九年,「批發、零售、進出
口質易、飲食及酒店業」佔本地生產總值最
大部分(24.7呦,其次是「金融、保險、地產
及商用服務業」(23.4%)和「社區、社會及個
人服務業」(21.4%)。
On invisible tra缸, exports of services remained robust and 尬的自ed by 12.6% in real terms 扭曲e 也ird qu訂ter of 2000 over a year earlier. Imports of services also recorded a modest increase of 3 .2% 旭 real terms in 也e 也irdqu訂ter.
τ'he implicit price deflator of GDP, as an overall me品叮eof inflation 誼 the economy, recorded a ye訂﹒on-ye訂 decline of 6.6% 扭曲e 也ird qu訂ter of 2000. This compared with decreases of 7 .0% in the first quarter and 7 .6% 扭曲e second qu訂ter.
h 也e light of the latest information available, the GDP real grow白色r the first qu甜er of 2000 was revised slightly downwards to 14.2% (企om 14.3%) while that for the second quarter was revised slightly upwards to 10 .9% 償。m 10.8%).
Production-based GDP at current prices for 1999
The preliminary figures of production-based GDP for 1999 位e also released. The production-based GDP statistics which 訂e comp.iled mainly based on data collected 企om 也eannual economic surveys 訂e useful for analysis of the contributions of di宜erent economic activities to the total GDP. In 1999,位ie "wholesale, retail and import/export trades, resta叮血的 and hotels" accounted for the l訂gest share (24.7%) 。f the GDP, followed by the “financing, ins叮祖間, real estate and business services" (23.4%), and "commun旬, social and personal services" (21.4%).
本地生產總值的實質變動百分率
%
16
14
12
10
8
6
4
2
0
-2
-4
-6
-8
Percentage change in GDP in real terms
本地生產總值原來數列與上年同期比較的實質變動百分率
Ye缸-on-year% change in the original GDP series
• 經季節性調整本地生產總值數列與對上季度比較的實質變動百分率
Quarter-to-quarter% change in the seasonally adjusted GDP series
QI Q2 Q3 Q4 QI Q2 Q3 Q4 QI Q2 Q3 Q4 QI Q2 Q3 Q4 QI Q2 Q3 Q4 QI .Q2 Q3 Q4 QI Q2 Q3 Q4 QI Q2 Q3 Q4 QI Q2 Q3 Q4 QI Q2 Q3 1991 1992 1993 1994 1995 1996 1997 1998 1999 2000
4
年 季
Year Quarter
1990
1991 1992 1993 1994 1995
1996 1997 1998 1999
1995 2 3 4
1996 2 3 4
1997 2 3 4
1998 2 3 4
1999 1 2 3 4
2000 1 2 3
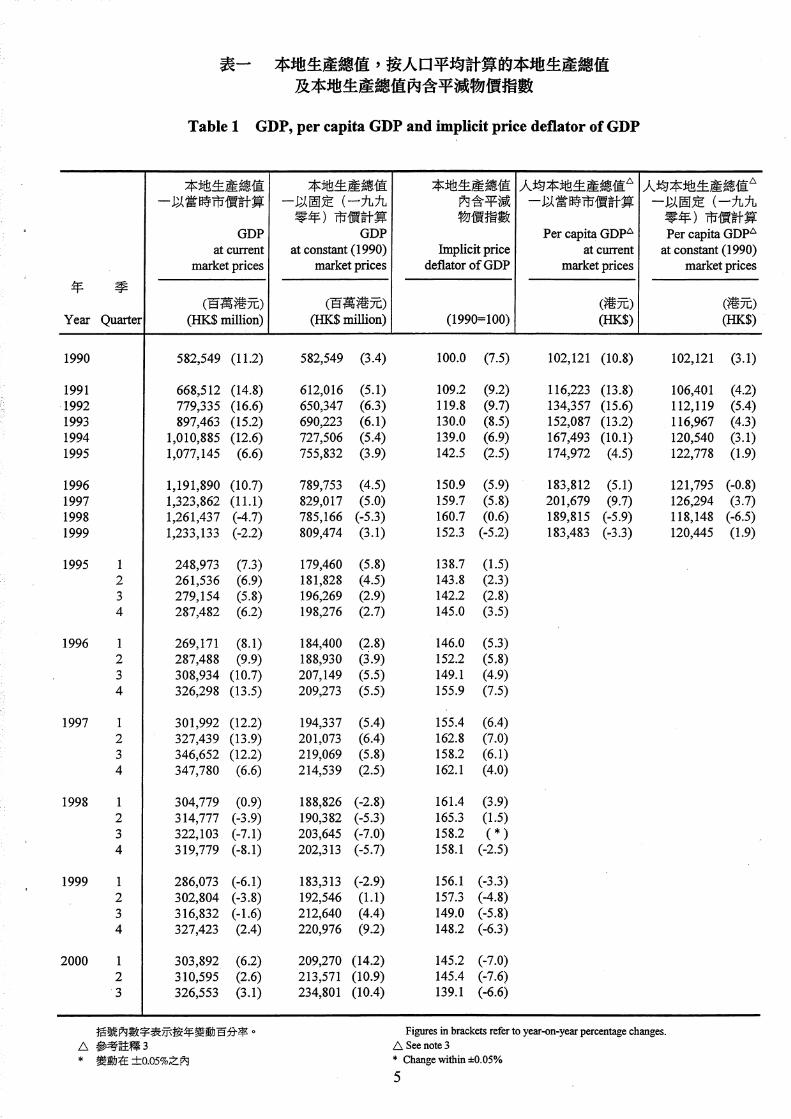
表一 本地生產總值,按人口平均計算的本地生產總值及本地生產總值內含平滅物價指數
Table 1 GDP, per capita GDP and implicit price deflator of GDP
本地生產總值 本地生產總值 本地生產總值 人均本地生產總值A一以當時市價計算 一以固定(一九九 內會平減 一以當時市價計算
零年)市價計算 物價指數
GDP GDP Per capita GDPL> at current at cons絢nt (1990) Implicit price at cu叮ent
market prices market prices deflator of GDP market prices
(百萬港元) (百萬港元) (港元)(HK$ million) 。王K$ million) (1990=100) (HK$)
582,549 (11.2) 582,549 。.4) 100.0 (7.5) 102,121 (10.8)
668,512 (14.8) 612,016 (5.1) 109.2 (9.2) 116,223 (13.8) 779,335 (16.6) 650,347 (6.3) 119.8 (9.7) 134,357 (15.6) 897,463 (15.2 690,223 (6.1) 130.0 (8.5) 152,087 (13勾
1,010,885 (12.6) 727,506 (5.4) 139.0 (6.9) 167,493 (10.1) 1,077,145 (6.6) 755,832 (3.9) 142.5 。.5) 174,972 (4.5)
1,191,890 (10.7) 789,753 (4.5) 150.9 (5.9) 183,812 (5.1) 1,323,862 (11.1) 829,017 (5.0) 159.7 (5.8) 201,679 (9.7) 1,261,437 (-4.7) 785,166 (-5.3) 160.7 (0.6) 189,815 (-5.9) 1,233,133 (-2.2) 809,474 (3.1) 152.3 (-5.2) 183,483 (-3.3)
248,973 (7.3) 179,460 (5.8) 138.7 (1.5) 261,536 (6.9) 181,828 (4.5) 143.8 。.3)279,154 (5.8) 196,269 。.9) 142.2 ο.8)
287,482 (6.2) 198,276 。.7) 145.0 (3.5)
269,171 (8.1) 184,400 (~.8) 146.0 (5.3) 287,488 (9.9) 188,930 (3.9) 152.2 (5.8) 308,934 (10.7) 207,149 (5.5) 149.1 (4.9) 326,298 (13.5) 209,273 (5.5) 155.9 (7.5)
301,992 (12.2) 194,337 (5.4) 155.4 (6.4) 327,439 (13.9) 201,073 (6.4) 162.8 (7.0) 346,652 (12.2) 219,069 (5.8) 158.2 (6.1) 347,780 (6.6) 214,539 (2.5) 162.1 (4.0)
304,779 (0.9) 188,826 (-2.8) 161.4 (3.9) 314,777 (-3.9) 190,382 (-5.3) 165.3 (1.5) 322,103 (-7.1) 203,645 (-7.0) 158.2 (*) 319,779 (-8.1) 202,313 (-5.7) 158.1 (-2.5)
286,073 (-6.1) 183,313 (-2.9) 156.l (-3.3) 302,804 (-3.8) 192,546 (1.1) 157.3 (-4.8) 316,832 (-1.6) 212,640 (4.4) 149.0 (-5.8) 327,423 ο.4) 220,976 (9.2) 148.2 (-6.3)
303,892 (6.2) 209,270 (14.2 145.2 (-7.0) 310,595 (2.6) 213,571 (10.9) 145.4 (-7.6) 326,553 (3.1) 234,801 (10.4) 139.1 (-6.6)
人均本地生產總值A一以固定(一九九零年)市價計算
Per capita GDPL> at constant (1990)
market prices
(港元)
。IK$)
102,121 (3.1)
106,401 (4.2 112,119 (5.4) 116,967 (4.3) 120,540 。.1)122,778 (1.9)
121,795 (-0.8) 126,294 (3.7) 118,148 (-6.5) 120,445 (1.9)
括號內數字表示按年變動百分率。 Figures in brackets refer to ye訂-on-ye訂 percentage changes. !:::,. Seenote3 A 參考詮釋 3
* 變動在 ±o屆%之內 * Change within ±0.05%
5

表二經季節性調整的本地生產總值(以固定(一九九零年)市價計算)
及內含平減物價指數。
年 季
Year Quarter
1991 2 3 4
1992 2 3 4
1993 2 3 4
1994 2 3 4
1995 1 2 3 4
1996 2 3 4
1997 2 3 4
1998 2 3 4
1999 2 3 4
2000 2 3
。參考註釋17 至 19
*變動在±0.05%之內
.與對上季度比較的變動百分率.
Table 2 Seasonally adjusted GDP (at constant (1990) market prices)
and implicit price deflator <> - Percentage change over the preceding quarter .
本地 私人 政府 貨物出口 貨物進口 服務輸出 服務輸入
生產總值 消費開支 消費開支
Gross Private Government Exports Imports Exports Imports domestic consumption consumption of of of of product expenditure expenditure goods goods services services
1.1 0.7 3.8 -1.5 1.5 0.5 3.9 1.5 3.8 0.7 5.9 4.9 2.9 2.4 1.3 4.8 -0.2 4.1 3.8 0.2 1.4 1.9 -1.0 3.4 6.6 5.5 3.0 6.4
1.3 1.1 7.9 2.0 4.9 4.2 0.6 1.8 2.6 1.6 8.1 8.0 3.2 1.0 1.7 4.7 1.7 1.7 1.4 1.2 3.4 1.1 -1.6 0.8 5.2 6.8 0.4 1.3
1.3 1.4 -2.9 3.3 2.9 2.6 -0.2 1.8 3.8 4.3 1.1 -0.1 3.4 4.5 2.0 1.9 -0.2 4.0 3.7 2.6 0.3 0.8 1.7 1.0 0.7 * -1.5 -1.6
1.5 3.1 0.1 1.7 4.4 3.6 7.4 1.0 -0.9 3.0 4.6 7.0 0.1 0.8 1.1 0.8 -0.5 2.4 2.1 2.5 1.1 1.7 2.2 0.8 3.5 3.5 2.1 0.7
1.6 -0.2 0.8 4.8 6.7 * 0.6 -0.1 -0.3 * 1.3 0.8 1.5 0.6 -0.3 -0.7 2.4 2.6 1.8 0.9 0.1 1.5 2.0 0.3 -1.7 -1.3 1.4 -1.2
1.7 3.0 * 2.2 3.4 4.5 3.1 1.0 -0.9 1.8 1.8 -0.4 1.5 2.5 1.3 0.5 1.9 2.0 1.2 4.0 0.4 1.4 3.9 0.8 -0.6 1.8 -0.4 1.6
2.1 1.1 -0.8 1.7 4.8 0.5 0.4 1.3 2.3 4.5 2.6 -1.2 0.1 -1.4 0.6 2.6 -4.3 0.9 0.8 -3.6 5.1
-1.8 -4.0 0.3 3.3 3.5 -3.4 0.5
-2.8 -3.5 1.4 -4.8 -4.7 2.1 0.5 -1.6 -1.4 -2.2 -0.2 -1.2 -1.2 -0.8 -1.1 -2.6 4.6 -5.8 ” 8.2 3.1 -0.2 -0.5 -2.3 -1.2 0.5 -0.9 -0.l 2.0
0.6 1.4 2.8 0.9 0.2 -0.3 -1.7 2.3 3.6 -2.3 3.3 1.8 1.6 0.5 2.2 0.1 1.2 4.2 5.7 11.2 0.9 3.8 0.3 3.7 3.4 4.3 -0.4 -0.7
5.1 4.9 0.9 7.4 8.0 2.3 -0.8 -0.6 -0.2 -2.8 1.5 -0.5 4.6 4.6 1.7 0.5 0.7 4.7 5.9 5.8 0.1
<> See notes 17 to 19 * Change within ±0.05%
6
%
本地生產總值內含平減物價指數
Implicit price deflator of GDP
1.9 2.6 3.1 2.3
2.9 1.5 1.9 2.2
3.2 1.0 1.6 1.9
3.0 0.9 0.8 0.7
-0.7 1.3 1.7 1.0
1.2 1.6 1.3 3.2
0.3 2.0 0.9 0.7
0.2 -0.2 -0.7 -1.6
-0.9 -1.7 -1.9 -1.8
-1.9 -2.1 -1.l

表三 各組成部分在本地生產總值的按年實質變動百分率中所佑的比率++
Table 3 Component contributions to year-on-year rate of change in real terms of GDP++
本地 私人 政府 本地固定資 貨物出口 貨物進口
年 季 生產總值 消費開支 消費開支 本形成總額 存貨增減 (離岸價) (到岸價) 服務輸出 服務輸入
Gross domestic
Gross Private Government fixed Changes Exports of Imports of domestic consumption consumption capital Ill goods goods Exports of Imports of
Year Qu訂ter product expenditure expenditure formation inventories (f.o.b.) (c.i.f.) services services
變動百分率 百分點 百分點 百分點 百分點 百分點 百分點 百分點 百分點
%ch血ge %po旭t %point %point %p。但t %point %point % point %point
1990 3.4 3.2 0.4 2.1 0.4 9.9 -11.7 0.9 -1.7
1991 5.1 4.9 0.6 2.5 -0.3 19.0 -21.0 I.I -1.7 1992 6.3 4.5 1.0 2.5 0.7 24.3 -27.8 2.6 -1.5 1993 6.1 4.5 0.2 1.0 -1.0 18.7 -18.4 2.0 -1.0 1994 5.4 4.0 0.3 4.3 2.6 15.4 -21.5 1.7 -1.4 1995 3.9 0.9 0.2 3.2 2.8 18.6 -22.8 1.3 -0.4
1996 4.5 2.8 0.3 3.5 -4.0 8.0 -7.8 2.6 -0.8 1997 5.0 3.7 0.2 4.4 0.2 10.3 -13.0 ** ” 0.7 1998 -5.3 -4.5 0.1 -2.8 -3.1 -7.3 13.2 -0.5 -0.5 1999 3.1 0.5 0.3 -6.2 0.5 6.3 -0.2 2.1 **
1995 1 5.8 1.2 0.3 3.6 7.6 24.4 -32.1 1.3 -0.5 2 4.5 1.5 0.1 3.1 2.7 20.3 -24.2 1.5 -0.5 3 2.9 0.4 0.3 4.7 -0.4 19.6 -22.6 1.2 -0.4 4 2.7 0.7 0.3 1.7 1.7 10.9 -13.6 I.I -0.1
1996 2.8 2.4 0.2 3.0 -3.2 7.5 -8.9 2.2 -0.4 2 3.9 2.1 0.4 3.1 -5.4 6.7 -4.4 2.2 -0.7 3 5.5 2.7 0.3 1.8 -3.8 8.6 -6.2 3.0 -0.9 4 5.5 4.0 0.3 6.0 -3.8 9.0 -11.6 2.7 -1.3
1997 5.4 2.5 0.4 5.6 0.9 6.4 -11.1 1.5 -0.8 2 6.4 4.9 0.4 4.7 -1.9 10.6 國 13.2 0.8 **
3 5.8 6.0 ** 3.9 3.0 7.7 -12.9 -0.8 -1.0 4 2.5 1.4 ** 3.4 -1.4 16.0 -14.7 -1.4 -0.8
1998 -2.8 -2.0 0.2 -0.9 -3.0 2.3 2.9 -1.5 -0.8 2 -5.3 ” 3.5 -0.4 1.3 -2.6 -0.9 3.4 -1.9 -0.8 3 -7.0 -6.2 0.3 -3.7 -4.6 -12.l 19.3 0.1 ” 0.1 4 -5.7 -5.9 0.2 -7.3 -2.2 -17.0 25.6 1.2 -0.3
1999 -2.9 -3.2 0.4 -7.9 -3.2 -7.7 18.3 0.2 0.2 2 1.1 0.6 0.3 -10.6 -2.1 -3.7 15.7 1.0 -0.l 3 4.4 1.6 ** -3.5 1.5 13.9 -12.0 3.3 -0.4 4 9.2 2.6 0.4 -3.2 5.3 20.9 -20.7 3.7 0.2
2000 1 14.2 5.3 0.3 1.5 7.3 33.0 -37.6 4.3 **
2 10.9 3.1 0.2 1.5 4.9 31.0 -34.l 5.0 -0.7 3 10.4 3.1 0.2 3.6 2.2 31.4 -33.2 3.6 -0.6
++參考註釋20 ++ See note 20 **所佔比率在劫瓜%之內 ** Contribution wi也訟 ±0.05%
7
本地
年 季 生產總值
Gross domestic
Year Qu甜e1 product
1990 582,549
1991 668,512 1992 779,335 1993 897,463 1994 1,010,885 1995 1,077,145
1996 1,191,890 1997 1,323,862 1998 1,261,437 1999 1,233,133
1995 248,973 2 261,536 3 279,154 4 287,482
1996 269,171 2 287,488 3 308,934 4 326,298
1997 301,992 2 327,439 3 346,652 4 347,780
1998 304,779 2 314,777 3 322,103 4 319,779
1999 286,073 2 302,804 3 316,832 4 327,423
2000 303,892 2 310,595 3 326,553
'
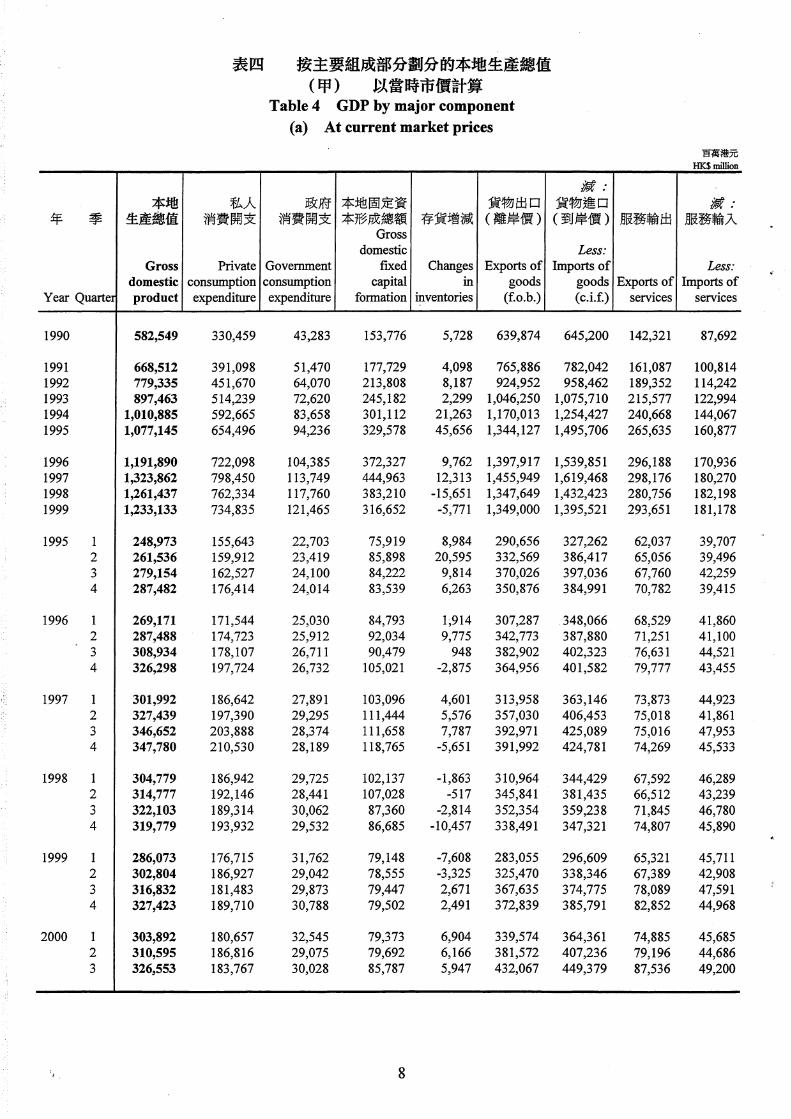
表四 按主要組成部分劃分的本地生產總值
私人消費開支
Private consumption expenditure
330,459
391,098 451,670 514,239 592,665 654,496
722,098 798,450 762,334 734,835
155,643 159,912 162,527 176,414
171,544 174,723 178,107 197,724
186,642 197,390 203,888 210,530
186,942 192,146 189,314 193,932
176,715 186,927 181,483 189,710
180,657 186,816 183,767
(甲) 以當時市價計算
Table 4 GDP by major component
(a) At current market prices
政府 本地固定資 貨物出口消費開支 本形成總額 存貨增減 (離岸價)
Gross domestic
Government fixed Changes Exports of consumption capital 立1 goods expenditure formation inventories (f.o.b.)
43,283 153,776 5,728 639,874
51,470 177,729 4,098 765,886 64,070 213,808 8,187 924,952 72,620 245,182 2,299 1,046,250 83,658 301,112 21,263 1,170,013 94,236 329,578 45,656 1,344,127
104,385 372,327 9,762 1,397,917 113,749 444,963 12,313 1,455,949 117,760 383,210 -15,651 1,347,649 121,465 316,652 -5,771 1,349,000
22,703 75,919 8,984 290,656 23,419 85,898 20,595 332,569 24,100 84,222 9,814 370,026 24,014 83,539 6,263 350,876
25,030 84,793 1,914 307,287 25,912 92,034 9,775 342,773 26,711 90,479 948 382,902 26,732 105,021 -2,875 364,956
27,891 103,096 4,601 313,958 29,295 111,444 5,576 357,030 28,374 111,658 7,787 392,971 28,189 118,765 -5,651 391,992
29,725 102,137 -1,863 310,964 28,441 107,028 -517 345,841 30,062 87,360 -2,814 352,354 29,532 86,685 -10,457 338,491
31,762 79,148 -7,608 283,055 29,042 78,555 -3,325 325,470 29,873 79,447 2,671 367,635 30,788 79,502 2,491 372,839
32,545 79,373 6,904 339,574 29,075 79,692 6,166 381,572 30,028 85,787 5,947 432,067
8
誡:貨物進口(到岸價)
L自~s:
Imports of goods (c.i.f.)
645,200
782,042 958,462
1,075,710 1,254,427 1,495,706
1,539,851 1,619,468 1,432,423 1,395,521
327,262 386,417 397,036 384,991
348,066 387,880 402,323 401,582
363,146 406,453 425,089 424,781
344,429 381,435 359,238 347,321
296,609 338,346 374,775 385,791
364,361 407,236 449,379
服務輸出
Exports of services
142,321
161,087 189,352 215,577 240,668 265,635
296,188 298,176 280,756 293,651
62,037 65,056 67,760 70,782
68,529 71,251 76,631 79,777
73,873 75,018 75,016 74,269
67,592 66,512 71,845 74,807
65,321 67,389 78,089 82,852
74,885 79,196 87,536
百萬港元
HK$million
諾:
服務輸入
Less: Imports of
services
87,692
100,814 114,242 122,994 144,067 160,877
170,936 180,270 182,198 181,178
39,707 39,496 42,259 39,415
41,860 41,100 44,521 43,455
44,923 41,861 47,953 45,533
46,289 43,239 46,780 45,890
45,711 42,908 47,591 44,968
45,685 44,686 49,200
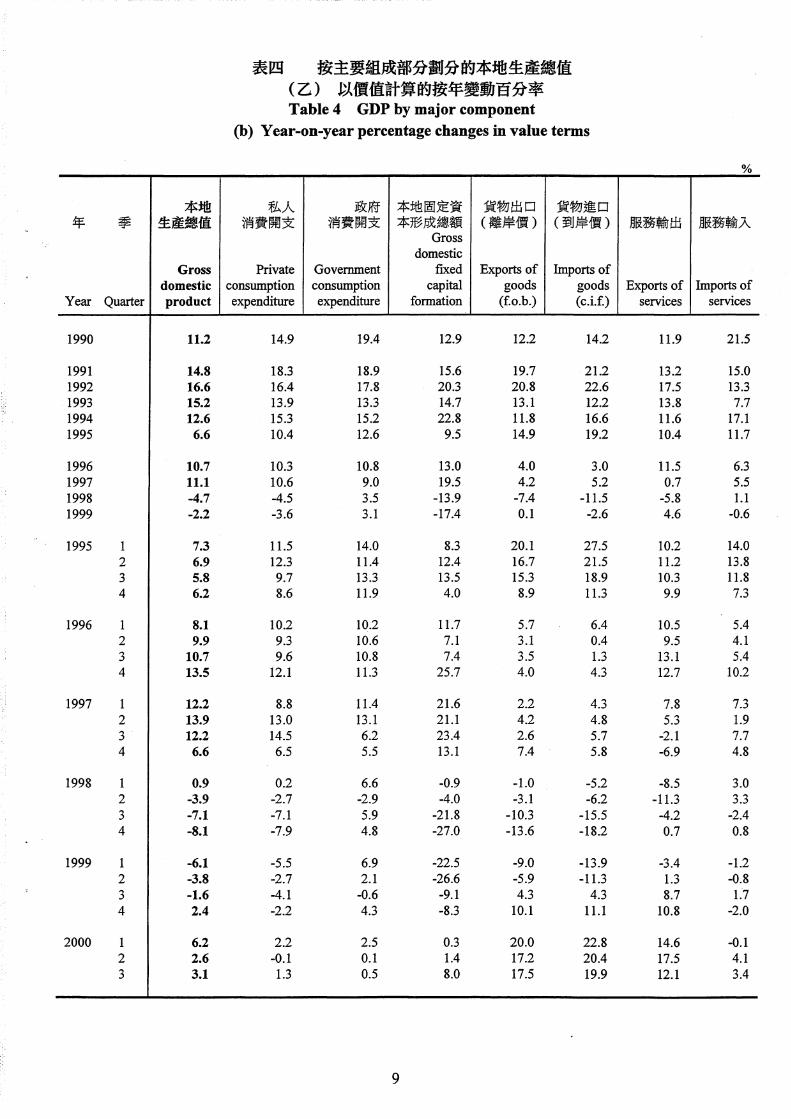
表四 按主要組成部分劃分的本地生產總值
(乙) 以價值計算的按年變動百分率Table 4 GDP by major component
(b) Year-on-year percentage changes in value terms
%
本地 私人 政府 本地固定資 貨物出口 貨物進口
年 季 生產總值 消費開支 消費開支 本形成總額 (離岸價) (到岸價) 服務輸出 服務輸入
Gross domestic
Gross Private Government fixed Exports of Imports of domestic consumption consumption capital goods goods Exports of Imports of
Year Quarter product expenditure expenditure formation (五o.b.) (c.i.f.) sefVlces services
1990 11.2 14.9 19.4 12.9 12.2 14.2 11.9 21.5
1991 14.8 18.3 18.9 15.6 19.7 21.2 13.2 15.0 1992 16.6 16.4 17.8 20.3 20.8 22.6 17.5 13.3 1993 15.2 13.9 13.3 14.7 13.I 12.2 13.8 7.7 1994 12.6 15.3 15.2 22.8 11.8 16.6 11.6 17.1 1995 6.6 10.4 12.6 9.5 14.9 19.2 10.4 11.7
1996 10.7 10.3 10.8 13.0 4.0 3.0 11.5 6.3 1997 11.1 10.6 9.0 19.5 4.2 5.2 0.7 5.5 1998 -4.7 ” 4.5 3.5 ” 13.9 -7.4 -11.5 -5.8 I.I 1999 -2.2 -3.6 3.1 -17.4 0.1 -2.6 4.6 -0.6
1995 7.3 11.5 14.0 8.3 20.I 27.5 10.2 14.0 2 6.9 12.3 11.4 12.4 16.7 21.5 11.2 13.8 3 5.8 9.7 13.3 13.5 15.3 18.9 10.3 11.8 4 6.2 8.6 11.9 4.0 8.9 11.3 9.9 7.3
1996 8.1 10.2 10.2 11.7 5.7 6.4 10.5 5.4 2 9.9 9.3 10.6 7.1 3.1 0.4 9.5 4.1 3 10.7 9.6 10.8 7.4 3.5 1.3 13.I 5.4 4 13.5 12.1 11.3 25.7 4.0 4.3 12.7 10.2
1997 I 12.2 8.8 11.4 21.6 2.2 4.3 7.8 7.3 2 13.9 13.0 13.I 21.1 4.2 4.8 5.3 1.9 3 12.2 14.5 6.2 23.4 2.6 5.7 -2.1 7.7 4 6.6 6.5 5.5 13.I 7.4 5.8 -6.9 4.8
1998 0.9 0.2 6.6 -0.9 -1.0 -5.2 -8.5 3.0 2 -3.9 -2.7 -2.9 -4.0 -3.1 -6.2 -11.3 3.3 3 -7.1 -7.I 5.9 -21.8 -10.3 -15.5 -4.2 -2.4 4 -8.1 -7.9 4.8 -27.0 -13.6 -18.2 0.7 0.8
1999 -6.1 -5.5 6.9 -22.5 -9.0 -13.9 -3.4 -1.2 2 -3.8 -2.7 2.1 -26.6 -5.9 -11.3 1.3 -0.8 3 -1.6 -4.1 -0.6 -9.1 4.3 4.3 8.7 1.7 4 2.4 -2.2 4.3 -8.3 10.l I I.I 10.8 -2.0
2000 6.2 2.2 2.5 0.3 20.0 22.8 14.6 -0.1 2 2.6 -0.1 0.1 1.4 17.2 20.4 17.5 4.1 3 3.1 1.3 0.5 8.0 17.5 19.9 12.1 3.4
9

本地
年 季 生產總值
Gross domestic
Year Qu訂ter product
1990 582,549
1991 612,016 1992 650,347 1993 690,223 1994 727,506 1995 755,832
1996 789,753 1997 829’。171998 785,166 1999 809,474
1995 179,460 2 181,828 3 196,269 4 198,276
1996 1 184,400 2 188,930 3 207,149 4 209,273
1997 194,337 2 201,073 3 219,069 4 214,539
1998 188,826 2 190,382 3 203,645 4 202,313
1999 1 183,313 2 192,546 3 212,640 4 220,976
2000 1 209,270 2 213,571 3 234,801
表四
(丙)
按主要組成部分劃分的本地生產總值
以固定(一九九零年)市價計算
私人消費開支
Private consumption expenditure
330,459
359,019 386,519 415,618 443,571 450,450
471,766 501,015 463,775 467,311
112,187 108,726 111,076 118,461
116,468 112,529 116,322 126,447
121,117 121,760 128,669 129,469
117,162 114,732 115,037 116,844
111,192 115,843 118,244 122,032
120,880 121,744 124,888
Table 4 GDP by major component
(c) At constant (1990) market prices
辦:政府 本地固定資 貨物出口 貨物進口
消費開支 本形成總額 存貨增減 (離岸價) (到岸價)
Gross domes討c Less:
Government fixed Changes Exports of Imports of consumption capital Ill goods goods expenditure formation inventones (主o.b.) ( c.i.f.)
43,283 153,776 5,728 639,874 645,200
46,617 168,059 4,081 750,677 767,796 52,789 183,480 8,453 899,418 938,058 53,935 190,259 2,224 1,021,022 1,057,538 56,057 220,171 20,058 1,127,276 1,206,013 57,857 243,800 40,103 1,262,522 1,371,848
60,162 270,146 9,608 1,322,954 1,430,864 61,629 304,569 10,927 1,404,124 1,533,705 62,124 281,647 -14,781 1,343,716 1,424,031 64,203 232,859 -10,874 1,392,823 1,425,939
14,792 56,935 8,449 276,875 304,928 14,058 61,634 17,908 313,395 352,261 14,536 63,226 8,399 343,417 362,139 14,471 62,005 5,347 328,835 352,519
15,151 62,319 2,674 290,375 320,895 14,717 67,217 8,058 325,515 360,179 15,162 66,731 986 360,309 374,375 15,132 73,879 -2,110 346,754 375,415
15,850 72,685 4,334 302,106 341,331 15,541 76,154 4,572 345,607 385,120 15,152 74,704 7,150 376,266 401,119 15,086 81,026 -5,129 380,145 406,134
16,166 70,986 -1,490 306,485 335,695 14,735 78,863 -581 343,801 378,341 15,741 66,536 -2,832 349,814 358,863 15,482 65,262 -9,878 343,616 351,132
16,836 56,114 -7,487 291,876 301,193 15,250 58,684 -4,642 336,830 348,400 15,783 59,329 321 378,134 383,372 16,334 58,732 934 385,983 392,973
17,459 58,791 5,898 352,348 370,029 15,657 61,566 4,799 396,512 414,015 16,170 67,069 5,018 444,930 454,008
10
服務輸出
Exports of services
142,321
148,945 164,801 177,984 189,602 198,751
218,000 217,818 213,892 230,494
47,023 49,017 50,324 52,387
50,971 52,960 56,244 57,825
53,719 54,525 54,636 54,938
50,858 50,694 54,757 57,583
51,330 52,626 61,469 65,069
59,200 62,236 69,204
百萬港元
HK$血泊ion
誠:
服務輸入
Less: Imports of
services
87,692
97,586 107,055 113,281 123,216 125,803
132,019 137,360 141,176 141,403
31,873 30,649 32,570 30,711
32,663 31,887 34,230 33,239
34,143 31,966 36,389 34,862
35,646 33,521 36,545 35,464
35,355 33,645 37,268 35,135
35,277 34,928 38,470

表四 按主要組成部分劃分的本地生產總值
(丁) 以實質計算的按年變動百分率Table 4 GDP by major component
( d) Year-on-year percentage changes in real terms
%
本地 私人 政府 本地固定資 貨物出口 貨物進口
年 季 生產總值 消費開支 消費開支 本形成總額 (離岸價) (到岸價) 服務輸出 服務輸入
Gross domestic
Gross Private Government fixed Exports of Imports of domestic consumption consumption capital goods goods Exports of Imports of
Year Qu訂ter product expenditure exp en di個re formation (f.o.b.) (c.i.f.) services services
1990 3.4 5.7 5.5 8.1 9.6 11.4 3.6 12.1
1991 5.1 8.6 7.7 9.3 17.3 19.0 4.7 11.3 1992 6.3 8.5 7.2 9.2 19.8 22.2 10.6 9.7 1993 6.1 7.5 2.2 3.7 13.5 12.7 8.0 5.8 1994 5.4 6.7 3.9 15.7 10.4 14.0 6.5 8.8 1995 3.9 1.6 3.2 10.7 12.0 13.8 4.8 2.1
1996 4.5 4.7 4.0 10.8 4.8 4.3 9.7 4.9 1997 5.0 6.2 2.4 12.7 6.1 7.2 -0.l 4.0 1998 -5.3 -7.4 0.8 -7.5 -4.3 -7.2 -1.8 2.8 1999 3.1 0.8 3.3 -17.3 3.7 0.1 7.8 0.2
1995 5.8 1.9 3.5 12.0 17.6 21.7 4.8 3.0 2 4.5 2.5 1.4 9.5 12.7 13.6 5.6 2.7 3 2.9 0.8 4.3 16.4 12.2 13.5 4.7 2.2 4 2.7 1.1 3.6 5.6 6.8 8.0 4.3 0.5
1996 2.8 3.8 2.4 9.5 4.9 5.2 8.4 2.5 2 3.9 3.5 4.7 9.1 3.9 2.2 8.0 4.0 3 5.5 4.7 4.3 5.5 4.9 3.4 11.8 5.1 4 5.5 6.7 4.6 19.2 5.4 6.5 10.4 8.2
1997 5.4 4.0 4.6 16.6 4.0 6.4 5.4 4.5 2 6.4 8.2 5.6 13.3 6.2 6.9 3.0 0.2 3 5.8 10.6 -0.l 11.9 4.4 7.1 -2.9 6.3 4 2.5 2.4 -0.3 9.7 9.6 8.2 -5.0 4.9
1998 -2.8 -3.3 2.0 -2.3 1.4 -1.7 -5.3 4.4 2 -5.3 -5.8 -5.2 3.6 -0.5 -1.8 -7.0 4.9 3 -7.0 -10.6 3.9 -10.9 -7.0 -10.5 0.2 0.4 4 -5.7 -9.8 2.6 -19.5 -9.6 -13.5 4.8 1.7
1999 -2.9 -5.l 4.1 -21.0 -4.8 -10.3 0.9 -0.8 2 1.1 1.0 3.5 -25.6 -2.0 -7.9 3.8 0.4 3 4.4 2.8 0.3 -10.8 8.1 6.8 12.3 2.0 4 9.2 4.4 5.5 -10.0 12.3 11.9 13.0 -0.9
2000 14.2 8.7 3.7 4.8 20.7 22.9 15.3 -0.2 2 10.9 5.1 2.7 4.9 17.7 18.8 18.3 3.8 3 10.4 5.6 2.5 13.0 17.7 18.4 12.6 3.2
11

年
Year
1990
1991 1992 1993 1994 1995
1996 1997 1998 1999
1995
1996
1997
1998
1999
2000
季
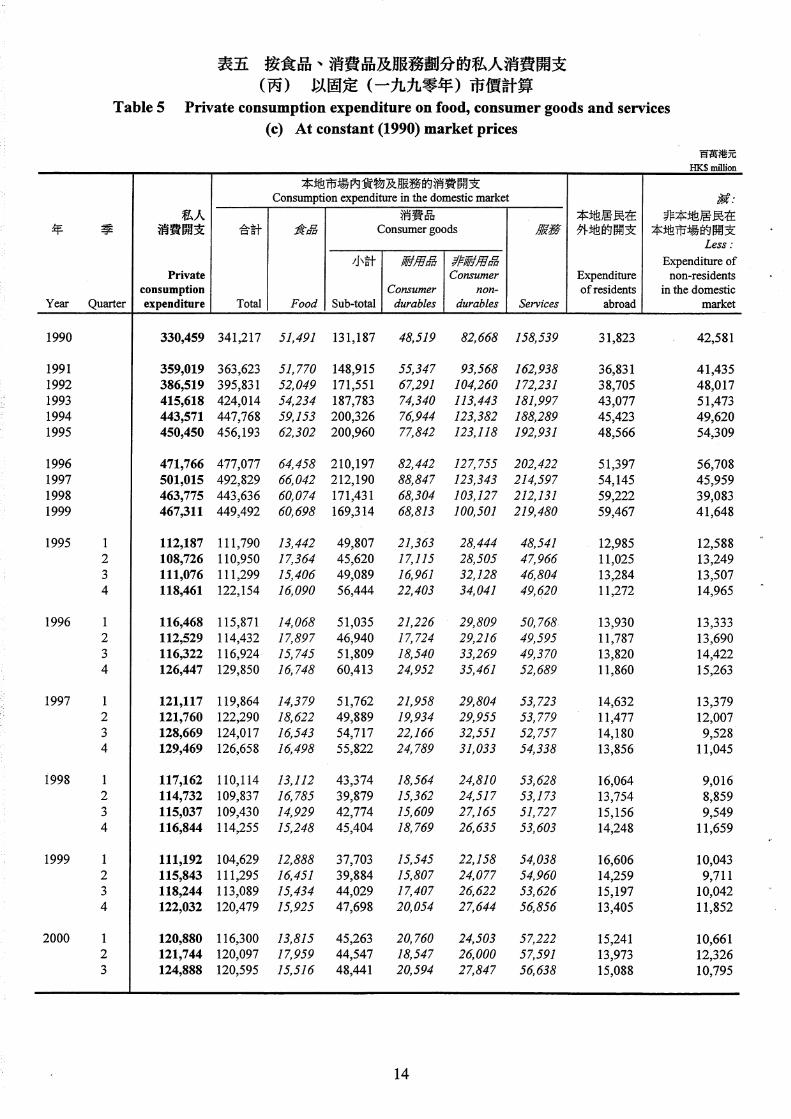
表五按食品、消費品及服務劃分的私人消費開支
(甲) 以當時市價計算
Table 5 Private consumption expenditure on food, consumer goods and services (a) At current market prices
本地市場內貨物及服務的消費開支Consumption expendi個re in the domestic market
私人 消費晶
消費開支 合計 食品 Consumer goods
小計 耐用品 非爾吉思品
Private Consumer consumption Consumer non-
本地居民在
嚴聲 外地的開支
Expenditure of residents
百萬港元
HK$ million
攝:非本地居民在
本地市場的開支Less:
Expenditure of non-residents
in the domestic Qu甜er expenditure T。但l Food Sub-total durables durables Services abroad market
330,459 341,217 51,491 131,187 48,519 82,668 158,539 31,823 42,581
391,098 397,152 56,864 159,261 57,726 101,535 181,027 37,803 43,857 451,670 464, 700 60,776 194,556 72,883 121,673 209,368 41,522 54,552 514,239 529,136 66,608 224,198 83,229 140,969 238 330 47,628 62,525 592,665 602,094 76,685 251,723 88,347 163,376 273,686 56,189 65,618 654,496 663,024 87,028 267,323 91,136 176,187 308,673 67,422 75,950
722,098 734,838 95,473 293,250 99,187 194,063 346,115 72,819 85,559 798,450 793,454 99,387 308,499 110,283 198,216 385,568 78,059 73,063 762,334 734,954 92,331 254,614 85,139 169,475 388,009 83,190 55,810 734,835 705,836 90,500 227,059 80,690 146,369 388,277 82,573 53,574
155,643 155,304 18,287 62,931 24,765 38,166 74,086 17,229 16,890 2 159,912 162,447 24,139 61,531 20,117 41,414 76,777 15,529 18,064 3 162,527 163,166 21,725 65,643 19,822 45,821 75,798 18,809 19,448 4 176,414 182,107 22,877 77,218 26,432 50,786 82,012 15,855 21,548
1 171,544 171,735 20,641 67,839 25,235 42,604 83 255 19,249 19,440 2 174,723 178,092 26,681 66,113 21,409 44,704 85,298 16,788 20,157 3 178,107 180,722 23,285 72,419 22,384 50,035 85,018 19,662 22,277 4 197,724 204,289 24,866 86,879 30,159 56.720 92,544 17,120 23,685
186,642 186,910 21,264 71,748 26,709 45,039 93,898 20,803 21,071 2 197,390 199,912 28,518 74,087 24,911 49,176 97.307 16,739 19,261 3 203,888 199,155 24,342 79,699 27,686 52,013 95,114 20,546 15,813 4 210,530 207,477 25,263 82,965 30,977 51,988 99,249 19,971 16,918
186,942 177,758 19,935 61,636 22 870 38,766 96,187 22,409 13,225 2 192,146 185,399 25,948 61,232 19,450 41,782 98,219 19,472 12,725 3 189,314 182,058 23,126 64,353 19,558 44,795 94,579 21,132 13,876 4 193,932 189,739 23,322 67,393 23,261 44,132 99,024 20,177 15,984
176,715 166,967 19527 50,806 18,592 32,214 96,634 22,844 13,096 2 186,927 179,572 25,428 55,508 19,190 36,318 98,636 19,787 12,432 3 181,483 173,399 22,434 57,723 20 083 37,640 斗 93,242 21,064 12,980 4 189,710 185,898 23,111 63,022 2之825 40,197 99,765 18,878 15,066
1 180,657 172,820 19,707 56,116 23,358 32,758 96,997 21,221 13,384 2 186,816 182,703 25,768 57,905 21,403 36,502 99,030 19,545 15,432 3 .183,767 176,649 21,813 59,014 23,032 35,982 95,822 21,066 13,948
12

年
Year
1990
1991 1992 1993 1994 1995
1996 1997 1998 1999
1995
1996
1997
1998
1999
2000
表五按食品、消費品及服務劃分的私人消費開支
(乙) 以價值計算的按年變動百分率
Table 5 Private consumption expendi個re on food, consumer goods and services (b) Year-on-year percentage changes in value terms
% 本地市場內貨物及服務的消費開支
Consumption expenditure in the domestic market
私人 消費品 本地居民在 非本地居民在
季 消費開支 合計 J之~t:r"b Consumer goods 嚴聲 外地的開支 本地市場的開支
小計 甜摺晶 非耐用品 Expenditure of Private Consumer Expenditure non-residents
consumption Consumer non- of residents in the domestic Qu甜:er expenditure T。但l Food Sub-total durables durables Services abroad market
14.9 13.3 12.5 10.8 11.4 10.4 15.8 20.6 7.0
18.3 16.4 10.4 21.4 19.0 22.8 14.2 18.8 3.0 16.4 17.9 6.9 22.2 26.3 19.8 17.6 9.8 24.4 13.9 13.9 9.6 15.2 14.2 15.9 13.8 14.7 14.6 15.3 13.8 15.J 12.3 6.1 15.9 14.8 18.0 4.9 10.4 10.l 13.5 6.2 3.2 7.8 12.8 20.0 15.7
10.3 10.8 9.7 9.7 8.8 JO.I 12.1 8.0 12.7 10.6 8.0 4.1 5.2 11.2 2.1 11.4 7.2 -14.6 -4.5 -7.4 -7.1 -17.5 -22.8 -14.5 0.6 6.6 -23.6 -3.6 -4.0 -2.0 -10.8 -5.2 -13.6 0.1 -0.7 -4.0
11.5 10.4 11.6 10.3 8.5 11.5 10.2 23.2 11.9 2 12.3 11.4 20.6 4.8 1.0 6.8 14.4 24.1 13.1 3 9.7 9.5 11.2 4.2 2.2 5.1 14.1 19.9 18.4 4 8.6 9.3 10.3 5.8 0.8 8.6 12.5 13.l 18.9
10.2 10.6 12.9 7.8 1.9 11.6 12.4 11.7 15.l 2 9.3 9.6 10.5 7.4 6.4 7.9 11.1 8.1 11.6 3 9.6 10.8 7.2 10.3 12.9 9.2 12.2 4.5 14.5 4 12.1 12.2 8.7 12.5 14.1 11.7 12.8 8.0 9.9
8.8 8.8 3.0 5.8 5.8 5.7 12.8 8.1 8.4 2 13.0 12.3 6.9 12.1 16.4 10.0 14.1 -0.3 -4.4 3 14.5 10.2 4.5 10.l 23.7 4.0 11.9 4.5 -29.0 4 6.5 1.6 1.6 -4.5 2.7 -8.3 7.2 16.7 -28.6
0.2 -4.9 -6.3 -14.1 -14.4 -13.9 2.4 7.7 -37.2 2 -2.7 -7.3 -9.0 -17.4 -21.9 -15.0 0.9 16.3 -33.9 3 -7.1 -8.6 -5.0 -19.3 -29.4 -13.9 -0.6 2.9 -12.2 4 -7.9 -8.5 -7.7 -18.8 -24.9 -15.1 -0.2 1.0 -5.5
-5.5 -6.1 -2.0 -17.6 -18.7 -16.9 0.5 1.9 -1.0 2 -2.7 -3.1 -2.0 -9.3 -1.3 -13.1 0.4 1.6 -2.3 3 -4.1 -4.8 -3.0 -10.3 2.7 -16.0 -1.4 -0.3 -6.5 4 -2.2 -2.0 -0.9 -6.5 -1.9 -8.9 0.7 -6.4 -5.7
2.2 3.5 0.9 10.5 25.6 1.7 0.4 -7.1 2.2 2 -0.1 1.7 1.3 4.3 11.5 0.5 0.4 -1.2 24.1 3 1.3 1.9 -2.8 2.2 14.7 -4.4 2.8 * 7.5
*變動在±0肘%之內 * Change within ±0.05%
13
年
Year
1990
1991 1992 1993 1994 1995
1996 1997 1998 1999
1995
1996
1997
1998
1999
2000
季
表五按食品、消費品及服務劃分的私人消費開支
(丙) 以固定(一九九零年)市價計算
Table 5 Private consumption expenditure on food, consumer goods and services ( c) At constant (1990) market prices
本地市場內貨物及服務的消費開支
Consumption expenditure in the domestic market
私人 消費品
消費開支 合計 食品 Consumer goods
小計 輯用品 非童話居品
Private Consumer consumption Consumer non-
本地居民在
服務 外地的開支
Expenditure of residents
百萬港元
HK$ million
誠
非本地居民在
本地市場的聞支Less:
Expenditure of non-residents
in the domestic Quarter expenditure Total Food Sub-to值1 durables durables Services abroad market
330,459 341,217 51,491 131,187 48,519 82,668 158,539 31,823 42,581
359,019 363,623 51,770 148,915 55,347 93,568 162,938 36,831 41,435 386,519 395,831 52,049 171,551 67,291 104,260 172,231 38,705 48,017 415,618 424,014 54,234 187,783 74,340 113,443 181,997 43,077 51,473 443,571 447,768 59,153 200,326 76,944 123,382 188,289 45,423 49,620 450,450 456, 193 62,302 200,960 77,842 123,118 192,931 48,566 54,309
471,766 477,077 64,458 210,197 82,442 127,755 202,422 51,397 56,708 501,015 492,829 66,042 212,190 88847 123,343 214,597 54,145 45,959 463,775 443,636 60,074 171,431 68,304 103,127 212,131 59,222 39,083 467,311 449,492 60,698 169,314 68,813 100,501 219,480 59,467 41,648
112,187 111,790 13,442 49,807 21,363 28,444 48,541 12,985 12,588 2 108,726 110,950 17,364 45,620 17,115 28,505 47,966 11,025 13,249 3 111,076 111,299 15,406 49,089 16,961 32,128 46,804 13,284 13,507 4 118,461 122,154 16,090 56,444 22,403 34,041 49,620 11,272 14,965
1 116,468 115,871 14,068 51,035 21,226 29,809 50,768 13,930 13,333 2 112,529 114,432 17,897 46,940 17,724 2夕,216 49,595 11,787 13,690 3 116,322 116,924 15,745 51,809 18,540 33,269 49,370 13,820 14,422 4 126,447 129,850 16,748 60,413 24,952 35,461 52,689 11,860 15,263
121,117 119,864 14,379 51,762 21,958 29,804 53,723 14,632 13,379 2 121,760 122,290 18,622 49,889 19,934 29,955 53,779 11,477 12,007 3 128,669 124,017 16,543 54,717 22,166 32,551 52,757 14,180 9,528 4 129,469 126,658 16,498 55,822 24,789 31’。33 54,338 13,856 11,045
1 117,162 110,114 13,112 43,374 18,564 24,810 53,628 16,064 9,016 2 114,732 109,837 16,785 39,879 15,362 24,517 53,173 13,754 8,859 3 115,037 109,430 14,929 42,774 15,609 27,165 51,727 15,156 9,549 4 116,844 114,255 15,248 45,404 18,769 26,635 53,603 14,248 11,659
1 111,192 104,629 12,888 37,703 15,545 22,158 54,038 16,606 10,043 2 115,843 111,295 16,451 39,884 15,807 24,077 54 960 14,259 9,711 3 118,244 113,089 15,434 44,029 17,407 26,622 53,626 15,197 10,042 4 122,032 120,479 15,925 47,698 20,054 27;644 56,856 13,405 11,852
120,880 116,300 13,815 45,263 20,760 24,503 57,222 15,241 10,661 2 121,744 120,097 17,959 44,547 18,547 26,000 57,591 13,973 12,326 3 124,888 120,595 15,516 48,441 20594 27,847 56,638 15,088 10,795
14

年
Year
1990
1991 1992 1993 1994 1995
1996 1997 1998 1999
1995
1996
1997
1998
1999
2000
表五按食品、消費品及服務劃分的私人消費開支
(丁) 以實質計算的按年變動百分率
Table 5 Private consump世on expenditure on food, consumer goods and services ( d) Year-on-year percentage changes in real terms
% 本地市場內貨物及服務的消費開支
Consumption expenditure in the domestic market
私人 消費品 本地居民在 非本地居民在
季 消費開支 合計 食品 Consumer goods 跟著每 外地的開支 本地市場的開支
小計 輯用品 非耐用品 Expenditure of Private Consumer Expenditure non-residents
consumption Consumer non- of residents in the domestic Qu甜er expenditure Total Food Sub-total durables durables Services abroad market
5.7 4.6 6.6 4.4 8.1 2.4 4.1 10.3 0.4
8.6 6.6 0.5 13.5 14.1 13.2 2.8 15.7 -2.7 8.5 9.7 0.5 15.2 21.6 11.4 7.4 5.1 15.9 7.5 7.1 4.2 9.5 10.5 8.8 5.7 11.3 7.2 6.7 5.6 9.1 6.7 3.5 8.8 3.5 5.4 -3.6 1.6 1.9 5.3 0.3 1.2 -0.2 2.5 6.9 9.4
4.7 4.6 3.5 4.6 5.9 3.8 4.9 5.8 4.4 6.2 3.3 2.5 0.9 7.8 -3.5 6.0 5.3 -19.0
-7.4 -10.0 -9.0 -19.2 -23.1 -16.4 -I.I 9.4 -15.0 0.8 1.3 1.0 -1.2 0.7 -2.5 3.5 0.4 6.6
1.9 1.7 3.8 3.7 5.9 2.1 -0.7 7.2 5.9 2 2.5 2.5 11.4 -1.7 -1.3 一2.0 3.8 8.1 7.1 3 0.8 1.3 2.7 -1.4 0.7 -2.5 3.7 7.1 11.9 4 1.1 2.0 3.0 0.6 -0.8 1.6 3.3 5.2 12.6
3.8 3.7 4.7 2.5 -0.6 4.8 4.6 7.3 5.9 2 3.5 3.1 3.1 2.9 3.6 2.5 3.4 6.9 3.3 3 4.7 5.1 2.2 5.5 9.3 3.6 5.5 4.0 6.8 4 6.7 6.3 4.1 7.0 11.4 4.2 6.2 5.2 2.0
4.0 3.4 2.2 1.4 3.4 * 5.8 5.0 0.3 2 8.2 6.9 4.1 6.3 12.5 2.5 8.4 -2.6 -12.3 3 10.6 6.1 5.1 5.6 19.6 -2.2 6.9 2.6 -33.9 4 2.4 -2.5 -1.5 -7.6 -0.7 -12.5 3.1 16.8 -27.6
-3.3 -8.1 -8.8 -16.2 -15.5 -16.8 -0.2 9.8 -32.6 2 -5.8 -10.2 -9.9 -20.1 -22.9 -18.2 -I.I 19.8 -26.2 3 -10.6 ” 11.8 -9.8 -21.8 -29.6 -16.5 -2.0 6.9 。24 -9.8 -9.8 -7.6 國18.7 -24.3 -14.2 -1.4 2.8 5.6
-5.1 -5.0 -1.7 -13.1 -16.3 -10.7 0.8 3.4 11.4 2 1.0 1.3 -2.0 * 2.9 -1.8 3.4 3.7 9.6 3 2.8 3.3 3.4 2.9 11.5 -2.0 3.7 0.3 5.2 4 4.4 5.4 4.4 5.1 6.8 3.8 6.1 -5.9 1.7
8.7 11.2 7.2 20.1 33.5 10.6 5.9 -8.2 6.2 2 5.1 7.9 9.2 11.7 17.3 8.0 4.8 -2.0 26.9 3 5.6 6.6 0.5 10.0 18.3 4.6 5.6 -0.7 7.5
*變動在±0.05%之內 * Change within ±0.05%
15

年 季
Year Qu甜er
1990
1991 1992 1993 1994 1995
1996 1997 1998 1999
1995 2 3 4
1996 2 3 4
1997 2 3 4
1998 2 ’3 、
4
1999 2 .) ’、
4
2000 2 3
表六按組成部分劃分的本地固定資本形成總額(甲) 以當時市價計算
Table 6 Gross domestic fixed capital formation by component
(a) At current market prices
本地固定資本 樓宇及建造 土地及樓宇 地產發展商 機器及設備
百萬港元
HKSmillion
形成總額 Buildim s and construction 的轉讓費用 的毛利 Machinery and ec uioment 公營 在營 公營 在蕾
Gross domestic 合計 部門 部門 Transfer Real estate 合計 部門 龍門
fixed capital Public Private costs of land developers’ Public Private formation Total Sector Sector 個d buildings margin Total Sector Sector
153,776 57,314 18,142 39,172 8,296 28,355 59,811 1,628 58,183
177,729 61,433 18,546 42,887 12,958 32,381 70,957 1,994 68963 213,808 63,056 20,414 42,642 17,917 44,610 88,225 1,901 86,324 245,182 73,201 30,334 42,867 19,873 56,833 95,275 2,730 92,545 301,112 90,031 36,255 53,776 21,320 74,885 114,876 3,734 111,142、
329,578 100,989 46,718 54,271 13,903 57,909 156,777 5,776 151,001
372,327 117,709 55,520 62,189 22,186 67,939 164,493 8,365 156128 444,963 134,490 53,142 81,348 37,867 88,774 183,832 9,563 174 269 383,210 138,192 50,916 87276 15,319 72,174 157,525 8509 149,016 316,652 125,992 55,258 70,734 12,049 44,854 133,757 8,741 125,016
75,919 25,596 12,277 13,319 3,184 15,207 31,932 1,667 30265 85,898 23,400 10,128 13,272 4,108 15,379 43,011 882 42,129 84,222 25,205 12,010 13 195 3,320 12,767 42,930 1,391 41,539 83,539 26,788 12,303 14,485 3,291 14,556 38,904 1,836 37068
84,793 30,795 16,428 14,367 4,203 14,386 35,409 2,489 32,920 92,034 26,205 11 348 14,857 5,190 16,405 44,234 1,415 42,819 90,479 27,589 12 484 15,105 5,072 15,959 41,859 2,213 39 646
105,021 33,120 15,260 17,860 7,721 21, 189 42,991 2,248 40,743
103,096 33,841 16,484 17,357 9,458 17,378 42,419 2,773 39 646 111,444 30,227 10,885 19,342 11,635 21,141 48,441 2,380 46,061 111,658 33,456 12,831 20 625 9,881 23,794 44,527 2,172 42,355 118,765 36,966 12,942 24,024 6,893 26,461 48,445 2,238 46,207
102,137 38,678 16,244 22,434 4,182 22,230 37,047 3,280 33,767 107,028 34,778 II 911 22,867 4,083 20,792 47,375 2,140 45,235 87,360 32,350 10,916 21,434 2,796 15,505 36,709 1,285 35,424 86,685 32,386 11,845 20541 4,258 13,647 36,394 1,804 34,590
79,148 35,622 16,496 19126 3,066 12,833 27,627 2,630 24 997 78,555 29,427 11,840 17,587 3,500 11,822 33,806 1,570 32,236 79,447 29,970 12 735 17235 2,889 10,742 35,846 2,045 33,801 79,502 30,973 14,187 16 786 2,594 9,457 36,478 2,496 33,982
~·,
79,373 3 J,326 15 258 16,068 2,984 ’9,577 35,486 2642 3之844
79,692 25,927 10,897 15,030 2,717 8,415 42,633 1,494 41 139 85,787 27,965 12,743 15,222 3,173 8,091 46,558 1,553 45 005
16
年 季
Year Qu甜er
1990
1991 1992 1993 1994 1995
1996 1997 1998 1999
1995 2 3 4
1996 2 3 4
1997 2 3 4
1998 2 3 4
1999 2 3 4
2000 2 3
表六按組成部分劃分的本地固定資本形成總額
(乙) 以價值計算的按年變動百分率
Table 6 Gross domestic fixe.d capital formation by component
(b) Year-on-year percentage changes in value terms
本地固定資本 樓宇及建造 土地及樓宇 地產發展商
%
機器及設備
形成總額 Buildim s and constn』ction 的轉讓費用 的毛利 Machinery and equipment 公營 在營 公營 私營
Gross domestic 合計 部門 都門 Transfer Real estate 合計 都鬥 部門
fixed capital Public Private costs ofland developers’ Public Private formation Total Sector Sector and buildings mar gm Total Sector Sector
12.9 17.6 13.9 19.4 8.6 16.0 8.0 -2.5 8.3
15.6 7.2 2.2 9.5 56.2 14.2 18.6 22.5 18.5 20.3 2.6 10.J -0.6 38.3 37.8 24.3 “ 4.7 25.2 14.7 16.l 48.6 0.5 10.9 27.4 8.0 43.6 7.2 22.8 23.0 19.5 25.4 7.3 31.8 20.6 36.8 20.J
9.5 12.2 28.9 0.9 -34.8 -22.7 36.5 54.7 35.9
13.0 16.6 18.8 14.6 59.6 17.3 4.9 44.8 3.4 19.5 14.3 -4.3 30.8 70.7 30.7 11.8 14.3 11.6
-13.9 2.8 -4.2 7.3 -59.5 -18.7 -14.3 -11.0 -14.5 -17.4 -8.8 8.5 -19.0 -21.3 -37.9 -15.I 2.7 -16.l
8.3 6.0 10.8 1.9 -53.4 -14.2 49.2 49.0 49.2 12.4 21.4 73.6 -1.3 -32.7 -19.4 34.5 41.1 34.3 13.5 12.8 33.9 -1.4 -28.0 -33.0 52.3 91.3 51.3 4.0 10.5 18.7 4.4 -12.9 -23.5 16.9 45.4 15.7
11.7 20.3 33.8 7.9 32.0 -5.4 10.9 49.3 8.8 7.1 12.0 12.0 11.9 26.3 6.7 2.8 60.4 1.6 7.4 9.5 3.9 14.5 52.8 25.0 -2.5 59.1 -4.6
25.7 23.6 24.0 23.3 134.6 45.6 10.5 22.4 9.9
21.6 9.9 0.3 20.8 125.0 20.8 19.8 11.4 20.4 21.1 15.3 -4.1 30.2 124.2 28.9 9.5 68.2 7.6 23.4 21.3 2.8 36.5 94.8 49.l 6.4 -1.9 6.8 13.1 11.6 -15.2 34.5 -10.7 24.9 12.7 -0.4 13.4
-0.9 14.3 -1.5 29.3 -55.8 27.9 -12.7 18.3 -14.8 -4.0 15.1 9.4 18.2 -64.9 -1.7 -2.2 -10.1 -1.8
-21.8 -3.3 -14.9 3.9 -71.7 -34.8 -17.6 -40.8 -16.4 -27.0 -12.4 -8.5 -14.5 -38.2 -48.4 -24.9 -19.4 -25.1
-22.5 -7.9 1.6 -14.7 -26.7 -42.3 -25.4 -19.8 -26.0 -26.6 -15.4 -0.6 -23.1 -14.3 -43.1 -28.6 -26.6 -28.7 -9.1 -7.4 16.7 -19.6 3.3 -30.7 -2.4 59.1 -4.6 -8.3 -4.4 19.8 -18.3 -39.l -30.7 0.2 38.4 且1.8
0.3 -12.l -7.5 “ 16.0 -2.7 -25.4 28.4 0.5 31.4 1.4 -11.9 -8.0 -14.5 -22.4 ”28.8 26.1 -4.8 27.6 8.0 -6.7 0.1 -11.7 9.8 -24.7 29.9 -24.1 33.1
17
年 季
Year Qu甜er
1990
1991 1992 1993 1994 1995
1996 1997 1998 1999
1995 2 3 4
1996 2 3 4
1997 2 3 4
1998 2 3 4
1999 2 3 4
2000 2 3
表六按組成部分劃分的本地固定資本形成總額
(丙) 以固定(一九九零年)市價計算
Table 6 Gross domestic fixed capital formation by component
(c) At constant (1990) market prices
本地固定資本 樓字及建造 土地及樓宇 地產發展商 機器及設備
百萬港元
HK$million
形成總額 Buildini?s and construction 的轉讓費用 的毛利 Machinezy and equipment 公營 在營 公營 在營
Gross domestic 合計 部門 部門 Transfer Real estate 合計 都門 部門
fixed capital Public Private costs ofland developers' Public Private formation Total Sector Sector and buildings mar gm Total Sector Sector
153,776 57,314 18,142 39,172 8,296 28,355 59,811 1,628 58,183
168,059 57,658 17,190 40,468 11,481 29,034 69,886 1,955 67;931 183,480 57,650 18,315 39,335 13,126 27,865 84,839 1,829 83,010 190,259 64,291 25,544 38,747 12,481 26,376 87,111 2,517 84,594 220,171 76,113 29,517 46,596 11,221 30,295 102,542 3,340 99,202 243,800 79,165 35,309 43,856 7,960 28,447 128,228 4,776 123,452
270,146 86,032 39,662 46,370 11,714 29,087 143,313 7,297 136,016 304,569 90,086 35,822 54,264 15,185 37,142 162,156 8,440 153,716 281,647 85,175 31,651 53,524 8,526 39,054 148,892 8,021 140,871 232,859 75,682 3之341 43,341 7,484 28,990 120,703 7859 112 844
56,935 20,549 9,522 11’。'27 1,725 7,364 27,297 1,424 25,873 61,634 18,370 7,585 10,785 2,268 7,454 33,542 688 32,854 63,226 19,771 9,231 10,540 2,010 6,502 34,943 1132 33,811 62,005 20,475 8,971 11,504 1,957 7,127 32,446 1,532 30,914
62,319 22,929 11,965 10,964 2,319 6,525 30,546 2,147 28399 67,217 19,204 8,070 11,134 2,834 7,312 37,867 1,213 36,654 66,731 20,228 8,932 11,296 2,798 7,068 36,637 l ’938 34,699 73,879 23,671 10,695 12,976 3,763 8,182 38,263 1999 36,264
72,685 23,272 11,243 12,029 3,845 7,765 37,803 2 471 35,332 76,154 20,428 7,345 13,083 4,517 9,067 42,142 2,071 40 071 74,704 22,382 8,684 13,698 3,982 9,641 38,699 1887 36,812 81,026 24,004 8,550 15,454 2,841 10,669 43,512 2 011 41,501
70,986 24,298 10,352 13,946 1,949 10,095 34,644 3 068 31,576 78,863 21,420 7,470 13,950 2,146 10,645 44,652 2 017 42,635 66,536 19,793 6,732 13,061 1,760 9,651 35,332 1,237 34,095 65,262 19,664 7,097 12 567 2,671 8,663 34,264 1,699 32 565
56,114 21,667 9,936 11,731 1,906 7,844 24,697 2,350 22,347 58,684 17,742 6,959 JO 783 2,060 7,398 31,484 1461 30,023 59,329 18,018 7;432 10586 1,846 7,190 32,275 1,841 30,434 58,732 18,255 8,014 10241 1,672 6,558 32,247 2 207 30,040
58,791 18,565 8 715 9850 1,851 6,330 32,045 2,385 29,660 61,566 15,968 6,358 9,610 1,850 6,111 37,637 1,320 36,317 67,069 17,387 7,473 9,914 2,217 6,205 41,260 1,377 39,883
18

年 季
Year Qua叮叮
1990
1991 1992 1993 1994 1995
1996 1997 1998 1999
1995 2 3 4
1996 2 .:> ’、
4
1997 2 3 4
1998 2 3 4
1999 2 3 4
2000 2 3
*變動在±0.05%之內
表六按組成部分劃分的本地固定資本形成總額
(丁) 以實質計算的按年變動百分率
Table 6 Gross domestic fixed capital formation by component
( d) Year-on-year percentage changes in real terms
本地固定資本 樓字及建造 土地及樓宇 地產發展商
%
機器及設備
形成總額 Buildings and construction 的轉讓費用 的毛利 Machinery and equipment 公營 私營 公營 私營
Gross domestic 合計 音在門 部門 Transfer Real estate 合計 韶鬥 部門
fixed capital Public Private costs of land developers' Public Private formation Total Sector Sector and buildings margin Total Sector Sector
8.1 8.0 5.8 9.0 6.8 14.2 5.8 -3.2 6.1
9.3 0.6 -5.2 3.3 38.4 2.4 16.8 20.1 16.8 9.2 * 6.5 -2.8 14.3 -4.0 21.4 -6.4 22.2 3.7 11.5 39.5 -1.5 -4.9 -5.3 2.7 37.6 1.9
15.7 18.4 15.6 20.3 -10.l 14.9 17.7 32.7 17.3 10.7 4.0 19.6 -5.9 -29.l -6.1 25.0 43.0 24.4
10.8 8.7 12.3 5.7 47.2 2.2 11.8 52.8 10.2 12.7 4.7 -9.7 17.0 29.6 27.7 13.1 15.7 13.0 開7.5 -5.5 -11.6 -1.4 -43.9 5.1 -8.2 -5.0 -8.4
-17.3 -11.1 2.2 -19.0 -12.2 -25.8 -18.9 -2.0 -19.9
12.0 0.3 5.0 -3.4 -49.9 2.0 38.6 38.3 38.6 9.5 12.5 62.8 -7.6 -29.3 -4.5 15.8 21.1 15.7
16.4 3.5 24.1 -9.6 -20.0 -16.8 40.5 76.6 39.5 5.6 1.4 7.4 -2.9 -4.9 -4.4 11.8 39.1 10.8
9.5 11.6 25.7 -0.6 34.4 -11.4 11.9 50.8 9.8 9.1 4.5 6.4 3.2 25.0 -1.9 12.9 76.3 11.6 5.5 2.3 -3.2 7.2 39.2 8.7 4.8 71.2 2.6
19.2 15.6 19.2 12.8 92.3 14.8 17.9 30.5 17.3
16.6 1.5 -6.0 9.7 65.8 19.0 23.8 15.1 24.4 13.3 6.4 -9.0 17.5 59.4 24.0 11.3 70.7 9.3 11.9 10.6 -2.8 21.3 42.3 36.4 5.6 -2.6 6.1 9.7 1.4 -20.J 19.1 -24.5 30.4 13.7 0.6 14.4
-2.3 4.4 -7.9 15.9 -49.3 30.0 -8.4 24.2 -10.6 3.6 4.9 1.7 6.6 ” 52.5 17.4 6.0 -2.6 6.4
-10.9 -11.6 -22.5 -4.7 -55.8 0.1 -8.7 -34.4 -7.4 -19.5 -18.1 -17.0 -18.7 -6.0 -18.8 -21.3 -15.5 -21.5
-21.0 -10.8 -4.0 -15.9 -2.2 -22.3 -28.7 -23.4 一29.2-25.6 -17.2 -6.8 -22.7 -4.0 -30.5 -29.5 -27.6 -29.6 -10.8 -9.0 10.4 -18.9 4.9 -25.5 -8.7 48.8 -10.7 -10.0 -7.2 12.9 -18.5 -37.4 -24.3 -5.9 29.9 -7.8
4.8 -14.3 -12.3 -16.0 -2.9 -19.3 29.8 1.5 32.7 4.9 -10.0 -8.6 -10.9 -10.2 -17.4 19.5 -9.7 21.0
13.0 -3.5 0.6 -6.3 20.1 -13.7 27.8 -25.2 31.0
* Change within ±0.05%
19

年 季 合計
Year Qu紅ter Total
1990 782,195
1991 926,973 1992 1,114,304 1993 1,261,827 1994 1,410,681 1995 1,609,762
1996 1,694,105 1997 1,754,125 1998 1,628,405 1999 1,642,651
1995 I . 352,693 2 397,625 3 437,786 4 421,658
1996 375,816 2 414,024 3 459,533 4 444,733
1997 387,831 2 432,048 3 467,987 4 466,261
1998 378,556 2 412,353 3 424,199 4 413,298
1999 348,376 2 392,859 3 445,724 4 455,691
2000 414,459 2 460,768 3 519,603
表七貨物出口及進口與服務輸出及輸入(甲) 以當時市價計算
Table 7 Exports and imports of goods and services (a) At current market prices
貨物出口與服務輸出 貨物進口與服務輸入
Exports of goods and services Imports of goods and services
貨物出口(離岸價)
Exports of goods (f.o.b.)
本地產品 貨物進口整體出口 出口 轉口 服務輸出 合計 (到岸價) 服務輸入
Exports Imports Imports Total Domestic of of goods of
Exports exports Re-exports services Total (c.i.f.) services
639,874 225,875 413,999 142,321 732,892 645,200 87,692
765,886 231’。45 534,841 161,087 882,856 782,042 100,814 924,952 234,124 690,829 189,352 1,072,704 958,462 114,242
1,046,250 223,027 823,223 215,577 1,198,704 1,075,710 122,994 1,170,013 222,092 947,921 240,668 1,398,494 1,254,427 144,067 1,344,127 231,657 1,112,470 265,635 1,656,583 1,495,706 160,877
1,397,917 212,160 1,185,758 296,188 1,710,787 1,539,851 170,936 1,455,949 211,410 1,244,539 298,176 1,799,738 1,619,468 180,270 1,347,649 188,454 1,159,195 280,756 1,614,621 1,432,423 182,198 1,349,000 170,600 1,178,400 293,651 1,576,699 1,395,521 181,178
290,656 50,588 240,068 62,037 366,969 327,262 39,707 332,569 57,485 275,084 65,056 425,913 386,417 39,496 370,026 63 802 306,224 67,760 439,295 397,036 42,259 350,876 5夕, 783 291,093 70,782 424,406 384,991 39,415
307,287 47;564 259 723 68,529 389,926 348,066 41,860 342,773 51,697 291,076 71,251 428,980 387,880 41,100 382,902 57,243 325 659 76,631 446,844 402,323 44,521 364,956 55,656 309,300 79,777 445,037 401,582 43,455
313,958 44,667 269,291 73,873 408,069 363,146 44,923 357,030 51,201 305,829 75,018 448,314 406,453 41,861 392,971 58,828 334,143 75,016 473,042 425,089 47,953 391,992 56,715 335,277 74,269 470,314 424,781 45,533
310,964 41,368 269,596 67,592 390,718 344,429 46,289 345,841 49,326 296514 66,512 424,674 381,435 43,239 352,354 51,805 300 548 71,845 406,018 359,238 46,780 338,491 45,955 292 537 74,807 393,211 347,321 45,890
283,055 36,327 246 728 65,321 342,320 296,609 45,711 325,470 41,788 283,683 67,389 381,254 338,346 42,908 367,635 46,779 320,856 78,089 422,366 374,775 47,591 372,839 45,706 327,134 82,852 430,759 385,791 44,968
339,574 41,486 298,088 74,885 410,046 364,361 45,685 381,572 44,304 337,268 79,196 451,922 407,236 44,686 432,067 50,405 381663 87,536 498,579 449,379 49,200
20
百萬港元
HK$million
貨物出口與服務輸出
誠貨物進口
與服務輸入
Exports less
imports of goods and
services
49,303
44,117 41,600 63,123 12,187
-46,821
-16,682 -45,613 13,784 65,952
-14,276 -28,288
-1,509 -2,748
-14,110 -14,956 12,689
-304
-20,238 -16,266
-5,055 -4,053
-12,162 -12,321 18,181 20,087
6,056 11,605 23,358 24,932
4,413 8,846
21,024
年 季 合計
Year Quarter Total
1990 12.1
1991 18.5 1992 20.2 1993 13.2 1994 11.8 1995 14.1
1996 5.2 1997 3.5 1998 -7.2 1999 0.9
1995 1 18.2 2 15.7 3 14.5 4 9.1
1996 6.6 2 4.1 3 5.0 4 5.5
1997 1 3.2 2 4.4 3 1.8 4 4.8
1998 1 -2.4 2 -4.6 3 -9.4 4 -11.4
1999 -8.0 2 -4.7 3 5.1 4 10.3
2000 19.0 2 17.3 3 16.6
表七貨物出口及進口與服務輸出及輸入(乙) 以價值計算的按年變動百分率
Table 7 Exports and imports of goods and services
(b) Year-on-year percentage changes in value terms
% 貨物出口與服務輸出 貨物進口與服務輸入
Exports of goods and services Im po此s of goods and services
貨物出口(離岸價)
Exports of goods (f.o.b.) 本迪產品 貨物進口
整體出口 出口 轉口 服務輸出 合計 (到岸價) 服務輸入
Exports Imports Imports Total Domestic of of goods of
Exports exports Re-缸;ports services Total (c.i.f.) services
12.2 0.8 19.5 11.9 15.0 14.2 21.5
19.7 2.3 29.2 13.2 20.5 21.2 15.0 20.8 1.3 29.2 17.5 21.5 22.6 13.3 13.l -4.7 19.2 13.8 11.7 12.2 7.7 11.8 -0.4 15.1 11.6 16.7 16.6 17.1 14.9 4.3 17.4 10.4 18.5 19.2 11.7
4.0 -8.4 6.6 11.5 3.3 3.0 6.3 4.2 -0.4 5.0 0.7 5.2 5.2 5.5
-7.4 -10.9 -6.9 -5.8 -10.3 -11.5 1.1 0.1 -9.5 1.7 4.6 -2.3 -2.6 -0.6
20.1 13.1 21.7 10.2 25.9 27.5 14.0 16.7 6.5 19.1 11.2 20.8 21.5 13.8 15.3 3.9 18.0 10.3 18.2 18.9 11.8 8.9 -3.4 11.9 9.9 10.9 11.3 7.3
5.7 -6.0 8.2 10.5 6.3 6.4 5.4 3.1 -10.1 5.8 9.5 0.7 0.4 4.1 3.5 -10.3 6.3 13.1 1.7 1.3 5.4 4.0 -6.9 6.3 12.7 4.9 4.3 10.2
2.2 -6.1 3.7 7.8 4.7 4.3 7.3 4.2 -1.0 5.1 5.3 4.5 4.8 1.9 2.6 2.8 2.6 -2.1 5.9 5.7 7.7 7.4 1.9 8.4 -6.9 5.7 5.8 4.8
-1.0 -7.4 0.1 -8.5 -4.3 -5.2 3.0 -3.l -3.7 -3.0 -11.3 -5.3 -6.2 3.3
-10.3 -11.9 -10.1 -4.2 -14.2 -15.5 -2.4 -13.6 -19.0 -12.7 0.7 -16.4 -18.2 0.8
-9.0 -12.2 -8.5 -3.4 自12.4 -13.9 -1.2 -5.9 -15.3 -4.3 1.3 -10.2 -11.3 -0.8 4.3 -9.7 6.8 8.7 4.0 4.3 1.7
10.1 -0.5 11.8 10.8 9.5 11.1 -2.0
20.0 14.2 20.8 14.6 19.8 22.8 -0.l 17.2 6.0 18.9 17.5 18.5 20.4 4.1 17.5 7.8 19.0 12.1 18.0 19.9 3.4
21

年 季 合計
Year Quarter Total
1990 782,195
1991 899,622 1992 1,064,219 1993 1,199,006 1994 1,316,878 1995 1,461,273
1996 1,540,954 1997 1,621,942 1998 1,557,608 1999 1,623,317
1995 323,898 2 362,412 3 393,741 4 381,222
1996 341,346 2 378,475 3 416,553 4 404,579
1997 355,825 2 400,132 3 430,902 4 435,083
1998 357,343 2 394,495 3 404,571 4 401,199
1999 343,206 2 389,456 3 439,603 4 451,052
2000 411,548 2 458,748 3 514,134
表七貨物出口及進口與服務輸出及輸入(丙) 以固定(一九九零年)市價計算
Table 7 Exports and imports of goods and services
(c) At constant (1990) market prices
貨物出口與服務輸出 貨物進口與服務輸入
Exports of goods and services Imports of goods and services
貨物出口(離岸價)
Exports of goods (五o.b.)
本地產是 貨物進口整體出口 出口 轉口 服務輸出 合計 (到岸價) 服務輸入
Exports Imports Imports Total Domestic of of goods of
Exports 研:ports Re-exports services Total (c.i.f.) services
639,874 225,875 413,999 142,321 732,892 645,200 87,692
750,677 22久015 523,662 148,945 865,382 767,796 97,586 899,418 227,430 671,988 164,801 1,045,113 938,058 107,055
1,021,022 217,138 803,884 177,984 1,170,819 1,057,538 113,281 1,127,276 212,200 915,076 189,602 1,329,229 1,206,013 123,216 1,262,522 216,346 1,046,176 198,751 1,497,651 1,371,848 125,803
1,322,954 198,119 1,124,835 218,000 1,562,883 1,430,864 132,019 1,404,124 202,369 1,201, 755 217,818 1,671,065 1,533,705 137,360 1,343,716 186,393 1,157,322 213,892 1,565,207 1,424,031 141,176 1,392,823 172,884 1,219,938 230,494 1,567,342 1,425,939 141,403
276,875 48,215 228,660 47,023 336,801 304,928 31,873 313,395 53,976 259,419 49,017 382,910 352,261 30,649 343,417 58,524 284,893 50,324 394,709 362,139 32,570 328,835 55,631 273,204 52,387 383,230 352,519 30,711
290,375 44,656 245,719 50,971 353,558 320,895 32,663 325,515 49,114 276,401 52,960 392,066 360,179 31,887 360,309 52,737 307,572 56,244 408,605 374,375 34,230 346,754 51,611 295 143 57,825 408,654 375,415 33,239
302,106 42 893 259,213 53,719 375,474 341,331 34,143 345,607 49,070 296,537 54,525 417,086 385,120 31,966 376,266 55,887 320,379 54,636 437,508 401,119 36,389 380,145 54,519 325,626 54,938 440,996 406,134 34,862
306,485 40,891 265,594 50,858 371,341 335,695 35,646 343,801 48,752 295,049 50,694 411,862 - 378,341 33,521 349,814 50 660 299,154 54,757 395,408 358,863 36,545 343,616 46,090 297.526 57,583 386,596 351,132 35,464
291,876 3咒 184 254,692 51,330 336,548 301,193 35,355 336,830 42,630 294,199 52,626 382,045 348,400 33,645 378,134 46,663 331,471 61,469 420,640 383,372 37,268 385,983 46,407 339,576 65,069 428,108 392,973 35,135
352,348 43,191 309,157 59,200 405,306 370,029 35,277 396,512 46,184 350,328 62,236 448,943 414,015 34,928 444,930 50,498 394 432 69,204 492,478 454,008 38,470
22
百萬港元
HK$million
貨物出口與服務輸出
滅貨物進口與服務輸入
Exports less
imports of goods and
services
49,303
34,240 19,106 28,187
-12,351 -36,378
-21,929 -49,123
-7,599 55,975
” 12,903 -20,498
-968 -2,008
-12,212 -13,591
7,948 -4,075
-19,649 -16,954
-6,606 -5,913
-13,998 -17,367
9,163 14,603
6,658 7,411
18,963 22,944
6,242 9,805
21,656

年 季 合計
Year Qu甜er Total
1990 8.4
1991 15.0 1992 18.3 1993 12.7 1994 9.8 1995 11.0
1996 5.5 1997 5.3 1998 -4.0 1999 4.2
1995 15.5 2 11.7 3 11.2 4 6.5
1996 I 5.4 2 4.4 3 5.8 4 6.1
1997 4.2 2 5.7 3 3.4 4 7.5
1998 0.4 2 -1.4 3 -6.1 4 -7.8
1999 -4.0 2 -1.3 3 8.7 4 12.4
2000 19.9 2 17.8 3 17.0
表七貨物出口及進口與服務輸出及輸入
(丁) 以實質計算的按年變動百分率
Table 7 Exports and imports of goods and services
( d) Year-on-year percentage changes in real terms
% 貨物出口與服務輸出 貨物進口與服務輸入
Expo此s of goods and services Imports of goods and services 貨物出口(離岸價)
Exports of goods (f.o.b.)
本地產品 貨物進口整體出口 出口 轉口 服務輸出 合計 (到岸價) 服務輸入
Exports Imports Imports Total Domestic of of goods of
Exports 白;ports Re-exports services Total (c.i.f.) services
9.6 -0.5 16.0 3.6 11.5 11.4 12.1
17.3 0.5 26.5 4.7 18.1 19.0 11.3 19.8 0.2 28.3 10.6 20.8 22.2 9.7 13.5 -4.5 19.6 8.0 12.0 12.7 5.8 10.4 -2.3 13.8 6.5 13.5 14.0 8.8 12.0 2.0 14.3 4.8 12.7 13.8 2.1
4.8 -8.4 7.5 9.7 4.4 4.3 4.9 6.1 2.1 6.8 -0.1 6.9 7.2 4.0
-4.3 -7.9 -3.7 -1.8 -6.3 -7.2 2.8 3.7 -7.2 5.4 7.8 0.1 0.1 0.2
17.6 10.8 19.2 4.8 19.7 21.7 3.0 12.7 3.3 14.9 5.6 12.6 13.6 2.7 12.2 1.3 14.8 4.7 12.5 13.5 2.2 6.8 -5.2 9.7 4.3 7.4 8.0 0.5
4.9 -7.4 7.5 8.4 5.0 5.2 2.5 3.9 -9.0 6.5 8.0 2.4 2.2 4.0 4.9 -9.9 8.0 11.8 3.5 3.4 5.1 5.4 -7.2 8.0 10.4 6.6 6.5 8.2
4.0 “ 3.9 5.5 5.4 6.2 6.4 4.5 6.2 -0.1 7.3 3.0 6.4 6.9 0.2 4.4 6.0 4.2 -2.9 7.1 7.1 6.3 9.6 5.6 10.3 -5.0 7.9 8.2 4.9
1.4 -4.7 2.5 -5.3 -1.1 -1.7 4.4 -0.5 -0.6 -0.5 -7.0 國1.3 -1.8 4.9 -7.0 -9.4 -6.6 0.2 -9.6 -10.5 0.4 -9.6 -15.5 -8.6 4.8 -12.3 -13.5 1.7
-4.8 -9.1 -4.1 0.9 -9.4 -10.3 -0.8 -2.0 -12.6 -0.3 3.8 -7.2 -7.9 0.4 8.1 -7.9 10.8 12.3 6.4 6.8 2.0
12.3 0.7 14.1 13.0 10.7 11.9 -0.9
20.7 16.2 21.4 15.3 20.4 22.9 -0.2 17.7 8.3 19.1 18.3 17.5 18.8 3.8 17.7 8.2 19.0 12.6 17.1 18.4 3.2
23
百萬港元
HK$million
表八 按經濟活動劃分的本地生產總值(以當時價格計算)
Table 8 GDP at current prices by economic activity
工業
Industry
拉發、零售、
農業及 採礦及 電力、錄氣 進出口貿易、 還輸、倉庫
年 漁業 合計 採石業 製造業 及水游業 建造業 4口』t自l.L 欽食及酒店業 及通訊業
Wholesale, retail and
的iportlexport
Mining Electricity, trades 了ransport,
Agriculture and gas restaurants storage and
Year and fishing Total quarηling Manufacturing and water Construction Total and hotel』 communications
以當時價格計算的本地生產總值 GDP at current prices
1980
1981
1982
1983
1984
1985
1986
1987
1988
1989
1990
1991
1992
1993
1994
1995
1996
1997
1998
1999
1,102 42,652
1,128 52,424
1,240 54,992
1,225 64,183
1,245 77,232
1,211 75,891
1,308 89,820
1,334 107 685
1,417 121,121
1,386 132,992
1,432 141,394
1,441 145,625
1,468 152,943
1,612 153,459
1,596 156,103
1,453 163,426
1,444 175,127
1,464 181,184
1,530 174,632
1,149 164,940
33869667940257971A2l5 ,4
,Jnυ
,
inycJd
守信
J
?-
7.
yd
勻,anu
向yd
勻,
ira
句/《
Unu
2233233222222I233233 4υ7
,
nυqtuny
弓,aκυqd
,Jnυ74qdn
句句
JS’,
AVOYOyny
?J
O574293l375268576445 85023I870l3275377085 Fh7仆史的厄扎「Rhk叫
K叫。叫
nH叫后圳身的7ho舟,向7仆
dH?軒的叫η均”、內
33345568999999888876 3ny
尚且
ny7
,,且,
Jlnynu
『4I7lfwoony2KU2
024386899612397781446 72276636
,486565l59253
1
之三
4ia
&
nRaaz
--
7~
zi
試試
244
IlFIlly4222233
8,929 90,698
12,385 111,159
13,371 126,974
l之885 136,107
12,917 161,312
l之679 176,771
14,253 204,880
17,024 257,776
20,658 315,717
25,738 364,557
30,220 416,620
34,659 484,448
3久337 577,709
43,089 675,098
46,325 792,472
54,761 851,235
65,058 953,642
71,650 1,050,386
69,937 994,813
64, 715 988,167
28,762
33,449
36,602
41,204
55,503
5咒943
66,020
89,249
109,793
124,749
140,722
163,284
190,760
224,462
249,167
270,520
301,277
313,270
288,081
284,656
22990923547473997906 20628299052029098213 ny
勻,BAUZJduduydKUAUKUnykU
弓,enyza
,
d
《UOOZJ
,
I
R
之
4aaa4
.La4zaIhaZZL
之久的的
2424ytgd
句4
弓,e
零J
’,d守
mJKU7
,弓
Jnynυr41AnυFA
’,4,iIaIA
,i
估本地生產總值(以要素成本計算)的百分比 Percentage contribution to GDP at factor cost
1980
1981
1982
1983
1984
1985
1986
1987
1988
1989
1990
1991
1992
1993
1994
1995
1996
1997
1998 1999
5 少於 0.05%
87765544333222211111 --
...
E
...........
nunununununUAUnununununununUAUnU
<Unununu
31.7
31.8
30.。31.9
32.2
29.9
30.3
29.4
27.6
26.7
25.3
23.l
20.9
18.5
16.4
16.1
15.5
14.7
14.9 14.3
2222llFallsuPOUROun9susdpg6usurJnou nHmn肌
nunυn
肌
nH肌nH的A肌肉趴
23.7
22.8
20.8
22.9
24.3
22.1
22.6
22.0
20.5
19.3
17.6
15.4
13.6
11.2
9.2
8.3
7.3
6.5
6.1
5.7
qdd句。
oda7duTrooOKU93
弓,銜,Jsd
,
I
,
igJ
尚Jd
“7d9nYAυ
2 .. AF4
,
4
弓,身?u
勻4
弓,&弓4
弓,a
?-
7u勻,e
弓,e
?’?﹒呵,身勻,-7e
?自司d
24
6
,Jqwdq4
的υ
。okυ7
弓,dd兮,Jrt2ny400
。。
06
677
.
65
.
1444
.
iii514151
丘
5.
67.5
67.5
69.3
67.5
67.3
69.6
69.2
70.3
72.。73.1
74.5
76.7
78.9
81.3
83.4
83.8
84.4
85.2
85.。85.6
21.4
20.3
2位。
20.4
23.1
22.8
22.3
24.3
25.l
25.0
25.2
25.9
26.l
27.0
2丘2
26.6
2反7
25.4
24.6
24.7
4.
H哼哼J
勻,ap0
,
49SKUJAnyqJKυ7
’,
2
月/
ZAO094
,旬,2
777
.在
7.
8aaaa
玖玖玖玖玖
a
玖玖玖玖
’,a

服務業
Services
金融、
保險、地產
及商用版發業
Financing, insurance, real estate
and business services
30,938
39,361
41,197
35,563
3久454
40,739
50,306
65,707
8之813
97,297
113,127
143,296
178,923
214,550
254,346
247,985
284,119
322,618
282,686
269,787
23.0
23.9
22.5
17.6
15‘ 6
16.0
I土。
17.9
18.9
19.5
20.2
22.7
24.4
25.8
26.8
24.4
25.1
26.2
24.1
23.4
§ Less也an0.05%
表八 按經濟活動劃分的本地生產總值(以當時價格計算)
Table 8 GDP at current prices by economic ac討.vity
非直接 以要素成本 以市價 以市價
社區、 計算的 計算的本地 計算的本地 計算的本地
社會及 金融中介 生產總值 生產 生產總值 生產總值
值人鼓務業 種字業權 服發調整 (以生產面編製) 及入口稅 (以生產面媚製) (以開支面插製)
Adjustment Gross Gross Gross for financial domestic domestic domestic
Communi紗, intermediation product at Taxes on product at product at
social and Ownership services factor cost production market prices market prices
personal of indirectly (production- and (production- (expenditure-
services premises measured based) imports based} based)
16,248 12,028 -7,200 134,451 5,965 140,417 141,796
21,320 15,152 -10,325 164,711 7,010 171,721 170,750
27,880 18,631 -11,405 183,205 6,812 190,018 192,488
32,163 22,496 -11,848 201,515 8,273 209,788 212,673
37,003 24,396 -11,725 239,789 9,493 249,282 256,493
42,511 26,671 -11,722 253,873 12,463 266,337 271,655
47,406 30,034 -13,079 296,008 15,212 311,220 312,561
53,011 35,859 -1久 743 366,795 20,445 387,240 384,488
61,002 43,416 -21,313 438,255 21,450 459,706 455’。2270,124 51,534 -23,800 498,935 25,390 524,326 523,861
81,328 59,257 -30,741 559,446 29,614 589’。60 582,549
94,293 68,873 -45,902 631,514 36,323 667,837 668,512
110,703 80,941 -54,846 732,120 48,777 780,897 779,335
130,408 89,862 -63,177 830,169 53,278 883,447 897,463
151,293 115,659 -70101 950,172 56,286 1,006,458 1,010,885
175,956 134,933 -80,358 1,016,115 52,974 1,069’。89 1,077,145
198,967 14久547 -89,356 1,130,212 62,443 l,192,656 1,191,890
220,451 171,383 -90,164 1,233,034 85,001 1,318’。35 1,323,862
233,009 170,974 -89,446 1,170,976 62,538 1,233,514 1,261,437
247,399 169,723 -93,533 1,154,257 55,846 1,210,103 1,233,133
12.1 8.9 -5.4 100.0
12.9 9.2 ” 6.3 100.0
15.2 10.2 -6.2 100.0
16.0 11.2 -5.9 100.0
15.4 10.2 -4.9 100.0
16.7 10.5 -4.6 100.0
16.0 10.1 -4.4 100.0
14.5 9.8 -4.8 100.0
13.9 9.9 -4.9 100.0
14.1 10.3 -4.8 100.0
14.5 10.6 -5.5 100.0
14.9 10.9 -7.3 100.0
15.1 ll.1 -7.5 100.0
15.7 10.8 -7.6 100.0
15.9 12.2 -7.4 100.0
17.3 13.3 -7.9 100.0
17.6 13.1 -7.9 100.0
17.9 13.9 -7.3 100.0
19.9 14.6 -7.6 100.0
21.4 14.7 -8.1 100.0
25
百萬港元
HK$million
統計差額
(百分比〉
Statistical
discrepancy
(%)
-1.0
0.6
-1.3
-1.4
-2.8
-2.0
-0.4
0.7
1.0
。 I1.1
-0.1
0.2
-1.6
-0.4
-0.7
0.1
-0.4
-2.2
-1.9

年
Year
1980
1981
1982
1983
1984
1985
1986
1987
1988
1989
1990
1991
1992
1993
1994
1995
1996
1997
1998
表九 選定經濟活動的增加價值(以當時價格計算)
Table 9 Value added at current prices for selected economic activities
百萬港元
HK$million
批發、零售、進出口貿易、飲食及酒店業 金融、保險、地產及商用服務業
Wholesale, retail and import/export trades, restaurants and hotels Financing, insurance, real estate and business services
進出口 商用
合計 批發業 零售業 質易業 飲食業 酒店業 合計 金融業 保險業 地產業 服務業
Import/ Wholesale Retail export Insurance Real Business
Total 甘ade 甘ade 甘ade Res ta叮曲的 Hotels Total Financing services estate services
28,762 2,528 6,576 14,357 4,007 1,295 30,938 8,760 869 18,269 3,040
33,449 2,777 7,540 16,262 5,257 1,613 39,361 11,487 1,280 22,370 4,224
36,602 2,875 8,098 18,040 5,779 1,810 41,197 12,926 1,349 22,272 4,650
41,204 2,992 7,758 22,070 6,313 2,071 35,563 13,103 1,527 15,387 5,546
55,503 3,747 10,004 31,748 7,311 2,693 37,454 14,177 1,631 15,249 6,397
57,943 3,963 10,660 32,045 8,149 3,126 40,739 14,278 2,005 16,750 7,706
66,020 4,299 11,127 37,563 9,236 3,796 50,306 18,362 2,226 20,271 9,448
89,249 5,758 14,454 52,600 11,652 4,784 65,707 23,767 2,827 26,733 12,379
109,793 6,349 17,912 65,606 13,840 6,087 82,813 26,057 3,560 36,815 16,381
124,749 7,246 19,895 73,065 17,750 6,793 97,297 29,781 4,269 45,354 17,892
140,722 9,458 20,156 85,593 18,689 6,826 113,127 34,600 4,555 54,068 19,903
163,284 10,046 24,052 101,999 19,959 7,229 143,296 54,142 5,418 60,181 23,555
190,760 10,884 27,731 119,806 23,293 9,046 178,923 69,602 6,609 75,558 27,154
224,462 13,148 29,655 145,646 25,354 10,659 214,550 83,272 9,201 91,581 30,495
249,167 13,069 34,731 162,124 27,370 11,872 254,346 88,785 11,868 117,698 35,996
270,520 14,098 32,884 184,571 26,244 12,723 247,985 94,487 11,824 100,480 41,194
301,277 15,397 36,871 207,128 27,446 14,434 284,119 112,300 11,104 115,326 45,388
313,270 14,815 37,826 217,712 29,587 13,330 322,618 124,505 10,764 134,186 53,163
288,081 13,493 29,781 209,507 26,628 8,673 282,686 109,487 10,816 112,842 49,542
26

年
Year
1993
1994
1995
1996
1997
1998
1999
1999
2000
表十 本地居民生產總值、按人口平均計算的本地居民生產總值
及本地居民可支配總收入
季
Qu叫er
2
3
4
1
2
Table 10 Gross National Product (GNP), per capita GNP
and Gross National Disposable Income (GNDI)
本地居民生產總值 按人口平均計算的女︱ 本地居民可支配總收入〈一以當時市價計算 本地居民生產總值 一以當時市價計算
一以當時市價計算
GNP Per capita GNP 女 GNDIA
at current at current at current market prices market prices market prices
(百萬港元) (港元) (百萬港元)
(HK.$ million) (HK.$) 。王K$ million)
910,708 (.) 154,331 (.) N.A.
1,022,925 ( 12.3) 169,488 ( 9.8) N.A.
1,097,656 ( 7.3) 178,304 ( 5.2) N.A.
1,192,078 ( 8.6) 183,841 ( 3.1) N.A.
1,334,337 ( 11.9) 203,275 ( 10.6) 1,321,870
1,290,199 (- 3.3) 194,143 (-4.5) 1,277,835
1,260,409 (- 2.3) 187,541 (- 3.4) 1,249,000
294,689 (-) 291,905
305,727 (-) 302,987
326,548 (,) 323,631
333,444 (-) 330,476
313,118 ( 6.3) 309,771
316,973 ( 3.7) N.A.
括號內數字表示按年變動百分率。 Figures in brackets refer to year-on-ye訂 percentage changes. (﹒)不適用 (.) Not applicable N.A. 沒有數字 N.A. Not available 合參考詮釋23 *see note 23 〈參考註釋31 " see note 3 1
27

表十一 按收益組成部分的對外要素收益流動以當時市價計算
Table 11 External Factor Income Flows (EFIF) by income component at current market prices
百萬港元
HK$million
年 季 收益組成部分類別 對外要素收益主流動總額 直接投資收益 有價證券投資收益 其他投資收益 僱員報酬
Type of Direct investment Portfolio investment Other investment 臼mpensation of Year Qu甜.er income component TotalEFIF mcome mcome mc心'me employees
1997 流入總計Inflow Total 469’。34 ( 19.4) 193,093 ( 53.8) 96,494 ( 14.1) 178,790 ( -1.8 657 ( 19.7) 流出總計
Outflow Total 458,560 ( 16.8) 244,884 ( 21.7) 40,646 ( 43.5) 172,373 ( 6.2) 657 ( 19.7) 流動淨值總計
Net flow Total 10,475 -51, 791 55,849 6,417 。1998 流入總計
Inflow Total 362,719 ( -22.7) 124,999 ( -35.3) 74,444 ( -22.9) 162,913 ( -8.9) 363 ( -44.7) 流出總計
Outflow Total 333,957 ( -27.2) 136,350 ( -44.3) 24,696 ( -39.2) 172,548 ( 0.1) 363 ( -44.7) 流動淨值總計
Netjlow Total 28,762 -11 351 49,748 -9,635 。1999 流入總計
Inflow Total 366,919 ( 1.2) 133,369 ( 6.7) 91,035 ( 22.3) 142,403 ( -12.6) 112 ( -69.1) 流出總計
Outflow Total 339,642 ( 1.7) 204,108 ( 49.7) 26,583 ( 7.6) I 08,839 ( -36.9) 112 ( -69.1) 流動淨值總計
Netflow Total 27,276 -70,738 64,450 33,565 。1999 流入總計
Inflow Total 84,046 (.) 26,600 (.) 22,592 (.) 34,805 (-) 49 (.) 流出總計
Outflow Total 75,429 (.) 38,508 (.) 5,092 (.) 31,780 (-) 49 (.) 流動淨值總計
Netflow Total 8,616 -11’908 17,499 3,025 。1999 2 流入總計
Inflow Total 91,069 (.) 32,695 (.) 24,315 (.) 34,036 (.) 23 (.) 流出總計
Outflow Total 88,146 (.) 51,761 (.) 8,510 (.) 27,852 (.) 23 (.) 流動淨值總計
Netjlow Total 2,923 -19 066 15 805 6,184 。1999 3 流入總計
Inflow Total 92,244 (-) 33,388 (.) 23,761 (.) 35,076 (.) 19 (.) 流出總計
Outflow Total 82,528 (.) 51,868 (.) 4,424 (.) 26,217 (.) 19 (-) 流動淨值總計
Net flow To的l 9,716 -18,479 19336 8,859 。1999 4 流入總計
Inflow Total 99,560 (-) 40,686 (.) 20,367 (.) 38,486 (.) 21 (.) 流出總吉十
Outflow Total 93,539 (.) 61,971 (.) 8,557 (.) 22,990 (-) 21 (.) 流動淨值總計
Netflow To的l 6,021 -21,285 11,810 15,497 。2000 流入總計
Inflow Total 108,264 ( 28.8) 45,136 ( 69.7) 23,922 ( 5.9) 39,186 ( 12.6) 20 ( -59.7) 流出總計
Outflow Total 99’。38 ( 31司 73,771 ( 91.6) 2,989 ( -41.3) 22,259 ( -30.0) 20 ( -59.7) 流動淨值總計
Net flow τotal 9,226 -28,635 20,934 16,927 。2000 2 流入總言十
Inflow Total 102,759 ( 12.8) 41,483 ( 26.9) 23,463 ( -3.5) 37,799 ( 11.1) 13 ( -43.9) 流出總計
Outflow To個1 96,381 ( 9.3) 62,297 ( 20.4) 11,554 ( 35.8) 22,516 ( -19.2) 13 ( -43.9) 流動淨值總計
Net flow To的l 6,378 -20814 11’909 15,283 。
括號內數字表示按年變動百分率。 Figures in brackets refer to year-。n-y1目r perc個個1ge changes. (-)不適用 (.) Not appli阻ble
28

表十二 以一九九零年為基年計算的實質本地總收入、實質本地居民總收入及以固定(一九九零年)市價計算的本地居民生產總值
Table 12 Real Gross Domestic Income (1990-based), Real Gross National Income (1990-based) and Gross National Product at constant (1990) market prices
年 季
Year Qu甜er
1993
1994
1995
1996
1997
1998
1999
1999
2000
+參考註釋 29
~參考註釋 30
2
3
4
2
本地生產總值
一以固定
(一九九零年)市價計算
Gross Domestic
Product at
Constant (1990) Market Prices
(1)
690,223 ( 6.1)
727,506 ( 5.4)
755,832 ( 3.9)
789,753 ( 4.5)
829,017 (5.0)
785, 166 ( -5.3)
809,474 ( 3.1)
183,313 ( -2.9)
192,546 ( 1.1)
212,640 ( 4.4)
220,976 ( 9.2)
209,270 ( 14.2)
213,571 ( 10.9)
括號內數字表示按年變動百分率。
(寸不適用
貿易價格@
比率變動的調整
Terms of@
Trade
Ac句us個ent
。)
33,421
23,777
-5,995
6,791
6,893
21,546
9,649
-704
4,218
4,300
1,835
-1,880
-1,017
#實質對外要素收益流動淨值的數字是將名義對外婆素收益
流動淨值用本地內部需求內含平滅物價指數予以平滅。
本地內部需求=私人消費開支+政府消費開支
+本地固定資本形成+存貨增減
@貿易價格比率變動的調整
以當時價格計算的出口總額 以當時價格計算的出口總額
進口的價格指數 出口的價樹體
請注意在這襄「貿易」包括貨物貿易及服務貿易﹒
實質本地+ 實質對外要素#
總收入 收益流動淨值
Real Net#
External Factor Real Gross+ Income Flows
Domestic Income (EFIF) (3)=(!)+σ) (4)
723,644 ( 7.7) 10,510
751,283 ( 3.8) 8,919
749,837 ( -0.2) 14,457
796,544 ( 6.2) 126
835,910 ( 4.9) 6,717
806,712 ( -3.5) 18,276
819,123 ( 1.5) 17,648
182,609 ( -4.5) 5,436
196,764 ( 0.5) 1,858
216,940 ( 2.2) 6,412
222,811 (7.4) 3,942
207,390 ( 13.6) 6,255
212,554 ( 8.0) 4,307
+ See note 29
~ See note 30
實質本地居民~
總收入
Real Gross ~ National Income
(5戶(3)+(4)
734,154 (
760,202 ( 3.5)
764,294 ( 0.5)
796,670 ( 4勾
842,627 ( 5.8)
824,988 ( -2.1)
836,771 ( 1.4)
188,045 (
198,622 (
223,352 (
226,753 (
213,645 ( 13.6)
216,861 ( 9.2)
Figures in brackets refer to year-o軒”訂戶叩開旭ge changes.
(-) Not applicable
百萬港元
HK$million
本地居民生產總值
一以固定(一九九零年)市價計算
Gross National
Product at
Constant (1990) Market Prices
(6持(!)+(4)
700,733 (
736,425 ( 5.1)
770,289 ( 4.6)
789,879 ( 2.5)
835,734 ( 5.8)
803,442 ( -3.9)
827,122 ( 2.9)
188,749 (
194,404 (
219,052 (
224,918 (
215,525 ( 14.2)
217,878 ( 12.1)
# Real Net EFIF is estimated by deflating Nominal Net EFlF using the implicit price deflator of Domestic Demand.
29
Domestic Demand =Private Consumption Expenditure + Government Consumption Expenditure + Gross Domestic Fixed Capital Formation + Changes in Inventories
@ Terms of Trade Adjustment
The value of 回:ports at current pri晶 The value of 目::ports at current pri喝
Thepri曲 ind位 of imports Thepri自 ind位。f血:ports
It should be noted 曲at "tr:叫e” here includes both回de in goods and個dein
seJ"Vlces

詮釋
本地生產總值的概念與編製方法
1. 本地生產總值是指一個國家或地區的所有
常住生產單位,在一個指定的期間內,未扣除固
定資本消耗的生產總值。如果一個生產單位以一
個國家或地區的經濟領域為其經濟利益中心’這
生產單位就是該國家或地區的常住單位。一個國
家或地區的經濟領域,是指該國家或地區的政府
所管汁的地域,而在該領域內的人士、貨物及資
本均可自由流動。
2. 於一九九七年七月一日,香港成為中華人民共和國的特別行政區。在本系列報告書中就一九
九七年七月或以後的統計資料而言,「香港」是
指香港特別行政區。香港特別行政區與中國內地
之間的經濟交易,視作國際交易(例如貨物質易
及服務質易)
3. 一個國家或地區的「按人口平均計算的本地
生產總值」是指把該國家或地區在某統計年的
「:本地生產總值」除以該國家或地區在該年的人
口總數而得的數字。自二零零零年八月,「居住
人口」方法已取代「廣義時點」方法以編製人口
估計。追溯至一九九六年的修訂人口數字經己編
製。由一九九六年起的人均本地生產總值已作出相應修訂。-
4. 本地生產總值可由不同方面計算。香港的本
地生產總值按年數字分別以開支面和生產面編
製,而按季數字則只以開支面編製。
5. 從開支面編製的本地生產總值,是將作最終
用途的貨物和服務的總產值,扣除其進口成分而
得。它是以下開支組成部分的總和:一
﹒括Zλ將貨眉宇三古是住戶和為住戶服務的私
人非牟利機構在貨物和服務方面的最終
消費開支價值。計算方法是把本地市場
內對貨物及服務的消費開支,加上本港
居民在外地的開支,減去非本地居民在
本地市場的開支。
• ilit府將安局¥]~是非參與商業活動的各個
政府部門及非牟利半政府機構用於購買
貨物及服務的開支。政府消費開支的計
算方法,是將僱員報酬加上購買貨物及
服務支出,扣除銷售貨物及服務的收
入。參與商業活動的政府部門並不包括
在內。這些政府部門和非參與商業活動
政府部門的分別,是前者所生產的貨物
和服務主要是售予市民使用。
Explanatory Notes
Concepts and methods for compiling GDP
I. GDP is a meas叮e of the total value of production of all resident producing units of a coun叮 or teπit。可 in a specified period, before deducting allowance for consumption of fixed capital. A producing unit is considered as a resident in a coun叮or territory if it maintains a centre of economic interest in the economic territory of that coun甘y or teπit。可﹒ The economic teπitory of a country or territory is the geographic te汀itory
administered by the government of the cou叮叮 or teπitory
within which persons, goods 扭扭 capital circulate 企eely.
2. On 1 July 1997, Hong Kong became a Special Adminis甘ative Region of the People’s Republic of China. In respect of statistics in this series of report,“Hong Kong" stands for the Hong Kong Special Adminis甘ative Region with effect from July 1997. Data on 甘ansactions vis-a-vis the mainland of China are 甘eated as international 甘ansactions (e.g. 甘ade in goods and trade in services).
3. Per capita GDP of a coun甘y or teπitory is obtained by dividing total GDP in a year b!'_ the population of that coun叮 orterritory in the same ye訂. Since August 2000, the "resident population” approach has been adopted in place of the “extended de facto" approach for compiling population estimates and revised population figures backdated to 1996 have been compiled. Per capita GDP 企om 1996 onwards have been revised accordingly.
4. GDP can be measured using di宜erent approaches. For Hong Kong, annual GDP is compiled using the expenditure approach and the production approach while qua巾rly GDP is only compiled using the expenditure approach.
5. Under the ex~enditure approach, GDP is equal to the value of goods and services produced for final use less their import content. It is the sum of the following expenditure components:.
30
• Private consumption expenditure refers to the value of all expenditure by the household sector and private nonprofit institutions serving households on goods and services for final consumption. It is calculated as the sum of consumption expenditure on goods and services in the domestic market and the expenditure of Hong Kong residents abroad less the expenditure of non-residents in the domestic market.
• Government consumption expenditure refers to 也ecurrent expenditure on goods and services by government dep釘tments which 訂e not engaged in trading activities and quasi-government non-profit institutions. It is calculated as the sum of compensation of employees and purchases of goods and services less receipts 企om sales of goods and services. Government departments engaged in 甘ading activities 訂e not covered. They are distinguished 企om other goveπunent departments in that they 訂e engaged in the production of goods and services mainly for sale to the public.

.本地圈定資本形成總額包握有甚望于1區建
造、機器及設備的投資總值、地產發展
商的毛利和土地及樓宇的轉讓費用。這
些數字是按公營及私營部門分類列出,
公營部門的數字是指政府、半政府部門
和公營機構的資本開支。
• 1¥至于在書源是指商業機構(主要是製造商
及分銷商)所持有的半製成晶、原料及製
成晶存貨的實質增減價值。
﹒質物出口及服發輸出減去貨物進口及服
主亨矗才λ :貨物出口包括以離岸價計算的
本地產品出口和貨物轉口總值。貨物進
口是指以到岸價計算的貨物進口總值。
貨物質易包括用作工業用途的黃金。服
務輸入及輸出包括本港居民與世界各地
進行的服務交易。
6. 以生產面編製的本地生產總值是本地各生產單位(例如工廠、商店、服務機構)的「增加
價值」的總和。一個生產單位的「增加價值」是
其生產的貨物和服務的價值(「生產總額」)減
去在其生產過程中耗用的貨物和服務的價值
(「中間投產消耗」)
7. 以生產面編製的本地生產總值的其中一種
主要用途,是反映一個國家或地區的經濟結構轉
變。因此,在編製此數列時,會分析各個別經濟
活動對於整體本地生產總值的貢獻。
8. 以開支面編製的本地生產總值分別以「當時
市價」及「固定(一九九零年)市價」編製。以
生產面編製的本地生產總值的按年數列,則以當
時市價編製。
9. 本地生產總值內含平減物價指數(或簡稱本
地生產總值平減物價指數)通常會用作概括地量
度一個經濟體系的整體通貨膨脹。這個指數涵蓋
有關消費、投資和進出口的價格變動。
10. 編製以固定市價計算的開支面本地主產總
值時,會採用一個標準的平減物價方法。每個開
支組成部分固定價格數值的計算方法,是把經平
減物價的各個分項組成部分加起來﹔而這些分項
組成部分固定價格數值的編製,是探用適當的物
價指數平減以當時價格計算的數值,或是根據基
年的價格而將現時數量重新計算而得。把以固定
價格計算的各個開支組成部分進一步相加起
來,便取得以固定價格計算的本地生產總值。然
後,將以當時價格計算的本地生產總值,除以以
固定價格計算的本地生產總值,便可以隱含方式
計算出本地主產總值平減物價指數。使用類似方
法,將每個以當時價格計算的本地生產總值組成
部分,除以相應的固定價格數值,便可以隱含方
• Gross domestic fzxed c中ital戶·rmation covers the gross value of investment expenditure on buildings and construction as well as machinery and equipment; real estate developers' m訂gin﹔ and transfer cost of land and buildings. Statistics 訂e classified into public and private sectors. Public sector denotes capital expenditure of governme肘, quasi-government institutions and public c。中orations.
• Changes in inventories refers to the value of physical change in the inventories of work-in-progress, raw materials and finished goods held by business ente中rises,
mainly manufacturers and dis甘ibutors.
• Exports of goods and services less imports of goods and services: Exports of goods include domestic exports and re-exports of merchandise recorded on f.o.b. basis, and imports of goods are valued at c.i.f., covering all merchandise imports. Trade in goods includes gold for in du甜ial use. Exports and imports of services cover transactions in services between Hong Kong residents and the rest of the world.
6. The production-based GDP is the sum of the value added of resident producing units, e.g. factories, shops, service organizations. Value added of a producing unit is the value of goods and services it produces ('gross output’) less the value of goods and services it uses up in the course of production (‘intermediate consumption').
7. One of the main uses of production-based GDP is to monitor changes in the economic structure of a coun甘y or territory. Hence, production-based GDP is compiled with analyses on the contribution of individual economic activities to total GDP.
8. Expenditure-based GDP is compiled at current market prices and at constant (l 990) market prices. Annual series of production-based GDP at cuπent market prices is also compiled.
9. The implicit price deflator of GDP (or GDP deflator in sho此) is generally used as a broad measure of overall inflation in the economy. It takes account of all price changes relating to consumption, investment, exports and imports.
10. In compiling the expenditure-based GDP at constant market prices, a standard deflation approach is adopted. The constant price measure of each expenditure component is obtained by adding up the respective deflated sub-components, each of the latter is compiled either by deflating the current price value using an appropriate price index, or by revaluing the current period quantities at base year prices. The constant price expenditure components 訂e h吋ier aggregated to arrive at the constant price GDP. Then, the GDP deflator is implicitly obtained by dividing the current price GDP by the constant price GDP. Similarly, by dividing each of the GDP components at C叮rent prices with each of the co汀esponding constant price figures, the respective implicit price deflators for individual expenditure components 訂e implicitly obtained. Hence as it stands, the implicit price deflators of GDP and its expenditure
31

式計算出個別開支組成部分的相關內含平減物
價指數。因此,本地生產總值及其開支組成部分
的內含平滅物價指數,並不是用以計算有關的固
定價格數值的。
編製本地生產總值的資料來源
11. 編製開支面本地生產總值的資料來源,包括
對外質易統計、對工商機構及住戶的按年、按季
及按月統計調查、政府脹目、各政府部門及其他
組織的行政資料。至於生產面本地生產總值,資
料來源主要包括從「按年經濟統計調查計劃」及
行政紀錄所得的資料。
本地生產總值數字發布的名稱法
12. 香港某一期間的本地生產總值,首次公布的
數字稱為「初步數字」。當獲得更多資料後,這些數字會作出修訂。這是符合世界各國的一般做
法,要盡早編製和發表本地生產總值數字,雖然
當時只有不齊全的資料可供採用。其後經修訂的
數字稱為「修訂數字」。已採納了全部定期資料
來源所得的數據而編製成的數字,則為最終的本
地生產總值。
本地生產總值的修訂及公布辦法
13. 從開支面編製的按年本地生產總值初步數
字,是在統計年度結束後約兩個月公布。至於從
生產面編製的按年本地生產總值初步數字,由於
資料所限,只能在該統計年度結束後約十一個月
發表。隨後,已發表的本地生產總值開支面及生
產面的按年數字便會根據最新資料作出修訂。每
年的最終數字會在該統計年度結束後第三年的
三月份公布。本地生產總值的概念架構及編製方
法,詳述在每年三月份出版的本地生產總值年刊
內。
14. 本地生產總值按季開支面的初步數字,在統
計季度結束後約兩個月公布。這些按季數列其後
會根據最新資料作出修訂,尤其是在修訂其按年
數字時。本地生產總值按季的最新數字是刊載在
本地生產總值季刊內。
15. 本刊物內一九九八年及以後的數列,在得到
更多資料時會作出修訂。
本地生產總值按季數字應用時須注意的要
點
16. 本地生產總值按季數列,提供最新資料,用
作評估當時的經濟表現。但在應用這些資料時,
應該留意,由於數據所限,本地生產總值及其組
成部分的按季數列,有時會作出重大修訂。普遍
來說,本地生產總值按季數列的準確程度,是較
components are not used as input for compiling the coπesponding constant price measures.
Data sources for compiling GDP
11. The data sources used for compiling expendit叮e-based
GDP include external trade statistics, annual, quarterly and monthly s叮veys on indus甘ial/business establishments and on households, government accounts and adminis甘ative data 企om
government departments and other organizations. As for production-based GDP, data sources mainly cover data collected 企om the Programme of Annual Economic Surveys and administrative records.
Nomenclature for data release of GDP
12. In Hong Kong, the first release of GDP in respect of a period is called “Preliminary fig叮es". When more data become available, the preliminary fig叮es will be revised. This routine is in accord個ce with international practice to compile and release GDP fig叮es at the earliest possible time by using only partial data. All those fig叮es published subsequently, on revision,訂e called “Revised figures". The figures 位e finalized when data 企om all regular sources 訂E incorporated.
Revision and publication schedule of GDP
13. For annual expenditure-based GDP, preliminary figures 訂e released about two months after the reference year. For annual production-based GDP, preliminary fig叮es are released about eleven months after the reference ye訂 because of data limitation. Subsequently, both expenditure-b品ed and production-based annual GDP fig叮es 訂e revised based on latest information available until they become finalized around the third March after the reference year. Conceptual :framework and methods of compiling GDP are detailed in the annual publication on Gross Domestic Product published in March each ye且
14. Preliminary figures for quarterly expenditure-based GDP are released about two months after the reference quarter. The quarterly series 訂e then revised and released based on latest information available, in particular when the annual figures 訂erevised. Latest quarterly GDP 訂e published in the qu訂terly
report on Gross Domestic Product.
15. In 血is report, GDP series for the year 1998 and onwards 釘e subject to further revision as more data become available.
Caution on the use of quarterly GDP figures
16. quarterly GDP provides 一 up-to-date information for assessing the current economic performance. However, users should note that qu訂terly series of GDP and its components 訂e
sometimes subject to large revision because of data limitations. Generally speaking, the qu訂terly series 訂e less precise than the
32

其按年數列為低。
經季節性調整的本地生產總值
17. 本地生產總值按季數字是會受季節性變動
影響。例如第三季及第四季的本地生產總值,通
常會高於同年的第一季及第二季。因此,在比較
相連兩季的價值時,必須十分小心。不過,如計
算按年河季的增長率,即是把某一季的數字與上
一年同季比較,則大致上可剔除這些季節效應。
18. 本地生產總值及其一些組成部分(包括私人
消費開支、政府消費開支、貨物出口、服務輸出、
貨物進口和服務輸入)的經季節性調整數列,現
時已有編製。然而,由於本地資本形成總額並沒
有明顯的季節性模式,所以並沒有編製這個組成部分的經季節性調整數列。
19. 經季節性調整的數列,由於季節性效應就統
計方法而盲已予剔除,所以相連兩個季度的數字
可以進行更有意義的比較。將本地生產總值原來
數列的按年變動數字與經季節性調整數列的相
連季度變動數字一起進行分析,能更清楚看到本
地生產總值的趨勢,尤其是在經濟出現轉折點的
時候。
各組成部分在本地生產總值的按年實質變
動百分率中所估的比率
20. 各組成部分在本地生產總值實質變動中所
估的比率,是量度個別組成部分的變動對本地生
產總值變動的影響。計算個別組成部分i在本地
生產總值的按年實質變動百分率中所估的比率
的方法如下:-
GDP i.t _ GDP i.r-l
GDP 叫x 100
其中GDP i.t表示本地生產總值中第i個組成部分
在t這段期間的固定價格數字﹔
GDP i.r-1表示本地生產總值中第i個組成部分
在t-1 這段期間的固定價格數字:
GDP ←l表示本地生產總值在t﹒ l 這段期間的
固定價格數字。
本地居民生產總值的概念與編製方法
21. 本地居民生產總值是指一個經濟體系內的
居民,由從事各項經濟活動所賺取的收益,不論
該等經濟活動是否在該經濟體系內進行。換言
之,編製本地居民生產總值應包括本地居民在經
annual series.
Seasonally adjusted GDP
17. Quarterly GDP fig叮es are subject to seasonal variations. For instance,甘1e value of the GDP are nonnally higher in 伽third and fo凹由 quarters than in the first and second quarters of the same year. Therefore, great c訂e has to be exercised in comparing the value of a quarterly GDP with that for 也epreceding qu訂ter. Such seasonal effects, nevertheless, may be largely removed by calculating the ye訂-on-year growth rate, which compares a qu訂terly figure with the coηesponding one 詛 the precedi時 ye缸
18. Seasonally adjusted data series 訂e currently compiled for the aggregate GDP and some of· its components, including private consumption expenditure, government consumption expenditure, exports of goods, exports of services, imports of goods and imports of services. However, seasonally adjusted data series is not compiled for gross domestic capital fonnation as no clear seasonal pattern is found in this component.
19. In the seasonally a吐justed series, seasonal effects have been removed statistically, thus enabling meaningful quarterto-qu訂ter comparison. When the ye訂﹒on-ye訂 quarterly
changes in the original GDP series and the qu訂ter-to-quarter
changes in the seasonally 叫justed GDP series 訂e analysed together, the 甘end of the GDP can be more clearly discerned, P前ticularly in regard to turning points in the economy.
Component contributions to year-on-year rate of change in real terms of GDP
20. The contributions to the percentage change in GDP provide a measure of the composition of GDP rate of change that is at甘ibutable to changes in individual components. The contribution of component i is calculated as follows :.
GDPi.t - GDP 心I
GDPr-I x 100
where GDP i.t refers to the constant price figure of ith component
of GDP at period t;
GDP i.t-l refers to the constant price figure of ith
component of GDP at period t. l ;
GDP 叫 refers to the constant price figure of total GDP at
period t-L
Concepts and methods for compiling GNP
21. GNP is a meas叮e of the total income earned by residents of an economy 企om engaging in various economic activities, iπespective of whether the economic activities 訂e carried out within the economic territory or outside. In other words, in compiling GNP, earnings of residents 企om various economic
33

濟領域內或領域外從事各類經濟活動的收益,而
扣除非本地居民在領域內從事經濟活動的收
益。
22. 計算本地居民生產總值,可用以下方程式:
本地居民主產總值=本地生產總值
十本地居民從經濟領域
外所賺取的要素收益
一非本地居民在經濟領
域內所賺取的要素收
益
23. 一個國家或地區的「按人口平均計算的本地
居民生產總值」是指把該國家或地區在某統計年
的「:本地居民生產總值」除以該國家或地區在該
年的人口總數而得的數字。自二零零零年八月,「居住人口」方法已取代「廣義時點」方法以編
製人口估計。追溯至一九九六年的修訂人口數字
經己編製。由一九九六年起的人均本地居民生產
總值已作出相應修訂。
24. 以固定市價計算的本地居民生產總值是以
固定市價計算的本地生產總值加上實質對外要
素收益流動淨值而得來。計算實質對外要素收益
流動淨值的方法須將名義對外要素收益流動淨
值用「本地內部需求內含平減物價指數」予以平
滅。
25. 實質本地居民總收入是量度一個經濟體系內的實質購買力的指標。計算實質本地居民總收
入,是把以固定市價計算的本地生產娟、值、質易
價格比率變動的調整和實質對外要素收益流動
淨值加起來。
26. 於一九九七年七月一日,香港成為中華人民
共和國的特別行政區。香港特別行政區與中國內
地之間的經濟交易、資產與負債數據,視作對外
交易及對外頭寸。因此,香港與內地之間的要素
收益流動,視作對外要素收益流動,並計算在香
港的本地居民主產總值之內。
27. 對外要素收益流動的分類,基本上類似國際
貨幣基金在一九九三年公布的國際收支手冊內
收入帳目的標準組成部分。這些收益組成部分稱
為直接投資收益、有價證券投資收益、其他投資
收益及僱員報酬。
• .Blff皮賞投產是指本地居民從直接投資
在經濟領域外的業務所賺取的收益,而
對該業務有持久利益或在管理方面真有
相當程度的影響力和控制權。這些收益
屬於公司間債務的淨利息收益、分發紅
利的收益、未分發利潤的分額及租金。
activities within or outside the economic territory 訂e included, whereas earnings of non-residents from economic activities within the economic territorγare excluded.
22. GNP is estimated by the following formula:
GNP =GDP
+ Factor income earned by residents 企om outside the economic territory
- Factor income earned by non-residents 企omwithin the economic territory
23. Per capita GNP of a coun訂y or territory is obtained by dividing GNP in a year by the population of 也at country or te叮itory in the same year. Since August 2000,也e “residentpopulation" approach has been adopted in place of the “extended de facto" approach for compiling population estimates and revised population figures backdated to 1996 have been compiled. Per capita GNP 企om 1996 onwards have been revised accordingly.
24. GNP at constant market prices 訂e obtained by adding to GDP at constant market prices the real net External Factor Income Flows (EFIF). Real net EFIF is obtained by deflating nominal EFIF using the implicit price deflator of domestic demand.
25. Real Gross National Income (RGNI) is a meas叮e of real purchasing power of an economy. RGNI is obtained by adding terms of trade 吋ustment and real net EFIF to GDP at constant market prices.
26. On 1 July 1997, Hong Kong became a Special Adminis甘ative Region of the People’s Republic of China. Data on transactions and assets and liabilities vis-a-vis the mainland of China (the Mainland) are 甘eated as external 甘ansactions and external positions respectively. Hence, factor income flows between Hong Kong and the Mainland are 甘·eated as external factor income flows and are covered in Hong Kong’s GNP figures.
27. The classification of EFIF is basically similar to the classification of standard components of the Income Account of the Balance of Payments Manual (BPM) published by the International Monetary Fund in 1993. These income components are direct investment income (DII), portfolio investment income (PII), other investment income (OII) and compensation of employees (CE).
34
• Direct Investment Income refers to earnings of residents from direct investment in business outside the economic teπitory, in which they have a lasting interest and a degree of influence or con甘ol over 也e management. These e訂nings are in the form of net interest receipts on intercompan~ debts, receipts of dis甘ibuted dividends, share of undistributed profits and gross rentals.
國際收支手冊指明對外投資在地產亦屬一
種直接投資。根據統計慣例,一個經濟體系
的土地及其他不動產及實物(例如樓宇)
只可由該經濟體系的居民所擁有。假如一個
香港居民在經濟領域外擁有地產,他會被視
為在該有關經濟體系擁有一間名義上的公
司,而這公司則擁有該地產。此等名義公司
與該等土地及建築物的法權擁有人的關係,可視作直接投資關係。
﹒予字會若丟失皮膏投產是指本地居民從投資
非本地股本(即股票)及債券(例如可
轉讓存款證、債券及票據)所得的收益。
與進行直接投資的投資者相比,有價證
券投資者在投資非本地企業所發行的股
票及債券時,對該等企業並無持久的利
益或在管理方面有任何影響力。凡持有
一聞公司不足 100/o股分,則作為有價證
券投資論。
• #1當皮主fl&.lJ.旨是指從其他非本地財務債
權及負債所得的對外利息收益流動,而
這些收益並不屬於直接投資收益或有價
證券投資收益。該等非本地財務債權及
負債包括短期及長期非市場上買賣的貸
款、存款、財務租約、賀易信貸等。
﹒倉貞軒昂f是指非本地居民從香港經濟領
域內作短期受僱及本地居民從經濟領域
外作短期受僱所賺取的勞工收益,包括
工資、薪金及其他現金或實物報酬。
本地居民生產總值的資料來源
28. 本地居民主產總值是根據本地生產總值及
「對外申索、負債及收益調查」所得的對外要素
收益流動數據編製,並輔以由其他來源所得資
料。這項調查是根據普查及統計條例進行。
實質本地總收入、實質本地居民總收入和本
地居民可支配總收入
29. 實質本地總收入是將本地生產總值加上貿
易價格比率變動的調整計算而得。這指標所量度
的實質本地總收入,能反映實質生產額的對外購
買力。由於進出口價格的相對變動,引致以一定
數量的出口產品所能換取的進口產品有所改
變。計算質易價格比率變動的調整是
x x (一一一),其中X為以當時價格計算的貨物出
Pm Px 口和服務輸出的總值, Pm為貨物進口及服務輸
入的價格指數, Px為貨物出口及服務輸出的價
格指數。
External investment in real estate, as specified by BPM, is also a form of direct investment. By statistical convention, land and other immovable structures and objects (e.g. building) in an economy can only be owned by residents of that economy. If a Hong Kong resident owns real estate outside the economic territory of Hong Kong, he should be regarded as owning a nominal company in the economy in question which in tum owns the real estate. The relationship between such nominal company and legal owner of the land and structures is then 甘eated as a direct investment relationship.
• Por.φlio Investment Income refers to earnings of residents 企om investment in non-resident equ江ies (i.e. stocks and sh訂es) and debt securities (e.g. negotiable certificates of deposits, bonds and bills). Compared with investors making direct investme前, portfolio investors in equity and debt securities of non-resident business ente中rises have no lasting interest or influence in the management of the companies they invest. A holding of less than 10% of equity in a company is regarded as portfolio investment.
• Other Investment Income refers to external flows of interest incomes derived 企om other financial claims on and liabilities to non-residents that are not classified as DII or PII. Examples of these claims and liabilities include short-term and long-term non-marketable loans, deposits, financial leases and trade credit.
• Compensation of Employees refers to labour income earned by non-residents from their short-term employment within the economic territory of Hong Kong and labour income earned by residents from their shortte口n employment outside the economic territory of Hong Kong. It comorises wao-es, salaries and other 0 t"' 0
remuneration whether paid in cash or in kind.
Data Sources for Compiling GNP
28. GNP is compiled based on GDP and data on EFIF collected from the Survey of External Claims, Liabilities and Income ~SECLI), supplemented by data 企om other sources. The survey is conducted under the provision of the Census and Statistics ordinance.
Real Gross Domestic Income, Real Gross National Income and Gross National Disposable Income
29. Real Gross Domestic Income (RGDI) is calculated as the GDP plus terms of trade adjustment. It reflects the external purchasing power of the real output,的 the relative movements in import and exports prices result in a varying volume of imports being exchangeable for a given volume of exports. The
x x terms of trade 吋ustment is calculated as (一一-一), where
Pm Px X is the total value of exports of goods and services at current prices, Pm the price index for imports of goods and services and Px the price index for exports of goods and services.
35

30. 實質本地居民總收入是將實質對外要素收
益流動淨值加進實質本地總收入。它是量度某一
經濟體系的居民所賺取的總收入所帶來的實質
購買力。
31. 本地居民可支配總收入是將本地居民生產
總值加上經常轉移淨值計算而得。這指標反映本
地居民可用於最終消費和儲蓄總額的收入。
有關刊物
32. 有關本地生產總值及本地居民生產總值的
詳細概念和編製方法,請參閱「:本地生產總值,
一九六一年至一九九九年」年刊。
本地生產總值一九六一年至一九九九年(每本$60)
30. Real Gross National Income (RGNI) is obtained by adding to RGDI the real net EFIF. It measures the real purchasing power of the total income earned by residents of an economy.
31. Gross National Disposable Income is derived as the GNP plus net cu汀ent 甘ansfers. It meas叮自由e income available to
residents for final consumption and gross saving.
Further reference
32. For more details on the concept and compilation methods of GDP and GNP, please refer to 由e report “Gross Domestic
Product, 1961 to 1999’,.
有關刊物
+ 此年刊在二零零零年三月份發表。內容包括本地生產總值由一九七三年第一季至一九九九年第四季的按季數列及自
一九六一年至一九九九年的按年數列。並詳細說明本地生產總值的概念、定義、資料來源及編製方法。
+ 此刊物備有中英文版,於下列地點發售:
. 香港金鐘道六十六號金鐘道政府合署低座地下,政府刊物銷售處。
. 香港灣停港灣這十二號灣仔政府大樓十九樓,政府統計處刊物出版組。
Further Reference
Gross Domestic Product 1961to1999 個 $60 per copy)
-9- This annual publication was released in March 2000. It contains the entire series of quarterly GDP from 出e first quarter of 1973 to the fourth quarter of 1999 and annual series of GDP from 1961 to 1999. Detailed concep包, definitions, da包 sources and compilation methods of GDP 釘e also included.
-9- This publication is available in sep訂ate English and Chinese versions and can be purchased 企om:
• Government Publications Centre, Ground Floor, Low Block, Queensway Government Offices, 66 Queensway, Hong Kong. . Publications Un尬, Census and Statistics Dep缸tment, 19th Floor, Wanchai Tower, 12 Harbour Road, Wan Chai, Hong Kong.
36

11/2000 J35730003BO $12
香港特別行政區政府新聞處投計
政府印務局印 t所Rill\聽取材自可再生林木﹜Designed by the Information Services Department Printed by the Printing Department Ho ng Kong Special Administrative Region Government (Printed on paper made rrom 叭·oodpulp derived rrom renewable forest s)