中国赴美房地产投资 - assets.kpmg
112
China Inbound Investing in U.S.Real Estate 中国赴美 房地产投资 July 2016 kpmg.com/us 2016 Semi-Annual Update 2016年上半年分析报告
-
Upload
khangminh22 -
Category
Documents
-
view
0 -
download
0
Transcript of 中国赴美房地产投资 - assets.kpmg
China Inbound Investing in U.S.Real Estate中国赴美 房地产投资
July 2016
kpmg.com/us
2016 Semi-Annual Update2016年上半年分析报告

@2016 KPMG LLP, a Delaware limited liability partnership and the U.S. member firm of the KPMG network of independent member firms affiliated with KPMG International Cooperative (“KPMG International”), a Swiss entity. All rights reserved.

Contents 目录
Executive summary 02
摘要U.S. real estate market overview 18
美国房地产市场概况Forms of investment in U.S. real estate 70
美国房地产投资形式Taxation 78
税务事项Valuation modeling norms in the U.S. 98
资产评估模型标准KPMG services to Chinese investors 102
毕马威为中国投资者热忱服务Contact us 108
联系我们
@2016毕马威会计师事务所,美国特拉华州的有限责任合伙,并为毕马威国际合作组织(“毕马威国际”)相关联的独立成员所网络中的美国成员公司。毕马威国际属瑞士实体公司。版权所有,不得转载。
China Inbound Investing in U.S. Real Estate中国赴美房地产投资

Executive summary
OverviewChinese investors have long looked towards U.S. real estate as a core investment as evidenced by the inflow of Chinese capital into the U.S. real estate market in recent years. The United States remains the principal place for Chinese outbound capital with the United States taking approximately USD10 billion of total Chinese inbound investment, of which approximately USD4.37 billion is invested in commercial properties.1
1 Cushman & Wakefield, Chinese Outbound Investment Jumps to a Record High of USD$21.37 Billion in 2015, March 30, 2016, http://www.businesswire.com/news/home/20160330005489/en/Chinese-Outbound-Investment-Jumps-Record-High-US21.37. Real Capital Analytics
-
2
4
6
8
10
12
2010 2011 2012
U.S. Property Acquisitions by Chinese Investors
US
D B
illio
ns
2013 2014 2015
ChinaSource: Real Capital Analytics, 2016
Chinese investment in U.S. real estate is a long-term phenomenon. That said, over time, there will be periods of high volume investment and periods of low volume investment, which will be driven by economic conditions, availability of suitable investments and geopolitical considerations.
Phil Marra, National Real Estate Funds Leader, KPMG LLP
“ “
@2016 KPMG LLP, a Delaware limited liability partnership and the U.S. member firm of the KPMG network of independent member firms affiliated with KPMG International Cooperative (“KPMG International”), a Swiss entity. All rights reserved.

摘要
总述从中国资金近几年流入美国房地产市场趋向表明,中国投资者已长期把美国房地产投资作为海外核心投资。美国仍是中国对外资本投资的主要目的地。中国在2015年对外投资总额约为100亿美元,其中43.7亿投资于美国商业楼盘。1
1 Cushman & Wakefield, 中国2015年对外投资高达创纪录的213.7亿美元, 2016年3月30日 http://www.businesswire.com/news/home/20160330005489/en/Chinese-Outbound-Investment-Jumps-Record-High-US21.37. Real Capital Analytics
-
2
4
6
8
10
12
2010 2011 2012
中国投资者收购的美国房地产
十亿
美元
2013 2014 2015
中国数据来源: Real Capital Analytics
中国对美国房地产的投资是一种长期现象。这意味着在经济环境、可投资机会以及地缘政治等因素驱动下,中国赴美房地产投资会随着时间的推移出现投资高峰期与低谷期。
Phil Marra, 美国房地产基金主管, 毕马威美国分所
“ “
@2016毕马威会计师事务所,美国特拉华州的有限责任合伙,并为毕马威国际合作组织(“毕马威国际”)相关联的独立成员所网络中的美国成员公司。毕马威国际属瑞士实体公司。版权所有,不得转载。
3China Inbound Investing in U.S. Real Estate
中国赴美房地产投资

Chinese developers focused on development assets, and by 2015 they took the lead on ground-up development projects without the aid of U.S.-domiciled joint venture partners. On the other hand, Chinese individuals have been focusing on office building, residential (multifamily), hotel, industrial, and retail assets, while institutions turned their attention to operating assets. As a result of the Chinese Insurance Regulatory Commission encouraging Chinese insurance companies to increase overseas investments, Chinese insurance companies invested directly in U.S. mature commercial properties and office buildings with stable income. Office remains the most popular asset class, accounting for 40 percent of total Chinese outbound capital in 2015, but the KPMG 2016 Real Estate Outlook Survey result indicates there are still quality properties in play; at the same time, it is getting significantly harder to attain sufficient returns.
Chinese insurance companies are permitted to invest up to 15 percent of its assets overseas but Chinese insurers currently invest just 1 percent of their assets overseas. This suggests there is still significant potential for Chinese insurers to increase their overseas investments. As Chinese insurers’ overseas real estate holdings are expected to grow to nearly 5 percent by 2019, which is equivalent to an additional investment of USD73 billion,2 we expect the United States to receive a significant portion of that additional investment. Discussions with Chinese investors indicate the next wave of Chinese investments to the United States to focus on senior care communities (e.g., assisted living, independent
living, skilled nursing, or acute care). China’s former One Child Policy and the increase in the country’s aging population have led to the increasing need to develop the know-how in running successful senior care communities, such as assisted living, independent living, skilled nursing, and acute care. Chinese investors are increasingly partnering with U.S. senior care providers to develop the understanding and skill sets necessary to build Western-style senior care communities in China; one example of this coming trend is Union Life, a Chinese insurance company, which acquired six U.S. healthcare facilities in a joint venture with Summit Healthcare REIT in 2015.3
In addition, approval of the Qualified Domestic Individual Investor program (QDII2) in October 2015 by China’s State Council further offers an unprecedented channel for China’s middle-class and high-net-worth individuals (HNWI) to invest overseas and promises to be a significant step in the liberalization of China’s financial sector and capital account. The QDII2 initiative complements China’s commitment to allow foreign-owned investment managers to access the Chinese high-net-worth market.
According to Bain & Company’s China Private Wealth Report, nearly half of surveyed Chinese HNWIs have individual investable assets in excess of RMB10 million (approximately USD1.6 million) and have plans to increase their overseas investment in the next year or two. HNWIs are entrusting an increasing “share of wallet”—or a percentage of their investable assets—to private banks or other high-end wealth management institutions. The report indicates
2 Cushman & Wakefield, USD73bn Investment bonanza by 2019, Chinese Insurance Outbound Capital, November 24, 2015
3 Summit Healthcare REIT, Inc. Announces Joint Venture, May 1, 2015, http://www.prnewswire.com/news-releases/summit-healthcare-reit-inc-announces-joint-venture-300075978.html
@2016 KPMG LLP, a Delaware limited liability partnership and the U.S. member firm of the KPMG network of independent member firms affiliated with KPMG International Cooperative (“KPMG International”), a Swiss entity. All rights reserved.

中国的开发商专注于待开发项目的投资,截至2015年中国开发商已可以独立开发,而不需要美国合资伙伴的帮助,并且成为土地开发项目的带头人。另一方面,中国个人投资一直以来专注于写字楼,住宅(多户),酒店,工业和商铺的房地产开发,而中国企业投资则把注意力转向营运资产。 随着中国保险监督管理委员会鼓励中国保险公司增加海外投资政策的出台,中国保险公司开始直接投资于能够带来稳定收入的美国成熟商业楼盘和写字楼。办公楼仍然是最热门的投资资产类别,占中国境外资本投资总额的的40%。据毕马威2015年房地产前景调查结果表明,虽然高品质的房地产项目仍在市场中存在,但是理想的收益却越来越难获取。
中国的保险公司海外投资限额可高达公司总资产的15%,但目前中国的保险公司仅有1%的海外投资。这一数据表明中国保险公司的海外投资仍有很大潜力。预计到2019年,中国保险公司的海外不动产投资会达到5%,相当于 730亿美元的投资增长2,而预计大部分的海外投资增长都会集中在美国。与中国投资者讨论表明,中国投资美国的下一个重点会在高级护理社区(例如,辅助生活社区,独立生活社区,专业护理社区或者急救中心)。中国的人口的老
龄化和曾经实施的独生子女政策,导致对成熟的高级护理社区的需求越来越多,特别是在辅助生活,独立生活,专业护理和急救等方面的需求。中国投资者越来越多地与美国高级护理供应商合作开发,以希望能理解和掌握在中国建立西式养老社区的必要技能;例如来自中国的合众人寿保险公司,在2015年与Summit Healthcare REIT合资,收购了6家美国健康护理机构。3
此外,中国国务院于2015年10月批准合格境内个人投资者计划(“QDII2”),为中国的中产阶层和高净值人群(“高净值人群”)提供了前所未有的海外投资渠道,在中国金融业和资本账户自由化的进程中迈出显著的一步。该QDII2计划还允许外资投资经理进入中国高净值市场。
据贝恩咨询公司《中国私人财富》报告,将近一半的被调查的中国高净值人群都有超过1000万元人民币(约合160万美元)的投资资金,并且计划在未来一两年增加其海外个人投资。这些高净值人群还将越来越多的“钱包份额”,即他们的可投资资产的比例,委托给私人银行或其他高端的财富管理机构去管理。此报告还指出这
2 Cushman & Wakefield, USD73bn Investment bonanza by 2019, Chinese Insurance Outbound Capital, November 24, 2015
3 Summit Healthcare REIT, 宣布合资企业, 2015年5月1日, http://www.prnewswire.com/news- releases/summit-healthcare-reit-inc-announces-joint-venture-300075978.html
@2016毕马威会计师事务所,美国特拉华州的有限责任合伙,并为毕马威国际合作组织(“毕马威国际”)相关联的独立成员所网络中的美国成员公司。毕马威国际属瑞士实体公司。版权所有,不得转载。
5China Inbound Investing in U.S. Real Estate
中国赴美房地产投资

HNWIs are putting 65 percent of their investable assets in the hands of third parties compared to 25 percent, on average, in 2009.4 Industry observers remain confident that the QDII2 scheme’s implementation will see real estate emerge as the popular asset class for investors compared to (1) shares, bonds, funds, insurance products, foreign exchange, and derivative products, and (2) greenfield and joint venture projects.5
Wealthy Chinese individuals also accessed the EB-5 program, a U.S. program that permits foreign investors to obtain a green card by investing in development projects that produce U.S. jobs. The program was used in many cases to help fuel development as the United States came out of the Great Recession. The EB-5 program has funded multiple luxury condominium towers and high-profile projects such as Hudson Yards in Manhattan. Chinese investors are also being approached to fund projects including the redevelopment of the former Macy’s headquarters in Brooklyn, New York; 1 and 3 Gotham Center in Long Island City, New York;6 the Brooklyn Heights Library redevelopment in Brooklyn, New York;7 the latest phase of 2 World Trade Center in Manhattan, New York;8 and Hunters Point Shipyard in San Francisco.9
We have also observed large Chinese real estate companies beginning to develop an international real estate fund model to facilitate institutional and high-net-worth investments, using expertise gained over the past five years in owning, operating, developing U.S. real estate, and indirectly investing through funds that are passive investors and vertically integrated fund managers.
Much of the investment activity by non-U.S. investors in U.S. real estate has been concentrated in coastal, “gateway” cities. New York, Los Angeles, San Francisco, and Washington, DC, are among some of the most sought-after real estate markets in the United States for Chinese investors. However, in certain circumstances, the Chinese influence in the United States is felt beyond the gateway cities with China Life Insurance Co. Ltd and Ping An Insurance Group Co. of China Ltd partnering with Tishman Speyer Properties to redevelop Boston Pier 4 in Boston, Massachusetts,10 while Beijing-based Zhang Long’s Lelege USA is developing Long Lake, a 108-acre development with mini-mansions at the former Canyon Lake Ranch northwest of Dallas.11
4 Bain & Company, China’s population of high net worth individuals swelled to more than one million in 2014, doubling from just four years ago, May 26, 2015, http://www.bain.com/about/press/press-releases/2015-china-private-wealth-report-press-release.aspx. Used with permission from Bain & Company.
5 KPMG Global China Practice, China Outlook 2015, http://www.kpmg.com/CN/en/IssuesAndInsights/ArticlesPublications/Documents/China-Outlook-2015-201501-v1.pdf
6 The Real Deal, Tishman Speyer looking to raise EB-5 capital for Macy’s redevelopment plan, March 29, 2016, http://therealdeal.com/2016/03/29/tishman-speyer-looking-to-raise-eb-5-capital-for-macys-redevelopment-plan/
7 The Real Deal, Hudson looks to raise $110M from EB-5 investors for Brooklyn library project, March 25, 2016, http://therealdeal.com/2016/03/25/hudson-looks-to-raise-110m-from-eb-5-investors-for-brooklyn-library-project/
8 The Real Deal, Silverstein seeks $500M in EB-5 funding for 2 WTC, November 4, 2015, http://therealdeal.com/2015/11/04/silverstein-seeks-500m-in-eb-5-funding-for-2-wtc/
9 San Francisco Business Times, Who’s paying for $8 billion Shipyard? So far, wealthy foreigners. Soon, Wall Street, July 13, 2015 http://www.bizjournals.com/sanfrancisco/blog/real-estate/2015/07/hunters-point-shipyard-lennar-foreign-investor-eb5.html?s=print
10 Reuters, China Life, Ping An take majority stake in $500 million Boston property project, April 8, 2015, http://www.reuters.com/article/2015/04/08/us-china-life-insur-ping-an-ins-usa-prop-idUSKBN0MZ0VD20150408
11 The Real Deal, Chinese buyers moving beyond “gateway” cities, November 30, 2015, http://therealdeal.com/2015/11/30/chinese-buyers-moving-beyond-gateway-cities/
@2016 KPMG LLP, a Delaware limited liability partnership and the U.S. member firm of the KPMG network of independent member firms affiliated with KPMG International Cooperative (“KPMG International”), a Swiss entity. All rights reserved.

些高净值人群将他们的可投资资产的65%委托给中介管理,而这一比列在2009年时仅为25% 4。行业观察家相信,QDII2计划的实施会使得房地产投资在与(1)股票,债券,基金,保险产品,外汇及衍生产品; 或者(2)待开发和合资项目相比脱颖而出成为投资者的热门投资产品。5
资金雄厚的中国个人也会获得参与EB -5项目的机会,EB -5允许外国投资者通过在美国投资促进当地就业的方式而获得绿卡。该方案此前经常用来帮助刺激经济发展,以促使美国走出经济大萧条。EB -5项目为多个豪华公寓塔楼和一些高知名度的房地产项目提供资金,例如曼哈顿的哈德森广场项目就是其中之一。中国的投资者也正被接洽,为包括设在纽约布鲁克林区的前梅西总部的重建项目;纽约长岛市哥谭中心一号和三号项目6;布鲁克林高地图书馆重建项
目7;纽约曼哈顿世界贸易中心2号楼的最新发展项目8;以及旧金山猎人船厂项目提供资金。9
我们还注意到中国大型地产公司,运用过去五年在购买,经营,开发美国房地产,及间接投资和垂直整合基金经理的专业经验,开始开发一个国际房地产基金模式,以促进投资机构和高净值人群的投资。
外国投资者在美国的投资活动大多集中在沿海地区的 “门户”城市。对于中国投资者来说,纽约、洛杉矶、旧金山和华盛顿特区,是一些最抢手的美国房地产市场。然而,在某些情况下,中国在美国房地产投资并不局限于口岸城市,比如中国人寿保险股份有限公司、平安保险公司与铁狮门合作重建波士顿4号码头10,北京张龙的力利记美国置业公司在达拉斯西北地区的长湖迷你别墅开发项目,项目前身是108英亩的峡谷牧场。11
4 贝恩咨询公司,中国的高净值人群在2014年超过一百万,四年翻一番, 2015年5月26日。 http://www.bain.com/about/press/press-releases/2015-china-private-wealth-report-press-release.aspx 此处引用获经贝恩咨询公司许可。
5 毕马威全球中国业务,中国2015年展望中国,http://www.Kpmg.com/CN/en/IssuesAndInsights/ArticlesPublications/Documents/China-Outlook-2015-201501-v1.pdf
6 The Real Deal, 铁狮门筹集资金,EB-5梅西重建计划, 2016年3月29日,http://therealdeal.com/2016/03/29/tishman-speyer-looking-to-raise-eb-5-capital-for-macys-redevelopment-plan/
7 The Real Deal, 哈德森募集1.1亿美元,布鲁克林图书馆EB-5项目, 2016年3月25日,http://therealdeal.com/2016/03/25/hudson-looks-to-raise-110m-from-eb-5-investors-for-brooklyn-library-project/
8 The Real Deal, Silverstein寻求世贸中心2号楼 seeks $500M in EB-5 funding for 2 WTC, 2015年11月4日, http://therealdeal.com/2015/11/04/silverstein-seeks-500m-in-eb-5-funding-for-2-wtc/
9 旧金山商业时报,谁来支付80亿美元造船厂项目?到目前为止,答案是有钱的外国人。华尔街,2015年7月13 日,http://www.bizjournals.com/sanfrancisco/blog/real-estate/2015/07/hunters-point-shipyard-lennar-foreign-investor-eb5.html?s=print
10 路透社报道,中国人寿,中国平安,拿到了5亿美元波士顿地产多数股权项目, 2015年4月8日,http://www.reuters.com/article/us-china-life-insur-ping-an-ins-usa-prop-idUSKBN0MZ0VD20150408
11 The Real Deal, Chinese buyers moving beyond“gateway”cities, November 30, 2015, http://therealdeal.com/2015/11/30/chinese-buyers-moving-beyond-gateway-cities/
China Inbound Investing in U.S. Real Estate中国赴美房地产投资
@2016毕马威会计师事务所,美国特拉华州的有限责任合伙,并为毕马威国际合作组织(“毕马威国际”)相关联的独立成员所网络中的美国成员公司。毕马威国际属瑞士实体公司。版权所有,不得转载。
7

Recent notable deals since October 2015 include:
Market Property name Asset type Investor Date Transaction information
New York 615 10th Avenue12 Development – Retail/Residential
Xinyuan Real Estate
November 2015
USD60 million acquisition of development site
New York (Downtown Brooklyn)
16 and 8-14 Nevins Street13
Development – Residential
China Vanke November 2015
USD48 million acquisition of development site with Adam America Real Estate and Slate Property Group
New York 565 Broome Street14 Condominium Cindat and Bank of China
January 2016
Cindat (USD135 million equity interest), Bank of China (USD320 million construction loan) development project with Bizzi & Partners Development
San Jose Midpoint at 23715 Land/Office Gemdale Corp. February 2016
Undisclosed price – project with Lincoln Property Co.
New York 45 Rivington Street16 Development – Residential
China Vanke February 2016
USD116 million acquisition of development site with Adam America Real Estate and Slate Property Group
New York Seven limited service hotels in Times Square, Chelsea, Herald Square, and the Financial District operating under the Holiday Inn, Hampton Inn, and Candlewood Suites brands17
Hotel Cindat Capital Management
February 2016
USD571.4 million (or USD526,000 per key)
New York 850 Third Avenue18 Office HNA Property Holdings
March 2016
USD463 million acquisition with MHP Real Estate Services
New York Strategic Hotels19 Hospitality Anbang Insurance Group
March 2016
USD6.5 billion
New York Park Lane Hotel20 Hotel Greenland Holdings Group
April 2016 Undisclosed price – 41 percent stake in project to redevelop property
12 The Real Deal, Xinyuan to Make Manhattan debut with Hell’s Kitchen condo project: sources, November 4, 2015, http://therealdeal.com/2015/11/04/xinyuan-to-make-manhattan-debut-with-hells-kitchen-condo-project/
13 The Real Deal, China Vanke joins 33-sotry DoBro condo project, November 4, 2015, http://therealdeal.com/2015/11/04/china-vanke-joins-adam-america-slates-33-story-dobro-project/
14 The Real Deal, Bizzi, partners secure $450M in Chinese capital for SOHO condo, January 22, 2016, http://therealdeal.com/2016/01/22/bizzi-partners-secure-450m-in-chinese-capital-for-soho-condo/
15 Silicon Valley Business Journal, Lincoln Property Co. and China’s Gemdale buy 21 acres in San Jose for office campus, February 5, 2016, http://www.bizjournals.com/sanjose/news/2016/02/05/lincoln-property-co-and-chinas-gemdale-buy-21.html
16 The Real Deal, Vanke, Adam America and Slate pay $116M for LES dev site, February 29, 2016, http://therealdeal.com/2016/02/29/vanke-adam-america-slate-pay-116m-for-les-dev-site/
17 The Real Deal, Hersha sells seven Manhattan hotels to China Cinda for $571M, February 4, 2016, http://therealdeal.com/2016/02/04/hersha-sells-seven-manhattan-hotels-to-china-cinda-for-571m/
18 The Real Deal, Chinese conglomerate backs MHP’s $463M deal for 850 Third, March 29, 2016, http://therealdeal.com/2016/03/29/chinese-conglomerate-backs-mhps-463m-deal-for-850-third/
19 Reuters, China’s Anbang to acquire Strategic Hotels for $6.5 billion: source, March 12, 2016, http://www.reuters.com/article/us-strategic-hotels-m-a-anbang-idUSKCN0WE0YY
20 The Real Deal, Did a major Chinese investment just revive Witkoff’s Park Lane condo plans?, April 28, 2016, http://therealdeal.com/2016/04/28/did-a-major-chinese-investment-just-revive-witkoffs-park-lane-condo-plans/
@2016 KPMG LLP, a Delaware limited liability partnership and the U.S. member firm of the KPMG network of independent member firms affiliated with KPMG International Cooperative (“KPMG International”), a Swiss entity. All rights reserved.

从2015年10月以来的重大交易包括:
市场 房地产名称 类型 投资者 日期 交易信息纽约 曼哈顿第十大道615号12 开发-零售/住宅 鑫苑置业 2015年11月 0.6亿美元收购
纽约(布鲁克林 市中心)
Nevins大街8-14,及16号13
开发-零售/住宅 中国万科 2015年11月 与Adam America Real Estate 及Slate Property Group 0.48亿美元联合收购
纽约 Broome 街565号14 公寓 信泰资本和中国银行
2016年1月 信泰 (1.35亿美元股权), 中国银行(3.2亿美元建筑贷款) 与Bizzi & Partners Development联合开发
圣荷西 Midpoint 237号15 土地/办公楼 金地集团 2016年2月 收购价未公开- 联同肯置业有限公司
纽约 李文顿街45号16 开发-住宅楼 中国万科 2016年2月 1.16亿美元收购,联同Adam America Real Estate 及Slate Property Group
纽约 位 于 时 代 广 场 , 切 尔西,Herald广场和金融区,在假日酒店,汉普顿酒店及德伍德套房品牌经营下的7家酒店17
酒店 信泰资本管理 2016年2月 5.714亿美元(或52.6万每间)
纽约 曼哈顿第三大道850号18 办公楼 海航置业控股 2016年3月 海航置业4.63亿美元收购
纽约 战略酒店19 酒店 安邦保险公司 2016年3月 65亿美元
纽约 柏宁酒店20 酒店 绿地控股集团 2016年4月 收购价未公开-41% 股权
12 The Real Deal,鑫苑购买地狱厨房公寓,首次亮相曼哈顿, 2015年11月4日,http://therealdeal.com/2015/11/04/xinyuan-to-make-manhattan-debut-with-hells-kitchen-condo-project/
13 The Real Deal,万科购买33层的DoBro 公寓计划,2015年11月4日,http://therealdeal.com/2015/11/04/china-vanke-joins-adam-america-slates-33-story-dobro-project/
14 The Real Deal,4.5亿中国资金投入 SOHO 公寓,2016年1月22日,http://therealdeal.com/2016/01/22/bizzi-partners-secure-450m-in-chinese-capital-for-soho-condo/
15 硅谷商业杂志,林肯置业有限公司和中国的金地联手收购在圣何塞的21英亩办公园区, 2016年2月5日, http://www.bizjournals.com/sanjose/news/2016/02/05/lincoln-property-co-and-chinas-gemdale-buy-21.html
16 The Real Deal,万科, Adam America 和Slate出价1.16亿美元,联手购买开发用地,2016年2月29日,http://therealdeal.com/2016/02/29/vanke-adam-america-slate-pay-116m-for-les-dev-site/
17 The Real Deal,Hersha出售7家曼哈顿酒店给中国信泰资本,售价5.71亿美元,2016年2月4日,http://therealdeal.com/2016/02/04/hersha-sells-seven-manhattan-hotels-to-china-cinda-for-571m/
18 The Real Deal,海航置业4.63亿美元收购曼哈顿第三大道850号,2016年3月29日,http://therealdeal.com/2016/03/29/chinese-conglomerate-backs-mhps-463m-deal-for-850-third/
19 Reuters, China’s Anbang to acquire Strategic Hotels for $6.5 billion 路透社报道,中国安邦65亿美元收购战略酒店,2016年3月12日,http://www.reuters.com/article/us-strategic-hotels-m-a-anbang-idUSKCN0WE0YY
20 The Real Deal,来自中国的重要投资重振Witkoff的柏宁公寓项目?,2016年4月28日,http://therealdeal.com/2016/04/28/did-a-major-chinese-investment-just-revive-witkoffs-park-lane-condo-plans/
@2016毕马威会计师事务所,美国特拉华州的有限责任合伙,并为毕马威国际合作组织(“毕马威国际”)相关联的独立成员所网络中的美国成员公司。毕马威国际属瑞士实体公司。版权所有,不得转载。
9China Inbound Investing in U.S. Real Estate
中国赴美房地产投资

21 KPMG Economics/Bureau of Labor Statistics--Employment Situation May 2016 / Haver Analytics
22 “Office REITs Accept Risks Leasing to Growing Private Tech Firms,” Bloomberg Intelligence, December 21, 2015
23 2016 Foreign Investment Survey, Association of Foreign Investors in Real Estate, January 4, 2016
24 “Foreign Investors Boost U.S. Office Values,” Bloomberg Intelligence, March 2016
U.S. office market: Open for businessContinued growth in the overall U.S. economy and low interest rates worldwide will likely support at least two more solid years for American real estate. KPMG LLP (KPMG) expects the U.S. economy to grow between 2 percent and 3.4 percent in the remaining quarters of 2016 and through 2017. Solid job growth, along with better wage gains, will support the consumer sector and residential real estate. That spending will offset the drag coming from the global slowdown which is widening the U.S. trade deficit and dampening manufacturing growth.
Solid job growth also supports a positive outlook for commercial office space. Since most of the U.S. economy is service-related, expanding businesses will likely need more office space to house their workers. Professional and business service employment grew 2.7 percent in the year ended in May 2016, faster than the 1.7 percent growth for all nonfarm jobs.21 Continued strength in the technology sector is also expected to lift demand for office space, although the focus in that sector remains largely regional, with California and New York benefitting the most.22
Interest rates should remain lowThe outlook for low interest rates will help finance both the purchase of existing office buildings and construction of new space. KPMG expects the Federal Reserve will increase its policy rate only once in 2016 as concerns about global growth present legitimate potential headwinds to U.S. liquidity conditions and while the international sector remains hampered by a still-strong dollar. KPMG expects rates at the
longer end of the U.S. yield curve will be held down due to “negative interest rate policies (NIRP)” being pursued by the European Central Bank and the Bank of Japan.
Low rates for the next few years mean more institutional investors will look at real estate assets as a way to obtain yield. Given the stable outlook for the U.S. economy, many foreign investors have increased their purchases of real estate here. A survey of its members by the Association of Foreign Investors in Real Estate (AFIRE) found 64 percent expect to increase investments in U.S. real estate in 2016. No one planned a major decline.23 For the second consecutive year, New York outranked London as the top global city for foreign real estate investment.
Foreign investors have already been major players in the U.S. office market. Global investment in U.S. office buildings reached a record USD28.8 billion in 2015, according to Real Capital Analytics.24 Canada led the list with USD7.3 billion in investments in U.S. office buildings, followed by Qatar (USD3.5 billion) and Germany (USD3.4 billion). According to Bloomberg data, China’s spending on U.S. office real estate totaled USD1.6 billion in 2015.
Foreign investment in U.S. office buildings is dominated by pension funds, sovereign wealth funds, and insurance companies that are allocating away from fixed income. At the time of this writing, more than 40 percent of the global bond market (sovereign and corporate) achieves a negative yield. Thus, Chinese investors in U.S. real estate
@2016 KPMG LLP, a Delaware limited liability partnership and the U.S. member firm of the KPMG network of independent member firms affiliated with KPMG International Cooperative (“KPMG International”), a Swiss entity. All rights reserved.

美国办公楼市场:开放的市场美国经济的持续增长和全球范围的低利率将有可能推动美国房地产业至少两个年度的的增长。毕马威美国分所(“毕马威”)预计,2016年当前到2017年底期间美国经济将增长在2%和3.4%之间。稳定的就业增长,以及更好的工资收入,将推动消费业和住宅房地产的发展。这一支出将抵消因全球经济放缓而导致美国的贸易赤字扩大及抑制制造业增长所造成的压力。
稳定的就业增长还带来商业办公用地的积极发展。由于大多数美国经济和服务相关,企业的扩张可能会需要更多的办公空间以容纳其员工。截至2016年5月,美国专业及商业服务业的就业增长率为2.7%,高于全国非农业就业增长率1.7%21 技术领域的持续走强也有望提高对办公空间的需求,但是技术业的发展重点在很大程度上比较区域化,以加州和纽约获益最多。22
低利率应会继续保持低利率的前景将有助于为购买现有的办公楼以及建设新办公楼提供融资。毕马威预计,基于全球增长显现出极可能对美国的流动性状况不利的情况,以及国际行业仍然受美元强的阻碍,美国联邦储备局在2016年最多只会提高一次利率。毕马威还预计,由于欧洲中央银行和日本银行实行的负利率政策(NIRP),美国收益率曲线的长端将会被压低。
21 毕马威经济学/劳动统计局—2016年5月就业状况部/哈弗分析22“房地产投资信托接受发展中私营科技企业的租赁风险“彭博社的情报,2015年12月15日23 投资展望调查,外国房地产投资者协会,2016年1月4日24 “外国投资者提高美国办公室的价值”彭博情报,2016年3月4日
未来几年的低利率意味着更多的机构投资者将着眼于投资房地产项目的方式来获得收益。鉴于美国经济前景稳定,许多外国投资者纷纷加大购买美国房地产。外国房地产投资者协会 (AFIRE)的一项调查显示,64%的AFIRE成员都希望在2016年增加在美国房地产的投资,无人预计投资会大幅度下滑。23 纽约则连续两年超过伦敦排在全球外资房地产投资城市的首位。
外国投资者已经成为美国写字楼市场的主要参与者。根据“实际资本分析”的数据表明,全球在美国写字楼的投资在2015年又创新高达到288亿美元。24 加拿大凭借着在美国办公楼市场的73亿美元投资排名第一,其次是卡塔尔(35亿美元)和德国(24亿美元)。据彭博社数据显示,中国在美国办公楼市场2005年的投资总额为16亿美元。
养 老 基 金 , 主 权 财 富 基 金 和 以 分 配固 定 收 益 为 主 的 保 险 公 司 是 外 资 在办 公 楼 市 场 投 资 的 主 力 军 。 在 撰 写本 文 时 , 超 过 4 0 % 的 全 球 债 券 市 场 (主权和企业)出现了负收益率。因此,中国投资者在美国房地产市场将会 与 越 来 越 多 的 寻 求 在 黄 金 地 产 赢得 固 定 收 益 的 全 球 公 司 进 行 竞 争 。
@2016毕马威会计师事务所,美国特拉华州的有限责任合伙,并为毕马威国际合作组织(“毕马威国际”)相关联的独立成员所网络中的美国成员公司。毕马威国际属瑞士实体公司。版权所有,不得转载。
11China Inbound Investing in U.S. Real Estate
中国赴美房地产投资

25 JLL Research, Investment Outlook Q4 2015
26 Ibid.
27 Ibid.
MI
WI
MN
SD
NE
KS
OK
TX
NM
CO
UTNV
CA
AZ
WY
MT ND
ID
OR
WA
IA
MO
IL
TN
KY
INOH
WV PA
VA
NC
SC
GAALMS
AR
LA
FL
MD
DE
RI
MA
NH
NY
VT
ME
CT
4.00–5.00%
5.00–6.00%
6.00–7.00%
7.00–8.00%
8.00–9.00%
9.00+
U.S. core product CBD cap rates
Seattle4.50–5.50%
Portland5.00–6.50%
Sacramento5.75–6.50%
San Francisco3.00–4.00%
East Bay6.50–7.50%
Los Angeles5.00–6.00%
San Diego6.00–7.00%
Phoenix7.00–7.50%
Denver5.00–6.00%
Dallas5.00–7.00%
Austin4.50–5.25%
Houston6.00–6.50%
Kansas City7.00–8.00%
Minneapolis WI6.00–7.00%
Chicago4.95–5.95%
Cleveland7.50–8.50%
Columbus8.00–9.00%
Cincinnati8.50–9.50%
Indianapolis8.50–9.50%
Detroit9.50–10.50% Pittsburgh
8.00–9.00%
Philadelphia6.00–7.50%
Washington, DC4.00–6.00%
Raleigh6.50 SC–7.50%Charlotte
6.25–7.50%
Atlanta5.00–6.00%
Tampa5.75–7.00%
Orlando5.50–7.00%
Miami4.50–6.00%
New York3.25–3.75%
Boston4.00–5.00%
Source: JLL Research
Source: JLL United States Investment Outlook Q4 2015
will be competing with more global players seeking fixed income proxies in prime real estate properties.
Changes to a major real estate tax act also makes U.S. real estate more attractive to some foreign investors, specifically qualified foreign pension funds. In December 2015, as part of a government spending bill, the United States eased its restrictions on the tax treatment of some foreign investment in U.S. real estate. The provision waived a tax that was imposed on non-U.S. pension funds under the 1980 Foreign Investment in Real Property Tax Act (FIRPTA). While not all investors can take advantage of the new legislation, it will likely increase capital flowing into the REIT sector.
Investors should look beyond major cities for higher yieldsForeign investors have concentrated in the United States’ “gateway” cities as they are considered the most liquid markets. But high prices and lower yields in those metro areas, along with the expected increase in demand thanks to the FIRPTA change, suggest investors
should cast a wider net when it comes to deciding where to spend their money in the United States.
More than half of all inbound investment has been spent in only four cities: New York, Washington, DC, Boston, and Seattle.25 This type of market concentration is likely to continue in 2016 since the AFIRE survey found investors most interested in looking at 2016 deals in New York, Los Angeles, San Francisco, and Washington, DC where cap rates are among the lowest in the nation.
The heavy demand for office buildings, especially “trophy assets”, has pushed up prices and lowered cap rates and that trend should continue into 2016. The price per square foot for trophy assets jumped a whopping 32 percent in 2015 over 2014.26 This has been somewhat supported by rising rents paid for Class A buildings in major central business districts (CBDs). But, with prices up more than rent rates, cap rates have come under pressure, especially in primary markets San Francisco and Los Angeles.27
@2016 KPMG LLP, a Delaware limited liability partnership and the U.S. member firm of the KPMG network of independent member firms affiliated with KPMG International Cooperative (“KPMG International”), a Swiss entity. All rights reserved.

25 仲量联行研究部,投资展望, 2015年四季度26 同上27 同上
MI
WI
MN
SD
NE
KS
OK
TX
NM
CO
UTNV
CA
AZ
WY
MT ND
ID
OR
WA
IA
MO
IL
TN
KY
INOH
WV PA
VA
NC
SC
GAALMS
AR
LA
FL
MD
DE
RI
MA
NH
NY
VT
ME
CT
4.00‒5.00%5.00‒6.00%6.00‒7.00%7.00‒8.00%8.00‒9.00%9.00+
美国CBD核心产品资本化率
西雅图4.50‒5.50%
珀特兰大5.00‒6.50%
萨克拉门托5.75‒6.50%
旧金山3.00‒4.00%
东湾6.50‒7.50%
洛杉矶5.00‒6.00%
圣地亚哥6.00‒7.00%
凤凰城7.00‒7.50%
丹佛5.00‒6.00%
达拉斯5.00‒7.00%
奥斯汀4.50‒5.25%
休斯敦6.00‒6.50%
堪萨斯城7.00‒8.00%
明尼阿波利斯6.00‒7.00%
芝加哥4.95‒5.95%
克利兰夫7.50‒8.50%
哥伦布市8.00‒9.00%
辛辛那提8.50‒9.50%
印第安纳波珀斯特8.50‒9.50%
Detroit9.50–10.50% 皮斯堡
8.00‒9.00%
费城6.00‒7.50%
华盛顿特区4.00‒6.00%
罗利6.50 SC‒7.50%夏洛特
6.25‒7.50%
亚特兰大5.00‒6.00%
坦帕5.75‒7.00%
奥兰多5.50‒7.00%
迈阿密4.50‒6.00%
纽约3.25‒3.75%
波士顿4.00‒5.00%
数据来源: JLL Research
数据来源: JLL 美国投资展望,2015年第四季度
底特律9.50‒10.50%
美国房地产税收的改革也对于外国投资者更具吸引力,特别是对符合条件的外国养老基金而言。在2015年12月,作为政府开支法案的一部分,美国放宽了对一些外国房地产投资的税收待遇的限制。该条款免除了在1980年外国投资房地产税法( FIRPTA )下对非美国养老基金的征税。虽然不是所有的投资者都会从新立法中获益,但是税法的改变可能会增加对房地产投资信托基金的投资。
投资者应放眼于大城市之外,争取更高的收益目前,外国投资都集中在美国的门户城市,因为投资者认为这些城市具有最强的市场流动性。但是这些城市高昂的地产价格,较低的收益率,以及在FIRPTA影响下不断增加的需求,都预示着投资者在决定于美国何处进行房地产投资时,应放眼于更多的城市。
AFIRE调查发现,外国房地产投资的一半都集中在四个大城市:纽约,华盛顿,波士顿和西雅图。25
而投资的集中性在2016年将会持续。因为AFIRE发现,投资者还是在纽约,洛杉矶,旧金山和华盛顿特区这些资本化率比较低的城市寻找感兴趣的投资。
办公楼,尤其是对“标志性建筑”的强烈需求推高了价格,降低了资本化率。这种趋势在2016年应该会继续持续。地标房产每平方英尺价格在2015年比2014年增长了32%。主要的商业区A级办公楼(中央商务区)租金上涨的现象和这一趋势保持一致。26 但随着价格上涨超过租金率,资 本化率面临压力,特别是在旧金山和洛杉矶等黄金市场。27 同时,较小城市的资本化率保持强势,为外国投资者的多样化投资提供了有利依据。
@2016毕马威会计师事务所,美国特拉华州的有限责任合伙,并为毕马威国际合作组织(“毕马威国际”)相关联的独立成员所网络中的美国成员公司。毕马威国际属瑞士实体公司。版权所有,不得转载。
13China Inbound Investing in U.S. Real Estate
中国赴美房地产投资

MI
WI
MN
SD
NE
KS
OK
TX
NM
CO
UTNV
CA
AZ
WY
MT ND
ID
OR
WA
IA
MOIL
TN
KY
INOH
WV PA
VA
NC
SC
GAALMS
AR
LA
FL
MD
DE
RI
MA
NH
NY
VT
ME
CT
Seattle5.50–6.25%
Portland6.50–7.50%
Sacramento6.75–7.50%
East Bay6.00–7.00%
Silicon Valley5.00–6.00%
Los Angeles4.00–7.00%
San Diego5.50–7.00%
Phoenix5.00–7.00%
Denver6.00–8.00%
Dallas5.00–7.50%
Austin5.00–6.00%
Houston6.50–8.00%
Minneapolis7.00–8.00%
Chicago7.00–8.00% Cleveland
8.00–9.00%
Columbus8.00–9.00%
Cincinnati8.50–9.00%
Indianapolis8.00–9.00%
Detroit8.00–9.00% Pittsburgh
7.50–8.50%
Philadelphia6.00–7.00%
Washington, DC6.00–8.00%
Raleigh7.00–8.00%
Charlotte6.75–8.00%
Atlanta6.00–7.00%
Tampa6.25–7.50%
Orlando6.25–7.50%
Miami5.75–7.00%
New York7.00–7.50%
Boston6.00–7.00%
4.00–5.00%
5.00–6.00%
6.00–7.00%
7.00–8.00%
8.00–9.00%
9.00+
Source: JLL Research
Source: JLL United States Investment Outlook Q4 2015
U.S. core product suburban cap rates
28 KPMG Economics/U.S. Bureau of Labor Statistics/Haver Analytics
Meanwhile, cap rates for smaller cities remain strong, bolstering the case for diversification for foreign investors.
Another reason foreign investors may want to consider looking at deals outside of Class A buildings in major CBDs is shifting preferences among U.S. firms and employees. Lower costs of living and a desire to live in smaller metropolitan areas are behind the stronger job growth in midsized U.S. cities.
As reported by JLL Research, creative businesses, including start-ups, have shown a preference for “architecturally unique” Class B office space that has been renovated to allow for new technology. This has resulted in a narrowing in the rents for Class B space versus Class A in certain metro areas.
Job growth metrics suggest demand for office space will grow among metro areas outside of the top cities, but investors should take care to understand the dynamics of individual markets. Some cities, such as Detroit and Pittsburgh, have attractive cap rates but little prospects for solid job growth, while some larger cities, such as San Francisco, have strong jobs growth but corresponding low cap rates; as a result, the upside potential may be limited. Investors will do well to look for the “sweet spots” in the office market; that is, midsized cities that have seen annualized job growth between 2.8 percent to 4.5 percent over the past two years28 which also exhibit cap rates between 5.0 percent and 7.25 percent.
Potential U.S. joint venture partners are putting an increasing focus on a foreign investor’s ability to close a deal quickly, and a track record of actually doing so. Those that are able to demonstrate this capability will differentiate themselves in the marketplace.
Jennifer Anderson, Tax Partner, U.S. - China Real Estate Initiative, KPMG LLP
“ “
@2016 KPMG LLP, a Delaware limited liability partnership and the U.S. member firm of the KPMG network of independent member firms affiliated with KPMG International Cooperative (“KPMG International”), a Swiss entity. All rights reserved.

MI
WI
MN
SD
NE
KS
OK
TX
NM
CO
UTNV
CA
AZ
WY
MT ND
ID
OR
WA
IA
MOIL
TN
KY
INOH
WV PA
VA
NC
SC
GAALMS
AR
LA
FL
MD
DE
RI
MA
NH
NY
VT
ME
CT
4.00‒5.00%5.00‒6.00%6.00‒7.00%7.00‒8.00%8.00‒9.00%9.00+
西雅图5.50-6.25%
珀特兰大6.50‒7.50%
萨克拉门托6.75‒7.50%
旧金山6.00‒7.00%
东湾5.00‒6.00%
洛杉矶4.00‒7.00%
圣地亚哥5.50‒7.00%
凤凰城5.00‒7.00%
丹佛6.00‒8.00%
达拉斯5.00‒7.50%
奥斯汀5.00‒6.00%
休斯敦6.50‒8.00%
明尼阿波利斯7.00‒8.00%
芝加哥7.00‒8.00% 克利兰夫
8.00‒9.00%
辛辛那提8.50‒9.00%
印第安纳波珀斯特8.00‒9.00%
皮斯堡7.50‒8.50%
华盛顿特区6.00‒8.00%
罗利7.00 ‒8.00%
夏洛特6.75‒8.00%
亚特兰大6.00‒7.00%
坦帕6.25‒7.50%
奥兰多6.25‒7.50%
迈阿密5.75‒7.00%
纽约7.00‒7.50%
波士顿6.00‒7.00%
底特律8.00‒9.00%
哥伦布市8.00‒9.00%
费城6.00‒7.00%
数据来源: JLL Research
数据来源: JLL 美国投资展望,2015年第四季度
美国郊区核心产品资本化率
28 毕马威经济/美国劳动局统计数字
外国投资者愿意考虑投资除中央商务区A级办公楼之外的办公地区的另一个原因是 美国企业和员工对中央商务区偏好的转移。较低的生活成本和对居住在较小城市的愿望是中型美国城市就业增长的主要原因。
据仲量联行研究,包括初创公司等具有创意的企业都显示了对精装且兼容新科技的“建筑风格独特的”的B级办公空间的偏好。这导致了在某些城市A级办公楼和B级办公楼租金差距的减小。
虽然就业增长率表明市场对于一线城市之外的办公地区的需求仍会增长,但投资者仍应该逐一了解每个城市的特有动态。一些城市,如底特律和匹兹堡,具有吸引力的资本率,但就业增长前景不大,而一些较大的城市,如旧金山则拥有强劲的就业增长率,但相应的低资本化率带来的升值潜力是有限的。投资者如果可以寻找到写字楼市场的“最佳点”,那么投资前景会不错。这些“最佳点”应是在过去的两年里,拥有2.8%到4.5%的年就业增长率,28 以及5.0 %到7.25 %的资本化 率的中等城市。
潜在的美国合资伙伴越来越关注外国投资者是否具备可以迅速成交的能力,同时会通过实际交易记录来作出判断。外国投资者若能够证明其具备此种能力则可以在市场中脱颖而出。
Jennifer Anderson, 税务合伙人, 中美房地产合作 , 毕马威美国分所
“ “
@2016毕马威会计师事务所,美国特拉华州的有限责任合伙,并为毕马威国际合作组织(“毕马威国际”)相关联的独立成员所网络中的美国成员公司。毕马威国际属瑞士实体公司。版权所有,不得转载。
15China Inbound Investing in U.S. Real Estate
中国赴美房地产投资

Detroit
IndianapolisCincinnatiPittsburgh
Cleveland Phoenix
RaleighTampaSacramento
DallasPortlandDenver
MiamiSeattle Washington, DC
Boston
New York
0%
2%
4%
6%
8%
10%
12%
0.0% 0.5% 1.0% 1.5% 2.0% 2.5% 3.0% 3.5% 4.0% 4.5% 5.0%
CB
D C
ap R
ate
(mid
poin
t)
Jobs Growth (CAGR Jan 14 - Jan 16)
Finding the "Sweet Spot"
San Francisco
Atlanta
San DiegoOrlando
East BayCharlotte
Columbus
Source: Jones Lang LaSalle for cap rates; KPMG Economics/US Bureau of Labor Statistics/Haver Analytics for jobs growth
Generational preferences also look positive for office demand among midsized and smaller cities. From a combination of urbanization, price or “cool factor”, Millennials—the large cohort of adults aged 25–34 years—show a preference to live and work in smaller urban areas. In a recent survey, Millennials were asked to name the city they expect to live in or move to in 2016. Among the top 10 cities named, only three—Atlanta, Boston, and Seattle—overlapped with the top 10 choices of inbound investors for office space.29 While Atlanta falls within the “sweet spot” KPMG has described, investors should also consider cities such as Denver and Charlotte that have both attractive cap rates and likely growing demand from employers and employees alike.
U.S. real estate looks set to continue showing strong if not record-setting growth over the next two years. Underpinning this growth is a solid domestic economy, low interest rates worldwide, and increasing demand from both U.S. and global investors seeking yield. The best returns are likely to be found in Class B space that is upgraded or in midtier and smaller cities that are seeing population and jobs growth. For Chinese investors that have traditionally kept to only a handful of cities, now may be the time to expand their geographic footprint within the United States.
We hope you find this publication of value as you consider your real estate investments in the United States.
29 Realtor.com, “Where’s Hot—and Where’s Not—for Home-Buying Millennials in 2016.”,http://www.realtor.com/news/trends/where-the-millennials-move-to-in-2016/
@2016 KPMG LLP, a Delaware limited liability partnership and the U.S. member firm of the KPMG network of independent member firms affiliated with KPMG International Cooperative (“KPMG International”), a Swiss entity. All rights reserved.

底特律
印第安纳波利斯辛辛那提匹兹堡
克利夫兰 凤凰城
罗利坦帕萨克拉门托
达拉斯波特兰 丹佛
迈阿密西雅图华盛顿特区
波士顿
纽约
0%
2%
4%
6%
8%
10%
12%
0.0% 0.5% 1.0% 1.5% 2.0% 2.5% 3.0% 3.5% 4.0% 4.5% 5.0%
CBD
资本
化率
(中间
值)
就业增长率 (复合年均增长率 2014年1月 - 2016年1月)
寻找投资“最佳点”
旧金山
亚特兰大
圣地亚哥 奥兰多
东湾夏洛特
哥伦布市
数据来源:仲量联行的资本化率;毕马威经济学/劳动统计局 /哈佛就业增长分析
不同年龄代的喜好对中型和小型城市写字楼的需求增长也有积极影响。千禧族大部分年龄在25-34岁,从城市化、价格或酷的因素等综合来看,这一年龄段的人群比较偏好生活和工作在小一些的城市。最近的一次调查显示,千禧族被询问他们希望2016年迁移到哪所城市生活中,选择的前10大城市中,只有亚特兰大,波士顿和西雅图三个大城市,同时也是外国写字楼投资的三大投资热点。29 即使亚特兰大符合毕马威上述的投资“最佳地”,投资者也应考虑其他城市例如丹佛和夏洛特这两个具有较好的资本化率及企业和就业率都有增长趋势的城市。
在未来两年内,即使没有创纪录的增长,美国房地产市场将继续表现强劲。推动这一增长的是稳固的美国国内经济,全球的低利率和不断增长的来自美国和全球的投资者寻求收益率的需求。最好的回报可能会在那些重新装修过的B级办公楼或在人口和就业有增长趋势的中等和较小的城市。对于那些传统上只投资于少数几个城市的中国投资者而言,现在可能是扩大其在美国境内投资的良好时机。
我们希望本出版物在您考虑投资美国房地产之时,能够对您有所帮助。
29 Realtor.com, Y世代在2016年最想购房的城市, http://www.realtor.com/news/trends/where-the-millennials-move-to-in-2016/
@2016毕马威会计师事务所,美国特拉华州的有限责任合伙,并为毕马威国际合作组织(“毕马威国际”)相关联的独立成员所网络中的美国成员公司。毕马威国际属瑞士实体公司。版权所有,不得转载。
17China Inbound Investing in U.S. Real Estate
中国赴美房地产投资

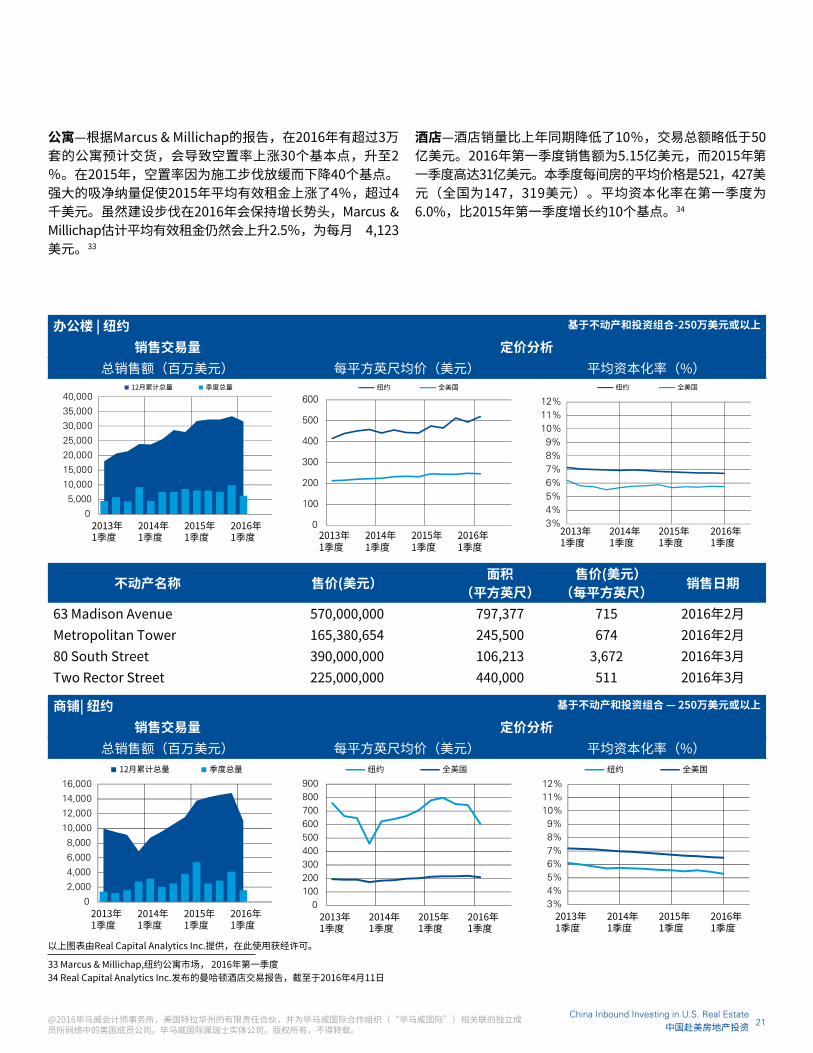
New York real estate marketOffice – The New York City office market ended the first quarter of 2016 with a vacancy rate of 7.8 percent. Vacancy was up over the previous quarter, with negative net absorption of 1,188,504 square feet (sf) in the first quarter. The largest lease signings occurring in 2016 included the 900,027sf lease signed by McGraw Hill Financial, Inc. at 55 Water Street in the Downtown submarket; the 211,400sf deal signed by Citadel Investment Group at 425 Park Avenue in the Midtown submarket; and the 210,496sf lease signed by Salesforce.com, Inc. at Three Bryant Park in the Midtown submarket. The largest projects underway at the end of the first quarter of 2016 were 3 World Trade Center, a 2,861,402sf building with 37 percent of its space preleased, and 30 Hudson Yards, a 2,600,000sf facility that is 100 percent preleased.30
Retail – The New York City retail market did not experience much change in market conditions in the first quarter of 2016. The vacancy rate went from 3.3 percent in the previous quarter to 3.2 percent in the current quarter. The largest lease signings occurring in 2016 included the 36,900sf deal signed by Frames
Bowling Lounge at Port Authority Bus Terminal; the 28,000sf renewal signed by Equinox Fitness at 1633 Broadway; and the 14,189sf lease signed by Equinox Fitness at 0 Bond Street. Retail net absorption was basically flat in New York City in the first quarter of 2016, with negative net absorption of 25,412sf in the quarter. Average quoted asking rental rates in the New York City retail market are up over previous quarters but down from their levels four quarters ago. Quoted rents ended the first quarter of 2016 at USD86.10 per sf per year. During the first quarter of 2016, no new space was completed in the New York City retail market. There were 2,630,328sf of retail space under construction at the end of the first quarter of 2016.31
Industrial – The New York Outer Boroughs Industrial market ended first quarter 2016 with a vacancy rate of 4.1 percent. The vacancy rate was unchanged over the previous quarter, with negative net absorption of 68,075sf in the first quarter. Vacant sublease space increased in the quarter, ending the quarter at 361,643sf. Rental rates ended the first quarter at USD17.39, an increase over the previous quarter. There were 699,448sf still under construction at the end of the quarter.32
30 The CoStar Office Report First Quarter 2016 New York City Office Market ©CoStar Group, Inc.
31 The CoStar Retail Report First Quarter 2016 New York City Retail Market ©CoStar Group, Inc.
32 The CoStar Industrial Report First Quarter 2016, The New York Outer Boroughs Industrial Market ©CoStar Group, Inc.
U.S. real estate market overviewThe following provides a market outlook for each asset type—commercial (office, retail, industrial), residential (multifamily), hospitality (hotel)—for the New York, Los Angeles, San Francisco, Washington, DC, Chicago, and Dallas markets for Q4 2015 to Q1 2016 activities.
@2016 KPMG LLP, a Delaware limited liability partnership and the U.S. member firm of the KPMG network of independent member firms affiliated with KPMG International Cooperative (“KPMG International”), a Swiss entity. All rights reserved.

纽约房地产市场办公楼—纽约办公楼市场2016年第一季度的空置率为7.8%。空置率比上一季度有所上升,净吸纳量在2016年第一季度为负1,188,504平方英尺。2016年最大的几笔租赁交易包括:由麦格劳—希尔集团在市中心水街55号签订的900,027平方英尺的办公用地租赁合同;Citadel投资集团在中城公园大道425号签署的211,400平方英尺的租赁合同;及由Salesforce.com等公司在三布莱恩特公园签订的210,496平方英尺的租赁合同。在2016年第一季度底正在进行的最大项目是世贸中心三号楼,此大楼将拥有2,861,402平方英尺的建筑面积,37%的办公用地已被预租。另一个大项目是哈德森广场30号,2,600,000平方英尺办公用地,100 %已预租。30
商铺—纽约零售市场在2016年第一季度市场条件没有太大的变化。空置率从上一季度的3.3%下降到本季度的3.2%。在2016年签署的最大的几笔租赁交易包括:港务局客运站保龄球贵宾室签署的36,900平方英尺的租赁合同;春分健身在百老汇1633号签署的28,000平方英尺的续租合同;以及春分健身在邦德街0号签署的14,189平方英尺的租赁合
同。第一季度商铺业净吸纳量基本上和上一季度持平,净吸纳量为负25,412平方英尺。商铺市场平均租金率呈上升趋势,租金率超过前三个季度,但是和四个季度前相比有所下降。2016年一季度的租金报价为每年86.10美元每平方英尺。到第一季度末,没有新的可租商铺,正在开工建设的零售空间为2,630,328平方英尺。31
工业—纽约外围各区工业市场在2016年 第 一 季 度 的 空 置 率 为 4 . 1 % 。 空 置率和上一季度持平,净吸纳量为负的68,075平方英尺。本季度空置转租面积有所增加,在本季度末为361,643平方英尺。房租为每平方英尺17.39美元,比上一季度有所提升。到第一季度末,699,448平方英尺的公寓面积仍在施工中。32
30 CoStar办公楼报告, 纽约办公楼市场,2016年第一季度31 CoStar商铺报告, 纽约商铺市场,2016年第一季度32 CoStar工业报告, 纽约外围城区工业市场,2016年第一季度
美国房地产市场概况下面按照资产类别,即商业(办公楼、商铺、工业)、住宅(公寓)和服务业(酒店),对2015年第四季度和2016年第一季度,纽约、洛杉矶、旧金山、华盛顿特区、芝加哥,及达拉斯的房地产市场情况进行概述。
@2016毕马威会计师事务所,美国特拉华州的有限责任合伙,并为毕马威国际合作组织(“毕马威国际”)相关联的独立成员所网络中的美国成员公司。毕马威国际属瑞士实体公司。版权所有,不得转载。
19China Inbound Investing in U.S. Real Estate
中国赴美房地产投资

Multifamily – According to Marcus & Millichap, the anticipated delivery of more than 30,000 rental units in 2016 will result in a 30-basis-point rise in the metro vacancy rate to 2 percent. In 2015, vacancy rates declined 40 basis points as the pace of construction slowed. Robust net absorption prompted a 4 percent lift in average effective rents to more than USD4,000 per month in 2015, with all boroughs recording strong gains. While the pace of construction is anticipated to remain intense through 2016, Marcus & Millichap estimates average effective rents will nonetheless rise 2.5 percent to USD4,123 per month.33
Hotel – The last 12 months have seen a 10 percent decrease in sales volume versus the prior year, totaling just under USD5 billion. First quarter 2016 sales volume was USD515 million, compared to first quarter 2015 sales volume totaling just under USD3.1 billion. The average price per room for first quarter 2016 was USD521,427 (versus USD147,319 nationally). Capitalization rates were up roughly 10 basis points in the first quarter from the same period a year ago, averaging 6.0 percent.34
Office | NYC Metro Based on properties & portfolios ~USD2.5mil or greater
Sales Transaction Volume Pricing Analysis
Sales (millions USD) Average price per sf (USD) Average cap rate (yield)
0
5,000
10,000
15,000
20,000
25,000
30,000
35,000
40,000
Q1 ‘13 Q1 ‘14 Q1 ‘15 Q1 ‘16
Rolling 12-mo. Total Quarterly Vol.
0
100
200
300
400
500
600
Q1 ‘13 Q1 ‘14 Q1 ‘15 Q1 ‘16
NYC Metro United States
3%4%5%6%7%8%9%
10%11%12%
Q1 ‘13 Q1 ‘14 Q1 ‘15 Q1 ‘16
NYC Metro United States
Property name Sale price (USD) Size (sf)Sale price
(USD per sf)Sale date
63 Madison Avenue 570,000,000 797,377 715 Feb-16
Metropolitan Tower 165,380,654 245,500 674 Feb-16
80 South Street 390,000,000 106,213 3,672 Mar-16
Two Rector Street 225,000,000 440,000 511 Mar-16
Retail | NYC Metro Based on properties & portfolios ~USD2.5mil or greater
Sales Transaction Volume Pricing Analysis
Sales (millions USD) Average price per sf (USD) Average cap rate (yield)
0
2,000
4,000
6,000
8,000
10,000
12,000
14,000
16,000
Q1 ‘13 Q1 ‘14 Q1 ‘15 Q1 ‘16
Rolling 12-mo. Total Quarterly Vol.
0100200300400500600700800900
Q1 ‘13 Q1 ‘14 Q1 ‘15 Q1 ‘16
NYC Metro United States
3%4%5%6%7%8%9%
10%11%12%
Q1 ‘13 Q1 ‘14 Q1 ‘15 Q1 ‘16
NYC Metro United States
Charts courtesy of Real Capital Analytics. Used with permission.
33 Marcus & Millichap, Multifamily Research Market Report – New York City Metro Area, First Quarter 2016.
34 RCA Trends & Trade, Manhattan Hotels as of April 11, 2016 ©Real Capital Analytics Inc.
@2016 KPMG LLP, a Delaware limited liability partnership and the U.S. member firm of the KPMG network of independent member firms affiliated with KPMG International Cooperative (“KPMG International”), a Swiss entity. All rights reserved.
办公楼 | 纽约 基于不动产和投资组合-250万美元或以上
销售交易量 定价分析总销售额(百万美元) 每平方英尺均价(美元) 平均资本化率(%)
不动产名称 售价(美元) 面积 (平方英尺)
售价(美元) (每平方英尺) 销售日期
63 Madison Avenue 570,000,000 797,377 715 2016年2月Metropolitan Tower 165,380,654 245,500 674 2016年2月80 South Street 390,000,000 106,213 3,672 2016年3月Two Rector Street 225,000,000 440,000 511 2016年3月
商铺| 纽约 基于不动产和投资组合 — 250万美元或以上
销售交易量 定价分析总销售额(百万美元) 每平方英尺均价(美元) 平均资本化率(%)
33 Marcus & Millichap,纽约公寓市场, 2016年第一季度34 Real Capital Analytics Inc.发布的曼哈顿酒店交易报告,截至于2016年4月11日
公寓—根据Marcus & Millichap的报告,在2016年有超过3万套的公寓预计交货,会导致空置率上涨30个基本点,升至2%。在2015年,空置率因为施工步伐放缓而下降40个基点。强大的吸净纳量促使2015年平均有效租金上涨了4%,超过4千美元。虽然建设步伐在2016年会保持增长势头,Marcus & Millichap估计平均有效租金仍然会上升2.5%,为每月 4,123美元。33
酒店—酒店销量比上年同期降低了10%,交易总额略低于50亿美元。2016年第一季度销售额为5.15亿美元,而2015年第一季度高达31亿美元。本季度每间房的平均价格是521,427美元(全国为147,319美元)。平均资本化率在第一季度为6.0%,比2015年第一季度增长约10个基点。34
以上图表由Real Capital Analytics Inc.提供,在此使用获经许可。
@2016毕马威会计师事务所,美国特拉华州的有限责任合伙,并为毕马威国际合作组织(“毕马威国际”)相关联的独立成员所网络中的美国成员公司。毕马威国际属瑞士实体公司。版权所有,不得转载。
21China Inbound Investing in U.S. Real Estate
中国赴美房地产投资

Property name Sale price (USD) Size (sf)Sale price
(USD per sf)Sale date
202 E 77th Street 17,500,000 6,130 2,855 Feb-16
386 3rd Avenue 12,000,000 8,295 1,447 Mar-16
414 W Broadway (Retail Condo) 8,500,000 2,900 2,931 Mar-16
406 W 13th St 4,000,000 2,364 1,692 Mar-16
130 E 12th St 5,000,000 4,770 1,048 Mar-16
275 Bleecker Street 11,000,000 4,519 2,434 Mar-16
216 Bowery 13,000,000 4,600 2,826 Mar-16
516 8th Avenue 25,000,000 7,500 3,333 Mar-16
Industrial | NYC Metro Based on properties & portfolios ~USD2.5mil or greater
Sales Transaction Volume Pricing Analysis
Sales (millions USD) Average price per sf (USD) Average cap rate (yield)
0
1,000
2,000
3,000
4,000
5,000
6,000
7,000
Q1 ‘13 Q1 ‘14 Q1 ‘15 Q1 ‘16
Rolling 12-mo. Total Quarterly Vol.
0
20
40
60
80
100
120
140
160
Q1 ‘13 Q1 ‘14 Q1 ‘15 Q1 ‘16
NYC Metro United States
3%4%5%6%7%8%9%
10%11%12%
Q1 ‘13 Q1 ‘14 Q1 ‘15 Q1 ‘16
NYC Metro United States
Property name Sale price (USD) Size (sf)Sale price
(USD per sf)Sale date
199 Starr Street (Brooklyn) 10,500,000 20,000 525 Mar-16
26 N 12th Street (Brooklyn) 53,000,000 59,405 892 Mar-16
550 W 37th Street 44,000,000 9,000 4,889 Mar-16
Apartment | NYC Metro Based on properties & portfolios ~USD2.5mil or greater
Sales Transaction Volume Pricing Analysis
Sales (millions USD) Average price per unit (USD) Average cap rate (yield)
0
5,000
10,000
15,000
20,000
25,000
30,000
Q1 ‘13 Q1 ‘14 Q1 ‘15 Q1 ‘16
Rolling 12-mo. Total Quarterly Vol.
0
50,000
100,000
150,000
200,000
250,000
300,000
350,000
400,000
Q1 ‘13 Q1 ‘14 Q1 ‘15 Q1 ‘16
NYC Metro United States
3%4%5%6%7%8%9%
10%11%12%
Q1 ‘13 Q1 ‘14 Q1 ‘15 Q1 ‘16
NYC Metro United States
Charts courtesy of Real Capital Analytics. Used with permission.
@2016 KPMG LLP, a Delaware limited liability partnership and the U.S. member firm of the KPMG network of independent member firms affiliated with KPMG International Cooperative (“KPMG International”), a Swiss entity. All rights reserved.

不动产名称 售价(美元) 面积 (平方英尺)
售价(美元) (每平方英尺) 销售日期
202 E 77th Street 17,500,000 6,130 2,855 2016年2月386 3rd Avenue 12,000,000 8,295 1,447 2016年3月414 W Broadway (Retail Condo) 8,500,000 2,900 2,931 2016年3月406 W 13th St 4,000,000 2,364 1,692 2016年3月130 E 12th St 5,000,000 4,770 1,048 2016年3月275 Bleecker Street 11,000,000 4,519 2,434 2016年3月216 Bowery 13,000,000 4,600 2,826 2016年3月516 8th Avenue 25,000,000 7,500 3,333 2016年3月
工业 | 纽约 基于不动产和投资组合 — 250万美元或以上
销售交易量 定价分析总销售额(百万美元) 每平方英尺均价(美元) 平均资本化率(%)
不动产名称 售价(美元) 面积 (平方英尺)
售价(美元) (每平方英尺) 销售日期
199 Starr Street (Brooklyn) 10,500,000 20,000 525 2016年3月26 N 12th Street (Brooklyn) 53,000,000 59,405 892 2016年3月550 W 37th Street 44,000,000 9,000 4,889 2016年3月
公寓 | 纽约 基于不动产和投资组合 — 250万美元或以上
销售交易量 定价分析总销售额(百万美元) 每套平均售价(美元) 平均资本化率(%)
以上图表由Real Capital Analytics Inc.提供,在此使用获经许可。
@2016毕马威会计师事务所,美国特拉华州的有限责任合伙,并为毕马威国际合作组织(“毕马威国际”)相关联的独立成员所网络中的美国成员公司。毕马威国际属瑞士实体公司。版权所有,不得转载。
23China Inbound Investing in U.S. Real Estate
中国赴美房地产投资

Property name Sale price (USD) No. of unitsSale price
per unit (USD)Sale date
Regency South 180,000,000 186 967,742 Mar-16
The Buchanan 270,000,000 289 934,256 Mar-16
320 East 22nd Street 87,500,000 94 930,851 Mar-16
Eastwood Towers 130,000,000 144 902,778 Mar-16
248 N 8th Street (Brooklyn) 125,000,000 169 739,645 Mar-16
Mohawk Apartments (Brooklyn) 56,500,000 86 656,977 Mar-16
Luna (Queens) 70,000,000 124 564,516 Mar-16
1059 Union Street (Brooklyn) 17,850,000 32 557,813 Mar-16
Beaumont 33,310,838 64 520,482 Mar-16
Hotel | NYC Metro Based on properties & portfolios ~USD2.5mil or greater
Sales Transaction Volume Pricing Analysis
Sales (millions USD) Average price per unit (USD) Average cap rate (yield)
01,0002,0003,0004,0005,0006,0007,0008,0009,000
Q1 ‘13 Q1 ‘14 Q1 ‘15 Q1 ‘16
Rolling 12-mo. Total Quarterly Vol.
0
100,000
200,000
300,000
400,000
500,000
600,000
Q1 ‘13 Q1 ‘14 Q1 ‘15 Q1 ‘16
NYC Metro United States
3%4%5%6%7%8%9%
10%11%12%
Q1 ‘13 Q1 ‘14 Q1 ‘15 Q1 ‘16
NYC Metro United States
Property name Sale price (USD) No. of keys Sale price
per key (USD)Sale date
JW Marriott Essex House 707,008,247 518 1,364,881 Dec-15
Doubletree Guest Suites Times Square Hotel
540,000,000 468 1,153,846 Dec-15
Jade Hotel 78,000,000 113 690,265 Jan-16
Strand Hotel 105,000,000 176 596,591 Jan-16
The Gracie Inn Hotel 6,450,000 13 496,154 Feb-16
Best Western Plus Seaport Inn 38,300,000 72 531,944 Feb-16
Wyndham Garden 60,000,000 124 483,871 Feb-16
Sheraton Tribeca New York Hotel
158,000,000 369 428,184 Mar-16
Charts courtesy of Real Capital Analytics. Used with permission.
@2016 KPMG LLP, a Delaware limited liability partnership and the U.S. member firm of the KPMG network of independent member firms affiliated with KPMG International Cooperative (“KPMG International”), a Swiss entity. All rights reserved.
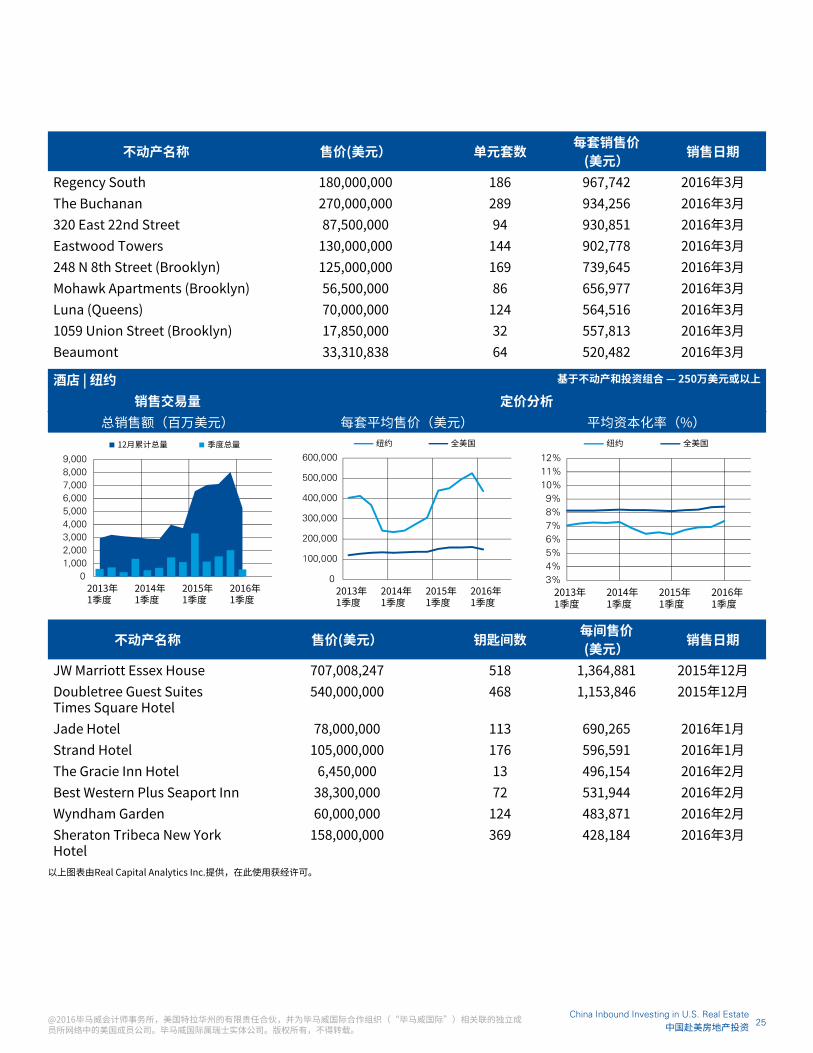
不动产名称 售价(美元) 单元套数 每套销售价 (美元) 销售日期
Regency South 180,000,000 186 967,742 2016年3月The Buchanan 270,000,000 289 934,256 2016年3月320 East 22nd Street 87,500,000 94 930,851 2016年3月Eastwood Towers 130,000,000 144 902,778 2016年3月248 N 8th Street (Brooklyn) 125,000,000 169 739,645 2016年3月Mohawk Apartments (Brooklyn) 56,500,000 86 656,977 2016年3月Luna (Queens) 70,000,000 124 564,516 2016年3月1059 Union Street (Brooklyn) 17,850,000 32 557,813 2016年3月Beaumont 33,310,838 64 520,482 2016年3月
酒店 | 纽约 基于不动产和投资组合 — 250万美元或以上
销售交易量 定价分析总销售额(百万美元) 每套平均售价(美元) 平均资本化率(%)
不动产名称 售价(美元) 钥匙间数 每间售价 (美元) 销售日期
JW Marriott Essex House 707,008,247 518 1,364,881 2015年12月Doubletree Guest Suites Times Square Hotel
540,000,000 468 1,153,846 2015年12月
Jade Hotel 78,000,000 113 690,265 2016年1月Strand Hotel 105,000,000 176 596,591 2016年1月The Gracie Inn Hotel 6,450,000 13 496,154 2016年2月Best Western Plus Seaport Inn 38,300,000 72 531,944 2016年2月Wyndham Garden 60,000,000 124 483,871 2016年2月Sheraton Tribeca New York Hotel
158,000,000 369 428,184 2016年3月
以上图表由Real Capital Analytics Inc.提供,在此使用获经许可。
@2016毕马威会计师事务所,美国特拉华州的有限责任合伙,并为毕马威国际合作组织(“毕马威国际”)相关联的独立成员所网络中的美国成员公司。毕马威国际属瑞士实体公司。版权所有,不得转载。
25China Inbound Investing in U.S. Real Estate
中国赴美房地产投资

Los Angeles real estate marketOffice – The Los Angeles office market ended the first quarter of 2016 with a vacancy rate of 10.9 percent. The vacancy rate was slightly down over the previous quarter, with positive net absorption of 811,328sf in the first quarter. The largest lease signings occurring in 2016 included the 123,221sf lease signed by Netflix at Sunset Bronson Studios – Icon in the Mid-Wilshire submarket; the 108,259sf deal signed by International Creative Management, Inc. at Constellation Place in the West Los Angeles submarket; and the 75,214sf lease signed by Clear Channel Communications, Inc. at Pinnacle I in the Burbank/Glendale/Pasadena submarket. The largest projects underway at the end of first quarter 2016 were Los Angeles Federal Courthouse, a 600,000sf building with 100 percent of its space preleased, and Office Plaza at Wilshire Grand, a 356,141sf facility that is speculative.35
Retail – The Los Angeles retail market did not experience much change in market conditions in the first quarter of 2016. The vacancy rate went from 4.6 percent in the previous quarter to 4.5 percent in the current quarter. The largest lease signings occurring in 2016 included the 45,100sf lease signed by Antelope Valley College at 2301 E Palmdale Boulevard; the 45,000sf deal signed by LA Fitness at 29431 Agoura Road; and the 40,518sf lease signed by Stater Bros. at 670 E. Los Angeles Avenue. Retail net absorption was slightly positive in Los Angeles in the first quarter of 2016, with positive net absorption of 683,466sf. Average quoted asking rental rates in the Los Angeles retail market are up over previous quarters and up from their levels four
quarters ago. Quoted rents ended the first quarter of 2016 at USD27.51 per sf per year. During the first quarter of 2016, 18 buildings totaling 178,052sf were completed in the Los Angeles retail market. There were 1,974,494sf of retail space under construction at the end of the first quarter of 2016.36
Industrial – The Los Angeles Industrial market ended the first quarter of 2016 with a vacancy rate of 2.5 percent. The vacancy rate was up over the previous quarter, with negative net absorption of 2,065,754sf in the first quarter. Vacant sublease space increased in the quarter, ending the quarter at 1,815,538sf. Rental rates ended the first quarter at USD9.17 per sf, an increase over the previous quarter. A total of nine buildings were delivered to the market in the quarter, totaling 691,045sf, with 3,790,267sf still under construction at the end of the quarter.37
Multifamily – Marcus & Millichap reports that a slower pace of construction, coupled with robust net absorption, fostered a 20-basis-point drop in the county vacancy rate to 3 percent as of yearend 2015. Marcus & Millichap reports that aside from downtown Los Angeles, which recorded the highest supply growth, the vast majority of submarkets recorded occupancy gains. Marcus & Millichap forecasts that a multi-decade high in apartment construction will foster a 40-basis-point rise in the metro vacancy rate to 3.4 percent in 2016. Robust demand for rentals provided a 6.1 percent lift in average effective rents to USD1,892 per month metro-wide in 2015. Marcus & Millichap forecasts average effective rent increases slowing to 3.7 percent to USD1,962 per month in 2016 as deliveries outpace demand growth.38
35 The CoStar Office Report, First Quarter 2016 Los Angeles Office Market©CoStar Group, Inc.
36 The CoStar Retail Report, First Quarter 2016 Los Angeles Retail Market ©CoStar Group, Inc.
37 The CoStar Industrial Report, First Quarter 2016 Los Angeles Industrial Market ©CoStar Group, Inc.
@2016 KPMG LLP, a Delaware limited liability partnership and the U.S. member firm of the KPMG network of independent member firms affiliated with KPMG International Cooperative (“KPMG International”), a Swiss entity. All rights reserved.

洛杉矶房地产市场办公楼—洛杉矶写字楼市场在2016年第一季度末的空置率为10.9 %。空置率较上一季度呈小幅回落,净吸纳量为正的811,328平方英尺。在2016年发生的最大的几笔租赁交易包括:Netflix公司在日落布朗森影城(威尔夏半山的标志性建筑)签订的123,221平方英尺的办公用地租赁合同; 国际创意管理公司在洛杉矶西部商圈星座大厦租赁的108,259平方英尺的办公面积;及清晰频道通信公司在伯班克/格伦代尔/帕萨迪纳商圈Pinnacle I签署的75,214平方英尺的租赁合同。在2016年第一季度末正在兴建的最大项目是洛杉矶联邦法院,一个拥有600,000平方英尺建筑面积的办公大楼,100%已预租; 另外一个大项目是在Wilshire的Office广场,估计可租用面积为356,141平方英尺。35
商 铺 — 洛 杉 矶 商 铺 市 场 在 2 0 1 6 年 第一季度市场条件没有太大的变化,空置率从上一季度的4.6%下降为本季度的4.5%。在2016年发生的最大的几笔租赁交易包括:Antelope Valley 大学在Palmdale东大道2301号租赁的 45,100平方英尺的租赁合同;LA健身在Agoura大街29431号签订的45,000平方英尺的租赁合同;斯塔特兄弟在洛杉矶东大道670号签订的40,518平方英尺的租赁合同。商铺业的净吸纳量在2016年第一季为正的683,466平方英尺。洛杉矶商铺市场平均租金率呈上升趋势,租金率超过前几个季度,以及2015第一季度。2016年第一季度末租金为 每年27.51美元每平方英尺,18栋商铺大楼共计178,052平方英尺面积待租,1,974,494平方英尺正在施工中。36
工业—洛杉矶工业市场在2016年第一季度的空置率为2.5%,比上一季度有所增加,净吸纳量为负的2,065,754平方英尺。本季度空置转租面积有所增加,在本季度末为1,815,538平方英尺。租金为9.17美元每平方英尺,较上一季度有所提升。到本季度末,共有9栋大楼,共计691,045平方英尺投入市场,3,790,267平方英尺仍在建设中。37
公寓—据Marcus & Millichap,洛杉矶公寓市场在本季度建设速度较慢,再加上强大的净吸纳量,促进空置率下降20个基点,在2015年底达到3%。Marcus & Millichap还指出,除洛杉矶市中心有创纪录的供应量增长外,绝大多数商圈的入住记录都呈涨势。Marcus & Millichap还预测由于几十年的公寓建设高潮将使得城市的空置率上升40个基点,在2016年会达到3.4%。强劲的租赁需求使得平均租金提升6.1%,2015年市区租金达到每月1,892美元,而由于交付超过需求,平均有效租金增幅在2016年会放缓至3.7%,为每月1,962美元。38
35 CoStar办公楼报告, 洛杉矶办公楼市场,2016年第一季度36 CoStar商铺报告, 洛杉矶商铺市场,2016年第一季度37 CoStar工业报告, 洛杉矶工业市场,2016年第一季度
@2016毕马威会计师事务所,美国特拉华州的有限责任合伙,并为毕马威国际合作组织(“毕马威国际”)相关联的独立成员所网络中的美国成员公司。毕马威国际属瑞士实体公司。版权所有,不得转载。
27China Inbound Investing in U.S. Real Estate
中国赴美房地产投资
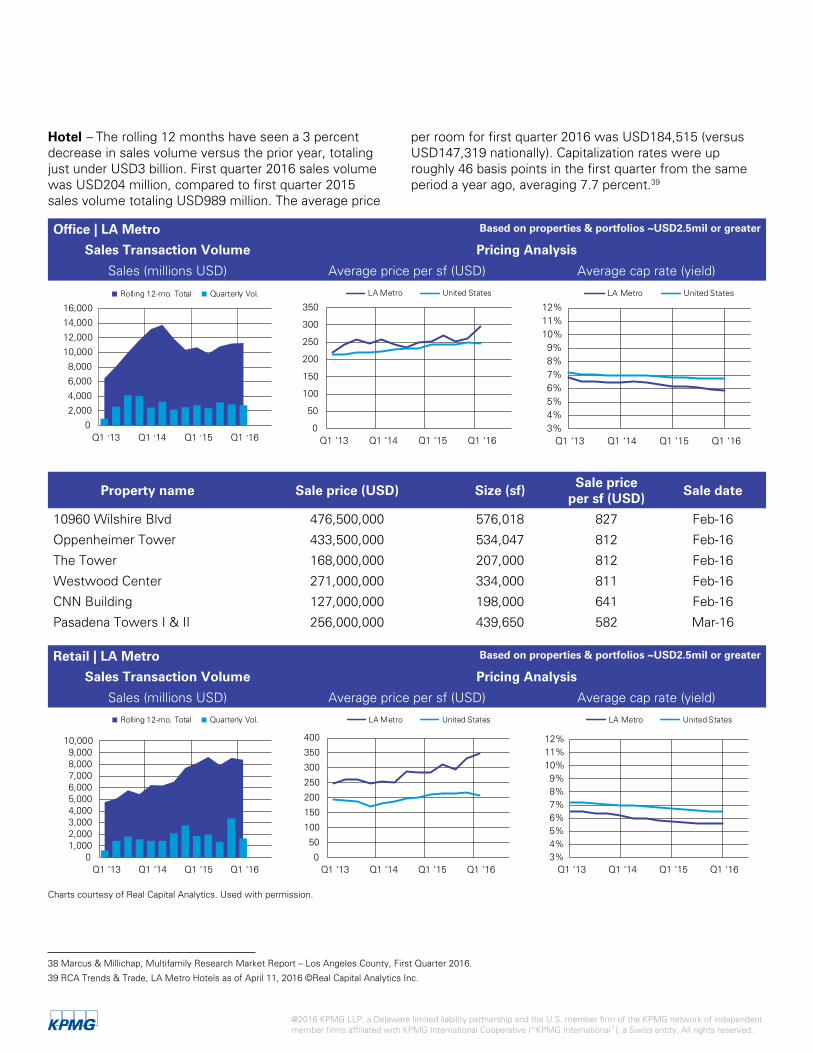
Hotel – The rolling 12 months have seen a 3 percent decrease in sales volume versus the prior year, totaling just under USD3 billion. First quarter 2016 sales volume was USD204 million, compared to first quarter 2015 sales volume totaling USD989 million. The average price
per room for first quarter 2016 was USD184,515 (versus USD147,319 nationally). Capitalization rates were up roughly 46 basis points in the first quarter from the same period a year ago, averaging 7.7 percent.39
Office | LA Metro Based on properties & portfolios ~USD2.5mil or greater
Sales Transaction Volume Pricing Analysis
Sales (millions USD) Average price per sf (USD) Average cap rate (yield)
0
2,000
4,000
6,000
8,000
10,000
12,000
14,000
16,000
Q1 ‘13 Q1 ‘14 Q1 ‘15 Q1 ‘16
Rolling 12-mo. Total Quarterly Vol.
0
50
100
150
200
250
300
350
Q1 ‘13 Q1 ‘14 Q1 ‘15 Q1 ‘16
LA Metro United States
3%4%5%6%7%8%9%
10%11%12%
Q1 ‘13 Q1 ‘14 Q1 ‘15 Q1 ‘16
LA Metro United States
Property name Sale price (USD) Size (sf)Sale price
per sf (USD)Sale date
10960 Wilshire Blvd 476,500,000 576,018 827 Feb-16
Oppenheimer Tower 433,500,000 534,047 812 Feb-16
The Tower 168,000,000 207,000 812 Feb-16
Westwood Center 271,000,000 334,000 811 Feb-16
CNN Building 127,000,000 198,000 641 Feb-16
Pasadena Towers I & II 256,000,000 439,650 582 Mar-16
Retail | LA Metro Based on properties & portfolios ~USD2.5mil or greater
Sales Transaction Volume Pricing Analysis
Sales (millions USD) Average price per sf (USD) Average cap rate (yield)
Rolling 12-mo. Total Quarterly Vol.
01,0002,0003,0004,0005,0006,0007,0008,0009,000
10,000
Q1 ‘13 Q1 ‘14 Q1 ‘15 Q1 ‘16
LA Metro United States
0
50
100
150
200
250
300
350
400
Q1 ‘13 Q1 ‘14 Q1 ‘15 Q1 ‘16
LA Metro United States
3%4%5%6%7%8%9%
10%11%12%
Q1 ‘13 Q1 ‘14 Q1 ‘15 Q1 ‘16
Charts courtesy of Real Capital Analytics. Used with permission.
38 Marcus & Millichap, Multifamily Research Market Report – Los Angeles County, First Quarter 2016.
39 RCA Trends & Trade, LA Metro Hotels as of April 11, 2016 ©Real Capital Analytics Inc.
@2016 KPMG LLP, a Delaware limited liability partnership and the U.S. member firm of the KPMG network of independent member firms affiliated with KPMG International Cooperative (“KPMG International”), a Swiss entity. All rights reserved.
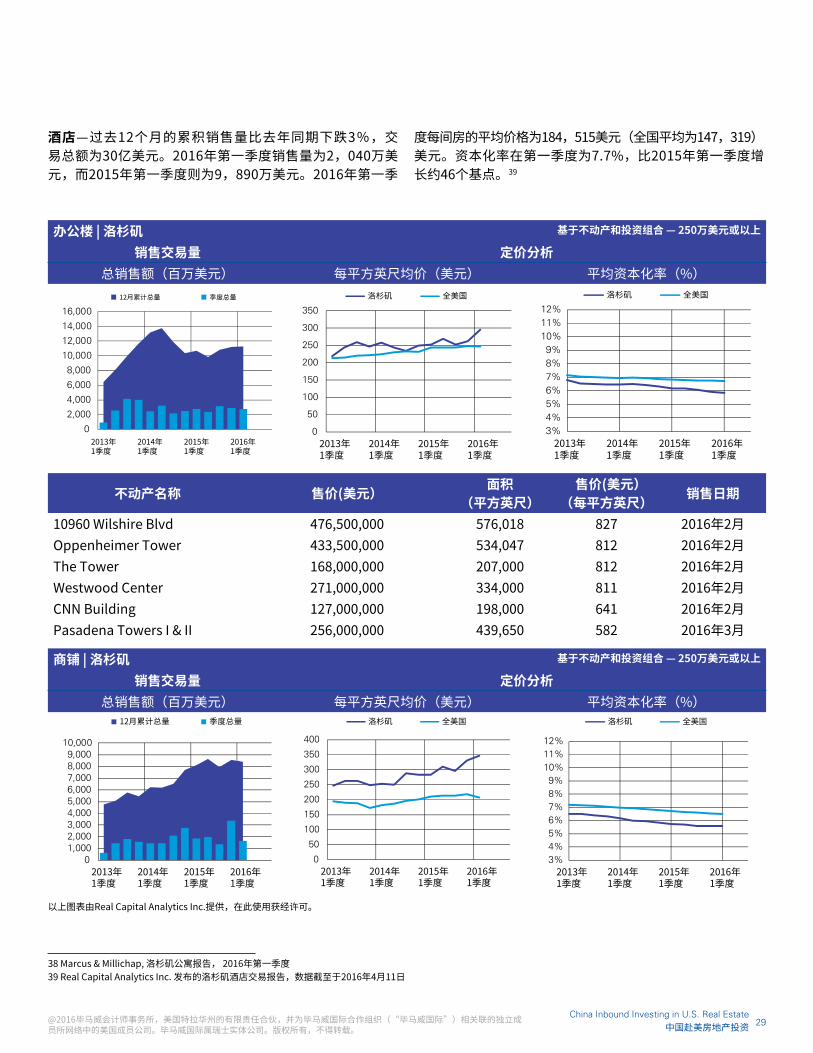
办公楼 | 洛杉矶 基于不动产和投资组合 — 250万美元或以上
销售交易量 定价分析总销售额(百万美元) 每平方英尺均价(美元) 平均资本化率(%)
不动产名称 售价(美元) 面积 (平方英尺)
售价(美元) (每平方英尺) 销售日期
10960 Wilshire Blvd 476,500,000 576,018 827 2016年2月Oppenheimer Tower 433,500,000 534,047 812 2016年2月The Tower 168,000,000 207,000 812 2016年2月Westwood Center 271,000,000 334,000 811 2016年2月CNN Building 127,000,000 198,000 641 2016年2月Pasadena Towers I & II 256,000,000 439,650 582 2016年3月
商铺 | 洛杉矶 基于不动产和投资组合 — 250万美元或以上
销售交易量 定价分析总销售额(百万美元) 每平方英尺均价(美元) 平均资本化率(%)
以上图表由Real Capital Analytics Inc.提供,在此使用获经许可。
38 Marcus & Millichap, 洛杉矶公寓报告, 2016年第一季度39 Real Capital Analytics Inc. 发布的洛杉矶酒店交易报告,数据截至于2016年4月11日
酒店—过去12个月的累积销售量比去年同期下跌3%,交易总额为30亿美元。2016年第一季度销售量为2,040万美元,而2015年第一季度则为9,890万美元。2016年第一季
度每间房的平均价格为184,515美元(全国平均为147,319)美元。资本化率在第一季度为7.7%,比2015年第一季度增长约46个基点。39
@2016毕马威会计师事务所,美国特拉华州的有限责任合伙,并为毕马威国际合作组织(“毕马威国际”)相关联的独立成员所网络中的美国成员公司。毕马威国际属瑞士实体公司。版权所有,不得转载。
29China Inbound Investing in U.S. Real Estate
中国赴美房地产投资

Property name Sale price (USD) Size (sf)Sale price
per sf (USD)Sale date
Village Glen Plaza 40,500,000 71,606 566 Feb-16
Fred Segal Building 43,000,000 28,747 1,496 Mar-16
Pasadena & Valley Union Building 5,880,000 5,225 1,125 Mar-16
Antiquarius Antique & Jewelry Mall 20,876,000 19,610 1,065 Mar-16
Brookhurst & Adams 18,556,000 24,016 773 Mar-16
Walgreens 9,660,000 14,380 672 Mar-16
Wells Fargo 11,000,000 19,067 577 Mar-16
Industrial | LA Metro Based on properties & portfolios ~USD2.5mil or greater
Sales Transaction Volume Pricing Analysis
Sales (millions USD) Average price per sf (USD) Average cap rate (yield)
Rolling 12-mo. Total Quarterly Vol.
0
2,000
4,000
6,000
8,000
10,000
12,000
Q1 ‘13 Q1 ‘14 Q1 ‘15 Q1 ‘16
LA Metro United States
0
20
40
60
80
100
120
140
Q1 ‘13 Q1 ‘14 Q1 ‘15 Q1 ‘16
LA Metro United States
3%4%5%6%7%8%9%
10%11%12%
Q1 ‘13 Q1 ‘14 Q1 ‘15 Q1 ‘16
Property name Sale price (USD) Size (sf)Sale price
per sf (USD)Sale date
Walmart Distribution Center 105,000,000 507,000 207 Feb-16
1205 Colorado Avenue 19,500,000 19,940 978 Feb-16
2001 East Dyer Road 55,000,000 363,000 152 Mar-16
Corona Dolphin 18,895,500 210,044 90 Mar-16
15025 Proctor Avenue 18,709,000 128,500 146 Mar-16
Telepictures Productions 15,375,000 56,457 272 Mar-16
1727 Buena Vista St 13,940,000 49,486 282 Mar-16
Irvine Industrial Complex 11,801,000 80,892 146 Mar-16
15500 S Avalon Blvd 10,794,000 62,630 172 Mar-16
1565 Eastwood Court 7,250,000 40,000 181 Mar-16
Vishay Americas 6,109,000 53,770 114 Mar-16
1862 E 55th St 5,550,000 48,234 115 Mar-16
Charts courtesy of Real Capital Analytics. Used with permission.
@2016 KPMG LLP, a Delaware limited liability partnership and the U.S. member firm of the KPMG network of independent member firms affiliated with KPMG International Cooperative (“KPMG International”), a Swiss entity. All rights reserved.

不动产名称 售价(美元) 面积 (平方英尺)
售价(美元) (每平方英尺) 销售日期
Village Glen Plaza 40,500,000 71,606 566 2016年2月Fred Segal Building 43,000,000 28,747 1,496 2016年3月Pasadena & Valley Union Building 5,880,000 5,225 1,125 2016年3月Antiquarius Antique & Jewelry Mall 20,876,000 19,610 1,065 2016年3月Brookhurst & Adams 18,556,000 24,016 773 2016年3月Walgreens 9,660,000 14,380 672 2016年3月Wells Fargo 11,000,000 19,067 577 2016年3月
工业 | 洛杉矶 基于不动产和投资组合 — 250万美元或以上
销售交易量 定价分析总销售额(百万美元) 每平方英尺均价(美元) 平均资本化率(%)
不动产名称 售价(美元) 面积 (平方英尺)
售价(美元) (每平方英尺) 销售日期
Walmart Distribution Center 105,000,000 507,000 207 2016年2月1205 Colorado Avenue 19,500,000 19,940 978 2016年2月2001 East Dyer Road 55,000,000 363,000 152 2016年3月Corona Dolphin 18,895,500 210,044 90 2016年3月15025 Proctor Avenue 18,709,000 128,500 146 2016年3月Telepictures Productions 15,375,000 56,457 272 2016年3月1727 Buena Vista St 13,940,000 49,486 282 2016年3月Irvine Industrial Complex 11,801,000 80,892 146 2016年3月15500 S Avalon Blvd 10,794,000 62,630 172 2016年3月1565 Eastwood Court 7,250,000 40,000 181 2016年3月Vishay Americas 6,109,000 53,770 114 2016年3月1862 E 55th St 5,550,000 48,234 115 2016年3月
以上图表由Real Capital Analytics Inc.提供,在此使用获经许可。
@2016毕马威会计师事务所,美国特拉华州的有限责任合伙,并为毕马威国际合作组织(“毕马威国际”)相关联的独立成员所网络中的美国成员公司。毕马威国际属瑞士实体公司。版权所有,不得转载。
31China Inbound Investing in U.S. Real Estate
中国赴美房地产投资

Apartment | LA Metro Based on properties & portfolios ~USD2.5mil or greater
Sales Transaction Volume Pricing Analysis
Sales (millions USD) Average price per unit (USD) Average cap rate (yield)
Rolling 12-mo. Total Quarterly Vol.
0
2,000
4,000
6,000
8,000
10,000
12,000
14,000
Q1 ‘13 Q1 ‘14 Q1 ‘15 Q1 ‘16
LA Metro United States
0
50,000
100,000
150,000
200,000
250,000
Q1 ‘13 Q1 ‘14 Q1 ‘15 Q1 ‘16
LA Metro United States
3%4%5%6%7%8%9%
10%11%12%
Q1 ‘13 Q1 ‘14 Q1 ‘15 Q1 ‘16
Property name Sales price (USD) No. of unitsSales price
per unit (USD)Sale date
Capri Apartments 36,550,000 330 110,758 Mar-16
Micropolitan at Urban Lights 27,100,000 45 602,222 Mar-16
Sierra Vista 26,500,000 166 159,639 Mar-16
Hotal | LA Metro Based on properties & portfolios ~USD2.5mil or greater
Sales Transaction Volume Pricing Analysis
Sales (millions USD) Average price per unit (USD) Average cap rate (yield)
Rolling 12-mo. Total Quarterly Vol.
0
500
1,000
1,500
2,000
2,500
3,000
3,500
4,000
Q1 ‘13 Q1 ‘14 Q1 ‘15 Q1 ‘16
LA Metro United States
0
50,000
100,000
150,000
200,000
250,000
Q1 ‘13 Q1 ‘14 Q1 ‘15 Q1 ‘16
LA Metro United States
3%4%5%6%7%8%9%
10%11%12%
Q1 '13 Q1 '14 Q1 '15 Q1 '16
Property name Sale price (USD) No. of keysSale price
per key (USD)Sale date
Loews Santa Monica Beach Hotel 442,624,549 342 1,294,224 Dec-15
Ritz Carlton Laguna Niguel 391,172,077 393 995,349 Dec-15
Montage Laguna Beach 248,837,199 250 995,349 Dec-15
Residence Inn Los Angeles Torrance/Redondo Beach
51,750,000 248 208,669 Dec-15
Pasadena Inn 14,500,000 67 216,418 Dec-15
Hyatt Valencia 50,967,000 244 208,881 Jan-16
Best Western Royal Palace 16,500,000 55 300,000 Jan-16
Hollywood Hills Hotel 38,500,000 43 895,349 Mar-16Charts courtesy of Real Capital Analytics. Used with permission.
@2016 KPMG LLP, a Delaware limited liability partnership and the U.S. member firm of the KPMG network of independent member firms affiliated with KPMG International Cooperative (“KPMG International”), a Swiss entity. All rights reserved.
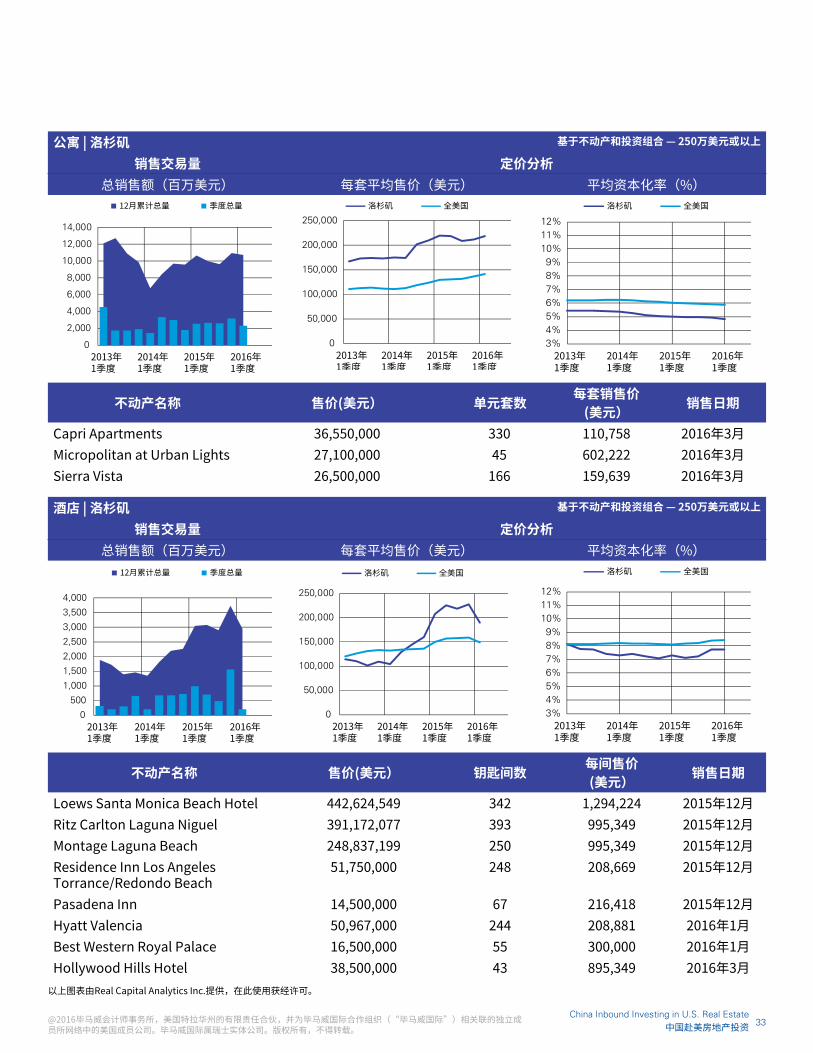
公寓 | 洛杉矶 基于不动产和投资组合 — 250万美元或以上
销售交易量 定价分析总销售额(百万美元) 每套平均售价(美元) 平均资本化率(%)
不动产名称 售价(美元) 单元套数 每套销售价 (美元) 销售日期
Capri Apartments 36,550,000 330 110,758 2016年3月Micropolitan at Urban Lights 27,100,000 45 602,222 2016年3月Sierra Vista 26,500,000 166 159,639 2016年3月
酒店 | 洛杉矶 基于不动产和投资组合 — 250万美元或以上
销售交易量 定价分析总销售额(百万美元) 每套平均售价(美元) 平均资本化率(%)
不动产名称 售价(美元) 钥匙间数 每间售价 (美元) 销售日期
Loews Santa Monica Beach Hotel 442,624,549 342 1,294,224 2015年12月Ritz Carlton Laguna Niguel 391,172,077 393 995,349 2015年12月Montage Laguna Beach 248,837,199 250 995,349 2015年12月Residence Inn Los Angeles Torrance/Redondo Beach
51,750,000 248 208,669 2015年12月
Pasadena Inn 14,500,000 67 216,418 2015年12月Hyatt Valencia 50,967,000 244 208,881 2016年1月Best Western Royal Palace 16,500,000 55 300,000 2016年1月Hollywood Hills Hotel 38,500,000 43 895,349 2016年3月
以上图表由Real Capital Analytics Inc.提供,在此使用获经许可。
@2016毕马威会计师事务所,美国特拉华州的有限责任合伙,并为毕马威国际合作组织(“毕马威国际”)相关联的独立成员所网络中的美国成员公司。毕马威国际属瑞士实体公司。版权所有,不得转载。
33China Inbound Investing in U.S. Real Estate
中国赴美房地产投资

San Francisco real estate marketOffice – The San Francisco office market ended the first quarter of 2016 with a vacancy rate of 6.8 percent. The vacancy rate was down over the previous quarter, with positive net absorption of 887,196sf in the first quarter. The largest lease signings occurring in 2016 included the 404,109sf lease signed by Verily at Alexandria Technology Campus in the San Mateo North County submarket; the 150,000sf deal signed by Airbnb at 999 Brannan Street in the SF Downtown South submarket; and the 110,874sf lease signed by GoPro, Inc. at 3025 Clearview Way in the San Mateo Central County submarket. The largest projects underway at the end of first quarter 2016 were Salesforce Tower, a 1,420,081sf building with 58 percent of its space preleased, and Park Tower at Transbay, a 751,500sf facility that is 0 percent preleased.40
Retail – The San Francisco retail market did not experience much change in market conditions in the first quarter of 2016. The vacancy rate went from 2.1 percent in the previous quarter to 2.2 percent in the current quarter. The largest lease signings occurring in 2016 included the 25,542sf lease signed by Ross Dress for Less at 280 Metro Center; the 12,057sf deal signed by Staples, Inc. at 1700 Van Ness Avenue; and the 11,000sf lease signed by Bedroom Express at 426 El Camino Real. Retail net absorption was slightly negative in San Francisco in the first quarter of 2016 at (88,851) sf. Average quoted asking rental rates in the San Francisco retail market are up over previous quarter levels and up from their levels four quarters ago.
Quoted rents ended the first quarter of 2016 at USD37.92 per sf per year. During the first quarter of 2016, no new space was completed in the San Francisco retail market. There were 356,786sf of retail space under construction at the end of the first quarter of 2016.41
Industrial – The San Francisco industrial market ended the first quarter of 2016 with a vacancy rate of 2.7 percent. The vacancy rate was down over the previous quarter, with positive net absorption of 359,380sf in the first quarter. Vacant sublease space decreased in the quarter, ending the quarter at 143,242sf. Rental rates ended the first quarter at USD19.22, an increase over the previous quarter. A total of two buildings were delivered to the market in the quarter totaling 7,023sf, with 408,797sf still under construction at the end of the quarter.42
Multifamily – Marcus & Millichap reports that the largest supply increase in more than 16 years will prompt a forecasted 20-basis-point rise in vacancy to 3.6 percent in 2016. In 2015, vacancy remained unchanged with performance highly dependent on multiple submarkets. Soaring demand for apartments is propelling average effective rents up 6.7 percent over the past 12 months to USD2,988 per month as of yearend 2015. This growth follows the 12.7 percent advancement recorded in 2014. Marcus & Millichap predicts that in 2016, average effective rents will tack on 6.3 percent to USD3,176 per month as a lack of available housing continues to propel local residents toward rentals. However, Marcus & Millichap reports high-end rentals are beginning to see rent growth level off.43
40 The CoStar Office Report, First Quarter 2016 San Francisco Office Market ©CoStar Group, Inc.
41 The CoStar Retail Report, First Quarter 2016 San Francisco Retail Market ©CoStar Group, Inc.
42 The CoStar Industrial Report, First Quarter 2016 San Francisco Industrial Market ©CoStar Group, Inc.
43 Marcus & Millichap, Multifamily Research Market Report – San Francisco Metro Area, First Quarter 2016.
@2016 KPMG LLP, a Delaware limited liability partnership and the U.S. member firm of the KPMG network of independent member firms affiliated with KPMG International Cooperative (“KPMG International”), a Swiss entity. All rights reserved.
旧金山房地产市场办公楼—旧金山写字楼市场在2016年第一季度的空置率为6.8%,较上一季度有所下降,净吸纳量为正887,196平方英尺。2016年发生的重大租赁交易包括:Verily在圣马刁县北商圈亚历山大技术园区签订的404,109平方英尺办公区的租赁合同;Airbnb在旧金山市区南商圈Brannan大街999号租赁的 150,000平方英尺的办公用地; 及GoPro在圣马刁县中区Clearview way 3025号签署的租赁110,874平方英尺办公用地的合同。2016年第一季度末正在施工的最大项目是Salsforce办公楼,拥有1,420,081平方英尺的建筑面积,58%已被预租。另外一个是在位于Transbay的公园塔楼 ,751,500平方英尺的出租空间,目前还没有办公面积被预租。40
商铺—旧金山商铺市场2016年第一季度市场条件没有太大的变化,空置率从 上 一 季 度 的 2 . 1 % 略 升 到 本 季 度 的2.2%。2016年发生的重大的租赁交易包括:Ross Dress for Less在Metro Center签订的25,542平方英尺用地的租赁合同; 史泰博公司在Van Ness大街1700号签署的12,057平方英尺的租赁合同;和Bedroom Express在El Camino Real 426号签订的11,000平方英尺的 租赁合同。旧金山商铺业净吸纳量在2016年第一季度略有下降,为负的88,851平方英尺。租金率超过上一季度和前四个季度的水平。2016年第一季度末租金为每年每平方英尺37.92美元。到第一季度末,没有新的商铺大楼竣工,在建的零售空间为356,786平方英尺。41
工 业 — 旧 金 山 工 业 市 场 2 0 1 6 年 第 一季度2016空置率为2.7%,比上一季度有所下降,第一季度净吸纳量为正的359,380平方英尺。空置转租在本季度下降到143,242平方英尺。第一季度末的房租为19.22美元每平方英尺,比上一季度有所增长。2016年第一季度末共有两栋工业楼,总计7,023平方英尺建成待租,另有408,797平方英尺仍在建设中。42
公寓—据Marcus & Millichap的报告表明,近16年来的强大的供给将促使空置率增高20个基点,在2016年增至3.6%。2015年和过去相比,空置率没有太多变化,主要市场活动都集中在多个分市场。过去12个月对公寓的需求不断飙升促使租金增长6.7%,平均每月租金在2015年底达到2,988美元,这一增长是紧随在2014年创纪录的12.7%增长之后。Marcus & Millichap预测,由于缺乏可购买的住房,居民将继续采取租房的方式,在2016年,平均租金将会增长6.3%,达到每月3,176 美元。不过,Marcus & Millichap预测租金增长势头将不会持续太久。43
40 CoStar办公楼报告, 旧金山办公楼市场, 2016年第一季度41 CoStar商铺报告, 旧金山商铺市场,2016年第一季度42 CoStar工业报告, 旧金山工业市场,2016年第一季度43 Marcus & Millichap, 旧金山公寓报告, 2016年第一季度
@2016毕马威会计师事务所,美国特拉华州的有限责任合伙,并为毕马威国际合作组织(“毕马威国际”)相关联的独立成员所网络中的美国成员公司。毕马威国际属瑞士实体公司。版权所有,不得转载。
35China Inbound Investing in U.S. Real Estate
中国赴美房地产投资
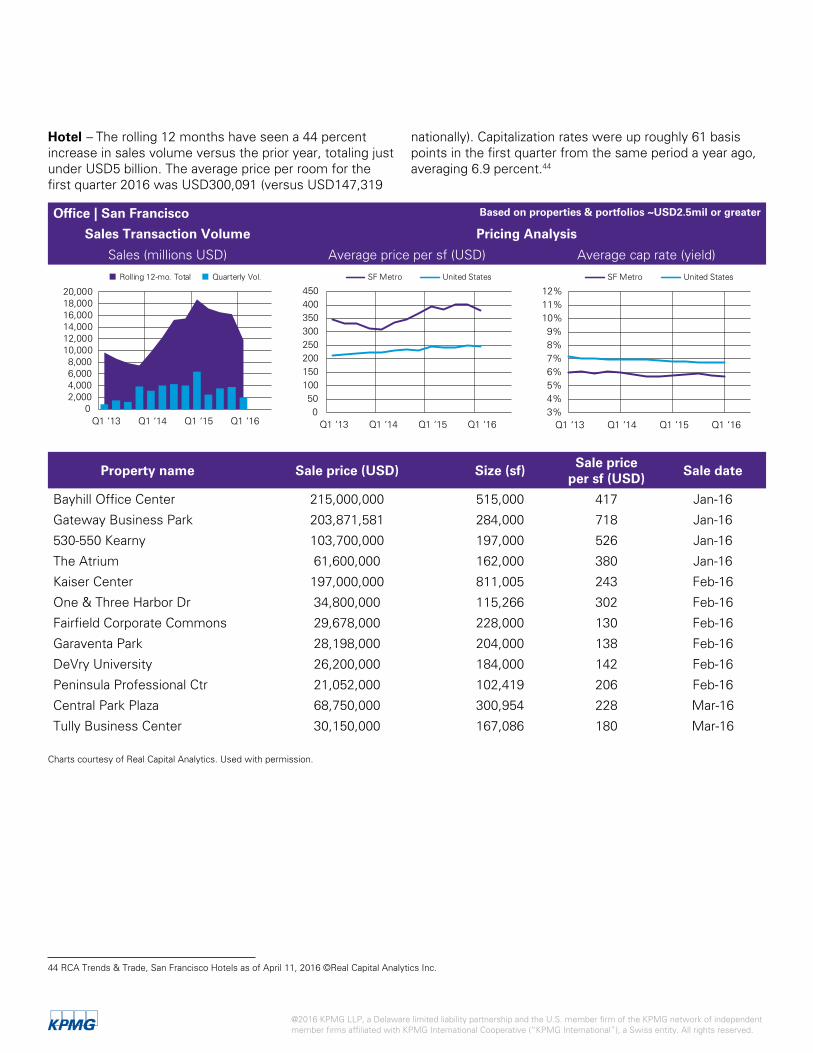
Hotel – The rolling 12 months have seen a 44 percent increase in sales volume versus the prior year, totaling just under USD5 billion. The average price per room for the first quarter 2016 was USD300,091 (versus USD147,319
nationally). Capitalization rates were up roughly 61 basis points in the first quarter from the same period a year ago, averaging 6.9 percent.44
Office | San Francisco Based on properties & portfolios ~USD2.5mil or greater
Sales Transaction Volume Pricing Analysis
Sales (millions USD) Average price per sf (USD) Average cap rate (yield)
02,0004,0006,0008,000
10,00012,00014,00016,00018,00020,000
Q1 ‘13 Q1 ‘14 Q1 ‘15 Q1 ‘16
Rolling 12-mo. Total Quarterly Vol.
050
100150200250300350400450
Q1 ‘13 Q1 ‘14 Q1 ‘15 Q1 ‘16
SF Metro United States
3%4%5%6%7%8%9%
10%11%12%
Q1 ‘13 Q1 ‘14 Q1 ‘15 Q1 ‘16
SF Metro United States
Property name Sale price (USD) Size (sf)Sale price
per sf (USD)Sale date
Bayhill Office Center 215,000,000 515,000 417 Jan-16
Gateway Business Park 203,871,581 284,000 718 Jan-16
530-550 Kearny 103,700,000 197,000 526 Jan-16
The Atrium 61,600,000 162,000 380 Jan-16
Kaiser Center 197,000,000 811,005 243 Feb-16
One & Three Harbor Dr 34,800,000 115,266 302 Feb-16
Fairfield Corporate Commons 29,678,000 228,000 130 Feb-16
Garaventa Park 28,198,000 204,000 138 Feb-16
DeVry University 26,200,000 184,000 142 Feb-16
Peninsula Professional Ctr 21,052,000 102,419 206 Feb-16
Central Park Plaza 68,750,000 300,954 228 Mar-16
Tully Business Center 30,150,000 167,086 180 Mar-16 Charts courtesy of Real Capital Analytics. Used with permission.
44 RCA Trends & Trade, San Francisco Hotels as of April 11, 2016 ©Real Capital Analytics Inc.
@2016 KPMG LLP, a Delaware limited liability partnership and the U.S. member firm of the KPMG network of independent member firms affiliated with KPMG International Cooperative (“KPMG International”), a Swiss entity. All rights reserved.

办公楼 | 旧金山 基于不动产和投资组合 — 250万美元或以上
销售交易量 定价分析总销售额(百万美元) 每平方英尺均价(美元) 平均资本化率(%)
不动产名称 售价(美元) 面积 (平方英尺)
售价(美元) (每平方英尺) 销售日期
Bayhill Office Center 215,000,000 515,000 417 2016年1月Gateway Business Park 203,871,581 284,000 718 2016年1月530-550 Kearny 103,700,000 197,000 526 2016年1月The Atrium 61,600,000 162,000 380 2016年1月Kaiser Center 197,000,000 811,005 243 2016年2月One & Three Harbor Dr 34,800,000 115,266 302 2016年2月Fairfield Corporate Commons 29,678,000 228,000 130 2016年2月Garaventa Park 28,198,000 204,000 138 2016年2月DeVry University 26,200,000 184,000 142 2016年2月Peninsula Professional Ctr 21,052,000 102,419 206 2016年2月Central Park Plaza 68,750,000 300,954 228 2016年3月Tully Business Center 30,150,000 167,086 180 2016年3月
以上图表由Real Capital Analytics Inc.提供,在此使用获经许可。
44 Real Capital Analytics Inc. 发布的旧金山酒店交易报告,数据截至于2016年4月11日
酒店—过去12个月的销售量与前一年相比增长了44% ,销售总额略低于50亿美元。2016年第一季度每间房的平均售价格
为300,091美元(全国平均售价为147,319美元)。资本化率在2016年第一季度为6.9%,比去年同期增长约61个基点。44
@2016毕马威会计师事务所,美国特拉华州的有限责任合伙,并为毕马威国际合作组织(“毕马威国际”)相关联的独立成员所网络中的美国成员公司。毕马威国际属瑞士实体公司。版权所有,不得转载。
37China Inbound Investing in U.S. Real Estate
中国赴美房地产投资

Retail | San Francisco Based on properties & portfolios ~USD2.5mil or greater
Sales Transaction Volume Pricing Analysis
Sales (millions USD) Average price per sf (USD) Average cap rate (yield)
0
500
1,000
1,500
2,000
2,500
3,000
3,500
4,000
Q1 ‘13 Q1 ‘14 Q1 ‘15 Q1 ‘16
Rolling 12-mo. Total Quarterly Vol.
0
50
100
150
200
250
300
350
400
Q1 ‘13 Q1 ‘14 Q1 ‘15 Q1 ‘16
SF Metro United States
3%4%5%6%7%8%9%
10%11%12%
Q1 ‘13 Q1 ‘14 Q1 ‘15 Q1 ‘16
SF Metro United States
Property name Sale price (USD) Size (sf)Sale price
per sf (USD)Sale date
400 San Antonio Rd 19,100,889 16,040 1,191 Jan-16
111 West San Bruno Avenue 3,500,000 3,500,000 583 Jan-16
Vida Apts Retail Condo 7,595,000 14,235 534 Jan-16
9 Kearny 4,900,000 3,080 1,591 Feb-16
3023-3027 Fillmore Street 5,200,000 6,623 785 Feb-16
CVS/Pharmacy 10,350,000 15,789 656 Feb-16
Palo Alto Midtown Center 11,850,000 18,160 653 Feb-16
2525 Van Ness Avenue 5,750,000 9,980 576 Feb-16
Destination Art 4,000,000 5,400 741 Mar-16
Former Radio Shack 4,750,000 6,600 720 Mar-16
Lovely Bride 4,100,000 6,207 661 Mar-16
Industrial | San Francisco Based on properties & portfolios ~USD2.5mil or greater
Sales Transaction Volume Pricing Analysis
Sales (millions USD) Average price per sf (USD) Average cap rate (yield)
0
1,000
2,000
3,000
4,000
5,000
6,000
7,000
Q1 ‘13 Q1 ‘14 Q1 ‘15 Q1 ‘16
Rolling 12-mo. Total Quarterly Vol.
020406080
100120140160180
Q1 ‘13 Q1 ‘14 Q1 ‘15 Q1 ‘16
SF Metro United States
3%4%5%6%7%8%9%
10%11%12%
Q1 ‘13 Q1 ‘14 Q1 ‘15 Q1 ‘16
SF Metro United States
Charts courtesy of Real Capital Analytics. Used with permission.
@2016 KPMG LLP, a Delaware limited liability partnership and the U.S. member firm of the KPMG network of independent member firms affiliated with KPMG International Cooperative (“KPMG International”), a Swiss entity. All rights reserved.

商铺 | 旧金山 基于不动产和投资组合 — 250万美元或以上
销售交易量 定价分析总销售额(百万美元) 每平方英尺均价(美元) 平均资本化率(%)
不动产名称 售价(美元) 面积 (平方英尺)
售价(美元) (每平方英尺) 销售日期
400 San Antonio Rd 19,100,889 16,040 1,191 2016年1月111 West San Bruno Avenue 3,500,000 3,500,000 583 2016年1月Vida Apts Retail Condo 7,595,000 14,235 534 2016年1月9 Kearny 4,900,000 3,080 1,591 2016年2月3023-3027 Fillmore Street 5,200,000 6,623 785 2016年2月CVS/Pharmacy 10,350,000 15,789 656 2016年2月Palo Alto Midtown Center 11,850,000 18,160 653 2016年2月2525 Van Ness Avenue 5,750,000 9,980 576 2016年2月Destination Art 4,000,000 5,400 741 2016年3月Former Radio Shack 4,750,000 6,600 720 2016年3月Lovely Bride 4,100,000 6,207 661 2016年3月
工业 | 旧金山 基于不动产和投资组合 — 250万美元或以上
销售交易量 定价分析总销售额(百万美元) 每平方英尺均价(美元) 平均资本化率(%)
以上图表由Real Capital Analytics Inc.提供,在此使用获经许可。
@2016毕马威会计师事务所,美国特拉华州的有限责任合伙,并为毕马威国际合作组织(“毕马威国际”)相关联的独立成员所网络中的美国成员公司。毕马威国际属瑞士实体公司。版权所有,不得转载。
39China Inbound Investing in U.S. Real Estate
中国赴美房地产投资

Property name Sale price (USD) Size (sf)Sale price
per sf (USD)Sale date
750 Harrison 7,125,000 5,324 1,338 Feb-16
M-Cubed Global 11,500,000 27,000 426 Feb-16
San Carlos Technology Center 36,450,000 103,000 534 Feb-16
690 East Arques Avenue 20,650,000 65,520 315 Feb-16
47444 Kato Rd 43,000,000 147,485 292 Feb-16
1740 Folsom St 4,920,000 18,862 261 Feb-16
815 Cherry Ln 4,300,000 16,800 256 Feb-16
1284 Forgewood Ave 5,000,000 20,000 250 Feb-16
1255 Terra Bella Ave 9,203,500 17,980 512 Mar-16
1245 Terra Bella Ave 7,541,750 16,000 471 Mar-16
Apartment | San Francisco Based on properties & portfolios ~USD2.5mil or greater
Sales Transaction Volume Pricing Analysis
Sales (millions USD) Average price per unit (USD) Average cap rate (yield)
01,0002,0003,0004,0005,0006,0007,0008,0009,000
Q1 ‘13 Q1 ‘14 Q1 ‘15 Q1 ‘16
Rolling 12-mo. Total Quarterly Vol.
0
50,000
100,000
150,000
200,000
250,000
300,000
350,000
Q1 ‘13 Q1 ‘14 Q1 ‘15 Q1 ‘16
SF Metro United States
3%4%5%6%7%8%9%
10%11%12%
Q1 ‘13 Q1 ‘14 Q1 ‘15 Q1 ‘16
SF Metro United States
Property name Sale price (USD) No. of unitsSale price
per unit (USD)Sale date
Sequoia Glen 33,500,000 114 293,860 Feb-16
Harvest Park 30,500,000 104 293,269 Feb-16
Orchard Ridge 22,000,000 77 285,714 Feb-16
395 E Okeefe St 18,024,041 79 228,152 Feb-16
1779 Woodland Ave 12,320,231 54 228,152 Feb-16
Royal Oaks 14,601,755 64 228,152 Feb-16
West Park Apartments 50,877,990 223 228,152 Feb-16
Saratoga Plaza 7,250,000 26 278,846 Mar-16 Charts courtesy of Real Capital Analytics. Used with permission.
@2016 KPMG LLP, a Delaware limited liability partnership and the U.S. member firm of the KPMG network of independent member firms affiliated with KPMG International Cooperative (“KPMG International”), a Swiss entity. All rights reserved.

不动产名称 售价(美元) 面积 (平方英尺)
售价(美元) (每平方英尺) 销售日期
750 Harrison 7,125,000 5,324 1,338 2016年2月M-Cubed Global 11,500,000 27,000 426 2016年2月San Carlos Technology Center 36,450,000 103,000 534 2016年2月690 East Arques Avenue 20,650,000 65,520 315 2016年2月47444 Kato Rd 43,000,000 147,485 292 2016年2月1740 Folsom St 4,920,000 18,862 261 2016年2月815 Cherry Ln 4,300,000 16,800 256 2016年2月1284 Forgewood Ave 5,000,000 20,000 250 2016年2月1255 Terra Bella Ave 9,203,500 17,980 512 2016年3月1245 Terra Bella Ave 7,541,750 16,000 471 2016年3月
公寓 | 旧金山 基于不动产和投资组合 — 250万美元或以上
销售交易量 定价分析总销售额(百万美元) 每套平均售价(美元) 平均资本化率(%)
不动产名称 售价(美元) 单元套数 每套销售价 (美元) 销售日期
Sequoia Glen 33,500,000 114 293,860 2016年2月Harvest Park 30,500,000 104 293,269 2016年2月Orchard Ridge 22,000,000 77 285,714 2016年2月395 E Okeefe St 18,024,041 79 228,152 2016年2月1779 Woodland Ave 12,320,231 54 228,152 2016年2月Royal Oaks 14,601,755 64 228,152 2016年2月West Park Apartments 50,877,990 223 228,152 2016年2月Saratoga Plaza 7,250,000 26 278,846 2016年3月
以上图表由Real Capital Analytics Inc.提供,在此使用获经许可。
@2016毕马威会计师事务所,美国特拉华州的有限责任合伙,并为毕马威国际合作组织(“毕马威国际”)相关联的独立成员所网络中的美国成员公司。毕马威国际属瑞士实体公司。版权所有,不得转载。
41China Inbound Investing in U.S. Real Estate
中国赴美房地产投资

Hotal | San Francisco Based on properties & portfolios ~USD2.5mil or greater
Sales Transaction Volume Pricing Analysis
Sales (millions USD) Average price per unit (USD) Average cap rate (yield)
0500
1,0001,5002,0002,5003,0003,5004,0004,5005,000
Q1 ‘13 Q1 ‘14 Q1 ‘15 Q1 ‘16
Rolling 12-mo. Total Quarterly Vol.
0
50,000
100,000
150,000
200,000
250,000
300,000
350,000
400,000
Q1 ‘13 Q1 ‘14 Q1 ‘15 Q1 ‘16
SF Metro United States
3%4%5%6%7%8%9%
10%11%12%
Q1 ‘13 Q1 ‘14 Q1 ‘15 Q1 ‘16
SF Metro United States
Property name Sale price (USD) No.of keys Sale price
per key (USD)Sale date
Four Seasons Silicon Valley 183,783,926 200 918,920 Dec-15
Westin St Francis 1,026,384,824 1,195 858,899 Dec-15
Ritz-Carlton Half Moon Bay 153,186,052 261 586,920 Dec-15
Sofitel 154,500,000 421 366,983 Dec-15
Hilton Garden Inn 74,000,000 160 462,500 Jan-16
Club Quarters 126,047,000 346 364,298 Feb-16
Marriott Courtyard 43,800,000 162 270,370 Feb-16 Charts courtesy of Real Capital Analytics. Used with permission.
@2016 KPMG LLP, a Delaware limited liability partnership and the U.S. member firm of the KPMG network of independent member firms affiliated with KPMG International Cooperative (“KPMG International”), a Swiss entity. All rights reserved.

酒店 | 旧金山 基于不动产和投资组合 — 250万美元或以上
销售交易量 定价分析总销售额(百万美元) 每套平均售价(美元) 平均资本化率(%)
不动产名称 售价(美元) 钥匙间数 每间售价 (美元) 销售日期
Four Seasons Silicon Valley 183,783,926 200 918,920 2015年12月Westin St Francis 1,026,384,824 1,195 858,899 2015年12月Ritz-Carlton Half Moon Bay 153,186,052 261 586,920 2015年12月Sofitel 154,500,000 421 366,983 2015年12月Hilton Garden Inn 74,000,000 160 462,500 2016年1月Club Quarters 126,047,000 346 364,298 2016年2月Marriott Courtyard 43,800,000 162 270,370 2016年2月
以上图表由Real Capital Analytics Inc.提供,在此使用获经许可。
@2016毕马威会计师事务所,美国特拉华州的有限责任合伙,并为毕马威国际合作组织(“毕马威国际”)相关联的独立成员所网络中的美国成员公司。毕马威国际属瑞士实体公司。版权所有,不得转载。
43China Inbound Investing in U.S. Real Estate
中国赴美房地产投资

Washington, DC real estate marketOffice – The Washington office market ended the first quarter of 2016 with a vacancy rate of 15.2 percent. The vacancy rate was up over the previous quarter, with negative net absorption of 1,186,480sf in the first quarter. The Federal Bureau of Prisons’ headquarters relocation to the 115,341sf space in the former Administration for Children and Families space at 370 L’Enfant Plaza SW was the largest deal signed in the first quarter of 2016. Skanska’s 2112 Pennsylvania Avenue project landed its first major tenant with law firm Cleary Gottlieb Steen & Hamilton LLP taking 114,958sf on the top floors of the project; the law firm will relocate from 2000 Pennsylvania Ave NW in the first quarter of 2018. The Universal Service Administrative Co. signed as an anchor tenant at One Metro Center where they will relocate into 102,348sf from 2001 L Street NW in September 2016. The largest projects underway at the end of the first quarter of 2016 were Capital One Campus – Building 3, a 975,000sf building with 100 percent of its space preleased and expected to be delivered in August 2018 as the tallest building in Northern Virginia. This is part of the Capital One Headquarters Campus 26-acre master plan including residential development. The National Science Foundation’s new headquarters at 2415 Eisenhower Avenue, a 700,000sf facility, is expected to be delivered in January 2017.45
Retail – The Washington retail market was flat overall, with the 4.2 percent vacancy rate staying constant from last quarter to this quarter. The largest lease signings occurring in 2016 included the 55,500sf lease signed by Saint Paul Baptist Church at 6333 Marlboro Pike; the 15,722sf
deal signed by Harbor Freight Tools at 10800 Promenade Lane; and the 12,415sf lease signed by Loudoun County Public Library at 22330 S Sterling Boulevard. Retail net absorption was slightly positive in the first quarter of 2016, with 251,542sf absorbed. Average quoted asking rental rates in the Washington retail market are down over previous quarter levels and down from their levels four quarters ago. Quoted rents ended the first quarter of 2016 at USD26.13 per sf per year. During the first quarter of 2016, 14 buildings totaling 150,078sf were completed in the Washington retail market. There were 2,286,627sf of retail space under construction at the end of the first quarter of 2016.46
Industrial – The Washington industrial market ended the first quarter of 2016 with a vacancy rate of 8.9 percent. The vacancy rate was up over the previous quarter, with positive net absorption of 1,459,134sf in the first quarter. Vacant sublease space decreased in the quarter, ending the quarter at 358,849sf. Rental rates ended the first quarter at USD9.87, an increase over the previous quarter. A total of 12 buildings were delivered to the market in the quarter totaling 1,830,295sf, with 2,281,885sf still under construction at the end of the quarter.47
Multifamily – Marcus & Millichap predicts the vacancy rate will be 4.1 percent for 2016, a decrease of 20 basis points from 2015. Average effective rents advanced 1.0 percent to USD1,599 metro-wide in 2015 as property owners opted to fill vacant units. In 2014, average effective rents swelled 3.4 percent. Marcus & Millichap forecasts average effective rents will increase by 2.8 percent to USD1,644 per month in 2016 as tenants fill available rentals.48
45 The CoStar Office Report, First Quarter 2016 Washington, D.C. Office Market ©CoStar Group, Inc.
46 The CoStar Retail Report, First Quarter 2016 Washington, D.C. Retail Market ©CoStar Group, Inc.
47 The CoStar Industrial Report, First Quarter 2016 Washington, D.C. Industrial Market ©CoStar Group, Inc.
48 Marcus & Millichap, Multifamily Research Market Report – Washington, D.C. Metro Area, First Quarter 2016.
@2016 KPMG LLP, a Delaware limited liability partnership and the U.S. member firm of the KPMG network of independent member firms affiliated with KPMG International Cooperative (“KPMG International”), a Swiss entity. All rights reserved.

华盛顿特区房地产市场办公楼—华盛顿特区在2016年第一季度空置率为15.2%,比上一季度有所提高,净吸纳量为负的1,186,480平方英尺。联邦监狱总部搬迁到前儿童和家庭管理中心租用的位于L’Enfant Plaza西南370号,115,341平方英尺的办公用地,这是2016年第一季度签署的最大的一笔交易。Cleary Gottlieb Steen & Hamilton 律师事务所在宾夕法尼亚大道2112号顶层租赁了114,958平方英尺的办公用地,成为Skanska公司此项目的第一大客户; 该律师事务所将于2018年从宾夕法尼亚西北大道2000号搬迁到新的办公用地。Universal Service Administrative公司,将在2016年9月迁至位于西北L大街2001号的102,348平方英尺的用地,成为One Metro中心的大客户。2016年第一季度最大的办公楼项目是在Capital One园区的拥有3,975,000平方英尺建筑面积的办公大楼。100%的面积都已预租,并预计在2018年8月年完工,这座大楼将会是北弗吉尼亚州的第一高楼。此办公楼是Capital One公司总部26英亩的总体规划,包括住宅发展的一部分。美国国家科学基金会的新总部将位于艾森豪威尔大道2415号,拥有700,000平方英尺的办公面积,预计于2017年1月竣工。45
商铺— 华盛顿特区商铺市场保持平稳水平,2016年第一季度空置率保持在4.2%。2016年发生的重大的租赁交易包括:圣保罗浸信会在Marlboro Pike 6333号签订的55,500平方英尺的租赁合同; Harbor Freight Tools在Promenade街10800号签订的15,722平方英尺的租赁合同; Loudoun County的公共图书馆在Sterling南大道22330号签订的12,415平方英尺的租赁合同。
商铺业净吸纳量在2016年第一季度稍微成正值,为251,542平方英尺。华盛顿商铺市场平均租金率出现下跌倾向,比上一季度和前四个季度水平都有所降低。第一季度末租金为每年26.13美元每平方英尺。到2016年第一季度末,14栋大楼共150,078平方英尺商铺面积投入市场,2,286,627平方英尺仍在建设中。46
工业—华盛顿特区工业市场在2016年第一季度的空置率为8.9%,比上一季度有所上升,净吸纳量为正的1,459,134平方英尺。本季度空置转租面积下降,到本季度末为358,849平方英尺。房租为 9.87美元,比上一季度有所增加。在本季度共有12栋大楼,1,830,295平方英尺建成待租,2,281,885平方英尺还在建设中。47
公寓—Marcus & Millichap预计空置率在2016年会达到4.1%,比2015年降低20个基点。由于房东积极寻找租户,月租金在2015年增长了1.0%,为1,599美元。2014年平均租金上涨率为 3.4%。Marcus & Millichap还预测由于租户的需求,2016年租金将提高2.8%,升至每月1,644美元。48
45 CoStar办公楼报告 ,华盛顿特区办公楼市场,2016年第一季度46 CoStar商铺报告 ,华盛顿特区商铺市场,2016年第一季度47 CoStar工业报告 ,华盛顿特区工业市场,2016年第一季度48 Marcus & Millichap, 华盛顿特区公寓市场,2016年第一季度
@2016毕马威会计师事务所,美国特拉华州的有限责任合伙,并为毕马威国际合作组织(“毕马威国际”)相关联的独立成员所网络中的美国成员公司。毕马威国际属瑞士实体公司。版权所有,不得转载。
45China Inbound Investing in U.S. Real Estate
中国赴美房地产投资
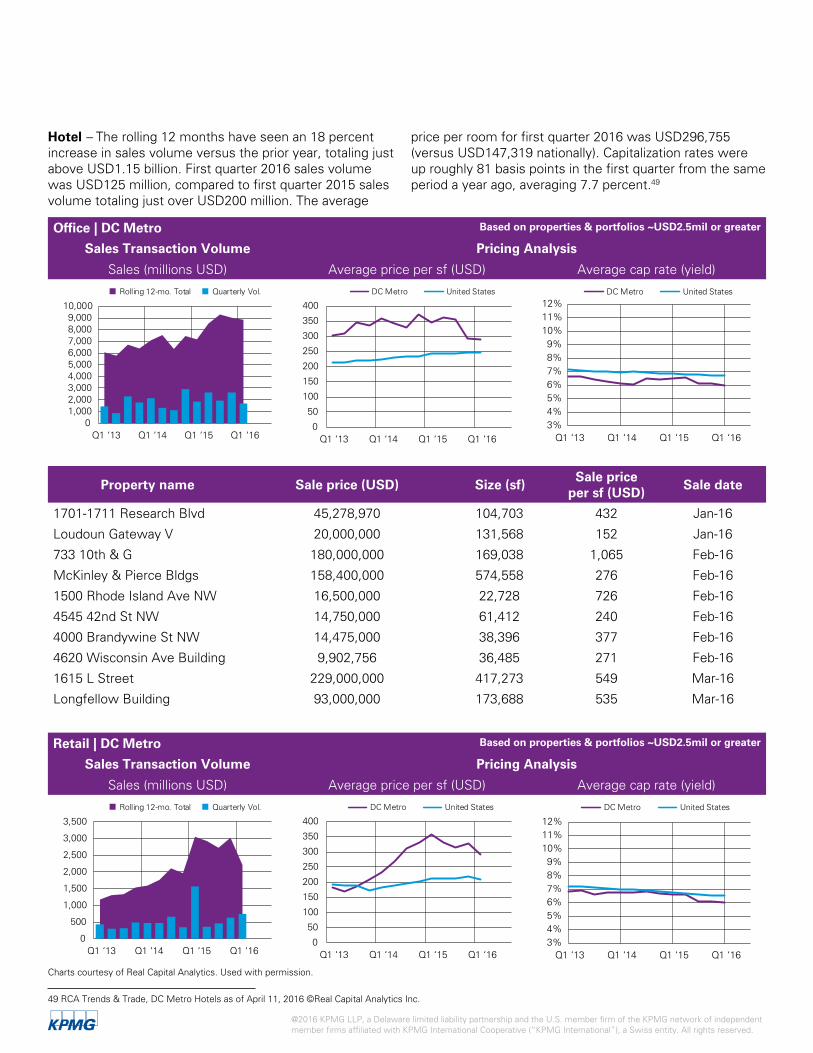
Hotel – The rolling 12 months have seen an 18 percent increase in sales volume versus the prior year, totaling just above USD1.15 billion. First quarter 2016 sales volume was USD125 million, compared to first quarter 2015 sales volume totaling just over USD200 million. The average
price per room for first quarter 2016 was USD296,755 (versus USD147,319 nationally). Capitalization rates were up roughly 81 basis points in the first quarter from the same period a year ago, averaging 7.7 percent.49
Office | DC Metro Based on properties & portfolios ~USD2.5mil or greater
Sales Transaction Volume Pricing Analysis
Sales (millions USD) Average price per sf (USD) Average cap rate (yield)
01,0002,0003,0004,0005,0006,0007,0008,0009,000
10,000
Q1 ‘13 Q1 ‘14 Q1 ‘15 Q1 ‘16
Rolling 12-mo. Total Quarterly Vol.
0
50
100
150
200
250
300
350
400
Q1 ‘13 Q1 ‘14 Q1 ‘15 Q1 ‘16
DC Metro United States
3%4%5%6%7%8%9%
10%11%12%
Q1 ‘13 Q1 ‘14 Q1 ‘15 Q1 ‘16
DC Metro United States
Property name Sale price (USD) Size (sf)Sale price
per sf (USD)Sale date
1701-1711 Research Blvd 45,278,970 104,703 432 Jan-16
Loudoun Gateway V 20,000,000 131,568 152 Jan-16
733 10th & G 180,000,000 169,038 1,065 Feb-16
McKinley & Pierce Bldgs 158,400,000 574,558 276 Feb-16
1500 Rhode Island Ave NW 16,500,000 22,728 726 Feb-16
4545 42nd St NW 14,750,000 61,412 240 Feb-16
4000 Brandywine St NW 14,475,000 38,396 377 Feb-16
4620 Wisconsin Ave Building 9,902,756 36,485 271 Feb-16
1615 L Street 229,000,000 417,273 549 Mar-16
Longfellow Building 93,000,000 173,688 535 Mar-16
Retail | DC Metro Based on properties & portfolios ~USD2.5mil or greater
Sales Transaction Volume Pricing Analysis
Sales (millions USD) Average price per sf (USD) Average cap rate (yield)
0
500
1,000
1,500
2,000
2,500
3,000
3,500
Q1 ‘13 Q1 ‘14 Q1 ‘15 Q1 ‘16
Rolling 12-mo. Total Quarterly Vol.
0
50
100
150
200
250
300
350
400
Q1 ‘13 Q1 ‘14 Q1 ‘15 Q1 ‘16
DC Metro United States
3%4%5%6%7%8%9%
10%11%12%
Q1 ‘13 Q1 ‘14 Q1 ‘15 Q1 ‘16
DC Metro United States
Charts courtesy of Real Capital Analytics. Used with permission.
49 RCA Trends & Trade, DC Metro Hotels as of April 11, 2016 ©Real Capital Analytics Inc.
@2016 KPMG LLP, a Delaware limited liability partnership and the U.S. member firm of the KPMG network of independent member firms affiliated with KPMG International Cooperative (“KPMG International”), a Swiss entity. All rights reserved.

办公楼 | 华盛顿特区 基于不动产和投资组合 — 250万美元或以上
销售交易量 定价分析总销售额(百万美元) 每平方英尺均价(美元) 平均资本化率(%)
不动产名称 售价(美元) 面积 (平方英尺)
售价(美元) (每平方英尺) 销售日期
1701-1711 Research Blvd 45,278,970 104,703 432 2016年1月Loudoun Gateway V 20,000,000 131,568 152 2016年1月733 10th & G 180,000,000 169,038 1,065 2016年2月McKinley & Pierce Bldgs 158,400,000 574,558 276 2016年2月1500 Rhode Island Ave NW 16,500,000 22,728 726 2016年2月4545 42nd St NW 14,750,000 61,412 240 2016年2月4000 Brandywine St NW 14,475,000 38,396 377 2016年2月4620 Wisconsin Ave Building 9,902,756 36,485 271 2016年2月1615 L Street 229,000,000 417,273 549 2016年3月Longfellow Building 93,000,000 173,688 535 2016年3月
商铺 | 华盛顿特区 基于不动产和投资组合 — 250万美元或以上
销售交易量 定价分析总销售额(百万美元) 每平方英尺均价(美元) 平均资本化率(%)
以上图表由Real Capital Analytics Inc.提供,在此使用获经许可。
49 Real Capital Analytics Inc.发布的华盛顿特区酒店交易报告,数据截至于2016年4月11日
酒店—过去12个月的销售量与上年相比增长18%,交易总额共计 11.5 亿美元。2016年第一季度销量为1.25亿美元,而2015年第一季度的销量总额刚刚超过2千万美元。2016年
第一季度每间房的平均价格是US 296,755美元(全国水平市147,319美元)。资本化率为7.7%,比2015年第一季度增长约81个基点。49
@2016毕马威会计师事务所,美国特拉华州的有限责任合伙,并为毕马威国际合作组织(“毕马威国际”)相关联的独立成员所网络中的美国成员公司。毕马威国际属瑞士实体公司。版权所有,不得转载。
47China Inbound Investing in U.S. Real Estate
中国赴美房地产投资

Property name Sale price (USD) Size (sf)Sale price
per sf (USD)Sale date
Regal Stadium 14 64,000,000 58,961 1,085 Jan-16
Plaza del Mercado 55,226,399 96,000 575 Jan-16
Free State 50,629,723 279,000 181 Jan-16
Virginia Gateway (Phase IV) 47,250,000 125,653 376 Jan-16
Virginia Gateway (Atlas Walk) 47,249,989 100,684 469 Jan-16
Merrifield II 45,546,037 137,813 330 Jan-16
Barcroft Plaza 37,660,586 101,000 373 Jan-16
Virginia Gateway (Phase I & II) 34,100,000 104,077 328 Jan-16
Hastings Marketplace 32,250,000 93,000 347 Jan-16
Ballston Quarter 138,526,536 310,704 446 Feb-16
Westgate Plaza 42,500,000 171,909 247 Feb-16
Industrial | DC Metro Based on properties & portfolios ~USD2.5mil or greater
Sales Transaction Volume Pricing Analysis
Sales (millions USD) Average price per sf (USD) Average cap rate (yield)
0200400600800
1,0001,2001,4001,6001,800
Q1 ‘13 Q1 ‘14 Q1 ‘15 Q1 ‘16
Rolling 12-mo. Total Quarterly Vol.
020406080
100120140160180
Q1 ‘13 Q1 ‘14 Q1 ‘15 Q1 ‘16
DC Metro United States
3%4%5%6%7%8%9%
10%11%12%
Q1 ‘13 Q1 ‘14 Q1 ‘15 Q1 ‘16
DC Metro United States
Property name Sale price (USD) Size (sf)Sale price
per sf (USD)Sale date
50 W Watkins Mill Rd 25,306,911 62,556 405 Jan-16
MedImmune 15,981,672 39,505 405 Jan-16
Belward South 19,951,098 49,317 405 Jan-16
Belward North 23,120,733 57,152 405 Jan-16
Novavax HQ 20,705,176 51,181 405 Jan-16
Human Genome 256,911,503 635,058 405 Jan-16 Charts courtesy of Real Capital Analytics. Used with permission.
@2016 KPMG LLP, a Delaware limited liability partnership and the U.S. member firm of the KPMG network of independent member firms affiliated with KPMG International Cooperative (“KPMG International”), a Swiss entity. All rights reserved.

不动产名称 售价(美元) 面积 (平方英尺)
售价(美元) (每平方英尺) 销售日期
Regal Stadium 14 64,000,000 58,961 1,085 2016年1月Plaza del Mercado 55,226,399 96,000 575 2016年1月Free State 50,629,723 279,000 181 2016年1月Virginia Gateway (Phase IV) 47,250,000 125,653 376 2016年1月Virginia Gateway (Atlas Walk) 47,249,989 100,684 469 2016年1月Merrifield II 45,546,037 137,813 330 2016年1月Barcroft Plaza 37,660,586 101,000 373 2016年1月Virginia Gateway (Phase I & II) 34,100,000 104,077 328 2016年1月Hastings Marketplace 32,250,000 93,000 347 2016年1月Ballston Quarter 138,526,536 310,704 446 2016年2月Westgate Plaza 42,500,000 171,909 247 2016年3月
工业 | 华盛顿特区 基于不动产和投资组合 — 250万美元或以上
销售交易量 定价分析总销售额(百万美元) 每平方英尺均价(美元) 平均资本化率(%)
不动产名称 售价(美元) 面积 (平方英尺)
售价(美元) (每平方英尺) 销售日期
50 W Watkins Mill Rd 25,306,911 62,556 405 2016年1月MedImmune 15,981,672 39,505 405 2016年1月Belward South 19,951,098 49,317 405 2016年1月Belward North 23,120,733 57,152 405 2016年1月Novavax HQ 20,705,176 51,181 405 2016年1月Human Genome 256,911,503 635,058 405 2016年1月
以上图表由Real Capital Analytics Inc.提供,在此使用获经许可。
@2016毕马威会计师事务所,美国特拉华州的有限责任合伙,并为毕马威国际合作组织(“毕马威国际”)相关联的独立成员所网络中的美国成员公司。毕马威国际属瑞士实体公司。版权所有,不得转载。
49China Inbound Investing in U.S. Real Estate
中国赴美房地产投资
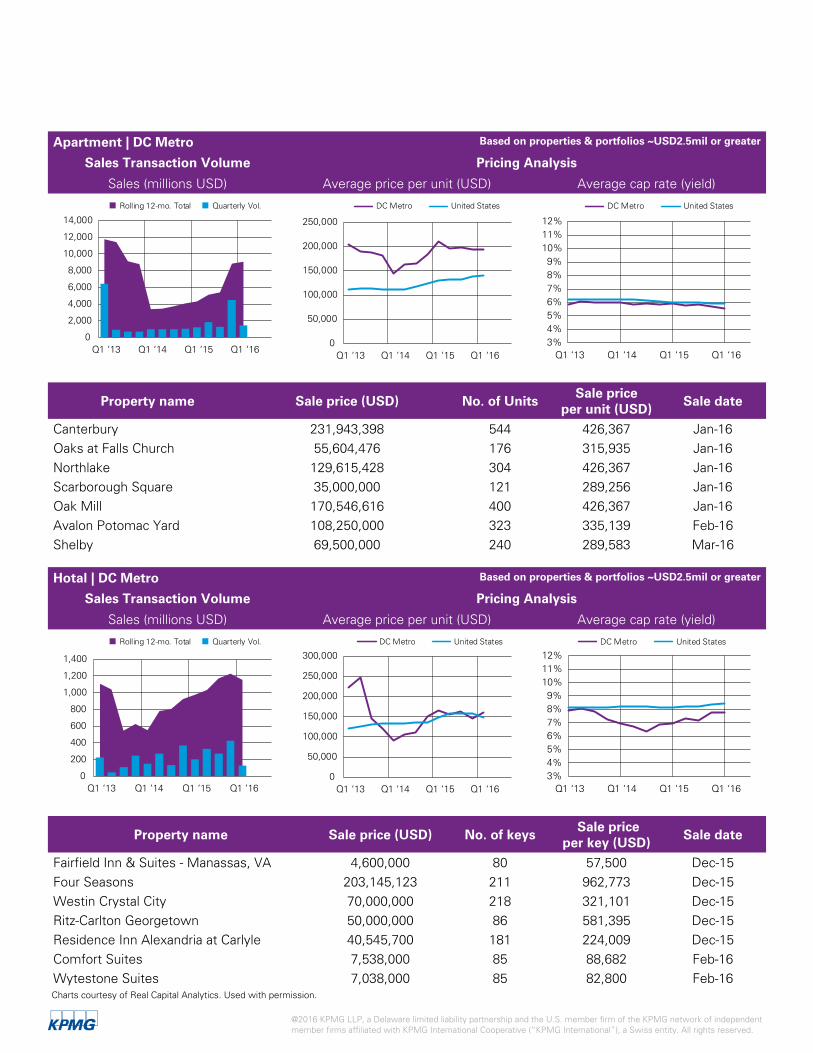
Apartment | DC Metro Based on properties & portfolios ~USD2.5mil or greater
Sales Transaction Volume Pricing Analysis
Sales (millions USD) Average price per unit (USD) Average cap rate (yield)
0
2,000
4,000
6,000
8,000
10,000
12,000
14,000
Q1 ‘13 Q1 ‘14 Q1 ‘15 Q1 ‘16
Rolling 12-mo. Total Quarterly Vol.
0
50,000
100,000
150,000
200,000
250,000
Q1 ‘13 Q1 ‘14 Q1 ‘15 Q1 ‘16
DC Metro United States
3%4%5%6%7%8%9%
10%11%12%
Q1 ‘13 Q1 ‘14 Q1 ‘15 Q1 ‘16
DC Metro United States
Property name Sale price (USD) No. of UnitsSale price
per unit (USD)Sale date
Canterbury 231,943,398 544 426,367 Jan-16Oaks at Falls Church 55,604,476 176 315,935 Jan-16Northlake 129,615,428 304 426,367 Jan-16Scarborough Square 35,000,000 121 289,256 Jan-16Oak Mill 170,546,616 400 426,367 Jan-16Avalon Potomac Yard 108,250,000 323 335,139 Feb-16Shelby 69,500,000 240 289,583 Mar-16
Hotal | DC Metro Based on properties & portfolios ~USD2.5mil or greater
Sales Transaction Volume Pricing Analysis
Sales (millions USD) Average price per unit (USD) Average cap rate (yield)
0
200
400
600
800
1,000
1,200
1,400
Q1 ‘13 Q1 ‘14 Q1 ‘15 Q1 ‘16
Rolling 12-mo. Total Quarterly Vol.
0
50,000
100,000
150,000
200,000
250,000
300,000
Q1 ‘13 Q1 ‘14 Q1 ‘15 Q1 ‘16
DC Metro United States
3%4%5%6%7%8%9%
10%11%12%
Q1 ‘13 Q1 ‘14 Q1 ‘15 Q1 ‘16
DC Metro United States
Property name Sale price (USD) No. of keys Sale price
per key (USD)Sale date
Fairfield Inn & Suites - Manassas, VA 4,600,000 80 57,500 Dec-15Four Seasons 203,145,123 211 962,773 Dec-15Westin Crystal City 70,000,000 218 321,101 Dec-15Ritz-Carlton Georgetown 50,000,000 86 581,395 Dec-15Residence Inn Alexandria at Carlyle 40,545,700 181 224,009 Dec-15Comfort Suites 7,538,000 85 88,682 Feb-16Wytestone Suites 7,038,000 85 82,800 Feb-16
Charts courtesy of Real Capital Analytics. Used with permission.
@2016 KPMG LLP, a Delaware limited liability partnership and the U.S. member firm of the KPMG network of independent member firms affiliated with KPMG International Cooperative (“KPMG International”), a Swiss entity. All rights reserved.

公寓 | 华盛顿特区 基于不动产和投资组合 — 250万美元或以上
销售交易量 定价分析总销售额(百万美元) 每套平均售价(美元) 平均资本化率(%)
不动产名称 售价(美元) 单元套数 每套销售价 (美元) 销售日期
Canterbury 231,943,398 544 426,367 2016年1月Oaks at Falls Church 55,604,476 176 315,935 2016年1月Northlake 129,615,428 304 426,367 2016年1月Scarborough Square 35,000,000 121 289,256 2016年1月Oak Mill 170,546,616 400 426,367 2016年1月Avalon Potomac Yard 108,250,000 323 335,139 2016年2月Shelby 69,500,000 240 289,583 2016年3月
酒店 | 华盛顿特区 基于不动产和投资组合 — 250万美元或以上
销售交易量 定价分析总销售额(百万美元) 每套平均售价(美元) 平均资本化率(%)
不动产名称 售价(美元) 钥匙间数 每间售价 (美元) 销售日期
Fairfield Inn & Suites - Manassas, VA 4,600,000 80 57,500 2015年12月Four Seasons 203,145,123 211 962,773 2015年12月Westin Crystal City 70,000,000 218 321,101 2015年12月Ritz-Carlton Georgetown 50,000,000 86 581,395 2015年12月Residence Inn Alexandria at Carlyle 40,545,700 181 224,009 2015年12月Comfort Suites 7,538,000 85 88,682 2016年2月Wytestone Suites 7,038,000 85 82,800 2016年2月
以上图表由Real Capital Analytics Inc.提供,在此使用获经许可。@2016毕马威会计师事务所,美国特拉华州的有限责任合伙,并为毕马威国际合作组织(“毕马威国际”)相关联的独立成员所网络中的美国成员公司。毕马威国际属瑞士实体公司。版权所有,不得转载。
51China Inbound Investing in U.S. Real Estate
中国赴美房地产投资

Chicago real estate marketOffice – The Chicago office market ended the first quarter of 2016 with a vacancy rate of 13.2 percent. The vacancy rate was up over the previous quarter, with negative net absorption of 519,523sf in the first quarter. The largest lease signings occurring in 2016 included the 277,849sf lease signed by CNA at 151 N. Franklin Street in the West Loop submarket; the 133,283sf deal signed by Echo Global Logistics, Inc. at 600 West Chicago Avenue in the River North submarket; and the 104,376sf lease renewal signed by Holland & Knight LLP at Citadel Center in the Central Loop submarket. The largest projects underway at the end of the first quarter of 2016 were 150 N. Riverside Dr., a 1,284,404sf building that is 80 percent preleased, and River Point, a 1,077,100sf building that is 68 percent preleased.50
Retail – The Chicago retail market did not experience much change in market conditions in the first quarter of 2016. The vacancy rate went from 7.8 percent in the previous quarter to 7.7 percent in the current quarter. The largest lease signings occurring in 2016 included the 65,816sf-lease signed by Dominick’s Finer Foods at 1118 Maple Avenue in Mundelein; the 38,237sf sublease signed by Jewel Osco at Golf II Shopping Center in Schaumburg; and the 33,600sf lease signed by Gizmos at 66 Orland Square Drive in Orland Park. Retail net absorption was moderately positive in Chicago in the first quarter of 2016, with 956,615sf absorbed. Average quoted asking rental rates in the Chicago retail market are up over the previous quarter and down from four quarters ago. Quoted rents ended the first quarter of 2016 at USD15.62 per
sf per year. During the first quarter of 2016, 30 buildings totaling 351,569sf were completed in the Chicago retail market. There were 2,597,727sf of retail space under construction at the end of the first quarter of 2016.51
Industrial – The Chicago industrial market ended the first quarter of 2016 with a vacancy rate of 7 percent. The vacancy rate was down over the previous quarter, with positive net absorption of 3,425,531sf in the first quarter. Vacant sublease space increased in the quarter, ending the quarter at 1,951,158sf. Rental rates ended the first quarter at USD5.69, an increase over the previous quarter. A total of 12 buildings were delivered to the market in the quarter totaling 3,294,040sf, with 14,036,591sf still under construction at the end of the quarter.52
Multifamily – Marcus & Millichap reports that rental unit completions are expected to rise to the highest level since 2000 as developers bring 8,000 apartments into service this year, representing a 1.1 percent increase in inventory. Of the total, 5,000 rental units are expected to be delivered in the city, and 3,000 units are expected in the suburbs. Demand is forecasted to continue to outpace supply, which will result in a vacancy decline of 20 basis points to 3.6 percent across the market in 2016; a 40-basis-point decline in vacancy was experienced last year. After a 5.1 percent jump in the average effective rent was registered during 2015, Marcus & Millichap forecasts rent growth will ease this year as competition from rental units in the most desirable neighborhoods expands concessions. Marcus & Millichap predicts the average asking rent will rise 3.9 percent this year to USD1,360 per month.53
50 The CoStar Office Report, First Quarter 2016 Chicago Office Market©CoStar Group Inc.
51 The CoStar Retail Report, First Quarter 2016 Chicago Retail Market©CoStar Group Inc.
52 The CoStar Industrial Report, First Quarter 2016 Chicago Industrial Market©CoStar Group Inc.
53 Marcus & Millichap, Multifamily Research Market Report – Chicago Metro Area, First Quarter 2016.
@2016 KPMG LLP, a Delaware limited liability partnership and the U.S. member firm of the KPMG network of independent member firms affiliated with KPMG International Cooperative (“KPMG International”), a Swiss entity. All rights reserved.

芝加哥房地产市场办公楼—芝加哥写字楼市场在2016年第一季度末空置率为13.2 %。空置率比上一季度有所增加,第一季净吸纳量为负的519,523平方英尺。在2016年发生的重大的租赁交易包括:CNA在西环商圈富兰克林北路151号签订的277,849平方英尺的租赁合同; Echo Global Logistics在河北商圈芝加哥西路600号签署的133,283平方英尺的租赁合同; 及Holland & Knight在中央环商圈由在Citadel中心签租的104,376平方英尺的续租合同。2016年第一季度末进行的最大项目是在Riverside北路150号拥有1,284,404平方英尺建筑面积的办公大楼,预租率已达到80%。另外一个大项目是在River Point,1,077,100平方英尺,预租率为68%。50
商铺—芝加哥商铺市场在2016年第一季度市场条件没有太大变化。空置率从 上 一 季 度 的 7 . 8 % 略 降 到 本 季 度 的7.7%。在2016年发生的重大的租赁交易包括:Dominick’s Finer Foods在Mundelein枫林大道1118号签订的65,816平方英尺的租赁合同;Jewel Osco在绍姆堡高尔夫II购物中心签订的38,237平方英尺的转租合同; 和Gizmos 在奥兰德广场奥兰多公园66号租赁的33,600平方英尺的商业用地。2016年 第 一 季 度 商 铺 业 净 吸 纳 量 为 正 的956,615平方英尺。平均租金比上一季度有所增加,但和四个季度前相比有所下降。2016年第一季度末租金为每年15.62美元每平方英尺。在第一季度末,30栋楼共计351,569平方英尺的商铺面积建成投入市场。2,597,727平方英尺仍在建设中。51
工业—芝加哥工业市场2016年第一季度空置率为7.0%,较上一季度有所下降,净吸纳量为正的3,425,531平方英尺。本季度空置转租面积增加,在第一季度末达到1,951,158平方英尺。房租为5.69美元每平方英尺 ,比上一季度有所增加。到第一季度末,共有12栋大楼,共计3,294,040平方英尺的建筑面积建成投入市场,14,036,591平方英尺仍在建设中。52
公寓—Marcus & Millichap报告说,芝加哥在2016年公寓的建成数量会达到自2000年的最高水平,预计会有8千套公寓在今年投入市场,这意味着库存将增加了1.1%。预计其中5千套在城市里,3千套在郊区。公寓的需求将继续超过供应,这将导致空置率在2016年降到3.6%,比上一季度降低20个基点,比上一年降低40个基点。平均租金在2015年增长5.1%之后,由于最理想的公寓区没有太多扩张空间,Marcus & Millichap预测租金增长在今年将会缓解。Marcus & Millichap还预测平均租金在2016年将上升3.9%,至每月1,360美元。53
50 CoStar办公楼报告 ,芝加哥办公楼市场,2016年第一季度51 CoStar商铺报告 ,芝加哥商铺市场,2016年第一季度52 CoStar工业报告 ,芝加哥工业市场,2016年第一季度53 Marcus & Millichap, 芝加哥公寓市场,2016年第一季度
@2016毕马威会计师事务所,美国特拉华州的有限责任合伙,并为毕马威国际合作组织(“毕马威国际”)相关联的独立成员所网络中的美国成员公司。毕马威国际属瑞士实体公司。版权所有,不得转载。
53China Inbound Investing in U.S. Real Estate
中国赴美房地产投资

Hotel – The rolling 12 months have seen a 156 percent increase in sales volume versus the prior year, totaling just around USD2.0 billion. First quarter 2016 sales volume was just under USD1.2 billion, compared to first quarter 2015 sales volume totaling USD41 million. The average price per room for first quarter 2016 was USD128,351 (versus USD147,319 nationally). Capitalization rates were up roughly 51 basis points in the first quarter from the same period a year ago, averaging 7.9 percent.54
Office | Chicago Based on properties & portfolios ~USD2.5mil or greater
Sales Transaction Volume Pricing Analysis
Sales (millions USD) Average price per sf (USD) Average cap rate (yield)
01,0002,0003,0004,0005,0006,0007,0008,0009,000
10,000
Q1 ‘13 Q1 ‘14 Q1 ‘15 Q1 ‘16
Rolling 12-mo. Total Quarterly Vol.
0
50
100
150
200
250
300
Q1 ‘13 Q1 ‘14 Q1 ‘15 Q1 ‘16
Chicago United States
3%4%5%6%7%8%9%
10%11%12%
Q1 ‘13 Q1 ‘14 Q1 ‘15 Q1 ‘16
Chicago United States
Property name Sale price (USD) Size (sf)Sale price
per sf (USD)Sale date
300 South Riverside Plaza (Leasehold) 43,000,000 1,048,367 41 Dec-15
One North Franklin 209,597,287 617,592 339 Dec-15
10 South LaSalle Street 166,500,000 781,426 213 Dec-15
180 North Lasalle Street 198,333,333 767,605 258 Jan-16
100 North LaSalle Street 32,330,000 163,708 197 Jan-16
CNA Plaza 108,000,000 1,144,394 94 Mar-16
1 North LaSalle 82,500,000 489,923 168 Mar-16
177 South Commons Drive 25,871,000 207,750 125 Mar-16
Retail | Chicago Based on properties & portfolios ~USD2.5mil or greater
Sales Transaction Volume Pricing Analysis
Sales (millions USD) Average price per sf (USD) Average cap rate (yield)
0500
1,0001,5002,0002,5003,0003,5004,0004,500
Q1 ‘13 Q1 ‘14 Q1 ‘15 Q1 ‘16
Rolling 12-mo. Total Quarterly Vol.
0
50
100
150
200
250
300
350
Q1 ‘13 Q1 ‘14 Q1 ‘15 Q1 ‘16
Chicago United States
3%4%5%6%7%8%9%
10%11%12%
Q1 ‘13 Q1 ‘14 Q1 ‘15 Q1 ‘16
Chicago United States
Charts courtesy of Real Capital Analytics. Used with permission.
54 RCA Trends & Trade, Chicago Hotels as of April 11, 2016 ©Real Capital Analytics Inc.
@2016 KPMG LLP, a Delaware limited liability partnership and the U.S. member firm of the KPMG network of independent member firms affiliated with KPMG International Cooperative (“KPMG International”), a Swiss entity. All rights reserved.
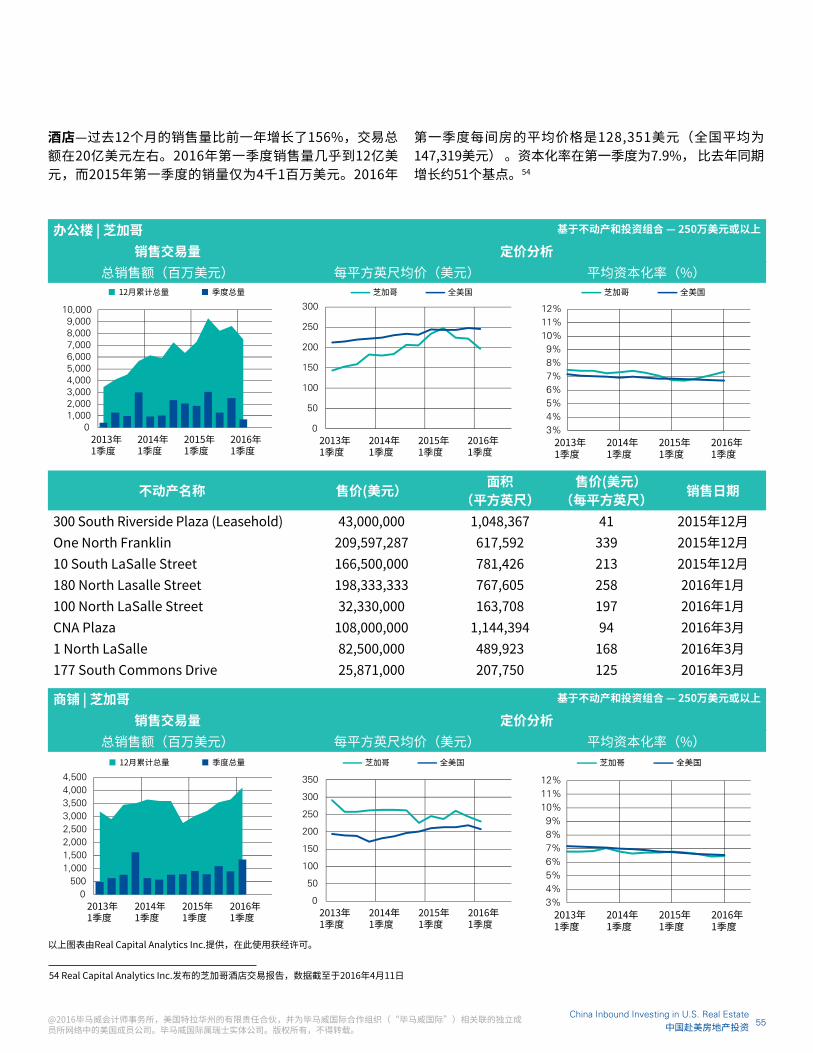
办公楼 | 芝加哥 基于不动产和投资组合 — 250万美元或以上
销售交易量 定价分析总销售额(百万美元) 每平方英尺均价(美元) 平均资本化率(%)
不动产名称 售价(美元) 面积 (平方英尺)
售价(美元) (每平方英尺) 销售日期
300 South Riverside Plaza (Leasehold) 43,000,000 1,048,367 41 2015年12月One North Franklin 209,597,287 617,592 339 2015年12月10 South LaSalle Street 166,500,000 781,426 213 2015年12月180 North Lasalle Street 198,333,333 767,605 258 2016年1月100 North LaSalle Street 32,330,000 163,708 197 2016年1月CNA Plaza 108,000,000 1,144,394 94 2016年3月1 North LaSalle 82,500,000 489,923 168 2016年3月177 South Commons Drive 25,871,000 207,750 125 2016年3月
商铺 | 芝加哥 基于不动产和投资组合 — 250万美元或以上
销售交易量 定价分析总销售额(百万美元) 每平方英尺均价(美元) 平均资本化率(%)
以上图表由Real Capital Analytics Inc.提供,在此使用获经许可。
54 Real Capital Analytics Inc.发布的芝加哥酒店交易报告,数据截至于2016年4月11日
酒店—过去12个月的销售量比前一年增长了156%,交易总额在20亿美元左右。2016年第一季度销售量几乎到12亿美元,而2015年第一季度的销量仅为4千1百万美元。2016年
第一季度每间房的平均价格是128,351美元(全国平均为147,319美元) 。资本化率在第一季度为7.9%, 比去年同期增长约51个基点。54
@2016毕马威会计师事务所,美国特拉华州的有限责任合伙,并为毕马威国际合作组织(“毕马威国际”)相关联的独立成员所网络中的美国成员公司。毕马威国际属瑞士实体公司。版权所有,不得转载。
55China Inbound Investing in U.S. Real Estate
中国赴美房地产投资

Property name Sale price (USD) Size (sf)Sale price
per sf (USD)Sale date
Crystal Point Center 46,903,256 339,898 138 Mar-16
Four Flaggs 46,360,200 364,120 127 Mar-16
Rivertree Court 42,585,758 308,610 138 Mar-16
Joffco Square 32,178,406 95,354 337 Mar-16
Joliet Commons 25,286,942 228,393 111 Mar-16
Maple Park Place 24,368,214 220,095 111 Mar-16
Chatham Ridge Shopping Center 22,379,759 175,774 127 Mar-16
Chestnut Court 21,806,631 172,918 126 Mar-16
Bradley Commons 19,364,479 174,901 111 Mar-16
Iroquois 17,779,067 140,981 126 Mar-16
Aurora Commons 16,004,326 126,908 126 Mar-16
Industrial | Chicago Based on properties & portfolios ~USD2.5mil or greater
Sales Transaction Volume Pricing Analysis
Sales (millions USD) Average price per sf (USD) Average cap rate (yield)
0500
1,0001,5002,0002,5003,0003,5004,0004,500
Q1 ‘13 Q1 ‘14 Q1 ‘15 Q1 ‘16
Rolling 12-mo. Total Quarterly Vol.
0
10
20
30
40
50
60
70
80
Q1 ‘13 Q1 ‘14 Q1 ‘15 Q1 ‘16
Chicago United States
3%4%5%6%7%8%9%
10%11%12%
Q1 ‘13 Q1 ‘14 Q1 ‘15 Q1 ‘16
Chicago United States
Property name Sale price (USD) Size (sf)Sale price
per sf (USD)Sale date
University Technology Research Park At IIT 44,140,650 127,900 345 Jan-16
1132 West Fulton Market 4,900,000 15,000 327 Jan-16
1100 West Fulton Market 3,900,000 15,000 260 Jan-16
2301 West Walnut Street 3,000,000 22,290 135 Jan-16
Clorox 3,940,000 37,964 104 Jan-16
1725 Winnetka Avenue 2,575,000 17,561 147 Feb-16
222 N Maplewood Ave 4,450,000 31,000 144 Feb-16
825 Corporate Woods Pkwy 2,500,000 19,967 125 Feb-16
2509 West Homer Street 6,500,000 59,800 109 Feb-16
Old Dominion Freight Line 18,250,000 78,830 232 Mar-16 Charts courtesy of Real Capital Analytics. Used with permission.
@2016 KPMG LLP, a Delaware limited liability partnership and the U.S. member firm of the KPMG network of independent member firms affiliated with KPMG International Cooperative (“KPMG International”), a Swiss entity. All rights reserved.

不动产名称 售价(美元) 面积 (平方英尺)
售价(美元) (每平方英尺) 销售日期
Crystal Point Center 46,903,256 339,898 138 2016年3月Four Flaggs 46,360,200 364,120 127 2016年3月Rivertree Court 42,585,758 308,610 138 2016年3月Joffco Square 32,178,406 95,354 337 2016年3月Joliet Commons 25,286,942 228,393 111 2016年3月Maple Park Place 24,368,214 220,095 111 2016年3月Chatham Ridge Shopping Center 22,379,759 175,774 127 2016年3月Chestnut Court 21,806,631 172,918 126 2016年3月Bradley Commons 19,364,479 174,901 111 2016年3月Iroquois 17,779,067 140,981 126 2016年3月Aurora Commons 16,004,326 126,908 126 2016年3月
工业 | 芝加哥 基于不动产和投资组合 — 250万美元或以上
销售交易量 定价分析总销售额(百万美元) 每平方英尺均价(美元) 平均资本化率(%)
不动产名称 售价(美元) 面积 (平方英尺)
售价(美元) (每平方英尺) 销售日期
University Technology Research Park At IIT 44,140,650 127,900 345 2016年1月1132 West Fulton Market 4,900,000 15,000 327 2016年1月1100 West Fulton Market 3,900,000 15,000 260 2016年1月2301 West Walnut Street 3,000,000 22,290 135 2016年1月Clorox 3,940,000 37,964 104 2016年1月1725 Winnetka Avenue 2,575,000 17,561 147 2016年2月222 N Maplewood Ave 4,450,000 31,000 144 2016年2月825 Corporate Woods Pkwy 2,500,000 19,967 125 2016年2月2509 West Homer Street 6,500,000 59,800 109 2016年2月Old Dominion Freight Line 18,250,000 78,830 232 2016年3月
以上图表由Real Capital Analytics Inc.提供,在此使用获经许可。
@2016毕马威会计师事务所,美国特拉华州的有限责任合伙,并为毕马威国际合作组织(“毕马威国际”)相关联的独立成员所网络中的美国成员公司。毕马威国际属瑞士实体公司。版权所有,不得转载。
57China Inbound Investing in U.S. Real Estate
中国赴美房地产投资

Apartment | Chicago Based on properties & portfolios ~USD2.5mil or greater
Sales Transaction Volume Pricing Analysis
Sales (millions USD) Average price per unit (USD) Average cap rate (yield)
0500
1,0001,5002,0002,5003,0003,5004,0004,500
Q1 ‘13 Q1 ‘14 Q1 ‘15 Q1 ‘16
Rolling 12-mo. Total Quarterly Vol.
020,00040,00060,00080,000
100,000120,000140,000160,000180,000
Q1 ‘13 Q1 ‘14 Q1 ‘15 Q1 ‘16
Chicago United States
3%4%5%6%7%8%9%
10%11%12%
Q1 ‘13 Q1 ‘14 Q1 ‘15 Q1 ‘16
Chicago United States
Property name Sale price (USD) No. of unitsSale price
per unit (USD)Sale date
Park 205 48,250,000 121 398,760 Dec-16
Penthouse Towers 30,000,000 126 238,095 Dec-16
North Water Residences 240,312,000 398 603,799 Jan-16
Wrigley I 8,000,000 18 444,444 Jan-16
3526 North Marshfield Avenue 4,570,000 15 304,667 Jan-16
Gateway West Loop 83,700,000 167 501,198 Mar-16
Lux24 34,860,000 73 477,534 Mar-16
Optima Old Orchard Woods (Bulk Condo) 44,200,000 172 256,977 Mar-16
Hotal | Chicago Based on properties & portfolios ~USD2.5mil or greater
Sales Transaction Volume Pricing Analysis
Sales (millions USD) Average price per unit (USD) Average cap rate (yield)
0
500
1,000
1,500
2,000
2,500
Q1 ‘13 Q1 ‘14 Q1 ‘15 Q1 ‘16
Rolling 12-mo. Total Quarterly Vol.
020,00040,00060,00080,000
100,000120,000140,000160,000180,000
Q1 ‘13 Q1 ‘14 Q1 ‘15 Q1 ‘16
Chicago United States
3%4%5%6%7%8%9%
10%11%12%
Q1 ‘13 Q1 ‘14 Q1 ‘15 Q1 ‘16
Chicago United States
Charts courtesy of Real Capital Analytics. Used with permission.
@2016 KPMG LLP, a Delaware limited liability partnership and the U.S. member firm of the KPMG network of independent member firms affiliated with KPMG International Cooperative (“KPMG International”), a Swiss entity. All rights reserved.

公寓 | 芝加哥 基于不动产和投资组合 — 250万美元或以上
销售交易量 定价分析总销售额(百万美元) 每套平均售价(美元) 平均资本化率(%)
不动产名称 售价(美元) 单元套数 每套销售价 (美元) 销售日期
Park 205 48,250,000 121 398,760 2015年12月
Penthouse Towers 30,000,000 126 238,095 2015年12月
North Water Residences 240,312,000 398 603,799 2016年1月
Wrigley I 8,000,000 18 444,444 2016年1月
3526 North Marshfield Avenue 4,570,000 15 304,667 2016年1月
Gateway West Loop 83,700,000 167 501,198 2016年3月
Lux24 34,860,000 73 477,534 2016年3月
Optima Old Orchard Woods (Bulk Condo) 44,200,000 172 256,977 2016年3月
酒店 | 芝加哥 基于不动产和投资组合 — 250万美元或以上
销售交易量 定价分析总销售额(百万美元) 每套平均售价(美元) 平均资本化率(%)
以上图表由Real Capital Analytics Inc.提供,在此使用获经许可。
@2016毕马威会计师事务所,美国特拉华州的有限责任合伙,并为毕马威国际合作组织(“毕马威国际”)相关联的独立成员所网络中的美国成员公司。毕马威国际属瑞士实体公司。版权所有,不得转载。
59China Inbound Investing in U.S. Real Estate
中国赴美房地产投资

Property name Sale price (USD) No. of keysSale price
per key (USD)Sale date
Fairmont 451,611,031 692 652,617 Dec-15
InterContinental Chicago 516,872,741 792 652,617 Dec-15
Candlewood Suites Aurora-Naperville 5,965,000 83 71,867 Dec-15
Hilton Orrington Hotel 60,000,000 269 223,048 Dec-15
Hilton Garden Inn 10,247,000 120 85,392 Jan-16
Lincolnshire Marriott Resort 20,000,000 390 51,282 Jan-16
Blackstone Hotel 58,500,000 332 176,205 Feb-16
Hotel Lincoln 73,000,000 184 396,739 Feb-16
Club Quarters Chicago 106,001,200 321 330,222 Feb-16
Chicago Marriott Southwest at Burr Ridge 22,500,000 184 122,283 Feb-16
Wyndham Glenview Suites 15,000,000 252 59,524 Mar-16 Charts courtesy of Real Capital Analytics. Used with permission.
@2016 KPMG LLP, a Delaware limited liability partnership and the U.S. member firm of the KPMG network of independent member firms affiliated with KPMG International Cooperative (“KPMG International”), a Swiss entity. All rights reserved.
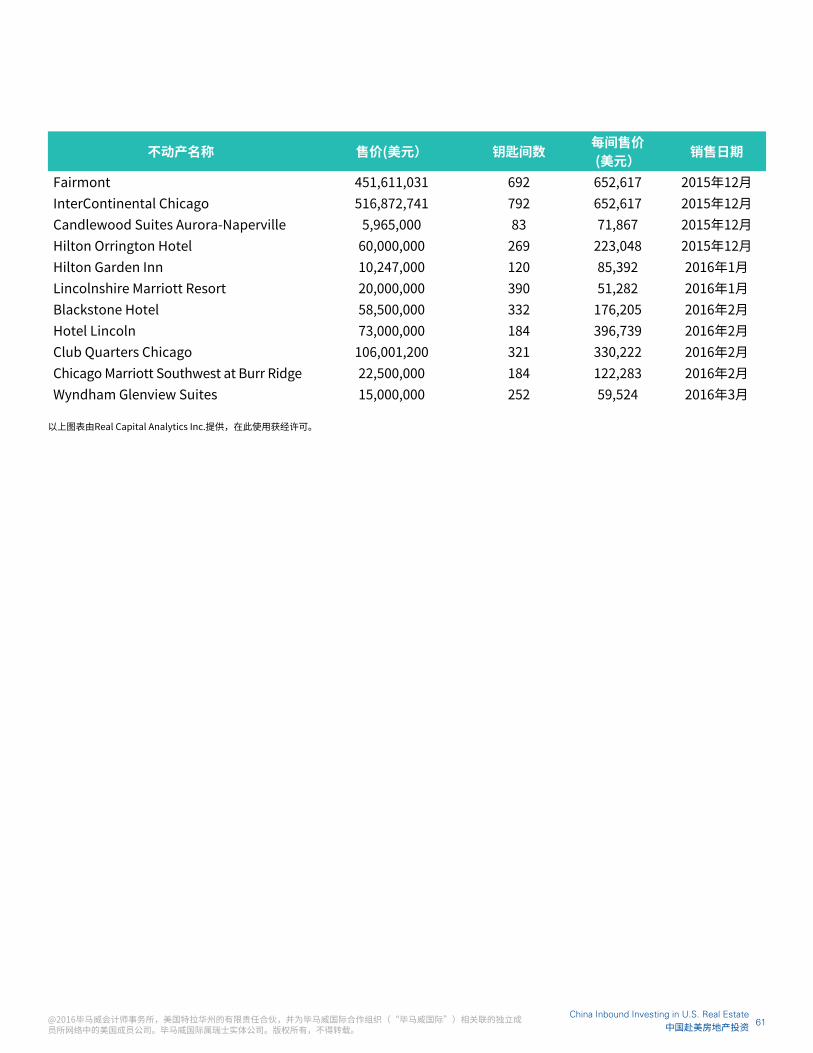
不动产名称 售价(美元) 钥匙间数 每间售价 (美元) 销售日期
Fairmont 451,611,031 692 652,617 2015年12月InterContinental Chicago 516,872,741 792 652,617 2015年12月Candlewood Suites Aurora-Naperville 5,965,000 83 71,867 2015年12月Hilton Orrington Hotel 60,000,000 269 223,048 2015年12月Hilton Garden Inn 10,247,000 120 85,392 2016年1月Lincolnshire Marriott Resort 20,000,000 390 51,282 2016年1月Blackstone Hotel 58,500,000 332 176,205 2016年2月Hotel Lincoln 73,000,000 184 396,739 2016年2月Club Quarters Chicago 106,001,200 321 330,222 2016年2月Chicago Marriott Southwest at Burr Ridge 22,500,000 184 122,283 2016年2月Wyndham Glenview Suites 15,000,000 252 59,524 2016年3月
以上图表由Real Capital Analytics Inc.提供,在此使用获经许可。
@2016毕马威会计师事务所,美国特拉华州的有限责任合伙,并为毕马威国际合作组织(“毕马威国际”)相关联的独立成员所网络中的美国成员公司。毕马威国际属瑞士实体公司。版权所有,不得转载。
61China Inbound Investing in U.S. Real Estate
中国赴美房地产投资

Dallas real estate marketOffice – The Dallas/Fort Worth office market ended the first quarter of 2016 with a vacancy rate of 14.4 percent. The vacancy rate was up over the previous quarter, with positive net absorption of 781,041sf in the first quarter. The largest lease signings occurring in 2016 included the 123,716sf deal signed by Toyota at The Campus at Legacy in the Far North Dallas submarket and the 120,910sf lease signed by Mortgage Contracting Services, Inc. at The Ridge at 121 in the Lewisville/Denton submarket. The largest projects underway at the end of the first quarter of 2016 were Toyota Motor Corp Headquarters, a 2,100,000sf office campus with 100 percent of its space preleased, and Liberty Mutual Campus Buildings, a 1,100,000sf office campus that is 100 percent preleased.55
Retail – The Dallas/Fort Worth retail market did not experience much change in market conditions in the first quarter of 2016. The vacancy rate went from 5.9 percent in the previous quarter to 5.8 percent in the current quarter. The largest lease signings occurring in 2016 included the 44,000sf lease signed by Carnival Food Stores at the Buckner Bruton Retail Building; the 25,000sf deal signed by Locke Supply at 1605 W. Pioneer Parkway; and the 11,691sf lease signed by Lincoln at The Star – Building 3E. Retail net absorption was strong in Dallas/Fort Worth in the first quarter of 2016, with 1,599,843sf absorbed in the quarter. Average quoted asking rental rates in the Dallas/Fort Worth retail market are up over previous quarter levels and up from their levels four quarters ago. Quoted rents ended the first quarter
of 2016 at USD15.02 per sf per year. During the first quarter of 2016, 70 buildings totaling 1,153,098sf were completed in the Dallas/Fort Worth retail market, with 3,973,893sf of retail space under construction at the end of the quarter.56
Industrial – The Dallas/Fort Worth industrial market ended the first quarter of 2016 with a vacancy rate of 6.7 percent. The vacancy rate was down over the previous quarter, with positive net absorption of 5,563,276sf in the first quarter. Vacant sublease space increased in the quarter, ending the quarter at 1,031,936sf. Rental rates ended the first quarter at USD5.29, an increase over the previous quarter. A total of 32 buildings were delivered to the market in the quarter totaling 4,208,725sf, with 19,943,582sf still under construction at the end of the quarter.57
Multifamily – Marcus & Millichap reports that strong apartment demand supported the absorption of nearly 18,600 units in 2015, driving the average vacancy rate down 50 basis points year-over-year to 4.7 percent, the lowest rate this business cycle. Comparatively, the vacancy rate declined 40 basis points on net absorption of 16,200 rental units in 2014. Marcus & Millichap reports that a record number of units are scheduled for delivery in 2016, and demand will not keep pace. Marcus & Millichap predicts vacancy should rise 20 basis points to 4.9 percent by yearend 2016. Additionally, Marcus & Millichap forecasts rent growth to slow from a record level as a slew of new units are added to the market inventory; the average effective rent should rise 3.9 percent to USD1,021 per month in 2016, following a 7.0 percent advance in 2015.58
55 The CoStar Office Report First Quarter 2016 Dallas/Ft. Worth Office Market©CoStar Group Inc.
56 The CoStar Retail Report First Quarter 2016 Dallas/Ft. Worth Retail Market©CoStar Group Inc.
57 The CoStar Industrial Report First Quarter 2016 Dallas/Ft. Worth Industrial Market©CoStar Group Inc.
58 Marcus & Millichap, Multifamily Research Market Report – Dallas/Fort Worth Metro Area, First Quarter 2016.
@2016 KPMG LLP, a Delaware limited liability partnership and the U.S. member firm of the KPMG network of independent member firms affiliated with KPMG International Cooperative (“KPMG International”), a Swiss entity. All rights reserved.

达拉斯房地产市场办公楼—达拉斯/沃斯堡地区2016年第一季度空置率为14.4%,比上一季度有所上升,净吸纳量为正的781,041平方英尺。在2016年发生的重大的租赁交易包括:丰田在达拉斯北部商圈The Campus at Legacy签署的123,716平方英尺租赁合同; Mortgage Contracting Services在路易斯维尔/丹顿商圈承The Ridge at 121签订的120,910平方英尺的租赁合同。在2016年第一季度末进行的最大建筑项目是丰田汽车公司总部的办公区,2,100,000平方英尺的办公室园区,100%的办公空间已被预租。另外利宝相互保险公司办公区建区规模也很大,1,100,000平方英尺的办公场地,100 %都已被预租。55
商铺—达拉斯/沃斯堡地区的商铺市场在2016年第一季度市场条件没有经历太大的变化,空置率由上一季度的5.9%略降为本一季度的5.8%。2016年发生的重大的租赁合同包括:Carnival食品店在Buckner零售大厦签订的44,000平方英尺的租赁合同; Locke Supply在先锋西大路1605号签署的25,000平方英尺的租赁合同; 和Lincoln在Star大厦3E座签订的11,691平方英尺的租赁合同。达拉斯/沃斯堡地区商铺业净吸纳量在2016年第一季度比较强劲,净吸纳量为1,599,843平方英尺。平均出租率比上一季度和前四个季度都有所增加,租金在2016年第一季度末为每年15.02美元每平方英尺。截至到第一季度末,70座商铺到楼共计1,153,098平方英尺竣工投入市场,3,973,893 平方英尺正在建设中。 56
工业—达拉斯/沃斯堡地区工业市场在2016年第一季度的空置率为6.7%,比上一季度有所降低,净吸纳量为正的5,563,276平方英尺。本季度空置转租面积有所增加,达到1,031,936平方英尺。房租为5.29美元每平方英尺,比上一个季度都有所增长。截至到第一季度末,共有32栋大楼,共计4,208,725平方英尺的建筑面积投入市场,19,943,582 平方英尺仍在建设中。57
公寓—据Marcus & Millichap报道,强 大 的 公 寓 需 求 使 得 2 0 1 5 年 吸 收 了18600套住房,推动空置率下调50个基点,降至4.7%,为这个经济周期最低空置率。相比之下,2014年空置率为16,200套,净吸纳量下降了40个基点。Marcus & Millichap预测,2016年建成的公寓会创下纪录,而公寓需求不会跟上公寓建设步伐。Marcus & Millichap还预计空置率在2016年底上升20个基点,达到4.9%。由于新公寓的不断建成,租金增长将会变缓; 租金将会上升3.9%,至每月1,021年美元,继2015年7.0%的增长之后。58
55 CoStar办公楼报告 ,达拉斯/沃斯办公楼市场,2016年第一季度56 CoStar商铺报告 ,达拉斯/沃斯商铺市场,2016年第一季度57 CoStar工业报告 ,达拉斯/沃斯工业市场,2016年第一季度58 Marcus & Millichap ,达拉斯/沃斯公寓市场, 2016年第一季度
@2016毕马威会计师事务所,美国特拉华州的有限责任合伙,并为毕马威国际合作组织(“毕马威国际”)相关联的独立成员所网络中的美国成员公司。毕马威国际属瑞士实体公司。版权所有,不得转载。
63China Inbound Investing in U.S. Real Estate
中国赴美房地产投资

Hotel – The rolling 12 months have seen a 15 percent decrease in sales volume versus the prior year, totaling just under USD833 million. First quarter 2016 sales volume was USD22 million, compared to first quarter 2015 sales volume totaling USD239 million. The average price per room for the
rolling 12 months was USD107,857 (versus USD148,205 nationally). Capitalization rates were up roughly 64 basis points in first quarter from the same period a year ago, averaging 9.1 percent.59
Office | Dallas Based on properties & portfolios ~USD2.5mil or greater
Sales Transaction Volume Pricing Analysis
Sales by Total (mil) Average price (USD) per sf Average cap rate (yield)
2,000
2,500
3,000
3,500
4,0004,500
1,500
0
500
1,000
Q1 ‘13 Q1 ‘14 Q1 ‘15 Q1 ‘16
Rolling 12-mo. Total Quarterly Vol.
0
50
100
150
200
250
Q1 ‘13 Q1 ‘14 Q1 ‘15 Q1 ‘16
Dallas United States
3%4%5%6%7%8%9%
10%11%12%
Q1 ‘13 Q1 ‘14 Q1 ‘15 Q1 ‘16
Dallas United States
Property name Sale price (USD) Size (sf)Sale price
per sf (USD)Sale date
The Points at Waterview 26,800,000 202,695 132 Dec-15
Baylor Surgery Center 14,385,850 36,880 390 Dec-15
Occidental Tower 95,000,000 549,170 173 Dec-15
2100 McKinney Ave 84,608,670 360,000 235 Dec-15
Texas Oncology 14,000,000 38,182 367 Feb-16
First Choice ER 8,420,275 7,000 1,203 Feb-16
Retail | Dallas Based on properties & portfolios ~USD2.5mil or greater
Sales Transaction Volume Pricing Analysis
Sales (millions USD) Average price per sf (USD) Average cap rate (yield)
0
500
1,000
1,500
2,000
2,500
3,000
3,500
Q1 ‘13 Q1 ‘14 Q1 ‘15 Q1 ‘16
Rolling 12-mo. Total Quarterly Vol.
0
50
100
150
200
250
Q1 ‘13 Q1 ‘14 Q1 ‘15 Q1 ‘16
Dallas United States
3%4%5%6%7%8%9%
10%11%12%
Q1 ‘13 Q1 ‘14 Q1 ‘15 Q1 ‘16
Dallas United States
59 RCA Trends & Trade, Dallas Hotels as of April 11, 2016 ©Real Capital Analytics Inc.
Charts courtesy of Real Capital Analytics. Used with permission.
@2016 KPMG LLP, a Delaware limited liability partnership and the U.S. member firm of the KPMG network of independent member firms affiliated with KPMG International Cooperative (“KPMG International”), a Swiss entity. All rights reserved.

办公楼 | 达拉斯 基于不动产和投资组合 — 250万美元或以上
销售交易量 定价分析总销售额(百万美元) 每平方英尺均价(美元) 平均资本化率(%)
不动产名称 售价(美元) 面积 (平方英尺)
售价(美元) (每平方英尺) 销售日期
The Points at Waterview 26,800,000 202,695 132 2015年12月Baylor Surgery Center 14,385,850 36,880 390 2015年12月Occidental Tower 95,000,000 549,170 173 2015年12月2100 McKinney Ave 84,608,670 360,000 235 2015年12月Texas Oncology 14,000,000 38,182 367 2016年2月First Choice ER 8,420,275 7,000 1,203 2016年2月
商铺 | 达拉斯 基于不动产和投资组合 — 250万美元或以上
销售交易量 定价分析总销售额(百万美元) 每平方英尺均价(美元) 平均资本化率(%)
以上图表由Real Capital Analytics Inc.提供,在此使用获经许可。
酒店 —过去12个月的销售量与去年同期相比下跌15%,交易总额略低于8.33亿美元。2016年第一季度销量为2,200万美元,而2015年第一季度的销量共计亿2.39亿美元。过去12个
月平均每间客房价格为107,857美元(全国平均价格148,205美元)。2016年第一季度资本化率为9.1%,比2015年第一季度增长约64个基点。59
59 Real Capital Analytics Inc.发布的达拉斯/沃斯酒店交易报告,数据截至于2016年4月11日
@2016毕马威会计师事务所,美国特拉华州的有限责任合伙,并为毕马威国际合作组织(“毕马威国际”)相关联的独立成员所网络中的美国成员公司。毕马威国际属瑞士实体公司。版权所有,不得转载。
65China Inbound Investing in U.S. Real Estate
中国赴美房地产投资

Property name Sale price (USD) Size (sf)Sale price
per sf (USD)Sale date
Plaza De Oro 13,350,000 93,941 142 Jan-16
Bedford Meadows 3,700,000 41,205 90 Feb-16
Family Dollar 2,041,861 8,320 245 Mar-16
Industrial | Dallas Based on properties & portfolios ~USD2.5mil or greater
Sales Transaction Volume Pricing Analysis
Sales (millions USD) Average price per unit (USD) Average cap rate (yield)
0
500
1,000
1,500
2,000
2,500
3,000
3,500
4,000
Q1 ‘13 Q1 ‘14 Q1 ‘15 Q1 ‘16
Rolling 12-mo. Total Quarterly Vol.
0
10
20
30
40
50
60
70
80
Q1 ‘13 Q1 ‘14 Q1 ‘15 Q1 ‘16
Dallas United States
3%4%5%6%7%8%9%
10%11%12%
Q1 ‘13 Q1 ‘14 Q1 ‘15 Q1 ‘16
Dallas United States
Property name Sale price (USD) Size (sf)Sale price
per sf (USD)Sale date
Arlington Commerce Center Bldgs A & B
44,148,897 776,798 57 Dec-15
351 Lakeside Parkway 17,410,406 231,660 75 Dec-15
Medline Industries 16,867,764 288,796 58 Dec-15
Apex Tool Group 16,090,300 336,449 48 Dec-15
Ford Motor Company 14,322,285 252,000 57 Dec-15
Southridge Regional One 14,185,882 249,600 57 Dec-15
1301 Ridgeview Drive 9,536,750 116,647 82 Dec-15
Ericsson 8,235,704 121,068 68 Dec-15
Teco Metal Products 3,212,510 90,364 36 Feb-16
Apartment | Dallas Based on properties & portfolios ~USD2.5mil or greater
Sales Transaction Volume Pricing Analysis
Sales (millions USD) Average price per unit (USD) Average cap rate (yield)
01,0002,0003,0004,0005,0006,0007,0008,0009,000
Q1 ‘13 Q1 ‘14 Q1 ‘15 Q1 ‘16
Rolling 12-mo. Total Quarterly Vol.
0
20,000
40,000
60,000
80,000
100,000
120,000
140,000
160,000
Q1 ‘13 Q1 ‘14 Q1 ‘15 Q1 ‘16
Dallas United States
3%4%5%6%7%8%9%
10%11%12%
Q1 ‘13 Q1 ‘14 Q1 ‘15 Q1 ‘16
Dallas United States
Charts courtesy of Real Capital Analytics. Used with permission.
@2016 KPMG LLP, a Delaware limited liability partnership and the U.S. member firm of the KPMG network of independent member firms affiliated with KPMG International Cooperative (“KPMG International”), a Swiss entity. All rights reserved.

不动产名称 售价(美元) 面积 (平方英尺)
售价(美元) (每平方英尺) 销售日期
Plaza De Oro 13,350,000 93,941 142 2016年1月Bedford Meadows 3,700,000 41,205 90 2016年2月Family Dollar 2,041,861 8,320 245 2016年3月
工业 | 达拉斯 基于不动产和投资组合 — 250万美元或以上
销售交易量 定价分析总销售额(百万美元) 每平方英尺均价(美元) 平均资本化率(%)
不动产名称 售价(美元) 面积 (平方英尺)
售价(美元) (每平方英尺) 销售日期
Arlington Commerce Center Bldgs A & B
44,148,897 776,798 57 2015年12月
351 Lakeside Parkway 17,410,406 231,660 75 2015年12月Medline Industries 16,867,764 288,796 58 2015年12月Apex Tool Group 16,090,300 336,449 48 2015年12月Ford Motor Company 14,322,285 252,000 57 2015年12月Southridge Regional One 14,185,882 249,600 57 2015年12月1301 Ridgeview Drive 9,536,750 116,647 82 2015年12月Ericsson 8,235,704 121,068 68 2015年12月Teco Metal Products 3,212,510 90,364 36 2016年2月
公寓 | 达拉斯 基于不动产和投资组合 — 250万美元或以上
销售交易量 定价分析总销售额(百万美元) 每套平均售价(美元) 平均资本化率(%)
以上图表由Real Capital Analytics Inc.提供,在此使用获经许可。
@2016毕马威会计师事务所,美国特拉华州的有限责任合伙,并为毕马威国际合作组织(“毕马威国际”)相关联的独立成员所网络中的美国成员公司。毕马威国际属瑞士实体公司。版权所有,不得转载。
67China Inbound Investing in U.S. Real Estate
中国赴美房地产投资
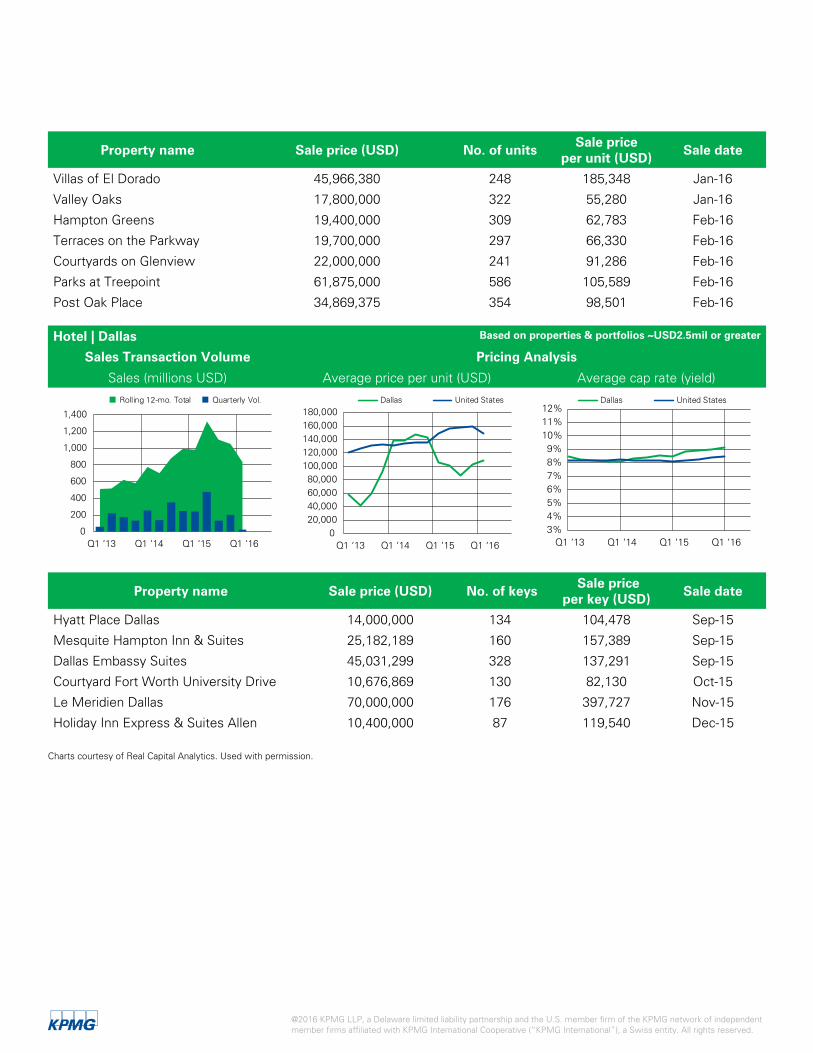
Property name Sale price (USD) No. of unitsSale price
per unit (USD)Sale date
Villas of El Dorado 45,966,380 248 185,348 Jan-16
Valley Oaks 17,800,000 322 55,280 Jan-16
Hampton Greens 19,400,000 309 62,783 Feb-16
Terraces on the Parkway 19,700,000 297 66,330 Feb-16
Courtyards on Glenview 22,000,000 241 91,286 Feb-16
Parks at Treepoint 61,875,000 586 105,589 Feb-16
Post Oak Place 34,869,375 354 98,501 Feb-16
Hotel | Dallas Based on properties & portfolios ~USD2.5mil or greater
Sales Transaction Volume Pricing Analysis
Sales (millions USD) Average price per unit (USD) Average cap rate (yield)
0
200
400
600
800
1,000
1,200
1,400
Q1 ‘13 Q1 ‘14 Q1 ‘15 Q1 ‘16
Rolling 12-mo. Total Quarterly Vol.
020,00040,00060,00080,000
100,000120,000140,000160,000180,000
Q1 ‘13 Q1 ‘14 Q1 ‘15 Q1 ‘16
Dallas United States
3%4%5%6%7%8%9%
10%11%12%
Q1 ‘13 Q1 ‘14 Q1 ‘15 Q1 ‘16
Dallas United States
Property name Sale price (USD) No. of keys Sale price
per key (USD)Sale date
Hyatt Place Dallas 14,000,000 134 104,478 Sep-15
Mesquite Hampton Inn & Suites 25,182,189 160 157,389 Sep-15
Dallas Embassy Suites 45,031,299 328 137,291 Sep-15
Courtyard Fort Worth University Drive 10,676,869 130 82,130 Oct-15
Le Meridien Dallas 70,000,000 176 397,727 Nov-15
Holiday Inn Express & Suites Allen 10,400,000 87 119,540 Dec-15 Charts courtesy of Real Capital Analytics. Used with permission.
@2016 KPMG LLP, a Delaware limited liability partnership and the U.S. member firm of the KPMG network of independent member firms affiliated with KPMG International Cooperative (“KPMG International”), a Swiss entity. All rights reserved.

不动产名称 售价(美元) 单元套数 每套销售价 (美元) 销售日期
Villas of El Dorado 45,966,380 248 185,348 2016年1月Valley Oaks 17,800,000 322 55,280 2016年1月Hampton Greens 19,400,000 309 62,783 2016年2月Terraces on the Parkway 19,700,000 297 66,330 2016年2月Courtyards on Glenview 22,000,000 241 91,286 2016年2月Parks at Treepoint 61,875,000 586 105,589 2016年2月Post Oak Place 34,869,375 354 98,501 2016年2月
酒店 | 达拉斯 基于不动产和投资组合 — 250万美元或以上
销售交易量 定价分析总销售额(百万美元) 每套平均售价(美元) 平均资本化率(%)
不动产名称 售价(美元) 钥匙间数 每间售价 (美元) 销售日期
Hyatt Place Dallas 14,000,000 134 104,478 2015年9月Mesquite Hampton Inn & Suites 25,182,189 160 157,389 2015年9月Dallas Embassy Suites 45,031,299 328 137,291 2015年9月Courtyard Fort Worth University Drive 10,676,869 130 82,130 2015年10月Le Meridien Dallas 70,000,000 176 397,727 2015年11月Holiday Inn Express & Suites Allen 10,400,000 87 119,540 2015年12月
以上图表由Real Capital Analytics Inc.提供,在此使用获经许可。
@2016毕马威会计师事务所,美国特拉华州的有限责任合伙,并为毕马威国际合作组织(“毕马威国际”)相关联的独立成员所网络中的美国成员公司。毕马威国际属瑞士实体公司。版权所有,不得转载。
69China Inbound Investing in U.S. Real Estate
中国赴美房地产投资

Forms of investment in U.S. real estate
How to invest in the U.S. real estate marketThe U.S. market offers significant opportunities for foreign investors. The continued strong demand from more than 310 million people for goods and services has resulted in a trade balance in the early 21st century that currently favors foreign exporters. But the business of exporting goods and services to the United States can be complicated by a host of duty and tariff-related challenges that often make building or buying a business in the United States a better long-term decision. The United States offers numerous financial incentives to build a business, and buying a business may be a cheaper alternative. But the decision whether to buy or build a business in the United States is also governed by a host of factors—geographic, demographic, financial and industrial—that need to be studied by foreign investors before making a commitment.
Buy or buildDevelopment activities comprise a greater financial risk to a real estate organization than the ownership of existing assets. The decision to buy or build real estate assets often hinges on a number of factors, including industry maturity, financial considerations, the potential for success, internal capacity, and supplier and customer availability.
Whether to buy or build often is a difficult decision. The build option offers the significant advantages of business confidentiality; the opportunity to use existing technology and intellectual capital; and the ability to further build brand, product and service recognition. Additional information on development property is required by investors to obtain a good understanding of the related risks. The key risks in developments are approvals, delays, difficulty financing when there is no track record, increasing capital expenses, stretching a management team beyond its regular duties resulting in quality control issues; and, on the income side, securing an expected or better sale price or rental income at suitable terms from quality purchasers or tenants.
The buy decision often allows for complete investigation of a target and the ability to negotiate a specific price and terms without concern about the cost overruns and delays that often occur with the internal build decision. Disadvantages of the buy decision include a long, drawn-out negotiation and closing process that may sometimes collapse, and the true cost of the acquisition may be much higher than the price originally intended.
Mergers and acquisitionsCompanies use mergers and acquisitions as alternatives to internal expansion. Mergers and acquisitions take many different forms, ranging
@2016 KPMG LLP, a Delaware limited liability partnership and the U.S. member firm of the KPMG network of independent member firms affiliated with KPMG International Cooperative (“KPMG International”), a Swiss entity. All rights reserved.

美国房地产投资形式
如何投资美国房地产市场美国房地产市场给外国投资者带来无限商机。逾3.1亿人口对商品及服务的 持续强劲需求,形成了21世纪初期的贸易差额,及有利于外国出口商的现状。但向美国出口商品及服务,尚有众多复杂的税务和关税相关的挑战,因而从长远角度来看,选择在美国创业或收购往往是进入美国市场和吸引美国消费者更好的决策。美国政府针对创业提供各种财政激励措施,也可能 收购或许是一个更为廉价的选择。然而,在美国选择收购或者创建企业还 受地理、人文、财务和行业等一系列因素的制约—这都是外国投资者在进军美国市场前应认真研究的内容。
收购抑或开发?对房地产企业而言,地产开发牵涉的财务风险远远超过拥有现有租赁资产。选择收购还是地产开发通常取决于诸多因素,包括行业成熟程度、金 融因素、成功潜力、内部产能、供应 商和客户的可得性。
收购或开发都是非常艰难的抉择。选 择开发非常有利于商业机密的保护、 当前技术和智力资本的使用、进一步创立品牌、产品和服务认可能力的提高。投资者还需要获得有关房地产开发的其他信息,才能更透彻地理解相关风险。地产开发阶段涉及的重要风险有审批、项目延误、缺乏信用记录导致的融资困难、不断增加的资本支出,同时管理层团队的常规责任和质量控制扩大化;在收入方面,能否从优质客户或租户获得预期或更高的销售价格或租赁收益且条款合适,也存在一定的风险。
选择收购则常常能够对投资目标进行全面的调查,具备商议具体价格和条款的能力,而不像开发决策那样担忧成本超支和项目延误。选择收购的弊端有冗长繁琐的协商与收尾过程,而且包含交易失败的可能性,收购实际成本也可能比原先的预期价格高出许多。
并购公司选择并购作为其内部扩张的替代方案。 并购形式多样,有两家公司的“友
@2016毕马威会计师事务所,美国特拉华州的有限责任合伙,并为毕马威国际合作组织(“毕马威国际”)相关联的独立成员所网络中的美国成员公司。毕马威国际属瑞士实体公司。版权所有,不得转载。
71China Inbound Investing in U.S. Real Estate
中国赴美房地产投资

from “friendly” mergers of two companies to “hostile” takeovers of publicly traded companies. In the United States, there are a number of securities and tax regulations governing mergers and acquisitions. Therefore, companies considering this option should seek not only financial and tax advice, but also legal advice when contemplating a merger or acquisition in the United States. Acquiring businesses has become a major activity both globally and in the United States. There are certain strategies and procedural matters involved in an effective acquisition process.
Those not experienced in mergers and acquisitions may need assistance from investment banking firms, business brokers, bankers, business advisers, financial consultants, valuation analysts, accounting firms and law firms. These resources can assist in identifying and analyzing potential targets, valuing the target, evaluating the tax consequences of the proposed acquisition, negotiating the contract, and integrating the target into existing operations.
Joint ventures and strategic alliances If a good acquisition target is not available, a joint venture or strategic alliance may be a viable way to enter the U.S. market. These alliances offer a way to grow and to obtain specific knowledge that would be very costly or time-consuming to achieve alone. An alliance demands cooperation and trust, and is often designed to share risk. A strategic alliance is a cooperative arrangement between two or more organizations designed to achieve a shared strategic goal.
Investment formForeign companies considering investing in the United States often are confronted with a maze of legal, financial and fiscal complications, including their first exposure to the U.S. tax system. The federal tax code includes a specific set of rules that govern the taxation of foreign investors in general. In addition, there are specific federal tax rules that cover the taxation of U.S. real estate owned directly or indirectly by foreign investors.
The foreign investor should have advanced knowledge of U.S. federal taxation under various structures in order to properly set up their U.S. structure while at the same time ensuring the structure allows for the execution of the business strategy.
A foreign enterprise may operate in the United States through a variety of legal forms, including U.S. corporation, foreign corporation, partnership, limited liability company (LLC) and real estate investment trust (REIT). One of the typical forms for real estate investment is through a fund structure. Tax and non-tax concerns can influence a business choice of legal structure. Certain entities may elect to be classified for U.S. tax purposes in a manner different than their legal form.
The type of real estate asset owned by a fund and type of financing involved in acquiring it critically impact the U.S. federal tax treatment of investors; the type of entity through which investors invest in funds also affects the U.S. federal tax consequences. The fund itself generally is formed either as a partnership or a limited liability company classified as a partnership for U.S. federal tax purposes. As such, the fund itself is not taxable on its income; rather the fund’s income, loss deduction and credit flow through to its partners, who are subject to U.S. federal tax on that income. Also, any trade or business conducted, directly or indirectly, by the fund will be attributed, for many purposes, to its investors. Limited partnerships and LLCs often provide more flexibility than other types of entities in permitting preferred returns and other non-traditional profit-sharing relationships.
PartnershipsFor U.S. federal tax purposes, a partnership is an association of two or more persons to act as co-owners of a business for profit. The partnership form of business enterprise lets investors pool their capital, ideas and management abilities. This pooling of assets may contribute to the establishment of a successful business.
@2016 KPMG LLP, a Delaware limited liability partnership and the U.S. member firm of the KPMG network of independent member firms affiliated with KPMG International Cooperative (“KPMG International”), a Swiss entity. All rights reserved.

好”兼并,也有对上市公司的“敌意”收购。美国有各种证券和税务法规规范并购。因此,考虑在美国进行并购的公司不仅要寻求财务和税务建议,还必须获得法律建议。收购已成为全美乃至全球的主要商业活动,一个高效的收购流程包含了某些策略和程序事项。
不具有并购经验的公司可寻求投资银行、商业经纪人、银行、商业顾问、财务顾问、评估分析师、会计师事务所或律师事务所的协助。这些资源可帮助企业识别分析和评估潜在目标公司、评估税务影响、洽谈合同、整合目标公司与当前运营。
合资与战略联盟若未发现合适的收购目标,成立合资企业或战略联盟或许是进入美国市场的可行途径。成立联盟提供了一种增加与获取具体知识的便捷方法,而通过单枪匹马的方式却会大大增加成本与时间。建立联盟需要相互合作与信任,并且通常须共同承担风险。一个战略联盟是一种两家或更多的企业为实现共同战略目标而形成的一种合作安排。
投资形式外国公司考虑在美国投资,往往会面对如迷宫般的法律、金融和财政一系列的全新的复杂规则,包括首次接触美国税收制度。美国联邦税法包含一整套针对外国投资者进行征税的具体规则。另外,对直接或间接由外国投资者持有的美国房地产制定了具体联邦税务规则。
外国投资者应透彻了解不同实体架构的联邦征税规定,以成立恰当的实体,确保实体架构便于实施商业策略。
外资企业可通过多种法律形式在美国运作,包括美国下属公司、外国下属公司、合伙企业、有限责任公司(LLC),房地产投资信托公司(REIT)。房地产投资的典型方式之一就是通过基金架构。税务及非税 务考虑都能影响法律结构的选择。某些实体可选择不同于其法律形式的美国税收类别。
房地产基金类型以及并购融资类型都会对投资者的联邦税课征方式产生重大影响,通过何种实体类型投资于基金也对投资者的联邦税产生影响。基金本身一般是合伙或有限责任公司,作为合伙企业缴纳美国联邦税。因此,基金公司本身并不用征税,其收入、可抵减损失及抵免都流向其合伙人,合伙人需要缴纳相关美国联邦所得税。同样地,基金直接或间接进行的贸易或业务,在很多情况下都归属于其投资者。在准许优先回报及非传统利润共享关系方面,有限合伙和有限责任公司通常具备更大的灵活性。
合伙企业从美国联邦税角度来看,合伙制企业是指两个或两个以上的个人,以共同所有人身份共同经营的以营利为目的的机构。合伙制企业可使投资者整合资金,构想以及管理理念。这种整合会对建立一个成功的企业有所帮助。
@2016毕马威会计师事务所,美国特拉华州的有限责任合伙,并为毕马威国际合作组织(“毕马威国际”)相关联的独立成员所网络中的美国成员公司。毕马威国际属瑞士实体公司。版权所有,不得转载。
73China Inbound Investing in U.S. Real Estate
中国赴美房地产投资

An entity classified as a partnership for U.S. federal tax purposes is a “flowthrough entity” that generally is not subject to U.S. federal tax on its income. Rather, the entity’s income “flows through” to its owners, who are taxed on that income. An entity classified as a partnership may come in various legal forms. The most common are a limited partnership or a limited liability company. If formed in the U.S., each of these entities will be classified as a flowthrough entity for U.S. federal tax purposes in the absence of an election otherwise. A partnership also may exist for U.S. federal tax purposes even if no legal entity is formed; rather, a contractual arrangement to operate a business entered into between two or more parties may give rise to a U.S. federal tax partnership.
Limited partnershipsA limited partnership is an association of co-owners formed to own a business. A limited partnership has at least one general partner and at least one limited partner. The liability of a limited partner generally is limited to the amount that partner invests in the partnership.
General partners are subject to unlimited liability for the debts of the partnership and are solely responsible for the management of the business. Limited partners may neither take part in the management of the business nor let their names be used in the partnership name. Violation of these rules may cause limited partners to be treated as general partners.
Withdrawal of a limited partner usually will not terminate the limited partnership. However, the withdrawal of all general partners will cause the partnership to be dissolved by operation of law.
Limited liability companiesAnother form of legal entity that may be classified as a partnership for U.S. federal tax purposes is the limited liability company (LLC). LLCs are neither partnerships nor corporations under applicable state law, but they generally provide limited liability to all of their owners for obligations of the business.
International considerationsA foreign investor may want to consider the following factors when deciding how to operate a business within the United States. This discussion assumes that a foreign parent corporation has purchased U.S. business assets (including real property).
Choice of entityIf a foreign corporation makes an acquisition of business assets (including real property) located in the United States, it must decide whether to operate its new U.S. business in a corporate or flowthrough entity which would most likely be a limited partnership or limited liability company.
As a general rule, a foreign corporation’s U.S. tax posture may be simplified from an operational standpoint if it chooses corporate status. For example, incorporation following acquisition may provide a discrete opportunity to infuse debt into the United States, if desirable and with proper tax considerations (including, but not limited to, debt vs. equity analysis). In later years, it also may be easier to integrate the new U.S. business interests with other U.S. targets that operate through U.S. corporations if the new U.S. business is itself a corporation for U.S. income tax purposes.
@2016 KPMG LLP, a Delaware limited liability partnership and the U.S. member firm of the KPMG network of independent member firms affiliated with KPMG International Cooperative (“KPMG International”), a Swiss entity. All rights reserved.

根据美国联邦税务法规,划归于合伙制的企业通常是一个免征联邦所得税的“流通实体”。实体的收入所得“流入”其所有人,而所有人具有纳税申报义务。合伙制实体可以以不同的法律形式存在。最常见的为有限合伙企业或有限责任公司。如果没有特别选择,根据美国联邦税务法规,这些在美国成立的合伙制实体均为“流通实体”。即使没有法律实体存在,在美国联邦税收体制下合伙制仍然可以存在。只要两个或两个以上当事人之间签订合作协议即可建立美国联邦税收的伙伴关系。
有限合伙有限合伙是以共同所有人的身份拥有一项商业的合伙组织。有限合伙至少拥有一名普通合伙人和一名有限合伙人。有限合伙人的责任通常仅限于该合伙人投资于合伙的份额。
普通合伙人对合伙的债务承担无限责任,并且全权负责业务管理。有限合伙人既不参加管理,也不允许合伙名称使用其姓名。违反这些规则可能使有限合伙人按照普通合伙人对待。
有限合伙人的退出通常不会终止有限合伙。但是所有普通合伙人的退出将依法迫使合伙制解散。
有限责任公司美国联邦税制下的另一种法律实体形式是有限责任公司(LLC)。在适用的州法下,有限责任公司既不是合伙企业,也不是公司,但它通常意味着其全部所有者对商业义务拥有有限责任。
国际性因素当外国投资者决定如何在美国经营企业时,需要考虑下列因素。此处假设外国母公司已经购买了美国商业资产(包括房地产)。
实体形式的选择 外国公司收购位于美国的商业资产(包括房地产)时,必须决定以公司或者流通实体形式经营其在美国的新业务。通常情况下会是有限合伙制或者有限责任制公司。
一般情况下,从经营角度来看,如果外国公司选择公司形式,其在美国税务状况就会得以简化。例如,随着并购成立的公司在有需要的情况下可提供向美国注入债务的机会以及包含但不仅限于债务与权益分析相关的税收考虑。如果该新美国企业本身是美国所得税目的的公司形式,那么在未来将之与其他公司形式的美国被收购企业进行整合就会容易得多。
@2016毕马威会计师事务所,美国特拉华州的有限责任合伙,并为毕马威国际合作组织(“毕马威国际”)相关联的独立成员所网络中的美国成员公司。毕马威国际属瑞士实体公司。版权所有,不得转载。
75China Inbound Investing in U.S. Real Estate
中国赴美房地产投资
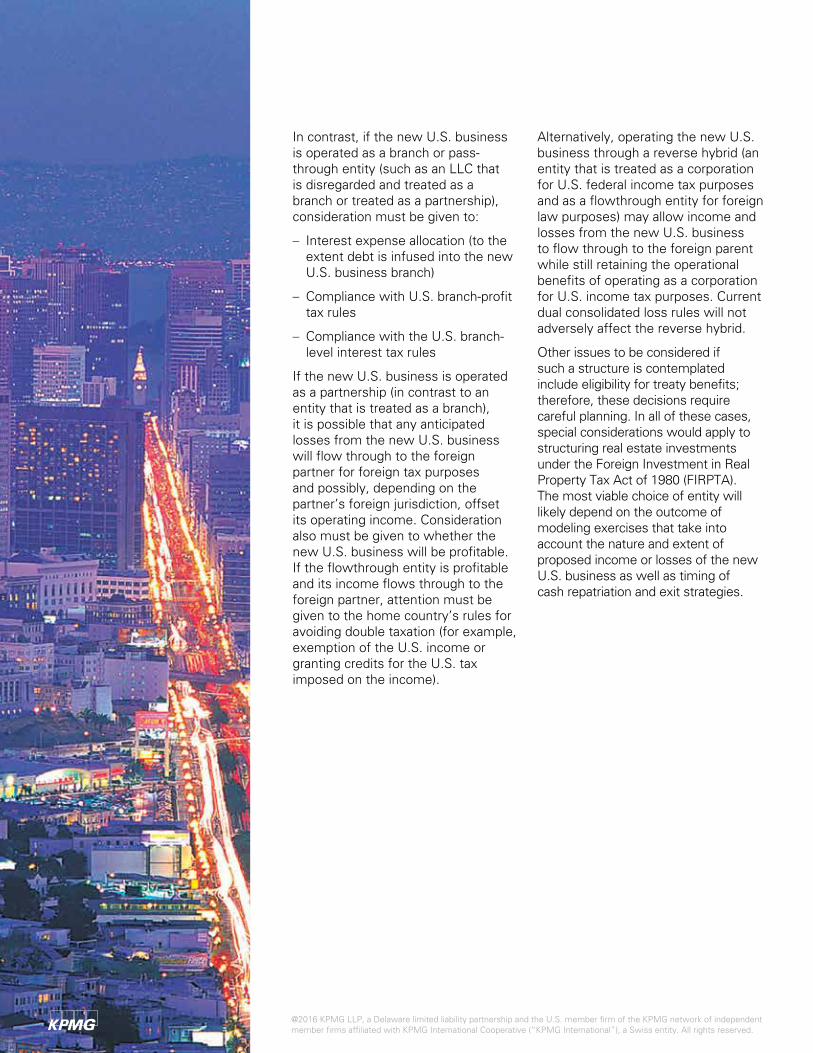
In contrast, if the new U.S. business is operated as a branch or pass- through entity (such as an LLC that is disregarded and treated as a branch or treated as a partnership), consideration must be given to:
– Interest expense allocation (to the extent debt is infused into the new U.S. business branch)
– Compliance with U.S. branch-profit tax rules
– Compliance with the U.S. branch-level interest tax rules
If the new U.S. business is operated as a partnership (in contrast to an entity that is treated as a branch), it is possible that any anticipated losses from the new U.S. business will flow through to the foreign partner for foreign tax purposes and possibly, depending on the partner’s foreign jurisdiction, offset its operating income. Consideration also must be given to whether the new U.S. business will be profitable. If the flowthrough entity is profitable and its income flows through to the foreign partner, attention must be given to the home country’s rules for avoiding double taxation (for example, exemption of the U.S. income or granting credits for the U.S. tax imposed on the income).
Alternatively, operating the new U.S. business through a reverse hybrid (an entity that is treated as a corporation for U.S. federal income tax purposes and as a flowthrough entity for foreign law purposes) may allow income and losses from the new U.S. business to flow through to the foreign parent while still retaining the operational benefits of operating as a corporation for U.S. income tax purposes. Current dual consolidated loss rules will not adversely affect the reverse hybrid.
Other issues to be considered if such a structure is contemplated include eligibility for treaty benefits; therefore, these decisions require careful planning. In all of these cases, special considerations would apply to structuring real estate investments under the Foreign Investment in Real Property Tax Act of 1980 (FIRPTA). The most viable choice of entity will likely depend on the outcome of modeling exercises that take into account the nature and extent of proposed income or losses of the new U.S. business as well as timing of cash repatriation and exit strategies.
@2016 KPMG LLP, a Delaware limited liability partnership and the U.S. member firm of the KPMG network of independent member firms affiliated with KPMG International Cooperative (“KPMG International”), a Swiss entity. All rights reserved.

相对而言,如果在美国的新业务作为分支机构或流通实体(或视为分支机构或合伙制企业)运营,那么必须考虑下列因素:
– 利息费用税前扣除的分配(仅限 向新美国分支机构注入债务)
– 美国分支机构的赢利所得税合规
– 美国分支机构的特别利息应税规则合规
如果新美国企业作为合伙企业形式经营(相对于视为分支机构,其预期税务损失会归属外国合伙人.如本国税法许可,外国合伙人进而有可能利用此税务损失以抵消美国境外经营收入。另外,还应考虑该新美国企业是否能盈利。如果流通实体盈利,其收益流入外国合伙人,则应注意母国的避免双重征税规则(如美国所得免税或就美国所得税给予税收抵免)。
另 一 种 选 择 是 , 通 过 反 向 混 合 实 体(reverse hybrid)(混合实体是按美国联邦所得税规定属于公司,而按照外国税法属于流通实体)来经营新美国企业,在保留以美国所得税目的的公司来进行运营的优势同时,也能使收益和损失从新美国企业流向外国母公司。当前的美国税务法规的双重合并亏损规则不会对反向混合体造成负面影响。若采用这样的架构,还应考虑是否具备税收协定优惠待遇资格;因此这些决策需要详密筹划。不管什么情况,应特别注意《1980年外国投资房地产税法案》(FIRPTA)下房地产投资的规划。确定最可行的实体形式,应综合考虑新美国企业的收入和损失的性质和范围,以及现金汇回的时机和退出策略问题,在此基础上建模处理。
@2016毕马威会计师事务所,美国特拉华州的有限责任合伙,并为毕马威国际合作组织(“毕马威国际”)相关联的独立成员所网络中的美国成员公司。毕马威国际属瑞士实体公司。版权所有,不得转载。
77China Inbound Investing in U.S. Real Estate
中国赴美房地产投资

Taxation
Under the Foreign Investment in Real Property Tax Act of 1980 (FIRPTA), any foreign investor (other than a qualified foreign pension fund or a foreign entity wholly-owned by a qualified foreign pension fund) investing in a U.S. real property
interest (USRPI) is deemed to conduct a U.S. trade or business and the gain or loss would be deemed to be effectively connected with a U.S. trade or business and therefore subject to taxation on a net basis.
Investment through
Tax implications
U.S. corporation
Corporations are generally subject to a tax rate of 35 percent and state and local income taxes would also be applicable. The corporation itself has a tax filing requirement; however, this eliminates the need for the foreign investor to personally file a U.S. income tax return. Repatriation of earnings for the corporation to the foreign investor give rise to double taxation and any dividends paid may be subject to 30 percent withholding tax absent a treaty reduction or exemption.
Foreign corporation
Similar to U.S. corporations, foreign corporations are generally subject to a federal tax rate of 35% as well as state and local income taxes. Repatriation of earnings from the foreign corporation is generally not subject to further taxation in the United States. Generally, stock of the foreign corporation can also be sold without the application of FIRPTA since the stock does not constitute USRPI. One major concern, however, is the 30 percent branch-profits tax that may be assessed on foreign corporations doing business in the United States.
Direct ownership
The major advantage to a foreign individual owning property directly is the favorable long-term capital gains tax rate available to individuals as well as the absence of double taxation that would otherwise be applicable if held through a corporation. Today, long-term capital gains are taxed at a 20 percent rate for individuals. The portion of the capital gain related to depreciation expense previously deducted is taxed at a 25 percent rate for individuals. However, direct ownership may create a U.S. income tax related filing obligation and also may create exposure to the U.S. federal estate tax if the individual dies while directly holding U.S. real property.
To effectively protect the return on their investments, foreign investors need to understand the fundamental dynamics and complexities of U.S. tax law, and specifically the benefits of proper tax structuring. In reality, there is no such thing as a “one-size-fits-all” solution in this regard.
Angela Yu, Tax Partner, U.S. - China Real Estate
Initiative, KPMG LLP
“
“
@2016 KPMG LLP, a Delaware limited liability partnership and the U.S. member firm of the KPMG network of independent member firms affiliated with KPMG International Cooperative (“KPMG International”), a Swiss entity. All rights reserved.

税务事项
投资结构 税务影响
美国公司
企业一般按照35%的税率缴联邦税,在联邦税之上各州及地方也有各自的的所得税税率。公司自身设立了纳税申报要求,这就省去了外国投资者必须亲自提交美国个人所得税申报单的麻烦。公司向外国投资者的收益汇回会导致双重税收,公司对股东所支付的股息可能征收30%的代扣所得税, 如外国投资者所在的国家和美国有双边税务条约,可享受较低的税收协定税率或免税。
外国公司
外国公司给非美国股东的汇回收益一般不必在美国进一步缴税。通常,从税务角度来看, 由于外国 公司股票不构成美国不动产权益,《1980年外国投资房地产税法》不适用于出售外国公司股票交易.但其中一个重要问题是在美国开展业务的外国公司可能需要缴纳30%的分支利得税。
直接所有权
外国个人直接拥有财产的主要优势是个人可享受优惠的长期资本利得税税率及免于双重征税(如果该财产由公司持有,则存在双重征税)。目前,对个人征收的长期资本利得税的税率为20%或23.8%。扣除折旧费用的资本收益以28.8%税率向个人征收。直接所有权制可能会产生美国个人所得税申报的相关义务。此外,直接持有美国不动产的个人死亡也可能会导致美国联邦遗产税的产生。
根据《1980年外国投资房地产税法》(“FIRPTA”),任何外国投资者(除符合资格的外国养老基金或外国养老基金的国外全资子公司)投资的美国不动产
权益均被视作在美国开展的贸易或业务,其投资收益或亏损被视作与在美国开展贸易或业务实际关联,因此按照净额征税。
为了有效地确保投资收益,外国投资者需要了解美国税法的基本动态和复杂性,特别是如何使企业从合理的税务构架中受益。对此,在实际操作中也是不存在“万能方案”的
Angela Yu, 税务合伙人, 中美房地产合作, 毕马威美国分所
“
“
@2016毕马威会计师事务所,美国特拉华州的有限责任合伙,并为毕马威国际合作组织(“毕马威国际”)相关联的独立成员所网络中的美国成员公司。毕马威国际属瑞士实体公司。版权所有,不得转载。
79China Inbound Investing in U.S. Real Estate
中国赴美房地产投资
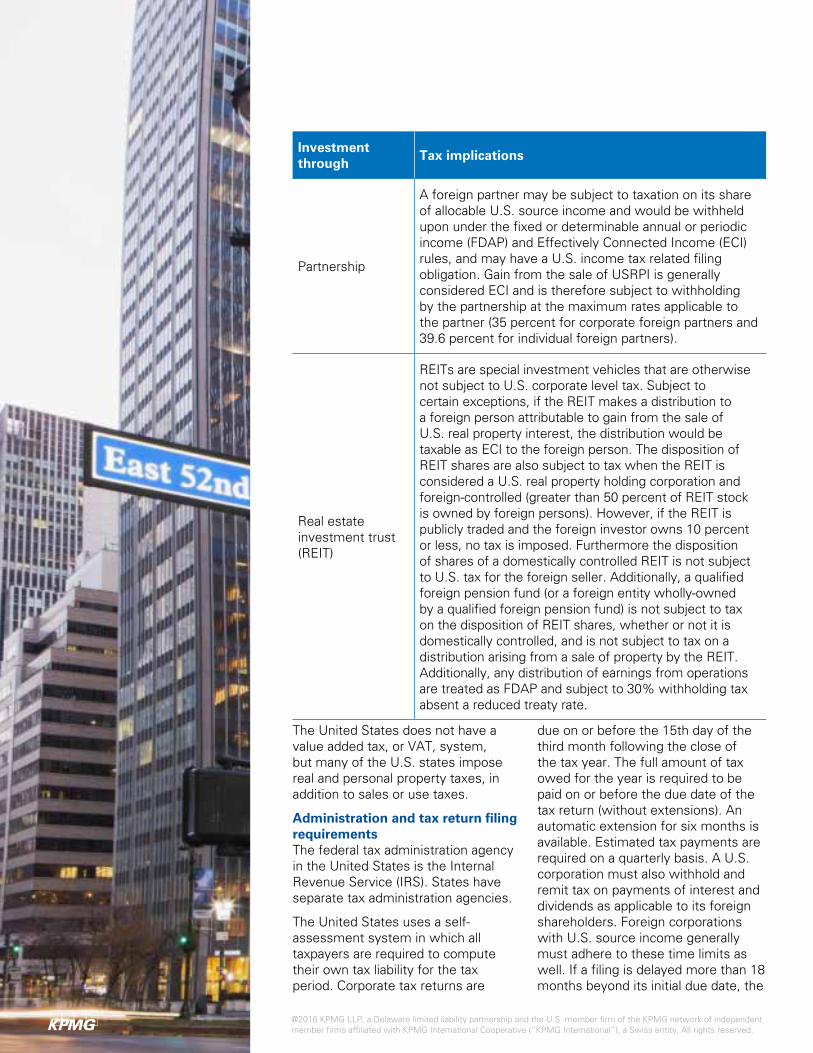
Investment through
Tax implications
Partnership
A foreign partner may be subject to taxation on its share of allocable U.S. source income and would be withheld upon under the fixed or determinable annual or periodic income (FDAP) and Effectively Connected Income (ECI) rules, and may have a U.S. income tax related filing obligation. Gain from the sale of USRPI is generally considered ECI and is therefore subject to withholding by the partnership at the maximum rates applicable to the partner (35 percent for corporate foreign partners and 39.6 percent for individual foreign partners).
Real estate investment trust (REIT)
REITs are special investment vehicles that are otherwise not subject to U.S. corporate level tax. Subject to certain exceptions, if the REIT makes a distribution to a foreign person attributable to gain from the sale of U.S. real property interest, the distribution would be taxable as ECI to the foreign person. The disposition of REIT shares are also subject to tax when the REIT is considered a U.S. real property holding corporation and foreign-controlled (greater than 50 percent of REIT stock is owned by foreign persons). However, if the REIT is publicly traded and the foreign investor owns 10 percent or less, no tax is imposed. Furthermore the disposition of shares of a domestically controlled REIT is not subject to U.S. tax for the foreign seller. Additionally, a qualified foreign pension fund (or a foreign entity wholly-owned by a qualified foreign pension fund) is not subject to tax on the disposition of REIT shares, whether or not it is domestically controlled, and is not subject to tax on a distribution arising from a sale of property by the REIT. Additionally, any distribution of earnings from operations are treated as FDAP and subject to 30% withholding tax absent a reduced treaty rate.
The United States does not have a value added tax, or VAT, system, but many of the U.S. states impose real and personal property taxes, in addition to sales or use taxes.
Administration and tax return filing requirementsThe federal tax administration agency in the United States is the Internal Revenue Service (IRS). States have separate tax administration agencies.
The United States uses a self-assessment system in which all taxpayers are required to compute their own tax liability for the tax period. Corporate tax returns are
due on or before the 15th day of the third month following the close of the tax year. The full amount of tax owed for the year is required to be paid on or before the due date of the tax return (without extensions). An automatic extension for six months is available. Estimated tax payments are required on a quarterly basis. A U.S. corporation must also withhold and remit tax on payments of interest and dividends as applicable to its foreign shareholders. Foreign corporations with U.S. source income generally must adhere to these time limits as well. If a filing is delayed more than 18 months beyond its initial due date, the
@2016 KPMG LLP, a Delaware limited liability partnership and the U.S. member firm of the KPMG network of independent member firms affiliated with KPMG International Cooperative (“KPMG International”), a Swiss entity. All rights reserved.
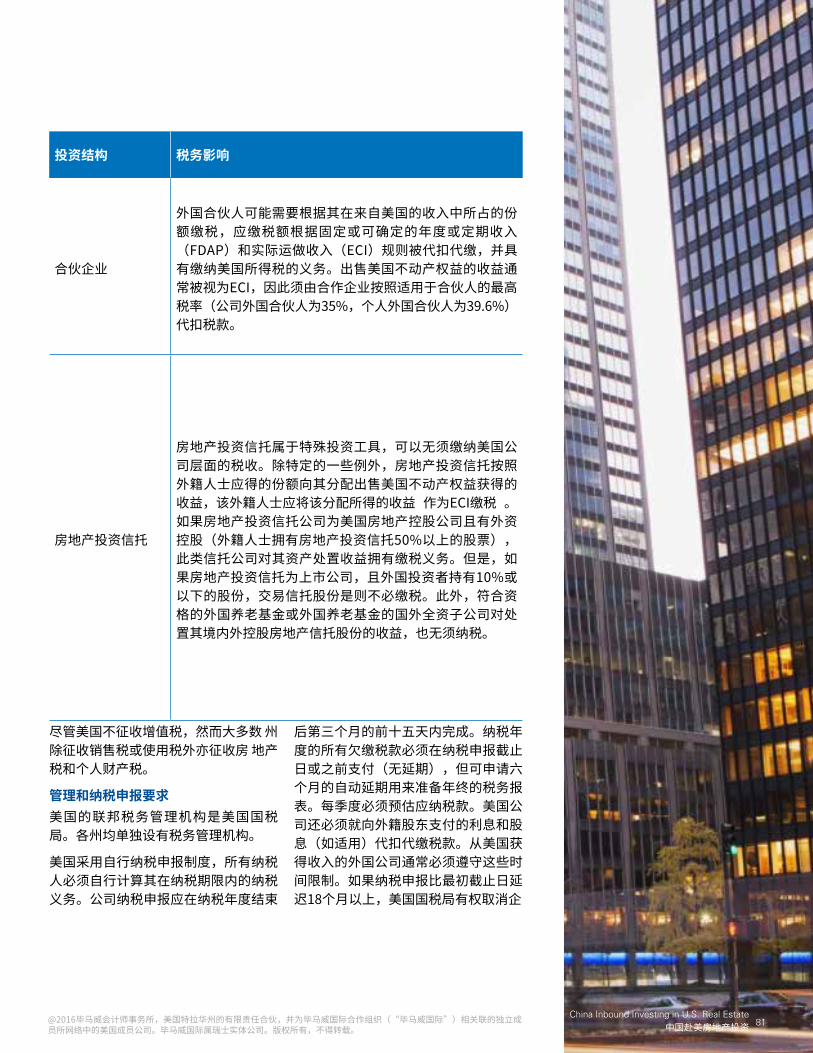
投资结构 税务影响
合伙企业
外国合伙人可能需要根据其在来自美国的收入中所占的份额缴税,应缴税额根据固定或可确定的年度或定期收入(FDAP)和实际运做收入(ECI)规则被代扣代缴,并具有缴纳美国所得税的义务。出售美国不动产权益的收益通常被视为ECI,因此须由合作企业按照适用于合伙人的最高税率(公司外国合伙人为35%,个人外国合伙人为39.6%)代扣税款。
房地产投资信托
房地产投资信托属于特殊投资工具,可以无须缴纳美国公司层面的税收。除特定的一些例外,房地产投资信托按照外籍人士应得的份额向其分配出售美国不动产权益获得的收益,该外籍人士应将该分配所得的收益 作为ECI缴税 。如果房地产投资信托公司为美国房地产控股公司且有外资控股(外籍人士拥有房地产投资信托50%以上的股票),此类信托公司对其资产处置收益拥有缴税义务。但是,如果房地产投资信托为上市公司,且外国投资者持有10%或以下的股份,交易信托股份是则不必缴税。此外,符合资格的外国养老基金或外国养老基金的国外全资子公司对处置其境内外控股房地产信托股份的收益,也无须纳税。
尽管美国不征收增值税,然而大多数 州除征收销售税或使用税外亦征收房 地产税和个人财产税。
管理和纳税申报要求美国的联邦税务管理机构是美国国税局。各州均单独设有税务管理机构。
美国采用自行纳税申报制度,所有纳税人必须自行计算其在纳税期限内的纳税义务。公司纳税申报应在纳税年度结束
后第三个月的前十五天内完成。纳税年度的所有欠缴税款必须在纳税申报截止日或之前支付(无延期),但可申请六个月的自动延期用来准备年终的税务报表。每季度必须预估应纳税款。美国公司还必须就向外籍股东支付的利息和股息(如适用)代扣代缴税款。从美国获得收入的外国公司通常必须遵守这些时间限制。如果纳税申报比最初截止日延迟18个月以上,美国国税局有权取消企
@2016毕马威会计师事务所,美国特拉华州的有限责任合伙,并为毕马威国际合作组织(“毕马威国际”)相关联的独立成员所网络中的美国成员公司。毕马威国际属瑞士实体公司。版权所有,不得转载。
81China Inbound Investing in U.S. Real Estate
中国赴美房地产投资

IRS claims to have the ability to deny the corporate taxpayer the benefit of deductions, meaning the foreign corporation risks being taxed on its gross income if it fails to file within 21.5 months of the end of its tax year.
Partnership tax returns are due on or before the 15th day of the fourth month following the close of the tax year. An automatic extension for five months is available. The partnership itself does not pay tax, so there are no quarterly estimated tax payments due. However, U.S. partnerships that have foreign partners are required to withhold and remit tax on a quarterly basis based on each foreign partner’s share of US source effectively connected income. Additionally, the partnership is required to withhold and remit tax in the event of the payment of interest, dividends, rents and other FDAP income to foreign partners.
Foreign individuals who receive US source effectively connected income or a loss from a partnership or who realize gain from the disposition of a U.S. real property interest are required to annually file a U.S. individual income tax return. Such foreign individuals also may be liable to make quarterly estimated tax payments with respect to partnership income.
U.S. and foreign corporations, U.S. partnerships and foreign individual are also subject to state income tax filings based on the location of the business.
RulingsPrivate letter rulings may be obtained from the IRS on many tax issues. The IRS usually will not consider taxpayer- specific rulings on issues that are factual in nature, but general guidance such as U.S. Treasury regulations, revenue rulings, notices and revenue procedures is available.
Foreign investorsA “foreign investor” in this section refers to both nonresident aliens and foreign corporations, unless indicated otherwise. A foreign investor generally is subject to U.S. income tax on two types of income:
– Certain U.S. source income that is not effectively connected with a U.S. trade or business
– Income that is effectively connected with a U.S. trade or business
A 30 percent tax rate and withholding usually are imposed on U.S. source income that is not effectively connected with a U.S. trade or business. In contrast, income that is effectively connected with a U.S. trade or business is subject to tax at the graduated corporate and individual tax rates as applicable. The highest federal corporate tax rate is currently 35 percent, and the highest individual tax rate is 39.6 percent. In addition, a foreign investor also may be subject to taxes on its disposition of real property and certain interests in real property. The highest capital gains tax rate on corporate entities is 35 percent, similar to ordinary income. The capital gains tax rate for individuals is 20 percent (25 percent for depreciation recapture).
Taxes on effectively connected incomeForeign corporate or individual investors are subject to U.S. federal income tax on income that is effectively connected with a U.S. trade or business. For this purpose, absent application of a treaty, the concept of permanent establishment does not apply. All U.S. source FDAP and capital gains are considered effectively connected to a U.S. trade or business if either of the following two tests is met:
– The income or gain is derived in the active conduct of a U.S. trade or business (the “asset use test”)
@2016 KPMG LLP, a Delaware limited liability partnership and the U.S. member firm of the KPMG network of independent member firms affiliated with KPMG International Cooperative (“KPMG International”), a Swiss entity. All rights reserved.

业纳税人的减税待遇,这意味着如果外国公司未能在纳税年度结束后的21.5个月内完成纳税申报,则可能按其总收入纳税。
合伙企业纳税申报应在纳税年度结束后第四个月的十五天内完成,可自动延期五个月。由于合伙企业自身不纳税,因此不必每个季度预估应纳税款。然而,有外籍合伙人的美国合伙企业必须按季度根据每名外籍合伙人的在美实际关联收入份额代扣代缴税款。此外,合伙企业必须就向外籍合伙人支付的利息、股息、租金和其他“固定或可确定的年度或定期收入”(FDAP)(如适用)代扣代缴税款。
从合伙企业获得来自美国的实际关联收入/损失的外籍个人或从处置美国不动产权益中实现收益的外籍个人每年必须申报美国个人联邦所得税。外籍个人还需按季度预缴合伙制企业收入。
美国境内及外国公司、美国合伙企业和外籍个人必须根据业务所在地申报州所得税。
裁定美国国税局私人信件裁定可对很多事宜作出裁定。美国国税局通常拒绝就具有事实性质的税务事宜向具体纳税人作出裁定,国税局的裁定一般是就如美国财政部法规、税收裁定、税款通知书和税务程序提供一般性的注释和引导。
外国投资者本部分的“外国投资者”是指非居民外国人和外国公司(除非另外说明)。外国投资者通常须就两类收入 缴纳美国所得税:
– 某些从美国获得的不与在美国开展的贸易或业务实际关联的收入;
– 与在美国开展的贸易或业务实际关联的收入。
从美国获得的不与在美国开展的贸易或业务实际关联的收入通常应缴纳 30%的代扣所得税。相比之下,与在 美国开展的贸易或业务实际关联的收入应按照适用的企业和个人所得税累进税率纳税。目前,联邦企业所得税最高税率为35%,个人所得税最高税率为39.6%加上3.8%的净投资收益税率。此外,外国投资者可能亦需就不动产处置和某些不动产权益纳税。公司实体的最高资本利得税率为35%,与普通收入相似。个人的资本利得税率为20%(25%的折旧回抵),加上3.8%的净投资收益税率。
实际关联收入税外国公司或个人投资者需要就与在美国开展的贸易或业务实际关联的收入缴纳美国联邦所得税和适当的州及地方税。为此,除税收协定另有规定,常设机构概念并不适用。如果满足以下两个测试,所有来源于美国的FDAP和资本利得都被视为与在美国开展的贸易或业务实际关联:
– 收入或收益源自美国贸易或业务活动(“资产使用测试”);
@2016毕马威会计师事务所,美国特拉华州的有限责任合伙,并为毕马威国际合作组织(“毕马威国际”)相关联的独立成员所网络中的美国成员公司。毕马威国际属瑞士实体公司。版权所有,不得转载。
83China Inbound Investing in U.S. Real Estate
中国赴美房地产投资

– The activities of the U.S. trade or business are a material factor in the realization of income (the “business activities test”)
FDAP income is a descriptive term relating to a class of income, rather than a highly technical definition. It includes items such as interest, dividends, rents, certain wages and annuities (fixed amounts, paid periodically) as well as items that are potentially equivalent to these income types, such as royalties paid in one lump sum. The U.S. resident payor’s perspective—and not the foreign taxpayer’s—is applied to determine whether any income item is FDAP.
The United States also generally applies a “force of attraction rule” and deems all income earned by a foreign investor from U.S. sources, other than FDAP and capital gains, to be effectively connected with a U.S. trade or business when that foreign investor conducts a U.S. trade or business.
As a practical matter, this rule may apply when a foreign seller has a U.S. trade or business and, unrelated to that U.S. trade or business, sells certain property within the United States. The income from the sale of unrelated property is treated as U.S. source income. The force of attraction rule treats such income as effectively connected income. This force of attraction rule does not apply when a treaty overrides U.S. domestic tax law and a permanent establishment concept is applied.
Foreign source income generally is not treated as effectively connected to a U.S. trade or business. However, it will be treated as effectively connected income if the foreign entity has an office in the United States to which the income is attributable, and the income consists of:
– Rents or royalties for the use of certain intangible property outside the United States or gains from the sale or exchange of such property; or
– Dividends, interest, or gains from the sale of stock and financial instruments derived from carrying on banking, financing or similar business in the U.S., or received by a corporation whose principal business is trading in stock and securities for its own account.
Generally, foreign investors are not subject to tax in the United States on capital gains, including gains from the sale of stock of other foreign corporations and gains from the sale of stock of U.S. domestic corporations, unless such gains are effectively connected with a U.S. trade or business. Special rules apply with respect to dispositions of certain U.S. real property and certain U.S. real property holding corporations that do result in the taxation of capital gains, however.
If a partnership engages in a U.S. trade or business, each foreign partner is treated as engaged in that trade or business and is subject to tax on an annual basis on its share of taxable income allocated by the partnership irrespective of cash distributions.
Foreign partners in such partnerships are generally subject to tax withholding by the partnership on their allocable share of the effectively connected taxable income of the partnership. A foreign partner that directly invests in a U.S. partnership must also annually file a U.S. income tax return.
FIRPTA—Dispositions of U.S. real property interestsFIRPTA treats a foreign investor’s income or gain (or loss) from the disposition of U.S. real property and certain investments in U.S. real property as if such gain or loss were effectively connected with a U.S. trade or business and taxed at regular income tax rates.
A U.S. real property interest (USRPI) generally includes any interest in real property located in the United States or in the U.S. Virgin Islands and any interest (other than solely as
@2016 KPMG LLP, a Delaware limited liability partnership and the U.S. member firm of the KPMG network of independent member firms affiliated with KPMG International Cooperative (“KPMG International”), a Swiss entity. All rights reserved.

– 美国贸易或业务活动是实现收入的重大因素(“业务活动测试”)。
FDAP是一个与收入分类有关的描述性术语,而非高度技术性定义。它包括利息、股息、租金、某些工资和年金(固定金额、定期支付)等项目,以及可能与这些收入类型等效的项目如一次性付清的特许权使用费。从美国居民纳税人而非外国纳税人的角度确定任何收入项目是否属于FDAP。
美国还通常采用“吸引力规则(force of attraction rule)”,将外国投资者从美国获得的除FDAP和资本利得外的所有收入视为在美国开展贸易或业务时取得的贸易或业务收入。
实际来看,当外国卖方在美国开展贸易或业务,并在美国出售与该贸易或业务无关的某财产时,本规则可能适用。出售与在美国开展贸易或业务无关的财产获得的收入被视为从美国获得的收入。吸引力规则将此类收入视作实际关联收入。当税收协定优于美国国内税收法律及常设机构概念适用时,本吸引力规则不适用。
来源于境外的收入通常不被视为与在 美国开展的贸易或业务实际关联。然而,如果外国实体在美国设有办事处且收入归属于该办事处,而且该收入包括以下项目,则该收入被视为实际关联收入:
– 在美国之外使用某些无形财产发生的租金或特许权使用费,或出售或交换此类财产产生的收益;
– 股息、利息或从出售股票及在美国开展银行、融资或类似业务衍生的金融工具中获得的收益,或以股票和证券交易作为主营业务的公司所获得股息、利息或收益。
一般情况下,外国投资者在美国无需在美国缴纳资本利得税,包括出售其他外国公司股票和美国本国公司股票所获得的收益,除非此类收益与在美国开展的贸易或业务实际关联。然而如果处置某些美国不动产和美国房地产控股公司的确导致了资本收益课税,适用特殊的规则。
如果合伙企业在美国从事贸易或业务,每名外籍合伙人都被视为从事该贸易或业务,且每年应按该合伙企业向其分配的应纳税所得的份额纳税,不考虑现金分配。此类合伙企业通常按照其外籍合伙人在合伙企业实际关联收入中的分配份额代扣税款。直接投资美国合伙企业的外籍合伙人每年必须申报美国所得税。
《1980年外国投资房地产税法》—处置美国不动产权益《1980年外国投资房地产税法》将外国投资者处置美国不动产和某些美国不动产投资所获得的收入或收益(或损失)视作与在美国开展贸易或业务实际关联的损益,并按照常规所得税税率征税。
美国不动产权益通常包括位于美国境内或美属维尔京群岛的不动产权益,以及
@2016毕马威会计师事务所,美国特拉华州的有限责任合伙,并为毕马威国际合作组织(“毕马威国际”)相关联的独立成员所网络中的美国成员公司。毕马威国际属瑞士实体公司。版权所有,不得转载。
85China Inbound Investing in U.S. Real Estate
中国赴美房地产投资
a creditor) in a domestic corporation that is or was a U.S. real property holding corporation (USRPHC) during the investor’s holding period. An interest in real property includes direct interests in U.S. real property, including land and improvements, mines, wells, natural deposits, and personal property associated with such types of real property. A U.S. real property holding corporation is a corporation that holds U.S. real property interests with a fair market value of at least 50 percent of the sum of the fair market values of its U.S. real property interests plus its interests in real property located outside the United States and its other assets that are used or held for use in a trade or business.
The transferee (buyer) of any U.S. real property interest is generally required to deduct and withhold (under special withholding rules) a tax equal to 15 percent of the amount realized by the foreign transferor (seller) upon disposition of the property and remit it to the IRS. Under the Protecting Americans from Tax Hikes (PATH) Act of 2015, which was signed into law on December 18, 2015, such withholding rate was increased to 15 percent (from the prior rate of 10 percent) for dispositions occurring after February 16, 2016. The foreign investor may enter into a prior agreement with the IRS to reduce the amount of withholding.
The withholding tax collected by the buyer is not the final tax liability. A refund may be claimed if the withholding tax exceeds the maximum tax liability.
The receipt of FIRPTA gain by a foreign corporation or individual requires the filing of a U.S. tax return.
Protecting Americans from Tax Hikes Act (PATH Act)Apart from the increase in FIRPTA withholding rates mentioned earlier, the PATH Act also contained a number of revisions to the FIRPTA rules. Among others, these provisions limit the application of FIRPTA to certain non-U.S. investors.
Increase in exempt publicly traded REIT ownership
Under pre-PATH Act law, a non-U.S. shareholder holding 5 percent or less of a publicly traded REIT is exempt from FIRPTA Tax on any gain from the disposition of such REIT or capital gain dividend paid by such REIT. Under the PATH Act, the 5 percent ownership threshold has been increased to 10 percent, allowing non-U.S. investors a larger ownership in such REITs without being subject to FIRPTA tax.
Exemption for qualified shareholders
Subject to certain restrictions, the PATH Act further provides a general exemption from FIRPTA Tax for REIT stock held by, and certain distributions made to, a “qualified shareholder” except to the extent that an investor in the qualified shareholder (other than an investor that itself is a qualified shareholder) actually or constructively holds more than 10 percent of the REIT stock.
A qualified shareholder includes certain foreign entities that (i) are publicly traded and eligible for the benefits of a comprehensive U.S. tax treaty, or (ii) are treated as partnerships for U.S. federal income tax purposes with partnership units representing greater than 50 percent of the value of all the partnership units regularly traded on the NYSE or NASDAQ markets. In addition, a qualified shareholder includes a foreign person that is a qualified collective investment vehicle that would be treated as a USRPHC
@2016 KPMG LLP, a Delaware limited liability partnership and the U.S. member firm of the KPMG network of independent member firms affiliated with KPMG International Cooperative (“KPMG International”), a Swiss entity. All rights reserved.

目前或曾经在投资者控股期间是美国不动产控股公司的本地公司的任何权益 (仅作为债权人除外)。不动产权益包括在美国不动产(这样的资产包括土地和改良物、矿山、井、天然沉积物及与不动产相关的个人财产)中的直接权益。美国不动产控股公司所持有的美国不动产权益的公平市价至少是美国不动产权益加上美国之外不动产和其他资产(被用于或持有以用于开展贸易或业务)的权益公平市价总和的50%。
美国不动产权益法规要求买方(付款方)通常扣除和(按照特殊代扣规则)代扣的方式,向美国国税局解缴相当于外国出让人(卖方)处置该不动产交易金额15%的税款。2015年保护美国人加税法案(PATH)在2015年12月18日签署生效,在该法案下,2016年2月16日之后发生的房产处置税率会提高到15%(从10%的现有税率)。外国投资者可与美国国税局达成事前协议,减少扣缴税额。由买方代扣的税额不是最终的应纳税额。如果代扣税额超出了最高应纳税额,可以申请退税。
外国公司或个人获得FIRPTA收益应在美国进行纳税申报。
保护美国人加税法案(PATH)除了前面提到FIRPTA预提率增加,PATH法案还包含对FIRPTA规则的进行了修改。其中的一些修改限制了非美国投资者对FIRPTA的申请。
提高对公开交易的房地产投资信托基金的所有权豁免的股权要求
在PATH生效之前,持有上市房地产投资信托股权5%以下的非美国股东,对信托支付的资本利得分红的处置输入是免税的。但根据PATH,5%的所有权门槛已经提高到10%。
对合格股东的豁免
在 一 定 限 制 下 , PATH还 对 拥 有 根 据FIRPTA所持有的房地产信托投资股权的“合格股东”,及对这些股东的某些投资分配,给予豁免。但这些股股东 (除了本身符合合格股东的规定)限制与实际或建设性持有房地产信托10%以上股权的股东。
一个合格的股东包括公开交易的某些外国实体,有资格获得一个全面的美国税收协定好处,被视为美国联邦所得税的定为合伙企业的外国实体。此外,满足一定要求的美国公司,也会被视为USRPHCs,成为合格股东。总之,新的立法提供了扩大符合条件的合格股东,包括某些其他类型的实体的权力。
@2016毕马威会计师事务所,美国特拉华州的有限责任合伙,并为毕马威国际合作组织(“毕马威国际”)相关联的独立成员所网络中的美国成员公司。毕马威国际属瑞士实体公司。版权所有,不得转载。
87China Inbound Investing in U.S. Real Estate
中国赴美房地产投资

if it were a domestic corporation and satisfies certain additional requirements. The new legislation also provides the Treasury with authority to expand the class of eligible qualified shareholders to include certain other types of foreign entities that are designated as qualified collective investment vehicles.
Expanded determination of domestically controlled REIT
A USRPI does not include any interest in a domestically controlled regulated investment company (RIC) or REIT (collectively, qualified investment entities or QIEs). A QIE is domestically controlled if foreign persons directly or indirectly own less than 50 percent of the value of the entity’s stock. It is often difficult, however, for QIEs to determine with certainty the U.S. or foreign status of all of their direct and indirect investors, particularly in the context of publicly traded entities.
The PATH Act provides three new rules and presumptions for purposes of determining whether a QIE is domestically controlled. First, a publicly traded QIE is permitted to presume (absent actual knowledge to the contrary) that a person that holds less than 5 percent of a class of publicly traded stock is a U.S. person. Second, any stock in a QIE that is held by a publicly traded QIE (or a RIC that issues redeemable securities) is treated as held by a foreign person, unless the other QIE is domestically controlled, in which case the stock is treated as held by a U.S. person. Lastly, stock in a QIE that is held by any other QIE not described above is treated as held by a U.S. person only to the extent the stock of the other QIE is (or is treated as) held by a U.S. person.
The new rules and presumptions could benefit existing investors in publicly traded QIEs as well as private REITs. The changes will make it easier for both publicly traded QIEs and private REITs to attain domestically
controlled REIT status, making them attractive options for FIRPTA tax planning for non-U.S. investors.
Exemption from FIRPTA for qualified foreign pension funds (QFPF)
The PATH Act provides that a capital gain dividend received by a QFPF (or by a foreign entity wholly-owned by a QFPF) from a REIT is not subject to US taxation. The PATH Act also exempts QFPFs from U.S. taxation on the disposition of an interest in a REIT or in a corporation which is a USRPHC.
A QFPF refers to any trust, corporation, or other organization or arrangement:
a) Which is created or organized under the law of a country other than the United States
b) Which is established to provide retirement or pension benefits to participants or beneficiaries that are current or former employees (or persons designated by such employees) of one or more employers in consideration for services rendered
c) Which does not have a single participant or beneficiary with a right to more than 5 percent of its assets or income
d) Which is subject to government regulation and provides annual information reporting about its beneficiaries to the relevant tax authorities in the country in which it is established or operates
e) With respect to which, under the laws of the country in which it is established or operates, (i) contributions to such organization or arrangement that would otherwise be subject to tax under such laws are deductible or excluded from the gross income of such entity or taxed at a reduced rate, or (ii) taxation of any investment income of such organization or arrangement is deferred or such income is taxed at a reduced rate.
@2016 KPMG LLP, a Delaware limited liability partnership and the U.S. member firm of the KPMG network of independent member firms affiliated with KPMG International Cooperative (“KPMG International”), a Swiss entity. All rights reserved.
扩大美国国内控制房地产投资信托的定义条件
USRPI不包括在美国国内控制的管理投资公司(RIC)或房地产投资信托(统称为“合格的投资主体”或“QIEs”)。QIEs被定义为外国人士直接或间接拥有该实体的50%以下的股权。但是在实际操作中,由于美国和外国投资者的直接间接投资,特别是上市公司复杂的股权架构,决定QIEs是非常困难的。
PATH法案为确定实体是否是QIE规定了三个新的条件和前提。首先,上市公司可以设定(除非实际情况相反)持有此类上市股票不到5%的投资人是美国的人。其次,任何一个被上市的QIE(或发行可赎回债券RIC)拥有股权的QIE, 被视为外国公司,除非其他QIE是美国国内控制公司。在这种情况下,股票可以被认为是由美国投资人拥有。最后,没有提及的其他QIE视为由美国投资人持有股权,但仅限于其他QIE(或被视为QIE)的股权是美国人士持有。
上市QIEs的现有投资者以及私人房地产投资信托投资者都可以从这些新的规则和前提下收益。这些变化使为上市QIEs和私人房地产投资信托容易达到国内房地产投资信托受控的要从而吸引非美国投资者进行FIRPTA税收筹划。
FIRPTA对境外养老基金的豁免
PATH法规定,境外养老基金从(或境外养老基金投资的外国实体)房地产投资信托获得资本利得是不向美国纳税的。该PATH法还对境外养老基金的房地产投资信托权益,或USRPHC权益的处置收入给予豁免 。
境外养老基金是指任何信托,法人或其他组织形式:
a)根据非美国国家的法律成立或组成,
b)成立的目的是为一个或多个企业的参与的现任或前任员工(或员工的指定受益人)提供退休或养老金,
c)没有一个参与者或受益人拥有超过百分之五的资产或收入,
d)基金受政府管制,并为当地税务机关提供收受益人年度信息报告,及
e)根据其所建立或经营所在国的法律,(i)该实体从毛收入中减免的收入以及降低的纳税率,或(ii)该实体的任何投资收入的税收递延或此类收入的降低税率。
@2016毕马威会计师事务所,美国特拉华州的有限责任合伙,并为毕马威国际合作组织(“毕马威国际”)相关联的独立成员所网络中的美国成员公司。毕马威国际属瑞士实体公司。版权所有,不得转载。
89China Inbound Investing in U.S. Real Estate
中国赴美房地产投资

Withholding taxes on certain U.S. source income
Certain types of U.S. source income, which are not effectively connected with a U.S. trade or business, are subject to 30 percent tax and withholding (unless a lower treaty rate applies). The principal types of this income include:
– FDAP income – e.g., interest and dividends
– Certain original issue discount on debt obligations when payments of principal or interest are received or when the obligations are sold
– Certain gains from the sale of patents and other intangible property to the extent the proceeds are contingent on the future productivity, use, or disposition of the property.
The receipt of FDAP income by a foreign corporation or individual does not require the filing of a U.S. tax return as long as proper withholding is done at source.
Other types of U.S. source income that are not effectively connected with a U.S. trade or business and are not subject to the 30 percent withholding regime include:
– Gains from the sale of capital assets and other property, except U.S. real property interests
– Interest received on certain deposits with banks and certain other financial institutions
– Interest on certain obligations issued by U.S. state and local governments
– Original issue discount on certain short-term debt obligations.
Subject to certain transition rules, the recently enacted Foreign Account Tax Compliance Act (FATCA) legislation imposes a 30 percent withholding tax on certain payments made after July 1, 2014,
to (1) foreign financial institutions (FFIs) that fail to comply with certain new disclosure requirements concerning U.S. accounts and (2) foreign entities (other than FFIs) that fail to certify they have no substantial U.S. owners or, alternatively, disclose the identities of such owners. A substantial U.S. owner generally means a U.S. individual, trust, partnership, or estate that owns directly or indirectly more than 10 percent of a foreign entity. A substantial U.S. owner also includes a privately held U.S. corporation that owns more than 10 percent of a foreign entity.
Payments subject to this new withholding regime include FDAP income that is not effectively connected to a U.S. trade or business and gross proceeds from the sale or other disposition of a stock or security that can give rise to payment of U.S. source dividends or interest. The purpose of this new withholding regime is to expand reporting by FFIs and foreign entities other than FFIs of U.S. persons’ offshore investment activities.
Sourcing of income rulesThe sourcing rules for gross income are organized by categories of income, including interest, dividends, personal service income, rents, royalties, and gains from the disposition of property. Dividends and interest generally are sourced based on the residence of the payer. In the case of a corporate payer, the determination is based on whether the corporation is domestic or foreign.
Thus, interest and dividends paid by a domestic corporation generally are considered U.S. source. In contrast, dividends and interest paid by a foreign corporation generally are considered foreign source. Rents and royalties are sourced based on where the underlying property is used. Numerous exceptions apply to these general rules.
@2016 KPMG LLP, a Delaware limited liability partnership and the U.S. member firm of the KPMG network of independent member firms affiliated with KPMG International Cooperative (“KPMG International”), a Swiss entity. All rights reserved.

就某些来源于美国的收入代扣税款与在美国开展的贸易或业务不实际关联的某些来源于美国的收入需要缴纳30%的代扣税款(除非双边税务协定提供较低的税率)。此类收入的主要类型包括:
– FDAP收入,如利息和股息;
– 当收到本金或利息款项或债权被出售时,债券的某些原发行折扣;
– 出售专利及其他无形财产获得的某些收益,且收益取决于该财产未来的生产率、使用或处置。
只要已在税源完成适当代扣,外国公司或个人获得FDAP无需在美国进行纳税申报。
与在美国开展的贸易或业务不实际关联且适用于30%代扣税率的其他来源于美国的收入类型包括:
– 出售除美国不动产权益外的固定资产及其他财产获得的收益;
– 从银行和某些其他金融机构收到的存款利息;
– 美国州政府和地方政府发行的某些债券的利息;
– 某些短期债券的原发行折扣。
除适用于某些过渡规定外,近日颁布的《海外账户税收合规法案》(Foreign Account Tax Compliance Act)对2014年7月1日后支付的某些款项执行30%的代扣税率,该规定适用于(1)未遵守
与美国账户相关的某些新的披露要求的外资金融机构;及(2)未能证明不存在“重大美国所有者(substantial U.S. owner)”或未能披露这些所有者身份的外国实体(外资金融机构除外)。“重大美国所有者”一般指直接或间接拥有外国实体超过10%权益的美国个人、信托、合伙企业或不动产,亦包括拥有外国实体的超过10%权益的私营美国公司。
须遵守这一新代扣制度的款项包括与美国贸易或业务不实际关联的FDAP,以及可引起来源于美国的股息和利息支付的股票或债券出售或其他处置所获得的总收益。该新代扣制度的目的在于详细报告外资金融机构和美国人士投资的外资金融机构的离岸投资活动。
收入来源规则收入来源规则按收入类别确定,包括 利息、股息、个人服务收入、租金、特许权使用费和从财产处置中获得的收益。股息和利息一般取决于支付方所在地。如果支付方是公司,则根据该公司是国内公司还是外国公司来确定。因此,由国内公司支付的利息和股息通常被视为来源于美国。相对地,由外国公司支付的股息和利息通常被视为来源于外国。租金和特许权使用费的来源取决于相关财产在何处使用。除上述一般性规则之外,还存在多种例外情况。
@2016毕马威会计师事务所,美国特拉华州的有限责任合伙,并为毕马威国际合作组织(“毕马威国际”)相关联的独立成员所网络中的美国成员公司。毕马威国际属瑞士实体公司。版权所有,不得转载。
91China Inbound Investing in U.S. Real Estate
中国赴美房地产投资

Transfer pricingThe IRS is authorized to make transfer pricing adjustments in transactions between commonly controlled entities if the price set by the parties is not at arm’s length. The rules apply to organizations that are owned or controlled, either directly or indirectly, by the same interests. For example, the IRS is authorized to make transfer pricing adjustments between a foreign investor and its wholly owned domestic corporation.
The IRS is authorized to allocate income, deductions and other tax items between commonly owned or commonly controlled organizations as necessary to prevent evasion of taxes or to clearly reflect the parties’ income. In the case of a transfer or license of intangible property, the income from the transfer must be “commensurate with the income attributable to the intangible.” Thus, the transfer pricing rules generally attempt to identify the respective amounts of taxable income of the related parties that would have resulted if the parties had been unrelated parties dealing at arm’s length. Advance pricing agreements addressing transfer pricing issues may be obtained from the IRS.
If a foreign shareholder owns directly or indirectly stock representing at least 25 percent of the vote or value in a U.S. corporation, the U.S. corporation must complete and file Form 5472 (“Information Return of a 25 percent Foreign-Owned U.S. Corporation or a Foreign Corporation Engaged in a U.S. Trade or Business (Under Sections 6038A and 6038C of the Internal Revenue Code)”), on an annual basis, to report certain transactions with related foreign and U.S. parties (e.g., sales of inventory, interest payments made or received). This form allows the U.S. tax authorities to properly audit the transfer pricing of such transactions. The failure to file one or more Form(s) 5472 may result in a penalty of USD10,000 for
each such failure. The penalty also can be applied for failure to maintain adequate records.
A foreign corporation engaged in a U.S. trade or business also is required to file Form(s) 5472 to report certain transactions with related foreign and U.S. parties.
Thin capitalization: earnings-stripping rulesThe United States applies earnings- stripping rules to certain taxpayers, including U.S. corporations owned by foreign corporations. If certain other conditions are met, a corporation’s interest deduction is limited when the corporation makes a substantial (in proportion to its income) interest payment to a foreign related person who is not subject to U.S. tax in whole or in part on that interest payment. A corporation’s interest deduction is also limited when the corporation makes a substantial interest payment to an unrelated U.S. or foreign person who is not subject to U.S. gross basis taxation in whole or in part on that interest payment, provided that a foreign related person has guaranteed the corporation’s underlying debt. A foreign person is not subject to U.S. gross basis taxation in whole or part if, for example, the foreign person is eligible to claim a reduced or zero rate of withholding under a U.S. tax treaty.
A corporation will be subject to the earnings-stripping rule if it has:
– Excess interest for the tax year (net interest expense in excess of 50 percent of the adjusted taxable income), and
– A debt-to-equity ratio at the end of the taxable year in excess of 1.5 to 1.
If a corporation meets these requirements, any interest paid to a related person will be treated as disqualified interest and disallowed as a deduction to the extent of the excess interest expense for the year. Disallowed interest may be carried over to future years.
@2016 KPMG LLP, a Delaware limited liability partnership and the U.S. member firm of the KPMG network of independent member firms affiliated with KPMG International Cooperative (“KPMG International”), a Swiss entity. All rights reserved.

转让定价如果受共同控制的实体双方设定的交易价格并非建立在公平基础上,IRS有权对交易做出转让定价调整。这些规则适用于由相同利益方直接或间接拥有或控制的组织。例如,IRS有权对外国投资者与其美国国内独资公司做出转让定价调整。
IRS有权(根据需要)在受共同拥有或控制的组织之间分配收入、扣除额和其他税项,以防止逃税或更清 晰地反映各方的收入。在对无形资产进行转让或授权的情况中,转让收入必须“与源自无形资产的收入相称”。因此,转让定价规则通常为确定交易方作为非关联方公平交易时的应税收入。
处理转让定价问题的预先定价协议可从IRS获得。如果一名外国股东直接或间接拥有的股票相当于一家美 国公司的至少25%投票权或价值,该美国公司每年均须填妥并递交“5472 表”(“外资拥有25%权益的美国公司或从事美国贸易或业务的外国公司的资料申报(根据《国内税收法典》第6038A和第6038C条)”),以申报与外国和美国关联方进行的交易,例如出售存货、支付或收取的利息。美国税务机关通过“5472表”能够妥善地审查该等交易的转让定价。如未能递交一份或多份“5472表”,每次可能会被罚款10,000美元。记录保存不足亦可能被罚款。
从事美国贸易或业务的外国公司亦须递交“5472表”,以申报与外国和美国关联方进行的交易。
资本弱化:收益剥离原則美国税法的收益剥离规则会对某些纳税人的利息扣除额将有一定的限制,这些纳税人包括外国公司拥有的美国公司。如果符合若干其他条件,当公司向外国关联人士支付大额利息(按其收入比例),而该人士不须就该利息的所有或部分缴纳美国税项时,公司的利息扣除额将受到限制。即使是公司向非关联的美国或外国人士支付大额利息,而该人士不须就该利息付款的所有或部分缴纳按总额计算的美国税项且一名外国关联人士已担保公司的相关债务,公司的利息扣除额也会受到限制。如果外国人士根据某税收协议符合减免或免缴预扣税资格,该外国人士不须整体或部分地缴纳按总额计算的美国税项。
如果公司具备以下条件,应遵从收益剥离原则和考虑对税务的影响:
– 在该纳税年度有超额利息(净利息支出 超 出 调 整 后 的 应 纳 税 所 得 的50%);及
– 在应课税年度结束时的债务股本比超过1.5﹕1。
如果公司满足这些要求,任何付给关联方的利息都将视同不符合资格的利息,而不得作为超额利息予以抵扣。不允许扣除的利息递延到将来的年度。
@2016毕马威会计师事务所,美国特拉华州的有限责任合伙,并为毕马威国际合作组织(“毕马威国际”)相关联的独立成员所网络中的美国成员公司。毕马威国际属瑞士实体公司。版权所有,不得转载。
93China Inbound Investing in U.S. Real Estate
中国赴美房地产投资

Check-the-box rules and domestic reverse hybridsUnder U.S. check-the-box rules, a foreign investor has flexibility with respect to an “eligible entity” and may elect how an entity will be classified for U.S. federal income tax purposes. For example, an investor may structure its investment as a “domestic reverse hybrid entity” (an entity that is classified as a corporation for U.S. federal tax purposes but as a partnership under foreign law). This structure may allow startup losses to flow through to the entity’s foreign investors for foreign tax purposes while retaining the benefits of operating through an entity classified as a corporation for U.S. federal income tax purposes, which may also provide an opportunity to introduce cashless leverage into such entity. Special rules apply with respect to certain aspects of the taxation of domestic reverse hybrid entities.
Deferral of deductionsA deduction for expenses payable to certain related foreign persons generally may need to be deferred until the foreign person reflects the payment in income (when received).
TreatiesIn addition to the U.S. and foreign statutory rules for the taxation of foreign income of U.S. persons and the U.S. income of foreign nationals, bilateral income tax treaties limit the amount of income or withholding tax that may be imposed by one treaty partner on residents of the other treaty partner. For example, treaties often reduce or eliminate withholding taxes imposed by a treaty country on certain types of income, such as dividends, interest and royalties, paid to residents of the other treaty country. For another example, treaties set the standard for taxation of the business activities of a resident of the other treaty country (known as a “permanent establishment”).
Treaties also include provisions governing the creditability of taxes imposed by the treaty country in which income is earned in computing the amount of tax owed to the other country by its residents with respect to that income. Treaties also provide procedures under which inconsistent positions taken by the treaty countries on a single item of income or deduction may be mutually resolved by the two countries. The United States has a network of bilateral income tax treaties covering more than 60 countries, including China (PRC). This network includes all of the OECD member countries and encompasses many other countries with significant trade or investment with the United States.
The United States has entered into a series of bilateral tax treaties that eliminate withholding tax on dividends paid by one corporation to another corporation that owns, generally, at least 80 percent of the stock of the dividend paying corporation (often referred to as “direct dividends”), provided that certain conditions are met. The elimination of withholding tax under these circumstances is intended to further reduce the tax barriers for direct investment between the treaty countries.
The benefit of lower withholding rates under a tax treaty can be denied if payments are made to partnerships or certain hybrid entities, for instance certain entities that are not treated as fiscally transparent by the interest holder’s state of residence. This will be the case with respect to a foreign partner of a partnership if the following circumstances are present:
– The partner or member of the entity is not subject to tax on the payment by the partner or member’s residence jurisdiction
– The tax treaty does not contain a provision that addresses the treatment of items paid to partnerships
@2016 KPMG LLP, a Delaware limited liability partnership and the U.S. member firm of the KPMG network of independent member firms affiliated with KPMG International Cooperative (“KPMG International”), a Swiss entity. All rights reserved.

纳税实体类型选择规则和混合实体(domestic reverse hybrids)根据美国的纳税实体类型选择规则,外国投资者可以灵活地选择作为“符合条件的实体”,并选择在美国 联邦所得税缴纳方面如何对实体进行分类。例如,投资者可将投资设为“混合实体”(按照美国联邦所得税规定属于公司,而按照外国法律属于合伙企业)。这种结构可使得投资启动损失归属实体的外国投资者,作为外国税收的抵扣项,而在同时实体在缴纳美国联邦税方面仍拥有作为公司类实体运营的优势,此外还有引入无现金杠杆(cashless leverage)的机会。要值得注意的是混合实体在某些纳税事务方面适用特殊的规则。
扣除递延 通常情况下,应付某些外国关联方的费用的扣除,可能需要递延至外国关联方将所付款项计入收入(收到付款)时。
税收协定除了适用于对美国人所获外国收入和外国侨民所获美国收入征税的美国和外国法规之外,双边所得税协定也限制协定一方可向另一方居民征收的所得税或预扣税的额度。例如,按照税收协定,缔约国对支付给另一缔约国居民的某些收入(例如股息、利息和特许权使用 费),经常降低或免除征收预扣税。又比如税收协定对另一缔约国居民(即 “常设机构”)在缔约国从事的商业活动制定纳税标准。
税收协定还包含了税收抵免规定,某缔约国居民企业来源于另一缔约国的所得,应缴纳收入发生国的税款属于税收抵免范围。当某项收入或扣除额在两个缔约国税务处理不一致时,税收协定还规定了两国达成谅 解的程序。
美国与60多个国家/地区,包括中国,签订了双边所得税协定。协定范围覆盖所有的经济合作与发展组织(OECD)成员国,并覆盖许多与美国进行重大贸易或投资的其他国家。
美国签署了一系列双边税收协定,按照协定只要符合特定的条件,公司向持有该公司通常至少80%股权的另一公司支付的股息(通常指“直接股息”)即可免除预扣税。在这些情况下免除预扣税,有助于进一步减少缔约国之间直接投资的税收障碍。
如果向合伙企业或若干混合实体(如 不被权益持有人的居住州视为财政透明)支付款项,则可能不允许适用税收协定下的较低预扣税率。如果出现以下情况,合伙企业的外国合伙人就符合上述情况:
– 根据税收协定合伙人或实体的成员无须为合伙人或实体成员所属辖区内的支付款项纳税
– 税收协定对支付给合伙企业的项目未做明文规定
@2016毕马威会计师事务所,美国特拉华州的有限责任合伙,并为毕马威国际合作组织(“毕马威国际”)相关联的独立成员所网络中的美国成员公司。毕马威国际属瑞士实体公司。版权所有,不得转载。
95China Inbound Investing in U.S. Real Estate
中国赴美房地产投资

– The partner or member’s residence jurisdiction does not impose a tax on distribution of the item to the partner or member of the entity.
Special rules also allow the U.S. tax authorities to deny the benefit of lower withholding rates under an applicable income tax treaty in those cases where it has been determined that the treaty resident recipient of the U.S. source FDAP income is acting as a conduit entity in a conduit financing arrangement.
Treaties also include limitation of benefits provisions. In order for a treaty to apply, the recipient of the income must meet certain requirements as to residency or operations of their business. This
prevents treaty shopping. For example, if the beneficial owner of the income is not in a country in which the United States has an income tax treaty (e.g., Hong Kong), then the use of an offshore holding company in between the beneficial owner and the United States that is located in a treaty country (e.g., the United Kingdom) would not result in treaty benefits pursuant to the U.K./U.S. income tax treaty.
Pursuant to the income tax treaty between the United States and China, interest and dividend withholding that is treated as FDAP can be reduced from 30 percent to 10 percent when received by a Chinese individual or corporation that is entitled to benefits under the treaty.
@2016 KPMG LLP, a Delaware limited liability partnership and the U.S. member firm of the KPMG network of independent member firms affiliated with KPMG International Cooperative (“KPMG International”), a Swiss entity. All rights reserved.

– 合伙人或实体成员所属辖区不向分配给合伙人或实体的成员的项目征税。
在特殊情况下,即使是符合双边税收协定的居民定义,如果有其他事实与情况证明协定国居民收款人是刻意运用中介实体来享受一些双边税收协定的优惠待遇,美国税务机关可以运用特别规则来决定在此情况下不适用所得税协定中的较低预扣税率。
协定还包括优惠条款的限制。为了使得协定适用,收入的所得者必须满足居住或业务运营上的一定要求。这可防止双
边税收协定交易。例如,如果收入的所得拥有者并非在与美国签订收入税收协定的国家(如香港),使用位于实益拥有人与美国之间的缔约国(如英国)的离岸控股公司,根据英国/美国的所得税协定,此类的公司或个人难以享受协定优惠。
根据美国和中国之间的所得税协定,协定适用的中国个人或公司获得被视为FDAP的利息和股息时,其利息和股息的预扣税率从30%降至10%。
@2016毕马威会计师事务所,美国特拉华州的有限责任合伙,并为毕马威国际合作组织(“毕马威国际”)相关联的独立成员所网络中的美国成员公司。毕马威国际属瑞士实体公司。版权所有,不得转载。
97China Inbound Investing in U.S. Real Estate
中国赴美房地产投资

Valuation considerations by asset type – Office: property is typically viewed as central business district (CBD) or suburban. When valuing office properties, investors typically rely upon the income and market approaches. Under the income approach, the discounted cash flow method is relied upon in most cases for multi-tenant offices.
– Industrial: property can be classified as flex/R&D or warehouse typically. Investors tend to focus on credit quality and length of lease term to drive investment returns. All three valuation approaches will be considered, especially in build-to- suit industrial properties that have minimal comparables.
– Retail: property can be classified as strip-center, in-line, power center, or regional mall. Depending on what asset class within retail is being valued, inputs/assumptions can vary based on the quality of store/tenant. Typically, the income or market approaches are relied upon.
– Multifamily: property can vary from market rate to low-income/affordable housing. Student housing and senior living are sometimes classified as apartment/multifamily, but should really be considered outside of this asset class. Typically, the income or market approach will be relied upon given the short-term nature of the leases and availability of comparable sales, respectively.
– Hotel/Lodging: property types can range from economy (no restaurant/ food and beverage department) to luxury and resort (depending on amenities). Typically, the income and market approaches are relied upon.
Office – Valuation drivers for office properties are the various market leasing assumptions (rent, TI’s, downtime, vacancy, expense growth, etc.) relied upon in a multi-tenant building. Valuation professionals will typically use Argus to model discounted cash flow (DCF) models in multi- tenant buildings given the roll-over associated with leasing.
– Typical discount cash flow assumptions will include a holding period of 7 to 10 years, assuming reversion of the property one year after holding. Terminal cap rates can be impacted if significant roll-over occurs in the reversion year.
Typical company types that invest in institutional real estate – Life Insurance Companies, Pension Funds, Public Real Estate Companies, Pension Fund Advisors, REITs, and Public C Corporations.
Industrial – Similar to office, industrial properties are underwritten based on market leasing assumptions. In single tenant industrials, the credit-worthiness of the tenant and length of term can drive investment rates significantly.
Valuation modeling norms in the U.S.
@2016 KPMG LLP, a Delaware limited liability partnership and the U.S. member firm of the KPMG network of independent member firms affiliated with KPMG International Cooperative (“KPMG International”), a Swiss entity. All rights reserved.

各类资产的评估考虑因素 – 办公地产:办公地产典型地被认为是
中央商务区(CBD)或郊区的地产。在评估办公地产时,投资者一般依赖租金收益和市场现状的俩种方法。在运用租金收益方法时,评估多租户办公财产的多数情况均依赖贴现现金流量。
– 工业地产:工业地产典型地被归类为多用途/研发或仓库。投资者常常关注信用质量以及租赁期限是否有利于提高投资收益。工业地产应考虑各种可行的评估方法,特别对于不大可能拥有可比较个案的量身定制的工业地产。
– 商铺地产:商铺地产可归类为沿街、前店、购物中心或区域性购物商场。根据评估的商铺资产类别,输入值/假 设 会 因 商 场 / 承 租 人 的 质 量 而 不同。商铺地产一般依赖租金收益和市场现状的俩种方法。
– 多 户 住 宅 ( 公 寓 ) 地 产 : 多 户 住 宅 (公寓)地产有多种类型,如商品房乃至低收入/经济适用房。学生住房及老年人住房有时被归类为公寓/多户住宅地产,但不应考虑在此种资产类别之内。鉴于租约的短期性和存在可比较销售数据,一般会采用租金收益和市场现状的俩种方法对多户住宅(公寓)地产进行评估。
– 酒店/宾馆:酒店/宾馆地产有经济型 (不含餐馆/餐饮部)、奢侈型和度假型(取决于健身购物等附属设施)。一般也采用租金收益和市场现状的俩种方法。
办公地产办公地产的评估主要从基于多租户建筑物的各种市场租赁假设(房租、租户装修、闲置期、空缺期、成本上升等)着手。鉴于租赁的续期特性,评估专业人员往往使用Argus对多租户建筑物的贴现现金流量(DCF)模型进行建模。
典型的贴现现金流量假设包含7-10年的置存期,假设置存期过后一年的复原期。如果复原期间发生重大展期,那么边际利率上限会受到影响。
投资机构房地产的典型公司类型 – 人寿保险公司、养老基金公司、公共
房地产公司、养老基金顾问、房地产投资信托公司以及C类型公共公司。
工业地产 – 与办公地产相似,工业地产根据市场
租赁假设的基础上进行评估。在单一承租人工业地产中,承租人的信誉及租赁期限都能大大影响投资率。
资产评估模型 标准
@2016毕马威会计师事务所,美国特拉华州的有限责任合伙,并为毕马威国际合作组织(“毕马威国际”)相关联的独立成员所网络中的美国成员公司。毕马威国际属瑞士实体公司。版权所有,不得转载。
99China Inbound Investing in U.S. Real Estate
中国赴美房地产投资

– Discounted cash flow and direct capitalization methods are common, the latter if the property has a single tenant and a lease term longer than 5 years remaining.
Retail – Depending on the retail property type, the credit-worthiness of the tenant and store sales can have significant valuation impacts on retail properties. Generally, U.S. retail properties will have lease clauses that derive rent based on a percentage of gross store sales; which in well-performing markets can drive cash flows.
– Tenant improvements (TIs) need to be underwritten appropriately based on the finishes required by the tenant. Higher-end stores will negotiate rent based on TIs provided by the landlord, which can impact cash flow projections.
– Modeling is typically done in Argus, assuming that the retail center is a multi-tenant building with a number of different leases and options to enter into the valuation considerations.
Multifamily – Rent and expense modeling are key in multifamily valuation. It is essential to understand market demand and vacancy for properties, given renters’ need for amenities and proximity to transportation/ work. Depending on property type (garden, high-rise, etc.), expenses can fluctuate significantly and it is important to understand property management and expense growth estimates.
– Given the short-term nature of typical rental leases in the U.S., most investors will value this property type with a DCF, assuming a 5- to 10- year hold. Since there are many multifamily properties in metropolitan markets, a market approach on a dollar per unit will be relied upon often as well. In applying the market approach, it is key to understand the number of units at the comparables as well as amenities offered and age of the comparables as these drive rental demand.
Hotel/lodging – Room rate and occupancy are the key drivers in hospitality valuation. Most professionals will assume cash flow projections as a percentage of total room revenue or on an occupied room basis.
– It is important to understand the operating nature of the hotel as well as benchmark against historical performance. The hospitality market in major metro areas is relatively transparent with completive reports available that benchmark your property against competitive properties in the market. It is essential to understand what the “comp set” is comprised of in terms of number of keys (rooms), occupancy type (transient, business, etc.), and amenities.
– Valuation models will usually be done in Excel as Argus does not have the ability to benchmark all the departmental revenues and expenses that are associated with a hotel.
@2016 KPMG LLP, a Delaware limited liability partnership and the U.S. member firm of the KPMG network of independent member firms affiliated with KPMG International Cooperative (“KPMG International”), a Swiss entity. All rights reserved.
– 贴现现金流量和直接资本化两种方式都很常见,如果地产有单一承租人,而且剩余租赁期限超过5年,则采用直接资本化法。
商铺地产 – 根据不同的商铺地产类型,承租人的
信誉和商店销售额都会对商铺地产的评估造成重大影响。一般来说,美国商铺地产的租赁条款规定按商店销售总额的比例收取租金;地产处于良好的商业地段,有助于提高现金流量。
– 租户装修须根据承租人的装修要求适当地进行评估。较为高端的店铺会根据房东提供的装修情况来协商租金,很可能影响现金流量预测。
– 假设商铺中心是含有多种不同租赁和选项的多租户建筑物,其评估建模一般用Argus进行。
多户住宅(公寓)地产 – 租金和开支建模是多户住宅(公寓)
地产评估的关键。鉴于承租人对附属设施和交通/工作便利的需求,了解市场需求和地产空缺期非常重要。视地产类型(园 林风格/高层等)的不同,开支会有很大幅度的浮动,评估应兼顾物业管理和开支增加估计。
– 鉴于美国租赁期限的短期性特点,大多数投资者采用贴现现金流量的方式对此类地产进行评估(假设5-10年的置存期)。因大都市拥有丰富的多户住宅(公寓)地产,因此也经常采用市场现状法(统一采用单价)评估。在运用市场法时,应掌握可比实例物业的面积数量、提供的设施、物业年限,因为这些因素影响租赁需求。
酒店/宾馆 – 酒店评估的重要考虑因素包括房费和
入住率。大多数专业人员将预测的现金流量假设为总房费的百分数,或者以入住率为基础。
– 应了解酒店的经营性质和历史业绩基准。因为可获得市场上可比竞争性地产的完整报告,所以主要都市区域的酒店市场行情相对比较清晰。而且有必要理解“竞争对手(comp set)”的情况,包括其(房间)钥匙数量、入住类型(过往旅客、商务旅客等)、以及附属设施。
– 评估模型一般以Excel进行,因为Argus不能比较酒店所有部门的收益和开支。
@2016毕马威会计师事务所,美国特拉华州的有限责任合伙,并为毕马威国际合作组织(“毕马威国际”)相关联的独立成员所网络中的美国成员公司。毕马威国际属瑞士实体公司。版权所有,不得转载。
101China Inbound Investing in U.S. Real Estate
中国赴美房地产投资

KPMG’s Global China Practice (GCP) is a community of professionals known for providing high quality, consistent services to China inbound and outbound investors around the world. With teams of China experts, cross-border investment advisors and Mandarin speakers in strategic investment locations around the world, the GCP brings China insights and China investment experience to our Chinese clients investing overseas and to our multinational clients interested in investing or expanding in the China marketplace.
The GCP connects our network of more than 50 local China practices so that our clients are never far from a China-focused professional.
Through our GCP and KPMG LLP’s U.S. Real Estate Practice, KPMG can assist with every stage of the asset and investment life cycle and offers experience in working with all levels of stakeholders throughout the real estate industry.
Whether your focus is local, national, regional or global, we can provide the right mix of experience to support and enhance your needs and ambitions. Our knowledgeable real estate professionals focus on providing informed perspectives and clear solutions, drawing experience from a variety of backgrounds including accounting, tax, advisory, banking, regulation and corporate finance.
Our client focus, commitment to excellence, global mindset and consistent delivery build trusted relationships that are at the core of our business and reputation.
Our extensive experience serving all segments of the real estate industry includes assisting:
– Real estate investment and private equity fund management
– Real estate investment trusts (REITs)
– Institutional investors and advisers, including pension and sovereign wealth funds
– Real estate operating companies
– Real estate service companies
– Lenders and intermediaries
– Developers
– Construction companies and engineering firms
– Hospitality companies
– Homebuilders
An integrated approachIf you are in the business of real estate investing, our integrated approach to the investment life cycle helps to deliver results. How? Our professionals have an in-depth understanding of the industry and a global network to draw localized knowledge. This means our professionals are well-placed to advise you through the investment life cycle.
KPMG services to Chinese investors
The U.S. market is highly complex across a number of important dynamics—legal, regulation, taxation—and the most prudent foreign investors spend substantial energy on setting up a network of local advisers to ensure they are executing their strategy properly and identifying the best approaches to this market. Any wrong step can significantly affect their returns.
Roger Power, Audit Partner, Leader,
U.S. - China Real Estate Initiative, KPMG LLP
“
“
@2016 KPMG LLP, a Delaware limited liability partnership and the U.S. member firm of the KPMG network of independent member firms affiliated with KPMG International Cooperative (“KPMG International”), a Swiss entity. All rights reserved.

毕马威全球中国业务发展中心(GCP)的专业服务团队遍布世界各地,为在中国市场投资的跨国企业和扩展海外业务的中国企业,提供优质一致的服务。中国业务发展中心在全球各投资热点地区配备了中国专家团队、跨国投资顾问、以及深谙中文的专业人士,为投资海外的中国客户,以及有兴趣在中国市场投资或扩 展业务的跨国公司,提供有关中国市场的精辟见解和投资经验。
毕马威全球中国业务发展中心将50多个当地中国业务团队紧密地联系在一起,以便客户随时随地可以享受到我们中国专家团队的服务。
通过中国业务发展中心和毕马威美国分所房地产业务部门,毕马威能够提供与分享房地产行业关于资产与投资 周期的各个阶段的建议与经验。无论您专注的市场是当地、整个国家、区域还是全球,我们都能提供恰当的经验,以支持和强化您的需求和远大目标。知识渊博的房地产专业人员,具备会计、税务、咨询、银行、法规和企业融资等各种背景,致力于提供独特的创见和明晰的解决方案。我们以客为先,拥有广阔的国
际视野,对质量一丝不苟,客户信赖我们始终一致的服务质量,这是毕马威发展业务,享誉国际的核心。
房地产业各领域的客户包括:
– 房地产投资和私募基金管理
– 房地产投资信托
– 机构投资人和顾问,包括养老金和主权财富基金
– 房地产经营公司
– 房地产服务公司
– 贷款方和中介机构
– 房地产开发商
– 建筑公司和工程公司
– 酒店服务公司
– 住宅建筑商
综合一体的解决方案 如果您从事房地产投资业务,我们鉴于投资周期的综合一体的解决方案可助您实现效益。我们的专业人员对该行业理解深入,而且具有可以利用本地化知识的全球网络,因此有条件在整个投资周期为您提供建议。
毕马威为中国投资者热忱服务
鉴于美国市场在法律、监管及税务方面的高度复杂性,谨慎的外国投资者会投入大量精力组建当地的投资顾问关系网络,以有效执行相关战略及应对市场变化。任何一步出现差错都会对投资收益造成重大影响。
Roger Power, 审计合伙人,
中美房地产合作主管, 毕马威美国分所
“
“
@2016毕马威会计师事务所,美国特拉华州的有限责任合伙,并为毕马威国际合作组织(“毕马威国际”)相关联的独立成员所网络中的美国成员公司。毕马威国际属瑞士实体公司。版权所有,不得转载。
103China Inbound Investing in U.S. Real Estate
中国赴美房地产投资

1. Set-up and raising money – Advising on investing in new markets
– Helping to build and assess business plans and strategies
– Identifying business or joint venture partners
– Conducting feasibility studies and economic assessments
– Advising on effective staff remuneration
– Fund structuring options to help mitigate potential tax exposures on investments in multiple jurisdictions
– Assessing fund mangers’ regulatory and compliance requirements
2. Acquisition and disposition of investments – Advising on corporate mergers and acquisitions
– Performing detailed financial, tax and purchaser or vendor due diligence
– Advising on project financing
– Executing forensic background checks on new investments
– Providing valuations on complex assets or portfolio structures
3. Reporting on performance and plan delivery – Driving value from the audit and delivering efficient, effective communications with stakeholders
– Performing governance reviews, including internal audit process, defining or redeveloping the finance function and reporting systems and pre-IPO review
– Advising on leasehold liability transfers
– Assessing performance management (and MIS systems) and recommending improvements
– Providing objective and strategic advice around distressed assets
– Advising on process improvement, organizational transformation and cost optimization
– Improving back-office functions
– Performing tax compliance services
– Conducting regulatory compliance reviews
4. Restructuring, refinancing and divesting – Providing restructuring advice
– Advising on cost-cutting and cost management
– Helping with the development of tax-efficient structures
– Helping to determine debt capacity
– Providing financial modeling or the audit of current models
5. Realization and exit – Advising on extracting capital from existing property assets and limiting tax liabilities
– Helping to ensure the reliability of the financial and commercial information that underpins a transaction
– Providing support before and during the IPO process
– Advising on the feasibility, structuring and raising of funds for REIT conversion or international listing.
@2016 KPMG LLP, a Delaware limited liability partnership and the U.S. member firm of the KPMG network of independent member firms affiliated with KPMG International Cooperative (“KPMG International”), a Swiss entity. All rights reserved.
1.企业建立与筹资 – 新市场投资建议
– 协助建立和评估商务计划和策略
– 识别业务和合资合伙人
– 进行可行性研究和经济评估
– 提供关于有效的员工薪酬相关的建议
– 为涉及多个国家和地区投资时提供资金结构方案,规避潜在税务风险
– 评估基金管理人的监管与合规要求
2.收购与投资的处置 – 提供公司并购相关的建议,
– 进行详细的财务、税务和买方卖方尽职调查
– 提供项目融资相关的建议
– 对新投资项目进行法政背景调查
– 对复杂资产或组合结构进行估值
3.绩效报告及规划实施 – 提升审计价值,与利益相关方展开高
效沟通
– 进行治理审查,包括内部审计流程、定义和重新开发财务职能、报告系统和上市前审查
– 提供租赁责任转让相关的建议
– 评估绩效管理(以及MIS系统),并提出改进措施的建议
– 提供对于不良资产处理的客观战略性建议
– 提供有关于流程改进、组织转型和成本优化的建议
– 改善后台办公职能
– 提供税务合规服务
– 提供监管合规审查服务
4.重组、再融资和剥离服务 – 提供重组建议
– 提供关于削减成本和成本管理的建议
– 协助开发设计最优化税收组织构架
– 提供财务建模或当前模型的审核 服务
5.变现与退出 – 提供从现有地产抽取资本及限制纳税
责任的建议
– 协助确保交易相关的财务和商业信息的可靠性
– 提供上市及前期支持
– 提 供 关 于 房 地 产 投 资 信 托 公 司(REIT)转换或国际上市的可行性、规划和筹资相关的建议。
@2016毕马威会计师事务所,美国特拉华州的有限责任合伙,并为毕马威国际合作组织(“毕马威国际”)相关联的独立成员所网络中的美国成员公司。毕马威国际属瑞士实体公司。版权所有,不得转载。
105China Inbound Investing in U.S. Real Estate
中国赴美房地产投资

@2016 KPMG LLP, a Delaware limited liability partnership and the U.S. member firm of the KPMG network of independent member firms affiliated with KPMG International Cooperative (“KPMG International”), a Swiss entity. All rights reserved.

@2016毕马威会计师事务所,美国特拉华州的有限责任合伙,并为毕马威国际合作组织(“毕马威国际”)相关联的独立成员所网络中的美国成员公司。毕马威国际属瑞士实体公司。版权所有,不得转载。
107China Inbound Investing in U.S. Real Estate
中国赴美房地产投资

Contact us
KPMG’s U.S. - China Real Estate Initiative is a cross-border network of experienced professionals.
U.S. leads
Greg WilliamsNational Sector Leader--Building, Construction & Real Estate / Asset ManagementT: +1 214 840 2425E: [email protected]
Jennifer AndersonPartner, TaxU.S. - China Real Estate InitiativeT: +1 212 954 7806E: [email protected]
Phil MarraNational Real Estate Funds Leader T: +1 212 954 7864E: [email protected]
Roger Power Partner, AuditLeader, U.S. - China Real Estate Initiative T: +1 415 963 5410E: [email protected]
Angela YuPartner, TaxU.S. - China Real Estate InitiativeT: +1 212 954 2680E: [email protected]
Key local office professionals
Los Angeles
Tony KitchenerPartner, AuditT: +1 213 955 8695E: [email protected]
Martin GriffithsPartner, TaxT: +1 213 955 8339E: magriffiths@ kpmg.com
New York
Shirley ChoyAudit Managing DirectorT: +1 212 909 5074E: [email protected]
Jennifer AndersonPartner, Tax T: +1 212 954 7806E: [email protected]
San Francisco
Roger PowerPartner, AuditT: +1 415 963 5410E: [email protected]
Graeme FletcherPrincipal, TaxT: +1 415 963 5473E: [email protected]
Washington, DC
Thomas GerthPartner, AuditT: +1 703 286 6566E: [email protected]
Jonathan WoehrlePartner, TaxT: +1 703 286 8261E: [email protected]
Chicago
Tony CircolonePartner, AuditT: +1 312 665 2210E: [email protected]
Paul ChambersPartner, TaxT: +1 312 665 2669E: [email protected]
Key contacts in China
Nelson LaiHead of Real Estate, ChinaT: +86 21 2212 2701E: [email protected]
John Gu Partner, TaxT: +86 10 8508 7095E: [email protected]
Dallas
Troy ButtsPartner, AuditT: +1 214 840 2107E: [email protected]
Danny HertelPartner, TaxT: +1 214 840 2250E: [email protected]
Andrew ZhaoPartner, Transaction Services T: +86 21 2212 3585E: [email protected]
Steve MooreManaging Director, Head of U.S. Real Estate Deal AdvisoryT: +1 212 954 4292E: [email protected]
@2016 KPMG LLP, a Delaware limited liability partnership and the U.S. member firm of the KPMG network of independent member firms affiliated with KPMG International Cooperative (“KPMG International”), a Swiss entity. All rights reserved.

联系我们
毕马威中美房地产合作是由资深专业人士组成的跨境网络。美国分所负责人Greg Williams美国房地产业务主管合伙人电话: +1 214 840 2425电邮: [email protected]
Jennifer Anderson税务合伙人中美房地产合作 电话: +1 212 954 7806电邮: [email protected]
Phil Marra美国房地产基金主管电话: +1 212 954 7864 电邮: [email protected]
Roger Power审计合伙人中美房地产合作主管 电话: +1 415 963 5410电邮: [email protected]
Angela Yu税务合伙人中美房地产合作电话: +1 212 954 2680电邮: [email protected]
美国本地办公室联系人洛 杉 矶 纽约 旧金山 华盛顿特区Tony Kitchener审计合伙人电话: +1 213 955 8695E: [email protected]
Shirley Choy审计 电话: +1 212 909 5074E: [email protected]
Roger Power审计合伙人电话: +1 415 963 5410E: [email protected]
Thomas Gerth审计合伙人 电话: +1 703 286 6566E: [email protected]
Martin Griffiths税务合伙人 电话: +1 213 955 8339电邮: magriffiths@ kpmg.com
Jennifer Anderson税务合伙人 电话: +1 212 954 7806电邮:[email protected]
Graeme Fletcher税务电话: +1 415 963 5473电邮: [email protected]
Jonathan Woehrle税务合伙人 电话: +1 703 286 8261电邮: [email protected]
芝加哥 达拉斯 中国联络人Tony Circolone审计合伙人电话: +1 312 665 2210电邮: [email protected]
Troy Butts审计合伙人电话: +1 214 840 2107电邮: [email protected]
黎俊文房地产行业主管合伙人,中国电话: +86 21 2212 2701电邮: [email protected]
赵怿并购服务合伙人电话: +86 21 2212 3585电邮: [email protected]
Paul Chambers税务合伙人电话: +1 312 665 2669电邮: [email protected]
Danny Hertel税务合伙人电话: +1 214 840 2250电邮: [email protected]
古军华 税务合伙人电话: +86 10 8508 7095E: [email protected]
Steve Moore常务总监 美国房地产交易咨询主管电话: +1 212 954 4292电邮: [email protected]
@2016毕马威会计师事务所,美国特拉华州的有限责任合伙,并为毕马威国际合作组织(“毕马威国际”)相关联的独立成员所网络中的美国成员公司。毕马威国际属瑞士实体公司。版权所有,不得转载。
109China Inbound Investing in U.S. Real Estate
中国赴美房地产投资

kpmg.com/socialmedia
The information contained herein is of a general nature and is not intended to address the circumstances of any particular individual or entity. Although we endeavor to provide accurate and timely information, there can be no guarantee that such information is accurate as of the date it is received or that it will continue to be accurate in the future. No one should act upon such information without appropriate professional advice after a thorough examination of the particular situation.
© 2016 KPMG LLP, a Delaware limited liability partnership and the U.S. member firm of the KPMG network of independent member firms affiliated with KPMG International Cooperative (“KPMG International”), a Swiss entity. All rights reserved.
The KPMG name and logo are registered trademarks or trademarks of KPMG International.
部分或全部本文所描述的服务可能不是允许的毕马威会计师事务所审计客户及其关联公司 。
本刊物所载资料仅供一般参考用,并非针对任何个人或团体的个别情况而提供。虽然本所已致力提供准确和及时的资料,但本所不能保证这些资料在阁下收取时或日后仍然准确。任何人士不应在没有详 细考虑相关的情况及获取适当的专业意见下依据所载资料行事。
© 2016 毕马威会计师事务所,美国特拉华州的有限责任合伙,并为毕马威国际合作组织(“毕马威国际”)相关联的独立成员所网络中的美国成员公司。毕马威国际属瑞士实体公司。版权所有,不得转载。
毕马威的名称和标识均属于毕马威国际的注册商标。