Grey seal diet at the southern limit of its European distribution: combining dietary analyses and...
10
J. Mar. Biol. Ass. U.K. (2007), 87, 255–264 Printed in the United Kingdom Journal of the Marine Biological Association of the United Kingdom (2007) doi: 10.1017/S002531540705463X Grey seal diet at the southern limit of its European distribution: combining dietary analyses and fatty acid profiles The north-east Atlantic grey seal, Halichoerus grypus, is widely distributed along the European coastline from northern Russia to France, with the core population centred around Scotland. To date, very little is known of the diet of the species at the southern margin of the species range. However, because grey seal numbers have been increasing over the last few decades in France, the issue of their potential interactions with coastal fisheries is frequently raised. The diet of grey seal in the Molène Archipelago was investigated by combining scat, stomach content and fatty acid analyses, since all three approaches have complementary potentials to reveal feeding habits of a predator. A total of 145 scats mostly of moulting adult males, 14 stomach contents of yearlings and 14 blubber samples from animals of all ages were analysed following standard methodologies. Scats revealed a diet mainly constituted of 50.6% by mass (M) of wrasse, Labridae (mostly Labrus bergylta), 20.7%M conger eel, Conger conger, and 11.9%M sea bass, Dicentrarchus labrax. Stomach contents were made up of 52.3%M cuttlefish, Sepia officinalis, 9.5%M sole, Solea solea, and 9.4 %M conger eel. All these prey are different from the diet observed in core areas. Fatty acid analysis from the blubber confirmed that the diet differed between the Molène Archipelago and one of the Scottish breeding sites. It also showed that most of the inter- individual variability was explained by variation in seal body masses, which could be linked to behavioural ontogeny of foraging strategies. Most of the prey species identified in the food of the grey seal in Brittany are also targeted by professional and/or recreational fisheries in the area; additionally, several prey size-ranges also partly overlap with marketed size-ranges for several species. INTRODUCTION The grey seal is distributed in temperate and sub-polar waters of the North Atlantic and three stocks are generally recognized: in the north-west Atlantic, the north-east Atlantic and the Baltic Sea. The core of the north-east Atlantic stock is located around Scotland (UK), where around 75% of the population of this stock breed (Sea Mammal Research Uunit, 2004). However, this stock geographically spreads northwards along the Norwegian and Russian coasts as far as the Barents Sea and southwards to Ireland, southern Great Britain, France, the Netherlands and Germany (Härkönen et al., in press). The size of the breeding or resting groups drastically decreases towards the edges of the distribution area, from up to one or several tens of thousands of individuals per location in Scotland (Sea Mammal Research Uunit, 2004) to about one hundred in France, for instance. Four permanent grey seal haul-out sites are known along the French north-west coasts, the most important of which is the Molène Archipelago at the western tip of Brittany (Figure 1) where more than half of the French ‘population’ is found (Härkönen et al., in press). There, the maximum seal counts were ~70 in the years 1991–2000, with a trend of +7% over that decade (Vincent et al., 2005) and mark–recapture analyses of photo-identification data estimated total seal number in the area at a seasonal maximum of 98 [95% CI: 75–175] in the early summer (Gerondeau et al., 2007). In spite of these fairly low numbers of seals and because a Marine Protected Area is planned in the same region, the issue of potential interaction with local fisheries, both professional and recreational, is increasingly frequently raised. The food and foraging ecology of the grey seal has been extensively studied in the core of its distribution, but very little is known at the southern limit of its European range, including the south-west British Isles and the French coast. In order to establish baseline knowledge that would be necessary for future investigation of the impact of grey seals on local fish resources and their overlap with fisheries, we studied the diet of the grey seals in an approach which combined scat and stomach content analyses and fatty acid profiling of satellite-tracked seals. Looking at scat and stomach content composition allows the recent diet to be quantitatively investigated, whereas fatty acid signatures in the blubber integrate the diet of individuals over several weeks and can reveal among individuals dietary variability potentially linked to biological (sex, size etc.) or behavioural characteristics (travelling patterns). V. Ridoux* †∫ , J. Spitz † , C. Vincent* and M.J. Walton ‡ *Centre de Recherches sur les Ecosystèmes Littoraux Anthropisés (CRELA), UMR 6217, Université de La Rochelle, 17071 La Rochelle cédex, France. † Centre de Recherche sur les Mammifères Marins (CRMM), Université de La Rochelle, 17071 La Rochelle, France. ‡ Sea Mammal Research Unit, University of St Andrews, St Andrews, Fife KY16 8LB, Scotland, UK. ∫ Corresponding author, e-mail: [email protected]
-
Upload
independent -
Category
Documents
-
view
1 -
download
0
Transcript of Grey seal diet at the southern limit of its European distribution: combining dietary analyses and...
J. Mar. Biol. Ass. U.K. (2007), 87, 255–264Printed in the United Kingdom
Journal of the Marine Biological Association of the United Kingdom (2007)
doi: 10.1017/S002531540705463X
Grey seal diet at the southern limit of its European distribution:combining dietary analyses and fatty acid profiles
The north-east Atlantic grey seal, Halichoerus grypus, is widely distributed along the European coastline from northern Russia to France, with the core population centred around Scotland. To date, very little is known of the diet of the species at the southern margin of the species range. However, because grey seal numbers have been increasing over the last few decades in France, the issue of their potential interactions with coastal fisheries is frequently raised. The diet of grey seal in the Molène Archipelago was investigated by combining scat, stomach content and fatty acid analyses, since all three approaches have complementary potentials to reveal feeding habits of a predator. A total of 145 scats mostly of moulting adult males, 14 stomach contents of yearlings and 14 blubber samples from animals of all ages were analysed following standard methodologies. Scats revealed a diet mainly constituted of 50.6% by mass (M) of wrasse, Labridae (mostly Labrus bergylta), 20.7%M conger eel, Conger conger, and 11.9%M sea bass, Dicentrarchus labrax. Stomach contents were made up of 52.3%M cuttlefish, Sepia officinalis, 9.5%M sole, Solea solea, and 9.4 %M conger eel. All these prey are different from the diet observed in core areas. Fatty acid analysis from the blubber confirmed that the diet differed between the Molène Archipelago and one of the Scottish breeding sites. It also showed that most of the inter-individual variability was explained by variation in seal body masses, which could be linked to behavioural ontogeny of foraging strategies. Most of the prey species identified in the food of the grey seal in Brittany are also targeted by professional and/or recreational fisheries in the area; additionally, several prey size-ranges also partly overlap with marketed size-ranges for several species.
INTRODUCTION
The grey seal is distributed in temperate and sub-polar waters of the North Atlantic and three stocks are generally recognized: in the north-west Atlantic, the north-east Atlantic and the Baltic Sea. The core of the north-east Atlantic stock is located around Scotland (UK), where around 75% of the population of this stock breed (Sea Mammal Research Uunit, 2004). However, this stock geographically spreads northwards along the Norwegian and Russian coasts as far as the Barents Sea and southwards to Ireland, southern Great Britain, France, the Netherlands and Germany (Härkönen et al., in press). The size of the breeding or resting groups drastically decreases towards the edges of the distribution area, from up to one or several tens of thousands of individuals per location in Scotland (Sea Mammal Research Uunit, 2004) to about one hundred in France, for instance.
Four permanent grey seal haul-out sites are known along the French north-west coasts, the most important of which is the Molène Archipelago at the western tip of Brittany (Figure 1) where more than half of the French ‘population’ is found (Härkönen et al., in press). There, the maximum seal counts were ~70 in the years 1991–2000, with a trend of +7%
over that decade (Vincent et al., 2005) and mark–recapture analyses of photo-identification data estimated total seal number in the area at a seasonal maximum of 98 [95% CI: 75–175] in the early summer (Gerondeau et al., 2007). In spite of these fairly low numbers of seals and because a Marine Protected Area is planned in the same region, the issue of potential interaction with local fisheries, both professional and recreational, is increasingly frequently raised. The food and foraging ecology of the grey seal has been extensively studied in the core of its distribution, but very little is known at the southern limit of its European range, including the south-west British Isles and the French coast.
In order to establish baseline knowledge that would be necessary for future investigation of the impact of grey seals on local fish resources and their overlap with fisheries, we studied the diet of the grey seals in an approach which combined scat and stomach content analyses and fatty acid profiling of satellite-tracked seals. Looking at scat and stomach content composition allows the recent diet to be quantitatively investigated, whereas fatty acid signatures in the blubber integrate the diet of individuals over several weeks and can reveal among individuals dietary variability potentially linked to biological (sex, size etc.) or behavioural characteristics (travelling patterns).
V. Ridoux*†∫, J. Spitz†, C. Vincent* and M.J. Walton‡
*Centre de Recherches sur les Ecosystèmes Littoraux Anthropisés (CRELA), UMR 6217, Université de La Rochelle, 17071 La Rochelle cédex, France. †Centre de Recherche sur les Mammifères Marins (CRMM), Université de La Rochelle, 17071 La
Rochelle, France. ‡Sea Mammal Research Unit, University of St Andrews, St Andrews, Fife KY16 8LB, Scotland, UK.∫Corresponding author, e-mail: [email protected]
256 V. Ridoux et al. Grey seal diet in France
Journal of the Marine Biological Association of the United Kingdom (2007)
MATERIALS AND METHODSStudy site
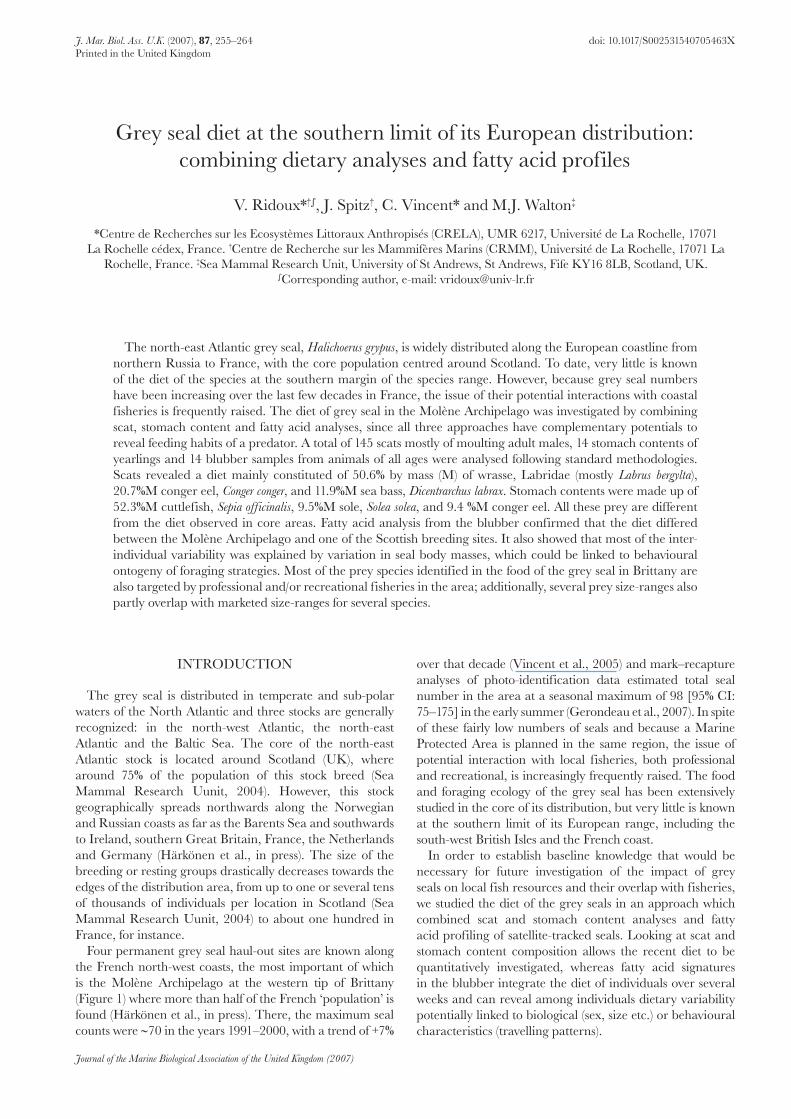
The Molène Archipelago is located off the western coast of Brittany, France (Figure 1). The archipelago is constituted of half a dozen shallow islands, only one of which is inhabited, and numerous tidal reefs, surrounded by an extended plateau at depths shallower than 20 m. On average, about 50 to 60 grey seals use this area as a haul-out site, but analysis of age and sex categories and sex composition suggests that the assemblage of individuals living there changes according to the major periods of the species’ yearly cycle (Vincent et al., 2005; Gerondeau et al., 2006). Tidal rocks are preferential haul-out sites during most of the year cycle whereas small islands, which permanently emerge, are preferred by females
nursing pups in the autumn and by moulting animals in late winter (Vincent, 2001).
Dietary analysis
Scats were collected at haul-out sites in the Molène Archipelago from March 1998 to March 2000 and stored frozen at -20°C. Because haul-out sites located above the high tide level are mostly used by the seals during their moult, scats were collected during the months of January to March. Although scats could not be attributed to individual seals of known age or sex, scats collected in this way were more likely to be produced by adult males as the composition of the group using the area during the moult is heavily skewed in favour of this category, displaying a sex ratio of about 5:1 (Vincent et al., 2005). In addition to scats, stomachs from seals by-caught in bottom-set gill-nets were also obtained from the vicinity of the archipelago (Figure 1), ligatured and removed at necropsy, and stored frozen at -20°C. All these animals, but one, were yearlings.
Dietary analysis was standard and followed procedures generally used for marine top predators (Pierce & Boyle, 1991; Croxall, 1993; Ridoux, 1994) that will only briefly be described here. Scat and stomach samples were washed on a 0.2 mm mesh size sieve. Prey items were identified to species from the examination of diagnostic hard remains like otoliths and bones for fish and mandibles for cephalopods, by using available keys and guides (Clarke, 1986; Härkönen, 1986) as well as our reference material (CRMM/University of La Rochelle). The composition of the diet was quantified by occurrence (number or proportion of scats/stomachs containing a prey taxon), relative abundance (number or proportion by number of individuals belonging to a given prey taxon throughout the series of scats/stomachs) and reconstituted body mass (mass or proportion by mass of a given prey taxon throughout the series of scats/stomachs). A prey was considered present in a sample when at least one diagnostic part was found. The number of fish individuals in a sample was half the number of otoliths or
Figure 1. Study area (black dots indicate sampling locations of the stomach samples, the dashed area shows where tracked seals were caught and blubber samples obtained, the stars indicate sampling sites of scats).
Seal SexBody mass
(kg)Body length
(cm) Start dateTracking
duration (days)
Per cent time spent in (from Vincent et al., 2005)
Open sea BrittanyChannelIslands Great Britain Molène
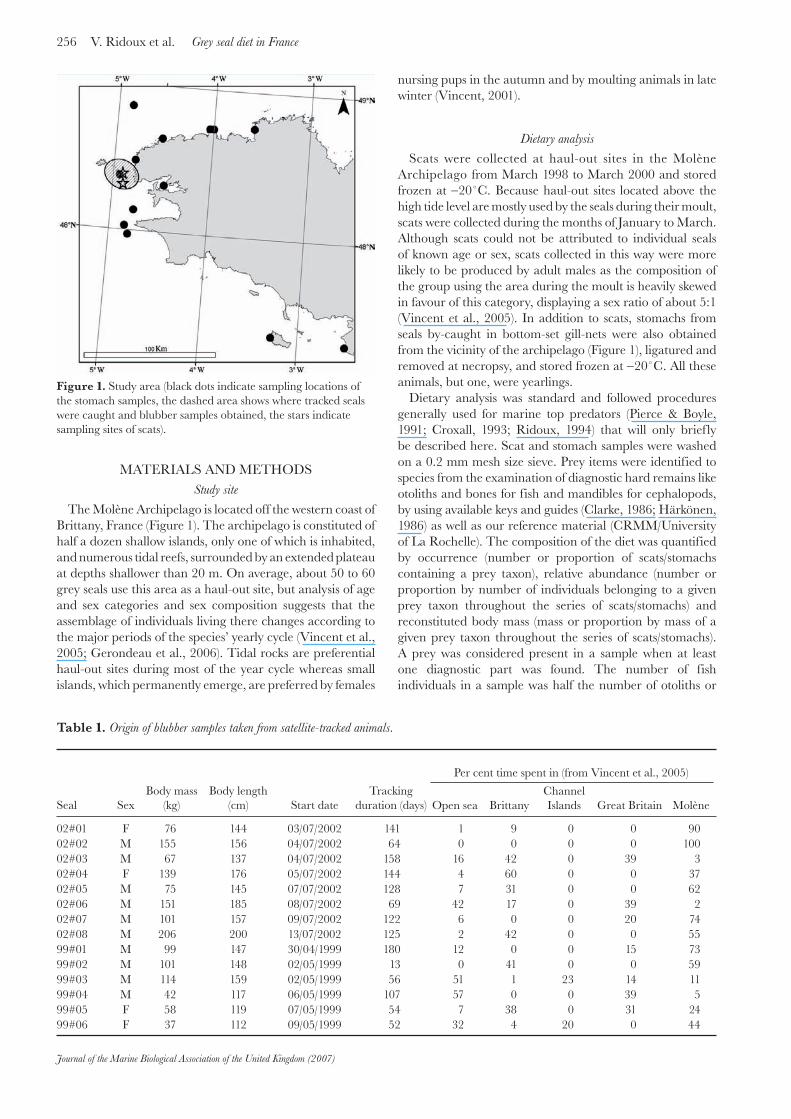
02#01 F 76 144 03/07/2002 141 1 9 0 0 9002#02 M 155 156 04/07/2002 64 0 0 0 0 10002#03 M 67 137 04/07/2002 158 16 42 0 39 302#04 F 139 176 05/07/2002 144 4 60 0 0 3702#05 M 75 145 07/07/2002 128 7 31 0 0 6202#06 M 151 185 08/07/2002 69 42 17 0 39 202#07 M 101 157 09/07/2002 122 6 0 0 20 7402#08 M 206 200 13/07/2002 125 2 42 0 0 5599#01 M 99 147 30/04/1999 180 12 0 0 15 7399#02 M 101 148 02/05/1999 13 0 41 0 0 5999#03 M 114 159 02/05/1999 56 51 1 23 14 1199#04 M 42 117 06/05/1999 107 57 0 0 39 599#05 F 58 119 07/05/1999 54 7 38 0 31 2499#06 F 37 112 09/05/1999 52 32 4 20 0 44
Table 1. Origin of blubber samples taken from satellite-tracked animals.
Journal of the Marine Biological Association of the United Kingdom (2007)
257Grey seal diet in France V. Ridoux et al.
dentary bones rounded up to the integer and the number of cephalopods was given by the higher number of upper or lower beaks. All diagnostic parts were measured following the standards, namely otolith length (OL) and cephalopod lower rostral length (LRL), and converted to total body length and individual body mass by using available allometric relationships (Clarke, 1986; Härkönen, 1986; CRMM, unpublished relationships). In order to take otolith erosion into account, OL measurements obtained from scat samples, but not from stomachs, were multiplied by correction factors from the literature (Prime & Hammond, 1990; Pierce et al., 1993; Hammond et al., 1994a; Tollit et al., 1997). The reconstituted mass of a taxon in a given sample was obtained by averaging individual body masses in that sample multiplying by the number of individuals of the taxon in the same sample.
For some species, a specific treatment departed slightly from the general schedule outlined above. Garfish, Belone belone, which was always ingested without the head (presumably because of its acute rostrum) was identified from its uniquely green-tinged vertebrae. Wrasse, family Labridae, were identified and measured from the otoliths, but enumerated from the higher counts obtained from otoliths (as above) and of their distinctive impaired pharyngeal teeth plate. Among crustaceans, only the shore crab, Carcinus maenas, was considered as a possible primary prey of the grey seal and included in the calculations as such. In contrast, numerous remains of anomuran crabs, families Porcellanidae, Paguridae and Galatheidae, corresponded to prey items of about 10 mm long and were therefore
considered to be fish prey secondarily ingested by the seals; they were therefore discarded from the analyses.
Ninety-five per cent confidence intervals (95% CI) around the percentages by number and by mass were generated for each prey species by bootstrap simulations (Reynolds & Aebischer, 1991). The bootstrapping routine was written by using the R software. Random samples were drawn with replacement and the procedure was repeated 1000 times.
Fatty acid profiles
The sampled animals covered a large range of sizes and body masses (Table 1) and were shown by satellite telemetry (Vincent et al., 2005) to have contrasted strategies of habitat use: some of them were strictly resident and stayed in the vicinity of their Molène resting sites, others alternately used the Molène Arquipelago and areas along the Breton mainland coasts, others moved to coastal regions around the south-west British Isles and, finally, some of them made extensive use of open sea areas in the western English Channel (Table 1). Blubber samples were taken from individuals caught at haul-out site and processed as described in Walton et al. (2000). Briefly, lipids were extracted by the method of Folch et al. (1957) and converted to FAMES (fatty acid methyl esters) in the presence of acidified methanol. The FAMES were separated by gas chromatography on a DB23 fused silica capillary column (30 m × 0.25 mm internal diameter). Peak areas were quantified by the software package Chromcard v. 2.3 (Carlo Erba) and individual fatty acids were expressed as the percentage by weight of the total fatty acids characterized. As is customary, values are expressed to two decimal places, but this degree of accuracy is not implied.
As a previous study (Walton & Pomeroy, 2003) has shown that the diets of seals and hence fatty acid profiles can change at certain localities between years, the average fatty acid profiles of the seals will be listed separately by year. An inter-population distance measure Dfap was calculated to compare the two years of sampling (see Walton & Pomeroy, 2003).
Several multivariate statistical techniques, detailed in Walton & Pomeroy (2003), were applied to the resulting fatty acid profiles. These techniques have the potential to reveal qualitative differences in diet, i.e. that temporal or spatial difference or changes have occurred, but without specifying what prey species had been eaten. Principal components analysis (PCA) requires at least as many samples as variables, therefore in this case where there are 58 acids and only 14 seals a selection of variables is required, which could have an influence on the outcome. Firstly, in order to test using all variables, the sample size was increased by comparing the French seals with seals from a North Sea colony (the Isle of May) also sampled in 1999 and 2002 (M. Walton, unpublished results).
RESULTSDiet composition
The diet of the grey seal was mostly composed of fish and cephalopods but differed substantially according to whether one considers the results obtained from scats or from stomach contents. These two sources of dietary information will be examined separately.
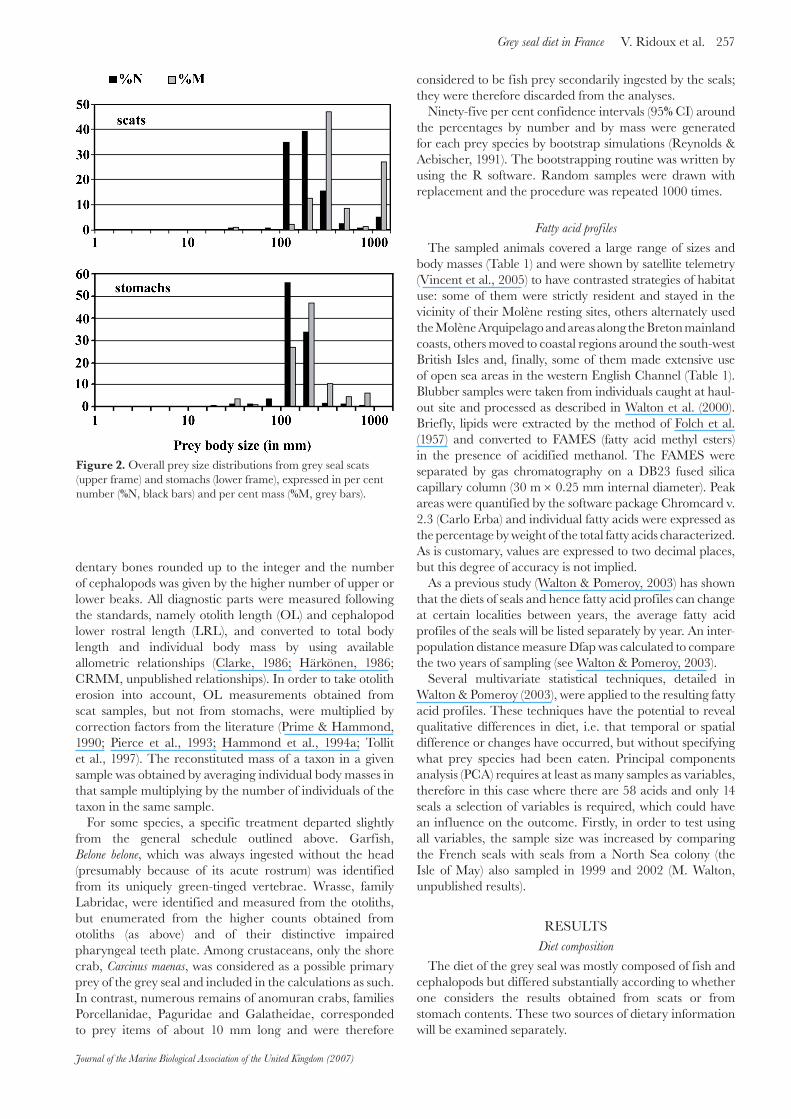
Figure 2. Overall prey size distributions from grey seal scats (upper frame) and stomachs (lower frame), expressed in per cent number (%N, black bars) and per cent mass (%M, grey bars).
258 V. Ridoux et al. Grey seal diet in France
Journal of the Marine Biological Association of the United Kingdom (2007)
From the analysis of prey remains found in scats, the prey array comprised 18 fish taxa and 2 of cephalopods. Fish dominated overwhelmingly with 96% by number and 98.6% by reconstituted mass (Table 2). It appeared that wrasse (presumably the ballan wrass, Labrus bergylta, but confusion with otoliths of other labrids was possible) accounted for 50.6% of the diet by mass (95% CI: 34–68); conger eels, Conger conger, ranked second with a total contribution of 20.7%M (95% CI: 8–35), followed by the sea bass, Dicentrarchus labrax (11.9%M; 95% CI: 1–24) and an assemblage of gadids (7.3%M altogether) among which pollack, Pollachius spp.,
were the most important (3.7%M; 95% CI: 0–10). However, it must be noted that the average number of prey remains per scat was fairly low and therefore inter-scat heterogeneity was correspondingly high as shown by the width of the 95% CIs. The average prey individual body mass was 698 g and the overall prey size-distribution was from a 10 cm long dragonet, Callionymus lyra, or 4 g sand eel, Ammodytidae, to a conger eel of 130 cm and 5.2 kg; prey from 10 to 25 cm long accounted for 74% by number of the diet and larger prey, from 25 to 40 cm long accounted for 47% by mass of the diet (Figure 2).
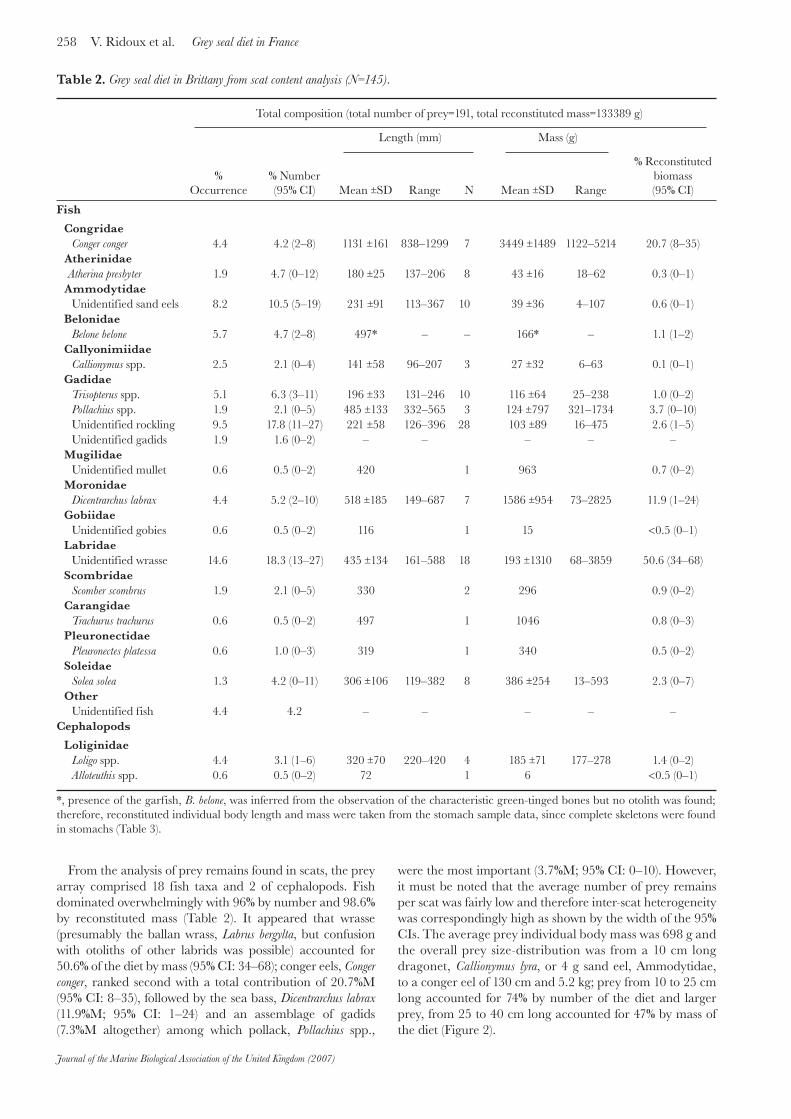
Total composition (total number of prey=191, total reconstituted mass=133389 g)
Length (mm) Mass (g)
%Occurrence
% Number(95% CI) Mean ±SD Range N Mean ±SD Range
% Reconstitutedbiomass(95% CI)
Fish
CongridaeConger conger 4.4 4.2 (2–8) 1131 ±161 838–1299 7 3449 ±1489 1122–5214 20.7 (8–35)
AtherinidaeAtherina presbyter 1.9 4.7 (0–12) 180 ±25 137–206 8 43 ±16 18–62 0.3 (0–1)
AmmodytidaeUnidentified sand eels 8.2 10.5 (5–19) 231 ±91 113–367 10 39 ±36 4–107 0.6 (0–1)
BelonidaeBelone belone 5.7 4.7 (2–8) 497* – – 166* – 1.1 (1–2)
CallyonimiidaeCallionymus spp. 2.5 2.1 (0–4) 141 ±58 96–207 3 27 ±32 6–63 0.1 (0–1)
GadidaeTrisopterus spp. 5.1 6.3 (3–11) 196 ±33 131–246 10 116 ±64 25–238 1.0 (0–2)Pollachius spp. 1.9 2.1 (0–5) 485 ±133 332–565 3 124 ±797 321–1734 3.7 (0–10)Unidentified rockling 9.5 17.8 (11–27) 221 ±58 126–396 28 103 ±89 16–475 2.6 (1–5)Unidentified gadids 1.9 1.6 (0–2) – – – – –
MugilidaeUnidentified mullet 0.6 0.5 (0–2) 420 1 963 0.7 (0–2)
MoronidaeDicentrarchus labrax 4.4 5.2 (2–10) 518 ±185 149–687 7 1586 ±954 73–2825 11.9 (1–24)
GobiidaeUnidentified gobies 0.6 0.5 (0–2) 116 1 15 <0.5 (0–1)
LabridaeUnidentified wrasse 14.6 18.3 (13–27) 435 ±134 161–588 18 193 ±1310 68–3859 50.6 (34–68)
ScombridaeScomber scombrus 1.9 2.1 (0–5) 330 2 296 0.9 (0–2)
CarangidaeTrachurus trachurus 0.6 0.5 (0–2) 497 1 1046 0.8 (0–3)
PleuronectidaePleuronectes platessa 0.6 1.0 (0–3) 319 1 340 0.5 (0–2)
SoleidaeSolea solea 1.3 4.2 (0–11) 306 ±106 119–382 8 386 ±254 13–593 2.3 (0–7)
OtherUnidentified fish 4.4 4.2 – – – – –
Cephalopods
LoliginidaeLoligo spp. 4.4 3.1 (1–6) 320 ±70 220–420 4 185 ±71 177–278 1.4 (0–2)Alloteuthis spp. 0.6 0.5 (0–2) 72 1 6 <0.5 (0–1)
*, presence of the garfish, B. belone, was inferred from the observation of the characteristic green-tinged bones but no otolith was found; therefore, reconstituted individual body length and mass were taken from the stomach sample data, since complete skeletons were found in stomachs (Table 3).
Table 2. Grey seal diet in Brittany from scat content analysis (N=145).
Journal of the Marine Biological Association of the United Kingdom (2007)
259Grey seal diet in France V. Ridoux et al.
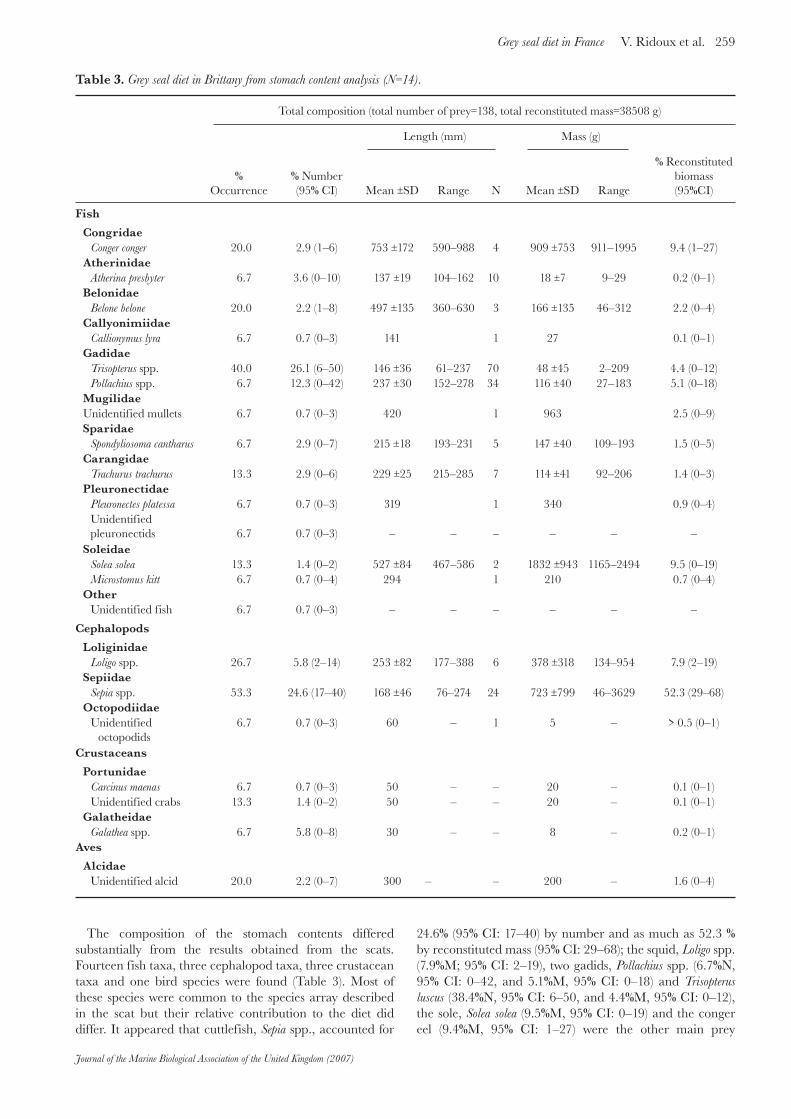
The composition of the stomach contents differed substantially from the results obtained from the scats. Fourteen fish taxa, three cephalopod taxa, three crustacean taxa and one bird species were found (Table 3). Most of these species were common to the species array described in the scat but their relative contribution to the diet did differ. It appeared that cuttlefish, Sepia spp., accounted for
24.6% (95% CI: 17–40) by number and as much as 52.3 % by reconstituted mass (95% CI: 29–68); the squid, Loligo spp. (7.9%M; 95% CI: 2–19), two gadids, Pollachius spp. (6.7%N, 95% CI: 0–42, and 5.1%M, 95% CI: 0–18) and Trisopterus luscus (38.4%N, 95% CI: 6–50, and 4.4%M, 95% CI: 0–12), the sole, Solea solea (9.5%M, 95% CI: 0–19) and the conger eel (9.4%M, 95% CI: 1–27) were the other main prey
Total composition (total number of prey=138, total reconstituted mass=38508 g)
Length (mm) Mass (g)
%Occurrence
% Number(95% CI) Mean ±SD Range N Mean ±SD Range
% Reconstitutedbiomass(95%CI)
Fish
CongridaeConger conger 20.0 2.9 (1–6) 753 ±172 590–988 4 909 ±753 911–1995 9.4 (1–27)
AtherinidaeAtherina presbyter 6.7 3.6 (0–10) 137 ±19 104–162 10 18 ±7 9–29 0.2 (0–1)
BelonidaeBelone belone 20.0 2.2 (1–8) 497 ±135 360–630 3 166 ±135 46–312 2.2 (0–4)
CallyonimiidaeCallionymus lyra 6.7 0.7 (0–3) 141 1 27 0.1 (0–1)
GadidaeTrisopterus spp. 40.0 26.1 (6–50) 146 ±36 61–237 70 48 ±45 2–209 4.4 (0–12)Pollachius spp. 6.7 12.3 (0–42) 237 ±30 152–278 34 116 ±40 27–183 5.1 (0–18)
MugilidaeUnidentified mullets 6.7 0.7 (0–3) 420 1 963 2.5 (0–9)Sparidae
Spondyliosoma cantharus 6.7 2.9 (0–7) 215 ±18 193–231 5 147 ±40 109–193 1.5 (0–5)Carangidae
Trachurus trachurus 13.3 2.9 (0–6) 229 ±25 215–285 7 114 ±41 92–206 1.4 (0–3)Pleuronectidae
Pleuronectes platessa 6.7 0.7 (0–3) 319 1 340 0.9 (0–4)Unidentifiedpleuronectids 6.7 0.7 (0–3) – – – – – –
SoleidaeSolea solea 13.3 1.4 (0–2) 527 ±84 467–586 2 1832 ±943 1165–2494 9.5 (0–19)Microstomus kitt 6.7 0.7 (0–4) 294 1 210 0.7 (0–4)
OtherUnidentified fish 6.7 0.7 (0–3) – – – – – –
Cephalopods
LoliginidaeLoligo spp. 26.7 5.8 (2–14) 253 ±82 177–388 6 378 ±318 134–954 7.9 (2–19)
SepiidaeSepia spp. 53.3 24.6 (17–40) 168 ±46 76–274 24 723 ±799 46–3629 52.3 (29–68)
OctopodiidaeUnidentified
octopodids6.7 0.7 (0–3) 60 – 1 5 – > 0.5 (0–1)
Crustaceans
PortunidaeCarcinus maenas 6.7 0.7 (0–3) 50 – – 20 – 0.1 (0–1)Unidentified crabs 13.3 1.4 (0–2) 50 – – 20 – 0.1 (0–1)
GalatheidaeGalathea spp. 6.7 5.8 (0–8) 30 – – 8 – 0.2 (0–1)
Aves
AlcidaeUnidentified alcid 20.0 2.2 (0–7) 300 – – 200 – 1.6 (0–4)
Table 3. Grey seal diet in Brittany from stomach content analysis (N=14).
260 V. Ridoux et al. Grey seal diet in France
Journal of the Marine Biological Association of the United Kingdom (2007)
species. The number of prey items per stomach was 13.6. The average prey individual body mass was 279 g, much lower than in the scat sample set, and the overall prey size-distribution was from a Trisopterus of 6 cm long and 2 g to a conger eel of 99 cm long and estimated to weigh 2 kg. However, prey from 10 to 16 cm long accounted for 56% by number of the diet whereas slightly larger prey, from 16 to 25 cm long, constituted 47% by mass of the diet (Figure 2).
FAME Percentage by weight of total fatty acids
Year 1999, N=6 Year 2002, N=8 All, N=14
12 0.09 ±0.02 0.10 ±0.02 0.09 ±0.02 13 0.02 ±0.01 0.03 ±0.02 0.03 ±0.0214 2.92 ±0.31 3.19 ±0.41 3.07 ±0.39 *14:1n-9 0.10 ±0.02 0.09 ±0.02 0.10 ±0.0214:1n-7 0.07 ±0.02 0.05 ±0.01 0.06 ±0.0214:1n-5 1.09 ±0.28 1.06 ±0.17 1.07 ±0.21 *iso15 0.16 ±0.04 0.14 ±0.02 0.15 ±0.03Anti15 0.06 ±0.02 0.04 ±0.01 0.05 ±0.0215 0.40 ±0.03 0.34 ±0.04 0.36 ±0.05 #15:1n-x 0.13 ±0.04 0.11 ±0.02 0.12 ±0.03iso16 0.16 ±0.05 0.13 ±0.02 0.14 ±0.04 #16 9.02 ±2.11 9.29 ±1.02 9.17 ±1.53 *16:1n-9 0.65 ±0.07 0.60 ±0.06 0.62 ±0.0716:1n-7 16.55 ±2.08 15.40 ±1.70 15.89 ±1.90 *16:1n-5 0.19 ±0.04 0.18 ±0.02 0.19 ±0.03iso17 0.30 ±0.10 0.22 ±0.03 0.25 ±0.08 #16:2n-6 0.09 ±0.02 0.09 ±0.03 0.09 ±0.03 #Anti17 0.19 ±0.07 0.16 ±0.03 0.17 ±0.05 #16:2n-4 0.26 ±0.09 0.26 ±0.10 0.26 ±0.0917 0.24 ±0.05 0.25 ±0.03 0.25 ±0.0416:3n-4 0.16 ±0.06 0.18 ±0.13 0.17 ±0.10 #17:1n-x 0.75 ±0.13 0.62 ±0.05 0.67 ±0.1116:3n-1 0.21 ±0.05 0.22 ±0.03 0.22 ±0.04iso18 0.07 ±0.01 0.06 ±0.01 0.06 ±0.0116:4n-1 0.14 ±0.03 0.16 ±0.13 0.15 ±0.10 #18 1.51 ±0.48 1.61 ±0.28 1.57 ±0.37 *18:1n-11 0.85 ±0.49 1.38 ±0.78 1.15 ±0.71 *#18:1n-9 24.39 ±2.42 24.22 ±2.17 24.29 ±2.20 *18:1n-7 5.17 ±0.52 5.13 ±0.50 5.15 ±0.50 *18:2d5,7 0.03 ±0.00 0.03 ±0.01 0.03 ±0.0118:1n-5 0.21 ±0.03 0.22 ±0.03 0.22 ±0.03 #18:2n-6 1.25 ±0.30 1.24 ±0.14 1.24 ±0.21 *18:2n-4 0.11 ±0.02 0.13 ±0.06 0.12 ±0.04 #18:3n-6 0.09 ±0.01 0.09 ±0.04 0.09 ±0.0318:3n-4 0.19 ±0.04 0.19 ±0.03 0.19 ±0.0318:3n-3 0.64 ±0.17 0.55 ±0.09 0.59 ±0.1418:3n-1 0.09 ±0.02 0.07 ±0.02 0.08 ±0.0218:4n-3 0.82 ±0.06 0.85 ±0.29 0.84 ±0.2218:4n-1 0.08 ±0.01 0.10 ±0.03 0.09 ±0.0220 0.07 ±0.02 0.10 ±0.03 0.09 ±0.0320:1n-11 0.67 ±0.17 0.74 ±0.43 0.71 ±0.3420:1n-9 1.65 ±0.45 2.33 ±0.97 2.04 ±0.85 *20:1n-7 0.34 ±0.06 0.36 ±0.12 0.35 ±0.09 #20:2n-6 0.27 ±0.05 0.31 ±0.06 0.29 ±0.0620:3n-6 0.13 ±0.03 0.16 ±0.03 0.14 ±0.03 #20:4n-6 1.36 ±0.37 1.60 ±0.29 1.50 ±0.3420:3n-3 0.12 ±0.02 0.13 ±0.02 0.12 ±0.0220:4n-3 0.63 ±0.12 0.72 ±0.07 0.68 ±0.1020:5n-3 4.31 ±0.68 4.87 ±1.82 4.63 ±1.44 *22:1n-11 0.26 ±0.12 0.60 ±0.61 0.45 ±0.49 #22:1n-9 0.07 ±0.02 0.15 ±0.11 0.12 ±0.09 #21:5n-3 0.32 ±0.05 0.35 ±0.08 0.34 ±0.0722:4n-6 0.57 ±0.14 0.69 ±0.18 0.64 ±0.17 *#22:5n-6 0.38 ±0.04 0.36 ±0.08 0.37 ±0.0622:4n-3 0.11 ±0.04 0.10 ±0.01 0.11 ±0.0324 0.02 ±0.00 0.02 ±0.01 0.02 ±0.0022:5n-3 5.51 ±0.81 5.35 ±0.43 5.42 ±0.60 *22:6n-3 13.75 ±1.83 12.25 ±2.47 12.89 ±2.29 *
TOTAL 99.96 ±0.02 99.95 ±0.03 99.95 ±0.02
Sum of: saturated 15.10 ±2.90 15.56 ±1.54 15.37 ±2.14unsaturated 84.35 ±2.92 83.97 ±1.54 84.13 ±2.14MUFA 52.81 ±3.89 52.96 ±3.04 52.89 ±3.29PUFA 31.55 ±2.38 31.01 ±2.92 31.24 ±2.62n-3 26.00 ±2.30 24.99 ±2.94 25.42 ±2.64n-6 4.10 ±0.60 4.50 ±0.43 4.33 ±0.53n-3/n-6 6.47 ±1.20 5.63 ±1.09 5.99 ±1.17
MUFA, monounsaturated fatty acids; PUFA, polyunsaturated fatty acids; *, marks the 14 most abundant fatty acids; #, marks the 14 fatty acids showing the greatest overall percentage variation between the year classes.
Table 4. Fatty acid profiles of blubber from seals sampled in Brit-tany in 1999 and 2002. Values are the means ±SD.
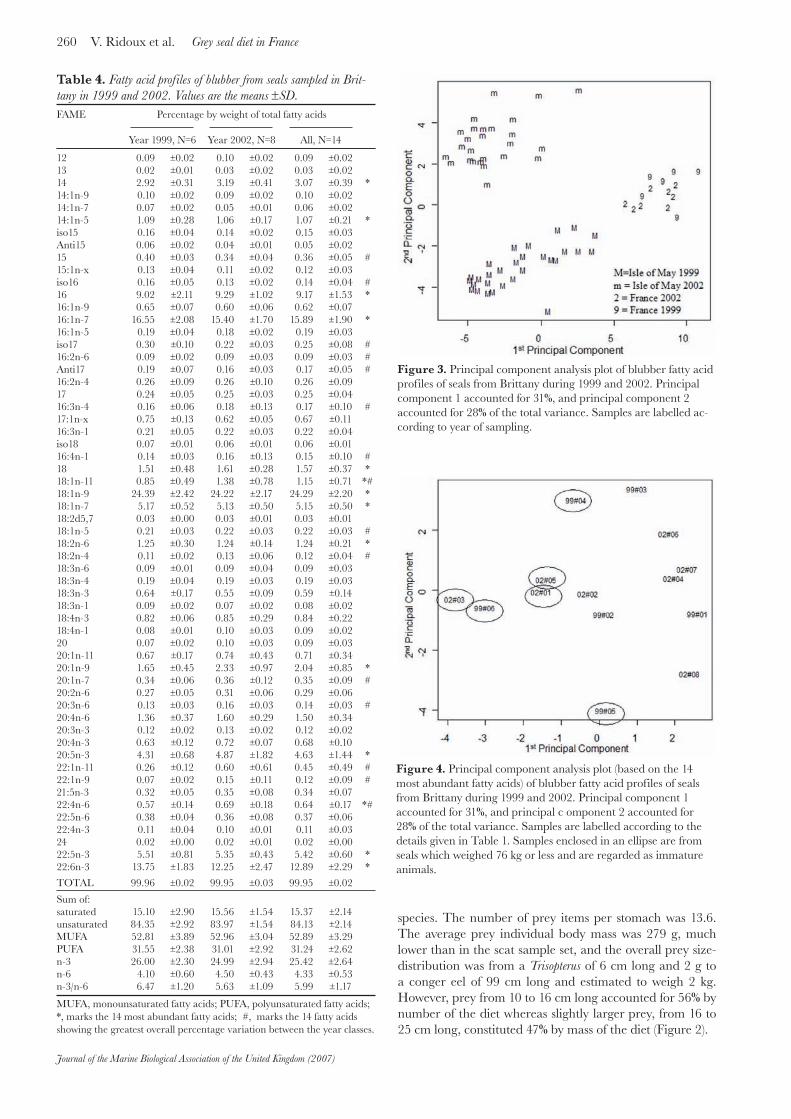
Figure 3. Principal component analysis plot of blubber fatty acid profiles of seals from Brittany during 1999 and 2002. Principal component 1 accounted for 31%, and principal component 2 accounted for 28% of the total variance. Samples are labelled ac-cording to year of sampling.
Figure 4. Principal component analysis plot (based on the 14 most abundant fatty acids) of blubber fatty acid profiles of seals from Brittany during 1999 and 2002. Principal component 1 accounted for 31%, and principal c omponent 2 accounted for 28% of the total variance. Samples are labelled according to the details given in Table 1. Samples enclosed in an ellipse are from seals which weighed 76 kg or less and are regarded as immature animals.
Journal of the Marine Biological Association of the United Kingdom (2007)
261Grey seal diet in France V. Ridoux et al.
M
etho
dsD
iet c
ompo
sitio
n in
% re
cons
titut
ed m
ass [
rang
e](m
ain
spec
ies)
Loca
litie
s
No.
of
faec
esN
o. o
f st
omac
hsEO
CF
C
lupe
ids
Gad
ids
Sand
eel
sFlatfish
Oth
ers
R
efer
ence
s
Nor
th-w
est A
tlant
ic
Sabl
e Is
land
365
No
17.7
[1.7
–47.
2] (1
)69
.2 [4
9.7–
85.3
] (2)
10.7
[2.9
–19.
4]2.
4 [0
.0–2
.7]
Bow
en &
Har
rison
, 199
4
Nov
a Sc
otia
, ins
hore
106
No
57.2
[9.0
–65.
8](3
)25
.8 [1
4.6–
27.8
](1)
17.0
[8.4
–60.
3] (4
)B
owen
et a
l., 1
993
Nov
a Sc
otia
, offs
hore
37N
o33
.3 [2
0.7–
38.7
](5)
45
.3 [3
2.7–
75.1
] (2)
21.3
[4.2
–26.
6] (6
)B
owen
et a
l., 1
993
Gul
f of S
t Law
renc
e82
No
29 (3
) 37
(1)
727
(7)
Mur
ie &
Lav
igne
, 199
2
Nor
th-e
ast A
tlant
ic
Nor
th-w
est I
cela
nd41
1N
o37
.5 [3
2.5–
38.4
](1,
10)
18.7
[18.
2–21
.4] (
8)43
.8 [4
3.4–
46.1
] (9)
Hau
ksso
n &
Bog
ason
, 199
7
Sout
h Ic
elan
d24
No
80.6
[78.
4–91
.6] (
8)19
.4 [8
.4–2
1.6]
Hau
ksso
n &
Bog
ason
, 199
7
Don
na N
ook
481
Yes
1.3
24.9
[5.5
–50.
6] (1
,14)
26.4
[0.6
–63.
5] (8
)33
.7 [0
.3–7
3.7]
(11,
12)
13.6
[0.0
–42.
8]
Prim
e &
Ham
mon
d, 1
990
Mor
ay F
irth
35N
o6.
5 [0
–9.2
] (1,
14)
72.3
[61–
100]
(8)
5.7
[0–8
.1] (
21)
15.4
[0–2
1.7]
(22)
Pier
ce e
t al.,
199
1
Mor
ay F
irth
95N
o0.
87.
069
.1 (8
)14
.3 (1
3)8.
0 (1
5)Th
omps
on e
t al.,
199
6
Ork
ney
993
Yes
34.3
[23–
56] (
1,16
)42
.2 [8
–68]
(8)
16.2
[6–5
1] (1
7)7.
7 [0
–13]
Ham
mon
d et
al.,
199
4b
Out
er H
ebrid
es51
1Ye
s+
44.9
[17–
68] (
1,14
,16)
20.4
[0–4
3] (8
)17
.9 [9
–30]
(18)
16.9
[1–6
7] (2
0)H
amm
ond
et a
l., 1
994a
Inne
r Heb
rides
238
Yes
1.8
53.3
[38–
80] (
1,16
)4.
2 [0
–13]
(8)
9.8
[0–3
1] (1
9)32
.7H
amm
ond
et a
l., 1
994a
Irel
and
284
–40
.1 (2
3,14
)2.
2 (8
)40
.6 (1
7)17
.1 (1
5)M
. McK
ibbe
n, u
npub
lishe
d
Irel
and
37–
91.3
[84–
95] (
14, 2
3)0.
11.
4 [1
–2.2
]7.
1 [4
–13.
5] (1
5)M
. McK
ibbe
n, u
npub
lishe
d
Brit
tany
145
Yes
11.9
(24)
0.4
5.0
(17)
82.7
(25)
this
wor
k
Brit
tany
14Ye
s11
.4 (2
3, 2
6)2.
985
.7 (2
7, 2
8)th
is w
ork
EOC
F, e
rode
d ot
olith
cor
rect
ion
fact
or; (
1) G
adus
mor
hua;
(2) A
mm
odyt
es d
ubiu
s; (3
) Clu
pea
hare
ngus
; (4)
Sco
mbe
r sco
mbr
us; (
5) M
erlu
cciu
s bili
near
is; (
6) sq
uids
; (7)
Mal
lotu
s vill
osus
; (8)
San
d ee
ls; (
9) A
narh
icha
s lup
us;
(10)
Pol
lach
ius v
irens
; (11
) Sol
ea so
lea;
(12)
Lim
anda
lim
anda
; (13
) Pla
ticht
hys fl
esus
; (14
) Mer
lang
ius m
erla
ngus
; (15
) Oct
opus
sp.;
(16)
Mol
va m
olva
; (17
) Ple
uron
ecte
s pla
tess
a; (1
8) L
epid
orho
mbu
s whi
ffiag
onis
; (19
) G
lypt
ocep
halu
s cyn
oglo
ssus
; (20
) Con
ger c
onge
r; (2
1) M
icro
stom
us k
itt; (
22) E
ledo
ne c
irrh
osa;
(23)
Tri
sopt
erus
spp.
; (24
) Cili
ata
mus
tella
; (25
) Lab
rus s
pp; (
26) P
olla
chiu
s spp
.; (2
7) S
epia
offi
cina
lis; (
28) L
olig
o sp
p.
Tab
le 5
. Rev
iew o
f the
gre
y se
al d
iet co
mpo
sitio
n.
262 V. Ridoux et al. Grey seal diet in France
Journal of the Marine Biological Association of the United Kingdom (2007)
Fatty acid profiles
The average fatty acid profiles of the seals sampled in this study are listed separately by year in Table 4. The profiles appeared similar and no significant inter-individual difference was seen in the average Euclidean dissimilarity measures either for within 1999 (6.26 ±3.17), within 2002 (6.22 ±3.14) or between 1999 and 2002 (6.09 ±1.92). The inter-population distance measure Dfap was zero, meaning that no significant difference was found between the 1999 and 2002 samples.
As shown from the PCA presented in Figure 3, and not unexpectedly, the French seals cluster out separately from the Isle of May seals. However, whereas the Isle of May’ seals were clearly differentiated by year, there was no such differentiation by year for the French seals. To test the French seals separately a further three PCA analyses were performed using different subsets: firstly, the seven summary category variables (sum of saturated etc.) shown in Table 4 (results not shown); secondly, the 14 most abundant fatty acids amongst all seals (marked with an * in Table 4) (see Figure 4); and thirdly, the 14 fatty acids showing the greatest variance between 1999 and 2002 (marked with a # in Table 4) (results not shown). In all these cases the results were similar to those shown in Figure 3, with no obvious clustering according to year of sampling.
When the distribution of points in the plot shown in Figure 4 are compared to the travel budget details given in Table 1, there is no obvious clustering of seals which spent most of their time in Brittany and those which travelled much further afield. However, a clear pattern arose when one compared the distribution of points to individual body mass (Figure 4), with animals lower than 76 kg and those heavier than this threshold fairly well separated along the first axis of the PCA.
DISCUSSIONGeneral
Being the southernmost permanent grey seal colony in the north-east Atlantic, the Molène Archipelago is home to only a limited number of individuals and therefore gathering very large collections of food material or blubber samples is not possible over a realistic period of time. In order to draw a more complete picture of the feeding ecology of the grey seal at the southern limit of its range, the present approach aimed at compensating for the rather limited sample sizes by combining independent sources of data: faeces, stomach content and fatty acid signature analyses. Each of those has its specific methodological advantages and limitations.
Faeces and stomach content analyses reflect the food composition during the day prior to sampling and give access to prey size-ranges and a quantified species composition of the diet. Extensive literature has reported on biases associated to prey-specific differential transit patterns in the digestive tract and differential erosion of diagnostic parts (e.g. Bigg & Fawcett, 1985; Harvey & Antonelis, 1994; Yonezaki et al., 2003). These biases, which affect the probability that a prey eaten is recovered and the ability to back-calculate original prey body mass, are fully acknowledged here. In an attempt to partly cope with the erosion bias, otolith lengths
were corrected by using published correction factors in the scat analysis and not in the stomach content analysis. We considered that otoliths found in scats had undergone a full digestion process whereas those from stomach content had not, since the latter were most often recovered directly from fish skulls and consequently had suffered little digestion if at all. We did not attempt to correct for possible difference in transit patterns; however, the interpretation of the difference in food composition derived from scats as opposed to stomachs will consider the possibility that squid beaks may accumulate in the stomach and be predominantly rejected orally rather than in the faeces (see below).
Fatty acid profiles have the potential to provide dietary information integrated over time scales determined by the turnover rate of the tissue in which they are analysed, typically a few weeks in the case of the blubber (Iverson et al., 1995). Firstly, this technique can reveal qualitative differences in diet between individuals or groups of individuals without specifying what prey species had been eaten (Iverson et al., 1997; Walton et al., 2000). In addition to this, quantitative dietary data can now be obtained by using quantitative fatty acid signature analysis (QFASA) when a complete library of prey fatty acid profiles is available (Iverson et al., 2004). In the present case, the available prey library was incomplete and a full QFASA analysis could not be carried out.
In spite of these limitations, the present study provides original data from a previously undocumented area, allows comparisons with other sites within the north-east Atlantic range of the species and sheds some light on inter-individual heterogeneity of the diet.
Geographical variations of the diet
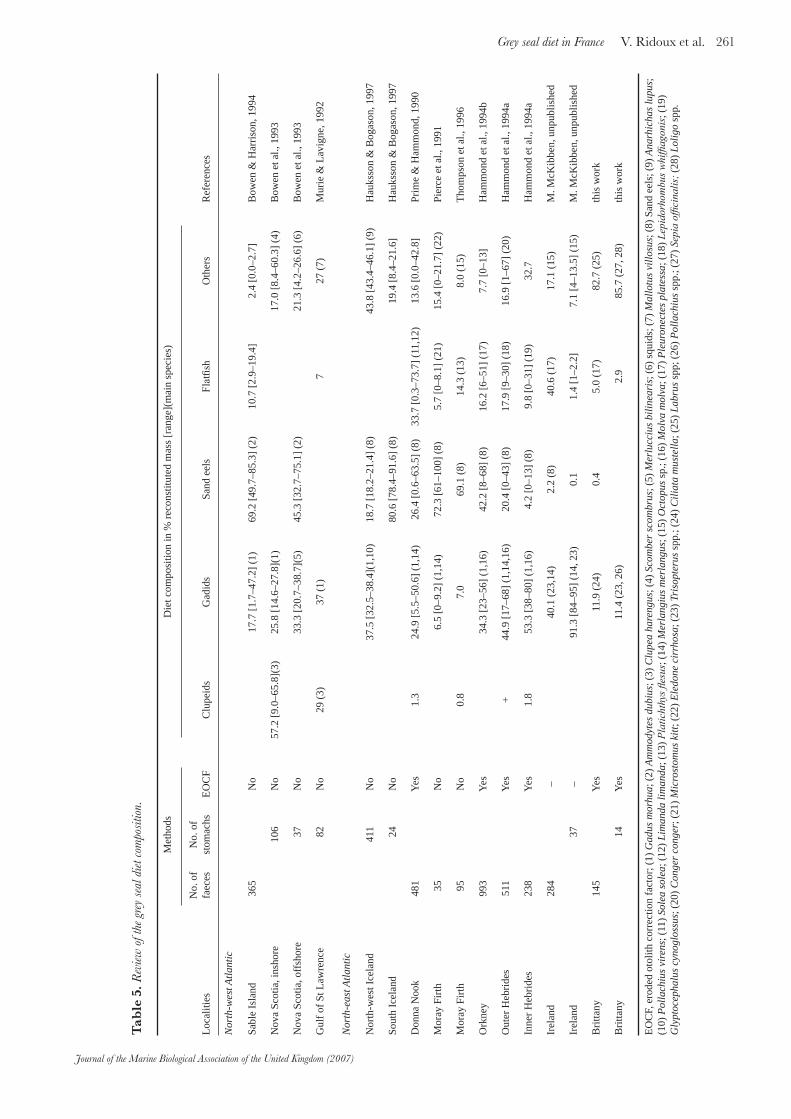
None of the major prey species found at the Molène Archipelago (wrasse, sea bass, conger eel and cuttlefish) was previously reported to be of any importance in the food of the grey seals from core areas (Table 5). Indeed, cod, Gadus morhua, whiting, Merlangius merlangus, sand eels, Ammodytidae, plaice, Pleuronectes platessa, and herring, Clupea harengus, were the commonest prey in most previous study sites, often accounting for up to 50–90% by mass of the diet (Table 5). All these species account for a negligible part of the grey seal diet in Brittany, while most occur in Brittany waters (whiting, plaice, and sand eels to a lesser extent, constitute commercially exploited resources; cod and herring are rare).
In regard to the fatty acid studies, the blubber profiles of the French grey seals are basically similar to those reported for other grey seals found in European waters (e.g. Walton & Pomeroy 2003), in that they contain a wide variety of fatty acids, rich in poly-unsaturated fatty acids especially of the n-3 series. No major differences in fatty acid profiles were detected by the Dfap measure or by PCA, between those seals sampled in 1999 and those in 2002, implying that no major change in diet during this time had occurred. In contrast, a clear difference was found with samples collected on the Isle of May, which is in line with results obtained from scats and stomachs (Table 5).
Inter-individual variations of the diet
The comparison of scat versus stomach contents on the one hand, and the structuring of fatty acid profiles on the
Journal of the Marine Biological Association of the United Kingdom (2007)
263Grey seal diet in France V. Ridoux et al.
other hand suggest some degree of differentiation of the diet amongst grey seal in Brittany.
The PCA is not a statistical test in itself, but, as it does not require prior classifications of the data, it does give a useful visual representation of the natural spread of the data and allows one to look for possible clustering which can then be analysed using other statistical tests. No obvious clustering could be seen which related fatty acid profiles to where the seals spent their time, according to the satellite tracking data, given in Table 1. It could be argued that fatty acid profiles related to the diet eaten before, and not during the satellite tracking. Although it would have been preferable to recapture the same individuals after their tracking, this is highly improbable due to seal movements and logistical difficulties in targeting one individual for the catch. Nevertheless, we suggest that the seals’ behaviour recorded by the tags over several months was typical of their behaviour prior to capture. Then one might have expected to see dietary differences between those seals which stayed over several months close to the Brittany shore compared to those which travelled longer distances, such as to England (Vincent et al., 2005). The absence of clustering related to travelling patterns would suggest that the general diet is grossly the same at the geographical scale at which these movements occur in the western English Channel.
Other sources of inter-individual variability in the diet relate to body size or age of the animals. The difference in the diet and prey sizes described from the analysis of the faeces (>50%M wrasse; prey of 698 g on average) as opposed to the stomach samples (>50%M cuttlefish; prey of 279 g on average) could be interpreted either as methodologically-driven, or related to age or size of the animals. Indeed, squid beaks could be eliminated orally and therefore would be over-represented in the stomachs and under-represented in the scats. Alternatively, this difference could ref lect a real change in the diet between yearlings and adults. Indeed, all stomachs but one were obtained from by-caught individuals in their first year of life, whereas collecting scats was possible only at moulting sites, a circumstance where adult males largely predominate in the seal assemblage of the Molène Archipelago (Vincent et al., 2005). The fatty acid data concur with the hypothesis of an age-related change in the diet and suggest that some degree of ontogeny of foraging techniques occurred and was expressed by a change in diet composition with body mass; this change is the major structuring pattern visible along the first axis of the PCA.
Potential for interactions with local fisheries
Irrespective of their actual commercial importance—for instance, wrasse are mainly used as bait for the lobster and crab pot fishery whereas the sea bass is a highly valued species—it appears that most of the prey species identified in the food of the grey seal are also targeted by professional and/or recreational fisheries in the area. Additionally, several prey size-ranges also partly overlap with marketed size-ranges for several species. However, more information is needed to quantify the removals generated by the increasing number of seals dwelling in this area and compare them to human removals. In particular, it is crucial to determine seasonal
changes in seal numbers and their age/gender composition, calculate their annual energy requirements, determine food composition and energy content and assess the spatial extent of seal predation around their haul-out sites. The present work provides baseline information for one of these different facets. Another further step would be to assess whether the removals performed by one of the consumers (seals or fisheries) would have any effect on the capacity of the other to exploit these resources.
Many thanks are due to Jean-Yves Le Gall and David Bourles (Réserve Naturelle de l’Iroise), Laureline Meynier, Mathias Rouan and trainers from Océanopolis who helped in collecting scats on haul-out sites. We are also very much indebted to fishermen and observers of the French National Stranding Network who reported or brought back on land stranded or by-caught carcasses of seals. We wish to thank Emer Rogan and Maggy McKibben for sharing data on grey seals diet in Ireland. This work was part of a research and management project funded by the European Community, the Regional Council of Brittany and the French Ministries of Education and Research and of the Environment.
REFERENCESBigg, M.A. & Fawcett, I., 1985. Two biases in diet determination
of northern fur seals (Callorhinus ursinus). In Marine mammals and fisheries (ed. J.R. Beddington et al.), pp. 284–291. Boston, USA: George Allen & Unwin.
Bowen, W.D., Lawson, J.W. & Beck, B., 1993. Seasonal and geographic variation in the species composition and size of prey consumed by grey seals (Halichoerus grypus) on the Scotian shelf. Canadian Journal of Fisheries and Aquatic Sciences, 50, 1768–1778.
Bowen, W.D. & Harrison, G.D., 1994. Offshore diet of grey seals Halichoerus grypus near Sable Island, Canada. Marine Ecology Progress Series, 112, 1–11.
Clarke, M.R., 1986. A handbook for the identification of cephalopod beaks. Oxford: Clarendon Press.
Croxall, J.P., 1993. Diet. In Antarctic seals (ed. R.W. Laws), pp. 268–290. Cambridge: Cambridge University Press.
Folch, J, Lees, M. & Sloane Stanley, G.H., 1957. A simple method for the isolation and purification of total lipids from animal tissues. Journal of Biological Chemistry, 226, 497–509.
Gérondeau, M., Barbraud, C., Ridoux, V. & Vincent, C., 2007. Abundance estimate and seasonal patterns of grey seal (Halichoerus grypus) occurrence in Brittany, France, as assessed by photo-identification and capture–mark–recapture. Journal of the Marine Biological Association of the United Kingdom, 87, 365–372.
Hammond, P.S., Hall, A.S. & Prime, J.H., 1994a. The diet of grey seals in the inner and outer Hebrides. Journal of Applied Ecology, 31, 737–746.
Hammond, P.S., Hall, A.S. & Rothery, P., 1994b. Consumption of fish prey by grey seals. In Grey seals in the North Sea and their interactions with fisheries, pp. 35–69. Final Report to the Ministry of Agriculture, Fisheries and Food, Contract no. MF0503. St Andrews, UK: Sea Mammal Research Unit.
Härkönen, T., 1986. Guide to the otoliths of the bony fishes of the northeast Atlantic. Hellerup: Danbiu ApS. Biological Consultants.
Härkönen, T., Brasseur, S.,Teilmann, J.,Vincent, C., Dietz, R., Abt, K. & Reijnders, P., in press. Status of grey seals along mainland Europe from the southwestern Baltic to France. Tromsø: NAMMCO Scientific Publications.
Harvey, J.T. & Antonelis, G.A., 1994. Biases associated with non-lethal methods of determining the diet of northern elephant seals. Marine Mammal Science, 10, 178–187.
264 V. Ridoux et al. Grey seal diet in France
Journal of the Marine Biological Association of the United Kingdom (2007)
Hauksson, E. & Bogason V., 1997. Comparative feeding of grey (Halichoerus grypus) and common seals (Phoca vitulina) in coastal waters of Iceland, with a note on the diet of hooded (Cystophora cristata) and harp seals (Phoca groenlandica). Journal of Northwest Atlantic Fisheries Science, 22, 125–135.
Iverson, S.J., Field, C., Bowen, W.D. & Blanchard, W. 2004. Quantitative fatty acid signature analysis: a new method of estimating predator diets. Ecological Monographs, 74, 211–235.
Iverson, S.J., Frost, K.J. & Lowry, L.F., 1997. Fatty acid signatures reveal fine scale structure of foraging distribution of harbour seals and their prey in Prince William Sound, Alaska. Marine Ecology Progress Series, 151, 255–271.
Iverson, S.J., Oftedal, O.T., Bowen, W.D., Boness, D.J. & Sampugna, J., 1995. Prenatal and postnatal transfer of fatty acids from mother to pup in the hooded seal (Cystophora cristata). Journal of Comparative Physiology, 165, 1–12.
Murie, D.J. & Lavigne, D.M., 1992. Growth and feeding habits of grey seals (Halichoerus grypus) in the northwestern gulf of Saint-Lawrence, Canada. Canadian Journal of Zoology, 70, 1604–1613.
Pierce, G.J. & Boyle, P.R., 1991. A review of methods for diet analysis in piscivorous marine mammals. Oceanographic Marine Biology. Annual Review, 29, 409–486.
Pierce, G. J., Miller, A., Thompson, P.M. & Hislop, J.R.G., 1991. Prey remains in grey seal (Halichoerus grypus) faeces from the Moray Firth, north-east Scotland. Journal of Zoology, 224, 337–341.
Pierce, G.J., Boyle, P.R., Watt, J. & Grisley, M., 1993. Recent advances in diet analysis of marine mammals. In Marine mammals: advances in behavioural and population biology (ed. I.L. Boyd), pp. 241–261. Oxford, Oxford Science Publications, Zoological Society of London Symposia, 66.
Prime, J.H. & Hammond, P.S., 1990. The diet of grey seals from the south-western North Sea assessed from analyses of hard parts found in faeces. Journal of Applied Ecology, 27, 435–447.
Reynolds, J.C. & Aebischer, N.J., 1991. Comparison and quantification of carnivore diet by faecal analysis: a critique, with recommendations, based on the study of the fox, Vulpes vulpes. Mammal Review, 21, 97–122.
Ridoux, V., 1994. The diets and dietary segregation of seabirds at the subantarctic Crozet Islands. Marine Ornithology, 22, 1–192.
Sea Mammal Research Unit (SMRU), 2004. Scientific advice on matters related to the management of seal populations: 2004. UK Special Committee On Seals, 99pp.
Thompson, P.M., McConnell, B.J., Tollit, D.J., McKay, A., Hunter, C. & Racey, P.A., 1996. Comparative distribution, movements and diet of harbour and grey seals from the Moray Firth, NE Scotland. Journal of Applied Ecology, 33, 1572–1584.
Tollit, D., Greenstreet, S.P.R. & Thompson, P.M., 1997. Prey selection by harbour seals, Phoca vitulina, in relation to variations in prey abundance. Canadian Journal of Zoology, 75, 1508–1518.
Vincent, C. 2001. Ecological bases for the conservation of the grey seal, Halichoerus grypus, in the Iroise Sea, France. PhD thesis, Université de Bretagne Occidentale, Brest, France.
Vincent, C., Fedak, M.A., McConnell, B.J., Meynier, L., Saint-Jean, C. & Ridoux, V., 2005. Status and conservation of grey seal, Halichoerus grypus, in France. Biological Conservation, 126, 62–73.
Walton, M.J., Henderson, R.J. & Pomeroy, P.P., 2000. Use of blubber fatty acid profiles to distinguish dietary differences between grey seals Halichoerus grypus from two UK breeding colonies. Marine Ecology Progress Series, 193, 201–208.
Walton, M.J. & Pomeroy, P.P., 2003. Use of blubber fatty acid profiles to detect inter-annual variations in the diet of grey seals. Marine Ecology Progress Series, 248, 257–266.
Yonezaki, S., Kiyota, M., Baba, N., Koidi, T. & Takemura, A., 2003. Size distribution of the hard remains of prey in the digestive tract of northern fur seal (Callorhinus ursinus) and related biases in diet estimation by scat analysis. Mammal Study, 28, 97–102.
Submitted 7 June 2006. Accepted 24 October 2006.