Empires of Forestry: Professional Forestry and State Power in Southeast Asia, Part 1

F
Gf
BRa
b
c
Md
e
a
ARRA
KLMG
1
taot0t(ewe
ooAwtf
f
0d
ARTICLE IN PRESSG ModelORECO-12296; No. of Pages 13
Forest Ecology and Management xxx (2010) xxx–xxx
Contents lists available at ScienceDirect
Forest Ecology and Management
journa l homepage: www.e lsev ier .com/ locate / foreco
reenhouse gas emissions between 1993 and 2002 from land-use change andorestry in Mexico
en de Jonga,∗, Carlos Anayab, Omar Maserac, Marcela Olguína, Fernando Pazd, Jorge Etcheversd,ené D. Martínezc, Gabriela Guerreroc, Claudio Balbontíne
El Colegio de la Frontera Sur, Unidad Villahermosa, Carretera a Reforma km. 15.5, Ra Guineo 2da Sección, Villahermosa, C.P. 86280, Tabasco, MexicoInstituto Potosino de Investigación Científica y Tecnológica, Camino a la Presa San José 2055, Col. Lomas 4a sección, C.P. 78216, San Luis Potosí, S.L.P., MexicoCentro de Investigaciones en Ecosistemas, UNAM, Campus Morelia, Antigua Carretera a Pátzcuaro No. 8701 Col. Ex-Hacienda de San José de La Huerta C.P. 58190,orelia, Michoacán, MexicoColegio de Postgraduados, Campus Montecillo, km 35.5 Carretera México-Texcoco, C.P. 56230, Montecillo, Edo de México, MexicoUniversidad de Castilla La Mancha, Instituto Desarrollo Regional – Teledetección y SIG, 02071, Albacete, Spain
r t i c l e i n f o
rticle history:eceived 3 February 2010eceived in revised form 4 August 2010
a b s t r a c t
In this paper we present the Mexican inventory of greenhouse gas (GHG) emissions from the land-usesector. It involved integration of forest inventory, land-use and soil data in a GIS to estimate the net flux
ccepted 7 August 2010
eywords:and-use changeexico
of GHG between 1993 and 2002.The net GHG flux of 86.9 (±34.4%) Tg CO2 y−1 resulted from the balance of emissions of 64.5
(±12%) Tg CO2 y−1 from biomass loss, 4.9 (±259%) Tg CO2 y−1 from managed forests, and 30.3(±106%) Tg CO2 y−1 from mineral soils, and the removals of 12.9 (±36%) Tg CO2 y−1 in abandoned lands.Main sources of uncertainty include lack of integrated soil and biomass data and the impact of the variousmanagement practices on biomass. Key factors are identified to improve GHG inventories and to reduce
HG inventoriesuncertainty.. Introduction
Climate change is considered the most important environmen-al problem of the present century (Denman et al., 2007). Recentnalysis of global temperature change indicates that the emissionsf greenhouse gases (GHGs) to the atmosphere have contributedo the increase of the global mean temperature by approximately.8 ◦C during the past century. In the past 30 years (1975–2005)he rate of global warming was calculated at +0.2 ◦C per decadeHansen et al., 2006). The expected impacts of climate change oncosystems and human societies, has prompted efforts to estimateith higher precision the current emissions of GHGs and its future
volution, as well as to assess options to reduce these emissions.The land-use, land-use change and forestry (LULUCF) sector is
ne of the six major sources of GHGs, particularly of carbon dioxider CO2 (Watson et al., 2000; Prentice et al., 2001; Houghton, 2003;
Please cite this article in press as: de Jong, B., et al., Greenhouse gas emiin Mexico. Forest Ecol. Manage. (2010), doi:10.1016/j.foreco.2010.08.0
chard et al., 2004). At a global scale, in 2004 the LULUCF sectoras the third source sector of GHGs emissions, with about 17% of
otal emissions, after Energy Supply and Industry that accountedor about 26 and 19%, respectively, of total emissions (IPCC, 2007).
∗ Corresponding author. Tel.: +52 993 3136110x3401;ax: +52 993 3136110x3001.
E-mail addresses: [email protected], [email protected] (B. de Jong).
378-1127/$ – see front matter © 2010 Elsevier B.V. All rights reserved.oi:10.1016/j.foreco.2010.08.011
© 2010 Elsevier B.V. All rights reserved.
Terrestrial ecosystems play an important role in the global carboncycle and changes in land-use and land-cover (LU/LC) affect thisrole (Brown and Lugo, 1982; Prentice et al., 2001). Changes in LU/LCaffect the amount of carbon stored in vegetation and soil, thereby,either releasing CO2 to, or removing it from, the atmosphere. Theemission of carbon may result from burning, decomposition of deadbiomass and conversion of high-biomass forests to low-biomassland uses such as pasture, whereas the removal of CO2 results fromgrowing vegetation where we observe an increase in biomass. Thus,terrestrial ecosystems can switch between a carbon source andsink, depending if the specific area is being disturbed, managedor recovering biomass. Deforestation in the tropical regions is themain source of ecosystem derived CO2 emissions according to anal-yses of land-use change at a global scale (Houghton, 2003; Achardet al., 2004). However, there is still a high degree of uncertainty inthe estimates. Consequently, more detailed national inventories ofCO2 and other GHG emissions from forest conversion in tropicalcountries are especially important to better understand the roleof land-use change dynamics in the global carbon cycle and thepotential to reduce these emissions.
ssions between 1993 and 2002 from land-use change and forestry11
In Mexico, the LULUCF sector was considered the second sourceof GHG emissions after fossil fuel consumption, with a total of112 Tg CO2 y−1 (INE-SEMARNAT, 2001). However, this estimate wasbased on default and project-based data from the literature. In thelast decade, Mexico has gathered national information including

INF
2 and M
srmotlldfeatTibt(M2
2
2
ttbu(eslC1baflatsaCssbaotatldtiobnf
2
c(
ARTICLEG ModelORECO-12296; No. of Pages 13
B. de Jong et al. / Forest Ecology
ystematically collected spatially explicit data that allow for a moreeliable GHG inventory. This article summarizes the results of aajor research project aimed at developing a national inventory
f GHG emissions from the LULUCF sector in Mexico from 1993o 2002. The project involved a comprehensive effort to calcu-ate changes in land-use by integrating various geographic mapayers and carbon stocks derived from forest and soil inventoryata, and combining these spatially explicit data with emissionactors derived from national governmental and specialized lit-rature sources to estimate the net flux of GHG. The project alsoimed at identifying and quantifying the sources of uncertaintyo give direction for ongoing and future data collecting activities.he results serve as a basis to define what additional informations required in order for Mexico to enter in international forestry-ased mitigation efforts, such as the emerging financial mechanismo reduce emissions from deforestation and forest degradationREDD+). The project was part of the national GHG inventory of
exico where national emissions were reported up to the year002 (INE-SEMARNAT, 2006).
. Methods
.1. LULUCF sector
The methodology we used follows the approach proposed byhe IPCC (mainly IPCC, 1997; with minor adjustments accordingo IPCC, 2003). This approach is based on assessing changes iniomass and soil carbon stocks in forests and forest-derived landses due to human activities and relies on two related premises:1) the flux of carbon to or from the atmosphere is assumed to bequal to changes in carbon stocks in existing biomass and mineraloils, and (2) changes in carbon stocks can be estimated by estab-ishing rates of change in area by land-use and related changes in
stocks, and the practices used to carry out the changes (IPCC,997). The methodology does not take into account natural car-on fluxes from unmanaged land, as it only requests reporting ofnthropogenic emissions. GHG inventories typically report the netuxes (emissions by sources and removals by sinks) of GHG to thetmosphere. For the LULUCF sector, the IPCC methodology requireshat such fluxes are estimated on the basis of net changes in carbontocks in four categories: (a) forest and grassland conversion; (b)bandonment of croplands, pastures and other managed land; (c)O2 emissions and removals from soils; and (d) changes of biomasstocks in forests due to management practices. We focus on emis-ions and removals of CO2 in living above- and below groundiomass and soil organic matter, for which national data werevailable. No quantitative data are available in Mexico for deadrganic matter and litter pools and were therefore excluded fromhe analysis. Emissions from forest disturbances, such as stormsnd insects are also excluded, as total reported areas disturbed byhese regimes are less than 1% of total area of managed forest orand converted from one LU class to another. Fire statistics do notistinguish human-induced fires to clear grasslands and agricul-ural lands (where relatively small amounts of biomass is burnedn each fire) from fires used to burn biomass during conversionf forests to other land uses (where large amounts of biomass isurned). Therefore we only take into consideration emissions ofon-CO2 gases from fires, when it concerns loss of biomass during
orest conversion (see next section).
Please cite this article in press as: de Jong, B., et al., Greenhouse gas emiin Mexico. Forest Ecol. Manage. (2010), doi:10.1016/j.foreco.2010.08.0
.2. Forest and grassland conversion
This section deals with the emissions of GHG derived from theonversion of forests and grasslands to other land-use/land-coverLU/LC) classes. To estimate such emissions, information is required
PRESSanagement xxx (2010) xxx–xxx
about the rates of land conversion to each other LU/LC class andcarbon losses or gains due to these changes. Land conversion isgenerally derived from land-use statistics or land-use maps fromdifferent years.
We used two land-use maps to assess the LU/LC changes in Mex-ico between 1993 and 2002. Both maps (scale 1:250,000) weredeveloped by the Instituto Nacional de Estadística Geográfica eInformática (INEGI, 1996, 2005), derived from manual interpre-tation of Landsat TM imagery and field verification. These mapsshow the distribution of more than 60 vegetation classes presentin Mexico. Forests are presented in one of four successional cate-gories: mature vegetation, secondary vegetation with a tree-, shrub,or herbaceous-dominated cover. Natural scrubland is presentedin two categories: mature and secondary. Other natural land-useclasses include natural grasslands and various wetland vegetationtypes, among the most important classes. Various agricultural andanimal husbandry classes are also distinguished in the maps, butthe emissions from these latter were not taken into account. Wereclassified the natural vegetation classes into 11 categories, pri-marily based on their similarity in biomass stocks: (1) Coniferousforest (mainly pines; CF), (2) mixed Coniferous-broadleaved forest(predominantly pine-oak; CBF), (3) broadleaved forest (predom-inantly oak; BF), (4) tropical humid forest (THF), (5) tropical dryforest (TDF), (6) mangrove forest (MG), (7) scrubland (SL), (8) palmforest (Palms), (9) natural grasslands (GR), (10) wetlands (WT) and(11) a composed class (IAPF) of agriculture, pasture land and differ-ent types of plantations. Additionally, forests (1–6) were separatedinto two successional stages: (1) mature and tree dominated sec-ondary vegetation; and (2) secondary vegetation dominated byshrubs or herbaceous plants (sec). A composite class named “Oth-ers” refers to subtropical deserts, bare lands, human settlement,urban areas and water bodies. Thus a total of 18 LU/LC classes weredistinguished. Both maps were reclassified and we quantified theLU/LC changes between 1993 and 2002, applying a GIS-overlay pro-cedure. Finally, we calculated the rates of annual LU/LC changedividing the total change by the number of years for the periodof analysis (9 years), thus assuming a linear change in land-usebetween 1993 and 2002.
Forest biomass was estimated using a dataset of about 16,000geo-referenced inventory plots (1000 m2 each), systematically dis-tributed over the terrestrial ecosystems of Mexico (Fig. 1, SARH,1994). The distance between the plots varied according to the veg-etation type, with shorter distances between plots in forest land(5 km) as opposed to plots located in desert vegetation (25 km).Data collected in each plot included: individual tree diameter(DBH = 1.30 m), height and species of all trees >10 cm DBH, groundcover of shrub and herbaceous vegetation and data on naturalregeneration of trees (SARH, 1994).
Aboveground biomass in live and dead trees was estimatedusing published allometric equations for three groups of treespecies (broadleaved, conifers, palms; Table 1). For broadleavedspecies we used four equations that discern four different rainfallregimens (<800, 800–1500, 1500–4000, >4000 mm). Root biomassdensities were estimated using a biomass expansion factor (Cairnset al., 1997). Shrub biomass in primary and secondary forests wasestimated by multiplying the cover data by scrub biomass densityreported in the Mexican GHG Inventory of 2000 (INE-SEMARNAT,2001). Biomass per plot (Mg ha−1) was estimated as the sum ofabove and below ground tree and shrub biomass. Other carbonpools (except for soil) were not considered, as no quantitativedata were available. The inventory plots were measured during
ssions between 1993 and 2002 from land-use change and forestry11
1992–1994 and are thus closely related to the land-use and land-cover map of the year 1993 (INEGI, 1996). We therefore usedthis map to determine the land-use class of each inventory plotand to estimate the average biomass density in each vegetationclass. Geographic variation of biomass densities within each veg-

ARTICLE IN PRESSG ModelFORECO-12296; No. of Pages 13
B. de Jong et al. / Forest Ecology and Management xxx (2010) xxx–xxx 3
Table 1Allometric equations used to estimate tree biomass (kg of dry matter).
Tree species group Mean annual precipitation Equation Source
Aboveground biomass
Broadleaves
<800 mm 10(−0.535 + log10(BA)) Brown(1997)800–1500 mm Exp(−1.996 + 2.32 × ln(DBH))
1500–4000 mm Exp(−3.1141 + 0.9719 × ln(DBH2 × H)) Brown et al. (1989)>4000 mm Exp(−3.3012 + 0.9439 × ln(DBH2 × H)) Brown et al. (1989)
Conifers All Exp(−1.170 + 2.119 × ln(DBH)) Brown (1997)Palms All >7.5 cm DAP; 10 + (6.4H) Brown (1997)
N TAB = t
ebmrMPeatcbss
c
�
wotccfFr
Root biomassBroadleaves conifers palms All
otes: DBH = diameter at breast height (cm); H = height (m); BA = basal area (cm2);
tation class was tested using the ecoregion map provided to usy INEGI (2000). The ecoregions define spaces in an ecologicallyeaningful way, and are useful for national and regional envi-
onmental resource inventories and assessments (CEC, 1997). Forexico, seven ecoregions have been described (CEC, 1997): Great
lains, North American Deserts, Mediterranean California, South-rn Semi-Arid Highlands, Temperate Sierras, Tropical Dry Forestsnd Tropical Humid Forests. Biomass densities of a vegetation classhat show a significant (P < 0.05) variation among ecoregions, werealculated separately for each ecoregion. It was assumed that theiomass density within each LU/LC class did not change in bothtudy years other than those changes calculated in the managementection (Section 5).
The change in carbon stocks in living biomass due to LU/LChanges was calculated using Eq. (1).
CBLConversion=
∑
ij
(BBeforeij− BAfterij
) × �ATo-Landij× FC (1)
here �CBLConversionis the change in carbon stocks in living biomass
n forests lands annually converted to other LU/LC class, BBeforeijis
he average biomass stock on LU/LC class i and ecoregion j before
Please cite this article in press as: de Jong, B., et al., Greenhouse gas emiin Mexico. Forest Ecol. Manage. (2010), doi:10.1016/j.foreco.2010.08.0
onversion, BAfterijis the biomass stock on LU/LC immediately after
onversion of forest i in ecoregion j, �ATo-Landijis the area of land
orest i on ecoregion j annually converted to other LU/LC class,C is the carbon fraction in the dry matter (default 0.5), i rep-esents the LU/LC classes and j represents the ecoregions. After
Fig. 1. Distribution of the forest inventory plots 1992–1994 (INF 1994, ca. 1
Exp(−1.0587 + 0.8836 × ln(TAB)) Cairns et al. (1997)
otal aboveground biomass (Mg ha−1).
conversion, forests lands change to several LU/LC class types; con-sequently, BAfter was calculated as the weighted average of thebiomass stocks in LU/LC classes immediately after conversion ofland forest i weighted by the �ATo-Landij
. Finally, we estimated thecarbon emissions as carbon losses due to burning and natural decayseparately, as is suggested by IPCC (2003). This approach addressesburning for the purposes of land clearing, and is used to estimate theemissions of non-CO2 trace gases that occur as a result of biomassburning. The method consists in multiplying the changes of thebiomass carbon stocks that occurred in a LU/LC class by the frac-tions of such stocks that were burned and oxidized on and off thesites (IPCC, 2003). For this estimation we assumed that 50% of thecleared biomass was burned in the first year, with the remaining50% left to decay. The default method for estimating carbon emis-sions from decay assumes that all biomass decays over a periodof 10 years; however, we report all emissions from decay in yearone (the year of change). Emissions of non-CO2 greenhouse gases(CH4, CO, N2O and NOx) from biomass burning were estimated bymultiplying the total carbon released by the emission ratios of suchgases (Eq. (2)). In this calculus we used default emission ratios foropen burning of cleared forests (IPCC, 2003).
CH4 emission = (Creleased) × (emission ratio) × 16/12 (2)
ssions between 1993 and 2002 from land-use change and forestry11
CO emission = (Creleased) × (emission ratio) × 28/12
N2O emission = (Creleased) × (N/C ratio)×(emission ratio)×44/28
6,000 plots), and mean rainfall. Each point represents a sample plot.

ARTICLE IN PRESSG ModelFORECO-12296; No. of Pages 13
4 B. de Jong et al. / Forest Ecology and Management xxx (2010) xxx–xxx
RNAT
N
2l
(scaodawcyfu
�
w
aAcudi(u
2
aGSof
Fig. 2. Distribution of the soil sample points (SEMA
Ox emission = (Creleased) × (N/C ratio)×(emission ratio)×46/14
.3. Abandonment of croplands, pastures and other managedands
This section addresses the removal of carbon in abandoned landsagriculture and pasture land converted to secondary forest andecondary forest converted to forest). Only the accumulation ofarbon in the aboveground biomass is considered in this section,s no data are available on carbon accumulation in other poolsf abandoned land. The methods employed to estimate the aban-oned areas during the period of 1993–2002 were taken from thenalysis of LU/LC change described above (Section 1). Additionally,e conducted a cartographic analysis to estimate the removal of
arbon in managed lands that were abandoned for more than 20ears, as is suggested by the IPCC (1997). This analysis was madeollowing the same procedures described in the previous section,sing the 1976 and 2002 land-use maps (INEGI N.D.; INEGI, 2005).
The removal of carbon was estimated using Eq. (3).
CBGconversion=
∑
i
(�Ai × Gi) × CF (3)
here �CBGconversionis the annual increase in carbon stocks due to
boveground biomass increment in lands converted to forest lands,i is the forest area of the class i that originated from another LU/LClass, Gi is the average annual aboveground biomass increment innits of dry matter of forest type i, CF is the carbon fraction ofry matter (default = 0.5), and i represent the forest class. Biomass
ncrement data were derived from SARH (1994) and CONAFOR2005), except for mangroves for which IPCC default values weresed (IPCC, 1997).
.4. CO2 removals and emissions from soils
Soil organic carbon (SOC) was determined at 0–30 cm depth
Please cite this article in press as: de Jong, B., et al., Greenhouse gas emiin Mexico. Forest Ecol. Manage. (2010), doi:10.1016/j.foreco.2010.08.0
s is suggested by IPCC (1997). SOC data were obtained from twoIS databases derived from studies performed at a national scale:EMARNAT-CP (2002) and INEGI (unpublished data covering vari-us years of collection from 1968 to 2000). No other database existsor soil carbon at a national scale in Mexico. All data were geo-
-CP, 2002). Each soil profile is represented by a dot.
referenced. SOC concentrations from SEMARNAT-CP correspondedto 0–20 cm soil depth and included bulk density, whereas INEGI’sdata corresponded to 0–30 cm soil depth and did not include bulkdensity. Consequently, we extrapolated the SEMARNAT-CP’s datato 30 cm depth and estimated bulk density values of data as fol-lows: SOC data from the two GIS data base were classified in soiltype by overlaying them over the national soil map, scale 1:250,000(INEGI, 2002). Subsequently, we performed a quality-control analy-sis that consisted in verifying the congruency between the SOC dataand the soil type and climatic characteristics in which they werecollected. For this analysis we used the following maps: distribu-tions of soil types in Mexico (INEGI, 2002) and Climates of Mexico(García, 1998). In order to recalculate SOC from the 20 cm databaseto 30 cm, we established a relation between 0–20 and 0–30 cm soildepths using 4248 SOC data from the INEGI data base, consider-ing soil type/subtype as criteria of homogeneity. The restitutionequation was:
SOC30 cm = a + bSOC20 cm (4)
where SOC is the soil organic carbon, and “a” and “b” are theparameters from the regression equation. The regression equa-tions for almost all cases were positive and statistically significant(R2 ≥ 0.94; P < 0.05, results not shown).
We used bulk density values of 1820 data points fromSEMARNAT-CP to assign average values for each soil type/subtype(129) and for those cases with not enough comparable data weused bulk density values reported by Batjes (1997). As such, soiltype/subtypes were used as criteria of homogeneity for bulk den-sity and if the SEMARNAT-CP database contained three o more datapoints in a soil type/subtype, the mean value of these points wasused for this particular soil type, but if ≤3 points were available,we used the values proposed by Batjes for this particular soil type.SOC concentration was then converted to SOC content (Mg ha−1)by multiplying the concentration by bulk density and layer depth.Outliers within a particular soil type/subtype were excluded fromthe analysis. The resulting GIS database used was the SEMARNAT-CP (sampled in the period 2000–2002), which contained 4422 SOC
ssions between 1993 and 2002 from land-use change and forestry11
data distributed uniformly over Mexico (Fig. 2).We allocated the soil types recorded in the study to one of five
soil groups proposed by the IPCC (1997): soils with high-activityclay minerals (HAC soils), soils with low activity clay minerals (LACsoils), Sandy soils (soils with >70% sand and <8% clay minerals), Vol-

INF
and M
cWflMlc
baioE
�
wsAt
2
ntd
�
wgal
c
L
wwvstobasotsb
ibowate
ta
�
ARTICLEG ModelORECO-12296; No. of Pages 13
B. de Jong et al. / Forest Ecology
anic soils (soils derived from volcanic ash allophonic mineralogy),etland soils (soils with restricted drainage leading to periodic
ooding and anaerobic conditions); (spodic soils do not exist inexico). Next the data points were geographically joined to the
and-use maps from 1993 and 2002 (INEGI, 1996, 2005) in order toalculate the mean SOC contents in each LU/LC–IPCC soil class.
Carbon emission and removal from mineral soils were estimatedased on the changes in SOC stocks as a function of changes in LU/LCctivities (IPCC, 1997). We employed a 9-year period of changenstead of the recommended 20 years, as this covered the periodf the maps we used (1993–2002). The calculation was made usingq. (5).
CSOCFConversion=
∑
ik
SOCikt× (Aikt
− Aikt−9) (5)
here �CSOCFConversionis the net change in the soil organic carbon
tock due to LU/LC changes; SOC is the soil organic carbon content,is land area, i represent the LU/LC class, k is the soil category andis the particular year.
.5. CO2 emissions and removals from managed forests
Annual carbon emissions from managed forests (according toational and state statistics of forest production) were calculated ashe annual decrease in forest aboveground biomass carbon stocksue to wood extraction using Eq. (6).
CFFL = Ltimber + Lfuelwood (6)
here �CFFL is the annual decrease in carbon stocks due to above-round biomass extraction from managed forests; Ltimber is thennual carbon loss due to felling, and Lfuelwood is the annual carbonoss due to fuelwood gathering for residential use.
Carbon loss due to commercial wood extraction (Ltimber) wasalculated using Formula (7):
timber =∑
s
Hs × Ds × BEFRs × CF (7)
here H is the annual extracted volume of wood; D is the basicood density; BEFR is the biomass expansion factor for converting
olume of extracted wood to total aboveground biomass of a treepecies, CF is the carbon fraction of dry matter (default = 0.5), and s ishe tree species. In this calculus, it is assumed that wood extractionnly affects the aboveground biomass, and that all abovegroundiomass carbon (including dead organic matter) is lost immediatelyfter harvesting. This last assumption considers that the existingtock of long-term forest products do not change over time. Dataf extracted volume of wood were derived from state-level statis-ics and wood density data were obtained from Mexican literatureources. Default biomass expansion factors (IPCC, 2003) were usedecause no data are available for Mexico.
In Mexico, it is estimated that the volume of fuelwood gatherings approximately three times higher than the total commercial tim-er legally harvested in the country (Díaz, 2000). The third categoryf wood consumption is non-authorized harvesting of timber andood for local construction. There are very few reliable statistics
vailable for this category. We applied the uncontrolled extrac-ion rate published by SEMARNAT, although we realize that thisstimation has a high level of uncertainty (SEMARNAT, 1995–2002).
Annual carbon removal in managed forests was estimated as
Please cite this article in press as: de Jong, B., et al., Greenhouse gas emiin Mexico. Forest Ecol. Manage. (2010), doi:10.1016/j.foreco.2010.08.0
he aboveground biomass increment in each area of such forests,ccording to Eq. (8).
CFFG =∑
i
(Ai × Gi) × CF (8)
PRESSanagement xxx (2010) xxx–xxx 5
where �CFFG is the annual increase in carbon stocks due to above-ground biomass increment in managed forest, Ai is the area ofmanaged forests for each forest type, Gi is the average annual incre-ment rate in aboveground biomass in units of dry matter, by foresttype, and CF is the carbon fraction of dry matter (default = 0.5).
For the purpose of this study, managed forests were classifiedas (a) native forests used for commercial felling, (b) commercialplantations, (c) restoration plantations and (d) forests for fuelwoodproduction. In México, the native forests that are used for forestmanagement are: coniferous forests, broadleaved forests, mixedconiferous-broadleaved forests, tropical dry forest, and tropicalmoist forest. The areas managed of each forest type were derivedfrom national sources. The annual aboveground biomass incrementG was calculated using Eq. (9).
G = Iv × D × BEFI (9)
where Iv is the average annual increment in harvestable volume, Dis the basic wood density, and BEFI is the biomass expansion fac-tor to convert annual volume increment to total aboveground treebiomass increment. We used average annual volume increment andwood density data from the 1992–1994 national forest inventory(SARH, 1994) and default BEFI data provided by the IPCC (2003).
2.6. Uncertainty analysis
Uncertainty analysis is required to calculate the confidenceinterval of the fluxes and to prioritize efforts to improve theaccuracy of inventories in the future and guide decisions onmethodological choices. The estimation of the uncertainties asso-ciated to the parameters used in the GHG inventory are based onvariation in (1) measurement data, (2) national and internationalpublished information, (3) IPCC default uncertainties and (4) expertjudgment (IPCC, 2003). In this study, uncertainties in measurementand literature data were used when these were available. In somecases, available uncertainty data were complemented with expertjudgment, and in a few cases, estimates had to rely entirely on IPCCdefault values and associated uncertainties. The uncertainties ofdifferent parameters were combined using the error propagationmethod of TIER 1, as recommended by the IPCC (2003). Uncer-tainties in stock data were derived from spatial variation of stockscalculated from the forest inventory plots and soil sample plots,uncertainties in activity data derived from the land-use maps wereestimated from possible error in polygon delimitation and com-paring the classification with an independently generated nationalland-use map. Uncertainty estimates in national statistics werebased on expert judgement or IPCC defaults.
3. Results
3.1. Forest conversion
Mexico’s land area of about 195 million hectares was coveredin 1993 by tropical highland and lowland forests (36%), scrub-lands (27%) and developed areas, such as agriculture and pasture(22%, Table 2). Approximately 9.3 millions of hectares of forests andscrubland were converted to another land-use class between 1993and 2002, with a conversion rate of 1.0 × 10⁶ ha y−1 (this includesconversion of forests and scrubland of all successional stages toother land-use classes). The rate of forests conversion was higherin tropical humid forest (312 × 103 ha y−1) than in tropical dry for-est (237 × 103 ha y−1), tropical highland forests (CF, CBF and BF;
ssions between 1993 and 2002 from land-use change and forestry11
240 × 103 ha y−1) and scrubland (98 × 103 ha y−1). LU/LC changeswere widely distributed over the forested areas of the country buthad relatively higher rates in the Yucatan peninsula, Southern Mex-ico (Oaxaca, Chiapas, and Tabasco), and in Western Mexico (Jaliscoand Guerrero; Fig. 3).

Please cite this article in press as: de Jong, B., et al., Greenhouse gas emissions between 1993 and 2002 from land-use change and forestryin Mexico. Forest Ecol. Manage. (2010), doi:10.1016/j.foreco.2010.08.011
ARTICLE IN PRESSG ModelFORECO-12296; No. of Pages 13
6 B. de Jong et al. / Forest Ecology and Management xxx (2010) xxx–xxx
Table 2Areas of ecosystems in Mexico in the years 1993 and 2002.
LU/LC class Area (ha) Difference Area (%)
1993 2002 2002
Tropical highland forests (CF, CF-sec, CBF, CBF-sec, BF, BF-sec) 34,563,961 34,188,964 −374,997 18Tropical lowland forests (THF, THF-sec, TDF, TDF-sec) 37,062,693 35,385,630 −1,677,063 18Scrublands 53,182,840 52,344,696 −838,144 27Grasslands 22,350,033 22,127,357 −222,676 11Wetlands 1,043,159 1,059,038 15,879 1Other 5,967,235 6,001,593 34,358 3IAPF 40,485,966 43,548,610 3,062,644 22
Total 194,655,888 194,655,888 100
CF = coniferous forest (mainly pines), CBF = mixed coniferous-broadleaved forest (predominantly pine-oak), BF = broadleaved forest (predominantly oak), THF = tropical humidforest, TDF = tropical dry forest. Sec = secondary shrub and herbaceous stage of the various forest types.
Fig. 3. Land-use and land-cover changes between 1993 and 2002 in (a) tropical highland and (b) tropical lowland forests of Mexico.

ARTICLE IN PRESSG ModelFORECO-12296; No. of Pages 13
B. de Jong et al. / Forest Ecology and Management xxx (2010) xxx–xxx 7
Table 3Biomass carbon, soil organic carbon (SOC) and total carbon stocks by land-use classes in Mexico. Data are geometric means, weighed by land area. Total carbon is the sum ofbiomass carbon plus SOC. In parenthesis uncertainty (U%) expressed as percentage of geometric mean and number of plots (N).
LU/LC Class Carbon in biomass Carbon in soils
Mg C ha−1 (U%; N) HAC LAC Sandy Volcanic Wetland
Mg C ha−1 (U%; N) Mg C ha−1 (U%; N) Mg C ha−1 (U%; N) Mg C ha−1 (U%; N) Mg C ha−1 (U%; N)
CF 47 (11%; 627) 63 (23%; 51) 31 (34%; 2) NAa 100 (28%; 13) NACFsec 15 (23%; 325) 58 (41%; 10) NA NA 72 (10%; 2) NACBF 41 (6%; 1448) 89 (22%; 67) 123 (31%; 14) 31 (73%; 2) 62 (29%; 19) NACBFsec 18 (14%; 524) 81 (39%; 18) 152 (105%; 2) ND 94 (21%; 4) NABF 31 (10%; 1073) 79 (29%; 54) 62 (116%; 2) 65 (64%; 3) 59 (46%; 6) NABFsec 13 (15%; 571) 124 (16%; 60) 110 (50%; 6) NA ND NATHF 52 (7%; 1126) 166 (11%; 131) 58 (54%; 7) NA 138 (0%; 1) NATHFsec 19 (14%; 438) 115 (18%; 84) 42 (0%; 1) NA 132 (0%; 1) NATDF 19 (5%; 1134) 98 (15%; 201) 16 (0%; 1) 30 (32%; 25) NA NATDFsec 15 (10%; 503) 98 (16%; 179) 82 (0%; 1) 43 (67%; 7) 127 (0%; 1) NAMG NDb 166 (82%; 9) NA NA NA NAMGsec ND ND NA NA NA NASLc 19 (8%; 1334) 59 (9%; 674) ND 64 (11%; 317) ND NASLsec 6 (20%; 177) 80 (16%; 100) 27 (0%; 1) 30 (18%; 61) ND NAGR 11 (20%; 1515) 67 (8%; 412) 93 (27%; 35) 28 (16%; 104) 74 (42%; 6) 44 (12%; 2)WT ND 54 (32%; 4) NA NA NA 78 (0%; 1)Palms ND NA NA NA NA NAOthers ND 70 (29%; 79) NA 43 (35%; 19) 93 (0%; 1) 47 (0%; 1)IAPF ND 84 (5%; 1193) 49 (15%; 88) 42 (9%; 272) 80 (16%; 51) 28 (32%; 13)
Abbreviations: CF = coniferous forest (mainly pines), CBF = mixed coniferous-broadleaved forest (predominantly pine-oak), BF = broadleaved forest (predominantly oak),THF = tropical humid forest, TDF = tropical dry forest, MG = mangrove forest, SL = scrubland (dessert and semi-dessert); GR = natural grasslands, WT = wetlands, oth-ers = subtropical deserts, bare lands, human settlement, urban areas and water bodies, IAPF = a composed class of agriculture, pasture land and different types of plantations,a -activ
L1ficBr
mfC(
vcmbb1t(lfdCa
ceugctom
nd sec = secondary shrub and herbaceous stage of forest type, HAC = soils with higha NA = not applicable.b ND = no data.c Default value for 100% scrub cover.
Biomass carbon densities varied significantly among theU/LC classes. In primary forests, biomass carbon ranged from9 Mg C ha−1 in tropical dry forests to 52 Mg ha−1 in tropical humidorests (Table 3); whereas, in secondary forest the carbon densitiesn biomass varied from 13 to 18 Mg C ha−1. In non-forest land-coverlasses, biomass carbon ranged from 6 to 19 Mg C ha−1 (Table 3).iomass carbon within a LU/LC class varied between ecologicalegions, as is noted by the range of variation that is shown in Table 3.
On a national scale, the largest carbon stocks were present inountainous forests (Fig. 4). In 2002, total carbon stock accounted
or 2.6 Pg C, of which 43% occurred in tropical highland forest (CF,BF, BF), 38% in tropical lowland forest (THF, TDF), 11% in scrublandSL) and 7% in natural grassland (GR).
The changes of LU/LC considerably altered the carbon stocks inegetation during the period of study. On an area basis, biomassarbon losses were highest in both CF and THF, where approxi-ately 70% (32 and 36 Mg C ha−1, respectively) of the original forest
iomass was lost after conversion (Table 4). The rate of biomass car-on loss from forests and scrublands ecosystems was estimated at8 Tg y−1 (Table 4). Major losses were due to the transformation ofropical lowland forest (THF, TDF, 49%) and tropical highland forestsCF, CBF, BF, 37%) to other LU/LC classes. The emission from biomassoss was estimated at 64 Tg CO2 y−1, of which 47% were derivedrom biomass burning (Table 4). Additionally, biomass burning pro-uced the following annual emissions of non-CO2 gases: 217 GgH4; 1113 Gg CO; 1 Gg N2O and 32 Gg NOx. These emissions of CH4nd N2O are equivalent to 5.7 Tg CO2
− equiv. y−1.The uncertainty of biomass loss due to forest and grassland
onversion was estimated at 12%, associated with the uncertaintystimations of land conversion and biomass stock. To estimate thencertainty associated with the areas, the errors derived from poly-
Please cite this article in press as: de Jong, B., et al., Greenhouse gas emiin Mexico. Forest Ecol. Manage. (2010), doi:10.1016/j.foreco.2010.08.0
on delimitation and from LU/LC classification were taken intoonsideration. The uncertainty associated with the estimation ofhe biomass stocks considered the errors derived from the usef allometric equations and the standard deviation around theean of the biomass stock in each LC class. The uncertainty of the
ity clay minerals, LAC = soils with low-activity clay minerals.
emissions of non-CO2 gases was estimated at 70% (IPCC defaultvalue).
3.2. CO2 removals in abandoned cropland, pasture and othermanaged lands
CO2 removals in abandoned cropland, pasture and other man-aged lands was estimated as the annual increment of abovegroundforest biomass in all lands that were converted from grassland,IAPF, and Others to secondary forest, and secondary forest toforests during 1993–2002. Total abandoned area was estimated at5.6 × 106 ha, mainly in THF (30%) and TDF (22%, Table 5). Per hectareaboveground biomass increments ranged from 0.13 Mg C ha−1 y−1
in SL to 1.6 Mg C ha−1 y−1 in THF (Table 5). The accumulation ofbiomass carbon in abandoned lands at the national level wasestimated at 3.5 Tg C y−1, which is equivalent to a removal of12.9 Tg CO2 y−1 (Table 5). The largest removal (58%) occurred intropical humid forests because they had both the highest share ofabandoned lands and the highest annual biomass increment rate.The uncertainty of the net removal of CO2 in abandoned lands wasestimated at 36%, derived from the errors in the estimation of theland area that was abandoned and the increment of abovegroundbiomass in these areas. The errors associated with the biomassincrements were estimated at 50%, combining default and litera-ture data (data not shown).
3.3. CO2 emissions and removals from mineral soils
Only five of the six IPCC soil categories are present in Mexico:HAC, LAC, Sandy, Volcanic and Wetland soils. At the national level,most of the soils are of the categories HAC and Sandy soil (82%
ssions between 1993 and 2002 from land-use change and forestry11
and 13%, respectively). On average, SOC was higher in Volcanic andHAC soils (94 and 91 Mg C ha−1, respectively) than in LAC, Wetland,and Sandy soils (70, 49 and 42 Mg C ha−1, respectively). The differ-ences of SOC among LU/LC classes is related to the soil category,but on average, SOC was higher in CBF and BF than in CF within

ARTICLE IN PRESSG ModelFORECO-12296; No. of Pages 13
8 B. de Jong et al. / Forest Ecology and Management xxx (2010) xxx–xxx
in terr
trpMaalg
bcn3or
TA1
Fig. 4. Biomass carbon stocks
he highland region, and higher in THF than in TDF in the lowlandegion (Table 3). The highest stocks of SOC occurred in the Yucataneninsula, which is part of the tropical lowland humid region ofexico (Fig. 5). In 2002, total SOC stock at 30 cm depth in primary
nd secondary ecosystems was estimated at 10.9 Pg C, distributeds followed: 33% in tropical forests (THF and TDF), 29% in scrub-ands, 25% in temperate forests (CF, CBF, BF), and 13% in naturalrasslands, wetlands and mangroves (Table 6).
The estimation of the carbon emissions from mineral soils wasased on the changes in land-cover areas associated with the SOC
Please cite this article in press as: de Jong, B., et al., Greenhouse gas emiin Mexico. Forest Ecol. Manage. (2010), doi:10.1016/j.foreco.2010.08.0
ontent in each soil and LU/LC class. According to this approach,et carbon emissions from soils were estimated at 8.3 Tg C y−1 or0.2 Tg CO2 y−1 (Table 6). Highest carbon emissions occurred in sec-ndary BF and secondary TDF ecosystems, and the largest carbonemoval occurred in the IAPF class (managed lands) because the
able 4nnual area change (in kha y−1), biomass stocks before and after LU change (Mg C ha−1)993–2002 in Mexico. Data in parenthesis denotes the percentage of uncertainty.
LU/LC Class Area, A (kha y−1) Biomass before,Bb (Mg C ha−1)
CF 62 (17) 47 (8)CFsec 8 (65) 15 (20)CBF 115 (20) 41 (5)CBFsec 16 (67) 18 (13)BF 116 (24) 31 (8)BFsec 33 (55) 13 (14)THF 231 (23) 52 (7)THFsec 81 (64) 19 (14)TDF 146 (24) 19 (5)TDFsec 91 (56) 15 (11)MG 7 (14) SDMGsec 0 SDSL 98 (10) 19 (50)GR 0 0
Total 1004
CO2 emission from burning (in Gg CO2)CO2 emission from decay (in Gg CO2)Total CO2 emission (in Gg CO2)Non-CO2 emissions (in Gg CO2 equiv.)
estrial ecosystems of Mexico.
large increment of area in this LU/LC class during the period ofstudy. Total uncertainty was estimated at 84%, resulted from thecombination of errors derived from the determination of soil depth,soil bulk density and the standard deviation around the mean of soilcarbon stocks, as well as from the determination of the land areasand land-use changes for both land-use and soil classes (data notshown).
3.4. Forest management
ssions between 1993 and 2002 from land-use change and forestry11
Annual biomass carbon losses from managed forests wereestimated as the sum of losses from commercial round woodharvest, non-authorized harvesting and fuel wood gathering.During 1993–2002, the extracted volume of commercial roundwood ranged from 6.0 to 8.8 × 10⁹ m3 y−1 with an average of
and net emissions of CO2 to the atmosphere by land-cover classes over the period
Biomass after,Ba (Mg C ha−1)
Biomass loss, Bb − Ba(Mg C ha−1)
Total biomass loss,(A × (Bb − Ba) Gg C y−1)
14 (19) 32 (8) 1999 (19)10 (19) 6 (14) 47 (65)17 (14) 24 (5) 2735 (21)10 (14) 8 (10) 131 (56)14 (15) 17 (7) 1952 (26)10 (15) 3 (10) 108 (67)16 (17) 36 (7) 8285 (24)10 (17) 10 (11) 798 (55)12 (17) 7 (7) 1022 (25)10 (17) 5 (9) 477 (64)SD SD SDSD SD SD9 (14) 10 (34) 977 (38)0 0 0
18,527 (12)
30,54333,96464,5085699

Please cite this article in press as: de Jong, B., et al., Greenhouse gas emissions between 1993 and 2002 from land-use change and forestryin Mexico. Forest Ecol. Manage. (2010), doi:10.1016/j.foreco.2010.08.011
ARTICLE IN PRESSG ModelFORECO-12296; No. of Pages 13
B. de Jong et al. / Forest Ecology and Management xxx (2010) xxx–xxx 9
Table 5Estimate of the average annual carbon uptake in abandoned areas by land-cover classes in Mexico over the periods 1993–2002 and 1976–2002. Data in parenthesis denotesthe percentage of uncertainty.
LU/LC class Abandoned area (k ha) Biomass incrementa (Mg C ha−1 y−1) Total biomassincrement (Gg C y−1)
1993–2002 1976–2002 1993–2002 1976–2002
CFsec 92 (20) 65 (20) 0.65 (37) 0.65 (37) 102 (42)CBFsec 199 (20) 40 (20) 0.55 (46) 0.55 (46) 131 (50)BFsec 183 (20) 65 (20) 0.65 (42) 0.65 (42) 161 (46)MGsec 45 (20) 0 0.4 (55) 0.4 (55) 18 (58)THFsec 1253 (20) 112 (20) 1.55 (55) 0.35 (55) 1982 (58)TDFsec 796 (20) 246 (20) 0.55 (55) 0.13 (55) 497 (58)SLsec 197 (20) 27 (20) 0.25 (55) 0.13 (55) 56 (58)GR 768 (20) 0 0.25 (55) SD 204 (58)IAPF 1473 (20) 0 0.26 (55) 0 390 (58)
Total 5006 555 3514 (36)CO2 uptake (Gg y−1) 12,883 (36)
a SARH (1994); IPCC (2003); CONAFOR (2005).
Fig. 5. Soil organic carbon (SOC) stocks in terrestrial ecosystems in Mexico.
Table 6Estimates of soil organic carbon (SOC) stocks, changes in SOC stocks, and emissions of CO2 derived from mineral soils due to LU/LC changes in Mexico over the period1993–2002. Positive changes between years indicate carbon loss, whereas negative changes indicate soil carbon accumulation. Data in parenthesis denotes the percentageof uncertainty, derived from uncertainties in carbon stocks and area changes.
LU/LC class COS 1993 (Tg C) COS 2002 (Tg C) Change 1993–2002 (Tg C) Rate of change (Tg C y−1)
CF 370 (43) 356 (42) 14 (17) 1.6CFsec 60 (38) 72 (38) −11 (232) −1.3CBF 188 (55) 230 (59) −42 (59) −4.7CBFsec 880 (112) 821 (112) 59 (90) 6.6BF 295 (105) 333 (108) −38 (122) −4.3BFsec 1030 (51) 945 (51) 84 (41) 9.4THF 1500 (48) 1480 (47) 20 (22) 2.2THFsec 441 (18) 403 (19) 38 (44) 4.3TDF 1087 (31) 1056 (31) 32 (21) 3.5TDFsec 692 (61) 627 (61) 66 (44) 7.3MG 72 (75) 68 (74) 4 (31) 0.4SL 2932 (24) 2889 (24) 43 (10) 4.8SLsec 268 (24) 264 (24) 4 (24) 0.5GR 1352 (55) 1337 (55) 15 (55) 1.6WT 55 (32) 54 (32) 0 0.0Others 356 (45) 360 (45) −3 (45) −0.4ND 804 (113) 793 (113) 11 (113) 1.2IAPF 2999 (40) 3219 (40) −220 (40) −24.5
Total 15,381 15,307 74 8.3 (84)Net CO2 emissions 30.2 (84)

ARTICLE IN PRESSG ModelFORECO-12296; No. of Pages 13
10 B. de Jong et al. / Forest Ecology and Management xxx (2010) xxx–xxx
Table 7Estimates of the annual carbon emission and uptake from Mexican managed forests between 1993 and 2002. Data inparenthesis denotes the percentage of uncertainty.
A = ndCONA
7s
caw4mwacca5scvcw
o
S
1For convention minus sign represents uptake of carbon. NSources: aSEMARNAT (1995–2002). cSEMARNAT (2000).(1994). hIPCC (2003).
.0 × 109 m3 y−1, mainly from conifers (Fig. 6). This volume repre-ented a biomass carbon loss of approximately 2.4 Tg y−1 (Table 7).
Non-authorized harvesting is difficult to estimate. The offi-ially published estimates from SEMARNAT (2001) indicate thatpproximately 13 million m3 of round wood is harvested per yearithout a permit, which represents a biomass carbon loss of around
.1 Tg y−1. Carbon in national fuelwood consumption was esti-ated at 8.8 Tg y−1 in the Mexican residential sector. In this studye conservatively assumed that fuelwood consumption is sustain-
ble, in other words that fuelwood consumption is completelyovered by biomass increase in the forests managed for fuelwoodollection. The loss of biomass carbon from round wood harvestnd renewable use of fuelwood summed 15.2 Tg y−1, releasing5.8 Tg y−1 of CO2 to the atmosphere (Table 7). This rate of emis-ion had an uncertainty of 17%. This uncertainty resulted from theombination of errors associated with the estimation of the har-ested timber and with the use of biomass expansion factors to
Please cite this article in press as: de Jong, B., et al., Greenhouse gas emiin Mexico. Forest Ecol. Manage. (2010), doi:10.1016/j.foreco.2010.08.0
onvert volume to total biomass. This latter error was high becausee used default biomass expansion factors (data not shown).
The removal of CO2 in managed forests was estimated by meansf annual volume increment of aboveground forest biomass. Timber
Fig. 6. Annual timber production in Mexico.EMARNAT (1995–2002)
ot applicable.FOR (2005). eSARH (1990). fSee text for details. gSARH
harvest in Mexico is conducted almost exclusively in native forests,covering about 6.2 × 10⁶ ha (mainly highland pine-oak forests,78%). The area with forest plantation was estimated at 1.5 × 10⁶ ha,98% from reforestation. Annual aboveground biomass incrementestimates in native forests ranged from 0.5 to 1.0 Mg C ha−1 y−1
in tropical dry forests and tropical humid forests, respectively;whereas in plantations ranged from 0.7 to 5.6 Mg ha−1 y−1 (Table 7).To calculate the balance between the emissions and the removalof carbon due to the renewable use of fuel wood, we estimatedthe area of accessible forest, which corresponds to the forestarea in a buffer zone of 5 km around settlements and townswith more than 100 inhabitants. The forest area within thesebuffer zones corresponded to 35.9 × 10⁶ ha. Biomass incrementin these forests was conservatively estimated at 0.5 Mg ha−1 y−1.Taking into account the increment of biomass carbon from com-mercial forests (3.8 Tg y−1), plantations (1.2 Tg y−1) and accessibleforests for fuel wood gathering (8.8 Tg y−1), the total annual car-bon removal was estimated at 13.9 Tg y−1, which corresponds to aCO2 removal of 50.9 Tg y−1 in managed forests at the national level(Table 7). The uncertainty of this removal was estimated at 11%.Most of this uncertainty was associated with biomass increments,but the error associated with the estimation of managed areas isalso an important source of uncertainty (data not presented).
The removal of CO2 in managed forests was lower than the emis-sions associated with the loss of biomass, resulting in a net emissionof 4.9 Tg CO2 y−1 in managed forest (Table 7). The combined uncer-tainties of emission and removal of CO2 resulted in 259% of the netestimated emission.
3.5. Net balance of GHG flux
Net emissions of GHG from the LULUCF sector in Mexicobetween 1993 and 2002 were estimated at 86.9 Tg CO2 equiv. y−1
(Fig. 7), resulting from 94.8 Tg CO2 equiv. y−1 emissions of biomass
ssions between 1993 and 2002 from land-use change and forestry11
and soil organic carbon losses due to the conversion of forest andscrubland to other LU/LC classes, a removal of 12.9 Tg CO2 equiv. y−1
derived from the increment of biomass in abandoned areas, andan emission of 4.9 Gt CO2 equiv. y−1 from managed forests. The netemission had an uncertainty of 34.4% (±29.9 Tg CO2 equiv. y−1).

ARTICLE ING ModelFORECO-12296; No. of Pages 13
B. de Jong et al. / Forest Ecology and M
Fca
4
Gtstlidsab6G
(dAaut
lrcilliH
oe1vascceldAn
f
et al., 1997; INE-SEMARNAT, 2001). This permits better estimations
ig. 7. Annual rates and level of uncertainty of emission and uptake of CO2 fromhanges in the biomass and soil organic carbon (SOC) stocks due to LU/LC changesnd forest management in Mexico between 1993 and 2002.
. Discussion
The study was part of the third national communication ofHG emissions of Mexico, presented at the UNFCCC-COP 12. It is
he first inventory with most information derived from nationalources (TIER 2) and as such it is not comparable with the firstwo inventories that were based mainly on default data anditerature review. However, all three inventories indicate that Mex-can forests are undergoing a rapid process of degradation andeforestation, which in turn are contributing to high net GHG emis-ions (INE-SEMARNAP, 1997; INE-SEMARNAT, 2001). The averagennual emission of 86.9 Tg CO2 y−1 from 1993 to 2002 representsetween 13.5 and 17% of the total emissions of Mexico (512 and43 Tg CO2 y−1, respectively) and is the second important source ofHG after the Energy sector (INE-SEMARNAT, 2006).
Globally, LU/LC change emits between 4.0 and 8.0 Pg CO2 y−1
Watson et al., 2000; Houghton, 2003; Achard et al., 2004), mainlyue to deforestation in the tropics. The key areas are located in themazon region and South-East Asia, with minor emissions in Africand Central America (Achard et al., 2004). According to these fig-res, Mexico is contributing about 1–2% of the global emissions inhe LU/LC sector.
Although land-use change occurred all over the country, theand-use change dynamics was higher in the tropical lowlandegions, particularly the Yucatan peninsula. About 54% of allhanges took place in the tropical lowland forests and only 34%n the highland forests (Table 2). The forest conversion in tropicalowland forests generates not only CO2 emissions due to biomassoss, but also non-CO2 emissions, since most of the land-use changen this region is based on slash-and-burn practices (Maass, 1995;ughes et al., 1999; Giardina et al., 2000; Kauffman et al., 2003).
Our study suggests that large parts of this region is in some kindf secondary or degraded stage, since about 48% of the lowland for-st present in 2002 was classified as secondary forest. Also, during993 and 2002 about 4.6 million hectares were abandoned and inarious stages of regrowth in this region. This suggests that largereas of tropical lowland forests currently considered as maturetands, contain significant portions of secondary forest plots, andonsequently may represent relatively low densities of biomass,ompared to undisturbed forests (Hughes et al., 1999). This wouldxplain in part the relatively low-biomass densities of the tropicalowland forests that we estimated from inventory plots. In fact ourata are amongst the lowest reported for such forests (IPCC, 2003).
Please cite this article in press as: de Jong, B., et al., Greenhouse gas emiin Mexico. Forest Ecol. Manage. (2010), doi:10.1016/j.foreco.2010.08.0
more detailed spatially explicit analysis of the recently finishedational forest inventory could give insight in this hypothesis.
Large uncertainties still remain about the role of the variousorest management practices on GHG dynamics. Even though this
PRESSanagement xxx (2010) xxx–xxx 11
study indicates that current forest exploitation activities are gen-erating net emissions to the atmosphere, the uncertainty aroundthis estimate includes the possibility of managed forest being anet sink. Various studies have pointed out that Mexican forestsare producing much less commercial wood than their potential,due to deficient management practices (Merino, 1999; Torres-Rojo, 2004; ITTO, 2005). For example, Pine-oak forest of the Northand Central portions of Mexico have the potential of producingbetween 5 and 15 m3 ha−1 y−1, however currently they are pro-ducing only between 1.5 and 3 m3 ha−1 y−1 (SARH, 1994). On theother hand, uncontrolled timber harvesting has increased, whichin turn accelerates the process of forest degradation and deforesta-tion and the emission of large quantities of GHG. Currently, theestimated uncontrolled harvesting of round wood reached twicethe amount of authorized harvesting in forests with managementplans (SEMARNAT, 2001; ITTO, 2005).
A key issue that influences GHG estimates is the definition ofmanaged versus unmanaged land, particularly concerning forests.As no data of multi-year inventories were available for this study,we applied the gain-loss approach, as recommended by IPCC(1997). Especially the area estimation of managed forests is a largesource of uncertainty that can create large differences in GHG fluxestimations in countries like Mexico, with large areas covered byforests. We therefore only took into consideration the gain in car-bon of those forests that have management plans and forests forfuelwood production. As data become available from the MexicanNational Forest Inventory that started in 2004 to establish about25,000 permanent sampling plots, a change to the stock-changeapproach is feasible, as recommended by IPCC.
Reducing emissions from deforestation and degradation is oneof the key options for Mexico to mitigate its GHG emissions andwould generate cheaper short-term benefits than through refor-estation, where new sinks are created only in the future, whenplanted forests reach high-biomass density levels (Sheinbaum andMasera, 2000; Fearnside and Barbosa, 2003). Additional benefits ofavoiding deforestation are conservation of biodiversity and otherecological services provided by forests (Bonnie et al., 2000; Nabuurset al., 2007).
4.1. Sources of error
GHG inventories in general are part of a continuous process,directed towards improving reporting and analysis. Although thisinventory represents a substantial improvement over the first twoinventories, large uncertainties in the data still occur in at least fouraspects: (1) the estimation of the rate of land-use change; (2) thespatial variation of the size of the existing carbon pools in each land-use; (3) the change in carbon pools after the land-use conversionor management activity; and (4) the impact of burning on CO2 andnon-CO2 emissions.
In this study we used two maps that were produced with similarclassification methodology and image interpretation procedures.This reduces the sources of error substantially (Cairns et al., 2000).The errors associated with classification systems can be reducedby implementing a more systematic protocol of verification in thefield and the implementation of a continuous land-use changemonitoring procedure, with the aid of available satellite imagery(e.g. PRODES in Brazil; http://www.obt.inpe.br/prodes/). Carbonemissions from biomass loss in this study take into account bothdeforestation and forest degradation, which is an improvementwith previous studies that considered deforestation only (Masera
ssions between 1993 and 2002 from land-use change and forestry11
of emissions, since in Mexico forests degradation is a first step toeventual forests conversion to other land uses.
We selected the default allometric equations to estimatebiomass densities, which would give the lowest biomass densities,
INF
1 and M
wado
eses(ba
ahtbocatalosoomtocStistttt(tasdpao
mfamastertctdfcttm
ARTICLEG ModelORECO-12296; No. of Pages 13
2 B. de Jong et al. / Forest Ecology
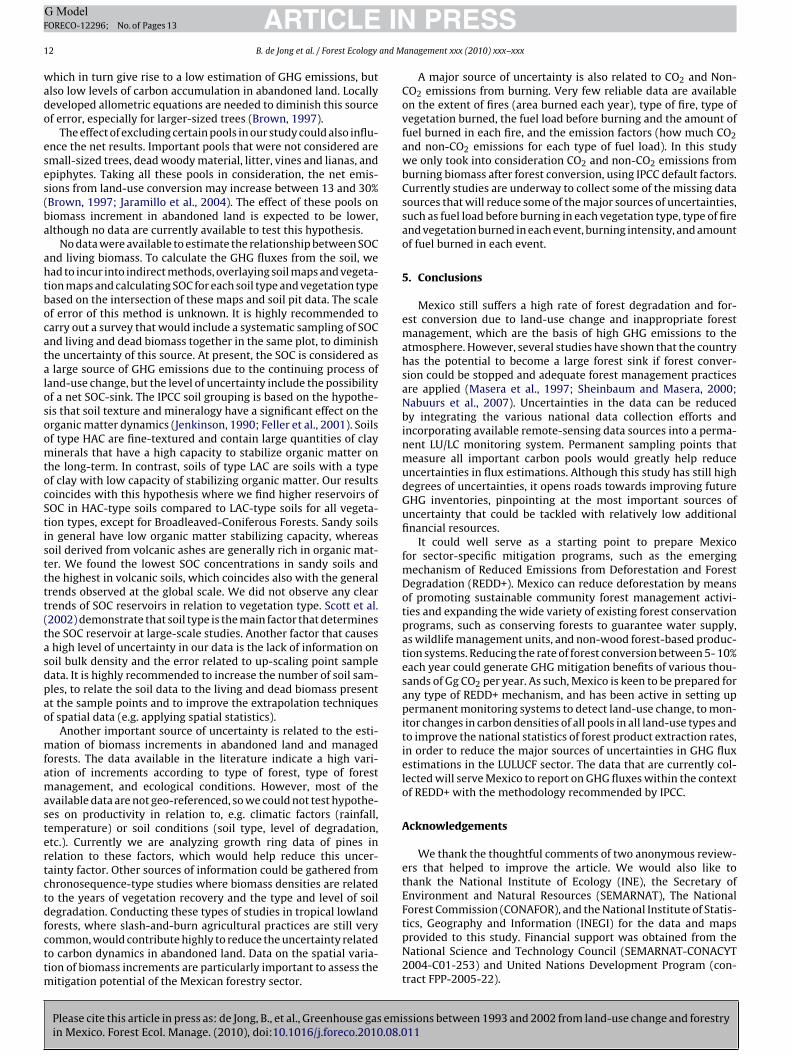
hich in turn give rise to a low estimation of GHG emissions, butlso low levels of carbon accumulation in abandoned land. Locallyeveloped allometric equations are needed to diminish this sourcef error, especially for larger-sized trees (Brown, 1997).
The effect of excluding certain pools in our study could also influ-nce the net results. Important pools that were not considered aremall-sized trees, dead woody material, litter, vines and lianas, andpiphytes. Taking all these pools in consideration, the net emis-ions from land-use conversion may increase between 13 and 30%Brown, 1997; Jaramillo et al., 2004). The effect of these pools oniomass increment in abandoned land is expected to be lower,lthough no data are currently available to test this hypothesis.
No data were available to estimate the relationship between SOCnd living biomass. To calculate the GHG fluxes from the soil, wead to incur into indirect methods, overlaying soil maps and vegeta-ion maps and calculating SOC for each soil type and vegetation typeased on the intersection of these maps and soil pit data. The scalef error of this method is unknown. It is highly recommended toarry out a survey that would include a systematic sampling of SOCnd living and dead biomass together in the same plot, to diminishhe uncertainty of this source. At present, the SOC is considered aslarge source of GHG emissions due to the continuing process of
and-use change, but the level of uncertainty include the possibilityf a net SOC-sink. The IPCC soil grouping is based on the hypothe-is that soil texture and mineralogy have a significant effect on therganic matter dynamics (Jenkinson, 1990; Feller et al., 2001). Soilsf type HAC are fine-textured and contain large quantities of clayinerals that have a high capacity to stabilize organic matter on
he long-term. In contrast, soils of type LAC are soils with a typef clay with low capacity of stabilizing organic matter. Our resultsoincides with this hypothesis where we find higher reservoirs ofOC in HAC-type soils compared to LAC-type soils for all vegeta-ion types, except for Broadleaved-Coniferous Forests. Sandy soilsn general have low organic matter stabilizing capacity, whereasoil derived from volcanic ashes are generally rich in organic mat-er. We found the lowest SOC concentrations in sandy soils andhe highest in volcanic soils, which coincides also with the generalrends observed at the global scale. We did not observe any clearrends of SOC reservoirs in relation to vegetation type. Scott et al.2002) demonstrate that soil type is the main factor that determineshe SOC reservoir at large-scale studies. Another factor that causeshigh level of uncertainty in our data is the lack of information on
oil bulk density and the error related to up-scaling point sampleata. It is highly recommended to increase the number of soil sam-les, to relate the soil data to the living and dead biomass presentt the sample points and to improve the extrapolation techniquesf spatial data (e.g. applying spatial statistics).
Another important source of uncertainty is related to the esti-ation of biomass increments in abandoned land and managed
orests. The data available in the literature indicate a high vari-tion of increments according to type of forest, type of forestanagement, and ecological conditions. However, most of the
vailable data are not geo-referenced, so we could not test hypothe-es on productivity in relation to, e.g. climatic factors (rainfall,emperature) or soil conditions (soil type, level of degradation,tc.). Currently we are analyzing growth ring data of pines inelation to these factors, which would help reduce this uncer-ainty factor. Other sources of information could be gathered fromhronosequence-type studies where biomass densities are relatedo the years of vegetation recovery and the type and level of soilegradation. Conducting these types of studies in tropical lowland
Please cite this article in press as: de Jong, B., et al., Greenhouse gas emiin Mexico. Forest Ecol. Manage. (2010), doi:10.1016/j.foreco.2010.08.0
orests, where slash-and-burn agricultural practices are still veryommon, would contribute highly to reduce the uncertainty relatedo carbon dynamics in abandoned land. Data on the spatial varia-ion of biomass increments are particularly important to assess the
itigation potential of the Mexican forestry sector.
PRESSanagement xxx (2010) xxx–xxx
A major source of uncertainty is also related to CO2 and Non-CO2 emissions from burning. Very few reliable data are availableon the extent of fires (area burned each year), type of fire, type ofvegetation burned, the fuel load before burning and the amount offuel burned in each fire, and the emission factors (how much CO2and non-CO2 emissions for each type of fuel load). In this studywe only took into consideration CO2 and non-CO2 emissions fromburning biomass after forest conversion, using IPCC default factors.Currently studies are underway to collect some of the missing datasources that will reduce some of the major sources of uncertainties,such as fuel load before burning in each vegetation type, type of fireand vegetation burned in each event, burning intensity, and amountof fuel burned in each event.
5. Conclusions
Mexico still suffers a high rate of forest degradation and for-est conversion due to land-use change and inappropriate forestmanagement, which are the basis of high GHG emissions to theatmosphere. However, several studies have shown that the countryhas the potential to become a large forest sink if forest conver-sion could be stopped and adequate forest management practicesare applied (Masera et al., 1997; Sheinbaum and Masera, 2000;Nabuurs et al., 2007). Uncertainties in the data can be reducedby integrating the various national data collection efforts andincorporating available remote-sensing data sources into a perma-nent LU/LC monitoring system. Permanent sampling points thatmeasure all important carbon pools would greatly help reduceuncertainties in flux estimations. Although this study has still highdegrees of uncertainties, it opens roads towards improving futureGHG inventories, pinpointing at the most important sources ofuncertainty that could be tackled with relatively low additionalfinancial resources.
It could well serve as a starting point to prepare Mexicofor sector-specific mitigation programs, such as the emergingmechanism of Reduced Emissions from Deforestation and ForestDegradation (REDD+). Mexico can reduce deforestation by meansof promoting sustainable community forest management activi-ties and expanding the wide variety of existing forest conservationprograms, such as conserving forests to guarantee water supply,as wildlife management units, and non-wood forest-based produc-tion systems. Reducing the rate of forest conversion between 5- 10%each year could generate GHG mitigation benefits of various thou-sands of Gg CO2 per year. As such, Mexico is keen to be prepared forany type of REDD+ mechanism, and has been active in setting uppermanent monitoring systems to detect land-use change, to mon-itor changes in carbon densities of all pools in all land-use types andto improve the national statistics of forest product extraction rates,in order to reduce the major sources of uncertainties in GHG fluxestimations in the LULUCF sector. The data that are currently col-lected will serve Mexico to report on GHG fluxes within the contextof REDD+ with the methodology recommended by IPCC.
Acknowledgements
We thank the thoughtful comments of two anonymous review-ers that helped to improve the article. We would also like tothank the National Institute of Ecology (INE), the Secretary ofEnvironment and Natural Resources (SEMARNAT), The NationalForest Commission (CONAFOR), and the National Institute of Statis-
ssions between 1993 and 2002 from land-use change and forestry11
tics, Geography and Information (INEGI) for the data and mapsprovided to this study. Financial support was obtained from theNational Science and Technology Council (SEMARNAT-CONACYT2004-C01-253) and United Nations Development Program (con-tract FPP-2005-22).

INF
and M
R
A
B
B
B
B
C
C
C
C
D
D
F
F
G
G
H
H
H
I
I
I
I
I
I
I
I
ARTICLEG ModelORECO-12296; No. of Pages 13
B. de Jong et al. / Forest Ecology
eferences
chard, F., Eva, H.D., Mayaux, P., Stibig, H.J., Belward, A., 2004. Improved estimatesof net carbon emissions from land cover change in the tropics for the 1990s.Global Biogeochemical Cycles 18, 1–11.
atjes, N.H., 1997. A world data set of derived soil properties by FAO-UNESCO soilunit for global modelling. Soil Use and Management 13, 9–16.
onnie, R., Schwartzman, S., Oppenheimer, M., Bloomfield, J., 2000. Counting thecost of deforestation. Science 288, 1164–1763.
rown, S., 1997. Estimating biomass and biomass change of tropical forests: a primer.In: FAO Forestry Paper. Food and Agriculture Organization, Rome, Italy.
rown, S., Lugo, A.E., 1982. The storage and production of organic matter in thetropical forests and their role in the global carbon cycle. Biotropica 14, 161–187.
airns, M.A., Brown, S., Helmer, E.H., Baumgardner, G.A., 1997. Root biomass alloca-tion in the world’s upland forests. Oecologia 111, 1–11.
airns, M.A., Haggerty, P.K., Alvarez, R., De Jong, B.H.J., Olmsted, I., 2000. TropicalMexico’s recent land-use change: a region’s contribution to the global carboncycle. Ecological Applications 10 (5), 1426–1441.
ommission for Environmental Cooperation (CEC), 1997. Ecological Regions of NorthAmerica: Toward a Common Perspective. Commission for Environmental Coop-eration, Quebec, Canada.
omisión Nacional Forestal (CONAFOR), 2005. Evaluación externa del PRODEPLAN,Ejercicio fiscal 2004. CONAFOR, México.
enman, K.L., Brasseur, G., Chidthaisong, A., et al., 2007. Climate change 2007: thephysical science basis. In: Solomon, S., Qin, D., Manning, M., Chen, Z., Marquis,M., Averyt, K.B., Tignor, M., Miller, H.L. (Eds.), Contribution of Working GroupI to the Fourth Assessment Report of the Intergovernmental Panel on ClimateChange. Cambridge University Press, Cambridge, pp. 499–587.
íaz, R., 2000. Consumo de lena en el sector residencial de México. Evoluciónhistórica y emisiones de CO2. Tesis de maestría en Ingeniería Energética. Facultadde Ingeniería, UNAM, México, D.F.
eller, C., Albrecht, A., Blanchart, E., Cabidoche, Y.M., Chevallier, T., Hartmann, C.,Eschenbrenner, V., Larré-Larrouy, M.C., Ndandou, J.F., 2001. Soil organic car-bon sequestration in tropical areas. General considerations and analysis of someedaphic determinants for Lesser Antilles soils. Nutrient Cycling in Agroecosys-tems 61, 19–31.
earnside, P.M., Barbosa, R.I., 2003. Avoided deforestation in Amazonia as a globalwarming mitigation measure: the case of Mato Grosso. World Resource Review15, 352–361.
arcía, E., 1998. Climas (clasificación de Koppen, modificado por García). Escala1:1000000. Comisión Nacional para el Conocimiento y Uso de la Biodiversidad(CONABIO), México.
iardina, C.P., Sanford Jr., R.L., Døckersmith, I.C., Jaramillo, V.J., 2000. The effectsof slash burning on ecosystem nutrient during the land preparation phase ofshifting cultivation. Plant and Soil 220, 247–260.
ansen, J., Sato, M., Ruedy, R., Lo, K., Lea, D.W., Medina-Elizade, M., 2006. Globaltemperature change. PNAS 103, 14288–14293.
oughton, R.A., 2003. Revised estimates of the annual net flux of carbon to theatmosphere from changes in land use and land management 1850–2000. Tellus55B, 378–390.
ughes, R.F., Kauffman, J.B., Jaramillo, V.J., 1999. Biomass, carbon, and nutrientaccumulation in tropical evergreen secondary forest of the Los Tuxtlas region,Mexico. Ecology 80, 1892–1907.
NE-SEMARNAP. 1997. Primera Comunicación Nacional de México ante la Conven-ción Marco de las Naciones Unidas sobre el Cambio Climático.
NE-SEMARNAT, 2001. México 2a Comunicación Nacional ante la Convención Marcode las Naciones Unidas ante el cambio climático. INE-SEMARNAT, México D.F.
NE-SEMARNAT, 2006. Inventario nacional de emisiones de gases de efecto inver-nadero 1990–2002. INE-SEMARNAT, México D.F.
NEGI, N.D. Carta de Uso Actual del Suelo y Vegetación Serie I. INEGI, Aguascalientes,México.
NEGI, 1996. Carta de Uso Actual del Suelo y Vegetación Serie II. INEGI, Aguas-calientes, México.
Please cite this article in press as: de Jong, B., et al., Greenhouse gas emiin Mexico. Forest Ecol. Manage. (2010), doi:10.1016/j.foreco.2010.08.0
NEGI, 2000. Mapa de Ecoregiones de México, escala 1:250,000. INEGI, Aguas-calientes, México.
NEGI, 2002. Información Geográfica sobre edafología. Serie I escala 1:250,000.INEGI, Aguascalientes, México.
NEGI, 2005. Carta de Uso Actual del Suelo y Vegetación Serie III. INEGI, Aguas-calientes, México.
PRESSanagement xxx (2010) xxx–xxx 13
Intergovernmental Panel on Climate Change (IPCC), 1997. Revised 1996 IPCC Guide-lines for National Greenhouse Gas Inventories. Intergovernmental Panel onClimate Change, United Nations Environment Programme, Organization forEconomic Co-Operation and Development, International Energy Agency, Paris,France.
Intergovernmental Panel on Climate Change (IPCC), Penman, J., et al., 2003. GoodPractice Guidance for Land Use, Land-Use Change, and Forestry. IPCC NationalGreenhouse Gas Inventories Programme. IGES, Japan.
Intergovernmental Panel on Climate Change (IPCC), 2007. Climate change 2007, mit-igation of climate change. In: Working Group III Contribution to the IPCC FourthAssessment Report. IPCC, Switzerland.
International Tropical Timber Council (ITTO), 2005. Achieving the ITTO Objective2000 and Sustainable Forest Management in Mexico. ITTO, Yokohama, Japan.
Jaramillo, V.J., Ahedo-Hernández, R., Kauffman, J.B., 2004. Root biomass and carbonin a tropical evergreen forest of Mexico: changes with secondary succession andforest conversion to pasture. Journal of Tropical Ecology 19, 457–464.
Jenkinson, D.S., 1990. The turnover of organic carbon and nitrogen in soil. Philosoph-ical Transactions of the Royal Society of London B329, 361–366.
Kauffman, J.B., Steele, M.D., Cummings, D.L., Jaramillo, V.J., 2003. Biomass dynamicsassociated with deforestation, fire, and conversion to cattle pasture in a Mexicantropical dry forest. Forest Ecology and Management 176, 1–12.
Maass, J.M., 1995. Conversion of tropical dry forest to pasture and agriculture. In:Bullock, S.H., Money, H.A., Medina, E. (Eds.), Seasonally Dry Tropical Forests.Cambridge University Press, Cambridge, pp. 337–360.
Masera, O., Ordonez, M.J., Dirzo, R., 1997. Carbon emissions from Mexican forests:the current situation and long-term scenarios. Climatic Change 35, 265–295.
Merino, L., 1999. La gestión colectiva de los recursos forestales en México, RevistaMexicana de Comercio Exterior, Dec 1999.
Nabuurs, G.J., Masera, O., Andrasko, K., Benitez-Ponce, P., Boer, R., Dutschke, M.,Elsiddig, E., Ford-Robertson, J., Frumhoff, P., Karjalainen, T., Krankina, O., Kurz,W.A., Matsumoto, M., Oyhantcabal, W., Ravindranath, N.H., Sanz Sanchez, M.J.,Zhang, X., 2007. Forestry. In: Metz, B., Davidson, O.R., Bosch, P.R., Dave, R., Meyer,L.A. (Eds.), Climate Change 2007: Mitigation. Contribution of Working GroupIII to the Fourth Assessment Report of the Intergovernmental Panel on ClimateChange. Cambridge University Press, Cambridge, United Kingdom and New York,NY, USA.
Prentice, I.C., Farquhar, G.D., Fasham, M.J.R., et al., 2001. The carbon cycle and atmo-spheric carbon dioxide. Climate change 2001. In: Houghton, J.T., Ding, Y., Griggs,D.J., Noguer, M., van der Linden, P.J., Dai, X., Maskell, K., Johnson, C.A. (Eds.), TheScientific Basis. Contribution of Working Group I to the Third Assessment Reportof the Intergovernmental Panel on Climate Change. Cambridge University Press,Cambridge, UK, pp. 183–237.
Scott, N.A., Tate, K.R., Giltrap, D.J., Tattersall Smith, C., Wilde, R.H., Newsome, P.F.J.,Davis, M.R., 2002. Monitoring land-use change effects on soil carbon in NewZealand: quantifying baseline soil carbon stocks. Environmental Pollution 116,167–186.
Secretaría de Agricultura y Recursos Hidráulicos (SARH), 1990. Estadísticas sobrereforestación 1960–1990. Informe interno de la Dirección General de PolíticaForestal de la Subsecretaría Forestal, México, D.F.
Secretaría de Agricultura y Recursos Hidráulicos (SARH), 1994. Inventario NacionalForestal Periódico. México, D.F.
Secretaría de Medio Ambiente y Recursos Naturales (SEMARNAT), 1995–2002.Anuario de la producción forestal. México, D.F.
Secretaría de Medio Ambiente y Recursos Naturales (SEMARNAT), 2000. Superficiesbajo manejo. México, D.F.
Secretaría de Medio Ambiente y Recursos Naturales (SEMARNAT), 2001. PlanEstratégico Forestal 2025. México, D.F.
SEMARNAT-CP, 2002. Evaluación de la degradación de los suelos causada por el hom-bre en la República Mexicana, a escala 1:250,000. Memoria Nacional, MéxicoD.F., México.
Sheinbaum, C., Masera, O.R., 2000. Mitigating carbon emissions while advanc-ing national development priorities: the case of México. Climatic Change 47,259–282.
Torres-Rojo, J.M., 2004. Análisis técnico del sistema de manejo conocido como PlanPiloto Forestal de Quintana Roo. In: Bray, D.B., Santos, V., Armijo, N. (Eds.),
ssions between 1993 and 2002 from land-use change and forestry11
Investigaciones en apoyo de una economía de conservación en la zona maya deQuintana Roo. Organización de Ejidos Productores Forestales de la Zona Maya,Felipe Carrillo Puerto, Quintana Roo, México.
Watson, R.T., Noble, I.R., Bolin, B., Ravindranath, N.H., Verardo, D.J., Dokken, D.J.,2000. Land Use, Land Use Change and Forestry. Cambridge University Press,New York.
Copyright © 2022 FDOKUMEN