Grazing and colony size development in Phaeocystis globosa (Prymnesiophyceae): the role of a...
12
INTRODUCTION Organisms of lower trophic levels face the danger of predation, and the ability to defend against predators is therefore a main driving force in their evolutionary histories (Mole, 1994; Tollrian, 1995). Because defence mechanisms can be costly to maintain, it is to the advan- tage of an organism to activate its defence mechanisms only when predation risk is sensed (Agrawal, 1998). Signals for predation risk may come in visual, audio, physical or chemical forms. Since most lower trophic organisms lack visual or audio perceptions, detecting predators will rely on chemical or physical cues. Research on defensive responses among phytoplankton has been largely limited to freshwater systems. A well- studied example is morphological defence in the colony- forming chlorophyte Scenedesmus sp., which is often abundant in lakes. When solitary Scenedesmus sp. cells are grazed by daphnids, colony formation intensifies such that the particle size increases to beyond the handling capacity of the grazers (Lürling and van Donk, 1997; Lürling, 1999). Subsequent studies showed that this defensive response is triggered by ‘infochemicals’ released during the grazing process (Lampert et al., 1994; Lürling and van Donk, 1997; Lürling, 1998), although the nature of these infochemicals is still under dispute (Wiltshire and Lampert, 1999; Lürling and von Elert, 2001). A comparable example in the marine systems is the cosmopolitan phytoplankton genus Phaeocystis (Prymne- siophyceae). The life cycle of Phaeocystis sp. involves an alternation between solitary cells and colonies (Rousseau et al., 1994). Massive blooms of Phaeocystis sp. frequently cause environmental and economic damage to coastal areas [(Weisse et al., 1994) review]. Phaeocystis sp. also plays important roles in the global sulphur cycle and climate Journal of Plankton Research 25(7), © Oxford University Press; all rights reserved Grazing and colony size development in Phaeocystis globosa (Prymnesiophyceae): the role of a chemical signal KAM W . TANG 1, * DANISH INSTITUTE FOR FISHERIES RESEARCH, KAVALERGÅRDEN , DK- CHARLOTTENLUND, DENMARK 1 PRESENT ADDRESS: VIRGINIA INSTITUTE OF MARINE SCIENCE, COLLEGE OF WILLIAM & MARY , PO BOX , GLOUCESTER POINT , VA , USA *CORRESPONDING AUTHOR: [email protected] The bloom-forming prymnesiophyte Phaeocystis globosa forms hollow, spherical, mucilaginous colonies that vary from micrometres to millimetres in size. A recent paper gave the first empirical evidence that colony size increase in P. globosa is a defensive response against grazers, and knowing the signalling mechanism(s) behind this response will thus be a key to understanding the trophody- namics in systems dominated by this species. I conducted experiments with specially designed diffusion incubators, each of which consists of a non-grazing chamber (with P. globosa only) and a grazing chamber (grazers + phytoplankton) connected by 2 μm polycarbonate membrane filters. The results showed that physical contact with grazers was not required to initiate the defensive response; instead, P. globosa colony size increase was found to be stimulated by dissolved chemicals generated by ambient grazing activities. This signal was non-species specific, such that various combinations of three species of grazers and four species of phytoplankton in the grazing chambers all resulted in significant, but different extents of colony enlargement in P. globosa in the non-grazing chambers (30–300% larger than the ‘grazer-free’ control). High concentrations of ambient solitary P. globosa cells and other phytoplankton seemed to suppress colony enlargement in P. globosa, and grazers would help reduce this inhibition by removing the ambient solitary P. globosa cells and other phytoplankton. These non- species-specific mechanisms would allow P. globosa to regulate colony size development and defend itself in diverse planktonic systems, which may help to explain the global success of this species. JOURNAL OF PLANKTON RESEARCH VOLUME NUMBER PAGES ‒
Transcript of Grazing and colony size development in Phaeocystis globosa (Prymnesiophyceae): the role of a...

I N T RO D U C T I O N
Organisms of lower trophic levels face the danger ofpredation, and the ability to defend against predators istherefore a main driving force in their evolutionaryhistories (Mole, 1994; Tollrian, 1995). Because defencemechanisms can be costly to maintain, it is to the advan-tage of an organism to activate its defence mechanismsonly when predation risk is sensed (Agrawal, 1998).Signals for predation risk may come in visual, audio,physical or chemical forms. Since most lower trophicorganisms lack visual or audio perceptions, detectingpredators will rely on chemical or physical cues.Research on defensive responses among phytoplanktonhas been largely limited to freshwater systems. A well-studied example is morphological defence in the colony-forming chlorophyte Scenedesmus sp., which is oftenabundant in lakes. When solitary Scenedesmus sp. cells are
grazed by daphnids, colony formation intensifies suchthat the particle size increases to beyond the handlingcapacity of the grazers (Lürling and van Donk, 1997;Lürling, 1999). Subsequent studies showed that thisdefensive response is triggered by ‘infochemicals’released during the grazing process (Lampert et al.,1994; Lürling and van Donk, 1997; Lürling, 1998),although the nature of these infochemicals is still underdispute (Wiltshire and Lampert, 1999; Lürling and vonElert, 2001).
A comparable example in the marine systems is thecosmopolitan phytoplankton genus Phaeocystis (Prymne-siophyceae). The life cycle of Phaeocystis sp. involves analternation between solitary cells and colonies (Rousseauet al., 1994). Massive blooms of Phaeocystis sp. frequentlycause environmental and economic damage to coastalareas [(Weisse et al., 1994) review]. Phaeocystis sp. also playsimportant roles in the global sulphur cycle and climate
Journal of Plankton Research 25(7), © Oxford University Press; all rights reserved
Grazing and colony size development inPhaeocystis globosa (Prymnesiophyceae):the role of a chemical signalKAM W. TANG1,*DANISH INSTITUTE FOR FISHERIES RESEARCH, KAVALERGÅRDEN , DK- CHARLOTTENLUND, DENMARK
1PRESENT ADDRESS: VIRGINIA INSTITUTE OF MARINE SCIENCE, COLLEGE OF WILLIAM & MARY, PO BOX , GLOUCESTER POINT, VA , USA
*CORRESPONDING AUTHOR: [email protected]
The bloom-forming prymnesiophyte Phaeocystis globosa forms hollow, spherical, mucilaginous
colonies that vary from micrometres to millimetres in size. A recent paper gave the first empirical
evidence that colony size increase in P. globosa is a defensive response against grazers, and knowing
the signalling mechanism(s) behind this response will thus be a key to understanding the trophody-
namics in systems dominated by this species. I conducted experiments with specially designed diffusion
incubators, each of which consists of a non-grazing chamber (with P. globosa only) and a grazing
chamber (grazers + phytoplankton) connected by 2 µm polycarbonate membrane filters. The results
showed that physical contact with grazers was not required to initiate the defensive response; instead,
P. globosa colony size increase was found to be stimulated by dissolved chemicals generated by ambient
grazing activities. This signal was non-species specific, such that various combinations of three species
of grazers and four species of phytoplankton in the grazing chambers all resulted in significant, but
different extents of colony enlargement in P. globosa in the non-grazing chambers (30–300% larger
than the ‘grazer-free’ control). High concentrations of ambient solitary P. globosa cells and other
phytoplankton seemed to suppress colony enlargement in P. globosa, and grazers would help reduce
this inhibition by removing the ambient solitary P. globosa cells and other phytoplankton. These non-
species-specific mechanisms would allow P. globosa to regulate colony size development and defend
itself in diverse planktonic systems, which may help to explain the global success of this species.
JOURNAL OF PLANKTON RESEARCH VOLUME NUMBER PAGES ‒
250831 13/6/03 3:35 pm Page 831

regulation owing to its high production of dimethylsul-phoniopropionate, a precursor of the climatically activegas dimethylsulphide (Liss et al., 1994). Much remainsunknown about the biological roles of different life stagesand the regulation of transition between stages (Rousseauet al., 1994; Lancelot et al., 1998). Nevertheless, the preva-lence of the colonial form in natural Phaeocystis sp. bloomsin contrasting water types prompts the ideas that Phaeo-
cystis sp. colony development is regulated by commonfactors (Lancelot and Rousseau, 1994) and contributes tothe success of the genus in marine systems (Rousseauet al., 1994; Lancelot et al., 1998). Unlike the chain-forming Scenedesmus sp., Phaeocystis sp. colonies are hollow,balloon-like structures with individual cells lying beneatha thin mucous skin (Van Rijssel et al., 1997). This arrange-ment allows the colonies to increase their size with alimited number of cells—colonies of up to a few milli-metres in size with only a few thousand individual cellsare common in natural Phaeocystis sp. populations(Rousseau et al., 1990), and colonies of 2 cm in diameterhave been recorded in the laboratory (Riegman and vanBoekel, 1996). A long-held belief is that Phaeocystis sp.colony formation and growth is a defence strategybecause large colonies create a size-mismatch problem forsmall grazers (Weisse et al., 1994; Lancelot et al., 1998;Hamm et al., 1999; Ploug et al., 1999), but empiricalevidence had been missing until recently. Jakobsen andTang ( Jakobsen and Tang, 2002) showed that Phaeocystis
globosa formed colonies in the absence of grazers, but thepresence of grazers induced the colonies to increase insize significantly. Mean colony diameter in the grazingtreatments was up to 3-fold larger than that in the control;the overall range of colony diameter was also higher inthe grazing treatments, indicating that the change incolony diameter was not due to selective grazing on smallcolonies [figure 5 in ( Jakobsen and Tang, 2002)]. Colonysize increase provided protection for individual P. globosa
cells such that the grazers subsequently starved anddeclined ( Jakobsen and Tang, 2002). While thephenotypic response of P. globosa to grazing is clear, thesignalling mechanism(s) behind such a response remainsunclear. Earlier work by Kornmann showed that colonysize development was a function of the concentration ofan extract from boiled mud added to the medium, indi-cating that an unspecified chemical substance favourscolony enlargement (Kornmann, 1955). In the presentstudy, several possibilities will be considered.
(i) Physical signal: colony size increase is induced byphysical contact between P. globosa cells and grazers.If this is the case, it requires that P. globosa cells escapeor survive ingestion before the defence mechanismcan be initiated.
(ii) Chemical signal caused by non-specific grazing:colony size increase is induced by chemicals releasedby grazers independent of their feeding on P. globosa
cells. In this case, the chemicals indicate the presenceof potential grazers, but the resultant defensiveresponse is non-specific to grazing mortality ofP. globosa cells.
(iii) Chemical signal caused by specific grazing: chemi-cals are released when P. globosa cells are grazed upon.In this case, colony size increases only when P. globosa
cells are affected.(iv) Indirect grazing effect: grazing activities alter the
constituents of the ambient water, which theninduces P. globosa colony size to increase. Examplesare alteration of ambient nutrient composition andavailability due to grazers’ excretion, and removal ofco-existing phytoplankton cells.
The formation of large mucilaginous colonies in Phaeo-
cystis sp. is one of the most intriguing examples ofmorphological defence among phytoplankton. This studywas part of a continuing effort to investigate how grazersaffect P. globosa colony development. The goal was to char-acterize the signalling mechanism(s) behind P. globosa
colony size increase as a defensive response to grazing,which will help us better understand the trophodynamicsin systems dominated by P. globosa and explain its successin the world’s oceans.
M E T H O D
Phytoplankton and grazers
The present study used P. globosa, which forms nearlyperfect spherical colonies and is one of the most widelydistributed Phaeocystis species in the world’s oceans(Lancelot et al., 1998). Non-axenic P. globosa (CCMP 1528;which originated from the Pacific coast of South America)and other phytoplankton cultures (Table I) were grown inL-medium (Guillard and Hargraves, 1993) at 19 ± 1°Cwith 60–100 µmol photons m–2 s–1 in a 12 h light:12 hdark cycle. The cultures were maintained in exponentialgrowth phase by regular dilution with fresh medium.Solitary P. globosa cells for the experiments were collectedby passing the culture twice through an 11 µm sieve undergravity ( Jakobsen and Tang, 2002). Two protozoan andone copepod species were used as grazers (Table I). Theheterotrophic dinoflagellate Gyrodinium dominans wasoriginally isolated from Øresund, Denmark. Anotherheterotrophic dinoflagellate, Glenodinium cf. danicum, whichoriginated from the North Sea, was generously providedby Dr Suzanne Stromm (Western Washington University,USA). Both are common coastal protozoan species, and
JOURNAL OF PLANKTON RESEARCH VOLUME NUMBER PAGES ‒
250831 13/6/03 3:35 pm Page 832

grazing by G. dominans has been shown to induce colonyenlargement in P. globosa ( Jakobsen and Tang, 2002).Protozoan cultures were grown in L-medium on theexperimental diets for at least five generations beforeexperiments. Temora longicornis is a common calanoidcopepod species that co-exists with Phaeocystis sp. intemperate waters (Weisse, 1983; Hansen, 1995; Cotonnecet al., 2001). Mature females of T. longicornis collected fromthe North Sea were allowed to produce eggs in the labora-tory, which were then used to establish a cohort. A newgeneration of T. longicornis was raised to adults on a dietof Rhodomonas salina. Before the experiments, new maturefemale T. longicornis were acclimated to the experimentaldiets for at least 2 days. All experiments were carried outon a rotating plankton wheel (0.4 r.p.m.) at 19 ± 1°C with60–100 µmol photons m–2 s–1 in a 12 h light:12 h darkcycle. Aliquots were removed from experimental contain-ers and preserved in 4% acid Lugol’s solution. Protozoancells, solitary P. globosa cells and P. globosa colonies wereenumerated and sized according to the method ofJakobsen and Tang ( Jakobsen and Tang, 2002).
Test for a chemical signal (Experiments 1–4)
To test for the presence of a chemical signal, experimentswere carried out with specially designed diffusion incuba-tors. Each incubator was made of two polystyrenechambers connected by two 2 µm polycarbonatemembrane filters (Figure 1); the ‘grazing chamber’contained grazer and phytoplankton cells, whereas the‘non-grazing chamber’ contained only P. globosa solitarycells. Thus, grazers on one side and P. globosa cells on theother side of the incubator could exchange dissolvedchemicals across the membrane filters without physical
contact. Unlike dialysis bags commonly used for similarexperiments, the diffusion incubators can be fastenedonto a rotating plankton wheel to keep particles in suspen-sion. The incubators were arranged on the planktonwheel such that both chambers received equal amounts oflight. Preliminary tests with food dye showed thatdiffusion across the membrane filters reached ~50 and90% of equilibrium after 3 and 5 days, respectively(Figure 2). For controls, both chambers were filled withP. globosa solitary cells. The species specificity of the signalwas tested with different combinations of grazers andphytoplankton in the grazing chamber (Table II).Changes in cell abundance, P. globosa colony abundance
K. W. TANG PHAEOCYSTIS COLONY SIZE AND CHEMICAL SIGNAL
Table I: Phytoplankton and grazer species used in experiments
Phytoplankton Taxonomic group Size (µm) Carbon content (pg cell–1)
Phaeocystis globosa Prymnesiophyte 4.4 9.3
Isochrysis galbana Prymnesiophyte 4.2 8.2
Dunaliella tertiolecta Chlorophyte 7.0 30.2
Rhodomonas salina Cryptophyte 6.9 29.8
Thalassiosira weissflogii Diatom 15.0 105
Grazers Taxonomic group Size (µm)
Gyrodinium dominans Naked heterotrophic dinoflagellate 15
Glenodinium cf. danicum Thecate heterotrophic dinoflagellate 9.8
Temora longicornis Calanoid copepod 1000
All phytoplankton cultures were grown in L-medium (with silica for diatoms). Carbon content was calculated from cell size according to Strathmann(Strathmann, 1967). Phytoplankton cell size was measured on a particle counter. The size of heterotrophic dinoflagellates was measured by invertedmicroscopy. Copepod size was measured as approximate body length.
Fig. 1. Diffusion incubator. Each incubator contains two chambersmade of polystyrene tissue culture flasks. Two polycarbonate membranefilters are first glued to one flask with non-toxic silicone glue and held inplace by acrylic plastic rings. The rings are fused to both flasks by chlo-roform, which is volatile and leaves no harmful traces. The incubator isrotated in a direction that ensures equal amounts of light for both sides.
250831 13/6/03 3:35 pm Page 833

and size were followed for up to 15 days. While positiveresults (i.e. P. globosa colony size increased relative to thecontrol) would indicate the involvement of a chemicalsignal, additional experiments were required to furthercharacterize the chemical signal (see below).
Test of cell concentration effects(Experiment 5)
Experiments were conducted to test whether the initialsolitary P. globosa cell concentration affected their responseto the chemical signal. Four diffusion incubators were
filled with G. dominans (~1000 cells ml–1) and Dunaliella
tertiolecta (~45 000 cells ml–1) on one side and L-mediumon the opposite side. After 3 days, D. tertiolecta was grazedto low concentration and grazing-related dissolved chemi-cals would have diffused and accumulated in the non-grazing chambers of the incubators. Medium from thenon-grazing chambers was then harvested and used toincubate various concentrations of P. globosa solitary cells(initial concentration 50, 10 and 2 � 103 cells ml–1, in trip-licates) for 13 days. Untreated L-medium was used forcontrols. If the increase in colony size (relative to thecontrols) was inversely proportional to the initial cellconcentrations, it would suggest that the ambientchemical signal perhaps behaved similarly to nutrientsand was consumed by the cells during the colony develop-ment process.
Test of interspecific inhibition (Experiment 6)
Natural populations of Phaeocystis sp. co-exist with otherphytoplankton species (Riegman et al., 1992; Hegarty andVillareal, 1998). If the presence of competing phyto-plankton species inhibits Phaeocystis sp. bloom develop-ment and colony development, grazers may reduce suchinhibition by selectively removing the co-existing phyto-plankton species. To test the possibility of interspecificinhibition, duplicate diffusion incubators were set up suchthat one side was filled with P. globosa solitary cells whilethe opposite side was filled with a different phytoplanktonspecies. Four phytoplankton species were tested (Table I).For controls, both sides were filled with P. globosa solitarycells. All cell concentrations were adjusted to ~1–1.5 µgC ml–1 based on cell volume-to-carbon conversions(Strathmann, 1967). Cell abundance, colony abundanceand size were measured after 10 days.
JOURNAL OF PLANKTON RESEARCH VOLUME NUMBER PAGES ‒
Fig. 2. Diffusion of food dye across membrane filters of a diffusionincubator. Side A of the incubator began with red food dye and side Bwith distilled water. The incubator was then secured on a rotatingplankton wheel, and aliquots were taken through time from both sidesfor measuring absorbance at 320 nm. Results are expressed as the ratioof absorbance between A and B, and a ratio of 1 indicates equilibriumdistribution of food dye between the two sides.
Table II: Initial conditions of diffusion incubators for Experiments 1–4
Expt Treatment ‘Grazing’ chamber ‘Non-grazing’ n
Phytoplankton conc. Grazer abundancea (cells ml–1)
(cells ml–1) (cells ml–1)
1 PHA 2 � 104 P. globosa 400 G. dominans 2 � 104 2
DUN 2 � 104 D. tertiolecta 400 G. dominans 2 � 104 3
2 RHO 2 � 104 R. salina 200 G. dominans 2 � 104 3
3 RHO 2 � 104 R. salina 180 G. cf. danicum 104 3
4 TW 9000 T. weissflogii 10 T. longicornis (total) 1.3 � 104 4
All ‘non-grazing’ chambers were filled with solitary P. globosa cells. For controls, both sides of the diffusion incubators were filled with solitary P. globosacells (2–6 replicates).n, number of replicates.aGrazer abundance for T. longicornis is expressed as the total number of females.
chamber
250831 13/6/03 3:35 pm Page 834

Data analysis
Cell abundance and colony abundance among treatmentswere compared by parametric tests (Student’s t-test, orone-way ANOVA followed by Tukey test). For colonydiameters, data from within treatments were pooled andpresented in box plots showing 5, 10, 25, 50, 75, 90 and95 percentiles. Differences in colony diameters amongtreatments were tested by non-parametric tests(Mann–Whitney rank sum test, or Kruskal–Wallis testfollowed by Dunn’s pairwise comparisons). Colonyenlargement was indicated by significantly larger colonysize relative to the control on the corresponding days. Thesignificance level for all statistical tests was set at P = 0.05.To simplify the subsequent text, colony size is discussed interms of the geometric mean colony diameters.
R E S U LT S
Diffusion incubator experiments:G. dominans
In Experiment 1, grazing by G. dominans reduced solitaryP. globosa cells and D. tertiolecta to low concentrations in thegrazing chambers initially (Figure 3). Solitary P. globosa cellconcentration increased again after 3 days when G. dominans began to decline. However, D. tertiolecta wasunable to recover, and disappeared after 9 days. In the
K. W. TANG PHAEOCYSTIS COLONY SIZE AND CHEMICAL SIGNAL
Fig. 3. Diffusion incubator with G. dominans as grazers (Experiment 1).PHA, P. globosa treatment; DUN, D. tertiolecta treatment. (A) Phaeocystisglobosa solitary cell concentrations. (B) Phaeocystis globosa colony concen-trations. Results for the control are expressed as average concentrationsper chamber. (C) Cell concentrations of G. dominans and D. tertiolecta.Error bars are standard deviations of 3–4 replicates. Initial experimentalconditions are given in Table II.
Fig. 4. Box plots showing 5, 10, 25, 50, 75, 90 and 95 percentiles ofP. globosa colony diameters (Experiment 1). PHA, P. globosa treatment;DUN, D. tertiolecta treatment. Each box represents 90–120 measure-ments. Numbers are the geometric mean colony diameters, and aster-isks indicate significant difference (P < 0.05) from the control of the samesampling day.
250831 13/6/03 3:35 pm Page 835

non-grazing chambers, solitary P. globosa cell concentra-tions increased exponentially and levelled off by Day 12.The final concentration of solitary P. globosa cells in thenon-grazing chamber for the DUN (D. tertiolecta) treat-ment was 1.44 � 106 cells ml–1; thus, the average concen-tration for the entire incubator (grazing chamber +non-grazing chamber) would be 7.2 � 105 cells ml–1.Similarly, the average solitary P. globosa cell concentrationin the PHA (P. globosa) treatment was 7.6 � 105 cells ml–1
for the entire incubator. Both values were not significantlydifferent from the average solitary cell concentration inthe control, which was 7.5 � 105 cells ml–1 (Figure 3). Theabundance of P. globosa colonies gradually increased in allnon-grazing chambers and the control throughout the
experimental period. In the grazing chamber of the PHAtreatment, colonies also increased with time, but to alower abundance than the opposite side of the incubator(Figure 3). The average colony abundance for the entireincubator was not significantly different among all treat-ments.
Colony size in the control increased slightly, thenremained steady at ~60 µm after 9 days (Figure 4). Colonysize development was markedly different in the othertreatments. In the PHA treatment, colonies appeared inthe grazing chamber only after 6 days, and rapidlyincreased in size; by Day 15, the colonies were on averageabout three times larger than those in the control. In thenon-grazing chamber of the PHA treatment, colony sizealso increased significantly, by 30% relative to the controlafter 12 days. Significant colony enlargement was alsoobserved in the non-grazing chamber of the DUN treat-ment from Day 9 to Day 15, and the final colony size was60% larger than the control. The final colony size in theDUN treatment was also significantly larger than that inthe PHA non-grazing chamber, but smaller than that inthe PHA grazing chamber.
In Experiment 2, grazing by G. dominans reduced R. salina concentration to near zero by Day 15 (Figure 5);during this period, G. dominans increased initially, thendecreased as food became limiting. The solitary P. globosa
cell concentration in the non-grazing chamber of theRHO (R. salina) treatment increased steadily and reached8.0 � 105 cells ml–1; thus, the final average concentrationfor the entire incubator was 4.0 � 105 cells ml–1, the sameas that in the control (Figure 5). Colony concentration inthe RHO treatment increased to 6080 � 0.5 = 3040
JOURNAL OF PLANKTON RESEARCH VOLUME NUMBER PAGES ‒
Fig. 5. Diffusion incubator with G. dominans as grazers (Experiment 2).RHO, R. salina treatment. (A) Phaeocystis globosa solitary cell concentra-tions. (B) Phaeocystis globosa colony concentrations. Results for the controlare expressed as average concentrations per chamber. (C) Cell concen-trations of G. dominans and R. salina. Error bars are standard deviationsof 2–3 replicates. Initial experimental conditions are given in Table II.
Fig. 6. Box plots of P. globosa colony diameters (Experiment 2). RHO,R. salina treatment. Each box represents 60–90 measurements. Numbersare the geometric mean colony diameters, and asterisks indicate signifi-cant difference from the control of the same sampling day.
250831 13/6/03 3:36 pm Page 836

colonies ml–1 after 15 days, not significantly different fromthe control (average 2200 colonies ml–1). Colony develop-ment in the control was similar to that in Experiment 1,and the final colony size was 62 µm (Figure 6). Significantenlargement of P. globosa colonies was observed in thenon-grazing chamber of the RHO treatment from Day10 to Day 15, and the final colony size was 66% largerthan the control.
Diffusion incubator experiments:G. cf. danicum
In Experiment 3, R. salina was reduced by grazing to lowconcentration and did not recover until Day 15 (Figure 7).Glenodinium cf. danicum increased to high concentrationwithin 5 days, before decreasing to near zero at the end
of the experiment. In the RHO treatment, the finalconcentration of solitary P. globosa cells averaged 7.7 � 105
� 0.5 = 3.9 � 105 cells ml–1, significantly higher than thatin the control (2.6 � 105 cells ml–1); however, the finalcolony concentration (average 4800 ml–1) was notdifferent from the control (4600 ml–1). Colony size wassignificantly larger in the RHO treatment, and by Day 15the RHO treatment resulted in a 42% colony enlarge-ment relative to the control (Figure 8).
Diffusion incubator experiments:T. longicornis
In Experiment 4, the non-grazing chamber was filled withP. globosa, whereas the grazing chamber contained Thalas-
siosira weissflogii and T. longicornis. The phytoplankton celldynamics in this experiment were very different from theother experiments (Figure 9). Grazing activity wasconfirmed by the accumulation of copepod faecal pellets(average 11 pellets ml–1 on Day 15) and the presence ofnewly hatched nauplii in the grazing chamber; however,no female copepods survived at the end of the experi-ments. The concentration of T. weissflogii in the grazingchamber remained low initially, then increased to a highconcentration (7.3 � 104 cells ml–1). In the non-grazingchamber, solitary P. globosa cells increased to a highconcentration on Day 10, then decreased to 8.5 � 105
cells ml–1 on Day 15. Thus, the average cell concentration
K. W. TANG PHAEOCYSTIS COLONY SIZE AND CHEMICAL SIGNAL
Fig. 7. Diffusion incubator with G. cf. danicum as grazers (Experiment3). RHO, R. salina treatment. (A) Phaeocystis globosa solitary cell concen-trations. (B) Phaeocystis globosa colony concentrations. Results for thecontrol are expressed as average concentrations per chamber. (C) Cellconcentrations of G. cf. danicum and R. salina. Error bars are standarddeviations of 3–6 replicates. Initial experimental conditions are given inTable II.
Fig. 8. Box plots of P. globosa colony diameters (Experiment 3). RHO,R. salina treatment. Each box represents 90–180 measurements.Numbers are the geometric mean colony diameters, and asterisksindicate significant difference from the control of the same sampling day.
250831 13/6/03 3:36 pm Page 837
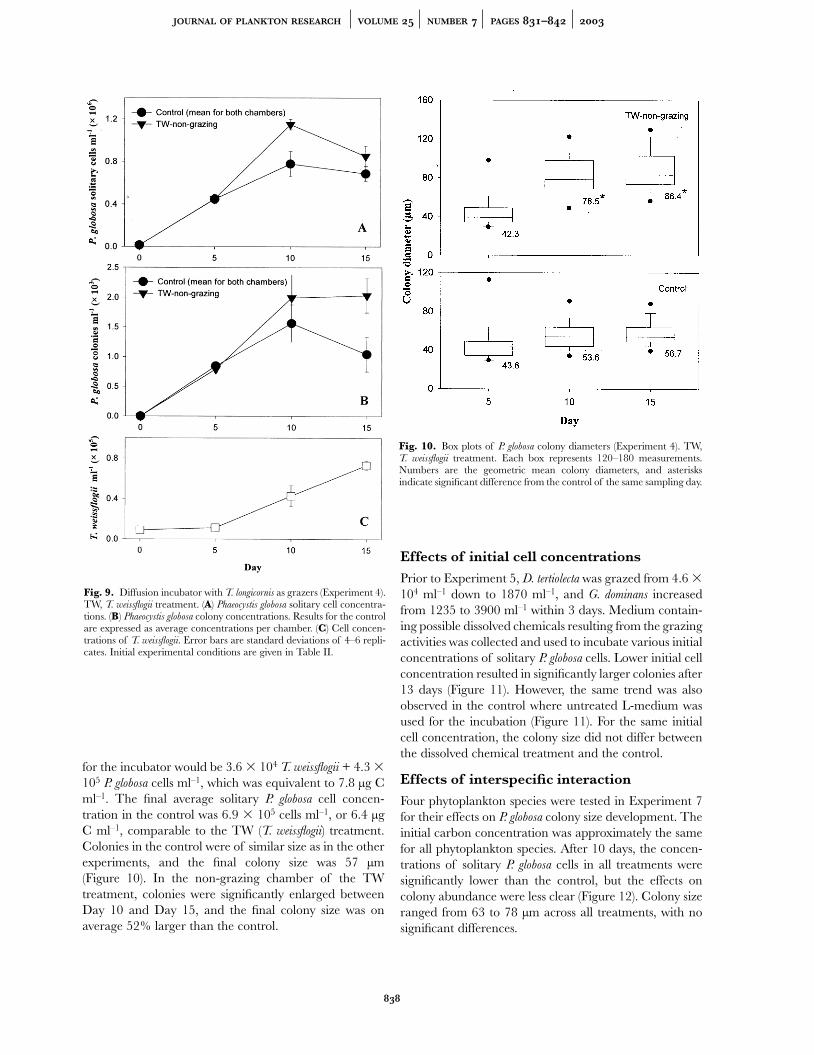
for the incubator would be 3.6 � 104 T. weissflogii + 4.3 �105 P. globosa cells ml–1, which was equivalent to 7.8 µg Cml–1. The final average solitary P. globosa cell concen-tration in the control was 6.9 � 105 cells ml–1, or 6.4 µgC ml–1, comparable to the TW (T. weissflogii) treatment.Colonies in the control were of similar size as in the otherexperiments, and the final colony size was 57 µm(Figure 10). In the non-grazing chamber of the TWtreatment, colonies were significantly enlarged betweenDay 10 and Day 15, and the final colony size was onaverage 52% larger than the control.
Effects of initial cell concentrations
Prior to Experiment 5, D. tertiolecta was grazed from 4.6 �104 ml–1 down to 1870 ml–1, and G. dominans increasedfrom 1235 to 3900 ml–1 within 3 days. Medium contain-ing possible dissolved chemicals resulting from the grazingactivities was collected and used to incubate various initialconcentrations of solitary P. globosa cells. Lower initial cellconcentration resulted in significantly larger colonies after13 days (Figure 11). However, the same trend was alsoobserved in the control where untreated L-medium wasused for the incubation (Figure 11). For the same initialcell concentration, the colony size did not differ betweenthe dissolved chemical treatment and the control.
Effects of interspecific interaction
Four phytoplankton species were tested in Experiment 7for their effects on P. globosa colony size development. Theinitial carbon concentration was approximately the samefor all phytoplankton species. After 10 days, the concen-trations of solitary P. globosa cells in all treatments weresignificantly lower than the control, but the effects oncolony abundance were less clear (Figure 12). Colony sizeranged from 63 to 78 µm across all treatments, with nosignificant differences.
JOURNAL OF PLANKTON RESEARCH VOLUME NUMBER PAGES ‒
Fig. 9. Diffusion incubator with T. longicornis as grazers (Experiment 4).TW, T. weissflogii treatment. (A) Phaeocystis globosa solitary cell concentra-tions. (B) Phaeocystis globosa colony concentrations. Results for the controlare expressed as average concentrations per chamber. (C) Cell concen-trations of T. weissflogii. Error bars are standard deviations of 4–6 repli-cates. Initial experimental conditions are given in Table II.
Fig. 10. Box plots of P. globosa colony diameters (Experiment 4). TW,T. weissflogii treatment. Each box represents 120–180 measurements.Numbers are the geometric mean colony diameters, and asterisksindicate significant difference from the control of the same sampling day.
250831 13/6/03 3:36 pm Page 838

D I S C U S S I O N
Role of a chemical signal in P. globosacolony size development
In Experiment 1, solitary P. globosa cells in the control andall non-grazing chambers increased exponentially, thenlevelled off by Day 15. The maximum cell concentrationswere possibly limited not by major nutrients (based on cellconcentrations, <10% of the total nitrogen and phos-phorus would have been consumed), but by the alkalinityof the medium (final pH = 9.0). Colony development inthe grazing chamber of the PHA treatment was verysimilar to the results from conventional glass bottle incu-bation ( Jakobsen and Tang, 2002). For example, similarinitial cell concentrations of G. dominans and P. globosa
resulted in almost identical final P. globosa colony concen-tration and size distribution [Figures 3 and 4 of this study;
figure 5 ‘High grazing’ in Jakobsen and Tang ( Jakobsenand Tang, 2002)]. In both studies, grazing by G. dominans
induced the same degree of colony enlargement (~3-foldincrease) relative to the control after 14–15 days. Suchcomparison shows that the diffusion incubators workedequally well as traditional glass bottles for studying P. globosa colony size development. However, the diffusionincubators prevent physical contact between the grazersin the grazing chambers and the P. globosa cells in the non-grazing chambers; therefore, colony size increase in thenon-grazing chamber could only be induced by achemical signal that resulted from grazing activities on the
K. W. TANG PHAEOCYSTIS COLONY SIZE AND CHEMICAL SIGNAL
Fig. 11. Response to grazing-related dissolved chemicals as a functionof initial solitary P. globosa cell concentrations (Experiment 5). UntreatedL-medium was used as a control. Each box represents final colony diam-eters (60 measurements) after 13 days. Numbers are the geometric meancolony diameters; asterisks indicate significant difference between treat-ments of different initial cell concentrations. For the same initial cellconcentrations, there was no significant difference between the dissolvedchemical treatment and control in terms of final colony size. Initialexperimental conditions are explained in the text.
Fig. 12. Effects of interspecific interactions on P. globosa colony develop-ment (Experiment 7). Diffusion incubators were filled on one side withP. globosa solitary cells and on the opposite side with equal carbon concen-trations of a different phytoplankton species (Control, P. globosa; ISO,I. galbana; DUN, D. tertiolecta; RHO, R. salina; TW, T. weissflogii). (A) Boxplots of colony diameters after 10 days. Each box represents 60 measure-ments and numbers are the geometric mean diameters. (B) Phaeocystisglobosa colony concentrations. (C) Phaeocystis globosa solitary cell concen-trations. Significant difference among treatments is also shown. Errorbars are standard deviations of duplicates. Initial experimentalconditions are explained in the text.
250831 13/6/03 3:36 pm Page 839

opposite side. In Experiments 1–4, colonies in all non-grazing chambers were significantly enlarged, indicatingthat physical contact with grazers was not required totrigger the defensive response by P. globosa.
An important observation is that the grazing effect wasnot species specific: three grazer and four phytoplanktonspecies in various combinations all resulted in P. globosa
colony enlargement relative to the controls, although theextent of enlargement varied. Thus, P. globosa respondedto chemicals characteristic of ambient grazing activitiesin general, and not just to physical contact or damage.This non-species-specific response would allow P. globosa
lead time to activate the defence mechanism, especiallyagainst grazers that selectively feed on an alternativelyavailable food source. For example, many copepods cangraze on a monospecific diet of solitary Phaeocystis sp. cells[summarized in Tang et al. (Tang et al., 2001)], but preferalternative food if Phaeocystis sp. cells are offered in amixture with other food particles (Hansen et al., 1993;Tang et al., 2001). Thus, grazing on co-existing phyto-plankton by copepods may not only reduce competition,but may also initiate the defence mechanism in P. globosa
in advance (Experiment 4, Figure 10).
Nature of the chemical signal
In this discussion, ‘chemical signal’ is broadly defined asa change in the ambient chemical composition that leadsto P. globosa colony enlargement. Such a change could bedue to de novo synthesis of chemical compounds, or alter-ation of existing constituents (e.g. nutrient ratios) of themedium. While Experiments 1–4 confirm the role of achemical signal in promoting P. globosa colony enlarge-ment, Experiments 5 and 6 were designed to further char-acterize this chemical signal. Two possible workingmechanisms need to be considered: a positive signalresults from grazing activities that promotes colony sizeincrease; a negative signal suppresses colony size increaseand is reduced by grazing activities.
In Experiment 1, the DUN non-grazing chamber andthe PHA non-grazing chamber had the same concentra-tions of P. globosa solitary cells and colonies (Figure 3), yetthe final colony size was significantly larger in the DUNnon-grazing chamber (Figure 4). Such a difference can beexplained by a positive signal resulting from theG. dominans grazing activities in the corresponding grazingchambers. Colonies in the PHA grazing chamber werethe largest, perhaps because the solitary P. globosa cellswould have received the strongest chemical signal fromthe immediate surrounding grazing activities. Colonyenlargement in the DUN and PHA treatments continuedbetween Day 9 and 15, even though grazing activitieswere negligible (indicated by the declining grazer concen-trations), suggesting that the grazing-related chemical
signal lasted at least 6 days, enough time to reach within90% of equilibrium distribution across the membranefilters (Figure 2). Therefore, the less pronounced colonyenlargement in the PHA non-grazing chamber relative tothe PHA grazing chamber suggests that the signal waspartly lost before diffusing across the membrane filters.
In Experiment 5, the response of P. globosa to thechemical signal was inversely proportional to the initialsolitary cell concentration. At first glance, these obser-vations seem to be consistent with the hypothesis that thechemical signal behaved as nutrients, such that for anequal amount of the signal, a lower initial cell concen-tration would respond more strongly (larger colonies).However, this cell concentration-dependent response wasalso found in the control, where the grazing-relatedchemicals were replaced by regular L-medium. Thus,results from Experiment 5 led to the hypothesis that asecond mechanism might be at work in regulating P. globosa colony size: high solitary P. globosa cell concen-tration appeared to suppress colony development, andgrazing of P. globosa cells decreased such suppression andallowed the colonies to increase in size. This hypotheticalsuppression also appears to come from other phyto-plankton species: interacting with other phytoplanktonspecies reduced the growth of solitary P. globosa cells, yetthe colonies were still restricted to small size (Experiment7). Grazing on these phytoplankton species would
JOURNAL OF PLANKTON RESEARCH VOLUME NUMBER PAGES ‒
Fig. 13. Dual mechanism for regulating P. globosa colony size develop-ment. High concentrations of solitary P. globosa cells (black circles) andother phytoplankton (squares) suppress (–) colony enlargement. Grazing(block arrows) by zooplankton (e.g. copepods and heterotrophic dino-flagellates) reduces this inhibition and produces a positive signal (+) thatstimulates colony size increase, which helps protect P. globosa cells.
250831 13/6/03 3:36 pm Page 840

therefore relieve the inhibition on colony enlargement, asshown in Experiments 1–4 (Figure 13).
Adaptive significance of the chemicalsignalling mechanism
Our previous study showed that grazing induced a colonysize increase in P. globosa ( Jakobsen and Tang, 2002). Thegoal of the present study was to characterize the signallingmechanism(s) that induces such a defensive response. Severalconclusions can be drawn from the experimental results.
Colony enlargement in P. globosa could be induced by achemical signal, which has, compared with a mechanicalsignal, the following advantage: because P. globosa solitarycells are readily ingested by many protozoan and copepodspecies, sometimes at high rates [(Tang et al., 2001) andreferences therein], it would be highly advantageous for P. globosa to initiate the defence mechanism prior tophysical contact with the grazers. Thus, the ability ofP. globosa to detect and respond to a grazing-relatedchemical signal by increasing the colony size will enhancethe chance of its survival.
In this study, colony size development appeared to besuppressed when the growth of solitary cells is favoured,or when there is strong competition from other phyto-plankton. Grazing will not only reduce this inhibition, butalso release a positive signal that induces colony enlarge-ment. Large P. globosa colonies may suffer from fastsinking, reduced nutrient uptake and additional metaboliccost for mucus production (Ploug et al., 1999; van Rijsselet al., 2000); thus, it would frequently be beneficial for P. globosa to remain as solitary cells and small colonieswhen grazing pressure is low. This grazing-related dualmechanism (decreased inhibition plus positive signal)would effectively regulate colony size developmentaccording to the ambient conditions.
For prey with a single defence mechanism, its chanceagainst diverse predators could be enhanced by a non-specific warning system. In the present case, the globallydistributed P. globosa is required to interact and defendagainst wide-ranging grazers. The limitation of its invari-ant defence mechanism (i.e. colony formation and enlarge-ment) can be partly compensated for by a non-specificsignalling mechanism that responds to general grazingactivities in the ambient environment. This study showedthat the signal(s) that regulated colony enlargement wasnot specific to the ambient phytoplankton or the grazers.Thus, this non-species-specific response would allow P. globosa to defend itself in diverse plankton communities.
The ecology of colony development inPhaeocystis
Traditionally, colony development and grazing aretreated as separate processes in Phaeocystis research;
however, this and our earlier studies ( Jakobsen and Tang,2002) showed that the two processes are linked, leading tonew understanding of Phaeocystis sp. bloom dynamics. Forinstance, field observations show that diatom bloomsregularly precede P. globosa blooms in the North Sea(Peperzak et al., 1998; Frangoulis et al., 2001). Theconventional view is that this bloom succession is regu-lated by changes in ambient nutrient composition andconcentration, and light intensity (Riegman et al., 1992;Peperzak et al., 1998). Yet, the role of grazers could beequally important. Results from the present study suggestthat grazing by copepods will not only reduce the diatompopulation, but also induce P. globosa colony enlargementsuch that subsequent size mismatch between the coloniesand the grazers would further favour P. globosa bloomdevelopment.
The application of defence theory has led to newinsights into the ecological and evolutionary aspects ofP. globosa colony development ( Jakobsen and Tang, 2002;this study); nevertheless, several questions await furtherstudy. (i) While the involvement of a chemical signal inP. globosa colony enlargement is evident, the chemicalnature of the signal remains unknown. Because the signalappeared to be non-species specific, it is likely to be acommon metabolite(s), such as excretory or cell lysisproducts. (ii) Although colony formation is a commonfeature in P. globosa, the relative dominance between thesolitary form and colonial form, and colony size distri-butions, can vary significantly between populations(Lancelot et al., 1998). This geographical variation mayreflect the differences in the ambient phytoplanktoncomposition, growth and grazing pressure. (iii) Phaeocystis
globosa colony formation in nature is probably regulatedby a combination of physical, chemical and biologicalfactors. Different populations of P. globosa are also likely toshow different responses to these factors, and evolvedifferently as a function of such factors plus hydrologicalconditions. While small-scale laboratory experiments canisolate and test individual factors, study of the synergisticeffects of various factors would require more compre-hensive, larger scale experiments and field observations.
AC K N OW L E D G E M E N T S
The author thanks S. Stromm for providing protozoancultures, Hans Jakobsen for helping with protozoanspecies identification, Elith Pedersen and Kristine Hansenfor technical assistance, T. Kiørboe, the editor and tworeviewers for constructive comments. This study wassupported by a Carlsberg Foundation (Denmark) researchfellowship awarded to K.W.T., and Danish NaturalScience Research Council Grant # 9801393 awarded toThomas Kiørboe.
K. W. TANG PHAEOCYSTIS COLONY SIZE AND CHEMICAL SIGNAL
250831 13/6/03 3:36 pm Page 841

R E F E R E N C E SAgrawal, A. A. (1998) Algal defenses, grazers, and their interactions in
aquatic trophic cascades. Acta Oecol., 19, 331–337.
Cotonnec, G., Brunet, C., Sautour, B. and Thoumelin, G. (2001) Nutri-tive value and selection of food particles by copepods during a springbloom of Phaeocystis sp. in the English Channel, as determined bypigment and fatty acid analyses. J. Plankton Res., 23, 693–703.
Frangoulis, C., Belkhiria, S., Goffart, A. and Hecq, J.-H. (2001)Dynamics of copepod faecal pellets in relation to a Phaeocystis domi-nated phytoplankton bloom: characteristics, production and flux.J. Plankton Res., 23, 75–88.
Guillard, R. R. L. and Hargraves, P. E. (1993) Stichochrysis immobilis is adiatom, not a chrysophyte. Phycologia, 32, 234–236.
Hamm, C. E., Simson, D. A., Merkel, R. and Smetacek, V. (1999)Colonies of Phaeocystis globosa are protected by a thin but tough skin.Mar. Ecol. Prog. Ser., 187, 101–111.
Hansen, F. C. (1995) Trophic interactions between zooplankton andPhaeocystis cf. globosa Helgoländer Meeresunters, 49, 283–293.
Hansen, F. C., Reckerman, M., Klein Breteler, W. C. M. and Riegman,R. (1993) Phaeocystis blooming enhanced by copepod predation onprotozoa: evidence from incubation experiments. Mar. Ecol. Prog. Ser.,102, 51–57.
Hegarty, S. G. and Villareal, T. A. (1998) Effects of light level and N:Psupply ratio on the competition between Phaeocystis cf. pouchetii (Hariot)Lagerheim (Prymnesiophyceae) and five diatom species. J. Exp. Mar.
Biol. Ecol., 226, 241–258.
Jakobsen, H. H. and Tang, K. W. (2002) Effects of protozoan grazingon colony formation in Phaeocystis globosa (Prymnesiophyceae) and thepotential costs and benefits. Aquat. Microb. Ecol., 27, 261–273.
Kornmann, P. (1955) Beobachtungen an Phaeocystis-kulturen. Helgol.
Wiss. Meeresunters., 5, 218–233.
Lampert, W., Rothhaupt, K. O. and von Elert, E. (1994) Chemicalinduction of colony formation in a green alga (Scenedesmus acutus) bygrazers (Daphnia). Limnol. Oceanogr., 39, 1543–1550.
Lancelot, C. and Rousseau, V. (1994) Ecology of Phaeocystis: the key roleof colony forms. In Green, J. C. and Leadbeater, B. S. C. (eds), The
Haptophyte Algae. Clarendon Press, Oxford, pp. 229–245.
Lancelot, C., Keller, M. D., Rousseau, V., Smith, W. O., Jr and Mathot,S. (1998) Autecology of the marine haptophyte Phaeocystis sp. InAnderson, D. M., Cembella, A. D. and Hallegraeff, G. M. (eds),Physiological Ecology of Harmful Algal Blooms. Springer-Verlag, Berlin,pp. 209–224.
Liss, P. S., Malin, G., Turner, S. M. and Holligan, P. M. (1994) Dimethylsulfide and Phaeocystis—a review. J. Mar. Syst., 5, 41–53.
Lürling, M. (1998) Effect of grazing-associated infochemicals on growthand morphological development in Scenedesmus acutus (Chloro-phyceae). J. Phycol., 34, 578–586.
Lürling, M. (1999) Grazer-induced coenobial formation in clonalcultures of Scenedesmus obliquus (Chlorococcales, Chlorophyceae).J. Phycol., 35, 19–23.
Lürling, M. and van Donk, E. (1997) Morphological changes inScenedesmus induced by infochemicals released in situ from zooplank-ton grazers. Limnol. Oceanogr., 42, 783–788.
Lürling, M. and von Elert, E. (2001) Colony formation in Scenedesmus: nocontribution of urea in induction by a lipophilic Daphnia exudate.Limnol. Oceanogr., 46, 1809–1813.
Mole, S. (1994) Trade-offs and constraints in plant–herbivore defensetheory: a life-history perspective. Oikos, 71, 3–12.
Peperzak, L., Colijn, F., Gieskes, W. W. C. and Peeters, J. C. H. (1998)Development of the diatom-Phaeocystis spring bloom in the Dutchcoastal zone of the North Sea: the silicon depletion versus the dailyirradiance threshold hypothesis. J. Plankton Res., 20, 517–537.
Ploug, H., Stolte, W. and Jørgensen, B. B. (1999) Diffusive boundarylayers of the colony-forming plankton alga Phaeocystis sp.: implicationsfor nutrient uptake and cellular growth. Limnol. Oceanogr., 44,1959–1967.
Riegman, R. and van Boekel, W. (1996) The ecophysiology of Phaeocys-
tis globosa: a review. J. Sea Res., 35, 235–242.
Riegman, R., Noordeloos, A. M. and Cadee, G. C. (1992) Phaeocystis
blooms and eutrophication of the continental coastal zones of theNorth Sea. Mar. Biol., 112, 479–484.
Rousseau, V., Mathot, S. and Lancelot, C. (1990) Calculating carbonbiomass of Phaeocystis sp. from microscopic observations. Mar. Biol.,107, 305–314.
Rousseau, V., Vaulot, D., Casotti, R., Cariou, V., Lenz, J., Gunkel, J. andBaumann, M. (1994) The life cycle of Phaeocystis (Prymnesiophyceae):evidence and hypotheses. J. Mar. Syst., 5, 23–39.
Strathmann, R. R. (1967) Estimating the organic carbon content ofphytoplankton from cell volume or plasma volume. Limnol. Oceanogr.,12, 411–418.
Tang, K. W., Jakobsen, H. H. and Visser, A. W. (2001) Phaeocystis globosa
(Prymnesiophyceae) and the planktonic food web: feeding, growth,and trophic interactions among grazers. Limnol. Oceanogr., 46,1860–1870.
Tollrian, R. (1995) Predator-induced morphological defenses—costs,life-history shifts, and maternal effects in Daphnia pulex. Ecology, 76,1691–1705.
Van Rijssel, M., Hamm, C. and Gieskes, W. W. C. (1997) Phaeocystis
globosa (Prymnesiophyceae) colonies: hollow structures built with smallamounts of polysaccharides. Eur. J. Phycol., 32, 185–192.
Weisse, T. (1983) Feeding of calanoid copepods in relation to Phaeocystis
pouchetii blooms in the German Wadden Sea area off Sylt. Mar. Biol.,74, 87–94.
Weisse, T., Tande, K., Verity, P., Hansen, F. and Gieskes, W. (1994) Thetrophic significance of Phaeocystis blooms. J. Mar. Syst., 5, 67–79.
Wiltshire, K. H. and Lampert, W. (1999) Urea excretion by Daphnia: acolony-inducing factor in Scenedesmus? Limnol. Oceanogr., 44,1894–1903.
Received on August 26, 2002; accepted on April 1, 2003
JOURNAL OF PLANKTON RESEARCH VOLUME NUMBER PAGES ‒
250831 13/6/03 3:36 pm Page 842