An unusual temperature induced isostructural phase transition in a scheelite, Li 0.5 Ce 0.5 MoO 4
Upload
independentCategory
view
0download
0
Dyes and Pigments 76 (2008) 179e186www.elsevier.com/locate/dyepig
Grayeblue Al2O3eMoOx ceramic pigments: Crystal structure,colouring mechanism and performance
Michele Dondi a, Francesco Matteucci a,*, Giovanni Baldi b, Andrea Barzanti b,Giuseppe Cruciani c, Isabella Zama a, Claudia L. Bianchi d
a ISTEC-CNR, Institute of Science and Technology for Ceramics, Via Granarolo 64, 48018 Faenza, Italyb CE.RI.COL., Colorobbia Research Centre, Via Pietramarina 53, 50053 Sovigliana-Vinci (Fi), Italy
c Department of Earth Sciences, University of Ferrara, Via Saragat 1, 44100 Ferrara, Italyd Department of Physical Chemistry & Electrochemistry, University of Milan, Via Golgi 19, 20133 Milano, Italy
Received 21 February 2006; received in revised form 16 April 2006; accepted 9 August 2006
Available online 10 October 2006
Abstract
Grayish-blue coloured aluminaemolybdena was synthesized by high temperature reducing firing and experimented as ceramic pigment. Syn-chrotron light and conventional X-ray diffraction powder, ICP-OES and BET analyses proved that molybdenum spreads over alumina surface,without entering the corundum lattice, with a high superficial concentration (i.e. 27e99 Mo atoms nm�2) implying a prevailing octahedral co-ordination and a certain long-range order, eventually resulting in the formation of crystalline MoO2. XPS and DRS suggested the occurrence ofdifferent valences, Mo(VI) being predominant over Mo(V) and Mo(IV). The colouring mechanism is mainly due to electronic absorption ofMo(V) in the redeorange region of the visible spectrum, giving rise to a characteristic blue shade; the gray cast is caused by extensive lightabsorption by Mo(IV) crystal field transitions and particularly MoeO charge transfer. The colouring performance of Al2O3eMoOx in ceramicglazes and porcelain stoneware bodies for wall and floor tiles is excellent, being equivalent to the pigment coloration. Thermal stability in thesematrices seems to be mostly affected by Na2O and MgO. However, the distinctly blue shade of these pigments is much less intense than that ofthe most performant ceramic colorants. At all events, aluminaemolybdena system develops a peculiar colour that cannot be reproduced unlessutilising the most expensive blue and black cobalt-bearing ceramic pigments.� 2006 Elsevier Ltd. All rights reserved.
Keywords: Ceramic pigments; Colouring performance; Molybdenum oxides; Optical properties
1. Introduction
The Al2O3eMoO3 system has attracted a noteworthy inter-est, in the last decade, for its catalytic properties and its poten-tial applications in a great deal of reactions, especiallyhydrodesulfurization, ethylene polymerization and isomeriza-tion [1,2]. Hence, aluminaemolybdena interactions havebeen thoroughly investigated, with special emphasis on adhe-sion mechanisms and kinetics, valences and coordination of
* Corresponding author. Tel.: þ39 0 546 699738; fax: þ39 0 546 46381.
E-mail address: [email protected] (F. Matteucci).
0143-7208/$ - see front matter � 2006 Elsevier Ltd. All rights reserved.
doi:10.1016/j.dyepig.2006.08.021
Mo ions, short-range and long-range order of Mo oxide, for-mation of transient phases, effect of additives and conditionsof thermal treatment [2e12].
The adhesion of Mo on the surface of a-Al2O3 occurs bychemical adsorption, with no cationic substitution into thecrystal lattice of corundum [2e7]. During the thermal treat-ment, Mo spreads onto the alumina by a diffusion mechanisminvolving probably both surface and gas phase transport bysublimationecrystallization of molybdenum oxide [5,6].
Molybdena changes coordination and long-range orderdepending on its superficial concentration on a-Al2O3: forvery low concentrations (<5.6 Mo atoms nm�2) highlydispersed tetrahedral [MoO4] sites are present; above this
180 M. Dondi et al. / Dyes and Pigments 76 (2008) 179e186
dispersion limit, there are tetrahedral and octahedral sites co-existing; for high concentrations, a long-range ordering of[MoO6] occurs, giving eventually rise to crystalline MoO3 orMoO2 in reducing conditions [2e4,7].
On the corundum surface, Mo ions occur mainly withvalence (VI), as detected by XPS, even after a thermal cyclein reducing conditions. However, the occurrence of lowervalences of molybdenum is somehow evidenced by opticalspectroscopy; as a matter of fact, many Al2O3eMoO3
products prepared in reducing environment exhibit a grayish-blue shade that is not consistent with the presence ofMo(VI) only [13,14].
The possibility to obtain heat-resistant, blue-colouredoxides is of the highest interest for the ceramic industry, asall the ceramic pigments in the market contain cobalt (e.g.Co2SiO4, CoAl2O4, (Zn,Co)SiO4) [15,16] and there are grow-ing problems concerning the toxicity, high cost and limitedavailability of cobalt oxide [16]. On the other hand, the widelyused VeZrSiO4 pigment is turquoise and cannot impart a pureblue coloration to ceramic wares [15].
Assessing the potential of aluminaemolybdena as ceramicpigment is the main goal of the present work. For this purpose,Al2O3eMoOx powders were synthesized in industrial-likeconditions, characterised from the structural and spectroscopicviewpoints, then tested in several ceramic applications (walland floor tiles, sanitary ware) in a wide range of temperature(950e1300 �C).
2. Materials and methods
2.1. Sample preparation
Three samples were prepared by dry mixing Al2O3 andMoO3, with 99.9% of purity and particle size distribution of20e30 mm, in the following Al2O3/MoO3 weight ratios: 92:8(AM8), 90:10 (AM10) and 85:15 (AM15). Mixtures were firedin reducing atmosphere in a mullite crucible up to 1300 �Cwith a heating rate of 5 �C min�1, 2 h of soaking time (perma-nence at the maximum firing temperature) and natural cooling.The reducing atmosphere in the kiln was obtained by fluxingnitrogen/hydrogen in the 95:5 ratio up to 200 �C througha pine hole in the bottom of the crucible, so that the samplewas crossed by gas. After firing the powders were wet milled,dried and sieved at 100 microns.
2.2. Sample characterisation
Laboratory X-ray powder diffraction data were collected ona Philips PW 1820/00 diffractometer at room temperature (CuKa radiation; 15e130� 2q range; D2q step 0.02�; countingtime per step 10 s; diffracted-beam graphite monochromator)on the samples AM10 and AM15. In order to determineaccurately the crystal structure parameters, the sample AM8was characterised through high resolution X-ray powder dif-fraction, performed at the SwisseNorwegian Beam Line(ESRF, Grenoble, France). Powder samples, filled in glasscapillaries of 0.5 mm, were mounted in the DebyeeScherrer
geometry (l¼ 0.79982 A, 1e52.5� 2q range; D2q step0.0025�; counting time per step 1.5 s). Crystal structure Riet-veld refinements were performed using the GSAS-EXPGUI[17,18] package (see Table 1). Starting atomic parametersfor the corundum were taken from Maslen [19], adopting thesame R-3cH space group. The number of independent refinedvariables ranged up to 24: scaling factors, zero-point correc-tion, cell dimensions, 6e12 coefficients of the shifted Cheby-schev function to fit the background, atomic positions, andprofile coefficients (one Gaussian GW and two Lorentzianterms [Lx,Ly]). The Al vs. Mo fraction in the cationic sitewas refined by contrasting their X-ray scattering curves andassuming full occupancy of the cationic site. Refined unitcell parameters and crystallographic details are given inTable 1. X-ray photoelectron spectra were taken in a M-probeapparatus (Surface Science Instruments). The source wasmonochromatic Al K radiation (1486.6 eV). A spot size of200� 750 mm and a pass energy of 25 eV were used. Theenergy scale was calibrated with reference to the 4f7/2 levelof a freshly evaporated gold sample, at 84.0� 0.1 eV, andwith reference to the 2p3/2 and 3s levels of copper at932.5� 0.1 and 122.39� 0.15 eV, respectively. The bindingenergies (BE) were corrected for specimen charging byreferencing the C 1s peak to 284.6 eV, and the backgroundwas subtracted using Shirley’s method. The C region was fittedinto two or three peaks, depending on the tail shape. Thedeconvolution was performed using only Gaussian line shapes.The accuracy of the reported BE can be estimated to be�0.1 eV. With a monochromatic source, an electron floodgun is required to compensate the build up of positive chargeon the samples during the analyses, when insulating samplesare analyzed: a value of 5 eV has been selected. UVeviseNIR spectroscopy was performed by diffuse reflectance witha BaSO4 integrating sphere (Perkin Elmer l35) in the 300e1100 nm range, step 0.3 nm, using BaSO4 as a reference.Energy and width of the main absorbance peaks in the opticalspectra were determined using Gaussian bands for ded transi-tions and Lorentzian bands for MoeO charge transfer througha deconvolution procedure (PFM, OriginLab). Microstructuralanalysis was carried out by scanning electron microscopy(SEM, Cambridge 360, Oxford, UK). Measurement of specificsurface of pigments was performed by nitrogen adsorptionwith single point method using a Micromeritics FlowSorb II2300 apparatus (ASTM C 1069), while the amount of molyb-denum was determined by inductively coupled plasma emis-sion spectrophotometry (ICP-OES) with a Varian Liberty200 equipment; the analytical solutions were obtained bymelting with lithium tetraborate at 1200 �C in graphite cruci-ble. The surface concentration of Mo was estimated based onICP-OES and BET data according to Ref. [3]. The colouringperformance was appraised by adding the pigment AM10(5 wt%) to a ceramic body and to three glazes for porcelainstoneware (G1) and stoneware tiles (G2 and G3) that under-went firing in industrial kilns at temperatures between 1150and 1220 �C. Moreover, thermal stability was appraised bywet mixing the aluminaemolybdena pigments (5 wt%) intoseveral ceramic matrices: two glassy coatings (F1 and F2)
181M. Dondi et al. / Dyes and Pigments 76 (2008) 179e186
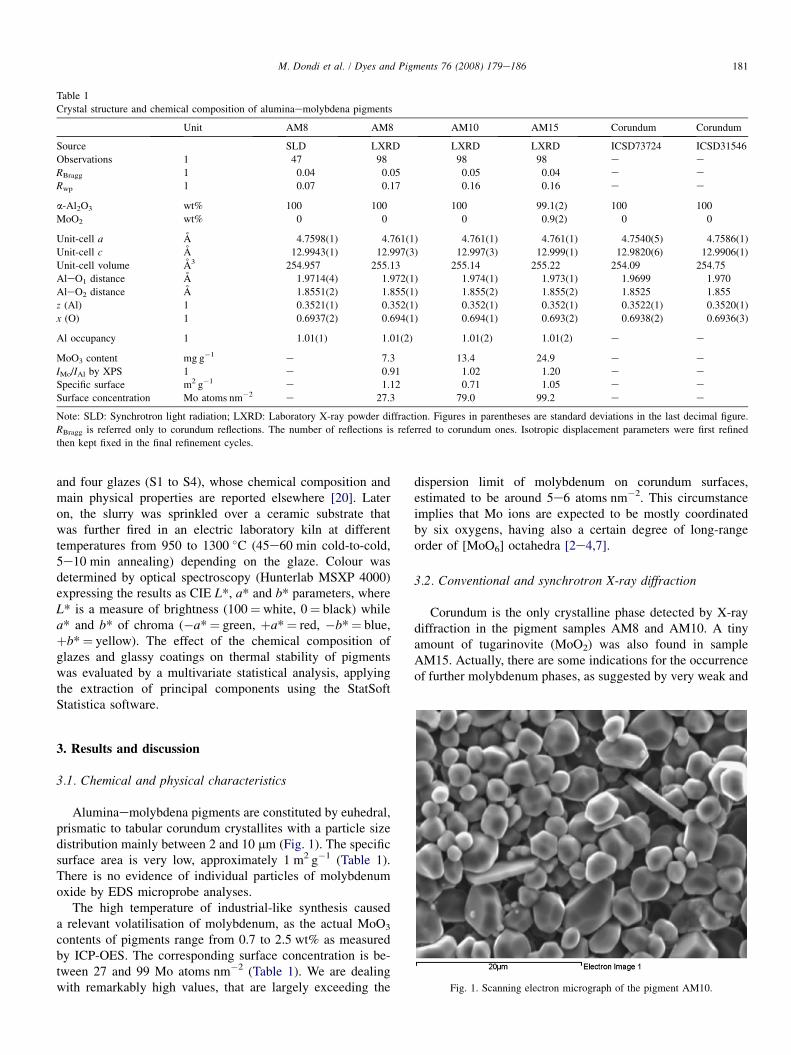
Table 1
Crystal structure and chemical composition of aluminaemolybdena pigments
Unit AM8 AM8 AM10 AM15 Corundum Corundum
Source SLD LXRD LXRD LXRD ICSD73724 ICSD31546
Observations 1 47 98 98 98 e e
RBragg 1 0.04 0.05 0.05 0.04 e eRwp 1 0.07 0.17 0.16 0.16 e e
a-Al2O3 wt% 100 100 100 99.1(2) 100 100
MoO2 wt% 0 0 0 0.9(2) 0 0
Unit-cell a A 4.7598(1) 4.761(1) 4.761(1) 4.761(1) 4.7540(5) 4.7586(1)
Unit-cell c A 12.9943(1) 12.997(3) 12.997(3) 12.999(1) 12.9820(6) 12.9906(1)
Unit-cell volume A3 254.957 255.13 255.14 255.22 254.09 254.75
AleO1 distance A 1.9714(4) 1.972(1) 1.974(1) 1.973(1) 1.9699 1.970
AleO2 distance A 1.8551(2) 1.855(1) 1.855(2) 1.855(2) 1.8525 1.855
z (Al) 1 0.3521(1) 0.352(1) 0.352(1) 0.352(1) 0.3522(1) 0.3520(1)
x (O) 1 0.6937(2) 0.694(1) 0.694(1) 0.693(2) 0.6938(2) 0.6936(3)
Al occupancy 1 1.01(1) 1.01(2) 1.01(2) 1.01(2) e e
MoO3 content mg g�1 e 7.3 13.4 24.9 e e
IMo/IAl by XPS 1 e 0.91 1.02 1.20 e eSpecific surface m2 g�1 e 1.12 0.71 1.05 e e
Surface concentration Mo atoms nm�2 e 27.3 79.0 99.2 e e
Note: SLD: Synchrotron light radiation; LXRD: Laboratory X-ray powder diffraction. Figures in parentheses are standard deviations in the last decimal figure.
RBragg is referred only to corundum reflections. The number of reflections is referred to corundum ones. Isotropic displacement parameters were first refined
then kept fixed in the final refinement cycles.
and four glazes (S1 to S4), whose chemical composition andmain physical properties are reported elsewhere [20]. Lateron, the slurry was sprinkled over a ceramic substrate thatwas further fired in an electric laboratory kiln at differenttemperatures from 950 to 1300 �C (45e60 min cold-to-cold,5e10 min annealing) depending on the glaze. Colour wasdetermined by optical spectroscopy (Hunterlab MSXP 4000)expressing the results as CIE L*, a* and b* parameters, whereL* is a measure of brightness (100¼white, 0¼ black) whilea* and b* of chroma (�a*¼ green, þa*¼ red, �b*¼ blue,þb*¼ yellow). The effect of the chemical composition ofglazes and glassy coatings on thermal stability of pigmentswas evaluated by a multivariate statistical analysis, applyingthe extraction of principal components using the StatSoftStatistica software.
3. Results and discussion
3.1. Chemical and physical characteristics
Aluminaemolybdena pigments are constituted by euhedral,prismatic to tabular corundum crystallites with a particle sizedistribution mainly between 2 and 10 mm (Fig. 1). The specificsurface area is very low, approximately 1 m2 g�1 (Table 1).There is no evidence of individual particles of molybdenumoxide by EDS microprobe analyses.
The high temperature of industrial-like synthesis causeda relevant volatilisation of molybdenum, as the actual MoO3
contents of pigments range from 0.7 to 2.5 wt% as measuredby ICP-OES. The corresponding surface concentration is be-tween 27 and 99 Mo atoms nm�2 (Table 1). We are dealingwith remarkably high values, that are largely exceeding the
dispersion limit of molybdenum on corundum surfaces,estimated to be around 5e6 atoms nm�2. This circumstanceimplies that Mo ions are expected to be mostly coordinatedby six oxygens, having also a certain degree of long-rangeorder of [MoO6] octahedra [2e4,7].
3.2. Conventional and synchrotron X-ray diffraction
Corundum is the only crystalline phase detected by X-raydiffraction in the pigment samples AM8 and AM10. A tinyamount of tugarinovite (MoO2) was also found in sampleAM15. Actually, there are some indications for the occurrenceof further molybdenum phases, as suggested by very weak and
Fig. 1. Scanning electron micrograph of the pigment AM10.

182 M. Dondi et al. / Dyes and Pigments 76 (2008) 179e186
broad peaks (Fig. 2) tentatively attributable to MoO3 or toa mixed valence oxide (Mo4O11), but it was not possible tosolve them.
The Rietveld refinement of the corundum structure gavereliable results for both conventional and synchrotron X-raydiffraction data (Fig. 3). The refined crystallographic parame-ters for all the three samples do not exhibit any significantvariation by varying the molybdenum doping amount (Table1). The cell parameters of the doped alumina pigments areslightly larger than those of the undoped structure [19] beingwithin the range of the pure a-Al2O3 [21] due to differentprocessing conditions (i.e. raw materials, firing cycle, etc.).The cell parameters and refined octahedral distances in dopedsamples are larger than those reported for the undoped struc-ture; this could be interpreted as caused by the isomorphoussubstitution of Mo ions for Al ions in the alumina structure.However, the differences are within the estimated error range.Furthermore, the attempts to refine the electron density in theoctahedral site e assuring the convergence of isotropic dis-placement parameters e suggest the only presence of alumin-ium ions.
3.3. X-ray photoelectron and diffuse reflectancespectroscopy
All the three tested samples showed XPS spectra character-ised by two Mo(VI) peaks centred at 232.2 and at 235.7 eV,respectively (Fig. 4). Interesting enough, the intensity ratioof the Mo and Al peaks is perfectly correlated with theMoO3 content measured by ICP-OES (Table 1). Similar XPSspectra were collected by other authors [7,11,13]: there wasno evidence for Mo (IV) or Mo (V) in molybdenum filmsover a-Al2O3, even when strongly reducing conditions wereapplied. Though the width of Mo3d5/2 peaks was used asa clue for the occurrence of multiple valences (e.g. FWHMvalues around 2.7 eV [13]), it depends mainly on the thicknessof the molybdena film [7]. In our pigments these FWHMvalues are about 1.8 eV, therefore corresponding to y1%Mo loading according to Spevack and McIntyre [7] in goodaccordance with our ICP data.
The diffuse reflectance spectra are characterised by aconspicuous light absorption in the UVeviseNIR range,
Fig. 2. X-ray powder diffraction pattern of sample AM15.
where two very broad humps are clearly distinguished(Fig. 5) being separated by a minimum of absorbance inbetween 22,000 and 25,000 cm�1, corresponding to 400e450 nm, thus explaining the blue shade perceived by thehuman eye. These spectra are very similar to those obtainedfor the same system by Siokou and co-workers [13].
The two above-mentioned humps were successfully decon-volved assuming the occurrence of mainly crystal field (CF)electronic transitions at lower energies (i.e. <22,000 cm�1)and oxygen-metal charge transfer (MLCT) at the higher wave-numbers, in agreement with the known optical response ofmolybdenum-bearing oxides [13,22].
In particular, three CF transitions were found (Table 2):
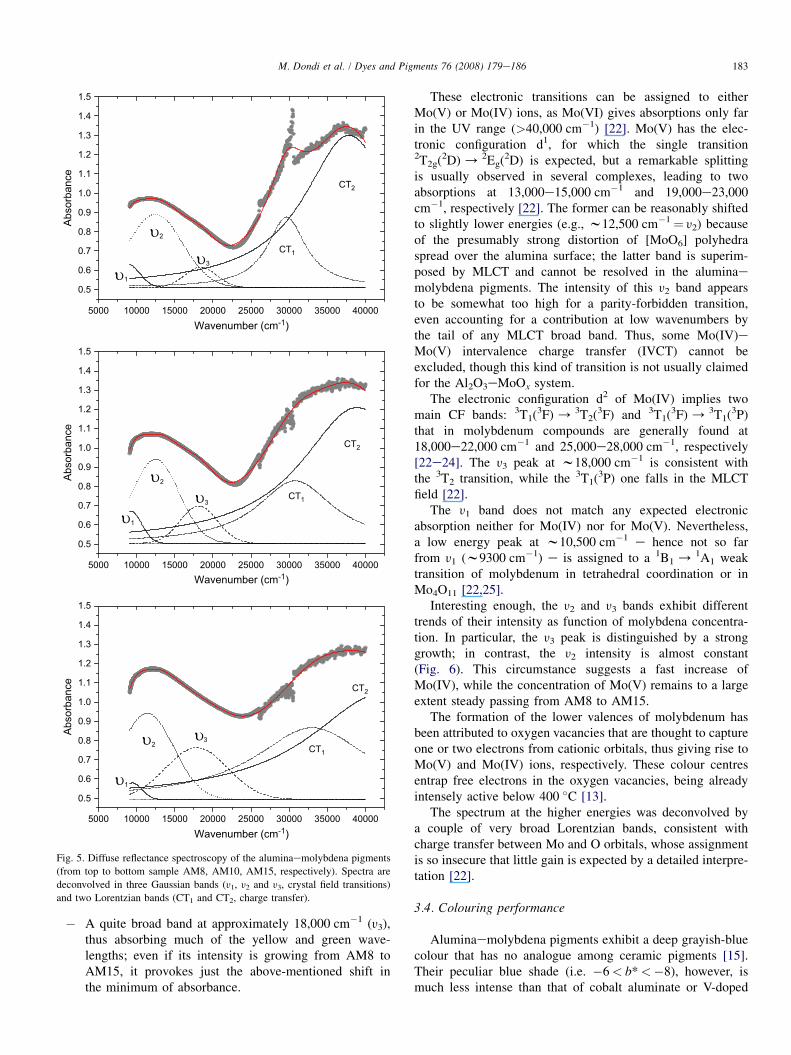
� A weak band below 10,000 cm�1 (y1) rather steady in allsamples; being far in the infrared, it has little or no influ-ence on coloration.
� An intense peak centred at about 12,000 cm�1 (y2); beingextended also in the redeorange region of the visiblerange, it is mainly responsible for the blue shade ofpigments.
Fig. 3. Rietveld refinement plot of the X-ray powder diffraction data of the
sample AM8. In the figure the continuous line represents the calculated
pattern, while cross points show the observed pattern. The difference curve
between observed and calculated profiles is plotted below.
Fig. 4. X-ray photon spectroscopy Mo(3d) spectrum of pigment AM10.
183M. Dondi et al. / Dyes and Pigments 76 (2008) 179e186
� A quite broad band at approximately 18,000 cm�1 (y3),thus absorbing much of the yellow and green wave-lengths; even if its intensity is growing from AM8 toAM15, it provokes just the above-mentioned shift inthe minimum of absorbance.
0.5
0.6
0.7
0.8
0.9
1.0
1.1
1.2
1.3
1.4
1.5
Abso
rban
ce
5000 10000 15000 20000 25000 30000 35000 40000Wavenumber (cm-1)
1
2
3
0.5
0.6
0.7
0.8
0.9
1.0
1.1
1.2
1.3
1.4
1.5
Abso
rban
ce
5000 10000 15000 20000 25000 30000 35000 40000Wavenumber (cm-1)
1
23
CT1
CT2
0.5
0.6
0.7
0.8
0.9
1.0
1.1
1.2
1.3
1.4
1.5
Abso
rban
ce
5000 10000 15000 20000 25000 30000 35000 40000Wavenumber (cm-1)
1
2
3CT1
CT2
CT1
CT2
Fig. 5. Diffuse reflectance spectroscopy of the aluminaemolybdena pigments
(from top to bottom sample AM8, AM10, AM15, respectively). Spectra are
deconvolved in three Gaussian bands (y1, y2 and y3, crystal field transitions)
and two Lorentzian bands (CT1 and CT2, charge transfer).
These electronic transitions can be assigned to eitherMo(V) or Mo(IV) ions, as Mo(VI) gives absorptions only farin the UV range (>40,000 cm�1) [22]. Mo(V) has the elec-tronic configuration d1, for which the single transition2T2g(2D) / 2Eg(2D) is expected, but a remarkable splittingis usually observed in several complexes, leading to twoabsorptions at 13,000e15,000 cm�1 and 19,000e23,000cm�1, respectively [22]. The former can be reasonably shiftedto slightly lower energies (e.g., w12,500 cm�1¼ y2) becauseof the presumably strong distortion of [MoO6] polyhedraspread over the alumina surface; the latter band is superim-posed by MLCT and cannot be resolved in the aluminaemolybdena pigments. The intensity of this y2 band appearsto be somewhat too high for a parity-forbidden transition,even accounting for a contribution at low wavenumbers bythe tail of any MLCT broad band. Thus, some Mo(IV)eMo(V) intervalence charge transfer (IVCT) cannot beexcluded, though this kind of transition is not usually claimedfor the Al2O3eMoOx system.
The electronic configuration d2 of Mo(IV) implies twomain CF bands: 3T1(3F) / 3T2(3F) and 3T1(3F) / 3T1(3P)that in molybdenum compounds are generally found at18,000e22,000 cm�1 and 25,000e28,000 cm�1, respectively[22e24]. The y3 peak at w18,000 cm�1 is consistent withthe 3T2 transition, while the 3T1(3P) one falls in the MLCTfield [22].
The y1 band does not match any expected electronicabsorption neither for Mo(IV) nor for Mo(V). Nevertheless,a low energy peak at w10,500 cm�1 e hence not so farfrom y1 (w9300 cm�1) e is assigned to a 1B1 / 1A1 weaktransition of molybdenum in tetrahedral coordination or inMo4O11 [22,25].
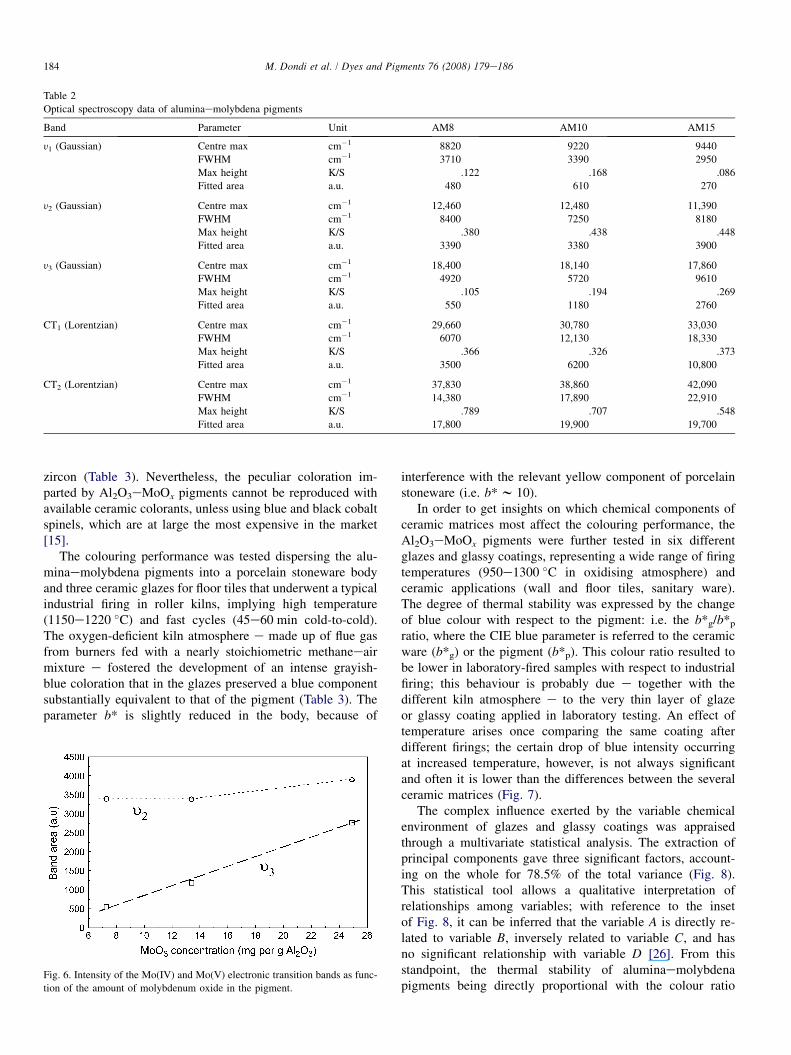
Interesting enough, the y2 and y3 bands exhibit differenttrends of their intensity as function of molybdena concentra-tion. In particular, the y3 peak is distinguished by a stronggrowth; in contrast, the y2 intensity is almost constant(Fig. 6). This circumstance suggests a fast increase ofMo(IV), while the concentration of Mo(V) remains to a largeextent steady passing from AM8 to AM15.
The formation of the lower valences of molybdenum hasbeen attributed to oxygen vacancies that are thought to captureone or two electrons from cationic orbitals, thus giving rise toMo(V) and Mo(IV) ions, respectively. These colour centresentrap free electrons in the oxygen vacancies, being alreadyintensely active below 400 �C [13].
The spectrum at the higher energies was deconvolved bya couple of very broad Lorentzian bands, consistent withcharge transfer between Mo and O orbitals, whose assignmentis so insecure that little gain is expected by a detailed interpre-tation [22].
3.4. Colouring performance
Aluminaemolybdena pigments exhibit a deep grayish-bluecolour that has no analogue among ceramic pigments [15].Their peculiar blue shade (i.e. �6< b*<�8), however, ismuch less intense than that of cobalt aluminate or V-doped
184 M. Dondi et al. / Dyes and Pigments 76 (2008) 179e186
Table 2
Optical spectroscopy data of aluminaemolybdena pigments
Band Parameter Unit AM8 AM10 AM15
y1 (Gaussian) Centre max cm�1 8820 9220 9440
FWHM cm�1 3710 3390 2950
Max height K/S .122 .168 .086
Fitted area a.u. 480 610 270
y2 (Gaussian) Centre max cm�1 12,460 12,480 11,390
FWHM cm�1 8400 7250 8180
Max height K/S .380 .438 .448
Fitted area a.u. 3390 3380 3900
y3 (Gaussian) Centre max cm�1 18,400 18,140 17,860
FWHM cm�1 4920 5720 9610
Max height K/S .105 .194 .269
Fitted area a.u. 550 1180 2760
CT1 (Lorentzian) Centre max cm�1 29,660 30,780 33,030
FWHM cm�1 6070 12,130 18,330
Max height K/S .366 .326 .373
Fitted area a.u. 3500 6200 10,800
CT2 (Lorentzian) Centre max cm�1 37,830 38,860 42,090
FWHM cm�1 14,380 17,890 22,910
Max height K/S .789 .707 .548
Fitted area a.u. 17,800 19,900 19,700
zircon (Table 3). Nevertheless, the peculiar coloration im-parted by Al2O3eMoOx pigments cannot be reproduced withavailable ceramic colorants, unless using blue and black cobaltspinels, which are at large the most expensive in the market[15].
The colouring performance was tested dispersing the alu-minaemolybdena pigments into a porcelain stoneware bodyand three ceramic glazes for floor tiles that underwent a typicalindustrial firing in roller kilns, implying high temperature(1150e1220 �C) and fast cycles (45e60 min cold-to-cold).The oxygen-deficient kiln atmosphere e made up of flue gasfrom burners fed with a nearly stoichiometric methaneeairmixture e fostered the development of an intense grayish-blue coloration that in the glazes preserved a blue componentsubstantially equivalent to that of the pigment (Table 3). Theparameter b* is slightly reduced in the body, because of
Fig. 6. Intensity of the Mo(IV) and Mo(V) electronic transition bands as func-
tion of the amount of molybdenum oxide in the pigment.
interference with the relevant yellow component of porcelainstoneware (i.e. b* w 10).
In order to get insights on which chemical components ofceramic matrices most affect the colouring performance, theAl2O3eMoOx pigments were further tested in six differentglazes and glassy coatings, representing a wide range of firingtemperatures (950e1300 �C in oxidising atmosphere) andceramic applications (wall and floor tiles, sanitary ware).The degree of thermal stability was expressed by the changeof blue colour with respect to the pigment: i.e. the b*g/b*p
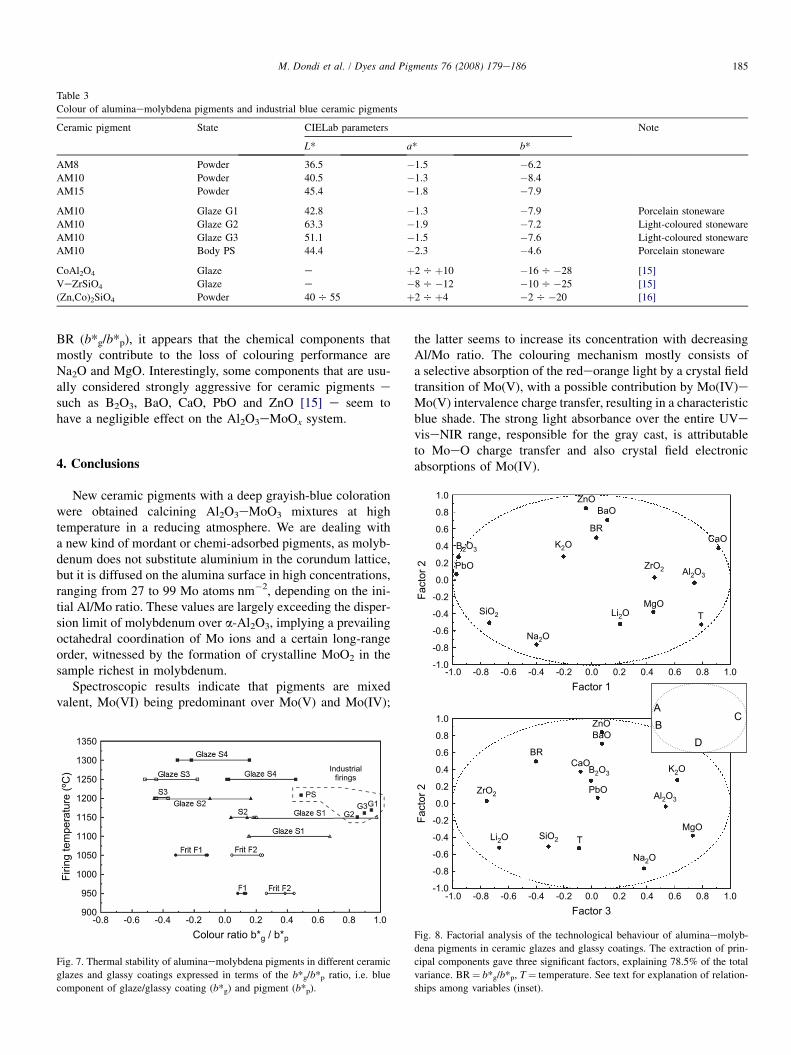
ratio, where the CIE blue parameter is referred to the ceramicware (b*g) or the pigment (b*p). This colour ratio resulted tobe lower in laboratory-fired samples with respect to industrialfiring; this behaviour is probably due e together with thedifferent kiln atmosphere e to the very thin layer of glazeor glassy coating applied in laboratory testing. An effect oftemperature arises once comparing the same coating afterdifferent firings; the certain drop of blue intensity occurringat increased temperature, however, is not always significantand often it is lower than the differences between the severalceramic matrices (Fig. 7).
The complex influence exerted by the variable chemicalenvironment of glazes and glassy coatings was appraisedthrough a multivariate statistical analysis. The extraction ofprincipal components gave three significant factors, account-ing on the whole for 78.5% of the total variance (Fig. 8).This statistical tool allows a qualitative interpretation ofrelationships among variables; with reference to the insetof Fig. 8, it can be inferred that the variable A is directly re-lated to variable B, inversely related to variable C, and hasno significant relationship with variable D [26]. From thisstandpoint, the thermal stability of aluminaemolybdenapigments being directly proportional with the colour ratio
185M. Dondi et al. / Dyes and Pigments 76 (2008) 179e186
Table 3
Colour of aluminaemolybdena pigments and industrial blue ceramic pigments
Ceramic pigment State CIELab parameters Note
L* a* b*
AM8 Powder 36.5 �1.5 �6.2
AM10 Powder 40.5 �1.3 �8.4
AM15 Powder 45.4 �1.8 �7.9
AM10 Glaze G1 42.8 �1.3 �7.9 Porcelain stoneware
AM10 Glaze G2 63.3 �1.9 �7.2 Light-coloured stoneware
AM10 Glaze G3 51.1 �1.5 �7.6 Light-coloured stoneware
AM10 Body PS 44.4 �2.3 �4.6 Porcelain stoneware
CoAl2O4 Glaze e þ2 Oþ10 �16 O�28 [15]
VeZrSiO4 Glaze e �8 O�12 �10 O�25 [15]
(Zn,Co)2SiO4 Powder 40 O 55 þ2 Oþ4 �2 O�20 [16]
BR (b*g/b*p), it appears that the chemical components thatmostly contribute to the loss of colouring performance areNa2O and MgO. Interestingly, some components that are usu-ally considered strongly aggressive for ceramic pigments esuch as B2O3, BaO, CaO, PbO and ZnO [15] e seem tohave a negligible effect on the Al2O3eMoOx system.
4. Conclusions
New ceramic pigments with a deep grayish-blue colorationwere obtained calcining Al2O3eMoO3 mixtures at hightemperature in a reducing atmosphere. We are dealing witha new kind of mordant or chemi-adsorbed pigments, as molyb-denum does not substitute aluminium in the corundum lattice,but it is diffused on the alumina surface in high concentrations,ranging from 27 to 99 Mo atoms nm�2, depending on the ini-tial Al/Mo ratio. These values are largely exceeding the disper-sion limit of molybdenum over a-Al2O3, implying a prevailingoctahedral coordination of Mo ions and a certain long-rangeorder, witnessed by the formation of crystalline MoO2 in thesample richest in molybdenum.
Spectroscopic results indicate that pigments are mixedvalent, Mo(VI) being predominant over Mo(V) and Mo(IV);
PS
G2G3G1
Industrialfirings
Firin
g te
mpe
ratu
re (º
C)
Colour ratio b*g / b*p
-0.8 -0.6 -0.4 -0.2 0.0 0.2 0.4 0.6 0.8 1.0
1350
1300
1250
1200
1150
1100
1050
1000
950
900
Fig. 7. Thermal stability of aluminaemolybdena pigments in different ceramic
glazes and glassy coatings expressed in terms of the b*g/b*p ratio, i.e. blue
component of glaze/glassy coating (b*g) and pigment (b*p).
the latter seems to increase its concentration with decreasingAl/Mo ratio. The colouring mechanism mostly consists ofa selective absorption of the redeorange light by a crystal fieldtransition of Mo(V), with a possible contribution by Mo(IV)eMo(V) intervalence charge transfer, resulting in a characteristicblue shade. The strong light absorbance over the entire UVeviseNIR range, responsible for the gray cast, is attributableto MoeO charge transfer and also crystal field electronicabsorptions of Mo(IV).
ZnO
ZnO
BaO
BaO
BR
BR
ZrO2
MgO
MgO
CaO
CaO
T
T
Al2O3
Al2O3
PbO
PbO
B2O3
B2O3
SiO2
SiO2
Na2O
Na2O
K2O
K2O
Li2O
ZrO2
Li2O
1.0
0.8
0.6
0.4
0.2
0.0
Fact
or 2
-0.2
-0.4
-0.6
-0.8
-1.0
1.0
0.8
0.6
0.4
0.2
0.0
Fact
or 2
-0.2
-0.4
-0.6
-0.8
-1.0
1.00.80.60.40.20.0Factor 1
-0.2-0.4-0.6-0.8-1.0
1.00.80.60.40.20.0Factor 3
-0.2-0.4-0.6-0.8-1.0
BC
D
A
Fig. 8. Factorial analysis of the technological behaviour of aluminaemolyb-
dena pigments in ceramic glazes and glassy coatings. The extraction of prin-
cipal components gave three significant factors, explaining 78.5% of the total
variance. BR¼ b*g/b*p, T¼ temperature. See text for explanation of relation-
ships among variables (inset).
186 M. Dondi et al. / Dyes and Pigments 76 (2008) 179e186
The Al2O3eMoOx behaves satisfactorily into porcelainstoneware bodies as in ceramic glazes for floor tiles, being thecolouring performance analogue to that of the pure pigment.This excellent stability at high temperature (1150e1220 �C)could be promoted by the oxygen-deficient atmosphere of indus-trial kilns, as the coloration tested in an oxidant environment (i.e.electric kiln) proved to be less stable, though mostly affected bythe occurrence of Na2O and MgO into the ceramic coatingswhere the pigment is dispersed.
Even if the colour of aluminaemolybdena pigments(�8< b*<�6) is much less blue than that of current indus-trial pigments, their peculiar grayish-blue shade cannot bereproduced, unless using very expensive colorants based oncobalt oxide.
Acknowledgements
Authors are grateful to ESRF for providing access to syn-chrotron radiation under the public beamtime programme(exp. No. CH1321). Many thanks to Dr. Maria Chiara Dalconi,Guia Guarini and Dr. Andrea Ruffini for their useful assistancein the XRPD, BET and ICP-OES analyses, respectively.
References
[1] Haber J. The role of molybdenum in catalysis. Ann Arbor, MI: Climax
Molybdenum Co.; 1981.
[2] Zi F, Yang J, Yan P, Wang X, Guo H, Wu N. J Mater Chem
2003;13:1206e9.
[3] Sarrazin P, Kasztelan S, Payen E, Bonnelle JP, Grimblot J. J Chem Phys
1993;97:5954e61.
[4] Hu H, Wachs IE, Bare SR. J Phys Chem 1995;99:10897e910.
[5] Gunther S, Gregoratti L, Kiskinova M, Taglauer E, Grotz P, Schubert UA,
et al. J Chem Phys 2000;112(12):5440e6.
[6] Xu W, Yan J, Wu N, Zhang H, Xie Y, Tang Y, et al. Surf Sci
2000;470:121e30.
[7] Spevack PA, McIntyre NS. J Phys Chem 1993;97:11020e30.
[8] Reddy BM, Chowdhury B, Reddy EP, Fernandez A. Appl Catal A Gen
2001;213:279e88.
[9] El-Shobaky HG, Mokhtar M, Ahmed AS. Thermochim Acta
1999;327:39e46.
[10] El-Shobaky GA, Abdalla FHA, Ghozza AM, Khalil KA. Thermochim
Acta 1996;275:235e347.
[11] Plyuto YuV, Babich IV, Plyuto IV, Van Langeveld AD, Moulijn JA. Appl
Surf Sci 1997;119:11e8.
[12] Sarrin J, Noguera O, Royo H, Perez Zurita MJ, Scott C, Goldwasser MR,
et al. J Mol Catal A Chem 1999;144:441e50.
[13] Siokou A, Lefheriotis G, Papaefthimou S, Yianoulis P. Surf Sci
2001;482e485:294e9.
[14] Larrubia MA, Busca G. Mater Chem Phys 2001;72:337e46.
[15] Eppler RA. Am Ceram Soc Bull 1987;66:1600e4.
[16] Fores A, Llusar M, Badenes JA, Calbo J, Tena MA, Monros G. Green
Chem 2000;2(3):93e100.
[17] Larson AC, Von Dreele RB. Los Alamos National Labaratory Report
LAUR 86-748; 2000.
[18] Toby BH. J Appl Crystallogr 2001;34:210e3.
[19] Maslen EN, Strel’tsov VA, Strel’tsova NR, Ishizawa N, Satow Y. Acta
Crystallogr B 1993;49:973e80.
[20] Matteucci F, Lepri Neto C, Dondi M, Cruciani G, Baldi G, Boschi AO.
Adv Appl Ceram 2006;105:99e106.
[21] Cox DE, Moodenbaugh AE, Sleight AW, Chen H-Y. National Bureau of
Standards (U.S.), Special Publication, vol. 567; 1980. p. 189e201.
[22] Lever ABP. Inorganic electronic spectroscopy. 2nd ed. Amsterdam:
Elsevier; 1984.
[23] Carmichael WM, Edwards DA, Walton RA. J Chem Soc A 1966;97.
[24] Chisholm MH, Cotton FA, Extine MW. Inorg Chem 1978;17:1329.
[25] Porter VR, White WB, Roy R. J Solid State Chem 1972;4:250e4.
[26] Cooley WW, Lohnes PR. Multivariate data analysis. New York: Wiley;
1971.
Copyright © 2022 FDOKUMEN