Byzantine wall paintings from Kastoria, northern Greece: Spectroscopic study of pigments and...
14
Spectrochimica Acta Part A 78 (2011) 874–887 Contents lists available at ScienceDirect Spectrochimica Acta Part A: Molecular and Biomolecular Spectroscopy journal homepage: www.elsevier.com/locate/saa Byzantine wall paintings from Kastoria, northern Greece: Spectroscopic study of pigments and efflorescing salts Andreas Iordanidis a,∗ , Javier Garcia-Guinea b , Aggeliki Strati c , Amalia Gkimourtzina c , Androniki Papoulidou c a Department of Geotechnology and Environmental Engineering, Technological Educational Institute (TEI) of Western Macedonia, Kila, 50100 Kozani, Greece b Museo Nacional Ciencias Naturales, CSIC, C/José Gutierrez Abascal 2, Madrid 28006, Spain c 16th Ephorate of Byzantine Antiquities, Mitropoleos 25, 52100 Kastoria, Greece article info Article history: Received 30 June 2010 Received in revised form 9 December 2010 Accepted 14 December 2010 Keywords: Byzantine pigments Raman ESEM-EDX Efflorescence Kastoria abstract This study concerns the investigation of pigments and efflorescence phenomena on the wall paintings of Kastoria, a rural, non-metropolitan Byzantine town. A large number of representative samples were collected from the murals of three churches, dated to post-Byzantine era (14th–17th c. AD). The identified pigments for the red colour were hematite (Fe 2 O 3 ), cinnabar (HgS) and minium (Pb 3 O 4 ), while brown and yellow colours were attributed to mixtures of ochres (Fe-oxides and hydroxides) and lime. The utilization of admixtures of iron, lead and mercury compounds was also attested in order to render specific tones on the painted surfaces. Black and dark blue hues were prepared using black carbon and Mn in some cases. Grey colours were assigned to a mixture of black carbon and lime. Green colour is rather attributed to admixtures of Fe-rich minerals and lime and not to the commonly used green earths. Baryte (BaSO 4 ) was also evidenced as a filler or extender. Phosphorous was detected and connected to proteinaceous material and Mo and Sb were traced which are probably affiliated to Fe-oxides. Regarding efflorescing salts, the determined compounds are: calcite, dolomite, gypsum, halite, nitratine, natron and mirabilite, all of which are related to temperature and humidity changes and moisture fluctuations inside the wall paintings. © 2010 Elsevier B.V. All rights reserved. 1. Introduction Pigment identification on archaeological artefacts such as wall paintings is crucial for the understanding of the raw material and the painting technique applied and furthermore allocate appropriate procedures for future conservation and restoration. Furthermore, the aesthetic appearance of the wall paintings is seri- ously affected when exposed to aggressive environmental factors (humidity–temperature, fungi, bacteria, lichens) and the structural damage caused by the degradation phenomena due to salts neo- formation can be severe. Therefore, the precise identification of the salts is crucial for their removal and cleaning. The employ- ment of interdisciplinary analytical techniques for such analyses is a common practice nowadays, using both destructive and non- destructive analytical methods, e.g. optical microscopy, scanning electron microscope (SEM/EDX), infra-red spectroscopy (FTIR), Raman micro-spectroscopy, thermal analysis (DSC/TGA/DTA), X- ray diffraction (XRD) and other techniques [1–3]. ∗ Corresponding author. Tel.: +30 24610 68298; fax: +30 24610 39682. E-mail address: [email protected] (A. Iordanidis). While several studies have been published regarding pigments and efflorescence phenomena on Byzantine wall paintings [4–6], the analytical characterization of the Byzantine and post-Byzantine artefacts from Kastoria, northern Greece, is only sporadically mentioned in the literature [7]. A great development of church architecture and a parallel flourishing of hagiography occurred in the region of Kastoria during Byzantine era. Remarkable Byzantine monuments are preserved in this rural, non-metropolitan town, with wall paintings and rare samples of Byzantine icons and wood- cut temples of inestimable artistic value [8,9]. In the present study, the investigation of various post-Byzantine (14th–17th c. AD) wall paintings of three churches from Kastoria town is attempted. The study is focused on both the identi- fication of the raw material used for the pigments and the efflorescence phenomena occurred on the surfaces of the wall paintings. This study is expected to help curators, conservators and archaeologists who are working in the area in their effort to conserve the Byzantine monuments of Kastoria. Since very limited information exists on the analytical characterization of Kasto- ria’s Byzantine wall paintings, this is indeed the first systematic attempt to study an adequate series of pigment and effloresc- ing salts. The utilization of state of the art analytical techniques 1386-1425/$ – see front matter © 2010 Elsevier B.V. All rights reserved. doi:10.1016/j.saa.2010.12.055
Transcript of Byzantine wall paintings from Kastoria, northern Greece: Spectroscopic study of pigments and...

Bo
AAa
b
c
a
ARRA
KBREEK
1
paaFo(dftmideRr
1d
Spectrochimica Acta Part A 78 (2011) 874–887
Contents lists available at ScienceDirect
Spectrochimica Acta Part A: Molecular andBiomolecular Spectroscopy
journa l homepage: www.e lsev ier .com/ locate /saa
yzantine wall paintings from Kastoria, northern Greece: Spectroscopic studyf pigments and efflorescing salts
ndreas Iordanidisa,∗, Javier Garcia-Guineab, Aggeliki Strati c, Amalia Gkimourtzinac,ndroniki Papoulidouc
Department of Geotechnology and Environmental Engineering, Technological Educational Institute (TEI) of Western Macedonia, Kila, 50100 Kozani, GreeceMuseo Nacional Ciencias Naturales, CSIC, C/José Gutierrez Abascal 2, Madrid 28006, Spain16th Ephorate of Byzantine Antiquities, Mitropoleos 25, 52100 Kastoria, Greece
r t i c l e i n f o
rticle history:eceived 30 June 2010eceived in revised form 9 December 2010ccepted 14 December 2010
eywords:yzantine pigmentsaman
a b s t r a c t
This study concerns the investigation of pigments and efflorescence phenomena on the wall paintingsof Kastoria, a rural, non-metropolitan Byzantine town. A large number of representative samples werecollected from the murals of three churches, dated to post-Byzantine era (14th–17th c. AD). The identifiedpigments for the red colour were hematite (Fe2O3), cinnabar (HgS) and minium (Pb3O4), while brown andyellow colours were attributed to mixtures of ochres (Fe-oxides and hydroxides) and lime. The utilizationof admixtures of iron, lead and mercury compounds was also attested in order to render specific toneson the painted surfaces. Black and dark blue hues were prepared using black carbon and Mn in some
SEM-EDXfflorescenceastoria
cases. Grey colours were assigned to a mixture of black carbon and lime. Green colour is rather attributedto admixtures of Fe-rich minerals and lime and not to the commonly used green earths. Baryte (BaSO4)was also evidenced as a filler or extender. Phosphorous was detected and connected to proteinaceousmaterial and Mo and Sb were traced which are probably affiliated to Fe-oxides. Regarding efflorescingsalts, the determined compounds are: calcite, dolomite, gypsum, halite, nitratine, natron and mirabilite,all of which are related to temperature and humidity changes and moisture fluctuations inside the wallpaintings.
. Introduction
Pigment identification on archaeological artefacts such as wallaintings is crucial for the understanding of the raw materialnd the painting technique applied and furthermore allocateppropriate procedures for future conservation and restoration.urthermore, the aesthetic appearance of the wall paintings is seri-usly affected when exposed to aggressive environmental factorshumidity–temperature, fungi, bacteria, lichens) and the structuralamage caused by the degradation phenomena due to salts neo-ormation can be severe. Therefore, the precise identification ofhe salts is crucial for their removal and cleaning. The employ-
ent of interdisciplinary analytical techniques for such analysess a common practice nowadays, using both destructive and non-
estructive analytical methods, e.g. optical microscopy, scanninglectron microscope (SEM/EDX), infra-red spectroscopy (FTIR),aman micro-spectroscopy, thermal analysis (DSC/TGA/DTA), X-ay diffraction (XRD) and other techniques [1–3].∗ Corresponding author. Tel.: +30 24610 68298; fax: +30 24610 39682.E-mail address: [email protected] (A. Iordanidis).
386-1425/$ – see front matter © 2010 Elsevier B.V. All rights reserved.oi:10.1016/j.saa.2010.12.055
© 2010 Elsevier B.V. All rights reserved.
While several studies have been published regarding pigmentsand efflorescence phenomena on Byzantine wall paintings [4–6],the analytical characterization of the Byzantine and post-Byzantineartefacts from Kastoria, northern Greece, is only sporadicallymentioned in the literature [7]. A great development of churcharchitecture and a parallel flourishing of hagiography occurred inthe region of Kastoria during Byzantine era. Remarkable Byzantinemonuments are preserved in this rural, non-metropolitan town,with wall paintings and rare samples of Byzantine icons and wood-cut temples of inestimable artistic value [8,9].
In the present study, the investigation of various post-Byzantine(14th–17th c. AD) wall paintings of three churches from Kastoriatown is attempted. The study is focused on both the identi-fication of the raw material used for the pigments and theefflorescence phenomena occurred on the surfaces of the wallpaintings. This study is expected to help curators, conservatorsand archaeologists who are working in the area in their effort to
conserve the Byzantine monuments of Kastoria. Since very limitedinformation exists on the analytical characterization of Kasto-ria’s Byzantine wall paintings, this is indeed the first systematicattempt to study an adequate series of pigment and effloresc-ing salts. The utilization of state of the art analytical techniques
mica A
iiabotttsse
2
2
VaGtiaptsBpco
2
c1mauegNsts
2
Eapt2saol(oO5bws
A. Iordanidis et al. / Spectrochi
s expected to provide valuable information on the character-zation of the raw materials used for the painted surfaces. Inddition, by describing the salts, the restoration technique wille fairly improved and help to preserve the aesthetic integrityf the murals. The procedure embraces a preliminary orienta-ion using environmental scanning electron microscope coupledo energy dispersive system (ESEM-EDS) for the observation ofhe micro-stratigraphy and micro-structure (making use of bothurface and cross-section samples) and the elementary microanaly-is, complemented by micro-Raman spectroscopy on pigments andfflorescing salts.
. Experimental
.1. Monuments
Sampling was carried out in three churches, Agios Georgiosounou, Agios Nikolaos Kyritzi and Agios Nikolaos Magaliou, whichre of great interest with commendable artistic meaning. Agioseorgios Vounou was built and decorated with wall paintings in
he second half of the 14th century, originally as an one-aisle Basil-ca and it was reconstructed in the 16th century and a narthex wasdded on the northwest side which was also decorated with wallaintings. The wall paintings of Agios Nikolaos Kyritzi are dated inhe 14th century, although the church was expanded towards theouth side in a reconstruction that took place in 1654. The one-aisleasilica church of Agios Nikolaos Magaliou was decorated with wallaintings in the second half of the 15th century and the church alsoontains wall paintings dated in the 17th century which are situatedn the east wall.
.2. Sampling
During last years, there has been a systematic archaeologi-al study of these three churches by the scientific staff of the6th Ephorate of Byzantine Antiquities of Kastoria. Fresh frag-ents of pigmented surfaces of wall paintings from the three
forementioned churches were collected from deteriorated areaspon the wall paintings. The samples were dated to post-Byzantinera (14th–17th century A.D.), and named as GEVO (Agios Geor-ios Vounou), NIKY (Agios Nikolaos Kyritzi) and NIMA (Agiosikolaos Magaliou). An effort was made to have representative
amples, i.e. to cover the majority of colours and chronologicalypes within these monuments. The sample characteristics arehown in Table 1.
.3. Analytical methods
All samples of the pigmented surfaces were analysed by ESEM-DX and Raman spectroscopy. Emphasis was given on pigmentsnd efflorescing salts, since they threaten the integrity of theaintings. A Philips QUANTA 200 Environmental scanning elec-ron microscope (ESEM), coupled with an Oxford INCA Energy00 Energy Dispersive System (EDS) was used. For the Ramanpectroscopy, a Thermo Scientific DXR Raman Microscope with
780 nm laser beam was employed, setting the power valuef the sample irradiation at 12 mW. The average spectral reso-ution in the Raman shift range of 100–3000 cm−1 was 5 cm−1
grating 400 lines/mm, spot size 2 �m). Raman images werebtained using the 20× objective of the con-focal microscope.
ther analytical parameters were as follows: 30 s bleaching time;exposures of 10 s exposure time. Additionally, for a small num-er of pigmented plasters of the wall paintings, polished sectionsere prepared for the ESEM-EDX analysis of their pigments and
alts.
cta Part A 78 (2011) 874–887 875
3. Results and discussion
3.1. Pigments
Characteristic colours observed on the wall paintings of thethree Kastoria’s Byzantine churches are shown in Figs. 1 and 2. Themicrochemical observation using ESEM-EDX technique has pro-vided several images of the main pigments used for the decoration(Figs. 3–5). The pigments were also evident under the Raman micro-scope, as shown in Figs. 6 and 7, along with their characteristicRaman spectra.
The employment of mixed fresco–secco techniques is evidentfor the analysed samples in our study, especially when viewing thecross-sections (Fig. 3). In fresco technique (Fig. 3a, sample NIKY1),the pigments are mixed with plain water or lime water and thenthey are applied on damp lime-based plaster, while the secco tech-nique (Fig. 3b, sample GEVO10) is used for painting on dry plasterwith pigments mixed with different types of organic binders [4,6].
Three inorganic red pigments played an important role inmedieval times: hematite (Fe2O3), vermilion (HgS) and minium(Pb3O4) [5,10–13]. The red colour found on the painted surfaces ofour samples is mainly attributed to Fe-rich minerals or cinnabar(HgS). Characteristic images of cinnabar particles are shown inFigs. 3a (cross sectional sample) and 4a (sample GEVO16), withthe EDX analysis showing composition of HgO 49.5% and SO328.95% (Table 2). The Raman spectra and microscopic view underRaman microscope of cinnabar are shown in Fig. 6a. The peaksat 243 (very strong), 279, 339 cm−1 of sample GEVO16-RED areclearly assigned to mercury sulphide. Red-coloured vermilion pig-ment has been used in Byzantine and medieval eras, as certifiedby several authors [5,13–16]. However, in our study, most ofthe red coloured samples are due to iron oxides and hydrox-ides. The most widely-used inorganic pigments of Byzantine andpost-Byzantine hagiography are earth pigments called ochres suchas red and yellow ochres, limonite, goethite and hematite [15].The particle on the cross-section of the red pigmented GEVO10sample (Fig. 3b) and the chemical composition of the surfacesamples in Figs. 4c (sample NIKY13A), d (sample NIKY6B), e (sam-ple NIKY14) and 5b (sample GEVO10) are all Fe-rich compounds,related to red ochres. The EDS analysis on a red-coloured area ofsample GEVO6 revealed concentrations of FeO 3.32% (Table 2). Themain red pigment identified was hematite (Fe2O3), with its charac-teristic Raman peaks at 218, 287 (very strong), 403 and 605 cm−1
(Fig. 7a) [5,15,17,18].The presence of orange coloured lead oxides was also attested,
as shown in Fig. 4b (sample GEVO9) and c (sample NIKY13A). Thechemical composition of the surface area of the Pb-rich sampleNIKY13A showed a PbO content of 14.29%. Red lead (Pb3O4), alsocalled minium, was also identified by other scholars worldwide[6,13,14,16,17,19] The Raman spectra of the same sample revealedRaman shifts of the orange-coloured pigment (Fig. 5b) at 120 (verystrong), 150, 225, 312, 390 and 548 cm−1, which are characteristicof minium [13,19].
The application of various mixtures or definite layers of minium,ochres and vermilion to render different gradations, shades andtones on the wall paintings is observed in our study, e.g. NIKY13A(Fig. 4c) and has also been attested in the work of Daniilia et al. [4]on Byzantine murals from Meteora (central Greece). Degradationproducts of the reddish (rich in Fe, Hg and Pb) pigments were visibleby the dull and dark colour impressions of the painted surface, butusing the Raman microscope we were able to focus on the unaltered
raw pigments beneath these encrustations.The dark, black and blue hues on the wall paintings are mainlyattributed to black carbon, and in some cases to manganese oxides.The latter is shown in Fig. 4f (sample NIMA5) and the presence ofMn-oxides is demonstrated in Table 2, where the concentration of

876 A. Iordanidis et al. / Spectrochimica Acta Part A 78 (2011) 874–887
Table 1Characteristics of the pigments collected from the three Byzantine churches of Kastoria, northern Greece. GEVO = Agios Georgios Vounou; NIKY = Agios Nikolaos Kyritzi;NIMA = Agios Nikolaos Magaliou.

A. Iordanidis et al. / Spectrochimica Acta Part A 78 (2011) 874–887 877
Table 1 (Continued )
MsTs
nO on an area of sample NIMA5 is 0.12%. The Raman spectra of thisample shows characteristic peaks at 583 and 636 cm−1 (Fig. 6d).he concentration of CO2 on the black coloured surface of NIKY2ample is 99.92%, while the Raman spectra of another carbonaceous
surface (sample GEVO2) shows the characteristic bands at 1330and 1591 cm−1 and the same is true for the blue colour, such as theRaman peaks of 1335 and 1591 cm−1 in NIKY2 sample (Fig. 7d). TheCO2 content of the blue coloured surface is 75.61%. Similar findings,

878 A. Iordanidis et al. / Spectrochimica Acta Part A 78 (2011) 874–887
Fig. 1. Macroscopic images of characteristic painted surfaces of the Saint Basil’s figure from the wall paintings of Agios Nikolaos Kyritzi (sample NIKY6): (A) brown fromt ed frol
rw
[GR(Eo
h(4pFmNlctmdMoasRhl[
he face proplasmos, (B) brown from the check dress, (C) ochre from the halo, (D) regend, the reader is referred to the web version of the article.)
egarding utilization of black carbon for black and dark blue colours,ere addressed by other researchers [6].
The grey colour is due to a mixture of calcite and black carbon11]. This is clearly shown in the ESEM photos of Fig. 5c (sampleEVO1) and the Raman images and spectra of Fig. 6e, showing theaman bands of calcite (1082, 708, 275, 150 cm−1) and black carbon1527, 1601 cm−1) of the grey-coloured sample GEVO4 [7,18]. TheDS analysis of an area of the latter sample shows concentrationsf CaO 22.31% and CO2 69.25% (Table 2).
The brown colour is identified as a mixture of calcite andematite (Fig. 7b, sample GEVO14-BROWN), while the yellowochre) is assigned to a mixture of iron oxides (Raman shifts at06 and 607 cm−1) and calcite (peak at 1082 cm−1) (Fig. 7c, sam-le GEVO14-OCHRE). The differentiation in the concentrations ofe, Si, Ca and other elements in brown and yellow (ochre) pig-ents is also shown in Table 2 (samples GEVO14-BROWN andIKY8-OCHRE) and similar observations have been previously pub-
ished [4,6,7,15,18,20]. The precise identification of the mineralomposition of the ochres is a difficult task. Even the utiliza-ion of the ratios between characteristic peak intensities of the
ineral phases comprised the ochres, proved to be extremelyifficult for a thorough determination of the compounds [21].oreover, the Raman spectra of complex mixtures of materials may
verlap or change over time, and thus the assignment of bandsnd the identification of particular minerals is difficult [22]. We
hould also bear in mind that there are differentiations in theaman shifts and peak intensities of the various Fe-oxides andydroxides, when using different laser sources (excitation wave-engths), especially regarding state of crystallinity of the minerals23].
m the robe’s inert part. (For interpretation of the references to colour in this figure
The green colour is surprisingly a mixture of Fe-oxides (Fig. 7e,sample GEVO13-GREEN), most probably hematite and goethite(228, 406, 529, 610, 660, 1343, 1430, 1529 cm−1) and calcite(1082 cm−1) without any green earth minerals (celadonite, glau-conite) or copper minerals (malachite) present [15,24,25]. The EDSanalysis of a green coloured surface of sample GEVO13 showed con-centrations of CaO 38.22%, CO2 52.89% and FeO 1.13% (Table 2).Green earths used as pigments since antiquity and they are mainlyconstituted of clayey micas celadonite or glauconite. Other green-ish clay minerals that may be included in green earths pigments aresmectites, chlorites, serpentines and pyroxenes [24,26]. The attri-bution of green colour to various mixtures of organic and inorganiccompounds, other than the so-called green earths has also beendemonstrated by Abdel-Ghania et al. [12], and agrees with ourfindings. Nevertheless, it should be mentioned that in our studywe only had the opportunity to analyse one green coloured sam-ple.
Baryte (BaSO4) has also been identified by ESEM analysis (Fig. 5a,sample GEVO14), with a characteristic chemical composition ofBaO 36.14% and SO3 23.24% (sample GEVO8, Table 2). This min-eral, which has been used as a filler or extender [10] has not beenidentified under Raman microscopy. The minor contents (0.68%)of Sr within the baryte crystal is related to the paragenesis ofSr within Ba-rich minerals [16] The presence of Antimony (Sb)and Molybdenum (Mo) in trace amounts in the red-coloured sam-
ples GEVO4 and GEVO10 might be related with the iron oxidespresent in the pigments of these samples (Table 2). Sb and Mohave also been affiliated with Fe by other scholars [16]. The geo-chemical affinity of Sb and Mo with Pb and Sn is well knownand one could anticipate the incorporation of trace quantities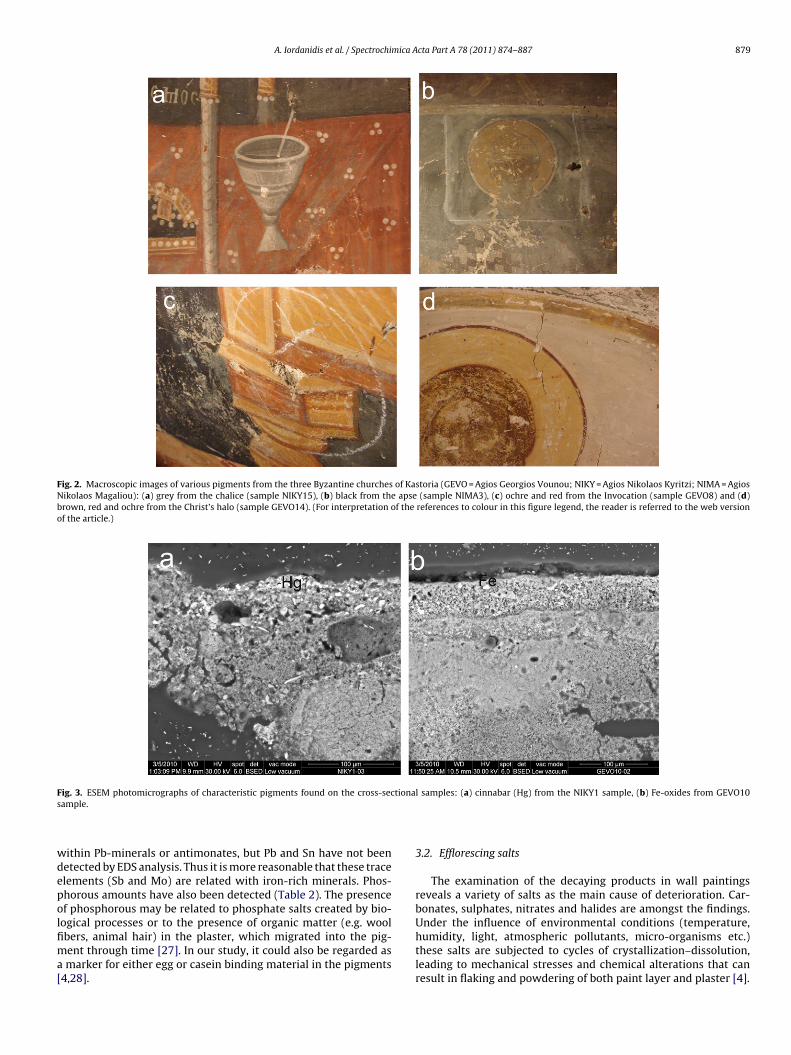
A. Iordanidis et al. / Spectrochimica Acta Part A 78 (2011) 874–887 879
Fig. 2. Macroscopic images of various pigments from the three Byzantine churches of Kastoria (GEVO = Agios Georgios Vounou; NIKY = Agios Nikolaos Kyritzi; NIMA = AgiosNikolaos Magaliou): (a) grey from the chalice (sample NIKY15), (b) black from the apse (sample NIMA3), (c) ochre and red from the Invocation (sample GEVO8) and (d)brown, red and ochre from the Christ’s halo (sample GEVO14). (For interpretation of the references to colour in this figure legend, the reader is referred to the web versionof the article.)
F tionas
wdepolfima[
ig. 3. ESEM photomicrographs of characteristic pigments found on the cross-secample.
ithin Pb-minerals or antimonates, but Pb and Sn have not beenetected by EDS analysis. Thus it is more reasonable that these tracelements (Sb and Mo) are related with iron-rich minerals. Phos-horous amounts have also been detected (Table 2). The presencef phosphorous may be related to phosphate salts created by bio-
ogical processes or to the presence of organic matter (e.g. woolbers, animal hair) in the plaster, which migrated into the pig-ent through time [27]. In our study, it could also be regarded asmarker for either egg or casein binding material in the pigments4,28].
l samples: (a) cinnabar (Hg) from the NIKY1 sample, (b) Fe-oxides from GEVO10
3.2. Efflorescing salts
The examination of the decaying products in wall paintingsreveals a variety of salts as the main cause of deterioration. Car-bonates, sulphates, nitrates and halides are amongst the findings.
Under the influence of environmental conditions (temperature,humidity, light, atmospheric pollutants, micro-organisms etc.)these salts are subjected to cycles of crystallization–dissolution,leading to mechanical stresses and chemical alterations that canresult in flaking and powdering of both paint layer and plaster [4].
880 A. Iordanidis et al. / Spectrochimica Acta Part A 78 (2011) 874–887
Table 2Chemical composition (major element oxides in wt %, as determined by EDX-ESEM) of characteristic pigments from the wall paintings of Kastoria’s Byzantine churches.
Compound Mineral
Cinnabar Lead oxide Baryte Blackcarbon
BlackMn-rich
Grey RedFe-rich
BrownFe-rich
Ochre Blue Green Sb & Morich
Sample ID GEVO16RED
NIKY13ABROWN
GEVO8RED
NIKY2BLUE
NIMA5GREY
GEVO4GREY
GEVO6RED
GEVO14BROWN
NIKY8OCHRE
NIKY3BLUE
GEVO13GREEN
GEVO10RED
Type ofanalysisspot/area
Spot Area Spot Area Area Area Area Area Area Area Area Area
Concentrations (wt %)SiO2 7.87 4.55 11.08 1.54 4.72 12.39 7.38 6.16 3.45 1.56Al2O3 1.29 0.72 3.31 0.56 1.20 1.75 3.27 2.38 0.86 1.15FeO 1.31 0.52 1.77 0.18 3.32 9.16 1.31 0.95 1.13 0.30MgO 2.62 2.22 0.54 0.47 0.50 2.26 0.89 0.84 1.46CaO 3.81 6.27 5.89 0.08 28.53 22.31 28.31 38.66 13.85 8.62 38.22 38.39SO3 28.95 23.24 5.03 3.94 0.30 0.63 3.02 2.80Na2O 2.19 1.31 0.72 0.82 0.78 0.28 1.47K2O 0.48 2.92 0.51 0.70 0.39 1.04 0.80 0.62TiO2 0.36 0.22 0.12CO2 17.38 65.87 25.61 99.92 42.06 69.25 59.56 36.52 66.00 75.61 52.89 55.29P2O5 0.46 0.46 1.40BaO 36.14SrO 0.68HgO 49.50PbO 14.29MnO 0.12Sb2O3 1.20MoO3 0.56
Table 3Chemical composition (major element oxides in wt %, as determined by EDX-ESEM) of characteristic efflorescing salts and soot from the wall paintings of Kastoria’s Byzantinechurches.
Compound Mineral
Calcite Gypsum Dolomite Soot Nitratine Natron + halite Mirabilite
Sample ID GEVO10 RED GEVO1 GREY NIKY5 RED GEVO2 GREY GEVO1 GREY GEVO2 BLACK GEVO2 DARKType of analysis spot/areas Spot Area Area Area Spot Area SpotConcentrations (wt %)SiO2 0.70 1.28 14.70 0.15 0.44 1.57Al2O3 0.50 2.65 0.27 0.59FeO 0.80 2.36 0.39MgO 0.31 0.93 3.46CaO 40.10 40.28 19.53 2.58 7.45 32.17 37.27SO3 0.35 54.18 1.24 2.64 2.85 53.03Cl 0.18 0.98 0.05 0.10 4.83 1.26N2O5 55.61Na2O 1.14 0.15 14.62 16.65 8.45K2O 0.13 1.21 0.59 0.03 0.47
wiah
onpos((asag
CO2 56.91 55.10P2O5 0.38
The most common process that lead to the deterioration of theall paintings is the formation of gypsum during sulphation, which
nvolves the dry deposition reaction between limestone (CaCO3)nd sulphur dioxide (SO2) gas, in the presence of high relativeumidity [5,7,27,29–31].
Calcite and gypsum aggregates are shown in the ESEM imagesf Fig. 5c (sample GEVO1) and d (sample NIKY7). Gypsum anditratine are clearly shown on the cross-sections of Fig. 8a (sam-le NIKY7) and b (sample GEVO1), respectively. The salts found bothn the surface and within the main body of the plaster samples weretudied with the environmental scanning electron microscopyESEM) and Raman Spectroscopy. Characteristic images of gypsum
hydrated calcium sulphate), halite (NaCl) and nitratine (NaNO3)re shown in Fig. 5e (sample GEVO2). High contents of alkali nitrate,ulphates and chlorides are known to cause weakened structuresnd all these salts have been detected in our study [11,31,32]. Whileypsum and halite are very common salts found on wall paint-94.31 21.51 39.510.09 0.98
ings, the presence of nitratine is probably related to the presenceof proteinecious material (e.g. egg or wax) as a binder agent forthe manufacture of the plasters and the pigments [4,17,22,32]. Theorigin of nitrates from nitrifying bacteria has also been suggestedby Martınez-Arkarazo et al. [32]. Nitrate salts could be regarded assevere deterioration factors and special attention should be takenfor this kind of salts [33].
Figs. 9 and 10 display the Raman shifts of the characteristic efflo-rescing minerals determined on the painted surfaces of the samplesof this study. Calcite is evident from its main peak at 1082 cm−1
and its secondary peaks at 709, 276 and 151 cm−1 (Fig. 9a, sampleGEVO2 and Fig. 10a, sample GEVO12). The high CaO and CO2 con-
tents of calcite crystals were determined in sample GEVO10 and are40.10% and 56.91%, respectively (Table 3). Gypsum shows charac-teristic peaks at 1132, 1005 (strongest intensity), 669 and 412 cm−1(Fig. 9b, sample GEVO1), and the concentrations of CaO and SO3of characteristic crystal aggregates of sample GEVO1 are 40.28%

A. Iordanidis et al. / Spectrochimica Acta Part A 78 (2011) 874–887 881
Fig. 4. ESEM photomicrographs of characteristic pigments observed on the surface samples of this study: (a) cinnabar (HgS) mineral (2) on sample GEVO16-RED, (b) lead( IKY13i ent o
aaoR(2
p
Pb) oxides on sample GEVO9-GREY, (c) lead oxides’ bright crystals (1) on sample Nron (Fe) rich phases (2) on sample NIKY14-ROSE and (f) manganese (Mn) rich pigm
nd 54.18%, respectively (Table 3). Dolomite [CaMg(CO3)2] miner-ls have also been detected by EDX analysis with a MgO contentf the surface area of sample NIKY5 being 3.46% (see Table 3) and
aman microscopy, as shown on the grey agglomerates of Fig. 9csample GEVO1) and its characteristic peaks at 1095 (very strong),96 and 173 cm−1.Natron (NaCO3·10H2O) with its band at 1049 cm−1 is mostrobably the salt detected with calcite under the Raman image
A-BROWN, (d) mineral phases rich in Fe and Pb (2) on sample NIKY6B-BROWN, (e)n sample NIMA5-GREY.
and spectra of sample GEVO12 (Fig. 10a). According to Magureguiet al. [31], the formation of natron is due to the hydration ofsodium oxide into sodium hydroxide and the attack of CO2 to
promote the sodium carbonate. The EDX analysis of natron andhalite salt crystals found in sample GEVO2 showed concentra-tions of NaO and Cl 16.65% and 4.83%, respectively (Table 3,sample GEVO2). Moreover, the ESEM observation revealed thepresence of mirabilite (Na2SO4·10H2O), showing (Table 3) con-
882 A. Iordanidis et al. / Spectrochimica Acta Part A 78 (2011) 874–887
Fig. 5. ESEM photomicrographs of characteristic minerals and effloresning salts observed on the surface samples of this study: (a) Baryre (BaSO4) mineral (2) on sampleG threes ARK,a
c[
a1tpr(
EVO14-BROWN, (b) crust of the Fe-rich pigment (3) of sample GEVO10-RED, (c)ample GEVO1-GREY, (d) calcite and gypsum minerals (1–3) on the sample NIKY7-Dnd (f) Soot (2) on the sample NIMA3-BLACK.
entrations of Na2O and SO3 8.45% and 53.03%, respectively33].
Bright white aggregates of nitratine (NaNO3) with its bandst 1065 (very strong) and 182 cm−1 and calcite (1083, 277,
51 cm−1) is also evident in Fig. 10b (sample GEVO2) and onhe ESEM image of Fig. 5e (sample GEVO2), where halite co-articipates. The EDS analysis of nitratine found in sample GEVO1evealed contents of Na2O and NO3 14.62% and 55.61%, respectivelyTable 3).characteristic strata of Ca-rich substrate (3), pigment (2) and sulphate salts (1) of(e) nitratine and natron (1) and halite and gypsum (2) on the sample GEVO2-DARK
Soot is also found on the murals of our study, originatingfrom the use of these churches for religious ceremonies, e.g.candle combustion [27]. A characteristic soot cover is shownon the ESEM image of Fig. 5f (sample NIMA3), with an EDS
calculated chemical composition of CO2 94.31% (Table 3, sam-ple GEVO2). Similar soot particles embedded in black crusts onthe surface of monuments have been addressed by Potgieter-Vermaaka et al. [29]. The characteristic Raman image andspectra of a soot assemblage is also shown in Fig. 10c (sam-
A. Iordanidis et al. / Spectrochimica Acta Part A 78 (2011) 874–887 883
Fig. 6. Raman spectra and photomicrographs of characteristic pigment minerals: (a) cinnabar (HgS), showing a bright red colour and its peaks at 243 (vs), 279, 339 cm−1
[sample GEVO16-RED], (b) orange coloured Pb-oxide, revealing peaks at 120 (vs), 150, 225, 312, 390 and 548 cm−1 [sample NIKY13A-BROWN], (c) black carbon with its peaksat 1330 and 1591 cm−1 [sample GEVO2-BLACK], (d) dark coloured manganese (Mn) oxides with peaks at 583 and 636 cm−1 [sample NIMA5-GREY] and (e) grey colour, beinga mixture of calcite (1082, 708, 275, 150 cm−1) and black carbon (1527, 1601 cm−1) [sample GEVO4-GREY] (laser wavelength 780 nm, objective 20×). (For interpretation ofthe references to colour in this figure legend, the reader is referred to the web version of the article.)

884 A. Iordanidis et al. / Spectrochimica Acta Part A 78 (2011) 874–887
Fig. 7. Raman spectra and photomicrographs of characteristic pigment minerals: (a) hematite (Fe2O3) dark red crystal showing its peaks at 218, 287 (vs), 403, 605 cm−1
[sample GEVO6-RED], (b) brown colour, being a mixture of hematite (peaks at 220, 287 (vs), 405, 607 cm−1) and calcite (1082 cm−1) [sample GEVO14-BROWN], (c) ochre-yellow colour due to a mixture of Fe-oxides (406, 607 cm−1) and calcite (1082, 707, 275, 149 cm−1) [sample GEVO14-OCHRE], (d) blue colour, showing the presence of blackcarbon (1335, 1591 cm−1) [sample NIKY2-BLUE] and (e) green colour, being a mixture of Fe-oxides (hematite, goethite) (228, 406, 529, 610, 660, 1343, 1430, 1529 cm−1)and calcite (1082 cm−1) [sample GEVO13-GREEN] (laser wavelength 780 nm, objective 20×). (For interpretation of the references to colour in this figure legend, the readeris referred to the web version of the article.)

A. Iordanidis et al. / Spectrochimica Acta Part A 78 (2011) 874–887 885
Fig. 8. ESEM photomicrographs of characteristic efflorescing salts found on the cross-sectional samples: (a) gypsum crystals on the NIKY7 sample and (b) nitratine crystalson the GEVO1 sample.
Fig. 9. Raman spectra and photomicrographs of characteristic efflorescing salts: (a) white calcite (CaCO3) crystals showing its peaks at (1082, 709, 276, 151 cm−1) [sampleGEVO2-GREY], (b) gypsum (CaSO4·2H2O) agglomerates (1132, 1005 (vs), 669, 412 cm−1 [sample GEVO1-GREY] and (c) grey dolomite (1095 (vs), 296, 173 cm−1) with gypsum(1005 cm−1) [sample GEVO1-GREY] (laser wavelength 780 nm, objective 20×).

886 A. Iordanidis et al. / Spectrochimica Acta Part A 78 (2011) 874–887
F nd so7 e GEV( c) soow
p1
4
lfTaHmaMpwolm(p
ig. 10. Raman spectra and photomicrographs of characteristic efflorescing salts a09, 276, 151 cm−1) and natron (NaCO3·10H2O) with its band at 1049 cm−1 [samplvs) and 182 cm−1 and calcite (1083, 277, 151 cm−1) [sample GEVO2-BLACK] and (avelength 780 nm, objective 20×).
le NIKY13A), with the main Raman shifts at 1334 and561 cm−1.
. Conclusions
ESEM/EDX and Raman spectroscopy were applied for the ana-ytical characterization of several pigments and efflorescing saltsrom Byzantine wall paintings of Kastoria town, northern Greecehis combined use of both spectroscopic methods yielded valu-ble information for the raw material and the technique applied.ematite (Fe2O3), cinnabar (HgS) and minium (Pb3O4) were deter-ined in the red coloured surfaces. Brown and yellow colours were
ssigned to mixtures of ochres (Fe-oxides and hydroxides) and lime.ixtures of iron, lead and mercury compounds were also used to
erform different hues in the murals. Black and dark blue tonesere prepared using mainly charcoal and secondly manganese
xides. Grey colour was assigned to a mixture of black carbon andime. Green colour is rather attributed to admixtures of Fe-rich
inerals and lime than to green earths. Trace amounts of baryteBaSO4) (used as a filler or extender), phosphorous (affiliated toroteinaceous material) and antimony and molybdenum (parage-
ot: (a) white agglomerates of calcite (CaCO3) crystals showing its peaks at (1082,O12-RED], (b) bright white aggregates of nitratine (NaNO3) with its bands at 1065t deposited on a painted surface (1334, 1561 cm−1) [sample NIKY13A-RED] (laser
netic phases to Fe-oxides) were also detected in a few samples. Theefflorescence phenomena were attributed to the following salts:calcite, dolomite, gypsum, halite, nitratine, natron and mirabilite,all of which are known to cause weakened structures and are cre-ated due to aggressive atmospheric conditions (extreme variationsin temperature, humidity and pressure, acid gases, infiltrations byaqueous solution, bacteria).
Acknowledgements
We acknowledge the financial support of project CGL2009-09247 of the Spanish Plan Nacional I+D+i and the SYNTHESYSProject ES-TAF-258 of the European Community, giving access tothe research infrastructures of the Museo Nacional de CienciasNaturales (MNCN), Madrid, Spain. The technicians Rafael Gonzales-Martin, Laura Tormo and Manuel Castillejo Magarin of the MNCNare gratefully acknowledged.
References
[1] F. Agnoli, I. Calliari, G.A. Mazzocchin, Ann. di Chim. 97 (2007) 1–7.[2] H.G. Edwards, D.W. Farwell, J. Raman Spectrosc. 39 (2008) 985–992.

mica A
[
[
[
[
[
[
[
[
[[[[
[
[[
[[
[[
[
[
A. Iordanidis et al. / Spectrochi
[3] J. Striova, G. Coccolini, S. Micheli, C. Lofrumento, M. Galeotti, A. Cagnini, Castel-lucci E.M., Spectrochim. Acta A 73 (2009) 539–545.
[4] S. Daniilia, E. Minopoulou, K.S. Andrikopoulos, A. Tsakalof, K. Bairachtari, J.Archaeol. Sci. 35 (2008) 2474–2485.
[5] S. Sotiropoulou, S. Daniilia, C. Miliani, F. Rosi, L. Cartechini, D. Papanikola-Bakirtzis, Appl. Phys. A 92 (2008) 143–150.
[6] A. Hein, I. Karatasios, D. Mourelatos, Anal. Bioanal. Chem. 395 (2009)2061–2071.
[7] E. Pavlidou, M. Arapi, T. Zorba, M. Anastasiou, N. Civici, F. Stamati, K.M.Paraskevopoulos, Appl. Phys. A 83 (2006) 709–717.
[8] A. Orlandos, Byzantine monuments of Kastoria; Archeion ton Byzantinonmnimeion tis Ellados, 4 (ABME A’), 1938.
[9] E. Tsigaridas, The monumental painting of the byzantine churches in Kastoria,In: Macedonian Hellenism, Melbourne, 1995.
10] B. Wehling, P. Vandenabeele, L. Moens, R. Klockenkiimper, A. von Bohlen, G.Van Hooydonk, M. de Reu, Mikrochim. Acta 130 (1999) 253–260.
11] S. Daniilia, S. Sotiropoulou, D. Bikiaris, C. Salpistis, G. Karagiannis, Y. Chrys-soulakis, B.A. Priced, J.H. Carlsone, J. Cult. Her. 1 (2000) 91–110.
12] M. Abdel-Ghania, H.G.M. Edwards, B. Sternc, R. Janaway, Spectrochim. Acta A73 (2009) 566–575.
13] M.L. Franquelo, A. Duran, L.K. Herrera, M.C. Jimenez de Haro, J.L. Perez-Rodriguez, J. Mol. Struc. 924–926 (924) (2009) 404–410.
14] P. Poulia, D.C. Emmony, C.E. Maddenb, I. Sutherland, Appl. Surf. Sci. 173 (2001)252–261.
15] N. Civici, M. Anastasiou, T. Zorba, K.M. Paraskevopoulos, T. Dilo, F. Stamati, M.Arapi, J. Cult. Herit. 9 (2008) 207–213.
16] M. Sawczak, A. Kaminska, G. Rabczuk, M. Ferretti, R. Jendrzejewski, G.S. liwinski,Appl. Surf. Sci. 255 (2009) 5542–5545.
[
[
[
cta Part A 78 (2011) 874–887 887
17] B. Constantinescu, R. Bugoi, G.H. Niculescu, D. Popovici, G.H. Manacu-Adamesteanu, in: M. Uda, et al. (Eds.), X-rays for Archaeology, 2005, pp.163–171.
18] L.D. Kock, D. De Waal, Spectrochim. Acta A 71 (2008) 1348–1354.19] S. Daniilia, E. Minopoulou, Appl. Phys. A 96 (2009) 701–711.20] D.L.A. de Faria, F.N. Lopes, Vib. Spectrosc. 45 (2007) 117–121.21] D. Bikiaris, S. Daniilia, S. Sotiropoulou, O. Katsimbiri, E. Pavlidou, A.P. Moutsat-
sou, Y. Chryssoulakis, Spectrochim. Acta A 56 (1999) 3–18.22] A. Nevin, I. Osticioli, D. Anglos, A. Burnstock, S. Cather, E. Castellucci, Raman
Spectrosc. 39 (2008) 993–1000.23] L. Burgio, R.J.H. Clark, Spectrochim Acta A 57 (2001) 1491–1521.24] D. Hradila, T. Grygar, J. Hradilova, P. Bezdicka, Appl. Clay Sci. 22 (2003)
223–236.25] K. Serifaki, H. Böke, S. Yalcın, B. Ipekoglu, Mater. Charact. 60 (2009) 303–311.26] F. Ospitali, D. Bersani, G. Di Lonardo, P.P. Lottici, J. Raman Spectrosc. 39 (2008)
1066–1073.27] M. Ostrooumov, Spectrochim. Acta A 73 (2009) 498–504.28] A. Nevin, J. Loring Melia, I. Osticioli, G. Gautier, M.P. Colombini, J. Cult. Herit. 9
(2008) 154–161.29] S.S. Potgieter-Vermaaka, R.H.M. Godoi, R. Van Grieken, J.H. Potgieter, M. Oujja,
M. Castillejo, Spectrochim. Acta A 61 (2005) 2460–2467.30] P. Lopez-Arce, J. Garcia-Guinea, D. Benavente, L. Tormo, E. Doehne, Constr. Build.
Mater. 23 (2009) 846–855.31] M. Maguregui, A. Sarmiento, R. Escribano, I. Martinez-Arkarazo, K. Castro, J.M.
Madariaga, Anal. Bioanal. Chem. 395 (2009) 2119–2129.32] I. Martınez-Arkarazo, M. Angulo, O. Zuloaga, A. Usobiaga, J.M. Madariaga, Spec-
trochim. Acta A 68 (2007) 1058–1064.33] K. Zehnder, O. Schoch, J. Cult. Herit. 10 (2009) 319–330.