Graphs and Gapminder - Linda Green
28
GRAPHS AND GAPMINDER Graphs and Gapminder After completing this section, students should be able to: • Read a static plot/graph of one to many variables and use it to tell a story • Read a dynamic complex plot/graph of many variables and use it to tell a story • Critique a graph and point to issues of axis truncation, axis compression, and misuse of area and volume. 11
-
Upload
khangminh22 -
Category
Documents
-
view
0 -
download
0
Transcript of Graphs and Gapminder - Linda Green

GRAPHS AND GAPMINDER
Graphs and Gapminder
After completing this section, students should be able to:
• Read a static plot/graph of one to many variables and use it to tell a story
• Read a dynamic complex plot/graph of many variables and use it to tell a story
• Critique a graph and point to issues of axis truncation, axis compression, andmisuse of area and volume.
11

Graphs GRAPHS AND GAPMINDER
Graphs
Type of graph: histogram: represents amount by ...
12

Graphs GRAPHS AND GAPMINDER
13
Graphs GRAPHS AND GAPMINDER
Question. About what percent of households earn between $30,000 and $35, 000?
Question. About what percent of households earn between $90,000 and $115,000?
Question. On the plot of the US annual household income, are there more householdswith income under $5,000 a year or over $200,000 a year?
A. Substantially more households have incomes under $5,000 a year.
B. Substantially more households have incomes over $200,000 a year.
C. About the same number of households are in both categories.
Question. Are there more households with income below $25,000 or between $90,000and $115, 000?
Question. Why do the bars jump up higher at the far right?
14
Graphs GRAPHS AND GAPMINDER
Question. Ignoring the higher right two bars, is this graph symmetric – i.e., do the leftand right sides look like mirror images?
Question. What does this shape tell you about rich and poor in the US?
15
Graphs GRAPHS AND GAPMINDER
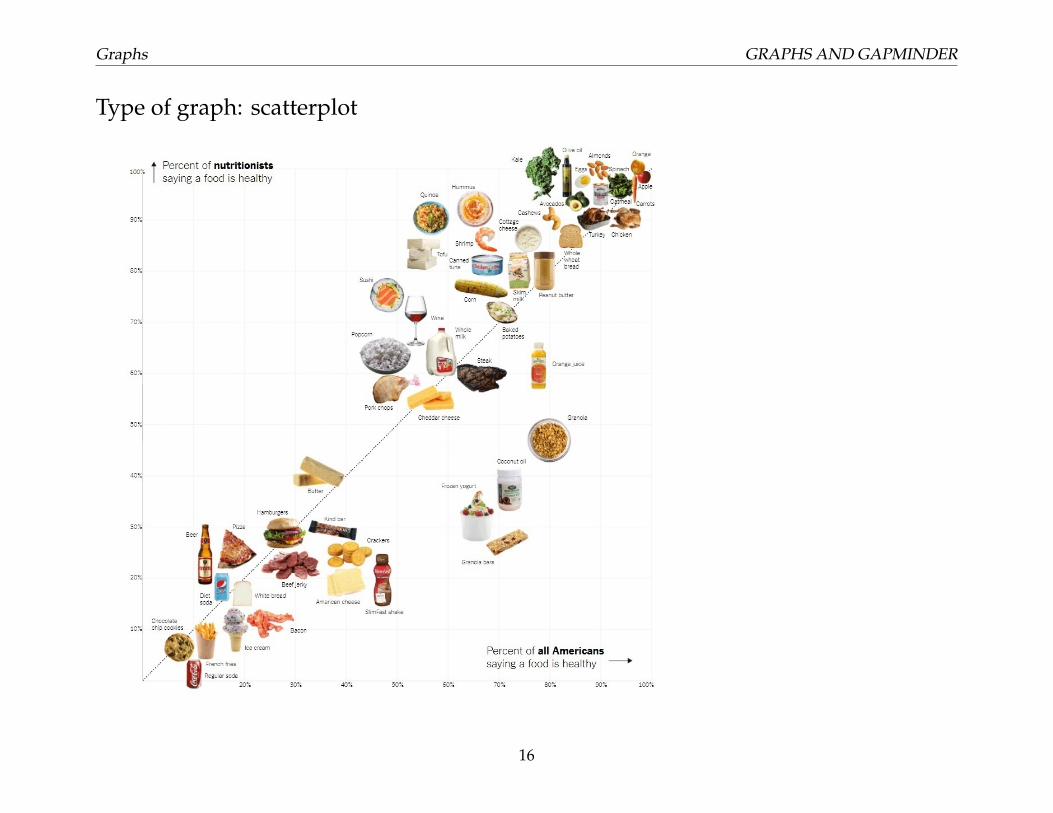
Type of graph: scatterplot
16

Graphs GRAPHS AND GAPMINDER
1. What variables are represented in the graph?
2. What relationships exist between these variables?
3. How might you explain why these relationships exist?
17

Graphs GRAPHS AND GAPMINDER
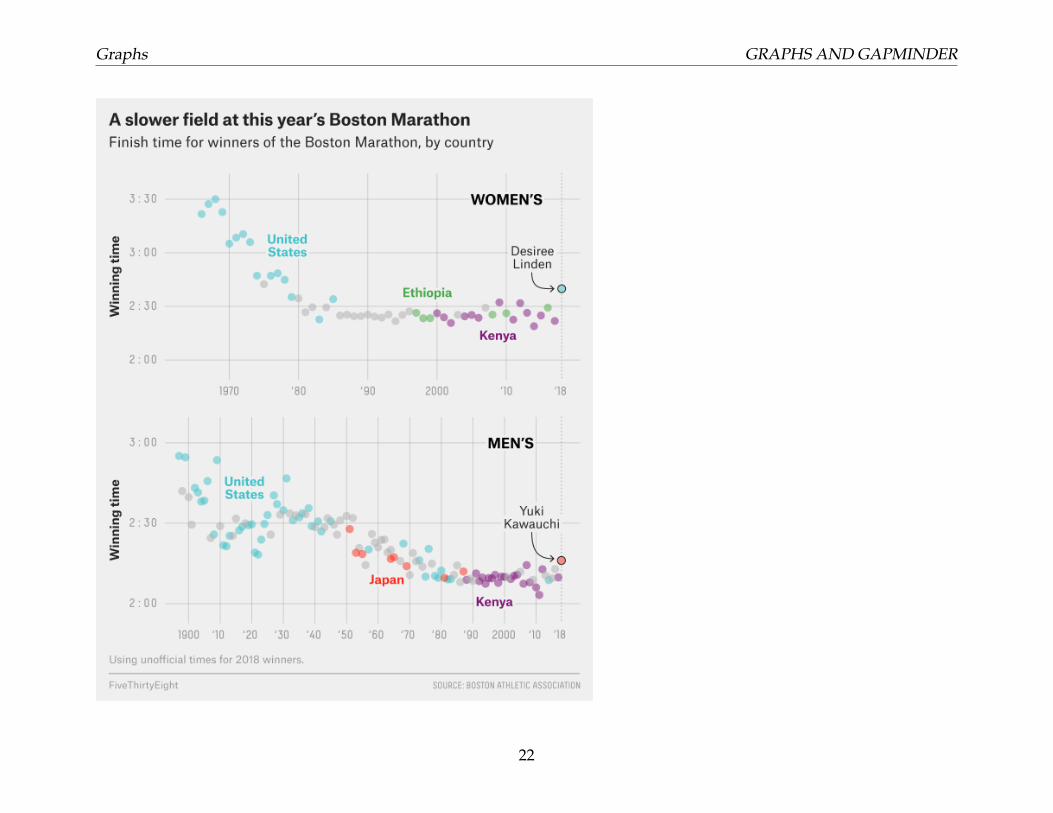
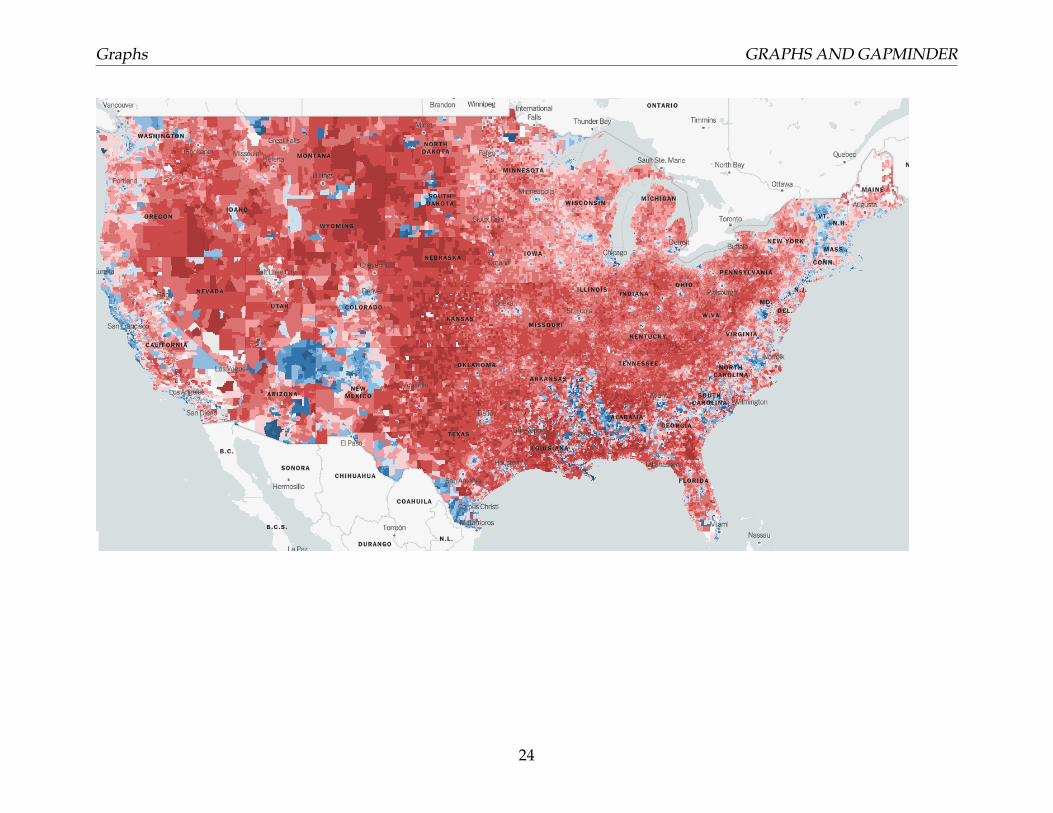
Each group, pick one graph (or one related pair of graphs) from the following collection.For your graph, answer the following questions.
1. What variables are represented in the graph?
2. What relationships exist between these variables?
3. How might you explain why these relationships exist?
18

Graphs GRAPHS AND GAPMINDER
.
19

Graphs GRAPHS AND GAPMINDER
.
20

Graphs GRAPHS AND GAPMINDER
.
21
Graphs GRAPHS AND GAPMINDER
22

Graphs GRAPHS AND GAPMINDER
23
Graphs GRAPHS AND GAPMINDER
24

Graphs GRAPHS AND GAPMINDER
25
Graphs GRAPHS AND GAPMINDER
.
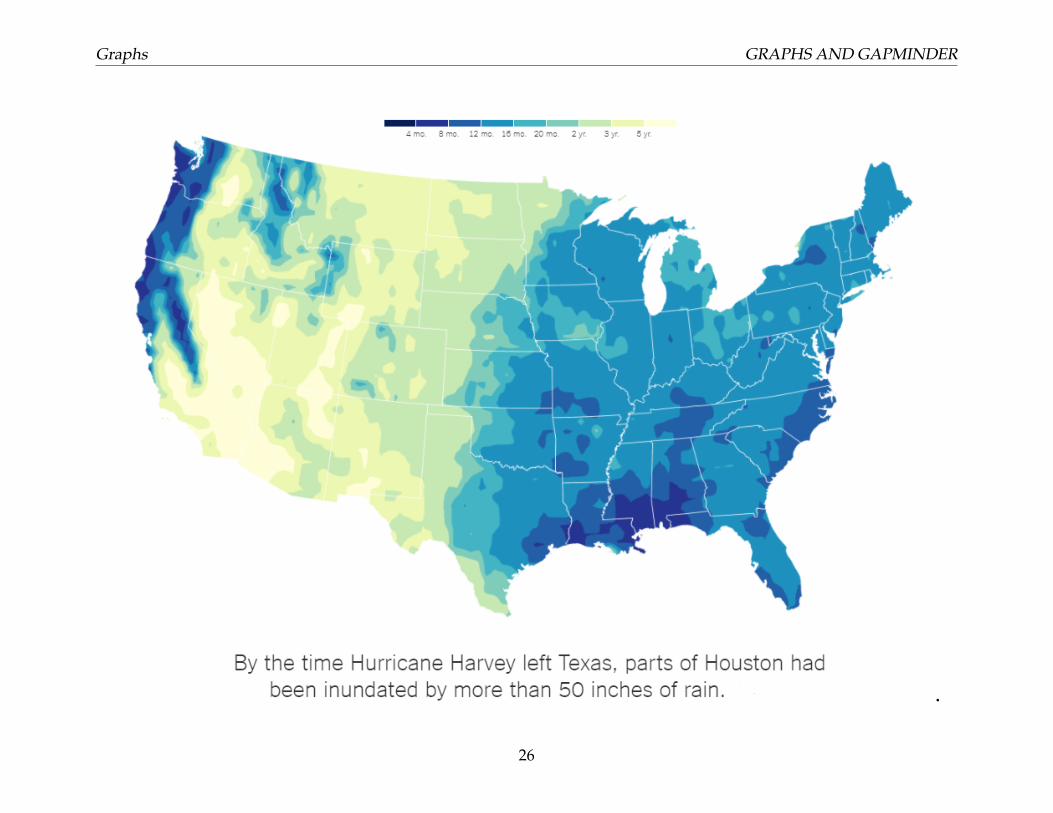
26

Graphs GRAPHS AND GAPMINDER
27
Bad Graphs GRAPHS AND GAPMINDER
Bad Graphs
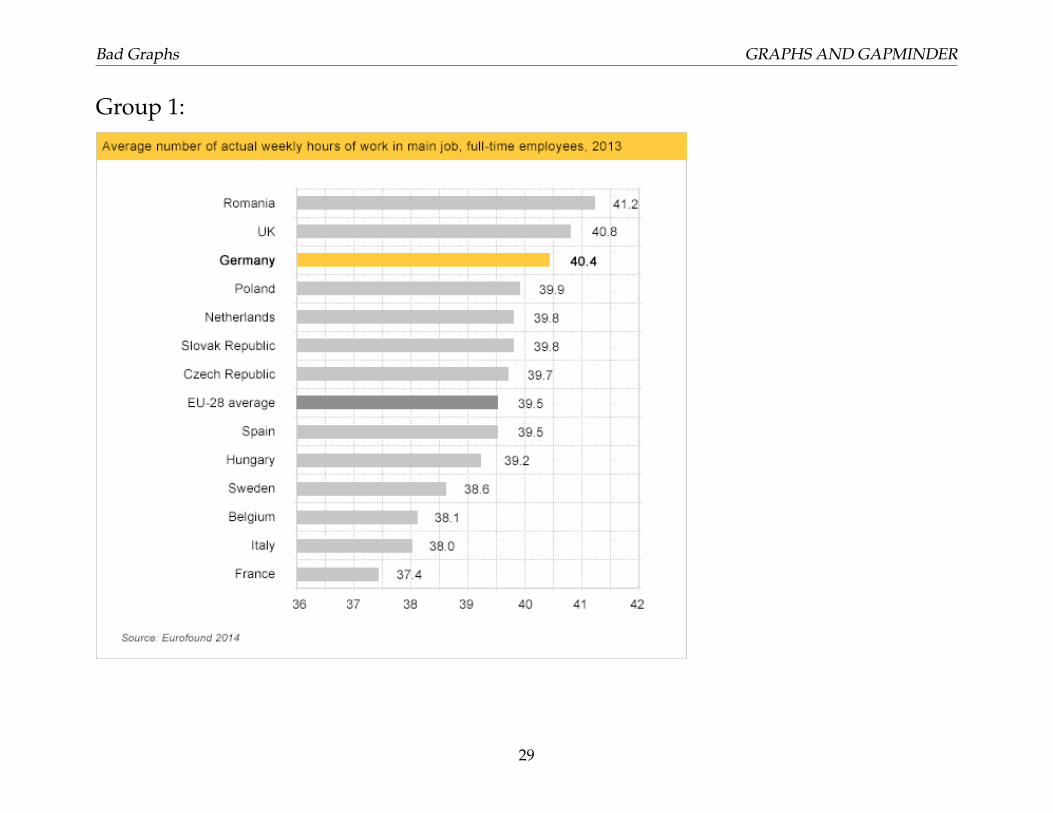
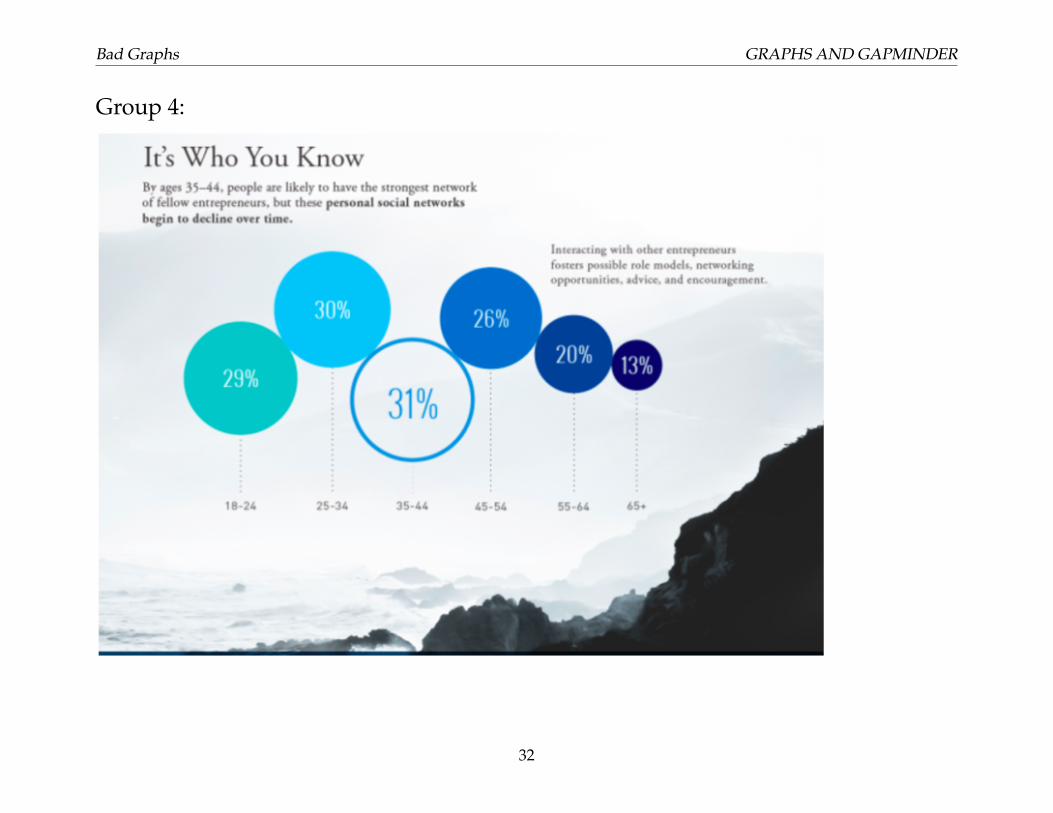
For each graph, find the weaknesses of the graph. Can you think of ways to improveit?
28
Bad Graphs GRAPHS AND GAPMINDER
Group 1:
29

Bad Graphs GRAPHS AND GAPMINDER
Group 2:
30

Bad Graphs GRAPHS AND GAPMINDER
Group 3:
31
Bad Graphs GRAPHS AND GAPMINDER
Group 4:
32

Bad Graphs GRAPHS AND GAPMINDER
Group 5:
33

Gapminder GRAPHS AND GAPMINDER
Gapminder
Gapminder is a plotting tool that lets you explore relationships between variables bycountry.
• Go to www.gapminder.org/tools
• Click on the arrows by the axes labels to change the variables being plotted. Youcan also change from linear to logarithmic scales.
• Click the play button to see the change over time.
34

Gapminder GRAPHS AND GAPMINDER
Find a good story to tell with a Gapminder graph.
• What variables would be of interest to explore their relationships?
• How is best to use Gapminder to explore these relationships?
• How might you explain why these relationships exist?
35

Homework GRAPHS AND GAPMINDER
Homework
1. Find a graph online or in the media that you think is the misleading the viewer.
(a) Include an image of the graph and an informal citation of where you found it.
(b) How is the graph misleading the viewer? How you would you fix it?
(c) Do you think it is intentionally manipulative? Why or why or why not.
2. Go to Gapminder at https://www.gapminder.org/tools/ and watch the How To Useshort video (link at the top).
(a) Change the x- and y-axes to variables that have a relationship that you findinteresting. Include a screenshot of your graph (you can pick which year tostop the video on).
(b) Describe the relationship between the variables. Specifically, what happensto the y-axis variable as the x-axis variable increases, and what happens overtime?
(c) Provide a potential explanation for your observations in part (b).
(d) Describe something you find interesting about this graph.
3. Look at the graph about ride-hailing services below from NYTimes.com. The datawas generated by RideAustin, a nonprofit ride-hailing service in Austin, Texas.
36
Homework GRAPHS AND GAPMINDER
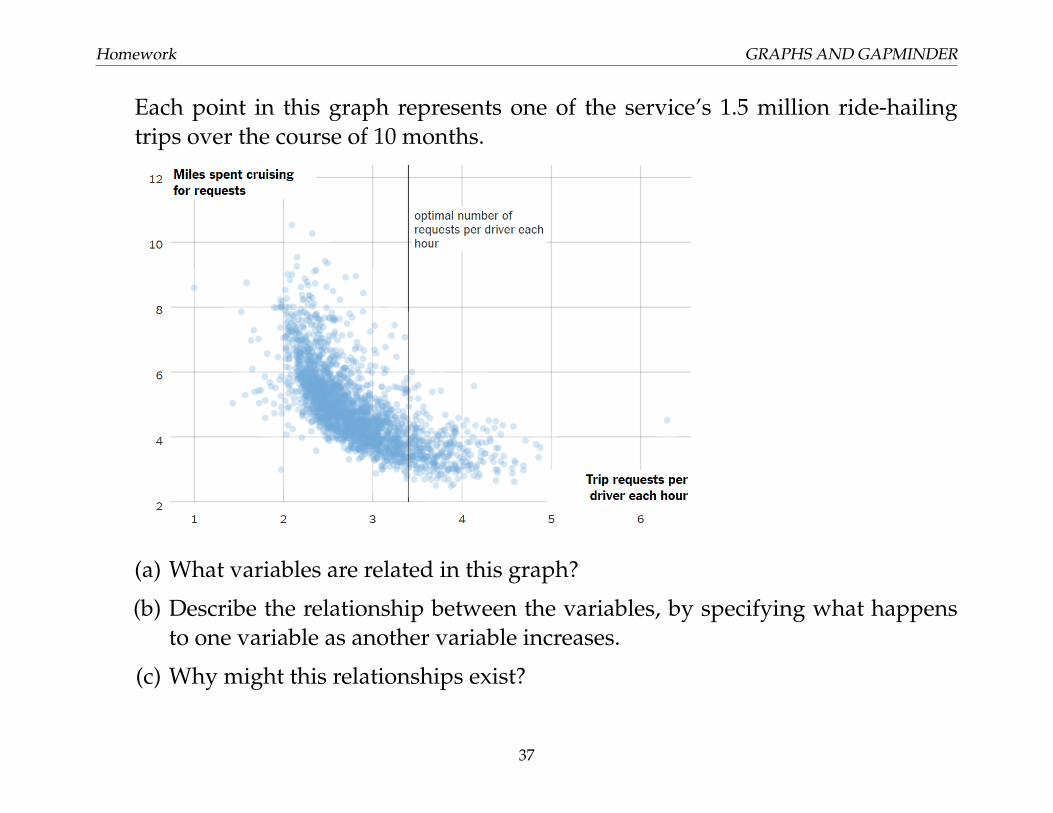
Each point in this graph represents one of the service’s 1.5 million ride-hailingtrips over the course of 10 months.
(a) What variables are related in this graph?
(b) Describe the relationship between the variables, by specifying what happensto one variable as another variable increases.
(c) Why might this relationships exist?
37
Homework GRAPHS AND GAPMINDER
(d) Why are there no data points in the upper right quadrant of the graph?
(e) According to the NY Times, a researcher analyzed the data in this graph to findthat the optimal number of ride requests per driver per hour was 3.4. Whatabout the shape of the graph makes it seem plausible that 3.4 ride requests perhour is most e�cient for drivers and riders?
38