The Quantification of Doubt in Obsessive-Compulsive Disorder
Upload
independentCategory
view
0download
0
Granting teachers the ‘benefit of the doubt’ in performance evaluations
Nicky Rogge
HUB RESEARCH PAPER 2009/17 JULI 2009
1
Granting teachers the ‘benefit of the doubt’ in performance evaluations
Nicky Rogge∗, §
July 2009 ABSTRACT Students’ evaluations of teacher performance (SETs) are increasingly used by universities. However, in their current format SET-scores are controversial mainly due to two issues: (1) questionnaire items are relegated to the status of being of equal importance, and (2) the feedback to the teachers is rather vague and limited. This paper proposes a tailored version of Data Envelopment Analysis to construct SET-scores. One part of this method’s appeal stems from overcoming the two aforementioned criticisms. In particular, DEA accounts for different values and interpretations that teachers attach to ‘good teaching’ and teacher performances are put into a relative perspective to be optimally evaluated. Second, if available, expert opinion on the relative importance of teaching aspects can be easily incorporated into the evaluation. The identification of teachers’ relative strengths and weaknesses is a third advantage. The method is illustrated using data collected at the Hogeschool Universiteit Brussel.
Keywords: student evaluations of teaching; Data Envelopment Analysis; higher education; Benefit of the doubt; weight restrictions JEL-Classification: C14, C61, I21
∗ Centrum voor Economie en Management, Hogeschool Universiteit Brussel, Brussel,Belgium Stormstraat 2, 1000 Brussel (Belgium) Email: [email protected] Tel.: +32 2 609 82 54; fax: +32 2 217 64 64 § Faculty of Business and Economics, Katholieke Universiteit Leuven, Leuven, Belgium

2
Introduction
While still controversial, student evaluations of teaching (hereafter, SETs) have become an
important and frequently used method of assessment, its rationale being that students, and
only students, are constant observers of what happens during the lectures. While the plethora
of research has been devoted to establishing the validity, reliability, stability and usefulness of
student evaluations (see, among others, Abrami et al., 1990; Centra, 1994; De Jong et al.,
2001; Feldman, 1996, 1997; Marsh, 1982, 1984, 1987; Marsh et al., 1993, 1997; McKeachie,
1997; etc.), only limited attention has been paid to how the student questionnaires should be
processed and translated into useful insights and messages for faculty self-improvement. The
common practice is to provide the teachers with average ratings on questionnaire items and,
eventually, a SET score that is just a weighted average of these ratings. Formally,
( ),1
1q
j i j ii
SET w y=
=∑
where we assume n teachers in the sample of observations, jSET the teacher evaluation score
for instructor j ( j =1,…n), ,j iy the class-average student rating for instructor j on
questionnaire item i ( i =1,…,q), and iw the weight assigned to this item i . Note that there is
iw and not ijw , as weights are fixed over evaluated teacher performances. In situations where
SET scores are computed as the arithmetic average, weights are equal ( )qwi 1= across all
questionnaire items i .
Several points can be made here. First of all, when using an arithmetic average all
questionnaire items (measuring different aspects of teacher performance) are relegated to the
status of being of equal importance. Whether or not such equal weights and, in general, any
set of fixed weights are appropriate is questionable. Indeed, there are some indications
suggesting that equality of weights across teaching aspects and/or over teachers is undesirably
3
restrictive. As an illustration of the latter, one frequently observes that teachers value teaching
aspects differently in the definition and, thus, the evaluation of excellent teaching (Pritchard et
al., 1998 p.32).1 These differences are not surprising given the different personalities and
abilities of teachers. Hence, using fixed weights in the build-up of SET scores may be
somewhat counterintuitive. Pritchard et al. (1998, p. 32) put it even stronger: “If an evaluation
system is to be valid, differences in importance [of teaching aspects] need to be captured
when effective teaching is measured. If responses to items are averaged, differences in
importance are lost…. Therefore, some method of weighting importance must be used so that
measures can be combined into a single index in a way that preserves the differential
importance of the components.” Moreover, in the absence of a consensus on how teaching
aspects exactly interrelate, any choice of fixed weights will be subjective to some extent. The
use of fixed weights can also introduce unfairness in teacher evaluations. Indeed, fixed
weights may favour teachers who perform well on aspects that receive high weights, while
disfavouring teachers who excel on aspects with low assigned weights. Teachers may invoke
this subjectivity in weight choice to undermine the credibility of the SET scores. Last but not
least, teachers only get limited information out of such a weighted average, the essential
reason being that it is not at all clear what scores precisely imply. At what value does a score
become an indication of good overall teaching performance? Very often, scores are compared
to some standard fixed norm (i.e., external benchmark) to check whether the teacher
performance is of proper quality. The question remains whether the norm itself is suitable. For
instance, how reliable is such a fixed norm if a large majority of the teachers perform better
(something that is frequently observed in practice)? A similar reasoning applies to the
identification of the teacher’s principal strengths and weaknesses. When is a rating on a
questionnaire item high (low) enough for this item to be considered as a strength (weakness)?
1 Illustrative are the strong inter-individual disagreements observed in the opinion of teachers and students on the appropriate weights in our current study (see Table 1).
4
For a teacher, a SET score becomes much more meaningful when it is constructed and
interpreted in a relative perspective to the performances of colleagues. These considerations
are a central theme of the current paper.
The main purpose of this study is to present a specially tailored version of the Data
Envelopment Analysis methodology (DEA, hereafter) as a well-suited approach to construct
meaningful SET scores based on questionnaire data. The DEA model has been developed by
Charnes et al. (1978) as a non-parametric (i.e., it does not assume any a priori assumption on
the production frontier) technique to estimate efficiency of observations. In the current paper,
we do not apply the original DEA model, but rather an alternative approach which originates
from DEA. This so-called ‘benefit of the doubt’ (BoD) model exploits the characteristic of
DEA that it, thanks to its linear programming formulation, allows for an endogenous
weighting of multiple outputs/achievements (Melyn and Moesen, 1991). This approach has
several advantages over the currently employed methodologies. Firstly, SET scores are no
longer computed by just averaging the class ratings over the several questionnaire items.
Instead, for each teacher performance under evaluation, weights are chosen endogenously in a
relative perspective to the performances of other teachers such that an optimal SET score is
realized. Therefore, teachers with performances receiving low SET scores can no longer
blame their poor evaluation to unfair weights. Second, DEA is a non-parametric technique
which implies that only limited assumptions are required on how the different teaching
aspects interrelate. This approach is justifiable in the complex setting of constructing SET
scores where “one knows what the characteristics of good teaching are, but one doesn’t know
how they relate to each other” (Weimer, 1990 p. 13). Third, DEA is flexible to incorporate
stakeholder opinion (e.g. teachers, students, practitioners, pedagogical experts, etc.) in the
construction of the SET scores. Clearly, this involvement is beneficial for the credibility and
5
acceptance of the evaluation results. Finally, DEA provides a summarizing picture of the
teacher’s overall performance together with additional information on the most important
relative strengths and weaknesses (observed for each subject lectured by the teacher as well as
more general). This is a practical advantage as the overall score can be used for summative
purposes (i.e., tenure, promotion, etc.) while the information on relative strengths and
weaknesses can be used for normative purposes (i.e., improving teacher performance). During
the paper, each of these advantages will be discussed more in detail.
The paper is laid out as follows. The next section briefly describes the questionnaire data
collected at the Hogeschool Universiteit Brussel (HUB) during the academic years 2005-2006
and 2006-2007. A section then follows which presents the DEA for a non-specialist audience.
Doing so, I will stress some fundamental intuitions and show some basic formulas, focusing
less on the technical and computational aspects of DEA (these are treated at length in various
surveys: e.g. Cooper et al. 2004, or Zhu, 2003). The basic DEA model is adjusted to the
specific context of constructing a composite SET score based on only performance indicators
(i.e., the questionnaire items). The ensuing section discusses the methodological as well as
practical importance of incorporating the opinions of stakeholders (i.e., students and lecturers)
as weight restrictions to ensure that a proper weighting scheme is established. This section
will also demonstrate the importance of such restrictions in establishing relative strengths and
weaknesses. This is followed by a section that proposes a format for an individual lecturer
report. In the subsequent section we illustrate how all individual teacher evaluations can be
easily summarized in a faculty evaluation report. The paper ends with a summary of the
conclusion reached and a discussion of some limitations that could be addressed in future
research.
6
Student questionnaire The purpose is to estimate teacher performance as measured by the performance of a teacher
on a specific course. In particular, the present study explores a detailed sample on 530 college
courses j ( )1, ,530j = K taught by 148 different teachers. Teachers who lecture several
courses will therefore have several teacher performance scores (SET-scores), i.e. one for each
evaluated course. These courses were taught in the Commercial Sciences and Commercial
Engineering programs at the Hogeschool Universiteit Brussel (HUB) in the first and second
semester of the academic years 2005-2006 and 2006-2007. During the last two weeks of these
semesters, in total, 30.098 responses were elicited from the students using a questionnaire.
Note that a student could have been asked to express his appreciation of multiple courses. The
questionnaire comprised 16 statements to evaluate the multiple aspects of teacher
performance. Students were asked to rate a lecturer’s performance on all statements on a five-
point Likert scale that corresponds to a coding rule ranging from 1 (I completely disagree) to
5 (I completely agree). To facilitate the users’ understanding of the ‘underlying structure’ in
teacher performance, statements focussing on similar aspects of the teaching activity were
grouped into key dimensions: ‘Learning & Value’, ‘Examinations & Assignments’, ‘Lecture
Organization’, and ‘Individual Lecturer Report’ (see Appendix 1). The development of the
questionnaire as well as the categorization of the items into these key dimensions were largely
based on a study of the content of effective teaching, the specific intentions of the evaluation
instrument, and reviews of previous research and feedback (e.g. Marsh, 1982, 1984, 1987,
1989 and 1991; Marsh et al., 1991, 1992, 1993 and 1997; etc.). Based on a literature review,
Marsh et al. (1992, p. 146) conclude that this approach is more commonly used than statistical
techniques such as factor analysis or multitrait-multimethod analysis. The individual course
was the unit of analysis, rather than the individual student. For each course j ( )1, ,530j = K ,
7
this entails computing an average student rating ,j iy for each questionnaire item i ( i = item
1,…, item 16):
( ), , ,
12j i j i s
s course j
y yS ∈
= ∑
with , ,j i sy the appreciation of student s for the teacher lecturing course j on item i . The
jcourses∈ indicates that all S students registered for course j and present during the
administration of the questionnaires are considered in the computation of the class mean
rating on the items ,j iy ( )1, ,16i = K . Note that this value of S can be lower than the number of
students enrolled for the course j (i.e., official class size) as students may be absent during
this administration. Among others, Cranton et al. (1990), Aiken (1996) and Thorndike et al.
(1991), Yunker (1983) and Marsh (1987) argued in favour of using the class as the unit of
analysis and not the individual student. In essence, all arguments in favour of the use of class-
level data boil down to the same idea, namely that the process of averaging across the
individual ratings produces a more reliable and balanced picture of the teacher's complete
performance. For instance, Yunker (1983) emphasized that aggregating student ratings at the
class level has the advantage of lessening the influence of extraneous student variables (e.g.
academic ability, his personal intention when rating the lecturer) and errors (e.g. inaccuracies
in the data collection) on the results.
Methodology The methodology to construct SET scores is rooted in DEA, a performance measurement
technique originally developed by Farrell (1957) and put into practice by Charnes et al.
(1978). In essence, DEA is a linear programming tool for evaluating the relative efficiency of
a set of similar entities (e.g., firms, individuals, etc.) given observations on (possibly multiple)
8
inputs and outputs and, often, no reliable information on prices, in a setting where one has no
(exact) knowledge about the ‘functional form’ of the production or cost function. However
broad, one immediately appreciates the conceptual similarity between that problem and the
one of constructing SET scores based on a large array of single-dimensional performance
indicators i ( )1, ,i q= K (i.e., the q average class ratings ,j iy collected using a carefully
constructed questionnaire) and no precise understanding on the exact importance of each of
these indicators. In fact, in comparison to DEA, the only difference is that the build-up of SET
scores only requires a look at achievements (without explicitly taking into account the input
dimension). Formally, in the DEA setting, all evaluated entities are assumed to have a
‘dummy input’ equal to one. The intuitive interpretation (see, amongst others, Lovell et al.
1995 and Cook, 2004) for this focus may be obtained by simply looking upon this specific
version of the DEA-model as a tool for summarizing performances on the several components
of the evaluated phenomenon, without explicit reference to the inputs that are used for
achieving such performances. Melyn et al. (1991) were the first to adjust DEA to such a
setting. They labelled the resulting model ‘Benefit of the Doubt’ (BoD), a label that originates
from one of the features of DEA: the use of an endogenous weight selection procedure in the
aggregation. For a presentation of the BoD-formula in a stepwise fashion, see Cherchye et al.
(2007b).
The main conceptual starting point of DEA is that, in the absence of any detailed knowledge
on the correct weights, information on the appropriate weights can be retrieved from the
observed data themselves (i.e., a posteriori). In particular, the basic idea is to put each teacher
performance on a specific course c (as measured by the ,c iy ’s) in a relative perspective to the
other teacher performances (the ,j iy ’s with 1,...,j n= ) included in the comparison set ϒ and
look for relative strengths and weaknesses. A good relative performance of a teacher on a

9
specific item i indicates that this teacher considers this aspect as relatively important.
Accordingly, this aspect should weigh more heavily in the performance evaluation. As a
result, a large weight is assigned. The opposite reasoning holds for the teaching aspects on
which a teacher performs weak compared to the other colleagues in the comparison set (i.e.,
low weights are assigned to such items). In other words, for each evaluated teacher
performance on a specific course c separately, DEA looks for the weights that maximize the
impact of the teacher’s relative strengths and minimize the influence of the relative
weaknesses. As a result, BoD-weights ,c iw are optimal in the sense that they are chosen in
such a way as to maximize the teacher’s SET score cSET .2 Formally, this point is covered by
the general max operator in the following basic DEA problem (adjusted for the ‘Benefit of the
Doubt’ context of constructing a composite SET score based on achievements only, see also
Cherchye et al., 2007b):3
( )
( ) ( )
( )
,, ,
1
, ,1
,
max 3
. .
1 1,..., 3
0 1,... 3
c i
q
c c i c iw
i
q
c i j ii
c i
SET w y
s t
w y j n all n a
w i q b
=
=
=
≤ = ∈ Υ
≥ =
∑
∑
Thus, in the absence of any detailed information on the ‘true’ weights, DEA assumes that
representative weights can be inferred from looking at the relative strengths and weaknesses.
This indeed means that the each teacher is granted the benefit-of-the-doubt when it comes to
assigning weights in the build-up of his/her cSET ’s (i.e., one for each evaluated course). This
quality explains a major of the appeal of the DEA-based cSET ’s: teachers can no longer blame
a low SET score on damaging or unfair weights. 2 For completeness, we mention that DEA alternatively allows for a ‘worst-case’ perspective in which entities receive their worst set of weights, hence, high (low) weights on performance indicators on which they perform relative weak (strong) (Zhou et al., 2007). 3 As mentioned above, this adjusted model is formally tantamount to the original input oriented CCR-DEA model of Charnes et al. (1978), with all questionnaire items considered as outputs and a dummy input equal to one for all observations.
10
In basic DEA, teachers are granted considerable leeway in the definition of their most
favourable weights ,c iw . In fact, optimal weights only need to satisfy two constraints: the
normalization constraint ( )a3 and the non-negativity constraint ( )b3 . The first restriction
imposes that no other teacher performance present in the sample ϒ can have a SET score
higher than unity when applying the optimal weights ,c iw of the teacher performance c under
evaluation. The second constraint states that weights should be non-negative. Hence, cSET is
a non-decreasing function of the performances on the several statements i . Apart from these
restrictions, the formal model ( ) ( )3 3b− allows weights to be freely estimated in order to
maximize cSET .4
From restriction ( )a3 , one can deduce that, for all evaluated teacher performances cSET
( )1, ,c n= K , cSET will lie between 0 and 1 with higher values indicating a better relative
teacher performance. In fact, this constraint highlights the benchmarking idea of DEA: the
most favourable weights for the evaluated teacher performance are always applied to all n
performances in the comparison set ϒ . One is in that way effectively looking which of the
teacher performances in this sample are worse, similar or better. If 1cSET = , the teacher
lectures the course, relative to the other evaluated courses, in the best way (i.e., he/she acts as
his/her own benchmark). That is, it is not outperformed by other observations j
( )1, , , ,j c n= K K when applying his/her best possible weights ,c iw . On the other hand, a
4 It is important to stress that the DEA-approach effectively allows one to impose a common (endogenously selected) set of weights by imposing further restrictions on the weights. In particular, it is possible to reduce (or even eliminate) the dispersion of weight values over evaluated performances pertaining to the same teacher or, even more general, over all evaluated teacher performances. For an application of this idea on country-level data, see Cherchye et al. (2007a) and Kao et al., (2005). I will refrain from pursuing this further in this paper. As will be discussed in the next sections, I prefer granting some limited flexibility in the definition of the weights (the flexibility being limited by the weigh restrictions as retrieved from the stakeholders). Doing so, I bear in mind the common observation that while the possibility of arriving at a stakeholder consensus on a unique set of weights is rather unlikely, agreement on weight bounds is much simpler to obtain.
11
1cSET ≤ reveals that there is at least one observation in the sample who realizes a higher SET
score when applying the most favourable weights ,c iw for the teacher performance under
evaluation (weights which are surely less favourable than the own optimal DEA weights). In
such situations, clearly, a strong case can be made for the notion that this teacher performance
is ‘outperformed’. Such an outperforming performance may be conceived as a suitable
benchmark for the evaluated performance. More generally, the cSET -value reveals the degree
of superior performance. The closer is cSET to unity, the closer is the evaluated performance
to the benchmark performance. Note that this interpretation is intuitive and straightforward to
convey to the target audience: “The SET-scores of other teacher performances in the
comparison set ϒ , constructed with your optimal weights, may indeed be higher than the
SET-score for your own evaluated performance. From point of view of improving your own
teaching performance, focus specifically on those teacher performances who realize the
highest SET-values when using your optimal weights.”
Up to now, only the teacher performances on individual courses have been evaluated. To get
an impression of a teacher’s overall performance, it is valuable to combine his or her multiple
course evaluations into an overall quantitative score. To get to such an overall index of
teaching quality, TTQ , the administrator of the questionnaires at HUB proposed to aggregate
all k SET scores pertaining to a teacher using a measure of the course importance.
Specifically, the administrator at HUB made explicit to weigh the SET score of each course
with the number of contact hours ch :
( )4cT c
cc LecturerT
hTQ SET
h∈
=∑
The rational for using contact hours is that, in general, courses with a higher contact hour ask
more preparation, organization, etc., and, therefore, should weigh more heavily in the
12
evaluation of that teacher’s overall performance. Note that this is merely a proposal reflecting
the preference of the administrator of the SETs at the Hogeschool Universiteit Brussel. Other
universities may prefer the use of alternative aggregation weights (e.g.: class size as an
indication of the number of students who expressed their appreciation on the evaluated
teacher performance). As all SET scores of each individual teacher T are optimal, TTQ is
optimal too (and this irrespective of the aggregation weights used).
Stakeholder opinion and weight restrictions DEA clearly marks a deviation from the common fixed/equal weighting practice in that it
grants teachers considerable leeway in the definition of their most favourable weights ,c iw . In
fact, apart from the two minor constraints ( )a3 and ( )b3 in the basic model, DEA allows
weights to be freely estimated in order to maximize an individual’s SET score. This large
freedom in weight choice can be seen as an advantage as it enables teachers to put themselves
in the best possible light relative to their colleagues. Disillusioned teachers can no longer
blame a low SET score on a harmful or unfair weighting scheme. Any other weighting
scheme than the one specified by DEA would worsen the SET score. However, this flexibility
also carries some potential disadvantages as it may allow a teacher to appear as a brilliant
performer in a manner that is hard to justify. For instance, there is nothing that keeps model
( ) ( )3 3b− from assigning zero or quasi-zero weights to questionnaire items on which the
teacher performs poorly compared to the colleagues, thereby neglecting those aspects in his or
her assessment. For example, in an extreme scenario, all the relative weight could be assigned
to only a few items, which would then completely determine the SET score. One thus faces
the risk of basing an evaluation on only a subset of all (judiciously selected and defined)
questionnaire items. Further, there is the potential problem that DEA may select weights that

13
contradict prior stakeholder views (e.g. students, lecturers, pedagogic experts, faculty board,
etc.). Questionnaire items that experts judge to be of only secondary importance may receive
very high weights in basic DEA analysis. Or, conversely, in its basic version, DEA may
assign a low weight to items which experts judge to be of crucial importance. To avoid zero
or unrealistic weights, additional weight restrictions are needed in the basic model. Formally,
the constraint ( )c3 is added to the model, with W denoting the set of permissible weight
values defined based upon the opinion of selected stakeholders e E∈ .
( ), 1,..., 3c i ew W i q and e E c∈ = ∈
In our application, we gathered opinion on appropriate weights of the two parties most
involved in the teaching process (i.e., students and teachers).5 In total, 16 students and 16
teachers were invited to complete five Budget Allocation analyses (BA, hereafter). Such a
Budget Allocation analysis is a participatory methodology in which stakeholders have to
distribute 100 points over the items allocating more to what they regard to be the more
important items. Four of these BA-analyses where performed within the four key dimensions
of teaching where the stakeholders were asked to express their opinion on the relative
importance of the constituting questionnaire items. One BA-analysis pertained to the general
teaching level. In this analysis, teachers and students had to distribute 100 points over the four
dimensions, giving more to those dimensions whose importance he/she wanted to stress.
Summary information (i.e., average, the minimum and maximum BA-weights) about the
distribution of the points so-obtained is provided in Table 1. As one notices, there are strong
inter-individual disagreements about the precise value of the weights (i.e., large difference
between the maximum and the minimum assigned weights). Not a single pair of stakeholders
shared a similar proposal. In addition, nobody in the panel proposed to weigh all dimensions 5 Weight restrictions are the result of stakeholder opinions and thus introduce subjectivity into the evaluation system. Although this subjectivity is at times considered as less acceptable than objectivity, in the current application this is not regarded as an issue. In fact, subjectivity of this type is both desirable and essential as it helps identifying how teachers should be more or less performing to be viewed as good teachers. Further, stakeholder participation is a critical way to promote acceptance of the evaluation tool.
14
and questionnaire items equally, in contrast with the common practice. The question to be
taken up in the remainder of this section is how stakeholder opinions can be incorporated
when calculating SET scores.
Different types of weight restrictions have been proposed to introduce additional information
in the basic DEA model (e.g., Wong et al., 1990; Thompson et al., 1990; etc.). Cherchye et al.
(2007b) argued in favour of using proportional virtual weight restrictions when opinions have
been collected by a BA-approach. The stated ‘weights’ (which actually are budget shares) are
then very easy to incorporate. Formally,
( ), ,
, ,1
5c i c ii iq
c i c ii
w y
w y
α β
=
≤ ≤∑
An interesting feature about this type of restrictions is that the interpretation of the bounds
remains invariant to changes in the Likert scale. In the DEA literature, this feature is also
known as ‘unit invariance’. While not providing a formal proof of this statement here (see e.g.
Cooper et al., 2000, pp. 39), the underlying intuition is quite straightforward: the original
scale of the questionnaire item (4-point, 5-point, 6-point, etc.) has no influence on the
interpretation of the proportional virtual weight restriction.
[Table 1 About Here] The only difficulty is the how to specify the bounds, given the diversity over individual
stakeholders. The idea is to grant DEA more leeway in the definition of the relative
importance of the items (i.e., relative to the key dimensions they belong to) while allowing
only a limited amount of flexibility in the definition of the relative importance of the key
dimensions to the overall SET score. In terms of the proportional virtual weight restrictions

15
pertaining to the items, the lower and upper bound are respectively the minimum and
maximum weight as specified by the stakeholders (the columns ‘Min’ and ‘Max’ in Table 1).
For example, in the dimension ‘Lecture Organization’ the weight of the questionnaire item
‘The lecturer takes into account my knowledge and skills’ is allowed to vary between 5% and
30%:
( ), ,
, ,. .
5.00% 30.00% 6c know c know
c i c ii Lect Org
w y
w y∈
≤ ≤∑
The lower and upper bound pertaining to the key dimensions are centered around the
dimension-specific average BA-weights as specified by the experts (the column ‘Average’ in
Table 1). A certain amount of variation is allowed, viz. minus 25% (lower bound) and plus
25% (upper bound) of this average weight. In the example of the key dimension ‘Lecture
Organization’, for instance, this would yield 0.2207 0.75 0.1655iα = × = and
0.2207 1.25 0.2759iβ = × = . Formally,
( ), ,
. .
, ,1
0.1655 0.2759 7c i j i
i Lect Org
q
c i j ii
w y
w y
∈
=
≤ ≤∑
∑
Similar proportional virtual weight restrictions are also imposed on the other key dimensions:
‘Learning & Value’ (lower bound: 0.2390; upper bound: 0.3984), Examinations &
Assignments’ (lower bound: 0.1777; upper bound: 0.2961), and ‘Individual Lecturer
Characteristics’ (lower bound: 0.1678; upper bound: 0.2796).
Individual teacher results
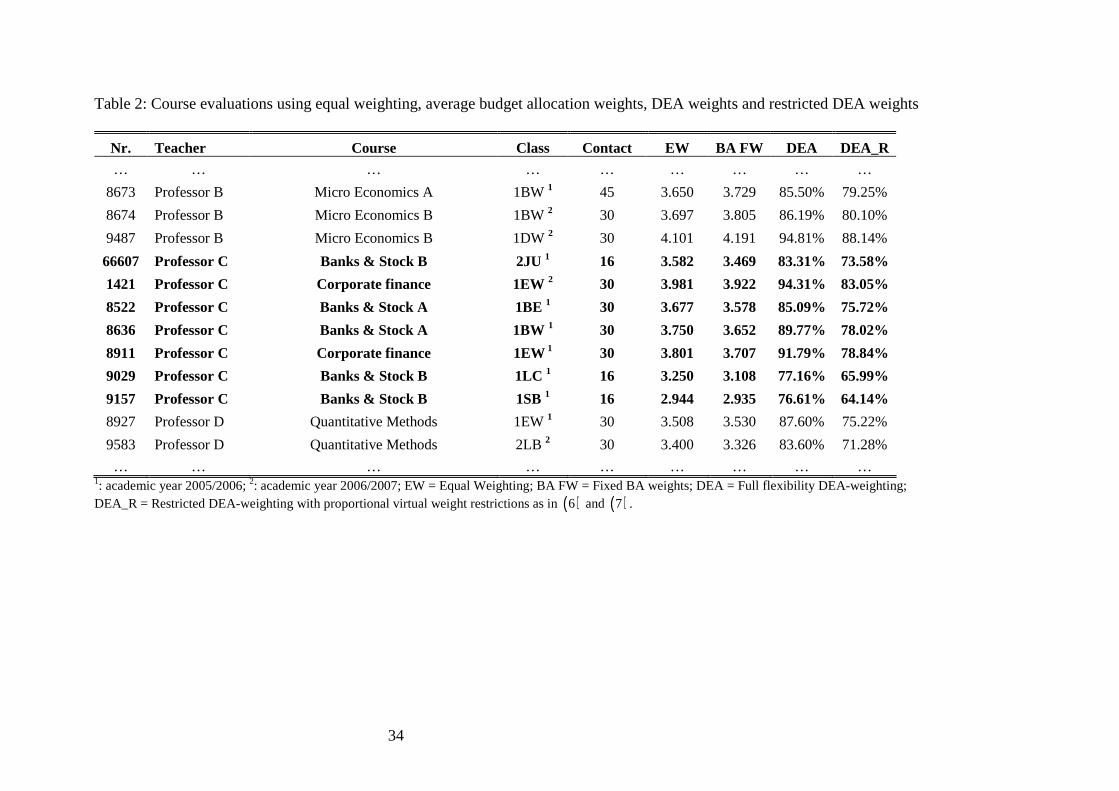
We first examine the individual course evaluations as computed by ( ) ( )3 3b− and the
proportional virtual weight restrictions as in ( )6 and ( )7 . Table 2 displays some results. The
first five columns provide some administrative information, the last four columns present the
16
SET-scores following different evaluation approaches. The ‘EW’-column provides the
commonly-used arithmetic average SET score. Somewhat similarly, the column ‘BA FW’
displays a weighted average using the average specified BA-weights (cf. Table 1). Note that
both these approaches are just two specific cases of fixed weighting. Compare, for instance,
the SET scores for the courses ‘Micro Economics A’ (8673) and ‘Bank & Stock A’ (8522).
Using equal weights, the latter is evaluated to be of higher quality. The opposite holds when
applying the average BA-weights in the aggregation. It is obvious that one may invoke this
dependency to question the credibility and the use of SET scores. Indeed, a SET-score is not
very meaningful when the resulting ordering depends solely on the preferences of merely one
or a few stakeholder(s). In practice, however, all SET scores constructed using fixed weights
are prone to precisely this deficiency. Removing the requirement for administrators to fix a set
of weights would eliminate this dependency and, thus, an important criticism. As noted above,
SET scores constructed using DEA (column ‘DEA’) are less vulnerable to this criticism as
weights are chosen endogenously and, thus, objectively based on the observed data
themselves. Further, the optimality of the DEA weights may well tone down some of the
negative feelings of teachers towards evaluations.
[Table 2 About Here]
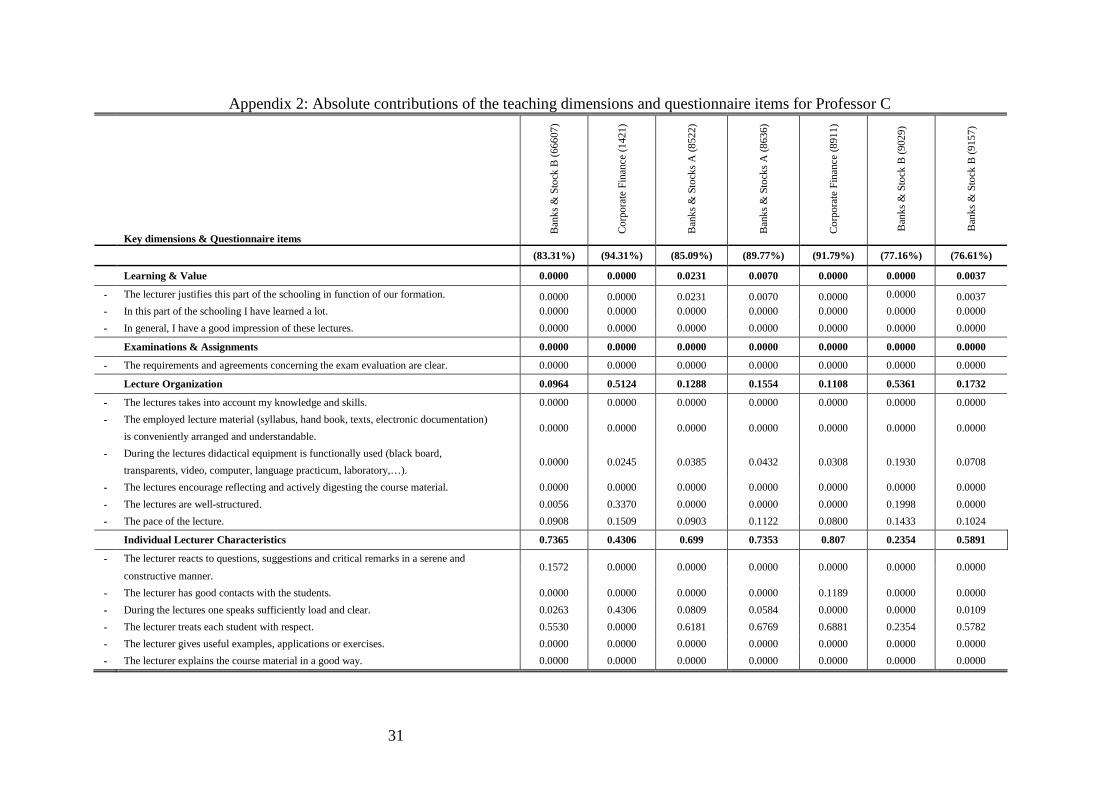
As argued above, in its full flexibility version, DEA still suffers from the problem of allowing
inappropriate (zero or extreme) weights. In fact, in the current example of constructing SET
scores, if one would use DEA without any additional restrictions, the majority of the weights
would be equal to zero (cf. Appendix 2). More precisely, SET scores constructed using full
flexibility DEA comprise on average only 3.72 of the 16 statements. There would be even 74
SET-scores (approximately 14% of all SET scores) which just comprise one single statement.
Clearly, this abolishes the original desideratum of SET scores portraying a multidimensional
17
phenomenon (see, for instance, Feldman, 1996, 1997; and Marsh, 1984). As already
discussed, we handle this issue by incorporating stakeholder opinion in the analysis by adding
weight restrictions. The result is a restricted DEA-model (column ‘DEA_R’) which provides a
balance between, on the one hand, freedom in the definition of optimal weights and, on the
other hand, conformity to some general specifications on the appropriate values of these
weights. For that reason, it seems save to say that both theoretically as well as intuitively,
SET scores constructed using restricted DEA are the least open to criticism.
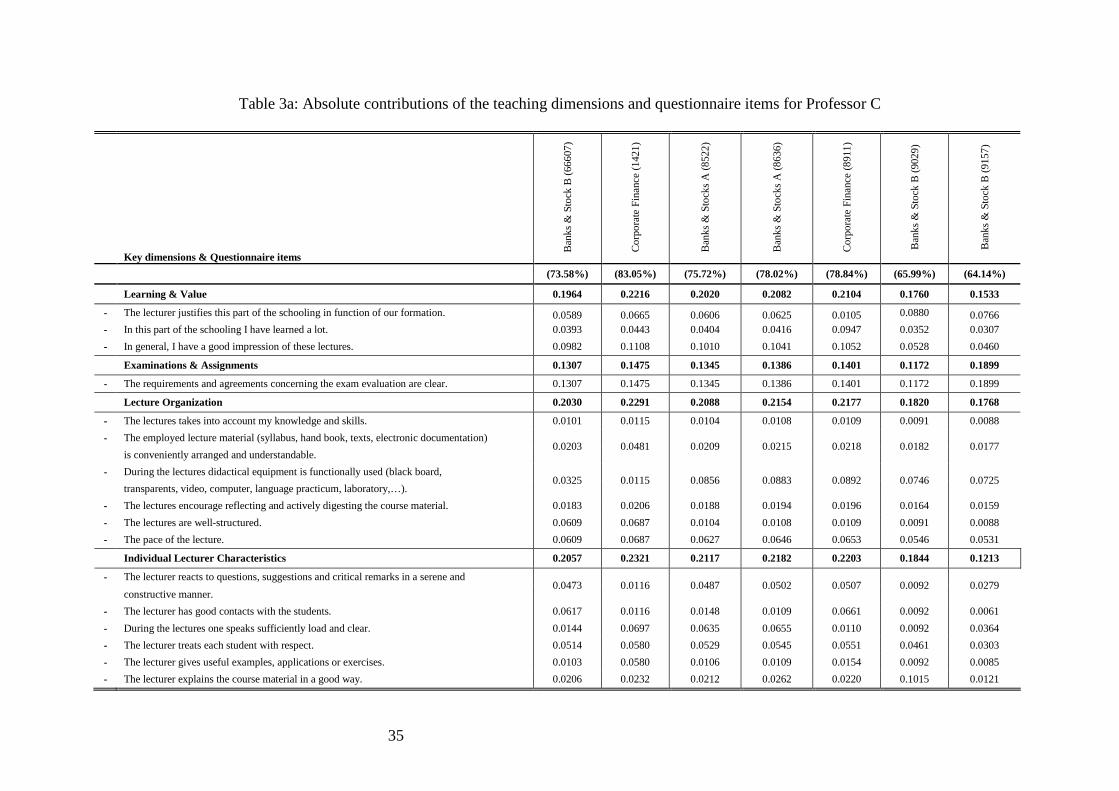
While Table 2 generates some valuable insights into the quality of the evaluated teaching
practices, a single number is far too shallow a basis for learning about the multiple factors
causing a certain teaching performance. Evidently, plausible explanations of observed
teaching performance require detailed analyses indicating what strengths and weaknesses are
at the origin of these performances. In this respect, DEA enables an in-depth analyses as
Table 3a and Table 3b illustrate for the evaluated courses of Professor C. Table 3a shows the
absolute contributions (i.e., , ,c i j iw y ) of the 16 statements for each of the seven courses
evaluated for Professor C. Note two things. First, within each key dimension, contributions of
questionnaire-items sum up to exact contribution of that dimension. Second, absolute
contributions of all four key dimensions sum up to the SET scores. Somewhat trivially,
absolute contributions of all 16 statements sum up to that same SET-score. Besides that, Table
3a doesn't reveal much useful information.
[Table 3a About Here]
[Table 3b About Here]
18
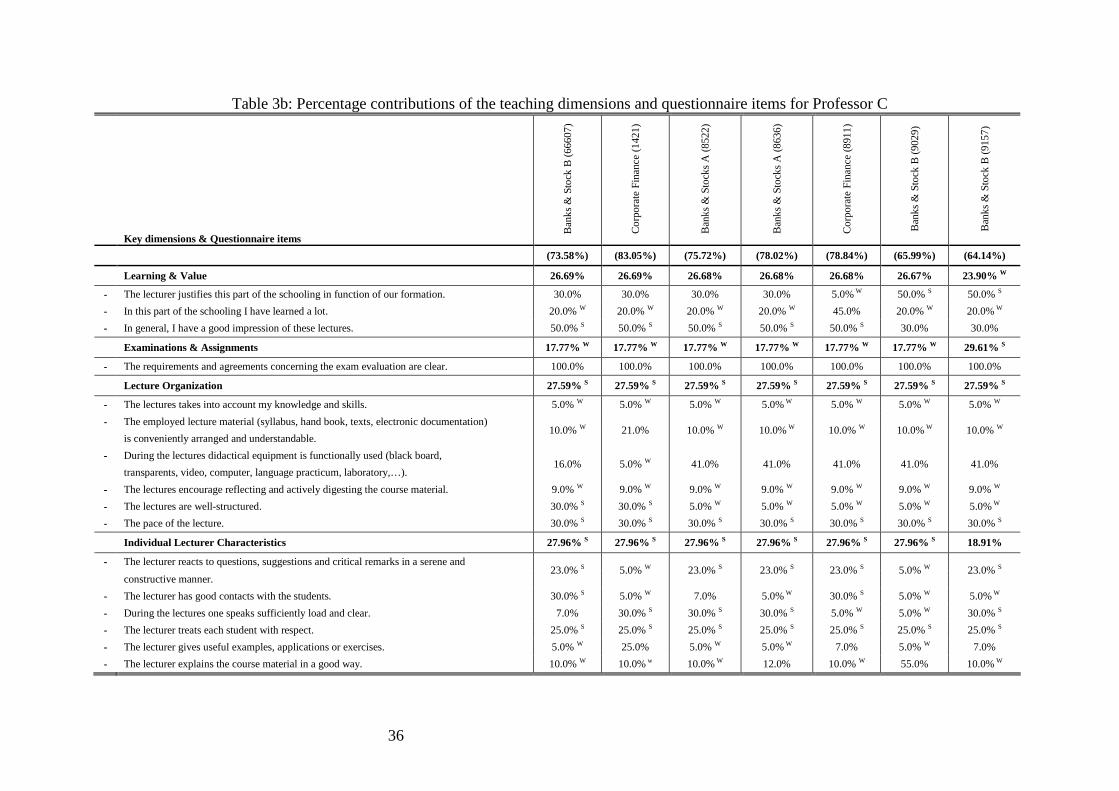
More findings can be retrieved from Table 3b, which displays the percentage contributions of
the key dimensions and questionnaire statements. One can readily note that all tabulated
percentage contributions are in accordance with the added weight restrictions as retrieved
from the stakeholder group (cf. Table 1). Further remark that, even without violating these
restrictions, DEA-obtained percentage contributions can still be quite diverse. Third and more
importantly, this table shows an interesting side-effect of such restrictions: binding
restrictions reveal relative strengths and weaknesses. This side-effect results from the relative
perspective and the endogenous weight selection which enables DEA to assign higher (lower)
weights to those statements for which the evaluated teacher performs relatively best (worst).
With these features of DEA in mind, it is straightforward to see that binding proportional
virtual weight restrictions as in ( )6 and ( )7 reveal statements on which DEA was limited in
the definition of optimal weights. To be more precise, binding restrictions in upward
(downward) direction indicate the accordance of the maximum (minimum) allowed
importance and, thus, relative strengths (weaknesses). In fact, if not for the presence of these
restrictions, higher (lower) optimal weights would have been assigned.
To illustrate this, let’s go back to the course evaluations of Professor C and more in particular,
the optimal percentage contributions of the statement ‘This lecturer has good contacts with the
students’ in the key dimension ‘Individual Lecturer Characteristics’. In the evaluation of the
courses ‘Banks & Stocks B’ (66607) and ‘Corporate Finance’ (8911) DEA attached the
maximum allowed importance to this statement (i.e., 30%). Straightforwardly, if the
restriction pertaining to this statement would have been less stringent (i.e., upper bound of
40% instead of 30%) DEA would have weighted this statement more heavily in the SET
scores for these two courses. As a result, for these two courses, the contact of the teacher with
the students appears to be a relative strength. An opposite reasoning applies in the evaluations
19
of the courses ‘Corporate Finance’ (1421), ‘Banks & Stocks A’ (8636), ‘ Banks & Stocks B’
(9029), and ‘ Banks & Stocks B’ (9157) where the statement is granted the minimum allowed
importance of 5%. In case of more flexibility, the optimal impact of this statement in the SET
scores would have been lower. By consequence, these downwardly binding restrictions are
perceived as 'revealed evidence' of a relative weakness in the performance of Professor C
when lecturing these respective courses. In the evaluation of the course ‘Banks & Stocks A’
(8522), the contact with the students is neither seen to be a relative strength nor a relative
weakness as the weight restriction is not binding. In sum, binding weight restrictions enable a
quick and largely objective identification of relative strengths and weaknesses in an evaluated
teacher performance. In Table 3b, superscripts ‘W’ and ‘S’ are used to indicate respectively
relative strengths and weaknesses. Clearly, this feature of DEA is interesting in the definition
of key messages in an individual feed-back report.
Up to now, teacher performance has only been analyzed at the level of the individual course.
While providing detailed and useful insights, ideally, individual course evaluations should be
summarized into key messages for the teacher. Essentially, this boils down to solving the
following question: when can a questionnaire item, indicated as relative strength (weakness)
in one or more course evaluations, be considered as an overall relative strength (weakness) in
the evaluated teacher’s performance. In cases where the weight restrictions pertaining to a
particular statement is upwardly (downwardly) binding in all evaluated courses, the answer is
straightforward. For Professor C, for instance, binding restrictions on the statements ‘The
lectures takes into account my knowledge and skills’ (weakness), ‘The lectures encourage
reflecting and actively digesting the course material’ (weakness), ‘The pace of the lecture’
(strength), and ‘The lecturer treats each student with respect’ (strength) clearly indicate
general features in teacher C’s performance. A largely similar reasoning applies to the
20
statements where restrictions are binding in the evaluation of all but one course performance
(e.g. ‘In this part of the schooling I have learned a lot’, ‘The employed lecture material is
conveniently arranged and understandable’, and ‘In general, I have a good impression of these
lectures’). Conversely, the interpretation is less apparent when the findings from the
individual courses are mixed. Perfect illustrations are the statements ‘The lectures are well-
structured’, and ‘The lecturer has good contacts with the students’ with respectively 5 and 4
indications of relative weaknesses and 2 indications of relative strengths. In the absence of
any standard rules, subjectivity from part of the evaluator is unavoidable. The idea, however,
should be that a statement can only be considered as an overall relative strength (weakness)
for a teacher when it is indicated as such in the majority (e.g., 2 3) of the evaluations of his or
her courses. In the evaluation of Professor C, for example, a required amount of 5 indications
seems reasonable. Note that this is only a proposal. Some evaluators may be more (less)
stringent when it comes to acknowledging relative strengths and weaknesses in the summary
of the teacher’s performance evaluation, thereby setting higher (lower) limits. Nevertheless,
limit values should not contradict intuition. When, for instance, in the evaluation of seven
courses, a statement is indicated only once as weakness and six times as a mediocre relative
performance (e.g., the item ‘During the lectures didactical equipment is functionally used’ for
professor C), it seems hard to justify that this statement is an overall weakness. Based on the
limit value of ‘5’, respectively six and five statements were established as overall weakness
and strength in Professor C’s teaching performance.
We conclude this section by mentioning that all the aforementioned results are readily
summarized into a feedback report. An illustration for Professor C can be found in Appendix
3. The report consists of three parts. The upper part presents the SET scores of all of Professor
C’s evaluated courses as well as some administrative information (see, Table 2). The middle
21
part of the report visualizes the percentage contributions of the key dimensions. The bottom
part of the sheet further lists the most profound relative strengths and weaknesses in Professor
C’s teaching performance. Both the middle and the lower part are mainly retrieved from Table
3b. The feedback report could be further complemented with written comments from
individual student questionnaires about particular strengths and weaknesses. Note that such a
format could be easily mailed to the teachers together with additional information on the exact
purposes of the evaluation system, a brief description of the used methodology, an invitation
for feedback sessions, and/or a summary of the faculty results.
Faculty results
So far, only individual course and teacher results have been discussed. Nevertheless, it is also
of interest to provide an overall impression of what qualities and shortcomings are frequently
observed among faculty staff. While the literature (e.g. Hativa, 1995) points to several
benefits of such a university-wide picture (e.g. feedback to the faculty board, etc.), perhaps,
the most important of all is that such an overview might enable teachers to put their results
into a wider perspective. Or, to put it in the words of an evaluated teacher: “I think the
evaluation process will be more constructive to my reflection if there was some way in which
the generally observed findings could be fed back to me. This would enable me to compare
my own results with my colleagues’ achievements, thereby indicating which areas particularly
deserve instant action.” This statement seems to confirm the point made by Peel (2005) when
he claims that the role of ‘the other’ in stimulating opportunities for reflection is pivotal.
Indeed, an overall faculty report might make the teachers more ‘self’ aware of their evaluation
results. Consequently, it may encourage reflection on teaching and foster debate about and
dissemination of best practice teaching behaviour. Also in this respect, DEA sits quite
comfortably. In fact, faculty results can be quite easily derived from the percentage

22
contributions as in Table 3b. One only needs to calculate the percentages of individual courses
in which a statement was evaluated as respectively a relative strength and a relative weakness
(cf. Table 4).
[Table 4 About Here]
In table 4, questionnaire items and key dimensions are considered as a general characteristic
of faculty staff when they are indicated as relative strength or weakness in more than 60% of
the evaluated courses. While being subjective, this cut-off value seems intuitively reasonable.
In the case of HUB, this means that teachers are generally performing well when it comes to
organizing their lectures, teaching at an appropriate pace, speaking sufficiently load an clear
during the lectures, and treating each student with respect. Areas where further improvement
is possible include: taking into account the knowledge and skills of students when organizing
lectures, making lecture material more conveniently arranged and understandable,
encouraging reflection and an active digestion of course material, organizing the lectures so
that they are better structured, and explaining the course material in a better way.
Conclusion
The current paper contributes to the literature in that it clearly deviates from the current
methodology to process questionnaire data in student evaluations of teacher performance
(SETs). In contrast to the traditional arithmetic average SET scores, the idea was to use a
specially tailored version of the Data Envelopment Analysis methodology (DEA) to construct
SET scores and to translate the results into useful insights and messages for faculty self-
improvement. Compared to the common practice, DEA has several advantages. First,
questionnaire items are no longer relegated to the status of being of equal importance. Instead
DEA accounts for different values and interpretations that teachers attach to ‘good teaching’.

23
Second, each evaluated teacher performance (i.e., for lecturing a particular course) is put into
a relative perspective to be optimally evaluated. As a result, teachers who receive low SET
scores for lecturing certain courses can no longer blame their poor evaluation on unfair
weights. Third, DEA is a nonparametric technique which implies that only limited
assumptions are required on how the different teaching aspects interrelate. Fourth, DEA is
flexible to incorporate stakeholder opinion (e.g. teachers, students, practitioners, pedagogical
experts, etc.) in the construction of the SET scores. Clearly, this involvement is beneficial for
the credibility and acceptance of the evaluation results. Finally, DEA provides a summarizing
picture of the teacher’s overall performance together with additional information on the
teacher’s most important relative strengths and weaknesses. Based on these advantages, it
seems fair to say that DEA is well-suited to handle teacher evaluation exercises.
Nevertheless, in its basic (even restricted) version, DEA still suffers from some limitations
that could be addressed in future work: the sensitivity of the evaluation results (i.e., SET
scores) towards potential outliers, extreme values, and data irregularities and the inability to
account for the influence of background variables. The sensitivity of conventional DEA to
outlying observations or data irregularities results from the basic feature to include all n
observations in the comparison sample in the performance evaluations. As a result, atypical
observations could heavily disturb all evaluation results (as they typically perform as
benchmarks). Further, original DEA does not account for the influence of background
variables. Essentially, this implies assuming that the environment has no influence on the
attainable performance. Particularly in the context of evaluating teacher performances such an
assumption seems hardly tenable and very much open to criticism. First of all, there are the
numerous findings in the academic literature which suggest that one or more background
conditions (e.g., class size, teacher gender, teacher experience, course grades, timing of the
24
course) may have a significant influence on SET scores (Abrami et al., 1980; Cashin, 1995;
Centra, 2003; d’Appollonia et al., 1997; Eiszler, 2002; Feldman, 1997; Griffin, 2001, 2004;
Langbein, 1994, 2008; Lin, 2009; Marsh, 1987, 2007; Marsh et al., 1997, 2000; Nasser et al.
2006; Ting, 2000; etc.). Second, there is the practical experience from teachers themselves
which indicates that some teaching environments are more constructive to high-quality
teaching (and, hence, high SET scores) while other environments make such a level of
teaching less evident. Consequently, if not accounting for the influence of background
variables, one risks obtaining evaluations results which can be seriously biased and
misleading. Recently, Cazals et al. (2002), Daraio and Simar (2005, 2007a, 2007b), and De
Witte and Kortelainen (2008) developed some extentions in the basic DEA framework to
make the results to data irregularities and atypical observations, to account for the operating
environment, and to explore which of the environmental variables have a significant impact
on the DEA-scores. Implementing these developments in the above presented approach
clearly are interesting avenues for future research that may benefit the reliability and validity
of DEA to evaluate teacher performance.
Acknowledgments The author wishes to express his gratitude to Tom Van Puyenbroeck, Laurens Cherchye, Wim Moesen, Erwin Ooghe and Dries Berings for their constructive comments and to Tom Colpaert for the data collection.
References Abrami, P.C., Dickens, W.J., Perry, R.P., and Leventhal, L. (1980). Do teacher standards for
assigning grades affect student evaluations of instruction. Journal of Educational Psychology 72(1): 107-118.
Abrami, P.C., d’Apollo, S., and Cohen, P.A. (1990). The validity of student ratings of
instruction: What we know and what we do not. Journal of Educational Psychology 82(2): 219-231.
25
Aiken, L. (1996): Rating scales and checklists: Evaluating behaviour, personality, and attitudes. New York: John Wiley.
Cashin, W. E. (1995). Student ratings of teaching: the research revisited, IDEA Paper Nr.32. Cazals, C., Florens, J.P., and Simar, L. (2002). Nonparametric Frontier Estimation: A Robust
Approach. Journal of Econometrics 106(1), 1-25. Centra, J.A. (1994). The use of teaching portfolio and student evaluations for summative
evaluations. Journal of Higher Education 11: 1-10. Centra, J.A. (2003). Will Teachers Receive Higher Student Evaluations by Giving Higher
Grades and Less Course Work. Research in Higher Education 44(5): 495-518. Charnes, A. Cooper, W.W., and Rhodes, E. (1978). Measuring the efficiency of decision
making units, European Journal of Operational Research 2: 429-444. Cherchye, L. and Kousmanen, T. (2007a). Benchmarking Sustainable Development: A
Synthetic Meta-Index Approach, Chapter 7 in M. McGillivray and M. Clarke (Eds.), Perspectives on Inequality, Poverty and Human Well-being. New York: United Nations University Press: 139-168.
Cherchye, L., Moesen, W., Rogge, N., and Van Puyenbroeck, T. (2007b). An introduction to
‘benefit of the doubt’ composite indicators. Social Indicators Research Vol. 82: 111-145.
Cook, W.D. (2004). Qualitative data in DEA, in W.W. Cooper, L. Seiford, and J. Zhu.
Handbook on Data Envelopment Analysis. Kluwer Academic Publishers: 75-97. Cooper, W.W., Seiford, L.M., and Tone, J. (2000). Data Envelopment Analysis: A
Comprehensive Text with Models, Applications, References and DEA-Solver Software. Kluwer Academic Publishers, Dordrecht.
Cooper, W.W., Seiford, L.M., and Zhu, J. (2004). Handbook on Data Envelopment Analysis.
Kluwer Academic Publishers, Dordrecht. Cranton, P., and Smith, R. (1990). Reconsidering the unit of analysis: A model of student
ratings of instruction. Journal of Educational Psychology 82(2): 207-212. D’Appollonia, S., and Abrami, P.C. (1997). Navigating student ratings of instruction.
American Psychologist 52(11): 1198-1208. Daraio, C., and Simar, L. (2005). Introducing Environmental Variables in Nonparametric
Frontier Models: A Probabilistic Approach. Journal of Productivity Analysis, 24 (1), 93-121.
Daraio, C., and Simar, L. (2007a). Advanced robust and nonparametric methods in efficiency
analysis: Methodology and applications. Series: Studies in Productivity and Efficiency, Springer.
26
Daraio, C., and Simar, L. (2007b). Conditional Nonparametric Frontier Models for Convex
and Nonconvex Technologies: A Unifying Approach. Journal of Productivity Analysis, 28, 13-32.
De Jong, R., and Westerhof, K.J. (2001). The quality of student ratings of teacher behaviour.
Learning Environment Research 4: 51-85. De Witte, K., & Kortelainen, M. (2008). Blaming the exogenous environment? Conditional
efficiency estimation with continuous and discrete environmental variables. CES Discussion Paper Series DPS 08.33; MPRA Paper 14034.
Eiszler, C.F. (2002). College Students' Evaluations of Teaching and Grade Inflation. Research
in Higher Education 43(4): 483-501. Farrell, M.J. (1957). The measurement of productive efficiency. Journal of the Royal
Statistical Society, Series A, CXX Part 3: 253-290. Feldman, K.A. (1996). Identifying exemplary teaching: Using data from course and teacher
evaluations. In M.D. Svinicki and R.J. Menges (Eds), Honoring Exemplary Teaching. (New Directions for Teaching and Learning, No. 65.) San Francisco: Jossey-Bass.
Feldman, K.A. (1997). Identifying exemplary teaching: Evidence from student ratings. In R.P.
Perry and J.C. Smart (Eds), Effective Teaching in Higher Education: Research and Practice. New York: Agathon Press.
Griffin, B.W. (2001). Instructor Reputation and Student Ratings of Instruction. Contemporary
Educational Psychology 26: 534-552. Griffin, B.W. (2004). Grading leniency, grade discrepancy, and student ratings of instruction.
Contemporary Educational Psychology 29: 410-425. Hativa, N. (1995). The department-wide approach to improving faculty instruction in higher
education: A qualitative evaluation. Research in Higher Education 36(4): 377-413. Kao, C., and Tung, H.T. (2005). Data Envelopment Analysis with Common Weights: The
Compromise Solution Approach. Journal of the Operational Research Society 56: 1196-1203.
Langbein, L. (1994). The Validity of Student Evaluations of Teaching. Political Science and
Politics 27(3): 545-553. Langbein, L. (2008). Management by results: Student evaluation of faculty teaching and the
mis-measurement of performance. Economics of Education Review 27: 417-428. Lin, T-C. (2009). Economic Behavior in Student Ratings of Teaching: Revenge or Reward?
Journal of Economic Education: under review.
27
Lovell C.A.K, Pastor J.T., and Turner J.A. (1995). Measuring Macroeconomic Performance in the OECD: A Comparison of European and Non-European Countries. European Journal of Operational Research 87: 507-518.
Marsh, H. W. (1982). SEEQ: A reliable, valid, and useful instrument for collecting students'
evaluations of university teaching. British Journal of Educational Psychology 52(1): 77–95.
Marsh, H.W. (1984). Students’ evaluations of university teaching: dimensionality, reliability,
validity, potential biases and utility. Journal of Educational Psychology 76(5): 707-754.
Marsh, H.W. (1987). Students’ evaluations of university teaching: Research findings,
methodological issues, and directions for further research. Journal of Educational Research 11: 253-288.
Marsh, H. W. (1989). Responses to reviews of students' evaluations of university teaching:
Research findings, methodological issues, and directions for future research. Instructional Evaluation 10: 5–9.
Marsh, H. W. (1991). Multidimensional students' evaluations of teaching effectiveness: A test
of higher-order structures. Journal of Educational Psychology 83(2): 285–296. Marsh, H.W. (2007). Students’ evaluations of university teaching: dimensionality, reliability,
validity, potential biases and usefulness. In R.P. Perry and J.C. Smart (Eds.), The Scholarship of Teaching and Learning in Higher Education: An Evidence-Based Perspective (pp. 319-383), Springer.
Marsh, H. W., and Hocevar, D. (1991). The multidimensionality of students' evaluations of
teaching effectiveness: The generality of factor structures across academic discipline, instructor level, and course level. Teaching & Teacher Education 7(1): 9–18.
Marsh, H. W., and Dunkin, M. J. (1992). Students' evaluations of university teaching: A
multidimensional perspective. In John. C. Smart (ed.), Higher Education: Handbook of Theory and Research, vol. 8, pp. 143–233. New York: Agathon Press.
Marsh, H.W., and Bailey, M. (1993). Multidimensional students’ evaluations of teaching
effectiveness. Journal of Higher Education 64: 1-18. Marsh, H.W., and Roche, L. (1997). Making students’ evaluations of teaching effectiveness effective:
The critical issues of validity, bias, and utility. American Psychologist 52 (11): 1187-1197. Marsh, H.W., and Roche, L. (2000). Effects of Grading Leniency and Low Workload on Students'
Evaluations of Teaching, Popular Myth, bias, validity, or innocent bystanders? Journal of Educational Psychology 92(1): 202-228.
McKeachie, W.J. (1997). Student Ratings: The Validity of Use. American Psychologist:
1218-1225.
28
Melyn W., and Moesen W. (1991). Towards a Synthetic Indicator of Macroeconomic Performance: Unequal Weighting when Limited Information is Available. Public Economics Research Paper 17. CES, KU Leuven.
Nasser, F., and Hagtvet, K.A. (2006). Multilevel analysis of the effects of students and
instructor/course characteristics on student ratings. Research in Higher Education 47(5): 559-590.
Peel, D. (2005). Peer observation as a transformatory tool? Teaching in Higher Education
10(4): 489-504. Pritchard, R.D., Watson, M.D., Kelly, K., & Paquin, A.R. (1998). Helping Teachers Teach
Well: A New System for Measuring and Improving Teaching Effectiveness in Higher Education. The New Lexington Press, San Francisco.
Thompson, R.G., Langemeier, L.N., Lee, C., Lee, E., and Thrall, R.M. (1990). The Role of
Multiplier Bounds in Efficiency Analysis with Application to Kansas Farming. Journal of Econometrics 46: 93-108.
Thorndike, R.L., Cunningham, G.K., and Hagen, E.P. (1991). Measurement and Evaluation in
Psychology and Education. 5th edition, New York: McMillan. Ting, K-F. (2000). A Multilevel Perspective on Student Ratings of Instruction: Lessons from
the Chinese Experience. Research in Higher Education 41(5). 637-661 Weimer, M. (1990). It’s a myth: Nobody knows what makes teaching good, in Neff, R.A. and
Weimer, M. (eds.), College Teaching: Collected Readings for the New Instructor. Madison, WI: Magnn.
Wong Y.H.B., and Beasly J.E. (1990). Restricting Weight Flexibility in Data Envelopment
Analysis. Journal of the Operational Research Society 41: 829-835. Yunker, J.A. (1983). Validity research on student evaluations of teaching effectiveness:
Individual student observations versus class mean observations. Research in Higher Education 19(3): 63-379.
Zhou,P., Ang, B.W., and Poh, K.L. (2007), “A Mathematical Programming Approach to
Constructing Composite Indicators”, Ecological Economics, 62, pp. 291-297. Zhu, J. (2003). Quantitative Models for Performance Evaluation and Benchmarking.
International Series in Operations Research and Management Science, Kluwer Academic Publishers, Dordrecht.
29
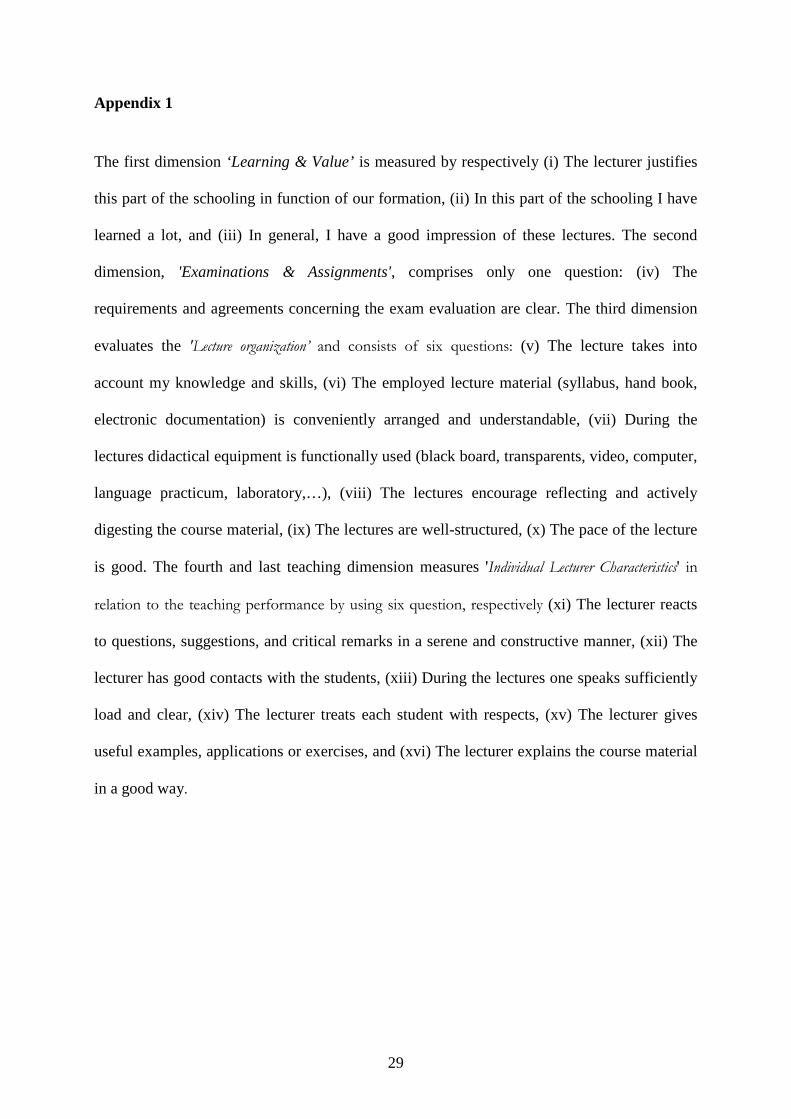
Appendix 1
The first dimension ‘Learning & Value’ is measured by respectively (i) The lecturer justifies
this part of the schooling in function of our formation, (ii) In this part of the schooling I have
learned a lot, and (iii) In general, I have a good impression of these lectures. The second
dimension, 'Examinations & Assignments', comprises only one question: (iv) The
requirements and agreements concerning the exam evaluation are clear. The third dimension
evaluates the 'Lecture organization’ and consists of six questions: (v) The lecture takes into
account my knowledge and skills, (vi) The employed lecture material (syllabus, hand book,
electronic documentation) is conveniently arranged and understandable, (vii) During the
lectures didactical equipment is functionally used (black board, transparents, video, computer,
language practicum, laboratory,…), (viii) The lectures encourage reflecting and actively
digesting the course material, (ix) The lectures are well-structured, (x) The pace of the lecture
is good. The fourth and last teaching dimension measures 'Individual Lecturer Characteristics' in
relation to the teaching performance by using six question, respectively (xi) The lecturer reacts
to questions, suggestions, and critical remarks in a serene and constructive manner, (xii) The
lecturer has good contacts with the students, (xiii) During the lectures one speaks sufficiently
load and clear, (xiv) The lecturer treats each student with respects, (xv) The lecturer gives
useful examples, applications or exercises, and (xvi) The lecturer explains the course material
in a good way.
30
Appendix 1: questionnaire outline: 4 key dimensions with 16 questionnaire items
Key dimensions & Questionnaire items Average Stdev
Learning & Value
- The lecturer justifies this part of the schooling in function of our formation. 3.866 0.548
- In this part of the schooling I have learned a lot. 3.734 0.601
- In general, I have a good impression of these lectures. 3.642 0.572
Examinations & Assignments
- The requirements and agreements concerning the exam evaluation are clear. 3.622 0.694
Lecture Organization
- The lectures takes into account my knowledge and skills. 3.688 0.590
- The employed lecture material (syllabus, hand book, texts, electronic documentation)
3.957 0.521
is conveniently arranged and understandable.
- During the lectures didactical equipment is functionally used (black board, 3.835 0.686
transparents, video, computer, language practicum, laboratory,…).
- The lectures encourage reflecting and actively digesting the course material. 3.567 0.624
- The lectures are well-structured. 3.623 0.637
- The pace of the lecture. 4.038 0.646
Individual Lecturer Characteristics
- The lecturer reacts to questions, suggestions and critical remarks in a serene and 3.749 0.658
constructive manner.
- The lecturer has good contacts with the students. 4.138 0.437
- During the lectures one speaks sufficiently load and clear. 3.212 0.323
- The lecturer treats each student with respect. 3.875 0.590
- The lecturer gives useful examples, applications or exercises. 3.796 0.653
- The lecturer explains the course material in a good way. 3.638 0.641
31
Appendix 2: Absolute contributions of the teaching dimensions and questionnaire items for Professor C
Key dimensions & Questionnaire items Ban
ks &
Sto
ck B
(66
607
)
Co
rpo
rate
Fin
anc
e (
142
1)
Ban
ks &
Sto
cks
A (
852
2)
Ban
ks &
Sto
cks
A (
863
6)
Co
rpo
rate
Fin
anc
e (
891
1)
Ban
ks &
Sto
ck B
(90
29
)
Ban
ks &
Sto
ck B
(91
57
)
(83.31%) (94.31%) (85.09%) (89.77%) (91.79%) (77.16%) (76.61%)
Learning & Value 0.0000 0.0000 0.0231 0.0070 0.0000 0.0000 0.0037
- The lecturer justifies this part of the schooling in function of our formation. 0.0000 0.0000 0.0231 0.0070 0.0000 0.0000 0.0037 - In this part of the schooling I have learned a lot. 0.0000 0.0000 0.0000 0.0000 0.0000 0.0000 0.0000
- In general, I have a good impression of these lectures. 0.0000 0.0000 0.0000 0.0000 0.0000 0.0000 0.0000
Examinations & Assignments 0.0000 0.0000 0.0000 0.0000 0.0000 0.0000 0.0000
- The requirements and agreements concerning the exam evaluation are clear. 0.0000 0.0000 0.0000 0.0000 0.0000 0.0000 0.0000
Lecture Organization 0.0964 0.5124 0.1288 0.1554 0.1108 0.5361 0.1732
- The lectures takes into account my knowledge and skills. 0.0000 0.0000 0.0000 0.0000 0.0000 0.0000 0.0000
- The employed lecture material (syllabus, hand book, texts, electronic documentation)
is conveniently arranged and understandable. 0.0000 0.0000 0.0000 0.0000 0.0000 0.0000 0.0000
- During the lectures didactical equipment is functionally used (black board,
transparents, video, computer, language practicum, laboratory,…). 0.0000 0.0245 0.0385 0.0432 0.0308 0.1930 0.0708
- The lectures encourage reflecting and actively digesting the course material. 0.0000 0.0000 0.0000 0.0000 0.0000 0.0000 0.0000
- The lectures are well-structured. 0.0056 0.3370 0.0000 0.0000 0.0000 0.1998 0.0000
- The pace of the lecture. 0.0908 0.1509 0.0903 0.1122 0.0800 0.1433 0.1024
Individual Lecturer Characteristics 0.7365 0.4306 0.699 0.7353 0.807 0.2354 0.5891
- The lecturer reacts to questions, suggestions and critical remarks in a serene and
constructive manner. 0.1572 0.0000 0.0000 0.0000 0.0000 0.0000 0.0000
- The lecturer has good contacts with the students. 0.0000 0.0000 0.0000 0.0000 0.1189 0.0000 0.0000
- During the lectures one speaks sufficiently load and clear. 0.0263 0.4306 0.0809 0.0584 0.0000 0.0000 0.0109
- The lecturer treats each student with respect. 0.5530 0.0000 0.6181 0.6769 0.6881 0.2354 0.5782
- The lecturer gives useful examples, applications or exercises. 0.0000 0.0000 0.0000 0.0000 0.0000 0.0000 0.0000
- The lecturer explains the course material in a good way. 0.0000 0.0000 0.0000 0.0000 0.0000 0.0000 0.0000

32
Appendix 3: Individual feedback report
Pers.Nr. M/F Age PhD < 2 years Reseach%3453 F 39 Yes No 50%
Enq.Nr. Course Dir. Group Master Class size contact Score
66607 Banks & Stock B Comm.Ir. 2JU 1 X 57 16 73.58%
1421 Corporate finance Comm.Sc. 1EW 2 0 21 30 83.05%
8522 Banks & Stock A Comm.Sc. 1BE 1 0 64 30 75.72%
8636 Banks & Stock A Comm.Sc. 1BW 1 0 156 30 78.02%
8911 Corporate finance Comm.Sc. 1EW 1 0 27 30 78.84%
9029 Banks & Stock B Comm.Sc. 1LC 1 0 100 16 65.99%
9157 Banks & Stock B Comm.Sc. 1SB 1 0 121 16 64.14%
Overall SCORE: 75.76%1: academic year 2005/2006, 2: academic year 2006/2007
STRENGTHS
+ The pace of the lectures is good (7/7)+ Students indicate that you treat them with a lot of respect (7/7)+ In general, students have a good impression of your lectures (5/7)+ Students appreciate that the lecturer reacts to questions, suggestions and critical remarks in a serene and
constructive manner (5/7)
WEAKNESSES
- Lectures should more encourage reflecting and actively digesting the course material (7/7)- The knowledge and skills of the students should be more considered (7/7)- For some lectures, students indicate that what they have learned was only moderate. (6/7)- Students indicate that the lecture material (syllabus, hand book, texts, electronic documentation) for some courses
could be more conveniently arranged and understandable. (6/7)- Some lectures could be better structured (5/7)- The course material can sometimes be better explained (5/7)
InstructorProfessor C
-8
-6
-4
-2
0
2
4
6
8
Learning & Value Examinations &Assignments
LectureOrganization
Individual LecturerCharacteristics

33
Table 1: Student and teacher opinion on the importance of key dimensions and questionnaire items
Key dimensions & Questionnaire items Exp1 Exp2 Exp3 Exp4 … Exp29 Exp30 Exp31 Exp32 Average Min Max
Learning & Value 29 7 28 50 … 56 29 33 11 31.87% 7.00% 56.00%
- The lecturer justifies this part of the schooling in function of our formation. 30 5 30 30 … 10 10 20 30 21.97% 5.00% 50.00%
- In this part of the schooling I have learned a lot. 50 90 40 65 … 60 70 40 20 48.28% 20.00% 90.00%
- In general, I have a good impression of these lectures. 20 5 30 5 … 30 20 40 50 29.75% 5.00% 50.00%
Examinations & Assignments 35 27 11 25 … 22 29 11 22 23.69% 5.00% 57.00%
- The requirements and agreements concerning the exam evaluation are clear. 100 100 100 100 … 100 100 100 100 100.00% 100.00% 100.00%
Lecture Organization 24 33 39 19 … 11 29 28 33 22.07% 6.00% 39.00%
- The lectures takes into account my knowledge and skills. 8 10 15 10 … 20 7 10 5 14.06% 5.00% 30.00%
- The employed lecture material (syllabus, hand book, texts, electronic documentation) 20 30 25 20 … 20 23 10 20 21.72% 10.00% 30.00%
is conveniently arranged and understandable.
- During the lectures didactical equipment is functionally used (black board, 7 15 15 10 … 10 16 10 10 12.13% 5.00% 50.00%
transparents, video, computer, language practicum, laboratory,…).
- The lectures encourage reflecting and actively digesting the course material. 35 15 10 10 … 25 14 20 25 16.50% 9.00% 35.00%
- The lectures are well-structured. 15 10 20 25 … 15 25 30 25 19.84% 5.00% 30.00%
- The pace of the lecture. 15 20 15 25 … 10 15 20 15 15.75% 10.00% 30.00%
Individual Lecturer Characteristics 12 33 22 6 … 11 14 28 33 22.37% 5.00% 42.00%
- The lecturer reacts to questions, suggestions and critical remarks in a serene and 15 15 10 10 … 15 9 20 5 13.44% 5.00% 23.00%
constructive manner.
- The lecturer has good contacts with the students. 10 5 15 10 … 10 11 10 5 13.22% 5.00% 30.00%
- During the lectures one speaks sufficiently load and clear. 20 10 15 10 … 10 15 20 5 14.84% 5.00% 30.00%
- The lecturer treats each student with respect. 10 10 15 20 … 10 14 10 5 14.03% 5.00% 25.00%
- The lecturer gives useful examples, applications or exercises. 20 30 20 20 … 15 25 20 20 18.00% 5.00% 35.00%
- The lecturer explains the course material in a good way. 25 30 25 30 … 40 26 20 60 26.47% 10.00% 60.00%
34
Table 2: Course evaluations using equal weighting, average budget allocation weights, DEA weights and restricted DEA weights
Nr. Teacher Course Class Contact EW BA FW DEA DEA_R
… … … … … … … … …
8673 Professor B Micro Economics A 1BW 1 45 3.650 3.729 85.50% 79.25%
8674 Professor B Micro Economics B 1BW 2 30 3.697 3.805 86.19% 80.10%
9487 Professor B Micro Economics B 1DW 2 30 4.101 4.191 94.81% 88.14%
66607 Professor C Banks & Stock B 2JU 1 16 3.582 3.469 83.31% 73.58%
1421 Professor C Corporate finance 1EW 2 30 3.981 3.922 94.31% 83.05%
8522 Professor C Banks & Stock A 1BE 1 30 3.677 3.578 85.09% 75.72%
8636 Professor C Banks & Stock A 1BW 1 30 3.750 3.652 89.77% 78.02%
8911 Professor C Corporate finance 1EW 1 30 3.801 3.707 91.79% 78.84%
9029 Professor C Banks & Stock B 1LC 1 16 3.250 3.108 77.16% 65.99%
9157 Professor C Banks & Stock B 1SB 1 16 2.944 2.935 76.61% 64.14%
8927 Professor D Quantitative Methods 1EW 1 30 3.508 3.530 87.60% 75.22%
9583 Professor D Quantitative Methods 2LB 2 30 3.400 3.326 83.60% 71.28%
… … … … … … … … … 1: academic year 2005/2006; 2: academic year 2006/2007; EW = Equal Weighting; BA FW = Fixed BA weights; DEA = Full flexibility DEA-weighting; DEA_R = Restricted DEA-weighting with proportional virtual weight restrictions as in ( )6 and ( )7 .
35
Table 3a: Absolute contributions of the teaching dimensions and questionnaire items for Professor C
Key dimensions & Questionnaire items Ban
ks &
Sto
ck B
(66
607
)
Co
rpo
rate
Fin
anc
e (
142
1)
Ban
ks &
Sto
cks
A (
852
2)
Ban
ks &
Sto
cks
A (
863
6)
Co
rpo
rate
Fin
anc
e (
891
1)
Ban
ks &
Sto
ck B
(90
29
)
Ban
ks &
Sto
ck B
(91
57
)
(73.58%) (83.05%) (75.72%) (78.02%) (78.84%) (65.99%) (64.14%)
Learning & Value 0.1964 0.2216 0.2020 0.2082 0.2104 0.1760 0.1533
- The lecturer justifies this part of the schooling in function of our formation. 0.0589 0.0665 0.0606 0.0625 0.0105 0.0880 0.0766 - In this part of the schooling I have learned a lot. 0.0393 0.0443 0.0404 0.0416 0.0947 0.0352 0.0307
- In general, I have a good impression of these lectures. 0.0982 0.1108 0.1010 0.1041 0.1052 0.0528 0.0460
Examinations & Assignments 0.1307 0.1475 0.1345 0.1386 0.1401 0.1172 0.1899
- The requirements and agreements concerning the exam evaluation are clear. 0.1307 0.1475 0.1345 0.1386 0.1401 0.1172 0.1899
Lecture Organization 0.2030 0.2291 0.2088 0.2154 0.2177 0.1820 0.1768
- The lectures takes into account my knowledge and skills. 0.0101 0.0115 0.0104 0.0108 0.0109 0.0091 0.0088
- The employed lecture material (syllabus, hand book, texts, electronic documentation)
is conveniently arranged and understandable. 0.0203 0.0481 0.0209 0.0215 0.0218 0.0182 0.0177
- During the lectures didactical equipment is functionally used (black board,
transparents, video, computer, language practicum, laboratory,…). 0.0325 0.0115 0.0856 0.0883 0.0892 0.0746 0.0725
- The lectures encourage reflecting and actively digesting the course material. 0.0183 0.0206 0.0188 0.0194 0.0196 0.0164 0.0159
- The lectures are well-structured. 0.0609 0.0687 0.0104 0.0108 0.0109 0.0091 0.0088
- The pace of the lecture. 0.0609 0.0687 0.0627 0.0646 0.0653 0.0546 0.0531
Individual Lecturer Characteristics 0.2057 0.2321 0.2117 0.2182 0.2203 0.1844 0.1213
- The lecturer reacts to questions, suggestions and critical remarks in a serene and
constructive manner. 0.0473 0.0116 0.0487 0.0502 0.0507 0.0092 0.0279
- The lecturer has good contacts with the students. 0.0617 0.0116 0.0148 0.0109 0.0661 0.0092 0.0061
- During the lectures one speaks sufficiently load and clear. 0.0144 0.0697 0.0635 0.0655 0.0110 0.0092 0.0364
- The lecturer treats each student with respect. 0.0514 0.0580 0.0529 0.0545 0.0551 0.0461 0.0303
- The lecturer gives useful examples, applications or exercises. 0.0103 0.0580 0.0106 0.0109 0.0154 0.0092 0.0085
- The lecturer explains the course material in a good way. 0.0206 0.0232 0.0212 0.0262 0.0220 0.1015 0.0121
36
Table 3b: Percentage contributions of the teaching dimensions and questionnaire items for Professor C
Key dimensions & Questionnaire items Ban
ks &
Sto
ck B
(66
607
)
Co
rpo
rate
Fin
anc
e (
142
1)
Ban
ks &
Sto
cks
A (
852
2)
Ban
ks &
Sto
cks
A (
863
6)
Co
rpo
rate
Fin
anc
e (
891
1)
Ban
ks &
Sto
ck B
(90
29
)
Ban
ks &
Sto
ck B
(91
57
)
(73.58%) (83.05%) (75.72%) (78.02%) (78.84%) (65.99%) (64.14%)
Learning & Value 26.69% 26.69% 26.68% 26.68% 26.68% 26.67% 23.90% W
- The lecturer justifies this part of the schooling in function of our formation. 30.0% 30.0% 30.0% 30.0% 5.0% W 50.0% S 50.0% S
- In this part of the schooling I have learned a lot. 20.0% W 20.0% W 20.0% W 20.0% W 45.0% 20.0% W 20.0% W
- In general, I have a good impression of these lectures. 50.0% S 50.0% S 50.0% S 50.0% S 50.0% S 30.0% 30.0%
Examinations & Assignments 17.77% W 17.77% W 17.77% W 17.77% W 17.77% W 17.77% W 29.61% S
- The requirements and agreements concerning the exam evaluation are clear. 100.0% 100.0% 100.0% 100.0% 100.0% 100.0% 100.0%
Lecture Organization 27.59% S 27.59% S 27.59% S 27.59% S 27.59% S 27.59% S 27.59% S
- The lectures takes into account my knowledge and skills. 5.0% W 5.0% W 5.0% W 5.0% W 5.0% W 5.0% W 5.0% W
- The employed lecture material (syllabus, hand book, texts, electronic documentation)
is conveniently arranged and understandable. 10.0% W 21.0% 10.0% W 10.0% W 10.0% W 10.0% W 10.0% W
- During the lectures didactical equipment is functionally used (black board,
transparents, video, computer, language practicum, laboratory,…). 16.0% 5.0% W 41.0% 41.0% 41.0% 41.0% 41.0%
- The lectures encourage reflecting and actively digesting the course material. 9.0% W 9.0% W 9.0% W 9.0% W 9.0% W 9.0% W 9.0% W
- The lectures are well-structured. 30.0% S 30.0% S 5.0% W 5.0% W 5.0% W 5.0% W 5.0% W
- The pace of the lecture. 30.0% S 30.0% S 30.0% S 30.0% S 30.0% S 30.0% S 30.0% S
Individual Lecturer Characteristics 27.96% S 27.96% S 27.96% S 27.96% S 27.96% S 27.96% S 18.91%
- The lecturer reacts to questions, suggestions and critical remarks in a serene and
constructive manner. 23.0% S 5.0% W 23.0% S 23.0% S 23.0% S 5.0% W 23.0% S
- The lecturer has good contacts with the students. 30.0% S 5.0% W 7.0% 5.0% W 30.0% S 5.0% W 5.0% W
- During the lectures one speaks sufficiently load and clear. 7.0% 30.0% S 30.0% S 30.0% S 5.0% W 5.0% W 30.0% S
- The lecturer treats each student with respect. 25.0% S 25.0% S 25.0% S 25.0% S 25.0% S 25.0% S 25.0% S
- The lecturer gives useful examples, applications or exercises. 5.0% W 25.0% 5.0% W 5.0% W 7.0% 5.0% W 7.0%
- The lecturer explains the course material in a good way. 10.0% W 10.0% w 10.0% W 12.0% 10.0% W 55.0% 10.0% W

37
Table 4: faculty strengths and weaknesses
Key dimensions & Questionnaire items STRENGTH WEAKNESS
Learning & Value 2.83% 45.47%
- The lecturer justifies this part of the schooling in function of our formation. 59.62% 18.68%
- In this part of the schooling I have learned a lot. 10.00% 56.98%
- In general, I have a good impression of these lectures. 30.38% 34.34%
Examinations & Assignments 20.75% 51.70%
- The requirements and agreements concerning the exam evaluation are clear. - -
Lecture Organization 89.62% * 4.15%
- The lectures takes into account my knowledge and skills. 15.47% 72.45% *
- The employed lecture material (syllabus, hand book, texts, electronic
documentation) is conveniently arranged and understandable. 14.34% 74.15% *
- During the lectures didactical equipment is functionally used (black board,
transparents, video, computer, language practicum, laboratory,…). 0.75% 44.91%
- The lectures encourage reflecting and actively digesting the course material. 10.38% 81.7% *
- The lectures are well-structured. 19.43% 66.79% *
- The pace of the lecture. 99.25% * 0.38%
Individual Lecturer Characteristics 75.66% * 9.81%
- The lecturer reacts to questions, suggestions and critical remarks in a serene and
constructive manner. 40.38% 54.34%
- The lecturer has good contacts with the students. 29.81% 50.57%
- During the lectures one speaks sufficiently load and clear. 64.15% * 23.21%
- The lecturer treats each student with respect. 67.36% * 23.77%
- The lecturer gives useful examples, applications or exercises. 17.36% 58.30%
- The lecturer explains the course material in a good way. 2.26% 68.49% *
Copyright © 2022 FDOKUMEN