
Graduation tables: a proposal for a demographic analysis of educational indicators in Brazil
22
1 TEXTO PARA DISCUSSÃO N° 422 GRADUATION TABLES: A PROPOSAL FOR A DEMOGRAPHIC ANALYSIS OF EDUCATIONAL INDICATORS IN BRAZIL José Irineu Rangel Rigotti Renato Moreira Hadad Maio de 2011
Transcript of Graduation tables: a proposal for a demographic analysis of educational indicators in Brazil
1
TEXTO PARA DISCUSSÃO N° 422
GRADUATION TABLES: A PROPOSAL FOR A DEMOGRAPHIC ANALYSIS OF EDUCATIONAL INDICATORS IN
BRAZIL
José Irineu Rangel Rigotti Renato Moreira Hadad
Maio de 2011
2
Ficha catalográfica
R572g 2011
Rigotti, José Irineu Rangel.
Graduation tables : a proposal for a demographic analysis of educational indicators in Brazil / José Irineu Rangel Rigotti, Renato Moreira Hadad. – Belo Horizonte : UFMG/CEDEPLAR, 2011.
22 p. : il., gráfs. - (Texto para discussão, 422)
Inclui bibliografia. 1. Demografia - Brasil. 2. Indicadores educacionais. 3.
Desigualdades regionais. I. Hadad, Renato Moreira. II. Universidade Federal de Minas Gerais. Centro de Desenvolvimento e Planejamento Regional. III. Título. IV. Série.
CDD: 304.600981
Elaborada pela Biblioteca da FACE/UFMG - NMM 015/2011
3
UNIVERSIDADE FEDERAL DE MINAS GERAIS FACULDADE DE CIÊNCIAS ECONÔMICAS
CENTRO DE DESENVOLVIMENTO E PLANEJAMENTO REGIONAL
GRADUATION TABLES: A PROPOSAL FOR A DEMOGRAPHIC ANALYSIS OF EDUCATIONAL INDICATORS IN
BRAZIL*
José Irineu Rangel Rigotti CEDEPLAR/UFMG
Renato Moreira Hadad
PUC-Minas
CEDEPLAR/FACE/UFMG BELO HORIZONTE
2011
* Research for this paper was partially fund by INEP/CAPES/MEC (Observatório da Educação, Project nº 15), CNPq (Project
306775/2008-5), and FAPEMIG (Project APQ-02635-2008 and Project PPM-00282-10). Comments and discussions with Márcia Caldas were helpful to the definitions of some concepts.
Graduation Tables: A Proposal for a Demographic Analysis of Educational Indicators in Brazil - CEDEPLAR/UFMG - TD 422 (2011)
4
SUMÁRIO
1. INTRODUCTION ....................................................................................................................................... 6 2. FUNCTIONS OF THE “GRADUATION TABLE” ................................................................................. 11 3. DEMOGRAPHIC AND REGIONAL ANALYSIS OF THE BRAZILIAN SCHOOLING IN 2000 ....... 14 4. CONCLUDING REMARKS ..................................................................................................................... 20 REFERENCES .............................................................................................................................................. 22
Graduation Tables: A Proposal for a Demographic Analysis of Educational Indicators in Brazil - CEDEPLAR/UFMG - TD 422 (2011)
5
RESUMO
Geralmente, os censos demográficos contêm informações sobre um sistema de educação seriado, ou seja, declarações de idade e série. Estas informações podem ser usadas para estimar uma série de indicadores, úteis para diagnósticos e prognósticos do sistema educacional. Um dos objetivos principais deste trabalho é fornecer uma base técnica para a projeção de população por níveis de escolaridade, em uma região ou país. Este se insere na tradição das metodologias formais da demografia, utilizadas na análise e projeção de população, tais como as Tabelas de Vida. A técnica proposta pode auxiliar a avaliação dos prováveis resultados da aplicação de políticas educacionais relacionadas à promoção, repetência e evasão, no médio e longo prazos. Os procedimentos metodológicos foram aplicados para as cinco regiões brasileiras, embora ele possa ser aplicado a outros países ou regiões que tenham as informações de séries concluídas, por idade. ABSTRACT
Demographic censuses usually contain information about a graded education system, i.e. age and grade declarations. This information can be used to estimate a series of indicators, useful for diagnostics and prognostics of the educational system. One of the principal goals of this paper is to provide a new technical framework to forecast population by levels of schooling, in a country or region. It follows in the tradition of formal demographic methodologies used in analyzing and projecting population, such as Life Tables. Thus, one could study the probable social consequences of the implementation of any educational policies related to promotion and retention practices, over the medium and long runs. The methodological procedures were applied to the five Brazilian Regions, although it could be applied to other countries or regions that have the information of grades concluded by age.
Key Words: Demographic analysis, trends and forecast of educational indicators, regional inequalities JEL Classification: J11 - Demographic Trends and Forecasts
Graduation Tables: A Proposal for a Demographic Analysis of Educational Indicators in Brazil - CEDEPLAR/UFMG - TD 422 (2011)
6
1. INTRODUCTION
In spite of the great concern in diagnosing the levels of education in a variety of countries and regions, especially in underdeveloped areas, academic studies still need to develop appropriated methods to deal with demographic data. Moreover, in areas characterized by social, economic and regional inequalities the search for disaggregated information is particularly recurrent.
In Brazil, a promising field of studies has been attempted with the use of the so-called PROFLUXO Model, developed by Fletcher1 and Fletcher and Ribeiro2. This model is a class of the well-known “Transition Rate Models”, elaborated by UNESCO, in which the enrollments in a given year are related to the enrollments of the previous grades of the previous year. The transition rates describe the move of the students between grades year to year.
One of the greatest advantages of the PROFLUXO is that:
“Based upon age and grade declarations, together with optional classificatory variables (sex, region, income group, etc.), the model can be applied to virtually any census or large scale sample survey in any country in any year” (Fletcher and Ribeiro, 1989).
In summary, PROFLUXO is basically used to create a grade transition matrix, with
coefficients describing age-specific intake, promotion, repetition, and dropout in each grade.
PROFLUXO Model will not be described in detail, because we are not concerned in calculating the transition rates (promotion, repetition and dropout). One of the reasons is the PROFLUXO assumption of stability of the educational system, which does not hold anymore in Brazil and many Latin America countries, since the 90’s – certainly it is also true for many other underdeveloped regions. However, we will take into account the idea of considering a curve of graduation by age and grade. This will be the basis for a more detailed study of a series of educational indicators. The concepts developed in this article search for alternatives to the study of demand for and the levels of schooling in Brazil, in spite of being applicable in any country or region that have age and grade information. Thus, the paper principal aim is to suggest a new technique of demographic analysis for the diagnostic and prognostic of the schooling of regions with low levels of attendance among the grades of the educational system, illustrating with the particular case of Brazilian Regions.
From the Brazilian Demographic Census, for each of the 11 grades of Brazilian basic education3, it is possible to select the individuals of a given age enrolled in a specific grade as well as people of the same age having left school after concluding at least that grade. The frequencies of individuals by age having passed a given grade are accumulated with the previous grades – the people who graduated in a grade must be graduated in all the previous grades4. Then, we will obtain all the
1 FLETCHER, P.R. A mathematical model of school trajectory, repetition and performance of first level schooling in Brazil
(Brasília, DF: CNRH, 1985). 2 FLETCHER, P. R. and RIBEIRO, S. C. Modeling Education System Performance with Demographic Data: an introduction
to the Profluxo Model. 1989. 3 From 2004 on, Brazilian states began to implement the Basic Educational system of 12 years. 4 One grade completed corresponds to one year of schooling.

Graduation Tables: A Proposal for a Demographic Analysis of Educational Indicators in Brazil - CEDEPLAR/UFMG - TD 422 (2011)
7
individuals having passed the grade. In other words, students in the grade i+1, who completed the grade i, are added to all those having concluded their studies up to grade i.
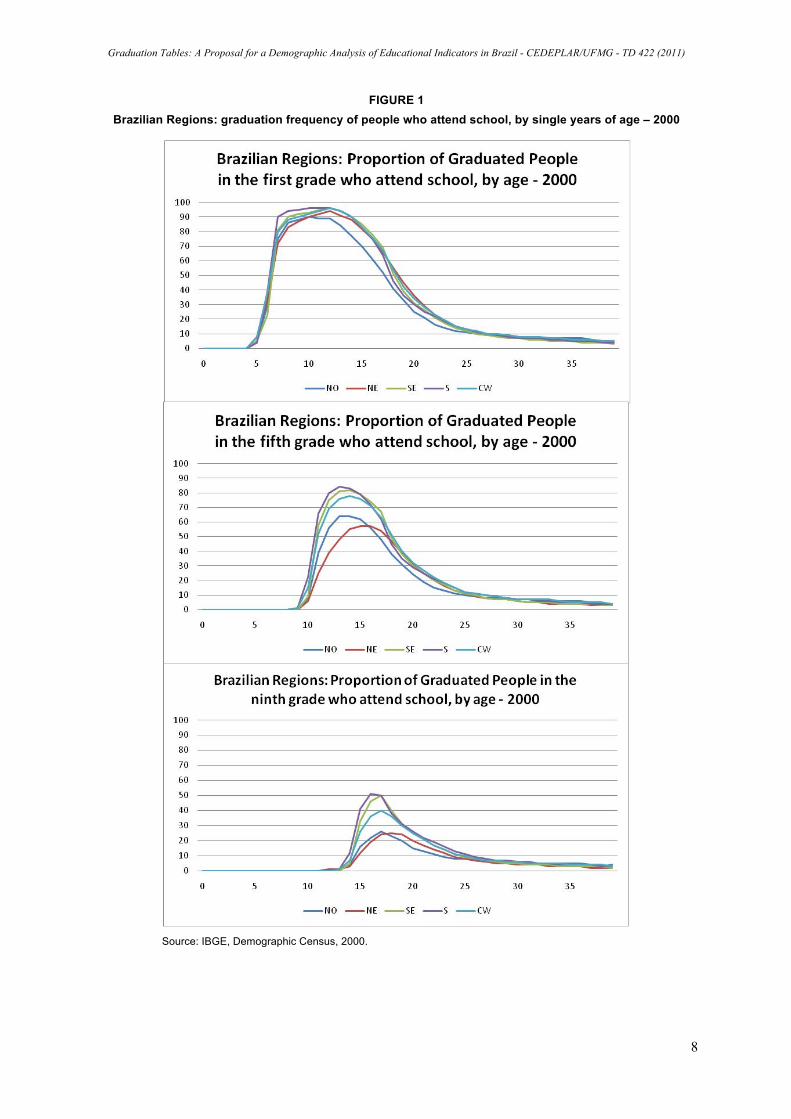
Figure 1 represents the frequency of graduated people attending school in the first, fifth and ninth grades, for the cases of five Brazilian Regions, from the Demographic Census of 2000. As showed in the Figure 1, almost all students completed the first grade in the Regions, except in the North, where less than 90% passed this grade. But the situation aggravate when considering the fifth grade, since only the South and the Southeast reach a little more than 80% of graduation around thirteen years old. Here we note the age-grade distortion, given that the ideal age would be eleven years old. In the North and in the Northeast the coverage and the late age are even worst.
The problem of the low schooling is showed clearly in the ninth grade, which summarizes the regional inequalities, since only half of the students reach the graduation with sixteen and seventeen years old in two regions (South and Southeast, respectively), while these figures are 40% in the Center-West and a approximately a quarter in the North and Northeast. If we consider that the correct age to be approved in this grade is sixteen years old, we realize the perversity of the educational system, i.e. just the “strongest” can reach that grade.
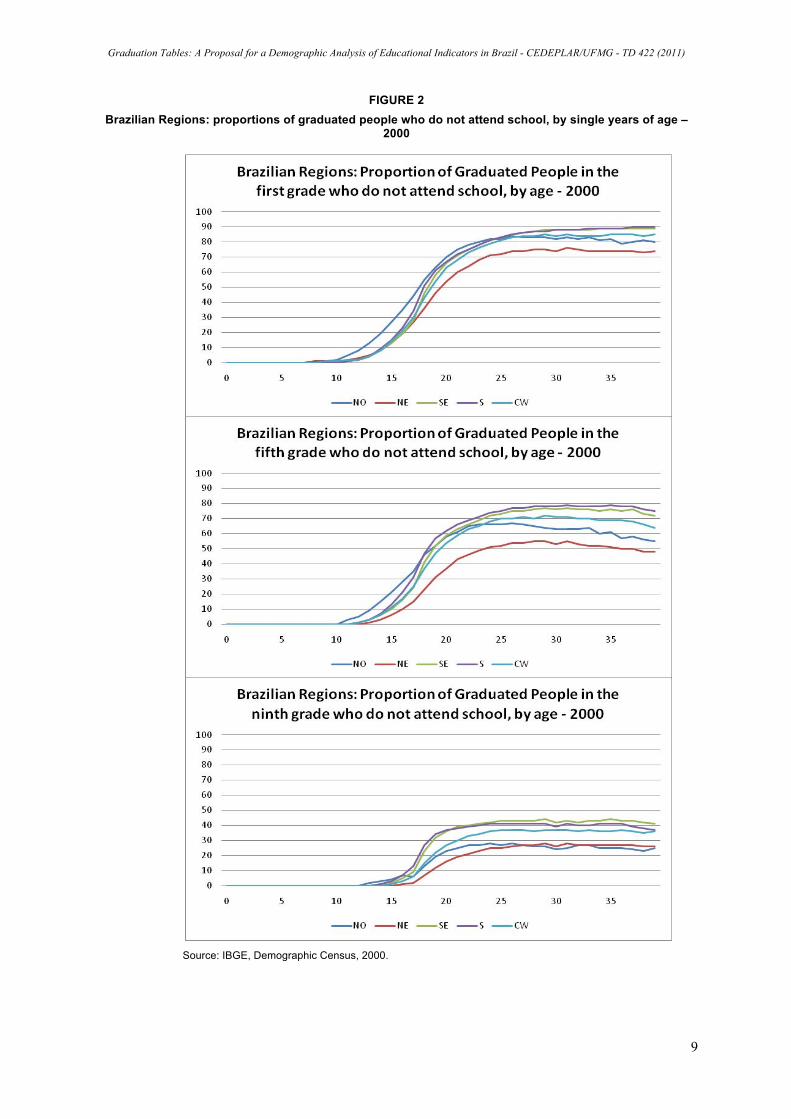
In the Figure 2 we have the proportion of graduated people who had left school, in each grade and year of age. In this case, we can observe a lower graduation in all grades and regions, compared with those people who still attended school. It occurs because the curves are reflecting the experiences of the past Brazilian educational system, when the survivors of older cohorts still attended school. Of course, the coverage of the system has improved, but it is far from ideal.
Graduation Tables: A Proposal for a Demographic Analysis of Educational Indicators in Brazil - CEDEPLAR/UFMG - TD 422 (2011)
8
FIGURE 1 Brazilian Regions: graduation frequency of people who attend school, by single years of age – 2000
Source: IBGE, Demographic Census, 2000.
Graduation Tables: A Proposal for a Demographic Analysis of Educational Indicators in Brazil - CEDEPLAR/UFMG - TD 422 (2011)
9
FIGURE 2 Brazilian Regions: proportions of graduated people who do not attend school, by single years of age –
2000
Source: IBGE, Demographic Census, 2000.
Graduation Tables: A Proposal for a Demographic Analysis of Educational Indicators in Brazil - CEDEPLAR/UFMG - TD 422 (2011)
10
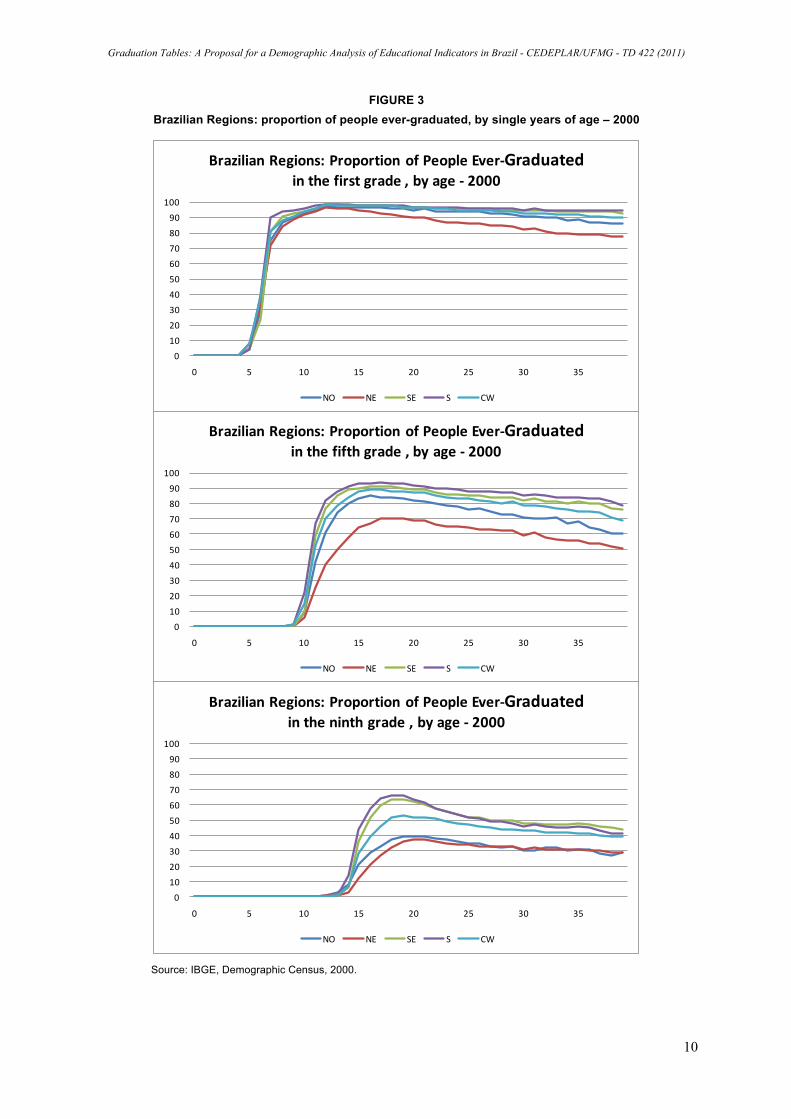
FIGURE 3 Brazilian Regions: proportion of people ever-graduated, by single years of age – 2000
0102030405060708090
100
0 5 10 15 20 25 30 35
Brazilian Regions: Proportion of People Ever-‐Graduatedin the first grade , by age -‐ 2000
NO NE SE S CW
0102030405060708090
100
0 5 10 15 20 25 30 35
Brazilian Regions: Proportion of People Ever-‐Graduatedin the fifth grade , by age -‐ 2000
NO NE SE S CW
0102030405060708090
100
0 5 10 15 20 25 30 35
Brazilian Regions: Proportion of People Ever-‐Graduatedin the ninth grade , by age -‐ 2000
NO NE SE S CW
Source: IBGE, Demographic Census, 2000.
Graduation Tables: A Proposal for a Demographic Analysis of Educational Indicators in Brazil - CEDEPLAR/UFMG - TD 422 (2011)
11
The merge of both proportions results in all the people ever-graduated by grade, as shown in the Fig. 3. The vertical axes of the curves represents the level of graduation in each grade, rising from an initial age up to a maximum, where the proportion begins a steadily decrease. This happens because the curve is assembling several cohorts, and also reflecting the experience of schooling in the past, when the coverage of the educational system was much lower. If we can not interpret this performance as cohort experience – the students will not lose education already attained –, we can take advantage of the known similarities in the age patterns of the proportion ever-graduated among Brazilian regions. Despite the social, economic and regional inequalities, Rigotti (2001) observed that the Brazilian regions have clear age patterns in terms of graduation by grades. The differences are due the age of access in a grade, the level of graduations, and the steepness with which the curves rise. Thus, this paper follows in the tradition of many demographic studies that search for empirical regularities, particularly in the age patterns, as mortality, fertility, migration or marriage (Coale and Trussel, 1996). Indeed, we have noticed the similarity between the proportions ever-married studied by Coale (1971) and the proportion ever-graduated focused in this paper.
We will take into account the proportion of people ever-graduated in each grade of the basic level – four years in the Primary School, four years in the Secondary School, and three years in the High School. In other words, it will be considered a hypothetical cohort5, without differences in the selectivity of migration and mortality by level of schooling.
The model in the next section can be considered a “Graduation Table”, an analogy to Life Tables. The proposed methodology will be applied to the five Brazilian Regions, even though it could be replicated in any country or region that contains declarations about grades completed and age.
2. FUNCTIONS OF THE “GRADUATION TABLE”
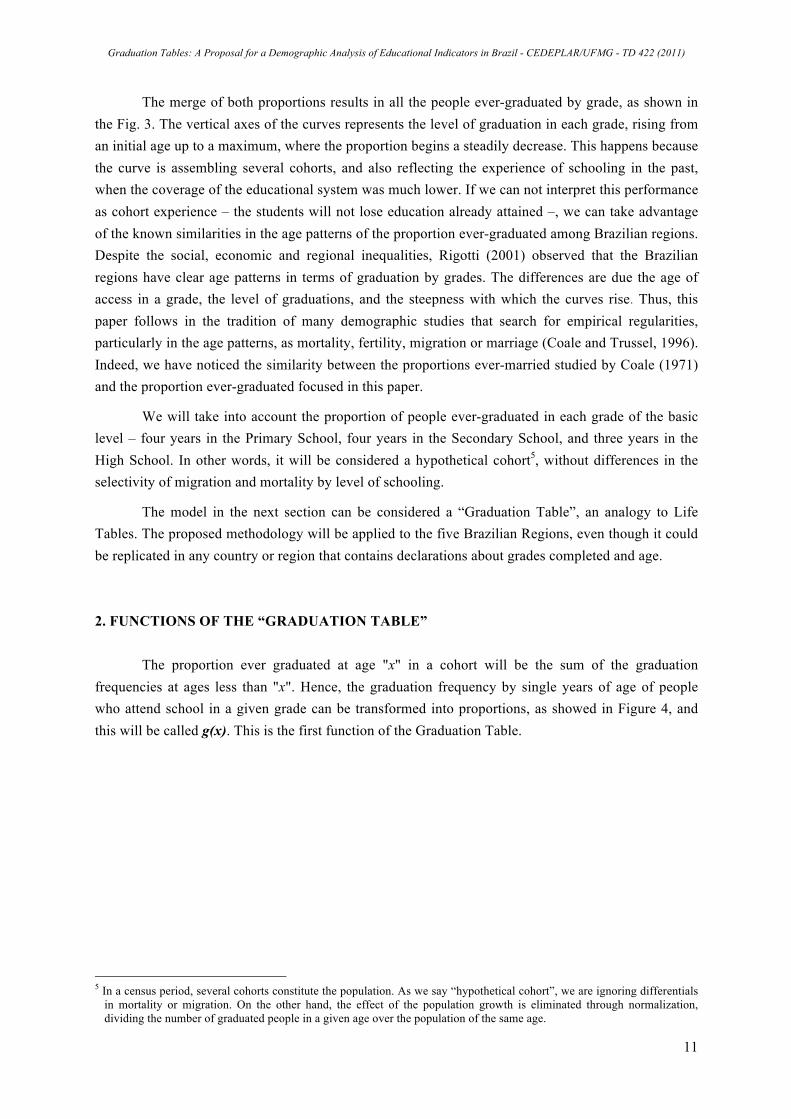
The proportion ever graduated at age "x" in a cohort will be the sum of the graduation frequencies at ages less than "x". Hence, the graduation frequency by single years of age of people who attend school in a given grade can be transformed into proportions, as showed in Figure 4, and this will be called g(x). This is the first function of the Graduation Table.
5 In a census period, several cohorts constitute the population. As we say “hypothetical cohort”, we are ignoring differentials
in mortality or migration. On the other hand, the effect of the population growth is eliminated through normalization, dividing the number of graduated people in a given age over the population of the same age.
Graduation Tables: A Proposal for a Demographic Analysis of Educational Indicators in Brazil - CEDEPLAR/UFMG - TD 422 (2011)
12
FIGURE 4 Functions of the Graduation Table
Next, we will describe each function that will estimate some educational indicators of the
Brazilian population.
The first step is smoothing or fitting a curve that represents the proportion of an age group that has passed a given grade i 6, the gi(x). Age-grade proportions represent the cumulative frequency distribution for graduated people by age and grade in a cohort. For cross-section data many cohorts are put together, reflecting their particular experiences of promotion, repetition and drop-out (there is a function for each of the four grades in the Primary School, four grades in the Secondary School, and 3 grades in the High School). The sequence of points g i(x) rises to a maximum, representing the flow of students passing grade i. After this point, the curve continues constant, i.e. there is no new graduation7.
From g i(x) one can calculate ixgr , the probability of graduating from age x to age x+n in a
given grade i:
(1) )(1
)()(xg
xgnxggr i
iiix −
−+=
Next, the curve g i(x) is cumulated (integrated) between the ages x to age x+n to yield the
person-years lived in the ever-graduated state (nGix) – see Figure 4. In a hypothetical cohort it can be
interpreted as the number of years lived as graduated for a person with at least i years of schooling (recall that each grade corresponds to one year of schooling):
(2) danx
x∫+
= g(x)G xi
n , being “a” variable of integration to differentiating it from x.
6 The expression “having passed a given grade” means “graduating from a grade” and denotes those who have successfully
completed a grade. 7 In a curve directly observed from the census, after the maximum, the line would fall down, because it expresses older
cohorts who obtained their schooling in past years.

Graduation Tables: A Proposal for a Demographic Analysis of Educational Indicators in Brazil - CEDEPLAR/UFMG - TD 422 (2011)
13
From age x to age w one have the expected number of years lived as graduated in a given grade i, the Ti
x. The w can be any age after the curve for the last grade has flattened - i.e. the age in which there is no person being graduated (the longer the age, more serious will be the age-grade distortion). Thus:
(3) dawx
x∫=
= g(x)T xi , being “a” variable of integration to differentiating it from x.
If one consider x’ as the ideal age for been graduated in grade i8, the number of years lived with at
least the grade i, from this particular age will be called x'iT . Hence this function can be calculated as
follow:
(4) )'(100T x'i
xw−×= , and in a perfect world everyone should be graduated in the correct age.
That is because this function only makes sense if x ≥ x’. The functions (3) and (4) allow one estimating the years of schooling lost from a given age x, by the hypothetical cohort:
(5) ix
ix
ix TTLT −= , for all x ≥ x’.
These procedures must be repeated for all 11 grades of Basic Education in Brazil.
The average of grades completed (or years of schooling) by the hypothetical cohort from age x’ to w (YS), correspondent to each educational degree, will be:
(6) YSPS = ( ) ( )∑ ∑= =
⎥⎦
⎤⎢⎣
⎡−−
8
1 ''
i
w
xx
ix xwxwT (Primary and Secondary School)
(7) YSHS = ( ) ( )∑ ∑= =
⎥⎦
⎤⎢⎣
⎡−−
11
9 ''
i
w
xx
ix xwxwT (High School)
(8) YSBE = ( ) ( )∑ ∑= =
⎥⎦
⎤⎢⎣
⎡−−
11
1 ''
i
w
xx
ix xwxwT (All Basic Education)
Where i corresponds to the grades and x’ is the appropriated age for that grade.
The last step is calculating the Promotion Ratio (Px,x+n), the probability of a person of age x (when occur maximum graduation) graduated in a given grade i completing subsequent grades i+n, at age x+n.
8 In 2000, the ideal age for being graduated was 8 years old for the first grade, 9 years old for the second grand and so on.
Graduation Tables: A Proposal for a Demographic Analysis of Educational Indicators in Brazil - CEDEPLAR/UFMG - TD 422 (2011)
14
(9) xi
1
ninx1
nxx, GG +
++ =P
The ideal situation to be reached by the education system is when the areas under the two consecutives curves equal 1 (one), that is, all the people would be graduated in both consecutive grades. From now on, we will undertake an analysis to assess how far the five Great Regions of Brazil are of the ideal educational indicators. 3. DEMOGRAPHIC AND REGIONAL ANALYSIS OF THE BRAZILIAN SCHOOLING IN
2000
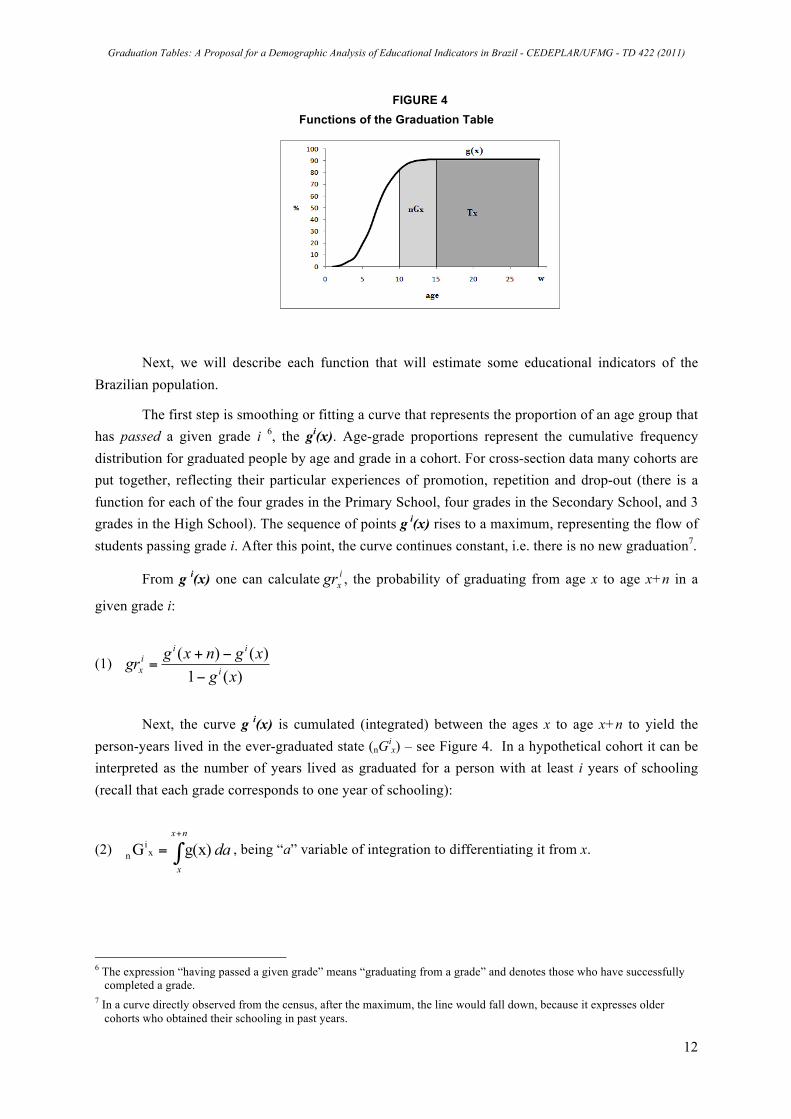
The next curves show, for the five Brazilian regions, the improvement in graduation of the educational system during decades. The observed curves rise to a maximum and then decline with the advancing age. After the maximum they represent the graduation of past years, when the older age cohorts completed their schooling. Graduation proportions are increasing over time - younger generations present much higher promotion, showing the changes of the educational system, as the increase of coverage and the decline of repetition.
FIGURE 6 Brazilian regions: Proportion of ever-graduated for grade one, by age, 2000
0
10
20
30
40
50
60
70
80
90
100
1 3 5 7 9 11 13 15 17 19 21 23 25 27 29 31 33 35 37 39
Region N -‐ cohort
Region N -‐ observed
Region NE -‐ cohort
Region NE -‐ observed
Region SE -‐ cohort
Region SE -‐ observed
Region S -‐ cohort
Region S -‐ observed
Region CW -‐ cohort
Region CW -‐ observed
The more advanced the grades, the larger will be the gap between the line corresponding to a hypothetical cohort and the line related to the observed population in the Brazilian Demographic Census of 2000. It is noticeable that in the first grades less developed regions have larger distances between the two curves, as North and Northeast (Figures 6). This occurs because poor areas had much lower coverage, as well as higher repetition.
Graduation Tables: A Proposal for a Demographic Analysis of Educational Indicators in Brazil - CEDEPLAR/UFMG - TD 422 (2011)
15
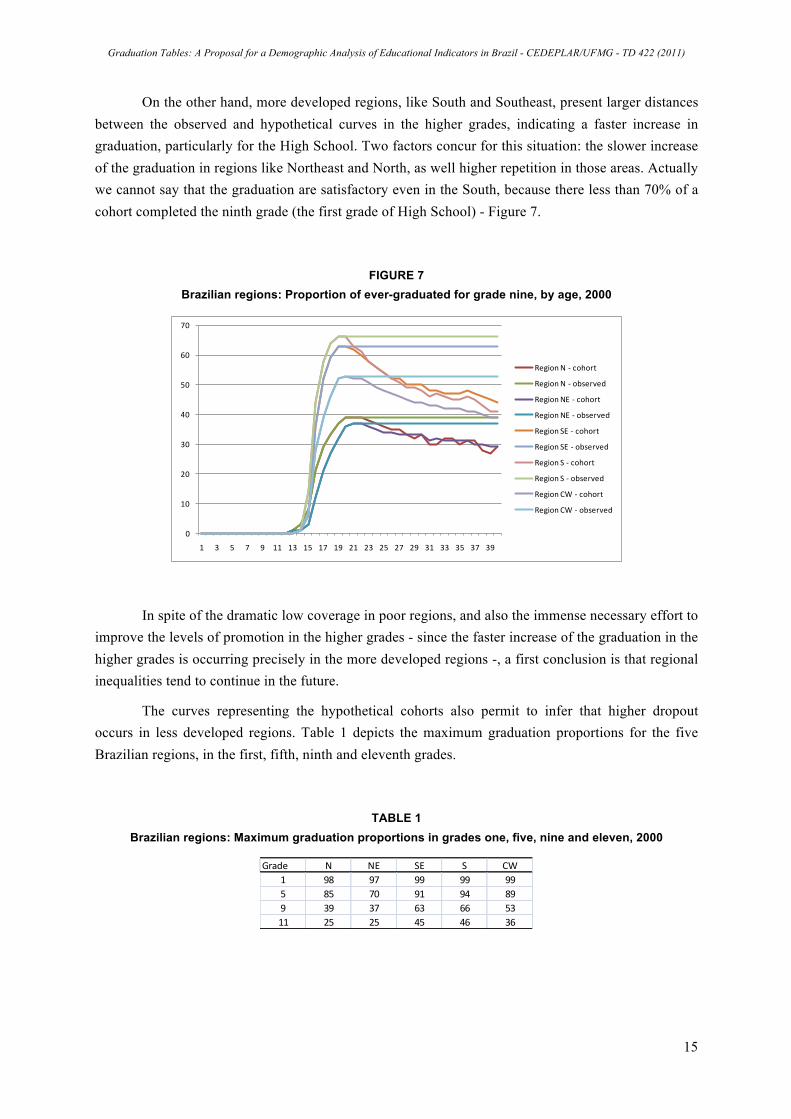
On the other hand, more developed regions, like South and Southeast, present larger distances between the observed and hypothetical curves in the higher grades, indicating a faster increase in graduation, particularly for the High School. Two factors concur for this situation: the slower increase of the graduation in regions like Northeast and North, as well higher repetition in those areas. Actually we cannot say that the graduation are satisfactory even in the South, because there less than 70% of a cohort completed the ninth grade (the first grade of High School) - Figure 7.
FIGURE 7 Brazilian regions: Proportion of ever-graduated for grade nine, by age, 2000
0
10
20
30
40
50
60
70
1 3 5 7 9 11 13 15 17 19 21 23 25 27 29 31 33 35 37 39
Region N -‐ cohort
Region N -‐ observed
Region NE -‐ cohort
Region NE -‐ observed
Region SE -‐ cohort
Region SE -‐ observed
Region S -‐ cohort
Region S -‐ observed
Region CW -‐ cohort
Region CW -‐ observed
In spite of the dramatic low coverage in poor regions, and also the immense necessary effort to improve the levels of promotion in the higher grades - since the faster increase of the graduation in the higher grades is occurring precisely in the more developed regions -, a first conclusion is that regional inequalities tend to continue in the future.
The curves representing the hypothetical cohorts also permit to infer that higher dropout occurs in less developed regions. Table 1 depicts the maximum graduation proportions for the five Brazilian regions, in the first, fifth, ninth and eleventh grades.
TABLE 1 Brazilian regions: Maximum graduation proportions in grades one, five, nine and eleven, 2000
Grade N NE SE S CW
1 98 97 99 99 995 85 70 91 94 899 39 37 63 66 5311 25 25 45 46 36
Graduation Tables: A Proposal for a Demographic Analysis of Educational Indicators in Brazil - CEDEPLAR/UFMG - TD 422 (2011)
16
At the first grade, Brazil almost has guaranteed universal coverage, since the proportion of graduated arrived at 97% in Northeast - the lowest proportion in 2000. Unfortunately, Brazil has demonstrated not being capable of ensuring the school for everybody up to the end of the basic level. Indeed, at the fifth grade the graduation drop to 94% in the South (the best performance) and 91% in the Southeast, near followed by the Center-West with 89%. North and Northeast present proportion of 85% and 70%, respectively.
The situation worsens as the grades progresses. At the ninth grade the graduation fall deeply, but vary across the regions. Again, the lowest levels take place in the Northeast and the North, where the proportions do not exceed 40%. An intermediary figure is found in Center-West, while the higher levels occur in the South and Southeast, even though they do not surpass 70%.
In 2000, only a quarter of a cohort was able to conclude the Basic Education in the Northeast and North. The graduation proportion of the eleventh grade in the Center-West did not exceed 36%, and the more developed regions, South and Southeast presented 46% and 45%, respectively. In other words, at the beginning of the new century not even half of the Brazilian population concluded the Basic Education. The situation is aggravated by the fact that the regional inequalities tend to be deeper, as indicated by the faster increase of the levels of graduation at higher grades in more developed regions9.
Another aspect of all the grades and regions considered refers to the age when the maximum of the graduation is reached. The lower is the proportion, the greater the age. This indicates a serious age-grade mismatch.
Now, we evaluate some other results of our model. For ease of comprehension we will focus the next analysis at the beginning of the Primary (grade one) and Secondary (grade eight) as well as at the beginning and the end of High School (grades nine and eleven, respectively).
9 Actually, the public policies implemented after 2000 had as condition the attendance at school. Probably this problem is
ameliorating currently, but this issue is not in the scope of this article.
Graduation Tables: A Proposal for a Demographic Analysis of Educational Indicators in Brazil - CEDEPLAR/UFMG - TD 422 (2011)
17
FIGURE 8 Probability of graduating in grades one, eight, nine and eleven, by age and Brazilian regions, 2000
0,00,10,20,30,40,50,60,70,80,91,0
4 5 6 7 8 9 10 11 12 13 14 15 16 17 18 19 20 21
Grade One
N NE SE S CO
0,00,10,20,30,40,50,60,70,80,91,0
4 5 6 7 8 9 10 11 12 13 14 15 16 17 18 19 20 21
Grade Eight
N NE SE S CO
0,00,10,20,30,40,50,60,70,80,91,0
4 5 6 7 8 9 10 11 12 13 14 15 16 17 18 19 20 21
Grade Nine
N NE SE S CO
0,00,10,20,30,40,50,60,70,80,91,0
4 5 6 7 8 9 10 11 12 13 14 15 16 17 18 19 20 21
Grade Eleventh
N NE SE S CO
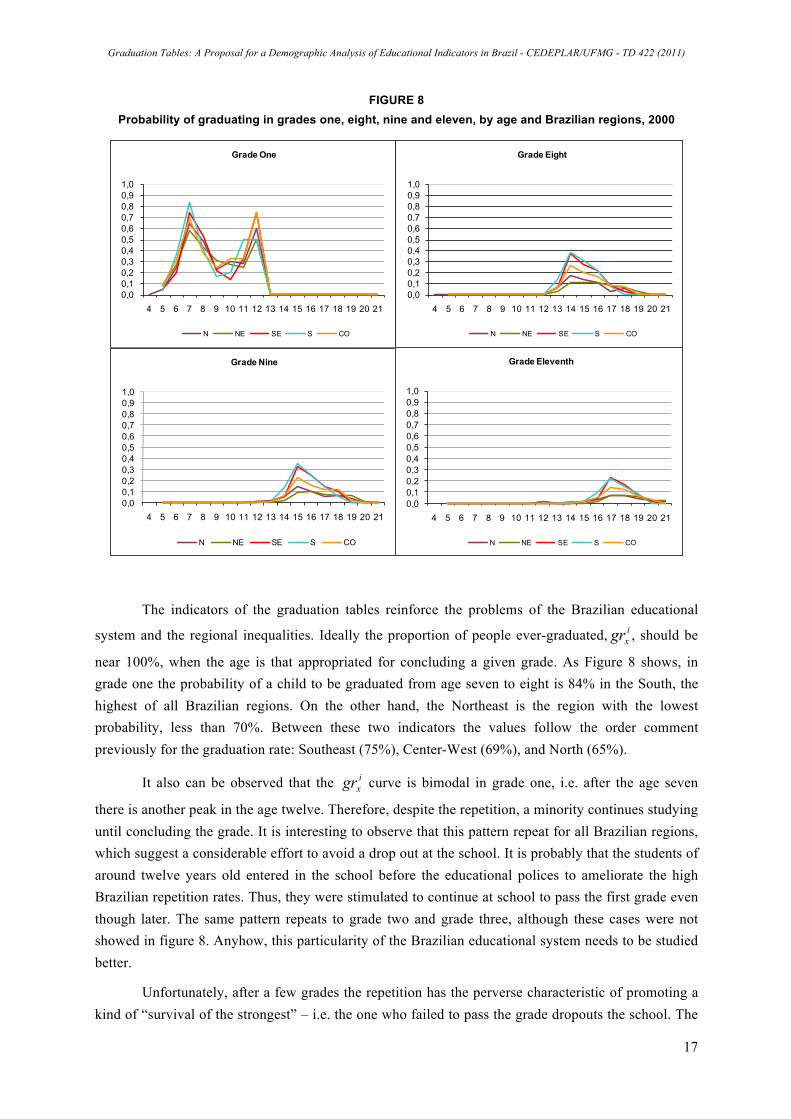
The indicators of the graduation tables reinforce the problems of the Brazilian educational
system and the regional inequalities. Ideally the proportion of people ever-graduated, ixgr , should be
near 100%, when the age is that appropriated for concluding a given grade. As Figure 8 shows, in grade one the probability of a child to be graduated from age seven to eight is 84% in the South, the highest of all Brazilian regions. On the other hand, the Northeast is the region with the lowest probability, less than 70%. Between these two indicators the values follow the order comment previously for the graduation rate: Southeast (75%), Center-West (69%), and North (65%).
It also can be observed that the ixgr curve is bimodal in grade one, i.e. after the age seven
there is another peak in the age twelve. Therefore, despite the repetition, a minority continues studying until concluding the grade. It is interesting to observe that this pattern repeat for all Brazilian regions, which suggest a considerable effort to avoid a drop out at the school. It is probably that the students of around twelve years old entered in the school before the educational polices to ameliorate the high Brazilian repetition rates. Thus, they were stimulated to continue at school to pass the first grade even though later. The same pattern repeats to grade two and grade three, although these cases were not showed in figure 8. Anyhow, this particularity of the Brazilian educational system needs to be studied better.
Unfortunately, after a few grades the repetition has the perverse characteristic of promoting a kind of “survival of the strongest” – i.e. the one who failed to pass the grade dropouts the school. The
Graduation Tables: A Proposal for a Demographic Analysis of Educational Indicators in Brazil - CEDEPLAR/UFMG - TD 422 (2011)
18
second chart in the Figure 8 represents this phenomenon. In grade eight we can see a more appropriate age-grade relationship. The modal age is fourteen years old, the correct one, but the levels of g(x) curves are far from ideal, since even in the South and Southeast the probability does not exceed 40%, while in the Northeast the value is little more than 10%.
The situation becomes more dramatic once we move forward in the series. The range in grade eleven varies between a maximum of 7% (Northeast) and 22% (South and Southeast). Once more, Center-West obtains an intermediary situation, i.e. 18%. Besides the very low probabilities, we also observe a considerable delay in concluding grade eleven in regions North and Northeast, where the curve is much more flat. In short, if the educational system does not considerably improve its transition from grade to grade not even a fifth of a cohort will conclude the basic education at the correct age.
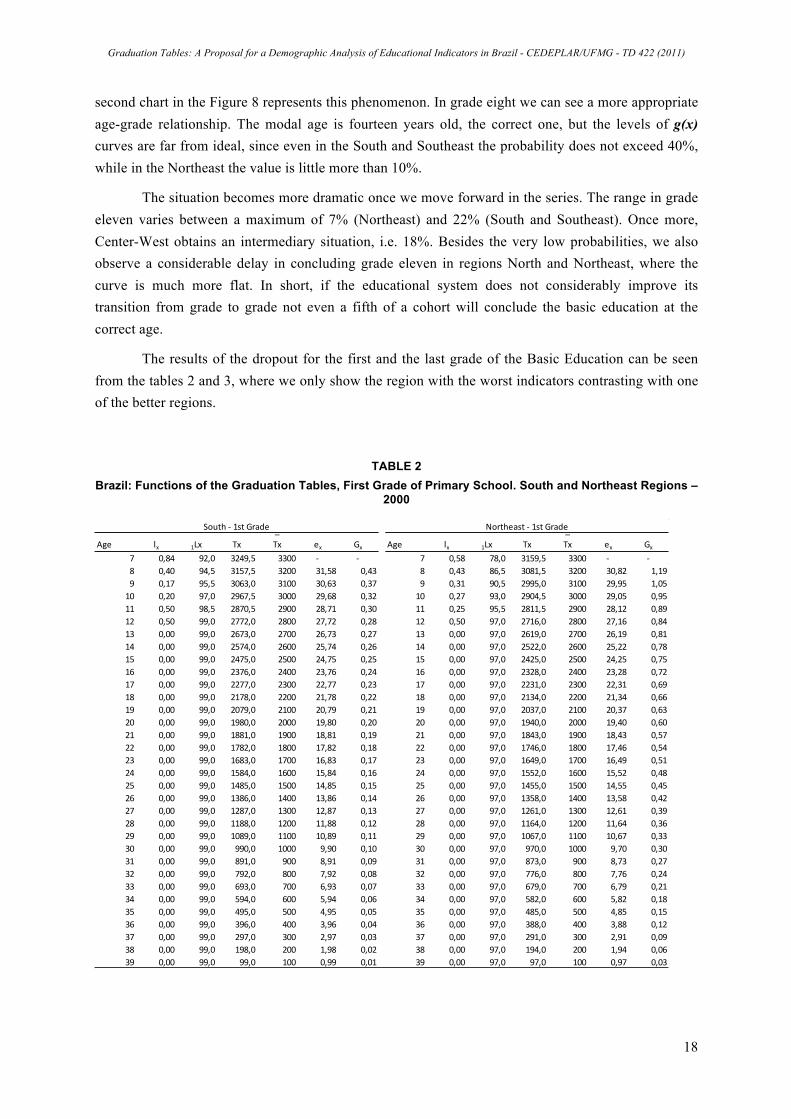
The results of the dropout for the first and the last grade of the Basic Education can be seen from the tables 2 and 3, where we only show the region with the worst indicators contrasting with one of the better regions.
TABLE 2 Brazil: Functions of the Graduation Tables, First Grade of Primary School. South and Northeast Regions –
2000
_ _Age lx 1Lx Tx Tx ex Gx Age lx 1Lx Tx Tx ex Gx
7 0,84 92,0 3249,5 3300 -‐ -‐ 7 0,58 78,0 3159,5 3300 -‐ -‐8 0,40 94,5 3157,5 3200 31,58 0,43 8 0,43 86,5 3081,5 3200 30,82 1,199 0,17 95,5 3063,0 3100 30,63 0,37 9 0,31 90,5 2995,0 3100 29,95 1,0510 0,20 97,0 2967,5 3000 29,68 0,32 10 0,27 93,0 2904,5 3000 29,05 0,9511 0,50 98,5 2870,5 2900 28,71 0,30 11 0,25 95,5 2811,5 2900 28,12 0,8912 0,50 99,0 2772,0 2800 27,72 0,28 12 0,50 97,0 2716,0 2800 27,16 0,8413 0,00 99,0 2673,0 2700 26,73 0,27 13 0,00 97,0 2619,0 2700 26,19 0,8114 0,00 99,0 2574,0 2600 25,74 0,26 14 0,00 97,0 2522,0 2600 25,22 0,7815 0,00 99,0 2475,0 2500 24,75 0,25 15 0,00 97,0 2425,0 2500 24,25 0,7516 0,00 99,0 2376,0 2400 23,76 0,24 16 0,00 97,0 2328,0 2400 23,28 0,7217 0,00 99,0 2277,0 2300 22,77 0,23 17 0,00 97,0 2231,0 2300 22,31 0,6918 0,00 99,0 2178,0 2200 21,78 0,22 18 0,00 97,0 2134,0 2200 21,34 0,6619 0,00 99,0 2079,0 2100 20,79 0,21 19 0,00 97,0 2037,0 2100 20,37 0,6320 0,00 99,0 1980,0 2000 19,80 0,20 20 0,00 97,0 1940,0 2000 19,40 0,6021 0,00 99,0 1881,0 1900 18,81 0,19 21 0,00 97,0 1843,0 1900 18,43 0,5722 0,00 99,0 1782,0 1800 17,82 0,18 22 0,00 97,0 1746,0 1800 17,46 0,5423 0,00 99,0 1683,0 1700 16,83 0,17 23 0,00 97,0 1649,0 1700 16,49 0,5124 0,00 99,0 1584,0 1600 15,84 0,16 24 0,00 97,0 1552,0 1600 15,52 0,4825 0,00 99,0 1485,0 1500 14,85 0,15 25 0,00 97,0 1455,0 1500 14,55 0,4526 0,00 99,0 1386,0 1400 13,86 0,14 26 0,00 97,0 1358,0 1400 13,58 0,4227 0,00 99,0 1287,0 1300 12,87 0,13 27 0,00 97,0 1261,0 1300 12,61 0,3928 0,00 99,0 1188,0 1200 11,88 0,12 28 0,00 97,0 1164,0 1200 11,64 0,3629 0,00 99,0 1089,0 1100 10,89 0,11 29 0,00 97,0 1067,0 1100 10,67 0,3330 0,00 99,0 990,0 1000 9,90 0,10 30 0,00 97,0 970,0 1000 9,70 0,3031 0,00 99,0 891,0 900 8,91 0,09 31 0,00 97,0 873,0 900 8,73 0,2732 0,00 99,0 792,0 800 7,92 0,08 32 0,00 97,0 776,0 800 7,76 0,2433 0,00 99,0 693,0 700 6,93 0,07 33 0,00 97,0 679,0 700 6,79 0,2134 0,00 99,0 594,0 600 5,94 0,06 34 0,00 97,0 582,0 600 5,82 0,1835 0,00 99,0 495,0 500 4,95 0,05 35 0,00 97,0 485,0 500 4,85 0,1536 0,00 99,0 396,0 400 3,96 0,04 36 0,00 97,0 388,0 400 3,88 0,1237 0,00 99,0 297,0 300 2,97 0,03 37 0,00 97,0 291,0 300 2,91 0,0938 0,00 99,0 198,0 200 1,98 0,02 38 0,00 97,0 194,0 200 1,94 0,0639 0,00 99,0 99,0 100 0,99 0,01 39 0,00 97,0 97,0 100 0,97 0,03
South -‐ 1st Grade Northeast -‐ 1st Grade
Graduation Tables: A Proposal for a Demographic Analysis of Educational Indicators in Brazil - CEDEPLAR/UFMG - TD 422 (2011)
19
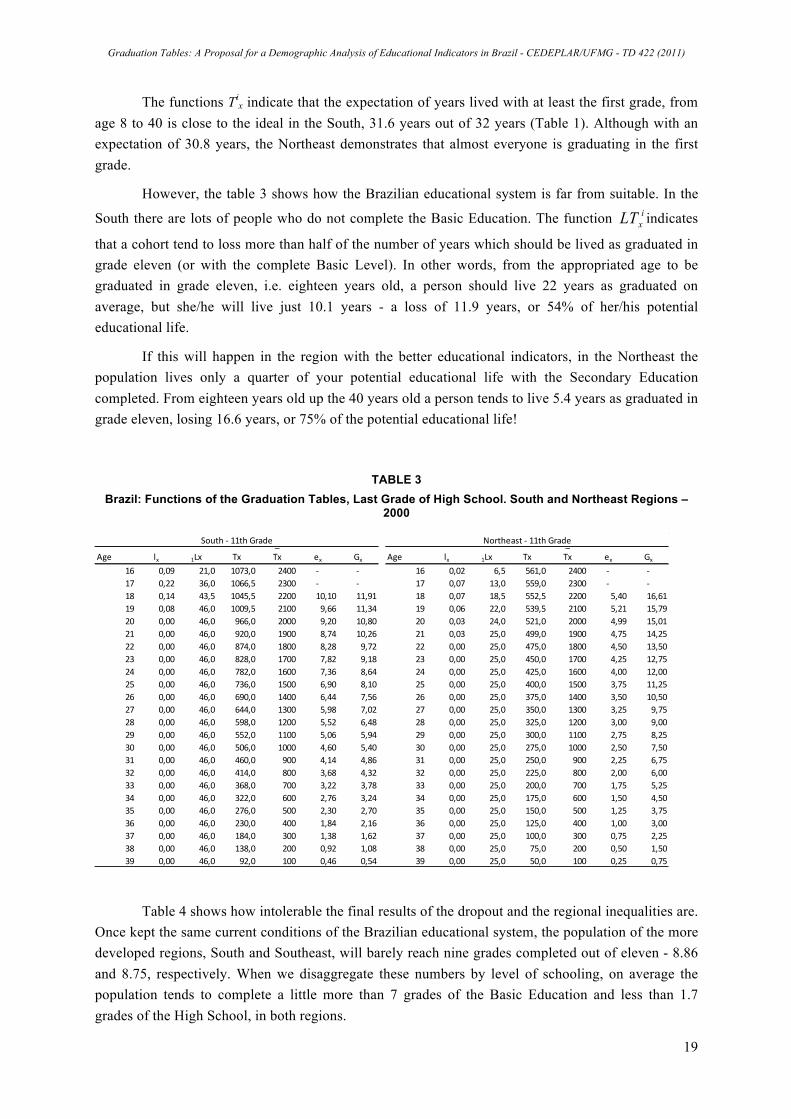
The functions Tix indicate that the expectation of years lived with at least the first grade, from
age 8 to 40 is close to the ideal in the South, 31.6 years out of 32 years (Table 1). Although with an expectation of 30.8 years, the Northeast demonstrates that almost everyone is graduating in the first grade.
However, the table 3 shows how the Brazilian educational system is far from suitable. In the
South there are lots of people who do not complete the Basic Education. The function ixLT indicates
that a cohort tend to loss more than half of the number of years which should be lived as graduated in grade eleven (or with the complete Basic Level). In other words, from the appropriated age to be graduated in grade eleven, i.e. eighteen years old, a person should live 22 years as graduated on average, but she/he will live just 10.1 years - a loss of 11.9 years, or 54% of her/his potential educational life.
If this will happen in the region with the better educational indicators, in the Northeast the population lives only a quarter of your potential educational life with the Secondary Education completed. From eighteen years old up the 40 years old a person tends to live 5.4 years as graduated in grade eleven, losing 16.6 years, or 75% of the potential educational life!
TABLE 3 Brazil: Functions of the Graduation Tables, Last Grade of High School. South and Northeast Regions –
2000
_ _Age lx 1Lx Tx Tx ex Gx Age lx 1Lx Tx Tx ex Gx
16 0,09 21,0 1073,0 2400 -‐ -‐ 16 0,02 6,5 561,0 2400 -‐ -‐17 0,22 36,0 1066,5 2300 -‐ -‐ 17 0,07 13,0 559,0 2300 -‐ -‐18 0,14 43,5 1045,5 2200 10,10 11,91 18 0,07 18,5 552,5 2200 5,40 16,6119 0,08 46,0 1009,5 2100 9,66 11,34 19 0,06 22,0 539,5 2100 5,21 15,7920 0,00 46,0 966,0 2000 9,20 10,80 20 0,03 24,0 521,0 2000 4,99 15,0121 0,00 46,0 920,0 1900 8,74 10,26 21 0,03 25,0 499,0 1900 4,75 14,2522 0,00 46,0 874,0 1800 8,28 9,72 22 0,00 25,0 475,0 1800 4,50 13,5023 0,00 46,0 828,0 1700 7,82 9,18 23 0,00 25,0 450,0 1700 4,25 12,7524 0,00 46,0 782,0 1600 7,36 8,64 24 0,00 25,0 425,0 1600 4,00 12,0025 0,00 46,0 736,0 1500 6,90 8,10 25 0,00 25,0 400,0 1500 3,75 11,2526 0,00 46,0 690,0 1400 6,44 7,56 26 0,00 25,0 375,0 1400 3,50 10,5027 0,00 46,0 644,0 1300 5,98 7,02 27 0,00 25,0 350,0 1300 3,25 9,7528 0,00 46,0 598,0 1200 5,52 6,48 28 0,00 25,0 325,0 1200 3,00 9,0029 0,00 46,0 552,0 1100 5,06 5,94 29 0,00 25,0 300,0 1100 2,75 8,2530 0,00 46,0 506,0 1000 4,60 5,40 30 0,00 25,0 275,0 1000 2,50 7,5031 0,00 46,0 460,0 900 4,14 4,86 31 0,00 25,0 250,0 900 2,25 6,7532 0,00 46,0 414,0 800 3,68 4,32 32 0,00 25,0 225,0 800 2,00 6,0033 0,00 46,0 368,0 700 3,22 3,78 33 0,00 25,0 200,0 700 1,75 5,2534 0,00 46,0 322,0 600 2,76 3,24 34 0,00 25,0 175,0 600 1,50 4,5035 0,00 46,0 276,0 500 2,30 2,70 35 0,00 25,0 150,0 500 1,25 3,7536 0,00 46,0 230,0 400 1,84 2,16 36 0,00 25,0 125,0 400 1,00 3,0037 0,00 46,0 184,0 300 1,38 1,62 37 0,00 25,0 100,0 300 0,75 2,2538 0,00 46,0 138,0 200 0,92 1,08 38 0,00 25,0 75,0 200 0,50 1,5039 0,00 46,0 92,0 100 0,46 0,54 39 0,00 25,0 50,0 100 0,25 0,75
South -‐ 11th Grade Northeast -‐ 11th Grade
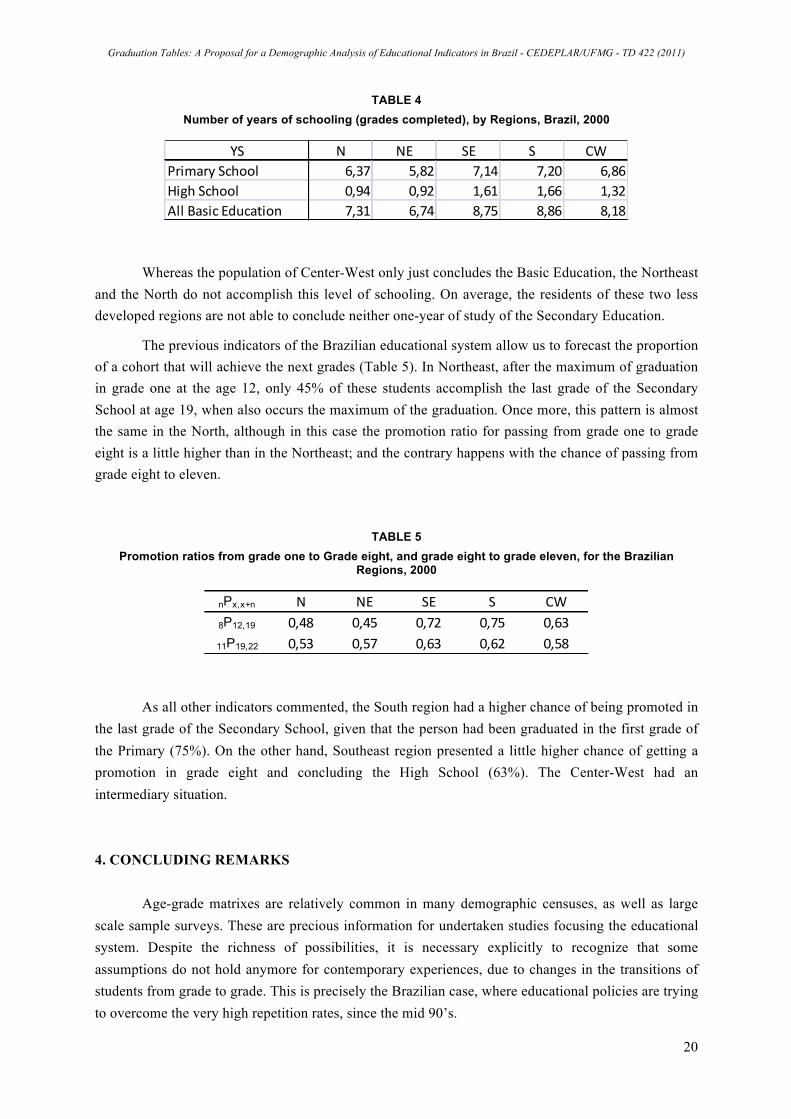
Table 4 shows how intolerable the final results of the dropout and the regional inequalities are. Once kept the same current conditions of the Brazilian educational system, the population of the more developed regions, South and Southeast, will barely reach nine grades completed out of eleven - 8.86 and 8.75, respectively. When we disaggregate these numbers by level of schooling, on average the population tends to complete a little more than 7 grades of the Basic Education and less than 1.7 grades of the High School, in both regions.
Graduation Tables: A Proposal for a Demographic Analysis of Educational Indicators in Brazil - CEDEPLAR/UFMG - TD 422 (2011)
20
TABLE 4 Number of years of schooling (grades completed), by Regions, Brazil, 2000
YS N NE SE S CW
Primary School 6,37 5,82 7,14 7,20 6,86High School 0,94 0,92 1,61 1,66 1,32All Basic Education 7,31 6,74 8,75 8,86 8,18
Whereas the population of Center-West only just concludes the Basic Education, the Northeast and the North do not accomplish this level of schooling. On average, the residents of these two less developed regions are not able to conclude neither one-year of study of the Secondary Education.
The previous indicators of the Brazilian educational system allow us to forecast the proportion of a cohort that will achieve the next grades (Table 5). In Northeast, after the maximum of graduation in grade one at the age 12, only 45% of these students accomplish the last grade of the Secondary School at age 19, when also occurs the maximum of the graduation. Once more, this pattern is almost the same in the North, although in this case the promotion ratio for passing from grade one to grade eight is a little higher than in the Northeast; and the contrary happens with the chance of passing from grade eight to eleven.
TABLE 5 Promotion ratios from grade one to Grade eight, and grade eight to grade eleven, for the Brazilian
Regions, 2000
nPx,x+n N NE SE S CW8P12,19 0,48 0,45 0,72 0,75 0,6311P19,22 0,53 0,57 0,63 0,62 0,58
As all other indicators commented, the South region had a higher chance of being promoted in the last grade of the Secondary School, given that the person had been graduated in the first grade of the Primary (75%). On the other hand, Southeast region presented a little higher chance of getting a promotion in grade eight and concluding the High School (63%). The Center-West had an intermediary situation. 4. CONCLUDING REMARKS
Age-grade matrixes are relatively common in many demographic censuses, as well as large scale sample surveys. These are precious information for undertaken studies focusing the educational system. Despite the richness of possibilities, it is necessary explicitly to recognize that some assumptions do not hold anymore for contemporary experiences, due to changes in the transitions of students from grade to grade. This is precisely the Brazilian case, where educational policies are trying to overcome the very high repetition rates, since the mid 90’s.
Graduation Tables: A Proposal for a Demographic Analysis of Educational Indicators in Brazil - CEDEPLAR/UFMG - TD 422 (2011)
21
From a methodological point of view, the instability of the Brazilian educational system ask for new approaches taking into account the impossibility of considering it stable. On the other hand, the advances of demographical techniques in fields like mortality, fertility or marriage were not followed by the educational studies. Our paper makes an effort to contribute for shedding lights to this matter, maybe the most important issue in less developed and extremely unequal countries like Brazil.
Although we did not have focused in the critical problem of the quality of the Brazilian educational system, the indicators proposed showed how the country was far from the social justice in terms of schooling. In the less developed regions, the intake at school is delayed, condemning many young students to start in disadvantage. Besides the efforts to beat the repetition and public policies to transfer income - to a certain extent successful - Brazil is ahead of a long way to run. The dropout is still very high and to achieve the most advanced grades is a privilege for a few.
We used the information from Brazilian census of 2000, a decade ago. Some changes are on the way, but recent research reveal that the school, particularly the High School, is far from interesting for Brazilian youngsters. Unquestionably, the dropout is a strong obstacle to be defeated. As the indicators of our model showed, the regional inequalities need to be taken into account, urgently and seriously. Indeed, the increase in coverage - particularly in the higher grades - and the progress among grades occurs faster in the more developed regions. Moreover, the chances to conclude the High School are lower in poor regions, particularly in the North. This is a perverse reflex of the inequalities in Brazil.
Finally, a few words should be said about our model. Like a new technique, it needs a series of refinements, especially to deal with the less populated geographical units. Attempts to smoothing or fitting the curves of the graduation proportion are necessary. As a first application, we are conscious that many ideas discussed here need to be depth. One of them will be simulate the impacts of possible changes in educational policies, as the reduction of dropout on the number of years of schooling, in a given region. Even the indicators discussed in this paper can be better exploited. For example, once available projections of population by age we can use the graduation ratio to forecast the human capital.
Graduation Tables: A Proposal for a Demographic Analysis of Educational Indicators in Brazil - CEDEPLAR/UFMG - TD 422 (2011)
22
REFERENCES COALE, A., TRUSSELL, J. The development and use of demographic models. Population Studies,
Vol. 50, No. 3, Nov., 1996, pp. 469-484.
COALE, A. Age Patterns of Marriage. Population Studies, Vol. 25, No. 2, july, 1971, pp. 193-214.
FLETCHER, P.R. A mathematical model of school trajectory, repetition and performance of first level schooling in Brazil (Brasília, DF: CNRH, 1985).
FLETCHER, P. R. and RIBEIRO, S. C. Modeling Education System Performance with Demographic Data: an introduction to the Profluxo Model. 1989.
RIGOTTI, J. I. R. A transição da escolaridade no Brasil e as desigualdades regionais. Revista Brasileira de Estudos Populacionais. ABEP, Campinas, v.18, n.1/2, 2001, p.59-73.