Graduated Driver Licensing in Georgia: The Impact of the Teenage and Adult Driver Responsibility Act...
50
-
Upload
independent -
Category
Documents
-
view
0 -
download
0
Transcript of Graduated Driver Licensing in Georgia: The Impact of the Teenage and Adult Driver Responsibility Act...


Technical Report Documentation Page 1. Report No. 2. Government Accession No. 3. Recipient’s Catalog No.
DOT HS 810 715 4. Title and Subtitle 5. Report Date
February 2007 6. Performing Organization Code
Graduated Driver Licensing in Georgia: The Impact of the Teenage and Adult Driver Responsibility Act (TADRA)
7. Author(s)
A. L. Kellermann, MD, MPH; A. Rios, BS; M. Wald, MLS, MPH; S. R. Nelson, MPH;K. Dark, BS, M.E. Price, M.S.
8. Performing Organization Report No.
9. Performing Organization Name and Address 10. Work Unit No. (TRAIS)
11. Contract or Grant No.
Department of Emergency Medicine and The Emory Center for Injury Control Emory University School of Medicine 531 Asbury Circle---Annex—Suite N340 Atlanta, GA 30322 DTNH22-03-H-05147
12. Sponsoring Agency Name and Address 13. Type of Report and Period Covered
Final Report 14. Sponsoring Agency Code
National Highway Traffic Safety Administration 400 Seventh Street SW. Washington, DC 20590 15. Supplementary Notes
Paul J. Tremont, Ph.D was the Contracting Officer’s Technical Representative for this project.
16. Abstract
The effectiveness of The Teenage and Adult Driver Responsibility Act (TADRA) passed by the Georgia legislature in 1997, in reducing fatal crashes among 16-year-old drivers was examined using the Fatality Reporting System. Results showed that during the first 5 1/2 years following the enactment of TADRA, the average annual driver crash rate for 16-year-olds declined 36.8 percent. When these data are compared to three bordering states that did not enact similarly restrictive legislation on 16-year-old drivers, the rate in Georgia (following TADRA enactment) was 34 percent lower than in Tennessee, 32 percent lower than in Alabama, and 18 percent lower than in South Carolina, although prior to the enactment of TADRA in Georgia, these states all had similar fatal crash rates among 16 year-old drivers. This finding strongly suggests that TADRA was responsible for the reduction in crash rate observed in Georgia.
17. Key Words 18. Distribution Statement
Graduated Driver Licensing, TADRA, Georgia, fatal crash rates, 16-year-old drivers, Fatality Analysis Reporting System
Copy available from the NHTSA webpage: www.nhtsa.dot.gov.
19 Security Classif. (of this report) 20. Security Classif. (of this page) 21 No. of Pages 22. Price
Unclassified Unclassified 43
Form DOT F 1700.7 (8/72)

Graduated Driver Licensing in Georgia
The Impact of the Teenage and Adult Driver Responsibility Act (TADRA)
Arthur L. Kellermann, M.D., M.P.H.
Angelyn Rios, B.S.
Marlena Wald, M.L.S., M.P.H.
Sascha R. Nelson, M.P.H.
Kimberly J. Dark, B.S.
Megan Emily Price, M.S.
Conducted for the National Highway Traffic Safety Administration, U.S. Department of Transportation, Under Cooperative Agreement Award No.
DTNH22-03-H - 05147
From the Department of Emergency Medicine
and The Emory Center for Injury Control Emory University School of Medicine
531 Asbury Circle – Annex Suite N340
Atlanta, Georgia, 30322
March 3, 2006
1

Executive Summary
In response to a series of widely publicized fatal crashes involving teenaged drivers, the Georgia General Assembly passed the Teenage and Adult Driver Responsibility Act, known as TADRA, during its 1997 legislative session. The law took effect in July of the same year. TADRA was subsequently strengthened by Georgia’s General Assembly in 2001. In addition to introducing graduated driver’s licensing in Georgia, TADRA imposed additional restrictions on young drivers. These include “zero tolerance” for DUI and automatic license revocation for excessive speeding and other dangerous driving behaviors. To assess the impact of TADRA, we analyzed fatal crash data by driver age in Georgia for 5 ½ years before enactment of TADRA, and 5 ½ years afterward. To control for historical effects, we compared Georgia’s experience to that of three neighboring States that did not enact equally comprehensive legislation during the study period. During the final 5 ½ years before TADRA was enacted (January 1, 1992, to June 30, 1997): • A total of 317 Georgia drivers age 16 were involved in fatal crashes. This represents an average annual
driver fatal crash rate of 57.0 per 100,000 16-year-olds. • The average annual fatal crash rate involving Georgia drivers 16 years old was 77 percent higher than that
of Georgia drivers 25 and older. • The average annual fatal crash rates of drivers 17 to 24 was more than 50 percent higher than that of
Georgia drivers 25 and older. • Unsafe or illegal speed was the most prevalent contributing factor in fatal crashes involving 16-year-old
Georgia drivers. Fully 35.6 percent of fatal crashes in this age group during the pre-TADRA period involved “unsafe or illegal speed.”
During the first 5 ½ years after TADRA was enacted (July 1, 1997, to December 31, 2002): • 230 Georgia drivers age 16 were involved in fatal crashes. This represents an average annual driver fatal
crash rate of 36.1 per 100,000 16-year-olds. Compared to the 5 ½ years prior to enactment of TADRA, the average annual rate of fatal crashes involving 16-year-old drivers decreased 36.8 percent.
• The average annual fatal crash rate of Georgia drivers age 16 was only 12.8 percent higher than that of
Georgia drivers 25 and older. • Speed-related fatal crashes involving 16-year-old Georgia drivers were cut by 42 percent, and alcohol-
related fatal crashes were reduced by nearly 60 percent without displacing fatal crashes to older age groups. • The first cohort of Georgians to grow up under TADRA (i.e., those who reached age 21 in 2002)
experienced an annual rate of fatal crashes 38 percent lower than drivers who reached age 21 in 1997, the year TADRA was enacted. Georgia drivers who reached age 21 in 2002 and were involved in a fatal crash that year were substantially less likely than their age-matched peers in 1997 to: (a) have a prior record of speeding; (b) have been previously convicted of DUI, or (c) have a prior license suspension for hazardous driving. These observations suggest that TADRA may exert lasting favorable effects on driver behavior.
2

Table of Contents Introduction 5 Methods Data Sources 5 Georgia’s TADRA Law 6 Data Analysis 7 Statistical Considerations 8 Results Driver Fatal Crashes 8 Speed-Related Fatal Crashes 10 Alcohol-Involved Fatal Crashes 11 Fatal Crashes by Time of Day 12 Seat Belt Use 12 Georgia’s Experience Compared to Three Adjoining States 13 Does TADRA Continue to Influence Behavior of Drivers After They Reach Age 21? 16 Discussion Background 17 The Current Study 18 Confounding Effects 19 Why Is TADRA So Effective Among 16-Year-Olds? 19 A Potential Cohort Effect 20 Comparison to Neighboring Southeastern States 20 Final Observations 21 Acknowledgements 23 References 24 Appendices Appendix 1: Peer-Reviewed Evaluations of State Graduated Licensing Laws 26 Appendix 2: Comparisons of GDL Laws for the States of Georgia, Alabama, South 27 Carolina, and Tennessee Appendix 3: Legal Sources Cited 31 Appendix 4: Data Tables 33 Appendix 5: Year-by-Year Teen Fatal Crash Rates for Georgia, Alabama, South 40
Carolina, and Tennessee 1992 – 2002
3

4

Introduction Young drivers are involved in fatal motor vehicle crashes at substantially higher rates than older drivers.1-3 This is probably the result of driver inexperience and the well-known tendency of many teens to engage in high-risk behavior, including risky driving.4-9 In an effort to reduce fatal crashes involving teenage drivers, many States have enacted conditional, or “graduated” driver licensing (GDL) laws.10-13 As of March 2005, 41 States and the District of Columbia had implemented GDL systems that include all three recommended stages -- a supervised learner’s period, an intermediate license for a specified period of time, followed by issuance of a full-privilege driver’s license.14 Despite these core similarities, State systems vary by the number and strictness of their provisions. To date, GDL laws have been evaluated in just a few States, including California, Connecticut, Florida, Kentucky, Michigan, North Carolina, Ohio, Pennsylvania, and Utah, with widely varying effects (Appendix 1).15-20
Responding to a series of highly publicized fatal crashes involving teen drivers, and with the strong encouragement of (then) Governor Zell Miller, the 1997 session of the Georgia General Assembly implemented a comprehensive package of measures designed to reduce fatal crashes involving teens. The law, entitled the Teenaged and Adult Driver Responsibility Act (TADRA) was passed with bipartisan support, quickly signed by the Governor, and took effect in July, 1997.21-23 In addition to addressing driver inexperience through introduction of graduated driver licensing, TADRA carried additional provisions aimed at two other important causes of fatal crashes involving young drivers – impaired driving and excessive speed. A formative assessment of the law’s impact six months following implementation suggested that it immediately produced beneficial effects among 16 and 17-year-old drivers.24 However, this evaluation was limited by its short follow-up interval. To determine if TADRA’s impact was both real and sustained, we analyzed data from the National Highway Traffic Safety Administration’s Fatality Analysis Reporting System (FARS) during the 5-½-year period immediately prior to enactment of TADRA (i.e., January 1, 1992, to June 30, 1997) and compared this to the State’s experience during the first 5 1/2 years following enactment (July 1, 1997, to December 31, 2002). To determine if any change in age-specific fatality rates was due to historical or regional effects, we compared Georgia’s experience with that of Alabama, South Carolina, and Tennessee – three States that did not enact similarly comprehensive legislation during the study interval. (Appendix 2)
Methods Data sources Data on fatal crashes in Georgia and the three comparison States were obtained from the National Highway Traffic Administration’s Fatality Analysis Reporting System. FARS is a national database of crashes in the United States occurring on public roadways that result in one or more deaths within 30 days of the crash. It includes over 180 driver, vehicle, scene, and crash variables. To assess TADRA’s effects over a prolonged period of time, crash data was analyzed over an 11-year period – 1992 through 2002. This allowed us to compare driver fatal crash rates during the final 5 1/2 years before enactment of TADRA to the first 5 1/2 years after enactment of the law.
5
For our analysis, a "driver fatal crash" was defined as a motor vehicle crash involving a driver of a given age in which a fatality occurred to any occupant of any vehicle involved in the crash or a pedestrian struck by the driver's vehicle. Under this definition, a "driver fatal crash" could involve the driver or another occupant of the driver's vehicle, an occupant of the vehicle struck by the driver's vehicle, a pedestrian, or multiple victims of the same crash. To calculate rates of “driver fatal crashes” by age group, we obtained population data from the U.S. Census Bureau for 1992-2002 “Estimates of the Population of the U. S. and States by Single Year of Age and Sex”. All rates presented are annual rates. Seat belt usage for vehicle occupants in fatal crashes was obtained from the FARS database and reflects usage as recorded on the fatal crash reports filed by the investigating law enforcement officers. Georgia’s TADRA law Georgia’s TADRA law targets three major factors associated with fatal crashes involving young drivers -- inexperience, alcohol-impaired driving, and excessive speed. Graduated licensing – In Georgia, a provisional, Class D license is issued to an individual who is at least age 16 and who has held a valid Instruction Permit for 12 months, and who during the preceding 12 months has not been convicted of DUI, hit-and-run, leaving the scene of an accident, or any offense for which four or more points are assessed. To receive a Class D license, an applicant must either complete an approved driver education course and a total of 20 hours of supervised driving (including 6 hours at night) or complete 40 hours of supervised driving with at least 6 of these occurring at night. When TADRA was enacted in 1997, a Class D license did not allow an individual to drive between 1 a.m. and 5 a.m. unless the driver was going to work, a school event, a religious activity, or a medical, fire, or law enforcement emergency. In 2001, this provision was significantly toughened to extend the curfew hours to between midnight and 6 a.m., and the curfew exemptions were rescinded. Class D license holders cannot legally drive with more than three passengers under the age of 21 who are not members of their immediate family. During the first six months of conditional licensing, the driver’s passengers can only be members of the driver’s immediate family. Class D restrictions remain in effect until age 18, when a unrestricted Class C License can be obtained if the driver has held a valid Class D license for at least 12 months and has not been convicted of DUI, hit-and-run, leaving the scene of an accident, or any offence for which four or more points are assessed. No Georgian under age 18 is issued an instructional permit or a provisional driver’s license unless they are enrolled in or have graduated from high school, have a parent’s permission to withdraw from school, or have received a GED. The Instructional Permit or driver’s license is suspended if an individual under 18 drops out of school without parental permission, misses 10 consecutive days of school without an excuse, or is suspended from school for threatening or striking a teacher or school employee, possessing drugs or alcohol on school property, or possessing a weapon on school property.
6

Zero tolerance of DUI – Under TADRA, any individual under 21 found to have a blood alcohol concentration (BAC) of .02 grams per deciliter or more at any time within three hours of driving is deemed guilty of driving under the influence (DUI). Georgians guilty of DUI automatically forfeit their driver’s licenses for a minimum of six months. In Georgia, a first DUI conviction can also result in significant monetary penalties, jail time, and mandatory community service. Individuals under 21 who are convicted of DUI must reapply and be successfully retested to re-obtain their driver’s licenses. Automatic license revocation for excessive speeding and other dangerous driving behaviors Under TADRA, Georgia drivers under 21 who are caught traveling more than 24 miles per hour over the posted speed limit (e.g., 55 mph in a zone posted for 30 mph or 90 mph in a zone posted for 65 mph) automatically forfeit their driver licenses for a period of 6 months. Other offenses that result in automatic license revocation include: hit-and-run or leaving the scene of an accident; racing or eluding an officer; reckless driving; any offense for which four or more points are assessed; purchasing or attempting to purchase an alcoholic beverage; and DUI. A first offense leads to automatic license revocation for 6 months; a second offense (or any DUI with a BAC of .08 or more) results in 12 months’ revocation. Re-instatement requires re-application and successful re-testing. Implementation and Dissemination Legislative deliberations and subsequent enactment of TADRA were widely covered by the news media, especially in metropolitan Atlanta, which contains approximately half of the State’s population. The law took effect in July of 1997. The State did not undertake significant dissemination efforts beyond the extensive coverage provided by the new media. Anecdotal reports from observers at the time suggest that the most effective “free advertising” was generated by the word-of-mouth complaints of teenaged drivers who lost their licenses after violating one or more TADRA provisions.
Data analysis To assess the impact of TADRA on motor vehicle crash fatalities in Georgia, we calculated the fatal crash rates of drivers in different age strata (16, 17, 18, 19, 20, 21-24, and 25+) during the 5 1/2 years prior to enactment of the law, and compared them to the fatal crash rates compiled by drivers in the same age strata during the 5 1/2 years following enactment.
To determine if certain aspects of TADRA’s legislative package were more effective than others, we analyzed age-specific rates of driver fatal crashes involving three high-risk behaviors if this was noted by the investigating officer and documented on the FARS report. These included: underaged DUI (denoted by the FARS variable “Driver Drinking”), excessive speed (denoted by the FARS variable “Driving too Fast for Conditions” or “In Excess of Posted Speed”), and late-night driving (denoted by determining the time of day in which the fatal crash occurred, divided into 3-hour time segments). The potentially confounding effect of rising rates of seat belt usage (a behavior not directly addressed by TADRA, but prone to influence by high-visibility enforcement) was examined as well. To determine if any changes in driver fatal crash rates were due to historical effects rather than the impact of TADRA itself, we compared pre- and post-enactment rates of driver fatal crashes involving Georgia drivers in various age groups to their peers in Alabama, South Carolina, and
7

Tennessee – three States that did not enact similarly comprehensive legislation during the study time frame (Appendix 2). To further dissect TADRA’s effects on the principal age group of interest (16-year-old drivers), we compared pre- and post-enactment fatal crash rates among 16-year-old Georgia drivers to those of 16-year-old drivers nationwide.
To determine if TADRA produced any sort of “cohort effects,” we compared the fatal crash rate of Georgia drivers who turned 21 in 2002 – five years after enactment of TADRA – to that of Georgians who turned 21 in 1997 (the year that TADRA was enacted). For each analysis, the rate of fatal crashes in an age stratum was calculated by dividing the number of fatal crashes involving drivers of that age before and after enactment of TADRA by the sum of the State’s population in that age stratum during the same time period, multiplied by 100,000. All rates presented are annual rates. Statistical considerations Statistical significance was determined by using Chi-square with an alpha level set at 0.01 except when 25 percent or more of the cells had expected counts less than 5. In that case, the Fisher’s Exact Test was used to calculate p-values. The statistical significance of differences in driver fatal crash rates 5 1/2 years before and 5 1/2 years after the law went into effect was tested separately for drivers age 16, 17, 18, 19, 20, 21-24, and 25+) in Georgia and the three comparison States – Tennessee, South Carolina, and Alabama. Similar comparisons were made pre- and post-TADRA enactment for speed-related fatal crashes, alcohol-involved fatal crashes, and driver fatal crashes involving 16-year-old drivers at various 3-hour intervals of the day. Descriptive statistics were calculated using Microsoft Excel. Tests of significance were calculated using SAS (SAS Version 8.2, Cary, NC).
Results Driver fatal crashes During the 5 1/2 years before TADRA was enacted, 317 Georgia drivers age 16 were involved in a crash that produced one or more fatalities -- an average annual rate of 57.0 fatal crashes per 100,000 16-year-old drivers. During the first 5 1/2 years following enactment of TADRA, 230 Georgia drivers age 16 were involved in a fatal crash - an average annual rate of 36.1 per 100,000 16-year-old drivers. This represents a 36.8 percent decrease in the rate of fatal crashes involving this age group of drivers (p = <0.0001). Prior to enactment of TADRA, the annual rate of fatal crashes among 16-year-old Georgia drivers was 77 percent higher than that of Georgia drivers 25 and older. Following enactment of TADRA, the annual fatal crash rate among 16-year-old Georgia drivers was only 12.8 percent higher than that of Georgia drivers 25 and older. Prior to enactment of TADRA, the annual rate of fatal crashes among 16-year-old Georgia drivers was 2.1 percent higher than that of Georgia drivers 21 to 24 years old. In the first 5 ½ years after enactment, the annual fatal crash rate among 16-year-old Georgia drivers was 26 percent less than that of Georgia drivers 21-24 years old.
8
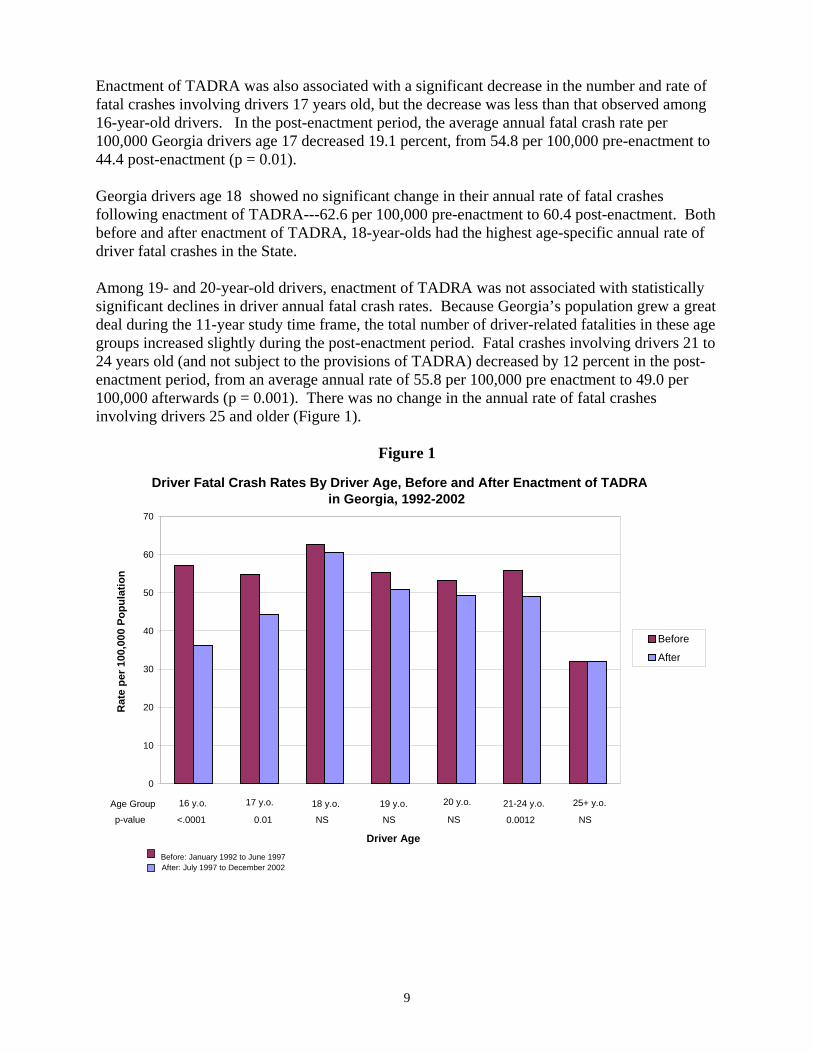
Enactment of TADRA was also associated with a significant decrease in the number and rate of fatal crashes involving drivers 17 years old, but the decrease was less than that observed among 16-year-old drivers. In the post-enactment period, the average annual fatal crash rate per 100,000 Georgia drivers age 17 decreased 19.1 percent, from 54.8 per 100,000 pre-enactment to 44.4 post-enactment (p = 0.01).
Georgia drivers age 18 showed no significant change in their annual rate of fatal crashes following enactment of TADRA---62.6 per 100,000 pre-enactment to 60.4 post-enactment. Both before and after enactment of TADRA, 18-year-olds had the highest age-specific annual rate of driver fatal crashes in the State.
Among 19- and 20-year-old drivers, enactment of TADRA was not associated with statistically significant declines in driver annual fatal crash rates. Because Georgia’s population grew a great deal during the 11-year study time frame, the total number of driver-related fatalities in these age groups increased slightly during the post-enactment period. Fatal crashes involving drivers 21 to 24 years old (and not subject to the provisions of TADRA) decreased by 12 percent in the post-enactment period, from an average annual rate of 55.8 per 100,000 pre enactment to 49.0 per 100,000 afterwards (p = 0.001). There was no change in the annual rate of fatal crashes involving drivers 25 and older (Figure 1).
Figure 1
Driver Fatal Crash Rates By Driver Age, Before and After Enactment of TADRAin Georgia, 1992-2002
16 y.o. 17 y.o. 18 y.o. 19 y.o. 20 y.o. 21-24 y.o. 25+ y.o. 0
10
20
30
40
50
60
70
Driver Age
Rat
e pe
r 100
,000
Pop
ulat
ion
Before
After
Before: January 1992 to June 1997After: July 1997 to December 2002
<.0001 0.01 NS NS NS 0.0012 NS Age Group
p-value
9

Speed-related fatal crashes Driving at an unsafe or illegal speed is a behavior commonly implicated in fatal crashes involving young drivers. Speed also contributes to other causes of crashes, including running off the roadway, following too closely, and failure to yield. Following enactment of TADRA, the annual rate of speed-related driver fatal crashes among Georgia 16-year-olds was cut almost in half, from 20.3 per 100,000 before the law went into effect to 10.3 afterward (p = <0.0001). Among 17-year-old drivers, speed-related driver fatal crashes declined 25.1 percent, from 14.0 per 100,000 in the pre-enactment period to 10.5 afterward. The only age group that did not experience a decline in speed-related fatal crashes was 18-year-old drivers. Among drivers in the 19, 20 and 21-24 year age strata, rates of speed-related fatal crashes declined by more than 30 percent. For drivers aged 21-24, this decline was statistically significant (p = <0.0001). Among drivers 25 years old or older, the annual rate of speed-related driver fatal crashes fell by 13 percent (p = 0.003). It should be noted that the average annual rate of speed-related crashes among drivers 25+ years old was substantially lower than that of younger drivers both before and after enactment of TADRA (Figure 2)
Figure 2
Speed-Related Fatal Crash Rates by Driver Age Before and After Enactment of TADRA in Georgia, 1992-2002
17 y.o. 19 y.o. 20 y.o. 21-24 y.o. 25+ y.o.16 y.o. 18 y.o.0
5
10
15
20
25
Driver Age
Rat
e pe
r 100
,000
Pop
ulat
ion
Before
After
Before January 1992 to June 1997 After July 1997 to December 2002
Definition: Speeding consisted of 'Driving too Fast for Conditions or In Excess of Posted Speed'
<.0001 NS NS 0.0126 0.0147 <.0001 0.003
Age Group
p-value
10

Alcohol-involved fatal crashes In Georgia, fatal crashes involving alcohol-involved drivers under 18 years old are relatively uncommon (Williams, 2002). However, once drivers reach age 18, rates of alcohol-involved fatal crashes begin to climb dramatically, peaking in the 21- to 24-year-old age group. Nevertheless, during the first 5 1/2 years after TADRA was enacted, fatal alcohol-involved crashes of Georgia drivers 16 years old declined 62.1 percent, from 4.1 per 100,000 pre-enactment to 1.6 afterwards (p = 0.008). Among 17-year-old drivers, alcohol-involved fatal crashes declined by 30 percent, from 4.7 per 100,000 before enactment to 3.3 in the post-enactment period. Because of the relatively small number of fatal crashes involved in this comparison, the decline is not statistically significant. The change in observed alcohol-involved fatal crashes involving 18-year-old drivers following enactment was not significant. As was the case with speed-related crashes, larger post-enactment decreases in alcohol-involved fatal crashes were noted in the 19, 20, 21-24, and 25+ age groups. Among drivers age 21 to 24 and 25+, these reductions were statistically significant (p = <0.0001) (Figure 3).
Figure 3
Alcohol-Involved Fatal Crash Rates by Driver Age, Before and After Enactment of TADRA in Georgia, 1992-2002
25+ y.o.21-24 y.o.20 y.o.19 y.o.18 y.o.17 y.o.16 y.o.0
2
4
6
8
10
12
14
16
18
Driver Age
Rat
e pe
r 100
,000
Pop
ulat
ion
Before
After
Before: January 1992 to June 1997 After: July 1997 to December 2002
Definition: Alcohol involvement was from the FARS variable 'Driver Drinking' from the assessment by investigating officers at the crash scene
0.0077 NS NS 0.0466 NS <.0001 <.0001
Age Group
p-value
11

Fatal crashes by time of day TADRA sharply restricts late-night driving by 16-year-olds. However, the most dangerous time for beginning drivers in Georgia is the 3 p.m. – 6 p.m. “rush hour” immediately after school.24.27 Both before and after enactment of TADRA, slightly more than one out of every four fatal crashes involving a 16-year-old Georgia driver occurred during this 3-hour afternoon interval. After TADRA was enacted, substantial decreases in 16-year-old driver fatal crash rates were noted in this afternoon time period, and every other 3-hour interval in the 24-hour cycle. The largest decrease in fatal crashes did not occur late at night, but between 6 a.m. to 9 a.m. (55.6 percent). The smallest decrease was in the 12 Noon to 3 p.m. time period (9.4%) (Figure 4).
Figure 4
Percent Change in Fatal Crash Rates Involving 16-year-old Drivers by Time of Day Before and After Enactment of TADRA in Georgia, 1992-2002
MN-2:59 AM 3:00-5:59 AM 6:00-8:59 AM 9:00-11:59 AM Noon-2:29 PM 3:00-5:59 PM 6:00-8:59 PM 9:00-11:59 PM-60
-50
-40
-30
-20
-10
0
10
20
30
40
Time Period
Dec
reas
e in
Rat
e
(Rate per 100,000 Population)
+
+
+
+
Seat belt use Following enactment of TADRA, average annual rates of safety restraint usage among drivers and passengers of vehicles involved in a fatal crash were higher in all age groups. Seat belt use among 16-year-old drivers involved in a fatal crash increased from 34.4 percent in the pre-enactment period, to 54.2 percent in the post-enactment period. Restraint use among the passengers of 16-year-old drivers increased from 29.4 percent to 52.7 percent. The greatest absolute increase in the observed annual rate of seat belt usage was noted among the occupants
12

of vehicles with an 18-year-old driver – their restraint use in fatal crashes was nearly three times higher than that noted during the pre-enactment period. The smallest post-enactment increases in restraint usage were noted among the occupants of vehicles driven by an individual over the age of 24. All comparisons of changing rates of seat belt usage before and after TADRA were significant (p=<.0001) (Figure 5).
Figure 5
Safety Belt Use by Drivers and Passengers Involved in Fatal Crashes Before and After Enactment of TADRA in Georgia, 1992-2002
16 y.o. 17 y.o. 18 y.o. Over 24 y.o.
0
10
20
30
40
50
60
Driver Age
Perc
ent B
elte
d
Before
After
Before: January, 1992 to June, 1997After: July, 1997 to December, 2002
<.0001 <.0001 <.0001 <.0001Age Group
p-value
Georgia’s experience compared to three adjoining States To determine if the reductions in driver fatal crash rates observed in Georgia after enactment of TADRA were due to regional or historical effects rather than the law itself, we compared age-specific pre- and post-enactment annual rates of driver fatal crashes in Georgia to those of three bordering States (South Carolina, Tennessee, and Alabama) that did not enact similarly restrictive legislation during the same time period. In the first 5 1/2 years following enactment of TADRA, South Carolina’s annual rate of fatal crashes per 100,000 citizens increased in both younger and older age groups. Among drivers over age 24, the increase was significant (p = <0.0001). During the same time frame, annual driver fatal crash rates in Tennessee declined slightly in all age groups except 18-year-olds. However, the decline was only significant for drivers age 21 to 24 (p = .01). In Alabama, annual fatal crash rates involving 16- and 17-year-old drivers decreased by 23 and 16 percent respectively (p = 0.01 and 0.08 respectively). However, the
13

annual driver fatal crash rate increased significantly among 18-year-olds (23 percent, p= 0.02), (Table 6). Prior to enactment of TADRA, the rate of driver fatal crashes among 16-year-old Georgia drivers was similar to that of 16-year-old drivers in the three comparison States. Following enactment of TADRA, the rate of fatal crashes involving 16-year-old drivers in Georgia was 34 percent lower than that in Tennessee, 32 percent lower than that in Alabama, and 18 percent lower than in South Carolina. Seventeen-year-old Georgia drivers experienced a fatal crash rate 21 percent, 16 percent and 21 percent lower than that the fatal crash rates of their age-matched peers Alabama, South Carolina and Tennessee, respectively. Figures 6a-d on the following two pages depict the net change in each State’s age-specific driver fatal crash rate during the 5-½-year follow-up period. Additional graphs, illustrating the year-by-year fatal crash rates of 16-year-old drivers in each State, are presented in Appendix 4.
Figure 6.a.
Percent Change of Driver Fatal Crash Rates Following Enactment of TADRA* in Georgia
16 17 18 19 20 21-24 25+-40
-30
-20
-10
0
10
20
30
Age
Perc
ent C
hang
e in
Rat
e
*(TADRA enacted in Georgia on July 1, 1997)
+
+
+
14

Figure 6.b.Percent Change of Driver Fatal Crash Rates Following Georgia’s Enactment of TADRA*
Alabama (non-TADRA control)
16 17 18 19 20 21-24 25+-40
-30
-20
-10
0
10
20
30
Age
Perc
ent C
hang
e in
Rat
e
*(TADRA enacted in Georgia on July 1, 1997)
+
+
+
Figure 6.c.Percent Change of Driver Fatal Crash Rates Following Georgia’s Enactment of TADRA*
South Carolina (non-TADRA control)
25+21-24201918 17 16 -40
-30
-20
-10
0
10
20
30
Age
Perc
ent C
hang
e in
Rat
e
*(TADRA enacted in Georgia on July 1, 1997)
+
+
+
15

Figure 6.d.Percent Change of Driver Fatal Crash Rates Following Georgia’s Enactment of TADRA*
Tennessee (non-TADRA control)
16 17 18 19 20 21-24 25+-40
-30
-20
-10
0
10
20
30
Age
Perc
ent C
hang
e in
Rat
e
*(TADRA enacted in Georgia on July 1, 1997)
+
+
+
Does TADRA continue to influence the behavior of drivers after they reach age 21? To determine whether Georgia teenagers who grew up under TADRA are driving differently at age 21 than Georgians who turned 21 immediately before enactment of the law, we compared the annual fatal crash rate and driving records for 21-year-old drivers involved in a fatal crash in 1997 (the year TADRA was enacted) to those of 21-year-old drivers involved in fatal crashes in 2002 (5 years after enactment). We also noted the percentage of driver fatal crashes pre- and post-enactment that were related to excessive speed or consumption of alcohol. Compared to their age-matched peers who were involved in a fatal crash in 1997, 21-year-old Georgia drivers involved in a fatal crash in 2002 were significantly less likely to have been previously convicted of speeding (p = <0.0001), other harmful motor vehicle infractions (p = 0.001), or to have a prior license suspension (p = 0.001). Prior DUI convictions among 21-year-old Georgia drivers involved in a fatal crash were also decreased, but the difference was only marginally significant (Fisher’s Exact p = .045). The first cohort of 21-year-old Georgia drivers who began driving in the era of TADRA were 38 percent less likely to be involved in a fatal crash (p= 0.007), 50 percent less likely to be involved in a speed-related fatal crash (p= 0.0299), and 74 percent less likely to be involved in an alcohol-related fatal crash (p= 0.0002) than their peers who turned 21 in 1997, the year that TADRA went into effect (Figure 7).
16

Figure 7
Rate of Fatal Crashes Involving 21-Year-Old Georgia Drivers Before and After Enactment of TADRA in Georgia
Alcohol-Involved Fatal Crashes
Speed-RelatedFatal Crashes
All Fatal Crashes0
10
20
30
40
50
60
70
80
Drivers Aged 21
Rat
e pe
r 100
,000
Pop
ulat
ion
Before
After
< 0.01 0.03 < 0.001p-value
Before: Age 21 in 1997 After: Age 21 in 2002
Discussion
Background: TADRA’s enactment came after a 6-year period of intense legislative lobbying and community activism. The political pressure to do something about teen crash fatalities reached a crescendo in the fall of 1996 following a series of highly publicized, multiple-fatality teen car crashes in the Metropolitan Atlanta area. The first version of TADRA was signed into law by then Governor Zell Miller on March 14, 1997.21-22 The legislation was further strengthened in 2000 with extension of driving curfew hours, elimination of curfew exemptions, and additional limitations on the number of passengers that can ride in a vehicle driven by provisional license holder. These features were signed into law by then Governor Roy Barnes on April 11, 2001.25-26 The first examination of the impact of TADRA was conducted by Angelyn Rios and reported in the Georgia Highway Safety 1999 Fact Book.24 She noted an immediate and highly positive effect of the law, particularly among 16- and 17-year-old drivers (a decrease of 35.1% in fatal crashes involving 16- and 17-year-old drivers). These findings suggest that TADRA had an immediately favorable impact, but the evaluation interval was too short to reach a definitive conclusion about the law. In 2001, Rios reexamined TADRA 18 months following enactment. At that point, the rate of fatal crashes involving Georgia drivers 16 and 17 years old was still 30 percent lower than it had been immediately prior to enactment.27 Although Rios’ findings were highly encouraging,
17

Georgia’s experience was not compared to that of neighboring States, so it was possible that much of the law’s perceived benefit might be due to historical effects, such as stricter traffic enforcement or rising rates of seat belt use.
The Current Study: Our evaluation confirms Rios’ earlier findings and indicates that the effects of TADRA were sustained over time. During the 5-½-year follow-up period, the rate of fatal crashes involving 16-year-old Georgia drivers was 36.8 percent lower than during the final 5 ½ years before enactment. This reduction was substantially greater than that observed in the comparison States, and twice the decline noted among 16-year-olds nationwide during this time interval. This suggests that enactment of TADRA produced significant benefits above and beyond what might be attributed to historical effects. We also found a statistically significant but more modest effect on fatal crashes involving 17-year-old drivers. No appreciable decrease in fatal crashes involving 18-year-olds was noted, but no increase was noted, either. This largely rules out displacement of crashes from younger to older age groups. If TADRA had simply encouraged young drivers to delay the onset of driving, or to reduce their frequency of driving until they were older, any net benefit from a decrease in fatal crashes involving 16- and perhaps 17-year-old drivers would be offset by higher rates of fatal crashes among 18-and-older drivers. This was not the case. TADRA’s impact on fatal crash rates involving 16-year-old drivers was greater than that noted in a number of States where GDL legislation has been evaluated (Appendix 1). We believe TADRA’s impact is greater because it includes a number of supplemental provisions aimed at deterring specific high-risk driving behaviors, most notably excessive speeding. TADRA also differs from many other State GDL systems because it imposes a highly meaningful and inescapable sanction -- automatic license revocation – on those who violate its provisions (Appendix 2). Analyzing 11 years of data allowed us to compare driver fatal crash rates by age group for 5 ½ years pre- and post-enactment. Most evaluations of GDL laws have had been limited by relatively short follow up intervals.11 Rather than limit our analysis to the youngest age groups of drivers, we examined changing rates of fatal crashes across the age spectrum. This allowed us to determine if TADRA simply displaced fatal crashes to older age groups. Comparing our data with that of three neighboring States allowed us to exclude potentially confounding historical effects. Adjusting for changes in population was necessary because Georgia, like other southern States, experienced significant growth during the study interval. Use of relatively lengthy pre- and post-enactment periods increased the power of our study to explore TADRA’s effects on specific types of hazardous driving behavior, such as excessive speeding, drunk driving, and late-night driving. It also enabled us to confirm that the law’s benefits were long-lasting. Every study is subject to limitations. The data used in our analysis is derived from fatal crash reports that reflect the perspectives of the law enforcement officers that complete them as well as the fiscal limitations of the agencies that support these collections. Enforcement of laws against various high-risk driving behaviors, such as nonuse of seat belts, speeding, and drunk driving, vary from State to State and probably change over time. We decided to calculate age-specific rates of driver fatal crashes using each State’s population, rather than the number of licensed drivers in each age group because the only national database that contains State and age-specific counts of licensed drivers (FHWA, Highway Statistics, DL-
18

22) specifically excludes drivers holding a provisional or restricted license.28 In 1989, a FHWA committee decided that the enumeration of licensed drivers for this file should not include Class P permit holders (i.e., instructional permits) as well as drivers with limited-use or restricted licenses. When this FHWA rule was implemented, it significantly reduced State counts of licensed drivers in the youngest age groups. Moreover, since different States interpreted the rule differently, it added a degree of variability to what had previously been a consistent process. Both effects make State-by-State comparisons based on current counts of licensed drivers highly problematic. Regardless of how officials in a particular State interpret the rule, it is clear that FHWA statistics significantly undercount drivers in youngest age groups, particularly drivers in GDL States where the issuance of Class P and various types of restricted licenses is quite common. Because drivers with restricted licenses are frequently on the road, particularly during peak hours of the day and evening, using FHWA data to calculate fatal crash rates could seriously undercount the number of young drivers at risk. The practical impact of this error would be to artificially inflate fatal crash rates in this age group, thereby masking the beneficial effects of GDL legislation and other measures aimed at young drivers. To avoid this error, we used standardized, age-specific population data as our denominator to calculate driver fatal crash rates. This approach offers the advantage of consistency, but it has its own limitations. It is possible that use of age-specific population data may overestimate the number of drivers at risk, since not all individuals choose to obtain driver licenses the moment they are eligible to do so. However, there is little evidence that large numbers of teens are deferring their decision to acquire driver licenses, beyond speculation based on misinterpretation of falling rates of licensure using FHWA statistics. Confounding effects: Certain historical effects may explain some but clearly not all of the benefits we observed. Although seat belt use was not directly encouraged by TADRA, it increased in Georgia as it did elsewhere throughout the 11-year study interval.29 In Georgia, observed rates of seat belt usage in all age groups increased from 50.6 percent in 1992 to 77.0 percent in 2002.30-31 As recorded on the fatal crash reports filed by law enforcement officers, seat belt usage by occupants involved in fatal crashes also increased, from 47 percent in 1992 to 79.6 in 2002. To control for the historical effect of rising seat belt usage as well as other factors such as the proliferation of more crash worthy vehicles, we compared Georgia’s experience to that of three neighboring States that did not enact similarly comprehensive legislation during the study time frame. Nationwide, the fatal crash rate involving 16-year-old drivers decreased 14.8 percent during the 5 1/2 year period immediately following the Georgia General Assembly’s enactment of TADRA. This is less than half the decrease that was observed among Georgia’s 16-year-old drivers during the same time period. If the decrease was due to seat belt use, we would have expected it to be gradual and mirrored in all States. Instead, we noted an immediate, “step-wise” reduction in fatal crash rates involving 16-year-old drivers – an effect that was not mirrored in the comparison States (Appendix Four).
Why is TADRA so effective among 16-year-olds? At age 16, the vast majority of teenagers are inexperienced drivers who live at home and are therefore subject to their parents’ or guardians’ supervision.32-33 They are also dependent on their parents or guardians for economic support. By age 17, many teens have acquired enough driving experience to become overconfident; they may also be less fearful of the disapproval of their parents or guardians. By
19

age 18, many teens have moved out of the house to go to college or start their first job, and are therefore living independently of their parents or guardians. They may also find it easier to acquire alcohol. In light of these developmental and social milestones, it is not surprising that TADRA had its greatest effect on 16-year-old drivers, and a diminishing but nonetheless valuable impact on 17- year-old drivers. If TADRA merely discouraged 16- and 17-year-olds from driving, or delayed the onset of high-risk driving without fundamentally altering driver behavior, any benefits accrued among 16- and 17-year-olds might be offset by a compensatory increase in fatal crashes involving drivers 18 or older. This did not occur.
The provision in TADRA that calls for automatic revocation of the license of a teen driver traveling more that 24 miles per hour over the posted speed limit may be particularly effective. Before enactment of TADRA, unsafe or illegal speed-related fatal crashes accounted for more than one-third of all fatal crashes involving 16-year-old drivers. After TADRA went into effect, annual rates of speed-related fatal crashes involving 16-year-old Georgia drivers were cut nearly in half. In fact, the reduction of speed-related fatal crashes accounted for more than half of the law’s effect among 16-year-old drivers. A Potential Cohort Effect: We found evidence that TADRA may impart lasting benefits to drivers who grow up under the law. The first cohort of Georgia drivers who reached age 21 in the era of TADRA were involved in fatal crashes at a rate fully 38 percent lower than that of Georgia drivers who turned 21 in 1997, the year that TADRA went into effect. Although some of this benefit is undoubtedly due to improvements in vehicle design and rising rates of seat belt use, the change is much greater than that noted on a national basis during this time frame. This suggests that Georgians who are reaching age 21 in the era of TADRA may be driving more responsibly than their predecessors. This is a fertile area for further research. Comparisons to Neighboring Southeastern States: TADRA’s effects were not mirrored in three adjoining Southern States* that did not enact similar legislation during the study interval.34
• The three comparison States added partial graduated licensing provisions to their existing motor vehicle statutes during the TADRA study period. Legislation was passed in Alabama in 2003, South Carolina in 1998, and Tennessee in 2004. See 54 Alabama Law Review 1473 (Summer, 2003), 56 South Carolina Code Annotated 1 § 175,176,180 and 55 Tennessee Code Annotated 50 §301-304, 311,312, 322 as well as, 49 Tennessee Code Annotated 6 §3017.
The differences between Georgia and its neighboring States of Tennessee and South Carolina are particularly stark. In the third comparison State, Alabama, fatal crashes involving 16-year-old drivers declined to a greater degree than the national average, but the decrease was not as great as that noted in Georgia. Based on these comparisons, it is highly unlikely that the decreases we observed among 16- and 17-year-old Georgia drivers were exclusively due to historical factors. This suggests that other States may achieve impressive reductions in teen fatal crash rates if they enact legislation similar to Georgia’s TADRA law.
20

In Alabama, the rate of fatal crashes involving 16-year-old drivers decreased 22.5 percent during the post-enactment period. Alabama did not enact GDL legislation prior to 2002, and the State’s GDL law did not go into effect until September 1 of that year (See Appendix 2). No other major legislative changes were adopted by Alabama during the 11-year interval of our study. To determine if other public education or enforcement interventions were implemented in Alabama during this time, we contacted colleagues in Alabama to ask them why Alabama’s experience diverged from that of Tennessee and South Carolina. They could not identify a reason. While Alabama’s decline during the study interval is intriguing, it was only 7.5 percent greater than the overall decline in the United States during the same time period. Furthermore, Alabama’s decrease was 14.3 percent less than that observed in Georgia’s during the same time frame.
Final Observations: Although our findings are encouraging, it is important to keep TADRA in perspective. Before TADRA was enacted, the rate of fatal crashes involving 16-year-old drivers in Georgia was quite high. In the first 5 ½ years following enactment, fatal crashes involving 16-year-old Georgia drivers declined dramatically, but the post enactment rate was still 28.6 percent higher than the U.S. average among 16-year-olds (36.1 per 100,000 in Georgia versus 28 per 100,000 nationwide). Happily, this “mortality gap” is less than half what it was before TADRA was enacted (57 per 100,000 in Georgia versus 32.8 per 100,000 nationwide). Georgia has made progress, but the State still has a long way to go.
Nevertheless, TADRA appears to have had a favorable impact on highway safety in Georgia. One way to quantify this benefit is to use sensitivity analysis to project the rate of fatal crashes that might otherwise have occurred if the Georgia’s General Assembly had failed to enact TADRA in 1997, or the Governor had failed to sign it into law. If Georgia had experienced the more modest decline in driver fatal crashes that was noted in Alabama during the 5-½-year follow-up interval (the “best case scenario”), 221 additional drivers age 16 to 20 would have been involved in a fatal crash. However, if driver fatal crash rates in Georgia had risen as much as they did in South Carolina (the “worst case scenario”), 434 additional drivers age 16 to 20 would have been involved in a fatal crash. Since a “driver fatal crash” can claim more than one life, it is likely that TADRA saved a minimum of 220 to 430 lives during its first 5 ½ years of existence. It is also possible, if not likely, that TADRA prevented a large number of serious but nonfatal injuries.
Why did TADRA have more impact than many States’ GDL laws? We cannot answer this question with certainty, but we believe it is probably because TADRA links graduated driver licensing with supplemental provisions designed to deter high-risk driving behaviors by teens. Chief among these are measures designed to deter driving at excessive rates of speed, drag racing, and evading a police officer, and a measure specifically designed to deter alcohol-impaired driving. Provision for an immediate, believable, and highly meaningful sanction, automatic license revocation, probably strengthens the deterrent effect of TADRA. Teen drivers in Georgia quickly learned that their parents could not help them evade the legal consequences of violating the law. Anecdotally, the loud complaints of the first young drivers who lost their license constituted the best publicity TADRA received. It is important to acknowledge that because the many provisions of TADRA were enacted as a package, it is impossible to dissect which particular aspect had the greatest effect. Nevertheless, it appears that enactment of TADRA resulted in an immediate and substantial decline in driver fatal crash rates in Georgia. The impact was greatest among 16-year-old drivers, but notable among 17-year-old drivers as well. Fatal crashes were not displaced to 18-
21

year-olds and older age groups. Interestingly, there is preliminary evidence that drivers reaching age 21 under TADRA may be driving more safely than their predecessors did. State governments interested in duplicating Georgia’s success should consider adopting a similarly comprehensive package of legislation. Successful replications in other States would provide compelling evidence that TADRA’s multi-faceted approach is effective. Georgia’s experience suggests that it is possible to facilitate a safe and orderly transition from adolescence to adult driving. Graduated licensing is a key component of that process, but States should consider strengthening it with additional provisions aimed at deterring high-speed driving, DUI, and other dangerous behaviors. Such laws, backed up by meaningful enforcement, and certain sanctions, may help more adolescent drivers and passengers reach adulthood.
22

Acknowledgement This research was funded in part by the National Highway Traffic Safety Administration under a Cooperative Agreement with Emory University (DTNH22-03-H-05123). Paul J. Tremont, Ph.D., was the NHTSA Project Officer for this study.
23

References 1. National Highway Traffic Safety Administration. (1993). Addressing the safety issues related to younger and older drivers: A report to Congress. Washington, DC. 2. Liu, J. Y., Mooney, D. P., Meyer, M. M., & Shorter, N. A. (1998). Teenage driving fatalities. Journal of Pediatric Surgery, 33(7), 1084-1088; discussion 1088-1089. 3. McKnight, A. J., & McKnight, A. S. (2000). The behavioral contributors to highway crashes of youthful drivers. Annual Proceedings. Association for the Advancement of Automotive Medicine, 44, 321-333. 4. O’Malley, P. M., & Johnston, L. D. (2003). Unsafe driving by high school seniors: National trends from 1976 to 2001 in tickets and accidents after use of alcohol, marijuana and other illegal drugs. Journal of Studies on Alcohol, 64(3), 305-312. 5. Ulmer, R. G., Williams, A. F., & Preusser, D. F. (1997). Crash involvements of 16-year-old drivers. Journal of Safety Research, 28(2), 97-103. 6. Williams, A. F. (2003b). Teenage drivers: patterns of risk. Journal of Safety Research, 34(1), 5-15. 7. Mayhew, D. R., Simpson, H. M., & Pak, A. (2003). Changes in collision rates among novice drivers during the first months of driving. Accident Analysis & Prevention, 35(5), 683-691. 8. Phebo, L., & Dellinger, A. M. (1998). Young driver involvement in fatal motor vehicle crashes and trends in risk behaviors, United States, 1988-95. Injury Prevention, 4(4), 284-287. 9. Martinez, R. (2005). Teen crash victims: Who are these people and why are they here? Annals of Emergency Medicine, 45(2), 155-156. 10. Waller, P. F. (2003). The genesis of GDL. Journal of Safety Research, 34(1), 17-23. 11. Shope, J. T., & Molnar, L. J. (2003b). Graduated driver licensing in the United States: evaluation results from the early programs. Journal of Safety Research, 34(1), 63-69. 12. Simpson, H. M. (2003). The evolution and effectiveness of graduated licensing. Journal of Safety Research, 34(1), 25-34. 13. Fildes, B., & Langford, J. (2002). Graduated licensing programmes and young-driver crashes. Lancet, 359(9308), 725-726. 14. Insurance Institute for Highway Safety. (2005). U.S. licensing systems for young drivers: Laws as of January 2005. Available: http://www.hwsafety.org/safety%5Flaws/us_licensing_systems.pdf Accessed March 8, 2005.
24

15. Agent, K., Steenbergen, L., Pigman, J, McCoy, C., & Pollack, S. (2001) Impact of the Graduated Driver License Program in Kentucky on teen motor vehicle crashes. Lexington, KY: Kentucky Injury Prevention and Research Center. 16. Foss, R. D., Feaganes, J. R., & Rodgman, E. A. (2001). Initial effects of graduated driver licensing on 16-year-old driver crashes in North Carolina.. JAMA, 286(13), 1588-1592. 17. Hyde, L. K., Cook, L. J., Knight, S., & Olson, L. M. (2005). Graduated driver licensing in Utah: Is it effective? Annals of Emergency Medicine, 45(2), 147-154. 18. Office of the Governor's Highway Safety Representative, Ohio Department of Public Safety. 2001. Evaluation of Ohio's graduated driver license program. Available: http://www.publicsafety.ohio.gov/news/gdlreport.pdf Accessed March 8, 2005. 19. Shope, J. T., Molnar, L. J., Elliott, M. R., & Waller, P. F. (2001). Graduated driver licensing in Michigan: early impact on motor vehicle crashes among 16-year-old drivers.. JAMA, 286(13), 1593-1598. 20. Ulmer, R. G., Preusser, D. F., Williams, A. F., Ferguson, S. A., & Farmer, C. M. (2000). Effect of Florida's graduated licensing program on the crash rate of teenage drivers. Accident Analysis & Prevention, 32(4), 527-532. 21. 40 OCGA 5 §22, 24,57.1 22. 14 Georgia State University Law Review 203 (December, 1997). 23. Firestone, D. (March 14, 2001). Bid to Raise Driving Age Is Roiling Rural Georgia. New York Times, p. A12. 24. State of Georgia. Governor’s Office of Highway Safety. (1999). Ed. A. M. Rios, Georgia Highway Safety 1999 Fact Book: A Report on Highway Safety in Georgia. Atlanta, GA: Governor’s Office of Highway Safety. 8-9. 25. 40 OCGA 5 § 26 and 40 OCGA 6 § 391 26. 18 Georgia State University Law Review 205 (Fall, 2001) 27. State of Georgia. Governor’s Office of Highway Safety. (2000). Ed. A. M. Rios, Young Drivers in Georgia: The Teenage and Adult Driver Responsibility Act, A Supplement to the Georgia Highway Safety 2000 Fact Book. Atlanta, GA: Governor’s Office of Highway Safety. 28. U.S. Department of Transportation. Federal Highway Administration. Highway Statistical Series. Report identifying state driver licenses and fees. Available: http://www.fhwa.dot.gov/ohim/hsguide/ch4.pdf Accessed March 29, 2005. 29. University of Georgia. Cooperative Extension Service. Survey Research Center. (2002) Georgia Governor’s Office of Highway Safety, Occupant Protection Survey. (unpublished report).
25

30. Loeb, P. D. (1993). The effectiveness of seat belt legislation in reducing various driver-involved injury rates in California. Accident Analysis & Prevention, 25(2), 189-197. 31. McKnight, R. H., & Dawson, S. K. (1996). Seat belt use in Kentucky -- a comparison of five measures. Journal of the Kentucky Medical Association, 94(3), 110-114. 32. Beck, K. H., Shattuck, T., Raleigh, R., & Hartos, J. (2003). Does graduated licensing empower parents to place greater restrictions on their newly licensed teens' driving? Health Education & Behavior, 30(6), 695-708. 33. Simons-Morton, B. G., & Hartos, J. L. (2003). How well do parents manage young driver crash risks? Journal of Safety Research, 34(1), 91-97. 34. Williams, A.F., & Mayhew, D.R.. (2003) Graduated Licensing: A Blueprint for North America. Arlington, VA: Insurance Institute for Highway Safety, Highway Loss Data Institute.
26

Appendix 1 Peer-Reviewed Evaluations of State Graduated Licensing Laws
Date
Enacted Time Periods
Evaluated State Populations Studied Effect Size Reported
Fatal or injury crashes for 16-year-old drivers: Primary Group: 17-year-old
drivers, with analyses of 15-, 16-, and 18-year-olds
1995: 5,570/172,554 population estimate for 16-year-olds
7/1996 Florida 1996: 5,781/182,640 population estimate for 16-year-olds 1995 vs. 1997 Amended
2001 Comparison Groups: (Ulmer,
2000) 25- to 54-year-old drivers; 1997: 5,388/185,689 population estimate for 16-year-olds Florida data compared to
similar age groups in Alabama
Post-enactment decrease per 1,000 16-year-old drivers:-10%
Primary Group: 16-17-year-olds
Post-enactment decreases per 1,000 16-year-old drivers: 1993-1995 Kentucky 10/1996 vs. Crashes: -30% (Agent, 2001) Comparison Groups: 19-year-
olds and above Injury Crashes: -33% 1997-1999 Fatal Crashes: -31% Driver fatal crashes for 16-year-olds:
Primary Group: 16-year-olds 1996: 54/1,000 population 1996 vs. 1998 and 1999
Michigan 1998: 41/1,000 population 4/1997 (Shope, 2001) Comparison Group: Drivers 25 and older
1999: 37/1,000 population Adjusted risk of a fatal crash among 16-year-old drivers: -25% Driver fatal crashes for 16-year-olds: 1996: 5/1,111 all crashes per 10,000 population Primary Group: 16-year-olds North
Carolina 1997: 5/1,181 all crashes per 10,000 population 1999 vs. 1996 12/1997 Comparison Group: Drivers
25 to 54 years old 1999 vs. 1997 1999: 2/855 all crashes per 10,000
population (Foss, 2001)
Post-enactment decrease in fatal crash rate per 1,000 16-year-old drivers: -57% Driver fatal crashes for 16-year-olds: 1996: 57/10,000 registered drivers 1988-1999 Primary Group: 16-year-olds 10/1997 Ohio 1997: 49/10,000 registered drivers Subanalyses for Amended
2004 1999: 47/10,000 registered drivers (Kilgore,
2001) Comparison Group: Drivers 25 to 54 years old
1999 vs. 1996 and 1997
1988: 64/10,000 registered drivers Post-enactment reduction in fatal crash rate per 1,000 16-year-old drivers: -17.5% Post-enactment crashes per 1,000 16-year old drivers: 1/1996-6/1999 Utah Primary Group: 16-year-olds 7/1999 7/1/1999-
6/30/2001 Total crashes: -5% (Hyde, 2004)
Injury Crashes: no significant difference
27

Appendix 2 Comparisons of Key Features of the Graduated Licensing Laws for the States of Georgia,
Alabama, Tennessee, and South Carolina (As of August 31, 2004 )
Specific Feature of Law Georgia Alabama Tennessee South
Carolina Date(s) implemented 1997 2001 2002 2001 1998
Revised
Learners’ Permits X X X X Driving permits can be issued to
persons as young as 15 X
At 14 if a “hardship”
situation is proven X X X X Written parental consent required to
secure a permit (legal guardians and other legally recognized family members over 21 may consent as well)
X With proof of
insurance
Graduated License Process
X X X Written parental consent required to secure a conditional license (legal guardians and other legally recognized family members over 21 may consent as well)
X With proof of
insurance
Conditional license issued after
specified number of months X X X X
12 months 12 months 6 months 6 months
Conditional license issued after documented number of hours of behind-the-wheel with licensed parent or guardian
X X X X 40 hours 30 hours 50 hours 40 hours
(6 at night) (10 at night) (10 at night)
X X X Conditional license issued after documented successful completion of a high school drivers’ education class or a State-authorized driving school to fulfill behind-the-wheel experience
Age of driving instructor limited to 21 or older (parents, guardians, or other instructors)
X
X X X X X Conditional license issued after the successful completion of a written test Passenger Restrictions Restrictions regarding the number of passengers in vehicle of conditional license holder
X X X X X Not more
than 3 Not more
than 3 More than 4 More than 1 More than 2
X During the first six months of a conditional license, only immediate family members can be transported by the driver
28

Specific Features of Law Georgia Alabama Tennessee South Carolina
1997 2001 2002 2001 1998 Revised
Curfews Holders of a conditional license are subject to a curfew period when they are not allowed to drive
X X X X X 1-5 a.m. Curfew
extended to Midnight –
6a.m. 11p.m. – 6a.m. Midnight –
6a.m. Midnight –
6a.m.
Suspension of License – Linkage to Secondary Education
X X Provisions to address and link school suspension and expulsion information from State Dept. of Education to suspension of conditional license by DMV
X
X X X Conditional license issuance and rights linked to school attendance and/or successful secondary school completion (e.g., graduation or GED)
X
Suspension of License – Moving Violations
X Written request for revocation of license may be made by parent, guardian or other legally recognized adult
X X X Conditional drivers with 4 or more points on their licenses for moving violations will have their license suspended. (Such violations include reckless driving, not wearing a seatbelt, leaving the scene of an accident, hit-and-run, and resisting or eluding law enforcement officers.)
X 6 points required,
rather than 4 points
X X X Conditional drivers with 2 suspensions
of their licenses will have their licenses revoked, and have to undergo a period revocation and re-testing/re-application Suspension of License - DUI
X X “Zero tolerance” for any drivers under 21 with a BAC greater than .02 g/dL that will lead to immediate suspension of their licenses
X
29

Specific Features of the Law South Tennessee Alabama Georgia Carolina
1998 2001 2002 1997 2001 Revised
X X Conditional drivers arrested for DUI with a BAC of less than .08 will suffer a six-month revocation of their licenses
X Conditional drivers arrested for DUI
with a BAC of greater than .08 will have their licenses revoked and will have to undergo a retest of on-road driving skills Suspension of License – DUI continued
X Conditional drivers arrested for DUI will spend a minimum of 1 day in jail, perform 40 hours of community service
Exemptions Yes No No No No Individuals who are 16 or older, who
are married, emancipated minors, or heads of household, are exempt from the conditional licensing process
Yes No No No No Behind-the-wheel driving experience may be waived at the request of parent or guardian
Yes No No No No Exemption to conditional licensing process for high school graduates younger than 18
Yes Yes Yes No No Exemptions regarding the number of passengers for occasions when conditional license holder is transporting parent or guardian, or going to and from school with siblings.
Yes Yes No No No Modifications to increase the number of passengers may be requested and granted upon petition of parent, guardian, or school official
30

Specific Feature of the Law Georgia Alabama Tennessee South Carolina
1997 2001 2002 2001 1998 Revised
Curfew exceptions for conditional license holders allow them to drive if: they are driving to and from work, in an emergency situation, to or from a religious event, with parent or guardian in car
Yes Rescinded X X X Also includes travel for opportunity for employment
Written note required
Hunting/fishing trip included too
No No Yes Yes Yes Exemptions to this law for military personnel
No No Yes Yes Yes Exemptions to this law for drivers from other States, with valid licenses
Yes Yes Yes Yes Yes Exemptions for the driving of agricultural vehicles by minors
n/a Good Fair Good Insurance Institute of Highway Safety’s Rating of State GDL law (Williams and Mayhew, 2004)
Marginal
31

Appendix 3 Legal Sources Consulted
Alabama Source
Title 32 – Motor Vehicles and Traffic 32-5A-195 Driver’s license, cancellation, suspension or
revocation
Code of Alabama
32-6-2 Exemptions 32-6-3 Examinations; renewal 32-6-7 Issuance; persons not eligible 32-6-7.2 Age restrictions 32-6-8 Learner’s license Title 16 - Education 16-28-41 Written guidelines
54 Alabama Law Review 1473 (Summer, 2003) Survey of the 2002 Alabama Legislation Georgia Source
Title 40 – Motor Vehicles and Traffic 40-5-21 (2002) Exemptions generally 40-5-22 (2002) Persons not to be licensed; minimum ages fro
licensees; school attendance requirements
Official Code of Georgia Annotated
40-5-24 (2002) Instruction permits; graduated licensing and related restrictions; temporary licenses
40-5-26 (2004) Applications of minors; distinctive licenses for persons under 21
40-5-27 (2002) Examination of applicants 40-5-57.1 (2002) Suspension of licenses of persons under 21 for
certain offenses; suspension of licenses of persons under 18 for certain point accumulations; issuance of a new license following suspension
40-6-391 (2004) Driving under the influence of alcohol, drugs, or other intoxicating substances; penalties; publication of notice of conviction for persons convicted of endangering a child
14 Georgia State University Law Review 203 (December, 1997) 18 Georgia State University Law Review 205 (Fall, 2001)
32

South Carolina Source
Title 56 – Motor Vehicles 56-1-175 (2003) Issuance of conditional driver’s license 56-1-176 (2003) Conditions for issuance of conditional driver’s
license and special restricted driver’s license
South Carolina Code Annotated
56-1-180 (2003) Special restricted licenses for certain groups Tennessee Source
Title 55. Motor and Other Vehicles. Chapter 50. Driver Licenses. 55-50-301 (2004) License-required – Requirements--Exception
Tennessee Code Annotated
55-50-302 (2004) Classes of licenses --Endorsements 55-50-303 (2004) Persons not eligible for licensing 55-50-304 (2004) Persons exempt from licensing 55-50-311 (2004) Learner permit – Intermediate license 55-50-312 (2004) Licensing of minors 55-50-322 (2004) Examination of applicants Title 49. Education. Chapter 6. Elementary and Secondary Education. Part 30. Attendance. 49-6-3017 (2004) Minors withdrawn from secondary school—
Denial of motor vehicle license or permit
33

Appendix 4
Data Tables
Table 1 Georgia Drivers in Fatal Crashes
Before and After Enactment of TADRA* (Number and Rate per 100,000 Population)
(*Before: January 1992 to June 1997; After: July 1997 to December 2002)
Before After Driver Age Number Rate Number Rate
Percent Change In Rate
Chi Square P-Value
16 317 57 <.0001 230 36.1 -36.8 28.5517 306 54.8 0.0100 284 44.4 -19.1 6.6418 339 62.6 0.6328 385 60.4 -3.5 0.2319 316 55.2 335 50.8 -7.8 1.09 0.2974 20 306 53.2 324 49.3 -7.2 0.88 0.3475 21-24 1,300 55.8 1,228 49 -12.1 10.50 0.0012 25+ 7,882 32.1 8,991 32 -0.5 0.12 0.7239
34

Table 2 Drivers in Speeding-Related Fatal Crashes in Georgia
Before and After Enactment of TADRA* (Number and Rate per 100,000 Population)
(*Before January 1992 to June 1997, after July 1997 to December 2002 Speeding consisted of “Driving too Fast for Conditions or In Excess of Posted Speed”)
Before After Driver Age Number Rate Number Rate
Percent Change In Rate
Chi Square P-value
16 113 20.3 66 10.3 -49.12 19.76 <.0001
17 78 14 67 10.5 -25.12 3.04 0.0813
18 82 15.2 100 15.7 3.63 0.06 0.8109
19 85 14.8 65 9.9 -33.52 6.23 0.0126
20 86 14.9 66 10.1 -32.75 5.95 0.0147
21-24 373 16 244 9.7 -39.12 37.08 <.0001
963 3.9 965 3.4 -12.63 8.83 0.0030 25+
35

Table 3
Drivers in Alcohol Involved Fatal Crashes in Georgia Before and After Enactment of TADRA* (Number and Rate per 100,000 Population)
(*Before: January 1992 to June 1997; After: July 1997 to December 2002 Alcohol involvement was from the FARS variable “Driver Drinking” from the assessment by investigating officers at the crash scene.)
Before After Percent Change in Rate
Driver Age
Chi-Square Number Rate Number Rate P-value
16 23 4.1 10 1.6 -62.12 7.10 0.0077 17 26 4.7 21 3.3 -29.59 1.44 0.2294 18 48 8.9 54 8.5 -4.4 0.05 0.8204 19 59 10.3 46 7 -32.22 3.96 0.0466 20 76 13.2 67 10.2 -22.74 2.38 0.1225 21-24 381 16.3 273 10.9 -33.31 26.47 <.0001 25+ 1,521 6.2 1,428 5.1 -18.14 29.62 <.0001
36

Table 4
Time of Day of Crash for Drivers Age 16 in Fatal Crashes in Georgia Before and After Enactment of TADRA* (Number and Rate per 100,000 Population)
Before After Time Period Percent
Change N % N %
12-2:59 a.m. 17 5.38 14 6.14 -17.6 3-5:59 a.m. 11 3.48 7 3.07 -36.4 6-8:59 a.m. 36 11.39 16 7.02 -55.6 9-11:59 a.m. 18 5.70 14 6.14 -22.2 12-2:29 p.m. 32 10.13 29 12.72 -9.4 3-5:59 p.m. 83 26.27 62 27.19 -25.3 6-8:59 p.m. 58 18.35 46 20.18 -20.7 9-11:59 p.m. 61 19.30 40 17.54 -34.4 Total 316 100.0 228 100.0 -27.8
*Before: January, 1992 to June, 1997; After: July, 1997 to December, 2002
37

Table 5 Seat Belt Use by Drivers and Passengers in Fatal Crashes in Georgia
Before and After Enactment of TADRA* (Number and Percent Belted)
Driver Age Before After
Change in Percent
Chi Square
Number Belted
Percent Belted
Number Belted
Percent Belted P-value
16 Driver 19.9 21.70 109 34.4 125 54.3 <.0001 Passenger 23.3 36.56 102 29.4 128 52.7 <.0001 Total Occupants 21.7 53.90 211 31.8 253 53.5 <.0001 17 Driver 28.1 47.09 94 30.7 167 58.8 <.0001 Passenger 20.6 22.94 84 30.2 123 50.8 <.0001 Total Occupants 24.6 68.98 178 30.5 290 55.1 <.0001 18 Driver 22.7 39.60 86 25.4 185 48.1 <.0001 Passenger 40.2 94.31 66 22 166 62.2 <.0001 Total Occupants 30 122.51 152 23.8 351 53.8 <.0001 Over 24 Driver 18.7 587.06 2911 36.9 4998 55.6 <.0001 Passenger 13.9 178.64 1281 32.2 2324 46.1 <.0001 Total Occupants 16.9 737.10 4192 35.3 7322 52.2 <.0001
*Before: January, 1992 to June, 1997; After: July, 1997 to December, 2002
38

39
Table 6 Drivers in Fatal Crashes
Before and After Enactment of TADRA (*Number and Rate per 100,000 Population / Before January 1992 - June 1997, After July 1997 - December 2002)
Georgia Before After Population Number Rate Population Number Rate
Percent Change in
Rate Chi-Square
P-value
16 555,849 317 57.03 638,024 230 36.05 -36.79 28.55 <.000117 557,993 306 54.84 640,103 284 44.37 -19.09 6.64 0.010018 541,423 339 62.61 637,158 385 60.42 -3.49 0.23 0.632819 572,815 316 55.17 658,934 335 50.84 -7.84 1.09 0.297420 575,712 306 53.15 656,951 324 49.32 -7.21 0.88 0.347521-24 2,331,907 1,300 55.75 2,505,619 1,228 49.01 -12.09 10.50 0.001225+ 24,531,405 7,882 32.13 28,135,895 8,991 31.96 -0.54 0.12 0.7239 Alabama Before After Population Number Rate Population Number Rate
Percent Change in
Rate Chi-Square
P-value
16 337,896 232 68.66 344,089 183 53.18 -22.54 6.71 0.009617 353,025 235 66.57 358,083 201 56.13 -15.68 3.16 0.075518 341,222 206 60.37 354,695 264 74.43 23.29 5.09 0.024019 356,925 257 72.00 363,441 274 75.39 4.70 0.28 0.596420 355,836 253 71.10 361,162 242 67.01 -5.76 0.44 0.509321-24 1,402,550 916 65.31 1,356,391 806 59.42 -9.01 3.83 0.050325+ 14,911,945 5,838 39.15 15,838,143 5,788 36.54 -6.65 13.79 0.0002 South Carolina Before After Population Number Rate Population Number Rate
Percent Change in
Rate Chi-Square
P-value
16 286,289 120 41.92 300,453 132 43.93 4.81 0.14 0.709217 298,994 133 44.48 317,600 168 52.90 18.92 2.23 0.134918 291,490 197 67.58 318,643 224 70.30 4.02 0.16 0.686719 309,390 175 56.56 333,955 211 63.18 11.70 1.17 0.278720 311,976 204 65.39 335,888 234 69.67 6.54 0.44 0.508221-24 1,258,835 747 59.34 1,244,555 775 62.27 4.94 0.88 0.346925+ 12,873,265 4,478 34.79 14,237,855 5,664 39.78 14.36 45.13 <.0001 Tennessee Before After Population Number Rate Population Number Rate
Percent Change in
Rate Chi-Square
P-value
16 399,159 239 59.88 423,456 231 54.55 -8.89 1.54 0.215617 402,611 268 66.57 430,360 242 56.23 -15.52 3.63 0.056718 389,264 289 74.24 426,157 332 77.91 4.93 0.36 0.549219 408,101 291 71.31 437,879 321 73.31 2.81 0.12 0.732220 408,573 285 69.76 435,493 302 69.35 -0.59 0.01 0.943321-24 1,641,313 1,021 62.21 1,651,956 994 60.17 -3.27 4207.16 <.000125+ 18,550,441 6,407 34.54 20,369,597 6,783 33.30 -3.59 4.40 0.0360

Table 7
Characteristics of Drivers Age 21 in Fatal Crashes in Georgia After Enactment of TADRA Compared With Drivers Age 21 in 1997 Before TADRA Enactment*
(Number and Rate per 100,000 Population)
Before After Age 21 in 1997 Age 21 in 2002
N Rate N Rate Driver History
Percent Change in Rate
Chi Square P-Value
Speeding Convictions 51 50.1 25 19.5 -61.1 16.06 <.0001Alcohol Convictions 7 6.9 2 1.6 -77.3 -- 0.04531
Other Convictions 29 28.5 12 9.4 -67.1 11.64 0.0006License Suspensions 26 25.3 9 7 -72.5 12.78 0.0004 Driver Crash Event Crashes 72 70.7 56 43.7 -38.2 7.45 0.0064Speeding Crashes 24 23.6 15 11.7 -50.4 4.71 0.0299Alcohol Crashes 27 26.5 9 7 -73.6 13.78 0.0002
*Before: January, 1992 to June, 1997; After: July, 1997 to December, 2002 1. Fisher’s Exact Test p-value
40

Appendix 5 Year-by-Year Teen Fatal Crash Rates for
Georgia, Alabama, South Carolina, and Tennessee: 1992 – 2002
Fatal Driver Crash Rates for 16-year-old Georgia Drivers
0
10
20
30
40
50
60
70
80
1992
1993
1994
1995
1996
1997
jan-
jun
1997
jul-d
ec
1998
1999
2000
2001
2002
Year
Rat
e pe
r 100
,000
41

Fatal Driver Crash Rates for 16-year-old Alabama Drivers
0
10
20
30
40
50
60
70
80
90
1992
1993
1994
1995
1996
1997
jan-
jun
1997
jul-d
ec
1998
1999
2000
2001
2002
Year
Rat
e pe
r 100
,000
Fatal Driver Crash Rates for 16-year-old South Carolina Drivers
0
10
20
30
40
50
60
1992
1993
1994
1995
1996
1997
jan-
jun
1997
jul-d
ec
1998
1999
2000
2001
2002
Year
Rat
e pe
r 100
,000
42

Fatal Driver Crash Rates for 16-year-old Tennessee Drivers
0
10
20
30
40
50
60
70
80
90
1992
1993
1994
1995
1996
1997
jan-
jun
1997
jul-d
ec
1998
1999
2000
2001
2002
Year
Rat
e pe
r 100
,000
43