Governor's Task Force on Climate Change Report
120
GOVERNOR’S TASK FORCE ON CLIMATE CHANGE REPORT PUBLISHED BY THE STATE OF WISCONSIN. DECEMBER 2020.
-
Upload
khangminh22 -
Category
Documents
-
view
2 -
download
0
Transcript of Governor's Task Force on Climate Change Report

G O V E R N O R ’S TA S K F O R C E O N
C L IM AT E C H A NGE RE P OR T
P U B L I S H E D B Y T H E S TAT E O F W I S C O N S I N . D E C E M B E R 2 0 2 0 .


G OV E R N O R ’ S TA S K F O R C E O N
C L I M AT E C H A N G E R E P O RTPublished by the state of Wisconsin. December 2020.
For more information, please see: https://climatechange.wi.gov
Suggested citation: State of Wisconsin. (2020). Governor’s Task Force
on Climate Change Report. Madison, WI.
Please remember to recycle. This report was printed on paper with post-
consumer recycled content and other sustainably harvested materials.
All photos courtesy of the Lt. Governor's Office and iStockphoto unless otherwise noted.
Cover photo provided by Travel Wisconsin.
Pictured on the inside front cover from top left to bottom right: Trevonna Simms, Pastor
Bridget Jones, Jessica LeClair, Dr. Chirantan Mukhopadhyay, Lieutenant Governor Barnes visits
Tomandl Farm, City of River Falls residents celebrate the switch to renewable energy (Credit:
Mike Noreen), Lieutenant Governor Barnes visits with members of the Bad River Band of Lake
Superior Chippewa, Dodge County Farmers Healthy Soil & Water (Credit: Tony Peirick), The Great
Lakes Indian Fish & Wildlife Commission Tribal Climate Adaptation Menu, Lieutenant Governor
Barnes tours storm damage with members of the St. Croix Chippewa Indians of Wisconsin, and
James Edward Mills leads an outdoor adventure with The Joy Trip Project.
i

LAND ACKNOWLEDGMENT
The task force would like to acknowledge that the
work that led to this report took place on land that
was stolen from Indigenous peoples, who have lived
in harmony with this land and its natural resources
since time immemorial. This work would not be
possible without wisdom and knowledge from the 11
federally recognized Native Nations and one federally
unrecognized Native Nation with whom the state
of Wisconsin shares geography: Bad River Band of
Lake Superior Chippewa, Forest County Potawatomi,
Ho-Chunk Nation, Lac Courte Oreilles Band of Lake
Superior Chippewa Indians, Lac du Flambeau Band of
Lake Superior Chippewa Indians, Menominee Indian
Tribe of Wisconsin, Oneida Nation, Red Cliff Band
of Lake Superior Chippewa, Sokaogon Chippewa
Community Mole Lake Band of Lake Superior
Chippewa, St. Croix Chippewa Indians of Wisconsin,
Stockbridge-Munsee Community Band of Mohican
Indians, Brothertown Indian Nation.
ACKNOWLEDGMENTS
We wish to acknowledge and appreciate the significant
contributions of the members of the Governor’s Task
Force on Climate Change. In addition, we are grateful
to the U.S. Climate Alliance for their support and
We offer our appreciation and acknowledgments for the significantcontributions of climate leaders, advocates, and organizations that went into the making of this report.
contributions, along with the long list of individuals
and organizations who provided expertise, including
The Bridge Studio, Wisconsin Initiative on Climate
Change Impacts, RENEW Wisconsin, Wisconsin Clean
Cities, 1000 Friends of Wisconsin, Organic Valley,
Great Lakes Indian Fish & Wildlife Commission,
Monroe County Climate Change Task Force, Dodge
County Farmers Healthy Soil & Water, Midwest
Energy Research Consortium, Great Plains Institute,
Urban Footprint, City of River Falls, City of Milwaukee,
University of Wisconsin Sustainability, Electa
Quinney Institute for American Indian Education,
Groundwork Milwaukee, Health Care Without Harm,
Mary Griggs Burke Center for Freshwater Innovation
Northland College, The Joy Trip Project, City of
Bayfield, Oneida Nation, Badger Rock Community
Center, Marathon County Conservation, Planning, and
Zoning Department, Walnut Way Conservation Corp,
Midwest Renewable Energy Association, Wisconsin
Bike Fed, Trevonna Simms, Pastor Bridget Jones,
Dr. Chirantan Mukhopadhyay, and Jessica LeClair. We
also wish to express our thanks to the state agency
staff who provided invaluable support, and to the
many members of the public who attended meetings
and listening sessions, submitted public comment, and
shared their expertise.
i i

C O N T E N T S
ACKNOWLEDGMENTS ii
FOREWORD
Letter from Lieutenant Governor Mandela Barnes 3
A Message from the Governor’s Task Force on Climate Change 5
EXECUTIVE SUMMARY 6
Governor Evers’ and Lieutenant Governor Barnes’ Climate Leadership 6
and the Governor’s Task Force on Climate Change
Task Force Members 7
Climate Solutions 8
The Task Force by Numbers: Community Voice + Participation 10
Environmental Justice 12
HOW CLIMATE CHANGE IS IMPACTING WISCONSIN 14
The Human and Economic Costs 14
The Science 14
Wisconsin’s Current Greenhouse Gas Emissions 16
ADVOCATES FOR CHANGE 18
CLIMATE SOLUTIONS 21
Climate Justice & Equity 22
Energy 28
Transportation 44
Agriculture 50
Resilient Systems 58
Clean Economy 66
Education 76
Food Systems 80
Forestry 86
Tier 2 92
1

“ The people are ready for change. The people are demanding change. Farmers are choosing more sustainable agricultural practices. Utility companies are investing in renewable energy. And our local communities are reforming their policies to promote greener, cleaner economies.” Lieutenant Governor Mandela Barnes Chair of the Governor’s Task Force on Climate Change
2

F O R E W O R D
Letter from Lieutenant Governor Mandela Barnes
Just months before Governor
Evers named me chair of his
Governor’s Task Force on
Climate Change, I spent a summer
day touring storm damage in
northern Wisconsin. While storm
damage tours are a common duty
for governors and lieutenant gover-
nors, this tour was different. Four-
teen tornadoes had hit Wisconsin
in a span of two days. The people I
met with were overwhelmed with
the destruction that stood before
us—most unsure of how they would
recover. Farms that had been in
families for generations were gone.
Since I took office, much of my time
as lieutenant governor has been
spent learning about the impact
climate change has been having on
our state. Extreme weather gener-
ates a costly toll on farmers and
their crops. Flooding is impacting
homes, infrastructure, and water
quality. Deadly cold spells have
shut down our state. And our Great
Lakes are experiencing a period
of record-high water levels, which
has grave consequences for coastal
ecosystems and will cost communi-
ties millions of dollars.
But more alarming is that the health
and well-being of every citizen
in this state is in grave danger
because of the changing climate.
Many have already been harmed by
human-caused climate change, and
further health risks are imminent if
we don’t take urgent action.
That’s why Governor Evers created
this task force. Our charge is to
combat the crisis at hand, to do so
in a way that weds science and data
with the experiences of citizens in
the state, to learn how different
communities and industries have
been impacted, and to learn from
those that are already leading the
way in combatting this crisis.
And that’s exactly what this task
force did. We focused our work on
the people of Wisconsin. We united
a diverse coalition—representing
different perspectives, communi-
ties, and industries—with a shared
vision to make Wisconsin a cleaner,
safer, and more equitable state.
We also focused on listening to
the voices that have gone unheard
by past leaders of this state and
nation—the voices of people of
color and low-income communities,
whose air and water are more likely
to be polluted but whose communi-
ties are far less likely to be included
in policymaking. These voices must
be part of the conversation and
drive solutions—anything less will
continue the long pattern of
environmental racism we have
witnessed in this country.
The policy solutions you will find
in this report lay the foundation
for our state to become a leader
in tackling the climate crisis. And
while adopting those policies is an
important first step, it’s clear that
our state must continue to take
bold, aggressive actions in order
to protect our precious natural
resources and preserve our beau-
tiful outdoor spaces.
The climate crisis has been
hundreds of years in the making,
and we know that we will not solve
it with one set of recommendations
or one biennial state budget, but
our state has let this crisis go unad-
dressed for too long.
The people are ready for change.
The people are demanding change.
Farmers are choosing more
sustainable agricultural practices.
Utility companies are investing in
renewable energy. And our local
communities are reforming their
policies to promote greener, cleaner
economies.
We can and must make Wisconsin a
place where everyone can grow up
in a safe and clean environment and
has the opportunity to thrive, no
matter their ZIP Code.
Lieutenant Governor Mandela Barnes
Chair of the Governor’s Task Force on Climate Change
3
“ While the climate crisis and COVID-19 pandemic are distinct, the known systemic impacts are not. Like COVID-19, climate change is a global phenomenon requiring massive structural transformations of economic and social institutions.” Kristofer James Canto
Chair, Healthy Communities and a Strong Economy Subcommittee,
Governor’s Task Force on Climate Change
4

A s the task force met over
the course of 2020, the
U.S. experienced another
unprecedented year of extreme
heat, wildfires, hurricanes, and
flooding. The devastation of these
disasters impacted the lives and
livelihoods of Americans already
struggling to cope during a world-
wide pandemic.
While the climate crisis and
COVID-19 pandemic are distinct,
the known systemic impacts are
not. Like COVID-19, climate change
is a global phenomenon requiring
massive structural transformations
of economic and social institutions.1
The effects of climate change tran-
sect all sectors, geographies, and
people. And while we all experi-
ence these changes, low-income
communities and communities
of color are disproportionately
impacted, bearing the most severe
consequences.
Failing to act swiftly and leaving
the climate crisis to manifest
unchecked will continue to wreak
havoc across the nation and in the
great state of Wisconsin. Concep-
tualizing the magnitude of the
problem is challenging. However,
we know that this global phenom-
enon is experienced locally.
Wisconsin’s climate is changing.
Climate challenges include more
hot, humid weather with more
intense and more frequent heavy
rainfalls, as well as freezing winter
rain instead of snow, followed by
deep winter freezes (such as those
from a polar vortex). These changes
affect the stability of Wisconsin’s
economic sectors as well as human
health and safety.2 Immediate
action is necessary.
• We must develop opportunities
to mitigate carbon emissions
and increase renewable energy;
• We must enhance our infra-
structure’s adaptive capacity
and strengthen overall environ-
mental, economic, and social
resilience;
• We must educate and train
our workforce with the skills
needed for a transition to a
low-carbon economy; and
• We must ensure all actions
are equitable and intention-
ally minimize unintended and
disproportionate impacts.
This is the first step in bold and
courageous action. Developed
collaboratively by appointees
from all sectors, institutions, and
communities across the state—
and under the leadership of
Lieutenant Governor Mandela
Barnes—it is with great pleasure
and responsibility that the
Governor’s Task Force on Climate
Change presents the following
recommendations for consideration
by Governor Tony Evers and the
Wisconsin State Legislature.
F O R E W O R D
A Message from the Governor’s Task Force on Climate Change
Kristofer James Canto
Chair, Healthy Communities and a Strong Economy
Subcommittee, Governor’s Task Force on Climate Change
5

Governor Evers’ and Lieutenant Governor Barnes’ Climate Leadership and the Governor’s Task Force on Climate Change
Recognizing the importance of addressing climate
change, Governor Evers and Lieutenant Governor
Barnes are committed to championing innovation and
inclusive, forward-leaning actions that make Wisconsin
a leader in reducing greenhouse gas (GHG) emissions
and preparing for the impacts of climate change. This
commitment was first demonstrated in Governor
Evers’ February 2019 announcement—just a few
months after he was elected—that he would join the
U.S. Climate Alliance, a bipartisan coalition
of 25 governors committed to implementing policies
that advance the goals of the Paris Agreement: to
reduce GHG emissions to 26–28 percent below
2005 levels by 2025.3
Following this announcement, on August 16, 2019,
Governor Evers issued Executive Order #38, which
established the Wisconsin Office of Sustainability and
Clean Energy. He charged the office with: 1) achieving
a goal of 100 percent carbon-free electricity by 2050;
2) ensuring Wisconsin is reducing emissions in line
with the Paris Agreement; 3) developing a clean energy
plan; 4) promoting clean energy workforce training; 5)
fostering clean energy innovation, research, and busi-
ness development; and 6) developing efficiency stan-
dards for new and existing state buildings.4
Further, on October 17, 2019, Governor Evers, along
with Lieutenant Governor Barnes, signed Executive
Order #52, establishing the Governor’s Task Force
on Climate Change (task force). The task force was
charged with developing policy recommendations
to meaningfully mitigate and adapt to the effects of
climate change for the benefit of Wisconsin commu-
nities. The task force’s list of policy recommendations
were to be delivered to the governor on or before
August 31, 2020; however, due to the challenges of the
COVID-19 pandemic, this deadline was extended.
E X E C U T I V E S U M M A R Y
Appointed as task force chair by Governor Evers,
Lieutenant Governor Barnes kicked off the first meeting
of the 32-member task force in December 2019. Task
force members met regularly in public meetings from
December 2019 to October 2020. In order to more
thoroughly develop and discuss climate solutions,
the task force formed three subcommittees: Healthy
Communities and a Strong Economy; Land Use and
Conservation; and Energy, Housing, Infrastructure, and
Transportation. Expert guests were invited to present
at both full-member meetings and subcommittee
meetings. In addition to these public meetings, the task
force hosted five virtual listening sessions and called
for written public commentary.
The recommendations found in this report are
intended to lay the foundation for the state to better
adapt to and mitigate the effects of climate change,
while also seeking economic opportunities in renew-
able energy and conservation. This report provides an
array of policy options, along with a variety of imple-
mentation strategies. Because the economic and
human costs of climate change are far too great to
ignore, it is imperative that the Governor, his admin-
istration, and the state legislature all take meaningful
action to combat the climate crisis. While the COVID-19
pandemic has created significant barriers for our
state, including fiscal barriers, there is opportunity to
stimulate the economy through job creation in clean
energy and conservation. While a full economic anal-
ysis has not been done on the policies listed within
this report, the task force did discuss fiscal challenges
and encourage future conversations on fiscal cost to
include the long-term costs of climate change—both
for the economy and the people of our state.
6

Lieutenant Governor Mandela Barnes, Chair
Secretary Preston Cole, Department of Natural Resources
Secretary Randy Romanski, Department of Agriculture, Trade & Consumer Protection
Pamela R. McGillivray, Department of Workforce Development
Dr. Darrell L. Williams, Wisconsin Emergency Management
State Senator Mark Miller, Monona
State Representative Mike Kuglitsch, New Berlin
State Representative Greta Neubauer, Racine
August Ball, Founder/CEO, Cream City Conservation & Consulting, LLC, Milwaukee
Kristofer Canto, Enterprise Risk Management Senior Analyst, American Family Insurance, Madison
Stacy M. Craig, Environmental Stewardship Advocate, Mason
Jeffrey Crawford, Attorney General, Forest County Potawatomi Community, Milwaukee
Robert “Bert” Garvin, Executive Vice President - External Affairs, WEC Energy Group, Milwaukee
Paul Graham, President, Central Waters Brewing Company, Amherst
Anna Haines, Professor of Natural Resource Planning, Director of the Center for Land Use Education and Wisconsin Center for Environmental Education , University of Wisconsin - Stevens Point, Stevens Point
Bill Hogseth, Watershed and Organizing Coordinator, Wisconsin Farmers Union, Chippewa Falls
Dylan Jennings, Ba d River Band of the Lake Superior Tribe of Chippewa Indians, and Director, Public Information Office, Great Lakes Indian Fish & Wildlife Commission, Odanah
Sheri Johnson, Director, Population Health Institute, Associate Professor (CHS), Department of Population Health Sciences, University of Wisconsin Madison School of Medicine and Public Health, Madison
Amber Meyer Smith, Vice President of Programs and Government Relations, Clean Wisconsin, Madison
Kathleen “Katie” McGinty, Vice President, Global Government Relations, Johnson Controls, Inc., Milwaukee
Robert Nigh, Board Member, Wisconsin Farm Bureau Federation, Viroqua
Rob Palmberg, Vice President – Strategic Planning, Dairyland Power Cooperative, La Crosse
Mike Peters, President/CEO, WPPI Energy, Sun Prairie
Chris Polla ck, Member, Wisconsin Farm Bureau Federation, Ripon
H. Jeffery Rafn, Ph.D, President, Northeast Wisconsin Technical College, Green Bay
Doug Rebout, Roger Rebout & Sons Farms, Janesville
Stephanie Salgado, Youth Climate Action Team, Madison
Kerry Schumann, Executive Director, Wisconsin Conservation Voters, Madison
Kirsten Shead, Co-Executive Director, Milwaukee Water Commons, Milwaukee
Mark Stoering, President - Wisconsin, Michigan, Xcel Energy, Eau Claire
Bob Stone, Assistant Business Manager/Business Agent We Energies, International Brotherhood of Electric Workers, Local 2150, Menominee Falls
Krystal Westfahl, Executive Director, Minocqua Area Chamber of Commerce, Minocqu a
The task force represents an array of industries and
communities—from industry professionals to youth
activists, from elected and Tribal officials to entrepre-
neurs. These diverse perspectives are further informed
by research and data from climate scientists, subject
matter experts, and public participation.
The task force members were selected by Governor
Evers and Lieutenant Governor Barnes to broadly
represent Wisconsinites from across the state. All
participants actively participated in the development of
the recommendations, and the diverse opinions of task
force members and the public were taken into consid-
eration. As such, these recommendations should
be taken as a package; not all members agreed with
each specific recommendation, but members agreed
that these recommendations reflected the general
consensus of the task force and should be forwarded
to the Governor.
LIST OF TASK FORCE MEMBERS
TA S K F O R C E M E M B E R S
7
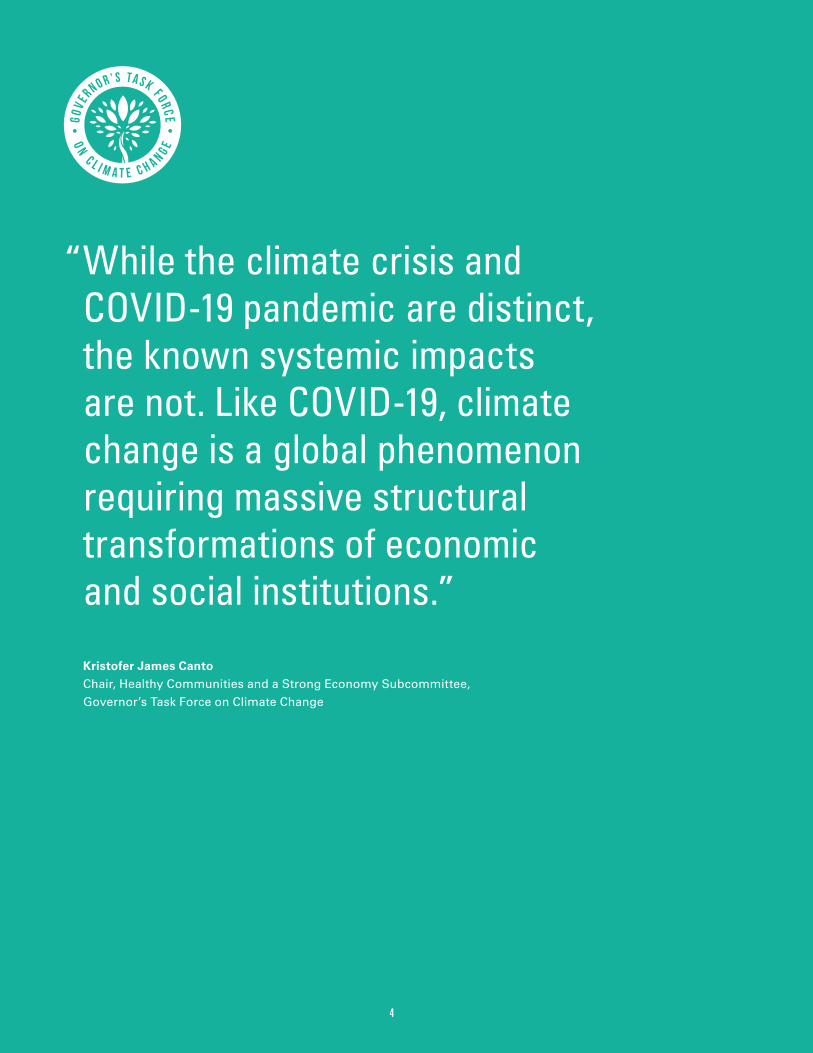
C L I M AT E S O L U T I O N S * | 9 S E C T O R S | 3 P O L I C Y PAT H WAY S P O L I C Y P A T H W A Y S I N C L U D E : E X E C U T I V E / A G E N C Y A C T I O N ( E A ) 2 0 2 1 – 2 0 2 3 S T A T E B U D G E T ( S B ) L E G I S L A T I O N ( L E )
CLIMATE JUSTICE & EQUITY
01 Create an Office of Environmental Justice p. 23 E A S B L E
02 Improve the state consultation process with Native Nations p. 24 E A S B L E
03 Mandate a racial disparity impact study p. 26 E A S B L E
04 Implement anti-racism education p. 26 E A S B L E
E N E R G Y
05 Improve data collection p. 29 E A S B L E
06 Develop electricity storage and microgrids for critical infrastructure p. 30 E A S B L E
07 Increase energy use reduction goals p. 32 E A S B L E
08 Expand Wisconsin’s Focus on Energy® funding p. 33 E A S B L E
09 Support load management p. 34 E A S B L E
10 Support low-cost debt financing of customer clean energy projects p. 35 E A S B L E
11 State lead by example p. 37 E A S B L E
12 Update state commercial and residential building energy codes p. 38 E A S B L E
13 Set utility carbon-reduction goals p. 40 E A S B L E
14 Support community solar p. 40 E A S B L E
15 Update interconnection standards p. 41 E A S B L E
16 Require analysis on the social cost of carbon p. 42 E A
S B L E
T R A N S P O R TAT I O N
17 Climate and environmental justice audited transportation planning and development p. 46 E A S B L E
18 Promote public transit and green public transportation p. 47 E A S B L E
19 Support hybrid-electric vehicles, electric vehicles, and infrastructure p. 48 E A S B L E
20 Safe, clean, and complete streets p. 49 E A S B L E
A G R I C U LT U R E
21 Support farmer-led watershed groups p. 51 E A S B L E
22 Pay farmers to increase soil carbon storage in agricultural and working lands p. 52 E A S B L E
23 Avoid conversion of natural working lands p. 55 E A S B L E
24 Make managed grazing livestock production systems an agricultural priority p. 56 E A S B L E
R E S I L I E N T S Y S T E M S
25 Update rules and increase collaboration on rainfall models strategies p. 59 E A S B L E
26 Focus on wetlands p. 60 E A S B L E
27 Create a flood resilience plan with a focus on urban- and rural-specific
watershed action
p. 62 E A S B L E
28 Fund and execute a statewide climate risk assessment and resilience plan p. 63 E A S B L E
29 Establish local control for waste p. 64 E A S B L E
8

C L E A N E C O N O M Y
30 Establish a Green Energy Advisory Council p. 68 E A S B L E
31 Create and deploy workforce transition plans p. 68 E A S B L E
32 Support public post-secondary educational entities p. 70 E A S B L E
33 Create new jobs through conservation and prepare individuals for work
within the green energy sector
p. 71 E A S B L E
34 Create a Wisconsin Economic Development Corporation Green Grant
and Loan program
p. 72 E A S B L E
35 Conduct a complete analysis and create a pathway to participate in
or implement carbon pricing that is optimal for Wisconsin
p. 74 E A S B L E
E D U C AT I O N
36 Expand support for teaching K-12 Climate Science and creating
climate resilient schools
p. 77 E A S B L E
37 Launch a climate change public education campaign p. 78 E A S B S B
F O O D S Y S T E M S
38 Increase funding to support local food systems p. 81 E A S B L E
39 Develop a food waste program p. 82 E A S B L E
40 Create a Manoomin (Wild Rice) Stewardship Council in partnership
with interested Native Nations
p. 83 E A S B L E
41 Create a statewide subsistence adaptation plan p. 84 E A S B L E
F O R E S T R Y
42 Prioritize forest conservation to "keep forests as forests" p. 87 E A S B L E
43 Pursue reforestation in rural areas p. 88 E A S B L E
44 Encourage tree planting in urban areas p. 89 E A S B L E
45 Implement climate-focused forest management p. 90 E A S B L E
46 Support Wisconsin wood product utilization p. 91 E A S B L E
T I E R 2 * *
47 Avoid all new fossil fuel infrastructure p. 93 E A S B L E
48 State divestment of fossil fuel stocks and other interests p. 93 E A
S B L E
49 Allow third party renewable financing (solar/energy generation) p. 95 E A S B L E
50 Develop strategies for the cost-effective early closure and reduced use
of coal facilities
p. 95 E A S B L E
51 Work with Midcontinent Independent System Operator and stakeholders
to focus on enhancing opportunities and financial value for clean distributed
energy resources
p. 96 E A S B L E
52 Maximize co-benefits and related financial value from clean energy projects p. 97 E A S B L E
53 Modernize rate design p. 99 E A S B L E
54 Promote the use of clean transportation fuels to ensure immediate and long-term
emissions reductions
p. 99 E A S B L E
55 Encourage antitrust enforcement p. 101 E A S B L E
* The climate solutions listed here are not organized by priority or ranking. ** Tier 2 policy options are proposals that were raised and, to some extent, discussed during the task force process or brought up during the
public hearing and public comment period. Each of these options drew both support and concern from task force members, a reflection of the diversity of perspective and worldview of the members. They are included as Tier 2 proposals to indicate they may merit further discus-sion and consideration outside of the work of the task force.
9

T H E TA S K F O R C E B Y N U M B E R S :
C O M M U N I T Y V O I C E + PA R T I C I PAT I O N
PA R T I C I PAT I O N
9 5 % c o u n t i e s p a r t i c i p a t i n g
5 1 3 o n l i n e p u b l i c c o m m e n t s s u b m i tte d
I N D U S T R I E S R E P R E S E N T E D O N T H E TA S K F O R C E :Environmental justice advocates,
environmental organizations, corporations,
Native Nations, utilities, small businesses,
farmers and farm organizations, public health
professionals, technical colleges, universities,
youth, tourism, labor unions, state legislature,
and state agencies.
One of the task force’s goals was to incorporate citizen views, concerns, and ideas into climate recommendations. The task force was largely successful in doing so. More than 1,000 Wisconsinites participated in listening sessions and individuals from all but three of the 72 counties in Wisconsin participated in some way. The task force also received over 500 written comments related to the climate crisis in Wisconsin.
P E O P L E
3 2 t a s k fo rc e m e m b e r s
1, 0 0 0 + l i s te n i n g s e s s i o n p a r t i c i p a n t s
E V E N T S
3 4 e x p e rt p re s e n t a t i o n s
5 v i r tu a l l i s te n i n g s e s s i o n s
2 1 s u b c o m m i tte e m e e t i n g s
5 m e m b e r m e e t i n g s
1 0

6 9 o u t o f 7 2 C o u n t i e s P a r t i c i p a t e d
WAS
HIN
GTON
SHEBOYGAN
FOND DU LAC
CALUMETWINNEBAGOWAUSHARA
MARQUETTE
GREE
N L
AKE
COLUMBIA DODGE
JEFFERSON WAUKESHA
WALWORTHROCK RACINE
KENOSHA
MIL
WAU
KEE
GREENLAFAYETTE
IOWA
DANE
SAUK
RICHLAND
CRAWFORD
VERNON
LA CROSSE
MONROE
JUNEAU ADAMS
MAN
ITOW
OC
KEW
AUN
EE
DOOR
BROWN
OUTAGAMIE
WAUPACAPORTAGEWOOD
JACKSON
TREM
PEAL
EAU
BUFFALO
EAU CLAIRE
PEPIN
PIERCE
ST. CROIXCHIPPEWA
TAYLOR
MARATHON
LINCOLN
LANGLADE
SHAWANO
MENOMINEE
OCONTO
MARINETTE
FLORENCE
ONEIDA
PRICE
ASHLAND
SAWYERBAYFIELD
RUSKBARRON
DUNN
POLK
WASHBURN
DOUGLAS
BURNETT
GRANT
VILAS
OZAU
KEE
1 1

Decades ago, Professor Robert Doyle Bullard, who
some consider to be the father of environmental
justice, said this about the environment and the action
of institutions: “Whether by conscious design or
institutional neglect, communities of color in urban
ghettos, in rural ‘poverty pockets’, or on economically
impoverished Native-American reservations face some
of the worst environmental devastation in the nation.”5
Since then, studies have proven that environmental
racism is very real and has had a profound impact on
the health and well-being of Black, Indigenous, and
other communities of color (BIPOC) and low-income
communities. A 2018 U.S. Environmental Protection
Agency (EPA) study found that pollution dispropor-
tionately affects BIPOC communities.6 They are more
likely to live near and breathe polluted air, as are
people who experience poverty. A 2016 joint study
from the National Association for the Advancement
of Colored People, Clean Air Task Force, and National
Medical Association found that Black Americans are
more likely to live in close proximity to fossil fuel facili-
ties and be exposed to the toxins they emit. The report
concluded that “the life-threatening burdens placed on
communities of color near oil and gas facilities are the
result of systemic oppression perpetuated by the tradi-
tional energy industry, which exposes communities to
health, economic, and social hazards.”7
In Wisconsin, the Sierra Club notes that working-class
communities are subject to pipelines and their poten-
tial threats, and low-income communities are exposed
to fracking, mining, and hazardous waste.8 In 2016,
Wisconsin received a failing grade in a report by the
Center for Effective Government. The report analyzed
how many people of color and low-income residents
live within close proximity to dangerous chemical
facilities.9
While study after study has proven that BIPOC and
low-income communities have been adversely
affected by environmental policies, the stories and
voices of these communities have also affirmed that
environmental racism exists and is harming their
communities. That is why the task force made envi-
ronmental justice a focus of its work and aspired to
incorporate equity into its recommendations. While
task force members participated in multiple envi-
ronmental racism presentations, invited experts
from communities of color and rural communities
to present at meetings, and analyzed recommen-
dations with an equity lens, it must be noted that
there is still much more work that can and should
be done to ensure policies adopted by the state do
not disproportionately affect BIPOC and low-income
communities. Much more intentional work by the task
force and the state of Wisconsin is needed to truly
adopt equitable policies. In addition, environmental
discussions and decisions must include the voices
and perspectives of those most impacted by their
outcome, and there must be significantly more diverse
representation throughout the policymaking
process. Lastly, in order to achieve environmental
justice in Wisconsin, government bodies—along
with others including corporations, nonprofit orga-
nizations, foundations, financial institutions, and the
education system—must confront the racism and
bias that exist within their systems. More impor-
tantly, it’s crucial that elected leaders and executives
begin making decisions that put people over profit.
E N V I R O N M E N TA L J U S T I C E
1 2

There is still much more work that can and should be done to ensure policies adopted by the state do not disproportionately affect BIPOC and low-income communities.
It’s crucial that elected leaders and executives begin making decisions that put people over profit.
1 3

THE HUMAN AND ECONOMIC COSTS
Whether it be the loss of life during an extreme weather
event, long-term illness due to air pollution, or the
costly economic toll climate change is having on
farmers and rural communities, the changing climate
is impacting everyone.
Climate inaction is projected to have tremendous health
and economic costs, and recent studies have indicated
that these costs are already weighing on Americans. A
2019 study found that ten climate-sensitive events that
occurred throughout the country—including extreme
heat in Wisconsin, harmful algal blooms in Florida, and
Western wildfires—resulted in an estimated $10 billion
in health costs.10 In Wisconsin, this extreme heat event
caused elevated levels of heat stress, heat stroke, and
heat exhaustion. Since then, Wisconsin has experi-
enced additional extreme weather events, including
tornadoes, flooding, and polar vortexes. In 2019, a polar
vortex brought Wisconsin one of its longest stretches
of sub-zero temperatures with some parts of the state
experiencing wind chill down to minus 60ºF.11
In economic costs, Wisconsin communities have
already suffered tens to hundreds of millions of dollars
of damage over the past decade due to extreme precip-
itation. Increased precipitation is leading to increased
flooding and storm surge, which impact communi-
ties and industries along the Mississippi River and
the Great Lakes as well as tourism along Wisconsin’s
waterways and beachfronts. A wetter, warmer climate
also increases precipitation and temperature vari-
ability. These swings in extremes are already nega-
tively impacting Wisconsin’s agriculture and livestock
sectors, which depend on predictable weather patterns.
According to the National Oceanic and Atmospheric
Administration’s Billion-Dollar Weather and Climate
Disasters database, between 2000 and 2020 there were
19 severe storm, two flooding, and six drought-related
billion-dollar disasters that affected Wisconsin to the
tune of $100 billion in impacts.12
T H E S C I E N C E
The climate has changed. Since the 1880s, the global
average surface temperature has increased by approx-
imately 1°C (2°F). Nineteen of the 20 warmest years on
record have all occurred since 2001.13 Even if the world
meets its current commitments set under the Paris
Agreement, the globe is projected to warm up to 3.1°C
by 2100.14
Global climate change impacts regions, commu-
nities, and populations unequally. The Wisconsin
Initiative on Climate Change Impacts (WICCI), a state-
wide collaboration of scientists and stakeholders, has
evaluated these impacts on Wisconsin since 2007. In
a recent report, WICCI identified how climate change
is impacting Wisconsin broadly and specifically, and
which communities will bear disproportionate conse-
quences.15 Many of these projections and findings are
consistent with the 2011 WICCI Assessment and add
further detail, analysis, and confidence to the findings
and projections from then.
Since the 1950s, Wisconsin has warmed 2.1°F and
its annual precipitation has increased by 15 percent
(4.5 inches). While winters have warmed faster than
summers, the number of extremely hot days (days
with temperatures exceeding 90°F) and hot nights
is expected to triple and quadruple, respectively, by
2050, assuming GHG emissions continue to rise. These
broader increases in precipitation and warming are
likely to drive more extreme weather events, such as
floods and heatwaves, which will affect Wisconsin’s
communities and industries in unequal ways.
In the case of extreme heat, southern Wisconsin will be
hit particularly hard if it experiences 80 to 90 extremely
hot days per year, as is currently projected for mid-cen-
tury. In this scenario, communities of color, the elderly,
H O W C L I M AT E C H A N G E I S I M PA C T I N G W I S C O N S I N
1 4

Data
: NOA
A Gl
obal
Lan
d an
d Oc
ean
Tem
pera
ture
http
://w
ww
.ncd
c.no
aa.g
ov/c
ag P
lot p
rodu
ced
by th
e W
isco
nsin
Initi
ativ
e on
Clim
ate
Chan
ge Im
pact
s
Days per Year
Days per Year with TMAX > 90ºF 1981–2010 Condition (Historical)
Global Temperature from 1880–2019
Days per Year with TMAX > 90ºF2041–2060 Condition (RCP 4.5)
0 5 10 15 20 25 30 35 40 45
Colder than 20th Century Average Warmer than 20th Century Average
1880
1890
1900
1910
1920
1930
1940
1950
1960
1970
1980
1990
2000
2010
2020
-0.4
-0.2
0
0.2
0.4
0.6
0.8
1
ºC ºF
-0.72
-0.36
0
0.36
0.72
1.08
1.44
1.8
Sour
ce: N
elso
n In
stitu
te C
ente
r for
Clim
atic
Res
earc
h UW
-Mad
ison
Map
s pr
oduc
ed b
y th
e W
isco
nsin
Initi
ativ
e on
Clim
ate
Chan
ge Im
pact
s
Number of days per year when the temperature exceeds 90°FHistorical extreme heat frequency (left) and mid-century extreme heat frequency (right) for a low-end emissions scenario (RCP 4.5)
1 5

individuals with existing health conditions, and
economically disadvantaged communities who lack
sufficient cooling capabilities will face disproportionate
impacts. Increased warming is leading to decreased
snowpack and warmer winters, and threatening
Wisconsin’s iconic coldwater fisheries by shifting the
range of temperature tolerance beyond many species’
survivability. Extreme heat is also leading to harmful
algal blooms in lakes, the proliferation of infectious
diseases and pests, and increased storm surge along
beaches and marinas. These realities disproportion-
ately affect outdoor recreation and tourism industries
that depend on the health and stability of these natural
resources.
Black, Indigenous, other communities of color, and
low-income communities within Wisconsin are already
disproportionately impacted by air pollution and
flooding. Wisconsin is home to 11 federally recognized
Native Nations and one non-state or federally recog-
nized Nation, which hold strong cultural, spiritual,
health, and economic ties to fisheries, native habi-
tats, and wild species and cultivars that are strained
by increased warming and precipitation. Some under-
represented coastal communities may have lower
tax bases, so they are less able to respond to and
rebuild from extreme storm and contamination events.
Increased global warming will further exacerbate these
socio-economic inequities and potentially bring others
to light without ambitious, state-led climate action.16
W I S C O N S I N ’ S C U R R E N T G R E E N H O U S E
G A S E M I S S I O N S
In August 2020, the Department of Natural Resources
(DNR) published the Wisconsin Greenhouse Gas Emis-
sions Inventory Report for the state’s Office of Sustain-
ability and Clean Energy and the task force.17 The
DNR used the EPA’s State Inventory Tool to estimate
Wisconsin’s emissions for the years 2005 and 2017, and
emissions trends from 1990 through 2017.
In 2017, the electricity sector accounted for most of
Wisconsin’s GHG emissions (33 percent), followed by
transportation (24 percent), agriculture (15 percent),
industrial energy use and processes (14 percent),
residential and commercial building energy use (13
percent), and waste (1 percent). At the same time, the
state’s emissions decreased by 9 percent between
2005 and 2017, primarily driven by decreasing carbon
intensity of the electricity sector. Every sector’s emis-
sions decreased between 2005 and 2017 except for
industrial processes and agriculture, with agriculture
accounting for the largest increase on an absolute
emissions basis. In addition, Wisconsin’s carbon-se-
questering forests and natural lands lost over 25
percent of their carbon sink capability between 2005
and 2017 due to intensified agriculture and the conver-
sion of cropland to urban development.18
1 6

33% Electricity
24% Transportation
15% Agriculture
11% Industrial
8% Residential
5% Commercial
3% Industrial Processes
1% Waste
81% Carbon Dioxide (CO2)
10% Methane (CH4)
7% Nitrous Oxide (N2O)
2% Fluorinated Gases (HFC, PFC, SF6)
2017 WISCONSIN EMISSIONS
BY SECTOR
2017 WISCONSIN EMISSIONS
BY GREENHOUSE GAS
Charts originally produced by the Wisconsin Department of Natural Resources for the 2020 Wisconsin Greenhouse Gas Emissions Inventory Report. Data sourced from EPA's State Inventory Tool, https://www.epa.gov/statelocalenergy/state-inventory-and-projection-tool
1 7

A D V O C A T E S F O R C H A N G E
Trevonna Simms MILWAUK E E , W I
“Many folks in the Milwaukee community have not seen jobs with
livable wages in decades due to deindustrialization, making it harder to live a quality—let alone energy-
effi ient—life.
Our deteriorating homes are the biggest cause of my community’s
carbon footprint that cost us money and health problems with little job
opportunities to fix our climate issues.
This climate crisis does not look the same outside of Milwaukee but there’s still a lack of urgency statewide. Our state is behind on becoming more energy efficient compared to our
neighbors in Illinois and Minnesota because our state lacks opportunities
to create more clean and energy- efficient communities.
For the sake of the most marginalized folks in rural and urban areas, we need the opportunities to create an economy that would better their lives, health, and
ultimately their community.”
Pastor Bridget Jones SUP E RIOR , W I
“When we talk about sustainability, especially in the Northland, often job creation is set against environmental protection. But in the Judeo-Christian tradition, humans were first created to care for the world God made, and I believe that is still our job before
anything else.
In addition to loving God, who created the whole Earth, the other job we were
given is to care for our neighbors. And God makes it clear that the most vulnerable among us deserve special
care. So often climate change, pollution, environmental degradation, and
resource depletion disproportionately affect poor communities and
communities of color.
Fortunately, it is possible to care for the Earth, care for our neighbors,
and have a robust economy. Tran-sitioning away from fossil fuels like fracked gas and toward renewables
allows our state to move forward into a bright, clean, sustainable future while
joining God’s work of healing and renewing the Earth.”
1 8

Jessica LeClair M A DISON, W I
“As a public health nurse, I have witnessed how accelerated climate
change has affected the health of our communities for more than a decade. Some communities are closer to the front lines of the climate crisis than others because of environmental
racism. Within these communities there are extremely vulnerable populations, such as people who are very young, very old, pregnant, and living with chronic health conditions. These
populations are experiencing health inequities due to disproportionate exposure to fl oding, heat waves,
extreme weather, and other symptoms of climate change.
Working to slow down the damage to our climate is a net gain with the
health and social justice lens. Promoting health and racial equity should be a central component of strategies
designed to combat the climate crisis. Climate justice recognizes climate change as a human and civil rights
issue, and we must engage this opportunity for a more equitable
and sustainable Wisconsin.”
Dr. Chirantan Mukhopadhyay MILWAUK E E , W I
“As medical students we learned about the many ‘determinants’ of health,
focusing on the physical, mental, and social. Now the medical community
is realizing how important our natural world is in keeping us healthy
and is speaking out about the importance of the ecological or
environmental determinants of health.
You can’t be healthy if the water you drink is tainted, if the air you breathe
isn’t clean, or if climate instability creates conditions for worsening wild-fires, fl oding, storms, and the inability to grow food. The climate crisis is nega-
tively impacting the health and well-being of people all around the world, especially communities of color and
children, including right here in Wisconsin.
If we address the grave threat to our health that climate change represents,
we have an opportunity to create a safe, secure, and healthy future for our patients and our children. We must take
decisive action now.”
1 9

2 0

C L I M A T E S O L U T I O N S A C R O S S 9 S E C T O R S | 3 P O L I C Y P A T H W A Y S
CL IM AT E JUS T ICE & EQ UI T Y p. 22
4 STRATEGIES
ENERGY p. 28
12 STRATEGIES
T R A NSP OR TAT ION p. 44
4 STRATEGIES
AGRICULT URE p. 50
4 STRATEGIES
RE SIL IEN T SYS T EMS p. 58
5 STRATEGIES
CL E A N EC ONOM Y p. 66
6 STRATEGIES
EDUC AT ION p. 76
2 STRATEGIES
F OOD SYS T EMS p. 80
4 STRATEGIES
F ORE S T RY p. 86
5 STRATEGIES
T IER 2 p. 92
9 STRATEGIES
POLICY PATHWAYS INCLUDE: E X E C U T I V E / A G E N C Y A C T I O N ( E A )
2 0 2 1 – 2 0 2 3 S T A T E B U D G E T ( S B )
L E G I S L A T I O N ( L E )
2 1

C limate change is not only an
issue of GHG emissions and
global temperatures. As the climate
shifts, human lives—particularly
those in communities of color,
low-income communities, immi-
grant communities, communities
with limited English proficiency
(LEP), and Indigenous communi-
ties—are affected by compromised
health, financial burdens, and social
and cultural disruptions.19 The ones
primarily causing climate change
are NOT the ones being dispro-
portionately harmed by it. More
affluent countries on a global level
and more affluent communities
within the U.S. and Wisconsin have
a much larger carbon footprint.
Yet it is less affluent countries and
communities who bear the greater
burden.20 Climate justice reorients
climate discourse from focusing
solely on reducing emissions and
recasts it as a human rights move-
ment, centering the communi-
ties most vulnerable to climate
change’s impacts in its solutions.21
According to the EPA,22 many
factors affect a community’s ability
to prepare for, respond to, and
cope with climate change’s health
impacts, including:
• Living in areas particularly
vulnerable to climate change
(e.g., coastal communities),
• Coping with higher levels of
existing health risks when
compared to other groups,
• Living in low-income commu-
nities with limited access to
healthcare services,
• Having high rates of uninsured
individuals who have difficulty
accessing quality healthcare,
• Having limited availability of
information and resources in a
person’s native language, and
• Less ability to relocate or
rebuild after a disaster.
Communities of color, low-income
communities, immigrant commu-
nities, and LEP communities are
more likely to live in areas with high
exposure to air and water pollu-
tion, and older and less-efficient
infrastructure, and areas prone
to extreme heat and flooding.23 In
the U.S., race is a more powerful
indicator than class in deter-
mining one’s proximity to toxic
facilities.24 Indigenous communi-
ties are particularly vulnerable to
climate change’s environmental
impacts, as they heavily rely on
natural resources for food, health,
and cultural and spiritual iden-
tity.25 These factors, in addition
to a historical lack of access to
resources and decision-making
institutions, put these communi-
ties at an unjust risk to the health,
economic, and environmental
impacts of climate change.
Climate justice is an extension of
environmental justice, a move-
ment born out of the U.S. Civil
Rights Movement of the 1960s. The
EPA defines environmental justice
as “the fair treatment and mean-
ingful involvement of all people
regardless of race, color, national
origin, or income, with respect to
the development, implementation,
and enforcement of environmental
laws, regulations, and policies.”26
In practice, achieving environ-
mental justice means guaranteeing
that these vulnerable communi-
ties receive equal protection from
environmental and health hazards,
and equal access to the deci-
sion-making process that deter-
mines their economic and energy
outcomes. ◙
C L I M A T E J U S T I C E & E Q U I T Y
2 2

C L I M AT E J U S T I C E & E Q U I T Y
01 Create an Office of Environmental Justice
S T R AT E G Y Create an Office of Environmental Justice tasked with collaborating across state
agencies and engaging with Black, Indigenous and communities of color, low-income communi-
ties, and environmental justice advocates to design climate policies that reduce emissions and
pollutants and address the cumulative and deadly impacts of their concentration within these
communities.
Creating an Office of Environmental Justice would help Wisconsin’s government protect the
health of its citizens and environment while promoting environmental equity in the administra-
tion of its programs. Many Great Lakes states have similar administrative bodies. The Illinois
Environmental Protection Agency has an Environmental Justice Officer,27 who coordinates all
environmental justice efforts of the agency through the Commission on Environmental Justice.28
Through a 2019 executive order, Michigan created an Office of the Environmental Justice Public
Advocate and an Interagency Environmental Justice Response Team.29 New York has an Office of
Environmental Justice within the state’s Department of Environmental Conservation.30 Illinois,31
Michigan,32 Minnesota,33 and New York34 all have Environmental Justice Advisory Groups, which
appoint diverse representatives from across the state to advise on inclusive and equitable policy
development.
EA Executive/
Agency Action
SB 2021–2023 State Budget
LE Legislation
CLIMATE JUSTICE & EQUITY
01 Create an Office of Environmental Justice p. 23 E A S B L E
02 Improve the state consultation process with Native Nations p. 24 E A S B L E
03 Mandate a racial disparity impact study p. 26 E A S B L E
04 Implement anti-racism education p. 26 E A S B L E
2 3

C L I M AT E S O L U T I O N S
02 Improve the state consultation process with Native Nations
S T R AT E GI E S
• Pilot a DNR program to develop a database for Tribal officials to submit concerns.
• Implement a DNR training program that would provide tailored trainings for staff
on cultural and Tribal climate work.
• Ensure consultation process includes both high-level decision makers within agencies
and technical staff from agencies.
According to the Great Lakes Indian Fish & Wildlife Commission’s A Tribal Climate Adaptation
Menu, “climate change has impacted and will continue to impact Indigenous peoples, their
lifeways and culture, and the natural world upon which they rely, in unpredictable and potentially
devastating ways.”35
In March 2019, Governor Evers signed Executive Order #18 relating to the affirmation of the
intergovernmental relationships among the state of Wisconsin and 11 Native Nations located
within the state. The order directed cabinet agencies to engage Native Nations on a government-
to-government basis in developing policies and programs that directly impact Native Nations or
their members and appropriately consult Native governments on matters that indirectly impact
Native Nations or their members. The order also directed state agencies to update the current
consultation process.
The National Congress of American Indians states that “Indigenous peoples of North America are
disproportionately vulnerable to climate change. The most vulnerable industries, settlements, and
societies are generally those in coastal and river flood plains; those whose economies are closely
linked with climate-sensitive resources; and those in areas prone to extreme weather events.
Nearly all tribes fit into one of those categories, and most Alaska Native communities fit into
all three.”
Native Americans are likely to be one of the most vulnerable populations to climate change.
Because of their heavy reliance on natural resources for food and health and because they are
culturally connected to their land, most are resistant to relocating to escape the harsh conditions
caused by extreme weather, wildfires, and habitat loss. Across the United States, tribes manage
95 million acres, 11 million acres more than the National Park Service, with many reservations
home to diverse habitats.
Not only are tribal communities resistant to relocating, but many tribal boundaries were created
through the treaty process which granted use off healthy resources in perpetuity. Inability to utilize
the local resources for subsistence, economic, and spiritual purposes represents a breach or abbro-
gation of rights. Additionally, Native Nations and Citizens of the Native Nations don’t always have
the option to leave or move away from these homelands, due to economic constraints and other
considerations.
Improving communication, engagement, and consultation with Wisconsin’s Native Nations can
help both the state and Native Nations address issues and concerns earlier in the policy and deci-
sion-making process. These proactive efforts will not only help ensure that sovereignty and treaty
rights are upheld, but can also help protect and preserve Tribal and ceded land where citizens
of the Native Nation live, hunt, fish, gather, and practice their culture—all important aspects that
contribute to their health and well-being.
EA Executive/
Agency Action
SB 2021–2023 State Budget
LE Legislation
2 4

- CLIMATE LEADER -
T HE GRE AT L A K E S INDI A N F ISH & W IL DL IF E
COMMISSION
The Great Lakes Indian Fish & Wildlife Commission (GLIFWC),
founded in 1984, represents Wisconsin, Minnesota, and Michigan’s
11 Ojibwe tribal nations. Through the 1837, 1842, and 1854 treaties,
these 11 tribes reserve the right to hunt, fish, and gather within the
U.S. To support the exercising of these treaty rights in treaty-ceded
territories, GLIFWC provides natural resources management,
expertise, conservation enforcement, legal and policy analysis,
and public information services.
GLIFWC infuses an Ojibwe perspective into its work to protect and
enhance the natural resources and habitat of treaty-ceded territo-
ries. Because climate change is deeply affecting the environment
and altering and disrupting the ecosystems within ceded territory,
GLIFWC is actively working to understand, adapt to, and mitigate
the effects of climate change. Its goal is to assist member nations in
co-managing the land and thus limiting the impact climate change is
having on Ojibwe people’s right to hunt, fish, and gather from their
land—something that is integral to their well-being and livelihood.
In 2019, GLIFWC released A Tribal Climate Adaptation Menu, an
extensive collection of adaptation methods that provides the frame-
work to incorporate Indigenous and traditional knowledge, culture,
language, and history into climate work. The menu is a collabora-
tive product developed by a diverse group of people representing
tribal, academic, intertribal, and government entities in Minnesota,
Wisconsin, and Michigan.
As Wisconsin embarks on combatting the climate crisis, it is imper-
ative it does so with the input and collaboration of its 12 Indigenous
Nations. As the original people and stewards of the land that is now
called Wisconsin, Indigenous people hold the wisdom
to care for the land.
For more information, visit https://www.glifwc.org
2 5

C L I M AT E S O L U T I O N S
03 Mandate a racial disparity impact study
S T R AT E G Y Mandate racial disparity impact studies for development projects.
An environmental impact assessment (EIA) is a management tool many organizations use to
evaluate the potential environmental impacts of a project, typically projects involving large-scale
siting and construction. Companies, governments, and the public use EIAs to assess the costs
and benefits of a project using an environmental lens, prior to making a final decision. Because
environmental hazards, displacement, and economic immobility continue to disproportionately
impact people of color and low-income communities, development projects (especially those
receiving government assistance and contracts) should apply a sociological lens to their
decision-making.
Requiring an independent racial disparity study that includes environmental hazard exposure,
economic impact to vulnerable communities, and GHG emissions would not only serve to protect
historically disproportionately impacted populations, but also limit opportunities for environmen-
tal and communal harm while simultaneously creating a market for cleaner energy options and
equitable developments.
Many states perform similar assessments. California’s Office of Environmental Health Hazard
Assessment developed CalEnviroScreen to help decision-makers map and identify communities
disproportionately exposed to and impacted by environmental pollutants. CalEnviroScreen uses
state and federal environmental, health, and socioeconomic data to identify cumulative pollution
burdens by geographic area. “Poverty, race and ethnicity, and education” are included socioeco-
nomic factors.36 In New Jersey, many of the state’s fossil-fuel power plants, waste treatment and
storage centers, landfills, and recycling plants disproportionately impact communities of color
and lower-income neighborhoods. To address this disparity, New Jersey recently passed land-
mark legislation S232, which requires the state’s Department of Environmental Protection to
evaluate the environmental and public health impacts of existing facilities on these communities
when reviewing permit applications, and to deny permits to new facilities found to lead to nega-
tive environmental justice impacts.37
04 Implement anti-racism education
S T R AT E G Y Educate state employees and the Wisconsin legislature about systemic oppression
and implicit bias.
P O L I C Y PAT H WAY
• In November 2019, Governor Evers signed Executive Order #59, directing state agencies to
develop equity and inclusion action plans and the Department of Administration to develop
and provide mandatory equity and inclusion training for state agency employees. This
should include anti-racism training and the Wisconsin legislature should implement anti-
racism training for legis lators and staff to address the systemic bias and racism that exists
in government.
EA Executive/
Agency Action
LE Legislation
EA Executive/
Agency Action
LE Legislation
2 6

Environmental racism and climate change are inextricably linked because the embedded racism
and bias that exist within social, government, corporate, and financial systems deem who bene-
fits from activities that produce harmful emissions and who suffers most from the consequences.
Historically, communities of color and low-income communities have suffered the most.
Government has a solid track record for cultivating policy that negatively impacts communities of
color. For example, the Wagner Act (AKA the National Labor Relations Act of 1935) and the Social
Security Act of 193538 excluded about half the workers in the American economy—namely agricul-
tural and domestic workers, jobs primarily filled by African Americans. For another example, the
General Infantry Bill39 denied benefits to millions of African American soldiers.
Because systemic racism remains embedded in our social structures, the average American’s
historical and racial literacy is depressingly low. Without knowledge of our country’s history,
unconscious bias education alone will not prevent government agency workers or the general
public from continuing to propose and support policies and laws that are unjust.
2 7

E nergy production and use
outside of the transportation
sector represents 57 percent of
Wisconsin’s GHG emissions and
is therefore a critical emissions
source to mitigate. This sector is
made up of electricity generation
(33 percent), along with onsite fuel
combustion for space and water
heating in residential (8 percent),
commercial (5 percent), and indus-
trial (11 percent) buildings.40 This
significant portion of Wisconsin’s
emissions profile represents major
opportunities to improve the state’s
energy production, transmis-
sion, and end-use infrastructure.
Pursuing these opportunities has
the potential to result in co-bene-
fits like improved human health,
economic development, equity,
and resilience.
Wisconsin has already made prog-
ress in addressing energy-sector
emissions. Between 2005 and
2017, CO2 emissions from elec-
tricity produced in the state fell
by 16 percent,41 due in large
part to decreased coal use and
increased use of natural gas and
renewable energy sources.42 In
fact, electricity generation from
non-hydro renewable sources grew
the fastest over this time period,
increasing by 2.6-fold. CO2 emis-
sions from energy use in the resi-
dential, commercial, and industrial
sectors decreased 10 percent from
2005 to 2017.
Despite this progress, there remain
a number of actions that Wisconsin
can take to further decarbonize
its energy sector. The recom-
mendations outlined below aim
to improve data collection and
reporting, increase the efficiency of
new and existing buildings, expand
the state’s renewable energy
capacity, encourage demand
response and load management,
and develop financing tools to help
fund Wisconsin’s clean energy
transition.
Several of the recommendations
in this sector include actions that
increase the deployment of energy
efficiency projects, many through
Focus on Energy® ,Wisconsin’s
statewide energy efficiency and
renewable resource program.
This program not only supports
economic development through the
creation of jobs, but also provides
utility bill savings for customers.
Job creation from energy efficiency
can be direct (e.g., in manufac-
turing, installation, servicing) and
indirect (e.g., through increased
disposable income to be redistrib-
uted in the economy). Studies have
shown that investing in energy
efficiency measures can create 380
jobs per Terrawatt-hour (TWh) of
electricity saved, whereas investing
in fossil-fuel plants creates only 110
jobs per TWh of electricity gener-
ated.43 In addition to job creation,
bill savings for customers results in
indirect economic growth through
additional disposable income. In
2019, according to an indepen-
dent evaluation, Focus on Energy®
provided $4.05 in direct economic
benefit for every dollar spent,
including $487 million worth of
avoided utility costs.44
All decarbonization efforts should
incorporate equity considerations
from the onset, through plan-
ning, design, and implementation.
Without careful design, planning,
and community input, programs
designed to decarbonize the energy
sector may have unintended
consequences that worsen ineq-
uity. Low-income households face
higher energy burdens (the portion
of income spent on energy bills)
and greater energy insecurity than
higher-income households, and
also face disproportionately high
health impacts from indoor and
outdoor air pollution.45 Because of
this, low-income customers can
most directly benefit from energy
efficiency programs and renew-
able energy projects, but the
planning, design, and implemen-
tation of the programs and proj-
ects must be undertaken with input
from these communities to ensure
that all aspects are undertaken
to maximize the benefit on these
communities. ◙
E N E R G Y
2 8

E N E R G Y
05 Improve data collection
S T R AT E G Y Direct agencies to work collaboratively to accurately report emissions, inform other
reporting and carbon tracking efforts, monitor progress, and provide data in decision-making to
help Wisconsin reach its goals.
P O L I C Y PAT H WAY
• Select agencies to track electricity consumption and GHG emissions to measure the
progress of carbon-reduction strategies and help inform agencies and decision-makers
regarding progress in Wisconsin’s emissions-reduction goals.
EA Executive/
Agency Action
E N E R G Y
05 Improve data collection p. 29 E A S B L E
06 Develop electricity storage and microgrids for critical infrastructure p. 30 E A S B L E
07 Increase energy use reduction goals p. 32 E A S B L E
08 Expand Wisconsin’s Focus on Energy® funding p. 33 E A S B L E
09 Support load management p. 34 E A S B L E
10 Support low-cost debt financing of customer clean energy projects p. 35 E A S B L E
11 State lead by example p. 37 E A S B L E
12 Update state commercial and residential building energy codes p. 38 E A S B L E
13 Set utility carbon-reduction goals p. 40 E A S B L E
14 Support community solar p. 40 E A S B L E
15 Update interconnection standards p. 41 E A S B L E
16 Require analysis on the social cost of carbon p. 42 E A
S B L E
2 9

C L I M AT E S O L U T I O N S
In order to understand the effects of GHG emissions on air quality and human health, there needs
to be recurring reports and studies on these effects. Providing clear and consistent carbon data
metrics, including data regarding electricity consumption and emissions on an hourly basis, will
assist in tracking carbon emissions and identifying opportunities for energy reductions or shifting
energy consumption to less-carbon-intensive time frames. These reports are also useful for any
measurement towards progress of goals related to GHG emissions. This will also allow statewide
agencies and decision-makers to collaborate to make better-informed decisions on how to reduce
emissions. Without these data, reports, and studies it would be hard to measure progress and see
if implemented policies have yielded the intended impacts.
Inequities in living conditions and health disproportionately place low-income communities and
some communities of color at greater risk of the health impacts of climate change. Low-income
communities and minority communities are likely to be exposed to environmental toxins and poor
air quality that increases the risk of respiratory illnesses and asthma exacerbation. These communi-
ties will benefit the most from the development of accurate metrics and data that could support the
development of new Focus on Energy® or utility-sponsored programs. These programs could help
shift or reduce the energy peak, align energy efficiency with carbon-reduction goals, and
align energy consumption with zero-carbon generation.
The design of the reports and studies should include input from communities around Wisconsin,
including impacted low-income and vulnerable communities, ensuring that their perspectives and
needs contribute to mitigation strategies.
06 Develop electricity storage and microgrids for critical infrastructure
S T R AT E G I E S
• Build resilience of the energy distribution system by exploring administrative and legislative
avenues to support local resilience through pilot programs and incentives.
• Increase funding to the Public Service Commission of Wisconsin’s (PSC) Office of Energy
Innovation to help local communities develop critical green energy infrastructure, such as
microgrids.
P O L I C Y PAT H WAY S
• PSC approval of utility incentive pilot programs, potentially including incentives and low-cost
financing.
• Additional resources to support pilots can be allocated through the upcoming budget.
• Grants or other funding can be used to accelerate microgrid deployment.
Microgrids are self-sufficient energy systems serving discrete areas such as college and hospi-
tal campuses, business complexes, and neighborhoods. Microgrids include one or more distrib-
uted energy sources (for example, solar panels, wind turbines, combined heat and power (CHP)),
and can include battery energy storage.46 When renewable-powered microgrids are coupled with
battery storage, they can also serve as tools to support community resilience during broader
weather or security-caused outages. Piloting and promoting the use of such microgrids in Wiscon-
sin can help the state meet its carbon goals, and can help ensure energy resilience, especially for
facilities that rely on uninterrupted power, including hospitals and others.
EA Executive/
Agency Action
SB 2021–2023 State Budget
LE Legislation
3 0

- CLIMATE LEADER -
CI T Y OF RI V ER FA L L S
On January 1, 2020, the City of River Falls became the first city in Wisconsin to power all
its city buildings on 100 percent renewable energy. With a population of 15,000, River
Falls is in the northwestern part of the state near the Wisconsin-Minnesota border and
on the banks of the Kinnikinic River.
A decade ago, the city began to prioritize conservation by promoting and adopting
energy efficient measures such as shutting off idling motors and turning off unused
lights. These actions were followed by switching to light-emitting diodes (LED) or fluo-
rescent lights in city buildings and then later installing automatic light sensors. The city
then worked with WPPI Energy, their wholesale power supplier, to offer more renew-
able energy options, including a program called “Green Blocks” that allows customers
to power their houses and businesses with renewable electricity for just an additional
$3 per month. By 2018, River Falls had the third-highest customer participation in the
nation for purchasing renewable energy just behind Portland, Oregon, and Alameda,
California. The city is also credited with building Wisconsin’s first city-owned solar
garden and is home to a Habitat for Humanity Eco-Village, a cluster of 18 solar-
powered homes that produce more electricity than they consume. In 2016, the City
of River Falls received the Award of Continued Excellence from the
American Public Power Association.
When the city flipped the switch on January 1, 2020 it powered up its seven govern-
ment buildings with renewable energy. Those buildings include their city hall, the public
library, the public works garage, the wastewater treatment plant, the public safety
building, the emergency medical services station, and the city pool. Later in 2020, the
cost of Green Blocks dropped to $2 per 300 kilowatt-hour (kWh) and at that point all
metered city facilities, other than buildings, were transitioned to 100 percent
renewable energy.
“Going 100 percent renewable for the city buildings and facilities is a logical extension
of the actions taken over the past decade and values demonstrated by our
community members including individual homeowners, businesses and institutional
property owners like churches and schools who voluntarily have been working together
and working forward doing our part with energy choices. The credit belongs to the
community who both has followed our lead and found opportunities to lead us in
considering future generations, embracing change, and serving our community.”
Scot Simpson, City Administrator for the City of River Falls.
City officials credit their accomplishments to dreaming big and acting, prioritizing
community engagement, and taking incremental steps in conservation and energy
efficiency and then renewable energy.
For more information visit www.rfcity.org/renewable
3 1

C L I M AT E S O L U T I O N S
The Office of Energy Innovation (OEI), in collaboration with University of Wisconsin (UW)
Extension and other local partners, has had great success in helping communities become
energy independent through grant programs and education outreach.47 More funding needs to
be allocated to expand OEI’s programming and increase local engagement in the green energy
transition and economy.
All Wisconsinites are affected by extreme weather events and natural disasters, which can result
in grid outages. It is important that households have access to power for extended periods to
enable communities to provide support to residents during a disaster. Power disruption can
be particularly dangerous for the elderly and people with pre-existing medical conditions who
require access to critical services such as breathing machines and home dialysis equipment.
Increased funding to OEI to provide additional microgrid pilot programs should be designed
to service marginalized communities. These communities may not have the resources to track
grant announcements, or write grant applications, or have the technical resources to identify
how microgrids could best serve their needs. The programs should be designed to incorpo-
rate outreach, engagement, and education to help overcome these barriers and ensure that the
program funding and activities reach those most in need. This grant program should not only help
local neighborhoods, counties, or municipalities, but also local Native Nations.
07 Increase energy use reduction goals
S T R AT E G Y The PSC should set a utility energy use reduction goal or standard of two percent
for utility-provided electric and one percent for natural gas as well as other fossil fuels, including
propane, heating oil, gasoline, and diesel (where reductions of those fuels is caused by electrifica-
tion and associated with Focus on Energy® and public utility incentives).
P O L I C Y PAT H WAY S
Pursuant to Wis. Stat. § 196.374(3)(b)1, which requires that the PSC evaluate Wisconsin’s utility-
administered energy efficiency and renewable energy resource programs, the PSC should issue
an order revising the energy efficiency goals, or have the administration execute a goal.
Energy efficiency resource standards (EERS) are long-term energy savings targets for utilities,
requiring utilities to meet a portion of their electric or natural gas needs using energy efficiency
programs. 2005 Wisconsin Act 141 requires the PSC to establish energy efficiency and renewable
energy targets every four years. Efficiency programs are administered through Focus on Energy®,
Wisconsin’s statewide energy efficiency and renewable resource program. The state sets Focus
on Energy®’s budget at 1.2 percent of utility revenues, which limits energy efficiency goals.
Under these funding constraints, in May 2018, the PSC set targets for 2019–2022 of approximately
0.6–0.7 percent of sales for electric utilities and 0.6 percent of sales for natural gas utilities.48
Wisconsin energy use reductions for electricity and natural gas are substantially below those in
neighboring states, and enhanced energy efficiency goals should be required for utilities.
The above goals would track with the overall energy-reduction goals set by the 2008 Governor’s
Task Force on Global Warming for electricity and natural gas and be similar to those set or recom-
mended by other states, including Illinois, Minnesota, and Colorado.49,50 This would also allow for
EA Executive/
Agency Action
3 2

E N E R G Y
energy-efficient electrification (and electric vehicles and other traditionally gas- or diesel-fueled
equipment) to begin replacing propane, heating oil, and transportation fuels – further contrib-
uting to emissions reductions. This makes Wisconsin more energy independent, more resilient,
and reduces energy costs. The inclusion of not only energy efficiency but also distributed renew-
able energy, electrification, and battery storage could allow for the goals to be implemented right
away, as opposed to over time as proposed in 2008, and may allow for higher goals. This policy
would build upon Focus on Energy®’s highly cost-effective existing program.
The policy, if fully and properly implemented, should result in significant energy use reduction
by underserved communities, as well as an ability for them to take advantage of the cost savings
of beneficial vehicles and building electrification, thereby significantly reducing their energy
costs. Although the overall impact will likely be very positive, in order to ensure that underserved
communities can fully participate, it is critical to have them involved in decision-making regarding
how to meet the energy use reduction goals to ensure that utility-offered programs are accessible
and cost effective. It will be important to conduct effective outreach to underserved communities
regarding all utility programs through avenues of communication that they regularly use.
08 Expand Wisconsin’s Focus on Energy® funding
S T R AT E GI E S
• Increase Focus on Energy® and utility incentive funding and align programs with energy-
and carbon-reduction goals and low-income energy efficiency and clean energy programs.
• Develop programs within the Focus on Energy® scope aimed at facilitating a logical
transition to electric appliances and equipment where feasible.
• Provide education and outreach regarding goals and benefits of policies, including vehicle
electrification and other carbon-reducing activities.
P O L I C Y PAT H WAY S
• Wis. Stat. § 196.374(3)(b)2, which currently requires each energy utility to spend 1.2 percent
of annual operating revenues from retail sales on funding efficiency programs, would be
modified to significantly increase the funding percentage.
• Wis. Stat. § 196.374(7)(a), which currently allows municipal utilities and electric co-ops to
collect an annual average of $8 per meter in fees, would be modified to increase the annual
average fee that they can charge and direct the additional funding to energy efficiency and
renewable energy programs.
• Wis. Stat. § 196.374, which outlines parameters for statewide energy efficiency and renew-
able resource programs, would be modified as necessary to expand energy efficiency and
renewable energy incentive programs to include beneficial building and vehicle electrifica-
tion, including battery energy storage and microgrids.
Energy efficiency is the cheapest and cleanest way to make sure Wisconsin’s energy needs are
met by eliminating the need for additional costly power plants. Reducing the amount of energy
needed to provide services like heating, cooling, and lighting to customers also reduces the
emissions from fossil-fueled generation and helps Wisconsin meet its carbon-reduction goals.
Programs offering energy efficiency resources and incentives help lower customers’ energy
costs, reduce peak energy demand, reduce harmful air pollution, and support local job growth.
SB 2021–2023
State Budget
LE Legislation
3 3

C L I M AT E S O L U T I O N S
Wisconsin’s Focus on Energy® administers resources and financial incentives on behalf of 107
electric and gas utilities. The program is funded by investor-owned utilities as required by Wis.
Stat. § 196.374(2)(a), and by fees collected by participating municipal and electric co-ops.51 Focus
on Energy® offers energy efficiency and renewable energy programs for both residential and
non-residential customers (including business, government, institutional, industrial, and agricul-
tural). In 2019, according to an independent evaluation, Focus on Energy® provided $4.05 in direct
economic benefit for every dollar spent, including $487 million worth of avoided utility costs.52
Increasing the funding that investor-owned utilities (IOUs) must spend on energy efficiency, and
increasing the amount that municipal utilities and co-ops can collect for this purpose, will allow
the Focus on Energy® to broaden and deepen its reach. The program can broaden by servicing
more customers, and deepen by offering additional incentives, to include support for the benefi-
cial electrification of buildings and vehicles, battery storage, and microgrids. Funding should also
focus on job training and economic growth in the sector, as energy efficiency can support a clean
energy economy in Wisconsin through jobs in manufacturing and installation.
Low-income households spend a disproportionately higher percentage of their household income
on energy, known as their energy burden. At the same time, they are more likely to live in older,
less-efficient homes, and the upfront cost of energy-saving upgrades is often prohibitive despite
the longer-term payback. Extreme heat in the summer and cold in the winter caused by climate
change will continue to make the economic impact worse on these families. Promoting additional
energy efficiency measures will help reduce energy bills and providing technical resources and
incentives for installation will help low-income households overcome the initial investment barrier
to energy efficiency. In order to ensure that these communities can fully participate, it is critical to
have them involved in decision-making regarding the design and implementation of the incentive
programs, to ensure that the programs are meeting their needs, are accessible to them, and help
realize the goal of cost-effectively reducing their energy use.
09 Support load management
S T R AT E G Y Establish programs at the PSC to incentivize load management, or demand-
side management (DSM), including tariffs to incentivize stationary and mobile battery load
management.
P O L I C Y PAT H WAY S
• Direct the PSC to establish programs and tariffs.
Load management, or demand-side management (DSM), is used to reduce consumer energy
demand, and is especially important during peak demand times to reduce load and minimize
the need for additional fossil-generated power plants to come online. DSM can be implemented
through energy efficiency (installing efficient products or technologies to permanently reduce the
demand) or demand response (DR, altering demand or behavior in the short term in response to
a peak demand event), and is deployed through education and incentives. DSM offers a variety
of environmental benefits, including reducing energy usage, offsetting the need for fossil-fueled
power plants, and helping to manage system challenges from increased wind and solar energy.
EA Executive/
Agency Action
3 4

E N E R G Y
To help address peak demand issues, it is important to establish flexible DR programs. The PSC's
Final Strategic Energy Assessment 2018-2024 reported an increase of 5.4 percent in peak energy
demand by 2024 (despite energy consumption growing by less than 1 percent per year), so increas-
ing grid flexibility will be critical to manage customer costs and minimize environmental impact if
the system peak continues to increase.53
These DR programs should be designed to incentivize stationary and mobile battery storage.
Program design should be based on “on-peak” charging projections to help ensure that owners
of batteries are incentivized to charge batteries during times of low energy demand and discharge
energy at peak demand times to assist with demand response. The purpose would be to estab-
lish electricity rate structures and technology-based smart charging programs which encour-
age charging at times most beneficial to the electricity system and consumers. These programs
have great potential, especially if Wisconsin sees substantial increases in electric vehicle (EV)
adoption, and vehicle-to-grid charging becomes available. The PSC should consider approving
pilot programs to help utilities gain experience and information about creating a user-friendly EV
charging experience that benefits all electric customers and the electric grid.
This effort should also identify and implement other opportunities to incentivize customers to use
energy when it is abundant and not when it is scarce, including through tariffs.
This will have a positive effect on underserved communities if programs are created to provide
additional advantages to owning EVs, which should increase their deployment and use, resulting
in decreased energy costs and EV emissions. However, if underserved communities are not able to
fully participate in DSM programs, utilize EVs, or other storage, they will be shut out of some of the
benefits of these programs. To mitigate potential negative impacts, incentive programs should be
designed to serve these communities, especially in EVs and battery energy storage.
10 Support low-cost debt financing of customer clean energy projects
S T R AT E GI E S
• Maximize property assessed clean energy (PACE) financing opportunities for commercial
customers. Encourage all counties to implement PACE ordinances for commercial properties
and provide information about PACE to businesses that likely may benefit.
• Provide on-bill financing for residential and governmental customers. Utilities should
provide on-bill financing with low-interest loans (or potentially no-interest loans for low-in-
come residences) for residential and governmental customers that are less likely to benefit
from PACE. Financing would be for remaining costs after application of available incentives,
including utility incentives, tax credits, and federal grants.
• Explore a Wisconsin Green Bank. Create a study committee to look into various public,
private, nonprofit, and hybrid models that would fund projects, including worker training and
equitable clean energy buildout in low-income communities and communities of color.
P O L I C Y PAT H WAY S
• Allow the PSC, or the appropriate government agency, to approve community renewable
energy projects and ensure that the community benefits.
• PSC approval of tariffs allowing for low-cost debt financing on utility bills, potentially with
the opportunity for rate recovery of the amount of subsidization of interest rates.
EA Executive/
Agency Action
SB 2021–2023 State Budget
LE Legislation
3 5

C L I M AT E S O L U T I O N S
• Convene working groups to further investigate policy implementation.
• Debt financing subsidies could be provided from state funds if there is no rate recovery of
utility financing.
• State funding would likely be needed to form and operate a green bank.
• If the formation of a Wisconsin Green Bank is utilized in lieu of or in addition to on-bill
financing, passage of legislation authorizing and creating such a bank.
• Revisit 2020 Assembly Bill (AB) 765 on green banks, which failed to pass earlier this year and
required a study and appropriation on green banks in Wisconsin.
Establishing mechanisms to finance energy efficiency and renewable energy will expedite project
and technology deployment that directly reduces emissions. Providing a variety of financing tools
will promote project development and expand access by making these opportunities more afford-
able. In addition to incentives (such as Focus on Energy® and utility incentives, state tax credits,
and grants), it is important to provide access to low-cost debt financing to encourage customers to
implement cost-effective clean energy projects. Without this debt financing, many customers may
not have the funding to implement what would otherwise be cost-effective measures and/or may
have other competing uses of their available funds that prevent them from implementing projects.
PACE financing allows property owners to obtain low-cost, long-term loans for energy efficiency,
renewable energy, and water conservation improvements. The financing tool covers hard and soft
costs, and is repaid through the property tax bill, so there is no upfront cost and ownership trans-
fers with the property. PACE ordinances have already been adopted in 45 Wisconsin counties,
realizing significant energy, water, and cost savings.54
Utility-provided on-bill financing allows customers to invest in efficiency improvements, such as
heating, ventilation and air conditioning (HVAC) upgrades or insulation, and repay the cost through
their utility bill. Through on-bill financing, the utility takes on the cost of the energy efficiency
or renewable energy project, and then collects repayment through its customer billing process.
Governments can get involved by assisting with the initial capital or credit, or by taking advantage
of on-bill programs themselves.
Green banks are financial institutions that use a combination of public funds and private
investment to finance the deployment of renewable energy and energy efficiency projects. Green
banks have been in operation for more than ten years and there are currently 14 green banks in
operation in the U.S.55 While the specific focus of these green banks varies, the goals of all green
banks are to use local expertise to deploy capital to drive investment in additional clean energy
projects that create jobs and reduce emissions. In 2018, U.S. green banks catalyzed $676 million in
total investment in projects across the country, resulting in a cumulative impact of over $3.5 billion
in investment since 2011. During that time, the private-to-public investment ratio for green banks
has averaged 3.4 to 1. Wisconsin has previously pursued legislation to study the feasibility of
establishing a green bank, 2020 AB 765 56, but that has not been passed.
Although low-cost financing programs should generally have a beneficial impact on underserved
communities, it will be important to consult with underserved communities during planning,
development, and implementation to make sure that financing programs are accessible and help
effectively reduce their energy use. These should not be limited to urban areas but also include
rural areas, which will likewise face energy challenges as the climate crisis worsens. It is critical
3 6
E N E R G Y
to ensure that there is effective outreach regarding the availability of low-cost debt financing to
underserved communities.
11 State lead by example
S T R AT E GI E S
• Wisconsin state agencies and decision-makers should set a strong example by taking
steps to reduce GHG emissions within the State’s asset portfolio through energy and water
conservation, waste management, energy production, building efficiency, transportation
use, procurement policies, and guidance for local governmental units.
• Direct the Wisconsin Department of Administration (DOA) to work with other state agen-
cies to set and take steps each year to meet energy- and carbon-reduction goals consis-
tent with the most stringent Wisconsin public utility plan. Seek funding from Focus on
Energy®, utility incentives, on-bill financing, and/or other available low-cost financing
methods (to the extent that they are available) to reduce costs and pay for projects out of
energy savings.
P O L I C Y PAT H WAY S
As part of a Wisconsin lead-by-example program, the State can do the following:
• All agencies track both energy use and GHG emissions and set reduction goals.
• Track energy and emissions reductions and benchmark all existing state buildings
and leaseholds. The State should share its benchmarking methods with interested
local communities, potentially through the Green Tier Legacy Communities program
or other mechanism.
• Set specific energy efficiency goals for state buildings, such as meeting ENERGY STAR®
Performance levels by 2027.
• Set a policy of incorporating renewable energy generation into all new construction and
increase the amount of renewable energy the State and UW System purchase to achieve
100 percent carbon-free energy before 2050. Alternatively, DOA could establish a more
aggressive goal of 100 percent clean energy by 2025 for state operations, including a 30–50
percent energy reduction by 2030 for all state buildings and UW campuses, requiring state
buildings to be 20 percent more efficient than current building codes, and requirement to
acquire all additional electricity through renewables by 2025.
• Consider including carbon footprint reductions and not just energy-use reduction in state
performance contracts.
• Join the Better Buildings Challenge of the U.S. Department of Energy (US DOE) to help
document and share state data. Under this program, leading businesses, manufacturers,
cities, states, universities, and school districts commit to improving the energy efficiency
of their buildings portfolio by at least 20 percent over ten years and share their strategies
and results.
• Participate in US DOE voluntary technical assistance initiatives geared towards state
government.
• Adopt a policy of replacing state fleet vehicles and off-road equipment with EVs and
electric equipment whenever it is cost-effective, considering total cost of ownership—
purchase price (reduced by any Focus on Energy®, utility, or other incentives), projected
operating cost savings from using electricity instead of fossil fuels, reduced maintenance
EA Executive/
Agency Action
3 7

C L I M AT E S O L U T I O N S
costs, and reduction of carbon and other emissions (applying a reasonable cost for carbon
and other pollutants reflecting their impacts).
• Assess and address resilience of the State’s infrastructure and share best practice infor-
mation regarding electrification and resilience with communities through the Green Tier
Legacy Communities program or other mechanism.
According to the EPA, states lead by example by establishing energy management and GHG
reduction programs within their own buildings and operations. These efforts save money on
energy bills, lower GHG emissions, and demonstrate the feasibility and benefits of clean energy
technologies and strategies to the larger market. This program, if properly implemented, should
provide operational cost savings for the State government and lower its carbon and broader envi-
ronmental footprint. State agencies will realize significant direct energy and GHG reductions from
State government operations, buildings, and fleet. Indirect impacts include the energy and GHG
reductions from municipalities and other jurisdictions that can learn from the State’s example and
take similar action. This policy should directly provide a small but not insignificant share of meet-
ing the 2050 goal and should increase EV usage to help meet transportation goals. Also, if the
State acts as a leader and shares the benefits of its actions with others, it can encourage and cata-
lyze others’ actions, resulting in greater emission reductions.
This has a positive effect on underserved communities because it should reduce the State’s
emissions and encourage others to lower their emissions. The positive impacts of this policy on
underserved communities would likely be greatest if the State prioritizes implementation of the
policy in areas where the State has operations in underserved communities. Purchasing policies
could intentionally address underserved communities, for example by including requirements for
a minimum level of contracting with small, women- and BIPOC-owned businesses. Paving a path
for municipalities will enable underserved communities to save energy costs over time, which can
be directed to other community needs, and increase resilience to climate impacts such as flood-
ing, which often disproportionately impact lower-income neighborhoods and individuals.
12 Update state commercial and residential building energy codes
S T R AT E G Y Update state commercial and residential building energy codes; include EV charging.
P O L I C Y PAT H WAY S
• The Department of Safety and Professional Services proposes updates to state residen-
tial and commercial codes. Wisconsin should adopt the most current energy code without
amendment (unless specific provisions are not feasible or cost-effective in Wiscon sin) and
should establish a process for more regularly updating the state code to align with the
model code.
• Legislation that would provide for 1) regularly updating the state energy codes based on
model codes, including for EV readiness, unless specific provisions in the model codes
are not feasible or cost-effective in Wisconsin, 2) updating the state energy codes beyond
generally accepted model codes if it is feasible and cost-effective to do so in Wisconsin,
and 3) allowing local communities to implement their own ordinances that are more strin-
gent than the state energy codes so long as they clearly provide how to comply with the
state and local codes.
EA Executive/
Agency Action
LE Legislation
3 8

E N E R G Y
Energy codes provide minimum requirements for energy efficiency in commercial and residen-
tial building construction. Codes are a cost-effective way to reduce energy use, reduce carbon
emissions, improve occupant comfort, and save money for utility customers. Energy codes are
adopted at the state level, and many local jurisdictions adopt “stretch” codes that go beyond their
state or model codes.
The International Energy Conservation Code (IECC) is the most widely adopted model energy
code, and is updated every three years through a voting process facilitated by the International
Code Council (ICC). Through this process, government members from state and local govern-
ments (including representatives from building departments, sustainability offices, housing
departments, and others) meet to vote on provisions affecting efficiency in the new code,
including standards for the structure (walls, floor, ceiling, insulation), openings (windows and
doors), and conditioning (ducts, ventilation, and leakage).
Wisconsin’s energy code is currently the 2015 IECC with amendments for commercial buildings
and the 2009 IECC with amendments for residential buildings. Because Wisconsin’s codes are
outdated, new building projects have not implemented all potential cost-effective energy effi-
ciency measures included in newer codes, and the State does not have EV charging readiness
requirements for new buildings. EV adoption can significantly lower transportation emissions,
especially as clean generation is added to the grid and the use of coal and other fossil fuel gener-
ation is reduced. EV charging infrastructure is substantially more cost-effective to install during
initial building construction than as a retrofit, and so should be included in Wisconsin’s building
energy code.
Wisconsin’s present codes prevent local communities from requiring additional energy efficiency
measures, which limits the ability of local communities to meet their clean energy goals. Enabling
local governments to develop and implement stretch codes that are more stringent than the
base state codes would allow leaders to achieve higher energy savings locally while accelerating
market acceptance.
Cost-effective code updates should result in net cost savings for Wisconsinites, both from
reduced energy use in buildings and because of the ability to utilize EVs, which have much lower
operating costs than gas or diesel vehicles. In addition to cost savings, this will result in substan-
tial reductions in carbon and other air emissions, including nitrogen oxide, sulfur dioxide, particu-
lates, and mercury, resulting in health benefits. This policy is critical to ensuring that underserved
communities are part of the clean energy transition, and that the safety and quality of housing
stock improves over time.
While building energy codes should have a positive impact, it is important to consult with under-
served communities to ensure that code updates are cost-effective and are applicable and benefi-
cial to their communities. It is also important to note that lower-income members of underserved
communities may not be able to afford EVs as quickly as others—in fact, low-income people in
Wisconsin may struggle to secure any sort of reliable transportation and cannot afford any sort
of vehicle. As the state works to promote EVs, it must be mindful of this and continue working to
make low-carbon transportation available to all people.
3 9

C L I M AT E S O L U T I O N S
13 Set utility carbon-reduction goals
S T R AT E GI E S
• Establish carbon-reduction goals for utilities as follows:
– By 2030, reduce net carbon emissions from the power sector to at least 60 percent
below 2005 levels.
– By 2050, reduce power sector net carbon emissions to 100 percent below 2005 levels.
• Utilities should be given flexibility in order to maintain reliable, resilient, and cost-effective
infrastructure.
P O L I C Y PAT H WAY
• The PSC should track progress towards these goals by utility through its biennial Strategic
Energy Assessment.
The power sector provides the largest opportunity for cost-effective GHG emissions reductions.
As other sectors pursue beneficial electrification (e.g., transportation and building fuels), decar-
bonizing the power sector is going to be critical to further reduce emissions economy-wide. The
PSC's Final Strategic Energy Assessment 2020-2026 indicates that Wisconsin utilities are on pace
to reduce their aggregate emissions to 44 percent below 2005 levels by 2026, surpassing the 40
percent reduction target multiple providers had previously set for 2030.57 What’s more, these
projected reductions do not consider a coal plant retirement announced in May, half of the 1,000
megawatts of solar power Alliant Energy is planning to acquire by 2024, or the solar farms being
developed by non-utility companies.
Most emissions reductions are expected to come from utility-scale renewable energy projects
with utility resource procurement or replacement reflecting the current demand and econom-
ics-based utility regulatory structure. Where cost-effective, and especially where it results in
environmental justice or resilience benefits, reductions should also come by partnering with
customers across multiple sectors and thereby leveraging funding from Focus on Energy® and
utility incentive programs. At the same time, utilities may need some flexibility with their goals in
order to maintain infrastructure that provides safe, reliable, and affordable energy and to allow
for maintenance of grid stability. The goals may be appropriately modified to be consistent with
a significant federal, nationwide carbon-reduction policy that includes all economic sectors when
such a policy is put in place.
14 Support community solar
S T R AT E G Y Encourage utility buildout of community solar and review green tariff models from
other states as well as the Madison Gas & Electric (MG&E) model. At the same time, facilitate
community solar/renewable energy sponsored by local communities and Tribes to help them
meet their clean energy goals.
P O L I C Y PAT H WAY S
• Development tariffs under Wis. Stat. §. 196.192 that allow for community solar.
• Allow local government to help regulate these projects.
• If the PSC believes changes are needed to Wis. Stat. § 196.192 to allow this policy,
legislation should be introduced to do so.
EA Executive/
Agency Action
EA Executive/
Agency Action
SB 2021–2023 State Budget
LE Legislation
4 0

E N E R G Y
To achieve 100 percent renewable electricity, Wisconsin needs local, community-driven action.
However, communities need support and incentives to invest in renewable energy projects so that
they can be part of the state’s green energy future. Community solar programs provide greater
access for several reasons: ownership (renters for whom rooftop solar isn’t an option can access
community solar), geography (those in shady or otherwise suboptimal locations for solar can
participate in community solar), and economics (participants avoid high upfront installation costs
of an individually owned system while still accessing solar). These programs can help create
community buy-in, expand renewable energy project development in both rural and urban areas,
and help low-income communities have ownership over their energy.
Many other states in the Midwest have successful and popular community renewable energy
projects, most notably in Minnesota with the state’s community solar gardens. This policy has
also been implemented in Colorado (HB20-1064 (2020)) and Virginia (HB 572 (2020)), with a
pilot program in the New York State Legislature (A01281 (2019-2020)). In fact, Colorado has just
updated its community solar gardens legislation to increase the maximum size and make it easier
for people in the community to be part of a garden (HB19-1003 (2019)). New York has multiple
cooperatives that seek to improve energy justice and renewable energy use (e.g., The New York
City Energy Co-op).
15 Update interconnection standards
S T R AT E G Y Interconnection standards have not been updated in Wisconsin since 2004, and do
not reflect developments in technology and energy storage markets. The Wisconsin Distrib-
uted Resources Collaborative and the PSC should address existing interconnection concerns and
should specifically address energy storage.
P O L I C Y PAT H WAY S
• PSC promulgation of modifications to Wis. Admin. Code § PSC 119.
• The PSC could appoint a committee, consisting of stakeholders actively involved with
the Wisconsin Distributed Resources Collaborative and other relevant stakeholders as
appropriate, to develop recommendations for modifying Wisconsin’s current
interconnection rules.
2001 Wisconsin Act 16 directed the PSC to promulgate rules for the interconnection of distributed
generation facilities to utility electric systems, and required those rules to:
• Establish uniform statewide standards—to the extent technically feasible and cost-effec-
tive—that promote the development of distributed generation facilities;
• Address engineering, reliability, and safety concerns; and
• Establish methods for determining charges for interconnection.
The PSC promulgated interconnection rules in January 2004 as Ch. PSC 119, Wisconsin Adminis-
trative Code. The rules establish uniform interconnection requirements for all regulated electric
utilities in Wisconsin, including:
• A standardized application process that allows streamlined processing for small facilities
with capacity of 20 kW and less; and
• Technical requirements related to system design, safety, technology, and equipment
certification.
EA Executive/
Agency Action
4 1

C L I M AT E S O L U T I O N S
Wisconsin’s interconnection procedures are outdated and ambiguous, resulting in differing stan-
dards and rules among different utilities. In order for the power grid to properly utilize distributed
resources, industry standards (e.g., IEEE-1547) need to be revised and updated. At the same time,
processes need to be established that will address technology changes or other technical issues as
they arise over time.
In 2019, the Minnesota Public Utilities Commission approved the Minnesota Distributed Energy
Resource Interconnection Process and Agreements (MN DIP/DIA), modeled after the Federal Energy
Regulatory Commission’s Small Generator Interconnection Procedures (FERC SGIP). This update
aimed to make the interconnection process more efficient and consistent statewide while encour-
aging technology-neutral distributed energy resource deployment.58
This policy, if fully and properly implemented, should result in more efficient and effective inter-
connection standards that make it easier and more cost-effective for underserved communities
to implement customer clean energy projects, lowering carbon and other emissions, and poten-
tially their energy costs. In order to ensure greater benefits to underserved communities, it will
be important to allow underserved communities to be involved in the rulemaking process to help
make sure the new interconnection standards allow them to effectively and efficiently interconnect
their potential facilities.
16 Require analysis on the social cost of carbon
S T R AT E G Y Support the passage of Wisconsin 2019 AB 766, introduced in January 2020, to require
the PSC to consider the social cost of carbon in its analysis in decisions about construction of new
utility-scale energy generation.
P O L I C Y PAT H WAY S
Passage of 2019 AB 766. If passage of that bill is not feasible, it is likely important to at least confirm
whether a statutory change is needed to allow the PSC to consider carbon emissions and the ability
of utilities to meet their 2030 and 2050 goals when evaluating new proposed generation and other
facilities, since Wis. Stat. §196.491(3)(d)3 provides that “[i]n its consideration of environmental
factors, the commission may not determine that the design and location or route is not in the public
interest because of the impact of air pollution if the proposed facility will meet the requirements
of ch. 285.”
The social cost of carbon estimates the damages resulting from climate change, including net
changes in human health, agricultural productivity, property damage from increased flood risk,
and heating and cooling costs.59 Presently, the PSC does not consider the impacts of carbon emis-
sions when it decides whether to approve a new generation source. Considering the cost of carbon
should allow the PSC to make better decisions to achieve the 100 percent carbon-free electric-
ity by 2050 goal. This policy would help the PSC to better compare the costs and benefits of new
sources of energy generation and storage, including natural gas options, wind and solar options,
utility-scale battery storage options, customer battery storage, and/or EV options where most of
the project costs are paid by customers who receive targeted incentives from Focus on Energy® or
utilities in return for commitments by the customers to operate under tariffs that add cost-effective
capacity to the system.
LE Legislation
4 2

E N E R G Y
Several other states are already using the social cost of carbon. For example:
• The social cost of carbon serves as the basis for the value of “zero-emission credits”
paid to electric utilities under state clean energy legislation (NY, IL).
• Electric utilities are required to use the federal social cost of carbon in their resource
planning (CO, MN, WA).
• State legislation requires regulators to incorporate the social cost of carbon in policy
analysis (CA).
4 3

T ransportation is integral to a
functioning society. It is one of
the most essential services a state
can provide. Wisconsin’s trans-
portation system and infrastruc-
ture includes an extensive range of
multi-modal elements, including
roadways, highways, bus transit
systems, passenger and freight rail-
ways, airports, and pedestrian and
bicycle infrastructure—all of which
connect residents and visitors to
families, friends, services, jobs, and
communities. It also enables the
movement of commodities in, out,
and around the state. The efficiency
and reliability of Wisconsin’s trans-
portation system and supporting
infrastructure have a direct impact
on the state’s economy and
environment, which in turn
effects the quality of life for its
5.8 million residents.
Emissions from the transporta-
tion sector are a direct output
from the combustion of fossil
fuels used to power vehicles.
However, the types of fuels used
and the number of vehicle miles
traveled (VMTs) can have a signifi-
cant impact on total emissions. In
Wisconsin, transportation sector
GHG emissions are the second-
largest source of economy-wide
emissions, representing 24 percent
of total emissions in 2017.60 Cars,
buses, trucks, off-road vehicles,
commercial aircraft, boats, and
rail all contribute to transporta-
tion end-use emissions. Nationally,
light-duty vehicles are the largest
contributor within the sector,
accounting for 59 percent, while
medium- and heavy-duty vehicles
follow at 23 percent, resulting in
on-road vehicles making up more
than three-quarters of transpor-
tation emissions.61 While trans-
portation emissions in Wisconsin
have declined 6 percent since 2005,
developing and adopting strategies
that avoid or reduce our fossil-fuel
dependence is critical to creating a
clean transportation future for the
citizens of Wisconsin. These strat-
egies include utilizing low-carbon
fuels and new and efficient technol-
ogies, and reducing VMTs through
smart land-use planning, mode-
shifting, and active transporta-
tion. Pursuing these transportation
solutions can result in economic,
health, and social benefits including
improved air quality, safer streets,
local economic development, and
improved access for low- and
moderate-income communities.
EVs powered by rechargeable
batteries currently present the
strongest potential to significantly
reduce GHG emissions in the
transportation sector, especially
when the electricity is generated
with low-carbon resources.62 EVs
provide many benefits, including
lower maintenance costs, lower
fuel costs, zero local emissions,
quieter operation, and faster
acceleration. Recognizing these
benefits, consumers around the
world are purchasing EVs leading
to continued market expansion.
This is evident in the 40 percent
year-on-year increase of EV sales
around the world in 2019.63 Much of
this growth is a result of declining
battery costs and increased driving
range. For example, although
battery packs remain the single-
highest-cost component in EVs,
battery prices dropped from $650/
kWh in 2013 to $156/kWh in 2019.64
Forecasts from Bloomberg New
Energy Finance's Electric Vehicle
Outlook 2020 report suggest
that price parity with internal
combustion vehicles occurs by
the mid-2020s; however additional
policy support is needed to main-
tain market growth and to facilitate
the necessary build-out of charging
infrastructure.65 In addition to the
market expansion of electric light-
duty vehicles, electric transit buses
are fully available at the commer-
cial level and are growing rapidly.
For example, the U.S. zero-emis-
sion bus fleets grew 36 percent
between 2018 and 2019.66
Based on the most recent data
available, in 2019 there were
1,963 plug-in hybrid electric and
1,140 battery electric vehicles
on the road in Wisconsin, with
259 publicly accessible charging
stations.67,68 To accelerate the rate
of adoption needed to significantly
reduce emissions in the transpor-
tation sector, it is essential that
Wisconsin implement policies and
programs to support this rapidly
evolving market.
In addition to technology improve-
ments, the way communities use
and plan the development of space
T R A N S P O R T A T I O N
4 4

T R A N S P O RTAT I O N
result in increased VMTs, which has
a direct impact on air quality and
human health. Land-use planning is
inextricably linked to our transpor-
tation system and planning efforts
should include a process that eval-
uates how a community may grow
and develop over time, including
the role transportation planning
can play in avoiding or encouraging
sprawl, vehicle-focused travel, and
a separation of living, working,
and leisure spaces. For instance,
utilizing a smart-growth planning
approach encourages and improves
regional accessibility, housing and
neighborhood density, mixed-use
development, street connectivity,
walkability, and public transit prox-
imity.69 This type of integrated
approach to land-use planning will
increase economic, social, and
environmental benefits across
the state.
Research has shown that environ-
mentally harmful infrastructure
such as highways and ports have
been intentionally and dispropor-
tionately placed in low-income
communities and communities of
color.70 This results in high expo-
sure to air, water, and noise pollu-
tion in these communities, which in
turn results in racial health dispar-
ities and economic divestment.
In addition, historically, state and
municipal transportation plan-
ners have not adequately provided
equitable access to transportation
services.71 Reframing transporta-
tion planning to be more equity-
focused, with a greater emphasis
on community engagement, can
result in more meaningful public
involvement and encourage the
development of a shared equitable
transportation outcome across all
stakeholders.
The following recommendations
will build a strong foundation
for achieving a clean transporta-
tion future, while also addressing
historical inequities in access to
transit and health impacts associ-
ated with transportation-related air
pollution. ◙
T R A N S P O R TAT I O N
17 Climate and environmental justice audited transportation planning and development p. 46 E A S B L E
18 Promote public transit and green public transportation p. 47 E A S B L E
19 Support hybrid-electric vehicles, electric vehicles, and infrastructure p. 48 E A S B L E
20 Safe, clean, and complete streets p. 49 E A S B L E
4 5

C L I M AT E S O L U T I O N S
17 Climate and environmental justice audited transportation planning and development
S T R AT E G Y Direct the Wisconsin Department of Transportation (WisDOT) to perform climate
and environmental justice impact analyses as transportation-related projects are considered
and developed.
P O L I C Y PAT H WAY
• WisDOT transportation planning and development should analyze and report the carbon
emissions and environmental justice impacts associated with transportation assets. The
carbon and climate impact analysis should include an evaluation of a project’s potential
impacts on VMTs, transportation-related carbon emissions, and an assessment of climate
resilience.
Quantifying transportation projects’ carbon impact can help planners evaluate a proposed project
and identify cost-effective, low-carbon alternatives. For instance, New York requires metropoli-
tan planning organizations (MPOs) to estimate the energy and carbon emissions from their long-
range transportation plans and their transportation improvement programs.72 This type of analysis
provides planners with an analytical framework for evaluating a transportation project’s carbon
and associated health impacts, allowing planners to evaluate the full direct and indirect costs
of a project.
Transportation infrastructure (e.g., roads, highways, bridges, railways) are susceptible to climate
impacts such as rising temperatures and more frequent and intense rainfall. Given the expected
impacts of climate change, it is essential that we build and prepare our transportation assets to
better withstand anticipated and unanticipated shocks and stresses that degrade and damage
transportation infrastructure. Greater resilience can be achieved by implementing planning and
land-use policies that focus on building resilient design into existing and new infrastructure,
promoting compact urban developments, and encouraging the use of a variety of transportation
modes. For instance, climate change projections can be used to identify areas at greater risk of
flooding, which allows transportation planners to safeguard key transportation routes against
climate impacts. Climate change projections can also be incorporated into decisions regarding
the rebuilding of infrastructure damaged by extreme weather events, helping to determine if it
is cost-effective to rebuild to a standard above the pre-disaster level. Utilizing tools that support
building resilient infrastructure now and into the future are essential as Wisconsin prepares for
a changing climate.
The environmental justice analysis should consider the positive and negative impacts of the proj-
ect on underserved communities. This should include whether negative impacts could be reduced
or positive impacts could be increased by incorporating public transit. This planning should be
performed at local and state levels. WisDOT could provide resources to local governments to
conduct their own transportation and land-use planning. Best practices could be shared with local
governmental units through the Green Tier Legacy Communities Program.
These analyses would help address the concerns repeatedly raised during the listening sessions
regarding the potential Interstate-94 highway expansion in Milwaukee, as well as similar issues
with other transportation projects.
EA Executive/
Agency Action
LE Legislation
4 6

T R A N S P O RTAT I O N
18 Promote public transit and green public transportation
S T R AT E GI E S
• Increase funding for Wisconsin’s public transit systems through the state budget to help
meet current and future needs.
• Allow municipalities and regions to effectively coordinate and fund local transportation
systems. Focus on opportunities to better facilitate connections between unemployed or
underemployed workers and available jobs.
• Develop regional public transit plans. Evaluate regional transit needs, including high-speed
and light rail. Look into various funding mechanisms (such as tax increment financing
(TIFs)) for public infrastructure and public, private, and hybrid funding models. Also look
into workforce aspects.
• Promote the construction and use of high-speed rail and other long-distance public transit.
To reduce carbon emissions and energy costs associated with transportation, it is important to
develop and implement plans that provide beneficial, low-carbon public transportation opportuni-
ties to Wisconsin residents. Additionally, this policy is critical for providing greater transportation
equity and increased mobility across the state. Because public transportation is often the lowest-
cost option for those who do not have the means to own or lease a personal automobile, greater
investment in and access to public transportation is critical.
Engaging large local- area employers is vital to ensuring that public transportation routes meet
the transportation-to-work requirements of the communities in which businesses are located.
Accordingly, it is important that local employers, governments, and public transit providers work
collaboratively to develop transportation solutions that cost-effectively meet the specific needs of
local and regional demands.
Recognizing the benefits of electric buses, several transit agencies across the U.S. are incorpo-
rating electric buses into their fleet. According to CALSTART, the U.S. zero-emission bus fleet
increased nearly 37 percent from 2018 to 2019, as almost every state across the country has a
transit agency with an electric bus in its fleet.73 Electric bus benefits include lower maintenance
and operational costs, zero tailpipe emissions leading to significant health benefits for local
communities, quieter operation, and faster acceleration. Identifying funding sources, such as the
Volkswagen Environmental Mitigation Trust Fund (both State and Tribal) or the Federal Transit
Administration Low-No grants, to support the transition to electric transit buses will be an import-
ant step to achieving clean transit options for Wisconsinites.
Creating high-speed rail to connect cities within the state and to connect Wisconsin with major
cities in neighboring states can help reduce street traffic and the presence of individual cars. This
would improve health and create a better built environment for communities in both urban and
rural areas. It is important that representatives from underserved communities be included in the
regional transportation planning to make sure that their communities are properly served.
SB 2021–2023
State Budget
LE Legislation
4 7

C L I M AT E S O L U T I O N S
19 Support hybrid-electric vehicles, electric vehicles, and infrastructure
S T R AT E G Y Develop a statewide electric transportation plan that:
• Includes input from key stakeholders (e.g., utilities, charging providers, EV manufacturers
and sellers, underserved communities, the PSC, and others),
• Focuses on steps to ensure that cost-effective charging infrastructure and incentives are
developed to rapidly, efficiently, and effectively increase EV adoption throughout the state,
in all sectors, and
• Places a special focus on underserved areas such as rural and lower-income urban areas.
Vehicle electrification is a key solution for decarbonizing the transportation sector, especially as
the electric grid is decarbonized. EVs offer consumers multiple benefits, including lower operat-
ing, maintenance, and fuel costs; smoother driving; and faster acceleration. Because of the high
efficiency of the electric drivetrain, the fuel economy of an EV compared to an internal combus-
tion engine is significantly higher.74 Further, a 2018 study from the University of Michigan’s Trans-
portation Research Institute found that EVs cost less than half as much to operate as gas-powered
cars, with the average cost to operate an EV in the U.S. being $485 per year (vs. $1,117 for a gaso-
line-powered vehicle).75
Presently Wisconsin charges an EV surcharge for battery electric, hybrid electric, and plug-in
hybrid vehicles (BEVs, HEVs, and PHEVs) which is higher in registration cost compared to tradi-
tional gas and diesel vehicles. To many this is considered a disincentive to the purchase, leasing,
and use of EVs and hybrids. In order to encourage EV penetration, in the short run it would be
beneficial to remove the current additional fees, especially as the EV market matures. Ultimately,
as deeper penetration of EVs occurs, it will likely be important to develop alternative funding for
road maintenance and development. This may include collecting enhanced registration fees or
utilizing road usage fees. An analysis on how to approach this issue is necessary.
In order to encourage significant EV deployment, it is necessary to address “range anxiety”
issues caused by the limited availability of public charging infrastructure and the fact that many
individuals and households in apartments or similar residential settings may not be able to charge
at their residence. Accordingly, it is important that steps be taken to help ensure that accessible
and affordable charging is available throughout the state. It is especially important to focus on
areas where the market, on its own, would likely take longer to provide charging access (e.g., rural
areas and low-income areas).
To support and grow their EV markets, states across the country have developed EV plans that
outline actions and strategies to advance their EV deployment goals.76 To name a few, Colorado,
Minnesota, Pennsylvania, and Connecticut all released their strategies within the past two years.77
In order to adequately address how best to accelerate EV adoption and the associated infrastruc-
ture, it is important that Wisconsin develop a statewide electric transportation plan with input
from key stakeholders.
EA Executive/
Agency Action
SB 2021–2023 State Budget
LE Legislation
4 8

T R A N S P O RTAT I O N
20 Safe, clean, and complete streets
S T R AT E GI E S
• Require the WisDOT to incorporate Complete Street designs in all state roadway projects.
• Restore eminent domain acquisition for pedestrian and bike trails.
• Increase state funding for the Transportation Alternatives Program (TAP) and direct a
portion of funds to under-resourced communities and environmental justice communities.
• Provide funding for bicycle programs and bike infrastructure in low-income communities.
In 2009, Wisconsin’s state legislature passed a Complete Streets law that limited state and
federal funds provided by WisDOT for highway reconstruction projects that didn’t include bicycle
and pedestrian walkways. States and cities across the country have adopted Complete Street
policies in order to more actively consider cyclists, pedestrians, and transit users in the design
and planning of all roads. For instance, typical characteristics of a complete street include bike
and walking paths, highly visible crosswalks, curb extensions, and streetlights. However, in 2015
the Complete Streets law was repealed in an effort to reduce the Department of Transportation's
regulatory costs. Yet according to nonprofit Wisconsin Bike Fed, the Complete Streets policy
improved health and safety, and helped local governments reduce cost burdens associated
with serious injuries as a result of poor street design.78 In addition, increases in biking and other
alternative methods of transportation can help reduce emissions. A 2015 study by the Institute
for Transportation and Development Policy found that a significant increase in biking worldwide
could reduce CO2 emissions in urban areas.79 In Wisconsin, if 20 percent more people in Madison
and Milwaukee biked for short trips versus driving a car, the state could emit 57,405 fewer tons
of CO2. 80
Eminent domain law in Wisconsin is articulated in Article 1, Section 13 of the Wisconsin Constitu-
tion. It allows private property to be taken by state or local governments, so long as the property
is taken for a public use and the owner is justly compensated. In 2017, the use of eminent domain
was prohibited to be used to establish or extend recreational trails, bicycle ways, bicycle lanes,
or pedestrian ways which, according to the Sierra Club, has led to a slow-down of more than
“twenty projects across the state that would improve recreation and transportation options”
and “millions of federal dollars are being left unspent.”81
In 2015, the Fixing America's Surface Transportation Act (FAST Act) eliminated the Moving Ahead
for Progress in the 21st Century Act (MAP-21) Transportation Alternatives Program (TAP). It was
replaced by Transportation Alternatives (TA) Set-Aside Implementation funding that supported
activities previously eligible under TAP, as well as smaller projects such as pedestrian and bicycle
facilities, and those that address community improvement and environmental mitigation. Invest-
ments in pedestrian and bike infrastructure typically happen in wealthy communities, ignoring the
needs of low-income communities. However, to achieve a sustainable, equitable transportation
system, it is critical that Wisconsin make investments in pedestrian and biking infrastructure in
low-income or underserved communities. These investments improve travel safety and access to
jobs, services, and recreation while providing a healthy and low-cost alternative to car ownership
and public transit.
SB 2021–2023
State Budget
LE Legislation
4 9

T he U.S. is home to nearly 900
million acres of farmland,
including pasture and grazing
lands.82 Wisconsin alone has more
than 13 million acres of agricultural
land and operates more dairy farms
than any other state.83
Climate change has negatively
affected agricultural producers
through increased frequency and
severity of extreme weather events,
and these events are projected to
intensify in the future.84 Farmers
are experiencing first-hand these
negative impacts. For example,
unpredictable weather patterns and
extreme weather events continue to
create challenging growing seasons
and negatively impact crop produc-
tion and animal health, further
contributing to financial stress
already persistent throughout agri-
cultural communities due to low
commodity markets. While some
crops might benefit from a longer
growing season, other species and
varieties of crops grown in an area
are projected to shift, resulting in
the need for new equipment, knowl-
edge, and resources to maintain
agricultural viability.85
Although agriculture currently is
a net source of emissions, farms
and ranches hold great potential to
generate negative emissions from
increased carbon sequestration
and reduce emissions from opera-
tions through low-cost strategies,
in addition to providing other crit-
ical societal benefits such as food,
habitat, and economic growth.86
There are also synergies among
climate-smart agriculture practices,
such as waste management and
composting systems that reduce
emissions and improve soil health
and carbon sequestration. Realizing
this potential will require wide-
spread adoption of climate-smart
crop management practices and
operational changes by hundreds of
thousands of individual farmers and
ranchers.
Wisconsin has an opportunity
to act on climate initiatives that
would increase the resilience of
the state’s farmers while providing
climate change benefits. Opportuni-
ties include: 1) reducing emissions
via changes to on-farm manage-
ment, and 2) advancing soil carbon
sequestration on agricultural lands
through the implementation of
conservation practices. These
opportunities could be approached
by the state through the combina-
tion of developing innovative new
programs and projects as well as
leveraging existing funding and
structures of state conservation
programming.
Globally, soils store two to three
times more CO2 than the atmo-
sphere and two to five times
more carbon than is stored in
vegetation.87 How we manage this
carbon pool can have significant
impacts on climate change. With
nearly 900 million acres of agricul-
tural land in the U.S., there is an
enormous opportunity to rebuild
soil organic carbon, sequester
atmospheric carbon, and reduce
CH4 and N2O emissions.88, 89 Some
estimates suggest that if the U.S.
were able to adequately address
economic, social, and technical
barriers to implementing soil
management best practices, U.S.
croplands have the potential to
sequester 1.5–5.0 billion metric
tons of CO2e per year for 20 years.90,
91 The same agronomic practices
that increase carbon sequestration
also can help mitigate flood events,
protect water quality, recharge
groundwater, and increase resil-
ience to drought.92 Recognizing
the societal importance of food
production, land managers and
policymakers must strive to balance
the protection of ecosystems for
climate mitigation and other envi-
ronmental co-benefits with the
need to optimize agricultural
management to feed a growing
world population. The state of
Wisconsin is a critical piece of
this puzzle. ◙
A G R I C U L T U R E
5 0

A G R I C U LT U R E
21 Support farmer-led watershed groups
S T R AT E GI E S
• Increase funding for farmer-led watershed groups promoting conservation practices.
– Establish the funding to be sufficient, increase funding to producer-led grants, increase
staff support at Department of Agriculture, Trade, and Consumer Protection (DATCP) to
track group’s progress, and support producer-led groups regionally.
– Establish a soil carbon and climate pilot program with producer-led watershed groups
to assess the extent and value of climate mitigation practices to generate carbon credits
based on verified protocols and models used in existing carbon markets. Identify
barriers to participation by agricultural producers and opportunities and solutions to
overcome those challenges.
– Fund classes and seminars to educate farmers of the benefits of no-till and minimum-till
practices in their fields.
– Increase support for nutrient and manure management to reduce N20 and CH4
emissions.
A G R I C U LT U R E
21 Support farmer-led watershed groups p. 51 E A S B L E
22 Pay farmers to increase soil carbon storage in agricultural and working lands p. 52 E A S B L E
23 Avoid conversion of natural working lands p. 55 E A S B L E
24 Make managed grazing livestock production systems an agricultural priority p. 56 E A S B L E
5 1

C L I M AT E S O L U T I O N S
PO L I C Y PAT H WAY S
• Statutory revision Wis. Stat. §. 93.59 to increase limit of award per producer-led group.
• Increases in producer-led funding and position authority for DATCP.
DATCP currently provides funding to producer-led groups that focus on non-point-source
pollution abatement activities through the Producer-Led Watershed Protection Grant Program
(PLWPG). The program’s goal is to improve Wisconsin’s soil and water quality by supporting and
advancing producer-led conservation solutions by increasing on-the-ground practices and farmer
participation in these efforts. Since launching in 2016, the program has grown from 14 groups to
31 groups funded to date.93 The PLWPG has been an effective tool to increase farmer participation
in non-point-source pollution abatement efforts to improve water quality and soil health. While
each group is different, most focus on conservation practice implementation, increasing outreach
and communication opportunities, and research and water quality monitoring activities. Allow-
ing farmers to experiment with new practices through this grant program has been an important
tool towards advancing conservation innovation in the state and has facilitated the acceptance
of non-traditional techniques via peer-to-peer (farmer-to-farmer) learning and networking. The
groups developed and coordinated through this program are well poised to be experimenters,
advocates, and messengers for climate-smart agricultural practices.
The agriculture sector holds the potential to serve as a critical climate solution, and a soil carbon
pilot program would help inform the practices and markets that would support climate-smart
agriculture in Wisconsin. This recommendation is directly related to the pay farmers to increase
soil carbon storage in agricultural and working lands recommendation below. Similar success has
been exhibited through other state programs such as Maryland’s Healthy Soils Program, which
was established in 2017 through state legislation and to date has achieved the CO2 equivalent
of removing over 5,000 passenger cars from the road through farmer adoption of cover crops,
adopting no-till or low-till farming practices, and rotational grazing.94
There are farmers that will be reluctant to change their farming practices, so it's critical that there
is thorough engagement with farmers across the state and that there are opportunities for all
farmers to learn more about the value of carbon sequestration through no-till and cover crops.
22 Pay farmers to increase soil carbon storage in agricultural and working lands
S T R AT E GI E S
• Establish a "carbon farmers" program at DATCP to develop methods for measuring how
much carbon is stored through agricultural management practices and provide tax incen-
tives or subsidies.
– Create and fund a pilot program through the Soil and Water Resource Management
grant to help inform the feasibility of a state-based agricultural policy that pays farmers
for carbon sequestration.
– Work with partners to understand carbon market options for Wisconsin that would
be consistent with, and complementary to, other efforts in the Midwest and federal
legislation to increase access to carbon markets for the state’s agriculture and
forestry industries.
SB 2021–2023
State Budget
LE Legislation
5 2

- C L IM AT E L E A DE R -
DODGE COUN T Y FA RMERS HE A LT H Y SOIL & WAT ER
Dodge County Farmers Healthy Soil & Water is a producer-led
group whose mission is to improve soil and water through
conservation practices and education. The group promotes
improving soil health through the use of cover crops, residue
management, and reduced tillage.
For the past five years, the group has provided the knowledge and
leadership needed to improve farming practices by building a strong
network of farmers, conducting research, holding monthly meetings,
providing progress reports, and hosting special events like on-farm
visits. The group also works collaboratively with non-farming orga-
nizations such as the DNR, Natural Resources Conservation Service,
lake associations, and other conservation groups to ensure farming
practices are not detrimental to the land and water.
With the changing climate and increased precipitation, the group
believes that implementing soil health practices can help reduce
runoff and erosion as well as create a more efficient carbon sink—
all while making agriculture more sustainable. They also believe the
best way to make these practices more widespread is through educa-
tion, especially peer-to-peer education. By demonstrating that no-till
and cover crops do work, showcasing examples of these farming
practices in their areas, illustrating what can be gained, and providing
incentives for conservation practices that protect soil health, more
farmers can adopt sustainable farming practices.
Dodge County Farmers Healthy Soil & Water is committed to being
part of Wisconsin’s solution to preserving its natural resources and
working to create a state where both its rich farming practices and
conservation practices can co-exist.
For more information, visit https://www.dodgecountyfarmers.com
5 3

C L I M AT E S O L U T I O N S
• Increase incentives for cover crops, reduced tillage, and crop rotation adjustments to
increase soil carbon storage.
– Establish a cost-share program to provide annual incentive payments to farmers who
sign agreements for long-term best management practices (BMPs) that mitigate the
impacts of and agriculture’s contribution to climate change, increase soil health, reduce
erosion and over-application of nutrients, and increase soil carbon storage.
– Establish a Climate Leader Award for a farm each year to highlight and educate about
climate-smart farming operations.
• Increase funding and technical support for carbon storage programs and practices.
– Establish an additional staffing grant award to support county land conservation depart-
ments in climate impact assessment and planning efforts through their land and water
resource management plans.
– Provide climate science technical support capacity at the state and county levels to
support agricultural practices that mitigate the impacts of and agriculture’s contribution
to climate change, including increasing managed grazing, alternative manure manage-
ment practices, input reduction, and assessing carbon storage metrics and methods.
– Establish a climate science education team consisting of state agencies and University
of Wisconsin System resources (including the UW Division of Extension) to develop
educational curriculum, classes, and materials focused on the importance of agricultural
climate best management practices and resources for on-farm implementation.
• Increase nutrient and manure management support to reduce N2O oxide and
CH4 emissions.
P O L I C Y PAT H WAY S
• These initiatives would require increased funding for incentives and position
authority at DATCP.
The creation of a "carbon farmers" pilot program that pays farmers for carbon sequestration and
GHG offsets would allow farmers to learn how to participate in markets that reward sustainable
management practices. This pilot program would enable DATCP and agricultural operators to gain
a thorough understanding of various carbon credit protocols and the degree of carbon credits
that various practices can generate, and therefore the amount of carbon tax credits a farm could
receive if a true carbon market is established in the Midwest. A working group would be formed
to perform iterative evaluations of the pilot program in the context of current federal legislation
and regional carbon markets. This ongoing evaluation of the pilot program will determine the
feasibility for a state carbon market for agriculture, taking into account how it could function, how
Wisconsin farmers would participate, the interest of companies in participating and purchasing
credits, and the appropriateness of these carbon markets for Wisconsin farmers.
To broaden incentives for cover crops, reduced tillage, and crop rotation changes to increase soil
carbon storage, an increase in Wisconsin’s Soil Water Resource Management grants that provide
funding through counties for on-farm implementation of conservation practices could be used.
In addition, rewarding farmers’ innovative and aggressive climate action can generate increased
awareness of climate change impacts and communicate the need for farmers to participate in
these efforts.
SB 2021–2023
State Budget
LE Legislation
5 4

A G R I C U LT U R E
Recently some county land conservation departments have worked to incorporate climate change
or extreme weather events in their land and water resource management plans, and additional
funding to counties to conduct climate change assessment and planning efforts through their
five- and ten-year land and water resource management plans is integral to understanding the
localized impacts and mitigating climate change at the county level. County land conserva-
tion departments are the on-the-ground staff that build close relationships with farmers around
conservation and deliver one-on-one technical assistance for projects and practices. Additional
county-level staff to support farmers at this level is integral to maintaining and advancing any
climate benefits realized through on-farm conservation practices. County staff also rely on engi-
neers and other specialists at DATCP to bring their local conservation practices and programming
to fruition. Therefore, a state Climate Change Adaptation and Mitigation Coordinator position at
DATCP to assist with climate-smart agriculture practice implementation strategies at local levels
would broaden the expertise provided by the state agency and help support county partners in
addressing climate change in the land use sector in ways most relatable to their local conditions.
This position would help assess conservation practices for their climate change adaptation and
mitigation benefits and would aid counties in broadening their assessment strategies to include
climate change-related metrics. A multi-agency climate science education team would provide
needed statewide expertise for farmers, consumers, industry, and units of government to turn to
for climate-related programming and information.
23 Avoid conversion of natural working lands
S T R AT E GI E S
• Incentivize identification of long-term additional farmland and conservation land base at
the local level through additional land use planning efforts.
– Increase technical and financial support to local units of government to educate
landowners about benefits of the Farmland Preservation Program (FPP) and
Conservation Reserve Enhancement Program (CREP), and resources to assist
landowners to participate.
– Increase support to local units of government to conduct farmland preservation
planning activities.
• Expand the income tax credit levels for landowners who comply with all soil and water
conservation standards.
• Explore allowing grasslands to be eligible for lower assessments through possible
modification of use value law.
• Provide funding to support economic development opportunities within Agricultural
Enterprise Areas (AEAs).
P O L I C Y PAT H WAY S
• Create an interagency state/federal working group to investigate addition of grasslands to
use value assessment.
• Statutory change to increase tax credit levels, funding for economic development, and local
government resources.
Extensive research and data have catalogued the impacts of land conversion from agriculture,
forestry, and grasslands to developed uses.95 Wisconsin needs its agricultural land more than ever
to provide food, fiber, and fuel. Protecting the most productive farmland should be of the utmost
EA Executive/
Agency Action
SB 2021–2023 State Budget
LE Legislation
5 5

C L I M AT E S O L U T I O N S
importance for Wisconsin’s economy that is so extensively supported by our working lands.
Voluntary compliance with conservation standards and adopting conservation practices through
programs like FPP and CREP not only improve water conservation and yield potential and reduce
erosion and fuel inputs but also increase carbon sequestration capacity of the soil.96 The finan-
cial incentives these programs provide motivate increased adoption of soil health practices that
increase carbon storage capacity.97
FPP has contributed significantly to raising awareness of agricultural land’s value, yet more
can be done to avoid conversion to other uses. FPP and the tax credit it provides are a tool to
increase conservation compliance across participating areas and to increase the number of
acres covered by nutrient management plans. Currently only landowners with farmland within a
certified farmland preservation zoning district or who own lands covered by an effective farmland
preservation agreement are eligible to receive the farmland preservation tax credit. Increasing the
tax credit would address shortfalls created by inflation and increased expenses for compliance
with program requirements while promoting continued implementation of soil and water
conservation standards.
The valuation standard for agricultural lands in Wisconsin differs from other land assessment
categories because the value is determined by the income it will produce as farmland. Per state
law, these lands must be primarily devoted to agricultural use. Agricultural lands include lands
devoted to crop production, those pastured for livestock, or lands enrolled in certain agricultural
or conservation programming under Tax 18.98 Grasslands provide needed wildlife habitat, their
perennial cover provides long-term soil carbon storage, and they reduce nutrient and sediment
runoff to water resources. Encouraging unproductive cropland to transition to permanent peren-
nial cover as grasslands through consideration for use value tax assessment may create motiva-
tion for transitioning those less-productive parcels.
Agricultural development is a statutorily defined goal of the AEA program.99 However, no fund-
ing mechanism has been defined for achieving this goal in the first ten years of the program.
Investing in economic development in areas that have prioritized a commitment to agricultural
use should further the program agenda of facilitating interest in agricultural preservation. A pilot
program to invest in designated AEAs would allow those communities to identify and implement
rural economic development opportunities within and surrounding AEAs to support agricultural
infrastructure, community businesses, farm viability, and enterprises that are so vital to sustain-
able rural economies.
24 Make managed grazing livestock production systems an agricultural priority
S T R AT E GI E S
• Allocate funding for a statewide grazing program at DATCP with three to four dedicated
regional coordinators (employed by DATCP or partner organizations) to support transi-
tion to grazing practices through technical assistance, business planning, and producer
education.
• Establish a program with competitive grants for education and technical assistance to land
and water agencies and nonprofit organizations.
5 6

A G R I C U LT U R E
P O L I C Y PAT H WAY
• This program would require position authority and funding for grants for education and
technical assistance at DATCP.
Managed grazing of perennial grasslands provides a continuous living cover on the soil, reducing
soil disturbance and increasing the potential for building soil carbon.100 Managed grazing reduces
the use of fossil-fuel-burning equipment used for planting, harvesting, and hauling manure, as
well as petroleum-based fertilizers and chemicals whose production also contributes to GHG
emissions on the larger global scale.101 In addition, managed grazing can improve soil health,
provide high-quality habitat for grassland wildlife and pollinators, sequester carbon, and increase
water-holding capacity, protecting the landscape from heavy rain events and flooding caused
by climate change.102 It provides these ecosystem services while reducing production costs and
increasing net income for farmers. For example, a Minnesota report identifies that transitioning 25
percent of ruminants to managed grazing and 25 percent of croplands to a combination of peren-
nial cover, diverse rotations, and cover crops could reduce the nation‘s GHG emissions by up to 9
percent.103 Electrical usage is also typically lower on managed grazing farms. Fans, lights, electric
feeding motors, and augers are used less during the 180-day grazing season, reducing the draw
on rural power grids during times of peak use.
In 2014, Wisconsin lost the Grazing Lands Conservation Initiative (WI-GLCI), which provided
important technical assistance and educational opportunities to farmers. The WI-GLCI, a grant
program coordinated by DATCP, received federal and state funding and resulted in 100,000
acres of new managed pasture and 100,000 acres of improved pasture from 2000 to 2012.104 The
WI-GLCI program provided the flexibility for local and regional organizations and agencies to
access resources and tailor programming to local needs.
The program provided trained grazing specialists who conducted pasture walks and other educa-
tional events to show farmers managed grazing in practice on their neighbors’ farms. These gath-
erings allowed grazing specialists to make initial contacts with farmers interested in managed
grazing, leading to the creation of grazing plans for their farms and provision of ongoing technical
assistance so livestock farmers could gain skills in managing their pastures. The program encour-
aged on-farm research and required researchers to involve farmers on their planning teams in
developing research priorities. The program’s goal was to increase the acreage of new and/or
improved pasture by ten percent per year over the next ten years.105
SB 2021–2023
State Budget
LE Legislation
5 7

Wisconsin’s climate is
changing. Climate chal-
lenges include more hot and muggy
weather, more intense and frequent
heavy rainfalls, and freezing winter
rain instead of snow, followed by
deep winter freezes. These changes
affect the stability of Wisconsin’s
economic sectors as well as human
health and safety. Future projec-
tions under a low-GHG-emissions
scenario suggest Wisconsin will
continue to warm into the middle
of the 21st century, including a
tripling in the frequency of extreme
heat days.106
Wisconsin is also likely to
become wetter in the coming
century, and extreme precipita-
tion events are likely to increase
in frequency and magnitude.107
For example, in March 2020 flood
events in Ashland, WI, caused
over seven million gallons of
sewage to flow into Lake Superior,
which is the source of Ashland’s
drinking water.108 Ashland was
also subjected to 500-year storm
events in 2012 and 2016 and was
in the center of a 1,000-year storm
event in 2018. Stormwater manage-
ment planning is one of many
crucial adaptation strategies to
build the resilience of communities
across Wisconsin due to increased
rain events.
While we know the actions
needed to mitigate carbon emis-
sions and slow the impacts of a
changing climate, we also know
with certainty that we must build
our adaptive capacity to enhance
Wisconsin’s resilience to the
changes ahead. Although the envi-
ronmental impacts of changing
climate have been known for some
time, we have failed to appro-
priately address these nega-
tive externalities by reflecting
climate-related fi ancial impacts
within our broader economic and
financial systems. The subsequent
result is infrastructure, commu-
nities, and industry sectors built
upon a misunderstood perception
of the environmental reality. By
measuring climate-related finan-
cial risk of short-, medium-, and
long-term climate scenarios, we
can begin to understand the finan-
cial implications of a changing
climate and the strategic invest-
ments needed to transition to a
low-carbon future.
The past decade has brought some
of the worst natural disasters and
the resulting leaching of hazardous
environmental contaminants into
nearby, often low-income commu-
nities. Natural disasters are not
great equalizers when it comes to
recovery; lower-income individuals
are more likely to live in neigh-
borhoods that are susceptible to
climate-related disasters and are
also often living near industrial
areas and hazardous waste sites,
leaving them more vulnerable to
toxic leaks and contaminated air
and water.109 Housing prices decline
as affluent people relocate out of
flood zones and other environ-
mentally unstable areas, allowing
poorer families to move in. These
trends may continue if commensu-
rate resources are not provided to
sustain or rebuild for those most
in need and decision-makers are
not suffi iently addressing disaster
prevention.
As cities assess modifications to
zoning, land use, and real estate
development, it is critical to
acknowledge climate science—
however inconvenient—and take
measures to address disaster
preparedness, aimed particularly
at helping the most vulnerable
communities. Decades of land
development, housing policy, and
economic growth have shaped
Wisconsin’s communities. Through
these policies, communities of
color have been deemed unde-
sirable and subsequently receive
inequitable investment in crit-
ical infrastructure and services.
Whether directly or indirectly, these
systemic actions have segregated
individuals by their skin color and
economic status. These drivers
of climate change and resulting
health and safety impacts must be
front and center and considered
throughout the implementation of
these recommendations. ◙
R E S I L I E N T S Y S T E M S
5 8
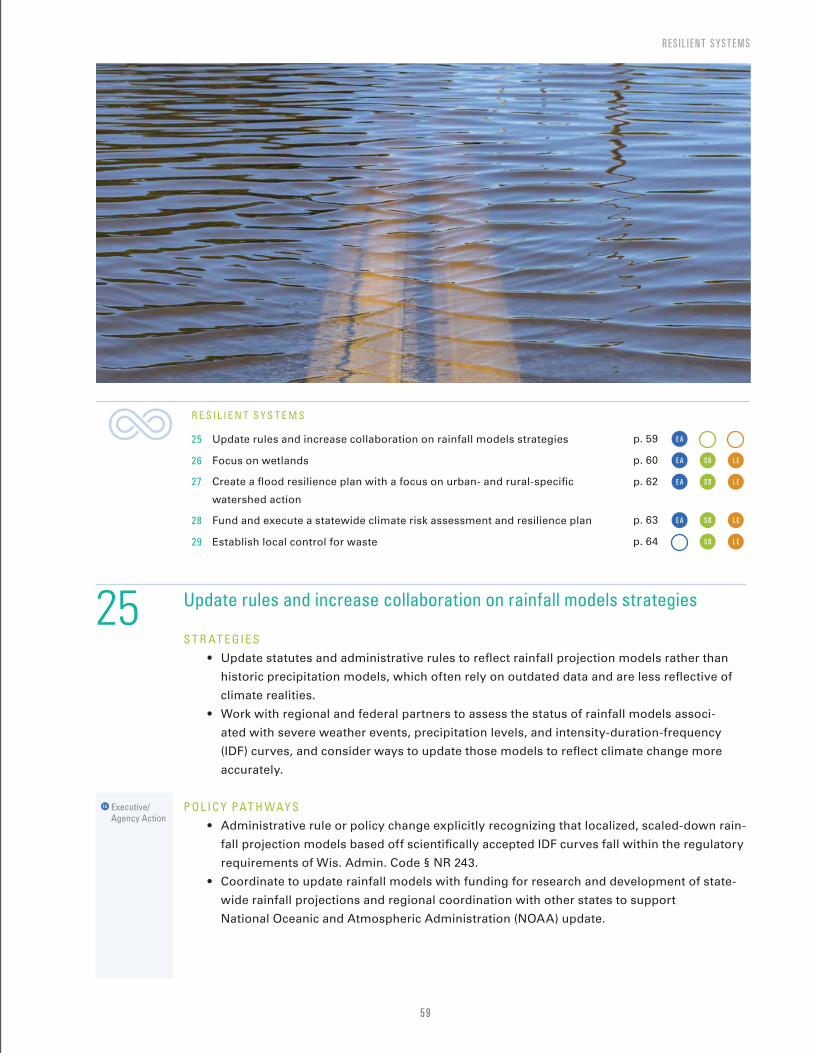
R E S I L I E N T S YS T E M S
25 Update rules and increase collaboration on rainfall models strategies
S T R AT E GI E S
• Update statutes and administrative rules to reflect rainfall projection models rather than
historic precipitation models, which often rely on outdated data and are less reflective of
climate realities.
• Work with regional and federal partners to assess the status of rainfall models associ-
ated with severe weather events, precipitation levels, and intensity-duration-frequency
(IDF) curves, and consider ways to update those models to reflect climate change more
accurately.
P O L I C Y PAT H WAY S
• Administrative rule or policy change explicitly recognizing that localized, scaled-down rain-
fall projection models based off scientifically accepted IDF curves fall within the regulatory
requirements of Wis. Admin. Code § NR 243.
• Coordinate to update rainfall models with funding for research and development of state-
wide rainfall projections and regional coordination with other states to support
National Oceanic and Atmospheric Administration (NOAA) update.
EA Executive/
Agency Action
R E S I L I E N T S Y S T E M S
25 Update rules and increase collaboration on rainfall models strategies p. 59 E A S B L E
26 Focus on wetlands p. 60 E A S B L E
27 Create a flood resilience plan with a focus on urban- and rural-specific
watershed action
p. 62 E A S B L E
28 Fund and execute a statewide climate risk assessment and resilience plan p. 63 E A S B L E
29 Establish local control for waste p. 64 E A S B L E
5 9

C L I M AT E S O L U T I O N S
Multiple reports have indicated that temperature and precipitation totals for the state will continue
to rise. Moreover, the frequency, duration, and severity of extreme weather events are all increas-
ing in Wisconsin. Until recently, many Wisconsin programs relied on U.S. Geological Survey Soil
Conservation Service Technical Paper 40 (TP40) for rainfall data.110 TP40 was published in 1961
and used historic rainfall data between 1937 and 1958. Given the age of that information, the data
and limits set by TP40 were clearly out-of-date and inapplicable as limits by the early 2000s. In
2013, the NOAA published NOAA Atlas 14, which identified precipitation frequencies for much of
the U.S., including the Midwestern states.111 Atlas 14 represents an ongoing, collaborative study
between NOAA and regionally defined states to analyze historic rainfall data to identify precipita-
tion event frequencies. Regions are updated and integrated into Atlas 14 as states within a region
opt-in to the review. Following publication of the updated data, Atlas 14 specifically overrules
TP40 and serves as the rainfall model for Wisconsin.
While Atlas 14 updated 60-year-old models, the study still does not sufficiently account for precip-
itation changes that are exacerbated by climate change. Wisconsin has seen an escalation in rain-
fall duration, frequency, and severity as well as seasonal shifts resulting from climate change.112
Therefore, models and regulations premised on historic analyses cannot adequately account for
the increased rate of these changes. When the regulatory standards are not representative of
weather realities, rural communities face an increased threat of water contamination from agricul-
tural runoff, manure spills, and leaking facilities. At a minimum, representative standards would
likely increase the required storage capacity of many manure lagoons around the state and could
potentially change spreading practices.
WICCI is beginning precipitation research that could improve the effectiveness of many Wiscon-
sin programs that rely on Atlas 14 rainfall data. One of WICCI’s proposals, the Wisconsin Rainfall
Project, will develop geographically specific, downscaled climate projections across the state. The
Wisconsin Rainfall Project will be capable of more accurately projecting extreme precipitation
events across the state and has already been cited by the City of Madison on municipal stormwa-
ter projects.
26 Focus on wetlands
S T R AT E GI E S
• Reconnect hydrologic systems and strategically restore wetlands to help solve runoff and
flooding issues in watersheds impacted by climate change.
• Prioritize wetland restoration and remediation.
• Establish an advisory council of experts to help craft a statewide strategy to restore the
natural capacity of Wisconsin landscapes to manage and store water.
• Support two pilot watershed assessment projects to develop methods of identifying
degraded hydrologic conditions and restoration priorities at the sub-watershed scale.
The methods and practices modeled will be a resource for watershed resilience planning
throughout the state.
• Support demonstration projects to showcase watershed-based wetland and floodplain
restoration techniques and practices that build resilience to flooding and drought.
6 0

R E S I L I E N T S YS T E M S
P O L I C Y PAT H WAY S
• An advisory council can be created by legislative, executive, or agency action, with
membership and mission outlined in its charter.
• Watershed assessment projects and flood demonstration projects can be implemented
through legislation or budget action. Since wetland and floodplain restoration achieves
multiple objectives (e.g., runoff management, flood control, carbon storage, fish and wild-
life habitat), these recommendations could be funded by soliciting requests for proposals
through existing grant programs. Strong local collaborations are often crucial to the
success of these projects and lay groundwork for identifying joint concerns and securing
funding to address them.
Wisconsin has lost nearly half of its original ten million acres of wetlands since the late 1800s.113
The legacy of wetland loss has fundamentally changed the way water flows across our land-
scapes. Millions of acres of wetlands have been ditched and drained; thousands of miles of
streams have been diverted, straightened, or armored; and many of our rivers are disconnected
from adjacent floodplains along major stretches.
These degraded conditions of wetlands disrupt the capacity of our watersheds to store and
manage water, and cause increased runoff, flashier flows, decreased baseflow, and severe
erosion. Absent intervention, the capacity of our landscapes to manage water will continue to
decline, even as climate vulnerabilities and associated damages continue to rise. We need to
prioritize wetland and floodplain restoration to ultimately improve the condition of watersheds
across the state to handle the increased intensity and frequency of precipitation and to maintain
baseflow and shallow groundwater supply during periods of drought.
An advisory council is needed to convene experts who will help move Wisconsin forward in
developing a statewide strategy to address water management issues. The pilot watershed
assessment projects and flood demonstration projects will provide a starting point for examples
of how local collaborations can work together to identify shared problems, identify potential
solutions focused on restoring the land’s natural capacity to manage and store water, implement
restoration practices, and measure results. While these projects are geographically situated,
the framework and lessons learned will be useful for other communities grappling with simi-
lar problems.
The advisory council can be convened as soon as possible to work on short- and long-term
recommendations for forming a state strategy to improve watershed health and resilience.
The advisory council’s work will be iterative and informed by results from the pilot watershed
assessments, flood demonstration projects, and other information. Pilot watershed assessment
projects can begin immediately as well, but need 12–18 months to complete. Construction of
demonstration projects can be completed in one field season pending engineering and resto-
ration costs. Training opportunities associated with demonstration sites will be ongoing.
EA Executive/
Agency Action
SB 2021–2023 State Budget
LE Legislation
6 1

C L I M AT E S O L U T I O N S
27 Create a flood resilience plan with a focus on urban- and rural-specific watershed action
S T R AT E G Y A flood resilience plan should include the following characteristics and goals:
• A plan for flood prevention;
• Water quantity and quality controls through natural solutions;
• A goal to restore historical wetlands in flood zones;
• Strict regulation on development in existing wetlands through easing of permitting for
restoration work and subsidies for property owners;
• Review of existing riparian buffer ordinances (provide protective revisions);
• Additional funding for existing flood resilience programming;
• Protection of critical wetlands and undeveloped lands in upper watersheds that impact
downstream urban areas;
• Assessment of watershed-level flood risks based on future flood and precipitation projec-
tions, in coordination with existing state assessments and research from the WICCI;
• Formation of a resilience office, which can house staff to implement statewide flood resil-
ience planning and shoreline erosion mitigation, and develop stormwater green infrastruc-
ture recommendations and planning; and
• Incentivize partnerships by providing training, planning tools, grant funds, and trained facil-
itators to help nonprofits, county, landowner, federal, and state agencies work together to
implement community resilience plans.
P O L I C Y PAT H WAY S
• A flood resilience plan would identify at-risk areas and prioritize them for funding.
This recommendation focuses on resilience: proactive solutions, prevention measures, and miti-
gation of the impacts of increased flooding due to the current and worsening effects of climate
change. Flooding of both urban and rural communities across Wisconsin has been an increasing
issue. Across the U.S., floodplain management is often a piecemeal and disjointed undertaking.114
Local governments are often left to develop their own plans, with minimal coordination among
neighboring jurisdictions or clear priorities from state agencies or officials. Therefore, to develop
a unified vision for floodplain management, the state should follow a model similar to one most
recently employed by Texas.115 The Texas Water Development Board is developing a statewide
flood plan that will be based on regional plans developed for each major river basin within the
state. While developing basin plans, communities are encouraged to work jointly and engage
with a range of stakeholders to identify major risk factors, consider and compare flood protection
options, and reach consensus on priority projects and protection policies. In addition to promot-
ing collaboration between individual localities, this framework provides a forum in which socio-
economic vulnerabilities can be addressed and supports prioritization of nature-based and other
solutions that will provide benefits above and beyond flood protection.116
There are myriad potential benefits of watershed-based planning. For example, watershed-level
analyses can help reveal land-use impacts across jurisdictions that might have otherwise gone
unrecognized.117 Understanding flood-risk drivers on a watershed scale can help identify key
opportunities to enhance the health of natural systems, such as restoring degraded streams or
wetlands and reconnecting floodplain lands. Looking across local planning and policy can also
expose knowledge, data, and regulatory gaps in stormwater or floodplain management that can
contribute to increased risk for citizens and assets.
EA Executive/
Agency Action
SB 2021–2023 State Budget
LE Legislation
6 2
R E S I L I E N T S YS T E M S
State-led collaboration across jurisdictions can also help identify priority projects, which
can stimulate jobs and reduce future losses, thereby positioning the state to access and
disperse federal resources more quickly. By empowering communities with tools and
resources to collaborate within a watershed, the state can increase the scale, cost-ef-
fectiveness, and benefits of risk-reduction projects, and better leverage local resources
against federal dollars. For example, after experiencing years of extreme weather events
in the region, topped off by three consecutive years of devastating floods, Monroe County
formed a climate change task force and is now a model for regional planning, assessment,
and action.118 Examples like this illuminate that a state flood strategy should be developed
on a watershed basis.
28 Fund and execute a statewide climate risk assessment and resilience plan
S T R AT E G Y Utilizing robust data and state-of-the-art technology to better understand
climate-related financial risk across the state, we can begin to strategically invest in adap-
tation measures that build resilience. This work must integrate processes that empower
regional and local units of government to continue adaptation and resilience planning
forward. The goal must be to build processes that are iterative and enable communities to
withstand system shocks, whether climate, health, or economic in nature.
P O L I C Y PAT H WAY S
• Require that climate change be included in comprehensive plans by revising
Wis. Stat. § 66.1001 to include a tenth required element: climate change.
• Require that local hazard mitigation plans include climate change.
• Require communities throughout Wisconsin to include climate change in their
community health improvement assessment and plans.
It is critical that Wisconsin understand the risks associated with the changing climate
described above and projected future scenarios. According to a federal report by the U.S.
Commodity Futures Trading Commission (CFTC), virtually every part of the economy is
vulnerable to the adverse effects of climate change, including human health and safety,
infrastructure, agriculture, residential and commercial property, and labor productiv-
ity.119 Without imminent progress mitigating global temperature rise, climate change will
reduce economic productive capacity and threaten opportunities for generating jobs and
income.120 Such an outcome could result in disorderly price adjustments in various asset
classes and have other less-predictable adverse effects in many facets of the U.S. finan-
cial system. Climate risk assessment should analyze impacts associated with both physical
and transitional climate risks.
A statewide climate risk assessment and resilience plan is necessary to identify infrastruc-
ture and communities most at risk of climate change impacts. Understanding vulnerabil-
ities and the statewide financial ramifications of changing climate will ensure mitigation
and adaptation measures taken are fiscally responsible and deliver the most equitable and
highest return on investment. This effort transects all state agencies and should be devel-
oped collaboratively, with state, regional, and local participation. Failing to understand the
climate-related financial risk for the state of Wisconsin will inhibit the effective transition
EA Executive/
Agency Action
SB 2021–2023 State Budget
LE Legislation
6 3

C L I M AT E S O L U T I O N S
to a low-carbon economy and present major risks to statewide economic and financial systems.
Acting now to measure, understand, and address these risks will allow for a more swift, coordi-
nated, and confident response strategy—positioning Wisconsin as a leader in climate action and
resilience.
Adequate funding is necessary to successfully develop a statewide climate risk assessment and
resilience plan. Funding should consider the need for dedicated staff, technology, and consultant
resources. In addition, funding should be provided to state and regional agencies and academic
partners to ensure their time can be dedicated appropriately.
29 Establish local control for waste
S T R AT E G Y Give local control back to local governments and allow local jurisdictions to adopt
environmental regulations above and beyond state minimum.
Municipalities can reduce waste and emissions, and protect natural resources by developing and
mandating their own environmental regulations. In 2016, the Wisconsin legislature passed 2015
AB 730, which took authority away from municipalities to ban plastic bags. 2015 AB 730 gave the
state authority over the regulation of auxiliary containers, which includes bags, bottles, or other
reusable and single-use packaging. In addition to preventing bans, 2015 AB 730 prohibits local
governments from imposing a fee for the use of these containers or regulating their disposition
or sale.121
SB 2021–2023
State Budget
LE Legislation
6 4

Failing to understand the climate-related financial risk for the state of Wisconsin will inhibit the effective transition to a low-carbon economy and present major risks to statewide economic and financial systems. Acting now to measure, understand, and address these risks will allow for a more swift, coordinated, and confident response strategy—positioning Wisconsin as a leader in climate action and resilience.
6 5

T ransitioning to a clean economy
will deliver economic, environ-
mental, and public health outcomes
for Wisconsin. Across the U.S.,
the energy sector is moving away
from fossil fuels and towards clean
sources of energy.122 In order to be
economically competitive within
the region and nationally, work-
force and economic development
initiatives are necessary to prepare
Wisconsinites for these careers of
the future.
This energy transition will also
provide important public health
co-benefits and can help Wisconsin
communities adapt to the expected
impacts of climate change.
Increasing renewable energy
deployment and transitioning away
from fossil fuels will reduce both
GHGs and conventional air pollut-
ants including oxides of nitrogen
(NOx), sulfur oxides (SOx), particu-
late matter, and mercury pollution.
Moreover, developing the clean
economy in Wisconsin will reduce
the disproportionate pollution
burden faced by communities of
color and low-income communities.
The clean energy transition is
already underway in Wisconsin
and nationally. According to 2020
Clean Jobs Midwest, there were
over 76,000 clean energy jobs in
Wisconsin prior to the COVID-19
crisis, including individuals in all 72
counties.123 At the end of 2019, the
clean energy sector employed more
Wisconsin workers than all waiters
and waitresses, computer program-
mers, lawyers, and web developers
in Wisconsin combined.124 Further,
clean energy jobs (including jobs
related to energy efficiency) in
Wisconsin grew 1.5 times faster
than the state’s overall employ-
ment.125 These clean energy jobs
are currently split almost evenly
between the combined Milwaukee
and Madison metro areas and
Wisconsin’s rural areas, demon-
strating that clean energy jobs
can lead to both urban and rural
economic growth.126
Nationally, clean energy jobs
continue to make up an increasing
share of total energy sector
employment.127 Energy efficiency
already employs more than one
out of every three U.S. workers in
the overall energy industry.128 Wind
service turbine technicians and
solar photovoltaic installers are
the number one and number three
fastest-growing occupations.129 This
national trend can also be found
in the continued job growth for
wind jobs in Wisconsin, increasing
more than two percent in each of
the past two years.130 Addition-
ally, many jobs in the clean energy
economy are accessible to workers
with a high school education,
limited college, or an associate’s
degree—such as construction, elec-
tricians, maintenance. Compared
to similarly educated peers in
other industries, they tend to earn
higher wages.131 For instance, over
two-thirds of clean energy jobs
are in construction and manufac-
turing.132 As Wisconsin looks to
recover from the current health and
economic crisis, investing in the
clean economy can spur sustained
job creation and economic growth
for the state.
Investing in the clean economy
also builds long-lasting community
and environmental resilience. Jobs
programs can also build on existing
apprenticeship and service models
and serve as a pathway for individ-
uals from underserved communi-
ties into the clean energy economy.
While the potential for clean energy
jobs in Wisconsin is significant,
policy actions are crucial to build
an inclusive clean energy work-
force and ensure that all individuals
may participate in the clean energy
transition.133 This includes retraining
for displaced fossil-fuel workers, as
well as apprenticeship programs
that serve historically marginal-
ized communities. Focused training
programs can expand clean energy
jobs to those of all backgrounds
and help rectify the current lack
of diversity in the sector. The
COVID-19 pandemic and its dispa-
rate health and economic impacts
on communities of color raises the
urgency on ensuring a just transi-
tion to a clean economy.
This section’s recommenda-
tions center on the participation
of communities, labor unions,
affected industries, and appren-
ticeship and education programs.
This includes affected community
participation on the recommended
Green Energy Advisory Council
C L E A N E C O N O M Y
6 6

C L E A N E C O N O M Y
and the Just Transition Advisory
Committee. Wisconsin can build on
successful examples in other states
when designing these efforts.
Other states including Colorado,
New Mexico, and New York have
already created high-level offices to
elevate just transition elements into
their energy planning.
Broad and coordinated economic
development across sectors and
regions can ensure that no commu-
nities are left behind. Careful
planning for the retirement of
fossil fuel assets and re-invest-
ment in affected communities
can lessen the financial impact
to workers, local businesses, and
counties. Centering communities
and workers in these efforts is vital
to building a just transition for all
Wisconsinites, and active participa-
tion and leadership of broad stake-
holder groups has been built into
the following recommendations. ◙
C L E A N E C O N O M Y
30 Establish a Green Energy Advisory Council p. 68 E A S B L E
31 Create and deploy workforce transition plans p. 68 E A S B L E
32 Support public post-secondary educational entities p. 70 E A S B L E
33 Create new jobs through conservation and prepare individuals for work
within the green energy sector
p. 71 E A S B L E
34 Create a Wisconsin Economic Development Corporation Green Grant
and Loan program
p. 72 E A S B L E
35 Conduct a complete analysis and create a pathway to participate in
or implement carbon pricing that is optimal for Wisconsin
p. 74 E A S B L E
6 7

C L I M AT E S O L U T I O N S
30 Establish a Green Energy Advisory Council
S T R AT E G Y Establish a Green Energy Advisory Council (Council) consisting of leaders of compa-
nies, utilities, labor unions, technical colleges, and apprenticeship programs and tasked with
creating a strategic venue for interaction and training programs and curricula driven by industry’s
priority workforce needs.
Creating this Council to oversee green job training will benefit both Wisconsin’s economy and
the environment. Investing in this workforce will signal to companies that Wisconsin is ready to
transition to the clean economy, and it will ensure that Wisconsin’s workforce will be ready for the
innovative and renewable industries of the future. The Council should also be directed to ensure
current fossil fuel industry workers, communities of color, and low-income individuals have
opportunities to benefit from education and jobs related to green energy.
The clean energy transition is already underway in Wisconsin, and preparing workers for the tran-
sition is imperative for the state’s economic, community, and public health. By 2018 Wisconsin
already had eight times more workers in the clean energy sector than in fossil fuels.134 Continued
investment in this workforce through training and apprenticeship programs will create pathways
for all Wisconsinites to participate in this growing workforce and the clean energy careers of
the future.
Energy efficiency leads all clean energy sectors in Wisconsin, employing over 63,500 people—
accounting for 8 in 10 of all clean energy workers.135 Energy efficiency also directly reduces costs
for households and businesses and is one of the most cost-effective GHG mitigation strategies.
Renewable energy generation came in second with nearly 6,000 jobs, led by solar and wind.136
These sectors now employ more than the approximately 3,300 workers employed at coal power
plants.137 Continued investments can support these growing state industries while positioning
Wisconsin to play a leading regional role in the Midwest’s clean economy.
A coordinated state approach to these efforts can help maximize the value of these investments
by ensuring that job training programs are responsive to the latest industry trends while serving
community needs. Employers in the energy sector cite lack of expertise and technical training as
the number one issue when hiring.138 This problem is particularly acute within the energy effi-
ciency construction sector, where more than 90 percent of employers surveyed said it was some-
what difficult or very difficult to find qualified hires.139 Trade programs can open pathways to these
professions for Wisconsinites without a college degree. Targeted training programs developed in
consultation with industry partners can provide Wisconsinites with the technical trade skills and
certifications needed to lead in the clean energy economy.
31 Create and deploy workforce transition plans
S T R AT E GI E S
• Establish a Just Transition Advisory Committee to work with utility companies to identify
or estimate the timing and location of facility closures and job layoffs in fossil-fuel-related
industries and their impact on affected workers, businesses, and communities. The
committee would help draft a just transition plan for Wisconsin for consideration by the
governor and legislature.
EA Executive/
Agency Action
6 8

C L E A N E C O N O M Y
• Establish and fund a clean energy training and reemployment program for affected workers
as well as workers new to the workforce with special attention to people and communi-
ties of color, Indigenous people and Native Nations, low-income people and communities,
and formerly incarcerated people. Utilize established apprenticeship and technical college
programs to deliver this training. Seek existing federal funding to supplement this initiative.
• Ensure jobs created include worker’s rights, such as paid family leave, sick days, health
insurance, and a fair wage.
The climate crisis has many implications for jobs throughout Wisconsin and the U.S., espe-
cially when the fossil fuel industry is phased out for more renewable energy. However, this also
provides a unique opportunity for Wisconsin to create jobs and have workers from the fossil fuel
industry be part of a just transition to a green economy. There is a need for these new jobs to help
those who were previously in the fossil fuel industry, as well as communities of color, formerly
incarcerated people, and low-income communities and households.
In 2019, coal and natural gas provided 76 percent of Wisconsin’s net power generation.140 There
were approximately 3,300 workers employed at these power plants at the end of 2019.141 Wiscon-
sin’s power sector is moving away from coal as a fuel source, based on consumer demand
for cleaner power and the declining cost of natural gas and renewable resources. This is a key
component to reaching a zero-carbon target.
The effects of coal plant closures on workers and communities have the potential to be significant
if not managed correctly. These plants have in many cases provided workers with strong union
jobs capable of supporting a family on less than a college degree. In addition to impacts on indi-
vidual workers and their families, the loss of coal-fired power plants can have severe impacts on
municipal tax bases, which provide important local services. Establishing a thorough workforce
transition plan early in the plant decommission process will result in a better transition away from
carbon-based fuels. This plan coupled with a robust and properly funded training and re-em-
ployment policy will help alleviate the negative impact on communities that are affected by plant
closures.
When fair access to good jobs with fair pay and safe conditions exist, individuals and communi-
ties become healthier. This policy could help improve income inequality and other social determi-
nants of health. Part of the just transition to a green economy is not only ensuring equity in access
to good jobs, but also ensuring that those jobs include workers’ rights such as family leave, sick
days, fair wages, and health insurance. These rights are vital to support the transition but also
to improve the health of people in the workforce. This policy needs to help those who are most
vulnerable not only to mitigate the climate crisis, but also to address current systemic barriers and
inequities in the current economy.
This policy is specifically related to environmental justice, especially if modeled after Minnesota,
Colorado, and Virginia, which brings attention to specific communities such as communities of
color, fossil fuel workers, and low-income communities among others.
Minnesota’s legislature is currently considering the Minnesota Green New Deal (HF 2836 (2020)),
which includes job training programs and the opportunity to participate in the clean energy econ-
omy with specific attention to communities of color, Indigenous people, low-income communi-
ties, workers in the fossil fuel industry, and formerly incarcerated people.142 Minnesota legislators
EA Executive/
Agency Action
SB 2021–2023 State Budget
LE Legislation
6 9

C L I M AT E S O L U T I O N S
have also introduced another bill, HF 3938 (2020),143 which would initiate a sustainable energy plan-
ning strategy for Minnesota’s transition to a renewable energy economy and includes a strong jobs
consideration.
In 2019, Colorado passed HB19-1314,144 which creates a just transition office in the division of
employment and training in the Department of Labor and Employment. In addition to this
permanent high-level office, the bill established a just transition advisory committee tasked
with developing a draft just transition plan with participation from affected stakeholder groups.
In 2020, Virginia passed the Virginia Energy Plan (HB 714),145 which includes creating jobs in the
energy efficiency program and a just transition, among other key points. Also in 2020, the Virginia
legislature introduced a separate bill, HB 547 (2020),146 that would establish the Virginia Energy
Economy Transition Council to assist Virginia in the transition from the use of fossil fuels to renew-
able energy by 2050.
32 Support public post-secondary educational entities
S T R AT E GI E S Implement new educational programs and curriculum changes within existing
educational programs that reflect and support a workforce transition to the new jobs and skills
required in response to actions taken to minimize the impact of climate change.
P O L I C Y PAT H WAY S
• Appoint members to the University of Wisconsin Board of Regents and the Wisconsin Tech-
nical College System Board of Trustees, as well as Secretary of the Department of Workforce
Development.
• Support the new required education program in the 2021-2023 State Budget.
• Direct that a portion of the existing funding for workforce training—such as Wisconsin Tech-
nical College System's Workforce Advance Training (WAT), Wisconsin Economic Devel-
opment Corporation (WEDC), and Department of Workforce Development Fast Forward
grants—be designated to support worker retraining to learn necessary skills as businesses
and manufacturers adopt new technologies in response to climate change.
• Fund for the development of educational pathways that allow students to progressively,
cost efficiently, and easily move from system to system, attaining higher-level credentials,
retraining as technologies change, and making occupational career changes.
• In order to receive or compete for funding, a post-secondary educational entity should estab-
lish an advisory committee that includes employers engaged in implementing new strate-
gies, products, and processes in response to climate change.
• Fund the Higher Educational Aids Board (HEAB) to target scholarships to students engaged
in studies directly related to programs preparing them for careers in occupational areas
addressing or responding to climate change.
Without a skilled and available workforce, Wisconsin will not be able to reach its goals that mini-
mize climate change impacts. Supporting the development of academic and technical skills through
post-secondary educational programs will help grow the workforce needed by businesses and
employers as they introduce new strategies, products, and processes in response to climate
change. These new opportunities often require the retraining of an employer’s existing workforce,
which can be costly. Subsidizing that cost allows these employers to adopt needed changes.
EA Executive/
Agency Action
SB 2021–2023 State Budget
LE Legislation
7 0
C L E A N E C O N O M Y
33 Create new jobs through conservation and prepare individuals for work within the green energy sector
S T R AT E GI E S
• Create a green jobs corps pilot program in Milwaukee. Pilot a program in Milwaukee
modeled after the Oakland Green Jobs Corps, a job-training pipeline providing green path-
ways out of poverty for low-income adults in Oakland, CA.
• Create a state-funded and state-run AmeriCorps-like program to train and deploy workers
to provide assistance restoring and rebuilding natural lands in both rural and urban areas.
Potential areas of work include:
– Coordinate resilience at local/watershed/regional levels in both urban and rural settings.
– Restore and build natural outdoor space for children in under-resourced areas.
– Lead tree-planting initiatives in urban areas, in Native Nations, and on public lands.
– Assist and train locals to build and care for community gardens in low-income and
Native Nations across the state.
• Create a state trails and parks job program for individuals transitioning out of the correc-
tional system.
These programs would create jobs and put more Wisconsinites to work, preserve and rebuild
natural areas, and make Wisconsin more resilient to the effects of a changing climate. These
programs are designed to help program participants from diverse backgrounds build sustainable
careers within the clean economy through technical training, professional development,
and industry connections.
The Milwaukee green job corps pilot program would train workers to be prepared for the nation
and the state’s transition to renewable energy. The program would also provide benefits to local
communities by ensuring that there is a renewable energy workforce prepared to supply clean
energy to some of the communities most impacted by climate change.
This program would be modeled on the successful Oakland Green Jobs Corps program, which
was launched in the fall of 2008. The City of Oakland awarded $250,000 to local capacity-building
partners to start the program.147 Participants move through the program in phases. The first two
learning components include hands-on construction and trade skills as well as classroom instruc-
tion that covers relevant clean energy industry topics (e.g., solar panel installation, principles of
sustainability, and environmental justice). Participants are then placed in six-month paid intern-
ships for on-the-job training. The program provides a certificate of completion, and students are
eligible for federal financial aid.
The program provides trainees with the tools to build careers in the clean economy through
world-class job training, environmental education, and connections to green jobs. In turn, the
graduates help advance community climate protection goals by creating a skilled local workforce
capable of doing the work necessary to achieve widespread GHG reductions in the community.
Conservation programs developed under this effort will focus on building career opportunities for
program participants while also increasing climate resilience. These programs can help achieve
environmental justice by targeting training and employment to people of color and low-income
individuals. These initiatives could also provide employment opportunities for those affected by
the COVID-19 pandemic and associated economic impacts, including young people.
SB 2021–2023
State Budget
LE Legislation
7 1

C L I M AT E S O L U T I O N S
A state-funded and run AmeriCorps-like program could build on existing initiatives such as
WisCorps148 to further expand the conservation workforce while investing in Wisconsin’s
natural lands and resources. These efforts could help prepare the state for the impacts from
climate change in both rural and urban areas. Watershed restoration programs could bolster
floodwater management and increase drought preparedness. Urban greening efforts including
tree planting, community gardens, and increasing access to urban outdoor space would not
only sequester GHGs but would also improve local air quality and increase recreation
opportunities in underserved communities.
34 Create a Wisconsin Economic Development Corporation Green Grant and Loan program
S T R AT E G Y Create a WEDC Green Grant and Loan program to support Wisconsin businesses
that focus on zero-waste, energy efficiency, green technology, and green businesses. Designate a
portion of these funds to support people of color, women, and veteran-owned businesses. Also,
designate a sub-set to start-ups investing in new technologies.
Renewable energy is the fastest-growing energy source in the U.S., doubling from 2000 to 2018.149
Nearly 90 percent of this growth is driven by wind and solar, with increases between 2008 and
2018 of 5 times the amount of wind generation and 48 times the amount of solar generation.150
Continued cost declines have made renewable technologies cost-competitive with traditional
generating sources,151 and the Energy Information Administration forecasted that wind and solar
will make 76 percent of all new capacity additions this year.152 A 2019 report found that new solar
and wind installed capacity is already more cost-effective than 74 percent of the existing U.S. coal
fl et.153 While this industry is growing quickly and costs continue to decline,154 government poli-
cies that support the research, development, and deployment of renewable energy technologies
will continue to be important in further driving costs down and spurring new innovations.
While federal tax incentives are helping this industry grow, state-specific funding could help
attract renewable energy companies to Wisconsin and could help incentivize current companies
to invest in green technology and research. In addition, as home to the UW System and other
great higher education institutions, the state should explore how it can retain young entrepre-
neurs and make Wisconsin a smart choice for start-ups.
Existing state economic development corporations can serve as a central organizing entity for
these efforts. WEDC155 leads economic development efforts for the state by providing resources,
operational support, and financial assistance to companies, partners, and communities in Wiscon-
sin. WEDC connects more than 600 partners, including regional economic development organiza-
tions, industry, academic institutions, and community partners, to foster economic growth across
the state.
WEDC manages a number of grant, loan, tax credit, and venture capital programs but does not
have one specific to funding businesses related to clean energy, zero-waste, or green technolo-
gies. Creating one could help draw and generate these businesses to and in our state, lessen our
reliance on imported energy, create jobs, and retain students graduating from the state higher
education systems.
EA Executive/
Agency Action
SB 2021–2023 State Budget
LE Legislation
7 2

- CLIMATE LEADER -
T HE JOY T RIP PRO JEC T
Founded by James Edward Mills, a 2014 Fellow of the Mountain &
Wilderness Writing Program at the Banff Centre in Alberta, Canada,
and the 2016 recipient of the Paul K. Petzoldt Leadership Award for
environmental education, the Joy Trip Project is a newsgathering and
reporting organization that covers outdoor recreation, environmental
conservation, acts of charitable giving, and practices of sustainable
living. Through storytelling, the Joy Trip Project aims to discover how
to live in harmony with the natural world and the rest of humanity.
Through the Joy Trip Project and his work, Mills highlights the
need to diversify the outdoors and asserts that “the nation’s wild
places—from national and state parks to national forests, preserves,
and wilderness areas—belong to all Americans. But not all of us
use these resources equally. People from marginalized communi-
ties are much less likely to seek recreation, adventure, and solace
in our wilderness spaces.” Coined by Mills as the “adventure gap,”
the lack of inclusivity and diversity within outdoors spaces is a huge
threat to the environment. If people do not feel connected to the
land and its resources, how do they become good stewards of it?
Mills calls attention to this issue through his work and challenges
individuals, government, and non-profits to engage with under-rep-
resented communities and help make public lands and outdoor recre-
ation more equitable. He also highlights how policies related to the
national park system have historically discriminated against Black
people—including how Jim Crow laws were incorporated into the
national park systems.
In addition to advocating for the outdoors to be more inclusive,
diverse, and equitable, Mills actively works to get more diverse popu-
lations into the outdoors by leading hiking, camping, and fishing
adventures. He is committed to sharing his love and passion with
the outdoors in hopes that outdoor spaces will reflect the diversity
within our country. Mills believes that over the next several years, it
is imperative that conservationists and outdoor recreation advocates
engage underrepresented segments of the population to ensure the
next generation is engaged with the land.
For more information, visit
https://joytripproject.com/about-joy-trip-project/
7 3

C L I M AT E S O L U T I O N S
Wisconsin could follow the example set by other states that have taken steps to integrate clean
economy considerations into their state economic development corporations. For instance, the
Michigan Economic Development Corporation has recently participated in bilateral memoran-
dums of understanding (MOUs)156 and prioritized green infrastructure in its investments.157 Massa-
chusetts has had a separate economic development corporation for over a decade committed
solely to the clean energy economy.158
35 Conduct a complete analysis and create a pathway to participate in or implement carbon pricing that is optimal for Wisconsin
S T R AT E GI E S
• Create a study commission to better understand potential impacts of revenue-gener-
ating, revenue-neutral, and cap-and-trade or other carbon pricing systems for the state
of Wisconsin, and determine how the state can best support regional and federal carbon
pricing efforts. Report out by December 31, 2021.
• Launch carbon pricing pilots:
– Internal carbon price research and implementation through UW System institutions.
– Partner with a voluntary, large Wisconsin-based emitter to test a carbon pricing pilot to
create a model for other large emitters.
Pricing carbon will accelerate Wisconsin’s transition toward a green sustainable economy.
According to the Intergovernmental Panel on Climate Change (IPCC), policies that put a price on
high emitters are needed to achieve cost-effective 1.5°C pathways.159 Eleven states across the
country currently participate in carbon markets and use the generated revenue to help fund a
wide range of programs like energy efficiency initiatives, flood preparedness and coastal resil-
ience, clean transportation projects, and clean energy investments.
Ten states participate in the Regional Greenhouse Gas Initiative (RGGI), a cap-and-trade program
that is reducing power-sector GHG emissions across the New England and Mid-Atlantic region.160
Beginning in 2021, Virginia will become the eleventh RGGI member and the first Southern state to
join the initiative.161 Pennsylvania is also working toward joining RGGI.162 A similar group of states,
through the Transportation & Climate Initiative (TCI), is currently working to “design a regional
low-carbon transportation policy proposal that would cap and reduce carbon emissions from the
combustion of transportation fuels.”163
California’s cap-and-trade program plays a pivotal role in helping the state reach its climate
goals while helping disadvantaged and low-income communities. Covering 85 percent of the
state’s GHG emissions, the program has generated more than $12 billion in revenue over the past
decade. Sixty percent of these funds have gone to projects that directly benefit marginalized
communities across the state.164
EA Executive/
Agency Action
LE Legislation
7 4

Part of the just transition to a green economy is not only ensuring equity in access to good jobs, but also ensuring that those jobs include workers’ rights such as family leave, sick days, fair wages, and health insurance. These rights are vital to support the transition but also to improve the health of people in the workforce.
7 5

A rticle 6 of the United Nations
Framework Convention on
Climate Change highlights educa-
tion and training as “integral” to
reducing the impacts of climate
change.165 In fact, a recent study
quantified that over a 30-year
period, climate change education—
if implemented globally—could
reduce emissions by almost 19
gigatons of CO2e, largely attributed
to lifestyle changes that resulted
from awareness of the causes and
impacts of climate change.166 Thus,
an informed citizenry represents
a critical foundation to build
climate mitigation and adaptation
strategies.
In the U.S., there is no federal
requirement that climate change
be taught in schools, despite over
80 percent of American parents
supporting its inclusion in science
curricula.167 States set their own
policies, such as by adopting the
Next Generation Science Stan-
dards, which broadly require that
global warming be introduced as
a “core idea” in middle school.
However, only 20 states and the
District of Columbia (representing
36 percent of U.S. students) have
adopted these standards. Another
24 states, including Wisconsin,
have developed custom stan-
dards based on broad K-12 science
education frameworks, but stan-
dards are inconsistent in whether
they highlight climate change
as a human-induced problem.168
Wisconsin’s Standards for Science
include climate change curricula for
grades 6 through 12, including the
“core idea” that human activity is a
causal factor.169
Beyond providing knowledge of
the causes, impacts, and solu-
tions to climate change, the educa-
tion system itself is a model of
climate change’s costs and unequal
impacts. Each year in the U.S., K-12
districts spend more money on
energy than they do on computers
and textbooks combined—over
$6 billion annually—and up to 30
percent of this use is inefficient
or unnecessary, leading to excess
GHG emissions.170 In Wisconsin,
public schools collectively spend
over $175 million in energy costs
each year, the second-largest
expenditure in many school district
budgets. When students and staff
spend six to eight hours per day
in aging, poorly ventilated school
buildings, they may be exposed
to poor indoor air quality and
increased heat stress. Indoor air
pollution in schools has been linked
to higher asthma rates in minors.171
In Wisconsin, the asthma burden
disproportionately falls upon
racial and ethnic minority popula-
tions.172 According to new research,
areas with growing numbers of
hot school days demonstrate
decreased student learning rates
and teaching quality, impacts that
are disproportionately borne by
lower-income school districts and
students of color.173
Schools that pursue energy effi-
ciency measures not only save
money and reduce GHG emis-
sions, but they can also reinvest
these savings into improving their
learning and environmental justice
outcomes. A 2019 study found
that if 67 percent of Wisconsin’s
public-school buildings “improved
their energy usage to exceed the
current energy code, they would
save an additional $8,220,000 in
utility costs.”174 These savings
can be put towards green infra-
structure, such as green spaces
and school gardens, which offer
outdoor learning opportunities,
higher neighborhood quality, and
stormwater management. School
gardens, for example, can help
advance environmental justice
and health equity by increasing
access to nutritious foods, serving
as a scaffold for science educa-
tion, and providing pathways to
green careers in urban and regen-
erative agriculture. One Wisconsin
school that transformed its building
to a greener, healthier facility
achieved $85,000 in annual energy
savings; decreased allergies and
asthma by 75 percent, absen-
teeism by 15 percent, and commu-
nicable diseases by 425 percent;
and increased test scores, teacher
retention, and enrollment. ◙
E D U C A T I O N
7 6

E D U CAT I O N
36 Expand support for teaching K-12 Climate Science and creating climate resilient schools
S T R AT E GI E S
• Reduce school building energy consumption and emissions.
• Increase green infrastructure at schools.
• Develop interdisciplinary, standards-aligned curriculum resources at the elementary,
middle, and high school levels, including an understanding of climate, the interconnected
nature of climate change, its potential local and global impacts, and individual and societal
actions that may mitigate its harmful effects.
• Restore the ability for school districts to exclude investments in energy efficiency and
renewable energy from revenue limits.
In 1990, the Wisconsin Center for Environmental Education (WCEE) was officially created under
1989 Wisconsin Act 299. The WCEE has two main programs on which its staff focus: KEEP, the
Wisconsin K-12 Energy Education Program, and LEAF, Wisconsin’s K-12 Forestry Education
Program. The WCEE also supports Green & Healthy Schools (GHS) which began in 2002.
GHS empowers, supports, and recognizes schools for nurturing healthy kids and sustainable
communities. These programs may be used as mechanisms to move forward with teaching
K-12 Climate Science in schools.
To help high-needs schools develop interdisciplinary, standards-aligned climate change
curriculum resources at the elementary, middle, and high school levels, the Department of
Public Instruction (DPI) may provide direct grants or contract with other agencies or
E D U C AT I O N
36 Expand support for teaching K-12 Climate Science and creating
climate resilient schools
p. 77 E A S B L E
37 Launch a climate change public education campaign p. 78 E A S B S B
SB 2021–2023
State Budget
LE Legislation
7 7

C L I M AT E S O L U T I O N S
non-governmental organizations (NGOs) to assist in material development. These climate change
standards should include an understanding of climate, the interconnected nature of climate
change, its potential local and global impacts, and individual and societal actions that may
mitigate its harmful effects. In June 2020, New Jersey became the first state to fully integrate
climate change education into its K-12 curriculum, moving it from an isolated topic under the
sciences to a component of other subjects like social studies, health, and mathematics.175
As part of the 2013–2015 budget, Governor Walker approved the ability of a school board, via
a resolution, to proceed with a Revenue Limit Exemption for energy efficiency projects. This
allowed school districts the authority to approve to borrow money beyond revenue limits set by
the state to pay for energy efficiency measures (renewable energy was excluded). Essentially, the
return on investment of the implemented energy efficiency project would pay for itself over time
and help a school district realize the benefits of reduced energy consumption and associated cost
savings right away.
As part of the 2017–2019 budget, Governor Walker exercised his veto authority and implemented
a 1,000-year moratorium on the school district energy efficiency revenue limit exemption, revers-
ing his previous decision. This was due to a number of districts increasing their debt related to
exceeding revenue limits for energy efficiency projects. Governor Walker explained this would
“maintain the ability for school districts to ask taxpayers if they wish to exceed revenue limits and
eliminate an exemption that has been viewed as a loophole to revenue limits.”
With limited budgets, this shut down the opportunity for school districts to pursue large energy
efficiency projects. Energy efficiency and now low-cost renewables (especially solar) should still
have the ability to pay for themselves over time. If this revenue limit exemption is reinstated, it
will allow flexibility for school districts to pursue new projects. DPI could work closely with other
state agencies with energy expertise to provide measurement and verification of the project's
proposed savings (pre- and post-implementation) in order to protect taxpayers and improve our
school infrastructure.
37 Launch a climate change public education campaign
S T R AT E GI E S
• Enable Wisconsinites to understand why they need to take urgent action to reduce carbon
emissions.
• The campaign(s) will:
– Focus on phenology—showing how scientists have found that recent changes in plants’
and animals’ life cycles demonstrate that Wisconsin’s climate is changing and predict
how it will change in the years to come.
– Show how those changes are affecting and will affect Wisconsinite lives as well as how
Wisconsinites should manage affected natural systems to benefit themselves and their
environment.
– Acquaint Wisconsinites with the need for and benefits of task force policies to reduce
carbon emissions and increase clean energy.
7 8

E D U CAT I O N
Many climate policies recommended by this task force will only succeed with broad, public
buy-in. A climate change public education campaign must provide Wisconsinites with information
about climate change, how it is impacting and will impact Wisconsin, and how Wisconsinites can
best mitigate or adapt to those changes, in part by helping to implement the recommendations
of the task force. This campaign can counter climate change misinformation while identifying the
health and economic benefits Wisconsinites will gain from a cleaner economy and environment.
By generating widespread awareness of these benefits, these campaigns can help build, expand,
and sustain public support of Wisconsin’s climate policies.
EA Executive/
Agency Action
SB 2021–2023 State Budget
7 9

A robust food system is an
integral part of Wisconsin’s
economy, health, and sustainable
future. The state’s agricultural
and food production sectors are
responsible for feeding both
local residents and far-reaching
communities throughout the U.S.
Importantly, the state’s food system
is closely tied to familial history
and heritage for many of the
Wisconsinites who contribute to the
growth and production of food in
the state. This legacy is especially
apparent amongst many local
Native Nations and subsistence
hunters and farmers, who not only
rely on local food resources for
health and survival, but also as a
key component of their cultural
heritage.176
Yet as Wisconsin’s food system has
expanded through the decades, so
too have the challenges involved in
efficiently managing food produc-
tion and distribution in an equi-
table, environmentally favorable
manner. In the U.S., the average
meal can travel many hundreds of
miles from source of production
to the point of consumption.177 A
significant percentage of our food
resources are not even consumed,
and end up decomposing in land-
fills.178 Such practices fail to priori-
tize local food economies and pull
fresh, healthy food options away
from Wisconsin communities.
Food-related transportation and
unnecessary waste also contribute
to GHG emissions in the U.S.
As such, an improperly managed
food system can result in significant
contributions to climate change.
Yet many of the food resources in
Wisconsin are themselves vulner-
able to the warming climate. In
particular, subsistence commu-
nities and Native Nations who
rely on resources like wild rice for
consumption and livelihood may be
significantly impacted by climate-
driven environmental changes in
the coming decades.179 Though the
precise impacts of climate change
on these food sources must be
further investigated, there is little
doubt that adaptation strategies
will have to be developed to help
protect communities relying on
these resources. In addition to the
cultural losses, the decline in the
Wisconsin subsistence and wild
rice food sectors would dramat-
ically increase food insecurity,
adversely affect the health of the
communities relying on these
resources, and put undue pressure
on the existing food supply chain in
the region.
More than one in ten households
in the state are becoming food inse-
cure.180 The flaws in the distribution
of food resources and the vulner-
abilities of the Wisconsin food
system to climate change are two
major contributing factors. Hispanic
and African American households
are particularly vulnerable and
show disproportionately high rates
of food insecurity throughout the
state.181 Redistributing surplus food
and investing in local food econ-
omies could have a significant
impact correcting for these inequi-
ties. However, resources must also
be allocated to specifically protect
wild rice habitats and subsis-
tence lifestyles to help address
the vulnerabilities of Tribal food
sources and cultural heritage to
climate change.
Strategies to improve Wisconsin’s
food system must focus on
bolstering the local production
and distribution of food resources.
Such strategies must build
connections between suppliers
and local communities, support
subsistence and wild rice food
supplies, and minimize waste with
efficient redistribution of food
surpluses. Taking such steps will
help to ensure a healthy Wisconsin
population, economy, and
environment. ◙
F O O D S Y S T E M S
8 0

F O O D S YS T E M S
38 Increase funding to support local food systems
S T R AT E G Y Help ensure robust local food systems and economies by increasing funding to
the state’s Farm-to-School and Buy Local, Buy Wisconsin programs; creating and funding the
Governor’s Farm-to-Fork proposal; and supporting programs that promote local food system
development to connect people with healthy and nutritious food options.
The modern globalized food system has resulted in a significant separation between the source
of food production and the location of eventual consumption. Though highly variable by location,
studies have found that food resources in the U.S. can travel over a thousand miles from farm to
plate.182 Food transportation on this scale is not only unnecessary in many cases, but also results
in significant adverse impacts to the environment and local communities in Wisconsin. Local food
production ensures GHG emissions from shipping and refrigeration are minimized and results in
fresher, healthier food remaining within the local community where it was grown or produced.183
Fostering a local food system also gives consumers greater transparency and purchasing power
to choose foods grown and produced with high health standards (e.g., organic items).
The Farm-to-School program is an example of a local food initiative with significant benefits to
several segments of a given community.184 By building connections between schools and local
food producers, the program ensures school children have access to healthy local food items that
are essential for growth and development in early childhood. Educational activities associated
F O O D S Y S T E M S
38 Increase funding to support local food systems p. 81 E A S B L E
39 Develop a food waste program p. 82 E A S B L E
40 Create a Manoomin (Wild Rice) Stewardship Council in partnership
with interested Native Nations
p. 83 E A S B L E
41 Create a statewide subsistence adaptation plan p. 84 E A S B L E
SB 2021–2023
State Budget
LE Legislation
8 1

C L I M AT E S O L U T I O N S
with the program give opportunities for students to learn more about health, farming practices,
and the local origins of their meals.185 The program supports local food producers (including
farmers, processors, ranchers, and others) by offering financial opportunities for food sales
within their community. As a whole, the Farm-to-School program strengthens local economies
and promotes vibrant, connected communities by building producer-consumer relationships
between Wisconsin farmers and schools.
The proposed Farm-to-Fork program would have a similar benefit to local Wisconsin food
economies. Rather than connecting food producers specifically with schools, Farm-to-Fork
aims to build connections between local food suppliers and other entities in need of large quanti-
ties of fresh, healthy food (especially those with cafeterias). The program aims to help the public
develop healthy eating habits and to provide information about local food producers, while also
supporting community farmers and producers through enhanced access to key local markets.
The program would award grants to businesses, universities, hospitals, and other entities that
are innovative or provide models for other entities to adopt.
A third state program supporting the local food economy is the Buy Local, Buy Wisconsin (BLBW)
competitive grant opportunity.186 Managed by the DATCP, BLBW aims to assist the state’s agricul-
tural and food supply sectors with expanded opportunities for food sales at the local level. Grants
are offered to help suppliers overcome challenges related to the marketing and distribution of
their products in local markets. The program offers a total of $200,000 in annual funding with a
maximum project award of $50,000 and a requirement that grantees provide a cash or in-kind
match of 50 percent (minimum) of the total budget for the project.187 Grants are awarded to a wide
variety of applicants, including “groups or businesses involved in Wisconsin production agricul-
ture, food processing, food distribution, food warehousing, retail food establishments or agri-
cultural tourism operations,” according to the DATCP BLBW call for proposals.188 In the history of
the program’s 67 funded projects, BLBW has generated some $10 million in new food sales at the
local level, generated or helped retain 233 jobs in the state’s food production sector, and helped to
support thousands of producers and food markets throughout Wisconsin.189
39 Develop a food waste program
S T R AT E G Y Pilot a food waste program, modeled after the successful Nashville Food Waste Initia-
tive, which encompasses preventing food waste, redirecting surplus food, and composting, with a
special focus for areas with food deserts. Once the pilot program has proven successful on a city
level, the program could be launched statewide. The program should work directly with various
stakeholders, including restaurants, farmers, grocery stores, and local communities.
Food waste is a major issue in the U.S. that contributes significantly to GHG emissions and has
serious implications for sustainable and equitable farming practices. According to the EPA,
Americans threw out more than 40 million tons of food in 2017, amounting to more than 15
percent of the total waste generated in the U.S. that year.190 Only about 6 percent of that food
waste was composted, while the remaining 94 percent ended up contributing significant GHG
to the atmosphere as it decomposed in a landfill or burned in a combustion facility.191 In addition
to the emissions resulting from wasted food, the water, energy, and human efforts involved in
producing the food in the first place are also wasted. Wisconsin, as one of the country’s leading
SB 2021–2023
State Budget
LE Legislation
8 2

F O O D S YS T E M S
agricultural states, has a unique opportunity to support the agricultural industry and local
communities throughout the state by addressing this pressing environmental and social issue.
Food waste is an especially concerning issue given the disparities that exist in Wisconsin
regarding access to food. Rates of food insecurity vary throughout the state, but more than one
in ten households are considered food insecure on average, highlighting how pressing the issue
of food availability is for many communities in Wisconsin.192 Food insecurity is even more serious
among Hispanic and African American households, at 32 percent and 34 percent, respectively
(as of 2017).193 The disparity between food availability in these communities and the general
population underscores the significant environmental justice concerns when it comes to food
insecurity in Wisconsin.
Importantly, food insecurity is closely associated with adverse health outcomes that are
preventable with reliable access to healthy food options.194 If the policy focuses on redirecting
food surplus to areas that have limited access to food (also known as food deserts) then it can
help households who are food insecure receive healthy food as well as encourage sustainable
farming practices in rural areas. Such policies can offer communities access to fruits and
vegetables instead of processed foods, which can help improve overall health and well-being.
Efforts are already being made to address the issue of food waste at the local level. The
Milwaukee City-County Task Force on Climate and Economic Equity Preliminary Report describes
the need to “develop strategies to reduce food waste, feed hungry Milwaukee residents, increase
composting, and develop markets for compost.”195 Milwaukee officials have considered the
successful Nashville Food Waste Initiative as a blueprint.196 This program engages stakeholders
in the community—including restaurants, governments, and retailers—to prevent food waste,
redirect surplus food to those in need, and compost food that must be disposed of.
40 Create a Manoomin (Wild Rice) Stewardship Council in partnership with interested Native Nations
S T R AT E G Y Form a permanent council to work in partnership with Tribes and Ojibwe wild rice
chiefs to provide support developing long-term solutions for proper management and protections
for northern wild rice (Zizania palustris), lakes, rivers, and surrounding ecosystems. A minimum
of half of the membership should be determined by interested Native Nations and include Ojibwe
wild rice chiefs.
Wild rice, also known as Manoomin, is a culturally significant plant that has provided food for
the Ojibwe and Menominee people for over a thousand years.197 The Ojibwe were one of several
Tribes that migrated from the East Coast after a prophecy predicted invaders from the sea and
plentiful food growing in the West.198 The migrating tribes soon discovered that food to be the
wild rice of the Great Lakes region, a grain that is an incredible nutritional source in the region and
which became critically important to the Native American diet for generations.199
Wild rice grows in the northern regions of Wisconsin and is well adapted to the state’s harsh
winter climate.200 Yet the species is also extremely sensitive to environmental conditions. It is
estimated that half of Wisconsin’s wild rice has already been lost because of poor water quality,
human activity, and loss of ideal natural habitats.201 The effects of climate change now pose yet
EA Executive/
Agency Action
SB 2021–2023 State Budget
LE Legislation
8 3

C L I M AT E S O L U T I O N S
another significant threat to wild rice and the way of life for Native Nations who rely on Manoomin
as a food source. Warming winter temperatures and increasing extreme weather events are
expected to lead to significant additional losses of wild rice in the state.202 Alarmingly for the
future of wild rice, Northern Wisconsin is anticipated to be the location of the greatest warming in
the state over the next 50 years.203
Ongoing, dedicated work alongside Native Nations to protect and preserve wild rice would also
have positive environmental impacts in the state. Aside from the major role it plays in the Ojibwe
diet and way of life, wild rice is a key element of Great Lakes coastal and interior wetlands that
provides essential habitat and food for a variety of animal species. Wild rice can significantly
improve local water quality by stabilizing soils, absorbing nutrients, and reducing friction from
wind and flowing water.204 Each of those ecosystem services is lost without proper management
of wild rice systems.
In 2018, Minnesota Governor Mark Dayton created a Wild Rice Task Force, which issued a
comprehensive report on managing wild rice in the state.205 The leading report recommenda-
tion was to create a Minnesota Wild Rice Stewardship Council to help protect the state’s wild
rice ecosystems. The council—made up of scientists, government representatives, and repre-
sentatives from all 11 of the state’s federally recognized Tribes—is charged with better managing
wild rice because of the positive health impacts, ecosystem services, and cultural importance of
Manoomin in the state. The nutritional benefits of wild rice are particularly relevant to the Tribes
that rely on the food staple because of the disparities between citizens of the Native Nations and
their white peers in both Minnesota and Wisconsin.206
41 Create a statewide subsistence adaptation plan
S T R AT E G Y Support the development of a statewide resource vulnerability index and an
accompanying subsistence adaptation plan. Conduct initial survey work—in collaboration with
Wisconsin communities—to identify species of importance for subsistence. Develop a team to
evaluate and assess the natural resources that subsistence communities rely upon in Wisconsin
to eventually use for improved management throughout the state.
P O L I C Y PAT H WAY S
• Appropriate funds to develop and carry out this work and the development of a statewide
resource vulnera bility index and an accompanying adaptation plan.
Climate change threatens food systems throughout the region and will disrupt subsistence life-
styles in Wisconsin. As regional populations continue to rise and the demand for food produc-
tion increases, large agricultural practices will potentially have to increase production. Impor-
tantly, communities of color are likely to be disproportionately affected by the sensitivities of
the Wisconsin food system to climate change given the existing disparity between healthy food
availability compared to White communities.207 Inner-city minority groups have limited access
to harvesting opportunities, while rural communities endure environmental degradation of
subsistence resources that provide much-needed and oftentimes traditional/cultural forms of
nourishment.
EA Executive/
Agency Action
SB 2021–2023 State Budget
LE Legislation
8 4

F O O D S YS T E M S
A multifaceted approach, which would encourage state residents to proactively grow and harvest
their own food throughout the year, could reduce some of the mass food production demand.
As climate change threatens native species significant for cultural, subsistence, economic, and
aesthetic purposes, a comprehensive adaptation plan could be simultaneously created that
encompasses vulnerable resources and mechanisms for adaptation planning.
Yet an assessment of resources of significance and the level of vulnerability is important to docu-
ment and understand, in order to better prepare and plan. Many resources are already at record
threat level. In northern parts of the state and throughout the region, walleye populations are
struggling to thrive as water temperatures increase and other environmental factors related to
climate change make it difficult for survival. Walleye are important to Wisconsin’s economy in the
form of hook-and-line fishing, but also significant to rural and Native Nations that depend upon
clean fish for consumption. Understanding the species' vulnerability for mitigation and adaptation
planning will help Wisconsin communities address current resource issues and plan for future
adaptation.
8 5
U .S. forests serve as a carbon
sink, offsetting approximately
10–20 percent of U.S. emissions
each year.208 Forests are one of the
largest sources of negative emis-
sions nationwide, and activities
like reforestation and improved
forest management hold the
great potential to increase carbon
sequestration.209 Broadly speaking,
forestlands are a source of GHG
emissions when they are converted
to other land uses (e.g., cropland),
when trees are harvested or other-
wise removed, and because of
catastrophic wildfire. Forests accu-
mulate carbon through tree growth,
replanting, and afforestation.
Carbon stored in long-lived wood
products, such as timber used
in buildings, is a mechanism for
storing sequestered carbon outside
the forest itself. Forest conserva-
tion (i.e., keeping forests as forests)
is a foundational pathway and
good management is essential to
keeping those forests preserved
and healthy.
Forests are Wisconsin’s dominant
land type, comprising 48 percent
of the state’s landscape, or 17
million acres of Wisconsin’s 35
million acres of land.210 From the
Northwoods to the urban areas of
Milwaukee, these dynamic, living
systems are vital to Wisconsin
by providing raw material to the
forest and wood products industry,
recreational areas, public health
benefits such as improved air and
water quality, and ecosystem func-
tions such as wildlife habitat and
watershed protection. Wiscon-
sin’s forests also provide a unique
opportunity to address climate
change because they both prevent
and reduce GHG emissions while
simultaneously providing essen-
tial social, environmental, and
economic benefits. However,
changes in climate are expected
to impact the function, health, and
productivity of forests, particularly
in northern latitudes, and forest
managers face many challenges
associated with the uncertainty of
how forests will respond to envi-
ronmental changes.211
Active management can reduce
the impacts of climate change, but
the efficacy and sustainability of
many adaptation and mitigation
practices need to be refined with
further application and monitoring.
For example, forest management
that considers the future changes
in our climate can increase carbon
storage by up to 3.4 million metric
tons of CO2 per year, or an increase
of 23 percent over current carbon
sequestration rates.212 Additional
carbon can be stored by modi-
fying other management practices
to maximize carbon benefits, such
as planting tree seedlings in forest
stands currently below well-stocked
levels and increasing harvest inter-
vals. In addition, implementing
adaptive, climate-focused manage-
ment strategies could help ensure
Wisconsin forests are more resil-
ient to climate change impacts.
Forests contribute vastly to the
state’s ecological, social, and
economic well-being. The majority
of Wisconsin’s forestland is located
in rural areas of the state in coun-
ties with low median incomes,
while urban forests contribute to
more-livable communities and
reduce temperature and heat
stress in underserved communi-
ties. The following recommenda-
tions aim to strengthen the state’s
forest resources and industries and
have a positive impact on those
nearby communities through local
jobs, reduced energy costs, and
an overall positive economic and
social impact in these historically
underserved communities. ◙
F O R E S T R Y
8 6

F O R E S T RY
42 Prioritize forest conservation to "keep forests as forests"
S T R AT E GI E S
• Tax forest land on its current use rather than its highest and best use.
• Provide tax credits or other financial incentives to landowners donating conservation ease-
ments with carbon benefits.
• Investigate the development of a family forest carbon credit program for small wood-
land owners.
• Source additional funding to acquire conservation easements and purchase lands to main-
tain them as working forests, protecting stored carbon and supporting local economies.
P O L I C Y PAT H WAY S
• Legislation would be required to change current or create new statute(s) that provide
tax-based incentives.
Preventing forest conversion and keeping forests as forests will help protect the carbon already
stored in Wisconsin’s forests. Forested land cover can mitigate the effects of climate change by
providing soil protection.213 Long-term increases in forest area and growing stock allow forest
carbon storage to increase. Keeping forests as forests can increase carbon storage by up to
276,000 metric tons of CO2 per year. Maintaining a balanced distribution of forest types, ages,
and size classes is an important consideration.
SB 2021–2023
State Budget
LE Legislation
F O R E S T R Y
42 Prioritize forest conservation to "keep forests as forests" p. 87 E A S B L E
43 Pursue reforestation in rural areas p. 88 E A S B L E
44 Encourage tree planting in urban areas p. 89 E A S B L E
45 Implement climate-focused forest management p. 90 E A S B L E
46 Support Wisconsin wood product utilization p. 91 E A S B L E
Photo courtesy of Travel Wisconsin
8 7

C L I M AT E S O L U T I O N S
A recent study on the economic contributions of conservation easements suggests working forests
protected by conservation easements have an overall positive economic impact on rural econ-
omies.214 Sustainable forestry practices, influenced by forest certification and land fragmenta-
tion, help ensure Wisconsin’s forests are managed in a way that contributes ecologically, socially,
and economically to our well-being. However, trends in ownership patterns continue to show
more landowners owning smaller parcel sizes, a key contributor to fragmentation of the forested
landscape and reduced carbon-storage capacity. Parcelization continues to occur as the number
of landowners continues increasing while average parcel size continues decreasing, leading to
concerns about habitat connectivity and economies of scale associated with sustainable forestry
practices, which could have negative economic consequences for both landowners and the logging
community. Efforts like a family forest carbon program help connect rural family forest owners
with companies to address climate change by giving families an opportunity to earn income from
their land, in exchange for implementing sustainable forest practices that help sequester and store
carbon. Companies can then purchase this carbon in the form of verified carbon credits.215
43 Pursue reforestation in rural areas
S T R AT E GI E S
• Develop and implement a rural tree-planting campaign.
• Increase funding for private landowner assistance through the Wisconsin Forest Landowner
Grant Program (WFLGP) to encourage more tree planting.
• Prioritize afforestation efforts on public lands.
• Secure funding to purchase and reforest open lands that were formerly forested, creating the
first state forest with a primary goal of carbon storage.
P O L I C Y PAT H WAY S
• Fund a rural tree-planting campaign.
• Increase funding for WFLGP.
Reforestation via tree planting is one of the simplest and most powerful tools for increasing carbon
storage on our lands. Wisconsin has many opportunities on public and private lands to increase
trees and stocking for healthy forests, and increased reforestation on public and private lands in
the state could offset as much as 5.6 million tons of CO2 per year.216 Lands to target for tree plant-
ing include unprofitable, marginal, or highly erodible farmland, agricultural or open lands in flood-
prone areas, open lands along riparian zones, and areas where opportunities to create or connect
wildlife corridors is high.
Many rural forest landowners are also agricultural producers located in counties with low median
incomes; tax breaks and funding for tree planting will encourage forest management and increase
carbon sequestration and storage. In addition, communities along rivers or other low-lying commu-
nities would benefit from reduced stormwater runoff because of trees. Afforestation (the planting
of a forest or trees in an area where there was no previous tree cover) may at times be viewed as
competing with agriculture, so to mitigate any negative impacts this effort would focus on marginal
and low-quality agricultural land. A campaign to plant trees in rural areas could start immediately,
with the DNR Division of Forestry working with partners on this campaign and prioritizing affor-
estation analysis and efforts on public lands.
SB 2021–2023
State Budget
LE Legislation
8 8

F O R E S T RY
44 Encourage tree planting in urban areas
S T R AT E GI E S
• Improve the health and well-being of urban communities by developing and implementing
an urban tree-planting campaign to foster more shade tree planting initiatives, fund
removal and replacement of dying ash trees, and other efforts.
• Provide financial and technical assistance to Wisconsin communities interested in partici-
pating in carbon credit programs, such as City Forest Carbon Credits.
• Support the development of urban wood programs to build local economies and utilize
local wood products, while continuing to sequester the carbon found in urban wood.
P O L I C Y PAT H WAY S
• Increase financial and technical assistance for Wisconsin communities for tree planting for
the Urban Forestry Grant Program to foster more shade tree planting initiatives.
This recommendation specifically calls for immediate increased financial and technical assistance
for Wisconsin communities to foster more shade tree planting initiatives. Urban tree planting
combined with enhanced tree maintenance can substantially increase urban forest carbon storage
and deliver additional carbon mitigation benefits through energy savings, especially if tree
planting programs are targeted to urban heat islands. The forest canopy in Wisconsin’s urban
communities has the potential to store an additional 332,000 metric tons of carbon as well as
provide other co-benefits such as improved public health, reduced city temperatures, stormwater
reduction, reduced heating and cooling costs, improved air quality, increased property values,
and other social, community, and economic co-benefits.217
Urban trees cover a small area relative to the whole state but play an important role in improving
air and water quality and public health. While urban trees sequester and store carbon, they reduce
energy demands because of their shade-giving abilities and transpiration of water vapor. Urban
trees also provide a range of additional benefits, including increased property values and reduced
crime rates. Urban tree-planting programs provide professional tree care jobs and help build a
local wood products economy. The U.S. Bureau of Labor Statistics reports that between 2020
and 2030, entry-level jobs in urban forestry will increase by ten percent.218 The DWD projects that
between 2016 and 2026 there will be an eight percent increase in the jobs outlook for Wisconsin
arborists.219 Other U.S. states like Rhode Island are also establishing urban forestry programs to
help accelerate and realize the myriad benefits of these trees.220
In addition to the benefits to people and communities, this recommendation also focuses on
developing urban wood programs to build economies and utilize wood products. Trees are about
half carbon and when they are made into urban wood products the carbon remains captured for
the product life, saving a significant amount of CO2 from being emitted to the atmosphere by
either burning the wood or grinding it into mulch. It is important to have markets for urban wood
that offer long-term carbon storage such as furniture, flooring, and other wood products.
SB 2021–2023
State Budget
LE Legislation
8 9

C L I M AT E S O L U T I O N S
45 Implement climate-focused forest management
S T R AT E GI E S
• Define carbon as a forest product through state policy to facilitate incorporation of
climate-focused management goals and practices into public and private forest manage-
ment programs and strengthen an emerging voluntary carbon market.
• Develop and implement climate-focused management practices for Wisconsin’s urban and
rural forests, including:
– Create programs providing financial assistance (e.g., property tax incentives) for both
public and private landowners to encourage underplanting in forest stands that are not
fully stocked.
– Use the defined carbon as a forest product to facilitate incorporation of climate-focused
management goals and practices into public and private forest management programs.
– Secure continued funding to acquire conservation easements and purchase lands
to maintain them as working forests, protecting stored carbon and supporting local
economies.
– Facilitate development of a family forest carbon program to allow small forest owners
to access forest carbon markets.
P O L I C Y PAT H WAY S
• Legislation would be required to define carbon as a forest product or to create new
statute(s) providing tax-based incentives and to secure funding to acquire conservation
easements and purchase lands.
Establishing carbon as a forest product would provide forest managers the economic oppor-
tunity to not only sell the wood that is cut, but also to sell the carbon from the wood that is
grown. Markets are rapidly emerging, especially for large forest owners, to sell carbon either
through compliance cap-and-trade programs (e.g., California’s program) or through voluntary
carbon exchanges. Since 2005, global voluntary carbon market projects have helped reduce,
sequester, or avoid more than 437 metric tons of CO2e.221 Defining carbon as a forest product
would help strengthen an emerging carbon market and incentivize growing trees and help to store
additional carbon. This change would incentivize the inclusion of increasing carbon storage as
part of forest management.
Consideration should be given to how defining carbon as a forest product (and resulting sale
of carbon credits in a forest carbon market) affects traditional wood markets in Wisconsin. This
could be addressed by highlighting data from U.S. Department of Agriculture (USDA) Forest
Service's Forest Inventory programs, which shows that net wood volume growth greatly outpaces
harvest removals at a nearly 2:1 ratio. Sound forest management has changed to favor respon-
sible forest management and tree harvesting such that “traditional forest management” often
closely aligns with requirements outlined by carbon offset markets for forest management.
Forest-based wood markets have traditionally been defined by product outputs from sawmills,
pulp mills, and other users of wood products to create physical products for sale in the market.
Forest carbon is now a priced commodity in the global marketplace, and according to USDA, the
U.S. carbon market is in its formative stages, with markets taking shape at the regional and state
levels.222 Forest carbon markets are not easily accessible for forest landowners in Wisconsin, and
forest carbon needs further quantification and emphasis as a forest product as outlined in this
recommendation and associated strategies.
SB 2021–2023
State Budget
LE Legislation
9 0

F O R E S T RY
46 Support Wisconsin wood product utilization
S T R AT E GI E S
• Develop and implement a campaign on the benefits of using Wisconsin wood products,
such as “local wood is good.”
• Acquire data and conduct analysis to calculate Wisconsin’s carbon emissions and the
impact of various forestry-based strategies to store carbon.
• Invest in research, development, and commercialization of Wisconsin-grown mass timber,
cross-laminated timber, biochar, and other innovative wood-based technologies
to store carbon.
• Support and incentivize the use of renewable thermal energy (woody biomass),
including for space heating, hot water, and industrial process heat such as district or
CHP and community-scale heating programs for hospitals and schools (e.g., the Fuel for
Schools program).
Wood is extremely effective for long-term carbon storage. Buildings made from wood not only
use less energy to produce and manufacture, but – through sustainable forest management – they
also can store carbon that otherwise would have been returned to the atmosphere when trees die
and decompose. More than ten percent of the U.S. forest carbon sink can be attributed to long-
lived wood products, such as furniture, flooring, and building materials. In 2015, over 2,600 million
metric tons of carbon were stored in harvested wood products in the U.S.223 While it is difficult
to quantify exactly how much carbon could be stored in wood products in Wisconsin, it does
provide a clear opportunity with the added benefit of growing jobs in Wisconsin and strength-
ening the state’s economy, while increasing the amount of carbon stored. In addition, producing
thermal energy from sustainably produced biomass that is currently generated by propane or
heating oil can offset fossil-fuel use and reduce GHG emissions.
These recommendations will help strengthen the state’s forest industries and have a positive
impact on Wisconsin’s communities through local job creation, especially in underserved
communities. Education and outreach efforts to raise public awareness about sustainably
harvested wood products from Wisconsin’s forests will be needed to explain this in the context
of sustainable forest and resource management.
SB 2021–2023
State Budget
LE Legislation
9 1

C L I M AT E S O L U T I O N S
T I E R 2T ier 2 policy options are proposals that were raised
and, to some extent, discussed during the task force
process or brought up during the public hearing and
public comment period. Each of these options drew
both support and concern from task force members,
a reflection of the diversity of perspective and world-
view of the members. They are included as Tier 2
proposals to indicate they may merit further discussion
and consideration outside of the work of the
task force. ◙
T I E R 2 * *
47 Avoid all new fossil fuel infrastructure p. 93 E A S B L E
48 State divestment of fossil fuel stocks and other interests p. 93 E A
S B L E
49 Allow third party renewable financing (solar/energy generation) p. 95 E A S B L E
50 Develop strategies for the cost-effective early closure and reduced use of coal facilities p. 95 E A S B L E
51 Work with Midcontinent Independent System Operator and stakeholders to focus
on enhancing opportunities and financial value for clean distributed energy resourcesp. 96 E A
S B L E
52 Maximize co-benefits and related financial value from clean energy projects p. 97 E A S B L E
53 Modernize rate design p. 99 E A S B L E
54 Promote the use of clean transportation fuels to ensure immediate and long-term
emissions reductions p. 99 E A
S B L E
55 Encourage antitrust enforcement p. 101 E A S B L E
Photo courtesy of Travel Wisconsin
9 2

T I E R 2
47 Avoid all new fossil fuel infrastructure
S T R AT E GI E S
• Avoid all new fossil fuel infrastructure for electricity generation.
• Avoid any new natural gas plants.
• Avoid new pipelines. Oppose new or expanding infrastructure whose primary purpose is
transporting fossil fuels through Wisconsin.
Public comment to the task force consistently and repeatedly requested action to avoid new fossil
fuel infrastructure in the state and requested bold action regarding our energy infrastructure.
The public comment characterizes the market failure of fossil fuel industries to account for
environmental damage, human health implications, and the continued placement of infrastructure
adjacent to Indigenous, Black, and other communities of color. Avoiding fossil fuel infrastructure
is one way to prevent a carbon lock-in, where policies, infrastructure, and investments made
in the past or present commit us to high-carbon emissions in the future, even when alternative
technologies are available.
Wisconsin cannot take meaningful climate action without bold action to reduce the use of fossil
fuels and pivot to renewable energy. To stay within the Paris Agreement climate goals, we cannot
build any new fossil fuel infrastructure, including infrastructure for the production and transporta-
tion of fossil fuels, such as wells, refineries, pipelines, and shipping terminals.
This fossil fuel infrastructure not only contributes to global warming but risks the health and
safety of our communities. Air pollution from fossil fuel extraction and burning has serious health
impacts. Some high-profile disasters in recent years have also demonstrated the safety risks
of gas infrastructure. Any expansion of fossil fuel energy production will add to the inequitable
burden on low-income communities and communities of color, both urban and rural.
48 State divestment of fossil fuel stocks and other interests
S T R AT E G Y Fossil fuel stocks or other interests should be removed from state of Wisconsin-
owned investments. In practice, this means the sale of any stocks or investments in the top
200 fossil fuel companies owned by the Wisconsin Retirement System and the UW System
Foundations and the banning of any future investments in these stocks or other interests.
P O L I C Y PAT H WAY S
• Wisconsin Retirement System: Legislative action could prohibit the state of Wisconsin
Investment Board (SWIB) from investing in securities of fossil fuel companies as part of
the Wisconsin Retirement System. Similar legislation has been proposed in several states,
including California, Vermont, Hawaii, New York, Massachusetts, and Connecticut.
• Divestment legislation could prohibit SWIB from investing in fossil fuel companies by disal-
lowing them as permissible investments. To minimize complications and the screening
process (and associated cost) for divestment, legislation must provide clear parameters for
SWIB. Typically, climate divestment legislation prohibits investment in the top 200 fossil
fuel companies.
• UW System Foundations: Per discussions with the Wisconsin Legislative Reference Bureau
(LRB), the UW System Foundations present more complex implementation questions. LRB
EA Executive/
Agency Action
SB 2021–2023 State Budget
LE Legislation
LE Legislation
9 3

C L I M AT E S O L U T I O N S
analysis states that there is no clear process through which the state can require the UW
System Foundation to divest funds from the fossil fuel industry because the Foundation
is a private 501(c)(3) nonprofit corporation. The UW System Foundation transfers gift
and investment income to UW Madison but is not part of the University itself. As an
independent entity, UW System Foundation is responsible for determining how it invests its
assets. This principle carries through for other similarly structured university foundations.
• While there is not a clear mechanism for state requirements toward UW System
Foundations, the foundations could independently divest their entire endowments from
fossil fuels using the same parameters discussed above, following the lead of many other
colleges and universities. There is currently a movement among UW students in support
of this voluntary divestment, known as the UW Divestment Coalition.
To successfully transition to carbon-free electricity and reduce economy-wide GHG emissions, it
is urgent that we implement a rapid transition off of fossil fuels and build support for investments
in clean energy. Divestment advocates argue that divesting from fossil fuels removes social
capital and financial resources from fossil fuel corporations, resulting in the reduction of GHG
emissions. Over the past ten years, a large and growing number of government organizations,
universities and university systems, nonprofits, and other organizations have divested.
If Wisconsin aims to achieve 100 percent carbon-free energy by 2050, we need to invest in
clean energy research, development, and deployment. Divestment from fossil fuels opens up
resources for investment in these areas, particularly if at least some of the divested resources
are invested in Wisconsin-based carbon-free energy research, development, and deployment.
As climate change accelerates and renewable energy continues to become increasingly cost
competitive, a growing number of financial analysts argue that fossil fuels will prove to be a
bad investment. Over the past few years, coal and oil stocks have shown great vulnerability. For
example, in August 2020, ExxonMobil was dropped from the Dow Jones Industrial Average. If this
trend continues, especially as Americans continue to travel less due to the pandemic, removing
fossil fuels from a stock portfolio becomes a more mainstream option. Enacting divestment
legislation could accelerate this shift and move us further from economic reliance on fossil fuels.
Multiple studies have demonstrated that divesting from fossil fuels does not have a statistically
significant impact on overall portfolio performance and has only a marginal impact on the utility
derived from such portfolios.
The fossil fuel divestment movement has long pointed out the disparate impacts on marginal-
ized communities of burning fossil fuels and highlighted how decision-makers are not centering
these people’s lived experiences, health, and well-being. Divesting from fossil fuels and investing
in clean energy will have financial implications for the viability of these companies and will be a
public demonstration of our values. Furthermore, divestment would have positive downstream
impacts on environmental health for marginalized communities affected by GHG emissions
and fossil fuel use. Those impacts could be expanded with targeted reinvestment of divested
resources in projects benefiting marginalized communities.
9 4

T I E R 2
49 Allow third party renewable financing (solar/energy generation)
S T R AT E G Y The PSC or legislature should clarify the ability of customers to utilize third party
financing for energy generation projects, including the ability of taxable customers (residential
customers and taxable entities) to enter equipment leases since they can do so without adversely
affecting the ability for the projects to receive federal tax credits and ability of nontaxable entities
to enter power purchase agreements since federal tax credits could be adversely affected if these
entities must enter equipment leases.
P O L I C Y PAT H WAY S
• Development of tariffs under Wis. Stat. § 196.192 allowing for limited solar third party
partnership financing.
• PSC could clarify that third parties are not considered public utilities.
• If the PSC believes that a legislative change is needed to provide for the tariffs identified
above, passage of legislation specifically allowing for such tariffs.
• Legislature could clarify that third parties are not considered public utilities.
Third party financing can spur solar growth and access, increasing affordability by: 1) allowing
customers to avoid upfront costs (the third party pays the capital investment and the customer
can pay it off over time while accessing cheap, renewable energy) and 2) decreasing overall proj-
ect costs by allowing a third party to access and pass on savings from the federal investment tax
credit that certain parties (such as nonprofits and municipalities) would not otherwise be able to
take advantage of. Third party solar financing can occur through solar leases (where a customer
pays for use of the system over a specified time period) or power purchase agreements (PPAs)
(where the system offsets the customer’s utility bill and the developer sells power generated to
the customer at a fixed rate).
The federal government provides a significant tax credit for solar energy projects, as well as valu-
able depreciation benefits, which governmental and nonprofit entities, as well as for-profit entities
with limited tax liability, cannot take advantage of without partnering with a financing entity that
can receive the tax benefits. In Wisconsin, there is some legal uncertainty regarding whether such
partnering is allowable. This reduces the number of projects with such financing partnerships
from going forward, reducing both the number of clean energy projects in the state and the flow
of federal tax benefits into the state of Wisconsin. Allowing for such partnerships—potentially
on a limited basis—could substantially increase customer clean energy projects and the flow of
federal incentives into the state.
50 Develop strategies for the cost-effective early closure and reduced use of coal facilities
S T R AT E G Y Revise Wisconsin Environmental Trust Financing statute Wis. Stat. § 196.27 to allow
utilities to explore financing and return-on-investment options and look to PSC docket 6630-ET-
101224 as a learning opportunity to address future securitization efforts, as well as explore other
potential financial tools that would support this transition for stakeholders. When retiring power
plants, it is possible to create “win-win-win” situations, where customers realize cost savings,
EA Executive/ Agency Action
SB 2021–2023 State Budget
LE Legislation
9 5

C L I M AT E S O L U T I O N S
utility investors’ investment expectations are met, and GHG reductions are achieved. Some
stakeholders and regulators seek a fourth “win” by providing support and transition services
to affected workers and communities.
P O L I C Y PAT H WAY S
• Explore carbon credit options through the PSC docket process.
• Change environmental trust bonds and allow return on investment.
Reducing GHG emissions from Wisconsin’s power sector will require retiring conventional
generation, in particular coal-fired power plants. However, Wisconsin utilities are challenged
by how to manage an equitable coal-to-clean transition that enables the remaining co-owned
coal plants to recover investments made on the existing undepreciated balances. This is further
complicated given that retiring these plants is dependent on balancing the financial situations
of multiple utilities. Most of the very old, fully depreciated coal plants have been retired already,
so future retirements will involve plants with higher unrecovered book balances.
Solutions need to be palatable to all stakeholders, including utilities, shareholders, communities,
industry, and ratepayers. In 2019, a group of Wisconsin stakeholders made up of utilities,
regulators, ratepayer advocates, environmental groups, and content experts explored the
feasibility and broad applicability of a set of financial tools to accelerate the retirement of
uneconomic coal plants in the state as part of the Rocky Mountain Institute’s e-Lab Accelerator.225
Coming out of the e-Lab Accelerator, the Wisconsin team agreed on the need to advance
securitization, along with associated economic modeling, broader stakeholder engagement,
and identification of required legislative actions.
Wisconsin can request plans from utilities that identify how they can cost-effectively close coal
plants early. Wisconsin could also consider mechanisms that would allow utilities to cost-effec-
tively address the remaining non-depreciated “book value” of their coal facilities, so these facili-
ties can be closed as soon as feasible, including:
• Seeking carbon credits from the California or voluntary carbon markets;
• Issuing environmental trust bonds (ETBs), which were used for $100 million of the $400
million remaining book value for the recently closed Pleasant Prairie plant; or
• Providing utilities opportunities to earn a return on investment so that once a utility
commits to close a coal plant by a certain date, they can use that planned closure to
support the need for new generation projects and to seek a somewhat higher overall
PSC-approved equity return on its investments.
51 Work with Midcontinent Independent System Operator and stakeholders to focus on enhancing opportunities and financial value for clean distributed energy resourcesS T R AT E GI E S
• Improve Midcontinent Independent System Operator (MISO) visibility and dispatch of
distributed energy resources (DERs)226 – through MISO’s existing stakeholder engagement
processes—and improve the quality of information MISO has about registered distributed
energy resources (DERs) to enable the following:
– More targeted dispatch, including the amount of DER dispatched and lead time for
dispatching it; and
EA Executive/
Agency Action
LE Legislation
9 6

T I E R 2
– Improved capabilities to project future DER adoption.
• Improve DER operator visibility into the MISO market through MISO’s existing engagement
processes and improve the quality of information that DER operators have about MISO
markets, including real-time load.
• Participate in developing changes to MISO rules. The PSC, utilities, and other Wisconsin
stakeholders should participate and take a leadership role in advancing key market rule
changes related to DERs.
• Improve the use of DER data in transmission planning. Make enhancements in MISO’s data
use and analytical tools to better enable planners to understand DER’s potential impact on
the transmission system and to identify any necessary transmission system enhancements
that need to be made to support DER adoption.
• In implementing these recommendations, the PSC, utilities, and other stakeholders should
focus on maximizing opportunities for the use of and value for clean DERs (e.g., wind, solar,
biogas, battery storage) capacity and energy production/release in order to encourage the
development and usage of clean DER facilities.
P O L I C Y PAT H WAY S
• PSC staff works with stakeholders to participate in MISO and ensure that the recommenda-
tions are fully and properly implemented.
DERs are small-scale generation or energy storage resources connected to the distribution system
close to where electricity is consumed. However, actions are needed to help ensure that DERs
provide maximum clean energy and capacity benefits to the grid. This includes allowing DERs
to fully integrate into the MISO system and maximizing opportunities for DERs to receive full
financial value for their capacity and energy production (for clean energy generation) and release
(for battery and other clean storage). Doing so will encourage additional clean DER installation
and operation, which would help meet the state’s carbon-reduction goals.
These recommended strategies came out of the Wisconsin Energy Distribution and Technology
Initiative and are supported by a wide spectrum of stakeholders, including investor- and
consumer-owned utilities, regulators, consumer advocates, environmental advocates, state and
local governments, businesses, economic developers, and academic researchers.227
52 Maximize co-benefits and related financial value from clean energy projects
S T R AT E GI E S
• DNR and DATCP should take the following steps to enhance the existing Wisconsin nutrient
trading program and encourage solar and biodigestion while helping to clean ground and
surface water:
– Informing agricultural landowners and solar and biodigestion developers about
potential for valuable nutrient reduction credits for ground-mount solar combined with
grasses/prairies and biodigestion of manure or food waste otherwise applied to farm
fields if the digestate is handled in a manner that reduces nutrient impacts to waters.
– Providing them information regarding areas that would especially benefit from solar or
biodigestion nutrient reduction (e.g., through maps showing areas with high nutrient
runoff, such as farms with nutrient-rich soils, manure or food waste spreading, and/
or slopes that allow for significant nutrient runoff to water bodies). This work could
EA Executive/
Agency Action
9 7

C L I M AT E S O L U T I O N S
be based on existing evaluations of nutrient-impacted water bodies for Total Daily
Maximum Load allocations and other available information.
– Making them aware of potential purchasers of the credits—including wastewater
dischargers needing credits, counties that receive payments from wastewater
dischargers operating under temporary variances, and lake districts and associations
that want to protect and enhance the quality of their lakes—so they can enter transac-
tions to sell any generated credits to them.
– Modifying, where appropriate, implementation of the nutrient reduction credit program
to make it easier for solar and biodigestion to receive and sell credits.
– Integrating the above with the Water Quality Trading Clearinghouse allowed under 2019
Wisconsin Act 151 if and when it is implemented.
• Wisconsin DNR should also modify state brownfield grants to provide additional points
for remediation and redevelopment projects that integrate solar or other clean energy
(e.g., 1 bonus point for each 50 kW of clean energy per acre of brownfield remediation, up
to a maximum of 5 bonus points on applications with a 100-point scoring system) and make
available additional Focus on Energy® or utility incentives for such projects (e.g., increase
available commercial solar incentives by 20 percent for projects on brownfields).
P O L I C Y PAT H WAY S
• DNR education and outreach and potential rule making.
Managing phosphorus and nitrogen runoff is critical to maintaining the health of Wisconsin’s
lakes, rivers, streams, and groundwater. Projects that reduce these nutrient losses hold potentially
significant financial value by generating credits that can be purchased by entities that need them,
including wastewater permit holders, counties pursuing nutrient reductions with funds from
wastewater dischargers with temporary variances, and lake districts and associations formed to
protect water bodies that may have access to funding from their members whose property values
would benefit from water quality improvements.
Solar development on farm fields can significantly improve water quality benefits because the
ground cover used with solar (typically prairies or other grasses) reduces nutrient runoff. Signif-
icant water quality benefits can also come from biodigestion projects that convert manure and
food waste that would otherwise be spread on farm fields to biogas and digestate, which gener-
ally has a slower nutrient release and can be used in ways to reduce nutrient runoff, especially
if DNR can provide clarity regarding alternative uses of digestate. Solar and other clean energy
development on brownfields can result in the beneficial reuse of those lands and revitalization of
blighted areas. Programs to take advantage of these co-benefits can help to make additional solar,
biogas, and other clean energy development more cost-effective and help increase their signifi-
cant clean water, clean air, and other co-benefits.
EA Executive/
Agency Action
9 8

T I E R 2
53 Modernize rate design
S T R AT E GI E S
• Review and update current rate design principles. Work with regulators and utilities to
explore new rate design mechanisms that provide the right price signals to customers and
the right incentives to utilities to reduce carbon emissions, encourage conservation, and
reduce peak demand.
• Explore creative/innovative rate design and tariffs such as EV and community solar tariffs,
time-of-use rates, and performance-based ratemaking.
• Explore options to incentivize clean energy and energy efficiency and to decrease dispro-
portionate impacts on low-income communities.
P O L I C Y PAT H WAY S
• Implementation of any policy regarding tariffs would likely occur through PSC rate dockets
for individual utilities.
• PSC docket 5-EI-157228 recently initiated a statewide investigation of buyback rates for
customers with distributed generation, which will serve as a platform for discussing renew-
able energy and net metering tariffs across all utilities.
Modernizing rate design has the potential to increase opportunities for customer sited genera-
tion, allowing customers to control their energy costs and/or participate in community solar type
of programs. Commenters on the draft Strategic Energy Assessment 2020–2026 cited interest
in appropriate pricing and rate design. The American Council for an Energy-Efficient Economy
(ACEEE) has identified three particularly important principles for rate design: simplicity, utility
revenue stability, and price signals that encourage energy efficiency and conservation. Wiscon-
sin could:
• Explore creative, innovative rate design and tariffs. Explore rate design options such as EV
and community solar tariffs, time-of-use rates, market-based rates, performance-based
ratemaking, decoupling, residential demand charges, and new load market pricing
rate designs.
• Establish a citizen regulatory reform study group. Establish citizen advisory committees
and regulatory reform study groups to the PSC. Include ratepayers and local communities
in compliance monitoring and the establishment of performance-based rates.
• Review and update current rate design principles. As smart grid technologies unleash new
data, work with regulators to explore new rate design mechanisms that help encourage
conservation and reduce peak demand.
54 Promote the use of clean transportation fuels to ensure immediate and long-term emissions reductions
S T R AT E GI E S
• Utilize low-emissions fuels such as compressed natural gas and propane autogas (also
known as liquified petroleum gas (LPG)) as bridge fuels to achieving a decarbonized trans-
portation system that includes widespread adoption of zero-tailpipe-emissions technolo-
gies such as electric and fuel cell vehicles.
EA Executive/
Agency Action
9 9

C L I M AT E S O L U T I O N S
• Expand the use of renewable fuels including ethanol, biodiesel, renewable natural gas, and
renewable propane gas.
• Establish an advisory committee that will analyze and chart a clean fuel policy pathway.
Fuels should be evaluated based on their GHG emissions intensity using lifecycle
accounting.
• Design a market-based clean fuels policy by July 1, 2021 that:
– Remains fuel and technology neutral, relying on a portfolio of clean fuels including
biodiesel, ethanol, renewable natural gas, electricity, hydrogen, and other renewable
and low-carbon fuels.
– Develops regulations that establish the program and defines Wisconsin’s fuel standards
and ability to establish a reasonable percent reduction in carbon intensity in transporta-
tion (aim for a 15–25 percent reduction by 2035).
– Establishes incentives from the fuel market and eliminates deficits by imposing costs, so
that money stays in and is redistributed in the fuel market.
– Collaborates with other Midwestern states as part of a regional clean fuels program.
To date, two states—California and Oregon—have adopted a market-based clean fuels standard
(also known as a low-carbon fuel standard (LCFS)) to decrease the GHG intensity of transportation
fuels over time. The GHG intensity is a performance-based measure of GHG emitted over the full
lifecycle of a fuel. This approach includes accounting for the GHG emissions from extraction to
vehicle operations.229 Lifecyle accounting also provides an incentive for improvements anywhere
along the supply chain. Clean fuel standards have proven to be a fuel- and technology-neutral
policy that cost-effectively reduces transportation GHG emissions, provides local economic bene-
fits, increases energy independence, and improves health through reduced air pollution.
The first step in developing a standard is setting the average annual carbon intensity that a
regulated entity must comply with—a percent reduction with a declining benchmark each year.
For instance, California’s carbon intensity standard is 20 percent below 2010 by 2030; Oregon’s
standard is 10 percent below 2015 by 2025.230, 231 Because the standard is performance-based,
fuel suppliers (the regulated entity) are free to choose how they meet the emissions target, thus
having the flexibility to lower the GHG intensity of their fuels by providing low-emitting fuel alter-
natives (such as electricity, biofuels, renewable natural gas, and hydrogen) or through buying
emissions credits. Credits are generated when a fuel is below the annual benchmark and deficits
are created when a fuel is above the benchmark. This market-based approach provides flexibility
and lowers cost of compliance, leading to innovation in transportation fuels.
In January 2020, the Great Plains Institute published a whitepaper, A Clean Fuels Policy for the
Midwest, which analyzes the impact of a clean fuels policy in the Midwest accompanied by a
series of principles for Midwest states to consider. This research and principles can serve as a
foundation for supporting Wisconsin’s approach to adopting a clean fuels policy.
EA Executive/
Agency Action
LE Legislation
1 0 0

T I E R 2
55 Encourage antitrust enforcement
S T R AT E GI E S
• Encourage the Wisconsin Attorney General (AG) and Department of Justice (DOJ) to
investigate the role of agricultural monopolization as it relates to family farmers' economic
resiliency when adapting to climate change using the following objectives:
– Increase staffing by adding two full-time employees (FTE) to the Antitrust Unit of the
DOJ to carry out investigations in anticompetitive business behavior.
– Provide the Wisconsin AG with civil investigative demand (CID) authority like in other
states that allow AG offices to investigate anti-competitive business practices.
P O L I C Y PAT H WAY S
• Increase staffing at CPAU at Wisconsin DOJ by adding two full-time employees (FTE).
• CID authority would require a statutory change: amend Wis. Stat. § 133.11 to delete
“and does believe” from the first sentence of (1).
Consolidation within major industry sectors can have significant impacts on market access
and concentration which can result in adverse impacts to competition as well as consumers
and workers.232 Family farmers in Wisconsin are uniquely positioned to play a leading role
in mitigating climate change. However, adopting climate-friendly farming practices requires
capital investments and a multi-year learning curve for new methods of planting, weed control,
fertilization, and equipment. A highly consolidated agricultural industry, in which a few
companies control the majority of inputs, can reduce market competition and stifle innovation,
thereby limiting the ability of individual farmers to adopt more conservation practices amidst
these economic pressures.233 Additionally, a highly consolidated agribusiness sector can have
an outsized influence on policies that shape the farming landscape and drive individual farmers’
cropping decisions. For example, crop insurance and other forms of agricultural subsidies
are only available for a handful of commodity crops like corn, wheat, and soybeans. These
subsidies have encouraged farmers to convert diversified crop and animal operations to less
diverse rotations.
Several factors have contributed to the rise in agricultural mergers and acquisitions, including
technological innovation, protection of intellectual property, increased financialization of the
agribusiness sector, and a lack of antitrust oversight.234 As federal antitrust enforcement has
weakened in recent years, state AGs must pick up the slack, despite tight budgets and staff
limitations. There is a precedent for the Wisconsin AG to act on matters of antitrust in agriculture.
However, while many state AGs have civil investigative demand authority, enabling them to
investigate anticompetitive business practices, the Wisconsin AG does not. This recommendation
proposes amendments to Wisconsin’s statutes to allow our state AG's office to conduct more
antitrust investigations.
SB 2021–2023
State Budget
LE Legislation
1 0 1

1 Litterman, Bob, et al. Managing Climate Risk in the U.S. Financial System. Market Risk Advisory Committee of the U.S. Commodity Futures Trading Commission, 2020. https://www.cftc.gov/sites/default/files/2020-09/9-9-20%20Report%20of%20the%20Subcom-mittee%20on%20Climate-Related%20Market%20Risk%20-%20Managing%20Climate%20Risk%20in%20the%20U.S.%20Financial%20System%20for%20posting.pdf.
2 Wisconsin Initiative on Climate Change Impacts. Report to Governor’s Task Force on Climate Change: Strategies to Improve Wisconsin’s Climate Resilience and Readi-ness. 2020. https://wicci.wisc.edu/wp-content/uploads/wicci-report-to-governors-task-force.pdf.
3 State of Wisconsin: Office of Governor Evers. “Gov. Evers Announces Plan to Join U.S. Climate Alliance.” [Press Release] February 12, 2019. https://evers.wi.gov/Pages/Newsroom/Press-Releases/021219-Gov-Evers-Announces-Plan-to-Join-U-S--Climate-Alliance.aspx.
4 State of Wisconsin: Office of Governor Evers. “Execu-tive Order #38.” August 16, 2019 (accessed October 19, 2020). https://evers.wi.gov/Documents/EO%20038%20Clean%20Energy.pdf.
5 Environmental Protection Agency. “Environmental Justice.” (accessed November 25th, 2020). https://www.epa.gov/environmentaljustice.
6 Newkirk II, Vann R. “Trump’s EPA Concludes Environmental Racism Is Real.” The Atlantic (February 28, 2018). https://www.theatlantic.com/politics/archive/2018/02/the-trump-administra-tion-finds-that-environmental-racism-is-real/554315/.
7 National Association for the Advancement of Colored People & Clean Air Task Force. “Fumes Across the Fence-Line: The Health Impacts of Air Pollution from Oil & Gas Facilities on African American Communi-ties.” (November 2017.) http://www.catf.us/wp-content/uploads/2017/11/CATF_Pub_FumesAcrossThe-FenceLine.pdf.
8 Wells, Adeline. “Environmental Justice in Wisconsin.” Sierra Club. (September 8, 2017). https://www.sierra-club.org/wisconsin/blog/2017/09/environmental-jus-tice-wisconsin.
9 Center for Effective Government. “Low-Income Resi-dents and People of Color in Wisconsin are Living near Chemical Dangers.” 2016. https://www.foreffectivegov.org/sites/default/files/info/factsheet-wisconsin.pdf.
10 Limaye, Vijay, Wendy Max, Juanita Constible, and Kim Knowlton. “Estimating the Health‐Related Costs of 10 Climate‐Sensitive U.S. Events During 2012.” GeoHealth volume 3, issue 9 (September 2019). https://agupubs.onlinelibrary.wiley.com/doi/10.1029/2019GH000202.
11 Brophy, Natalie. “Warm Wisconsin winter makes last January’s polar vortex seem like a distant memory.” Wausau Daily Herald. (last updated February 2, 2020). https://www.wausaudailyherald.com/story/weather/2020/01/31/wisconsin-weather-2019-polar-vor-tex-stark-contrast-2020-winter/4622872002/.
12 NOAA National Centers for Environmental Informa-tion. “Billion-Dollar Weather and Climate Disasters.” (accessed October 29, 2020). https://www.ncdc.noaa.gov/billions/events/WI/1980-2020.
13 NASA. “Global Climate Change: Vital Signs of the Planet.” (last updated October 27, 2020). https://climate.nasa.gov/.
14 Climate Action Tracker. “Temperatures.” (last updated September 23, 2020). https://climateactiontracker.org/global/temperatures/.
15 Wisconsin Initiative on Climate Change Impacts. Report to the Governor’s Task Force on Climate Change: Strat-egies to Improve Wisconsin’s Climate Resilience and Readiness. 2020. https://wicci.wisc.edu/wp-content/uploads/wicci-report-to-governors-task-force.pdf.
16 ibid.
17 Wisconsin Department of Natural Resources. Wisconsin Greenhouse Gas Emissions Inventory Report. August 2020. https://dnr.wisconsin.gov/sites/default/files/topic/ClimateChange/WisconsinGreen-houseGasEmissionsInventoryReport.pdf.
18 ibid.
19 U.S. Global Change Research Program. “Chapter 9: Populations of Concern.” The Impacts of Climate Change on Human Health in the United States: A Scientific Assessment. 2016. https://health2016.global-change.gov/low/ClimateHealth2016_09_Populations_small.pdf.
20 University of Colorado Boulder. “Climate Justice.” (accessed October 19, 2020). https://www.colorado.edu/ecenter/energyclimate-justice/general-energy-cli-mate-info/climate-change/climate-justice.
R E F E R E N C E S
1 0 2
21 United Nations. “Sustainable Development Goals: Climate Justice.” (accessed October 19, 2020). https://www.un.org/sustainabledevelopment/blog/2019/05/climate-justice/.
22 United States Environmental Protection Agency (EPA). “Climate Change, Health, and Environmental Justice.” May 2016. https://www.cmu.edu/steinbrenner/EPA%20Factsheets/ej-health-climate-change.pdf.
23 U.S. Global Change Research Program. “Chapter 9: Populations of Concern.” The Impacts of Climate Change on Human Health in the United States: A Scientific Assessment. 2016. https://health2016.global-change.gov/low/ClimateHealth2016_09_Populations_small.pdf.
24 NAACP. “Environmental and Climate Justice.” (accessed October 19, 2020). https://www.naacp.org/issues/environmental-justice/.
25 U.S. Global Change Research Program. “Chapter 15: Tribes and Indigenous Peoples.” Fourth National Climate Assessment. 2018 (revised June 2019). https://nca2018.globalchange.gov/chapter/15/.
26 U.S. Environmental Protection Agency. “Environmental Justice.” (accessed October 19, 2020). https://www.epa.gov/environmentaljustice.
27 Illinois Environmental Protection Agency. “Environ-mental Justice Officer.” (accessed October 19, 2020). https://www2.illinois.gov/epa/topics/environmen-tal-justice/Pages/officer.aspx.
28 Illinois Environmental Protection Agency. “Commis-sion on Environmental Justice.” (accessed October 19, 2020). https://www2.illinois.gov/epa/topics/environ-mental-justice/commission/Pages/default.aspx.
29 Michigan Department of Environment, Great Lakes, and Energy. “EGLE Names Regina Strong as Environ-mental Justice Public Advocate.” [Press Release] April 25, 2019. https://www.michigan.gov/egle/0,9429,7-135-3308_3323-495917--,00.html.
30 New York Department of Environmental Conserva-tion. “Environmental Justice: Office of Environmental Justice.” (accessed October 19, 2020). https://www.dec.ny.gov/public/333.html.
31 Illinois Environmental Protection Agency. “Illinois Envi-ronmental Justice Advisory Group.” (accessed October 19, 2020). https://www2.illinois.gov/epa/topics/environ-mental-justice/advisory-group/Pages/default.aspx#h2.
32 State of Michigan: Office of Governor Whitmer. “Twenty-one Michiganders Selected for the State’s First Environmental Justice Advisory Council.” [Press Release] January 23, 2020. https://www.michigan.gov/whitmer/0,9309,7-387-90487-517922--,00.html.
33 Minnesota Pollution Control Agency. “MPCA Environ-mental Justice Advisory Group.” (accessed October 19, 2020). https://www.pca.state.mn.us/about-mpca/mpca-environmental-justice-advisory-group.
34 State of New York: Office of Governor Cuomo. “Governor Cuomo Signs Legislation to Create Perma-nent Environmental Justice Advisory Board and Interagency Coordinating Council.” [Press Release] December 23, 2019. https://www.governor.ny.gov/news/governor-cuomo-signs-legislation-create-perma-nent-environmental-justice-advisory-board-and.
35 Great Lakes Indian Fish & Wildlife Commission. Dibag-injigaadeg Anishinaabe Ezhitwaad: A Tribal Climate Adaptation Menu. 2019. https://www.glifwc.org/Climat-eChange/TribalAdaptationMenuV1.pdf.
36 California Environmental Protection Agency: Office of Environmental Health Hazard Assessment. “About CalEnviroScreen.” (accessed October 19, 2020). https://oehha.ca.gov/calenviroscreen/about-calenviroscreen.
37 State of New Jersey: Office of Governor Murphy. “Governor Murphy Signs Historic Environmental Justice Legislation.” [Press Release] September 18, 2020. https://nj.gov/governor/news/news/562020/approved/20200918a.shtml.
38 DeWitt, Larry. “The Decision to Exclude Agricultural and Domestic Workers from the 1935 Social Secu-rity Act.” Social Security Bulletin, Vol. 70, No. 4. 2010. https://www.ssa.gov/policy/docs/ssb/v70n4/v70n4p49.html.
39 Blakemore, Erin. “How the GI Bill’s Promise Was Denied to a Million Black WWII Veterans.” History. (Last updated September 30, 2019). https://www.history.com/news/gi-bill-black-wwii-veterans-benefits#:~:tex-t=Failure%20to%20Receive%20GI%20Bill,been%20guaranteed%20fared%20no%20better.&tex-t=And%20the%20VA%20itself%20encouraged,educa-tional%20benefi s%20to%20some%20students.
40 Wisconsin Department of Natural Resources. Wisconsin Greenhouse Gas Emissions Inventory Report. August 2020. https://dnr.wisconsin.gov/sites/default/files/topic/ClimateChange/WisconsinGreen-houseGasEmissionsInventoryReport.pdf.
41 ibid.
42 U.S. Energy Information Administration. “Detailed State Data: Net Generation by State by Type of Producer by Energy Source (EIA-906, EIA-920, and EIA-923).” September 22, 2020 (accessed October 29, 2020). https://www.eia.gov/electricity/data/state/.
43 Ecofys. The Benefits of Energy Efficiency – Why Wait? September 2013. http://www.theclimatechan-georganisation.org/sites/default/files/archive/files/
1 0 3

The-Economic-Benefits-Of-Energy-Effi iency-for-the-USA---23Sept2013.pdf.
44 Cadmus. Focus on Energy Calendar Year 2019 Eval-uation Report: Volume I. June 2, 2020. https://www.focusonenergy.com/sites/default/files/Annual_Report-CY_2019_Volume_I.pdf
45 Bureau of Labor Statistics. “Consumer Expenditure Survey, 2018.” (Accessed September 3, 2020). https://www.bls.gov/cex/2018/combined/income.pdf; U.S. Energy Information Agency. “Household Energy Inse-curity, 2015.” (accessed September 3, 2020). https://www.eia.gov/consumption/residential/data/2015/hc/php/hc11.1.php.
46 Wood, Elisa. “What is a Microgrid?” Microgrid Knowl-edge. June 24, 2020. https://microgridknowledge.com/microgrid-defined (Accessed November 9, 2020).
47 University of Wisconsin-Madison, Wisconsin Energy Institute. “Microgrids.” (accessed October 29, 2020). https://energy.wisc.edu/research/electricity-systems/microgrids.
48 American Council for an Energy-Efficient Economy (ACEEE). “Energy Efficiency Resource Standards - Wisconsin.” (accessed October 29, 2020) https://database.aceee.org/state/energy-effi iency-re-source-standards.
49 Governor’s Task Force on Global Warming. Wiscon-sin’s Strategy for Reducing Global Warming. July 2008. http://www.climatestrategies.us/library/library/download/313.
50 American Council for an Energy-Efficient Economy (ACEEE). “Energy Efficiency Resource Standards – Illi-nois, Minnesota, Colorado.” (accessed October 29, 2020). https://database.aceee.org/state/energy-effi ien-cy-resource-standards.
51 Focus on Energy. “About Us.” (accessed October 29, 2020). https://focusonenergy.com/about.
52 Cadmus. Focus on Energy Calendar Year 2019 Eval-uation Report: Volume I. June 2, 2020. https://www.focusonenergy.com/sites/default/files/Annual_Report-CY_2019_Volume_I.pdf.
53 Public Service Commission of Wisconsin. Final Stra-tegic Energy Assessment: 2018–2024. July 2018. https://apps.psc.wi.gov/pages/viewdoc.htm?docid=348358.
54 University of Wisconsin-Madison: Energy on Wisconsin. “PACE Wisconsin Now Offered in 45 Coun-ties.” October 2, 2019 (accessed October 29, 2020). https://energyonwi.extension.wisc.edu/2019/10/02/pace-wisconsin-now-offered-in-45-counties/.
55 American Green Bank Consortium and Coalition for Green Capital. Green Banks in the United States: 2018 Annual Industry Report. May 2019. http://coalitionfor-greencapital.com/wp-content/uploads/2019/07/Green-BanksintheUS-2018AnnualIndustryReport.pdf.
56 Wisconsin State Legislature. “2020 Assembly Bill 765.” January 21, 2020 (accessed November 30, 2020). https://docs.legis.wisconsin.gov/2019/related/proposals/ab765.
57 Public Service Commission of Wisconsin. Final Strategic Energy Assessment: 2020–2026. October 1, 2020. https://apps.psc.wi.gov/pages/viewdoc.htm?docid=397611.
58 Minnesota Public Utilities Commission. “Interconnec-tion Information.” (accessed October 8, 2020). https://mn.gov/puc/energy/distributed-energy/interconnec-tion/; Minnesota Public Utilities Commission. State of Minnesota Distributed Energy Resources Interconnec-tion Process v 2.3. 2019. https://mn.gov/puc/assets/MN%20DIP_tcm14-431769.pdf.
59 U.S. Environmental Protection Agency. “Social Cost of Carbon.” December 2016. https://www.epa.gov/sites/production/files/2016-12/documents/social_cost_of_carbon_fact_sheet.pdf.
60 Wisconsin Department of Natural Resources. Wisconsin Greenhouse Gas Emissions Inventory Report. August 2020. https://dnr.wisconsin.gov/sites/default/files/topic/ClimateChange/WisconsinGreen-houseGasEmissionsInventoryReport.pdf.
61 U.S. Environmental Protection Agency: Office of Trans-portation and Air Quality. “Fast Facts, U.S. Transpor-tation Sector Greenhouse Gas Emissions, 1990–2018.” June 2020. https://nepis.epa.gov/Exe/ZyPDF.cgi?Dock-ey=P100ZK4P.pdf.
62 Electric Power Research Institute and Natural Resources Defense Council. Electrifying Transportation Reduces Greenhouse Gases and Improves Air Quality. September 2015. https://www.epri.com/research/prod-ucts/3002006881.
63 International Energy Agency. Global EV Outlook 2020. June 2020 (accessed October 29, 2020). https://www.iea.org/reports/global-ev-outlook-2020.
64 Bloomberg New Energy Finance. Electric Vehicle Outlook 2020. (accessed October 29, 2020) https://about.bnef.com/electric-vehicle-out-look/#toc-viewreport.
65 Bloomberg New Energy Finance. “Battery Pack Prices Fall As Market Ramps Up With Market Average at $156/kWh in 2019.” December 3, 2019. (accessed October 29,
1 0 4
http://www.theclimatechangeorganisation.org/sites/default/files/archive/files/The-Economic-Benefits-

2020). https://about.bnef.com/blog/battery-pack-prices-fall-as-market-ramps-up-with-market-average-at-156-kwh-in-2019/.
66 Silver, Fred, John Jackson, and Bryan Lee. Zeroing in on ZEBS: The Advanced Technology Transit Bus Index. CALSTART. October 17, 2019. https://calstart.org/wp-content/uploads/2019/10/Zeroing_In_on_ZEBs_Final_10182018-10.21.19.pdf.
67 EV Hub. “State EV Registration Data.” (accessed October 29, 2020). https://www.atlasevhub.com/mate-rials/state-ev-registration-data/.
68 U.S. Department of Energy. “Alternative Fuels Data Center.” (accessed October 29, 2020). https://afdc.energy.gov/stations/#/analyze?region=US-WI&coun-try=US&fuel=ELEC&access=public&access=private.
69 Smart Growth America. “What is smart growth?” (accessed October 29, 2020). https://smart-growthamerica.org/our-vision/what-is-smart-growth/.
70 Housing Matters: An Urban Institute Initiative. “How Zoning Shapes our Lives.” June 2019 (accessed October 29, 2020). https://housingmatters.urban.org/articles/how-zoning-shapes-our-lives.
71 Pulido, Laurie, Ellen Kohl, and Nicole-Marie Cotton. “State Regulation and Environmental Justice: The Need for Strategy Reassessment.” Capitalism Nature Socialism, Volume 27, Issue 2, 2016. https://www.tand-fonline.com/doi/abs/10.1080/10455752.2016.1146782?-journalCode=rcns20.
72 U.S. Department of Transportation. “Case Studies: State DOT Activities.” (accessed October 29, 2020). https://www.transportation.gov/sustainability/climate/case-studies-state-dot-activities.
73 CALSTART. “U.S. Zero-Emission Bus Fleet Grows Nearly 37 Percent Over Previous Year.” [Press Release] October 17, 2019 (accessed October 29, 2020). https://calstart.org/zeroing-in-on-zebs-pr-2019/.
74 U.S. Department of Energy. “All-Electric Vehicles.” (accessed October 29, 2020). https://fueleconomy.gov/feg/evtech.shtml.
75 McMahon, Jeff. “Electric Vehicles Cost Less Than Half As Much To Drive.” Forbes. January 14, 2018 (accessed October 29, 2020). https://www.forbes.com/sites/jeff-mcmahon/2018/01/14/electric-vehicles-cost-less-than-half-as-much-to-drive/?sh=4fbad81d3f97.
76 NC Clean Energy Technology Center. The 50 States of Electric Vehicles: Q2 2020 Quarterly Report. August 2020. https://nccleantech.ncsu.edu/wp-content/uploads/2020/08/Q2-20_EV_execsummary_Final.pdf.
77 Pennsylvania Department of Environmental Protec-tion. Pennsylvania Electric Vehicle Roadmap. February 2019. http://files.dep.state.pa.us/Energy/Offi eofPollu-tionPrevention/StateEnergyProgram/PAEVRoadmap.pdf; Minnesota Department of Transportation, Minne-sota Pollution Control Agency, and Great Plains Insti-tute. Accelerating Electric Vehicle Adoption: A Vision for Minnesota. 2019. http://www.dot.state.mn.us/sustainability/docs/mn-ev-vision.pdf; Connecticut Department of Energy and Environmental Protection. Electric Vehicle Roadmap for Connecticut. 2020. http://www.dpuc.state.ct.us/DEEPEnergy.nsf/c6c6d525f-7cdd1168525797d0047c5bf/f7ed4932eec438d-0852585520001c81b/$FILE/EV%20Roadmap%20for%20Connecticut.pdf; Colorado Energy Office. Colorado Electric Vehicle Plan 2020. April 2020. https://energyof-fi e.colorado.gov/sites/energyoffi e/files/2020-07/colo-rado_ev_plan_2020_-_fi al.pdf.
78 Wisconsin Bike Fed. “Complete Streets prioritize the safety of all people using the street over the speed of moving cars.” (accessed October 29, 2020). https://wisconsinbikefed.org/what-we-do/advocacy/milwau-kee-complete-streets-for-all/.
79 Institute for Transportation & Development Policy and University of California Davis. “A Global High Shift Cycling Scenario.” November 12, 2015. https://www.itdp.org/2015/11/12/a-global-high-shift-cy-cling-scenario/.
80 Maggie Grabow, Micah Hahn, and Melissa Whited. “Valuing Bicycling’s Economic and Health Impacts in Wisconsin.” The Nelson Institute for Environmental Studies, Center for Sustainability and the Global Envi-ronment, University of Wisconsin-Madison. January 2010. https://www.railstotrails.org/resourcehandler.ashx?id=4579.
81 Sierra Club, John Muir Chapter. “Why Can’t Eminent Domain Help Build Bike Paths?” October 7, 2019 (accessed October 29, 2020). https://www.sierraclub.org/wisconsin/blog/2019/10/why-cant-eminent-domain-help-build-bike-paths.
82 U.S. Department of Agriculture. Farms and Land in Farms: 2019 Summary. February 2020. https://www.nass.usda.gov/Publications/Todays_Reports/reports/fnlo0220.pdf.
83 Wisconsin’s Green Fire. Strategies for Mitigating Climate Change with Natural and Working Lands – A Policy Analysis and Playbook. July 15, 2020. https://wigreenfire.org/2019/wp-content/uploads/2020/07/WGF-NWL-Policy-Playbook-Final-07-15-2020.pdf.
84 U.S. Department of Agriculture: Agricultural Research Service. “Chapter 30: The Impact of Extreme Weather Events on Agriculture in the United States.” 2011. https://digitalcommons.unl.edu/cgi/viewcontent.cgi?ar-ticle=2316&context=usdaarsfacpub.
1 0 5
https://energyoffice.colorado.gov/sites/energyoffice/files/2020-07/colorado_ev_plan_2020_-_final.pdf
https://energyoffice.colorado.gov/sites/energyoffice/files/2020-07/colorado_ev_plan_2020_-_final.pdf
https://energyoffice.colorado.gov/sites/energyoffice/files/2020-07/colorado_ev_plan_2020_-_final.pdf
https://wigreenfire.org/2019/wp-content/uploads/2020/07/WGF-NWL-Policy-Playbook-Final-07-15-2020.pdf
https://wigreenfire.org/2019/wp-content/uploads/2020/07/WGF-NWL-Policy-Playbook-Final-07-15-2020.pdf
85 U.S. Department of Agriculture: Northwest Climate Hub. Applying Soil Health Management Systems to Reduce Climate and Weather Risks in the Northwest. April 2019. https://www.climatehubs.usda.gov/sites/default/files/Mngmt%20Systems%20Reduce%20Risks%20in%20the%20NW.pdf.
86 U.S. Environmental Protection Agency. “Sources of Greenhouse Gas Emissions.” (accessed October 20, 2020). https://www.epa.gov/ghgemissions/sourc-es-greenhouse-gas-emissions.
87 Intergovernmental Panel on Climate Change. Climate Change and Land: Summary for Policymakers. January 2020. https://www.ipcc.ch/site/assets/uploads/sites/4/2020/02/SPM_Updated-Jan20.pdf.
88 National Sustainable Agriculture Coalition. Agriculture and Climate Change: Policy Imperatives and Opportuni-ties to Help Producers Meet the Challenge. November 2019. https://sustainableagriculture.net/wp-content/uploads/2019/11/NSAC-Climate-Change-Policy-Posi-tion_paper-112019_WEB.pdf.
89 U.S. Department of Agriculture. Farms and Land in Farms: 2019 Summary. February 2020. https://www.nass.usda.gov/Publications/Todays_Reports/reports/fnlo0220.pdf.
90 Zomer, Robert, Deborah Bossio, Rolf Sommer, and Louis Verchot. “Global Sequestration Potential of Increased Organic Carbon in Cropland Soils.” Scientific Reports (2017) 7(1): 15554-15554. https://www.nature.com/articles/s41598-017-15794-8.
91 Sanderman, Jonathan, Tomislav Hengl, and Gregory Fiske. “Soil carbon debt of 12,000 years of human land use.” Proceedings of the National Academy of Sciences. (2017) 114(36), 9575-9580. https://www.pnas.org/content/114/36/9575.
92 Lehman, R. Michael, et al. “Soil biology for resilient, healthy soil.” Journal of Soil and Water Conservation. (2015) 70(1): 12a-18a. https://www.researchgate.net/publication/270453010_Soil_biology_for_resilient_healthy_soil.
93 Wisconsin Department of Agriculture, Trade and Consumer Protection. “Producer-Led Watershed Protection Grants.” (accessed October 20, 2020). https://datcp.wi.gov/Pages/Programs_Services/Produc-erLedProjects.aspx.
94 Maryland Department of Agriculture. “Soil Health Information.” (accessed October 20, 2020). https://mda.maryland.gov/resource_conservation/Pages/Soil-Health.aspx.
95 America’s Farmland Trust. “Farms Under Threat: The State of the States.” (accessed October 20, 2020). https://csp-fut.appspot.com/.
96 U.S. Department of Agriculture. Agriculture, Climate Change, and Carbon Sequestration. 2009. https://www.nrcs.usda.gov/Internet/FSE_DOCUMENTS/nrcs141p2_002437.pdf.
97 Biardeau, Léopold, Rebecca Crebbin-Coates, Ritt Keerati, Sara Litke, and Hortencia Rodríguez. Soil Health and Carbon Sequestration in US Croplands: A Policy Analysis. May 2016. https://food.berkeley.edu/wp-content/uploads/2016/05/GSPPCarbon_03052016_FINAL.pdf.
98 Wisconsin Department of Revenue. “Tax 18 Conser-vation Programs.” 2020. https://www.revenue.wi.gov/DOR%20Publications/tax18.pdf.
99 Wisconsin Department of Agriculture, Trade and Consumer Protection. “Agricultural Enterprise Area (AEA) Program.” (accessed October 20, 2020). https://datcp.wi.gov/Pages/Programs_Services/Agricul-turalEnterpriseAreas.aspx#:~:text=Agricultural%20enterprise%20areas%2C%20or%20AEAs,of%20land-owners%20and%20local%20governments.
100 Illinois Livestock Trail. “Environmental Benefits of Improved Grazing Management.” May 7, 2004 (accessed October 20, 2020). http://livestocktrail.illinois.edu/pasturenet/paperDisplay.cfm?ContentID=6618#:~:-text=The%20environmental%20benefits%20of%20well,improved%20fish%20and%20wildlife%20habitat.
101 U.S. Department of Agriculture: Natural Resources Conservation Service. “Grazing Lands.” (accessed October 20, 2020). https://www.nrcs.usda.gov/wps/portal/nrcs/detail/?cid=nrcs143_014209.
102 ibid.
103 Land Stewardship Project. “LSP White Paper: Farming to Capture Carbon and Address Climate Change Through Building Soil Health.” January 27, 2020. https://landstewardshipproject.org/repos-itory/1/3145/grazing_white_paper_executive_summary_1_23_20.pdf.
104 U.S. Department of Agriculture. Wisconsin Grazing Lands Conservation Initiative: Stategic Plan 2011–2016. December 2011. https://www.nrcs.usda.gov/Internet/FSE_DOCUMENTS/nrcs142p2_019548.pdf.
105 ibid.
106 Wisconsin Initiative on Climate Change Impacts. Report to the Governor’s Task Force on Climate Change: Strat-egies to Improve Wisconsin’s Climate Resilience and Readiness. July 2020. https://wicci.wisc.edu/wp-con-tent/uploads/wicci-report-to-governors-task-force.pdf.
107 Vavrus, Stephen J., and Ruben J. Behnke. “A compar-ison of projected future precipitation in Wisconsin using global and downscaled climate model simu-
1 0 6

lations: Implications for public health.” International Journal of Climatology 32, December 23, 2014. https://rmets.onlinelibrary.wiley.com/doi/pdf/10.1002/joc.3897.
108 Ashland Daily Press. “7.1 million gallons of sewage sent into Bay.” April 3, 2020 (accessed October 20, 2020). https://www.apg-wi.com/ashland_daily_press/news/local/7-1-million-gallons-of-sewage-sent-into-bay/arti-cle_5820ecbc-75c2-11ea-9347-572696437d53.html.
109 Sherwin, Brie. After the Storm: The Importance of Acknowledging Environmental Justice in Sustain-able Development and Disaster Preparedness. 2019 (accessed October 20, 2020). https://scholarship.law.duke.edu/cgi/viewcontent.cgi?article=1362&con-text=delpf.
110 Hershfield, David M. Technical Paper No. 40: Rain-fall Frequency Atlas of the United States for Durations from 30 Minutes to 24 Hours and Return Periods from 1 to 100 years. U.S. Department of Commerce. May 1961. https://www.weather.gov/media/owp/oh/hdsc/docs/TP40.pdf.
111 NOAA. Precipitation-Frequency Atlas of the United States. 2013. https://www.weather.gov/media/owp/oh/hdsc/docs/Atlas14_Volume8.pdf.
112 Wisconsin Initiative on Climate Change Impacts. “Trends and Projections.” (accessed October 20, 2020). https://wicci.wisc.edu/wisconsin-cli-mate-trends-and-projections/.
113 Wisconsin Wetlands Association. “Wetlands 101.” (accessed October 20, 2020). https://www.wisconsin-wetlands.org/learn/about-wetlands/wetlands-101/.
114 Pew Charitable Trusts: Flood Prepared Communities Initiative. “Pew Comments to Wisconsin Task Force on Climate Change.” July 31, 2020. https://www.pewtrusts.org/-/media/assets/2020/07/pew-comments-to-wi-task-force-on-climate-change.pdf.
115 Texas Water Development Board. “TWDB Flood Programs.” (accessed October 20, 2020). https://www.twdb.texas.gov/fl od/index.asp.
116 Opperman, Jeffrey J. A Flood of Benefits: Using Green Infrastructure to Reduce Flood Risks. The Nature Conservancy. May 2014. http://www.conservation-gateway.org/ConservationPractices/Freshwater/HabitatProtectionandRestoration/Documents/A%20Flood%20of%20Benefits%20-%20J.Opperman%20-%20May%202014.pdf.
117 U.S. Environmental Protection Agency. Guidance: Monitoring and Evaluating Nonpoint Source Watershed Projects. May 2016. https://www.epa.gov/sites/produc-tion/files/2016-06/documents/nps_monitoring_guide_may_2016-combined_plain.pdf.
118 Monroe County, Wisconsin. “Climate Change Task Force Committee.” (accessed October 20, 2020). https://www.co.monroe.wi.us/government/coun-ty-board-of-supervisors/boards-committees/climate-change-task-force.
119 Commodity Futures Trading Commission. “CFTC’s Climate-Related Market Risk Subcommittee Releases Report.” [Press Release] September 9, 2020 (accessed October 20, 2020). https://www.cftc.gov/PressRoom/PressReleases/8234-20.
120 Climate-Related Market Risk Subcommittee, Market Risk Advisory Committee of the U.S. Commodity Futures Trading Commission. Managing Climate Risk in the U.S. Financial System. September 9, 2020. https://www.cftc.gov/sites/default/files/2020-09/9-9-20%20Report%20of%20the%20Subcommittee%20on%20Climate-Related%20Market%20Risk%20-%20Managing%20Climate%20Risk%20in%20the%20U.S.%-20Financial%20System%20for%20posting.pdf.
121 National Federation of Independent Business. “Wisconsin Bans the Bag Ban.” April 6, 2016 (accessed October 20, 2020). https://www.nfib.com/content/news/economy/wisconsin-looks-to-ban-the-bag-ban-73556/.
122 U.S. Energy Information Administration. “Today in Energy: New electric generating capacity in 2020 will come primarily from wind and solar.” January 14, 2020 (accessed October 29, 2020). https://www.eia.gov/todayinenergy/detail.php?id=42495.
123 2020 Clean Jobs Midwest. “Wisconsin.” (accessed October 19, 2020). https://www.cleanjobsmidwest.com/state/wisconsin.
124 ibid.
125 ibid.
126 E2. Clean Jobs America 2018. August 2018. https://www.renewwisconsin.org/wp-content/uploads/2018/08/Clean-Jobs-Midwest-Wis-consin-08-08-2018.pdf.
127 Energy Futures Initiative and National Associa-tion of State Energy Officials. 2020 U.S. Energy and Employment Report. March 2020. https://static1.squarespace.com/static/5a98cf80ec4e-b7c5cd928c61/t/5ee783fe8807d732d560fcd-d/1592230915051/2020+USEER+EXEC+0615.pdf.
128 E2. Clean Jobs America 2019. March 2019 (accessed October 29, 2020). https://e2.org/reports/clean-jobs-america-2019/.
129 U.S. Bureau of Labor Statistics. “Occupational Outlook Handbook: Fastest Growing Occupations.” (accessed October 12, 2020). https://www.bls.gov/ooh/fast-est-growing.htm.
1 0 7
https://www.pewtrusts.org/-/media/assets/2020/07/pew-comments-to-wi-task-force-on-climate-change.pdf
https://www.pewtrusts.org/-/media/assets/2020/07/pew-comments-to-wi-task-force-on-climate-change.pdf

130 2020 Clean Jobs Midwest. “Wisconsin.” (accessed October 19, 2020). https://www.cleanjobsmidwest.com/state/wisconsin.
131 Muro, Mark, Adie Tomer, Ranjitha Shivaram, and Joseph Kane. Advancing Inclusion Through Clean Energy Jobs. Metropolitan Policy Program at Brook-ings. April 2019. https://www.brookings.edu/wp-content/uploads/2019/04/2019.04_metro_Clean-En-ergy-Jobs_Report_Muro-Tomer-Shivaran-Kane.pdf.
132 E2. Clean Jobs America 2019. March 2019 (accessed October 29, 2020). https://e2.org/reports/clean-jobs-america-2019/.
133 Luke, Nikki, Carol Zabin, Dalia Velasco, and Robert Collier. Diversity in California’s Clean Energy Workforce: Access to Jobs for Disadvantaged Workers in Renew-able Energy Construction. U.C. Berkeley Labor Center. August 2017. https://laborcenter.berkeley.edu/diversi-ty-in-californias-clean-energy-workforce/.
134 E2. Clean Jobs America 2018. August 2018. https://www.renewwisconsin.org/wp-content/uploads/2018/08/Clean-Jobs-Midwest-Wis-consin-08-08-2018.pdf.
135 2020 Clean Jobs Midwest. “Wisconsin.” (accessed October 19, 2020). https://www.cleanjobsmidwest.com/state/wisconsin.
136 ibid.
137 Energy Futures Initiative. U.S. Energy and Employ-ment Report 2020: Wisconsin. March 2020. https://static1.squarespace.com/static/5a98cf80ec4eb7c5cd-928c61/t/5e7818fcc54f956f567d8950/1584929020360/Wisconsin-2020.pdf.
138 Energy Futures Initiative and National Associa-tion of State Energy Officials. 2020 U.S. Energy and Employment Report. March 2020. https://static1.squarespace.com/static/5a98cf80ec4e-b7c5cd928c61/t/5ee783fe8807d732d560fcd-d/1592230915051/2020+USEER+EXEC+0615.pdf.
139 ibid.
140 U.S. Energy Information Administration. “Wisconsin State Energy Profile.” May 21, 2020. (accessed October 19, 2020). https://www.eia.gov/state/print.php?sid=WI.
141 Energy Futures Initiative. U.S. Energy and Employ-ment Report 2020: Wisconsin. March 2020. https://static1.squarespace.com/static/5a98cf80ec4eb7c5cd-928c61/t/5e7818fcc54f956f567d8950/1584929020360/Wisconsin-2020.pdf.
142 Minnesota State Legislature. “House File No. 2836.” 2019–2020. (accessed October 19, 2020). https://www.revisor.mn.gov/bills/bill.php?b=house&f=H-F2836&ssn=0&y=2019.
143 Minnesota State Legislature. “House File No. 3938.” 2019–2020. (accessed October 19, 2020). https://www.revisor.mn.gov/bills/bill.php?b=house&f=H-F3938&ssn=0&y=2020.
144 Colorado State Legislature. “House Bill No. 19-1314.” 2019. (accessed October 19, 2020). https://leg.colorado.gov/bills/hb19-1314.
145 Virginia State Legislature. “House Bill No. 714.” 2020. (accessed October 19, 2020). https://lis.virginia.gov/cgi-bin/legp604.exe?201+sum+HB714.
146 Virginia State Legislature. “House Bill No. 547.” 2020. (accessed October 19, 2020). https://lis.virginia.gov/cgi-bin/legp604.exe?201+sum+HB547.
147 City of Oakland. “Oakland Green Job Corps – Training & Jobs.” (accessed October 19, 2020). http://www2.oaklandnet.com/Government/o/PWA/o/FE/s/SO/OAK024387.
148 Wisconsin Conservation Corps. “About WisCorps.” (accessed October 19, 2020). https://wiscorps.org/about.
149 Center for Climate and Energy Solutions (C2ES). “Renewable Energy.” (accessed October 19, 2020). https://www.c2es.org/content/renewable-energy/.
150 U.S. Energy Information Administration. “Today in Energy: U.S. renewable electricity generation has doubled since 2008.” March 19, 2019. (accessed November 5, 2020). https://www.eia.gov/todayinen-ergy/detail.php?id=38752#:~:text=Renewable%20gener-ation%20provided%20a%20new,the%20United%20States%20in%202018.
151 Lazard. “Lazard’s Levelized Cost of Energy Analysis – Version 14.0.” October 2020. (Accessed November 5, 2020). https://www.lazard.com/perspective/levelized-cost-of-energy-and-levelized-cost-of-storage-2020/.
152 U.S. Energy Information Administration. “Today in Energy: New electric generating capacity in 2020 will come primarily from wind and solar.” January 19, 2020. (accessed November 5, 2020). https://www.eia.gov/todayinenergy/detail.php?id=42495.
153 Energy Innovation, LLC. “The Coal Cost Crossover: Economic Viability of Existing Coal Compared to New Local Wind and Solar Resources.” March 24, 2019 (accessed October 29, 2020). https://energyinnovation.org/publication/the-coal-cost-crossover/.
1 0 8
154 U.S. Energy Information Administration. “Average U.S. construction costs for solar and wind genera-tion continue to fall.” September 16, 2020. (accessed October 19, 2020). https://www.eia.gov/todayinenergy/detail.php?id=45136.
155 Wisconsin Economic Development Corporation. “Inside WEDC.” (accessed October 19, 2020). https://wedc.org/inside-wedc/.
156 Michigan Economic Development Corporation. “Whitmer to Partner with Finland on Clean Technology Growth and Development.” [Press Release] March 04, 2020. https://www.michiganbusiness.org/press-re-leases/2020/03/whitmer-to-partner-with-finland-on-clean-technology-growth-and-development/.
157 Michigan Economic Development Corporation. “Michigan Joins the Movement to Build Sustain-able Communities.” [Press Release] July 18, 2019. https://www.michiganbusiness.org/news/2019/07/michigan-joins-the-movement-to-build-sustain-able-communities/.
158 Massachusetts Clean Energy Center. “About MassCEC.” (accessed October 19, 2020). http://www.masscec.com/about-masscec.
159 Intergovernmental Panel on Climate Change. Global Warming of 1.5ºC. “Chapter 2: Mitigation pathways compatible with 1.5°C in the context of sustainable development.” 2018. https://www.ipcc.ch/report/sr15/mitigation-pathways-compatible-with-1-5c-in-the-con-text-of-sustainable-4-development/.
160 U.S. Climate Alliance. Leading the Charge: Working Together To Build An Equitable, Clean, And Prosperous Future. September 2020. https://www.usclimatealli-ance.org/annual-report.
161 Commonwealth of Virginia: Office of Governor Northam. “Virginia Becomes First Southern State to Join Regional Greenhouse Gas Initiative.” [Press Release] July 8, 2020. https://www.governor.virginia.gov/newsroom/all-releases/2020/july/head-line-859128-en.html.
162 Commonwealth of Pennsylvania: Office of Governor Wolf. “Governor Wolf Reaffirms Commitment to Combat Climate Change, Provides Update on RGGI Process.” [Press Release] June 22, 2020. https://www.governor.pa.gov/newsroom/governor-wolf-reaffirms-commitment-to-combat-climate-change-provides-up-date-on-rggi-process/.
163 The Transportation & Climate Initiative. “Nine States and D.C. to Design Regional Approach to Cap Green-house Gas Pollution from Transportation.”
[Press Release] December 18, 2018. https://www.transportationandclimate.org/nine-states-and-dc-de-sign-regional-approach-cap-greenhouse-gas-pollution-transportation.
164 U.S. Climate Alliance. Leading the Charge: Working Together To Build An Equitable, Clean, And Prosperous Future. September 2020. https://www.usclimatealli-ance.org/annual-report.
165 United Nations Framework Convention on Climate Change. “Education and Training under Article 6.” (accessed October 19, 2020). https://unfccc.int/topics/education-and-outreach/workstreams/education-and-training.
166 Cordero, Eugene C., Diana Centeno, and Anne Marie Todd. “The Role of Climate Change Education on Indi-vidual Lifetime Carbon Emissions,” PLOS ONE 15, no. 2. February 4, 2020. https://doi.org/10.1371/journal.pone.0206266.
167 Kamenetz, Anya. “Most Teachers Don’t Teach Climate Change; 4 In 5 Parents Wish They Did.” NPR.org. April 22, 2019 (accessed October 29, 2020). https://www.npr.org/2019/04/22/714262267/most-teachers-dont-teach-climate-change-4-in-5-parents-wish-they-did,
168 National Science Teaching Association. “About the Next Generation Science Standards.” (accessed October 19, 2020). https://ngss.nsta.org/About.aspx.
169 Wisconsin Department of Public Instruction. Wisconsin Standards for Science. November 2017. https://dpi.wi.gov/sites/default/files/imce/science/WI-Stan-dards-for-Science-2017.pdf.
170 Energy Star. “Schools: An Overview of Energy Use and Energy Efficiency Opportunities.” (accessed October 19, 2020). https://www.energystar.gov/sites/default/files/buildings/tools/SPP%20Sales%20Flyer%20for%20Schools.pdf.
171 Annesi-Maesano, Isabella, et al. “Poor air quality in classrooms related to asthma and rhinitis in primary schoolchildren of the French 6 Cities Study.” Thorax. August 2012. https://pubmed.ncbi.nlm.nih.gov/22436169/.
172 Wisconsin Department of Health Services. Wisconsin Asthma Burden Report 2020. June 2020. https://www.dhs.wisconsin.gov/publications/p02412-20.pdf.
173 Park, R. Jisung, Joshua Goodman, and A. Patrick Behrer. “Learning is inhibited by heat exposure, both internationally and within the United States.” Nature Human Behavior. October 5, 2020 (accessed October 29, 2020). https://www.nature.com/articles/s41562-020-00959-9.
1 0 9

174 Wisconsin Focus on Energy. “Wisconsin School Benchmarking Results.” 2019. https://www.focusone-nergy.com/sites/default/files/School_Benchmarking_Results_2019.pdf.
175 State of New Jersey: Office of Governor Murphy. “First Lady Tammy Murphy Announces New Jersey Will Be First State in the Nation to Incorporate Climate Change Across Education Guidelines for K-12 Schools.” [Press Release] June 3, 2020. https://www.nj.gov/governor/news/news/562020/20200603b.shtml.
176 Native Wild Rice Coalition. “Cultural Importance of Wild Rice.” (accessed October 14, 2020). http://www.nativewildricecoalition.com/cultural-importance.html.
177 Pirog, Rich S. “Food, Fuel, and Freeways: An Iowa perspective on how far food travels, fuel usage, and greenhouse gas emissions.” Leopold Center for Sustainable Agriculture, Iowa State University. 2001 (accessed October 14, 2020). https://lib.dr.iastate.edu/cgi/viewcontent.cgi?article=1002&context=leopold_pubspapers.
178 U.S. Environmental Protection Agency. “Facts and Figures about Materials, Waste and Recycling.” 2017. (accessed October 14, 2020). https://www.epa.gov/facts-and-figures-about-materials-waste-and-recycling/food-material-specific-data.
179 Great Lakes Indian Fish and Wildlife Commission. “Climate Change Vulnerability Assessment.” Version 1. April 2018. https://www.glifwc.org/ClimateChange/GLIFWC_Climate_Change_Vulnerability_Assessment_Version1_April2018.pdf.
180 Bartfeld, Judy. “Quick Facts on Food Insecurity in Wisconsin.” 2017. (accessed October 14, 2020). https://foodsecurity.wisc.edu/documents/WI_food_security_facts_2017.pdf.
181 ibid.
182 Pirog, Rich S. “Food, Fuel, and Freeways: An Iowa perspective on how far food travels, fuel usage, and greenhouse gas emissions.” Leopold Center for Sustainable Agriculture, Iowa State University. 2001 (accessed October 14, 2020). https://lib.dr.iastate.edu/cgi/viewcontent.cgi?article=1002&context=leopold_pubspapers.
183 ibid.
184 National Farm-to-School Network. “Wisconsin.” (accessed October 14, 2020). http://www.farmtoschool.org/our-network/Wisconsin.
185 National Farm-to-School Network. “About Farm-to-School: What is farm to school, and how does it contribute to vibrant communities?” (accessed October
14, 2020). http://www.farmtoschool.org/about/what-is-farm-to-school.
186 Wisconsin Department of Agriculture, Trade and Consumer Protection. “Apply Now for Grants to Grow Local Food Markets.” 2020 (accessed October 14, 2020). https://datcp.wi.gov/Pages/News_Media/ApplyNowfor-GrantstoGrowLocalFoodMarkets.aspx.
187 ibid.
188 ibid.
189 ibid.
190 U.S. Environmental Protection Agency. “Facts and Figures about Materials, Waste and Recycling.” 2017 (accessed October 14, 2020). https://www.epa.gov/facts-and-figures-about-materials-waste-and-recycling/food-material-specific-data.
191 U.S. Environmental Protection Agency. “Advancing Sustainable Materials Management: 2017 Fact Sheet.” 2017 (accessed October 14, 2020). epa.gov/sites/production/files/2019-11/documents/2017_facts_and_figures_fact_sheet_fi al.pdf.
192 Bartfeld, Judy. “Quick Facts on Food Insecurity in Wisconsin.” 2017 (accessed October 14, 2020). https://foodsecurity.wisc.edu/documents/WI_food_security_facts_2017.pdf.
193 ibid.
194 Feeding Wisconsin. “Data and Research: Hunger and Health.” 2020 (accessed October 14, 2020). https://feed-ingwi.org/data___research/health.php.
195 City of Milwaukee. Milwaukee City-County Task Force on Climate and Economic Equity Preliminary Report. 2020. https://city.milwaukee.gov/New---County-In-tranet-Files/docs/PreliminaryReport.pdf.
196 Natural Resources Defense Council. “Tackling Food Waste, Nashville-Style.” 2017 (accessed October 14, 2020). https://www.nrdc.org/resources/tackling-food-waste-nashvillian-style.
197 Wisconsin Public Radio. “An ‘Indicator Plant’: Wild Rice Struggles to Survive in A Changing Climate.” March 2, 2020 (accessed October 14, 2020). https://www.wpr.org/indicator-plant-wild-rice-struggles-survive-chang-ing-climate.
198 Cusick, Daniel. “Ojibwe Prophecy Led to the Great Lakes. Now It’s Threatened.” May 30, 2020 (accessed October 14, 2020). https://www.boreal.org/2020/05/30/316744/ojibwe-prophecy-led-to-the-great-lakes-now-its-threatened.
1 1 0
https://www.glifwc.org/ClimateChange/GLIFWC_Climate_Change_Vulnerability_Assessment_Version1_April20
https://www.glifwc.org/ClimateChange/GLIFWC_Climate_Change_Vulnerability_Assessment_Version1_April20

199 Wisconsin Public Radio. “An ‘Indicator Plant’: Wild Rice Struggles to Survive in A Changing Climate.” March 2, 2020 (accessed October 14, 2020). https://www.wpr.org/indicator-plant-wild-rice-struggles-survive-chang-ing-climate.
200 David, Peter, et al. “Manoomin, Version 1.0.” 2019 (accessed October 14, 2020). https://data.glifwc.org/manoomin/pdf/Manoomin.Stewardship.Plan.draft.[2019-08-15].pdf.
201 ibid.
202 Wisconsin Public Radio. “An ‘Indicator Plant’: Wild Rice Struggles to Survive in A Changing Climate.” March 2, 2020 (accessed October 14, 2020). https://www.wpr.org/indicator-plant-wild-rice-struggles-survive-chang-ing-climate.
203 Wisconsin Initiative on Climate Change Impacts. “Trends and Projections.” (accessed October 14, 2020). https://wicci.wisc.edu/wisconsin-cli-mate-trends-and-projections/#8.
204 Native Wild Rice Coalition. “Ecological Importance.” (accessed October 14, 2020). http://www.nativewil-dricecoalition.com/ecological-importance.html.
205 Minnesota Environmental Quality Board. Minne-sota Governor’s Task Force on Wild Rice Report. January 3, 2019. https://www.leg.mn.gov/docs/2019/other/190047.pdf.
206 Wisconsin Council on Children and Families. “Closing Gaps in Native American Health.” 2016 (accessed October 14, 2020). http://kidsforward.org/assets/Closing_Gaps.pdf.
207 Bartfeld, Judy. “Quick Facts on Food Insecurity in Wisconsin.” 2017 (accessed October 14, 2020). https://foodsecurity.wisc.edu/documents/WI_food_security_facts_2017.pdf.
208 U.S. Forest Service: Climate Change Resource Center. “Forests and Carbon Storage.” (accessed October 20, 2020). https://www.fs.usda.gov/ccrc/topics/forests-and-carbon-storage-2012
209 ibid.
210 Wisconsin Department of Natural Resources. Statewide Forest Action Plan. June 2020. https://widnr.widen.net/view/pdf/77tgnbh66w/2020-Statewide-Forestry-Ac-tion-Plan.pdf.
211 U.S. Environmental Protection Agency. “Climate Change Impacts on Forests.” (accessed October 20, 2020). https://19january2017snapshot.epa.gov/climate-impacts/climate-impacts-forests_.html.
212 Fargione, Joseph, et al. “Natural climate solutions for the United States.” Science Advances, 4 (11): November 14, 2018. https://advances.sciencemag.org/content/4/11/eaat1869.
213 Wisconsin Department of Natural Resources. Statewide Forest Action Plan. June 2020. https://widnr.widen.net/view/pdf/77tgnbh66w/2020-Statewide-Forestry-Ac-tion-Plan.pdf.
214 Murray, Helena, Paul Catanzaro, and Marla Markows-ki-Lindsay. “Economic Contributions of Forest Legacy Program Land.” Family Forest Research Center, UMass Department of Environmental Conservation. November 13, 2019. https://www.wildlandsandwoodlands.org/sites/default/files/B2%20-%20Markowski-Lindsay%-26Catanzaro.pdf.
215 American Forest Foundation. “Corporate Partner-ship in the Family Forest Carbon Program.” (accessed October 20, 2020). https://www.forestfoundation.org/family-forest-carbon-program.
216 Wisconsin’s Green Fire. Strategies for Mitigating Climate Change with Natural and Working Lands—A Policy Analysis and Playbook. July 15, 2020. https://wigreenfire.org/2019/wp-content/uploads/2020/07/WGF-NWL-Policy-Playbook-Final-07-15-2020.pdf.
217 Wisconsin Department of Natural Resources: Forestry Division. Urban Forests of Wisconsin, 2012. February 2017. https://www.fs.fed.us/nrs/pubs/jrnl/2017/nrs_2017_nowak_004.pdf.
218 U.S. Bureau of Labor Statistics. “Occupational Outlook Handbook.” Last modified September 1, 2020. https://www.bls.gov/ooh/life-physical-and-social-science/conservation-scientists.htm#tab-6.
219 Wisconsin Department of Workforce Development. “Arborist.” (accessed October 20, 2020). https://dwd.wisconsin.gov/apprenticeship/trades/arborist.htm.
220 Rhode Island Department of Environmental Manage-ment. “Urban and Community Forestry Program.” (accessed October 20, 2020). http://www.dem.ri.gov/programs/forestry/urban-forestry/.
221 Forest Trends. “Voluntary Carbon Market Insights: 2018 Outlook and First-Quarter Trends.” July 27, 2018 (accessed October 20, 2020). https://www.forest-trends.org/publications/voluntary-carbon-markets/.
222 U.S. Department of Agriculture. “Carbon Sequestra-tion.” (accessed October 20, 2020). https://www.fs.fed.us/ecosystemservices/carbon.shtml.
1 1 1
https://www.wildlandsandwoodlands.org/sites/default/files/B2%20-%20Markowski-Lindsay%26Catanzaro.pdf
https://www.wildlandsandwoodlands.org/sites/default/files/B2%20-%20Markowski-Lindsay%26Catanzaro.pdf
https://www.wildlandsandwoodlands.org/sites/default/files/B2%20-%20Markowski-Lindsay%26Catanzaro.pdf
https://wigreenfire.org/2019/wp-content/uploads/2020/07/WGF-NWL-Policy-Playbook-Final-07-15-2020.pdf
https://wigreenfire.org/2019/wp-content/uploads/2020/07/WGF-NWL-Policy-Playbook-Final-07-15-2020.pdf

223 U.S. Environmental Protection Agency. “Inventory of U.S. Greenhouse Gas Emissions and Sinks: 1990-2014.” (accessed November 9, 2020). https://www.epa.gov/ghgemissions/inventory-us-greenhouse-gas-emis-sions-and-sinks-1990-2014.
224 Public Service Commission of Wisconsin. “6630-ET-101: Application of Wisconsin Electric Power Company for a Financing Order Authorizing the Issu-ance of Environmental Trust Bonds.” https://apps.psc.wi.gov/APPS/dockets/content/detail.aspx?id=6630&-case=ET&num=101.
225 Rocky Mountain Institute e-Lab Accelerator. “Financial Tools Supporting Coal To Clean In Wisconsin.” 2019. https://rmi.org/elab-2019-financial-tools-coal-clean-wisconsin/.
226 Wisconsin Energy Distribution and Technology Initia-tive. “Stakeholder Recommendations to Accelerate the Clean Energy Transition and Optimize the Energy System for the Benefit of All.” July 2020. https://www.wpr.org/sites/default/files/wisconsin-energy-distribu-tion-and-technology-initiative.pdf.
227 ibid.
228 Public Service Commission of Wisconsin. “5-EI-157: Investigation of Parallel Generation Purchase Rates.” https://apps.psc.wi.gov/APPS/dockets/content/detail.aspx?id=5&case=EI&num=157.
229 Argonne National Laboratory. “Argonne GREET Model.” (accessed October 29, 2020). https://greet.es.anl.gov/homepage2.
230 California Air Resources Board. “Low Carbon Fuel Standard.” (accessed October 29, 2020). https://ww2.arb.ca.gov/our-work/programs/low-carbon-fuel-stan-dard/about.
231 Oregon Department of Environmental Quality. “Over-view of the Clean Fuels Program.” 2017. https://www.oregon.gov/deq/FilterDocs/cfpoverview.pdf.
232 American Antitrust Institute. “The State of Antitrust Enforcement and Competition Policy in the U.S.” April 14, 2020. https://www.antitrustinstitute.org/work-product/antitrust-enforcement-report/.
233 Stucke, Maurice E., and Allen P. Grunes. “An Updated Antitrust Review of the Bayer-Monsanto Merger.” The Konkurrenz Group. March 6, 2018. https://1bps-6437gg8c169i0y1drtgz-wpengine.netdna-ssl.com/wp-content/uploads/2018/03/2018-FINAL-White-Paper-with-PAN-3-7-2018.pdf.
234 Clapp, Jennifer. Bigger is Not Always Better: The Drivers and Implications of the Recent Agribusiness Megamergers. Waterloo, ON: Global Food Politics Group, University of Waterloo. 2017. https://www.researchgate.net/publication/314206957_Bigger_is_Not_Always_Better_Drivers_and_Implications_of_the_Recent_Agribusiness_megamergers.
1 1 2


Pictured here from top left to bottom right: Lieutenant Governor Barnes visits the Organic Valley Distribution Center in Cashton, Wisconsin with State Senator Jennifer Shilling; Lieutenant Governor Barnes chairs a Climate Change Task Force meeting.
1 1 4

Pictured here: Lieutenant Governor Barnes learns about wind energy education training programs at Lakeshore Technical College in Cleveland, Wisconsin.
1 1 5

P U B L I S H E D B Y T H E S TAT E O F W I S C O N S I N
https://climatechange.wi.gov