Government Services - Treasury and Finance Tasmania
138
PARLIAMENT OF TASMANIA Government Services Budget Paper No 2 Volume 2 Presented by Hon Peter Gutwein MP, Treasurer, for the information of Honourable Members, on the occasion of the Budget, 2016-17
-
Upload
khangminh22 -
Category
Documents
-
view
2 -
download
0
Transcript of Government Services - Treasury and Finance Tasmania

P A R L I A M E N T O F T A S M A N I A
Government Services Budget Paper No 2
Volume 2
Presented by
Hon Peter Gutwein MP, Treasurer, for the information of
Honourable Members, on the occasion of the Budget, 2016-17

Useful 2016-17 Budget and Government Websites
www.premier.tas.gov.au/budget_2016 Contains the 2016-17 Budget Paper documents and
related information including Budget Fact Sheets and
Government Media Releases.
www.treasury.tas.gov.au Contains the 2016-17 Budget Papers and Budget Paper
archives.
www.tas.gov.au Provides links to the websites of Tasmanian public sector
entities.
www.service.tas.gov.au Provides a comprehensive entry point to Government
services in Tasmania.

i
CONTENTS VOLUME 1 PART 1: DEPARTMENTS
1 Introduction
2 Department of Education
3 Finance-General
4 Department of Health and Human Services
5 Department of Justice
6 Ministerial and Parliamentary Support
7 Department of Police, Fire and Emergency Management
8 Department of Premier and Cabinet
9 Department of Primary Industries, Parks, Water and Environment
10 Department of State Growth
11 Department of Treasury and Finance
VOLUME 2 PART 2: AGENCIES
12 House of Assembly
13 Integrity Commission
14 Legislative Council
15 Legislature-General
16 Office of the Director of Public Prosecutions
17 Office of the Governor
18 Office of the Ombudsman
19 Tasmanian Audit Office
20 Tourism Tasmania

ii
PART 3: STATUTORY AUTHORITIES
21 Inland Fisheries Service
22 Marine and Safety Tasmania
23 Royal Tasmanian Botanical Gardens
24 State Fire Commission
25 Tasmanian Health Service
26 TasTAFE

iii
VOLUME 2: INDEX PART 2: AGENCIES
12 House of Assembly 3
Agency Outline 3
Key Deliverables 3
Output Information 4
Output Group 1: House of Assembly Support Services 5
Output Group 2: Payments Administered by the House of Assembly 5
Detailed Budget Statements 6
13 Integrity Commission 11
Agency Outline 11
Key Deliverables 11
Output Information 12
Output Group 1: Integrity Commission 12
Detailed Budget Statements 13
14 Legislative Council 17
Agency Outline 17
Key Deliverables 17
Output Information 18
Output Group 1: Legislative Council Support Services 19
Output Group 2: Payments Administered by the Legislative Council 19
Detailed Budget Statements 20
15 Legislature-General 25
Agency Outline 25
Key Deliverables 25
Output Information 26
Output Group 1: Parliamentary Reporting Service 27
Output Group 2: Parliamentary Library Service 27
Output Group 3: Parliamentary Printing and Systems 28
Output Group 4: Joint Services 28

iv
Detailed Budget Statements 30
16 Office of the Director of Public Prosecutions 35
Agency Outline 35
Key Deliverables 35
Output Information 36
Output Group 1: The Office of the Director of Public Prosecutions 36
Detailed Budget Statements 37
17 Office of the Governor 43
Agency Outline 43
Key Deliverables 44
Output Information 44
Output Group 1: The Office of the Governor 45
Detailed Budget Statements 46
18 Office of the Ombudsman 51
Agency Outline 51
Key Deliverables 51
Output Information 52
Output Group 1: The Office of the Ombudsman 52
Detailed Budget Statements 54
19 Tasmanian Audit Office 59
Agency Outline 59
Key Deliverables 60
Output Information 61
Output Group 1: Public Sector Management and Accountability 61
Detailed Budget Statements 63
20 Tourism Tasmania 67
Agency Outline 67
Key Deliverables 68
Output Information 71
Output Group 1: Tourism 71
Detailed Budget Statements 73

v
PART 3: STATUTORY AUTHORITIES
21 Inland Fisheries Service 79
Authority Outline 79
Key Deliverables 79
Detailed Budget Statements 80
22 Marine and Safety Tasmania 83
Authority Outline 83
Key Deliverables 83
Detailed Budget Statements 85
23 Royal Tasmanian Botanical Gardens 89
Authority Outline 89
Key Deliverables 90
Detailed Budget Statements 91
24 State Fire Commission 95
Authority Outline 95
Key Deliverables 96
Detailed Budget Statements 99
25 Tasmanian Health Service 105
Authority Outline 105
Key Deliverables 106
Output Information 108
Output Group 1: Tasmanian Health Service 109
Detailed Budget Statements 114
26 TasTAFE 123
Authority Outline 123
Key Deliverables 123
Detailed Budget Statements 125


PART 2: AGENCIES


House of Assembly 3
12 HOUSE OF ASSEMBLY
AGENCY OUTLINE The Office of the Clerk of the House of Assembly provides services through the provision of advisory,
procedural, research and administrative support to the House of Assembly, its committees, the Speaker of
the House and Members generally.
This chapter provides financial information about the Outputs to be delivered by the House of Assembly in
2016-17 and over the Forward Estimates period (2017-18 to 2019-20). Further information about the
House of Assembly is provided at www.parliament.tas.gov.au.
KEY DELIVERABLES The major focus for the House of Assembly in 2016-17 is the continuation of service delivery in an efficient
and timely manner to the House and its Committees in their constitutional roles.

4 House of Assembly
OUTPUT INFORMATION Outputs of the House of Assembly are provided under the following Output Groups:
Output Group 1 - House of Assembly Support Services; and
Output Group 2 - Payments Administered by the House of Assembly.
Table 12.1 provides an Output Group Expense Summary for the House of Assembly.
Table 12.1: Output Group Expense Summary 2015-16
Budget
2016-17
Budget
2017-18
Forward
Estimate
2018-19
Forward
Estimate
2019-20
Forward
Estimate
$'000) $'000) $'000) $'000) $'000)
Output Group 1 - House of Assembly Support
Services
1.1 House of Assembly Support Services 2 326 2 376 2 426 2 475 2 509
1.2 Select Committee Support Services 6 6 6 6 6
1.3 Investigatory Committee Support Services 108 110 112 114 116
2 440 2 492 2 544 2 595 2 631
Output Group 2 - Payments Administered by the
House of Assembly
2.1 Payments Administered by the House of
Assembly 5 424 5 532 5 643 5 738 5 795
5 424 5 532 5 643 5 738 5 795
TOTAL 7 864 8 024 8 187 8 333 8 426

House of Assembly 5
Output Group 1: House of Assembly Support Services
1.1 House of Assembly Support Services
This Output provides for the effective and lawful operation of the House and its committees, the fulfilment of
statutory requirements, the promotion of the role of the Parliament and the provision of written and oral advice.
1.2 Select Committee Support Services
This Output relates to Select Committees appointed by resolution of the House and provides resources to
enable the committees to address the terms of reference specified in their appointment.
1.3 Investigatory Committee Support Services
This Output provides a Committee Secretariat and resources for Investigatory Committees to enable
Committees to address the terms of reference of matters referred by the House.
Output Group 2: Payments Administered by the House of Assembly
2.1 Payments Administered by the House of Assembly
This Output relates to the payment of salaries and allowances as prescribed by legislation.

6 House of Assembly
DETAILED BUDGET STATEMENTS
Table 12.2: Statement of Comprehensive Income 2015-16
Budget
2016-17
Budget
2017-18
Forward
Estimate
2018-19
Forward
Estimate
2019-20
Forward
Estimate
$'000 $'000 $'000 $'000 $'000
Revenue and other income from transactions
Appropriation revenue - recurrent 7 882 7 989 8 161 8 307 8 400
Total revenue and other income from transactions 7 882 7 989 8 161 8 307 8 400
Expenses from transactions
Employee benefits1 7 343 7 560 7 712 7 846 7 927
Depreciation and amortisation 37 37 37 37 37
Supplies and consumables2 484 427 438 450 462
Total expenses from transactions 7 864 8 024 8 187 8 333 8 426
Net result from transactions (net operating
balance) 18 (35) (26) (26) (26)
Net result 18 (35) (26) (26) (26)
Comprehensive result 18 (35) (26) (26) (26)
Notes: 1. Growth in salary expenditure has been based on the Government's Wages Policy of 2 per cent per annum across the
Budget and Forward Estimates period. 2. The decrease in Supplies and consumables in 2016-17 reflects revised estimates based on 30 June 2015 actuals.

House of Assembly 7
Table 12.3: Revenue from Appropriation by Output
2015-16
Budget
2016-17
Budget
2017-18
Forward
Estimate
2018-19
Forward
Estimate
2019-20
Forward
Estimate
$'000 $'000 $'000 $'000 $'000
House of Assembly
Output Group 1 - House of Assembly Support
Services
1.1 House of Assembly Support Services 2 344 2 341 2 400 2 449 2 483
1.2 Select Committee Support Services 6 6 6 6 6
1.3 Investigatory Committee Support Services 108 110 112 114 116
2 458 2 457 2 518 2 569 2 605
Output Group 2 - Payments Administered by the
House of Assembly
2.1 Payments Administered by the House of
Assembly1 ....) 658 658 658 658
....) 658 658 658 658
House of Assembly
Total Recurrent Services 2 458 3 115 3 176 3 227 3 263
2 458 3 115 3 176 3 227 3 263
Reserved by Law
Members' Committee Fees and Allowances
(Parliamentary Salaries, Superannuation and
Allowances Act 2012) 31 31 31 31 31
Parliamentary Salaries and Allowances
(Parliamentary Salaries, Superannuation and
Allowances Act 2012)1 4 704 4 735 4 846 4 941 4 998
Travelling Allowances (Parliamentary Salaries,
Superannuation and Allowances Act 2012)1 689 108 108 108 108
5 424 4 874 4 985 5 080 5 137
Total Revenue from Appropriation 7 882 7 989 8 161 8 307 8 400
Controlled Revenue from Appropriation 7 882 7 989 8 161 8 307 8 400
7 882 7 989 8 161 8 307 8 400
Note: 1. Variations include the impact of a Budget neutral reallocation of $658 000 between Reserved by Law and general
Consolidated Fund funding. Further information on this change is provided in chapter 1 of this Budget Paper.

8 House of Assembly
Table 12.4: Statement of Financial Position as at 30 June
2016
Budget
2017
Budget
2018
Forward
Estimate
2019
Forward
Estimate
2020
Forward
Estimate
$'000 $'000 $'000 $'000 $'000
Assets
Financial assets
Cash and deposits 4 4 4 4 4
Receivables 3 4 4 4 4
7 8 8 8 8
Non-financial assets
Property, plant and equipment1 61 121 124 127 130
Heritage and cultural assets2 1 795 2 062 2 062 2 062 2 062
Other assets1 20 16 16 16 16
1 876 2 199 2 202 2 205 2 208
Total assets 1 883 2 207 2 210 2 213 2 216
Liabilities
Payables1 47 56 56 56 56
Employee benefits1 638 563 592 621 650
Total liabilities 685 619 648 677 706
Net assets (liabilities) 1 198 1 588 1 562 1 536 1 510
Equity
Reserves2 885 1 151 1 151 1 151 1 151
Accumulated funds 313 437 411 385 359
Total equity 1 198 1 588 1 562 1 536 1 510
Notes: 1. The variations in Property, plant and equipment, Other assets, Payables and Employee benefits in 2017 reflect revised
estimates based on 30 June 2015 actuals. 2. The increases in Heritage and cultural assets and Reserves in 2017 reflect a revaluation of artworks and artefacts as
at 30 June 2015.

House of Assembly 9
Table 12.5: Statement of Cash Flows
2015-16
Budget
2016-17
Budget
2017-18
Forward
Estimate
2018-19
Forward
Estimate
2019-20
Forward
Estimate
$'000 $'000 $'000 $'000 $'000
Cash flows from operating activities
Cash inflows
Appropriation receipts - recurrent 7 882 7 989 8 161 8 307 8 400
GST receipts 94 94 94 94 94
Total cash inflows 7 976 8 083 8 255 8 401 8 494
Cash outflows
Employee benefits1,2 (6 888) (6 953) (7 102) (7 226) (7 301)
Superannuation1 (490) (569) (581) (591) (597)
GST payments (94) (94) (94) (94) (94)
Supplies and consumables1 (484) (427) (438) (450) (462)
Total cash outflows (7 956) (8 043) (8 215) (8 361) (8 454)
Net cash from (used by) operating activities 20 40 40 40 40
Cash flows from investing activities
Payments for acquisition of non-financial assets1 (20) (40) (40) (40) (40)
Net cash from (used by) investing activities (20) (40) (40) (40) (40)
Net increase (decrease) in cash and cash
equivalents held .... .... .... .... ....
Cash and deposits at the beginning of the
reporting period 4 4 4 4 4
Cash and deposits at the end of the reporting
period 4 4 4 4 4
Notes: 1. The variations in Employee benefits, Superannuation, Supplies and consumables and Payments for acquisition of
non-financial assets in 2016-17 reflect revised estimates based on 30 June 2015 actuals. 2. Growth in salary expenditure has been based on the Government's Wages Policy of 2 per cent per annum across the
Budget and Forward Estimates period.


Integrity Commission 11
13 INTEGRITY COMMISSION
AGENCY OUTLINE The Integrity Commission operates under the Integrity Commission Act 2009 (the Act) and its role is to
improve the standard of conduct, propriety and ethics in the public sector by:
delivering education and training to prevent misconduct and develop resistance to misconduct;
building the capacity of the public sector to prevent and address misconduct; and
providing an effective mechanism for misconduct complaints to be addressed.
An important focus for the Integrity Commission is education, advice and prevention of public officer
misconduct to strengthen the confidence of Tasmanians in the capacity of state and local government public
authorities to operate ethically and with propriety.
The Commission also deals with complaints of misconduct, which in some instances, may lead to
investigations, either by the Commission or by the relevant public authority. The Commission also conducts
own motion investigations, and has the power to monitor and audit internal investigation processes conducted
by public authorities, including Tasmania Police.
The Commission is overseen by a Board, which includes the Chief Commissioner, the Ombudsman, the
Auditor-General and three other members with specialist expertise.
This chapter provides financial information about the Output to be delivered by the Integrity Commission
in 2016-17 and over the Forward Estimates period (2017-18 to 2019-20). Further information about the
Commission is provided at www.integrity.tas.gov.au.
KEY DELIVERABLES The key initiatives for the Commission include:
working with the public and key stakeholders to enhance community trust and confidence in public
authorities within Tasmania;
working cooperatively with public authorities, other integrity entities and the Parliamentary Standards
Commissioner to prevent misconduct and enhance capacity-building in dealing with misconduct;
educating public authorities and raising public awareness about integrity and ethical conduct; and
dealing with misconduct issues in a timely, effective and fair way in accordance with the public interest.

12 Integrity Commission
OUTPUT INFORMATION The individual Output of the Integrity Commission is provided under:
Output Group 1 - Integrity Commission.
Table 13.1 provides an Output Group Expense Summary for the Integrity Commission.
Table 13.1: Output Group Expense Summary
2015-16)
Budget)
2016-17)
Budget)
2017-18)
Forward)
Estimate)
2018-19)
Forward)
Estimate)
2019-20)
Forward)
Estimate)
$'000) $'000) $'000) $'000) $'000)
Output Group 1 - Integrity Commission
1.1 Integrity Commission1 2 486) 2 351) 2 403) 2 452) 2 488)
2 486) 2 351) 2 403) 2 452) 2 488)
TOTAL 2 486) 2 351) 2 403) 2 452) 2 488)
Note: 1. The decrease in expenditure in 2016-17 primarily reflects the cessation of one-off funding provided in 2015-16 for the
temporary extension of board funding ($43 000 one-off) and costs associated with conducting the independent review of the Integrity Commission Act 2009, as required by section 106 of the Act ($60 000 one-off), and revised estimates based on 30 June 2015 actuals. Funding received for the independent review has been provided by the Integrity Commission to the Department of Justice which is managing the review process.
Output Group 1: Integrity Commission
1.1 Integrity Commission
This Output provides:
education and capacity-building for public officers and enhancing public confidence in the integrity and
ethical conduct of the public sector;
preventative and advisory functions to public officers; and
complaint handling/assessment and the conduct of investigations and inquiries as outlined in the Act.

Integrity Commission 13
DETAILED BUDGET STATEMENTS
Table 13.2: Statement of Comprehensive Income
2015-16)
Budget)
2016-17)
Budget)
2017-18)
Forward)
Estimate)
2018-19)
Forward)
Estimate)
2019-20)
Forward)
Estimate)
$'000) $'000) $'000) $'000) $'000)
Revenue and other income from transactions
Appropriation revenue - recurrent1 2 390) 2 290) 2 346) 2 395) 2 431)
Total revenue and other income from transactions 2 390) 2 290) 2 346) 2 395) 2 431)
Expenses from transactions
Employee benefits1 1 673) 1 599) 1 644) 1 688) 1 705)
Depreciation and amortisation 92) 90) 86) 86) 86)
Supplies and consumables2 535) 476) 487) 488) 503)
Other expenses 186) 186) 186) 190) 194)
Total expenses from transactions 2 486) 2 351) 2 403) 2 452) 2 488)
Net result from transactions (net operating
balance) (96) (61) (57) (57) (57)
Net result (96) (61) (57) (57) (57)
Comprehensive result (96) (61) (57) (57) (57)
Notes: 1. The decreases in Appropriation revenue - recurrent and Employee benefits in 2016-17 primarily reflect the cessation
of one-off funding provided in 2015-16 for the temporary extension of board funding ($43 000 one-off) and costs associated with conducting the independent review of the Integrity Commission Act 2009, as required by section 106 of the Act ($60 000 one-off). Funding received for the independent review has been provided by the Integrity Commission to the Department of Justice which is managing the review process.
2. The decrease in Supplies and consumables in 2016-17 reflects the impact of 2014-15 Budget Savings Strategies and the cessation of one-off funding provided in 2015-16.

14 Integrity Commission
Table 13.3: Revenue from Appropriation by Output
2015-16)
Budget)
2016-17)
Budget)
2017-18)
Forward)
Estimate)
2018-19)
Forward)
Estimate)
2019-20)
Forward)
Estimate)
$'000) $'000) $'000) $'000) $'000)
Attorney-General and Minister for Justice
Output Group 1 - Integrity Commission
1.1 Integrity Commission1 2 390) 2 290) 2 346) 2 395) 2 431)
2 390) 2 290) 2 346) 2 395) 2 431)
Integrity Commission
Total Recurrent Services 2 390) 2 290) 2 346) 2 395) 2 431)
2 390) 2 290) 2 346) 2 395) 2 431)
Total Revenue from Appropriation 2 390) 2 290) 2 346) 2 395) 2 431)
Controlled Revenue from Appropriation 2 390) 2 290) 2 346) 2 395) 2 431)
2 390) 2 290) 2 346) 2 395) 2 431)
Note: 1. The decrease in appropriation revenue in 2016-17 reflects the cessation of one-off funding provided in 2015-16 for the
temporary extension of board funding ($43 000 one-off) and costs associated with conducting the independent review of the Integrity Commission Act 2009, as required by section 106 of the Act ($60 000 one-off). Funding received for the independent review has been provided by the Integrity Commission to the Department of Justice which is managing the review process.

Integrity Commission 15
Table 13.4: Statement of Financial Position as at 30 June
2016)
Budget)
2017)
Budget)
2018)
Forward)
Estimate)
2019)
Forward)
Estimate)
2020)
Forward)
Estimate)
$'000) $'000) $'000) $'000) $'000)
Assets
Financial assets
Cash and deposits1 28) 41) 41) 41) 41)
Receivables1 38) 8) 8) 8) 8)
66) 49) 49) 49) 49)
Non-financial assets
Property, plant and equipment2 6) ....) ....) ....) ....)
Intangibles 139) 107) 80) 53) 26)
Other assets 315) 318) 259) 200) 141)
460) 425) 339) 253) 167)
Total assets 526) 474) 388) 302) 216)
Liabilities
Payables1 22) 7) 7) 7) 7)
Provisions1 ....) 65) 65) 65) 65)
Employee benefits1 417) 284) 255) 226) 197)
Total liabilities 439) 356) 327) 298) 269)
Net assets (liabilities) 87) 118) 61) 4) (53)
Equity
Accumulated funds 87) 118) 61) 4) (53)
Total equity 87) 118) 61) 4) (53)
Notes: 1. The variations in Cash and deposits, Receivables, Payables, Provisions and Employee benefits in 2017 reflect revised
estimates based on 30 June 2015 actuals. 2. The decrease in Property, plant and equipment in 2017 reflects the full depreciation of the asset held.

16 Integrity Commission
Table 13.5: Statement of Cash Flows
2015-16)
Budget)
2016-17)
Budget)
2017-18)
Forward)
Estimate)
2018-19)
Forward)
Estimate)
2019-20)
Forward)
Estimate)
$'000) $'000) $'000) $'000) $'000)
Cash flows from operating activities
Cash inflows
Appropriation receipts - recurrent1 2 390) 2 290) 2 346) 2 395) 2 431)
Total cash inflows 2 390) 2 290) 2 346) 2 395) 2 431)
Cash outflows
Employee benefits1 (1 490) (1 457) (1 497) (1 536) (1 562)
Superannuation (173) (171) (176) (181) (172)
Supplies and consumables2 (541) (476) (487) (488) (503)
Other cash payments (186) (186) (186) (190) (194)
Total cash outflows (2 390) (2 290) (2 346) (2 395) (2 431)
Net increase (decrease) in cash and cash
equivalents held ....) ....) ....) ....) ....)
Cash and deposits at the beginning of the
reporting period 28) 41) 41) 41) 41)
Cash and deposits at the end of the reporting
period 28) 41) 41) 41) 41)
Notes: 1. The decreases in Appropriation receipts - recurrent and Employee benefits in 2016-17 primarily reflect the cessation
of one-off funding provided in 2015-16 for the temporary extension of board funding ($43 000 one-off) and costs associated with conducting the independent review of the Integrity Commission Act 2009, as required by section 106 of the Act ($60 000 one-off). Funding received for the independent review has been provided by the Integrity Commission to the Department of Justice which is managing the review process.
2. The decrease in Supplies and consumables in 2016-17 reflects the impact of 2014-15 Budget Savings Strategies and the cessation of one-off funding provided in 2015-16.

Legislative Council 17
14 LEGISLATIVE COUNCIL
AGENCY OUTLINE The Governor, the Legislative Council and the House of Assembly together constitute the Parliament of
Tasmania. The Legislative Council is the Upper House of Parliament and functions as a House of Review.
The role of the Members of the Legislative Council is:
to authorise the raising of revenue and the expenditure of State monies;
to examine the merits of legislation; and
to provide a parliamentary check on the Government of the day.
The Legislative Council has expanded from being a purely legislative body to a House that involves itself with
the examination and analysis of actions, decisions and workings of the Executive Government.
The Office of the Clerk of the Legislative Council provides apolitical support services and information to the
elected Members of the Legislative Council in the interests of the people of Tasmania.
This chapter provides financial information about the Outputs to be delivered by the Legislative Council in
2016-17 and over the Forward Estimates period (2017-18 to 2019-20). Further information about the
Legislative Council is provided at www.parliament.tas.gov.au.
KEY DELIVERABLES The key deliverables for the Legislative Council include:
supporting the Legislative Council in its constitutional role;
providing apolitical support with particular attention to administrative support, research, policy and
procedural support and advice to the President of the Legislative Council and other elected Members;
accurately and effectively preparing and presenting legislation, once passed through both Houses, to
Her Excellency the Governor for Royal Assent; and
promoting public awareness of the purpose, functions and work of the Legislative Council.

18 Legislative Council
OUTPUT INFORMATION Outputs of the Legislative Council are provided under the following Output Groups:
Output Group 1 - Legislative Council Support Services; and
Output Group 2 - Payments Administered by the Legislative Council.
Table 14.1 provides an Output Group Expense Summary for the Legislative Council.
Table 14.1: Output Group Expense Summary
2015-16
Budget
2016-17
Budget
2017-18
Forward
Estimate
2018-19
Forward
Estimate
2019-20
Forward
Estimate
$'000 $'000 $'000 $'000 $'000
Output Group 1 - Legislative Council Support
Services
1.1 Legislative Council Support Services 3 373 3 488 3 491 3 551 3 592
1.2 Committee Support Services 12 12 12 12 12
3 385 3 500 3 503 3 563 3 604
Output Group 2 - Payments Administered by the
Legislative Council
2.1 Payments Administered by the Legislative
Council 3 066 3 130 3 196 3 252 3 286
3 066 3 130 3 196 3 252 3 286
TOTAL 6 451 6 630 6 699 6 815 6 890

Legislative Council 19
Output Group 1: Legislative Council Support Services
1.1 Legislative Council Support Services
This Output provides:
procedural, administrative and research support and advice to the President and Members;
support for the overall operations of the Legislative Council;
assistance to Members to carry out their constitutional duties and responsibilities as elected
representatives of the people of Tasmania; and
equipment and research support allowances to Members.
1.2 Committee Support Services
This Output provides support and advice to Legislative Council Standing and Select Committees, Joint
Parliamentary Standing and Select Committees, and Joint Statutory Committees.
Output Group 2: Payments Administered by the Legislative Council
2.1 Payments Administered by the Legislative Council
This Output Group provides for the Parliamentary salaries and allowances of Members of the Legislative
Council as prescribed in legislation.

20 Legislative Council
DETAILED BUDGET STATEMENTS
Table 14.2: Statement of Comprehensive Income
2015-16)
Budget)
2016-17)
Budget)
2017-18)
Forward)
Estimate)
2018-19)
Forward)
Estimate)
2019-20)
Forward)
Estimate)
$'000) $'000) $'000) $'000) $'000)
Revenue and other income from transactions
Appropriation revenue - recurrent 6 497) 6 547) 6 684) 6 800) 6 875)
Total revenue and other income from transactions 6 497) 6 547) 6 684) 6 800) 6 875)
Expenses from transactions
Employee benefits1,2 5 859) 5 936) 5 995) 6 101) 6 166)
Depreciation and amortisation3 12) 3) 3) 3) 3)
Supplies and consumables1 580) 691) 701) 711) 721)
Total expenses from transactions 6 451) 6 630) 6 699) 6 815) 6 890)
Net result from transactions (net operating
balance) 46) (83) (15) (15) (15)
Net result 46) (83) (15) (15) (15)
Comprehensive result 46) (83) (15) (15) (15)
Notes: 1. The variations in Employee benefits and Supplies and consumables reflect a reallocation of Reserved by Law
expenditure between Travelling Allowances (Parliamentary Salaries, Superannuation and Allowances Act 2012) and Parliamentary Salaries and Allowances (Parliamentary Salaries, Superannuation and Allowances Act 2012).
2. Growth in salary expenditure has been based on the Government's Wages Policy of 2 per cent per annum across the Budget and Forward Estimates period.
3. The decrease in Depreciation and amortisation reflects a reduction in the depreciation value of computer equipment.

Legislative Council 21
Table 14.3: Revenue from Appropriation by Output
2015-16)
Budget)
2016-17)
Budget)
2017-18)
Forward)
Estimate)
2018-19)
Forward)
Estimate)
2019-20)
Forward)
Estimate)
$'000) $'000) $'000) $'000) $'000)
Legislative Council
Output Group 1 - Legislative Council Support
Services
1.1 Legislative Council Support Services 3 419) 3 405) 3 476) 3 536) 3 577)
1.2 Committee Support Services 12) 12) 12) 12) 12)
3 431) 3 417) 3 488) 3 548) 3 589)
Output Group 2 - Payments Administered by the
Legislative Council
2.1 Payments Administered by the Legislative
Council1 ....) 307) 307) 307) 307)
....) 307) 307) 307) 307)
Legislative Council
Total Recurrent Services 3 431) 3 724) 3 795) 3 855) 3 896)
3 431) 3 724) 3 795) 3 855) 3 896)
Reserved by Law
Members' Committee Fees and Allowances
(Parliamentary Salaries, Superannuation and
Allowances Act 2012) 40) 40) 40) 40) 40)
Parliamentary Salaries and Allowances
(Parliamentary Salaries, Superannuation and
Allowances Act 2012)1 2 745) 2 683) 2 749) 2 805) 2 839)
Travelling Allowances (Parliamentary Salaries,
Superannuation and Allowances Act 2012)1 281) 100) 100) 100) 100)
3 066) 2 823) 2 889) 2 945) 2 979)
Total Revenue from Appropriation 6 497) 6 547) 6 684) 6 800) 6 875)
Controlled Revenue from Appropriation 6 497) 6 547) 6 684) 6 800) 6 875)
6 497) 6 547) 6 684) 6 800) 6 875)
Note: 1. Variations include the impact of a Budget neutral reallocation of $307 000 between Reserved by Law and general
Consolidated Fund funding. Further information on this change is provided in chapter 1 of this Budget Paper. This variation also includes a reallocation of Reserved by Law expenditure between Travelling Allowances (Parliamentary Salaries, Superannuation and Allowances Act 2012) and Parliamentary Salaries and Allowances (Parliamentary Salaries, Superannuation and Allowances Act 2012).
22 Legislative Council
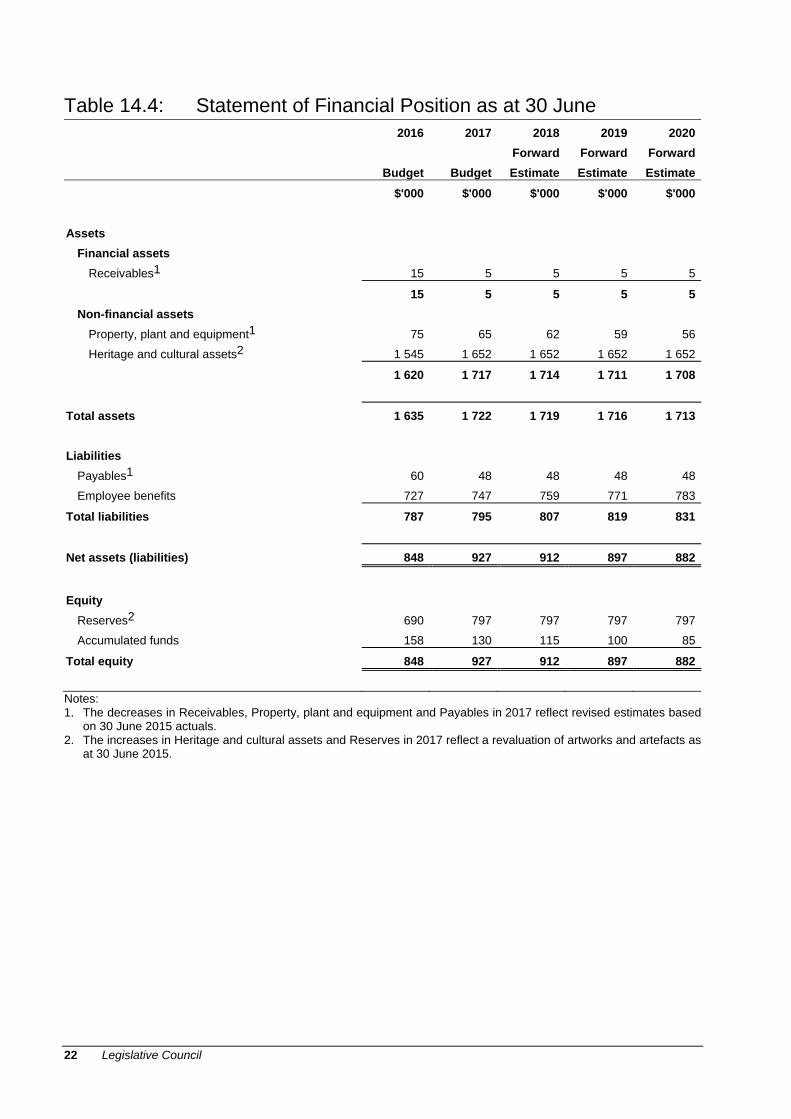
Table 14.4: Statement of Financial Position as at 30 June
2016)
Budget)
2017)
Budget)
2018)
Forward)
Estimate)
2019)
Forward)
Estimate)
2020)
Forward)
Estimate)
$'000) $'000) $'000) $'000) $'000)
Assets
Financial assets
Receivables1 15) 5) 5) 5) 5)
15) 5) 5) 5) 5)
Non-financial assets
Property, plant and equipment1 75) 65) 62) 59) 56)
Heritage and cultural assets2 1 545) 1 652) 1 652) 1 652) 1 652)
1 620) 1 717) 1 714) 1 711) 1 708)
Total assets 1 635) 1 722) 1 719) 1 716) 1 713)
Liabilities
Payables1 60) 48) 48) 48) 48)
Employee benefits 727) 747) 759) 771) 783)
Total liabilities 787) 795) 807) 819) 831)
Net assets (liabilities) 848) 927) 912) 897) 882)
Equity
Reserves2 690) 797) 797) 797) 797)
Accumulated funds 158) 130) 115) 100) 85)
Total equity 848) 927) 912) 897) 882)
Notes: 1. The decreases in Receivables, Property, plant and equipment and Payables in 2017 reflect revised estimates based
on 30 June 2015 actuals. 2. The increases in Heritage and cultural assets and Reserves in 2017 reflect a revaluation of artworks and artefacts as
at 30 June 2015.

Legislative Council 23
Table 14.5: Statement of Cash Flows
2015-16)
Budget)
2016-17)
Budget)
2017-18)
Forward)
Estimate)
2018-19)
Forward)
Estimate)
2019-20)
Forward)
Estimate)
$'000) $'000) $'000) $'000) $'000)
Cash flows from operating activities
Cash inflows
Appropriation receipts - recurrent 6 497) 6 547) 6 684) 6 800) 6 875)
GST receipts 70) 70) 70) 70) 70)
Total cash inflows 6 567) 6 617) 6 754) 6 870) 6 945)
Cash outflows
Employee benefits1,2 (5 499) (5 442) (5 564) (5 662) (5 723)
Superannuation (418) (414) (419) (427) (431)
GST payments (70) (70) (70) (70) (70)
Supplies and consumables1 (580) (691) (701) (711) (721)
Total cash outflows (6 567) (6 617) (6 754) (6 870) (6 945)
Net increase (decrease) in cash and cash
equivalents held ....) ....) ....) ....) ....)
Cash and deposits at the beginning of the
reporting period ....) ....) ....) ....) ....)
Cash and deposits at the end of the reporting
period ....) ....) ....) ....) ....)
Notes: 1. The variations in Employee benefits and Supplies and consumables reflect a reassignment of Reserved by Law
expenditure between Travelling Allowances (Parliamentary Salaries, Superannuation and Allowances Act 2012) and Parliamentary Salaries and Allowances (Parliamentary Salaries, Superannuation and Allowances Act 2012).
2. Growth in salary expenditure has been based on the Government's Wages Policy of 2 per cent per annum across the Budget and Forward Estimates period.


Legislature-General 25
15 LEGISLATURE-GENERAL
AGENCY OUTLINE Legislature-General provides support services to both Houses of Parliament and their Members through the
Joint House support staff, the Parliamentary Reporting Service, the Parliamentary Library Service and the
Parliamentary Printing, Systems and Broadcasting Services.
This chapter provides financial information about the Outputs to be delivered by Legislature-General during
2016-17 and over the Forward Estimates period (2017-18 to 2019-20). Further information about
Legislature-General is provided at www.parliament.tas.gov.au.
KEY DELIVERABLES The key deliverables for Legislature-General include:
supporting both Houses of Parliament and their Members;
providing Parliamentary Reporting Services, with particular attention to the accuracy and timeliness of
Hansard;
providing support to Members of Parliament and the public through the Parliamentary Library Service with
particular attention to the provision of research facilities;
providing Parliamentary Printing, Systems and Broadcasting Services;
continuing support for Joint Committees;
the redevelopment of the security and reception areas in Parliament House, which is considered essential
to ensure the safety of Members and the public; and
supporting the transition to newly developed Committee Rooms and work environments in the
Salamanca Building as part of the Government's commitment to parliament square.

26 Legislature-General
OUTPUT INFORMATION Outputs of Legislature-General are provided under the following Output Groups:
Output Group 1 - Parliamentary Reporting Service;
Output Group 2 - Parliamentary Library Service;
Output Group 3 - Parliamentary Printing and Systems; and
Output Group 4 - Joint Services.
Table 15.1 provides an Output Group Expense Summary for Legislature-General.
Table 15.1: Output Group Expense Summary 2015-16)
Budget)
2016-17)
Budget)
2017-18)
Forward)
Estimate)
2018-19)
Forward)
Estimate)
2019-20)
Forward)
Estimate)
$'000) $'000) $'000) $'000) $'000)
Output Group 1 - Parliamentary Reporting Service
1.1 Production and Printing of Parliamentary Reports 1 019) 1 017) 1 032) 1 051) 1 063)
1 019) 1 017) 1 032) 1 051) 1 063)
Output Group 2 - Parliamentary Library Service
2.1 Parliamentary Library Service 1 039) 1 047) 1 074) 1 095) 1 108)
1 039) 1 047) 1 074) 1 095) 1 108)
Output Group 3 - Parliamentary Printing and
Systems
3.1 Parliamentary Printing 465) 477) 489) 501) 513)
3.2 Parliamentary Systems 764) 776) 794) 812) 827)
1 229) 1 253) 1 283) 1 313) 1 340)
Output Group 4 - Joint Services
4.1 Buildings and Operations Management 2 074) 2 106) 2 145) 2 184) 2 220)
4.2 Joint Management Services 345) 400) 408) 414) 417)
4.3 Services to Members 877) 887) 905) 921) 933)
4.4 Corporate Services for Parliamentary Agencies 109) 109) 109) 109) 109)
3 405) 3 502) 3 567) 3 628) 3 679)
TOTAL 6 692) 6 819) 6 956) 7 087) 7 190)

Legislature-General 27
Output Group 1: Parliamentary Reporting Service
1.1 Production and Printing of Parliamentary Reports
This Output provides for the Parliamentary Reporting Service, which produces an accurate and timely official
record of debates in both Houses of Parliament and of evidence presented to Parliamentary Committees.
Performance Information Comments
Delivery of Hansard
The primary focus for the Hansard operation is to produce a daily transcript for Members as quickly as
possible - certainly by the following day. Part of the transcript is delivered to Members later the same day.
A full week's transcript is available on the Internet (public access) by the end of the following week.
Some of these times will vary when either House sits for extended hours or during an extended period of
several weeks of continuous sitting.
Output Group 2: Parliamentary Library Service
2.1 Parliamentary Library Service
This Output represents the Parliamentary Library Service which provides information and research services
specifically designed to assist Members of Parliament and Parliamentary Committees in performing their
duties. The Parliamentary Library also manages special and historical collections, the Parliamentary Museum
and is the repository for all Tasmanian Parliament publications.
Performance Information Comments
Parliamentary Library
A number of performance measures have been established for the Parliamentary Library Service. These are:
enquiries: perform 95 per cent of enquiries within the clients' deadlines;
newspapers and media releases: upload daily newspaper clippings and press releases to the intranet by
11 am;
media-monitoring: television news available on the Intranet by 9 am daily and audio digital capture
(ABC Radio) available on request;
prepare 95 per cent of media transcription requests within the clients' deadlines;
databases: input 90 per cent of Questions, Answers and Adjournments to the database within one week
of receipt of Hansard; and
input 95 per cent of tabled parliamentary papers within one week of tabling or receipt.

28 Legislature-General
Parliamentary Research Service
The Parliamentary Research Service aims to:
meet 95 per cent of the clients' requests within their deadlines;
update statistics on the Intranet within two days of ABS data arrival; and
complete 95 per cent of background briefings and submission summaries to Parliamentary Committees
prior to the hearing of witnesses.
Output Group 3: Parliamentary Printing and Systems
3.1 Parliamentary Printing
This Output involves the provision of services which meet the printing needs of Parliament, including: the
production of Parliamentary Papers; Votes and Proceedings; Notice Papers and Bills; and the printing
requirements of Members.
3.2 Parliamentary Systems
This Output provides for the maintenance of computerised systems for:
the computer requirements of the Parliamentary Reporting Service;
the computer and communication requirements of Members of both Houses of Parliament including
Regional Offices;
the Parliament website, Intranet, Internet and databases;
the television, broadcasting and archiving of sessions of both Houses of Parliament;
the security of the precinct including access control and CCTV; and
the Parliament's financial management.
Output Group 4: Joint Services
4.1 Buildings and Operations Management
This Output provides for the management of buildings and operations management as well as the provision
of purchasing and maintenance services for the Parliamentary complex, gardens and other offices (including
rentals, security, cleaning and communication services).
4.2 Joint Management Services
This Output provides for services to Legislature-General, including the Joint House Committee and other
functional areas not directly under the control of either House of Parliament.
4.3 Services to Members
This Output provides for services not directly related to the Legislative Council or House of Assembly for
certain Parliamentary Committees and the Leader of the Opposition.

Legislature-General 29
4.4 Corporate Services for Parliamentary Agencies
This Output provides for administrative services to the Clerks of both Houses, including responsibility for all
human resources and financial administration.

30 Legislature-General
DETAILED BUDGET STATEMENTS
Table 15.2: Statement of Comprehensive Income 2015-16)
Budget)
2016-17)
Budget)
2017-18)
Forward)
Estimate)
2018-19)
Forward)
Estimate)
2019-20)
Forward)
Estimate)
$'000) $'000) $'000) $'000) $'000)
Revenue and other income from transactions
Appropriation revenue - recurrent 6 051) 6 091) 6 236) 6 367) 6 470)
Appropriation revenue - works & services1 ....) 880) ....) ....) ....)
Sales of goods and services 172) 172) 172) 172) 172)
Total revenue and other income from transactions 6 223) 7 143) 6 408) 6 539) 6 642)
Expenses from transactions
Employee benefits 3 295) 3 363) 3 439) 3 507) 3 547)
Depreciation and amortisation 588) 588) 588) 588) 588)
Supplies and consumables 2 704) 2 763) 2 824) 2 887) 2 950)
Grants and subsidies 59) 59) 59) 59) 59)
Other expenses 46) 46) 46) 46) 46)
Total expenses from transactions 6 692) 6 819) 6 956) 7 087) 7 190)
Net result from transactions (net operating
balance) (469) 324) (548) (548) (548)
Net result (469) 324) (548) (548) (548)
Comprehensive result (469) 324) (548) (548) (548)
Note: 1. The increase in Appropriation revenue - works & services in 2016-17 reflects additional funding of $880 000 for the
redevelopment of security and reception areas in Parliament House.

Legislature-General 31
Table 15.3: Revenue from Appropriation by Output 2015-16)
Budget)
2016-17)
Budget)
2017-18)
Forward)
Estimate)
2018-19)
Forward)
Estimate)
2019-20)
Forward)
Estimate)
$'000) $'000) $'000) $'000) $'000)
Legislature-General
Output Group 1 - Parliamentary Reporting Service
1.1 Production and Printing of Parliamentary
Reports1 1 095) 1 006) 1 029) 1 048) 1 060)
1 095) 1 006) 1 029) 1 048) 1 060)
Output Group 2 - Parliamentary Library Service
2.1 Parliamentary Library Service 1 037) 1 045) 1 072) 1 093) 1 106)
1 037) 1 045) 1 072) 1 093) 1 106)
Output Group 3 - Parliamentary Printing and
Systems
3.1 Parliamentary Printing 465) 477) 489) 501) 513)
3.2 Parliamentary Systems 764) 776) 794) 812) 827)
1 229) 1 253) 1 283) 1 313) 1 340)
Output Group 4 - Joint Services
4.1 Buildings and Operations Management 1 534) 1 566) 1 605) 1 644) 1 680)
4.2 Joint Management Services 344) 399) 407) 413) 416)
4.3 Services to Members 703) 713) 731) 747) 759)
4.4 Corporate Services for Parliamentary Agencies 109) 109) 109) 109) 109)
2 690) 2 787) 2 852) 2 913) 2 964)
Capital Investment Program2 ....) 880) ....) ....) ....)
Legislature-General
Total Recurrent Services 6 051) 6 091) 6 236) 6 367) 6 470)
Total Works and Services2 ....) 880) ....) ....) ....)
6 051) 6 971) 6 236) 6 367) 6 470)
Total Revenue from Appropriation 6 051) 6 971) 6 236) 6 367) 6 470)
Controlled Revenue from Appropriation 6 051) 6 971) 6 236) 6 367) 6 470)
6 051) 6 971) 6 236) 6 367) 6 470)
Notes: 1. The decrease in Production and Printing of Parliamentary Reports in 2016-17 reflects the cessation of one-off funding
for the 27th pay in 2015-16. 2. The increases in Capital Investment Program and Total Works and Services in 2016-17 reflect additional funding of
$880 000 for the redevelopment of security and reception areas in Parliament House.

32 Legislature-General
Table 15.4: Statement of Financial Position as at 30 June
2016
Budget
2017
Budget
2018
Forward
Estimate
2019
Forward
Estimate
2020
Forward
Estimate
$'000 $'000 $'000 $'000 $'000
Assets
Financial assets
Cash and deposits1 93) 86) 86) 86) 86)
Receivables1 76) 66) 66) 66) 66)
169) 152) 152) 152) 152)
Non-financial assets
Inventories 36) 36) 36) 36) 36)
Property, plant and equipment 34 772) 35 065) 34 527) 33 989) 33 451)
Heritage and cultural assets2 508) 614) 614) 614) 614)
Other assets1 59) 55) 55) 55) 55)
35 375) 35 770) 35 232) 34 694) 34 156)
Total assets 35 544) 35 922) 35 384) 34 846) 34 308)
Liabilities
Payables1 199) 168) 168) 168) 168)
Employee benefits 874) 892) 902) 912) 922)
Other liabilities 16) 16) 16) 16) 16)
Total liabilities 1 089) 1 076) 1 086) 1 096) 1 106)
Net assets (liabilities) 34 455) 34 846) 34 298) 33 750) 33 202)
Equity
Reserves2 26 717) 26 823) 26 823) 26 823) 26 823)
Accumulated funds 7 738) 8 023) 7 475) 6 927) 6 379)
Total equity 34 455) 34 846) 34 298) 33 750) 33 202)
Notes: 1. The decreases in Cash and deposits, Receivables, Other assets and Payables in 2017 reflect revised estimates based
on 30 June 2015 actuals. 2. The increases in Heritage and cultural assets and Reserves in 2017 reflects a revaluation of artworks and artefacts as
at 30 June 2015.

Legislature-General 33
Table 15.5: Statement of Cash Flows 2015-16)
Budget)
2016-17)
Budget)
2017-18)
Forward)
Estimate)
2018-19)
Forward)
Estimate)
2019-20)
Forward)
Estimate)
$'000) $'000) $'000) $'000) $'000)
Cash flows from operating activities
Cash inflows
Appropriation receipts - recurrent 6 051) 6 091) 6 236) 6 367) 6 470)
Appropriation receipts - capital1 ....) 880) ....) ....) ....)
Sales of goods and services 172) 172) 172) 172) 172)
GST receipts 364) 364) 364) 364) 364)
Total cash inflows 6 587) 7 507) 6 772) 6 903) 7 006)
Cash outflows
Employee benefits2 (3 042) (3 020) (3 095) (3 156) (3 193)
Superannuation (322) (325) (334) (341) (344)
GST payments (364) (364) (364) (364) (364)
Grants and subsidies (59) (59) (59) (59) (59)
Supplies and consumables (2 704) (2 763) (2 824) (2 887) (2 950)
Other cash payments (46) (46) (46) (46) (46)
Total cash outflows (6 537) (6 577) (6 722) (6 853) (6 956)
Net cash from (used by) operating activities 50) 930) 50) 50) 50)
Cash flows from investing activities
Payments for acquisition of non-financial assets1 (50) (930) (50) (50) (50)
Net cash from (used by) investing activities (50) (930) (50) (50) (50)
Net increase (decrease) in cash and cash
equivalents held ....) ....) ....) ....) ....)
Cash and deposits at the beginning of the
reporting period 93) 86) 86) 86) 86)
Cash and deposits at the end of the reporting
period 93) 86) 86) 86) 86)
Notes: 1. The increases in Appropriation receipts - capital and Payments for acquisition of non-financial assets in 2016-17
reflects additional funding of $880 000 for the redevelopment of security and reception areas in Parliament House. 2. The decrease in Employee benefits in 2016-17 reflects the cessation of one-off funding for the 27th pay in 2015-16.


Office of the Director of Public Prosecutions 35
16 OFFICE OF THE DIRECTOR
OF PUBLIC PROSECUTIONS
AGENCY OUTLINE The Office of the Director of Public Prosecutions provides criminal law services to the State of Tasmania. The
Director of Public Prosecutions Act 1973 details the role and functions of the Director of Public Prosecutions
(DPP). Specifically, the DPP undertakes:
the conduct of all criminal prosecutions on indictment in the Supreme Court and in Magistrates Courts
where required;
investigations and proceedings for restraint orders, pecuniary penalty orders and unexplained wealth
declarations pursuant to the Crime (Confiscation of Profits) Act 1993;
the representation of government agencies in the prosecution of regulatory offences;
the representation of government agencies in appeals from Magistrates Courts to the Supreme Court;
the conduct of all child protection proceedings under the Children, Young Persons and Their Families
Act 1997 on behalf of the Secretary of the Department of Health and Human Services; and
representation of the Crown in relation to criminal matters, in appeals to the Full Court, Court of Criminal
Appeal and the High Court.
This chapter provides financial information about the Output to be delivered by the Office in 2016-17 and over
the Forward Estimates period (2017-18 to 2019-20). Further information about the Office of the Director of
Public Prosecutions is provided at www.crownlaw.tas.gov.au/dpp.
KEY DELIVERABLES The key deliverables for the Office of the Director of Public Prosecutions include:
contributing to the disruption of serious and organised crime through the enforcement of the Crime
(Confiscation of Profits) Act 1993 and Crime (Confiscation of Profits) Amendment (Unexplained Wealth)
Act 2013 as a joint initiative with the Department of Police, Fire and Emergency Management and the
prosecution of crimes;
undertaking summary prosecution matters on behalf of Work Safe Tasmania, Consumer Building and
Occupational Services, and Transport Compliance, and prosecuting serious matters in the Magistrates
Court as part of a trial with Tasmania Police; and
delivery of continuing professional development.

36 Office of the Director of Public Prosecutions
OUTPUT INFORMATION The individual Output for the Office of the Director of Public Prosecutions is provided under:
Output Group 1 - The Office of the Director of Public Prosecutions.
Table 16.1 provides an Output Group Expense Summary for the Office of the Director of Public Prosecutions.
Table 16.1: Output Group Expense Summary
2015-16)
Budget)
2016-17)
Budget)
2017-18)
Forward)
Estimate)
2018-19)
Forward)
Estimate)
2019-20)
Forward)
Estimate)
$'000) $'000) $'000) $'000) $'000)
Output Group 1 - The Office of the Director of
Public Prosecutions
1.1 The Office of the Director of Public
Prosecutions1 8 566) 7 181) 7 338) 7 484) 7 568)
8 566) 7 181) 7 338) 7 484) 7 568)
TOTAL 8 566) 7 181) 7 338) 7 484) 7 568)
Note: 1. The decrease in expenditure in 2016-17 reflects the transfer of $1.3 million for the Crown's civil litigation functions from
the Office of the Director of Public Prosecutions to the Office of the Solicitor-General within the Department of Justice.
Output Group 1: The Office of the Director of Public Prosecutions
1.1 The Office of the Director of Public Prosecutions
This Output provides criminal law services to the State of Tasmania in accordance with the requirements of
the Director of Public Prosecutions Act.

Office of the Director of Public Prosecutions 37
DETAILED BUDGET STATEMENTS
Table 16.2: Statement of Comprehensive Income
2015-16)
Budget)
2016-17)
Budget)
2017-18)
Forward)
Estimate)
2018-19)
Forward)
Estimate)
2019-20)
Forward)
Estimate)
$'000) $'000) $'000) $'000) $'000)
Revenue and other income from transactions
Appropriation revenue - recurrent1 7 657) 6 393) 6 550) 6 696) 6 787)
Sales of goods and services 722) 700) 700) 700) 700)
Other revenue2 78) ....) ....) ....) ....)
Total revenue and other income from transactions 8 457) 7 093) 7 250) 7 396) 7 487)
Expenses from transactions
Employee benefits1 6 611) 5 678) 5 814) 5 928) 5 987)
Depreciation and amortisation 48) 48) 48) 48) 41)
Supplies and consumables1,2 1 297) 989) 1 000) 1 022) 1 044)
Grants and subsidies 3) 3) 3) 3) 3)
Other expenses1 607) 463) 473) 483) 493)
Total expenses from transactions 8 566) 7 181) 7 338) 7 484) 7 568)
Net result from transactions (net operating
balance) (109) (88) (88) (88) (81)
Net result (109) (88) (88) (88) (81)
Comprehensive result (109) (88) (88) (88) (81)
Notes: 1. The variations in Appropriation revenue - recurrent, Employee benefits, Supplies and consumables and Other
expenses in 2016-17 reflect the transfer of $1.3 million for the Crown's civil litigation functions from the Office of the Director of Public Prosecutions to the Office of the Solicitor-General within the Department of Justice.
2. The decreases in Other revenue and Supplies and consumables in 2016-17 reflect the reclassification of the Confiscation of Profits Account from controlled to a true trust account.

38 Office of the Director of Public Prosecutions
Table 16.3: Statement of Comprehensive Income - Administered
2015-16)
Budget)
2016-17)
Budget)
2017-18)
Forward)
Estimate)
2018-19)
Forward)
Estimate)
2019-20)
Forward)
Estimate)
$'000) $'000) $'000) $'000) $'000)
Revenue and other income from transactions
Other revenue1 375) 500) 500) 500) 500)
Total revenue and other income from transactions 375) 500) 500) 500) 500)
Expenses from transactions
Transfers to the Consolidated Fund1 375) 500) 500) 500) 500)
Total expenses from transactions 375) 500) 500) 500) 500)
Net result from transactions (net operating
balance) ....) ....) ....) ....) ....)
Net result ....) ....) ....) ....) ....)
Comprehensive result ....) ....) ....) ....) ....)
Note: 1. The increases in Other revenue and Transfers to the Consolidated Fund in 2016-17 reflect estimates of revenue that
will result from an increased number of investigations and prosecutions pursuant to the Unexplained Wealth initiative.

Office of the Director of Public Prosecutions 39
Table 16.4: Revenue from Appropriation by Output
2015-16)
Budget)
2016-17)
Budget)
2017-18)
Forward)
Estimate)
2018-19)
Forward)
Estimate)
2019-20)
Forward)
Estimate)
$'000) $'000) $'000) $'000) $'000)
Attorney-General and Minister for Justice
Output Group 1 - The Office of the Director of
Public Prosecutions
1.1 The Office of the Director of Public
Prosecutions1,2 7 056) 5 885) 6 030) 6 166) 6 252)
7 056) 5 885) 6 030) 6 166) 6 252)
Office of the Director of Public Prosecutions
Total Recurrent Services 7 056) 5 885) 6 030) 6 166) 6 252)
7 056) 5 885) 6 030) 6 166) 6 252)
Reserved by Law
Salary, Travel and Other Allowances, Director of
Public Prosecutions (Director of Public
Prosecutions Act 1973)2 601) 508) 520) 530) 535)
601) 508) 520) 530) 535)
Total Revenue from Appropriation 7 657) 6 393) 6 550) 6 696) 6 787)
Controlled Revenue from Appropriation 7 657) 6 393) 6 550) 6 696) 6 787)
7 657) 6 393) 6 550) 6 696) 6 787)
Notes: 1. The decrease in the Office of the Director of Public Prosecutions in 2016-17 reflects the transfer of $1.3 million for the
Crown's civil litigation functions from the Office of the Director of Public Prosecutions to the Office of the Solicitor-General within the Department of Justice.
2. Variations include the impact of a Budget neutral reallocation of $112 000 in 2016-17 between Reserved by Law and general Consolidated Fund funding. Further information on this change is provided in chapter 1 of this Budget Paper.

40 Office of the Director of Public Prosecutions
Table 16.5: Statement of Financial Position as at 30 June
2016)
Budget)
2017)
Budget)
2018)
Forward)
Estimate)
2019)
Forward)
Estimate)
2020)
Forward)
Estimate)
$'000) $'000) $'000) $'000) $'000)
Assets
Financial assets
Cash and deposits1 625) 777) 777) 777) 777)
Receivables 5) 11) 11) 11) 11)
630) 788) 788) 788) 788)
Non-financial assets
Property, plant and equipment 49) 35) 21) 7) ....)
Intangibles2 39) ....) ....) ....) ....)
Other assets 318) 280) 246) 212) 178)
406) 315) 267) 219) 178)
Total assets 1 036) 1 103) 1 055) 1 007) 966)
Liabilities
Payables3 76) 16) 16) 16) 16)
Employee benefits 1 874) 1 406) 1 446) 1 486) 1 526)
Total liabilities 1 950) 1 422) 1 462) 1 502) 1 542)
Net assets (liabilities) (914) (319) (407) (495) (576)
Equity
Accumulated funds (914) (319) (407) (495) (576)
Total equity (914) (319) (407) (495) (576)
Notes: 1. The increase in Cash and deposits in 2017 reflects revised estimates based on 30 June 2015 actuals. 2. The decrease in Intangibles in 2017 reflects the completion of the development of the new case management system
to be used by both the Office of the Director of Public Prosecutions and the Department of Justice, but managed by the Department of Justice. The system was categorised as an Intangible asset (work in progress) by the Office during the development stage. As the system is now functional the Intangible asset has been fully amortised.
3. The decrease in Payables in 2017 reflects an opening balance adjustment of $59 000 for GST Tax Payable.

Office of the Director of Public Prosecutions 41
Table 16.6: Statement of Cash Flows
2015-16)
Budget)
2016-17)
Budget)
2017-18)
Forward)
Estimate)
2018-19)
Forward)
Estimate)
2019-20)
Forward)
Estimate)
$'000) $'000) $'000) $'000) $'000)
Cash flows from operating activities
Cash inflows
Appropriation receipts - recurrent1 7 657) 6 393) 6 550) 6 696) 6 787)
Sales of goods and services 700) 700) 700) 700) 700)
Other cash receipts2 100) ....) ....) ....) ....)
Total cash inflows 8 457) 7 093) 7 250) 7 396) 7 487)
Cash outflows
Employee benefits1 (6 010) (5 069) (5 193) (5 298) (5 351)
Superannuation1 (690) (569) (581) (590) (596)
Grants and subsidies (3) (3) (3) (3) (3)
Supplies and consumables1,2 (1 297) (989) (1 000) (1 022) (1 044)
Other cash payments1 (607) (463) (473) (483) (493)
Total cash outflows (8 607) (7 093) (7 250) (7 396) (7 487)
Net cash from (used by) operating activities (150) ....) ....) ....) ....)
Net increase (decrease) in cash and cash
equivalents held (150) ....) ....) ....) ....)
Cash and deposits at the beginning of the
reporting period 775) 777) 777) 777) 777)
Cash and deposits at the end of the reporting
period 625) 777) 777) 777) 777)
Notes: 1. The variations in Appropriation receipts - recurrent, Employee benefits, Superannuation, Supplies and consumables
and Other cash payments in 2016-17 reflect the transfer of $1.3 million for the Crown's civil litigation functions from the Office of the Director of Public Prosecutions to the Office of the Solicitor-General within the Department of Justice.
2. The decreases in Other cash receipts and Supplies and consumables in 2016-17 reflect the reclassification of the Confiscation of Profits Account from controlled to a true trust account.

42 Office of the Director of Public Prosecutions
Table 16.7: Statement of Cash Flows - Administered
2015-16)
Budget)
2016-17)
Budget)
2017-18)
Forward)
Estimate)
2018-19)
Forward)
Estimate)
2019-20)
Forward)
Estimate)
$'000) $'000) $'000) $'000) $'000)
Cash flows from operating activities
Cash inflows
Other cash receipts1 375) 500) 500) 500) 500)
Total cash inflows 375) 500) 500) 500) 500)
Cash outflows
Transfers to the Consolidated Fund1 (375) (500) (500) (500) (500)
Total cash outflows (375) (500) (500) (500) (500)
Net increase (decrease) in cash and cash
equivalents held ....) ....) ....) ....) ....)
Cash and deposits at the beginning of the
reporting period ....) ....) ....) ....) ....)
Cash and deposits at the end of the reporting
period ....) ....) ....) ....) ....)
Note: 1. The increases in Other cash receipts and Transfers to the Consolidated Fund in 2016-17 reflect estimates of revenue
that will result from an increased number of investigations and prosecutions pursuant to the Unexplained Wealth initiative.

Office of the Governor 43
17 OFFICE OF THE
GOVERNOR
AGENCY OUTLINE The Office of the Governor supports the Governor in the performance of her constitutional, administrative,
ceremonial, and community responsibilities by:
providing a high standard of policy advice and administrative support, including the organisation of
constitutional and ceremonial duties, and a program of community engagements;
facilitating the efficient and effective interaction between the Office of the Governor, the Parliament, the
Executive and the State Service; and
maintaining the Government House estate.
The Office is focused on achieving, or assisting to achieve, the following major outcomes:
safeguarding the integrity of the State's democratic system of government;
promoting community involvement in government and understanding of the democratic process;
promoting community understanding of the role of the Governor;
fostering activities in rural areas through speeches, visits, functions and other events;
encouraging the involvement of young people in the community;
supporting activities which promote a multicultural, diverse and tolerant society;
stimulating culture and the arts;
promoting the State's exports and its tourism industry; and
protecting and maintaining the heritage values of Government House and its grounds.
This chapter provides financial information for the Office of the Governor for 2016-17 and the Forward
Estimates period (2017-18 to 2019-20). Further information on the Office is provided at
www.govhouse.tas.gov.au.

44 Office of the Governor
KEY DELIVERABLES The key deliverables for the Office of the Governor include:
continuing support of the Governor's program of activities, with particular attention to the promotion of the
State of Tasmania;
preparing programs that bring a wide range of people to events at Government House;
preparing programs that promote a wide understanding of the activities and role of the Governor and the
Office of the Governor; and
reviewing asset management, maintenance and restoration plans for the Government House estate.
OUTPUT INFORMATION The individual Output of the Office of the Governor is provided under:
Output Group 1 - The Office of the Governor.
Table 17.1 provides an Output Group Expense Summary for the Office of the Governor.
Table 17.1: Output Group Expense Summary 2015-16)
Budget)
2016-17)
Budget)
2017-18)
Forward)
Estimate)
2018-19)
Forward)
Estimate)
2019-20)
Forward)
Estimate)
$'000) $'000) $'000) $'000) $'000)
Output Group 1 - The Office of the Governor
1.1 Support for the Governor1 3 862) 4 305) 4 192) 4 263) 4 308)
3 862) 4 305) 4 192) 4 263) 4 308)
TOTAL 3 862) 4 305) 4 192) 4 263) 4 308)
Note: 1. The increase in Support for the Governor reflects the provision of additional funding of $210 000 per annum for
salaries and wages to support the additional costs of the transition to the Tasmanian State Service Award salary structure in 2013 and $200 000 for essential estate maintenance in 2016-17.

Office of the Governor 45
Output Group 1: The Office of the Governor
1.1 Support for the Governor
This Output facilitates the efficient and effective interaction between the Office of the Governor, the
Parliament, the Executive, the State Service and the Tasmanian community. This Output also facilitates
cooperation between all arms of government and the community to promote the State of Tasmania to a
widening range of international guests and other visitors to the State.
Performance Information Comments
The Office will successfully perform this Output by:
meeting the expectations of the Governor in assisting her to meet her constitutional and legal
responsibilities;
meeting the expectations of the Governor and her spouse in the organisation of their official program and
the administration of the household; and
maintaining the Government House estate to a high standard.

46 Office of the Governor
DETAILED BUDGET STATEMENTS
Table 17.2: Statement of Comprehensive Income 2015-16)
Budget)
2016-17)
Budget)
2017-18)
Forward)
Estimate)
2018-19)
Forward)
Estimate)
2019-20)
Forward)
Estimate)
$'000) $'000) $'000) $'000) $'000)
Revenue and other income from transactions
Appropriation revenue - recurrent1 3 547) 3 990) 3 877) 3 956) 4 001)
Sales of goods and services2 ....) 55) 55) 55) 55)
Total revenue and other income from transactions 3 547) 4 045) 3 932) 4 011) 4 056)
Expenses from transactions
Employee benefits3 2 701) 3 044) 3 117) 3 176) 3 207)
Depreciation and amortisation 298) 298) 298) 298) 298)
Supplies and consumables4 832) 932) 746) 758) 772)
Other expenses 31) 31) 31) 31) 31)
Total expenses from transactions 3 862) 4 305) 4 192) 4 263) 4 308)
Net result from transactions (net operating
balance) (315) (260) (260) (252) (252)
Net result (315) (260) (260) (252) (252)
Other economic flows - other changes in equity
Changes in physical asset revaluation reserve 300) 300) 300) 300) 300)
Total other economic flows - other changes in
equity 300) 300) 300) 300) 300)
Comprehensive result (15) 40) 40) 48) 48)
Notes: 1. The increase in Appropriation revenue - recurrent reflects the provision of additional funding of $210 000 per annum
for salaries and wages to support the additional costs of the transition to the Tasmanian State Service Award salary structure in 2013 and $200 000 for essential estate maintenance in 2016-17.
2. The increase in Sales of goods and services in 2016-17 reflects income of $55 000 from the rental of cottages located at Government House.
3. The increase in Employee benefits reflects the provision of additional funding of $210 000 per annum for salaries and wages to support the additional costs of the transition to the Tasmanian State Service Award salary structure in 2013.
4. The increase in Supplies and consumables in 2016-17 reflects additional funding of $200 000 for essential estate maintenance.

Office of the Governor 47
Table 17.3: Revenue from Appropriation by Output 2015-16)
Budget)
2016-17)
Budget)
2017-18)
Forward)
Estimate)
2018-19)
Forward)
Estimate)
2019-20)
Forward)
Estimate)
$'000) $'000) $'000) $'000) $'000)
Premier
Output Group 1 - The Office of the Governor
1.1 Support for the Governor1,2 2 926) 3 433) 3 300) 3 359) 3 404)
2 926) 3 433) 3 300) 3 359) 3 404)
Office of the Governor
Total Recurrent Services 2 926) 3 433) 3 300) 3 359) 3 404)
2 926) 3 433) 3 300) 3 359) 3 404)
Reserved by Law
Salary, Her Excellency the Governor (Governor of
Tasmania Act 1982)2 611) 542) 562) 582) 582)
Salary, The Administrator (Governor of Tasmania Act
1982, Section 5(1)) 10) 15) 15) 15) 15)
621) 557) 577) 597) 597)
Total Revenue from Appropriation 3 547) 3 990) 3 877) 3 956) 4 001)
Controlled Revenue from Appropriation 3 547) 3 990) 3 877) 3 956) 4 001)
3 547) 3 990) 3 877) 3 956) 4 001)
Notes: 1. The increase in Support for the Governor reflects the provision of additional funding of $210 000 per annum for
salaries and wages to support the additional costs of the transition to the Tasmanian State Service Award salary structure in 2013 and $200 000 for essential estate maintenance in 2016-17.
2. Variations include the impact of a Budget neutral reallocation of $98 000 between Reserved by Law and general Consolidated Fund funding. Further information on this change is provided in chapter 1 of this Budget Paper.

48 Office of the Governor
Table 17.4: Statement of Financial Position as at 30 June
2016)
Budget)
2017)
Budget)
2018)
Forward)
Estimate)
2019)
Forward)
Estimate)
2020)
Forward)
Estimate)
$'000) $'000) $'000) $'000) $'000)
Assets
Financial assets
Cash and deposits1 (14) 185) 240) 295) 350)
Receivables 12) 7) 7) 7) 7)
(2) 192) 247) 302) 357)
Non-financial assets
Property, plant and equipment2 37 497) 37 364) 37 366) 37 368) 37 370)
Heritage and cultural assets2 3 563) 3 586) 3 586) 3 586) 3 586)
Other assets 4) 4) 5) 6) 7)
41 064) 40 954) 40 957) 40 960) 40 963)
Total assets 41 062) 41 146) 41 204) 41 262) 41 320)
Liabilities
Payables 84) 99) 101) 103) 105)
Employee benefits2 576) 505) 521) 529) 537)
Total liabilities 660) 604) 622) 632) 642)
Net assets (liabilities) 40 402) 40 542) 40 582) 40 630) 40 678)
Equity
Reserves 29 487) 29 797) 30 097) 30 397) 30 697)
Accumulated funds 10 915) 10 745) 10 485) 10 233) 9 981)
Total equity 40 402) 40 542) 40 582) 40 630) 40 678)
Notes: 1. The increase in Cash and deposits in 2017 primarily reflects income from the rental of cottages located at
Government House estate ($55 000 per annum) and the sale of a motor vehicle ($75 000). The negative balance in 2016 reflects the timing of GST payments and receipts.
2. The variation in Property, plant and equipment, Heritage and cultural assets, and Employee benefits in 2017 reflects revised estimates based on 30 June 2015 actuals.

Office of the Governor 49
Table 17.5: Statement of Cash Flows 2015-16)
Budget)
2016-17)
Budget)
2017-18)
Forward)
Estimate)
2018-19)
Forward)
Estimate)
2019-20)
Forward)
Estimate)
$'000) $'000) $'000) $'000) $'000)
Cash flows from operating activities
Cash inflows
Appropriation receipts - recurrent1 3 547) 3 990) 3 877) 3 956) 4 001)
Sales of goods and services2 ....) 55) 55) 55) 55)
GST receipts 60) 60) 60) 60) 60)
Total cash inflows 3 607) 4 105) 3 992) 4 071) 4 116)
Cash outflows
Employee benefits3 (2 431) (2 787) (2 854) (2 911) (2 939)
Superannuation4 (254) (241) (247) (257) (260)
GST payments (60) (60) (60) (60) (60)
Supplies and consumables5 (831) (931) (745) (757) (771)
Other cash payments (31) (31) (31) (31) (31)
Total cash outflows (3 607) (4 050) (3 937) (4 016) (4 061)
Net cash from (used by) operating activities ....) 55) 55) 55) 55)
Net increase (decrease) in cash and cash
equivalents held ....) 55) 55) 55) 55)
Cash and deposits at the beginning of the
reporting period (14) 130) 185) 240) 295)
Cash and deposits at the end of the reporting
period (14) 185) 240) 295) 350)
Notes: 1. The increase in Appropriation receipts - recurrent reflects the provision of additional funding of $210 000 per annum
for salaries and wages to support the additional costs of the transition to the Tasmanian State Service Award salary structure in 2013 and $200 000 for essential estate maintenance in 2016-17.
2. The increase in Sales of goods and services in 2016-17 primarily reflects income of $55 000 from the rental of cottages located at Government House.
3. The increase in Employee benefits reflects the provision of additional funding of $210 000 per annum for salaries and wages to support the additional costs of the transition to the Tasmanian State Service Award salary structure in 2013.
4. The decrease in Superannuation in 2016-17 reflects revised estimates based on 30 June 2015 actuals. 5. The increase in Supplies and consumables in 2016-17 reflects the provision of additional funding of $200 000 for
essential estate maintenance.


Office of the Ombudsman 51
18 OFFICE OF THE
OMBUDSMAN
AGENCY OUTLINE The Office of the Ombudsman operates under the Ombudsman Act 1978 and is responsible for enquiry and
investigation into complaints regarding the administrative actions of Tasmanian government agencies,
local councils and a range of other public authorities. The Ombudsman seeks to resolve individual grievances
and address systemic issues arising from administrative matters in the public sector. Through independent,
objective and impartial investigations, the Ombudsman promotes fairness and equity and aims to bring about
improvements in the quality and standard of public administration.
The Ombudsman also has a number of other responsibilities, including being the Health Complaints
Commissioner under the Health Complaints Act 1995, the Energy Ombudsman under the
Energy Ombudsman Act 1998 and providing administrative support for the Mental Health and Prison Official
Visitor Schemes. The Ombudsman is appointed as the Coordinator of the Official Visitors Scheme
(Corrections Act 1997) and is the Principal Official Visitor (Mental Health Act 2013).
The Ombudsman also undertakes additional responsibilities implementing the Right to Information Act 2009,
the Personal Information Protection Act 2004, the Public Interest Disclosures Act 2002 and investigating
complaints, as well as holding an ex officio position on the Board of the Integrity Commission under the
Integrity Commission Act 2009.
This chapter provides financial information about the Output to be delivered by the Office in 2016-17 and the
Forward Estimates period (2017-18 to 2019-20). Further information about the Office of the Ombudsman is
provided at www.ombudsman.tas.gov.au.
KEY DELIVERABLES The key deliverables for the Office of the Ombudsman include:
implementing the next phase of the Tasmanian Custodial Inspectorate project;
recruiting Official Visitors to maintain efficiencies of service delivery in both the Mental Health Official Visitor
and Prison Official Visitor programs;
continuing to work to minimise the number of cases in the Office which are older than one year;
continuing to work at maximising the percentage of health complaints assessed within 45 and 90 days of
receipt;
developing systems and processes for the more effective and timely resolution of complaints under the
Ombudsman Act, Health Complaints Act and requests under the Right to Information Act; and
working to provide high quality training in relation to the administration of the Right to Information Act.

52 Office of the Ombudsman
In 2015-16, the Ombudsman was allocated one-off funding of $150 000 to conduct an investigation into the
establishment of the Tasmanian Custodial Inspector. This phase of the project has been completed and
legislation is currently being progressed to establish the Office of the Tasmanian Custodial Inspector, which
will provide independent oversight of prison operations in Tasmania. Additional ongoing funding of $140 000
per annum has been provided from 2016-17 for operational costs associated with the Tasmanian Custodial
Inspector.
OUTPUT INFORMATION The individual Output of the Office of the Ombudsman is provided under:
Output Group 1 - The Office of the Ombudsman.
Table 18.1 provides an Output Group Expense Summary for the Office of the Ombudsman.
Table 18.1: Output Group Expense Summary
2015-16)
Budget)
2016-17)
Budget)
2017-18)
Forward)
Estimate)
2018-19)
Forward)
Estimate)
2019-20)
Forward)
Estimate)
$'000) $'000) $'000) $'000) $'000)
Output Group 1 - The Office of the Ombudsman
1.1 Decisions on Complaints Referred to the
Ombudsman and Health Complaints
Commissioner and Right to Information1 2 880) 2 660) 2 702) 2 738) 2 764)
2 880) 2 660) 2 702) 2 738) 2 764)
TOTAL 2 880) 2 660) 2 702) 2 738) 2 764)
Note: 1. The Office of the Ombudsman has implemented strategies to reduce administrative costs associated with the
performance of its Energy Ombudsman activities. The benefit of these lower costs has been passed on to Energy Entities in the form of lower fees and charges.
Output Group 1: The Office of the Ombudsman
1.1 Decisions on Complaints Referred to the Ombudsman and Health Complaints Commissioner and Right to Information
This Output provides for the independent and impartial resolution of complaints and the investigation of
systemic issues relating to public administration, health care and energy services.

Office of the Ombudsman 53
Table 18.2: Performance Information - Output Group 1
Performance Measure
Unit of
Measure
2013-14
Actual
2014-15
Actual
2015-16
Target
2016-17
Target
Enquiries Finalised - Ombudsman, Health
Complaints and Energy Ombudsman1 Number 1 300 1 338 1 620 1 700
Complaints Finalised - Ombudsman, Health
Complaints and Energy Ombudsman1 Number 1 583 1 266 1 620 1 700
Average Cost per Resolved Case -
Ombudsman, Health Complaints and Energy
Ombudsman2,3 $ 941 1 016 782 659
Cases Finalised per FTE4 Number 164 160 229 240
Complaints to Ombudsman, Health Complaints
and Energy Ombudsman Resolved in Less
Than Three Months5 % 84 70 85 85
Health Complaints Assessed Within Statutory
Period of 45 days6 % 52 57 50 50
Health Complaints Assessed Within the
Extended Statutory Period of 90 days6 % 80 82 80 80
Health Complaints - Early resolution under
Section 25A of the Act % 11 14 10 10
Notes: 1. The Office expects the number of enquires and complaints finalised to increase by approximately five per cent in
2016-17. 2. 'Case' includes both enquiries and complaints managed by the Office. 3. The decrease in expected Average Cost per Resolved Case in 2015-16 reflects a decrease in the number of enquiries
and complaints forecast in 2015-16. 4. The increase in expected Cases Finalised per FTE in 2015-16 reflects a lower number of FTEs in 2015-16 than
2014-15 and an increase in expected cases to be finalised in 2015-16. 5. The decrease in actual Complaints to the Ombudsman, Health Complaints and Energy Ombudsman Resolved in Less
Than Three Months in 2014-15 reflects a reduction in staffing levels for Health Complaints in 2014-15. 6. This period includes time waiting for responses from health providers and the Australian Health Practitioner Regulation
Agency.

54 Office of the Ombudsman
DETAILED BUDGET STATEMENTS
Table 18.3: Statement of Comprehensive Income
2015-16)
Budget)
2016-17)
Budget)
2017-18)
Forward)
Estimate)
2018-19)
Forward)
Estimate)
2019-20)
Forward)
Estimate)
$'000) $'000) $'000) $'000) $'000)
Revenue and other income from transactions
Appropriation revenue - recurrent1 2 149) 2 109) 2 151) 2 187) 2 213)
Other revenue from government 61) ....) ....) ....) ....)
Other revenue2 671) 511) 511) 511) 511)
Total revenue and other income from transactions 2 881) 2 620) 2 662) 2 698) 2 724)
Expenses from transactions
Employee benefits2 2 208) 2 011) 2 047) 2 078) 2 099)
Depreciation and amortisation3 10) 1) 1) 1) 1)
Supplies and consumables 579) 563) 567) 570) 573)
Other expenses 83) 85) 87) 89) 91)
Total expenses from transactions 2 880) 2 660) 2 702) 2 738) 2 764)
Net result from transactions (net operating
balance) 1) (40) (40) (40) (40)
Net result 1) (40) (40) (40) (40)
Comprehensive result 1) (40) (40) (40) (40)
Notes: 1. The decrease in Appropriation revenue - recurrent in 2016-17 primarily reflects one-off funding for the 27th pay in
2015-16. 2. The decreases in Other revenue and Employee benefits in 2016-17 reflect the implementation of strategies to reduce
administrative costs associated with the performance of the Office of the Ombudsman's Energy Ombudsman activities. The benefit of these lower costs has been passed on to Energy Entities in the form of lower fees and charges.
3. The decrease in Depreciation and amortisation in 2016-17 reflects revised estimates based on 30 June 2015 actuals.

Office of the Ombudsman 55
Table 18.4: Revenue from Appropriation by Output
2015-16)
Budget)
2016-17)
Budget)
2017-18)
Forward)
Estimate)
2018-19)
Forward)
Estimate)
2019-20)
Forward)
Estimate)
$'000) $'000) $'000) $'000) $'000)
Attorney-General and Minister for Justice
Output Group 1 - The Office of the Ombudsman
1.1 Decisions on Complaints Referred to the
Ombudsman and Health Complaints
Commissioner and Right to Information1 2 149) 2 109) 2 151) 2 187) 2 213)
2 149) 2 109) 2 151) 2 187) 2 213)
Office of the Ombudsman
Total Recurrent Services 2 149) 2 109) 2 151) 2 187) 2 213)
2 149) 2 109) 2 151) 2 187) 2 213)
Appropriation Carried Forward 61) ....) ....) ....) ....)
Total Revenue from Appropriation 2 210) 2 109) 2 151) 2 187) 2 213)
Controlled Revenue from Appropriation 2 210) 2 109) 2 151) 2 187) 2 213)
2 210) 2 109) 2 151) 2 187) 2 213)
Note: 1. The decrease in the Office of the Ombudsman in 2016-17 reflects the implementation of strategies to reduce
administrative costs associated with the performance of the Office of the Ombudsman's Energy Ombudsman activities. The benefit of these lower costs has been passed on to Energy Entities in the form of lower fees and charges.

56 Office of the Ombudsman
Table 18.5: Statement of Financial Position as at 30 June
2016)
Budget)
2017)
Budget)
2018)
Forward)
Estimate)
2019)
Forward)
Estimate)
2020)
Forward)
Estimate)
$'000) $'000) $'000) $'000) $'000)
Assets
Financial assets
Cash and deposits1 256) 362) 340) 318) 296)
Receivables 1) 4) 4) 4) 4)
257) 366) 344) 322) 300)
Non-financial assets
Property, plant and equipment1 32) ....) ....) ....) ....)
Intangibles1 18) 3) 2) 1) ....)
Other assets2 ....) 443) 443) 443) 443)
50) 446) 445) 444) 443)
Total assets 307) 812) 789) 766) 743)
Liabilities
Payables 2) 10) 10) 10) 10)
Employee benefits 344) 387) 404) 421) 438)
Total liabilities 346) 397) 414) 431) 448)
Net assets (liabilities) (39) 415) 375) 335) 295)
Equity
Accumulated funds (39) 415) 375) 335) 295)
Total equity (39) 415) 375) 335) 295)
Notes: 1. The variations in Cash and deposits, Property, plant and equipment and Intangibles in 2017 reflect revised estimates
based on 30 June 2015 actuals. 2. The increase in Other assets in 2017 predominantly reflects the fit-out of the Office of the Ombudsman's new premises
at Level 6, 86 Collins Street (NAB House), valued at $400 000.

Office of the Ombudsman 57
Table 18.6: Statement of Cash Flows
2015-16)
Budget)
2016-17)
Budget)
2017-18)
Forward)
Estimate)
2018-19)
Forward)
Estimate)
2019-20)
Forward)
Estimate)
$'000) $'000) $'000) $'000) $'000)
Cash flows from operating activities
Cash inflows
Appropriation receipts - recurrent1 2 149) 2 109) 2 151) 2 187) 2 213)
Other cash receipts2 671) 511) 511) 511) 511)
Total cash inflows 2 820) 2 620) 2 662) 2 698) 2 724)
Cash outflows
Employee benefits2 (2 002) (1 787) (1 820) (1 850) (1 870)
Superannuation2 (238) (207) (210) (211) (212)
Supplies and consumables (579) (563) (567) (570) (573)
Other cash payments (83) (85) (87) (89) (91)
Total cash outflows (2 902) (2 642) (2 684) (2 720) (2 746)
Net cash from (used by) operating activities (82) (22) (22) (22) (22)
Net increase (decrease) in cash and cash
equivalents held (82) (22) (22) (22) (22)
Cash and deposits at the beginning of the
reporting period 338) 384) 362) 340) 318)
Cash and deposits at the end of the reporting
period 256) 362) 340) 318) 296)
Notes: 1. The decrease in Appropriation receipts - recurrent in 2016-17 primarily reflects one-off funding for the 27th pay in
2015-16. 2. The decreases in Other cash receipts, Employee benefits and Superannuation in 2016-17 reflect the implementation
of strategies to reduce administrative costs associated with the performance of the Office of the Ombudsman's Energy Ombudsman activities. The benefit of these lower costs has been passed on to Energy Entities in the form of lower fees and charges.


Tasmanian Audit Office 59
19 TASMANIAN AUDIT OFFICE
AGENCY OUTLINE The Tasmanian Audit Office (the Office) assists the Auditor-General provide an independent view of the
financial and operational performance of State entities. The Audit Act 2008 sets out the Auditor-General's
functions, mandate and powers.
The Office's mandate is explicit in identifying its primary client as the Parliament. The Office will continue to
satisfy Parliament's requirements by engaging with the Public Accounts Committee and individual Members,
and by producing relevant reports aimed at providing independent assurance to the Parliament and
community on the performance and accountability of the Tasmanian Public Sector.
It is the independence of the Auditor-General and the Office, and the quality and objectivity of their work,
that underpins its reputation.
The Office satisfies its mandate by:
conducting audits of financial statements of State entities and issuing audit reports outlining their
compliance with relevant accounting standards and legislation;
providing an audit report on the Total State, General Government Sector and Public Account Statements,
which forms part of the Treasurer's Annual Financial Report;
issuing audit reports and other formal communications of audit findings to State entities, responsible
Ministers and relevant accountable authorities;
conducting audits of efficiency, effectiveness and economy of a State entity, a number of State entities, a
part of a State entity or a subsidiary of a State entity;
examining or investigating any matter relating to the accounts of the Treasurer, a State entity or a
subsidiary of a State entity;
examining or investigating any matter relating to public money, other money, or to public property or
other property;
conducting compliance audits to examine compliance by a State entity, or a subsidiary of a State entity,
with written laws or its own internal policies;
carrying out audits of employer functions outlined in the State Service Act 2000; and
managing its own activities efficiently and effectively.
The results of all audits conducted by the Auditor-General are reported to Parliament for its consideration.
This chapter provides financial information about the Output to be delivered by the Office during 2016-17
and over the Forward Estimates period (2017-18 to 2019-20). Further information about the Office is
provided at www.audit.tas.gov.au.

60 Tasmanian Audit Office
KEY DELIVERABLES The key deliverables for the Office include:
continuous improvement to financial audit processes and engagement with State entities to ensure
financial statements, and audit reports thereon, are issued in a timely manner and in accordance with the
requirements of the Audit Act. This will include upgrading the final audit methodology and associated
tools in order to further enhance the audit process;
ongoing development and improvement of Statutory Reports to Parliament on outcomes of financial
audits through the enhancement of reported information, report style and readability, financial analysis
and more informed commentary;
ongoing development of a forward program of probity, performance and compliance audits for inclusion
in annual plans of work;
development of a five-year forward strategic plan 2016-2020;
responding to new and revised accounting and auditing standards and contributing to their development
at the Exposure Draft stages;
facilitating the Fiji Twinning arrangement between the Office and the Office of the Auditor-General of Fiji
with funding provided by the Department of Foreign Affairs and Trade;
finalising the implementation of recommendations arising from an independent review of the Office
pursuant to section 44 of the Audit Act; and
continuing to undertake functions around the State Service Act as follows:
investigations referred by the Employer under the State Service Act which the Auditor-General agrees
to conduct; and
own-motion investigations, audits or reviews initiated by the Auditor-General.

Tasmanian Audit Office 61
OUTPUT INFORMATION The Office's individual Output is provided under:
Output Group 1 - Public Sector Management and Accountability.
Table 19.1 provides an Output Group Expense Summary for the Office.
Table 19.1: Output Group Expense Summary 2015-16)
Budget)
2016-17)
Budget)
2017-18)
Forward)
Estimate)
2018-19)
Forward)
Estimate)
2019-20)
Forward)
Estimate)
$'000) $'000) $'000) $'000) $'000)
Output Group 1 - Public Sector Management and
Accountability
1.1 Public Sector Management and Accountability1 7 733) 8 191) 8 186) 8 250) 8 317)
7 733) 8 191) 8 186) 8 250) 8 317)
TOTAL 7 733) 8 191) 8 186) 8 250) 8 317)
Note: 1. The increase in Public Sector Management and Accountability in 2016-17 reflects revised estimates based on
30 June 2015 actuals.
Output Group 1: Public Sector Management and Accountability
1.1 Public Sector Management and Accountability
This Output Group enables the Office to provide independent assurance to the Parliament and community
on the performance and accountability of the Tasmanian Public Sector. The services the Office must deliver
to enable achievement of this Outcome are:
Audit Assurance - independent assurance of Tasmanian public sector financial reporting, administration,
control and accountability; and
Parliamentary Reports and Services - independent assessment of the performance of selected State
entity activities, including scope for improving economy, efficiency, effectiveness and compliance.

62 Tasmanian Audit Office
Table 19.2 provides details of the performance measures to be applied in assessing the Office's
effectiveness and efficiency in achieving its outcomes.
Table 19.2: Performance Information - Output Group 1
Unit of
Measure
2013-14
Actual
2014-15
Actual
2015-16
Target
2016-17
Target
Audit Assurance
All financial audit opinions to be issued within 45 days of
receipt of final signed financial statements1 % 96 92 100 100
Overall client satisfaction survey - Financial Audit2 % nm 80 nm 75
Parliamentary Reports and Services
Parliamentarian general satisfaction index2,3 % nm 97 nm 75
Overall client satisfaction survey - Performance Audit2 % nm 69 nm 75
Number of Performance Audit reports tabled4 Number 7 6 7 7
Number of Statutory Reports on outcomes of financial
audits Number 1 1 1 1
Average number of months Performance Audits are
completed within5
Average
Months 9.0 10.0 9.0 9.0
Recommendations agreed and acted upon from
performance audits % nm 64 70 70
Number of 'employer' Performance Audits completed Number 1 1 1 1
Office-wide Efficiency Indicators
Total audit costs per $'000 of public sector transactions $ 0.4 0.4 0.4 0.4
Total audit costs per $'000 of public sector assets $ 0.2 0.2 0.2 0.2
Percentage of total (whole of office) paid hours charged
to audit activities6 % 50
48
55 55
nm = not measured
Notes: 1. Financial statement audits are completed on a cyclical basis. Audits of financial statements at 30 June 2015 were
completed in 2015-16. 2. The Satisfaction Indexes are calculated when the biennial Parliamentarian and Client Surveys are conducted. 3. The 2016-17 target represents the Australasian benchmark as used by Audit Offices in other jurisdictions. 4. The number of reports tabled includes compliance audits and investigations where applicable. The decrease by one
report in 2014-15 was due to staff absences and one staff departure. 5. The length of time taken to table performance reports for 2014-15 was 10 months. This was mainly due to the
complexity in scoping of one of the reports. 6. The percentage decrease in 2014-15 reflects the extra time taken to implement the upgrade of new audit
methodology (IPSAM 4). This required an increase in training hours for all financial audit services staff.

Tasmanian Audit Office 63
DETAILED BUDGET STATEMENTS
Table 19.3: Statement of Comprehensive Income
2015-16)
Budget)
2016-17)
Budget)
2017-18)
Forward)
Estimate)
2018-19)
Forward)
Estimate)
2019-20)
Forward)
Estimate)
$'000) $'000) $'000) $'000) $'000)
Revenue and other income from transactions
Appropriation revenue - recurrent1 2 347) 2 313) 2 350) 2 385) 2 408)
Sales of goods and services2 5 262) 5 604) 5 683) 5 693) 5 703)
Other revenue 165) 165) 158) 158) 158)
Total revenue and other income from transactions 7 774) 8 082) 8 191) 8 236) 8 269)
Expenses from transactions
Employee benefits2 5 267) 5 256) 5 356) 5 455) 5 572)
Depreciation and amortisation3 72) 54) 49) 49) 49)
Supplies and consumables2 2 371) 2 582) 2 487) 2 453) 2 391)
Other expenses2 23) 299) 294) 293) 305)
Total expenses from transactions 7 733) 8 191) 8 186) 8 250) 8 317)
Net result from transactions (net operating
balance) 41) (109) 5) (14) (48)
Net result 41) (109) 5) (14) (48)
Comprehensive result 41) (109) 5) (14) (48)
Notes: 1. The decrease in Appropriation revenue - recurrent in 2016-17 reflects the cessation of one-off funding for the
27th pay in 2015-16. 2. The variations in Sales of goods and services, Employee benefits, Supplies and consumables and Other expenses
in 2016-17 reflect revised estimates based on 30 June 2015 actuals. 3. The decrease in Depreciation and amortisation in 2016-17 reflects a reduction in amortisation due to all intangible
assets being fully depreciated.

64 Tasmanian Audit Office
Table 19.4: Revenue from Appropriation by Output
2015-16)
Budget)
2016-17)
Budget)
2017-18)
Forward)
Estimate)
2018-19)
Forward)
Estimate)
2019-20)
Forward)
Estimate)
$'000) $'000) $'000) $'000) $'000)
Treasurer
Output Group 1 - Public Sector Management and
Accountability
1.1 Public Sector Management and Accountability1 1 779) 1 853) 1 871) 1 891) 1 902)
1 779) 1 853) 1 871) 1 891) 1 902)
Tasmanian Audit Office
Total Recurrent Services 1 779) 1 853) 1 871) 1 891) 1 902)
1 779) 1 853) 1 871) 1 891) 1 902)
Reserved by Law
Salary and Travelling Allowance, Auditor-General
(Audit Act 2008)1 568) 460) 479) 494) 506)
568) 460) 479) 494) 506)
Total Revenue from Appropriation 2 347) 2 313) 2 350) 2 385) 2 408)
Controlled Revenue from Appropriation 2 347) 2 313) 2 350) 2 385) 2 408)
2 347) 2 313) 2 350) 2 385) 2 408)
Note: 1. Variations include the impact of a Budget neutral reallocation of $99 000 between Reserved by Law and general
Consolidated Fund funding. Further information on this change is provided in chapter 1 of this Budget Paper.

Tasmanian Audit Office 65
Table 19.5: Statement of Financial Position as at 30 June
2016)
Budget)
2017)
Budget1)
2018)
Forward)
Estimate)
2019)
Forward)
Estimate)
2020)
Forward)
Estimate)
$'000) $'000) $'000) $'000) $'000)
Assets
Financial assets
Cash and deposits 2 363) 1 989) 2 019) 2 038) 2 023)
Receivables 513) 509) 504) 499) 494)
Other financial assets 355) 533) 528) 523) 518)
3 231) 3 031) 3 051) 3 060) 3 035)
Non-financial assets
Property, plant and equipment2 169) 300) 274) 240) 206)
Other assets 28) 27) 23) 19) 15)
197) 327) 297) 259) 221)
Total assets 3 428) 3 358) 3 348) 3 319) 3 256)
Liabilities
Payables 128) 79) 76) 73) 70)
Employee benefits 1 127) 1 170) 1 165) 1 160) 1 155)
Superannuation ....) 149) 149) 149) 149)
Other liabilities 168) 233) 226) 219) 212)
Total liabilities 1 423) 1 631) 1 616) 1 601) 1 586)
Net assets (liabilities) 2 005) 1 727) 1 732) 1 718) 1 670)
Equity
Accumulated funds 837) 559) 564) 550) 502)
Other equity 1 168) 1 168) 1 168) 1 168) 1 168)
Total equity 2 005) 1 727) 1 732) 1 718) 1 670)
Notes: 1. The variation in statement items between 2016 Budget and 2017 Budget reflect revised estimates based on
30 June 2015 actuals. 2. The increase in Property, plant and equipment in 2017 reflects the capitalisation of refurbishment costs incurred
during the Office's relocation to new premises in June 2015.

66 Tasmanian Audit Office
Table 19.6: Statement of Cash Flows
2015-16)
Budget)
2016-17)
Budget)
2017-18)
Forward)
Estimate)
2018-19)
Forward)
Estimate)
2019-20)
Forward)
Estimate)
$'000) $'000) $'000) $'000) $'000)
Cash flows from operating activities
Cash inflows
Appropriation receipts - recurrent1 2 347) 2 313) 2 350) 2 385) 2 408)
Sales of goods and services2 5 614) 5 872) 5 936) 5 946) 5 956)
GST receipts 598) 635) 672) 672) 672)
Other cash receipts 165) 165) 158) 158) 158)
Total cash inflows 8 724) 8 985) 9 116) 9 161) 9 194)
Cash outflows
Employee benefits3 (5 220) (4 868) (4 954) (5 011) (5 152)
Superannuation2 (399) (648) (657) (699) (675)
GST payments (598) (635) (672) (672) (672)
Supplies and consumables2 (2 367) (2 579) (2 480) (2 446) (2 384)
Other cash payments2 (23) (299) (294) (293) (305)
Total cash outflows (8 607) (9 029) (9 057) (9 121) (9 188)
Net cash from (used by) operating activities 117) (44) 59) 40) 6)
Cash flows from investing activities
Payments for acquisition of non-financial assets (131) (31) (29) (21) (21)
Net cash from (used by) investing activities (131) (31) (29) (21) (21)
Net increase (decrease) in cash and cash
equivalents held (14) (75) 30) 19) (15)
Cash and deposits at the beginning of the
reporting period 2 377) 2 064) 1 989) 2 019) 2 038)
Cash and deposits at the end of the reporting
period 2 363) 1 989) 2 019) 2 038) 2 023)
Notes: 1. The decrease in Appropriation receipts - recurrent in 2016-17 reflects the cessation of funding in 2015-16 for the
27th pay. 2. The increases in Sales of goods and services, Superannuation, Supplies and consumables and Other cash
payments in 2016-17 reflect revised estimates based on 30 June 2015 actuals. 3. The decrease in Employee benefits in 2016-17 reflects the cessation of funding in 2015-16 for the 27th pay and
revised estimates based on 30 June 2015 actuals.

Tourism Tasmania 67
20 TOURISM TASMANIA
AGENCY OUTLINE Tourism Tasmania is a State Authority operating under the Tourism Tasmania Act 1996. Tourism Tasmania's
role is to grow economic and social value by creating domestic and international leisure travel to the State.
Tourism Tasmania's domestic and international marketing programs connect people culturally and emotionally
to Tasmania.
Tasmania's tourism industry is made up of around 2 000 separate businesses. According to the estimates in
the Tourism Satellite Accounts 2013-14 (Tourism Research Australia, May 2015, Appendix,
Tables 14 and 15), Tasmania's tourism industry directly and indirectly supports around 37 000 jobs in
Tasmania (16.2 per cent of total Tasmanian employment) and contributes about $2.3 billion to the economy
(9.1 per cent of the gross state product).
Through its destination marketing programs, Tourism Tasmania plays an important role in achieving the
Government and tourism industry's goal of attracting 1.5 million visitors a year to Tasmania by 2020.
This goal is part of the renewed industry and Government tourism blueprint, Tourism 21 (T21) - The
Tasmanian Visitor Economy Strategy 2015-2020, which was released in November 2015.
Through T21, the Government and industry is collectively focused on achieving its goal by growing demand
for travel to Tasmania; expanding air and sea access; investing in quality tourism infrastructure; and building
capability, capacity and community.
Under this joint approach, Tourism Tasmania's main contribution to reaching T21's 1.5 million visitor goal is
stimulating more demand for leisure travel to Tasmania, with a particular focus on brand marketing, content,
brand advocacy, strategic partnerships for conversion and stakeholder engagement to inspire customer
action.
Tourism Tasmania also collaborates with other government agencies and organisations involved with the
visitor economy to ensure the growth in visitor numbers is matched with the supply of adequate air and sea
access, new tourism experiences, accommodation, visitor services, infrastructure and a suitably skilled
workforce.
The Authority supports the Minister for Tourism, Hospitality and Events, Hon Will Hodgman MP.
This chapter details the Agency's financial information for 2016-17 and over the Forward Estimates period
(2017-18 to 2019-20).
Further information on Tourism Tasmania is provided at www.tourismtasmania.com.au.

68 Tourism Tasmania
KEY DELIVERABLES Table 20.1 provides a summary of the Budget and Forward Estimate allocations for key deliverables within
the Authority.
Table 20.1: Key Deliverables Statement 2016-17
Budget
2017-18
Forward
Estimate
2018-19
Forward
Estimate
2019-20
Forward
Estimate
$'000 $'000 $'000 $'000
Budget support for Aviation Market Development Fund 625 625 ….) ….)
Tourism Marketing - Additional Funding 5 000 5 000 4 000 4 000
Budget support for Aviation Market Development Fund
In line with the goals and priorities of Access 2020 and T21 - The Tasmanian Visitor Economy Strategy
2015-20, Tourism Tasmania has been in a range of discussions with international aviation carriers to build
market demand for visitors through commercial aviation partnerships and cooperative marketing programs.
Further market development is required to strengthen business case demand modelling to support limited
direct flights from key international markets, following the completion of the Hobart Airport Runway Extension
project in early 2018.
The Aviation Market Development Fund is for dedicated cooperative international airline marketing
partnerships through the establishment of specific airline codeshare arrangements and cooperative marketing
agreements to accelerate growth of Tasmanian visitors on their networks. This will establish demand through
domestic partner airlines and longer term marketing for direct aviation access services. It will also assist
market take up of increased domestic seat capacity into Tasmania, supporting domestic aviation partner
activity.
Brand advocacy
Research shows that in today's travel marketplace, word of mouth and third party referrals play a crucial role
in people's holiday decision making. Analysis of social media also reveals that Tasmanians are very involved
in providing helpful and unbiased personal insights and travel ideas for visitors and people who are planning,
or considering, a Tasmanian holiday.
As part of its marketing repertoire, Tourism Tasmania engages and enlists its stakeholders and customers to
support the destination brand, facilitating the sharing of Tasmania's rich stories and harnessing the power and
passion of Tasmanians to tell our story and add depth to the Tasmanian visitor experience. The Authority then
shares this relevant brand content and stories with followers, its target audience and other strategic marketing
partners in Australia and overseas through the use of its social, digital and other marketing platforms.
Global brand advocacy is also supported by social media and public relations activities through Tourism
Australia's International Media Hosting Program and the Authority's own Visiting Influencer Program to
broaden the reach of Tourism Tasmania's brand marketing campaigns and brand message.

Tourism Tasmania 69
Brand marketing
All of the Authority's marketing programs and campaigns are guided by a strong and distinctive Tasmanian
tourism brand. Tasmania's tourism brand focuses on key aspects of the State that are both good and different
to differentiate Tasmania from other travel destinations and encourage a clear, consistent and compelling
marketing message.
The Authority is responsible for developing and managing the State's tourism brand, which includes
monitoring its relevance and application in marketing campaigns and programs, and overseeing the evolution
of the tourism brand to maintain its relevance to ensure Tasmania continues to stand out from competing
destinations.
The Authority also continues to broaden the industry's understanding of Tasmania's tourism brand through
the education of key stakeholders including government, industry, commercial travel partners, regional
tourism bodies, and internally amongst its staff.
Content
To support its domestic and international marketing activities, Tourism Tasmania places great importance on
creating, curating, publishing and sharing content about Tasmania that best conveys the destination brand
and creates demand for travel to the State.
Outstanding content is used to effectively and efficiently differentiate Tasmania in a competitive and crowded
travel marketplace. Content plays a vital role in a consumer's decision making process by building brand
awareness, creating consumer engagement with the destination, increasing sales leads and travel bookings,
and building consumer advocacy and loyalty.
Content encompasses images, videos, footage, articles, blogs, stories and other assets that appeal to Tourism
Tasmania's target markets in Australia and overseas, and presents Tasmania's tourism experience in the best
possible light.
The Authority creates, publishes and shares brand-aligned content about Tasmania across its websites, social
media platforms, newsletters, direct marketing programs and mainstream media channels. It also ensures
appropriate systems and processes are in place to streamline the sharing and distribution of brand-aligned
content internally and externally with regional tourism organisations, partners and stakeholders.
Stakeholder engagement
While Tourism Tasmania's main role is to market Tasmania interstate and internationally as a leisure travel
destination, the Agency also engages and collaborates with other government agencies and organisations
involved with the visitor economy to ensure the growth in visitor numbers is matched with the supply of
adequate air and sea access, new tourism experiences, accommodation, visitor services, infrastructure and
a suitably skilled workforce.
As part of this collaboration, the Authority provides the Secretariat for the Premier's Visitor Economy Advisory
Committee and the T21 Steering Committee. It also supports and works closely with a number of important
industry stakeholders including the Tourism Industry Council Tasmania, the Tasmanian Visitor Information
Network and, in particular, the State's four regional tourism organisations.

70 Tourism Tasmania
Strategic partnerships for conversion
Tourism Tasmania invests in partnerships that deliver high value visitors for Tasmania. These partnerships
include cooperative marketing campaigns and promotions with a range of international and domestic partners
to stimulate travel, sales and holiday bookings for Tasmania. The Authority's partners include but are not
limited to sector and special interest groups, event organisers, wholesalers, retail travel networks, carriers and
inbound tour operators.
The Authority also works in partnership with Tourism Australia to promote the State through global campaigns
and programs, including Tourism Australia's 'There's Nothing Like Australia' campaigns, Restaurant Australia
and the new global Aquatic and Coastal campaign.
Strategic partnerships with Tourism Australia also encompass travel trade and consumer promotions in
selected international markets, and marketing partnerships with domestically based inbound tour operators
and youth travel chains.
Tourism Marketing - Additional Funding
The 2016-17 Budget contains the additional $5 million for tourism marketing activity provided in the previous
two budgets, consisting of $4 million per annum over the Forward Estimates and an additional $3 million
provided in 2015-16 Budget over three years. This additional funding has been directly invested in domestic
and international marketing programs to stimulate demand for leisure travel to Tasmania.

Tourism Tasmania 71
OUTPUT INFORMATION Tourism Tasmania has an individual output: Output Group 1 - Tourism.
Table 20.2 provides an Output Group Expense Summary for the Authority.
Table 20.2: Output Group Expense Summary
2015-16)
Budget)
2016-17)
Budget)
2017-18)
Forward)
Estimate)
2018-19)
Forward)
Estimate)
2019-20)
Forward)
Estimate)
$'000) $'000) $'000) $'000) $'000)
Output Group 1 - Tourism
1.1 Tourism1 26 690) 27 377) 27 878) 26 673) 27 019)
26 690) 27 377) 27 878) 26 673) 27 019)
TOTAL 26 690) 27 377) 27 878) 26 673) 27 019)
Note: 1. The decrease in 2018-19 reflects the cessation of additional initiative funding for tourism marketing (an additional
$1 million was provided in the 2015-16 Budget for 2015-16, 2016-17 and 2017-18, on top of an ongoing $4 million per annum increase in tourism marketing funding provided in the 2014-15 Budget) and Budget support for Aviation Market Development Fund.
Output Group 1: Tourism
1.1 Tourism
Tourism Tasmania's role is to create demand for travel to the State by connecting people culturally and
emotionally to Tasmania through domestic and international marketing programs that lead and activate the
Tasmanian brand, and grow economic and social value.
This Output primarily undertakes marketing activities that focus on building a strong distinctive tourism brand,
delivering targeted marketing campaigns, and facilitating public relations and social media activities to create
destination exposure in key Australian and international markets.
The Output includes commercial marketing partnerships with carriers, retail travel networks, online travel
retailers, and other distributors of Tasmanian tourism products, to stimulate holiday sales and bookings to
Tasmania.
This Output also supports the development and the growth of a strong regional tourism platform, and is also
responsible for ensuring that the future development and growth of Tasmania's economy is matched with
access capability.

72 Tourism Tasmania
Table 20.3: Performance Information
Performance Measure
Unit of
Measure
2013-14
Actual
2014-15
Actual
2015-16
Target
2016-17
Target
Visitors to Tasmania1 '000 1 058 1 147 1 155 1 288
Interstate leisure visitation to Tasmania1,2 '000 na na na 782
International leisure visitation to Tasmania2,3 '000 na na na 185
Interstate visitation to Tasmania1,4 '000 910 988 974 na
International visitation to Tasmania3,4 '000 163 198 181 na
Total holiday visitation1,5 '000 478 542 520 na
Intrastate visitation6,7 '000 1 225 1 271 1 249 na
Local tourism strategies with Regional Tourism
Organisations Number 4 4 4 4
Notes: 1. Visitors to Tasmania travelling on scheduled air and sea services. 2. Includes holiday and VFR (visiting friends and relatives) visitors only. It does not include visitors to Tasmania for
business, education or other purposes. 3. Data for International leisure visitation to Tasmania is sourced from the International Visitors Survey. 4. From 2016-17, Interstate visitation to Tasmania and International visitation to Tasmania have been replaced by
Interstate leisure visitation to Tasmania and International leisure visitation to Tasmania, respectively, as performance measures for Tourism Tasmania. The change reflects a focus on leisure visitation as a subset of total visitors.
5. From 2016-17, Total holiday visitation is no longer a performance measure for Tourism Tasmania. The change reflects a focus on total leisure travel.
6. From 2016-17, Intrastate visitation has been replaced by Interstate leisure visitation and International leisure visitation as performance measures for Tourism Tasmania.
7. Intrastate visitation data is sourced from the National Visitor Survey.

Tourism Tasmania 73
DETAILED BUDGET STATEMENTS
Table 20.4: Statement of Comprehensive Income
2015-16)
Budget)
2016-17)
Budget)
2017-18)
Forward)
Estimate)
2018-19)
Forward)
Estimate)
2019-20)
Forward)
Estimate)
$'000) $'000) $'000) $'000) $'000)
Revenue and other income from transactions
Appropriation revenue - recurrent1 25 890) 26 800) 27 301) 26 160) 26 597)
Sales of goods and services2,3 610) ....) ....) ....) ....)
Other revenue2,3 ....) 400) 400) 400) 400)
Total revenue and other income from transactions 26 500) 27 200) 27 701) 26 560) 26 997)
Expenses from transactions
Employee benefits3 6 174) 5 855) 5 972) 6 091) 6 201)
Depreciation and amortisation 190) 177) 177) 113) 22)
Supplies and consumables1,3 18 561) 19 761) 20 114) 18 822) 19 117)
Grants and subsidies3 1 677) 1 517) 1 547) 1 578) 1 609)
Other expenses3 88) 67) 68) 69) 70)
Total expenses from transactions 26 690) 27 377) 27 878) 26 673) 27 019)
Net result from transactions (net operating
balance) (190) (177) (177) (113) (22)
Net result (190) (177) (177) (113) (22)
Comprehensive result (190) (177) (177) (113) (22)
Notes: 1. The decreases in Appropriation revenue - recurrent and Supplies and consumables in 2018-19 reflect the cessation
of additional initiative funding for tourism marketing (an additional $1 million was provided in the 2015-16 Budget for 2015-16, 2016-17 and 2017-18, on top of an ongoing $4 million per annum increase in tourism marketing funding provided in the 2014-15 Budget) and Budget support for Aviation Market Development Fund.
2. The variations in Sales of goods and services and Other revenue in 2016-17 reflect a reclassification based on 30 June 2015 actuals.
3. The variations in Sales of goods and services, Other revenue, Employee benefits, Supplies and consumables, Grants and subsidies and Other expenses in 2016-17 reflect revised estimates based on 30 June 2015 actuals.

74 Tourism Tasmania
Table 20.5: Revenue from Appropriation by Output
2015-16)
Budget)
2016-17)
Budget)
2017-18)
Forward)
Estimate)
2018-19)
Forward)
Estimate)
2019-20)
Forward)
Estimate)
$'000) $'000) $'000) $'000) $'000)
Minister for Tourism, Hospitality and Events
Output Group 1 - Tourism
1.1 Tourism1 25 890) 26 800) 27 301) 26 160) 26 597)
25 890) 26 800) 27 301) 26 160) 26 597)
Tourism Tasmania
Total Recurrent Services 25 890) 26 800) 27 301) 26 160) 26 597)
25 890) 26 800) 27 301) 26 160) 26 597)
Total Revenue from Appropriation 25 890) 26 800) 27 301) 26 160) 26 597)
Controlled Revenue from Appropriation 25 890) 26 800) 27 301) 26 160) 26 597)
25 890) 26 800) 27 301) 26 160) 26 597)
Note: 1. The decrease in 2018-19 reflects the cessation of additional initiative funding for tourism marketing (an additional
$1 million was provided in the 2015-16 Budget for 2015-16, 2016-17 and 2017-18, on top of an ongoing $4 million per annum increase in tourism marketing funding provided in the 2014-15 Budget) and Budget support for Aviation Market Development Fund.

Tourism Tasmania 75
Table 20.6: Statement of Financial Position as at 30 June
2016)
Budget)
2017)
Budget)
2018)
Forward)
Estimate)
2019)
Forward)
Estimate)
2020)
Forward)
Estimate)
$'000) $'000) $'000) $'000) $'000)
Assets
Financial assets
Cash and deposits 16) 1) 1) 1) 1)
Receivables 108) 99) 99) 99) 99)
124) 100) 100) 100) 100)
Non-financial assets
Property, plant and equipment1 164) 202) 180) 158) 136)
Intangibles 401) 246) 91) ....) ....)
Other assets1 541) 450) 450) 450) 450)
1 106) 898) 721) 608) 586)
Total assets 1 230) 998) 821) 708) 686)
Liabilities
Payables1 60) 75) 75) 75) 75)
Provisions1 340) 96) 96) 96) 96)
Employee benefits 1 165) 1 277) 1 277) 1 277) 1 277)
Other liabilities 5) 6) 6) 6) 6)
Total liabilities 1 570) 1 454) 1 454) 1 454) 1 454)
Net assets (liabilities) (340) (456) (633) (746) (768)
Equity
Accumulated funds (340) (456) (633) (746) (768)
Total equity (340) (456) (633) (746) (768)
Note: 1. The variations in Property, plant and equipment, Other assets, Payables and Provisions in 2016-17 reflect revised
estimates based on 30 June 2015 actuals.

76 Tourism Tasmania
Table 20.7: Statement of Cash Flows
2015-16)
Budget)
2016-17)
Budget)
2017-18)
Forward)
Estimate)
2018-19)
Forward)
Estimate)
2019-20)
Forward)
Estimate)
$'000) $'000) $'000) $'000) $'000)
Cash flows from operating activities
Cash inflows
Appropriation receipts - recurrent1 25 890) 26 800) 27 301) 26 160) 26 597)
Sales of goods and services2,3 610) ....) ....) ....) ....)
Other cash receipts2,3 ....) 400) 400) 400) 400)
Total cash inflows 26 500) 27 200) 27 701) 26 560) 26 997)
Cash outflows
Employee benefits3 (5 439) (5 287) (5 393) (5 501) (5 601)
Superannuation3 (735) (568) (579) (590) (600)
Grants and subsidies3 (1 677) (1 517) (1 547) (1 578) (1 609)
Supplies and consumables1,3 (18 561) (19 761) (20 114) (18 822) (19 117)
Other cash payments (88) (67) (68) (69) (70)
Total cash outflows (26 500) (27 200) (27 701) (26 560) (26 997)
Net increase (decrease) in cash and cash
equivalents held ....) ....) ....) ....) ....)
Cash and deposits at the beginning of the
reporting period 16) 1) 1) 1) 1)
Cash and deposits at the end of the reporting
period 16) 1) 1) 1) 1)
Notes: 1. The decreases in Appropriation receipts - recurrent and Supplies and consumables in 2018-19 reflect the cessation of
additional initiative funding for tourism marketing (an additional $1 million was provided in the 2015-16 Budget for 2015-16, 2016-17 and 2017-18, on top of an ongoing $4 million per annum increase in tourism marketing funding provided in the 2014-15 Budget) and Budget support for Aviation Market Development Fund.
2. The variations in Sales of goods and services and Other cash receipts in 2016-17 reflect a reclassification based on 30 June 2015 actuals.
3. The variations in Sales of goods and services, Other cash receipts, Employee benefits, Superannuation, Grants and subsidies and Supplies and consumables in 2016-17 reflect revised estimates based on 30 June 2015 actuals.

PART 3: STATUTORY AUTHORITIES


Inland Fisheries Service 79
21 INLAND FISHERIES
SERVICE
AUTHORITY OUTLINE The Inland Fisheries Service (IFS) has wide statutory powers under the Inland Fisheries Act 1995 to regulate,
manage and protect freshwater fish and improve fisheries in inland waters.
The responsible Minister is the Minister for Primary Industries and Water, Hon Jeremy Rockliff MP, and the
supporting agency is the Department of Primary Industries, Parks, Water and Environment.
The IFS manages Tasmania's inland fisheries for the benefit of anglers and the Tasmanian community. This
requires management of:
Tasmanian inland recreational fisheries;
inland commercial fisheries and associated aquaculture industries; and
conservation of native fish and eradication of pest fish.
This chapter provides the IFS's financial information for 2016-17 and over the Forward Estimates period
(2017-18 to 2019-20). Further information on the IFS is provided at www.ifs.tas.gov.au.
KEY DELIVERABLES The key deliverables for the IFS include:
assessment of the feasibility of creating a new angling water and the improvement of other waters in
Southern Tasmania;
continuing a number of projects to develop and improve angler access to lakes, rivers and streams
throughout the State, including the Derwent and South Esk Rivers; and
continuing and reinforcing the extensive work completed to date in the eradication of carp in Lake Sorell.

80 Inland Fisheries Service
DETAILED BUDGET STATEMENTS
Table 21.1: Statement of Comprehensive Income
2015-16)
Budget)
2016-17)
Budget)
2017-18)
Forward)
Estimate)
2018-19)
Forward)
Estimate)
2019-20)
Forward)
Estimate)
$'000) $'000) $'000) $'000) $'000)
Revenue and other income from transactions
Grants 1 123) 1 123) 1 123) 1 123) 1 123)
Sales of goods and services1 592) 1 026) 1 028) 742) 756)
Fees and fines 1 674) 1 699) 1 734) 1 771) 1 776)
Interest2 120) 110) 80) 100) 100)
Total revenue and other income from transactions 3 509) 3 958) 3 965) 3 736) 3 755)
Expenses from transactions
Employee benefits3 2 165) 2 089) 2 141) 2 184) 2 230)
Depreciation and amortisation 262) 262) 262) 262) 262)
Supplies and consumables1 1 077) 1 534) 1 566) 1 206) 1 243)
Total expenses from transactions 3 504) 3 885) 3 969) 3 652) 3 735)
Net result from transactions (net operating
balance) 5) 73) (4) 84) 20)
Net result 5) 73) (4) 84) 20)
Other economic flows - other non-owner changes
in equity
Changes in physical asset revaluation reserve 1) 10) 10) 10) 10)
Total other economic flows - other non-owner
changes in equity 1) 10) 10) 10) 10)
Comprehensive result 6) 83) 6) 94) 30)
Notes: 1. The increases in Sales of goods and services and Supplies and consumables in 2016-17 and 2017-18 reflect
Australian Government funding for carp eradication. 2. The decrease in Interest in 2017-18 reflects an anticipated reduction in investment returns primarily due to a reduction
in the total value of interest earning assets held during that financial year. 3. The decrease in Employee benefits in 2016-17 reflects revised estimates based on 30 June 2015 actuals.

Inland Fisheries Service 81
Table 21.2: Statement of Financial Position as at 30 June
2016)
Budget)
2017)
Budget)
2018)
Forward)
Estimate)
2019)
Forward)
Estimate)
2020)
Forward)
Estimate)
$'000) $'000) $'000) $'000) $'000)
Assets
Financial assets
Cash and deposits 2 547) 2 722) 2 821) 3 008) 3 131)
Receivables 158) 174) 237) 300) 363)
2 705) 2 896) 3 058) 3 308) 3 494)
Non-financial assets
Property, plant and equipment 3 923) 3 906) 3 764) 3 622) 3 480)
Investment property 2 230) 2 435) 2 435) 2 435) 2 435)
6 153) 6 341) 6 199) 6 057) 5 915)
Total assets 8 858) 9 237) 9 257) 9 365) 9 409)
Liabilities
Payables 110) 133) 138) 143) 148)
Employee benefits1 572) 555) 564) 573) 582)
Total liabilities 682) 688) 702) 716) 730)
Net assets (liabilities) 8 176) 8 549) 8 555) 8 649) 8 679)
Equity
Reserves 2 075) 2 274) 2 284) 2 294) 2 304)
Accumulated funds 2 901) 3 075) 3 071) 3 155) 3 175)
Other equity 3 200) 3 200) 3 200) 3 200) 3 200)
Total equity 8 176) 8 549) 8 555) 8 649) 8 679)
Note: 1. The decrease in Employee benefits in 2017 reflects a reduction in leave balances.

82 Inland Fisheries Service
Table 21.3: Statement of Cash Flows
2015-16)
Budget)
2016-17)
Budget)
2017-18)
Forward)
Estimate)
2018-19)
Forward)
Estimate)
2019-20)
Forward)
Estimate)
$'000) $'000) $'000) $'000) $'000)
Cash flows from operating activities
Cash inflows
Grants 1 123) 1 123) 1 123) 1 123) 1 123)
Sales of goods and services1 592) 1 026) 1 028) 742) 756)
Fees and fines 1 674) 1 699) 1 734) 1 771) 1 776)
GST receipts 59) 60) 65) 65) 65)
Interest received2 120) 110) 80) 100) 100)
Total cash inflows 3 568) 4 018) 4 030) 3 801) 3 820)
Cash outflows
Employee benefits3 (1 950) (1 889) (1 934) (1 973) (2 012)
Superannuation (215) (200) (207) (211) (218)
GST payments (110) (100) (104) (104) (104)
Supplies and consumables1 (1 077) (1 534) (1 566) (1 206) (1 243)
Total cash outflows (3 352) (3 723) (3 811) (3 494) (3 577)
Net cash from (used by) operating activities 216) 295) 219) 307) 243)
Cash flows from investing activities
Payments for acquisition of non-financial assets (180) (200) (200) (200) (200)
Proceeds from the disposal of non-financial assets 80) 80) 80) 80) 80)
Net cash from (used by) investing activities (100) (120) (120) (120) (120)
Net increase (decrease) in cash and cash
equivalents held 116) 175) 99) 187) 123)
Cash and deposits at the beginning of the
reporting period 2 431) 2 547) 2 722) 2 821) 3 008)
Cash and deposits at the end of the reporting
period 2 547) 2 722) 2 821) 3 008) 3 131)
Notes: 1. The increases in Sales of goods and services and Supplies and consumables in 2016-17 and 2017-18 reflect
Australian Government funding for carp eradication. 2. The decrease in Interest received in 2017-18 reflects an anticipated reduction in investment returns primarily due to a
reduction in the total value of interest earning assets held during that financial year. 3. The decrease in Employee benefits in 2016-17 reflects revised estimates based on 30 June 2015 actuals.

Marine and Safety Tasmania 83
22 MARINE AND SAFETY
TASMANIA
AUTHORITY OUTLINE Marine and Safety Tasmania (MAST) seeks to be widely recognised as a proactive, approachable and
knowledgeable organisation that performs the functions required under the Marine and Safety Authority
Act 1997. These functions are to:
ensure the safe operation of vessels;
provide and manage marine facilities;
manage environmental issues relating to vessels; and
perform the functions delegated to the Authority by the Australian Maritime Safety Authority (AMSA).
The responsible Minister is the Minister for Infrastructure, Hon Rene Hidding MP, and the supporting agency
is the Department of State Growth.
This chapter provides MAST's financial information for 2016-17 and over the Forward Estimates period
(2017-18 to 2019-20). Further information on MAST is provided at www.mast.tas.gov.au.
KEY DELIVERABLES Table 22.1 provides a summary of the Budget and Forward Estimate allocations for key deliverables within
the Authority.
Table 22.1: Key Deliverables Statement 2016-17) 2017-18) 2018-19) 2019-20
Budget)
Forward)
Estimate)
Forward)
Estimate)
Forward)
Estimate)
$'000) $'000) $'000) $'000)
Marine Infrastructure Maintenance 829 831 833 835
National Maritime Reform - Transition1 750 750 .... ....
Recreational Boating Fund - Facilities and Services 1 619 1 723 1 878 1 896
St Helens Barway Stabilisation - Stage 2 589 .... .... ....
Note: 1. The variation in Nation Maritime Reform Transition costs compared with the 2015-16 Budget reflects a change in the
anticipated handover date of commercial vessel service delivery from 1 July 2019 to 1 July 2017.

84 Marine and Safety Tasmania
Marine Infrastructure Maintenance
A comprehensive preventative maintenance program will continue on important marine infrastructure
including navigation aids, jetties and breakwaters.
National Maritime Reform - Transition
From 1 July 2013, the Marine Safety (Domestic Commercial Vessel) National Law Act 2012 (National Law)
created a national safety system for domestic commercial vessels through a single national law for seafarers
and commercial vessel owners. The Act replaced eight existing federal, state and territory regulators with one
national marine safety regulator, the Australian Maritime Safety Agency. MAST will remain responsible for the
day-to-day administration of the National Law in Tasmania, under delegation from AMSA until AMSA assumes
full service delivery on 1 July 2017. Significant internal resources have been diverted to the transition out of
service delivery to ensure that MAST achieves the best outcome for commercial operators in Tasmania.
Recreational Boating Fund - Facilities and Services
The funding of community projects under the Recreational Boating Fund will continue during 2016-17 with
$1.6 million being made available for the upgrade of recreational boating facilities and continuation of safety
initiatives and services. Projects are funded from revenue received from the registration of recreational vessels
and licensing of operators.
St Helens Barway Stabilisation - Stage 2
Work to stabilise the entrance to the St Helens Barway commenced in 2015-16 with $589 000 provided for
Stage 1. The project will continue during 2016-17 with Stage 2 funding of a further $589 000 to be directed
towards the extension of the existing seawall to help create a more reliable and safe channel.

Marine and Safety Tasmania 85
DETAILED BUDGET STATEMENTS
Table 22.2: Statement of Comprehensive Income
2015-16)
Budget)
2016-17)
Budget)
2017-18)
Forward)
Estimate)
2018-19)
Forward)
Estimate)
2019-20)
Forward)
Estimate)
$'000) $'000) $'000) $'000) $'000)
Revenue and other income from transactions
Grants1 2 092) 1 592) 1 003) 1 003) 1 003)
Sales of goods and services2,3 4 909) 3 890) 4 909) 4 024) 3 272)
Interest 66) 67) 68) 70) 68)
Total revenue and other income from transactions 7 067) 5 549) 5 980) 5 097) 4 343)
Expenses from transactions
Employee benefits4 1 969) 2 213) 2 121) 1 627) 1 675)
Depreciation and amortisation 906) 912) 870) 869) 869)
Supplies and consumables5 4 208) 4 023) 3 816) 3 828) 3 798)
Total expenses from transactions 7 083) 7 148) 6 807) 6 324) 6 342)
Net result from transactions (net operating
balance) (16) (1 599) (827) (1 227) (1 999)
Net result (16) (1 599) (827) (1 227) (1 999)
Comprehensive result (16) (1 599) (827) (1 227) (1 999)
Notes: 1. The decrease in Grants in 2016-17 reflects the completion of the Prosser River Entrance Stabilisation - Stage 1 project.
The further decrease in 2017-18 reflects the completion of the St Helens Barway Stabilisation - Stage 2. 2. The decrease in Sales of goods and services in 2016-17 reflects the timing of recreational boating licence renewals
which occur every three years with the next renewal due on 30 June 2018. 3. The decrease in Sales of goods and services across the Forward Estimates compared to the 2015-16 Budget reflects
a reduction in commercial vessel annual administration fees due to MAST's transition out of commercial vessel service delivery.
4. The increase in Employee benefits in 2016-17 and 2017-18 reflects anticipated one off payments to staff due to MAST's changing staff levels resulting from its transition out of commercial vessel service delivery.
5. The decrease in Supplies and consumables reflects revised estimates based on 30 June 2015 actuals.

86 Marine and Safety Tasmania
Table 22.3: Statement of Financial Position as at 30 June
2016)
Budget)
2017)
Budget)
2018)
Forward)
Estimate)
2019)
Forward)
Estimate)
2020)
Forward)
Estimate)
$'000) $'000) $'000) $'000) $'000)
Assets
Financial assets
Cash and deposits1 2 561) 1 009) 917) 535) (553)
Receivables 169) 142) 139) 154) 156)
2 730) 1 151) 1 056) 689) (397)
Non-financial assets
Property, plant and equipment 112) 23) 10) ....) ....)
Infrastructure2 24 335) 24 708) 23 850) 23 002) 22 143)
Other assets 44) 39) 38) 35) 34)
24 491) 24 770) 23 898) 23 037) 22 177)
Total assets 27 221) 25 921) 24 954) 23 726) 21 780)
Liabilities
Payables3 424) 343) 334) 411) 410)
Employee benefits4 692) 755) 624) 546) 600)
Total liabilities 1 116) 1 098) 958) 957) 1 010)
Net assets (liabilities) 26 105) 24 823) 23 996) 22 769) 20 770)
Equity
Reserves 12 881) 13 089) 13 089) 13 089) 13 089)
Accumulated funds 3 285) 1 795) 968) (259) (2 258)
Other equity 9 939) 9 939) 9 939) 9 939) 9 939)
Total equity 26 105) 24 823) 23 996) 22 769) 20 770)
Notes: 1. Cash balances partly reflect the impact of the implementation of National Maritime Reforms. The actual financial impact
is yet to be determined. Strategies are being developed and implemented by the Board to ensure that a negative cash balance is not realised.
2. The increase in Infrastructure in 2017 reflects capital expenditure attributable to the St Helens Barway Stabilisation project.
3. The variation in Payables in 2016-17 reflects revised estimates based on 30 June 2015 actuals. 4. The variation in Employee benefits in 2016-17 and 2017-18 reflects the anticipated payment of employee entitlements
due to MAST's changing staff levels due to its transition out of commercial vessel service delivery.

Marine and Safety Tasmania 87
Table 22.4: Statement of Cash Flows
2015-16)
Budget)
2016-17)
Budget)
2017-18)
Forward)
Estimate)
2018-19)
Forward)
Estimate)
2019-20)
Forward)
Estimate)
$'000) $'000) $'000) $'000) $'000)
Cash flows from operating activities
Cash inflows
Grants1 2 092) 1 592) 1 003) 1 003) 1 003)
Sales of goods and services2,3 4 935) 3 890) 4 909) 4 024) 3 272)
GST receipts 355) 403) 383) 326) 383)
Interest received 66) 67) 68) 70) 68)
Total cash inflows 7 448) 5 952) 6 363) 5 423) 4 726)
Cash outflows
Employee benefits4 (1 724) (1 984) (2 099) (1 445) (1 485)
Superannuation (190) (194) (156) (142) (146)
GST payments (357) (391) (385) (390) (385)
Supplies and consumables5 (4 108) (4 024) (3 815) (3 828) (3 798)
Total cash outflows (6 379) (6 593) (6 455) (5 805) (5 814)
Net cash from (used by) operating activities 1 069) (641) (92) (382) (1 088)
Cash flows from investing activities
Payments for acquisition of non-financial assets (1 089) (589) ....) ....) ....)
Net cash from (used by) investing activities (1 089) (589) ....) ....) ....)
Net increase (decrease) in cash and cash
equivalents held (20) (1 230) (92) (382) (1 088)
Cash and deposits at the beginning of the
reporting period 2 581) 2 239) 1 009) 917) 535)
Cash and deposits at the end of the reporting
period 2 561) 1 009) 917) 535) (553)
Notes: 1. The decrease in Grants in 2016-17 reflects the completion of the Prosser River Entrance Stabilisation - Stage 1 project.
The further decrease in 2017-18 reflects the completion of the St Helens Barway Stabilisation - Stage 2. 2. The decrease in Sales of goods and services in 2016-17 reflects the timing of recreational boating licence renewals
which occur every three years with the next renewal due on 30 June 2018. 3. The decrease in Sales of goods and services across the Forward Estimates compared to the 2015-16 Budget reflects
a reduction in commercial vessel annual administration fees due to MAST's transition out of commercial vessel service delivery.
4. The increase in Employee benefits in 2016-17 and 2017-18 reflects anticipated one off payments to staff due to MAST's changing staff levels resulting from its transition out of commercial vessel service delivery.
5. The decrease in Supplies and consumables reflects revised estimates based on 30 June 2015 actuals.


Royal Tasmanian Botanical Gardens 89
23 ROYAL TASMANIAN
BOTANICAL GARDENS
AUTHORITY OUTLINE The Royal Tasmanian Botanical Gardens (RTBG) is a Statutory Authority, governed by the Royal Tasmanian
Botanical Gardens Act 2002 (RTBG Act). The RTBG Board, comprising seven members, is appointed by the
Minister and is responsible for managing, conserving and enhancing the RTBG in accordance with the RTBG
Act.
The responsible Minister is the Minister for Environment, Parks and Heritage, Hon Matthew Groom MP, and
the supporting Agency is the Department of Primary Industries, Parks, Water and Environment.
The vision of the RTBG is to create and maintain an exceptional garden that enriches Tasmania's social and
cultural life, showcases and contributes to the conservation of the flora of Tasmania and educates the
community about the importance of plants.
The mission of the RTBG is to sustainably manage the RTBG, conserve and develop the RTBG's living
heritage collections of plants, and create and deliver an exemplary and enlightening visitor experience and
thriving organisational culture.
This chapter provides the RTBG's financial information for 2016-17 and over the Forward Estimates period
(2017-18 to 2019-20). Further information on the RTBG is provided at www.rtbg.tas.gov.au.

90 Royal Tasmanian Botanical Gardens
KEY DELIVERABLES
The key deliverables for the RTBG include:
implementing the Board's Business Operational Plan for 2016-2021 and continuing the implementation of
the Strategic Master Plan and its associated recommendations;
developing and implementing sustainable business strategies aimed at increasing donations and
self-generated revenue;
planning and fundraising for the RTBG's Bicentenary in 2018;
developing and implementing a new Promotions and Marketing Plan;
conducting a structural and operational review of the organisation with the aim of ensuring the most efficient
and effective use of resources;
reviewing the strategic direction of the RTBG's education, learning and interpretation programs;
continuing to develop community engagement programs based around the Tasmanian Community Food
Garden and other aspects of the RTBG's operations; and
the ongoing operation of the Tasmanian Seed Conservation Centre and its associated research projects
in partnership with the Royal Botanic Gardens Kew in London; the Department of Primary Industries, Parks,
Water and Environment; the University of Tasmania; the Tasmanian Museum and Art Gallery Herbarium
and the Australian Seed Bank Partnership. The RTBG will continue to identify and secure ongoing funding
for targeted collection and research programs both locally and in conjunction with the Australian Seed
Bank Partnership.

Royal Tasmanian Botanical Gardens 91
DETAILED BUDGET STATEMENTS
Table 23.1: Statement of Comprehensive Income
2015-16)
Budget)
2016-17)
Budget)
2017-18)
Forward)
Estimate)
2018-19)
Forward)
Estimate)
2019-20)
Forward)
Estimate)
$'000) $'000) $'000) $'000) $'000)
Revenue and other income from transactions
Grants1 2 684) 2 665) 2 749) 2 828) 2 894)
Sales of goods and services 551) 593) 604) 618) 630)
Interest 25) 35) 35) 35) 35)
Other revenue2 258) 80) 82) 84) 86)
Total revenue and other income from transactions 3 518) 3 373) 3 470) 3 565) 3 645)
Expenses from transactions
Employee benefits3 2 582) 2 451) 2 512) 2 575) 2 638)
Depreciation and amortisation 303) 303) 303) 303) 303)
Supplies and consumables4 1 519) 910) 928) 942) 956)
Total expenses from transactions 4 404) 3 664) 3 743) 3 820) 3 897)
Net result from transactions (net operating
balance) (886) (291) (273) (255) (252)
Other economic flows included in net result
Net gain/(loss) on non-financial assets 10) ....) ....) ....) ....)
Total other economic flows included in net result 10) ....) ....) ....) ....)
Net result (876) (291) (273) (255) (252)
Comprehensive result (876) (291) (273) (255) (252)
Notes: 1. The decrease in Grants in 2016-17 reflects the completion of essential infrastructure maintenance funding. 2. The decrease in Other revenue reflects the completion of major projects funded by donations. 3. The decrease in Employee benefits in 2016-17 reflects revised estimates based on 30 June 2015 actuals. 4. The decrease in Supplies and consumables from 2016-17 reflects the completion of several major projects in 2015-16
including: infrastructure maintenance projects, the construction of the 24 Carrot School Gardens and the RTBG restaurant renovations.

92 Royal Tasmanian Botanical Gardens
Table 23.2: Statement of Financial Position as at 30 June
2016)
Budget)
2017
Budget1)
2018)
Forward)
Estimate)
2019)
Forward)
Estimate)
2020)
Forward)
Estimate)
$'000) $'000) $'000) $'000) $'000)
Assets
Financial assets
Cash and deposits 673) 695) 717) 757) 800)
Receivables 43) 16) 18) 20) 31)
716) 711) 735) 777) 831)
Non-financial assets
Inventories 116) 91) 91) 91) 96)
Property, plant and equipment 6 240) 7 006) 6 858) 6 705) 6 552)
Infrastructure 3 309) 3 330) 3 200) 3 070) 2 940)
9 665) 10 427) 10 149) 9 866) 9 588)
Total assets 10 381) 11 138) 10 884) 10 643) 10 419)
Liabilities
Payables 142) 69) 88) 102) 130)
Employee benefits 629) 578) 578) 578) 578)
Other liabilities 89) ....) ....) ....) ....)
Total liabilities 860) 647) 666) 680) 708)
Net assets (liabilities) 9 521) 10 491) 10 218) 9 963) 9 711)
Equity
Reserves 10 237) 10 895) 10 895) 10 895) 10 895)
Accumulated funds (716) (404) (677) (932) (1 184)
Total equity 9 521) 10 491) 10 218) 9 963) 9 711)
Note: 1. The variation in statement items between 2016 Budget and 2017 Budget reflect revised estimates based on
30 June 2015 actuals.

Royal Tasmanian Botanical Gardens 93
Table 23.3: Statement of Cash Flows
2015-16)
Budget)
2016-17)
Budget)
2017-18)
Forward)
Estimate)
2018-19)
Forward)
Estimate)
2019-20)
Forward)
Estimate)
$'000) $'000) $'000) $'000) $'000)
Cash flows from operating activities
Cash inflows
Grants1 2 684) 2 665) 2 749) 2 828) 2 894)
Sales of goods and services 549) 592) 602) 616) 628)
GST receipts 171) 92) 95) 96) 98)
Interest received 25) 35) 35) 35) 35)
Other cash receipts2 275) 98) 94) 96) 98)
Total cash inflows 3 704) 3 482) 3 575) 3 671) 3 753)
Cash outflows
Employee benefits3 (2 326) (2 196) (2 251) (2 307) (2 365)
Superannuation (256) (255) (261) (268) (273)
GST payments (171) (92) (95) (96) (98)
Supplies and consumables4 (1 717) (907) (926) (940) (954)
Total cash outflows (4 470) (3 450) (3 533) (3 611) (3 690)
Net cash from (used by) operating activities (766) 32) 42) 60) 63)
Cash flows from investing activities
Payments for acquisition of non-financial assets3 (60) (10) (20) (20) (20)
Proceeds from the disposal of non-financial assets3 15) ....) ....) ....) ....)
Net cash from (used by) investing activities (45) (10) (20) (20) (20)
Net increase (decrease) in cash and cash
equivalents held (811) 22) 22) 40) 43)
Cash and deposits at the beginning of the
reporting period 1 484) 673) 695) 717) 757)
Cash and deposits at the end of the reporting
period 673) 695) 717) 757) 800)
Notes: 1. The decrease in Grants in 2016-17 reflects the completion of essential infrastructure maintenance funding. 2. The decrease in Other cash receipts reflects the completion of major projects funded by donations. 3. The variations in Employee benefits, Payments for acquisition of non-financial assets and Proceeds from the disposal
of non-financial assets reflect revised estimates based on 30 June 2015 actuals. 4. The decrease in Supplies and consumables from 2016-17 reflects the completion of several major projects in 2015-16
including: infrastructure maintenance projects, the construction of the 24 Carrot School Gardens and the RTBG restaurant renovations.


State Fire Commission 95
24 STATE FIRE COMMISSION
AUTHORITY OUTLINE The State Fire Commission's primary purpose is to minimise the social, economic and environmental impact
of fire on the Tasmanian community. This is pursued through the provision of a rapid and effective response
to emergencies and through the delivery of a broad range of fire prevention, reduction and safety programs.
The Commission is also responsible for:
road crash rescue (in Hobart, Launceston, Burnie, Devonport and surrounding areas);
managing incidents involving hazardous materials;
providing an Urban Search and Rescue capability to manage the rescue of people from collapsed buildings
and structures; and
providing a rescue/mitigation response to terrorist incidents involving chemical, biological and radiological
agents.
A Fuel Reduction Unit (FRU) has been established within the Tasmania Fire Service, and has a key role in
coordinating the implementation of the Fuel Reduction Program across the whole-of-Government.
The State Fire Commission reports to the Minister for Police, Fire and Emergency Management,
Hon Rene Hidding MP, and the supporting agency is the Department of Police, Fire and Emergency
Management. The Commission delivers all of its services through its operational arm, the Tasmania Fire
Service.
This chapter provides the State Fire Commission's financial information for 2016-17 and over the Forward
Estimates period (2017-18 to 2019-20). Further information on the Commission can be found at
www.fire.tas.gov.au.

96 State Fire Commission
KEY DELIVERABLES Table 24.1 provides a summary of the Budget and Forward Estimate allocations for key deliverables by the
Commission.
Table 24.1: Key Deliverables Statement
2016-17 2017-18 2018-19 2019-20
Budget
Forward
Estimate
Forward
Estimate
Forward
Estimate
$'000 $'000 $'000 $'000
Bushfire Ready Neighbourhoods Program 577 588 600 612
Fire Fighting Appliance Replacement Program 3 200 3 450 4 150 3 200
Fire Station Build Program 2 000 1 330 1 095 1 000
Fuel Reduction Program1 9 000 9 000 .... ....
Information Technology Replacement Program 390 390 340 390
State Emergency Service Transition to the Tasmania Fire Service2 2 012 1 431 .... ....
State Fire Management Council 622 634 647 660
Notes: 1. The program is funded until 2017-18 and the program will be reviewed during 2016-17 with ongoing funding to be
considered in the context of future budgets. 2. Funding for two years has been provided by the Government to assist in the transition of the State Emergency Service
to the State Fire Commission whilst a longer term sustainable funding model is developed.
Bushfire Ready Neighbourhoods Program
The Bushfire Ready Neighbourhoods Program commenced in 2013-14. This Program is included in the
Commission's corporate plan at a total cost of $2.4 million. For many years, the Commission has been
providing high quality bushfire information, which has led to an increase in awareness of bushfire risk and
intention to take appropriate action. However, there are still many households in Tasmania that are not
prepared for bushfire. This Program engages with people in bushfire-prone communities, and strengthens
community networks and community members' capacity to prepare for bushfires.
Fire Fighting Appliance Replacement Program
The Commission is committed to providing its fire fighters with safe and operationally effective fire trucks,
allocated using a 'fitness for purpose' rationale. Each appliance category has an established, defined role and
functionality, with a specific scope of application which is considered in the process of allocation to brigades
matched to risk. The Commission has an endorsed rolling and sustainable fire truck replacement program
that will ultimately result in a decline in the maximum age of its operational fleet of trucks and ensure that all
trucks remain viable for operations in a safe and effective manner.
Total funding of $14 million over a four year period has been allocated to the Fire Fighting Appliance
Replacement Program, which will see the light tanker category of appliances upgraded with the
commissioning of 32 internally designed and fabricated appliances, allowing the decommissioning of
32 ageing light tanker appliances in excess of 30 years of age. The program will see the internal design and
fabrication of up to 65 tanker appliances of medium and heavy category, enhanced with compressed air foam
(CAF) capability once again replacing ageing appliances in these categories.

State Fire Commission 97
The Budget allows for the purchase of one new aerial platform, and funds the majority of the second aerial
appliance during this period.
Fire Station Build Program
Total funding of $5.4 million has been allocated over the next four years for capital upgrades to Commission
facilities which will include a combination of replacement and refurbishment of fire stations. One of the key
outcomes of the program will be further reducing the exposure to diesel particulate through better station
design; this will include the separation of fire fighter's personal protective clothing from firefighting appliance
diesel exhaust. This separation provides the added benefit of further eliminating any exposure to the possibility
of residual contaminants in protective clothing used in firefighting. This measure is consistent with mitigating
actions related to presumptive legislation for cancer in fire fighters.
Fuel Reduction Unit
The Government has committed to significantly increase fuel reduction burning across the State. Strategically
reducing risk in the areas that provide the most protection to communities is the priority; therefore, areas of
both private and public land are included - a 'tenure-blind' approach.
Funding has been transferred from the Department of Primary Industry, Parks, Water and Environment to the
Department of Police, Fire and Emergency Management from 2016-17 for two years and is reflected in
chapter 7 of this Budget Paper. The program is funded until 2017-18 and the program will be reviewed during
2016-17 with ongoing funding to be considered in the context of future budgets.
A Fuel Reduction Unit (FRU) has been established within the Tasmania Fire Service, and has a key role in
coordinating the implementation of the program across the whole-of-Government. The Fuel Reduction
Program utilises the resources of the Tasmania Fire Service, the Parks and Wildlife Service, Forestry
Tasmania and local councils to mitigate bushfire risk in a strategic, systematic way in urban, semi-rural and
some wilderness areas.
Of the Government's election commitment, which allocated total funding of $28.5 million over four years from
2014-15, remaining funding of $18 million will be expended in 2016-17 and 2017-18. The program takes a
strategic approach, and whilst other fuel treatments can and will be employed (for example mechanical
removal), planned burning remains the most cost effective tool available for managing vegetation fuel loads,
at the scale that is currently required.
Information Technology Replacement Program
The Information Technology infrastructure budget for 2016-17 will focus on integration of centralised server
and storage capacity. This will follow the whole-of-government strategy towards the 'Tasmanian Cloud' policy.
There will also be progression on network connection improvements and end user device replacements.
State Emergency Service Transition to the Tasmania Fire Service
Funding for two years has been provided by the Government to assist in the transition of the State Emergency
Service to the State Fire Commission whilst sustainable funding options are developed. Management
arrangements were revised in 2014-15 and the State Emergency Service now reports through the State Fire
Commission.
The additional funding has been provided to the Department of Police, Fire and Emergency Management and
is reflected in chapter 7 of this Budget Paper.

98 State Fire Commission
State Fire Management Council
The State Fire Management Council (SFMC) is an independently chaired body established under section 14
of the Fire Service Act 1979. It has the following functions:
to develop a state vegetation fire management policy to be used as the basis for all fire management
planning;
to advise and report regularly to the Minister on such matters relating to the administration of the Fire
Service Act, as it applies to vegetation fire management; and
to provide advice to the State Fire Commission regarding the prevention and mitigation of vegetation fires.
Legislative amendments in 2012 increased the roles and responsibilities of the SFMC, particularly in regard
to re-establishing Fire Management Area Committees (FMACs) with broader strategic fire management goals.
In order to meet these enhanced responsibilities, the Commission provides the necessary bushfire planning
and risk assessment expertise, and administrative support to both the SFMC and FMACs.
The SFMC plays a key role in the development of implementation strategies to deliver the Government's Fuel
Reduction Program that delivers a tenure blind, risk based program of burns to reduce fuel in the areas that
pose the greatest risk to the Tasmanian community. The State Fire Commission will contribute an additional
$622 000 in 2016-17, including $398 000 for the employment of four staff to support the Fuel Reduction Unit.
2016 Bushfire Emergency
During 2015-16, significant additional funding has been provided by the Government to assist in managing
the costs associated with the January 2016 bushfires. To date, total additional funding of $31 million has been
provided to the Tasmania Fire Service in response to the bushfire emergency. This funding comprised
$21 million in Requests for Additional Funds and $10 million within the Consolidated Fund Appropriation
(Supplementary Appropriation for 2015-16) Act 2016.
The Tasmania Fire Service is continuing the process of finalising the total costs of the January 2016 bushfires.
At this time, there remains a significant level of uncertainty in relation to the total cost and timing of further
funding requirements. In particular, the level of costs and timing of payments relating to assistance provided
by interstate firefighters and other jurisdictions are yet to be finalised. As a result, there is a potential for
additional funding to be required in coming months.
The State will be reimbursed by the Australian Government for some costs relating to the bushfires under the
Natural Disaster Relief and Recovery Arrangements (NDRRA). There is also potential for some costs
associated with the bushfires to be reimbursed through claims made under the Tasmanian Risk Management
Fund (TRMF). Whilst work in relation to progressing claims under both the NDRRA and TRMF is continuing,
an estimate of receipts from the Australian Government under the NDRRA of $13 million in 2016-17 has been
included in the 2016-17 Budget within Finance-General.

State Fire Commission 99
DETAILED BUDGET STATEMENTS
Table 24.2: Statement of Comprehensive Income
2015-16)
Budget)
2016-17)
Budget)
2017-18)
Forward)
Estimate)
2018-19)
Forward)
Estimate)
2019-20)
Forward)
Estimate)
$'000) $'000) $'000) $'000) $'000)
Revenue and other income from transactions
Grants1 4 989) 6 062) 5 506) 4 100) 4 125)
Taxation 64 689) 67 197) 70 210) 72 889) 75 975)
Sales of goods and services 5 874) 6 001) 6 121) 6 244) 6 369)
Fees and fines2 ....) 164) 167) 171) 174)
Interest 51) 10) 10) 10) 11)
Other revenue3 1 573) 10 403) 10 432) 1 461) 1 490)
Total revenue and other income from transactions 77 176) 89 837) 92 446) 84 875) 88 144)
Expenses from transactions
Employee benefits3,4 48 024) 52 454) 53 477) 51 926) 53 150)
Depreciation and amortisation 6 937) 6 879) 6 666) 6 539) 6 390)
Supplies and consumables3,5 21 887) 28 772) 29 204) 23 266) 23 528)
Borrowing costs 330) 418) 397) 393) 393)
Other expenses5 3 892) 2 943) 3 061) 3 128) 3 191)
Total expenses from transactions 81 070) 91 466) 92 805) 85 252) 86 652)
Net result from transactions (net operating balance) (3 894) (1 629) (359) (377) 1 492)
Net result (3 894) (1 629) (359) (377) 1 492)
Other economic flows - other non-owner changes in
equity
Other movements taken directly to equity6 ....) (505) ....) ....) ....)
Total other economic flows - other non-owner
changes in equity ....) (505) ....) ....) ....)
Comprehensive result (3 894) (2 134) (359) (377) 1 492)
Notes: 1. The increase in Grants in 2016-17 and 2017-18 reflects the additional two years of SES expenditure as part of the
State Emergency Service Transition to the Tasmania Fire Service. The decrease in 2018-19 reflects the cessation of this funding.
2. The increase in Fees and fines in 2016-17 is due to the reclassification of building inspection fees from Other revenue. 3. The increase in Other revenue, Employee benefits and Supplies and consumables in 2016-17 and 2017-18 reflects
the transfer of Fuel Reduction funding from the Department of Police, Fire and Emergency Management, and the expenditure of this funding by the Fuel Reduction Unit. The Fuel Reduction Program is funded until 2017-18 and the program will be reviewed during 2016-17 with ongoing funding to be considered in the context of future budgets. Given the responsibility for the FRU in the Tasmania Fire Service, it is appropriate that the funding be transferred to the Commission.

100 State Fire Commission
4. The increase in Employee benefits in 2016-17 also reflects award increases for salaries. 5. The increase in Supplies and consumables in 2016-17 also reflects the reclassification of cost of sales from Other
expenses. 6. The Other movements taken directly to equity in 2016-17 reflects the timing of movements in the Commission's
superannuation liability.
Table 24.3: Statement of Financial Position as at 30 June
2016)
Budget)
2017)
Budget)
2018)
Forward)
Estimate)
2019)
Forward)
Estimate)
2020)
Forward)
Estimate)
$'000) $'000) $'000) $'000) $'000)
Assets
Financial assets
Cash and deposits 505) (1 152) (220) 87) 3 259)
Receivables 1 522) 1 816) 1 816) 1 816) 1 816)
Other financial assets1 1 743) 1 657) 1 657) 1 657) 1 657)
3 770) 2 321) 3 253) 3 560) 6 732)
Non-financial assets
Inventories 1 438) 1 634) 1 634) 1 634) 1 634)
Property, plant and equipment2 102 303) 104 016) 103 324) 103 240) 102 359)
Other assets 1 211) 1 446) 1 446) 1 446) 1 446)
104 952) 107 096) 106 404) 106 320) 105 439)
Total assets 108 722) 109 417) 109 657) 109 880) 112 171)
Liabilities
Payables3 1 664) 2 336) 2 336) 2 336) 2 536)
Interest bearing liabilities 4 830) 4 830) 4 830) 4 830) 4 830)
Employee benefits 15 022) 15 766) 16 365) 16 965) 17 564)
Superannuation4 1 176) 316) 316) 316) 316)
Other liabilities5 323) ....) ....) ....) ....)
Total liabilities 23 015) 23 248) 23 847) 24 447) 25 246)
Net assets (liabilities) 85 707) 86 169) 85 810) 85 433) 86 925)
Equity
Reserves2 17 732) 18 916) 18 916) 18 916) 18 916)
Accumulated funds 67 975) 67 253) 66 894) 66 517) 68 009)
Total equity 85 707) 86 169) 85 810) 85 433) 86 925)
Notes: 1. The decrease in Other financial assets reflects a more accurate estimate for accrued revenue based on the
30 June 2015 outcome. 2. The increase in Property, plant and equipment and Reserves in 2017 reflects a more accurate estimate of assets
based on the 30 June 2015 outcome.

State Fire Commission 101
3. The increase in Payables in 2016-17 is due to the reclassification of income received in advance from Other liabilities and anticipated increases in trade creditors.
4. The decrease in Superannuation in 2016-17 reflects a more accurate estimate for the defined benefit superannuation plan based on the 30 June 2015 outcome.
5. The decrease in Other liabilities in 2016-17 is due to the reclassification of income received in advance to Payables.

102 State Fire Commission
Table 24.4: Statement of Cash Flows
2015-16)
Budget)
2016-17)
Budget)
2017-18)
Forward)
Estimate)
2018-19)
Forward)
Estimate)
2019-20)
Forward)
Estimate)
$'000) $'000) $'000) $'000) $'000)
Cash flows from operating activities
Cash inflows
Grants1 4 989) 6 062) 5 506) 4 100) 4 125)
Taxation 64 689) 65 276) 68 173) 70 770) 73 730)
Sales of goods and services 5 874) 6 001) 6 121) 6 244) 6 369)
Fees and fines2 ....) 164) 167) 171) 174)
GST receipts3 ....) 1 895) 1 868) 1 939) 1 852)
Interest received 51) 10) 10) 10) 11)
Other cash receipts4 1 274) 10 404) 10 432) 1 461) 1 490)
Total cash inflows 76 877) 89 812) 92 277) 84 695) 87 751)
Cash outflows
Employee benefits4,5 (42 669) (47 126) (47 960) (46 291) (47 402)
Superannuation (5 355) (5 328) (5 517) (5 635) (5 748)
Borrowing costs (330) (418) (397) (393) (393)
GST payments3 ....) (1 895) (1 868) (1 939) (1 852)
Supplies and consumables4 (24 247) (26 561) (27 077) (21 057) (20 993)
Other cash payments (2 943) (2 943) (3 061) (3 128) (3 191)
Total cash outflows (75 544) (84 271) (85 880) (78 443) (79 579)
Net cash from (used by) operating activities 1 333) 5 541) 6 397) 6 252) 8 172)
Cash flows from investing activities
Payments for acquisition of non-financial assets (4 120) (6 320) (5 765) (6 245) (5 300)
Proceeds from the disposal of non-financial assets 300) 300) 300) 300) 300)
Net cash from (used by) investing activities (3 820) (6 020) (5 465) (5 945) (5 000)
Cash flows from financing activities
Net borrowings 1 500) ....) ....) ....) ....)
Net cash from (used by) financing activities 1 500) ....) ....) ....) ....)
Net increase (decrease) in cash and cash
equivalents held (987) (479) 932) 307) 3 172)
Cash and deposits at the beginning of the reporting
period 1 492) (673) (1 152) (220) 87)
Cash and deposits at the end of the reporting
period 505) (1 152) (220) 87) 3 259)

State Fire Commission 103
Notes: 1. The increase in Grants in 2016-17 and 2017-18 reflects the additional two years of SES expenditure as part of the
State Emergency Service Transition to the Tasmania Fire Service. 2. The increase in Fees and fines in 2016-17 is due to the reclassification of building inspection fees from Other cash
receipts. 3. The increase in GST receipts and GST payments in 2016-17 reflects the introduction of GST items which had
previously not been recognised in the Budget estimates. 4. The increase in Other cash receipts, Employee benefits and Supplies and consumables in 2016-17 and 2017-18
reflects the transfer of Fuel Reduction funding from the Department of Police, Fire and Emergency Management, and the expenditure of this funding by the Fuel Reduction Unit. The Fuel Reduction Program is funded until 2017-18 and the program will be reviewed during 2016-17 with ongoing funding to be considered in the context of future budgets. Given the responsibility for the FRU in the Tasmania Fire Service, it is appropriate that the funding be transferred to the Commission.
5. The increase in Employee benefits in 2016-17 also reflects award increases for salaries.


Tasmanian Health Service 105
25 TASMANIAN HEALTH
SERVICE
AUTHORITY OUTLINE The Tasmanian Health Service (THS) commenced operation on 1 July 2015. The THS is a separate legal
entity under the Tasmanian Health Organisation Act 2011 (the Act) and is governed by the requirements of
this Act.
The THS features a Governing Council, comprising a chairperson and skills based members with a spread of
regional representation, and a CEO supported by local managers to coordinate statewide services at the local
level.
The THS is responsible for delivering integrated services aimed at maintaining and improving the health and
wellbeing of Tasmanians. Under the Act, the responsible Ministers are the Minister for Health, Hon Michael
Ferguson MP, and the Treasurer, Hon Peter Gutwein MP.
The functions of the THS include:
improving, promoting, protecting and maintaining the health of Tasmanians as required by its Service
Agreement;
managing public hospitals, health institutions, health services and health support services;
achieving and maintaining standards of patient care and delivery of services;
providing training and education relevant to the provision of health services;
undertaking research and development relevant to the provision of health services; and
collecting and providing health data for reporting and research purposes.
In addition to these functions, the THS is responsible for the implementation of the Tasmanian Clinical
Services Profile and will drive decisions about services that are in the best interests of Tasmania as a whole.
Funding for the THS is provided by both the State and Australian Governments. All Australian Government
and State Activity Based Funding (ABF) flows through the National Health Funding Pool, which is overseen
by an independent statutory office holder known as the Administrator. Block funding for some activities is paid
to the THS via a State-managed Fund. In addition to State and Australian Government funding, the THS also
generates its own revenue to fund some of its activities.
This chapter provides financial information for 2016-17 and over the Forward Estimates period (2017-18 to
2019-20) for the THS.

106 Tasmanian Health Service
KEY DELIVERABLES Table 25.1 provides a summary of the Budget and Forward Estimates allocations for key deliverables within
the THS.
Table 25.1: Key Deliverables Statement
2016-17
Budget
2017-18
Forward
Estimate
2018-19
Forward
Estimate
2019-20
Forward
Estimate$'000 $'000 $'000 $'000
Minister for Health
Hospital Alternative Program 1 450 1 000 …. ….
North West Regional Cancer Centre 3 800 4 100 4 500 4 500
Nurse Graduates - Additional Transition to Practice Placements 1 260 2 610 .... ….
One Health System - Additional Investment 8 000 7 500 7 000 7 000
Patients First 1 000 1 000 1 000 1 000
Rebuilding Health Services - Elective Surgery Program 20 000 20 000 …. ….
Hospital Alternative Program
This 2014 election commitment provided funding of $3 million to help keep people with chronic/complex illness
out of hospital, by providing them with quality care in the community. Initiatives under this program will be
implemented as part of the One Health System reforms.
As a component of this funding allocation, a proof of concept trial of a Community Rapid Response Service
in the Launceston area commenced during 2015-16. The Service provides treatment for people who need
short-term intermediate care that can be safely delivered in the community in partnership with their GP. The
service is targeted at people with acute illness or whose chronic/complex condition has deteriorated, which
would otherwise see them presented at an emergency department and, ultimately, admitted to hospital.
North West Regional Cancer Centre
The North West Regional Cancer Centre opened during 2015-16 as part of the Statewide Cancer Project.
Additional funding was provided in the 2015-16 Budget for the operating costs associated with the North West
component of the Northern Integrated Cancer Service.
Under the Northern Integrated Cancer Service, the North West Regional Cancer Centre in Burnie and Holman
Clinic in Launceston will work closely together to provide improved services across the North and North West
of the State. Through the development of a critical mass of specialists, the new linear accelerator will be
opened and operated at the North West Regional Hospital to provide radiation oncology treatment to cancer
sufferers.
The Budget funding allocations have been adjusted to reflect a revised service profile, with the North West
Cancer Centre now envisaged to be fully operational earlier than previously anticipated.

Tasmanian Health Service 107
Nurse Graduates - Additional Transition to Practice Placements
This 2014 election commitment provided $5.4 million over four years for additional Transition to Practice
Placements for nursing graduates. This will enable the employment of up to 85 additional graduate nurses
across the State over four years.
One Health System - Additional Investment
Additional funding of $29.5 million over four years is provided to support One Health System reforms.
Investment will be directed to the highest priority service reconfiguration as identified in the White Paper and
Clinical Services Profile (CSP) Implementation Plan.
Actions funded under this investment may include:
consolidation of clinical services into sites that are equipped and capable of delivering services safely and
efficiently;
consolidation of all birthing and inpatient maternity services to a single site in the North West;
refocusing the Mersey Community Hospital (MCH) towards sub-acute services and establishing the MCH
as an elective surgery centre; and
reconfiguration of existing services which will deliver optimal benefits to patients and improve efficiency.
Patients First
Additional funding of $1 million per annum is provided to the THS for the Patients First initiative to support the
implementation of actions to ensure patients receive timely care in emergency departments at the Royal
Hobart Hospital (RHH) and the Launceston General Hospital. This funding allocation supports the Patients
First actions, including:
the employment of Clinical Initiative Nurses to actively monitor and provide advice to patients and their
families whilst they are in an emergency department waiting room, including developing plans of care for
patients in consultation with emergency department doctors; and
the continuation of Psychiatric Emergency Nurses (PEN) at the RHH, following the cessation of Australian
Government funded PEN positions.
Rebuilding Health Services - Elective Surgery Program
This 2014 election commitment provided $76 million over four years for additional elective surgery with a focus
on the reduction of waiting lists. This commitment will improve the quality of life for thousands of Tasmanians
by ensuring patients get their operations sooner.

108 Tasmanian Health Service
OUTPUT INFORMATION Outputs of the THS are provided under:
Output Group 1 - Tasmanian Health Service.
Table 25.2 provides an Output Group Expense Summary for the THS.
Table 25.2: Output Group Expense Summary
2015-16)
Budget)
2016-17)
Budget)
2017-18)
Forward)
Estimate)
2018-19)
Forward)
Estimate)
2019-20)
Forward)
Estimate)
$'000) $'000) $'000) $'000) $'000)
Minister for Health
Output Group 1 - Tasmanian Health Service
1.1 Admitted Services1 760 331) 772 698) 765 352) 762 657) 793 870)
1.2 Non-admitted Services2 154 239) 167 534) 172 481) 173 109) 177 324)
1.3 Emergency Department Services3 122 114) 115 194) 115 073) 116 715) 119 447)
1.4 Community and Aged Care Services4 200 907) 194 407) 189 461) 188 987) 191 327)
1.5 Statewide and Mental Health Services 116 803) 116 813) 118 472) 121 378) 123 410)
1.6 Forensic Medicine Service 1 242) 1 435) 1 477) 1 654) 1 698)
1 355 636) 1 368 081) 1 362 316) 1 364 500) 1 407 076)
TOTAL 1 355 636) 1 368 081) 1 362 316) 1 364 500) 1 407 076)
Notes: 1. The decrease in Admitted Services in 2017-18 primarily reflects the completion of various National Partnership
Agreements (NPAs) including Improving Health Services in Tasmania - Schedule A - Reforming Elective Surgery in Tasmania; and completion of the Training More Specialist Doctors in Tasmania initiative which was funded by the Australian Government through the medical professional colleges. The decrease in 2018-19 primarily reflects the completion of the Rebuilding Health Services - Elective Surgery Program. The increase in 2019-20 reflects the impact of additional depreciation as a result of the transfer of the completed RHH Redevelopment to the THS in 2018-19.
2. The increase in Non-admitted Services primarily reflects updates to revenue and expenditure under the Highly Specialised Drug Program, Private Patient Scheme and research grants.
3. The decrease in Emergency Department Services primarily reflects the completion of the NPA on Improving Health Services in Tasmania - Schedule E - Improving Patient Pathways through Clinical and System Redesign.
4. The decreases in Community and Aged Care Services in 2016-17 and 2017-18 primarily reflect the completion of NPA and Commonwealth Own Purpose Expenditure (COPE) agreements including Improving Health Services in Tasmania - Schedule D - Better Access to Palliative Care, Adult Public Dental Services and Rural Primary Health Services Program; and cessation of the Child Dental Benefits Schedule. The Australian Government has announced a commitment to the continued funding of dental services beyond 30 June 2016. However, this commitment has not yet been ratified with the states and territories.

Tasmanian Health Service 109
Output Group 1: Tasmanian Health Service
1.1 Admitted Services
This Output provides admitted acute, sub-acute and non-acute inpatient services (elective and non-elective)
provided by Tasmania's major public hospitals to patients either admitted to a ward or in an out-of-hospital
setting. It excludes designated mental health wards in major public hospitals.
1.2 Non-admitted Services
This Output provides non-admitted services, including ambulatory acute and sub-acute services provided by
Tasmania's major public hospitals either on-site or in an out-of-hospital setting. This includes the provision of
Cancer Screening Services.
1.3 Emergency Department Services
This Output provides services relating to emergency presentations at Tasmania's major public hospital
emergency departments.
1.4 Community and Aged Care Services
This Output comprises rural hospitals, residential aged care and community health based services including:
rehabilitation, allied health assessments and case management; and
community nursing, continence, orthotics and prosthetics services, and equipment schemes.
In addition, community palliative care services provide interdisciplinary care, support and counselling to people
living with life limiting illnesses and their families. These services are provided in a community health centre
or home-based environment.
Emergency and general oral care and dentures to eligible adults (holders of Health Care or Pensioner
Concession cards) and all children under the age of 18 years, as well as a range of health promotion and
prevention activities are also provided through this Output.
1.5 Statewide and Mental Health Services
This Output provides services to clients and their families to treat, support and manage mental health
disorders. The service also provides:
crisis assessment and treatment, intensive support, community care and rehabilitation services;
primary health care services in correctional facilities;
forensic mental health services to people with mental illnesses who have come into contact with the criminal justice system; and
alcohol and drug services at the individual and population level.
1.6 Forensic Medicine Services
This Output provides forensic and medical services, forensic pathology and clinical forensic medicine.

110 Tasmanian Health Service
Table 25.3: Performance Information1,2
Performance Measure
Unit of
Measure
2013-14
Actual
2014-15
Actual
2015-16
Target
2016-17
Target
Admitted Services
Admitted patients - Acute Admitted Weighted Inlier
Units3,4 Number na na
94 659 96 552
Elective surgery patients seen on time5
Category 16 % 74.3 74.6 90.0 90.0
Category 26 % 49.3 49.4 70.0 70.0
Category 36 % 75.0 72.0 70.0 70.0
Elective surgery patients - average overdue wait
time for those waiting beyond the recommended
time5
Category 17 Days 35.8 21.5 24.0 21.5
Category 27 Days 167.1 146.5 157.5 150.0
Category 37 Days 352.2 181.3 132.6 130.0
Elective surgery baseline admissions8 Number 14 670 14 325 14 126 14 126
Hand hygiene compliance9 % na 77.5 70.0 75.0
Healthcare associated staphylococcus aureus
(including MRSA) bacteraemia (rate per 10 000
patient days)10 Rate na 0.8 2.0 2.0
Cost per weighted separation11 $ 5 171 5 419 5 217 5 348
Non-admitted Services
Outpatient attendances12 Number 482 870 487 136 492 356 504 665
Emergency Department Services
Department of Emergency Medicine
presentations13 Number 148 405 150 350 155 080 159 732
Emergency Department (ED) patients who are
admitted, referred for treatment or discharged
within four hours14 % 67.5 66.4
65.4 65.4
Percentage of all ED patients seen within the
recommended triage time14 % 72.8 70.0
64.2 64.2

Tasmanian Health Service 111
Table 25.3: Performance Information1,2 (continued)
Performance Measure
Unit of
Measure
2013-14
Actual
2014-15
Actual
2015-16
Target
2016-17
Target
Community and Aged Care15
Rural hospitals - separations Number 4 570 4 660 4 700 4 700
Rural hospitals - occupancy rate16 % na 55.0 55.0 55.0
Community nursing - occasions of service17 Number 208 300 173 027 176 488 180 018
Residential aged care - occupancy rate % na 78.0 78.0 78.0
Aged Care Assessment Program - completed
assessments18 Number 5 090 4 950 5 000 4 500
Oral Health Services19
Adults - occasions of service - general Number 8 810 15 551 15 390 10 496
Adults - occasions of service - episodic Number 32 230 32 670 32 461 28 705
Adults - occasions of service - dentures Number 15 145 18 933 19 925 15 041
Children - occasions of service Number 64 485 66 239 65 730 63 975
General (adults) waiting list Number 14 615 9 246 7 618 7 230
Dentures waiting list Number 1 455 819 791 1 137
Mental Health and Alcohol and Drug Services20
Inpatient Separations Number 2 020 2 090 2 136 2 136
Community and Residential - active clients Number 7 665 7 845 7 665 7 800
28 day readmission rate21 % 13.5 16.4 14.7 14.7
Proportion of persons with a mental illness whose
needs are met by the Tasmanian Mental Health
Service22 % 54.7 na 50.4 51.0
Average length of acute inpatient stay Days 12.6 10.2 11.0 11.0
Alcohol and Drug Services
Alcohol and Drug Services - closed episodes of
treatment Number 1 780 1 821 1 821 1 821
Pharmacotherapy Program - total active
participants
Number 840 931 931 931
Withdrawal Unit - bed occupancy % 49.7 48.8 50.0 50.0
Withdrawal Unit - average length of stay Days 7.0 6.3 7.0 7.0
Cancer Screening
Eligible women screened for breast cancer23 Number 29 236 30 482 30 990 32 010
BreastScreen - percentage of clients assessed
within 28 days of screening % 94.2 90.4 90.0 90.0

112 Tasmanian Health Service
Notes: 1. Actual performance prior to 1 July 2015 is provided for illustrative purposes only, and details either weighted
aggregates of the performance of THOs or aggregates of previously reported performance information. The 2013-14 actual data has been updated where more accurate information is now available. Previously published targets have been updated in some instances to reflect current projections and 2014-15 actual outcomes. Refer to prior year Budget Papers for information on individual THO performance.
2. The 2016-17 THS Service Agreement had not been finalised at the time of preparation of the State Budget. Targets in the Service Agreement may therefore differ from those in this table.
3. Acute Admitted Inlier Weighted Units are consistent with the 2015-16 THS Service Agreement Key Performance Indicator Data Definition. The 2015-16 target has been updated from the prior Budget, and is projected from year-to-date coded data (January). The 2016-17 target is based on annual growth of approximately 2 per cent from the 2015-16 target.
4. From 2015-16, the targets are based on Inlier Weighted Units. Comparison with prior years is not possible, with actuals and targets based on Weighted Separations.
5. This indicator excludes additional activity funded under the NPA Improving Health Services in Tasmania – Schedule A - Reforming Elective Surgery and Rebuilding Health Services - Elective Surgery Program.
6. The 2015-16 targets have been updated and are derived from the 2015-16 Service Agreement. 7. The 2015-16 targets have been updated based on actual data as at 31 March 2016. 8. This indicator excludes additional activity funded under the NPA Improving Health Services in Tasmania - Schedule
A - Reforming Elective Surgery and Rebuilding Health Services - Elective Surgery Program. The 2015-16 target is derived from the 2015-16 THS Service Agreement.
9. The 2015-16 target represents the interim national benchmark recommended by the Australian Commission on Safety and Quality in Healthcare.
10. The 2015-16 and 2016-17 targets represent the national threshold detailed in the National Healthcare Agreement. 11. The 2015-16 and 2016-17 targets have been updated and are based on the Round 18 National Hospital Cost Data
Collection results. 12. The 2016-17 target for outpatient attendances has been amended and is projected based on annual growth of
approximately 2.5 per cent from projected 2015-16 activity. 13. The 2016-17 target for Department of Emergency Medicine presentations has been amended and is based on annual
growth of approximately 3 per cent from projected 2015-16 activity. 14. The 2015-16 target has been updated and is based on actual data as at 31 March 2016. 15. Targets are based on historical trends. 16. Occupancy is an average for all facilities and calculated from 'beds occupied daily average'. Improving the utilisation
of rural hospitals is a key action of the Government's Patients First initiative and the target for this measure will be reviewed as this policy is implemented.
17. The reduction in occasions of service from 2013-14 is the result of more accurate data from the implementation of the iPatient Manager (iPM) community program and referrals being directed to other more appropriate community services. Targets have been updated and are based on projections of current data and reflect 2 per cent growth each year.
18. Actuals are sourced from Aged Care Assessment Team (ACAT) data. Targets are projected from year-to-date results and indicate a downwards trend in assessments due to a range of factors, including ongoing changes to the Australian Government aged care system.
19. Australian Government funding has been provided under the NPA Treating More Public Dental Patients and the Child Dental Benefits Scheme (CDBS). The Australian Government has announced a commitment to the continued funding of dental services beyond 30 June 2016. However, this commitment has not yet been ratified with the states and territories. Accordingly, the 2016-17 targets do not reflect the Australian Government proposed new funding arrangements. The 2015-16 targets have been revised to reflect activity completed to 29 February 2016 and projected to 30 June 2016.
20. Targets are based on historical trends, and have been updated in some instances. 21. The 2016-17 target is based on the national average. 22. This indicator is based on the estimated 3 per cent of the Tasmanian population with severe mental illness. 23. The 2016-17 target is the sum of the targets for: (a) the 40-69 years and 75+ years age groups; and (b) the 70-74 age
group. The target for (a) is a 6 per cent growth in the 2014-15 attendance figure, reflecting growth in the demographic. The target for (b) is based on meeting Australian Government performance expectations.

Tasmanian Health Service 113
Performance Information Comments
Sections 44 and 45 of the Act detail the provisions for the Service Agreement, the key mechanism of
accountability between the Minister for Health and the THS.
The Service Agreement includes:
a schedule of services to be provided by or on behalf of the THS and the funding to be provided in relation
to the provision of those services;
performance standards, targets and measures;
standards of patient care and service delivery;
reporting requirements; and
a performance management process.
The 2016-17 Service Agreement will be finalised following the delivery of the State Budget.
THS performance in relation to the Service Agreement targets will be monitored by the Department of Health
and Human Services throughout 2016-17.
Performance monitoring through the Service Agreement process focuses on improving the efficiency and
effectiveness of service delivery, and the safety and quality of care.

114 Tasmanian Health Service
DETAILED BUDGET STATEMENTS
Table 25.4: Statement of Comprehensive Income
2015-16)
Budget)
2016-17)
Budget)
2017-18)
Forward)
Estimate)
2018-19)
Forward)
Estimate)
2019-20)
Forward)
Estimate)
$'000) $'000) $'000) $'000) $'000)
Revenue and other income from transactions
Grants1 1 459 909) 1 160 953) 1 196 348) 1 742 264) 1 187 830)
Sales of goods and services 138 458) 140 275) 145 096) 148 191) 149 487)
Interest2 ....) 302) 329) 435) 496)
Other revenue3 29 276) 30 642) 25 987) 26 013) 25 437)
Total revenue and other income from transactions 1 627 643) 1 332 172) 1 367 760) 1 916 903) 1 363 250)
Expenses from transactions
Employee benefits4 922 096) 933 086) 929 329) 940 400) 965 890)
Depreciation and amortisation5 37 536) 39 536) 40 709) 33 684) 43 148)
Supplies and consumables6 345 162) 368 281) 363 961) 361 008) 367 599)
Grants and subsidies7 40 495) 7 494) 7 665) 8 534) 9 034)
Borrowing costs8 192) ....) ....) ....) ....)
Other expenses9 10 155) 19 684) 20 652) 20 874) 21 405)
Total expenses from transactions 1 355 636) 1 368 081) 1 362 316) 1 364 500) 1 407 076)
Net result from transactions (net operating
balance) 272 007) (35 909) 5 444) 552 403) (43 826)
Net result 272 007) (35 909) 5 444) 552 403) (43 826)
Other economic flows - other non-owner changes
in equity
Changes in physical asset revaluation reserve 45 889) 48 058) 49 678) 52 800) 78 169)
Total other economic flows - other non-owner
changes in equity 45 889) 48 058) 49 678) 52 800) 78 169)
Comprehensive result 317 896) 12 149) 55 122) 605 203) 34 343)

Tasmanian Health Service 115
Notes: 1. The movements in Grants primarily reflect the transfer of completed assets from the Department to the THS, including
the RHH Redevelopment in 2018-19. The Department undertakes capital works on behalf of the THS and transfers these assets to the THS once completed. The decrease in 2016-17 predominantly reflects the THS budgeting to receive completed components of the RHH Redevelopment in 2015-16. It is noted that the methodology for the transfer of assets has been altered, and the fully redeveloped RHH is now budgeted to be received in 2018-19. In addition, estimated revenue from the Australian Government has been adjusted as a result of updates to hospital activity estimates, and the Tasmanian Government has provided additional funding for the One Health System - Additional Investment initiative. The movement in Grants also reflects the impact of NPA funding for Improving Health Services in Tasmania - Schedule A - Reforming Elective Surgery in Tasmania, Adult Public Dental Services, Improving Health Services in Tasmania - Schedule E - Improving Patient Pathways through Clinical and System Redesign and Improving Health Services in Tasmania - Schedule D - Better Access to Palliative Care.
2. The increase in Interest primarily reflects the recognition of interest earned on Private Patient Scheme balances. 3. The decrease in Other revenue from 2017-18 is primarily due to the completion of the Training More Specialist Doctors
initiative which was funded by the Australian Government through the medical professional colleges. 4. The decrease in Employee benefits in 2017-18 is primarily due to the completion of Australian Government NPA
agreements including Improving Health Services in Tasmania Schedule A - Reforming Elective Surgery in Tasmania and Adult Public Dental Services; and the completion of the Training More Specialist Doctors initiative.
5. The movements in Depreciation and amortisation reflect anticipated depreciation schedules for existing and budgeted purchases of non-financial assets over the Budget and Forward Estimates period, including an increase in 2019-20 as a result of additional depreciation associated with the completed RHH Redevelopment project.
6. The increase in Supplies and consumables primarily reflects additional expenditure for Highly Specialised Drugs, Information Technology and Maintenance. The increase in 2016-17 is partially offset by a reallocation of the Tasmanian Risk Management Fund premium to Other expenses in accordance with prior year actuals. The decreases in Supplies and consumables in 2017-18 and 2018-19 relate to various State and Australian Government programs being completed in preceding years.
7. The decrease in Grants and subsidies reflects the expenditure of the Cross Border payments to other jurisdictions for 2013-14 and 2014-15, which was previously carried forward into 2015-16.
8. The decrease in Borrowing costs reflects the repayment of borrowings through the Department in 2015-16, which were provided to fund the cost of staff separations in the THOs in 2014-15.
9. The increase in Other expenses reflects the reallocation from Supplies and Consumables of the insurance premium paid into the Tasmanian Risk Management Fund. This reallocation aligns the expenditure item with the prior year actuals.

116 Tasmanian Health Service
Table 25.5: Sources of Revenue
2015-16
Budget
2016-17
Budget
2017-18
Forward
Estimate
2018-19
Forward
Estimate
2019-20
Forward
Estimate
$'000 $'000 $'000 $'000 $'000
Revenue from the Tasmanian Government
Activity based funding1 345 877 363 118 373 141 359 023 367 799
Block funding 304 059 309 829 318 176 326 181 334 101
649 936 672 947 691 317 685 204 701 900
Revenue from the Australian Government
Activity based funding2 261 709 293 755 301 102 308 629 316 345
Block funding 58 548 57 378 58 880 60 417 61 901
Mersey Community Hospital funding 72 274 75 500 77 388 79 413 81 201
National Partnership funding3 47 118 25 404 1 850 .... ....
Commonwealth Own Purpose Expenditure4 34 124 30 917 28 311 28 401 26 483
473 773 482 954 467 531 476 860 485 930
Transfers of Infrastructure from the Department
of Health and Human Services5
336 200 5 052 37 500 580 200 ....
Other Sources of Revenue6 167 734 171 219 171 412 174 639 175 420
Total 1 627 643 1 332 172 1 367 760 1 916 903 1 363 250
Notes: 1. The decrease in Activity based funding from the Tasmanian Government in 2018-19 reflects the cessation of fixed
term funding for 2014 election commitments. 2. The increase in Activity based funding from the Australian Government from 2016-17 primarily reflects updates to
estimated hospital activity following a review of actual activity achieved in 2014-15 and anticipated activity in 2015-16, and a minor reallocation between ABF and Block funding categories.
3. The decrease in National Partnership funding reflects the level of funding for current National Partnership Agreements with the Australian Government. NPAs ceasing with respect to the THS include the John L Grove, Elective Surgery and Emergency Department components of the Improving Health Services in Tasmania NPA, and the Adult Public Dental Services NPA.
4. The decrease in Commonwealth Own Purpose Expenditure reflects the expiration of current agreements. 5. The variation in Transfers of Infrastructure from the Department of Health and Human Services reflects revisions in
the estimated completion dates for major capital projects, and a revised methodology for the transfer of work-in-progress for the RHH Redevelopment to the THS.
6. The increase in Other Sources of Revenue from 2016-17 reflects revised estimates across a number of funding sources, including Highly Specialised Drugs and Private Patient Scheme estimates.
National Health Reform Agreement
The National Health Reform Agreement (NHRA) sets out arrangements for the Tasmanian and Australian
Government contributions to the provision of health services in Tasmania as delivered by the THS. Under the
NHRA, State and Australian Government funding is provided on the basis of activity through Activity Based
Funding (ABF) wherever practicable. Where it is not practical, funding is provided on a block basis.

Tasmanian Health Service 117
Block funded services include smaller regional or rural hospitals and teaching, training and research. Pricing
under the NHRA is determined by the Independent Hospitals Pricing Authority (IHPA).
Revenue from the Tasmanian Government
Activity Based Funding and Block Funding
The State contribution towards the operation and delivery of services is comprised of ABF and Block Funding
that is provided from the Government via the Department. The Department purchases hospital activity through
an annual THS Service Agreement. The 2016-17 THS Service Agreement will be in place from 1 July 2016.
Revenue from the Australian Government
Activity Based Funding and Block Funding
Under the NHRA, funding from the Australian Government is split between ABF and Block Funding. From
1 July 2014 to 30 June 2017, National Health Reform funding is linked to the level of services delivered by
public hospitals, as provided under the NHRA. During this period, each state's entitlement is directly linked to
the growth in public hospital activity. From 2014-15 the NHRA funding guarantees ceased.
From 1 July 2014, the Australian Government has provided growth funding equivalent to 45 per cent of the
efficient growth in both the activity and block funded components of the NHRA. The Independent Hospital
Pricing Authority (IHPA) determines the efficient price of ABF and the efficient cost of block grants.
At the Council of Australian Government (COAG) meeting of 1 April 2016, all jurisdictions agreed to extend
the current NHRA activity based and block funding arrangements under a Heads of Agreement that will form
the basis of negotiation of an addendum to the NHRA for the period from 1 July 2017 to 30 June 2020. This
agreement preserves the current arrangement of the Australian Government contributing 45 per cent of the
efficient growth in activity based funded services and block grants.
It was also agreed that, where a state may receive less funding under the new arrangements than it would
have under the block funding arrangements proposed in the 2014-15 Australian Government Budget, the
Australian Government will work with the state to consider whether there is a case to provide additional
funding.
National Partnership Funding
National Partnership Agreements (NPAs) are time limited agreements to support the delivery of specific
outcomes or projects. The decrease in NPA funding over the Budget and Forward Estimates period reflects
the expiry of agreements. NPA funding to be expended by the THS in 2016-17 includes:
Adult Public Dental Services ($2.1 million);
Improving Health Services in Tasmania - John L Grove ($5 million);
Improving Health Services in Tasmania - Elective Surgery ($16.1 million);
Improving Health Services in Tasmania - Emergency Department ($1 million); and
Expansion of BreastScreen Australia Program ($460 000).

118 Tasmanian Health Service
Commonwealth Own Purpose Expenditure
Commonwealth Own Purpose Expenditure (COPE) payments are paid from the responsible Australian
Government agency to the THS. COPE agreements in 2016-17 include:
Commonwealth Home Support Program ($16 million);
Transition Care Program ($5.4 million);
Medicare - aged care places ($3.7 million);
Multi-Purpose Services at Beaconsfield and Campbell Town ($2.5 million);
Radiation Oncology - Holman Clinic Capital Works ($1.4 million);
Home Care Packages ($1 million);
Aged Care Assessment Program ($652 000); and
Rural Primary Health Services Program ($218 000).
Other Sources of Revenue
Other Sources of Revenue represents THS generated own source revenue which in 2016-17 primarily
includes:
Patient Fees, including DVA revenue ($88.5 million); and
Pharmacy, Prosthesis and Pharmaceutical Benefits Scheme Revenue ($45.6 million).

Tasmanian Health Service 119
Table 25.6: Statement of Financial Position as at 30 June
2016)
Budget)
2017)
Budget)
2018)
Forward)
Estimate)
2019)
Forward)
Estimate)
2020)
Forward)
Estimate)
$'000) $'000) $'000) $'000) $'000)
Assets
Financial assets
Cash and deposits1 43 955) 67 819) 69 904) 72 644) 75 465)
Receivables 19 521) 20 718) 21 095) 21 508) 21 839)
Other financial assets 20 233) 18 824) 19 128) 19 478) 19 714)
83 709) 107 361) 110 127) 113 630) 117 018)
Non-financial assets
Inventories 7 997) 8 713) 8 826) 8 980) 9 098)
Property, plant and equipment2 1 405 612) 999 391) 1 051 652) 1 655 747) 1 695 885)
Heritage and cultural assets 576) 949) 1 034) 1 126) 1 227)
Intangibles3 3 463) 610) 523) 436) 349)
Other assets 3 901) 4 249) 4 227) 4 254) 4 347)
1 421 549) 1 013 912) 1 066 262) 1 670 543) 1 710 906)
Total assets 1 505 258) 1 121 273) 1 176 389) 1 784 173) 1 827 924)
Liabilities
Payables4 44 390) 61 791) 61 626) 62 359) 63 977)
Interest bearing liabilities5 3 333) ....) ....) ....) ....)
Employee benefits 196 754) 213 591) 215 093) 218 366) 227 592)
Other liabilities 12 023) 9 121) 7 778) 6 353) 4 917)
Total liabilities 256 500) 284 503) 284 497) 287 078) 296 486)
Net assets (liabilities) 1 248 758) 836 770) 891 892) 1 497 095) 1 531 438)
Equity
Reserves 267 946) 286 270) 335 948) 388 748) 466 917)
Accumulated funds6 518 937) 81 041) 86 485) 638 888) 595 062)
Other equity 461 875) 469 459) 469 459) 469 459) 469 459)
Total equity 1 248 758) 836 770) 891 892) 1 497 095) 1 531 438)
Notes: 1. The increase in Cash and deposits in 2017 primarily reflects revised assumptions on the timing of payments and size
of payments to other jurisdictions for cross border obligations; higher than anticipated cash balances in the Private Patient Scheme and COPES funding balances for the THOs as at 30 June 2015, prior to their transition to the THS.
2. The decrease in Property, plant and equipment in 2017 primarily reflects a revised methodology for the transfer of work-in-progress for the RHH Redevelopment to the THS and the 2014-15 actual balances from the THOs as at 30 June 2015. The increase in 2019 anticipates the transfer of assets from the Department to the THS as a result of the completion of the RHH Redevelopment in 2018-19.
3. The decrease in Intangibles in 2017 reflects the closing balance in the prior year. 4. The increase in Payables from 2017 reflects a more accurate estimate of the liability based on the prior year actual,
and revised assumptions on the timing of payments and size of payments to other jurisdictions for cross border obligations.

120 Tasmanian Health Service
5. The decrease in Interest bearing liabilities in 2017 reflects the repayment of borrowings through the Department in 2015-16, which were provided to fund the cost of staff separations in the THOs in 2014-15.
6. The decrease in Accumulated Funds in 2017 and increase in 2019 reflects a revised methodology for the transfer of work-in-progress for the RHH Redevelopment to the THS.

Tasmanian Health Service 121
Table 25.7: Statement of Cash Flows
2015-16)
Budget)
2016-17)
Budget)
2017-18)
Forward)
Estimate)
2018-19)
Forward)
Estimate)
2019-20)
Forward)
Estimate)
$'000) $'000) $'000) $'000) $'000)
Cash flows from operating activities
Cash inflows
Grants1 1 123 709) 1 155 901) 1 158 848) 1 162 064) 1 187 830)
Sales of goods and services 137 038) 141 289) 144 461) 147 462) 148 995)
GST receipts 29 369) 30 552) 30 088) 30 725) 31 345)
Interest received2 ....) 302) 329) 435) 496)
Other cash receipts3 29 276) 30 642) 25 987) 26 013) 25 437)
Total cash inflows 1 319 392) 1 358 686) 1 359 713) 1 366 699) 1 394 103)
Cash outflows
Employee benefits (828 126) (835 679) (832 145) (840 548) (858 104)
Superannuation (90 534) (95 944) (95 678) (96 575) (98 564)
Borrowing costs4 (192) ....) ....) ....) ....)
GST payments (29 369) (30 538) (30 109) (30 730) (31 399)
Grants and subsidies5 (40 495) (7 494) (7 665) (8 534) (9 034)
Supplies and consumables6 (347 330) (368 752) (365 657) (361 916) (367 657)
Other cash payments7 (10 157) (20 006) (20 585) (20 872) (21 393)
Total cash outflows (1 346 203) (1 358 413) (1 351 839) (1 359 175) (1 386 151)
Net cash from (used by) operating activities (26 811) 273) 7 874) 7 524) 7 952)
Cash flows from investing activities
Payments for acquisition of non-financial assets (3 552) (5 039) (5 789) (4 784) (5 131)
Net cash from (used by) investing activities (3 552) (5 039) (5 789) (4 784) (5 131)
Cash flows from financing activities
Net borrowings8 (1 667) ....) ....) ....) ....)
Net cash from (used by) financing activities (1 667) ....) ....) ....) ....)
Net increase (decrease) in cash and cash
equivalents held (32 030) (4 766) 2 085) 2 740) 2 821)
Cash and deposits at the beginning of the
reporting period 75 985) 72 585) 67 819) 69 904) 72 644)
Cash and deposits at the end of the reporting
period 43 955) 67 819) 69 904) 72 644) 75 465)

122 Tasmanian Health Service
Notes: 1. The increase in Grants primarily reflects additional revenue from the Australian Government as a result of updates to
hospital activity, and the provision of additional funding under the One Health System - Additional Investment initiative. This increase is offset by a partial reduction in the NPA on Improving Health Services in Tasmania – Schedule A - Reforming Elective Surgery in Tasmania; completion of the NPA on Improving Health Services in Tasmania - Schedule D - Better Access to Palliative Care; completion of funding provided by the Australian Government under the NPA on Improving Public Hospital Services - Sub Acute Beds; expiry of the agreement relating to the Australian Government initiative on Organ and Tissue Donation and the expiry of the NPA on Treating More Public Dental Patients.
2. The increase in Interest primarily reflects the recognition of interest earned on Private Patient Scheme balances. 3. The decrease in Other cash receipts from 2017-18 relates to the completion of the Training More Specialist Doctors
in Tasmania initiative which was funded by the Australian Government through the medical professional colleges. 4. The decrease in Borrowing costs reflects the early repayment of temporary borrowings for staff separations in the
THOs in 2014-15. 5. The decrease in Grants and subsidies reflects the expenditure of the Cross Border payments to other jurisdictions for
2013-14 and 2014-15, which were previously carried forward into 2015-16. 6. The increase in Supplies and Consumables primarily reflects additional expenditure for Highly Specialised Drugs,
Information Technology, and Maintenance as a result of updates to estimates of THS Own Source Revenue. The increase in 2016-17 is partially offset by a reallocation of the Tasmanian Risk Management Fund premium to Other expenses in line with prior year actuals. The decreases in Supplies and Consumables in 2017-18 and 2018-19 relate to various State and Australian Government programs coming to completion in the preceding years.
7. The increase in Other cash payments reflects the reallocation of TRMF premiums from Supplies and Consumables to align with prior year actuals.
8. The reduction in Net borrowings reflects the early repayment of temporary borrowings provided to fund the cost of staff separations in the THOs in 2015-16.

TasTAFE 123
26 TASTAFE
AUTHORITY OUTLINE TasTAFE is a Statutory Authority, established by the Training and Workforce Development Act 2013.
Governed by a Board of Directors, TasTAFE is the single entity responsible for public sector
post-compulsory Vocational Education and Training (VET) in Tasmania. Through its status as a registered
training organisation (RTO), its role is to enable Tasmanians to gain skills and qualifications needed within
the State's workforce and to support the community to succeed and prosper.
TasTAFE operates predominantly in a contestable training market in Tasmania as well as in a commercial
international student market. It services the training needs of individual learners as well as providing training
and workforce skills development services to Tasmanian employers and their employees.
The scope of training provided by TasTAFE aims to support the economic and policy priorities of the
Government and covers the major trade, technical and vocational occupations represented in the
Tasmanian economy.
Training is conducted statewide at training centres in Hobart, Clarence, Claremont, Launceston, Devonport
and Burnie; in Trade Training Centres; regional locations; and workplaces across the State. TasTAFE is
also offering increasing opportunities for students to access online training services.
The TasTAFE Board of Directors are accountable to the Minister for Education and Training,
Hon Jeremy Rockliff MP.
This chapter provides financial information for TasTAFE for 2016-17 and the Forward Estimates period
(2017-18 to 2019-20). Further information on TasTAFE is provided at www.tastafe.tas.edu.au.
KEY DELIVERABLES TasTAFE's key deliverables are driven by the Government's priorities and TasTAFE Board's corporate plan.
TasTAFE is developing a new organisational education strategy aimed at creating a more holistic system of
VET delivery across Tasmania, aligned with industry growth areas. This strategy will initially focus on the
advanced manufacturing, agricultural, construction and human services industries. The 2016-17 Budget
includes a commitment of $3 million over two years commencing in 2017-18 to support this initiative through
capital investment.
Other initiatives include:
the enhancement of TasTAFE's new organisational and operational model, with a focus on streamlining
management of TasTAFE's delivery, support and corporate service functions in order to improve service
delivery, achieve business efficiencies and ongoing business sustainability;
the implementation of the TasTAFE Education Blueprint that has been developed to guide a
contemporary approach to TasTAFE's VET delivery;

124 TasTAFE
strengthening TasTAFE's contribution to the skills requirements of the State's successful tourism and
hospitality sector, particularly through the development of local, interstate and international partnerships;
keeping TasTAFE's training activities and capabilities focussed on industry need and social and
economic drivers;
achieving measurable increases in core skills around literacy, numeracy, reasoning and writing. Future
work will build upon a 2015-16 pilot of a VET initiative that worked with 2 500 TasTAFE and private RTO
students that measured progress of these skills;
new business growth initiatives generated through the TasTAFE Business Development focus on
improving engagement with prospective and existing students through formal frameworks and improved
use of technology, as well as a comprehensive campaign to increase student numbers through a greater
emphasis upon engagement with prospective students, particularly those still in the schooling system;
continued growth in the use of TasTAFE's virtual learning environment to modernise educational
practices by providing TasTAFE students with access to more online learning opportunities and learning
resources; and
the continued implementation of a newly acquired student management system in two stages in 2017.

TasTAFE 125
DETAILED BUDGET STATEMENTS
Table 26.1: Statement of Comprehensive Income
2015-16)
Budget)
2016-17)
Budget)
2017-18)
Forward)
Estimate)
2018-19)
Forward)
Estimate)
2019-20)
Forward)
Estimate)
$'000) $'000) $'000) $'000) $'000)
Revenue and other income from transactions
Grants1 78 579) 75 350) 77 856) 78 875) 78 407)
Sales of goods and services2 25 850) 24 500) 24 990) 25 490) 26 000)
Total revenue and other income from transactions 104 429) 99 850) 102 846) 104 365) 104 407)
Expenses from transactions
Employee benefits3 71 144) 69 860) 70 889) 71 800) 72 697)
Depreciation and amortisation4 9 000) 7 445) 8 145) 8 145) 8 145)
Supplies and consumables 29 524) 29 750) 30 048) 30 348) 30 651)
Borrowing costs 1) ....) ....) ....) ....)
Total expenses from transactions 109 669) 107 055) 109 082) 110 293) 111 493)
Net result from transactions (net operating
balance) (5 240) (7 205) (6 236) (5 928) (7 086)
Net result (5 240) (7 205) (6 236) (5 928) (7 086)
Comprehensive result (5 240) (7 205) (6 236) (5 928) (7 086)
Notes: 1. The decrease in Grants in 2016-17 primarily reflects the cessation of funding for the 27th pay. 2. The decrease in Sales of goods and services in 2016-17 reflects estimated declining contestable training revenue
due to increased competition with RTOs. 3. The decrease in Employee benefits in 2016-17 reflects estimated declining contestable training revenue and
associated changes to the TasTAFE workforce. 4. The decrease in Depreciation and amortisation in 2016-17 reflects the revaluation of property undertaken at
30 June 2015.

126 TasTAFE
Table 26.2: Statement of Financial Position as at 30 June
2016)
Budget)
2017)
Budget)
2018)
Forward)
Estimate)
2019)
Forward)
Estimate)
2020)
Forward)
Estimate)
$'000) $'000) $'000) $'000) $'000)
Assets
Financial assets
Cash and deposits 666) 1 466) 1 438) 892) 1 125)
Receivables1 5 506) 3 059) 3 482) 3 182) 2 844)
Other financial assets1 ....) 1 289) 1 289) 1 289) 1 289)
6 172) 5 814) 6 209) 5 363) 5 258)
Non-financial assets
Inventories 291) 226) 226) 226) 226)
Property, plant and equipment2 237 887) 169 835) 165 190) 160 545) 154 400)
Heritage and cultural assets ....) 21) 21) 21) 21)
Intangibles3 ....) 7 020) 6 570) 6 120) 5 670)
Other assets4 3 324) 2 383) 1 933) 1 483) 1 033)
241 502) 179 485) 173 940) 168 395) 161 350)
Total assets 247 674) 185 299) 180 149) 173 758) 166 608)
Liabilities
Payables4 1 693) 6 997) 8 247) 7 947) 8 047)
Employee benefits 17 599) 16 482) 16 318) 16 155) 15 991)
Other liabilities 20) ....) ....) ....) ....)
Total liabilities 19 312) 23 479) 24 565) 24 102) 24 038)
Net assets (liabilities) 228 362) 161 820) 155 584) 149 656) 142 570)
Equity
Contributed capital 228 346) 228 037) 228 037) 228 037) 228 037)
Reserves2 16 976) 5 653) 5 653) 5 653) 5 653)
Accumulated funds2 (16 960) (71 870) (78 106) (84 034) (91 120)
Total equity 228 362) 161 820) 155 584) 149 656) 142 570)
Notes: 1. The variations in these items primarily reflects a reclassification between Receivables and Other financial assets
based on 30 June 2015 actuals. 2. The decreases in Property, plant and equipment, Reserves and Accumulated funds reflect the revaluation of
property undertaken at 30 June 2015. 3. The increase in Intangibles reflects the completion of the new student management system which will be amortised
over 10 years. 4. The variations in Other assets and Payables reflect revised estimates based on 30 June 2015 actuals.

TasTAFE 127
Table 26.3: Statement of Cash Flows
2015-16)
Budget)
2016-17)
Budget)
2017-18)
Forward)
Estimate)
2018-19)
Forward)
Estimate)
2019-20)
Forward)
Estimate)
$'000) $'000) $'000) $'000) $'000)
Cash flows from operating activities
Cash inflows
Grants1 78 579) 75 350) 77 856) 78 875) 78 407)
Sales of goods and services2 25 550) 24 775) 24 790) 25 640) 26 150)
GST receipts 5 572) 7 147) 7 201) 7 631) 7 726)
Total cash inflows 109 701) 107 272) 109 847) 112 146) 112 283)
Cash outflows
Employee benefits3 (65 393) (62 000) (62 939) (63 723) (64 518)
Superannuation (8 037) (7 860) (8 114) (8 240) (8 343)
Borrowing costs (1) ....) ....) ....) ....)
GST payments (5 572) (7 368) (7 424) (7 481) (7 538)
Supplies and consumables (29 474) (29 850) (28 798) (30 648) (30 551)
Total cash outflows (108 477) (107 078) (107 275) (110 092) (110 950)
Net cash from (used by) operating activities 1 224) 194) 2 572) 2 054) 1 333)
Cash flows from investing activities
Payments for acquisition of non-financial assets4 (3 130) (3 450) (2 600) (2 600) (1 100)
Net cash from (used by) investing activities (3 130) (3 450) (2 600) (2 600) (1 100)
Cash flows from financing activities
Net borrowings5 (843) ....) ....) ....) ....)
Net cash from (used by) financing activities (843) ....) ....) ....) ....)
Net increase (decrease) in cash and cash
equivalents held (2 749) (3 256) (28) (546) 233)
Cash and deposits at the beginning of the
reporting period 3 415) 4 722) 1 466) 1 438) 892)
Cash and deposits at the end of the reporting
period 666) 1 466) 1 438) 892) 1 125)
Notes: 1. The decrease in Grants in 2016-17 primarily reflects the cessation of funding for the 27th pay. 2. The decrease in Sales of goods and services in 2016-17 reflects estimated declining contestable training revenue
due to increased competition with RTOs. 3. The decrease in Employee benefits in 2016-17 reflects estimated declining contestable training revenue and
associated changes to the TasTAFE workforce. 4. The increase in Payments for acquisition of non-financial assets in 2016-17 reflects payments for the new student
management system. Increases in 2017-18 and 2018-19 compared with the 2015-16 Budget reflect additional funding for TasTAFE infrastructure investment of $1.5 million in each year.

128 TasTAFE
5. The decrease in Net borrowings in 2016-17 reflects the repayment of a loan provided from Finance-General to the former Tasmanian Skills Institute under the Targeted Voluntary Redundancy Program.