government of india - Ministry of Commerce and Industry
81
GOVERNMENT OF INDIA MINISTRY OF COMMERCE & INDUSTRY (DEPARTMENT OF COMMERCE) LOK SABHA STARRED QUESTION NO. 101(H) TO BE ANSWERED ON 24 th JULY, 2017 TRADE DEFICIT *101(H). SHRI KAPIL MORESHWAR PATIL: Will the Minister of COMMERCE & INDUSTRY (वािणÏय एवं उɮयोग मंी ) be pleased to state: (a) whether it is a fact that the exports have drastically come down due to which the foreign trade deficit has reached an alarming level during the last six months of the current year; (b) if so, the details thereof, sector-wise and the reasons therefor; (c) the names of countries with which India has registered favourable trade balance during the last three years and the current year, sector and year-wise; (d) the names of those countries with which India has registered trade deficit during the said period, sector and year-wise; and (e) the steps taken/being taken by the Government to overcome the trade deficit? ANSWER okf.kT; ,oa m|ksx jkT; ea=h ¼Jherh fueZyk lhrkje.k½ ¼Lora = izHkkj½ THE MINISTER OF STATE IN THE MINISTRY OF COMMERCE AND INDUSTRY (INDEPENDENT CHARGE) (SMT. NIRMALA SITHARAMAN) a) to e): A Statement is laid on the Table of the House. *****
-
Upload
khangminh22 -
Category
Documents
-
view
4 -
download
0
Transcript of government of india - Ministry of Commerce and Industry

GOVERNMENT OF INDIA MINISTRY OF COMMERCE & INDUSTRY
(DEPARTMENT OF COMMERCE)
LOK SABHA STARRED QUESTION NO. 101(H)
TO BE ANSWERED ON 24th JULY, 2017
TRADE DEFICIT *101(H). SHRI KAPIL MORESHWAR PATIL:
Will the Minister of COMMERCE & INDUSTRY (वािण य एवं उ योग मतं्री ) be
pleased to state:
(a) whether it is a fact that the exports have drastically come down due to which the foreign trade deficit has reached an alarming level during the last six months of the current year;
(b) if so, the details thereof, sector-wise and the reasons therefor; (c) the names of countries with which India has registered favourable trade balance during
the last three years and the current year, sector and year-wise; (d) the names of those countries with which India has registered trade deficit during the
said period, sector and year-wise; and (e) the steps taken/being taken by the Government to overcome the trade deficit?
ANSWER
okf.kT; ,oa m|ksx jkT; ea=h ¼Jherh fueZyk lhrkje.k½ ¼Lora= izHkkj½
THE MINISTER OF STATE IN THE MINISTRY OF COMMERCE AND INDUSTRY (INDEPENDENT CHARGE)
(SMT. NIRMALA SITHARAMAN)
a) to e): A Statement is laid on the Table of the House.
*****

STATEMENT REFERRED TO IN REPLY TO PARTS (a) TO (e) OF LOK SABHA
STARRED QUESTION NO. 101 FOR ANSWER ON 24TH JULY, 2017 REGARDING “TRADE DEFICIT”.
(a) & (b): Total value of exports (merchandise and services) of India with other countries during
the last six months is as follows:
Months Value of exports (in US$ Billions)
% growth over corresponding month of previous year
December,2016 37.84 3.30
January, 2017 35.86 6.17
February, 2017 38.60 16.36
March, 2017 43.09 20.35
April, 2017 37.53 11.03
May, 2017 37.44 4.40
Source: DGCI&S, Kolkata
The above data reflects that India’s export has maintained the positive growth during the last
six months as compared to exports of corresponding months of previous years.
(c): The names of the top 25 countries with which India has registered favourable trade
balance during the last three years and the current year are given at Annexure‐I. The top 25
Principal Commodities in which India has favourable trade balance during the last three years
and the current year are given at Annexure‐II.
(d): The names of the top 25 countries with which India has registered trade deficit during
the last three years and the current year are given at Annexure‐III. The top 25 Principal
Commodities in which India has trade deficit during the last three years and the current year
are given at Annexure‐IV.
(e): The Government has taken the following steps to overcome the trade deficit:
(i) The New Foreign Trade Policy (2015‐20) was announced on 1st April, 2015 with a focus on supporting both manufacturing and services exports.
(ii) The Merchandise Exports from India Scheme (MEIS) has been introduced in the Foreign
Trade Policy (FTP) 2015‐20 on 01.04.2015 with the objective to offset infrastructural
inefficiencies and associated costs involved in exporting goods/products which are

produced/ manufactured in India and to provide a level playing field to Indian exporters,
especially those having high export intensity and employment potential. The Scheme
incentivizes exporters in terms of freely transferable Duty Credit Scrips which are
transferable and can be used to pay certain Central duties/taxes including customs
duties. The Scheme covers exports of 7914 tariff lines at 8 digit levels to all countries.
(iii) The Services Exports from India Scheme (SEIS) has been introduced in the Foreign Trade
Policy (FTP) 2015‐20 on 01.04.2015. The Scheme provides rewards at the rate of 3 to 5%
on Net Foreign Exchange earnings, to service providers of notified services from India to
rest of the world, in the form of Duty Credit Scrips which are transferable and can be
used to pay certain Central duties/taxes including customs duties.
(iv) The Government has implemented the Niryat Bandhu Scheme with an objective to
reach out to the new and potential exporters including exporters from Micro, Small &
Medium Enterprises (MSMEs) and mentor them through orientation programmes,
counseling sessions, individual facilitation etc., on various aspects of foreign trade for
being able to get into international trade and boost exports from India.
(v) As part of the “Ease of Doing Business” initiatives, the Government has launched Single
Window Interface for Facilitating Trade (SWIFT) clearances project w.e.f 1st April, 2016.
The scheme enables the importers/exporters to file a common electronic ‘Integrated
Declaration’ on the Indian Customs Electronic Commerce/Electronic Data Interchange
(EC/EDI) Gateway i.e. ICEGATE portal. The Integrated Declaration compiles the
information requirements of Customs, FSSAI, Plant Quarantine, Animal Quarantine,
Drug Controller, Wild Life Control Bureau and Textile Committee. It replaces nine
separate forms required by these 6 different agencies and Customs.
(vi) Interest Equalization Scheme on pre & post shipment credit was launched to provide
cheaper credit to exporters.
(vii) A new scheme called Special Advance Authorisation Scheme for export of articles of
Apparel and Clothing Accessories was introduced w.e.f. 1st September 2016 wherein
exporters are entitled for an authorisation for fabrics including inter lining on pre‐import
basis and all industry rate of Duty Drawback for non‐fabric inputs on the exports.
(viii) Further, the Government continues to provide the facility of access to duty free raw
materials and capital goods for exports through schemes like Advance Authorization,
Duty Free Import Authorization (DFIA), Export Promotion Capital Goods (EPCG) and
drawback / refund of duties.
(ix) The Government launched a new scheme called Trade Infrastructure for Export Scheme
(TIES) w.e.f. 15th March, 2017 with the objective to enhance export competitiveness by
bridging gaps in export infrastructure, creating focused export infrastructure, first mile

and last mile connectivity for export oriented projects and addressing quality and
certification measures. The Central and State Agencies, including Export Promotion
Councils, Commodities Boards, SEZ Authorities and Apex Trade Bodies recognised under
the EXIM policy of Government of India are eligible for financial support under this
scheme.
(x) The Government has approved the proposal for notification of commitments under the
Trade Facilitation Agreement (TFA) of World Trade Organization (WTO), ratification and
acceptance of the Instrument of Acceptance of Protocol of TFA to the WTO Secretariat
and constitution of the National Committee on Trade Facilitation (NCTF). The Trade
Facilitation Agreement (TFA) contains provisions for expediting the movement, release
and clearance of goods, including goods in transit. It also sets out measures for effective
cooperation between customs and other appropriate authorities on trade facilitation
and customs compliance issues. These objectives are in consonance with India’s “Ease of
Doing Business” initiative.
***

Annexure‐I Statement referred to in reply of part (c) of Lok Sabha Starred Question no. 101 for answer on 24th July 2017.
Top 25 Countries with which India has favourable Trade Balance
S. No. 2014-15 2015-16 2016-17 2017-18 (Apr-May)*
1 U S A U S A U S A U S A
2 Hong Kong U Arab Emts U Arab Emts U Arab Emts
3 U Arab Emts Hong Kong Bangladesh Pr Bangladesh Pr
4 Sri Lanka DSR Bangladesh Pr Hong Kong Nepal
5 Bangladesh PR Sri Lanka DSR Nepal U K
6 U K U K U K Turkey
7 Kenya Nepal Vietnam Soc Rep Sri Lanka DSR
8 Nepal Turkey Turkey Egypt A RP
9 Turkey Kenya Sri Lanka DSR Netherland
10 Netherland Netherland Netherland Kenya
11 Vietnam Soc Rep Vietnam Soc Rep Singapore Italy
12 Singapore Pakistan Ir Kenya France
13 Mauritius Spain Spain Vietnam Soc Rep
14 Mozambique Gibraltar Oman Singapore
15 Tanzania Rep Egypt A Rp Pakistan Ir Mauritius
16 Pakistan Ir France Gibraltar Spain
17 Egypt A RP Mozambique Israel Pakistan Ir
18 Spain Mauritius Italy Oman
19 Philippines Philippines Philippines Hong Kong
20 Israel Ethiopia Egypt A Rp Israel
21 Italy Tanzania Rep Mauritius Ethiopia
22 Ethiopia Israel Tanzania Rep Poland
23 Gibraltar Sudan Ethiopia Mexico
24 Oman Mexico Portugal Somalia
25 Jordan Uganda Mexico Sudan
Source: DGCI&S, Kolkata (*Provisional)

Annexure‐II Statement referred to in reply of part (c) of Lok Sabha Starred Question no. 101 for answer on 24th July 2017.
Top 25 Principal Commodities in which India has favourable Trade Balance
S.No. 2014-15 2015-16 2016-17 2017-18 (Apr-May)*
1 Petroleum Products Petroleum Products Petroleum Products Petroleum Products
2 Gold And Other Precious Metal Jewellery
Drug Formulations, Biologicals Gold And Other Precious Metal Jewellery
Gold And Other Precious Metal Jewellery
3 Drug Formulations, Biologicals
Gold And Other Precious Metal Jewellery
Drug Formulations, Biologicals
Drug Formulations, Biologicals
4 Rmg Cotton Incl Accessories
Rmg Cotton Incl Accessories Rmg Cotton Incl Accessories
Rmg Cotton Incl Accessories
5 Motor Vehicle/Cars Motor Vehicle/Cars Motor Vehicle/Cars Motor Vehicle/Cars
6 Marine Products Cotton Fabrics, Madeups Etc. Marine Products Rmg Manmade Fibres
7 Cotton Fabrics, Madeups Etc.
Marine Products Rmg Manmade Fibres Marine Products
8 Buffalo Meat Buffalo Meat Cotton Fabrics, Madeups Etc.
Cotton Fabrics, Madeups Etc.
9 Rice -Basmati Rmg Manmade Fibres Buffalo Meat Rice -Basmoti
10 Cotton Yarn Cotton Yarn Rmg Of Other Textile Matrl Ship, Boat And Floating Struct
11 Rmg Manmade Fibres Rice -Basmoti Cotton Yarn Rmg Of Other Textile Material
12 Products Of Iron And Steel
Rmg Of Other Textile Material Rice -Basmoti Buffalo Meat
13 Manmade Yarn, Fabrics, Madeups
Manmade Yarn, Fabrics, Madeups
Manmade Yarn, Fabrics, Madeups
Manmade Yarn, Fabrics, Madeups
14 Rice(Other Than Basmati)
Products Of Iron And Steel Rice(Other Than Basmati) Products Of Iron And Steel
15 Rmg Of Other Textile Matrl
Rice(Other Than Basmoti) Products Of Iron And Steel Cotton Yarn
16 Pearl, Precious, Semiprecious Stones
Pearl, Precious, Semiprecious Stones
Spices Rice(Other Than Basmati)
17 Footwear Of Leather Footwear Of Leather Footwear Of Leather Spices
18 Two And Three Wheelers
Two And Three Wheelers Dyes Two And Three Wheelers
19 Dyes Spices Two And Three Wheelers Granit, Natural Stone And Product
20 Spices Dyes Carpet(Excl. Silk) Handmade
Footwear Of Leather
21 Guergam Meal Cotton Raw Incld. Waste Granit, Natural Stone And Product
Dyes
22 Granit, Natural Stone And Product
Carpet(Excl. Silk) Handmade Leather Goods Carpet(Excl. Silk) Handmade
23 Aircraft, Spacecraft And Parts
Granit, Natural Stone And Product
Pearl, Precious, Semiprecious Stones
Iron And Steel
24 Cotton Raw Include. Waste
Leather Goods Iron Ore Iron Ore
25 Leather Goods Agro Chemicals Handicrafts(Excl. Handmade Carpets)
Leather Goods
Source: DGCI&S, Kolkata (*Provisional)

Annexure‐III Statement referred to in reply of part (d) of Lok Sabha Starred Question no. 101 for answer on 24th July 2017.
Top 25 Countries with which India has trade deficit
S.No. 2014-15 2015-16 2016-17 2017-18 (Apr-May)*
1 China P Rp China P Rp China P Rp China P Rp
2 Switzerland Switzerland Switzerland Switzerland
3 Saudi Arab Saudi Arab Saudi Arab Saudi Arab
4 Qatar Indonesia Iraq Indonesia
5 Iraq Iraq Indonesia Iraq
6 Kuwait Korea Rp Korea Rp Korea Rp
7 Venezuela Qatar Australia Australia
8 Nigeria Nigeria Iran Nigeria
9 Indonesia Unspecified Qatar Iran
10 Korea Rp Australia Japan Russia
11 Australia Venezuela Nigeria Qatar
12 Malaysia Malaysia Venezuela Japan
13 Belgium Japan Unspecified Venezuela
14 Germany Germany Germany Kuwait
15 Iran Kuwait Malaysia Unspecified
16 Japan Iran Russia Germany
17 Angola Belgium Kuwait South Africa
18 Unspecified Russia Angola Malaysia
19 Chile Angola South Africa Thailand
20 Thailand Thailand Thailand Canada
21 Russia South Africa Ukraine Ghana
22 Ukraine Ghana Canada Belgium
23 Taiwan Canada Argentina Argentina
24 Canada Argentina Brazil Botswana
25 Argentina Taiwan Ghana Ukraine
Source: DGCI&S, Kolkata (*Provisional)

Annexure‐IV Statement referred to in reply of part (d) of Lok Sabha Starred Question no. 101 for answer on 24th July 2017.
Top 25 Principal Commodities in which India has trade deficit
S.No. 2014-15 2015-16 2016-17 2017-18 (Apr-May)*
1 Petroleum: Crude Petroleum: Crude Petroleum: Crude Petroleum: Crude
2 Gold Gold Gold Gold
3 Coal, Coke and Briquittes Etc Telecom Instruments Coal, Coke and Briquittes Etc
Coal, Coke and Briquittes Etc
4 Telecom Instruments Coal, Coke and Briquittes Etc
Telecom Instruments Telecom Instruments
5 Vegetable Oils Vegetable Oils Vegetable Oils Pearl, Precs, Semiprecs Stones
6 Other Commodities Computer Hardware, Peripherals
Other Commodities Vegetable Oils
7 Computer Hardware, Peripherals
Fertilezers Manufactured Computer Hardware, Peripherals
Electronics Components
8 Plastic Raw Materials Other Commodities Electronics Components Plastic Raw Materials
9 Fertilezers Manufactured Plastic Raw Materials Plastic Raw Materials Computer Hardware, Peripherals
10 Bulk Minerals and Ores Iron And Steel Aircraft, Spacecraft and Parts
Organic Chemicals
11 Organic Chemicals Electronics Components Organic Chemicals Other Commodities
12 Silver Indl. Machinery For Dairy Etc
Indl. Machinery For Dairy Etc
Indl. Machinery For Dairy Etc
13 Indl. Machinery For Dairy Etc
Organic Chemicals Fertilezers Manufactured Electronics Instruments
14 Inorganic Chemicals Bulk Minerals And Ores Pulses Silver
15 Iron And Steel Electronics Instruments Electronics Instruments Bulk Minerals And Ores
16 Project Goods Inorganic Chemicals Bulk Minerals And Ores Fertilezers Manufactured
17 Electronics Instruments Silver Consumer Electronics Inorganic Chemicals
18 Electronics Components Pulses Inorganic Chemicals Consumer Electronics
19 Consumer Electronics Consumer Electronics Medical And Scientific Instrum
Pulses
20 Pulses Ac, Refrigeration Machinery Etc
Project Goods Ac, Refrigeration Machinery Etc
21 Medical And Scientific Instrum
Project Goods Ac, Refrigeration Machnry Etc
Medical And Scientific Instrum
22 Electric Machinery And Equipment
Electric Machinery And Equipment
Silver Residual Chemical And Allied Prod
23 Other Wood And Wood Products
Medical And Scientific Instrum
Machine Tools Project Goods
24 Ac, Refrigeration Machinery Etc
Residual Chemical And Allied Prod
Electric Machinery And Equipment
Electric Machinery And Equipment
25 Machine Tools Machine Tools Paper, Paper Board And Product
Copper And Products Made Of Copr
Source: DGCI&S, Kolkata (*Provisional)

GOVERNMENT OF INDIA MINISTRY OF COMMERCE & INDUSTRY
(DEPARTMENT OF COMMERCE)
LOK SABHA STARRED QUESTION NO. 113(H)
TO BE ANSWERED ON 24th JULY, 2017
IMPORTS OF PRODUCTS *113(H). SHRI JAI PRAKASH NARAYAN YADAV:
Will the Minister of COMMERCE & INDUSTRY (वािण य एव ंउ योग मतं्री ) be
pleased to state:
(a) whether imports from countries like Mozambique, USA, Australia, Brazil, Mexico, Africa, China and Pakistan are being made in huge quantity;
(b) if so, the details thereof, country/ product-wise; and (c) the names of the companies which have imported products during the last three years
along with the quantity of imported goods and the amount spent in this regard?
ANSWER
okf.kT; ,oa m|ksx jkT; ea=h ¼Jherh fueZyk lhrkje.k½ ¼Lora= izHkkj½
THE MINISTER OF STATE IN THE MINISTRY OF COMMERCE AND INDUSTRY (INDEPENDENT CHARGE)
(SMT. NIRMALA SITHARAMAN)
a) to c): A Statement is laid on the Table of the House.
*****

STATEMENT REFERRED TO IN REPLY TO PARTS (a) TO (c) OF LOK SABHA
STARRED QUESTION NO. 113 FOR ANSWER ON 24TH JULY, 2017 REGARDING “IMPORTS OF PRODUCTS”.
(a) & (b): The India’s merchandise imports from China, USA, Australia, Africa, Brazil,
Mexico, Mozambique and Pakistan are as follows:
(values in US$ Millions)
Countries 2014-15
% share
of total imports
2015-16
% share
of total imports
2016-17
% share
of total imports
2017-18 (Apr-May)*
% share
of total imports
China 60413.2 13.5 61706.8 16.2 61286.2 15.9 11839.0 15.5
USA 21814.6 4.9 21781.4 5.7 22343.5 5.8 3989.4 5.2
Australia 10247.2 2.3 8898.8 2.3 11154.5 2.9 2088.4 2.7
Africa 6496.5 1.5 5948.4 1.6 5813.2 1.5 1270.0 1.7
Brazil 5400.9 1.2 4040.1 1.1 4114.7 1.1 655.1 0.9
Mexico 3393.2 0.8 2283.2 0.6 2944.5 0.8 547.6 0.7
Mozambique 325.7 0.1 362.9 0.1 546.3 0.1 189.1 0.2
Pakistan 497.3 0.1 441.0 0.1 456.3 0.1 84.3 0.1Total Imports from above countries
108588.6 24.2 105462.6 27.7 108659.3 28.3 20662.9 27.1
India total Imports
448033.4 100.0 381006.6 100.0 384319.3 100.0 76159.4 100.0
Source: DGCI&S, Kolkata (* Provisional)
The above data reflects that the total share of the said countries in India’s total imports is about
one fourth. The details of top 25 Principal Commodity‐wise imports from China, USA, Australia,
Africa, Brazil, Mexico, Mozambique and Pakistan are given at Annexure‐I.
(c): As per the Data Dissemination Policy, Directorate General of Commercial Intelligence &
Statistics (DGCI&S) maintains the confidentiality of exporters/importers information of
commercial sensitive data and prohibits the disclosure of information on identity particulars of
exporters/importers like Name and IE Code Numbers.
***

Annexure‐I Statement referred to in reply of part (a) & (b) of Lok Sabha Starred Question no. 113 for answer on 24th July 2017. Principal Commodity‐wise Imports from China
(in US$ Millions)
S. No. Principal Commodities 2014‐15 2015‐16 2016‐17
2017‐18 (April‐ May, 2017)*
1 Telecom Instruments 9240.87 10093.36 11308.54 2253.07
2 Electronics Components 1984.27 3514.48 4440.16 1148.87
3 Computer Hardware, Peripherals 4336.63 4413.69 4071.73 645.60
4 Indl. Machnry For Dairy Etc 2664.65 2866.60 2842.71 517.32
5 Organic Chemicals 2482.98 2416.74 2187.94 472.31
6 Consumer Electronics 2026.18 2204.17 2151.52 347.06
7 Electronics Instruments 1797.62 1926.26 2134.40 418.18
8 Electric Machinery And Equipme 1835.01 2170.23 2036.72 373.66
9 Bulk Drugs, Drug Intermediates 2088.31 2120.15 1826.34 347.66
10 Residul Chemicl And Alled Prod 1522.25 1458.94 1636.78 334.07
11 Ship, Boat And Floating Struct 1122.27 1264.90 1454.44 33.61
12 Iron And Steel 2713.35 2359.26 1346.71 196.80
13 Ac, Refrigeration Machnry Etc 1099.54 1045.79 1249.52 344.48
14 Fertilezers Manufactured 3148.71 3261.92 1244.16 54.30
15 Products Of Iron And Steel 1388.18 1181.85 1229.88 234.48
16 Other Misc. Engineering Items 677.32 751.06 902.34 162.90
17 Plastic Raw Materials 932.82 823.53 897.57 250.76
18 Auto Components/Parts 940.90 898.78 868.58 155.89
19 Other Commodities 760.17 853.69 838.34 160.96
20 Manmade Yarn,Fabrics,Madeups 974.92 853.93 798.71 143.74
21 Project Goods 1449.33 994.11 763.00 120.35
22 Aluminium, Products Of Aluminm 746.28 717.59 696.90 151.08
23 Cranes, Lifts And Winches 425.04 410.30 692.05 87.82
24 Accumulators And Batteries 321.39 510.49 608.80 131.37
25 Machine Tools 412.03 431.70 544.89 94.50
26 Moulded And Extruded Goods 429.98 484.41 537.77 108.62
27 Other Plastic Items 466.48 477.81 516.24 134.08
28 Agro Chemicals 412.22 332.65 506.10 149.08
29 Glass And Glassware 358.04 406.91 478.37 112.58
30 Oth Non Ferous Metal And Prodc 428.61 399.31 445.38 91.86
31 Silver 1141.02 384.51 440.69 65.99
32 Paper, Paper Board And Product 380.47 362.11 434.50 97.69
33 Oth Txtl Yrn, Fbric Mdup Artcl 457.68 487.19 432.60 118.74
34 Inorganic Chemicals 610.50 502.39 428.99 81.61

35 Other Construction Machinery 341.12 352.71 417.18 78.74
36 Coal,Coke And Briquittes Etc 423.63 364.40 402.79 100.23
37 Handcrfs(Excl.Handmade Crpts) 315.14 412.54 401.21 75.73
S. No. Principal Commodities 2014‐15 2015‐16 2016‐17 2017‐18
(April‐ May, 2017)*
38 Medical And Scientific Instrum 334.43 342.62 387.97 75.42
39 Ceramics And Allied Products 612.78 576.54 379.60 67.83
40 Other Miscellaenious Chemicals 481.28 393.44 338.58 63.87
41 Plastc Sht, Film, Plts Etc 256.54 294.29 318.72 68.57
42 Ic Engines And Parts 170.60 176.18 265.22 57.26
43 Auto Tyres And Tubes 160.63 249.97 257.71 38.57
44 Plywood And Allied Products 299.54 272.54 254.98 60.56
45 Paint, Varnish And Allid Prodc 235.92 227.37 245.61 49.69
46 Atm, Injctng Mlding Mchnry Etc 208.00 215.05 240.00 57.67
47 Petroleum Products 315.82 243.08 213.11 35.53
48 Copper And Prdcts Made Of Copr 225.06 185.58 197.24 43.87
49 Hnd Tool, Cttng Tool Of Metals 233.30 213.76 182.63 41.74
50 Bicycle And Parts 173.58 139.80 174.94 29.35
51 Cotton Fabrics, Madeups Etc. 259.50 249.05 172.63 28.27
52 Footwear Of Rubber/Canvas Etc. 136.62 147.14 167.83 41.95
53 Dyes 176.32 169.34 163.82 35.37
54 Pumps Of All Types 137.24 147.66 159.71 32.50
55 Fresh Fruits 74.42 56.17 159.60 57.20
56 Dye Intermediates 219.30 157.87 150.67 45.91
57 Footwear Of Leather 129.43 136.86 147.16 23.48
58 Sports Goods 127.07 130.84 138.65 33.30
59 Optical Items (Incl.Lens Etc) 134.69 135.20 137.68 32.56
60 Drug Formulations, Biologicals 129.67 144.78 135.21 17.46
61 Processed Minerals 134.41 117.97 131.31 27.94
62 Nucler Reactr, Indl Boilr, Prt 110.72 150.82 126.94 16.17
63 Silk,Raw 152.39 135.94 126.73 22.94
64 Othr Rubber Prodct Excpt Footw 121.12 115.80 115.79 24.29
65 Prime Mica And Mica Products 67.93 85.75 98.23 18.58
66 Manmade Staple Fibre 99.72 96.71 92.50 16.15
67 Cosmetics And Toiletries 79.77 89.49 87.74 19.57
68 Granit, Natrl Stone And Prodct 71.43 63.26 81.66 12.95
69 Rmg Manmade Fibres 61.34 71.58 79.72 10.90
70 Spices 54.56 47.97 76.53 14.86
71 Rmg Cotton Incl Accessories 57.77 70.25 72.44 9.68
72 Railwy Trnsprt Equipmnts, Prts 50.21 75.42 68.92 23.61
73 Rmg Of Othr Textle Matrl 61.90 63.95 66.44 11.29
74 Pulses 72.34 61.44 64.83 19.89

75 Packaging Materials 62.92 63.90 63.48 12.13
76 Office Equipments 78.65 83.66 61.36 5.51
77 Surgicals 62.19 71.64 55.10 11.84
78 Stationry/Offce, School Supply 45.06 48.29 48.25 12.12
79 Cotton Yarn 32.37 36.70 47.91 7.33
80 Pearl, Precs, Semiprecs Stones 31.19 45.11 45.76 11.45
81 Natrl Silk Yarn,Fabrics,Madeup 43.41 39.45 37.02 6.80
S. No. Principal Commodities 2014‐15 2015‐16 2016‐17 2017‐18
(April‐ May, 2017)*
82 Finished Leather 32.55 33.26 36.19 5.73
83 Leather Goods 35.60 38.29 29.93 3.93
84 Gold 35.70 24.18 28.37 6.10
85 Other Crude Minerals 29.94 28.57 25.63 5.18
86 Wollen Yarn,Fabrics,Madeupsetc 29.30 30.24 23.30 6.08
87 Carpet(Excl. Silk) Handmade 20.10 20.91 22.08 4.47
88 Graphite, Explsivs And Accesor 87.14 18.14 21.80 13.49
89 Misc Processed Items 15.87 17.86 21.38 4.69
90 Books, Publications And Prntng 20.94 43.46 20.32 2.86
91 Pulp And Waste Paper 16.42 14.98 19.65 3.42
92 Electrodes 20.07 16.20 15.97 2.97
93 Essential Oils 12.89 18.24 13.04 2.35
94 Processed Fruits And Juices 9.74 10.88 11.64 2.33
95 Nickel, Product Made Of Nickel 188.10 38.88 10.88 3.05
96 Leather Footwear Component 13.99 14.33 10.72 2.12
97 Cereal Preparations 11.54 9.29 9.45 1.12
98 Cmnt, Clinkr And Asbstos Cmnt 7.37 7.35 8.94 1.17
99 Motor Vehicle/Cars 9.77 5.45 8.52 1.14
100 Other Wood And Wood Products 0.29 2.76 8.29 1.30
101 Zinc And Products Made Of Zinc 14.77 8.27 8.25 0.86
102 Fruits / Vegetable Seeds 4.72 8.28 7.75 1.43
103 Two And Three Wheelers 2.31 7.42 6.65 0.50
104 Fertilezers Crude 6.02 6.17 6.53 1.50
105 Wool, Raw 9.66 8.27 6.47 1.89
106 Aircraft, Spacecraft And Parts 23.59 5.64 5.79 1.24
107 Processed Vegetables 5.29 6.84 5.71 1.56
108 Bulk Minerals And Ores 26.62 3.48 4.52 0.71
109 Gold And Oth Precs Metl Jwlery 5.52 5.04 4.38 1.08
110 Tin And Products Made Of Tin 1.19 0.81 3.75 0.21
111 Marine Products 0.62 1.29 2.71 0.12
112 Cocoa Products 2.97 3.09 2.63 0.43
113 Tea 2.19 1.88 2.40 0.39

114 Ayush And Herbal Products 0.40 0.96 2.13 0.25
115 Silk Waste 4.24 5.46 2.08 0.28
116 Coir And Coir Manufactures 3.81 1.99 2.06 1.13
117 Floricltr Products 1.63 1.68 1.66 0.44
118 Coffee 3.50 0.45 1.40 0.00
119 Tobacco Manufactured 1.84 1.21 1.40 0.12
120 Lead And Products Made Of Led 2.36 1.91 1.38 0.25
121 Human Hair, Products Thereo 7.26 6.15 1.34 0.38
122 Raw Hides And Skins 3.08 1.50 1.20 0.11
123 Rmg Silk 1.76 1.81 1.18 0.26
124 Rmg Wool 2.76 2.87 1.15 0.03
125 Other Jute Manufactures 2.03 0.78 0.53 0.10
S. No. Principal Commodities 2014‐15 2015‐16 2016‐17 2017‐18
(April‐ May, 2017)*
126 Milled Products 1.13 1.03 0.50 0.14
127 Vegetable Oils 0.25 0.40 0.37 0.10
128 Leather Garments 0.37 0.74 0.35 0.00
129 Handloom Products 1.12 1.27 0.34 0.03
130 Mica 0.18 0.15 0.31 0.05
131 Saddlery And Harness 0.17 0.10 0.14 0.02
132 Sugar 0.27 0.57 0.13 0.01
133 Alcoholic Beverages 0.14 0.16 0.12 0.01
134 Sulpher, Unroasted Iron Pyrite 0.11 0.13 0.10 0.02
135 Oil Meals 0.06 0.02 0.06 0.01
136 Other Oil Seeds 0.01 0.05 0.05 0.06
137 Cotton Raw Incld. Waste 0.01 0.01 0.05 0.00
138 Other Precious And Base Metals 0.70 0.00 0.03 0.00
139 Floor Cvrng Of Jute 0.04767 0.03828 0.01580 0.00800
140 Poultry Products 0.00214 0.00000 0.00974 0.00000
141 Shellac 2.26642 0.00076 0.00595 0.00003
142 Dairy Products 0.86172 0.58067 0.00586 0.00158
143 Silk Carpet 0.05069 0.00061 0.00139 0.00000
144 Natural Rubber 0.17466 0.13053 0.00128 0.00000
145 Newsprint 26.19044 0.14776 0.00076 0.00078
146 Jute Hessian 0.00000 0.00000 0.00057 0.00000
147 Jute Yarn 0.00017 0.00494 0.00014 0.00010
148 Rice(Other Than Basmoti) 0.00000 0.00095 0.00005 0.00000
149 Buffalo Meat 0.00000 0.00000 0.00000 0.00000
150 Cashew 0.00061 0.00000 0.00000 0.00000
151 Cashew Nut Shell Liquid 1.20575 0.12561 0.00000 0.00000
152 Castor Oil 0.15858 0.04482 0.00000 0.00000

153 Fresh Vegetables 0.04022 0.42286 0.00000 0.00000
154 Groundnut 0.00000 0.00000 0.00000 0.00000
155 Guergam Meal 0.00000 0.20655 0.00000 0.00000
156 Iron Ore 1.15273 0.00088 0.00000 0.00000
157 Mollases 0.00000 0.00003 0.00000 0.00000
158 Other Cereals 0.00000 0.00000 0.00000 0.00000
159 Petroleum: Crude 0.00000 63.25927 0.00000 0.00000
160 Rice ‐Basmoti 0.00000 0.00000 0.00000 0.00000
161 Sesame Seeds 0.00000 0.00000 0.00000 0.00000
162 Tobacco Unmanufactured 0.00000 0.02371 0.00000 0.00000
163 Wheat 0.00000 0.00000 0.00000 0.00000
Total Imports from China 60413.17 61706.83 61286.24 11838.96
Total Imports of India 448033.40 381006.60 384319.30 76159.40
Source: DGCI&S, Kolkata (* Provisional)

Principal Commodity‐wise Imports from USA
(in US$ Millions)
S.No. Principal Commodities 2014‐15 2015‐16 2016‐17 2017‐18
(April May, 2017)*
1 Aircraft, Spacecraft And Parts 2333.57 1857.03 4272.48 179.66
2 Gold 2698.10 2267.89 1422.69 454.42
3 Electric Machinery And Equipme 955.63 909.29 1269.88 253.95
4 Petroleum Products 962.88 792.74 1167.67 209.43
5 Residul Chemicl And Alled Prod 791.49 911.12 787.70 146.36
6 Medical And Scientific Instrum 730.47 738.62 744.81 141.50
7 Fresh Fruits 551.63 724.96 658.34 131.60
8 Plastic Raw Materials 571.78 561.79 614.07 117.49
9 Electronics Instruments 718.40 724.62 607.03 108.84
10 Other Commodities 494.25 377.02 592.12 99.38
11 Organic Chemicals 526.26 546.83 582.27 151.09
12 Paper, Paper Board And Product 524.86 487.15 507.10 89.82
13 Indl. Machnry For Dairy Etc 577.35 594.49 500.99 95.84
14 Coal,Coke And Briquittes Etc 492.43 496.48 470.28 266.68
15 Pearl, Precs, Semiprecs Stones 626.99 528.15 456.69 79.11
16 Iron And Steel 357.69 544.87 377.51 55.29
17 Computer Hardware, Peripherals 322.29 304.49 313.98 56.73
18 Electronics Components 296.99 307.50 294.78 51.69
19 Telecom Instruments 606.64 400.66 292.27 66.31
20 Cotton Raw Incld. Waste 93.88 113.01 289.09 89.97
21 Drug Formulations, Biologicals 286.68 303.20 285.89 50.30
22 Inorganic Chemicals 304.23 265.26 266.97 40.16
23 Ic Engines And Parts 312.06 268.63 262.36 64.17
24 Products Of Iron And Steel 229.79 209.97 228.25 34.50
25 Other Construction Machinery 301.67 218.00 220.18 38.83
26 Surgicals 183.23 166.47 212.33 40.16
27 Project Goods 193.95 261.87 209.17 69.06
28 Alcoholic Beverages 63.29 102.31 205.46 68.35
29 Other Misc. Engineering Items 218.96 208.78 191.77 33.79
30 Othr Rubber Prodct Excpt Footw 212.57 180.55 191.48 36.26
31 Fertilezers Manufactured 301.83 306.70 190.23 18.51
32 Pulses 168.38 151.89 182.76 6.27
33 Auto Components/Parts 163.46 224.66 181.50 40.08
34 Pulp And Waste Paper 250.36 181.23 171.73 31.81
35 Plastc Sht, Film, Plts Etc 116.09 121.50 160.41 28.73
36 Paint, Varnish And Allid Prodc 121.84 141.26 145.05 22.77
37 Aluminium, Products Of Aluminm 165.24 155.10 144.64 21.31
38 Ac, Refrigeration Machnry Etc 214.19 1290.15 143.72 21.81

39 Glass And Glassware 136.40 156.79 139.95 22.26
40 Gold And Oth Precs Metl Jwlery 95.93 134.41 131.66 27.71
41 Agro Chemicals 150.04 120.17 126.72 31.34
S. No. Principal Commodities 2014‐15 2015‐16 2016‐17 2017‐18
(April‐ May, 2017)*
42 Pumps Of All Types 128.12 129.40 124.01 19.15
43 Bulk Drugs, Drug Intermediates 129.33 150.09 122.32 19.53
44 Machine Tools 121.22 91.71 104.13 22.20
45 Cosmetics And Toiletries 86.96 82.03 99.01 19.48
46 Copper And Prdcts Made Of Copr 87.11 99.01 97.62 16.03
47 Ship, Boat And Floating Struct 99.30 109.71 95.50 1.65
48 Moulded And Extruded Goods 86.25 94.45 93.87 16.55
49 Atm, Injctng Mlding Mchnry Etc 103.22 89.55 90.59 14.52
50 Cranes, Lifts And Winches 55.98 74.29 75.26 10.86
51 Consumer Electronics 104.01 102.03 75.14 15.61
52 Manmade Yarn,Fabrics,Madeups 39.67 49.32 62.18 6.61
53 Hnd Tool, Cttng Tool Of Metals 66.08 56.39 60.73 10.63
54 Books, Publications And Prntng 104.30 87.46 60.02 6.32
55 Misc Processed Items 41.69 46.75 58.28 15.06
56 Silver 33.46 174.51 51.61 3.22
57 Cotton Fabrics, Madeups Etc. 72.20 62.75 50.46 9.85
58 Nucler Reactr, Indl Boilr, Prt 63.15 31.97 46.15 3.56
59 Oth Non Ferous Metal And Prodc 49.25 47.37 40.30 7.85
60 Other Miscellaenious Chemicals 32.39 40.31 37.08 5.90
61 Packaging Materials 41.57 40.96 36.67 8.43
62 Processed Minerals 35.77 32.09 34.63 7.49
63 Railwy Trnsprt Equipmnts, Prts 55.97 39.28 33.96 3.15
64 Lead And Products Made Of Led 30.91 27.72 31.65 3.35
65 Motor Vehicle/Cars 10.58 14.64 30.52 0.97
66 Handcrfs(Excl.Handmade Crpts) 37.87 25.54 30.22 2.48
67 Nickel, Product Made Of Nickel 26.36 23.91 29.51 5.33
68 Zinc And Products Made Of Zinc 28.25 18.57 26.63 7.48
69 Accumulators And Batteries 39.72 58.85 26.54 3.48
70 Newsprint 58.20 48.23 25.65 4.01
71 Plywood And Allied Products 30.39 34.32 23.38 4.69
72 Manmade Staple Fibre 30.66 30.94 23.21 3.43
73 Bulk Minerals And Ores 29.56 23.23 22.95 3.90
74 Other Plastic Items 27.74 18.02 21.94 3.46
75 Sports Goods 15.49 20.10 19.77 4.18
76 Optical Items (Incl.Lens Etc) 22.46 19.53 18.75 4.42
77 Electrodes 11.85 11.51 18.51 7.50

78 Other Precious And Base Metals 64.73 47.73 17.72 5.14
79 Ceramics And Allied Products 44.56 43.18 16.23 3.79
80 Marine Products 13.05 12.00 14.18 2.18
81 Oth Txtl Yrn, Fbric Mdup Artcl 15.36 16.52 13.82 3.50
82 Processed Fruits And Juices 8.97 11.25 13.77 5.74
83 Essential Oils 12.37 11.63 12.66 2.50
84 Other Wood And Wood Products 30.90 11.98 11.90 2.77
85 Two And Three Wheelers 9.71 13.86 11.65 2.02
86 Auto Tyres And Tubes 13.07 12.62 10.17 1.74
S. No. Principal Commodities 2014‐15 2015‐16 2016‐17 2017‐18
(April‐ May, 2017)*
87 Carpet(Excl. Silk) Handmade 11.88 10.98 10.04 2.85
88 Fruits / Vegetable Seeds 12.13 11.03 9.62 1.73
89 Finished Leather 10.42 8.72 9.30 1.08
90 Dyes 9.41 10.15 9.25 1.80
91 Spices 8.49 6.57 8.37 1.31
92 Prime Mica And Mica Products 9.56 5.60 5.95 1.12
93 Graphite, Explsivs And Accesor 6.27 5.50 5.03 0.55
94 Fertilezers Crude 2.15 3.17 4.65 0.57
95 Raw Hides And Skins 0.56 1.95 4.60 1.24
96 Leather Goods 5.12 6.07 4.28 0.46
97 Vegetable Oils 2.40 2.49 3.00 0.33
98 Other Crude Minerals 2.75 2.95 2.80 0.72
99 Other Cereals 0.17 0.83 2.71 0.39
100 Cocoa Products 2.76 2.23 2.60 0.47
101 Rmg Of Othr Textle Matrl 3.19 2.76 2.51 0.20
102 Wool, Raw 9.32 4.60 2.36 0.09
103 Dye Intermediates 9.53 3.00 1.94 0.32
104 Sugar 1.16 1.39 1.87 0.34
105 Rmg Cotton Incl Accessories 3.12 4.62 1.81 0.29
106 Footwear Of Leather 2.30 1.34 1.34 0.19
107 Office Equipments 2.67 2.22 1.25 0.08
108 Wollen Yarn,Fabrics,Madeupsetc 0.31 1.02 1.19 0.13
109 Cereal Preparations 1.87 1.58 1.16 0.27
110 Leather Footwear Component 1.37 2.67 1.08 0.10
111 Granit, Natrl Stone And Prodct 0.52 1.35 0.97 0.14
112 Bicycle And Parts 2.83 3.38 0.94 0.14
113 Rmg Manmade Fibres 1.70 1.38 0.90 0.06
114 Stationry/Offce, School Supply 2.44 1.67 0.74 0.08
115 Tea 0.34 0.83 0.71 0.08
116 Other Oil Seeds 0.11 0.75 0.59 0.01

117 Shellac 0.57 0.54 0.55 0.09
118 Cmnt, Clinkr And Asbstos Cmnt 1.00 0.38 0.41 0.10
119 Processed Vegetables 1.86 1.82 0.37 0.04
120 Rice(Other Than Basmoti) 0.33 0.14 0.36 0.00
121 Guergam Meal 0.69 1.50 0.30 0.03
122 Dairy Products 4.98 0.28 0.30 0.00
123 Rmg Wool 0.20 0.11 0.28 0.01
124 Footwear Of Rubber/Canvas Etc. 0.16 0.30 0.27 0.04
125 Coffee 0.51 0.44 0.23 0.03
126 Ayush And Herbal Products 0.55 0.21 0.23 0.06
127 Tobacco Manufactured 0.35 0.12 0.20 0.03
128 Other Jute Manufactures 0.21 0.22 0.18 0.00
129 Floricltr Products 0.37 0.28 0.18 0.03
130 Poultry Products 0.69 0.17 0.17 0.00
S. No. Principal Commodities 2014‐15 2015‐16 2016‐17 2017‐18
(April‐ May, 2017)*
131 Oil Meals 0.10 0.10 0.16 0.00
132 Mica 0.05 0.11 0.15 0.04
133 Natrl Silk Yarn,Fabrics,Madeup 0.10 0.14 0.15 0.00
134 Castor Oil 0.12 0.07 0.13 0.02
135 Tobacco Unmanufactured 0.32 0.18 0.10 0.18
136 Sulpher, Unroasted Iron Pyrite 0.06 0.09 0.09 0.01
137 Milled Products 0.05 0.10 0.09 0.01
138 Human Hair, Products Thereo 0.05 0.07 0.06 0.03
139 Rmg Silk 0.22 0.03 0.05 0.00
140 Tin And Products Made Of Tin 0.09 0.02 0.04 0.00
141 Coir And Coir Manufactures 0.00 0.01 0.04 0.01
142 Leather Garments 0.13 0.11 0.04 0.00
143 Cotton Yarn 0.07 0.03 0.03 0.00
144 Mollases 0.00495 0.01118 0.02481 0.00000
145 Cashew Nut Shell Liquid 0.00000 0.00000 0.02075 0.00000
146 Saddlery And Harness 0.00390 0.01898 0.01288 0.00488
147 Handloom Products 0.00855 0.01886 0.00007 0.01185
149 Cashew 0.13395 0.30241 0.00000 0.00000
150 Floor Cvrng Of Jute 0.00000 0.00003 0.00000 0.00000
151 Fresh Vegetables 0.17410 0.00000 0.00000 0.00000
153 Iron Ore 0.00090 0.00234 0.00000 0.00000
155 Jute Yarn 0.00014 0.00000 0.00000 0.00000
157 Natural Rubber 0.03442 0.00048 0.00000 0.00000
159 Other Meat 0.00120 0.00000 0.00000 0.00000
160 Petroleum: Crude 0.00000 15.73527 0.00000 46.43915

163 Sesame Seeds 0.00000 0.01536 0.00000 0.00000
165 Silk Carpet 0.00000 0.00005 0.00000 0.00000
Total Imports from USA 21814.60 21781.39 22343.53 3989.41
India’s Total Imports 448033.40 381006.60 384319.30 76159.40
Source: DGCI&S, Kolkata (* Provisional)

Principal Commodity‐wise Imports from Australia
(in US$ Millions)
S. No. Principal Commodities 2014‐15 2015‐16 2016‐17 2017‐18
(April‐May, 2017)*
1 Coal,Coke And Briquittes Etc 5665.97 4543.91 6472.52 1251.44
2 Pulses 188.41 624.34 921.72 146.96
3 Bulk Minerals And Ores 983.31 643.85 590.40 101.87
4 Petroleum Products 1.83 290.27 528.03 86.29
5 Wheat 9.25 123.46 525.38 48.56
6 Processed Minerals 262.44 269.51 341.55 74.66
7 Gold 1603.88 742.29 297.31 127.50
8 Cotton Raw Incld. Waste 53.77 29.90 282.59 2.42
9 Wool, Raw 174.84 164.71 159.91 39.23
10 Aluminium, Products Of Aluminm 100.85 139.50 158.20 34.09
11 Pearl, Precs, Semiprecs Stones 37.16 51.36 97.44 33.05
12 Lead And Products Made Of Led 113.98 96.46 94.99 12.60
13 Fresh Fruits 102.81 158.46 90.93 16.76
14 Iron And Steel 148.21 142.36 66.81 11.96
15 Nickel, Product Made Of Nickel 76.31 99.50 59.59 12.14
16 Paint, Varnish And Allid Prodc 75.87 52.23 58.78 12.98
17 Newsprint 20.63 33.59 45.95 9.44
18 Medical And Scientific Instrum 25.58 23.75 30.90 4.88
19 Indl. Machnry For Dairy Etc 27.88 28.69 26.12 2.12
20 Petroleum: Crude 52.37 217.57 23.63 0.00
21 Zinc And Products Made Of Zinc 41.74 32.25 22.53 4.05
22 Paper, Paper Board And Product 31.38 25.86 20.15 4.00
23 Fertilezers Manufactured 0.12 0.11 19.58 0.00
24 Electronics Instruments 14.02 10.91 13.96 1.68
25 Cereal Preparations 15.91 14.96 12.18 1.44
26 Finished Leather 12.89 9.62 11.09 1.75
27 Other Commodities 7.67 7.80 10.81 2.02
28 Inorganic Chemicals 11.14 11.62 10.41 10.59
29 Plywood And Allied Products 3.63 4.73 10.00 0.56
30 Drug Formulations, Biologicals 20.60 11.02 9.88 2.01
31 Electronics Components 9.21 11.22 8.60 0.94
32 Ayush And Herbal Products 2.73 4.72 7.30 2.48
33 Bulk Drugs, Drug Intermediates 8.96 7.48 5.78 1.36
34 Cosmetics And Toiletries 7.10 7.07 5.57 2.69
35 Other Construction Machinery 14.66 13.91 5.51 0.70
36 Gold And Oth Precs Metl Jwlery 3.36 3.89 5.28 0.68
37 Other Wood And Wood Products 17.27 1.82 4.79 0.32
38 Motor Vehicle/Cars 0.23 0.02 4.49 0.08

39 Aircraft, Spacecraft And Parts 0.90 0.52 4.47 0.12
40 Other Cereals 4.77 4.72 4.29 1.07
41 Machine Tools 3.72 1.78 4.03 0.52
S. No. Principal Commodities 2014‐15 2015‐16 2016‐17 2017‐18
(April‐ May, 2017)*
42 Plastic Raw Materials 3.93 4.68 3.93 0.54
43 Residul Chemicl And Alled Prod 4.37 6.26 3.74 0.51
44 Other Misc. Engineering Items 6.15 2.38 3.74 0.54
45 Electric Machinery And Equipme 7.53 4.65 3.58 6.47
46 Handcrfs(Excl.Handmade Crpts) 0.39 0.18 3.35 0.03
47 Telecom Instruments 2.76 2.61 3.09 0.33
48 Othr Rubber Prodct Excpt Footw 1.28 2.05 3.07 0.60
49 Auto Components/Parts 1.11 4.08 3.06 0.61
50 Pumps Of All Types 1.92 1.19 2.96 0.08
51 Plastc Sht, Film, Plts Etc 2.14 2.45 2.93 0.65
52 Alcoholic Beverages 3.61 4.17 2.89 0.65
53 Copper And Prdcts Made Of Copr 9.91 6.80 2.87 0.29
54 Products Of Iron And Steel 3.96 9.38 2.69 1.11
55 Moulded And Extruded Goods 1.87 1.75 2.69 0.34
56 Consumer Electronics 2.82 1.93 2.68 0.38
57 Railwy Trnsprt Equipmnts, Prts 0.64 1.82 2.29 1.32
58 Surgicals 1.99 2.46 2.23 0.04
59 Atm, Injctng Mlding Mchnry Etc 5.12 3.61 2.16 0.32
60 Other Miscellaenious Chemicals 4.11 5.07 2.16 0.64
61 Misc Processed Items 1.41 1.59 2.12 0.72
62 Cranes, Lifts And Winches 1.68 2.17 1.70 0.31
63 Raw Hides And Skins 1.53 0.91 1.60 0.22
64 Ac, Refrigeration Machnry Etc 2.40 1.42 1.60 0.20
65 Essential Oils 6.25 2.64 1.35 0.74
66 Computer Hardware, Peripherals 1.57 1.51 1.33 0.36
67 Sports Goods 0.86 1.82 1.11 0.14
68 Processed Fruits And Juices 1.24 1.58 1.04 0.14
69 Books, Publications And Prntng 0.94 0.92 0.95 0.09
70 Fruits / Vegetable Seeds 1.59 1.14 0.85 0.03
71 Organic Chemicals 1.42 0.98 0.81 0.09
72 Oth Non Ferous Metal And Prodc 2.29 1.48 0.72 0.19
73 Glass And Glassware 0.66 0.63 0.66 0.09
74 Manmade Yarn,Fabrics,Madeups 2.87 1.71 0.65 0.16
75 Nucler Reactr, Indl Boilr, Prt 1.08 0.99 0.62 0.10
76 Ic Engines And Parts 0.76 0.76 0.60 0.08
77 Other Crude Minerals 0.42 1.12 0.58 0.44
78 Iron Ore 161.01 3.88 0.50 0.00

79 Dairy Products 0.15 0.44 0.49 0.19
80 Cotton Fabrics, Madeups Etc. 0.42 0.20 0.48 0.03
81 Vegetable Oils 0.32 0.21 0.45 0.03
82 Packaging Materials 0.34 0.37 0.45 0.06
83 Sheep/Goat Meat 0.74 0.18 0.39 0.05
84 Agro Chemicals 0.24 0.25 0.37 0.05
85 Ceramics And Allied Products 0.79 0.43 0.37 0.04
S. No. Principal Commodities 2014‐15 2015‐16 2016‐17 2017‐18
(April‐ May, 2017)*
86 Graphite, Explsivs And Accesor 0.97 0.54 0.31 0.01
87 Hnd Tool, Cttng Tool Of Metals 0.58 0.45 0.29 0.03
88 Footwear Of Leather 0.36 0.18 0.26 0.04
89 Auto Tyres And Tubes 0.29 0.51 0.22 0.02
90 Ship, Boat And Floating Struct 1.83 1.65 0.21 0.00
91 Other Plastic Items 0.29 0.20 0.19 0.03
92 Accumulators And Batteries 0.24 0.38 0.18 0.00
93 Oth Txtl Yrn, Fbric Mdup Artcl 1.72 0.28 0.18 0.06
94 Processed Vegetables 0.00 0.03 0.18 0.00
95 Project Goods 19.61 13.52 0.16 0.00
96 Carpet(Excl. Silk) Handmade 0.28 0.01 0.13 0.00
97 Cocoa Products 0.53 0.02 0.13 0.00
98 Granit, Natrl Stone And Prodct 0.05 0.04 0.09 0.00
99 Optical Items (Incl.Lens Etc) 0.11 0.21 0.09 0.03
100 Electrodes 0.10 0.07 0.07 0.00
101 Spices 0.11 0.02 0.05 0.02
102 Bicycle And Parts 0.00007 0.02318 0.04774 0.00003
103 Prime Mica And Mica Products 0.00673 0.00853 0.04699 0.00138
104 Office Equipments 0.02202 0.03134 0.04615 0.00000
105 Pulp And Waste Paper 0.00000 0.00000 0.04264 0.00000
106 Rmg Of Othr Textle Matrl 0.03353 0.01682 0.03720 0.01367
107 Fertilezers Crude 0.00728 0.04495 0.03311 0.00000
108 Dyes 0.59815 0.42073 0.02305 0.05010
109 Wollen Yarn,Fabrics,Madeupsetc 0.10016 0.04944 0.02145 0.01204
110 Leather Goods 0.00075 0.02395 0.02002 0.02703
111 Rmg Cotton Incl Accessories 0.01777 0.00914 0.01530 0.00695
112 Rmg Manmade Fibres 0.00266 0.02232 0.01379 0.00000
113 Tea 0.00000 0.01263 0.01223 0.00000
114 Rmg Wool 0.00051 0.03230 0.00994 0.00000
115 Milled Products 0.43479 0.61996 0.00768 0.00000
116 Two And Three Wheelers 0.00000 0.00000 0.00648 0.00000
117 Coir And Coir Manufactures 0.00000 0.00000 0.00365 0.00000

118 Stationry/Offce, School Supply 0.01048 0.00257 0.00324 0.00000
119 Rmg Silk 0.00277 0.00057 0.00176 0.00000
120 Footwear Of Rubber/Canvas Etc. 0.00002 0.00000 0.00135 0.00012
121 Other Jute Manufactures 0.00000 0.00000 0.00101 0.00000
122 Cmnt, Clinkr And Asbstos Cmnt 0.00149 0.00003 0.00041 0.00000
123 Handloom Products 0.00260 0.00000 0.00010 0.00000
124 Silver 2.83238 120.68865 0.00000 0.00000
125 Cotton Yarn 0.17460 0.00000 0.00000 0.00000
126 Marine Products 0.00748 0.00000 0.00000 0.00000
127 Mollases 0.00690 0.00700 0.00000 0.00000
128 Other Precious And Base Metals 0.00571 0.00002 0.00000 0.00000
129 Coffee 0.00466 0.00000 0.00000 0.00000
S. No. Principal Commodities 2014‐15 2015‐16 2016‐17 2017‐18
(April‐ May, 2017)*
130 Other Oil Seeds 0.00088 0.00000 0.00000 0.00000
131 Leather Footwear Component 0.00040 0.00000 0.00000 0.00000
132 Oil Meals 0.00030 0.00000 0.00000 0.00000
133 Human Hair, Products Thereo 0.00021 0.00000 0.00000 0.00000
134 Floricltr Products 0.00018 0.00200 0.00000 0.00000
135 Saddlery And Harness 0.00012 0.00000 0.00000 0.00000
136 Poultry Products 0.00000 0.00000 0.00000 0.04129
137 Processed Meat 0.00000 0.00185 0.00000 0.00000
138 Sugar 0.00000 0.08834 0.00000 0.00000
139 Sulpher, Unroasted Iron Pyrite 0.00000 0.00754 0.00000 0.00000
Total imports from Australia
10247.24 8898.78 11154.48 2088.43
India’s Total Imports 448033.40 381006.60 384319.30 76159.40
Source: DGCI&S, Kolkata (* Provisional)

Principal Commodity‐wise Imports from Africa
(in US$ Millions)
S. No. Principal Commodities 2014‐15 2015‐16 2016‐17
2017‐18 (April‐May, 2017)*
1 Coal,Coke And Briquittes Etc 2494.37 2175.96 2103.35 519.04
2 Gold 1711.72 1591.06 1693.64 369.90
3 Pearl, Precs, Semiprecs Stones 110.70 194.88 472.20 125.10
4 Bulk Minerals And Ores 380.29 156.27 225.20 50.61
5 Pulp And Waste Paper 64.55 159.11 198.67 39.07
6 Iron Ore 469.89 300.03 165.12 7.53
7 Iron And Steel 538.41 357.80 154.24 26.82
8 Ic Engines And Parts 86.26 108.87 109.68 23.29
9 Other Precious And Base Metals 43.41 63.31 96.46 17.25
10 Petroleum Products 18.31 215.98 85.99 2.51
11 Aluminium, Products Of Aluminm 83.30 123.94 68.82 10.10
12 Inorganic Chemicals 33.40 43.55 68.31 11.96
13 Organic Chemicals 83.35 64.08 43.44 9.36
14 Nickel, Product Made Of Nickel 29.58 31.37 41.13 6.97
15 Copper And Prdcts Made Of Copr 25.18 44.13 34.20 4.86
16 Other Wood And Wood Products 49.16 43.66 33.51 4.62
17 Other Commodities 26.04 23.93 23.36 4.62
18 Auto Components/Parts 13.04 20.72 17.92 2.62
19 Indl. Machnry For Dairy Etc 35.24 22.96 17.05 4.12
20 Residul Chemicl And Alled Prod 15.32 16.32 17.03 2.86
21 Paper, Paper Board And Product 13.62 12.88 16.37 2.65
22 Other Misc. Engineering Items 2.72 17.12 13.64 0.13
23 Fresh Fruits 11.34 16.61 12.17 4.54
24 Silver 30.32 11.61 8.52 0.00
25 Glass And Glassware 12.09 15.94 8.21 0.54
26 Wool, Raw 14.96 13.06 7.65 2.35
27 Other Crude Minerals 6.93 7.30 6.99 2.60
28 Plastic Raw Materials 21.80 10.06 6.42 0.53
29 Cranes, Lifts And Winches 2.76 4.58 4.69 0.14
30 Fertilezers Crude 3.44 3.61 4.07 0.00
31 Oth Non Ferous Metal And Prodc 4.00 2.24 4.01 1.58
32 Lead And Products Made Of Led 1.69 1.31 3.75 0.27
33 Other Construction Machinery 1.93 2.81 3.44 0.03
34 Othr Rubber Prodct Excpt Footw 3.81 6.60 3.16 0.71
35 Products Of Iron And Steel 2.63 3.78 3.05 0.80
36 Vegetable Oils 0.00 0.00 2.71 0.00
37 Consumer Electronics 3.97 10.57 2.19 0.01
38 Processed Minerals 4.93 2.11 1.97 0.72

39 Cotton Raw Incld. Waste 3.58 0.29 1.96 0.00
40 Atm, Injctng Mlding Mchnry Etc 1.57 1.99 1.67 0.06
S. No.
Principal Commodities 2014‐15 2015‐16 2016‐17 2017‐18
(April‐ May, 2017)*
41 Drug Formulations, Biologicals 3.03 1.36 1.66 5.18
42 Granit, Natrl Stone And Prodct 1.83 1.53 1.49 0.39
43 Alcoholic Beverages 0.66 1.84 1.30 0.18
44 Finished Leather 1.57 1.58 1.30 0.19
45 Cosmetics And Toiletries 0.72 1.26 1.22 0.26
46 Zinc And Products Made Of Zinc 1.96 1.50 1.18 0.34
47 Pumps Of All Types 0.45 0.50 1.12 0.03
48 Newsprint 0.05 2.10 1.08 0.00
49 Electric Machinery And Equipme 0.76 3.48 1.05 0.09
50 Processed Fruits And Juices 1.50 1.65 0.97 0.03
51 Bulk Drugs, Drug Intermediates 0.18 0.10 0.96 0.18
52 Manmade Yarn,Fabrics,Madeups 0.14 0.26 0.86 0.21
53 Other Miscellaenious Chemicals 0.47 0.82 0.81 0.00
54 Electronics Instruments 1.10 1.39 0.69 0.16
55 Machine Tools 0.19 0.20 0.66 0.04
56 Ac, Refrigeration Machnry Etc 0.38 6.60 0.66 0.06
57 Cotton Fabrics, Madeups Etc. 0.43 0.38 0.64 0.04
58 Ceramics And Allied Products 0.34 1.04 0.60 0.00
59 Paint, Varnish And Allid Prodc 1.35 0.29 0.59 0.03
60 Electronics Components 0.51 0.56 0.58 0.06
61 Rmg Of Othr Textle Matrl 0.07 0.29 0.54 0.00
62 Wollen Yarn,Fabrics,Madeupsetc 0.25 0.64 0.51 0.08
63 Plywood And Allied Products 0.13 0.79 0.49 0.20
64 Medical And Scientific Instrum 3.91 0.85 0.43 0.10
65 Telecom Instruments 2.06 1.41 0.42 0.00
66 Spices 0.47 0.37 0.39 0.07
67 Carpet(Excl. Silk) Handmade 0.01 0.05 0.38 0.07
68 Hnd Tool, Cttng Tool Of Metals 0.51 0.38 0.34 0.00
69 Fruits / Vegetable Seeds 0.77 0.90 0.33 0.11
70 Other Cereals 0.22 0.28 0.32 0.10
71 Raw Hides And Skins 0.57 0.01 0.32 0.04
72 Essential Oils 0.14 0.24 0.30 0.11
73 Marine Products 0.04 0.02 0.24 0.00
74 Manmade Staple Fibre 0.00 0.02 0.23 0.06
75 Railwy Trnsprt Equipmnts, Prts 0.13 0.74 0.20 0.33
76 Plastc Sht, Film, Plts Etc 0.17 0.26 0.19 0.02
77 Gold And Oth Precs Metl Jwlery 0.18 0.08 0.19 0.00

78 Auto Tyres And Tubes 0.69 0.36 0.18 0.00
79 Packaging Materials 0.05 0.06 0.18 0.03
80 Handcrfs(Excl.Handmade Crpts) 0.36 0.05 0.18 0.05
81 Ayush And Herbal Products 0.17 0.15 0.16 0.00
82 Optical Items (Incl.Lens Etc) 0.17 0.03 0.14 0.00
83 Floricltr Products 0.08 0.17 0.14 0.03
84 Moulded And Extruded Goods 1.08 0.20 0.14 0.01
S. No.
Principal Commodities 2014‐15 2015‐16 2016‐17 2017‐18
(April‐ May, 2017)*
85 Fertilezers Manufactured 0.08 0.05 0.09 0.00
86 Dyes 0.03 0.11 0.09 0.00
87 Footwear Of Leather 0.00 0.00 0.09 0.00
88 Prime Mica And Mica Products 0.05 0.01 0.08 0.00
89 Sports Goods 0.02 0.17 0.06 0.02
90 Other Plastic Items 0.06 0.00 0.05 0.00
91 Oth Txtl Yrn, Fbric Mdup Artcl 0.24 0.16 0.05 0.08
92 Aircraft, Spacecraft And Parts 0.17 0.76 0.05 0.01
93 Misc Processed Items 0.03 0.03 0.04 0.00
94 Accumulators And Batteries 0.00007 0.11974 0.03772 0.00000
95 Project Goods 0.00000 0.05248 0.03533 0.00000
96 Books, Publications And Prntng 0.10025 0.13848 0.03403 0.00342
97 Cocoa Products 0.13534 0.01153 0.02928 0.03908
98 Graphite, Explsivs And Accesor 0.08774 0.00923 0.02495 0.00000
99 Rmg Manmade Fibres 0.00152 0.00000 0.02443 0.00000
100 Computer Hardware, Peripherals 0.11515 0.50722 0.02319 0.02790
101 Nucler Reactr, Indl Boilr, Prt 0.18107 0.24581 0.02218 0.00000
102 Pulses 0.05619 0.02360 0.02008 0.00000
103 Bicycle And Parts 0.01257 0.00233 0.01795 0.00000
104 Electrodes 0.00000 0.00274 0.01299 0.01941
105 Surgicals 0.11482 0.08859 0.01017 0.00967
106 Leather Goods 0.00002 0.00007 0.00675 0.00000
107 Agro Chemicals 0.02617 0.00151 0.00537 0.00048
108 Rmg Cotton Incl Accessories 0.00017 0.00119 0.00385 0.00000
109 Stationry/Offce, School Supply 0.00004 0.00000 0.00266 0.00000
110 Office Equipments 0.00000 0.02149 0.00259 0.00000
111 Processed Vegetables 0.00000 0.00486 0.00215 0.00000
112 Cereal Preparations 0.00139 0.00841 0.00193 0.00000
113 Sugar 0.00278 0.00000 0.00121 0.00000
114 Coffee 0.00000 0.01618 0.00083 0.00208
115 Cmnt, Clinkr And Asbstos Cmnt 0.00189 0.00062 0.00020 0.00005
116 Natural Rubber 3.08867 0.73151 0.00000 0.00000
117 Ship, Boat And Floating Struct 1.77375 5.42882 0.00000 0.00000
118 Dye Intermediates 0.34473 0.31844 0.00000 0.00000

119 Tea 0.25155 0.04021 0.00000 0.00963
120 Leather Footwear Component 0.03442 0.00000 0.00000 0.00000
121 Footwear Of Rubber/Canvas Etc. 0.01808 0.00008 0.00000 0.00000
122 Motor Vehicle/Cars 0.01182 0.15973 0.00000 0.03163
123 Two And Three Wheelers 0.00561 0.00000 0.00000 0.00000
124 Human Hair, Products Thereo 0.00033 0.00000 0.00000 0.00000
125 Dairy Products 0.00000 0.00319 0.00000 0.00000
126 Leather Garments 0.00000 0.00004 0.00000 0.00000
127 Natrl Silk Yarn,Fabrics,Madeup 0.00000 0.00701 0.00000 0.00236
128 Rmg Silk 0.00000 0.00003 0.00000 0.00000
129 Tobacco Manufactured 0.00000 0.00000 0.00000 0.01214
Total Imports From Africa 6496.52 5948.42 5813.22 1270.05
India’s Total Imports 448033.40 381006.60 384319.30 76159.40
Source: DGCI&S, Kolkata (* Provisional)
Principal Commodity‐wise Imports from Brazil
(in US$ Millions)
S.No. Principal Commodities 2014‐15 2015‐16 2016‐17 2017‐18
(April‐May, 2017)*
1 Petroleum: Crude 2510.81 1240.34 1334.64 200.92
2 Sugar 595.20 604.71 1015.38 78.82
3 Vegetable Oils 408.19 570.35 389.24 77.03
4 Iron And Steel 207.77 261.33 161.60 20.63
5 Bulk Minerals And Ores 255.17 283.01 159.15 36.24
6 Iron Ore 284.49 49.77 119.13 51.35
7 Plastic Raw Materials 13.88 38.60 107.65 20.15
8 Organic Chemicals 109.53 132.40 89.49 18.26
9 Drug Formulations, Biologicals 64.45 47.40 75.09 7.83
10 Gold 337.08 205.02 70.13 43.70
11 Other Commodities 47.32 68.03 56.07 8.60
12 Petroleum Products 23.69 4.31 46.25 0.00
13 Copper And Prdcts Made Of Copr 1.39 5.68 42.81 3.41
14 Other Wood And Wood Products 20.51 53.92 39.92 6.44
15 Residul Chemicl And Alled Prod 28.74 30.14 34.69 7.79
16 Plywood And Allied Products 19.79 18.77 25.60 4.73
17 Other Crude Minerals 44.53 33.73 19.99 4.74
18 Finished Leather 25.15 29.23 19.92 3.22
19 Paint, Varnish And Allid Prodc 4.30 17.65 18.87 4.15
20 Alcoholic Beverages 0.00 43.01 18.83 0.00
21 Pulp And Waste Paper 2.92 6.61 18.48 3.40
22 Other Construction Machinery 4.04 5.49 17.52 0.68
23 Cotton Raw Incld. Waste 2.70 5.14 15.45 0.71
24 Auto Components/Parts 27.21 20.67 14.71 2.22

25 Nickel, Product Made Of Nickel 10.75 9.43 14.36 2.82
26 Pearl, Precs, Semiprecs Stones 13.47 5.83 14.06 5.59
27 Indl. Machnry For Dairy Etc 20.41 14.76 11.30 5.71
28 Ic Engines And Parts 12.13 8.57 10.87 1.96
29 Medical And Scientific Instrum 7.91 8.55 9.79 2.10
30 Aluminium, Products Of Aluminm 5.65 2.51 9.31 0.66
31 Electric Machinery And Equipme 9.78 14.01 9.12 2.70
32 Other Misc. Engineering Items 8.36 8.36 8.78 2.05
33 Products Of Iron And Steel 18.27 13.51 8.08 1.78
34 Inorganic Chemicals 6.41 8.42 7.96 2.00
35 Pumps Of All Types 7.95 7.37 7.84 0.87
36 Electronics Instruments 5.57 5.08 7.52 1.46
37 Auto Tyres And Tubes 9.11 14.48 5.77 3.16
38 Paper, Paper Board And Product 1.92 2.69 5.59 0.60
39 Ac, Refrigeration Machnry Etc 5.04 6.39 5.47 1.17
40 Spices 6.29 3.02 5.21 2.09
41 Surgicals 9.13 4.30 4.64 0.99
S. No.
Principal Commodities 2014‐15 2015‐16 2016‐17 2017‐18
(April‐ May, 2017)*
42 Othr Rubber Prodct Excpt Footw 7.71 5.65 4.23 2.28
43 Machine Tools 4.71 2.31 4.19 0.29
44 Processed Fruits And Juices 2.50 2.39 4.09 0.51
45 Cosmetics And Toiletries 4.36 4.92 3.26 0.70
46 Granit, Natrl Stone And Prodct 6.50 5.99 3.08 0.65
47 Atm, Injctng Mlding Mchnry Etc 5.07 4.16 2.72 0.40
48 Electronics Components 4.68 3.32 2.56 0.36
49 Processed Minerals 2.35 13.68 2.45 0.22
50 Telecom Instruments 38.23 15.55 2.43 1.18
51 Oth Non Ferous Metal And Prodc 4.73 3.05 2.10 0.53
52 Moulded And Extruded Goods 2.68 2.00 1.88 0.35
53 Misc Processed Items 0.63 1.22 1.86 0.34
54 Other Cereals 0.11 2.02 1.67 0.00
55 Bulk Drugs, Drug Intermediates 1.95 1.75 1.50 0.18
56 Footwear Of Leather 1.10 1.27 1.44 1.08
57 Optical Items (Incl.Lens Etc) 1.34 1.09 1.26 0.18
58 Glass And Glassware 0.18 2.42 1.21 0.25
59 Other Plastic Items 0.50 1.12 1.17 0.43
60 Prime Mica And Mica Products 1.76 1.03 1.01 0.15
61 Railwy Trnsprt Equipmnts, Prts 1.72 1.66 0.95 0.00
62 Hnd Tool, Cttng Tool Of Metals 2.19 0.71 0.94 0.06
63 Pulses 0.57 5.92 0.93 0.00

64 Other Miscellaenious Chemicals 0.09 2.44 0.84 0.00
65 Plastc Sht, Film, Plts Etc 1.37 0.91 0.81 0.33
66 Tobacco Unmanufactured 1.99 1.35 0.79 0.00
67 Ceramics And Allied Products 0.35 0.38 0.76 0.09
68 Essential Oils 0.73 0.44 0.76 0.24
69 Zinc And Products Made Of Zinc 0.94 0.95 0.74 0.00
70 Cranes, Lifts And Winches 0.79 0.20 0.71 0.02
71 Footwear Of Rubber/Canvas Etc. 1.14 0.63 0.71 0.18
72 Poultry Products 0.27 0.49 0.63 0.20
73 Manmade Yarn,Fabrics,Madeups 0.78 0.36 0.61 0.11
74 Packaging Materials 0.18 0.32 0.61 0.09
75 Electrodes 1.12 0.84 0.55 0.04
76 Silk,Raw 0.23 0.17 0.40 0.00
77 Aircraft, Spacecraft And Parts 45.71 0.47 0.38 0.02
78 Fresh Fruits 0.00 0.71 0.33 0.19
79 Dyes 0.22 0.14 0.25 0.03
80 Dye Intermediates 0.00 0.00 0.20 0.00
81 Leather Footwear Component 0.27 0.19 0.20 0.04
82 Motor Vehicle/Cars 0.13 0.16 0.20 0.00
83 Ayush And Herbal Products 0.17 0.19 0.15 0.00
84 Raw Hides And Skins 0.60 0.30 0.12 0.04
85 Handcrfs(Excl.Handmade Crpts) 0.09 0.14 0.12 0.01
S. No.
Principal Commodities 2014‐15 2015‐16 2016‐17 2017‐18
(April‐ May, 2017)*
86 Gold And Oth Precs Metl Jwlery 0.00 0.01 0.12 0.01
87 Oth Txtl Yrn, Fbric Mdup Artcl 0.22 0.05 0.09 0.01
88 Consumer Electronics 0.28 0.03 0.05 0.01
89 Computer Hardware, Peripherals 0.43 0.29 0.04 0.00
90 Cotton Fabrics, Madeups Etc. 0.03 0.02 0.03 0.03
91 Rmg Cotton Incl Accessories 0.00 0.01 0.03 0.00
92 Two And Three Wheelers 0.00 0.00 0.03 0.00
93 Nucler Reactr, Indl Boilr, Prt 0.00 0.18 0.03 0.00
94 Cashew 0.00 0.00 0.03 0.00
95 Sports Goods 0.15 0.03 0.02 0.01
96 Natrl Silk Yarn,Fabrics,Madeup 0.00 0.00 0.02 0.00
97 Wool, Raw 0.09 0.73 0.02 0.02
98 Mica 0.00 0.00 0.01 0.00
99 Lead And Products Made Of Led 0.00 0.40 0.01 0.00
100 Bicycle And Parts 0.00 0.00 0.01 0.00
101 Natural Rubber 0.00 0.00 0.01 0.00

102 Books, Publications And Prntng 0.01 0.02 0.01 0.00
103 Silver 0.01 0.01 0.01 0.00
104 Accumulators And Batteries 0.12 0.00 0.00 0.00
105 Office Equipments 0.03 0.02 0.00 0.00
106 Agro Chemicals 12.53 16.96 0.00 0.32
107 Fruits / Vegetable Seeds 0.00 0.00 0.00 0.00
108 Rmg Of Othr Textle Matrl 0.00 0.01 0.00 0.00
109 Stationry/Offce, School Supply 0.00 0.00 0.00 0.00
110 Project Goods 18.09 1.77 0.00 0.00
111 Ship, Boat And Floating Struct 17.09 9.37 0.00 0.00
112 Coffee 1.75 2.00 0.00 0.14
113 Manmade Staple Fibre 0.14 0.02 0.00 0.00
114 Cocoa Products 0.11 0.33 0.00 0.00
115 Cashew Nut Shell Liquid 0.03 0.00 0.00 0.00
116 Shellac 0.01 0.00 0.00 0.00
117 Other Precious And Base Metals 0.01 0.00 0.00 0.00
118 Rmg Manmade Fibres 0.0024 0.0009 0.0000 0.0000
119 Cereal Preparations 0.0021 0.0000 0.0000 0.0000
120 Rmg Wool 0.0003 0.0000 0.0000 0.0000
121 Leather Goods 0.0002 0.0000 0.0000 0.0000
122 Cmnt, Clinkr And Asbstos Cmnt 0.0000 0.0002 0.0000 0.0000
123 Guergam Meal 0.0000 0.0013 0.0000 0.0000
124 Human Hair, Products Thereo 0.0000 0.0039 0.0000 0.0000
125 Marine Products 0.0000 0.0000 0.0000 0.0000
126 Mollases 0.0000 0.0000 0.0000 0.0104
127 Sesame Seeds 0.0000 0.2501 0.0000 0.0000
128 Tin And Products Made Of Tin 0.0000 0.0046 0.0000 0.0000
129 Tobacco Manufactured 0.0000 0.0000 0.0000 0.0004
Total Imports from Brazil 5400.91 4040.09 4114.69 655.07
India’s total Imports 448033.40 381006.60 384319.30 76159.40
Source: DGCI&S, Kolkata (* Provisional)
Principal Commodity‐wise Imports from Mexico
(in US$ Millions)
S. No. Principal Commodities 2014‐15 2015‐16 2016‐17
2017‐18 (April‐May, 2017)*
1 Petroleum: Crude 2684.27 1378.88 1842.30 343.56
2 Telecom Instruments 205.45 243.78 358.69 83.09
3 Gold 0.32 0.00 126.90 26.27
4 Computer Hardware, Peripherals 66.23 92.54 116.28 14.23
5 Auto Components/Parts 40.09 66.95 52.63 10.10
6 Bulk Minerals And Ores 17.29 61.99 52.06 2.49
7 Paint, Varnish And Allid Prodc 4.39 11.57 37.89 10.08

8 Electronics Instruments 42.84 39.61 37.23 7.84
9 Electronics Components 25.19 25.41 35.42 6.75
10 Medical And Scientific Instrum 21.06 20.16 27.27 5.75
11 Residul Chemicl And Alled Prod 15.15 14.32 25.41 1.79
12 Bulk Drugs, Drug Intermediates 19.58 21.09 23.52 3.13
13 Electric Machinery And Equipme 20.08 45.44 18.31 4.05
14 Iron And Steel 21.41 27.92 12.58 1.60
15 Plastic Raw Materials 9.03 2.85 12.42 1.03
16 Ic Engines And Parts 10.90 8.55 11.69 1.95
17 Other Misc. Engineering Items 15.96 14.87 10.71 2.27
18 Glass And Glassware 7.48 15.24 10.46 1.51
19 Indl. Machnry For Dairy Etc 6.68 10.92 8.73 1.22
20 Surgicals 23.02 26.17 7.71 1.87
21 Consumer Electronics 4.42 5.73 7.18 1.75
22 Inorganic Chemicals 1.24 2.18 6.88 0.23
23 Pumps Of All Types 5.85 3.48 6.06 0.41
24 Zinc And Products Made Of Zinc 9.63 6.22 5.88 1.02
25 Ac, Refrigeration Machnry Etc 2.49 4.23 5.54 0.36
26 Drug Formulations, Biologicals 10.15 6.59 5.45 0.51
27 Organic Chemicals 6.45 5.46 5.11 0.60
28 Pearl, Precs, Semiprecs Stones 0.10 0.02 4.72 0.04
29 Othr Rubber Prodct Excpt Footw 4.58 4.30 4.64 1.03
30 Alcoholic Beverages 3.51 5.02 4.36 0.48
31 Pulses 8.92 5.03 4.25 0.62
32 Finished Leather 3.25 3.26 4.13 0.82
33 Plastc Sht, Film, Plts Etc 4.00 3.96 3.71 0.45
34 Optical Items (Incl.Lens Etc) 3.04 3.46 3.29 0.60
35 Vegetable Oils 10.11 10.08 3.16 0.00
36 Other Commodities 3.49 4.30 3.08 0.35
37 Other Construction Machinery 2.22 1.70 2.89 0.15
38 Cosmetics And Toiletries 5.17 3.11 2.88 0.37
39 Products Of Iron And Steel 4.00 6.66 2.75 0.35
40 Aircraft, Spacecraft And Parts 5.73 3.13 2.60 0.56
41 Moulded And Extruded Goods 1.22 1.69 2.32 0.37
S. No. Principal Commodities 2014‐15 2015‐16 2016‐17 2017‐18
(April‐ May, 2017)*
42 Manmade Yarn,Fabrics,Madeups 1.82 0.83 1.65 0.51
43 Project Goods 8.840 20.125 1.605 0.000
44 Hnd Tool, Cttng Tool Of Metals 1.589 1.980 1.476 0.266

45 Paper, Paper Board And Product 0.817 1.228 1.256 0.141
46 Other Wood And Wood Products 0.023 0.616 1.254 0.064
47 Nickel, Product Made Of Nickel 0.311 0.362 1.220 0.174
48 Prime Mica And Mica Products 0.942 0.821 1.037 0.185
49 Misc Processed Items 0.386 0.891 0.982 0.077
50 Other Plastic Items 0.171 1.056 0.923 0.284
51 Atm, Injctng Mlding Mchnry Etc 0.758 0.446 0.872 0.127
52 Dyes 0.669 0.857 0.870 0.298
53 Machine Tools 0.369 0.162 0.749 1.237
54 Aluminium, Products Of Aluminm 1.218 2.332 0.720 0.273
55 Oth Non Ferous Metal And Prodc 1.745 2.250 0.691 0.345
56 Fertilezers Crude 0.861 0.277 0.647 0.000
57 Handcrfs(Excl.Handmade Crpts) 0.377 0.214 0.646 0.099
58 Other Crude Minerals 0.761 0.205 0.618 0.000
59 Books, Publications And Prntng 0.948 0.469 0.593 0.043
60 Marine Products 0.121 0.124 0.550 0.157
61 Oth Txtl Yrn, Fbric Mdup Artcl 0.306 0.527 0.534 0.093
62 Processed Minerals 0.329 0.471 0.513 0.141
63 Packaging Materials 0.426 0.570 0.505 0.090
64 Plywood And Allied Products 0.241 0.283 0.493 0.092
65 Copper And Prdcts Made Of Copr 1.113 2.042 0.489 0.027
66 Rmg Cotton Incl Accessories 0.228 0.143 0.336 0.070
67 Essential Oils 0.122 0.421 0.332 0.045
68 Wool, Raw 0.000 0.000 0.327 0.026
69 Lead And Products Made Of Led 1.827 0.796 0.325 0.000
70 Ship, Boat And Floating Struct 0.249 7.291 0.317 0.010
71 Electrodes 0.468 0.286 0.271 0.052
72 Spices 0.442 0.409 0.245 0.072
73 Ceramics And Allied Products 1.187 1.313 0.234 0.166
74 Cranes, Lifts And Winches 1.242 0.034 0.202 0.135
75 Motor Vehicle/Cars 0.060 2.869 0.172 0.000
76 Manmade Staple Fibre 0.178 0.269 0.159 0.029
77 Railwy Trnsprt Equipmnts, Prts 0.000 0.342 0.153 0.000
78 Other Miscellaenious Chemicals 0.199 0.270 0.144 0.044
79 Cotton Fabrics, Madeups Etc. 0.047 0.080 0.142 0.000
80 Ayush And Herbal Products 0.133 0.127 0.117 0.007
81 Sports Goods 0.115 0.304 0.112 0.013
82 Rmg Of Othr Textle Matrl 0.046 0.089 0.110 0.000
83 Footwear Of Leather 0.188 0.093 0.103 0.000
84 Fresh Fruits 0.358 0.692 0.093 0.000
85 Processed Fruits And Juices 0.221 0.048 0.081 0.000

S. No. Principal Commodities 2014‐15 2015‐16 2016‐17 2017‐18
(April‐ May, 2017)*
86 Accumulators And Batteries 0.164 0.206 0.075 0.026
87 Petroleum Products 0.052 0.034 0.072 0.015
88 Cocoa Products 0.000 0.000 0.065 0.000
89 Nucler Reactr, Indl Boilr, Prt 0.051 0.004 0.056 0.025
90 Rmg Manmade Fibres 0.064 0.082 0.044 0.001
91 Auto Tyres And Tubes 0.029 0.088 0.030 0.015
92 Stationry/Offce, School Supply 0.053 0.034 0.028 0.013
93 Processed Vegetables 0.000 0.003 0.019 0.000
94 Fruits / Vegetable Seeds 0.696 0.107 0.017 0.001
95 Wollen Yarn,Fabrics,Madeupsetc 0.074 0.031 0.016 0.017
96 Graphite, Explsivs And Accesor 0.000 0.000 0.014 0.000
97 Carpet(Excl. Silk) Handmade 0.005 0.002 0.008 0.000
98 Rmg Wool 0.001 0.000 0.005 0.014
99 Agro Chemicals 0.516 0.031 0.004 0.000
100 Leather Goods 0.009 0.001 0.004 0.002
101 Gold And Oth Precs Metl Jwlery 0.002 0.000 0.004 0.005
102 Bicycle And Parts 0.013 0.003 0.003 0.000
103 Footwear Of Rubber/Canvas Etc. 0.034 0.005 0.002 0.000
104 Office Equipments 0.037 0.010 0.001 0.000
105 Leather Garments 0.001 0.000 0.001 0.000
106 Other Cereals 0.000 0.000 0.000 0.000
107 Silver 2.606 9.447 0.000 0.000
108 Granit, Natrl Stone And Prodct 0.145 0.157 0.000 0.000
109 Raw Hides And Skins 0.070 0.000 0.000 0.000
110 Cotton Raw Incld. Waste 0.053 0.000 0.000 0.000
111 Dairy Products 0.012 0.018 0.000 0.000
112 Floricltr Products 0.012 0.000 0.000 0.000
113 Cmnt, Clinkr And Asbstos Cmnt 0.004 0.008 0.000 0.000
114 Leather Footwear Component 0.002 0.000 0.000 0.000
115 Wheat 0.0004 0.0000 0.0000 0.0000
116 Cereal Preparations 0.0000 0.0070 0.0000 0.0000
117 Coffee 0.0000 0.0000 0.0000 0.4253
118 Coir And Coir Manufactures 0.0000 0.0192 0.0000 0.0000
119 Dye Intermediates 0.0000 0.0108 0.0000 0.0000
120 Fertilezers Manufactured 0.0000 0.0000 0.0000 0.0004
Total Imports from Mexico 3393.15 2283.19 2944.48 547.63
India’s Total Imports 448033.40 381006.60 384319.30 76159.40
Source: DGCI&S, Kolkata (* Provisional)

Principal Commodity‐wise Imports from Mozambique
(in US$ Millions)
S.No. Principal Commodities 2014‐15 2015‐16 2016‐17
2017‐18 (April‐May, 2017)*
1 Coal,Coke And Briquittes Etc 218.46 217.52 309.25 140.35
2 Pulses 70.42 89.42 145.14 2.49
3 Cashew 8.38 17.14 68.06 34.59
4 Pearl, Precs, Semiprecs Stones 3.23 16.93 4.83 4.71
5 Cotton Raw Incld. Waste 0.00 0.00 4.07 0.00
6 Iron And Steel 9.31 7.41 3.98 1.97
7 Aluminium, Products Of Aluminm 1.42 1.37 3.08 0.85
8 Processed Minerals 5.15 10.59 2.84 0.00
9 Other Commodities 0.15 0.94 1.81 0.47
10 Processed Fruits And Juices 1.31 0.14 1.51 0.28
11 Inorganic Chemicals 0.92 0.00 0.50 0.32
12 Copper And Prdcts Made Of Copr 0.21 0.34 0.37 0.18
13 Plywood And Allied Products 0.01 0.19 0.28 0.00
14 Lead And Products Made Of Led 3.43 0.63 0.18 0.00
15 Sesame Seeds 0.51 0.00 0.11 0.00
16 Marine Products 0.01 0.03 0.07 0.00
17 Tea 0.09 0.02 0.04 0.02
18 Medical And Scientific Instrum 0.00 0.01 0.04 0.00
19 Products Of Iron And Steel 0.03 0.00 0.03 0.00
20 Indl. Machnry For Dairy Etc 0.00000 0.00000 0.02584 0.00000
21 Other Oil Seeds 0.06921 0.00000 0.02043 0.00000
22 Oil Meals 0.00000 0.13186 0.01648 0.00000
23 Mica 0.00000 0.02149 0.00969 0.00000
24 Petroleum Products 0.00043 0.00000 0.00128 0.00062
25 Granit, Natrl Stone And Prodct 0.05384 0.00000 0.00031 0.00000
26 Packaging Materials 0.00000 0.00000 0.00004 0.00000
27 Other Construction Machinery 2.28525 0.00000 0.00000 0.00000
28 Bulk Minerals And Ores 0.09152 0.05130 0.00000 0.00000
29 Residul Chemicl And Alled Prod 0.08711 0.00000 0.00000 0.00000
30 Other Miscellaenious Chemicals 0.07541 0.00000 0.00000 0.00000
31 Tobacco Unmanufactured 0.02175 0.00000 0.00000 0.00000
32 Cosmetics And Toiletries 0.00012 0.00000 0.00000 0.00000
33 Paper, Paper Board And Product 0.00007 0.00000 0.00000 0.00000
34 Drug Formulations, Biologicals 0.00000 0.00000 0.00000 0.00000
35 Fertilezers Crude 0.00000 0.00000 0.00000 2.86168
36 Plastc Sht, Film, Plts Etc 0.00000 0.00076 0.00000 0.00000
37 Zinc And Products Made Of Zinc 0.00000 0.00000 0.00000 0.04089
Total Imports from Mozambique 325.74 362.88 546.29 189.14
India’s total Imports 448033.40 381006.60 384319.30 76159.40

Source: DGCI&S, Kolkata (* Provisional)
Principal Commodity‐wise Imports from Pakistan
(in US$ Millions)
S.No. Principal Commodities 2014‐15 2015‐16 2016‐17
2017‐18 (April‐May, 2017)*
1 Fresh Fruits 106.74 89.26 126.63 12.06
2 Cmnt, Clinkr And Asbstos Cmnt 45.93 49.69 84.42 14.25
3 Petroleum Products 106.22 116.39 78.56 26.23
4 Bulk Minerals And Ores 9.20 17.24 21.51 5.40
5 Finished Leather 28.87 12.92 20.62 6.70
6 Processed Minerals 22.05 20.44 17.95 2.41
7 Inorganic Chemicals 17.09 13.94 15.42 1.85
8 Cotton Raw Incld. Waste 36.76 21.59 12.41 0.00
9 Cotton Fabrics, Madeups Etc. 23.68 18.84 11.80 1.84
10 Other Commodities 6.28 7.65 9.88 2.37
11 Glass And Glassware 16.03 5.97 7.76 0.91
12 Spices 5.02 5.09 6.87 1.02
13 Surgicals 4.83 2.74 6.71 0.39
14 Wool, Raw 9.84 7.19 5.35 0.76
15 Othr Rubber Prodct Excpt Footw 4.18 3.15 3.79 0.94
16 Alcoholic Beverages 2.41 3.28 3.47 0.38
17 Medical And Scientific Instrum 2.36 1.50 2.66 0.14
18 Marine Products 0.11 0.52 2.07 0.00
19 Rmg Cotton Incl Accessories 1.99 1.53 2.07 0.63
20 Processed Fruits And Juices 0.98 1.39 1.77 0.26
21 Manmade Yarn,Fabrics,Madeups 1.72 0.81 1.38 0.15
22 Plastic Raw Materials 16.70 7.21 1.36 0.01
23 Dyes 0.23 0.21 1.23 0.45
24 Rmg Manmade Fibres 0.51 0.87 1.00 0.13
25 Sports Goods 1.62 1.09 0.93 0.29
26 Coir And Coir Manufactures 0.00 0.00 0.75 0.00
27 Rmg Of Othr Textle Matrl 0.47 0.71 0.73 0.13
28 Ayush And Herbal Products 0.43 0.46 0.60 0.05
29 Oth Txtl Yrn, Fbric Mdup Artcl 0.47 0.45 0.57 0.10
30 Handcrfs(Excl.Handmade Crpts) 0.17 0.13 0.44 0.00
31 Fertilezers Crude 0.06 0.29 0.38 0.08
32 Oil Meals 0.00 0.00 0.37 0.00
33 Residul Chemicl And Alled Prod 0.29 0.30 0.36 0.00
34 Aluminium, Products Of Aluminm
1.03 0.10 0.35 0.04
35 Natrl Silk Yarn,Fabrics,Madeup 0.00 0.48 0.34 0.03

36 Granit, Natrl Stone And Prodct 0.43 0.27 0.33 0.15
37 Other Crude Minerals 0.18 0.16 0.28 0.11
38 Pulses 2.41 0.84 0.26 0.61
39 Hnd Tool, Cttng Tool Of Metals 0.23 0.09 0.23 0.02
40 Sesame Seeds 2.46 0.12 0.23 0.19
S. No. Principal Commodities 2014‐15 2015‐16 2016‐17 2017‐18
(April‐ May, 2017)*
41 Pearl, Precs, Semiprecs Stones 0.49 0.09 0.21 0.02
42 Paper, Paper Board And Product 0.07 0.40 0.20 0.24
43 Wollen Yarn,Fabrics,Madeupsetc 0.87 0.65 0.20 0.05
44 Indl. Machnry For Dairy Etc 0.28 0.04 0.18 0.00
45 Cotton Yarn 0.36 0.26 0.18 0.04
46 Other Cereals 0.00 0.00 0.17 0.00
47 Other Plastic Items 0.29 0.24 0.16 0.02
48 Other Oil Seeds 0.11 0.00 0.15 0.00
49 Packaging Materials 0.45 0.22 0.09 0.02
50 Leather Goods 0.15 0.35 0.09 0.02
51 Cosmetics And Toiletries 0.19 0.05 0.09 0.01
52 Books, Publications And Prntng 0.20 0.13 0.08 0.01
53 Auto Tyres And Tubes 0.00 0.00 0.08 0.00
54 Misc Processed Items 0.08 0.10 0.07 0.03
55 Shellac 0.00 0.00 0.06 0.00
56 Sulpher, Unroasted Iron Pyrite 0.11 0.04 0.05 0.03
57 Footwear Of Leather 0.09 0.10 0.05 0.01
58 Cranes, Lifts And Winches 0.00 0.00 0.05 0.00
59 Moulded And Extruded Goods 0.08 0.07 0.03 0.01
60 Leather Garments 0.14 0.08 0.03 0.00
61 Auto Components/Parts 0.16 0.01 0.03 0.00
62 Carpet(Excl. Silk) Handmade 0.12 0.02 0.03 0.00
63 Raw Hides And Skins 1.01 0.54 0.03 0.01
64 Guergam Meal 0.00 0.01 0.03 0.00
65 Ceramics And Allied Products 0.00 0.00 0.02 0.01
66 Tea 0.01 0.01 0.02 0.00
67 Bulk Drugs, Drug Intermediates 0.00 0.00 0.02 0.00
68 Electric Machinery And Equipme 0.01 0.02 0.02 0.01
69 Machine Tools 0.00 0.00 0.02 0.00
70 Ic Engines And Parts 0.00 0.01 0.01 0.00
71 Organic Chemicals 9.59 0.00 0.01 0.02
72 Products Of Iron And Steel 0.26 0.03 0.01 0.00

73 Pumps Of All Types 0.05 0.01 0.01 0.00
74 Plywood And Allied Products 0.17 0.06 0.01 0.00
75 Plastc Sht, Film, Plts Etc 0.26 0.30 0.01 0.01
76 Rmg Wool 0.00323 0.03075 0.00904 0.00000
77 Stationry/Offce, School Supply 0.00703 0.01249 0.00855 0.00425
78 Other Misc. Engineering Items 0.02927 0.03567 0.00810 0.00138
79 Cereal Preparations 0.00302 0.01601 0.00695 0.00079
80 Fruits / Vegetable Seeds 0.00402 0.00000 0.00604 0.01357
81 Paint, Varnish And Allid Prodc 0.00446 0.01631 0.00431 0.00009
82 Electronics Instruments 0.00000 0.00006 0.00201 0.00000
83 Footwear Of Rubber/Canvas Etc. 0.01152 0.00000 0.00200 0.00184
84 Ac, Refrigeration Machnry Etc 0.00000 0.00000 0.00174 0.00000
S. No. Principal Commodities 2014‐15 2015‐16 2016‐17 2017‐18
(April‐ May, 2017)*
85 Rmg Silk 0.13131 0.01059 0.00131 0.00118
86 Other Wood And Wood Products 0.01107 0.00314 0.00092 0.00000
87 Cocoa Products 0.00000 0.00000 0.00077 0.00000
88 Agro Chemicals 0.00000 0.00000 0.00060 0.00000
89 Oth Non Ferous Metal And Prodc 0.00085 0.00000 0.00040 0.00000
90 Other Construction Machinery 0.00000 0.00000 0.00022 0.11917
91 Railwy Trnsprt Equipmnts, Prts 0.00000 0.00012 0.00020 0.00000
92 Copper And Prdcts Made Of Copr
0.97508 0.22400 0.00009 0.00000
93 Zinc And Products Made Of Zinc 0.29589 0.00000 0.00000 0.00000
94 Cashew 0.07387 0.00000 0.00000 0.00000
95 Jute Hessian 0.05007 0.00000 0.00000 0.00000
96 Processed Vegetables 0.03780 0.02141 0.00000 0.00000
97 Coffee 0.01569 0.00000 0.00000 0.00000
98 Handloom Products 0.01284 0.00000 0.00000 0.00000
99 Iron And Steel 0.01127 0.00000 0.00000 0.00000
100 Computer Hardware, Peripherals 0.01088 0.00000 0.00000 0.00000
101 Manmade Staple Fibre 0.01025 0.00000 0.00000 0.00000
102 Tobacco Unmanufactured 0.00000 0.00000 0.00000 0.00000
103 Electronics Components 0.00673 0.00000 0.00000 0.00000
104 Dairy Products 0.00407 0.00000 0.00000 0.00000
105 Nucler Reactr, Indl Boilr, Prt 0.00204 0.00000 0.00000 0.00000
106 Jute Yarn 0.00081 0.00000 0.00000 0.00000
107 Drug Formulations, Biologicals 0.00049 0.00000 0.00000 0.00009
108 Atm, Injctng Mlding Mchnry Etc 0.00000 0.01122 0.00000 0.00000
109 Essential Oils 0.00000 0.00051 0.00000 0.00000
110 Fertilezers Manufactured 0.00000 0.78113 0.00000 2.50270

111 Fresh Vegetables 0.00000 0.21806 0.00000 0.00000
112 Other Jute Manufactures 0.00000 0.00035 0.00000 0.00000
113 Petroleum: Crude 0.00000 20.72494 0.00000 0.00000
Total Imports From Pakistan 497.31 441.03 456.33 84.26
India’s Total Imports 448033.40 381006.60 384319.30 76159.40
Source: DGCI&S, Kolkata (* Provisional)

GOVERNMENT OF INDIA MINISTRY OF COMMERCE & INDUSTRY
(DEPARTMENT OF COMMERCE)
LOK SABHA UNSTARRED QUESTION NO. 1151(H)
TO BE ANSWERED ON 24th JULY, 2017
EXPORT OF AGRO PRODUCTS 1151(H). SHRI HARISH CHANDRA ALIAS HARISH DWIVEDI:
Will the Minister of COMMERCE & INDUSTRY (वािण य एव ंउ योग मतं्री ) be
pleased to state:
(a) the total quantum of agro-products exported along with the value thereof during the last three years and the current year;
(b) whether there has been any shortfall in the said exports and if so, the details thereof and the reasons therefor;
(c) whether the Government proposes to introduce any scheme for promoting the exports of agro-products; and
(d) if so, the details thereof?
ANSWER
okf.kT; ,oa m|ksx jkT; ea=h ¼Jherh fueZyk lhrkje.k½ ¼Lora= izHkkj½
THE MINISTER OF STATE IN THE MINISTRY OF COMMERCE AND INDUSTRY (INDEPENDENT CHARGE)
(SMT. NIRMALA SITHARAMAN)
(a) Total quantum of agro-products exported along with the value thereof during the last
three years and the current year is enclosed at Annexure –I.
(b) The value of exports of agricultural products had declined in 2015-16 to Rs. 17.16 lakh crore as compared to Rs. 18.96 lakh crore in 2014-15. However, during 2016-17 the exports have recovered and increased to Rs. 18.52 lakh crore. The export of Agricultural products depends on several factors such as availability of surplus over the domestic requirements (including the requirement of buffer stock and strategic reserve, if any), concerns of food security, diplomatic/humanitarian considerations, international demand and supply situation, quality standards in the importing countries, varieties traded, price competitiveness, need to balance between remunerative prices to the growers and availability of agricultural products to common man at affordable prices etc.

(c & d) The Agricultural and Processed Food Export Development Authority (APEDA), an autonomous organisation under the Department of Commerce, has been promoting exports of agricultural products through its scheme ‘Agriculture Export Promotion Plan Scheme of APEDA’. The scheme is proposed to be continued, with some modifications, for the period 2017-18 to 2019-20.
******

Annexure – I India's Export of Agricultural Commodities
Quantity in thousand units; Value in Rs. crore)
Commodity Uni
t 2014-15 2015-16 2016-17 2017-18 (Apr-May)
Quantity Value Quantity Value Quantity Value Quantity Value MARINE PRODUCTS
KGS 10,73,965.69
33,688.38
9,78,027.05
31,219.43
11,90,508.14
39,707.47
1,98,077.90
6,653.38
BUFFALO MEAT TON
1,475.54
29,282.58
1,314.22
26,684.22
1,330.01
26,303.16
176.99
3,417.21
RICE ‐BASMOTI TON
3,698.93
27,586.71
4,045.83
22,718.60
4,000.49
21,604.54
795.80
5,103.36
SPICES KGS 9,26,020.95
14,847.74
8,31,681.25
16,630.15
10,19,344.99
19,442.39
2,36,316.76
3,436.41
RICE(OTHER THAN BASMOTI)
TON
8,278.23
20,441.55
6,464.59
15,483.39
6,820.80
17,145.36
1,026.00
2,686.55
COTTON RAW INCLD. WASTE
1,142.53
11,642.64
1,347.07
12,821.13
1,002.77
10,982.16
170.27
1,924.58
SUGAR TON
1,955.19
5,328.83
3,844.45
9,824.52
2,548.51
8,678.00
328.19
1,135.51
FRESH VEGETABLES
TON
2,061.00
4,666.45
2,104.36
5,237.10
3,389.80
5,771.91
487.32
771.38
COFFEE KGS 2,21,396.66
4,973.25
2,55,744.05
5,125.45
2,89,723.65
5,668.71
59,196.27
1,153.92
GROUNDNUT TON
708.39
4,675.37
542.73
4,075.63
726.54
5,456.72
64.12
510.02
OIL MEALS TON
3,904.59
8,129.18
2,056.36
3,599.56
2,616.13
5,378.39
416.92
974.64
CASHEW TON
134.57
5,565.85
103.13
5,027.99
92.17
5,303.37
16.64
1,035.20
FRESH FRUITS TON
486.94
3,160.08
654.66
4,191.24
820.32
5,025.80
165.10
1,071.33
TEA KGS 2,15,407.70
4,171.25
2,45,701.98
4,719.00
2,44,457.27
4,925.73
31,928.08
640.53
CASTOR OIL KGS 5,46,525.60
4,710.42
5,86,778.44
4,616.10
6,00,551.23
4,532.93
1,30,094.07
1,267.06
TOBACCO UNMANUFACTURED
KGS 2,19,572.23
4,162.71
2,15,316.96
4,373.45
2,05,338.40
4,270.73
31,612.29
664.99
PROCESSED FRUITS AND JUICES
3,626.86
5,32,279.73
3,766.99
5,34,879.92
3,908.59
68,658.57
548.22
CEREAL PREPARATIONS
TON
305.43
3,036.64
316.54
3,358.11
340.91
3,572.61
56.13
562.71
GUERGAM MEAL TON
665.11
9,478.26
325.25
3,233.87
423.29
3,131.74
107.46
847.96
MISC PROCESSED ITEMS
2,772.44
2,907.81
3,68,422.95
3,059.66
67,499.16
587.90
SESAME SEEDS KGS 3,75,656.06
4,717.77
3,28,455.73
3,012.31
3,08,934.70
2,709.07
49,561.21
422.21
TOBACCO MANUFACTURED
1,705.88
2,078.91
35,592.92
2,179.93
5,579.56
339.54
ALCOHOLIC BEVERAGES
2,264.89
2,42,095.40
2,030.92
2,32,690.21
2,014.13
38,045.08
330.21
PROCESSED VEGETABLES
1,721.89
1,74,427.42
1,697.21
1,93,823.34
1,774.18
24,665.93
222.82
DAIRY PRODUCTS 2,169.03
77,517.55
1,677.32
91,150.46
1,714.73
17,844.59
269.26
OTHER CEREALS TON
3,514.35
5,262.16
967.93
1,702.50
737.92
1,426.16
85.35
176.33
PULSES TON
222.14
1,218.31
255.74
1,656.03
137.18
1,281.63
33.46
340.66
COCOA PRODUCTS
KGS 20,877.70
848.66
32,652.56
1,267.61
25,700.17
1,089.99
4,154.57
159.06
SHEEP/GOAT MEAT
TON
23.61
828.11
21.95
837.76
22.72
875.86
4.94
186.95
OTHER OIL SEEDS TON
247.54
1,135.36
204.62
964.47
194.52
851.91
40.79
160.27
MILLED PRODUCTS
KGS 4,19,855.41
1,030.61
4,31,464.50
1,102.73
2,56,604.63
817.68
39,088.91
124.29
VEGETABLE OILS TON
42.05
580.13
30.60
522.94
61.02
785.91
3.91
72.80
FLORICLTR PRODUCTS
460.80
22,691.65
483.41
22,086.10
548.74
4,064.25
79.75
POULTRY PRODUCTS
651.19
768.72
4,49,527.49
531.65
80,677.43
89.53

FRUITS / VEGETABLE SEEDS
KGS 12,499.31
427.04
13,104.11
529.19
11,638.46
527.42
709.10
141.39
WHEAT TON
2,924.05
4,991.81
666.68
1,061.77
265.91
448.40
72.23
130.58
MOLLASES TON
247.61
193.01
818.57
656.81
390.68
314.98
14.95
14.28
NATURAL RUBBER TON
3.06
43.31
6.14
387.94
25.23
261.42
3.88
42.51
SHELLAC KGS 5,242.54
267.47
6,393.50
203.31
5,963.98
224.44
928.39
43.89
NIGER SEEDS KGS 18,155.89
108.96
14,121.56
123.27
14,128.46
117.68
1,343.65
8.30
CASHEW NUT SHELL LIQUID
KGS 10,937.59
55.81
11,677.26
57.59
11,426.76
44.07
1,582.44
5.83
ANIMAL CASINGS KGS 260.15
19.33
206.36
17.02
173.24
13.84
30.55
2.11
PROCESSED MEAT TON
0.41
14.20
0.28
6.16
0.14
4.58
0.03
0.94
OTHER MEAT TON
0.26
2.67
0.08
0.91
TOTAL: 18,96,348.4
2 17,16,378.0
5 18,52,339.6
6 3,13,494.0
0
Source: APEDA

GOVERNMENT OF INDIA MINISTRY OF COMMERCE & INDUSTRY
(DEPARTMENT OF COMMERCE)
LOK SABHA UNSTARRED QUESTION NO. 1163(H)
TO BE ANSWERED ON 24th JULY, 2017
EXPORT OF IRON ORE 1163(H). SHRI RAM TAHAL CHOUDHARY:
SHRI LAXMAN GILUWA:
Will the Minister of COMMERCE & INDUSTRY (वािण य एवं उ योग मतं्री ) be
pleased to state:
(a) whether the export of iron ore is increasing every year whereas the domestic need of iron ore is not being met ;
(b) if so, the details thereof and the total demand of iron ore in the country along with the total export of iron ore from the country during the last three years and the current year;
(c) whether various industries are on the verge of closure due to non-supply of iron ore and are unable of utilize their capacity; and
(d) if so, the details thereof along with the reaction of the Government thereto and the corrective measures taken by the Government in this regard?
ANSWER
okf.kT; ,oa m|ksx jkT; ea=h ¼Jherh fueZyk lhrkje.k½ ¼Lora= izHkkj½
THE MINISTER OF STATE IN THE MINISTRY OF COMMERCE AND INDUSTRY (INDEPENDENT CHARGE)
(SMT. NIRMALA SITHARAMAN)
(a) & (b): As per DGCI&S data, export of iron ore during last three years and current year
has shown a fluctuating trend. Details of total demand (consumption) and export of iron ore for this period are given in the table below:
(in million tonnes) Year Demand (Consumption) Export 2014-15 113.48 7.29 2015-16 122.10(E) 5.44 2016-17 131.38(E) 30.54 (P) 2017-18 (Upto May’2017)
NA 6.08 (P)
Source: Demand (Consumption) – JPC/IBM and Export - DGCI&S, Kolkata.
(P) = Provisional, (E) = Estimates on the basis of GDP growth rate @7.6%.
(c) & (d) : Production of iron ore during the last three years is more than the domestic
consumption and exports. Production of iron ore in the country is sufficient to meet the domestic requirement. Iron & Steel being deregulated sector, capacity utilization of plants is based on commercial consideration. Iron ore of Fe content

above 64% (other than of Redi origin to all markets and Iron ore of Goa origin when exported to China, Europe, Japan, South Korea and Taiwan irrespective of the Fe content) is regulated under Foreign Trade Policy 2015-20 by way of canalization through MMTC Limited. Government has levied an export duty @ 30% on iron ore lumps/fines above 58% Fe content. This is done to ensure that the overall demand for high grade iron ore in the domestic market is taken care of. Therefore, steps/measures are already in place to regulate exports of iron ore. Government has also notified Mines and Minerals (Development and Regulation) Amendment Act, 2015 to streamline grant of mining leases in order to maintain sufficient availability of raw materials for the various sectors including steel sector.
******

GOVERNMENT OF INDIA MINISTRY OF COMMERCE & INDUSTRY
(DEPARTMENT OF COMMERCE)
LOK SABHA UNSTARRED QUESTION NO. 1212
TO BE ANSWERED ON 24th JULY, 2017
MEASURES TO IMPROVE BALANCE OF TRADE 1212. DR. SUNIL BALIRAM GAIKWAD:
SHRI SUDHEER GUPTA: KUNWAR HARIBANSH SINGH: SHRI BIDYUT BARAN MAHATO: SHRI GAJANAN KIRTIKAR: SHRI T. RADHAKRISHNAN: SHRI ASHOK SHANKARRAO CHAVAN: SHRI KUNDARIYA MOHAN BHAI KALYANJI BHAI: SHRI L.K. VAGHELA: SHIR B. SRIRAMULU:
Will the Minister of COMMERCE & INDUSTRY (वािण य एवं उ योग मतं्री ) be
pleased to state:
(a) whether the Government has noticed that some countries like China, Indonesia, Malaysia and Thailand dump their various type of products in India and if so, the details threreof country-wise along with the reaction of the Government thereto;
(b) whether some Indian companies have filed applications with the Directorate General of Anti Dumping and Allied Duties (DGAD) for imposition of anti dumping duty on certain products including rubber items and if so, the details thereof along wiht the action taken by DGAD thereon product-wise;
(c) the details of corrective measures taken/being taken by the Government to protect the domestic industry from the countries who indulge in dumping their products in India;
(d) the details of India’s trade deficit with China during the last three years and the current year along with the reaction of the Government thereto and the steps taken or being taken by the Government for balance of trade between India and China; and
(e) whether the Government has developed an electronic dashboard for displaying foreign trade statistics online and if so, the details thereof?
ANSWER
okf.kT; ,oa m|ksx jkT; ea=h ¼Jherh fueZyk lhrkje.k½ ¼Lora= izHkkj½
THE MINISTER OF STATE IN THE MINISTRY OF COMMERCE AND INDUSTRY (INDEPENDENT CHARGE)
(SMT. NIRMALA SITHARAMAN)
(a) : Yes Madam. Based on the applications filed by the domestic industry (DI) for
imposition of anti‐dumping duty on imports from various countries including China PR,
Indonesia, Malaysia, Thailand etc., Directorate General of Anti‐dumping & Allied
Duties (DGAD) initiated anti‐dumping investigations on imports from various
countries. The details are as given below:

(as on 14.07.2017)
S.No. Country No. of Initiations since 01.01.2012
1. China PR 62
2. Indonesia 11
3. Malaysia 11
4. Thailand 10
5. Other
countries
129
Total 223
(b) &(c) : From time to time, DGAD receives applications from domestic producers for imposition of anti‐dumping duty on various products. After detailed investigations, preliminary/final findings are issued by DGAD based on which, Department of Revenue imposes provisional/definitive anti‐dumping duties. As on 14.7.2017, anti‐dumping duty is in force in 141 cases (country wise‐277 cases) and 54more cases (country wise‐131 cases)have been initiated. Product category wise details of cases is given below:‐
(as on 14.07.2017)
S.No. Product Category No. of cases in which duty is in force
No. of Cases initiated
1. Chemical and Petrochemicals 67 (143) 30 (71) 2. Electrical and electronic items
and accessories 06 (09) 00 (00)
3. Fibre Boards 03 (10) 01 (04) 4. Fibres and Yarn 12 (25) 07 (26) 5. Glass and Glassware 07 (12) 01 (02) 6. Machinery Items 05 (09) 01 (01) 7. Pharmaceutical 13 (14) 02 (02) 8. Rubber or Plastic products 07 (09) 04 (08) 9. Steel and other metals 17 (38) 03 (08) 10. Other Products 04 (08) 05 (09)
Total 141 (277) 54 (131) Figures in bracket denote No. of cases country wise. Note: In many cases, a single notification/investigation involves multiple countries.
(d) : Details of the trade deficit with China during the last three years and the current year upto April 2017 are given below:‐
Bilateral Trade between India and China 2014‐15 to 2016‐17 and the current year Value in US$ Billion
S.No. Financial Year Trade Deficit with China
1. 2014‐15 48.47
2. 2015‐16 52.69
3. 2016‐17 51.08
4. 2017‐18 (April, 2017)* 4.92 (Source: DGCI&S) *Provisional
Efforts are being made to increase overall exports by diversifying the trade basket with emphasis on manufactured goods, services, resolution of market access issues and other
non‐tariff barriers. This is done through bilateral meetings and institutional dialogues. Indian exporters are encouraged to participate in major trade fairs in China to show‐case Indian products. Further, many measures have been taken to overcome the overall trade deficit. These include implementation of Merchandise Exports from India Scheme (MEIS) and Services Exports from India Scheme (SEIS), implementation of NiryatBandhu Scheme, Single Window Interface for Facilitating Trade (SWIFT) clearance project as part of ‘Ease of doing Business’, Interest Equalization Scheme in pre and post shipment credit, Special Advance Authorization Scheme, Trade Infrastructure for Export Promotion (TIES) Scheme etc. (e) : The Foreign Trade Data Dashboard‐Trade Analytics has been launched on 10.10.2016. It aims at providing easy access to India’s export/import and balance of trade data in visual analytic format to all the stakeholders including public. It provides an overview of India’s trade dynamics for last five years.
********

GOVERNMENT OF INDIA MINISTRY OF COMMERCE & INDUSTRY
(DEPARTMENT OF COMMERCE)
LOK SABHA UNSTARRED QUESTION NO. 1213
TO BE ANSWERED ON 24th JULY, 2017
GRANTS UNDER MDA SCHEME 1213. SHRI R. DHRUVA NARAYANA:
Will the Minister of COMMERCE & INDUSTRY (वािण य एवं उ योग मतं्री ) be
pleased to state:
(a) whether the Government is providing grants of financial assistance funds under Marketing Development Assistance(MDA) scheme;
(b) if so, the details thereof; (c) whether the Government has approved any proposals in this regard during the last three
years and the current year; and (d) if so, the details thereof and if not, the reasons therefor?
ANSWER
okf.kT; ,oa m|ksx jkT; ea=h ¼Jherh fueZyk lhrkje.k½ ¼Lora= izHkkj½
THE MINISTER OF STATE IN THE MINISTRY OF COMMERCE AND INDUSTRY (INDEPENDENT CHARGE)
(SMT. NIRMALA SITHARAMAN)
(a) to (d): Yes. Under the Marketing Development Assistance (MDA) Scheme, lumpsum
assistance is provided to Export Promotion Councils/ Trade Promotion Organizations for the
following:
(i) to assist exporters with a f.o.b. value of exports of upto Rs.30 crore [relaxed in the
case of events in the Latin American and Caribbean (LAC) Region],for participation in
approved export promotion events abroad including reimbursement of air fares and
cost of rented space.
(ii) to assist Export Promotion Councils /Trade Promotion Organizations to undertake
export promotion activities for their product(s) and commodities in India and abroad.

The funds released to the eligible agencies under the MDA Scheme during the last
three years are as under:
Year Financial Assistance provided
2014-15 Rs. 50.00 crore
2015-16 Rs. 48.74 crore
2016-17 Rs. 45.93 crore
The Scheme now stands merged with the Market Access Initiative (MAI) Scheme.
****

GOVERNMENT OF INDIA MINISTRY OF COMMERCE & INDUSTRY
(DEPARTMENT OF COMMERCE)
LOK SABHA UNSTARRED QUESTION NO. 1215
TO BE ANSWERED ON 24th JULY, 2017
SPICES EXPORTS 1215. SHRI RAOSAHEB DANVE PATIL:
SHRI VENKATESH BABU T.G.: SHRI A.T. NANA PATIL:
Will the Minister of COMMERCE & INDUSTRY (वािण य एवं उ योग मतं्री ) be
pleased to state:
(a) whether the spices exports from the country have touched an all-time high and if so, the details thereof for the last three years and the current year in terms of their total volume and value along with the foreign exchange earned therefrom during the said period;
(b) whether any targets have been fixed by the Government in this regard for the next three years and if so, the details thereof;
(c) whether the Government has taken any steps to achieve the said targets and if so, the details thereof and if not, the reasons therefor; and
(d) the steps taken by the Government to help spices farmers by integrating operations for cultivation, post harvest processing for value addition packaging, storage and export of spices and spices products by meeting the quality specifications of the consuming countries?
ANSWER
okf.kT; ,oa m|ksx jkT; ea=h ¼Jherh fueZyk lhrkje.k½ ¼Lora= izHkkj½
THE MINISTER OF STATE IN THE MINISTRY OF COMMERCE AND INDUSTRY (INDEPENDENT CHARGE)
(SMT. NIRMALA SITHARAMAN)
(a) to(c): Yes Madam, the spices exports from the country have touched an all‐time high during 2016‐17. The export of spices & spice products from the country for the last 3 years is given below:
Year Quantity (Tons)
Value (Rs. crore)
2014‐15 893920 14900
2015‐16 843255 16238
2016‐17 947790 17665
No targets are fixed by the government for export of spices as the production and export of spices are
dependent upon various factors such as climatic conditions, market forces, domestic and international
demand, etc.

(d) Spices Board is implementing the “Export Oriented Production, Export Development & Promotion of
Spices” Scheme wherein assistance is provided to cultivators of cardamom for production of quality
planting materials, replanting of old and uneconomic gardens, new planting, irrigation development
programme, improved curing facilities, farm mechanization, etc. for boosting production.
In addition, Spices Board implements several programmes for spices farmers which, inter alia, include
development of infrastructure for common processing facilities in Spice Parks, adaptation of upgraded
technology in spice processing, setting up of quality evaluation labs for sampling and testing of the export
consignments for meeting quality specifications of consuming countries, assistance to farmers on post‐
harvest quality improvement, imparting training to farmers in Good Agricultural Practices etc.
******

GOVERNMENT OF INDIA MINISTRY OF COMMERCE & INDUSTRY
(DEPARTMENT OF COMMERCE)
LOK SABHA UNSTARRED QUESTION NO. 1217
TO BE ANSWERED ON 24th JULY, 2017
SEZ PROJECTS 1217. SHRIMATI KOTHAPALLI GEETHA:
Will the Minister of COMMERCE & INDUSTRY (वािण य एवं उ योग मतं्री ) be
pleased to state:
(a) whether the Government has granted more time to developers of certain Special Economic Zones (SEZs) including Navi Mumbai SEZ for implementation of their projects and if so, the details thereof;
(b) whether the validity period of some SEZs has been extended and if so, the details thereof; (c) whether the Government has also approved two proposals from ValueLabs Infra LLP and
GAR Corporation for establishing IT/ITeS SEZs in Telangana; and (d) if so, the details thereof and the present status of each SEZ in the country?
ANSWER
okf.kT; ,oa m|ksx jkT; ea=h ¼Jherh fueZyk lhrkje.k½ ¼Lora= izHkkj½
THE MINISTER OF STATE IN THE MINISTRY OF COMMERCE AND INDUSTRY (INDEPENDENT CHARGE)
(SMT. NIRMALA SITHARAMAN) (a) and (b): In terms of Rule 6(2)(a) of the Special Economic Zones Rules, 2006, the letter of approval granted to a Special Economic Zone (SEZ) developer is valid for a period of three years within which time, effective steps are to be taken by the developer to implement the approved project. The Board of Approval may, on an application by the developer, grant more time by extending the validity period of the letter of approval. During the last five years and current financial year (upto 30th June, 2017), extension of time have been granted to 145 developers of SEZs across the country, including 8 SEZs of M/s. Navi Mumbai SEZ Private Limited, to complete their projects. (c) and (d): The Government has approved a proposal from ValueLabs Infra LLP for setting up an IT/ITeS SEZ and GAR Corporation Private Limited for establishing 3 IT/ITeS SEZs, in Telangana. While letter of approval has been issued in all 4 cases, notifications have been issued in case of 3 SEZs of GAR Corporation Private Limited. In addition to Seven Central Government SEZs and 11 State/Private Sector SEZs set-up prior to the enactment of the SEZs Act, 2005, approvals have been accorded in respect of 420 proposals for setting up of SEZs in the country. Presently, a total of 218 SEZs are operational. States/UTs-wise status of SEZs is at Annexure.
*****

Annexure to the Lok Sabha Unstarred Question No. 1217 for 24th July, 2017
State-wise distribution of approved SEZs
States/UTs Formal Approvals
Notified SEZs Operational SEZs (Central Govt. + State Govt./Pvt. SEZs + notified SEZs under the
SEZ Act, 2005)
Andhra Pradesh 30 25 20
Chandigarh 2 2 2
Chhattisgarh 2 1 1
Delhi 2 0 0
Goa 7 3 0
Gujarat 28 24 19
Haryana 23 20 7
Jharkhand 1 1 0
Karnataka 62 51 26
Kerala 29 25 19
Madhya Pradesh 10 5 2
Maharashtra 55 49 28
Manipur 1 1 0
Nagaland 2 2 0
Odisha 7 5 3
Puducherry 1 0 0
Punjab 5 3 3
Rajasthan 9 8 4
Tamil Nadu 49 47 36
Telangana 64 55 29
Uttar Pradesh 24 19 12
West Bengal 7 5 7
GRAND TOTAL 420 351 218
*****

GOVERNMENT OF INDIA MINISTRY OF COMMERCE & INDUSTRY
(DEPARTMENT OF COMMERCE)
LOK SABHA UNSTARRED QUESTION NO. 1226
TO BE ANSWERED ON 24th JULY, 2017
EXPORT OF CARDAMOM 1226. SHRI P.K. BIJU:
Will the Minister of COMMERCE & INDUSTRY (वािण य एवं उ योग मतं्री ) be
pleased to state:
(a) the details of cardamom produced in the country from 2014 to 2017; (b) the details of cardamom exported from the country during the said period; and (c) the measures taken by the Government to meet the increasing domestic demand of
cardamom?
ANSWER
okf.kT; ,oa m|ksx jkT; ea=h ¼Jherh fueZyk lhrkje.k½ ¼Lora= izHkkj½
THE MINISTER OF STATE IN THE MINISTRY OF COMMERCE AND INDUSTRY (INDEPENDENT CHARGE)
(SMT. NIRMALA SITHARAMAN)
(a) The details of total production of cardamom in India during 2013‐14 to 2016‐17 are given below:
year Cardamom(small)
Production(Tons)
Cardamom(large)
Production(Tons)
2013‐14 16000 44652014‐15 18000 48502015‐16 23890 53152016‐17* 19625 5623
(*) provisional

(b) The exports of cardamom from India during 2013‐14 to 2016‐17 isas below:
Year Cardamom(small) Cardamom(large)
Qty(Tons) Value(Rs. Crores) Qty(Tons) Value(Rs. Crores)
2013‐14 3600 283.81 1110 79.61
2014‐15 3795 323.47 665 84.04
2015‐16 5500 449.83 600 75.50
2016‐17* 3850 421.50 780 82.66
(*) provisional
(c) The Government, through Spices Board, is implementing various programmes/ schemes to meet the
increasing domestic demand of Cardamom in the country, which inter alia, includes, production of quality planting materials of Cardamom in the growers field, replanting of old, senile and uneconomic gardens of Cardamom, new planting of Cardamom (large), assistance for farm mechanization, supply of Good Agricultural Practice (GAP) kits to cardamom growers and recognition of cardamom growers by instituting Awards for promoting healthy competition amongst the farmers for increasing the yield, etc.
*****

GOVERNMENT OF INDIA MINISTRY OF COMMERCE & INDUSTRY
(DEPARTMENT OF COMMERCE)
LOK SABHA UNSTARRED QUESTION NO. 1227
TO BE ANSWERED ON 24th JULY, 2017
BENEFITS TO INDUSTRIES FROM SEZs 1227. SHRI SUNIL KUMAR SINGH:
Will the Minister of COMMERCE & INDUSTRY (वािण य एवं उ योग मतं्री ) be
pleased to state:
(a) whether the Government has ascertained the number of rural and agro industries being benefited from Special Economic Zones (SEZs) particularly in the State of Jharkhand;
(b) if so, the details and the outcome thereof; (c) whether such industries in the SEZs have been able to generate adequate amount of
revenue for the Government; and (d) if so, the details thereof indicating the percentage of total revenue generated by the SEZs
from such industries and if not, the reaction of the Government thereto along with the corrective measures taken by the Government in this regard?
ANSWER
okf.kT; ,oa m|ksx jkT; ea=h ¼Jherh fueZyk lhrkje.k½ ¼Lora= izHkkj½
THE MINISTER OF STATE IN THE MINISTRY OF COMMERCE AND INDUSTRY (INDEPENDENT CHARGE)
(SMT. NIRMALA SITHARAMAN)
(a) to (d): Out of total 8 Special Economic Zones (SEZs) for Agro and Food Processing sectors in India, 7 have been notified and 3 SEZs are operational. A statement showing details is at Annexure. There is no Agro and Food Processing SEZ set up in the state of Jharkhand till date. The physical exports from these SEZs during the last five years and current year 2017-18 (i.e. up to 30th June, 2017) is as under:
Years Exports (Value in Rs. Crores)
% of total physical exports from SEZs
2012-13 806 0.17% 2013-14 881 0.18% 2014-15 1132 0.24% 2015-16 2365 0.51% 2016-17 4061 0.78% 2017-18
(up to 30.06.2017) 1245 0.90%
*****

Annexure to the Lok Sabha Unstarred Question No. 1227 for 24th July, 2017
List of Agro and Food Processing SEZs in India
Sl. No. Name of the developer Type of SEZ Location SEZ status 1 Kerala Industrial
Infrastructure Development Corporation (KINFRA)
Agro Based Food
Processing
Malappuram District, Kerala
Notified/ Operational
2 Parry Infrastructure Company Private Limited
Food Processing
Kakinada, Andhra Pradesh
Notified/ Operational
3 Pearl City (CCCL Infrastructure Limited)
Food Processing
Tuticorin District, Tamil Nadu
Notified/ Operational
4 Maharashtra Industrial Development Corporation
Agro-processing
Latur, Maharashtra Notified
5 Nagaland Industrial Development Corporation Limited
Agro and Food Processing
Demapur, Nagaland
Notified
6 Ansal Colours Engineering SEZ Limited
Agro and Food Processing Products
Sonepat, Haryana Notified
7 CCL Products (India) Limited
Agro based Food
Processing
Chittoor District, Andhra Pradesh
Notified
8 Akshaypatra Infrastructure Pvt. Ltd.
Food Processing
Mehsana, Gujarat Formal Approval
*****

GOVERNMENT OF INDIA MINISTRY OF COMMERCE & INDUSTRY
(DEPARTMENT OF COMMERCE)
LOK SABHA UNSTARRED QUESTION NO.1232
TO BE ANSWERED ON 24th JULY, 2017
TALK ON ECONOMIC CORRIDOR 1232. SHRI HUKUM SINGH:
Will the Minister of COMMERCE & INDUSTRY (वािण य एवं उ योग मतं्री ) be
pleased to state:
(a) whether the Government has held talks on the Bangladesh-China-India Myanmar economic corridor recently; and
(b) if so, the details and outcome thereof?
ANSWER
okf.kT; ,oa m|ksx jkT; ea=h ¼Jherh fueZyk lhrkje.k½ ¼Lora= izHkkj½
THE MINISTER OF STATE IN THE MINISTRY OF COMMERCE AND INDUSTRY (INDEPENDENT CHARGE)
(SMT. NIRMALA SITHARAMAN)
(a) & (b) : The Third Meeting of Joint Study Group (JSG) of Bangladesh-China-India-Myanmar
(Economic Corridor) was held on 25th and 26th April, 2017 in Kolkata. The meeting deliberated
upon the consolidation of various country reports so as to finalize a common report of Joint Study
Group (JSG).
****

GOVERNMENT OF INDIA MINISTRY OF COMMERCE & INDUSTRY
(DEPARTMENT OF COMMERCE)
LOK SABHA UNSTARRED QUESTION NO. 1237
TO BE ANSWERED ON 24th JULY, 2017
TRADE DEFICIT 1237. SHRI JANARDAN SINGH SIGRIWAL:
Will the Minister of COMMERCE & INDUSTRY (वािण य एवं उ योग मतं्री ) be
pleased to state:
(a) whether there has been a continuous rise in the trade deficit during each of the last three years and the current year and if so, the details thereof, year wise and the reasons therefor;
(b) the details of the targets fixed and achieved for import and export along with the details of the countries with which India’s trade deficit has widened during the said period;
(c) whether the Government has received representations from various trade organisations/export promotion councils to give impetus to exports and if so, the details thereof along with the steps taken by the Government to address their concerns;
(d) whether the Government has set up any Committee to suggest measures to boost exports and bridge the widening trade deficit and the rising current account deficit; and
(e) if so, the details thereof including the suggestions made by the Committee along with the steps taken/being taken by the Government thereon?
ANSWER
okf.kT; ,oa m|ksx jkT; ea=h ¼Jherh fueZyk lhrkje.k½ ¼Lora= izHkkj½
THE MINISTER OF STATE IN THE MINISTRY OF COMMERCE AND INDUSTRY (INDEPENDENT CHARGE)
(SMT. NIRMALA SITHARAMAN)
(a): The details of India’s total trade deficit (merchandise and services) for the last three years
and the current year are as follows:
(in US $ Billions)
Years Trade Deficit
2014‐15 -61.17
2015‐16 -49.30
2016‐17 -42.56
2016‐17 (Apr‐May)* 0.57
2017‐18 (Apr‐May)* -16.04 Source: DGCI&S, Kolkata (* Provisional)
The data in the above table reveals that trade deficit has a decreasing trend during the last three
years. It has increased for the period 2017‐18 (Apr‐May) as compared to the corresponding
period of previous year.

(b): The value of merchandise export targets fixed and achieved is as follows:
Years Export values (US$ Billions)
% Difference Target fixed Achievement
2013‐14 325 314 ‐3.38
2014‐15 340 310 ‐8.82
Source: Annual Report of Department of Commerce
As per Foreign Trade Policy 2015‐20, the Government aims to increase India’s exports of
merchandise and services from US$ 465.9 Billions to approximately US$ 900 Billions by 2019‐20
and to raise India’s share in world exports (Goods and Services) from 2% to 3.5%. The top 10
countries with which India’s trade deficit has increased during last three years and current year is
given in Annexure‐I.
(c) to (e): Representations/suggestions for reform of trade strategy are received from trade
organisations/export promotion councils from time to time, which are taken into consideration as
part of the regular ongoing process of review and reform of trade policy. As part of this process
Government has taken the following steps to increase the competitiveness of India’s exports and
bridge the trade deficit:
(xi) The New Foreign Trade Policy (2015‐20) was announced on 1st April, 2015 with a focus on supporting both manufacturing and services exports.
(xii) The Merchandise Exports from India Scheme (MEIS) has been introduced in the Foreign
Trade Policy (FTP) 2015‐20 on 01.04.2015 with the objective to offset infrastructural
inefficiencies and associated costs involved in exporting goods/products which are
produced/ manufactured in India and to provide a level playing field to Indian exporters,
especially those having high export intensity and employment potential. The Scheme
incentivizes exporters in terms of freely transferable Duty Credit Scrips which are
transferable and can be used to pay certain Central duties/taxes including customs duties.
The Scheme covers exports of 7914 tariff lines at 8 digit levels to all countries.
(xiii) The Services Exports from India Scheme (SEIS) has been introduced in the Foreign Trade
Policy (FTP) 2015‐20 on 01.04.2015. The Scheme provides rewards at the rate of 3 to 5%
on Net Foreign Exchange earnings, to service providers of notified services from India to
rest of the world, in the form of Duty Credit Scrips which are transferable and can be used
to pay certain Central duties/taxes including customs duties.
(xiv) The Government has implemented the Niryat Bandhu Scheme with an objective to reach
out to the new and potential exporters including exporters from Micro, Small & Medium
Enterprises (MSMEs) and mentor them through orientation programmes, counseling
sessions, individual facilitation etc., on various aspects of foreign trade for being able to
get into international trade and boost exports from India.
(xv) As part of the “Ease of Doing Business” initiatives, the Government has launched Single
Window Interface for Facilitating Trade (SWIFT) clearances project w.e.f 1st April, 2016.
The scheme enables the importers/exporters to file a common electronic ‘Integrated

Declaration’ on the Indian Customs Electronic Commerce/Electronic Data Interchange
(EC/EDI) Gateway i.e. ICEGATE portal. The Integrated Declaration compiles the
information requirements of Customs, FSSAI, Plant Quarantine, Animal Quarantine, Drug
Controller, Wild Life Control Bureau and Textile Committee. It replaces nine separate
forms required by these 6 different agencies and Customs.
(xvi) Interest Equalization Scheme on pre & post shipment credit was launched to provide
cheaper credit to exporters.
(xvii) A new scheme called Special Advance Authorisation Scheme for export of articles of
Apparel and Clothing Accessories was introduced w.e.f. 1st September 2016 wherein
exporters are entitled for an authorisation for fabrics including inter lining on pre‐import
basis and all industry rate of Duty Drawback for non‐fabric inputs on the exports.
(xviii) Further, the Government continues to provide the facility of access to duty free raw
materials and capital goods for exports through schemes like Advance Authorization, Duty
Free Import Authorization (DFIA), Export Promotion Capital Goods (EPCG) and drawback /
refund of duties.
(xix) The Government launched a new scheme called Trade Infrastructure for Export Scheme
(TIES) w.e.f. 15th March, 2017 with the objective to enhance export competitiveness by
bridging gaps in export infrastructure, creating focused export infrastructure, first mile
and last mile connectivity for export oriented projects and addressing quality and
certification measures. The Central and State Agencies, including Export Promotion
Councils, Commodities Boards, SEZ Authorities and Apex Trade Bodies recognised under
the EXIM policy of Government of India are eligible for financial support under this
scheme.
(xx) The Government has approved the proposal for notification of commitments under the
Trade Facilitation Agreement (TFA) of World Trade Organization (WTO), ratification and
acceptance of the Instrument of Acceptance of Protocol of TFA to the WTO Secretariat
and constitution of the National Committee on Trade Facilitation (NCTF). The Trade
Facilitation Agreement (TFA) contains provisions for expediting the movement, release
and clearance of goods, including goods in transit. It also sets out measures for effective
cooperation between customs and other appropriate authorities on trade facilitation and
customs compliance issues. These objectives are in consonance with India’s “Ease of Doing
Business” initiative.
***

Annexure‐I Statement referred to in reply to part (b) of Lok Sabha Unstarred Question No. 1237 for answer on 24th July, 2017 regarding “trade deficit”
Trade Deficit of top 10 countries (Value in USD Million)
Countries 2014‐16 2016‐17 % Change
South Africa ‐1194.52 ‐2258.77 89.09
Iran ‐4779.92 ‐8113.38 69.74
Russia ‐2152.21 ‐3620.26 68.21
Canada ‐1553.40 ‐2122.33 36.63
Argentina ‐1532.03 ‐1988.45 29.79
Botswana ‐968.42 ‐1230.27 27.04
Japan ‐4745.50 ‐5900.53 24.34
Ukraine ‐1889.95 ‐2170.83 14.86
Australia ‐7465.11 ‐8187.97 9.68
China PRP ‐48454.65 ‐51089.01 5.44
Source: DGCI&S, Kolkata (* Provisional)

GOVERNMENT OF INDIA MINISTRY OF COMMERCE & INDUSTRY
(DEPARTMENT OF COMMERCE)
LOK SABHA UNSTARRED QUESTION NO. 1271(H)
TO BE ANSWERED ON 24th JULY, 2017
DRY PORTS 1271(H). SHRI RAMDAS C. TADAS:
Will the Minister of COMMERCE & INDUSTRY (वािण य एवं उ योग मतं्री ) be
pleased to state:
(a) whether the Government has approved construction of dry ports in various States/UTs of the country;
(b) if so, the details of the places where dry ports are proposed to be constructed; (c) whether the Government proposes to construct a dry port at Shindhi Village in the district
of Vardha in Maharashtra; and (d) if so, the details thereof and the time by which construction of dry ports is likely to be
completed?
ANSWER
okf.kT; ,oa m|ksx jkT; ea=h ¼Jherh fueZyk lhrkje.k½ ¼Lora= izHkkj½
THE MINISTER OF STATE IN THE MINISTRY OF COMMERCE AND INDUSTRY (INDEPENDENT CHARGE)
(SMT. NIRMALA SITHARAMAN)
(a) and (b) : Proposals for setting up of Inland Container Depots (ICDs) which are considered as Dry Ports, Container Freight Stations (CFSs) and Air Freight Stations (AFSs) are received in the Department from Central and State Public Sector Undertakings and private developers from time to time. Department of Commerce itself does not set up such facility. An Inter-Ministerial Committee (IMC) set up under the aegis of Department of Commerce, since 1992, acts as a Single Window Clearance for approval of Inland Container Depots (ICDs) and Container Freight Stations (CFSs). Setting up of Air Freight Station (AFS) has also been included in the purview of IMC since 10th Oct. 2014. As on 30-06-2017, 324 Letters of Intent (LoIs) have been issued for the proposal received for setting up of ICDs/CFSs/AFSs by private developers, State and Central Public Sector Undertakings since 1992. Out of which, 236 ICDs/CFSs are functional, 52 are at various stages of implementation by the developers and 36 Letter of Intent (LoIs) have been cancelled either on the specific request of the developer or due to lack of adequate progress in implementation of the project. The list showing the State-wise / Union Territory-wise ICDs/CFSs/AFSs along with their operating agencies and locations is at Annexure.

(c) and (d):Department of Commerce has received a proposal on 07-07-2017 from Jawaharlal Nehru Port Trust for setting up an ICD at Sindi Village, Tal-Seloo, District of Vardha (near railway station) Maharashtra. All proposals for setting up of ICDs / CFSs / AFSs are placed before an Inter-Ministerial Committee for consideration and clearance. Thereafter, the time period of construction depends upon the developer’s ability to tie up and obtain the necessary finance for his project and to construct the facility.
*******

Annexure referred in Reply to Parts (a) and (b) of Lok Sabha Unstarred Question No.1271 for answer on 24-07-2017 regarding Dry Ports Statement showing the number of State-wiseFunctionaland Under Implementation ICDs / CFSs for the period 1992 to 2017 (as on 30-06-2017)
Name of State Inland Container Depots Container Freight
Stations Air Freight Station Total
F UI C F UI C F UI C Andhra Pradesh 02 01 01 05 09 02 0 0 0 20Bihar 0 01 0 0 0 0 0 0 0 1Chandigarh 01 0 0 0 0 0 0 0 0 1Chattisgarh 01 01 0 0 0 0 0 0 0 2Delhi 0 0 0 0 0 0 0 01 0 1Goa 0 0 0 01 0 0 0 0 0 1
Gujarat 07 02 01 23 05 07 0 0 0 45Haryana 06 03 03 03 0 0 0 0 0 15Himachal Pradesh 01 0 0 0 0 0 0 0 0 1Jharkhand 01 0 0 0 0 0 0 0 0 1Jammu Kashmir (J & K)
01 01 0 0 0 0 0 0 0 2
Karnataka 0 02 0 07 0 02 0 01 0 12Kerala 01 00 01 11 02 01 0 0 0 16Maharashtra 07 04 0 40 03 05 0 0 0 59Madhya Pradesh (M.P) 07 0 01 0 0 0 0 0 0 8Odisha 02 01 0 0 0 0 0 0 0 3Pondicherry 0 0 0 02 0 0 0 0 0 2Punjab 02 01 01 05 0 0 0 0 0 9Rajasthan 07 01 01 02 0 0 0 0 0 11Tamil Nadu (T.N) 09 01 0 48 07 08 0 0 0 73Telangana 01 01 01 02 01 00 0 0 0 06Uttarakhand 02 0 0 0 0 0 0 0 0 2Uttar Pradesh (U.P) 08 02 0 09 0 0 0 0 0 19West Bengal (W.B) 01 0 0 11 01 01 0 0 0 14Total 67 22 10 169 28 26 0 2 0 324
F = Functional (67 ICDs + 169 CFSs = 236) U.I. = Under Implementation (22 ICDs + 28 CFSs+ 02AFS = 52) C = Cancelled – (10 ICDs + 26 CFSs = 36)
Organization ICDs CFSs AFSs Total F UI C F UI C F UI C
Central Govt. PSUs 30 04 03 39 02 0 0 0 0 78State Govt. PSUs 3 1 1 13 1 0 0 0 0 19Private 34 17 6 117 25 26 0 02 0 227Total 67 22 10 169 28 26 0 02 0 324

LIST OF ICDs/CFSs / AFSs APPROVED BY THE IMC WHICH ARE UNDER IMPLEMENTATION OR FUNCTIONING –(As on 30-06-2017)
{@ PrivateU.I. – Under Implementation F – Functioning C – Cancelled}
S. No.
Place/ Location
Whether ICD or CFS
Agency/Company
State LOI date Status
1 Visakhapatnam CFS Central Warehousing Corporation AP
10.05.96 F
2 Visakhapatnam @ CFS M/s Sravan Shipping Services Pvt Ltd. AP
22.10.01 F
3 Visakhapatnam CFS Container Corporation of India Ltd. AP
12.05.04 F
4 Ongole, Praksam@ ICD Korkai Terminals Pvt. Ltd.(Name changed from Sterling Container Line Madras Pvt. Ltd. to M/s Korkai Terminals Pvt. Ltd. in 2005)
AP
24.09.04
F
5 Visakhapatnam @ CFS Gateway East India Pvt. Ltd., AP
10.02.05 F
6 Surareddy Palem@ ICD Viking Bulk Cargo Terminals Pvt.Ltd. Chennai
AP
1.9.2008 C
7 Guntur@ ICD Leaap International Pvt. Ltd. , Chennai AP
9.9.2008 F
8 Visakhapatanam CFS Sravan Shipping Services Pvt. Ltd. AP
02.02.12 U.I
9 Visakapatanam Port CFS Continental Warehousing Corporation Ltd.
AP
7.12.12 C
10 Krishnapatnam CFS Krishnapatnam Bay Area CFS Pvt. Ltd. AP
20.03.13 C
11 Kanithi Village, near Gangavaram Port, Vishakhapatnam
CFS VPL Integral CFS Pvt. Ltd. AP
14.06.13
F
12 Visakhapatnam CFS Container Corporation of India Ltd. AP 12-02-15 UI 13 Kakinada, East Godavari
Distt @ CFS / CY Innovative Container Services Pvt. Ltd AP 13-04-15 UI
14 Krishnapatnam Port @
CFS Krishnapatnam Bay Area CFS Pvt. Limited
AP 14-09-15 UI
15 Visakhapatnam @ CFS SICAL Multimodal and Railway Transport Ltd. (subject to ratification)
AP 13-10-15 UI
16. Visakhapatnam @ CFS Visakha Container Terminal Private Limited
AP 28-01-16 UI
17 Nellore @ CFS Gateway Distriparks Limited AP 04-08-16 UI 18 Bayyavaram,
Visakhapatnam Distt @ CFS Visakha CFS & Logistics Pvt. Limited AP 24-10-16 UI
19 Surareddy palem, Praksam ICD A. S. Shipping Agencies Pvt. Ltd. AP 30-03-17 UI 20 Kakinada, Andhra Pradesh CFS M/s Fortuna Port Services (P) Ltd. AP 17-05-17 UI 21 Patna, Bihar @ ICD Pristine Magadh Infrastructure Pvt. Ltd. Bihar 17.12.13 U.I 22 Derra Bassi ICD Punjab State Warehousing Corporation Chandigarh 17.09.98 F 23 Raipur ICD Container Corporation of India Ltd. Chhattisgarh 17.09.01 F
24 Naya Raipur ICD Container Corporation of India Limited Chhattisgarh 04-08-16 UI 25 Kapashera @ AFS Continental Carriers Limited Delhi 08-08-16 UI 26 Verna CFS Central Warehousing Corporation Goa
10.03.97 F
27 Kandla CFS Central Warehousing Corporation Gujarat 15.10.92 F 28 Surat CFS Central Warehousing Corporation Gujarat 15.10.92 F 29 Vadodara CFS Gujarat State Warehousing Corporation Gujarat 01.02.93 F 30 Deshrath CFS Central Warehousing Corporation Gujarat 13.12.95 F 31 Alkeshwar ICD Container Corporation of India Ltd Gujarat 24.06.99 F 32 Vapi CFS Central Warehousing Corporation Gujarat 24.06.99 F 33 Vadodara ICD Container Corporation of India Ltd. Gujarat 02-08.01 F 34 Mundra (Kutch)@ CFS M/s Mundra International Container
Terminal Pvt. Ltd. Gujarat 15.01.04 F
35 Gandhidham (Kandla)
CFS Container Corporation of India Ltd. Gujarat 24.11.04 F
36 Mundra CFS Central Warehousing Corporation Gujarat 24.11.04 F 37 Mundra@ CFS Mundhra CFS Pvt.Ltd. Mumbai Gujarat 6.1.2004 F 38 Kandla @ CFS Seabird Marine Services Pvt. Ltd. Gujarat 10.02.05 F 39 Nana Kapaya @ (Mundra) CFS Rishi Container Station Pvt. Ltd. Gujarat 02.08.05 C 40 Mithiroad @
(Kandla) CFS Gandhidham Developers Pvt. Ltd. Gujarat 02.08.05 F
41 Mundra @ CFS Saurashtras Containers Pvt. Ltd. Gujarat 02.08.05 F

42 Mundra Port @
CFS Forbes and Company (Formerly Forbes Gokak Ltd.)
Gujarat 26.09.05 F
43 Mithiroad @ (Kandla)
CFS Kandla Container Freight Stations Gujarat 26.09.05 C
44 Dhrab @ (Mundra) CFS Ashutosh Container Services Pvt. Ltd. Gujarat 22.11.05 F 45 Mundra @ CFS Seabird Marine Services Pvt. Ltd. Gujarat 20.02.06 F 46 Mithirohar
Village @ Kandla ICD Arvind V Joshi & Co. Gujarat 06.03.06
17.12.13 F
47 Mundra @ CFS Meridian Shipping Agency Pvt. Ltd. Gujarat 17.03.06 F 48 Mundra @ CFS Allcargo Global Logistics Ltd. Gujarat 12.10.06 F 49 Mundra @ CFS Honeycomb Logistics Pvt Ltd. Gujarat 12.10.06 F 50 Ahmedabad @ ICD Hasti Petro Chemical & Shipping Ltd. Gujarat 25.04.07 F 51 Mundra @ CFS Kachchh Container Freight Station (Pvt.)
Ltd. Gujarat 15.05.07 C
52 Pipavav Port @ CFS Contrans Logistic Pvt.Ltd. Gujarat ( Box Trans Logistics Private Ltd.was changed to Contrans Logistic Pvt.Ltd. wef 7.8.08)
Gujarat 01.08.07 F
53 Pipavav Port @ CFS LCL Agencies (India) Pvt.Ltd. Gujarat 04.03.08 F 54 Pipavav Port @ CFS Ameya CFS Pvt.Ltd Gujarat 04.03.08 C 55 Pipavav Port @ CFS Magnet Logistics Park Pvt.Ltd Gujarat 05.03.08 C 56 Khodiyar,Gandhinagar ICD Container Corporation of India Ltd. Gujarat 8.9.2008 F 57 Pipavav Port CFS Central Warehousing Corporation, New
Delhi Gujarat 5.1.2009 F
58 Lakodra Distt. Vadodara @ ICD Contrans Logistics Pvt.Ltd.(Box Trans Logistics Private Ltd.was changed to ContransLotisticPvt.Ltd. wef 7.8.08)
Gujarat 13.5.09 C
59 Hazira, Surat @ ICD Kribhco Infrastructure Ltd. Gujarat 3.12.10 F 60 Pipavav CFS Kesar Terminals and Infrastructure
Limited Gujarat 16.02.12 C
61 Gandhidham, Kutch, Gujarat
CFS Fair Deal Freight Solution Ltd. Gujarat 15.04.13 F
62 Gujarat Pipavav Port, Ucchaiya @
CFS APM Terminals India Private Limited Gujarat 19-05-14 C
63 Village Sachana, Taluka Viramgam, Ahmedabad @
ICD Continental Warehousing Corporation (Nhava Sheva) Ltd
Gujarat 29-04-15 UI
64 Village Tumb, Umergaon, Valsad @
ICD Navkar Terminals Limited Gujarat 29-04-15 F
65 Moje Suvali, Taluka, Choryasi, Dist. Surat. @
CFS Seabird Marine Services Pvt. Ltd Gujarat 10-06-15 UI
66 Dhrub Village, Mundra Taluka, Kutch @
CFS Hind Mundra Terminal Pvt. Limtied Gujarat 14-09-15 F
67 Hazira, Surat @ CFS Hazira Container Freight Station Pvt. Gujarat 14-09-15 UI 68 Paiki, Village Motakapaya,
Mundra @ CFS Rishi Container Freight Station Pvt.
Limited Gujarat 14-09-15 UI
69 Village Zarpara, Mundra Taluka @
CFS Landmark CFS Private Limited Gujarat 17-12-15 UI
70 Hazira @ CFS Hind Terminals Pvt. Ltd. Gujarat 15-11-16 UI 71 Viramgam, Ahmedabad ICD Gateway Rail Freight Limited Gujarat 17-11-16 UI 72 Faridabad @ CFS Associated Container Terminal Ltd. Haryana 22.10.92 F 73 Rewari CFS Haryana Warehousing Corporation Haryana 28.02.95 F 74 Kundli CFS Central Warehousing Corporation Haryana 01.06.2K F 75 GarhiHarsaru ICD Gateway Distriparks Ltd. (LOI changed
from the name of M/s Continental Warehousing Corporation to M/s Distriparks on 14.5.2004.) @)
Haryana 14.05.04 F
76 Gurgaon ICD Container Corporation of India Ltd. Haryana 17.05.05 C 77 Patli @ ICD Adani Logistics Limited (Approval for
change of name of the company from Inland Conware Private Limited to Adani Logistics Limited given vide letter dated 06.08.2013)
Haryana 01.05.06 F
78 Village Piyala/ Asaoti @ ICD Gateway Distriparks Ltd. Haryana 12.10.06 F 79 Growth Centre Bawal,,
Distt. Rewari@ ICD Sanjvik Terminals Pvt. Ltd.,New Delhi Haryana 5.1.2009 U.I
80 Ballabhgarh ICD CONCOR Haryana 13.1.2009 F 81 Pali, Rewari ICD Kribhco Infrastructure Limited, Noida Haryana 25.4.12 F 82 Rai(Sonepat) ICD CONCOR Haryana 20.6.12 C 83 Village Panchi, Gujaran,
Sonepat, Haryana ICD BoxTrans Logistics (India) services
Pvt.Ltd. Haryana 20.6.12 F
84 Samalkha, Panipat ICD India Infrastructure and Logistics Pvt. Ltd. Haryana 12.11.12 C 85 Village Janoli and Bhagola,
Palwal, Distt.Faridabad ICD Hind Terminal Pvt. Ltd. Haryana 12.11.12 U.I
86 Village Jattipur, Samalkha, Panipat
ICD Continental Warehousing Corporation Haryana 05-09-14 U.I
87 Baddi,H.P ICD CONCOR H.P. 5.1.2010 F
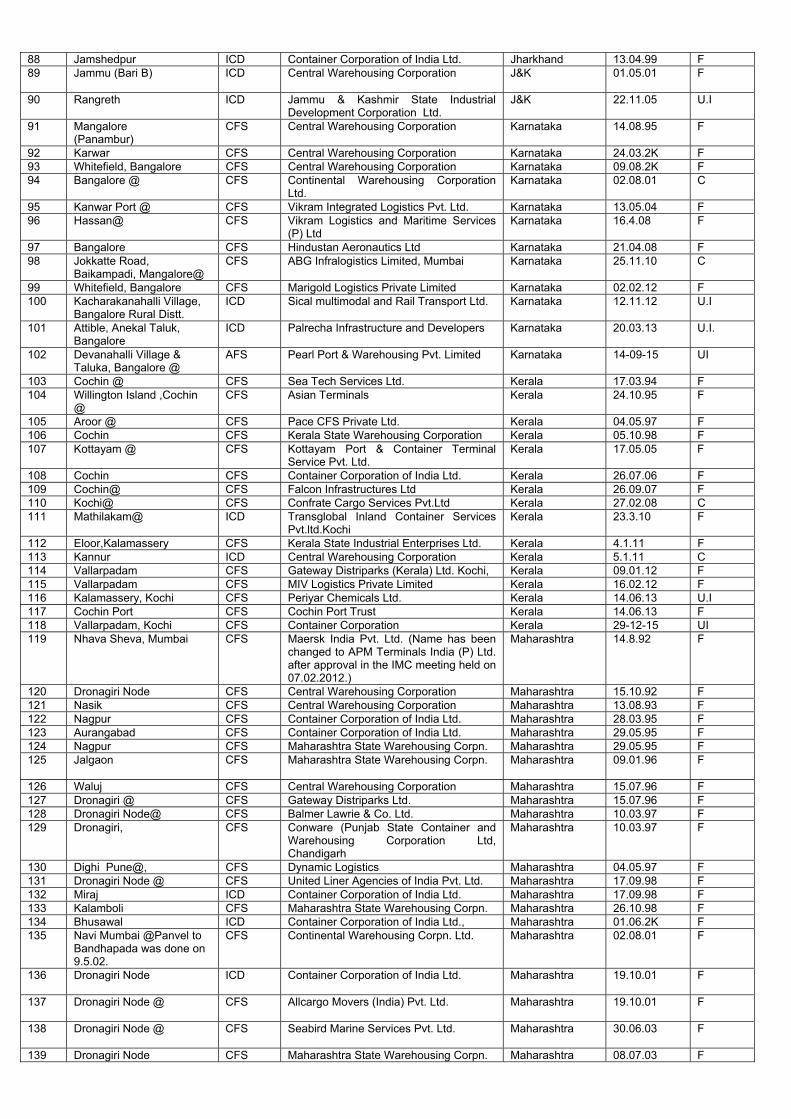
88 Jamshedpur ICD Container Corporation of India Ltd. Jharkhand 13.04.99 F 89 Jammu (Bari B) ICD Central Warehousing Corporation J&K
01.05.01 F
90 Rangreth ICD Jammu & Kashmir State Industrial Development Corporation Ltd.
J&K
22.11.05 U.I
91 Mangalore (Panambur)
CFS Central Warehousing Corporation Karnataka 14.08.95 F
92 Karwar CFS Central Warehousing Corporation Karnataka 24.03.2K F 93 Whitefield, Bangalore CFS Central Warehousing Corporation Karnataka 09.08.2K F 94 Bangalore @ CFS Continental Warehousing Corporation
Ltd. Karnataka 02.08.01 C
95 Kanwar Port @ CFS Vikram Integrated Logistics Pvt. Ltd. Karnataka 13.05.04 F 96 Hassan@ CFS Vikram Logistics and Maritime Services
(P) Ltd Karnataka 16.4.08 F
97 Bangalore CFS Hindustan Aeronautics Ltd Karnataka 21.04.08 F 98 Jokkatte Road,
Baikampadi, Mangalore@ CFS ABG Infralogistics Limited, Mumbai Karnataka 25.11.10 C
99 Whitefield, Bangalore CFS Marigold Logistics Private Limited Karnataka 02.02.12 F 100 Kacharakanahalli Village,
Bangalore Rural Distt. ICD Sical multimodal and Rail Transport Ltd. Karnataka 12.11.12 U.I
101 Attible, Anekal Taluk, Bangalore
ICD Palrecha Infrastructure and Developers Karnataka 20.03.13 U.I.
102 Devanahalli Village & Taluka, Bangalore @
AFS Pearl Port & Warehousing Pvt. Limited Karnataka 14-09-15 UI
103 Cochin @ CFS Sea Tech Services Ltd. Kerala 17.03.94 F 104 Willington Island ,Cochin
@ CFS Asian Terminals Kerala 24.10.95 F
105 Aroor @ CFS Pace CFS Private Ltd. Kerala 04.05.97 F 106 Cochin CFS Kerala State Warehousing Corporation Kerala 05.10.98 F 107 Kottayam @ CFS Kottayam Port & Container Terminal
Service Pvt. Ltd. Kerala 17.05.05 F
108 Cochin CFS Container Corporation of India Ltd. Kerala 26.07.06 F 109 Cochin@ CFS Falcon Infrastructures Ltd Kerala 26.09.07 F 110 Kochi@ CFS Confrate Cargo Services Pvt.Ltd Kerala 27.02.08 C 111 Mathilakam@ ICD Transglobal Inland Container Services
Pvt.ltd.Kochi Kerala 23.3.10 F
112 Eloor,Kalamassery CFS Kerala State Industrial Enterprises Ltd. Kerala 4.1.11 F 113 Kannur ICD Central Warehousing Corporation Kerala 5.1.11 C 114 Vallarpadam CFS Gateway Distriparks (Kerala) Ltd. Kochi, Kerala 09.01.12 F 115 Vallarpadam CFS MIV Logistics Private Limited Kerala 16.02.12 F 116 Kalamassery, Kochi CFS Periyar Chemicals Ltd. Kerala 14.06.13 U.I 117 Cochin Port CFS Cochin Port Trust Kerala 14.06.13 F 118 Vallarpadam, Kochi CFS Container Corporation Kerala 29-12-15 UI 119 Nhava Sheva, Mumbai CFS Maersk India Pvt. Ltd. (Name has been
changed to APM Terminals India (P) Ltd. after approval in the IMC meeting held on 07.02.2012.)
Maharashtra
14.8.92 F
120 Dronagiri Node CFS Central Warehousing Corporation Maharashtra 15.10.92 F 121 Nasik CFS Central Warehousing Corporation Maharashtra 13.08.93 F 122 Nagpur CFS Container Corporation of India Ltd. Maharashtra 28.03.95 F 123 Aurangabad CFS Container Corporation of India Ltd. Maharashtra 29.05.95 F 124 Nagpur CFS Maharashtra State Warehousing Corpn. Maharashtra 29.05.95 F 125 Jalgaon CFS Maharashtra State Warehousing Corpn. Maharashtra
09.01.96 F
126 Waluj CFS Central Warehousing Corporation Maharashtra 15.07.96 F 127 Dronagiri @ CFS Gateway Distriparks Ltd. Maharashtra 15.07.96 F 128 Dronagiri Node@ CFS Balmer Lawrie & Co. Ltd. Maharashtra 10.03.97 F 129 Dronagiri, CFS Conware (Punjab State Container and
Warehousing Corporation Ltd, Chandigarh
Maharashtra
10.03.97 F
130 Dighi Pune@, CFS Dynamic Logistics Maharashtra 04.05.97 F 131 Dronagiri Node @ CFS United Liner Agencies of India Pvt. Ltd. Maharashtra 17.09.98 F 132 Miraj ICD Container Corporation of India Ltd. Maharashtra 17.09.98 F 133 Kalamboli CFS Maharashtra State Warehousing Corpn. Maharashtra 26.10.98 F 134 Bhusawal ICD Container Corporation of India Ltd., Maharashtra 01.06.2K F 135 Navi Mumbai @Panvel to
Bandhapada was done on 9.5.02.
CFS Continental Warehousing Corpn. Ltd. Maharashtra
02.08.01
F
136 Dronagiri Node ICD Container Corporation of India Ltd. Maharashtra
19.10.01 F
137 Dronagiri Node @ CFS Allcargo Movers (India) Pvt. Ltd. Maharashtra
19.10.01 F
138 Dronagiri Node @ CFS Seabird Marine Services Pvt. Ltd. Maharashtra
30.06.03 F
139 Dronagiri Node CFS Maharashtra State Warehousing Corpn. Maharashtra 08.07.03 F

140 CWC Distriparks
Bhendakhal, Navi .Mumbai
CFS Central Warehousing Corporation Maharashtra
07.01.04 F
141 Desur (Belgaum) CFS Container Corporation of India Ltd. Maharashtra
22.01.04 F
142 Navi Mumbai @ CFS Continental Warehousing Corpn. (Nhava Shava) Ltd.
Maharashtra
28.07.04 F
143 Dhasakoshi @ CFS Ameya Logistics Pvt. Ltd., Maharashtra 25.08.04 F 144 Impex Park, Dronagiri
Node CFS Central Warehousing Corporation Maharashtra
09.09.04 F
145 Panvel @ ICD JWC Logistics Park Pvt. Ltd., Maharashtra
24.11.04 F
146 Panvel @ CFS Navkar Corporation Ltd.(Name changed from M/s Preeti Logistics Ltd. to M/s Navkar Corporation Ltd. on approval in the IMC meeting held on 21.05.2010
Maharashtra
30.12.04 (change of status from ICD to CFS was done vide LOI dated 24.4.08)
F
147 Nhava Sheva @ CFS Forbes &Com.(Formerly Forbes Gogak Limited)
Maharashtra
10.02.05 F
148 Navi Mumbai CFS Central Warehousing Corporation Maharashtra 10.02.05 F
149 Dronagiri @ CFS Maersk India Pvt. Ltd. Maharashtra 17.05.05 F 150 Dharamtar Port Navi
Mumbai@ CFS PNP Maritime Services Pvt. Ltd. Maharashtra 10.11.05 C
151 Nasik CFS Container Corporation of India Ltd. Maharashtra 06.03.06 F 152 TelegaonDabhade ,@
Pune ICD KSH Distriparks Pvt. Ltd. Maharashtra
26.07.06 F
153 Jui Village, JNPT @ CFS Coralline Container Services Pvt. Ltd., Maharashtra 01.08.07 C 154 Village Dighode@ CFS Fastlane Distriparks and Logistics
Limited, Mumbai( Gem Distriparks and Logistics Limited was changed to Fastlane Distriparks and Logistics Limited wef 7.1.2009). Name further changed to SKIL Infrastructure Limited in the IMC meeting held on 23-05-2014
Maharashtra
02.08.07 C
155 Village Dighode,Raigad@ CFS RamtechInfraservicesPvt.Ltd., Maharashtra 5.11.07 C 156 Village Somthane /
Bhatan@ CFS Apollo Logi Solutions Ltd Maharashtra 28.02.08 F
157 Village Dighode,Raigad@ CFS ParkcityComputechPvt.Ltd. Maharashtra
04.03.08 C
158 Raigad@ CFS Preeti Logistics Ltd Maharashtra 24.4.08 F 159 Raigad@ CFS Ashte Logistics Pvt.Ltd Maharashtra 05.05.08 F 160 Nagpur@ ICD World Window Wardha Infrastructure
Pvt.Ltd. Maharashtra 8.12.2008 F
161 Somatane, Distt. Raigad@ CFS Navakar Corporation Ltd.Navi Mumbai Maharashtra 5.1.2009 F 162 Nhava Sheva, Navi
Mumbai@ CFS Vaishno Logistics Yard Maharashtra 24.4.2009 F
163 Palaspe,Panvel-Goa Highway, Near Nhava Sheva Port, Navi Mumbai@
CFS Ocean Gate Container Terminals Pvt.Ltd. Mumbai
Maharashtra
21.1.2010 F
164 Village Somatane,Panvel Taluk, Raigad District, Mumbai@
CFS Indev Logistics Private Limited Maharashtra
10.6.2010 F
165 Village Khairne, Taluka Panvel, Dist Raigad, Nhava Sheva@
CFS Balaji Warehousing And Pest Control Services Pvt.Ltd.
Maharashtra
1.7.2010 F
166 Borkedi, near Nagpur@ ICD Distribution Logistics Infrastructure Pvt. Limited (name of company changed on 08-05-2015) (ETA Engineering Pvt.Ltd. – old name)
Maharashtra 14.1.11 U.I
167 Village Khopta, Uran, Raigad
CFS Transindia Logistics Parak Private Limited
Maharashtra 21.02.12 F
168 Padeghar,Dist.Raigad, Tal.Panvel,
CFS JWR Logistics Pvt.Ltd. Maharashtra 12.7.12 F
169 Tarapur, Thane Distt. ICD Vaishno Container Terminal Maharashtra 7.12.12 F 170 Butibori, Nagpur ICD Glocal ICD Pvt. Ltd. Maharashtra 14.1.13 U.I 171 Navi Mumbai, Maharashtra CFS E.F.C Logistics India Pvt. Ltd. Maharashtra 17.04.13 F 172 Koproli, Uran, Raigad @ CFS Nhava Sheva Logistics Pvt. Limited Maharashtra 09-04-15 UI 173 PalapsePhata, Panvel @ CFS Take Care Logistics Park India Pvt. Ltd Maharashtra 10-04-15 F 174 Village Bhingar, Panvel
Taluk, Dist. Raigad, @ CFS Saastha Warehousing Corporation Maharashtra 10-06-15 UI

175 Village Dighode, Uran Taluka, Raigad @
CFS` Sarveshwar Logistics Services Private Limited
Maharashtra 21-12-15 UI
176 Mihan Area of District Nagpur
ICD Container Corporation of India Limited Maharashtra 01-08-16 UI
177 Bhamboli, Pune @ ICD APM Terminals Pvt. Ltd. Maharashtra 17-11-16 UI 178 Indore ICD Container Corporation of India Ltd. MP 28.02.95 F 179 Gwalior ICD Container Corporation of India Ltd. MP 28.02.95 F 180 Mandideep ICD Container Corporation of India Ltd. MP 02.08.02 F 181 Village Dhannad
Rau,Dist.Indore@ ICD Pegasus Inland Container Depot Pvt.Ltd MP 04.03.08 F
182 Pitampur(Indore@ ICD All Cargo Global Logistics Ltd MP 07.03.08 F 183 Ratlam ICD CONCOR MP 2.7.2008 F 184 Bangrod Distt.
Ratlam@ ICD GSEC Logistics Ltd. MP 27.04.09 C
185 Powarkheda, Hoshanabad District @
ICD Kesar Multimodal Logistics Ltd. MP 19.12.12 F
186 Ballasore ICD Container Corporation of India Ltd. Odisha
19.10.94 F
187 Kalinganagar@ ICD Apeejay Infralogistics, Kolkata Odisha
4.6.10 F
188 Jharsuguda ICD Container Corporation of India Ltd. Odisha 21-09-15 UI 189 Pondicherry @ CFS Sattva Hi-Tech & Conware Pvt. Ltd. Pondicherry 06.05.99 F 190 Pondicherry @ CFS Continental Container Freight Station Pondicherry 21.09.04 F 191 Amritsar CFS Punjab State Warehousing Corporation Punjab
13.07.92 F
192 Bhatinda CFS Punjab State Warehousing Corporation Punjab
13.08.93 F
193 Ludhiana @ CFS Overseas Warehousing Pvt. Ltd. Punjab
04.06.97 F
194 Ludhiana @ CFS Krishna Cargo Movers Pvt. Ltd. Punjab
11.05.06 F
195 Amloh Road @ CFS Gurudev Impex Pvt. Ltd. Punjab 13.09.07 F 196 Sahnewal@ ICD Gateway Rail Freight Pvt. Ltd., New Delhi Punjab
6.2.07 F
197 Amritsar@ ICD Shore to Shore Logistics India Ltd.Amritsar
Punjab
2.6.2010 C
198 Ludhiana ICD Pristine Mega Logistics Park Pvt. Ltd. Punjab
19.07.13 U.I.
199 Ludhiana @ ICD Innovative B2B logistics, Sahnewal Punjab 16.6.14 F 200 Jodhpur CFS Rajasthan Small Industries Corporation Rajasthan 22.01.93 F 201 Udaipur CFS Central Warehousing Corporation Rajasthan 13.08.93 F 202 Bhilwara ICD Rajasthan Small Industries Corporation Rajasthan 06.06.96 F 203 Bhiwadi ICD Rajasthan Small Industries Corporation Rajasthan 10.03.97 F 204 Jaipur ICD Container Corporation of India Ltd. Rajasthan 10.11.97 F 205 Jodhpur ICD Container corporation of India Ltd. Rajasthan 01.09.99 F 206 Jodhpur @ ICD Hasti Petro Chemical & Shipping Ltd. Rajasthan 01.10.08 F 207 Ravatha Road (Kota) ICD Container Corporation of India Ltd. Rajasthan 22.01.03 F 208 Bikaner ICD Rajasthan Small Industries
Corporation,Jaipur Rajasthan 20.8.09 C
209 Hindaun ICD Kribhco Infrastructure Ltd. Rajasthan 12.11.12 U.I 210 Kathuwas & Mandhan Dist.
Alwar ICD Container Corporation of India Ltd. Rajasthan 06.03.14 F
211 Tuticorin CFS Container Corporation of India Ltd. TN 22.10.92 F 212 Tuticorin @ CFS SEC Services Ltd. TN 16.10.92 F 213 Madhavaram CFS Central Warehousing Corporation TN 13.08.93 F 214 Tirupur @ CFS TEA Lemuir Cont. Terminal Pvt. Ltd. TN 28.03.94 F 215 Tuticorin @ CFS St. John Freight Systems Pvt. Ltd. TN 11.08.94 F 216 Coimbatore, Singanallur CFS Central Warehousing Corporation TN 14.08.95 F 217 Chennai @ CFS Gateway Distriparks (South) Pvt. Ltd. TN 28.02.95
F
218 Chennai @ CFS A.S.Shipping Agencies Pvt. Ltd. TN 28.02.95 F 219 Salem @ CFS Sanco Trans Ltd. TN 14.08.95 F 220 Chennai CFS Balmer Lawrie & Co. Ltd. TN 24.10.95 F 221 Chennai @ CFS Viking Warehousing TN 24.10.95 F 222 Chennai @ CFS SICAL Distriparks Ltd. TN 15.07.96 F 223 Tuticorin CFS Central Warehousing Corporation TN 10.11.97 F 224 Tuticorin @ CFS Sanco Trans Ltd. TN 10.11.97 F 225 Madurai ICD Container Corporation of India Ltd. TN 10.11.97 F 226 Chennai @ CFS Sattva Hi-Tech & Conware Pvt. .Ltd. TN 01.09.99 F

227 Malpakkam Arakkonam @
ICD Sattva Hi-Tech & Conware (Arakkonam) Pvt.. Ltd.
TN 24.03.2K F
228 Tuticorin @ CFS Continental Container Freight Station This CFS has been amalgamated with Indev Logistics Private Ltd. With the approval of IMC held on 21.10.10.
TN 24.03.2K F
229 Karur @ CFS Continental Container Freight Station Pvt.Ltd.(Continental Container Freight Station was changed to Continental Container Freight Stations Pvt.Ltd. vide their letter dated 20.6.10.This CFS has been amalgamated with Indev Logistics Private Ltd. With the approval of IMC held on 21.10.10.
TN 28.06.2K F
230 Madhavaram @ CFS Continental Warehousing Corpn Ltd. ,Chennai(LOI was transferred to Continental Warehousing Corporation (Nhava Seva)Ltd. Navi Mumbai on 7.6.2010)
TN 09.08.2K F
231 Tuticorin @ CFS Raja Agencies TN 07.06.01 F 232 Manali @ CFS Indian Corporate Business Centre Ltd. TN 02.08.02 F 233 Tirupur @ CFS Continental Container Freight Station
Pvt.Ltd.(Continental Container Freight Station is converted into Continental Container Freight Stations Pvt.Ltd. vide their letter dated 20.6.10. This CFS has been amalgamated with Indev Logistics Private Ltd. With the approval of IMC held on 21.10.10)
TN 06.08.02 F
234 Tuticorin @ CFS K.S.P.S.Natarajan CFS Park Pvt. Ltd. TN 07.08.02 F 235 Tuticorin @ CFS Hari & Co. TN 16.08.02 F 236 Manali @ CFS Kailash Shipping Ser Pvt. Ltd. TN 08.11.02 F 237 Edyansavadu @ (Ponneri
Taluk) CFS M/s Triway CFS Pvt. Ltd. TN 22.11.02
F
238 Tirupur ICD Container Corporation of India Ltd. TN 07.05.03 F 239 Chennai @ CFS Vishrutha Logistics Ltd. TN 30.06.03 F 240 Coimbatore @ ICD Chettinad Logistics Pvt. Ltd. TN 26.09.03 F 241 Irugur ICD Container Corporation of India Ltd TN 24.11.04 F 242 Tuticorin @ CFS A S Shipping Pvt. Ltd. TN 17.05.05 F 243 Manali @ CFS Sattva Logistics Pvt. Ltd. TN 26.09.05 F 244 Chennai @ CFS Allcargo Movers (I) Pvt. Ltd. TN 06.03.06 F 245 Vallur Village Chennai@ CFS German Express Shipping Agency (India)
Pvt. Ltd. TN 06.03.06 F
246 Napalayam @ Chennai CFS PRK Container Freight Station Pvt. .Ltd. TN 11.05.06 C 247 Irrungattukottai,
Sriperumbudur@ CFS Glovis India Pvt.Ltd., Tamil Nadu
LoI issued to Hyundai Motor India Ltd. was cancelled on 1.1.10 and LOI was reissued to Glovis India (P) Ltd.on 1.1.10
TN 1.1.2010 F
248 Vichur Village, Chennai CFS Avanthi Logistics Pvt. Ltd. TN 29.06.06 C 249 Sadayankuppam Village
Chennai@ CFS GRR Logistics Pvt. Ltd. TN 26.07.06 C
250 Chennai @ CFS Chandra CFS and Terminal Operators Pvt. Ltd.
TN 26.07.06 F
251 Kattrambakkam Village Chennai @
ICD Sun Global Logistics Pvt. Ltd. TN 26.07.06 F
252 Irungattukottai Chennai@
ICD Indev Logistics Pvt Ltd. TN 26.07.06 F
253 Chennai @ CFS Devadoss Reddy Logistics Pvt. Ltd. TN 12.10.06 F 254 Tuticorin @ CFS Vilsons Container Terminal TN 15.05.07 F 255 Tuticorin @ CFS Continental Warehousing Corporation
(Nhava Seva) Ltd TN 15.05.07 F
256 Gummidipoondi@ Chennai CFS Durai Shipping & Services Pvt. Ltd., TN 15.05.07 C 257 Chrompet (Chennai) ICD Central Warehousing Corporation TN 02.08.07 F 258 Chennai @ CFS Ennore Cargo Containers Terminals Pvt.
Ltd. TN 10.02.05 F
259 Gounderpalayam@ CFS Seahorse Distribution and freight Services Pvt.Ltd
TN 03.03.08 C
260 Chennai@ CFS Maersk India Pvt.Ltd. TN 04.03.08 F

261 Vichur village@ CFS R.R.Distriparks (P) Ltd TN 08.04.08 C 262 Tuticorin@ CFS Diamond Shipping Agencies Pvt.Ltd.,
Tuticorin TN 4.6.2008 F
263 Chennai@ CFS Triway Warehouses and Holdings Pvt. Ltd. Chennai
TN 6.6.2008 C
264 Tuticorin@ CFS St. John Freight Systems Ltd. , Tuticorin TN 1.9.2008 C 265 MilavattanVillage,Tuticorin
@ CFS SICAL Distriparks Ltd TN 27.4.2009 F
266 Puzhal Village, Thiruvallur, Chennai @
CFS Calyx Container Terminal Pvt.Ltd., Mumbai
TN
19.8.09 F
267 Ponneri Taluk,Tiruvallur Distt. Near Ennore Port @
CFS Sattva Conware Pvt.Ltd. Chennai TN 1.1.2010 F
268 Madhavaram, Chennai @ CFS Thiru Rani Logistic Private Ltd.Chennai TN 11.2.2010 F 269 Kattupalli Port, ,Ponneri
Taluka,Thiruvallur Dist. T.N @
CFS L&T Shipbuilding Ltd.Chennai TN 2.6.2010 F
270 Attathangal/Nallur Village CFS Continental Warehousing Corporation (Nhava Seva), Navi mumbai
TN 18.10.10 F
271 Ambur,North Arcot District CFS Western Gateway Cargo Services Private Limited
TN 02.02.12 F
272 Hosur, Krishnagiri District ICD Pearl Port & Warehousing Pvt. Ltd. TN 31.05.12 F 273 Door No.121, Harbour
Express Road,Tuticorin CFS Chola Logistics Pvt.Ltd TN 20.6.12 F
274 Manali, Vaikadu Village, Chennai
CFS Sudharsan Logistics Pvt.Ltd. TN 12.11.12 F
275 Anuppampattu Village CFS Sical Multimodal and Rail Transport Ltd. TN 07.12.12 U.I 276 Tiruvottiyur, Chennai CFS STP
Services Private Limited TN 05.09.13 F
277 Central Warehousing Corporation
CFS Central Warehousing Corporation (LoI re-issued in the name of CWC from Chennai Port Trust vide letter No.16/14/2013-Infra-1, dated 10-03-2015 thus superceding LoI dated 17-12-2013)
TN 10-03-15 U.I
278 Trivallur, Chennai CFS NDR Infrastructure Pvt. Limited TN 26-09-14 U.I 279 Ayyanadaippu, Tuticorin @ CFS Prompt Terminals Pvt. Limited TN 14-09-15 UI 280 Madurai @ ICD Kern Enterprises Pvt. Ltd TN 04-08-16 UI 281 Ponneri Taluka, Thiruvallur
@ CFS Supply Chain Logistics TN 24-10-16 UI
282 Meelavattan village, Tuticorin
CFS A L S Tuticorin Terminal Pvt. Ltd. TN 13-02-17 UI
283 Kattupalli Village, Thiruvallur, Chennai
CFS Apollo World Connect Limited TN 30-03-17 UI
284 Hyderabad @ CFS Batco Integrated Logistics Pvt. Ltd. Telangana 24.09.04 F 285 Hyderabad CFS Telangana State Trade Promotion
Corporation Telangana 24.3.2008 U.I
286 Nagiredipalli Village@ ICD Tej Inland Container Depot (P) Ltd. Telangana 04.04.08 C 287 Hyderabad @ ICD All Cargo Global Logistics Ltd., Mumbai Telangana 2.9.2008 U.I 288 Mamidipally, Ranga Reddy
District, Hyderabad CFS Andhra Pradesh Trade Promotion
Corporation Ltd. Telangana 27.4.09 F
289 Thimmapur village,Distt. Mahaboob Nagar (T)
ICD Continental Multimodal Terminals Limited (Kribhco Continental Multimodel Logistic Park Ltd. was changed to Continental Multimodal Terminals Limited on 31.10.11)
Telangana 27.1.11 F
290 Kanpur CFS Central Warehousing Corporation UP
19.10.94 F
291 Varanasi CFS Central Warehousing Corporation UP
29.05.95 F
292 Agra ICD Container Corporation of India Ltd. UP
29.05.95 F
293 Saharanpur CFS Central Warehousing Corporation UP
10.05.96 F
294 Dadri, Greator, Noida CFS Container Corporation of India Ltd. UP
10.11.97 F
295 Kanpur @ CFS Container Corporation of India Ltd. UP
17.09.98 F
296 Loni ICD Central Warehousing Corporation UP
17.09.98 F
297 Bhadohi ICD Central Warehousing Corporation UP
17.09.98 F
298 Surajpur,G.Noida ICD Central Warehousing Corporation UP
13.04.99 F
299 Dadri @ CFS Star Track Terminal Pvt. Ltd., UP 14.01.04 F

300 Dadri @ CFS Albatross CFS Pvt. Ltd. UP 08.02.05 F 301 Dadri @ CFS Trident Terminals Pvt. Ltd. UP 10.02.05 F 302 Madhosingh
(Mirzapur) ICD Container Corporation of India Ltd. UP
17.05.05 F
303 Dadri @ CFS CMA CGM Logistics Park (Dadri) Pvt. Ltd.
UP
20.02.06 F
304 Dadri,Greater Noida @ ICD Allcargo Logistics Park Private Ltd.Mumbai
UP
5.1.2009 F
305 Loni (Ghaziabad) @ ICD Worlds window Infrastructure and Logistics Pvt.Ltd. New Delhi
UP
20.8.09 U.I
306 Panki @ ICD Kanpur Logistics Park Pvt.Ltd. New Delhi UP
10.6.10 F
307 Tehsil-khurja, Dist. BulandShahar, U.P.
ICD M/s Arshiya Northern Domestic Distriparks Ltd.
UP
20.03.13 F
308 Modi Nagar, U.P. ICD Kribhco Infrastructure Ltd. UP 14.06.13 U.I 309 Kashipur US Nagar ICD Kashipur Infrastructure and Freight
Terminal Pvt. Ltd. Uttarakhand
05.09.13 F
310 Pantnagar, Uttarakhand
ICD SIDCUL, CONCOR Uttarakhand 06.03.14 F
311 Calcutta@ CFS Balmer Lawrie & Co. Ltd. WB 13.07.92 F 312 Calcutta CFS Central Warehousing Corporation WB
15.10.92 F
313 Haldia CFS Central Warehousing Corporation WB
09.01.96 F
314 Haldia @ CFS A L Logistics Pvt. Ltd. WB 27.05.03 F 315 Durgapur @ ICD Allied ICD Services Ltd. WB 08.02.05 F 316 Khidderpore@ CFS Century Plyboards(I) Ltd. Kolkata WB
8.9.2008 F
317 JJP Yard, Kidderpore, Kolkata @
CFS Century Plyboards(I) Ltd. Kolkata WB 12-09-08 F
318 Majerhat, Khidderpore CFS CONCOR WB
27.4.09 F
319 Haldia @ CFS Apeejay Infralogistics Pvt.Ltd. Kolkata WB
1.1.10 F
320 Haldia @ CFS Ralson Petrochemicals Ltd. WB 4.1.11 F 321 Dighasipur, Distt.
Purba Medinipur @ CFS Five Star Container Terminals Pvt. Ltd. WB
25.07.11 C
322 Haldia @ CFS LCL Logistix (India) Pvt.Ltd WB 12.11.12 F 323 New Paharpur Road,
Santoshpur, Maheshtala @
CFS Phonex Logistics Pvt. Ltd WB 14-09-15 F
324 Khidirpur, Kolkata @ CFS Trans World Terminals Private Limited WB 24-10-16 UI
****

GOVERNMENT OF INDIA MINISTRY OF COMMERCE & INDUSTRY
(DEPARTMENT OF COMMERCE)
LOK SABHA UNSTARRED QUESTION NO. 1277
TO BE ANSWERED ON 24th JULY, 2017
PREFERENTIAL TRADE AGREEMENTS 1277. DR. SANJAY JAISWAL:
Will the Minister of COMMERCE & INDUSTRY (वािण य एवं उ योग मतं्री ) be
pleased to state:
(a) whether the Government has expanded Preferential Trade Agreements with many countries;
(b) if so, the details thereof; (c) whether the Government is considering to offer incentives to companies for boosting
exports to those countries with which the Government has expanded Preferential Trade Agreements; and
(d) if so, the details thereof ?
ANSWER
okf.kT; ,oa m|ksx jkT; ea=h ¼Jherh fueZyk lhrkje.k½ ¼Lora= izHkkj½
THE MINISTER OF STATE IN THE MINISTRY OF COMMERCE AND INDUSTRY (INDEPENDENT CHARGE)
(SMT. NIRMALA SITHARAMAN) (a) & (b): Yes Madam, the government has recently expanded two Preferential Trade Agreements, namely, Chile and Asia Pacific Trade Agreement (APTA). The India-Chile Preferential Trade Agreement of March, 2006 was further expanded on 6th September 2016, according to which India and Chile have offered to each other concessions on 1031 and 1784 tariff lines respectively. The 4th Round of tariff concessions under Asia Pacific Trade Agreement (APTA) was concluded on 13th January 2017, according to which tariff concessions on specified lines based on Margin of Preference have been offered by member countries to each other. The first Round of APTA was entered into force in 1975 and the current membership of APTA includes Bangladesh, China, India, Lao PDR, Republic of Korea, and Sri Lanka. Both the Agreements will come into force subject to completion of internal procedures.
(c)&(d) There are no specific schemes for promoting exports under these two Agreements, however, exporters can avail of the existing export promotion schemes for boosting exports to the countries covered under the two Agreements.
*****

GOVERNMENT OF INDIA MINISTRY OF COMMERCE & INDUSTRY
(DEPARTMENT OF COMMERCE)
LOK SABHA UNSTARRED QUESTION NO. 1302
TO BE ANSWERED ON 24th JULY, 2017
MERGER OF DGFT WITH CBEC 1302. SHRI B. VINOD KUMAR
Will the Minister of COMMERCE & INDUSTRY (वािण य एवं उ योग मतं्री ) be
pleased to state:
(a) whether the Government is working on a proposal to merge the Directorate General of Foreign Trade (DGFT) with the Central Board for Excise and Customs (CBEC) to promote ease of doing business for exports and imports;
(b) if so, the details thereof; and (c) the present status of the said proposal?
ANSWER
okf.kT; ,oa m|ksx jkT; ea=h ¼Jherh fueZyk lhrkje.k½ ¼Lora= izHkkj½
THE MINISTER OF STATE IN THE MINISTRY OF COMMERCE AND INDUSTRY (INDEPENDENT CHARGE)
(SMT. NIRMALA SITHARAMAN)
(a): No, Madam. (b)&(c): Do not arise in view of reply to (a) above.
***

GOVERNMENT OF INDIA MINISTRY OF COMMERCE & INDUSTRY
(DEPARTMENT OF COMMERCE)
LOK SABHA UNSTARRED QUESTION NO. 1315
TO BE ANSWERED ON 24th JULY, 2017
COMPANY FOR GeM 1315. SHRIMATI MEENAKASHI LEKHI:
Will the Minister of COMMERCE & INDUSTRY (वािण य एवं उ योग मतं्री ) be
pleased to state:
(a) whether the Ministry is planning to set up a company to operate the Government e-Marketplace(GeM) which is a platform for procurement of goods and services by different Ministries and departments;
(b) if so, the details thereof; and (c) the progress made in this regard?
ANSWER
okf.kT; ,oa m|ksx jkT; ea=h ¼Jherh fueZyk lhrkje.k½ ¼Lora= izHkkj½
THE MINISTER OF STATE IN THE MINISTRY OF COMMERCE AND INDUSTRY (INDEPENDENT CHARGE)
(SMT. NIRMALA SITHARAMAN)
(a) & (b) Yes Madam, on 12th April 2017, the Union Cabinet gave approval for setting up of Government e-Marketplace Special Purpose Vehicle (GeM SPV) as a 100% Government owned Section 8 Company, under the Department of Commerce. The GeM shall act as the National Public Procurement Portal and the SPV shall set-up, operate and maintain the GeM system for procurement of goods and services by Government organizations. The GeM SPV shall be provided a grant of Rs 200 Crore over a period of 2 years by the Government and thereafter it shall be self-sustaining. The SPV shall have a 7 member Board of Directors and it shall be manned by both Government officials on deputation as well as professionals hired from the market.
(c) The GeM SPV was incorporated as a Section 8 Company on 17th May 2017. CEO
of GeM has been appointed and is in place since 21st June 2017.
********

GOVERNMENT OF INDIA MINISTRY OF COMMERCE & INDUSTRY
(DEPARTMENT OF COMMERCE)
LOK SABHA UNSTARRED QUESTION NO. 1339
TO BE ANSWERED ON 24th JULY, 2017
BAN ON IMPORT OF STAINLESS STEEL 1339. SHRI PRAHLAD SINGH PATEL:
Will the Minister of COMMERCE & INDUSTRY (वािण य एवं उ योग मतं्री ) be
pleased to state:
(a) whether the Government is aware that blanket ban on imports of stainless steel materials is reportedly choking the capital good industry due to unavailability of quality substance of new age grades and the sizes in domestic market in the country;
(b) if so, the details thereof; (c) whether the Government has received any petition regarding the above mentioned matter; (d) if so, details thereof and the action was taken by the Government thereon; and (e) the steps taken/proposed to be taken by the Government for domestic production of the
above said steel in the country?
ANSWER
okf.kT; ,oa m|ksx jkT; ea=h ¼Jherh fueZyk lhrkje.k½ ¼Lora= izHkkj½
THE MINISTER OF STATE IN THE MINISTRY OF COMMERCE AND INDUSTRY (INDEPENDENT CHARGE)
(SMT. NIRMALA SITHARAMAN)
(a) : There is no ban on import of stainless steel materials under Foreign Trade Policy,
2015-20.
(b) : Does not arise.
(c) & (d): Yes Madam. Process Plant and Machinery Association of India (PPMAI) has recently submitted representation suggesting, inter alia, a blanket ban on import of stainless steel products. A blanket ban on import is not feasible as it will be WTO incompatible. However, anti-dumping duty is already in place since October, 2012 on imports of Stainless Steel Cold Rolled Flat Products of 400 series having width below 600 mm originating in/exported from European Union, Republic of Korea and the USA for 5 years. In June, 2015, Govt imposed anti-dumping duty on imports of Hot Rolled Flat Products of Stainless Steel of grade 304 of width up to 1650 mm from China, Malaysia and Republic of Korea for 5 years. Further, in December 2015, anti-dumping duty was imposed on imports of Cold Rolled Stainless Steel Flat Products having width of 600 mm to 1250 mm originating in/exported from PR China, Republic of Korea, European Union, South Africa, Taiwan (Chinese Taipei), Thailand and the USA for a period of 5 years.

(e): Government has released the National Steel Policy 2017, which has laid down the broad roadmap for encouraging long term growth for the Indian steel industry. To address the issue of quality, Ministry of Steel has issued Stainless Steel (Quality Control) Order, dated 10 June, 2016 covering 3 Stainless Steel Flat Products. This Order also prohibits production, import & distribution of sub standard products of stainless steel, thereby making the quality steel available for the end users.

GOVERNMENT OF INDIA MINISTRY OF COMMERCE & INDUSTRY
(DEPARTMENT OF COMMERCE)
LOK SABHA UNSTARRED QUESTION NO. 1363
TO BE ANSWERED ON 24th JULY, 2017
EXPORT OF SEAFOOD 1363. PROF. K.V. THOMAS:
MOHAMMED FAIZAL:
Will the Minister of COMMERCE & INDUSTRY (वािण य एवं उ योग मतं्री ) be
pleased to state:
(a) the total quantity and value of seafood and seafood products exported from the country during the last five years;
(b) the steps taken/being taken by the Government to boost the export of seafood items from the country;
(c) whether the Government has any plan to export special tuna fish (Mas) from Lakshadweep and if so, the details thereof; and
(d) whether the Government has received representations from Lakshadweep Administration and others in this regard and if so, the details thereof along with the reaction of the Government thereto?
ANSWER
okf.kT; ,oa m|ksx jkT; ea=h ¼Jherh fueZyk lhrkje.k½ ¼Lora= izHkkj½
THE MINISTER OF STATE IN THE MINISTRY OF COMMERCE AND INDUSTRY (INDEPENDENT CHARGE)
(SMT. NIRMALA SITHARAMAN)
(a) The total quantity and value of seafood and seafood products exported from India during the last 5 years is as below:
Year Quantity of export (in Metric Tons)
Value
Rs. in Crore US$ in million 2012-13 928215 18856.26 3511.67 2013-14 983756 30213.26 5007.70 2014-15 1051243 33441.61 5511.12 2015-16 945892 30420.83 4687.94 2016-17 1134948 37870.90 5777.61
(b) The Government through Marine Product Export Development Authority (MPEDA) is extending technical and financial assistance in the capture fisheries sector to develop the infrastructure facilities for the fishing, processing, value addition and export of seafood products. MPEDA is also supporting the Aquaculture sector to increase the production of export oriented aquaculture through various technical/financial assistance schemes, research & development and extension activities.

(c) & (d) MPEDA has received representations from the Hon’ble Member of Parliament of Lakshadweep and Lakshadweep Co-operative Marketing Federation Ltd. requesting for better export markets for “Masmin” (dried smoked tuna product). A meeting in this regard was convened by MPEDA on 06.01.2017 inviting the exporters and some central/state fisheries agencies. Based on the discussions in the meeting, a survey about the resources and infrastructure facilities in the island was done. On the request of exporters, MPEDA office at Lakshadweep is following up the matter with the local administration to make available the necessary infrastructure for the processing and storage of Tuna for initiating export of the same.
*****