Gonçalo André Martins Ribeiro Dissertation submitted as ...
78
MACROECONOMIC DETERMINANTS OF INTERNATIONAL CURRENCIES: BOND SHARES AFTER THE INTERNATIONALIZATION OF THE RENMINBI Gonçalo André Martins Ribeiro Dissertation submitted as partial requirement for the conferral of Master in Economics Supervisor: Prof. Luís Filipe Martins, Assistant Professor, ISCTE Business School, Departments of Quantitative Methods for Business and Economics Co-supervisor: Prof. Alexandra Ferreira-Lopes, Assistant Professor, ISCTE Business School, Department of Economics October 2016
-
Upload
khangminh22 -
Category
Documents
-
view
0 -
download
0
Transcript of Gonçalo André Martins Ribeiro Dissertation submitted as ...

MACROECONOMIC DETERMINANTS OF INTERNATIONAL CURRENCIES:
BOND SHARES AFTER THE INTERNATIONALIZATION OF THE RENMINBI
Gonçalo André Martins Ribeiro
Dissertation submitted as partial requirement for the conferral of
Master in Economics
Supervisor:
Prof. Luís Filipe Martins, Assistant Professor, ISCTE Business School, Departments of
Quantitative Methods for Business and Economics
Co-supervisor:
Prof. Alexandra Ferreira-Lopes, Assistant Professor, ISCTE Business School,
Department of Economics
October 2016

II
Resumo
A presente dissertação analisa o contributo das variáveis macroeconómicas na quota-
parte das moedas do SDR Basket – CNY, EUR, GBP, JPY e USD – no mercado de
obrigações internacionais. Foram extraídos dados para as emissões de obrigações a nível
internacional e utilizados dados trimestrais de 2009Q3 a 2015Q4, de modo a captar o
período após a internacionalização do Renminbi (CNY) no mercado de obrigações
offshore. Adicionalmente, com base no país da empresa-mãe, definimos três regiões
para cada moeda: (i) América; (ii) Europa e (iii) Ásia, Oceânia e África.
Foi utilizado um sistema baseado num modelo de Seemingly Unrelated Equations
(SURE) e rejeitadas as hipóteses de independência dos erros entre equações e da
homogeneidade dos parametros. Os resultados mostram que a quota-parte das
obrigações internacionais é influenciada pela dimensão da economia, pelas taxas de
inflação e pelo spread de taxas de juro. Além disso, os resultados sugerem que os
determinantes não apresentam um padrão homogéneo. Os coeficientes estimados
diferem não só entre moedas mas também entre regiões da mesma moeda. Os nossos
resultados indicam que a expansão da economia Chinesa suporta a internacionalização
da moeda em todas as regiões e que o USD detém um estatuto distinto que ainda não foi
atingido por nenhuma outra moeda.
Palavras-Chave: Moedas Internacionais, Obrigações Internacionais, SUR, Determinantes
Macroeconómicas da Procura Internacional de Moeda.
JEL Codes: G15, F40, F41

III
Abstract
This dissertation analyses the macroeconomic variables that determines the currencies’
shares in the international bond market, for the five currencies of the SDR Basket:
CNY, EUR, GBP, JPY, and USD. We collect data for bond issuances at an international
level and we use quarterly data between 2009Q3 and 2015Q4, in order to cover the
period after the internationalization of the Renminbi (CNY) in the offshore bond
markets. Additionally, based on the country of the parent company, we define three
regions for each currency: (i) America; (ii) Europe and (iii) Asia, Oceania and Africa.
We use a system-based model of Seemingly Unrelated Equations (SURE) and reject the
hypotheses of independence of the errors across equations and parameters’ equality
across equations. The results show that the share of international bonds is influenced by
the size of the economy, by inflation rates and by the yield spread. Moreover, they
suggest that the determinants do not present a homogenous pattern. The estimated
coefficients differ not only between currencies but also between regions under the same
currency. Our results indicate that the expansion of the Chinese economy is likely to
support the internationalization of the currency across all regions and that the USD has
a distinctive role that has not yet been achieved by any other currency.
Keywords: International Currencies; International Bonds, SUR, Macroeconomic Determinants
of International Currencies
JEL Codes: G15, F40, F41

IV
Acknowledgements
First and foremost, I would like to thank my supervisors, Professor Luís Martins and
Professor Alexandra Ferreira-Lopes, who walked with me through this journey and
gave me tremendous support, insights, comments and motivation to move forward.
This dissertation concludes a chapter in my life, one more that I am proud to complete.
But all the effort, all the sweat and success I dedicate to Paula Alexandra de Sousa
Martins, Rui Fernando Esteves Ribeiro and Catarina de Sousa Martins Ribeiro. May
this achievement be yours as well, as much as it is mine. I am grateful to you, because I
am nothing more than the product of all your characters and values as human beings
dosed and mixed with my personal measures. You are the foundation of my personality.
I know we will never walk alone. I love you from the bottom of my heart.
I want to thank Helle Sanden for the support, patience and for all the love that she gives
me, which is so essential for me. I will never be able to put into words how much I love
and care about you, but I hope I will have an infinite number of years to try this difficult
task. Always by your side.
I would like to thank to Duarte Gonçalves for everything I learned with you during
these 5 years, for all the conversations and tips, but above all for your truly friendship,
you made me a better person, a better human being. I will always be with you no matter
what.
I would also like to thank to Diogo Baltazar for all the patience and insightful comments
that helped me a lot during this dissertation, and all my colleagues from the Investment
Department of Fidelidade. Special words for Mafalda Alves and Dr. Alfredo Falcão that
in many moments understood that this project was important for me.

V
Contents
1. Introduction ............................................................................................................................. 1
2. Literature Review ................................................................................................................... 3
2.1. The Three Functions of Money ........................................................................... 3
2.2. Determinants of Currencies’ International Use ................................................... 5
2.3. Factors Influencing Currency Choice in Debt Issuance ...................................... 7
2.4. The Concept of International Bonds ................................................................... 9
2.5. Why the International Bond Market? ............................................................... 11
3. Data and Methodology ........................................................................................................ 13
4. The Evolution of International Bonds after the Internationalization of the Renminbi
..................................................................................................................................................... 20
5. Empirical Results ................................................................................................................. 31
6. Conclusions ........................................................................................................................... 38
References ................................................................................................................................. 41
A. Annexes ...................................................................................................................... 45
Annex 1: Correlation Matrix of Residuals ...................................................................... 45
Annex 2: Market Types from Bloomberg ....................................................................... 49
Annex 3: Exchanges on Bloomberg for each of the Currencies ..................................... 50
Annex 4: Currencies Used in the Total Amount of International Bonds ....................... 53
Annex 5: Example of the Matrix Output from Bloomberg ............................................. 54
Annex 6: Details of the Database .................................................................................... 55
Annex 7: Countries and Regions for each Currency ....................................................... 58
Annex 8: Cross-Equation Coefficient Tests .................................................................... 64

VI
Annex 9: Amounts Issued in a Given Currency per Region ........................................... 66
List of Figures
Figure 1: RMB Offshore Bond Issuances ....................................................................... 13
Figure 2: Total Amount of International Bonds .............................................................. 20
Figure 3: Aggregate Share of the 5 SDR Currencies ..................................................... 21
Figure 4: Amount Issued by Currency from European Agents ....................................... 22
Figure 5: EUR and USD Percentage among European Agents ....................................... 23
Figure 6: Percentage of the Amount Issued for European Agents .................................. 24
Figure 7: EUR/USD Comparison among European Agents ........................................... 25
Figure 8: Amount issued by Agents from America ......................................................... 26
Figure 9: Percentage of the Amount issued by Agents from America ............................ 27
Figure 10: EUR/USD Comparison among Agents from America .................................. 28
Figure 11: Amount issued by Agents from Asia, Oceania and Africa ............................ 29
Figure 12: Percentage of the Amount Issued by Agents from Asia, Oceania and Africa
......................................................................................................................................... 29
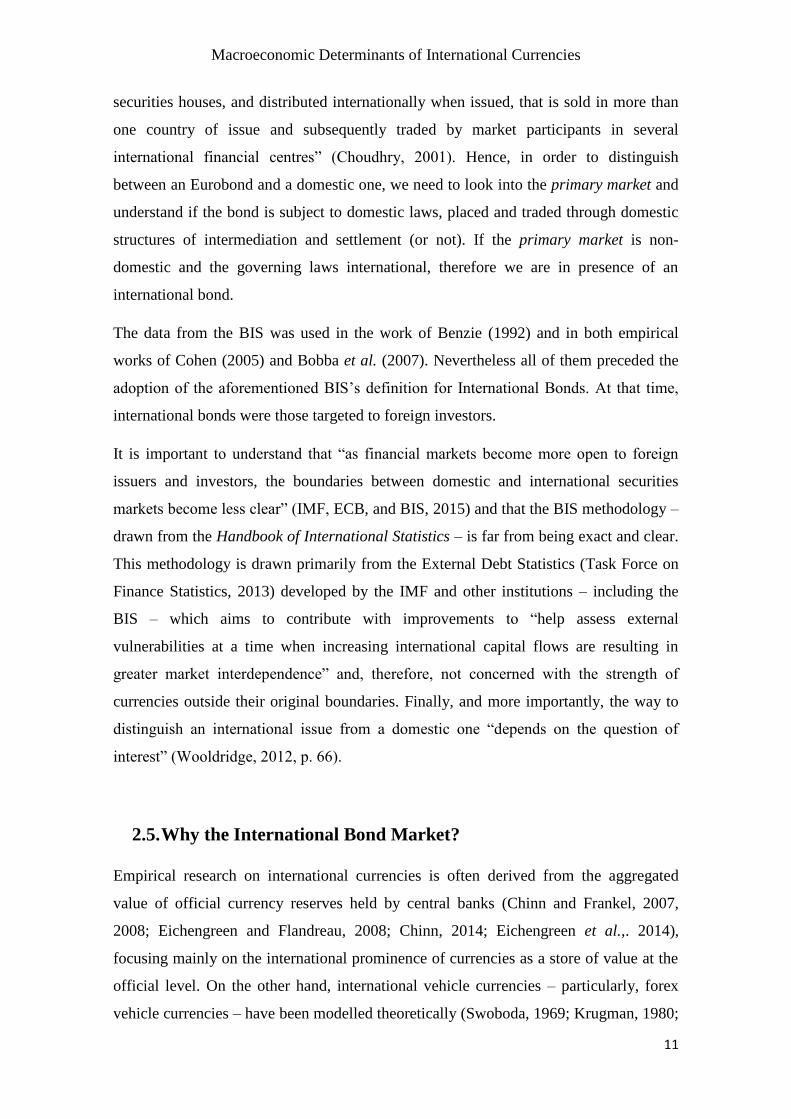
Figure 13: Percentage of the Amount Issued by Agents from Asia, Oceania and Africa,
except the USD ................................................................................................................ 30
Figure 14: CNY amount issued per region ...................................................................... 66
Figure 15: USD amount issued per region ...................................................................... 66
Figure 16: EUR amount issued per region ...................................................................... 67
Figure 17: JPY amount issued per region ........................................................................ 67
Figure 18: GBP amount issued per region....................................................................... 68

VII
List of Tables
Table 1: Correlation between GDP Share and Bilateral Trade Share ............................. 31
Table 2: SUR Model 1 - Share of International Debt with GDP Share........................... 32
Table 3: SUR Model 2 - Share of International Debt with Bilateral Trade Share .......... 33
Table 4: Model 1 – Correlation Matrix of Residuals....................................................... 45
Table 5: Model 2 – Correlation Matrix of Residuals....................................................... 47
Table 6: Market Types on Bloomberg ............................................................................. 49
Table 7: List of Domestic Exchanges per Currency ........................................................ 50
Table 8: List of Currencies ............................................................................................. 53
Table 9: USD Issuances per Ulimate Parent Country ..................................................... 54
Table 10: Details of the Database .................................................................................... 55
Table 11: Details of the GDP Variable Used .................................................................. 57
Table 12: Countries per Currency ................................................................................... 58
Table 13: GDP Share Coefficient Testing ....................................................................... 64
Table 14: Bilateral Trade Share Coefficient Testing ....................................................... 64
Table 15: Coefficient Testing Between Regions ............................................................. 65

VIII
List of Abbreviations
BIS – Bank of International Settlements
CNY – Chinese Renminbi
ECB – European Central Bank
EUR – Euro
FDI – Foreign Direct Investment
FGLS – Feasible Generalized Least Squares
GBP – British Pound
GDP – Gross Domestic Product
IMF – International Monetary Fund
IMS – International Monetary System
JPY – Japanese Yen
MTN – Medium Term Note
SDR – Special Drawing Rights
SPV – Special Vehicle Purpose
SRCH – Bloomberg’s Fixed Income Search Function
SUR – Seemingly Unrelated Regressions
SURE – Seemingly Unrelated Equations
USD – US Dollar

IX

X

Macroeconomic Determinants of International Currencies
1
1. Introduction
On November 30th
2015, the International Monetary Fund (IMF)’s Executive Board
decided to include the Chinese Renminbi (CNY) in the Special Drawing Rights (SDR)
Currency Basket as the fifth currency alongside with the US Dollar (USD), the
Eurozone Euro (Euro), the British Pound (GBP) and the Japanese Yen (JPY). This was
the major change that occurred on the 2015’s five-year revision of the SDR Currency
Basket. Effective on October 1st 2016, the inclusion of the Renminbi in the SDR Basket
represents the beginning of a new era for the Chinese Currency and for the International
Monetary System (IMS). There are two factors that support its inclusion in the Currency
Basket. Firstly, the rise of China as one of the world’s largest exporters in the five year
period that preceded the review. Secondly, the Renminbi is now considered “freely
usable” according to the definition stated on the IMF’s Articles of Agreement: “A freely
usable currency means a member’s currency that the Fund determines (i) is, in fact,
widely used to make payments for international transactions, and (ii) is widely traded in
the principal exchange markets.” (Article XXXf, IMF, 2016). Based on the factors
determining the currencies weight in the SDR Basket, the CNY will represent, on
October 1st 2016, 10.92% of the SDR Currency Basket surpassing the JPY (down from
9.4% in 2010 to 8.33% in 2015) and the GBP (down from 11.3% in 2010 to 8.09% in
2015)1.
This dissertation aims to analyse the international role of the five currency units of the
SDR Basket and to understand what economic and financial factors drive the use of
these currencies at the international sphere. We study the period after the introduction of
the Renminbi in the offshore bond markets and we make use of data from the
international bond market, which include both public and private issues of bonds at the
international level. We explore the use of currencies as a store of value and unit of
account. We aim to understand if the economic and financial factors that influence the
share of international currencies have the same impact over the share of each of the five
currencies or, on the other hand, if the impact differ depending on the currency in
question. Additionally, we segregate the issuances of each currency by regions,
according to the region of the issuer of the bond, to capture if the determinants that
1 The USD represents 41.73% (41.9% in 2010) and the Euro 30.93 (37.4% in 2010).
Macroeconomic Determinants of International Currencies
2
influence each of the currencies’ shares also differ by geographic regions from which
the issuers belong.
We use a system-based model of Seemingly Unrelated Equations (SURE) and reject the
hypothesis of independence of the errors across equations. Since contemporaneous
correlation exists across the equations of the model we therefore estimate the model
using the feasible generalized least squares (FGLS) estimator, thus obtaining more
precise point estimates for the parameters.
The results suggest that the determinants of international bonds shares do not present a
homogenous pattern. There is heterogeneity between currencies and also between
different regions for the same currency. Determinants such as the GDP share of
currency’s country, the bilateral trade share between the currency’s country and the
region of the issuer, inflation and yield spread are statistically significant.
We find that one of the measures of the size of the economy, the GDP share of the
currency i’s country, has a positive impact over the share of international bonds among
issuers from the region of the currency i. In other words, the share of bonds issued by
agents that belong to the region of the currency tend to increase when the share of the
GDP of the currency’s country increases. Furthermore, the results indicate that the
impact of determinants such as the size of the economy or the stability of a currency
show a clear dichotomy, with negative GDP share coefficients for the share of bonds
issued by agents outside the region of the currency. For the USD, the inflation rates
present positive coefficients for the shares issued by American issuers but negative
otherwise. We find out that the expansion of the Chinese economy is likely to support
the internationalization of the currency across all regions and, finally, we conclude that
the USD still is a distinctive reference currency at a global level.
The dissertation is structured as following. In the next section, Section 2, we review the
literature on international currencies and international bonds. We start by looking to the
three functions of money, then we look at the determinants that influence both
international currencies shares and international bond shares, and we conclude this
section be revisiting and reviewing the concept of international bonds itself and
understanding what justifies the study of bonds to measure international currency
strength. In Section 3 we describe the data and methodology applied and we terminate
with a descriptive analysis of the data that we collect. In Section 4, we present the

Macroeconomic Determinants of International Currencies
3
empirical results of our models using the system of SUREs. Section 5 derives the
conclusions.
2. Literature Review
In this section, we start by looking to the three functions of money in their private and
public uses. In section 2.2., we review the economic and financial determinants that
influence the use of one currency at an international level. Additionally, in order to
analyse the particular dimension of bonds, we complete the list of determinants
influencing international currencies with those that influence the issuance of
international bonds (section 2.3). In Section 2.4., we discuss the concept of international
bonds, its changes through time and which bond types integrate this category of
issuances. Finally, in section 2.5., we connect the literature on international currencies
with the research that uses bonds to study the strength of the currencies outside their
domestic area, while justifying the use of international bonds.
2.1. The Three Functions of Money
It is well established among economists that money encompasses three fundamental
roles: medium of exchange, unit of account, and store of value. Furthermore, these roles
were subsequently divided into private and official uses, to emphasize the differences
between the use operated by private agents and by official institutions, respectively
(Cohen, 1971; Krugman, 1984). An international currency is, therefore, one that plays
the traditional aforementioned roles at the international level. With the establishment of
international economic relationships as a fundamental cornerstone of modern economic
development, the choice of what currency is used in such transactions started to be
analysed by economists (Kindleberger, 1967; Swoboda, 1968, 1969; Cohen, 1971;
Hakkio, 1973; McKinnon, 1979; Krugman, 1980, 1984; Blinder, 1996; Chinn and
Frankel, 2007).
Medium of Exchange
A third currency used to mediate economic transactions between importers and
exporters is a vehicle currency, functioning as a medium of exchange. In international
transactions between two countries with small economies, it can be convenient for both

Macroeconomic Determinants of International Currencies
4
to settle trade through a foreign trade vehicle currency, in order to diminish transaction
costs based on the strategic externalities (e.g., a large percentage of international trade
with the country of the vehicle currency) or economies of scale (a large community
widely using and accepting the vehicle currency) that the vehicle currency might be able
to provide (Matsuyama et al., 1993).
Similarly, a currency can be used as a “forex vehicle currency” (Hartmann, 1998),
which is another important dimension of an international currency. In other words, the
forex vehicle currency plays the medium of exchange role by mediating the trade of two
other currencies in financial markets – more concretely, in the foreign exchange (forex)
market.
At the official level, a vehicle currency would be the currency used by Central Banks to
intervene in the foreign exchange markets and influence exchange rates or sustain an
official parity. McKinnon (1979) in his seminal work, discusses why it does not exist a
system of “symmetrical multiple interventions by each central bank in all convertible
currencies”, showing that the international system – at an official level – also tends to
rely on one currency.
Unit of Account
The medium of exchange function is often linked with the unit of account function
(Krugman, 1984). At a private level, a currency functions as an invoicing currency
whenever it is used to denominate trade or financial transactions. At the official level,
countries can peg their domestic currencies to a foreign one in order to reduce exchange
rate uncertainty by fixing the exchange rate with that currency.
Store of Value
Finally, the last function of money is to serve as a store of value. A currency that is
widely used internationally, often presents a stable value with relatively low volatility,
enabling both private and official agents to hold it, without losing wealth through
constant corrosives processes of devaluation (Chinn and Frankel, 2008, p. 57; Cohen,
2005). Therefore, functioning as an investment or reserve currency.
Macroeconomic Determinants of International Currencies
5
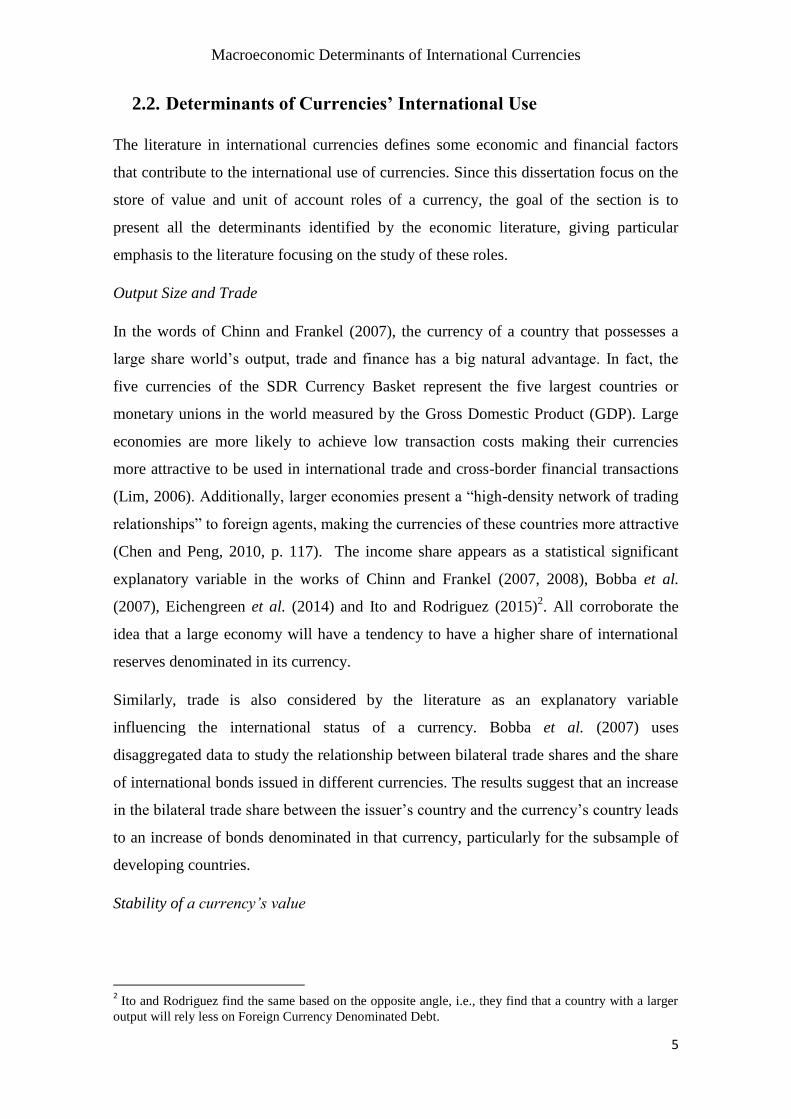
2.2. Determinants of Currencies’ International Use
The literature in international currencies defines some economic and financial factors
that contribute to the international use of currencies. Since this dissertation focus on the
store of value and unit of account roles of a currency, the goal of the section is to
present all the determinants identified by the economic literature, giving particular
emphasis to the literature focusing on the study of these roles.
Output Size and Trade
In the words of Chinn and Frankel (2007), the currency of a country that possesses a
large share world’s output, trade and finance has a big natural advantage. In fact, the
five currencies of the SDR Currency Basket represent the five largest countries or
monetary unions in the world measured by the Gross Domestic Product (GDP). Large
economies are more likely to achieve low transaction costs making their currencies
more attractive to be used in international trade and cross-border financial transactions
(Lim, 2006). Additionally, larger economies present a “high-density network of trading
relationships” to foreign agents, making the currencies of these countries more attractive
(Chen and Peng, 2010, p. 117). The income share appears as a statistical significant
explanatory variable in the works of Chinn and Frankel (2007, 2008), Bobba et al.
(2007), Eichengreen et al. (2014) and Ito and Rodriguez (2015)2. All corroborate the
idea that a large economy will have a tendency to have a higher share of international
reserves denominated in its currency.
Similarly, trade is also considered by the literature as an explanatory variable
influencing the international status of a currency. Bobba et al. (2007) uses
disaggregated data to study the relationship between bilateral trade shares and the share
of international bonds issued in different currencies. The results suggest that an increase
in the bilateral trade share between the issuer’s country and the currency’s country leads
to an increase of bonds denominated in that currency, particularly for the subsample of
developing countries.
Stability of a currency’s value
2 Ito and Rodriguez find the same based on the opposite angle, i.e., they find that a country with a larger
output will rely less on Foreign Currency Denominated Debt.

Macroeconomic Determinants of International Currencies
6
In order to perform a role as an international store of value, economic agents need to
have confidence in the value of a currency. Stability is an important factor, so that
investors and economic agents do not see the value of their assets erase. Chinn and
Frankel (2007) empirical results suggests that exchange rate volatility and relatively
high inflation levels influence negatively the share of a currency’s international share as
a store of value. Similarly, Cohen (2005), studying the international bond market,
concludes that the issuance of international bonds tends to be higher for strong
currencies. However, in Bobba et al. (2007), inflation has a very low positive impact
over the share of international bonds and it is statistically significant only for developed
countries.
The results obtained by Bobba et al (2007) reveal that, although inflation contributes to
undermine currency’s value, higher inflation levels can benefit the share of bonds issued
in that currency, particularly, at an international level. Despite the fact that unstable
currencies are associated with higher risk and therefore higher interest rates for issuers,
it can still be possible to reduce costs by issuing in a foreign currency that presents high
inflation levels. Hence, explaining the positive impact of inflation in debt issuances at
an international level.
Financial Markets Development
The development and deepness of financial centres of a country has been recognized as
one of the major factors driving the ascendance of one currency’s international use
(Eichengreen et al.,. 2014). With the sophistication of domestic financial markets, the
increase in liquidity and the expansion of the available financial instruments, it is likely
that international actors will rely on the currencies of countries where financial markets
are liquid, broad, and diverse. Also, historically, the two main international currencies
of the XXth
century, the British Pound and the US Dollar, were backed by the most
developed financial centres at the time, London and New York, respectively (Lim
2006). Nevertheless, studying empirically the deepness and development of financial
centres it is a difficult task. The most broadly used proxy to capture financial markets
development is foreign exchange turnover. Chinn and Frankel (2007, 2008), Frankel
(2012), Lee (2014), and Chinn (2014) use the triannual data of foreign exchange
turnover from BIS as a proxy, using a log-linear interpolation method between
observations. Eichengreen et al. (2014), studying foreign public debt issuance in the
XXth
century, and Eichengreen and Flandreau (2008) use bank assets relative to the

Macroeconomic Determinants of International Currencies
7
GDP as a proxy for financial depth. Ito and Rodriguez (2015) use gross domestic
savings as a ratio to GDP and total private credit creation to examine the development
of financial markets. Finally, the stock market capitalization is also considered as an
alternative to measure of financial market development in the work of Chinn and
Frankel (2008).
Persistence and Network Externalities
Many economists, such as Eichengreen and Mathienson (2000), Lim (2006), and Chinn
and Frankel (2007), stress the importance of path-dependency and emphasize that
reserve currencies are unlikely to change dramatically. However, this does not mean
that a change of the leading international currencies do not occur, but rather that – if it
happens – it will occur gradually. There is a deep consensus that “an international
currency, like a domestic currency, is more useful when others use it.” (Chinn and
Frankel, 2007, 2008; Frankel, 2012; Eichengreen et al.,. 2014, p. 14), making
economies of scope also an important factor regarding the international use of
currencies. Despite the evidence that changes in international currency status do not
occur rapidly, the fact that one currency can perform different international roles and
reinforce itself help to support Chinn and Frankel’s belief that international currencies
can be considered a tipping phenomenon (Chinn and Frankel, 2008), i.e., the derivative
of currency’s use with respect to its determinants might be greater when one currency
overcomes and surpasses the other. Hence, they can accelerate the shift in the
international order.
2.3. Factors Influencing Currency Choice in Debt Issuance
Summing up to the aforementioned determinants, we also consider some specific
factors that may influence the choice of issuance currency in international debt
securities. The issuance of bonds across national borders appeared as a result of the
willingness of economic agents to diversify characteristics of the assets issued for
financing purposes or held as a financial asset (Benzie, 1992), and the increasing
globalization and capital mobility “encourage borrowers to utilise bond markets outside
their country of residence” (1992). Under this context, which that contributed to the
expansion of cross-border debt issuance, two main factors influence the choice of the

Macroeconomic Determinants of International Currencies
8
issuance currency: risk management considerations and borrowing costs minimizations
(Cohen, 2005).
Interest Rate Differential
One factor that influences currency choice in the issuance of international bonds is the
possibility to reduce borrowing costs. The cost of borrowing money through financial
markets is the yield that investors demand in the moment of raising debt. Since the
yields offered by corporations in a given currency will be affected by the benchmark
interest rate in that currency, the proxy used by the literature to measure borrowing
costs are differences in benchmark government bond yields. Cohen (2005) uses the 10-
year yield differentials and Bobba et al. (2007) use one-year interest rate differentials
between the dollar and the other currencies. An increase in government bonds’ interest
rate tend to increases corporate bonds’ yields, following the government benchmark
curve and maintaining the risk premium. However, it is also true that the government
bond interest rate depends on the monetary and fiscal policies adopted by the country
and, of course, by their creditworthiness. Therefore, interest rate differential might arise,
for instance, in virtue of divergent monetary policies of different central banks.
It must be stressed that in a world with no transaction costs and perfect information both
Uncovered Interest Parity (UIP) and the Covered Interest Parity (CIP) would always
prevail, since any deviation from those parities would be exploited by economic agents
through an arbitrage process. McBraddy and Schill (2007) study this issue empirically
and find that agents without hedging motives take advantage of international foreign-
currency bonds to exploit advantages and minimize borrowing costs. Additionally, they
find that bond issuance tend to occur after periods of appreciation of a given currency
and that consequently, on average, the issuance of that bonds precedes a period of
devaluation (2007).
Habib and Joy (2008) present the most complete study regarding uncovered and
covered interest parity. They use bond-data to verify the existence of deviations from
the equilibrium parities and their significance for the issuance of foreign-currency
denominated debt. Habib and Joy concerns are not with the total amount issued but
rather with the total number of bonds issued in foreign currency. Hence, issues
regarding currencies’ dominance at an international level are not addressed.
Nevertheless, the results obtained by Habib and Joy provide microeconomic empirical

Macroeconomic Determinants of International Currencies
9
evidence that can support results at the aggregate level. They find that issuers take
advantage of uncovered interest parity deviations and conclude that they will prefer to
issue in lower yield currencies. However, they also state that “issuance does not respond
in a consistent manner to expected depreciation of the issuance currency” (2008), which
is contrary to the findings obtained by Mcbraddy and Schill (2007).
Hedging Motives
Firms that possess assets or revenues in a given currency can decide to issue in that
given currency in order to hedge the income generated and overcome exchange rate
risks. This “natural hedge” allows firms to avoid currency mismatches between assets
and liabilities and international bonds denominated in the main currencies are often used
by firms from developing countries as a risk management tool. Although evidence that
the presence of foreign operations leads firms to issue in foreign currency arise from
firm-level studies (Keloharju and Niskanen, 2001; Allayannis et al.,. 2002; Kedia and
Mozumdar, 2003; Esho et al.,. 2007; Clark and Judge, 2009), Cohen (2005) takes into
account this evidences and uses investment growth as a proxy to capture the use of
international bonds in a given currency to hedge future cash-flows from real assets
(2005, p. 59).
2.4. The Concept of International Bonds
The definition of what might be considered an international bond is far from being
consensual. The Bank of International Settlements (BIS), the institution that publishes,
since the 1980’s, statistics on debt capital markets, defines International Debt Securities
as “debt securities issued in a market other than the local market of the country where
the borrower resides. They capture issues conventionally known as Eurobonds and
foreign bonds”3.
In 2012, the BIS proceeded to a revision of the definition of an international bond in
order to harmonize their statistics with the standards existent in the Handbook on
Securities Statistics (see the latest version from the IMF, the ECB, and the BIS in 2015).
The institution faces contemporary conceptual challenges in the definition of what is an
3 See www.bis.org/statistics/about_securities_stats.htm.

Macroeconomic Determinants of International Currencies
10
international bond (Wooldridge, 2012). On the basis of these conceptual changes is the
evolution of the debt securities markets.
In the 1980’s, the international bonds were a measure of a country’s level of debt held
by foreign investors, i.e., it was a proxy for foreign portfolio investment (Wooldridge,
2012). However, with the integration of financial markets and the liberalization of
capital flows, foreign investors can access domestic markets as well as domestic
investors can use international markets. Consequently, international bonds as they were
defined, cannot, nowadays, accomplish its initial purpose of functioning as a proxy of
foreign portfolio investment. Moreover, other metrics and accountability techniques
appeared that perform better that role (see, for instance, the Balance of Payments and
International Investment Position Statistics from the IMF).
The BIS “no longer refers to the targeted investor base [as before the revision] and
instead focuses on the primary market, i.e., the market where securities are issued for
the first time” (Wooldridge, 2012). Thus, international bonds are “those issued in a
market other than the local market of the country where the borrower resides”
(Wooldridge, 2012). BIS’s International Debt Securities, therefore, compare two
factors: the country where the borrowers reside and the market where the bond was
issued. It does not take into account the currency of denomination, i.e., a US company
issuing a US Dollar bond can be considered an international bond as long as this bond is
issued in a country other than the US.
To better grasp what the BIS takes into account we look closely to the definitions of
foreign bonds and Eurobonds. Foreign bonds are bonds denominated in a currency other
than the one used in the issuer’s country, independently of the market were they are
issued. They are also called Foreign-Currency Denominated Bonds4. The criterion used
is whether the issuer’s country is the one of the currency of issuance or not, rather than
the primary market where the security was issued. Consequently, there are foreign
bonds issued on both domestic and non-domestic markets.
Eurobonds are bonds issued offshore, independently of the currency of issuance – in
relation to the issuer’s country, the currency can be either domestic or non-domestic. A
Eurobond is an instrument of debt issued through “a syndicate of issuing banks and
4 Although some authors use the old and narrower definition of foreign bonds: bonds issued in domestic
markets by non-residents, in the same currency of the market were the bond is issued (Choudhry, 2001)
Macroeconomic Determinants of International Currencies
11
securities houses, and distributed internationally when issued, that is sold in more than
one country of issue and subsequently traded by market participants in several
international financial centres” (Choudhry, 2001). Hence, in order to distinguish
between an Eurobond and a domestic one, we need to look into the primary market and
understand if the bond is subject to domestic laws, placed and traded through domestic
structures of intermediation and settlement (or not). If the primary market is non-
domestic and the governing laws international, therefore we are in presence of an
international bond.
The data from the BIS was used in the work of Benzie (1992) and in both empirical
works of Cohen (2005) and Bobba et al. (2007). Nevertheless all of them preceded the
adoption of the aforementioned BIS’s definition for International Bonds. At that time,
international bonds were those targeted to foreign investors.
It is important to understand that “as financial markets become more open to foreign
issuers and investors, the boundaries between domestic and international securities
markets become less clear” (IMF, ECB, and BIS, 2015) and that the BIS methodology –
drawn from the Handbook of International Statistics – is far from being exact and clear.
This methodology is drawn primarily from the External Debt Statistics (Task Force on
Finance Statistics, 2013) developed by the IMF and other institutions – including the
BIS – which aims to contribute with improvements to “help assess external
vulnerabilities at a time when increasing international capital flows are resulting in
greater market interdependence” and, therefore, not concerned with the strength of
currencies outside their original boundaries. Finally, and more importantly, the way to
distinguish an international issue from a domestic one “depends on the question of
interest” (Wooldridge, 2012, p. 66).
2.5. Why the International Bond Market?
Empirical research on international currencies is often derived from the aggregated
value of official currency reserves held by central banks (Chinn and Frankel, 2007,
2008; Eichengreen and Flandreau, 2008; Chinn, 2014; Eichengreen et al.,. 2014),
focusing mainly on the international prominence of currencies as a store of value at the
official level. On the other hand, international vehicle currencies – particularly, forex
vehicle currencies – have been modelled theoretically (Swoboda, 1969; Krugman, 1980;

Macroeconomic Determinants of International Currencies
12
Black, 1991; Matsuyama et al., 1993; Devereux and Shi, 2013), but there are scarce
empirical evidence (Hartmann, 1998; Flandreau and Jobst, 2009, among the few).
Regarding the unit of account function, examples of empirical evidence can be found in
the works of Calvo and Vegh (1992) and Goldberg and Tille (2008).
Currency considerations derived from the denomination of international bonds can be
found in the work of Cohen (2005), Bobba et al. (2007), Chitu and Eichengreen (2012)
and Ito and Rodriguez (2015). Cohen (2005) tries to understand the determinants of
aggregate issuance of international debt securities, using data from the BIS. Bobba et al.
(2007), investigate the determinants of international currency choice in the context of
the creation of the Euro. Chitu and Eichengreen (2012) investigate when the dollar
surpassed the pound as the leading international currency using the bond market as a
reference. Finally, Ito and Rodriguez (2015) use foreign-currency public debt to
investigate the factors that drive the issuance of debt, with an emphasis not on the
currencies’ international strengthen but rather on the issuance country’s idiosyncrasies
that justify its reliance on foreign debt at the government level.
Despite economists’ preference towards international official reserves as the main
instrument to help us explain the relevance of international currencies, there are reasons
to believe that other accountabilities should be explored to complement the analyses and
results obtained through the study of the amount of central banks’ official reserves.
By studying the international bond market, essentially we are studying two roles of a
given currency. First, the use of a currency as an investment currency and therefore its
capacity to be a leading store of value. Secondly, it measures the capacity of a currency
to function as unit of account, allowing agents (both private and public) to quote debt in
that currency. Moreover, as mentioned previously, with higher volume of debt in a
given currency, it becomes more likely for a currency to emerge as a forex vehicle
currency, contributing to the success of the currency as a medium of exchange in
financial markets. Therefore, by studying the issuance of international bonds we are
able to cover a wider perspective that encompass more than a single role and takes into
account the private sphere of financial markets.
Additionally, other arguments unveil the importance of the bond market. Mehl et al.
(2004) argue that “with increasing capital mobility, central bank reserve holdings and
interventions are smaller in volume than private transactions in international financial

Macroeconomic Determinants of International Currencies
13
markets and are likely to have less bearing on a currency’s international status”, adding
that bonds play an important role due to the size and volume of the market. Moreover,
the majority of the foreign reserves held by central banks are foreign assets, namely
bonds, because even though the main goal is to intervene in the exchange markets,
central banks want to get some return meanwhile. Hence, they hold very liquid assets
that give support to the exchange market interventions. As Ma and Yao (2015) state,
“currency markets on their own are the largest financial markets, but currency trades
typically involve bond purchases and sales. Thus what we mean by a liquid and actively
traded currency is primarily one backed by a big and liquid bond market”.
At the end of the XXth
century, it was already set the idea that financial transactions
were important and its magnitude contributed significantly to the definition of the IMS.
Blinder (1996), conceived that, even though historically “the market’s choice of an
international reserve currency has followed the patterns of trade”, in the modern world,
financial considerations could became more relevant. Thus, at the end of the XXth
century, the vast majority of international transactions stemmed from trade in assets
rather than trade in goods (Blinder, 1996). This pattern did not change. It did not change
the prominence of financial markets in international exchange nor the importance of
international bond markets. The transition to an economy less dependent on banking as
a source of finance is occurring slowly not only in developed countries but also in
emerging markets, particularly in Latin America (Powell 2014; Turner 2014).
3. Data and Methodology
The dissertation covers the period after the internationalization of the CNY. Although
the first issuance occurred in 2007, between the last quarter of 2008 and the third
quarter of 2009 there was no issuances (see Figure 1). Therefore, our analysis starts in
the third quarter of 2009, the date from which the CNY offshore bonds have been issued
ever since. We collect data for the five currencies of the SDR for 26 quarters, with the
sample ending in the last quarter of 2015. The data was extracted from the Bloomberg
Terminal.

Macroeconomic Determinants of International Currencies
14
Figure 1: RMB Offshore Bond Issuances
Our main goal is to understand if the aforementioned macroeconomic determinants
affect differently the currencies of interest and across different regions and, therefore,
we estimate a system of equations with a Seemingly Unrelated Equations (SUR)
developed in a first moment by Zellner (1962). The model is composed by 15 equations
representing the different share of international bonds for each currency/region
combination possible (i,j). The shares vary through time and are modelled as follows:
𝐷𝑒𝑏𝑡 𝑆ℎ𝑎𝑟𝑒𝑖𝑗𝑡 = 𝑎𝑖𝑗 + 𝛽1𝑖𝑗𝐺𝐷𝑃 𝑆ℎ𝑎𝑟𝑒𝑖𝑡 + 𝛽2𝑖𝑗𝑇𝑟𝑎𝑑𝑒 𝑆ℎ𝑎𝑟𝑒𝑖𝑗𝑡 + 𝛽3𝑖𝑗𝑆𝑡𝑎𝑏𝑖𝑙𝑖𝑡𝑦𝑖𝑡
+ 𝛽4𝑖𝑗𝑀𝑎𝑟𝑘𝑒𝑡 𝐶𝑎𝑝𝑖𝑡 + 𝛽5𝑖𝑗𝑆𝑝𝑟𝑒𝑎𝑑𝑖𝑡 + 𝛽6𝑖𝑗𝐹𝐷𝐼𝑖𝑡 + 𝑢𝑖𝑗𝑡
𝑖 = 𝐶𝑁𝑌; 𝐸𝑈𝑅; 𝐺𝐵𝑃; 𝐽𝑃𝑌; 𝑈𝑆𝐷
𝑗 = 𝐴𝑚𝑒𝑟𝑖𝑐𝑎; 𝐸𝑢𝑟𝑜𝑝𝑒; 𝐴𝑠𝑖𝑎, 𝑂𝑐𝑒𝑛𝑖𝑎 𝑎𝑛𝑑 𝐴𝑓𝑟𝑖𝑐𝑎
𝑡 = [2009𝑄3; … ; 2015𝑄4]
Where Debt Share is the share of international bonds in currency I issued by agents in
region j at time t, GDP Share is the share of the GDP of the currency i’s country at time
t, Trade Share is the average bilateral trade share between the currency i’s country and
the countries of the region j at time t, Stability is measured using two different variables

Macroeconomic Determinants of International Currencies
15
in different regressions: the average inflation rate of the quarter and currencies volatility
against the SDR of the currency i’s country at time t, Market Cap is the market
capitalization share of currency i’s country at time t in world’s total market
capitalization, Spread is the difference between the interest rate of the benchmark
government bond of currency i’s country and the US government yield with the same
maturity, and FDI is the Foreign Direct Investment in each of the currency i’s local
economy at time t. More details about all these variables are provided bellow.
The SUR model allows the errors to be correlated between different equations in the
same period in time, that is, 𝐸(𝑢𝑖𝑗𝑡𝑢𝑘𝑙𝑡) ≠ 0. Since our dependent variable is measured
in percentages, bounded between zero and one, and since increases in one share imply
decreases in at least one of the remaining shares, the estimation method allows us to
investigate the correlation and the relationship between the errors of the different shares,
something we cannot do by using individual regressions nor with panel data methods.
Additionally, since the dependent variable is bounded between zero and one, we apply a
logarithmic transformation which allows us to use standard linear regression methods,
in line with Chinn and Frankel (2008) and Bobba et al (2007). Hence, the new
dependent variable is now 𝑙𝑜𝑔 (𝐷𝑒𝑏𝑡 𝑆ℎ𝑎𝑟𝑒𝑖𝑗𝑡
1−𝐷𝑒𝑏𝑡 𝑆ℎ𝑎𝑟𝑒𝑖𝑗𝑡). We test different specifications of the
model, making use of two different measures of the size of the economy and two
measures of stability in a currency.
A. Dependent Variable
As mentioned previously, the dependent variable used to study the international role of
currencies is the share of international bonds issued in a given currency. The definition
we intend to use is closely related with the one used by the BIS. We use Bloomberg as a
platform to help us differentiate international bonds from domestic ones. There are few
tools we can take advantage of to better discriminate between the two forms of debt.
First, we will make use of the Bloomberg Field “Market Type” which allows us to
understand if the market is Domestic (e.g. Domestic, Domestic MTN, US Domestic,
etc.) or International (e.g. Euro MTN, Euro Non-Dollar, Global, etc.). Secondly, we use
the field “Exchange Code” to understand if the bond was issued through a Domestic
Exchange or not, when compared with the country of the currency of issuance.
Therefore all bonds with a Market Type International and issued through Non-Domestic
Exchanges are considered as international. Additionally, we include issues from non-

Macroeconomic Determinants of International Currencies
16
domestic agents which present an “International” Market Type and a domestic
Exchange Code, in relation with the currency of issuance. Since the focus of the
dissertation is on the currencies, we decided to include this second group of issuances
which, although placed in multiple exchanges included domestic ones, are issued by
non-residents. The focus is not on the relation between issuer country vs. market of
issuance but rather between currency vs. issuer and currency vs. market of issuance.
The amount of international currencies has been collected from Bloomberg using the
function SRCH, which allows downloading data about bonds. We have selected all
asset classes (government and corporate) and all the securities (outstanding and
matured). After that we filtered by “Market Type” and selected the bonds that presented
the following market type: Euro-MTN, Euro Non-Dollar, Euro-Dollar, Global,
Bulldog5, Samurai
6, Shogun
7, Yankee
8 or US Non-Dollar. The full list of subfields can
be found in Annex 1.
Then, two different filters were applied in order to collect all bonds considered as
international (Eurobonds or Foreign Bonds): (1) Bonds in a given currency exchanged
through markets other than those of the currency’s country issued by all agents9; (2)
Bonds in a given currency exchanged through the exchanges of the currency’s country
and issued by non-domestic agents10
. The full list of domestic exchanges for each
currency can be found in Annex 2.
Examples of the first filter are euro-denominated bonds issued through an American
exchange by a German entity or a euro-denominated bonds issued through an American
exchange by an American firm. Both counting as International Bonds denominated in
euros. Examples of the second filter are euro-denominated bonds issued in a European
exchange by an American or a Japanese firm, whereas euro-denominated bonds issued
by European agents through a European exchange are not considered as international
bonds.
After this selection process, which is done individually for each currency presented in
the study, we run the command results on Bloomberg.
5 Pound-denominated bond issued in the United Kingdom by non-British institutions
6 Yen-denominated bond issued in Tokyo by non-Japanese entities.
7 Foreign-currency bonds issued in Japan by non-Japanese entities.
8 Dollar-denominated bonds issued in US by non-American entities
9 Presented in the next section of this dissertation as the bonds issued “out”.
10 Presented in the next section of this dissertation as the bonds issued “in”.

Macroeconomic Determinants of International Currencies
17
Then we use tab matrix, available on Bloomberg, to adjust the results to our goals and
export them to excel. The tab matrix shows us a matrix with the date in the first column,
allowing the remaining columns to be defined based on the user’s preferences –
constrained to the Bloomberg fields available, e.g. exchange code; issuer country,
industry, etc. These columns will be important, since it allows us to segregate the
amount issued per country.
Each of the cells of the matrix present the amount issued or outstanding in the
respective period.
We choose the quarterly time length, we use the Ultimate Parent Country of Risk as the
Bloomberg field to define each of the columns of our matrix and we measured the
amount issued (not the outstanding) converted to USD using the exchange rate of the
period. The Ultimate Parent Country of Risk field returns the country of the ultimate
parent company that issued the bond11
. We choose the ultimate parent in detriment of
the issuer’s country since in a considerable number of cases, the issuer is a Special
Vehicle Purpose (SPV) created only with a purpose of issuing debt and incorporated in
offshore countries. By choosing the ultimate parent company we avoid considering the
country of the SPVs in our sample. An example of the structure of the Excel output
obtained through the matrix tab can be found in Annex 5
In order to produce a share, we take into account all international bonds issued by
issuers from a specific region regardless the currency of issuance:
𝐷𝑒𝑏𝑡 𝑆ℎ𝑎𝑟𝑒𝑖𝑗𝑡 =𝐷𝑒𝑏𝑡𝑖𝑗𝑡
∑ 𝐷𝑒𝑏𝑡𝑖𝑗𝑡𝑁𝑖=1
𝑖 = 𝐶𝑁𝑌; 𝐸𝑈𝑅; 𝐺𝐵𝑃; 𝐽𝑃𝑌; 𝑈𝑆𝐷
𝑗 = 𝐴𝑚𝑒𝑟𝑖𝑐𝑎; 𝐸𝑢𝑟𝑜𝑝𝑒; 𝐴𝑠𝑖𝑎, 𝑂𝑐𝑒𝑛𝑖𝑎 𝑎𝑛𝑑 𝐴𝑓𝑟𝑖𝑐𝑎
𝑡 = [2009𝑄3; … ; 2015𝑄4]
Where Debt is the amount issued. The full list of currencies that were used can be found
in Annex 4.
B. Independent Variables
11
Throughout the dissertation, when we mention issuer, it is the Ultimate Parent Company of issuance
that we are mentioning.

Macroeconomic Determinants of International Currencies
18
Next, we describe each of the independent variables used in the model. The full list of
the variables and its details can be found in Annex 5.
1. GDP Share
In order to measure the size of the economy of the currency’s country we constructed
the GDP share on the G20 total GDP12
of each of the five economies under study. The
GDP share of each country is the quarterly real GDP value in USD, with 2010 as the
base year. All time series with a different base year were transformed using the OECD
deflator. All time series denominated in other currencies were transformed into dollars
using the average annual exchange rate of the given currency against the dollar in the
base year. The full detailed list of the GDP variables used can be found in Annex 6.
2. Bilateral Trade Share
The trade share is also conceived by Chinn and Frankel (2008) as a measure of the size
of the economy. Therefore, in line with Bobba et al. (2007), we intend to capture a third
dimension by introducing a bilateral trade share between the currency’s country and the
region of the issuer. In Bobba et al. (2007) they use country-level data to produce
bilateral trade shares. In our case we produce regions instead of country level data, since
our quarterly data at a country-level presented a considerable portion of zeros for the
CNY. Hence, in order to avoid this issue, we built 3 regions: Europe, America and Asia,
Oceania and Africa. The regions represent the total amount of issues from countries that
belong to that specific region. The countries that are included in each region can be
found in Annex 6 (naturally they differ across currencies).
The data was collected from the bilateral trade historical series database developed by
the research center CEPII. We take the average bilateral share of all the countries that
composes the respective regions in each currency:
𝐵𝑖𝑙𝑎𝑡𝑒𝑟𝑎𝑙 𝑇𝑟𝑎𝑑𝑒 𝑅𝑒𝑔𝑖𝑜𝑛𝑡 = ∑ 𝐵𝑖𝑙𝑎𝑡𝑒𝑟𝑎𝑙 𝑇𝑟𝑎𝑑𝑒 𝑆ℎ𝑎𝑟𝑒 𝐶𝑜𝑢𝑛𝑡𝑟𝑦𝑖𝑡
𝑛𝑖=1
𝑁𝑢𝑚𝑏𝑒𝑟 𝐶𝑜𝑢𝑛𝑡𝑟𝑖𝑒𝑠
Additionally, since the data is annual, we use the value obtained for the last quarter of
the year and we interpolate linearly for the remaining quarters. Following Bobba et al.
(2007), we use lagged trade in order to avoid reverse-causality.
12
The G20 total GDP sums the Real GDP of all the G20 countries except Saudi Arabia, due to lack of
data.

Macroeconomic Determinants of International Currencies
19
3. Inflation Rate
We use currency i’s country seasonally adjusted monthly year-on-year inflation rate
data. Then we compute the average inflation value of the quarter using the monthly
data13
. The last observation of the quarter was also tested in detriment of the averaged
value. Data for the UK and China were seasonally adjusted using Eviews. Final remark,
the inflation rate for the currency i’s country do not vary with region.
4. Volatility Against the SDR
We collect data for the volatility against the SDR basket using the IMF International
Financial Statistics. We use the monthly exchange rates of each currency against the
SDR from which we calculate the standard deviation of the quarter.
5. Market Capitalization
We use market capitalization data produced by Bloomberg to create shares for each of
the currency i’s country. As a denominator, we use world market capitalization also
produced by Bloomberg. To the Eurozone, we compute the sum of the market
capitalization of each of the nineteen countries of the Euro Area.
6. Spread
In order to analyse borrowing costs, we use 5-year government bond yields of each of
the currencies’ country and compute their differences against US Government Bonds. In
the case of the USD, the spread between the German Bonds and US Government Bonds
is used.
7. FDI
We decided to use a variable that could enable us to test the existence of hedging
motives at an aggregate level. We decided to include the foreign direct investment
growth in the currency’s country. We seasonally adjusted all the data using Eviews.
13
We tested models with both averaged value and using the last observation of the quarter and the results
were identical without any significant difference. Since the R-Squared were higher in models with the
first, we kept the averaged value.

Macroeconomic Determinants of International Currencies
20
4. The Evolution of International Bonds after the
Internationalization of the Renminbi
In this section we describe the evolution of the share and amount of international bonds
for the five currencies of the SDR Basket. The analysis starts with an overall look into
the dynamic of the aggregate amount of international bonds issued and, in a second
moment, derives a deeper descriptive analysis by segregating the amount issued per
region.
Between the third quarter of 2009 and the last quarter of 2015, the total amount of
international bonds issued averaged $672.2675 Billion USD per quarter. It reached a
maximum of $918.0832 Billion USD in the first quarter of 2012, right after the two
quarters with the lowest amount of international securities issued: the third quarter of
2011 and the minimum in the last quarter of 2011 ($495.655 Billion USD) – see Figure
2. Figure 2 aggregates the total amount of international bonds issued for all the
currencies available on Bloomberg. The complete list of currencies can be found in
Annex 3.
Figure 2: Total Amount of International Bonds

Macroeconomic Determinants of International Currencies
21
The dominance of the five currencies of the SDR in the international scene is evident.
The majority of international bonds are issued in one of the 5 currencies under study.
Altogether, between the third quarter of 2009 and the end of 2015, the five currencies of
the SDR basket always represented more than 86% of the total of international
issuances – see Figure 3 –, reaching a maximum of 93.44% of the amount issued in the
second quarter of 2015. On average, during this period, 90.55% of the amount issued
was denominated in one of these currencies.
Figure 3: Aggregate Share of the 5 SDR Currencies
Despite the dominance of the five currencies of the SDR, the extent of their dominance
differs depending on the location of the issuer agent. Based on the ultimate parent
country of risk, we consider three geographic areas: (i) Europe, (ii) Asia & Oceania &
Africa and (iii) America14
.
14
Including North, Central, and South America

Macroeconomic Determinants of International Currencies
22
1. Europe
Among European agents, the Dollar and the Euro were the two main currencies of
issuance. During the period under study, the average amount issued per quarter was
$112.80 Billion and $91.81 Billion, for the Dollar and Euro, respectively (see figure 4).
Figure 4: Amount Issued by Currency from European Agents
Three interesting data points need to be mentioned. In the first quarter of 2011, with the
sovereign crisis undergoing, there was a need for European Agents to search for
financing sources in USD. The amount issued increased more than 100 USD Billion
from 85.35 USD Billions to 186.289 USD Billions. The increased amount was mainly
issued outside the Eurozone (see figure 7, left graph). Similarly, in the first quarter of
2012, during the sovereign crisis, there was a sharp increase in the amount issued by
European Agents, although this time both EUR and USD denominated issuances surged
– a similar movement occurred in the GBP amount. Finally, despite the upturn in the
beginning of 2015, the indirect impact of the QE actions promoted by the ECB over the
international bond market seem to have been reduced. In particular, when compared
with the two data points mentioned previously.

Macroeconomic Determinants of International Currencies
23
It is possible to see that the euro and the dollar together always represented more than
80% of the issuances among European agents (see figure 5). Consequently, the
issuances in the other three currencies of the SDR Basket are of a reduced number
among European agents. Of the three remaining currencies, only the GBP represented
more than 10% of the issuance during the period under study (and solely for two
consecutive quarters). The pound, the yen, and the Renminbi averaged 8.88%, 2.87%,
and 0.38%, respectively (figure 6).
Figure 5: EUR and USD Percentage among European Agents

Macroeconomic Determinants of International Currencies
24
Figure 6: Percentage of the Amount Issued for European Agents
Notably, the dollar overwhelmed the euro, on average, during the period under study.
However, the euro denominated bonds show an upward trend since the second quarter
of 2012 that helped to close the gap between the euro and the dollar and enable the euro
to end 2015 as the first rank currency among European agents. This upward trend was
obtained due to the increase in the amount of euro-denominated bonds listed in
exchanges inside the euro-zone (see figure 7, left graph). Hence, more than showing the
recovery of the euro against the dollar as an international currency among European
agents, these international bonds issued by agents from outside the Eurozone also reveal
that the Euro-area is being more widely used as an international financial centre.

Macroeconomic Determinants of International Currencies
25
Figure 7: EUR/USD Comparison among European Agents
2. America
If we look only for international bonds issued by American agents, we can conclude that
the dollar remains the main currency despite the constant downward trend that started in
2010 (see figure 8). On average, the agents from countries of the North, Central, and
Latin America issued $147.46 Billion of dollar-denominated international bonds. It
represented more than 80% of the issuances of international bonds from American
agents until the second quarter of 2013, falling sharply afterward and reaching a
minimum of 48.12% in the third quarter of 2015.

Macroeconomic Determinants of International Currencies
26
Figure 8: Amount issued by Agents from America
The decrease in the share of the dollar is justified by the increase in the share of euro-
denominated international bonds among American issuers. If we take into account all
the period under study, the second most important international currency among
American issuers averaged $22.23 Billion per quarter in issuances. On the other hand,
between the second quarter of 2013 and the last quarter of 2015, the average amount of
euro-denominated international bonds was $38.60 Billion whereas the average value of
the dollar falls drastically to $95.54 Billion. The euro share of international issuances
among American agents reached a maximum of 42.29% in the third quarter of 2015,
falling sharply again in the last quarter of 2015 (see figure 9).

Macroeconomic Determinants of International Currencies
27
Figure 9: Percentage of the Amount issued by Agents from America
It is also possible to observe that the sharp increase in the issued amount of euro-
denominated international bonds by American agents occurred due to an increase in the
issuances inside the euro-area, while the issuances in exchanges outside the euro-area
maintained a stable pattern (see figure 10, left graph). On the other hand, the decrease in
the issuances of dollar-denominated bonds among American agents happened as a result
of the continuous decline of the international bonds issued outside the United States of
America (see figure 10, graph on the right). Thus, it is possible to conclude that
American agents are issuing less dollar-denominated international bonds outside USA
and issuing more euro-denominated international bonds through euro-area exchanges.
Among the American agents the other three currencies of the SDR basket represent a
tiny share of the total of international bonds issued. On average, between 2009 and
2015, the British pound, the Japanese yen, and the Chinese Renminbi represented
together only 4.1% of the issuances.

Macroeconomic Determinants of International Currencies
28
Figure 10: EUR/USD Comparison among Agents from America
3. Asia & Oceania & Africa
The majority of the international debt issued by agents from Asia, Oceania, and Africa
is dollar-denominated (see figure 11 and 12). The share of the dollar-denominated
international bonds averaged 74.65% of the total issuances by agents from these
regions. The average amount of dollar-denominated bonds during this period was
$79.59 Billion and, although it registered a slight upward trend between 2009 and 2015,
its share decreased. The decrease in the overall shared occurred mainly due to the
emergence of Renminbi-denominated international bonds. Although the amount of
Renminbi-denominated bonds is still reduced when compared with the dollar, two
interesting facts are worth mentioning. First, the Chinese currency was able to be the
currency with the second largest share of international bonds issued by agents from
Asia, Oceania, and Africa, surpassing the euro in 14 periods out of the 26 (see figure
13). Second, the share of Renminbi-denominated bonds reached 22.97% of the
issuances of agents of this region in the first quarter of 2014 and averaged 9.18%, while

Macroeconomic Determinants of International Currencies
29
the euro-denominated securities represented 9.58% on average between 2009 and 2015,
only 0.4% more on average than issues in Renminbi.
Figure 11: Amount issued by Agents from Asia, Oceania and Africa
Figure 12: Percentage of the Amount Issued by Agents from Asia, Oceania and Africa
Macroeconomic Determinants of International Currencies
30
Figure 13: Percentage of the Amount Issued by Agents from Asia, Oceania and Africa,
except the USD

Macroeconomic Determinants of International Currencies
31
5. Empirical Results
In this section we present the results derived from the SUR Model. Although in the first
moment, our goal was to produce a unique SUR Model to model the shares of
international bonds per currency and across regions, we were forced to take another path
and take two specifications. The two measures of the size of the economy, the GDP
share and the Bilateral Trade Share, present high levels of correlation for some
currencies (see Table 1). In order to avoid problems with multicollinearity, we compute
two different specifications, one with the GDP share and the other one with the bilateral
trade share as a covariate for all equations but maintaining the two in those equations
where the correlation is less than 0.8, in absolute value.
Table 1: Correlation between GDP Share and Bilateral Trade Share
i = CNY i = EUR i = GBP i = JPY i = USD
GDP
Share
currency
CNY
GDP
Share
currency
EUR
GDP
Share
currency
GBP
GDP
Share
currency
JPY
GDP
Share
currency
USD
Currency i Bilateral Trade Share
- Europe (t-1) 0.9691 0.8199 0.4888 0.5535 -0.4725
Currency i Bilateral Trade Share
- America (t-1) 0.9483 0.9652 0.6804 0.4728 0.6592
Currency i Bilateral Trade Share
- Asia, Oceania and Africa (t-1) 0.9904 0.9759 0.9040 0.5886 0.8561
Tables 2 and 3 estimation was adjusted for small samples using STATA options that
report small sample statistics and the estimated covariance of the disturbances.
Table 2 presents the results when considering the GDP share for all equations as a
measure of the size of the economy. The Market Capitalization shares and the FDI are
not statistically significant and therefore dropped from the estimated model.
Furthermore, the specification takes inflation as a variable for stability, since volatility
against the SDR appears to be not statistically significant.

Macroeconomic Determinants of International Currencies
32
Table 2: SUR Model 1 - Share of International Debt with GDP Share
Note: Obtained using STATA command sureg <varlist>, small dfk corr
Variables CNY - America
CNY – Europe
CNY - Asia, Oceania
and Africa
EUR - America
EUR - Europe
EUR - Asia, Oceania
and Africa
GBP - America
GBP - Europe
GBP - Asia, Oceania
and Africa
JPY - America
JPY - Europe
JPY - Asia, Oceania
and Africa
USD - America
USD - Europe USD - Asia, Oceania
and Africa
GDP Share 163.9*** 120.1*** 65.25*** -119.0*** 26.87*** -36.91 -1,250*** -123.8 216.0 -116.9*** 51.75** 161.2*** 105.7*** -18.65* 64.76*** (42.27) (19.52) (8.662) (18.03) (8.890) (33.84) (373.1) (110.1) (345.0) (27.08) (20.82) (27.75) (26.99) (10.13) (16.56)
Bilateral
Trade (t-1) 445.5*** -81.41** -241.4 392.7 -157.8** 8.713 10.32
(154.2) (34.23) (158.1) (275.5) (75.77) (31.77) (24.53) Inflation 0.964*** 0.480*** 0.266*** -0.981*** 0.0412 -0.461** -0.486*** 0.0907** -0.250* -0.168*** 0.139*** 0.117* 0.407*** -0.101*** -0.0346
(0.266) (0.124) (0.0535) (0.0999) (0.0420) (0.196) (0.131) (0.0406) (0.143) (0.0639) (0.0454) (0.0633) (0.0637) (0.0221) (0.0494) Spread -0.494 0.924*** 0.529*** 0.919*** -0.439*** 0.705* 0.809 -0.151 -0.107 0.520*** 0.235** 0.657*** -0.554*** -0.264*** -0.162*
(0.579) (0.263) (0.105) (0.246) (0.114) (0.365) (0.565) (0.218) (0.791) (0.177) (0.115) (0.207) (0.153) (0.0605) (0.0910) Dummy
Quarter 2 0.491***
(0.113)
Dummy
Quarter 3 0.480*** 0.399***
(0.101) (0.135)
Constant -28.04*** -23.46*** -11.94*** 21.76*** -5.721*** 5.454 45.09*** 4.775 -11.70 10.79*** -11.07*** -12.40*** -26.04*** 4.634* -15.05***
(4.923) (2.285) (1.031) (3.498) (1.706) (6.404) (14.78) (4.120) (13.86) (3.327) (2.299) (2.841) (6.887) (2.759) (4.211)
Observations 25 25 25 25 25 25 25 25 25 25 25 25 25 25 25 R-squared 0.318 0.782 0.815 0.888 0.308 0.169 0.419 0.156 0.242 0.452 0.604 0.454 0.842 0.368 0.511
Standard
errors in
parentheses
*** p<0.01,
** p<0.05,
* p<0.1
Non-
Significant F-
Test

Macroeconomic Determinants of International Currencies
33
Table 3: SUR Model 2 - Share of International Debt with Bilateral Trade Share
Variables CNY –
America CNY –
Europe CNY - Asia,
Oceania and Africa
EUR - America
EUR – Europe
EUR - Asia, Oceania
and Africa
GBP - America
GBP - Europe
GBP - Asia, Oceania
and Africa
JPY - America
JPY - Europe
JPY - Asia, Oceania
and Africa
USD - America
USD - Europe
USD - Asia, Oceania
and Africa
GDP Share -1,010*** -111.0 -128.6*** 48.28*** 122.4*** 93.20*** -5.515
(307.0) (111.6) (20.12) (18.39) (32.52) (25.41) (12.12) Bilateral Trade
(t-1) 556.2* 396.9*** 57.26*** -61.94*** 4.216 31.48 136.3 -100.6** -22.26 -207.8* 594.3*** -45.09 -1.081 -11.58 36.49*
(323.8) (87.17) (8.781) (14.99) (9.951) (27.70) (180.6) (43.00) (75.45) (121.2) (226.0) (77.12) (28.39) (28.80) (20.94)
Inflation 0.618** 0.473*** 0.245*** -0.600*** -0.0870* -0.0290 -0.392*** 0.0355 -0.365** -0.169*** 0.158*** 0.0748 0.262*** -0.0843*** -0.0942
(0.271) (0.126) (0.0426) (0.0815) (0.0506) (0.174) (0.141) (0.0439) (0.144) (0.0481) (0.0412) (0.0761) (0.0578) (0.0290) (0.0600)
Spread 0.0110 0.960*** 0.595*** -0.393* -0.0229 -0.633** -0.0932 0.257 0.723 0.673*** 0.0926 0.120 -0.906*** -0.214*** -0.309***
(0.811) (0.310) (0.104) (0.206) (0.108) (0.267) (0.624) (0.273) (0.744) (0.137) (0.109) (0.217) (0.166) (0.0750) (0.107)
Dummy Quarter 2 0.494***
(0.0773)
Dummy Quarter 3 0.449*** 0.460***
(0.0621) (0.156)
Constant -24.20*** -16.45*** -9.260*** 0.867 -1.064 -4.510*** 37.06*** 4.905 -2.548*** 11.44*** -12.36*** -13.32*** -21.60*** 1.937 -0.123
(8.399) (1.484) (0.728) (0.695) (1.826) (1.602) (12.10) (4.103) (0.793) (2.895) (2.023) (3.154) (6.302) (3.307) (0.945)
Observations 25 25 25 25 25 25 25 25 25 25 25 25 25 25 25
R-squared 0.234 0.670 0.856 0.873 0.197 0.186 0.454 0.198 0.263 0.456 0.524 0.336 0.865 0.210 0.377
Standard errors in parentheses
*** p<0.01, ** p<0.05,
* p<0.1 Non-Significant F-Test
Note: Obtained using STATA command sureg <varlist>, small dfk corr

Macroeconomic Determinants of International Currencies
34
Table 3 presents the results using the Bilateral Trade Share for all equations as a
measure of the size of the economy. Similarly, the variables Market Capitalization, FDI
and Volatility against the SDR presented non-significant statistical results.
We also included seasonal time dummies, in order to understand if the shares of the
international bonds are influenced by seasonality. Only the JPY presented significant
seasonal dummies in which the share of international bonds in Europe and Asia,
Oceania and Africa increases in quarters 2 and 3. Additionally, we tested dummies for
the first quarter of 2011 and 2012 for issuances from European Agents for all the five
currencies under study, since the graphs presented spikes at those dates that justify their
existence in the model. However, none of the dummies ended up being statistically
significant. Finally, we tested for the existence of a time trend, but the results again
were not statistically significant.
The first important result is that we reject the null hypothesis of no contemporaneous
cross-equation correlations between errors. For instance, the USD and the EUR, the two
main currencies at an international level, present residuals that are negatively correlated,
especially among European and American issuers. The share of international bonds in
EUR and in USD display a residual correlation of -0.7052 (Model 1) and -0.7879
(Model 2) among American issuers. Similarly, among European issuers, the correlation
of the residuals is -0.8678 (Model 1) and -0.862 (Model 2). These results demonstrate
and justify the pertinence of using a Seemingly Unrelated Equations model (see Annex
1 for the full matrix of correlation).
Additionally, the results indicate the existence of heterogeneity across coefficients. In
both specifications, the estimated impact of the explanatory variables across currency
shares differ. Moreover, in some situations, when we analyse different regions for the
same currency, we observe that the estimated impact of explanatory variables also
differ. The pairwise heterogeneity of the coefficients was tested using a standard F-type
test – see annex 7.
We decided to discuss the results by analysing separately the most relevant features of
each macroeconomic determinant in the model. The R-squared vary from 0.15 to 0.88 in
model 1 and from 0.19 to 0.89 in model 2. The models perform worst, in terms of fit, in
the case of the GBP. Moreover, the GBP presents one equation (Asia, Oceania and
Africa) that is overall insignificant, in model 2. The R-squared for the CNY share

Macroeconomic Determinants of International Currencies
35
among issuers Asia, Oceania and Africa; for the EUR among American issuers; and for
the USD among American issuers are all above 0.8.
It is not possible to clearly identify which specification performs best since the R-
squared values are very similar in both models. Model 1 present relatively higher R-
squared in 8 out of 15 equations and model 2 in the remaining 7.
Size of the Economy
As expected, the results suggest that the size of the economy has a positive impact in the
region of the currency, for all currencies in which this macroeconomic variable showed
to be significant (CNY, EUR, JPY and USD).
Among issuers that belong to the currency’s region, the influence of the size of the
economy is greater for the JPY (161.2) and the USD (105.7). Both the EUR share of
international bonds and the CNY share of international bonds also increase among
agents from Europe and from Asia, Oceania and Africa, respectively, when the
correspondent economy grows, but the coefficients are smaller (26.87 for the EUR and
65.25 for the CNY). The GBP is the only currency that presents a non-significant value
– in this case, for issuances by European agents - meaning that the share of international
bonds denominated in GBP among European Agents do not react to an expansion of the
British Economy.
However, the same homogeneity does not occur when we consider other regions rather
than the region where the country of the currency belongs to. The impacts of the size of
the economy are positive for CNY in both America and Europe regions – with the
highest estimate values–, for the USD among Asia, Oceania and Africa agents, and for
the JPY among European agents.
The EUR and the USD, for instance, present interesting results in this respect. When the
share of the economy of the Eurozone increases, the share of international bonds
denominated in EUR among American issuers tend to be smaller and, similarly, the
same happens for the USD, although in this case the estimate is only significant at a
10% level. According to the estimates, the magnitude of the results are also striking.
The negative impact on the share of EUR among American issuers is ten times higher
than the negative impact on the share of USD among European agents. Similarly, the
GBP share among American issuers decrease every time the British economy expand, in

Macroeconomic Determinants of International Currencies
36
fact, the currency that presents the most negative coefficient. Since the GDP share do
not contribute positively in none of the regions, one of the conclusions we can obtain is
that the expansion of the British economy do not favour the internationalization of its
currency. Curiously, the Japanese GDP share impacts negatively among American
issuers but positively among European agents. The results are robust in both models 1
and 2.
Finally, and contrary to all the other currencies, the CNY is the only currency which
increases its’ share in all regions when the Chinese GDP share increases. The impacts
are higher among American issuers, followed by European issuers and finally in the
local region Asia, Oceania and Africa. These results suggest that the CNY has the
potential and capacity to become a relevant currency not only in its local region but
rather globally. It is also interesting to understand that the impact of the Bilateral Trade
Share – presented in model 2 – is always positive and it is larger than the impact of the
GDP share among American and European agents.
Inflation
With regard to the inflation rate, we obtained different results to those obtained by
Bobba et al (2007). In our model, inflation has a negative effect on the share of
international bonds denominated in EUR and USD in regions other than those of the
currency of issuance. Additionally, the inflation’s coefficient for USD issuances among
American issuers is positive in both models 1 and 2, and we verify the same positive
sign in model 2 for the EUR share among European agents. If we look at the
particularities of the USD and EUR, as the main global reference currencies, we can
understand why inflation undermines the share of international bonds among
international actors. Both EUR and the USD are used as safe-heavens and present stable
inflation rates in their local economies and, therefore, rarely used by issuers as an
instrument to reduce costs of borrowing based on continuous erosion of value through
inflation. Hence, a sudden increase in inflation is not sufficient to change expectations
among issuers that the long-term level of inflation will increase permanently. Rather, it
can be seen as a measure of risk and, as a consequence, the role of a safe-haven
currency get affected, which consequently reduces the issuances among international
actors.

Macroeconomic Determinants of International Currencies
37
On the other hand, the impact of Chinese inflation on CNY share of international bonds
is positive across all regions. In this case, it is possible to admit that agents expect
inflation to be continually high and, therefore, try to take advantage and reduce
borrowing costs through this mean.
For the remaining two currencies, the GBP and the JPY, the impacts are heterogeneous
between the different regions. In the case of the GBP, the impact of higher levels of
inflation rate is positive among European issuers – local region of the currency – but
negative for the other two regions. The JPY presents a positive coefficient for Europe
and negative for America. Additionally, in Asia, Oceania and Africa the results are not
robust across both specifications, presenting a significant value in Model 1 but not in
Model 2.
Spread
The results obtained for the proxy that capture borrowing costs are also statistically
significant. Moreover, they corroborate the idea that the USD is the main reference
currency at an international level. It is the only currency that does not present positive
responses in the shares of international currencies to an increase in the spread between
the government bond yields – in this case, the different between the US government
bonds and the German government bonds.
Assuming no change in the risk spread associated with international bonds, the spread
between international bonds will also widen due to the increase in the spread of the
benchmark bonds. Hence, this can have one of two consequences: an increase in the
demand of international bonds of the currency with the relative higher interest rate or a
decrease in the supply of international bonds of that same currency. If the first occurs,
then the share of bonds denominated in that currency tend to be higher; with a decrease
in the supply, however, the share of bond tend to be lower.
In the case of the USD, since the spread has a negative impact over the share of
international bonds denominated in dollars, we can conclude that, when the interest rate
is relatively higher, the downward movement in the supply curve offset any possible
upward movement in the demand curve. Thus, that investors do not “search for yield” in
USD denominated bonds but rather look for stability, regardless of the issuer’s region.
The opposite seems to occur with the remaining currencies, with the exception of the
EUR among European agents, a region where the EUR is also a reference currency.
Macroeconomic Determinants of International Currencies
38
For the CNY, the effects of a higher spread have a positive impact over the share of
international bonds issued by agents from Europe and from Asia, Oceania and Africa.
The results are robust and hold in both models. Contrarily, the results from the JPY
seems to not hold in the second specification. Despite presenting positive statistical
significant coefficients for all the regions in model 1, in model 2 only the JPY share
among American issuers seems to respond to changes in the spread between yields of
the benchmark bonds.
Distinctively from the other currencies, the GBP present no significant values in any of
the regions. Therefore, the results suggest that this macroeconomic variable do not have
impact in the share of GBP denominated bonds at an international level.
6. Conclusions
The CNY is now considered a “free usable” currency by the IMF. How much this
currency will be used outside its borders it is still an uncertainty. According with the
data that we collect, the CNY was able, after few years of its inception in the
international markets, to be the second most used currency – after the USD – between
issuers from Asia, Oceania and Africa. The offshore bonds denominated in CNY
appeared in 2007 and, since then, the IMS seems to be in a continuous process of
adaptation to the internationalization of the Renminbi. As a proof of it, the CNY is now
part of the SDR Basket with the third higher weight after the USD and the EUR.
In line with these changes, our goal was to understand how the macroeconomic
determinants influence the different shares of international bonds. When looking to the
determinants that influence the strength of one currency at an international level, the
literature analyse the currencies altogether, and not distinguish between currencies.
We decided to chase this view and, in this dissertation, we model the shares of
international currencies using Seemingly Unrelated Regression Models, between
2009Q3 and 2015Q4. The data is composed by international debt shares of each of the
five currencies of the SDR Basket, which are subsequently divided into three regions
(America; Europe and Asia, Oceania and Africa), based on the country of the parent
company of issuance.

Macroeconomic Determinants of International Currencies
39
We find strong evidence supporting the hypothesis of distinct coefficients across
equations and of correlated errors, thus supporting our modelling technique based on
Seemingly Unrelated Equations.
We find out that the share of international bonds is influenced by the size of the
economy, by inflation rates and by the yield spread. The size of the economy has a
positive impact over the share of a given currency among the issuers that belong to the
region of the currency. In particular, we conclude that the share of the USD, EUR, CNY
and JPY among issuers from America, Europe and Asia, Oceania and Africa,
respectively, increases when their national economy expand. However, of all currencies
under study, only the CNY presents a positive coefficient for the size of the economy
irrespectively of the region of the issuer. For the CNY we also establish that the impact
of the bilateral trade share over the share of international bonds is higher than the
impact produced by an increase in the share of the Chinese GDP. For the EUR and
USD, the findings suggest that when the Eurozone or American GDP share increases,
the share of international bonds denominated in EUR or USD decrease among
American and European issuers, respectively.
We also find out that for the case of inflation, there are heterogeneous results. For the
EUR and the USD, inflation has a negative impact over the share of international bonds
when we consider regions other than the one of the currency of issuance – Europe and
America, respectively. The findings suggest that both the EUR and the USD are
reference currencies, since international issuers do not tend to issue more in order to
take advantage of higher inflation rates. Contrarily to this, the CNY share of
international bonds increase with inflation, irrespectively of the region under study.
Finally, the spread of government bond yields suggest that the USD has a distinctive
role that has not yet been achieved by any other currency. The USD is the only currency
which is not used by investors as a “search of yield” currency in any of the regions
under study. On the other hand, the share of the EUR, the second most important
currency worldwide, responds positively to an increase in the spread in regions other
than Europe, however, the results seem to not be robust in our model. Finally, both the
CNY and the JPY respond positively to a wider spread between the local government
bond and the government of the reference currency.

Macroeconomic Determinants of International Currencies
40
Despite these interesting findings, our models present some visible limitations. Firstly,
the models do not incorporate the lagged dependent variable as an explanatory factor. A
lagged variable would be able to capture the persistency that exists in the share of
international currencies and already mentioned in the literature. As a result, our models
present, in some cases, low R-Squared values that we believe could be increased if we
took into account this specification. However, in some cases, even with this handicap,
our models present a R-Squared of above 0.8 for (i) the USD Share among American
issuers; (ii) for the EUR share among European issuers; (iii) for the CNY among issuers
from Asia, Oceania and Africa. Thus, we also offset the idea that shares of international
currencies do not react to macroeconomic fundamentals.
Therefore, in our perspective, further research could be produced by applying dynamic
models that allowed coefficients to vary between currencies. The hypothesis that the
coefficients of the macroeconomic explanatory variables are equal for all currencies and
regions seems to be too strong.
Moreover, some important determinants defined by the literature such as the market
development or hedging motives need to be explored further with better proxies.
Additionally, another research path could take into account the exchange venues where
these bonds are traded and analyse the shares based on the exchanges rather than on the
country of the issuer. Although many bonds end up being traded Over-the-Counter, we
believe that further research on this could bring also interesting results.
Macroeconomic Determinants of International Currencies
41
References
Aizenman, J. 2015. The internationalization of the RMB, capital market openness, and
financial reforms in China. NBER Working Paper.
Allayannis, G., Brown, G. & Klapper L. 2003. Capital Structure and Financial Risk:
Evidence from Foreign Debt Use in East Asia. Journal of Finance, 58 (6).
Benzie, R. 1992. The Development of the International Bond Market. BIS Working
Papers
Black, S. 1991. Transactions costs and vehicle currencies. Journal of International
Money and Finance, 10(4) : 512–526.
Blinder, A. 1996. The role of the dollar as an international currency. Eastern Economic
Journal, 22 (2) : 127.
Bobba, M., Corte, G. & Powell, A. 2007. On the Determinants of International
Currency Choice: Will the Euro Dominate the World? Inter-American
Development Bank Working Paper.
Calvo, G., Vegh, C. 1992. Currency Substitution in Developing Countries: An
Introduction. Munich RePEc Archive.
Chen, H. & Peng, W. 2009. The Potential of the Renminbi as an International Currency.
BIS Working Papers
Chinn, M. & Frankel, J. 2007. Wil the Euro Eventually Surpass the Dollar as Leading
International Reserve Currency? Clarida RH, editor. G7 Current Account
Imbalances. 284–323. The University of Chicago Press.
Chinn, M. & Frankel J. 2008. Why the Euro Will Rival the Dollar. International
Finance, 11(1):49–73.
Chinn, M. 2014. Emerging Market Economies and the Next Reserve Currencies. Open
Economics Review, 26 : 155–174.
Chitu, L., Eichengreen, B. & Mehl, A. 2012. When Did the Dollar Overtake Sterling As
the Leading International Currency? Evidence From the Bond Markets. ECB
Working Papers
Clark, E. & Judge, A. 2009. Foreign Currency Derivatives versus Foreign Currency
Debt and the Hedging Premium. European Financial Management Review, 15
(3) : 606–642.
Cohen, B. 1971. The Future of Sterling as an International Currency. Mcmillan
Publisher.

Macroeconomic Determinants of International Currencies
42
Cohen, B. 2005. Currency choice in international bond issuance. BIS Quarterly Review,
53–66.
Devereux, M. & Shi, S. 2013. Vehicle currency. International Economics Review, 54
(1) : 97–133.
Eichengreen, B., Chi, L. & Mehl, A. 2014. Stability or Upheaval? The Currency
Composition of International Reserves in the Long Run. ECB Working Papers
Eichengreen, B. & Flandreau, M. 2008. The rise and fall of the dollar, or when did the
dollar replace sterling as the leading reserve currency? European Review of
Economic History, 13 : 377–411.
Eichengreen, B. & Mathieson, D. 2000. The currency composition of international
reserves: Retrospect and Prospect. IMF Working Paper.
Esho, N., Sharpe, I. & Webster, K. 2007. Hedging and choice of currency denomination
in international syndicated loan markets. Pacific-Basin Finance Journal, 15 (2) :
195–212.
Flandreau, M. & Jobst, C. 2009. The Empirics of International Currencies: Network
Externalities, History and Persistence. The Economic Journal.
Frankel, J. 2012. Internationalization of the RMB and Historical Precedents. Journal
Economic Integration. 27 (3) : 329–365.
Goldberg, L. & Tille, C. 2008. Vehicle currency use in international trade. Journal
International Economics, 76 (2) : 177–192.
Habib, M. & Joy, M. 2008. Foreign-Currency Bonds: Currency Choice and the Role of
Uncovered and Covered Interest Parity. ECB Working Papers.
Hakkio, C. 1973. The Dollar’s International Role. Contemporary Policy Issues, 11 :
62–75.
Hartmann, P. 1998 Currency competition and foreign exchange markets. The dollar,
the yen, and the Euro. Cambridge University Press.
IMF, European Central Bank, Bank of International Settlements. 2015. Handbook on
Securities Statistics.
IMF. 2016. Articles of Aggreement. Washington, DC
Ito, H. & Rodriguez, C. 2015. Do We Like the Greenback or Something Else? An
Analysis on the Determinants of Reliance on Foreign-Currency Denominated
Debt. Working Paper.
Kedia, S. & Mozumdar, A. 2003. Foreign Currency--Denominated Debt: An Empirical
Examination. The Journal of Business, 76 (4) : 521–546.

Macroeconomic Determinants of International Currencies
43
Keloharju, M. & Niskanen, M. 2001. Why Do Firms Raise Foreign Currency
Denominated Debt? Evidence from Finland. European Financial Management, 7
(4) :481–496.
Kindleberger, C. 1967. Essays in International International Finance: The Politics of
International Money and World Language. Essays on International Finance, (61).
Krugman, P. 1980. Vehicle Currencies and the Structure of International Exchange.
Journal of Money, Credit Banking, 12 (3)
Krugman, P. The International Role of the Dollar: Theory and Prospect. National
Bureau of Economic Researh. 1984 ; I : 261–278.
Lee, J. 2014. Will the renminbi emerge as an international reserve currency? Asian
Development Bank. 37(1):42–62.
Lim, E. 2006. The Euro’s Challenge to the Dollar: Different Views from Economists
and Evidence from COFER (Currency Composition of Foreign Exchange
Reserves) and Other Data. IMF Working Papers.
Ma, G. & Yao, W. 2015. Can The Chinese Bond Market Facilitate A Globalizing
Renminbi Renminbi? BOFIT Discussion Papers.
Matsuyama, K., Kiyotaki, N., Matsui, A. 1993. Toward a theory of international
currency. Review of Economic Studies, 60: 283–307.
Mcbrady, M., Schill, M. 2007. Foreign currency-denominated borrowing in the absence
of operating incentives. Journal financial economics. 2007;86(1):145–77.
McKinnon, R. 1979. Money in International Exchange. Oxford University Press.
Mehl, A., Geis, A. & Wredenborg, S. 2004. International Role of the Euro Evidence
from bonds issued by non-euro area residents. ECB Working Papers.
Powell, A. 2014. Global Recovery and Monetary Normalization Escaping a Chronicle
Foretold? Latin America and Caribbean Macroeconomic Report
Swoboda, A. 1968. The euro-dollar market: An interpretation. Essays on International
Finance, 64.
Swoboda, A. 1969. Vehicle currencies in the foreign exchange market: the case of the
dollar. New York: Praeger.
Task Force on Finance Statistics. 2013. External Debt Statistics: Guide for Compilers
and Users. Washington DC.
Turner, P. 2014. The global long-term interest rate, financial risks and policy choices in
EMEs. BIS Working Papers.
Wooldridge, P. 2012. Enhancements to the BIS debt securities statistics. BIS Quarterly

Macroeconomic Determinants of International Currencies
44
Review 63–76.
Zellner, A. 1962. An efficient method of estimating seemingly unrelated regressions
and test for aggregation bias. Journal of the American Statistical Association.
57(298): 348-368.
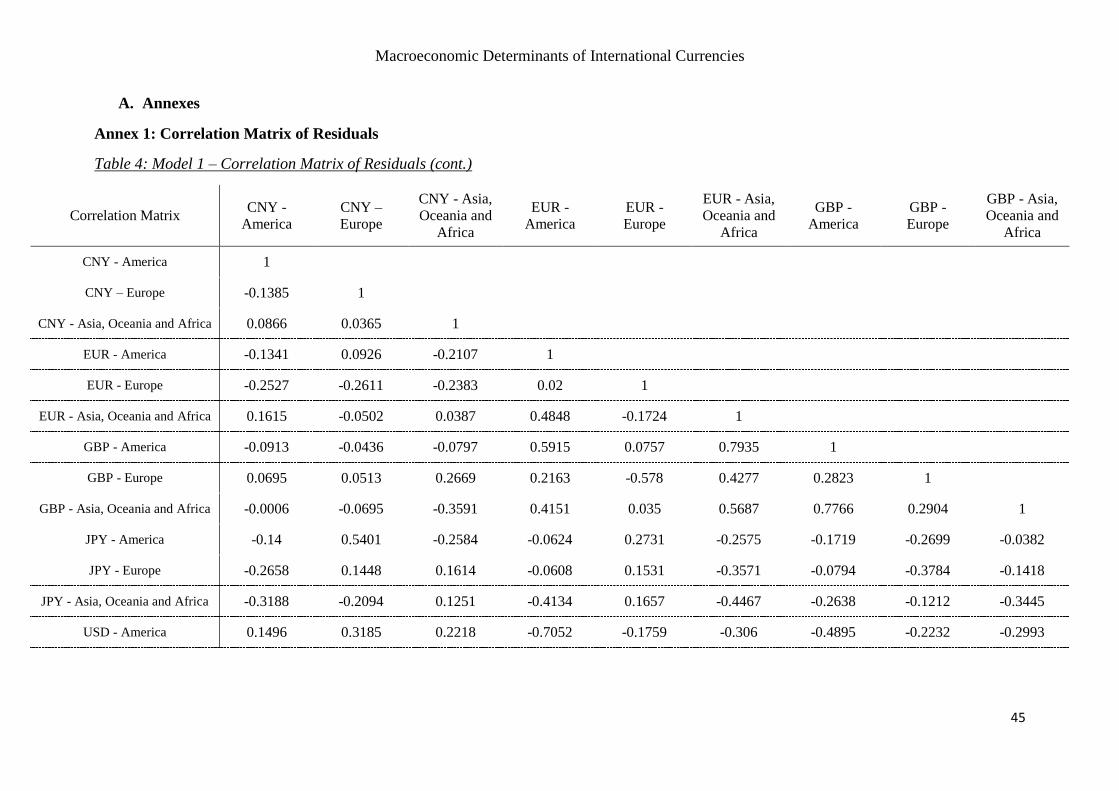
Macroeconomic Determinants of International Currencies
45
A. Annexes
Annex 1: Correlation Matrix of Residuals
Table 4: Model 1 – Correlation Matrix of Residuals (cont.)
Correlation Matrix CNY -
America
CNY –
Europe
CNY - Asia,
Oceania and
Africa
EUR -
America
EUR -
Europe
EUR - Asia,
Oceania and
Africa
GBP -
America
GBP -
Europe
GBP - Asia,
Oceania and
Africa
CNY - America 1
CNY – Europe -0.1385 1
CNY - Asia, Oceania and Africa 0.0866 0.0365 1
EUR - America -0.1341 0.0926 -0.2107 1
EUR - Europe -0.2527 -0.2611 -0.2383 0.02 1
EUR - Asia, Oceania and Africa 0.1615 -0.0502 0.0387 0.4848 -0.1724 1
GBP - America -0.0913 -0.0436 -0.0797 0.5915 0.0757 0.7935 1
GBP - Europe 0.0695 0.0513 0.2669 0.2163 -0.578 0.4277 0.2823 1
GBP - Asia, Oceania and Africa -0.0006 -0.0695 -0.3591 0.4151 0.035 0.5687 0.7766 0.2904 1
JPY - America -0.14 0.5401 -0.2584 -0.0624 0.2731 -0.2575 -0.1719 -0.2699 -0.0382
JPY - Europe -0.2658 0.1448 0.1614 -0.0608 0.1531 -0.3571 -0.0794 -0.3784 -0.1418
JPY - Asia, Oceania and Africa -0.3188 -0.2094 0.1251 -0.4134 0.1657 -0.4467 -0.2638 -0.1212 -0.3445
USD - America 0.1496 0.3185 0.2218 -0.7052 -0.1759 -0.306 -0.4895 -0.2232 -0.2993

Macroeconomic Determinants of International Currencies
46
CNY -
America
CNY –
Europe
CNY - Asia,
Oceania and
Africa
EUR -
America
EUR -
Europe
EUR - Asia,
Oceania and
Africa
GBP -
America
GBP -
Europe
GBP - Asia,
Oceania and
Africa
USD - Europe 0.3289 0.113 0.1732 -0.147 -0.8678 0.0641 -0.2348 0.3431 -0.1099
USD - As(ia, Oceania and
Africa -0.2359 0.4222 -0.4742 0.2485 0.0215 -0.0329 0.1214 -0.0053 0.2995
(cont.) Table 4: Model 1 – Correlation Matrix of Residuals
Correlation Matrix
JPY - America JPY - Europe
JPY - Asia, Oceania
and Africa USD - America USD - Europe
USD - Asia, Oceania
and Africa
JPY – America 1
JPY – Europe -0.0442 1
JPY - Asia, Oceania and
Africa -0.1613 0.15 1
USD - America 0.3965 0.1168 -0.0284 1
USD - Europe -0.3555 -0.2052 -0.019 0.2295 1
USD - Asia, Oceania and
Africa 0.5723 -0.0924 -0.3481 0.1754 -0.0892 1
Breusch-Pagan test of independence: chi2(105) = 232.770, Pr = 0.0000
Note: Obtained using STATA command sureg <varlist>, small dfk corr

Macroeconomic Determinants of International Currencies
47
Table 5: Model 2 – Correlation Matrix of Residuals (cont.)
Correlation Matrix CNY -
America
CNY –
Europe
CNY - Asia,
Oceania and
Africa
EUR -
America
EUR -
Europe
EUR - Asia,
Oceania and
Africa
GBP -
America
GBP -
Europe
GBP - Asia,
Oceania and
Africa
CNY - America 1
CNY – Europe -0.0547 1
CNY - Asia, Oceania and
Africa -0.0157 -0.0633 1
EUR - America -0.0825 -0.0009 -0.1269 1
EUR - Europe -0.181 -0.0922 -0.2145 -0.0803 1
EUR - Asia, Oceania and
Africa 0.1207 -0.2801 -0.1733 0.5069 -0.2259 1
GBP - America -0.0813 -0.2416 -0.3564 0.5468 0.0566 0.7906 1
GBP - Europe -0.016 -0.0695 0.0923 0.1866 -0.5498 0.413 0.292 1
GBP - Asia, Oceania and
Africa 0.0503 -0.0951 -0.5149 0.3552 0.0485 0.5584 0.7794 0.2709 1
JPY - America -0.1626 0.604 -0.3486 -0.1956 0.4005 -0.5389 -0.3267 -0.3145 -0.1691
JPY - Europe -0.2406 0.2484 0.1493 -0.025 0.1702 -0.4161 -0.1482 -0.3147 -0.1968
JPY - Asia, Oceania and
Africa -0.3044 -0.0934 0.0581 -0.259 0.0717 -0.45 -0.3357 -0.0939 -0.4183
USD - America 0.1932 0.2963 0.0118 -0.7879 -0.1753 -0.3471 -0.4399 -0.042 -0.1686
USD - Europe 0.2761 0.2131 0.0645 -0.0173 -0.862 0.1394 -0.1268 0.4129 0.0381
USD - Asia, Oceania and
Africa -0.2846 0.4742 -0.5323 0.0624 0.0792 -0.0228 0.1456 0.105 0.287

Macroeconomic Determinants of International Currencies
48
(cont.) Table 5: Model 2 – Correlation Matrix of Residuals
Correlation Matrix JPY - America JPY – Europe JPY - Asia, Oceania
and Africa USD - America USD - Europe
USD - Asia, Oceania
and Africa
JPY – America 1
JPY – Europe 0.0596 1
JPY - Asia, Oceania
and Africa 0.0975 0.2645 1
USD - America 0.2735 0.1035 0.0531 1
USD - Europe -0.3269 -0.1525 -0.0143 0.34 1
USD - Asia, Oceania
and Africa 0.5577 -0.1603 -0.2363 0.2102 0.0528 1
Breusch-Pagan test of independence: chi2(105) = 246.585, Pr = 0.0000
Note: Obtained using STATA command sureg <varlist>, small dfk corr

Macroeconomic Determinants of International Currencies
49
Annex 2: Market Types from Bloomberg
Table 6: Market Types on Bloomberg
Market Type
Included Euro-MTN
Euro Non-Dollar
Euro-Dollar
Global
Samurai
Shogun
Yankee
US Non-Dollar
Excluded Australian
Canadian
Domestic
Domestic MTN
Private Placement
Restructured Debt
UK Guilt Stock
US Domestic
US Govt
Warrant

Macroeconomic Determinants of International Currencies
50
Annex 3: Exchanges on Bloomberg for each of the Currencies
Table 7: List of Domestic Exchanges per Currency
Domestic Exchanges Market Type
CNY Shangai Stock Exchange
Shengzhen Stock Exchange
EUR Luxemburg
Frankfurt
Dusseldorf
Vienna
Dublin
Amsterdam
Paris
Madrid
Brussels
Milan
NOMX Helsinki
Berlin
Hamburg
Hannover
Munich
Stuttgart
Lisbon
Athens
Valencia
Bilbao
AIAF
Lyon
Strasbourg
Marseille
Nancy
Nantes
Barcelona
Cent Anotacione
All German SE
Malta
Nouveau Marche
Euronext-Paris
Euronext-Amsterdam

Macroeconomic Determinants of International Currencies
51
Euronext-Brussels
TLX
EuroMTF
Euwax Stuttgart
Antwerp
SEDEX-Milan
Malta
Euro TLX
Xetra
SCDACH-Frankfurt
SIBE
NYSE BondMatch
Malta
Mercato Telemati
Extra MOT Pro
GBP London
London Intl
MTS Amsterdam
MTS S.p.A
MTS Belgium
MTS Portugal
MTS France
MTS Ireland
MTS Greece
Chi-X
Tradeweb Europe
Tradeweb LLC
LSE-Retail
JPY Tokyo
Tokyo 2
Osaka
Osaka 2
Nagoya
Fukuoka
Sapporo
USD New York
NYSE MKT LLC
Yellow Sheets
Nasdaq

Macroeconomic Determinants of International Currencies
52
NYSE Arca
Trace
CBOE
Nasdaq OMX PHLX
Chicago
Cincinnati
Nasdaq/NCM
Nasdaq/NGM
Nasdaq/NGS
Third Mkt Corp
BATS

Macroeconomic Determinants of International Currencies
53
Annex 4: Currencies Used in the Total Amount of International Bonds
Table 8: List of Currencies
of Currency Name
AED United Arab Emirates
dirham
ARS Argentine Peso
AUD Australian Dollar
BRL Brazilian Real
CAD Canadian Dollar
CHF Swiss Franc
CLP Chilean Peso
CNY Chinese Renminbi
COP Colombian Peso
CZK Czech Koruna
DKK Danish Krone
EGP Egyptian Pound
EUR Euro
GBP Pound Sterling
HKD Hong Kong Dollar
HUF Forint
ILS New Israeli Shekel
IDR Indonesian Rupiah
INR Indian Rupee
JPY Japanese yen
KRW South Korean Won
KZT Kazakhstani Tenge
MXN Mexican Peso
NGN Naira
NOK Norwegian Krone
NZD New Zealand Dollar
PEN Peruvian Nuevo Sol
PLN Polish Zloty
RON Romanian New Leu
RUB Russian Ruble
SEK Swedish Krona
SGD Singapore Dollar
TRY Turkish Lira
TWD Taiwan Dollar
USD US Dollar
VEB Venezuelan bolívar
VND Vietnamese đồng
ZAR South African Rand

Macroeconomic Determinants of International Currencies
54
Annex 5: Example of the Matrix Output from Bloomberg
Table 9: USD Issuances per Ultimate Parent Country
Note: Illustrative example. Ult. Parent Countries are not all represented in this figure.

Macroeconomic Determinants of International Currencies
55
Annex 6: Details of the Database
Table 10: Details of the Database
Variable Currency Source Bloomberg
Ticker Observations
GDP
CNY Bloomberg CNGDGDP Index
China’s quarterly GDP
series starts in 2011Q1.
Therefore, the remaining
observations were
obtained using the
annual YoY growth rate.
EUR Bloomberg
EUGVEMU
Index
GBP Bloomberg EUGVUKI Index
JPY Bloomberg
JGDPOGDP
Index
USD Bloomberg
GDP CHWG
Index
TRADE SHARE CNY CEPII
EUR CEPII
GBP CEPII
JPY CEPII
USD CEPII
Inflation CNY Bloomberg
CNCPIYOY
Index
EUR Bloomberg
ECCPEMUY
Index
GBP Bloomberg
UKRPCJYR
Index
JPY Bloomberg JNCPIYOY Index
USD Bloomberg CPI YOY Index
Volatility SDR CNY IMF not applicable
Extracted through IMF
Financial Data
EUR IMF not applicable Extracted through IMF
Financial Data
GBP IMF not applicable Extracted through IMF
Financial Data
JPY IMF not applicable Extracted through IMF
Financial Data

Macroeconomic Determinants of International Currencies
56
USD IMF not applicable Extracted through IMF
Financial Data
FDI
CNY Bloomberg
CHCUNFE Index
& CHCUNFER
Index
Two ticker used because
from 2010 onwards
China started FDI in
USD (CHCUNFER),
and we segregate both
amounts
EUR Bloomberg
EUCAYF56
Index &
EUCAYF57
Index
EUCAYF56 Index: FDI
from Monetary and
Financial Institutions;
EUCAYF57 Index: FDI
from other sectors
GBP Bloomberg
UKCAHJYR
Index
JPY Bloomberg JNBPFDEL Index
USD Bloomberg
UACSIEQO
Index
Government 5-year yield CNY Bloomberg GTCNY5Y govt
EUR Bloomberg GDBR5 Index
GBP Bloomberg GUKG5 Index
JPY Bloomberg GTJPY5Y govt
USD Bloomberg USGG5YR Index
Market Capitalization CNY Bloomberg
WCAUCHIN
Index
EUR Bloomberg not applicable
sum of all 19 countries
from Eurozone, based on
the respective tickers
GBP Bloomberg WCAUUK Index
JPY Bloomberg
WCAUJAPA
Index
USD Bloomberg WCAUUS Index

Macroeconomic Determinants of International Currencies
57
Table 11: Details of the GDP Variable Used
Country Bloomberg Ticker Obs
China CNGDGDP Index
UK EUGVUKI Index
Eurozone EUGVEMU Index
US GDP CHWG Index
Japan JGDPOGDP Index
EU EUGNEU27 Index
Argentina ARADTOTL Index
Australia AUNAGDP Index
Brazil BZGDGDPQ Index
Canada CGE9MP Index
India IGQREGDP Index &
INQGGDP Index
IGQREGDP Index: between 2011Q2 and
2015Q4; INQGGDP Index: between 2009Q3
and 2011Q1
Indonesia IDGDP Index
Mexico MXGPLEVL Index
Russia RUDPGDPN Index &
RUDPGL Index
RUDPGDPN Index: between 2011Q1 and
2015Q4; INQGGDP Index: between 2009Q3
and 2010Q4
South Africa SAGDP Index
South Korea KOECSTOT Index
Turkey TUGPCU Index

Macroeconomic Determinants of International Currencies
58
Annex 7: Countries and Regions for each Currency
Table 12: Countries per Currency
Currency Region Country ISO
Code
CNY Asia, Oceania and Africa CN
HK
AU
KR
AE
SG
TW
JP
IN
ZA
MY
QA
RU
NZ
TH
MN
CNY Europe GB
FR
DE
NL
LU
CH
SE
IT
ES
AT
IE
HU
CNY Americas US
CA
MX
KY
VG
BR
EUR Asia, Oceania and Africa CN
AU
JP

Macroeconomic Determinants of International Currencies
59
KR
ZA
IN
QA
AE
NZ
RU
IL
HK
LB
EUR Europe CH
GB
SE
NO
JE
DK
IS
CZ
HU
PL
TR
GI
RO
HR
BG
LI
FR
DE
NL
LU
BE
IT
ES
AT
PT
IE
GR
FI
EE
CY
EUR Americas US
KY
CA
BR

Macroeconomic Determinants of International Currencies
60
BM
AR
MX
VE
CO
CL
VC
JM
GBP Asia, Oceania and Africa AU
CN
JP
SG
HK
ZA
AE
NZ
IN
KR
RU
MY
KZ
IL
GBP Europe ES
NL
IE
SE
DE
JE
NO
LU
FI
CH
IT
AT
FR
IS
PT
DK
GG
BE
IM
GR
GB
GI

Macroeconomic Determinants of International Currencies
61
GBP Americas US
CA
KY
BM
VG
BB
BR
MX
JPY Asia, Oceania and Africa JP
AU
KR
AE
CN
HK
NZ
SG
IN
TW
ZA
MY
JPY Europe DE
GB
NO
FR
SE
NL
CH
LU
FI
DK
ES
AT
IE
IT
BE
JE
IS
PT
GR
TR
JPY Americas US
CA

Macroeconomic Determinants of International Currencies
62
KY
AR
BR
PA
CL
USD Asia, Oceania and Africa CN
AU
JP
KR
HK
IN
TW
AE
RU
SG
ID
ZA
PH
MY
TH
NZ
KZ
USD Europe GB
DE
FR
CH
NL
ES
GG
SE
IE
LU
BE
NO
IT
DK
UA
AT
TR
FI
JE
USD Americas US
CA

Macroeconomic Determinants of International Currencies
63
BR
MX
AR
PA
KY
CA
BR
MX
AR
CL
KY
BM
CO
PE
VG
JM

Macroeconomic Determinants of International Currencies
64
Annex 8: Cross-Equation Coefficient Tests
Table 13: GDP Share Coefficient Testing
Dependent Variables
listed
EUR –
America
EUR –
Europe
USD –
America
USD –
Europe
USD –
Asia,
Oceania
and
Africa
EUR – America -
EUR – Europe 45.34
(0.00) -
USD – America 37.67
(0.00)
15.66
(0.0001) -
USD – Europe 26.42
(0.00)
10.90
(0.0011)
32.83
(0.00) -
USD – Asia, Oceania and
Africa
60.06
(0.00)
4.96
(0.0266)
5.84
(0.0162)
31.37
(0.00) -
Note: Obtained using STATA post-estimation command: test [dep_var] gdp_sharei =
[dep_var] gdp_sharei. Values of the F-statistic presented, p-values in parenthesis. Other
coefficients were tested with the aforementioned in order to produce a combined F-Test,
using the STATA command accumulate after each of the pairwise comparisons being
made.
Table 14: Bilateral Trade Share Coefficient Testing
Bilateral Trade Shares EUR -
America EUR -
Europe USD -
Europe
EUR - America -
EUR - Europe 15.48
(0.0001) -
USD - Europe 2.77
(0.0972) 0.47
(0.4931) -
Note: Obtained using STATA post-estimation command: test [dep_var] gdp_sharei =
[dep_var] gdp_sharei. Values of the F-statistic presented, p-values in parenthesis.
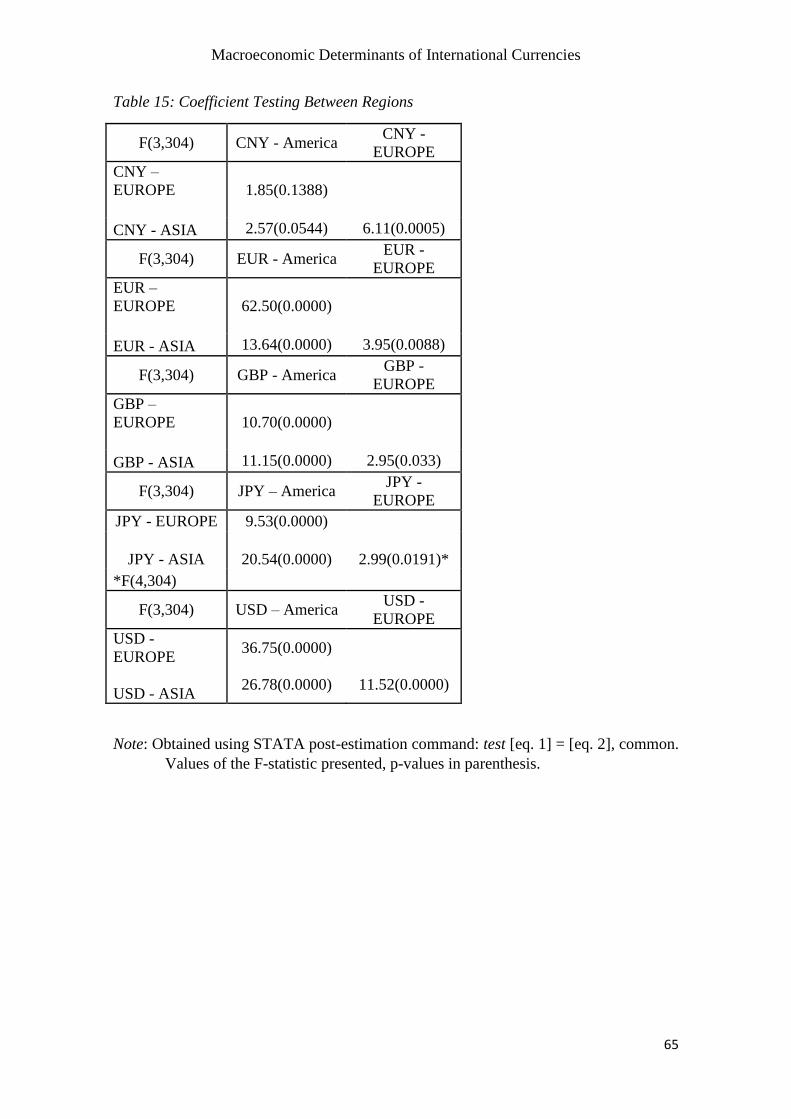
Macroeconomic Determinants of International Currencies
65
Table 15: Coefficient Testing Between Regions
F(3,304) CNY - America CNY -
EUROPE
CNY –
EUROPE
1.85(0.1388)
CNY - ASIA 2.57(0.0544) 6.11(0.0005)
F(3,304) EUR - America EUR -
EUROPE
EUR –
EUROPE
62.50(0.0000)
EUR - ASIA 13.64(0.0000) 3.95(0.0088)
F(3,304) GBP - America GBP -
EUROPE
GBP –
EUROPE
10.70(0.0000)
GBP - ASIA 11.15(0.0000) 2.95(0.033)
F(3,304) JPY – America JPY -
EUROPE
JPY - EUROPE 9.53(0.0000)
JPY - ASIA 20.54(0.0000) 2.99(0.0191)*
*F(4,304)
F(3,304) USD – America USD -
EUROPE
USD -
EUROPE 36.75(0.0000)
USD - ASIA 26.78(0.0000) 11.52(0.0000)
Note: Obtained using STATA post-estimation command: test [eq. 1] = [eq. 2], common.
Values of the F-statistic presented, p-values in parenthesis.

Macroeconomic Determinants of International Currencies
66
Annex 9: Amounts Issued in a Given Currency per Region
Figure 14: CNY amount issued per region
Figure 15: USD amount issued per region

Macroeconomic Determinants of International Currencies
67
Figure 16: EUR amount issued per region
Figure 17: JPY amount issued per region

Macroeconomic Determinants of International Currencies
68
Figure 18: GBP amount issued per region