Globalization and the role of public transfers in redistributing income in Latin America and the...
29
Copyright © UNU-WIDER 2009 * World Bank, email: [email protected] This is a revised version of a paper originally prepared for the UNU-WIDER project conference on The Impact of Globalization on the Poor in Latin America, directed by Professors Machiko Nissanke and Erik Thorbecke. The conference was organized in Rio de Janeiro, in collaboration with Pontifícia Universidade Católica do Rio de Janeiro, 23–24 September 2006. UNU-WIDER gratefully acknowledges the financial contribution of the Finnish Ministry of Foreign Affairs to this project, and the contributions from the governments of Denmark (Royal Ministry of Foreign Affairs), Norway (Royal Ministry of Foreign Affairs), Sweden (Swedish International Development Cooperation Agency—Sida) and the United Kingdom (Department for International Development) to the Institute’s overall research programme and activities. ISSN 1810-2611 ISBN 978-92-9230-169-9 Research Paper No. 2009/02 Globalization and the Role of Public Transfers in Redistributing Income in Latin America and the Caribbean Emmanuel Skoufias,* Kathy Lindert, and Joseph Shapiro January 2009 Abstract This paper focuses on measuring the extent to which publicly subsidized transfers in Latin America and the Caribbean redistribute income. The redistributive power of 56 transfers in eight countries is measured by their simulated impacts on poverty and inequality, and by their distributional characteristic. Our findings suggest that public transfers can be effective instruments to redistribute income to the poor. Yet frequently they have not managed to do so. The redistributive impacts from social insurance are limited—and even regressive in some countries. This is due to two design factors: a ‘truncation’ in coverage due to requirements of membership in formal labour markets which exclude the majority of the poor, and highly generous unit benefits for those in the upper quintiles. The more recent emergence of social assistance only partially offsets this historical truncation of public transfers in the region. Despite coverage and distributional patterns that favour the poor, small unit subsidies limit the redistributive, poverty and inequality impacts of even the most targeted social assistance programmes. We also find considerable variation among social assistance programmes, with many food based programmes and scholarships being regressive. Keywords: social protection, insurance, redistribution, targeting, poverty, inequality, welfare JEL classification: D31, H55, I31, I38
Transcript of Globalization and the role of public transfers in redistributing income in Latin America and the...
Copyright © UNU-WIDER 2009 * World Bank, email: [email protected] This is a revised version of a paper originally prepared for the UNU-WIDER project conference on The Impact of Globalization on the Poor in Latin America, directed by Professors Machiko Nissanke and Erik Thorbecke. The conference was organized in Rio de Janeiro, in collaboration with Pontifícia Universidade Católica do Rio de Janeiro, 23–24 September 2006. UNU-WIDER gratefully acknowledges the financial contribution of the Finnish Ministry of Foreign Affairs to this project, and the contributions from the governments of Denmark (Royal Ministry of Foreign Affairs), Norway (Royal Ministry of Foreign Affairs), Sweden (Swedish International Development Cooperation Agency—Sida) and the United Kingdom (Department for International Development) to the Institute’s overall research programme and activities. ISSN 1810-2611 ISBN 978-92-9230-169-9
Research Paper No. 2009/02 Globalization and the Role of Public Transfers in Redistributing Income in Latin America and the Caribbean
Emmanuel Skoufias,* Kathy Lindert, and Joseph Shapiro January 2009
Abstract
This paper focuses on measuring the extent to which publicly subsidized transfers in Latin America and the Caribbean redistribute income. The redistributive power of 56 transfers in eight countries is measured by their simulated impacts on poverty and inequality, and by their distributional characteristic. Our findings suggest that public transfers can be effective instruments to redistribute income to the poor. Yet frequently they have not managed to do so. The redistributive impacts from social insurance are limited—and even regressive in some countries. This is due to two design factors: a ‘truncation’ in coverage due to requirements of membership in formal labour markets which exclude the majority of the poor, and highly generous unit benefits for those in the upper quintiles. The more recent emergence of social assistance only partially offsets this historical truncation of public transfers in the region. Despite coverage and distributional patterns that favour the poor, small unit subsidies limit the redistributive, poverty and inequality impacts of even the most targeted social assistance programmes. We also find considerable variation among social assistance programmes, with many food based programmes and scholarships being regressive.
Keywords: social protection, insurance, redistribution, targeting, poverty, inequality, welfare JEL classification: D31, H55, I31, I38
The World Institute for Development Economics Research (WIDER) was established by the United Nations University (UNU) as its first research and training centre and started work in Helsinki, Finland in 1985. The Institute undertakes applied research and policy analysis on structural changes affecting the developing and transitional economies, provides a forum for the advocacy of policies leading to robust, equitable and environmentally sustainable growth, and promotes capacity strengthening and training in the field of economic and social policy making. Work is carried out by staff researchers and visiting scholars in Helsinki and through networks of collaborating scholars and institutions around the world.
www.wider.unu.edu [email protected]
UNU World Institute for Development Economics Research (UNU-WIDER) Katajanokanlaituri 6 B, 00160 Helsinki, Finland Typescript prepared by Lisa Winkler at UNU-WIDER The views expressed in this publication are those of the author(s). Publication does not imply endorsement by the Institute or the United Nations University, nor by the programme/project sponsors, of any of the views expressed.
Tables and figures appear at the end of this paper.
1
1 Introduction
The recovery of economic growth in most countries of Latin America and the Caribbean (LAC) by the 1990s has been accompanied by the world wide trend towards globalization and increased pressure to be competitive. These developments have led to increased concerns not only about the drivers of international competiveness, but also about the ability of LAC countries to protect the poorer segment of their population from economic shocks that are easily propagated in an increasingly interdependent economic environment. For example, the increased pressure to be internationally competitive has led to the recognition that investments in education and skills of labour can be a means of not only alleviating poverty, but also of increasing competitiveness in the international sphere. At the same time, the recent increasing trend in food prices and the current financial crisis originating in the US mortgage market, have increased concerns about the poverty, inequality, and redistributional impacts of economic shocks associated with globalization (World Bank 2008).
The social policies in LAC countries that have evolved in over the last decade can be characterized by two key features: stronger social safety nets that target resources to the poor and vulnerable, and transfer programmes conditioned on investments in human capital. The experience gained during the earlier years of import substitution policies suggested that a targeted approach to safety nets may be more sustainable, at least fiscally, than widespread subsidies to goods and services as an instrument of social policy towards protection from poverty. Additional key instruments of social policy towards poverty alleviation and redistribution include the conditional cash transfer (CCT) programmes, such as Oportunidades in Mexico, Familias en Accion in Colombia, Bolsa Familia in Brazil, and other related programmes in Ecuador, Nicaragua, Honduras, Peru, and Chile, that combine redistribution of income with incentives towards household investment in education, health, and nutrition.
This paper, extracted from a larger regional study by Lindert et al. (2006), provides one of the first investigations of the redistributive outcomes of 56 public transfer programmes adopted in eight countries in LAC: Argentina, Brazil, Chile, Colombia, the Dominican Republic, Guatemala, Mexico, and Peru.1 Cross-country evidence on the extent to which some types of transfer programmes are better instruments of social protection and redistribution of income than others, allows for a more informed assessment of the role and nature of social policy in an economic environment of increasing competition for public resources.
Social assistance and social insurance
The literature on social protection generally distinguishes between two categories of public transfers: social insurance and social assistance. This distinction often builds on the social risk management concept in which social insurance helps people mitigate the impact of risks, while social assistance helps households cope with risks. In addition to risk coping, many social assistance programmes focus largely on helping raise the
1 The full regional study can be accessed at the link: http://web.worldbank.org/WBSITE/EXTERNAL/COUNTRIES/LACEXT/0,,contentMDK:20871694~pagePK:146736~piPK:146830~theSitePK:258554,00.html
2
consumption levels of the chronic poor. Another common distinction involves sources of funding, with social insurance largely drawing on contributions and social assistance being non-contributory.
In general the classification of public transfers into social insurance and social assistance using a single classification is bound to raise some criticisms. To minimize such problems we distinguish between social assistance and social insurance transfers: objectives, eligibility requirements, and financing.2
Social assistance transfers commonly have the explicit objectives of reducing poverty and inequality. In contrast, the core objectives of social security and other social insurance systems are to prevent poverty among the elderly and smooth consumption profiles over a person’s lifetime (combining elements of inter-temporal individual savings and risk pooling).3 Nonetheless, many recognize that social security systems also play an important role in society’s income redistribution policies (equity aspects), particularly with pay-as-you-go or multi-pillar systems. As such, we consider social assistance and (net) social insurance programmes side-by-side as explicit redistributive tools.
A defining characteristic of social insurance programmes in LAC is that they typically tie eligibility to membership in the formal labour market. Since much of the labour force, and particularly the poor, do not work in the formal sector, they are largely missed by these transfer schemes. In contrast, social assistance transfers rarely base eligibility on formal employment. Rather, social assistance programmes generally use the individual or household (not the formal worker) as the assistance unit, provided that they fit certain income or poverty targeting criteria.
The third distinguishing feature is that social insurance programmes usually involve transfers for which beneficiaries make at least partial contributions that involve risk pooling. Put another way, beneficiaries of social insurance transfers know they will receive some benefit back from their contributions into the pooled fund, but the benefit is not necessarily directly proportional to their contributions (and in fact, many public insurance schemes run considerable deficits, as discussed below). Social assistance programmes generally do not require any direct ‘risk-pooling’ contributions from their beneficiaries. Some assistance programmes can involve contributions (for example, a partial payment for a subsidized food), but these contributions involve no pooling of risk (and tend to be minimal).
Given that social insurance is financed by contributions, it is quite reasonable to question the treatment of social insurance payments as ‘transfers’. The basic premise for classifying these benefits as public transfers is that many social security systems in LAC are unfunded, public defined benefit schemes that incur significant tax financed deficits. Despite formal membership contributions, most public social security regimes in LAC run significant deficits due to higher benefits pay-out than collection of contributions. Like social assistance programmes, these pension deficits are financed by general tax revenues and thus constitute ‘public transfers’ or subsidies from the government
2 See Annex 2 in Lindert et al. (2006) for details on classification for specific case-study countries analysed in this paper.
3 Rofman (2005).
3
(taxpayers) to the beneficiary households.4 As such, they clearly have important redistributive impacts that merit investigation.
Indeed, pension deficits in LAC are significant. In Brazil, for example, pension deficits represented 3.7 per cent of GDP in 2003 for the two main pension schemes at the federal level alone—or 40 per cent of total benefits paid out. Add in pension deficit from schemes operated by sub-national governments, and the total pensions deficit climbs to 5.6 per cent of GDP. Similarly, in Argentina pension deficits averaged 3.6 per cent of GDP, or 56 per cent of total benefits paid out, from 1999–2004.5 (for more details on pension deficits for all eight countries included in this analysis see Annex 3 of Lindert et al. 2006).
Clearly, there are many other aspects of the design and performance of pensions systems—such as their affect on national savings, the accumulation of capital, the labour market or the fiscal situation—that can have an indirect impact on equity outcomes. In this paper we assess social insurance transfers in terms of their incidence on poverty and their current redistributive impact—and do not address longer term macroeconomic issues (solvency) nor their indirect impact on equity.
This paper analyses ‘net transfers’ from pensions, defined as the benefits received minus total contributions (i.e., the portion of benefits that is financed by general tax revenues due to deficits in the pension system), rather than gross benefits (defined as full benefits received, as reported in the household survey).6 Again, the basic premise for this is that ‘net pension subsidies’ (net of contributions) compete for tax financed resources with social assistance and other forms of spending, with very different redistributive patterns.
Ideally, the ‘net pension subsidy’ for each individual should be based on the net present value of the pension income received by a pensioner over his whole life, minus the value of his/her contributions to the pension plan over his/her working life.7 The main shortcoming of this approach is the absence of data on an individual’s (historical) pension contributions. In the absence of such data, we adopt an alternative, albeit imperfect, approach.
4 A related argument objects specifically to the classification of civil servant pensions as public transfers. The argument usually runs along the lines of ‘the general tax revenues used to pay civil servant pensions are the employer contributions, and in this case, the employer is the government’. This argument has a point, but the question is an issue of magnitude—civil servant pensions tend to be very large—and also the fact that even with mandated contributions, these schemes run significant deficits. Brazil’s federal civil servant pension scheme, for example, ran a deficit of about 1.7 per cent of GDP—almost the same deficit as the publicly-managed pension scheme for a much larger number of private sector workers. Moreover, civil servants tend to be at the higher end of the income spectrum, so these large tax-financed deficits are going largely to the rich, as our paper demonstrates below.
5 Source: Dirección de Análisis de Gasto Publico y Programmeas Sociales. 6 It is important to note that we have also carried out the same analysis using gross rather than ‘net’
pension transfers without any notable change in the findings reported for the net pension transfers. 7 Afonso and Fernandes (2006) estimate expected contributions and benefit flows for a representative
group of households over the period from 1976 to 1999 for Brazil, using data from the national household survey (PNAD).
4
For all countries, we use public accounts data (see Annexes 2 and 3 in Lindert et al. 2006) and estimate the ‘average net subsidy coefficient’ which equals: (total benefits paid out minus total contributions received) / (total benefits paid out). The pension received by an individual (as reported in the household survey) is then multiplied by this average net subsidy coefficient. While this approach attempts to allow for the fact that pensions are partially contributory, it involves a number of implicit assumptions. For example, the calculation of the average net transfer coefficient assumes implicitly that the current contributions to the pension system represent the history of contributions of the current beneficiaries. This assumption ignores the substantial heterogeneity that may exist among the earlier contributions of the current participants in the pension system. Some of the current participants, for example, may have contributed nothing while others may have contributed more than they receive (in net present value terms). Moreover, this heterogeneity may not be neutral across the income distribution.
With these considerations in mind, the rest of the paper is organized as follows. Section 2, presents the measures of redistribution used to evaluate the extent to which public transfers redistribute income and impact on social welfare. Section 3 discusses the data sources and the measures of welfare employed, while Section 4 present the main results. Section 5 presents some conclusions and policy implications.
2 Measuring redistribution
To measure the impact of transfers on poverty and inequality, we present poverty and inequality indices before and after the transfer. We use the Foster–Greer–Thorbecke (FGT: 1984) family of the poverty headcount (α =0), poverty gap (α =1), and poverty severity (α =2) with all transfers:
∑∑ ≤Λ−
h
hhh
w
wzyzy )()1( α
(1)
where Λ (.) as an indicator function that takes the value 1 if its argument is true and 0 otherwise. wh
represents the number of persons in the household multiplied by the household weight in the survey, and yh represents the reported income or consumption of a household, and z equals a poverty line, which we set equal to the greatest income in the bottom quintile of the country’s income distribution. Since we use probabilistic household surveys for estimation and desire information that represents the country rather than the sample, we use a database of households but weights equal to wh for all indices.
For each transfer, we present the same FGT index without the per capita value of the transfer dmh to household h, i.e.:
( )∑
∑ ≤−Λ−−h
hhhhh
w
wzdmyzdmy )()1( α
(2)
The inequality statistics with and without transfers are constructed along similar lines. The social welfare impact of transfers is measured using a measure known as the
5
distributional characteristic index (DCI).8 This measure has the advantages of allowing for an analysis of the redistributive impact of transfers that (a) takes into account the full spectrum of households (not just certain quintiles); (b) allows one to asses how much better or worse one transfer programme is compared to another; and (c) is independent of the different sizes of their budgets. The distributional characteristic offers several advantages over other statistics of redistribution such as coverage, absolute and relative incidence, and related measures, such as the Coady et al. (2004) CGH measure.
First, the distributional characteristic makes value judgments—in particular, concern for the poor relative to concern for the rich—transparent and flexible. Second, the distributional characteristic allows for a broader class of social welfare functions than other measures permit. Third, the distributional characteristic avoids the controversy and difficulty of specifying a poverty line. Kanbur and Squire (2001) note one drawback of measures that assign zero welfare to marginal income of households above a poverty line: the well-being of someone just above a poverty line is similar to the well-being of someone just below a poverty line. Pritchett (2004) similarly argues that in describing well-being, a social welfare function should be ‘non-paternalistic’. The use of low poverty lines has difficulty passing this test. Fourth, the DCI is useful for analysing redistributive effectiveness because it allows for the quantitative comparison of how much better or worse programmes are relative to each other independently of the (different) sizes of their budgets. In other words, for programmes with the same budget, a programme with a larger distributional characteristic is a programme that has a greater effect on social welfare. Fifth, the distributional characteristic can be decomposed into the welfare effect achieved through the selection of beneficiary households (targeting) and through varying the size of transfers across beneficiary households (redistribution). Like other indices, the distributional characteristic allows for analysis of the impact of programme reforms from an initial, imperfect situation, and it allows quantitative comparison across programmes of how much better one programme is than another. Sixth, the distributional characteristic takes into consideration all the households in the economy by assigning welfare weights to every household. Moreover, the concern of the society towards the poor people may be allowed to vary by changing the value of a single parameter. Undercoverage and leakage for example, judge a programme by whether a poor or non-poor household or not is covered by the programme, without taking into consideration the fact that the ‘rich’ household participating in the programme may be actually just above the poverty line and not from the top of the income distribution. Similarly the severity of poverty measure P(2) tends to assign welfare weights to households below the poverty line while those just above the poverty line are given zero welfare weights.
To derive the distributional characteristic, consider an economy with two groups, households and government, and a programme with a fixed transfer budget B.9 Social welfare is specified as a standard Bergson–Samuelson function:
8 For related applications of the DCI the reader is referred to Coady and Skoufias (2004) and Skoufias and Coady (2007).
9 To keep things simple, we do not concern ourselves with the source of funds (e.g., taxing the richer households) for the budget allocated to poverty alleviation since one can think of this source of funds as being the same across competing programmes and thus cancelling out in comparisons.
6
( ) ( ) ( )[ ]HHhh ypVypVypVW ,,...,,,...,, 11 (3)
where ( )ypV h , is the indirect utility function for household h, p is the vector of commodity prices faced by the household and y is total household income defined through the household budget constraint as:
hhhh pxmwly =+=
where w is a vector of factor prices, hl is the supply of factors by the household, hm is lump sum transfers from the government to the household, and hpx is total household expenditures on commodities. Household indirect utility is assumed to be decreasing in commodity prices, increasing in factor prices and increasing in lump sum transfers. A transfer programme can be characterized by a vector 1,..., ,...,h Hdm dm dm dm⎡ ⎤= ⎣ ⎦ where
0>hdm for beneficiary households and 0=hdm for non-beneficiary households. The social welfare impact of any transfer programme is then:
∑ ∑≡∂∂
∂∂=
h hhhh
h
h
h dmdmmV
VWdW β (4)
where hβ (the ‘welfare weight’) is the social value of extra income to household h. Multiplying and dividing the right hand side of (4) by the programme budget
∑=h
hdmB gives:
∑ ∑∑∑∑≡≡=
h hh
hhh
hh
hh
hh Bdmdm
dmdmdW λθββ (5)
where hθ is the share of the transfer budget going to each household and ∑=
hhhθβλ .
Equation (5) can be used to highlight a number of important points on the welfare effect of programmes. The term λ , also called the distributional characteristic (or DCI) of the programme, represents the marginal benefit of distributing a unit of income (US$1) through a transfer programme relative to the marginal cost (i.e., the budget ). Thus the value of λ does not depend on the size of the programme budget and a comparison of the values of λ across different programmes allows to compare the social value of distributing income through different programmes independently of the programmes’ budgets. The full welfare effect of a programme is described by the product of λ with the size of the programme budget B. Thus programmes with the same value of λ but higher budgets are likely to have a higher effect of social welfare. Alternatively, Equation (5) implies that if the budget B is the same across all alternative programmes considered then a comparison of the values of λ for each programme provides ‘a sufficient statistic’ of the welfare effect of programmes.10
10 Also, given any two programmes i and j, with ji λλ < the ratio ji λλ provides an estimate of the budget savings that can be realized through allocating resources from programme i to the better
7
As Equation (5) highlights, the distributional characteristic is weighted average of welfare weights of the social welfare impact of a transfer instrument multiplied by the share of the transfer going to each household. Therefore λ will differ across transfer programmes both because welfare weights differ across households and because the structure of transfers (i.e. who receives them and how much) differs across programmes. The greater the proportion of the budget ending up in the hands of the poorest households, the greater the distributional characteristic. The calculation of λ thus requires specifying welfare weights for each household. A useful and common method for specifying these weights derives from Atkinson’s (1970) constant elasticity social welfare function. In that function, the relative welfare weight of household h is calculated as:
ε
β ⎟⎠⎞
⎜⎝⎛= h
kh
yy
(6)
where k is a reference household. Often that reference household is on the poverty line z, so zyk = . In Equation (6), ε captures aversion to inequality, with aversion increasing in ε. For example, ε = 0 implies no aversion to inequality—a dollar has a dollar of value regardless of who receives it—so all welfare weights take on the value unity. A value ε = 1 implies that if household h has twice (half) the income of household k, then the welfare weight of household h is 0.5 (2.0) but the welfare weight of household k is unity. As ε approaches infinity, the welfare impact of transfers to the poorest household dominates the evaluation, consistent with a Rawlsian maxi-min social welfare perspective where one cares only about the welfare impact on the poorest household. For example, if we divide households into income quintiles and attach to them a welfare weight based on quintile mean income, then as ε increases, the ranking of programmes will be increasingly influenced by the share of transfers going to the poorest quintile. Specifying welfare weights using greater values of ε can incorporate concern for poverty without introducing sharp distinctions between poor and non-poor households.
A particular value of the distributional characteristic can be interpreted as the number of units social welfare generated per dollar transferred. For transfers with many beneficiaries, a more direct explanation is difficult. But for a transfer with only one beneficiary, the distributional characteristic would equal the marginal utility of that beneficiary.
The distributional characteristic can be decomposed into two indices; each index is both conceptually and empirically useful. Define dm* as the average transfer to beneficiaries, i.e., the total amount of transfers divided by the number of beneficiaries, where beneficiaries are those with dmh > 0. Then add and subtract dm* across all beneficiaries, so for all non-beneficiaries dm* = 0, to get:
( )RT
hh
hhh
hh
hh
dmdmdm
dmdm
λλββ
λ +=−
+=∑
∑∑∑ **
(7)
targeted programme j (i.e., a programme with the highest λ ) under the maintained assumption that the two programmes have the same welfare effect ( )ji dWdW = .
8
where Tλ is the targeting efficiency and Rλ is the redistributive ‘sizing’ efficiency of the transfer instrument. So Rλ captures the welfare impact, keeping targeting constant, of deviating from uniform transfers. Also, Tλ captures the welfare impact of a programme that divides B into equal amounts and gives them to the same beneficiary households, and Rλ is the adjustment that needs to be made to allow for the differentiation of transfer sizing across households in a more progressive ( Rλ > 0) or regressive ( Rλ < 0) manner. For programmes that give every beneficiary identical transfers, Rλ = 0. The sense in which Rλ captures the redistributive efficiency of the policy instrument is made clearer by interpreting it as the welfare impact of a self-financing programme that transfers kdm to households and finances transfers by a lump sum tax on all beneficiary households, i.e., all households with kdm > 0.
3 Data
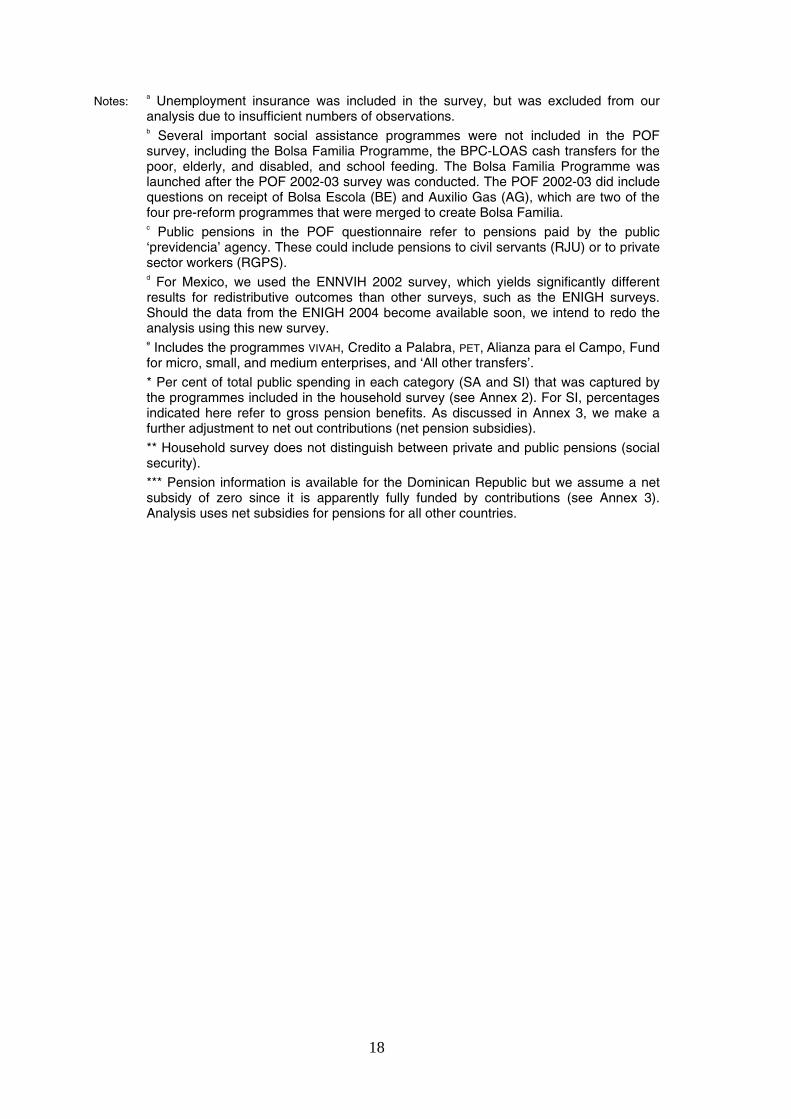
Large household surveys offer the most direct way to empirically measure the outcomes of transfers. This paper presents redistributive outcomes from household surveys for 56 public transfer interventions in eight LAC countries: Argentina, Brazil, Chile, Colombia, the Dominican Republic, Guatemala, Mexico, and Peru. Several reasons motivated the selection of these eight countries. First, each offers a recent and large household survey with information on specific public transfers.11 Second, these countries represent a range of social protection systems. As discussed above, LAC countries can be divided into a stylized typology of three types of countries according to their level and mix of spending on social protection transfers. The countries selected for case studies in this paper represent a mix of countries from each of these three stylized groups.
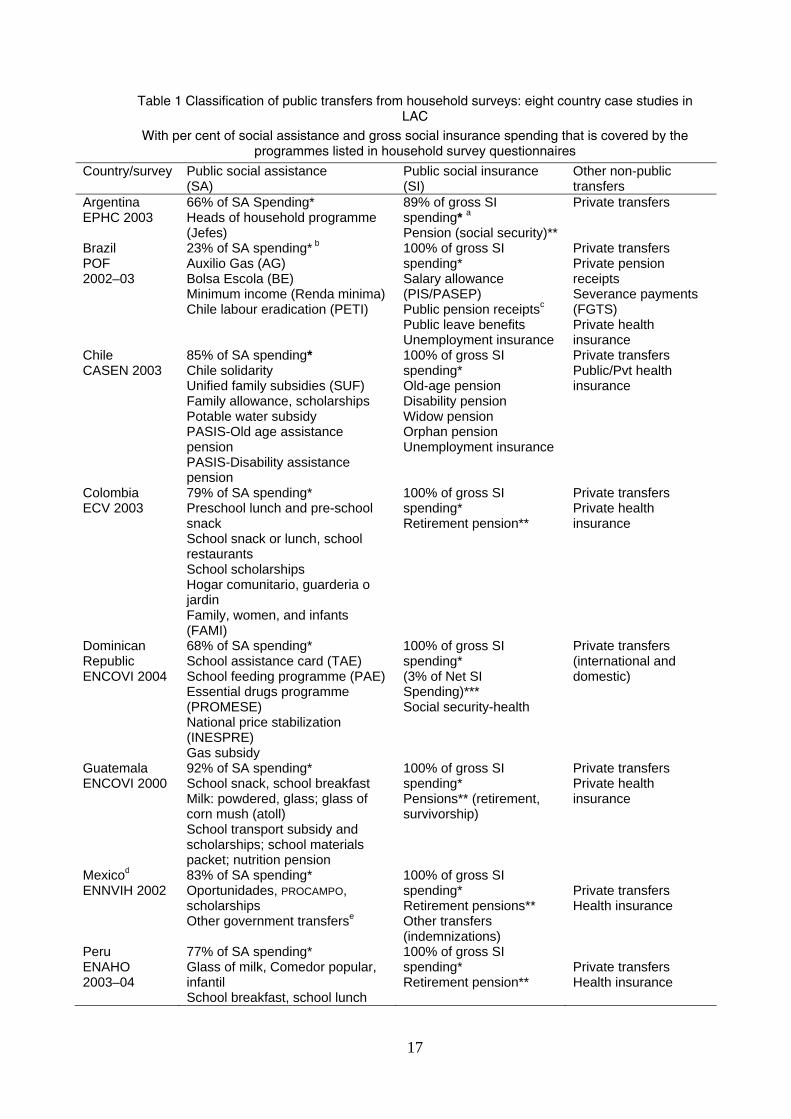
The inclusion of questions on specific transfers in household survey questionnaires drives the extent to which we can measure the redistributive effectiveness of these transfers. Table 1 lists the social assistance and social insurance transfers, as well as other ‘non-public’ transfers, that were included in household surveys—and hence in our analysis of the redistributive impacts of transfers in our eight case study countries. It also indicates what share of total public social assistance and social insurance spending were ‘captured’ by the transfers included in the household survey questionnaires (see Annex 2 in Lindert et al. 2006 for more details).
The household surveys capture most (gross) pension spending for the countries in our sample. Nonetheless, the share of spending on social assistance captured in household surveys varies significantly, ranging from 23 per cent of social assistance spending in Brazil to 92 per cent for Guatemala. This raises some important caveats with respect to the inclusion of social assistance programmes in our analysis. Notably, due to data limitations (and the fact that the analysis is ‘hostage’ to the specific programmes
11 A longer list of countries was initially considered. Some, such as Costa Rica, Jamaica, and Uruguay, were excluded (despite significant spending on public transfers and/or existence of programmes of interest) because the household surveys available at the time the analysis was conducted did not include sufficient detail on receipt of specific programmes. Others, such as El Salvador and Paraguay were excluded because of limited existence of public transfer programmes (and low spending), and consequently, low coverage of such programmes in household surveys.

9
captured in single year cross-section surveys), some important social assistance programmes were inevitably left out. Broadly speaking, several notable workfare programmes, such as Argentina’s former Trabajar programme,12 and Colombia’s Empleo en Acción, were excluded from the analysis because they were not included in the household surveys in question. Some early childhood development or nutrition programmes were included in household surveys and hence our analysis (if they involved a significant cash or in-kind transfer component), but the social service aspects of many ECD and related programmes were underrepresented in the surveys. Social funds were also left out since they involve transfers to communities and not households, and as such were not captured in the household surveys. In some instances, specific notable programmes—such as Brazil’s BPC-LOAS disability and elderly assistance and Colombia’s Familias en Acción were not included in the household survey questionnaires.
Other methodological caveats
All of our empirical measures of the redistributive power of public transfer programmes are based on some implicit assumptions that might have an effect on the conclusions that are drawn from these measures. It is thus necessary to state these implicit assumptions up front. Our preferred measure of welfare is household consumption per capita inclusive of all the public and private received (see Annex 5 in Lindert et al. 2006, for a more detailed discussion of estimating redistribution in practice).13 In three of the countries (Argentina, Chile, and the Dominican Republic) where a consumption measure is either not available or problematic, we use household income inclusive of all public and private transfers received. The sensitivity tests that we conducted suggest that that these assumptions have relatively little influence on the resulting estimates of the redistributive impact of transfers. In addition, in the calculations of the impact of the public transfers on poverty, inequality, and welfare, it is assumed that the removal (or receipt) of the public transfer does not have any significant effects on household labour supply behaviour. Although the sensitivity of our findings to this latter assumption was not investigated, the limited evidence that is available on this issue suggests that this may not be a serious cause of concern.
The eight household surveys used in this study have similar structures but varied methodological details. All but Guatemala’s ENCOVI survey conducted interviews in 2002, 2003, or 2004. All the surveys have national coverage except Argentina, which surveyed only urban areas. In Brazil, Colombia, Guatemala, Mexico, and Peru, the four surveys for which we use consumption data, we measure welfare by per capita consumption. For Argentina, Chile, and the Dominican Republic we measure welfare by per capita income. When available, we use the welfare aggregate that the survey’s implementing agency constructed. For the Guatemala survey, we use the consumption aggregate constructed by the National Institute of Statistics (INE) and used in the Guatemala poverty assessment (World Bank 2003b). For the Colombia survey we use
12 In fact, other programme-specific analyses show that Argentina’s former Trabajar public works programme was quite progressive (well-targeted), with a Coady-Grosh-Hoddinott Index of 4.00 (higher than programmes included in our sample). The programme, however, was phased out and replaced by the Household Heads programme analysed in this paper.
13 Note that, unless otherwise specified, all results are on a per capita basis using quintiles ranking individuals on post-transfer incomes or consumption.
10
the consumption aggregate that Nuñez and Espinosa (2004) constructed. We use IBGE’s consumption aggregate for Brazil and construct the consumption aggregate for Mexico following Deaton and Zaidi (2002). All details of consumption and income aggregates appear in Table 1. We include the value of transfers in consumption aggregates, and we measure per capita consumption as the household’s total consumption divided by the number of individuals in the household.
4 Results
Household surveys allow us to estimate inequality and poverty indices before and after transfers, though these estimates do not take into account possible behavioural responses to either scenario (e.g., possible reduced work effort due to the transfers).14
4.1 Public transfers and inequality
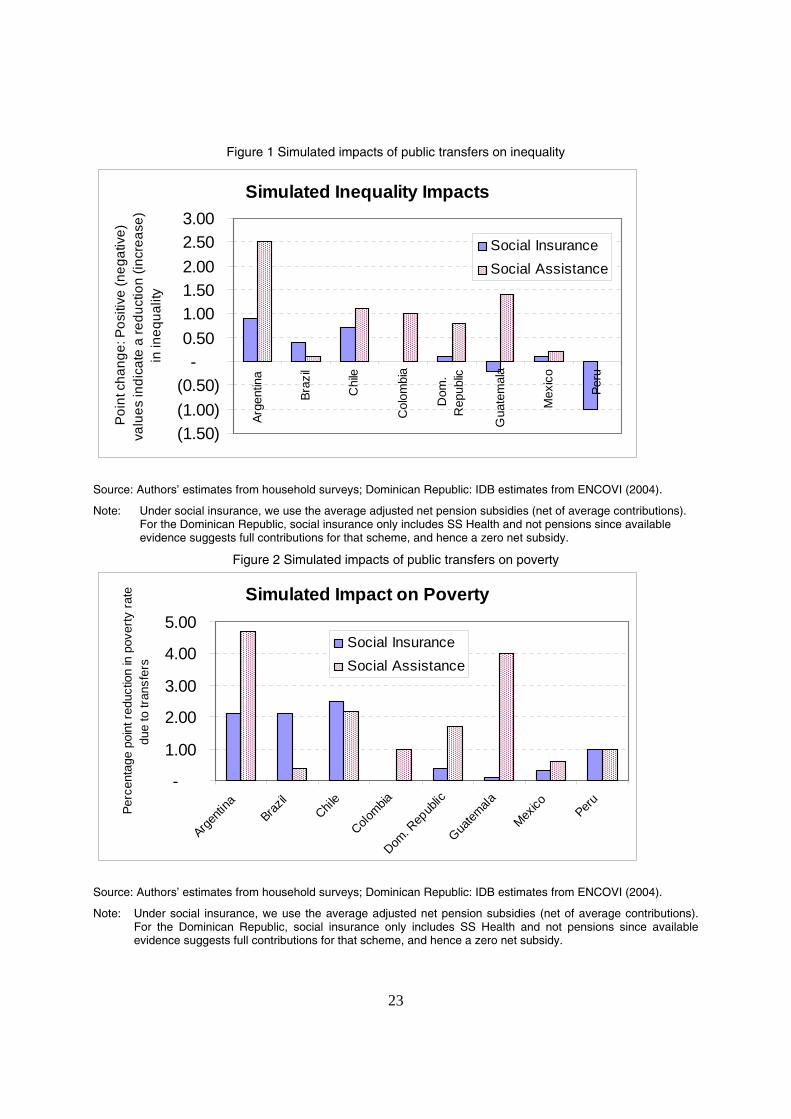
The impact of public transfers on inequality is examined via simulated impacts on inequality (Ginis) with and without the transfers.15 Figure 1 reveals that the impacts of existing public transfers on inequality in LAC are fairly muted. Social assistance has a stronger impact in reducing inequality than social insurance. Interestingly, social assistance does reduce inequality by more than a ‘Gini’ point in several countries, despite relatively small unit transfers. The impact is largest for Argentina’s social assistance (Jefes programme), due to higher unit subsidies associated with a fairly well targeted programme. Inequality impacts of social assistance transfers in Brazil appear to be lower, though these impacts could be underestimated due to the fact that the household survey (POF 2002–03) missed capturing several large social assistance programmes (notably: BPC-LOAS for the poor elderly and disabled, and the integrated and expanded Bolsa Família programme). In fact, evidence from a new household survey (PNAD 2004) suggests that these very social assistance transfers may have played an important role in the notable recent fall in inequality in Brazil.16
The impacts of social insurance on inequality are fairly small—and in some cases these schemes actually increase inequality (Guatemala, Peru). In contrast, social insurance schemes in Argentina, Brazil, and Chile tend to decrease inequality. In each of these countries, although their social insurance schemes are regressive in their own right (i.e., have a positive concentration coefficient) they tend to be less unequally distributed than income from other sources. Consequently, the Gini for pre-transfer inequality (without the social insurance transfers) is higher (more unequal) than the concentration coefficient for the specific social insurance transfers.
14 Since results are based on subtraction of transfer income from household survey income aggregates rather than from experimental or non-experimental estimates of poverty and inequality impact, we refer to reported results as simulated poverty and inequality impacts. However, it is useful to note, that at least in the short run, estimates based on the experimental designs of a conditional and an unconditional cash transfer programme suggest that transfer programmes have no effect on the labour supply of beneficiary households in the rural areas (e.g., Skoufias and di Maro 2008; Skoufias et al. 2008).
15 This approach ignores possible behavioural responses (e.g., with households adapting their labour market participation in either scenario).
16 Ferreira et al. (2006).
11
4.2 Public transfers and poverty
Figure 2 reveals that the poverty impacts of public transfers vary significantly across countries in LAC. These impacts depend on a number of factors, including (a) the size of unit transfers (which reflects overall spending effort); and (b) targeting and coverage of the poor and near poor (which reflect the extent to which transfers actually reach lower income households). As such, in some countries and for some transfers, these factors converge to make a relatively strong impact. Argentina’s social assistance (Jefes programme) is one such example, combining fairly strong targeting, coverage, and high unit transfers.17 A contrasting example is Brazil’s social assistance (mainly the pre-reform CCTs included in the POF 2002–03 survey): despite strong targeting and coverage of the poor, their poverty impact is muted by very low unit transfers.
With social insurance, some countries—such as Colombia, the Dominican Republic, Guatemala, and Mexico—record negligible poverty impacts, due to a combination of relatively low (net) unit subsidies and very weak targeting and coverage of the poor and near poor. In contrast, despite weak targeting and overall regressivity, social insurance schemes still do manage to have an important poverty impact due to very high unit subsidies (i.e., the small share of social insurance transfers that do reach poorer households represents a significant share of their incomes).
4.3 Impacts of public transfers on social welfare: the distributional characteristic
The typical measures of redistribution, such as coverage and absolute and relative incidence, all emphasize different aspects of transfers, on their own, but they are of limited use in simultaneously addressing the issues of magnitude (size) and redistribution (targeting). Most social assistance programmes, for example, have coverage and absolute incidence that generally favour those at the poorer end of the spectrum, but their unit values are typically small, hence dampening their impact on poverty and inequality. In contrast, although the (net) unit values of social insurance programmes are far more generous, the coverage and distribution of these benefits are highly biased in favour of the rich, hence weakening their potential poverty and inequality impacts.
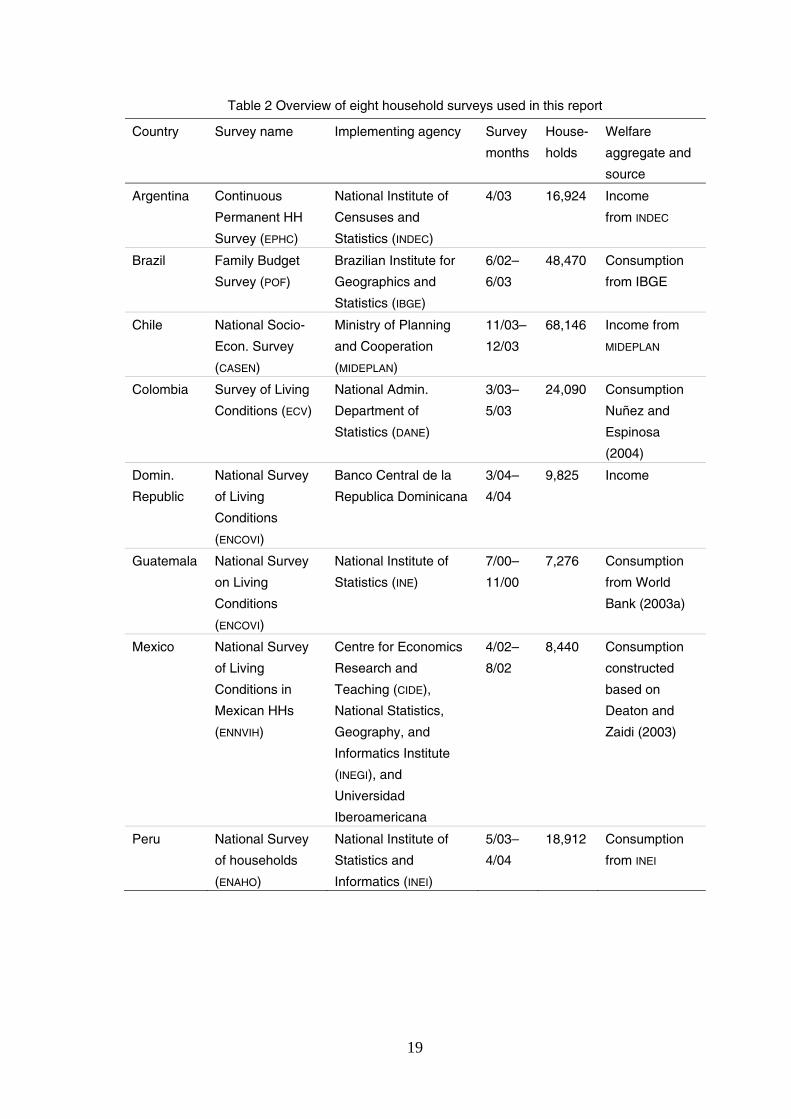
Standardizing budgets and taking into account the full spectrum of households in this way, the DCI offers several notable conclusions in terms of the redistributive power and social welfare impacts of public transfers in LAC. Countries and programmes are ranked by the DCI in summary Tables 3A, 3B, and 3C. Graphs with notable patterns are presented in Figures 3, 4, and 5.
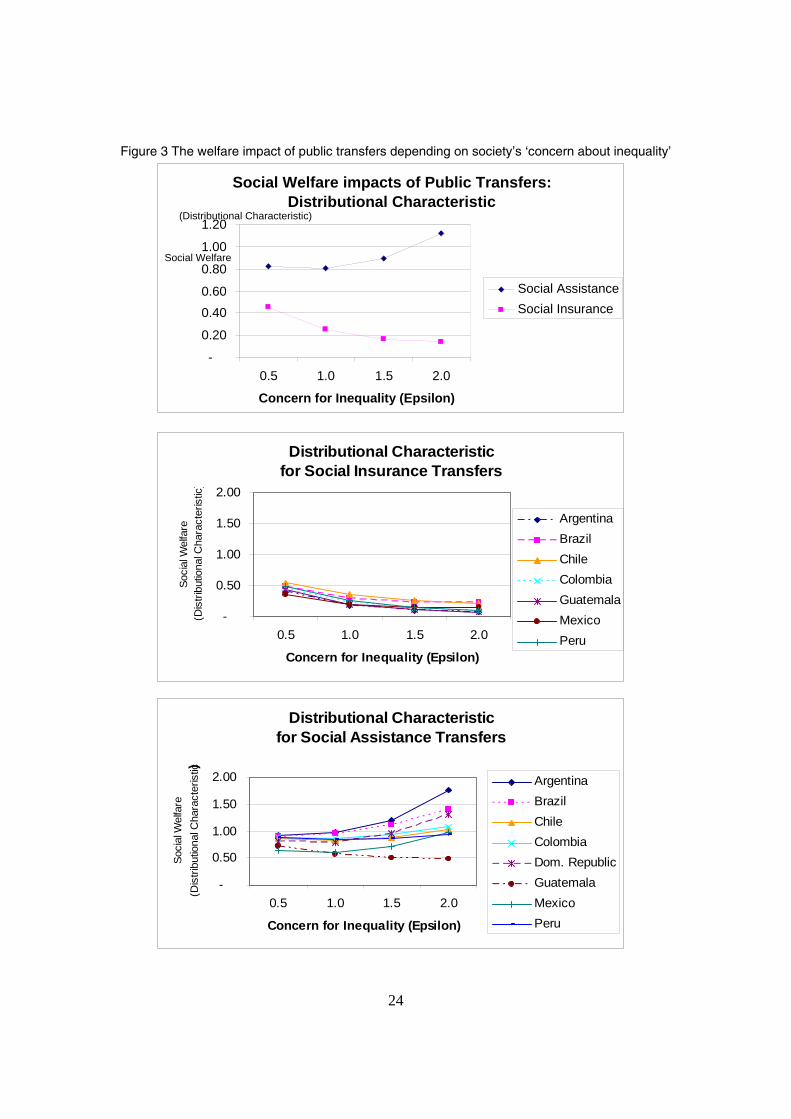
First, social assistance programmes are far more effective than social insurance programmes at redistributing income and contributing to social welfare, per unit of currency transferred (Figure 3). This is not unexpected, particularly given that the primary aim of most social assistance programmes is to reduce poverty and since social assistance programmes are not generally linked to formal labour market participation (unlike social insurance). Yet the range of this difference is astonishing. For all countries in our sample, the per-dollar social welfare contributions of social assistance
17 Admittedly, these simulations do not take into account possible behavioural responses, such as work effort, which could be higher with higher unit transfers, as discussed for Argentina below.
12
(DCI) exceed those for social insurance regardless of the degree of ‘concern for inequality’ (all values of epsilon; Figure 3).
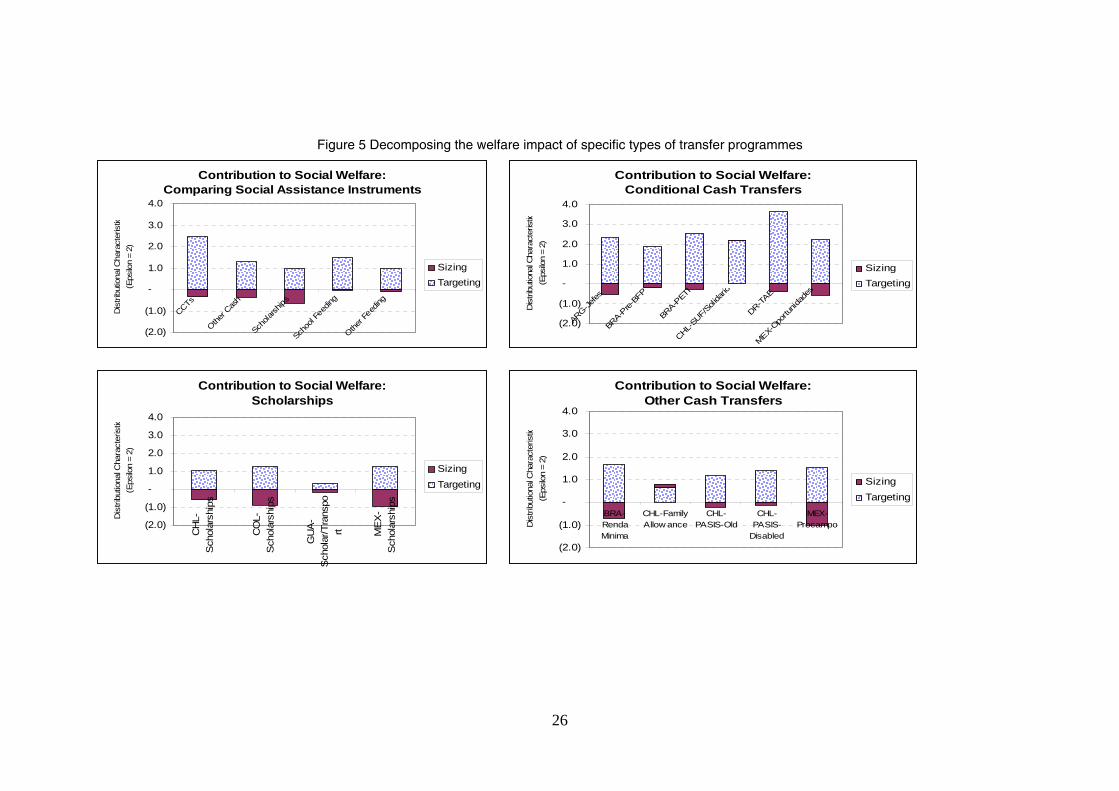
Second, the main social welfare gains arise from ‘targeting efficiency’ rather than progressively differentiated ‘sizing’ of unit transfers. This result holds across countries and types of transfers in our sample. In fact, the ‘sizing’ component is negative (regressive) in many instances (Figures 4 and 5). As such, most public transfer programmes redistribute income through targeting (i.e., making an effort to channel benefits to the poor). Few programmes differentiate the size of benefits (unit values) as a way to further redistribute income (e.g., by making larger benefits for poorer or larger households). In fact, as discussed above, most programmes have higher unit benefits for relatively richer households—which has a regressive ‘sizing’ effect on social welfare (Figures 4 and 5). Exceptions to this are Chile’s family allowances and SUF (unified family subsidy) benefits, which assign larger unit transfers to poorer and larger families (Figure 5).
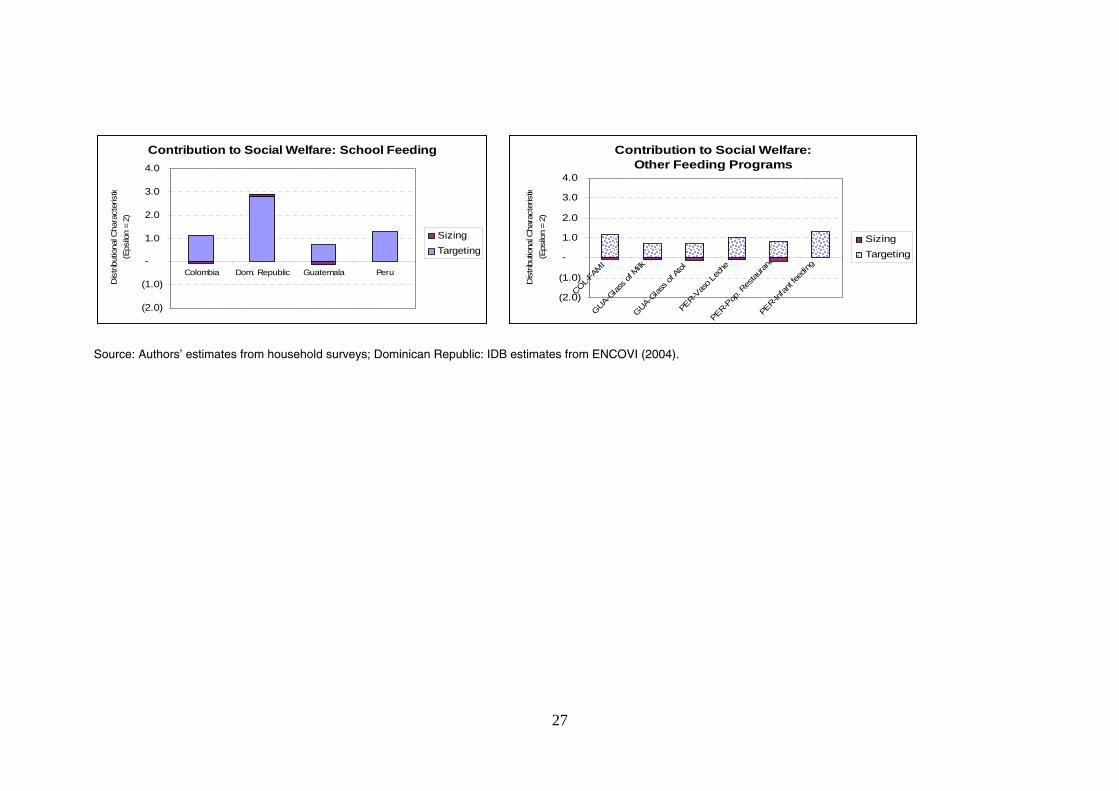
Third, within social assistance, conditional cash transfers result in higher social welfare (DCIs) than other types of cash or food based transfers (Figure 5). On average, the net DCI (combined targeting and sizing components) for CCTs is 2.1, as compared with 1.4 for school feeding programmes, 0.9 for both other feeding and other cash transfers, and 0.4 for scholarships. These results hold for various degrees of ‘concern for inequality’ (various values of epsilon).
Fourth, within specific countries, the distributional characteristic varies considerably across programmes. Some examples:
Argentina: The distributional characteristic of net pension subsidies in Argentina is about 0.08 as compared with 1.76 for the Household Heads (Jefes de Hogares) programme. Thus US$1 distributed through the Jefes programme results in an increase social welfare that is 23 times greater than the change in social welfare achieved through public spending on pensions (net of contributions). Clearly pensions have objectives other than redistribution to the poor (i.e., protecting people in their old age). And clearly contribution financed pensions are important instruments for this objective. But the use of general tax revenues to plug the large deficits in these pensions—which are highly regressive—begs the question of whether or not these public resources could be used more effectively elsewhere (e.g., a well-targeted first pillar minimum pension for the poor).
Brazil: A similar comparison could be made for Brazil’s Bolsa Escola (one of the pre-Bolsa Familia programmes) and publicly financed net pension subsidies in Brazil. The DCI for net pension subsidies is 0.2 as compared with 1.5 for Bolsa Escola. Thus US$1 distributed through Bolsa Escola (now Bolsa Familia) results in an increase in social welfare that is over six times greater than the associated change in social welfare achieved through tax financed net pension subsidies. Taking a more comparable set of programmes, unemployment insurance—though regressive overall—is more effective than the FGTS mandatory savings and severance payment scheme. Specifically, US$1 distributed through unemployment insurance (DCI = 0.35) would deliver an increase in social welfare over three times greater than the change in welfare achieved through FGTS severance payments (DCI = 0.11).
13
Chile. Like for Brazil and Argentina, Chile could gain in social welfare—or save incur fiscal savings—by reallocating tax revenues from social insurance schemes (net subsidies) to social assistance programmes (Table 3A). Interestingly, there could also be gains from reallocating among social assistance programmes. Specifically, Chile could gain in social welfare by reallocating from family allowances to the unified family subsidy (SUF). One dollar distributed through SUF (DCI = 2.31) would deliver an increase in social welfare that is close to three times greater than the change in social welfare associated with family allowances (DCI = 0.79).
Colombia: As with all other countries, Colombia could gain in social welfare—or incur fiscal savings—by reallocating tax revenues towards social assistance programmes (Table 3A). Even the targeting of social assistance programmes, however, could be improved, particularly for scholarships, which are regressive. (This study does not include the conditional cash transfer, Familias en Acción, because it was not included in the survey.)
Dominican Republic: Several social assistance programmes in the survey for the Dominican Republic ranked fairly high in terms of their social welfare impact per dollar spent (e.g., the school-based transfer, TAE, and school feeding, PAE), as shown in Table 3C. These programmes are quite small in terms of budgetary spending and unit subsidy values. Others, such as the gas subsidy (DCI = 0.92), did not have such strong social welfare impacts. Since the ENCOVI 2004 survey was carried out, the government has initiated two conditional cash transfer programmes (Comer es Primero and ILAE) to replace the TAE programme, and proposed changes in the gas subsidy. Simulations conducted by the IDB suggest that these reforms could result in significantly higher social welfare impacts, if properly targeted.
Guatemala: None of Guatemala’s social insurance or social assistance programmes have very strong impacts on social welfare, with the DCI ranging from a low of 0.08 for net pension subsidies to 0.64 for the powdered milk/glass of milk programmes (Table 3C). Targeting and programme design overall needs to be improved in Guatemala, which is also one of the lowest SP spenders in our sample.
Mexico: Of all of Mexico’s public transfer programmes, only one—the conditional cash transfer, Oportunidades—has significant social welfare impacts (DCI column in Tables 3A–3C). Unsurprisingly, tax funding of net pension subsidies has a fairly small impact on social welfare (DCI = 0.15). Yet even many social assistance programmes—most of which were regressive—have relatively low social welfare impacts. The social welfare contribution of Oportunidades (DCI = 1.67), which includes transfers tied to school attendance, is far higher than the social welfare impacts of scholarships (DCI = 0.35). Moreover, although the farmer support programme ‘PROCAMPO’ has different objectives than Oportunidades, social welfare impacts are over three times greater under Oportunidades than under PROCAMPO (DCI = 0.53).
Peru: As with all other countries in our sample, the tax financing of pension deficits (net subsidies) generates relatively low social welfare in Peru, as compared with its social assistance programmes. However, even within social assistance, welfare gains could be incurred by reallocating public expenditures or strengthening targeting. For example, Peru could gain in social welfare by reallocating resources from the Glass of Milk programme (DCI = 0.93) to the school feeding programmes, such as school breakfasts (DCI = 1.32), or by improving the targeting of the Glass of Milk programme.

14
Yet none of these food based programmes generates the high social welfare gains observed for the conditional cash transfer programmes (such as SUF/Solidario, Bolsa Escola, Oportunidades) in other countries.
5 Concluding remarks and policy implications
This study informs a broader debate about the consequences of globalization for income inequality. While consensus is elusive on the redistributive effects of globalization, some consensus exists that the effect is non-zero: globalization redistributes income. Understanding the potential of social assistance and insurance to magnify or compensate for the redistributive effects of globalization lends insight as to reasonable social safety nets to implement when countries decrease tariffs and trade barriers and in other ways embrace globalization.
This paper is specifically concerned with the redistributive impacts of social policy, focusing only on a subset of social policy instruments: public transfers (and, specifically, those that were included in household surveys). It is essential, however, to keep in mind that social policy has other important objectives besides redistribution, including (a) smoothing of income over the life cycle in relation to people’s needs; (b) promoting the accumulation of human capital; and (c) ensuring adequate protection against events such as sickness, disability, unemployment, or loss of income. Although these additional objectives are not considered in detail here, they must be taken into consideration when assessing the overall efficiency of public transfers.18
With these caveats in mind, our findings suggest that public transfers can be effective instruments to redistribute income to the poor. But they have not often done so. Specifically, the redistributive performance of social insurance and social assistance transfers can be summarized as follows: Social assistance has a stronger impact in reducing inequality than social insurance.
The impacts of social insurance on inequality are fairly small—and in some cases these schemes actually increase inequality (Guatemala, Peru). In contrast, social insurance schemes in Argentina, Brazil, and Chile tend to decrease inequality.
The poverty impacts of public transfers vary significantly across countries in LAC.
Social assistance programmes are far more effective than social insurance programmes at redistributing income and contributing to social welfare, per unit of currency transferred.
The main social welfare gains arise from ‘targeting efficiency’ rather than progressively differentiated ‘sizing’ of unit transfers. This result holds across countries and types of transfers in our sample. In fact, the ‘sizing’ component is negative (regressive) in many instances (Figures 4 and 5). As such, most public transfer programmes redistribute income through targeting (i.e., making an effort to channel benefits to the poor). Few programmes differentiate the size of benefits (unit values) as a way to further
18 Transfers that are not reaching the poor segments of the population and thus appear to perform poorly from a redistributive perspective, may perform well when examined in terms of the other objectives of social policy.
15
redistribute income (e.g., by making larger benefits for poorer or larger households). In fact, as discussed above, most programmes have higher unit benefits for relatively richer households—which has a regressive ‘sizing’ effect on social welfare.
There is considerable variation in redistributive impacts within the class of social assistance transfers. Too many are regressive. These include scholarships and many food based programmes. Governments should reconsider these programmes—or at least strengthen their design. The relatively high progressivity of CCTs is likely driven by a clear definition of the poor as the target group and the explicit use of targeting mechanisms to determine eligibility, and not on their conditionalities per se. Such design mechanisms could be built into other social assistance programmes, for example using a combination of geographic targeting and individual assessment mechanisms to target needs based scholarships.
The duality of these social insurance and social assistance systems suggests that there is ample room for improvements in the consistency and coordination of social polices. Many countries have undertaken reforms to improve these systems, but such reforms generally follow parallel tracks. A more integrated approach based on a better understanding of the trade-offs in social policies could bring about redistributive and efficiency gains that can allow LAC countries to reap more benefits from globalization (e.g. Grosh et al. 2008).
References
Afonso, L. E., and R. Fernandes (2006). ‘Uma Estimativa dos Aspectos Distributivos a Previdência Social no Brasil’. Draft Working Paper.
Atkinson, A. (1970). ‘On the Measurement of Inequality’. Journal of Economic Theory, 2 (3): 244–63.
Coady, D., and E. Skoufias (2004). ‘On the Targeting and Redistributive Efficiencies of Alternative Transfer Instruments’. Review of Income and Wealth, 50 (1): 11–27.
Coady, D., M. Grosh, and J. Hoddinott (2004). Targeting of Transfers in Developing Countries: Review of Lessons and Experience. Washington, DC: World Bank and IFPRI.
Deaton, A., and S. Zaidi (2002). ‘Guidelines for Constructing Consumption Aggregates for Welfare Analysis’. Living Standards Measurement Study Working Paper 135. Washington, DC: World Bank.
Ferreira, F. H. G., P. G. Leite, and J. A. Litchfield (2006). ‘The Rise and Fall of Brazilian Inequality: 1981–2004’. Working Paper 3876. Washington, DC: World Bank.
Foster, J. E., J. Greer, and E. Thorbecke (1984). ‘A Class of Decomposable Poverty Indices’. Econometrica (52): 761–6.
Grosh, M., C. del Ninno, E. Tesliuc, and A. Ouerghi. (2008). For Protection and Promotion: The Design and Implementation of Effective Safety Nets. Washington, DC: World Bank.
16
Kanbur, R., and L. Squire (2001). ‘The Evolution of Thinking about Poverty’, in G. M. Meyer and J. E. Stiglitz. (eds), Frontiers of Development Economics. New York: Oxford University Press.
Lindert, K., E. Skoufias, and J. Shapiro (2006). ‘Redistributing Income to the Poor and the Rich: Public Transfers in Latin America and the Caribbean’, Discussion Paper 0605. Washington, DC: World Bank.
Núñez, J., and S. Espinosa. (2004). ‘Asistencia Social en Colombia: Diagnóstico y Propuestas’. Documentos CEDE 002027. Bogotá: Universidad de los Andes, Centro de Estudios para el Desarrollo Económico.
Pritchett, L. (2004). Comments on ‘Competing Concepts of Inequality in the Globalization Debate’, in S. M. Collins, and C. Graham (eds), Brookings Trade Forum. Washington, DC: The Brookings Institution.
Rofman, R. (2005). ‘Social Security Coverage in Latin America’. Social Protection Discussion Paper Series 0523. Washington, DC: World Bank.
Skoufias, E., and D. Coady (2007). ‘Are the Welfare Losses from Imperfect Targeting Important?’ FCND Discussion Paper 125. Washington, DC: IFPRI.
Skoufias, E., and V. di Maro (2008). ‘Conditional Cash Transfers, Adult Work Incentives, and Current Poverty’. Journal of Development Studies, 44 (7): 935–60.
Skoufias, E., M. Unar, and T. González-Cossío (2008). ‘The Impacts of Cash and In-Kind Transfers on Consumption and Labour Supply: Experimental Evidence from Rural Mexico’. Policy Research Working Paper 4778. Washington, DC: World Bank
World Bank (2003a). ‘“Social Protection” in Brazil: Equitable, Competitive, Sustainable. Contributions for Debate’. Report 27832. Washington, DC: World Bank.
World Bank (2003b). ‘Poverty in Guatemala’. Report 24221-GU. Washington, DC: World Bank.
World Bank (2008). ‘Rising Food and Fuel Prices: Addressing the Risks to Future Generations’. Paper prepared for the 2008 Annual Meetings. Washington, DC: World Bank.
17
Table 1 Classification of public transfers from household surveys: eight country case studies in LAC
With per cent of social assistance and gross social insurance spending that is covered by the programmes listed in household survey questionnaires
Country/survey Public social assistance (SA)
Public social insurance (SI)
Other non-public transfers
Argentina EPHC 2003
66% of SA Spending* Heads of household programme (Jefes)
89% of gross SI spending* a Pension (social security)**
Private transfers
Brazil POF 2002–03
23% of SA spending* b Auxilio Gas (AG) Bolsa Escola (BE) Minimum income (Renda minima) Chile labour eradication (PETI)
100% of gross SI spending* Salary allowance (PIS/PASEP) Public pension receiptsc Public leave benefits Unemployment insurance
Private transfers Private pension receipts Severance payments (FGTS) Private health insurance
Chile CASEN 2003
85% of SA spending* Chile solidarity Unified family subsidies (SUF) Family allowance, scholarships Potable water subsidy PASIS-Old age assistance pension PASIS-Disability assistance pension
100% of gross SI spending* Old-age pension Disability pension Widow pension Orphan pension Unemployment insurance
Private transfers Public/Pvt health insurance
Colombia ECV 2003
79% of SA spending* Preschool lunch and pre-school snack School snack or lunch, school restaurants School scholarships Hogar comunitario, guarderia o jardin Family, women, and infants (FAMI)
100% of gross SI spending* Retirement pension**
Private transfers Private health insurance
Dominican Republic ENCOVI 2004
68% of SA spending* School assistance card (TAE) School feeding programme (PAE) Essential drugs programme (PROMESE) National price stabilization (INESPRE) Gas subsidy
100% of gross SI spending* (3% of Net SI Spending)*** Social security-health
Private transfers (international and domestic)
Guatemala ENCOVI 2000
92% of SA spending* School snack, school breakfast Milk: powdered, glass; glass of corn mush (atoll) School transport subsidy and scholarships; school materials packet; nutrition pension
100% of gross SI spending* Pensions** (retirement, survivorship)
Private transfers Private health insurance
Mexicod ENNVIH 2002
83% of SA spending* Oportunidades, PROCAMPO, scholarships Other government transferse
100% of gross SI spending* Retirement pensions** Other transfers (indemnizations)
Private transfers Health insurance
Peru ENAHO 2003–04
77% of SA spending* Glass of milk, Comedor popular, infantil School breakfast, school lunch
100% of gross SI spending* Retirement pension**
Private transfers Health insurance
18
Notes: a Unemployment insurance was included in the survey, but was excluded from our analysis due to insufficient numbers of observations.
b Several important social assistance programmes were not included in the POF survey, including the Bolsa Familia Programme, the BPC-LOAS cash transfers for the poor, elderly, and disabled, and school feeding. The Bolsa Familia Programme was launched after the POF 2002-03 survey was conducted. The POF 2002-03 did include questions on receipt of Bolsa Escola (BE) and Auxilio Gas (AG), which are two of the four pre-reform programmes that were merged to create Bolsa Familia.
c Public pensions in the POF questionnaire refer to pensions paid by the public ‘previdencia’ agency. These could include pensions to civil servants (RJU) or to private sector workers (RGPS).
d For Mexico, we used the ENNVIH 2002 survey, which yields significantly different results for redistributive outcomes than other surveys, such as the ENIGH surveys. Should the data from the ENIGH 2004 become available soon, we intend to redo the analysis using this new survey.
e Includes the programmes VIVAH, Credito a Palabra, PET, Alianza para el Campo, Fund for micro, small, and medium enterprises, and ‘All other transfers’.
* Per cent of total public spending in each category (SA and SI) that was captured by the programmes included in the household survey (see Annex 2). For SI, percentages indicated here refer to gross pension benefits. As discussed in Annex 3, we make a further adjustment to net out contributions (net pension subsidies).
** Household survey does not distinguish between private and public pensions (social security).
*** Pension information is available for the Dominican Republic but we assume a net subsidy of zero since it is apparently fully funded by contributions (see Annex 3). Analysis uses net subsidies for pensions for all other countries.
19
Table 2 Overview of eight household surveys used in this report
Country Survey name Implementing agency Survey
months
House-
holds
Welfare
aggregate and
source
Argentina Continuous
Permanent HH
Survey (EPHC)
National Institute of
Censuses and
Statistics (INDEC)
4/03 16,924 Income
from INDEC
Brazil Family Budget
Survey (POF)
Brazilian Institute for
Geographics and
Statistics (IBGE)
6/02–
6/03
48,470 Consumption
from IBGE
Chile National Socio-
Econ. Survey
(CASEN)
Ministry of Planning
and Cooperation
(MIDEPLAN)
11/03–
12/03
68,146 Income from
MIDEPLAN
Colombia Survey of Living
Conditions (ECV)
National Admin.
Department of
Statistics (DANE)
3/03–
5/03
24,090 Consumption
Nuñez and
Espinosa
(2004)
Domin.
Republic
National Survey
of Living
Conditions
(ENCOVI)
Banco Central de la
Republica Dominicana
3/04–
4/04
9,825 Income
Guatemala National Survey
on Living
Conditions
(ENCOVI)
National Institute of
Statistics (INE)
7/00–
11/00
7,276 Consumption
from World
Bank (2003a)
Mexico National Survey
of Living
Conditions in
Mexican HHs
(ENNVIH)
Centre for Economics
Research and
Teaching (CIDE),
National Statistics,
Geography, and
Informatics Institute
(INEGI), and
Universidad
Iberoamericana
4/02–
8/02
8,440 Consumption
constructed
based on
Deaton and
Zaidi (2003)
Peru National Survey
of households
(ENAHO)
National Institute of
Statistics and
Informatics (INEI)
5/03–
4/04
18,912 Consumption
from INEI
20
Table 3A Summary indicators by class of public transfers: social protection, social assistance, and social insurance
CGH CGH DCIAll Benef. Benef. Q5/Q1 Q1 Q5 Q1 Q5 Q1 Q5 For Q1 For Q1+Q2 Epsilon=2
TOTAL SOCIAL PROTECTIONCOL SPT All social protection 19.3 1.9 45% 26% 24% 25% 8.0% 0.8% 1.18 1.02 0.79 MEX SPT All social protection 21.1 9.6 40% 22% 10% 51% 4.1% 0.6% 0.48 0.58 0.47 GUA SPT All social protection 10.1 4.1 64% 39% 12% 29% 8.0% 2.2% 0.59 0.75 0.43 ARG SPT All social protection 79.6 6.9 34% 30% 7% 44% 39.3% 9.1% 0.36 0.49 0.43 CHL SPT All social protection 41.0 7.1 74% 41% 10% 38% 13.0% 4.3% 0.48 0.57 0.41 BRA SPT All social protection 43.3 9.3 54% 43% 7% 52% 9.4% 4.4% 0.34 0.42 0.29 PER SPT All social protection 17.6 46.2 72% 31% 3% 63% 2.6% 6.7% 0.16 0.20 0.17
TOTAL SOCIAL INSURANCE (NET BENEFITS)BRA SIT All social insurance 52.9 6.9 28% 42% 5% 54% 6.9% 4.3% 0.27 0.35 0.23 CHL SIT All social insurance 80.9 6.0 14% 27% 4% 46% 4.2% 4.0% 0.20 0.32 0.22 MEX SIT All social insurance 65.6 4.2 2% 10% 3% 63% 0.8% 0.4% 0.15 0.36 0.16 PER SIT All social insurance 100.1 3.6 1% 20% 1% 68% 0.7% 6.6% 0.05 0.10 0.11 COL SIT All social insurance 23.7 5.6 1% 17% 1% 66% 0.1% 0.6% 0.05 0.12 0.09 GUA SIT All social insurance 20.7 10.1 1% 9% 1% 81% 0.1% 0.7% 0.06 0.09 0.08 ARG SIT All social insurance 106.1 12.0 5% 29% 1% 56% 3.4% 9.0% 0.04 0.14 0.08 DOM SIT All Social Insurance (SS health) 46.1 N.A. 2% 3% 7% 30% 0.3% 0.1% 0.37 0.55 N.A.
TOTAL SOCIAL ASSISTANCEARG SAT All social assistance 35.9 1.7 30% 1% 32% 1% 35.9% 0.1% 1.60 1.80 1.76 BRA SAT All social assistance 6.7 4.1 34% 3% 38% 12% 2.4% 0.0% 1.89 1.65 1.40 DOM SAT All Social Assistance N.A. N.A. 94% 96% 14% 28% 7.1% 0.9% 0.70 0.77 1.3 COL SAT All social assistance 17.0 1.0 45% 9% 33% 6% 7.9% 0.1% 1.67 1.42 1.09 CHL SAT All social assistance 11.9 1.2 69% 19% 28% 10% 8.8% 0.3% 1.40 1.37 1.03 MEX SAT All social assistance 9.6 4.0 38% 15% 20% 31% 3.3% 0.1% 0.99 0.94 0.97 PER SAT All social assistance 1.6 1.2 72% 12% 30% 6% 1.9% 0.1% 1.51 1.36 0.94 GUA SAT All social assistance 9.3 3.4 64% 32% 13% 22% 7.9% 1.5% 0.66 0.83 0.48
Average Unit Value, US$PPP Coverage Abs. Inc Rel. Inc
Note: Authors’ estimations using household surveys. Dominican Republic: IDB estimates from ENCOVI (2004). Using the same general notation as in the text, coverage is
defined as the portion of the population that receives a transfer, or ∑∑ >Λ
h
hh
wwdm )0(
. Absolute incidence represents the portion of a transfer’s total budget received by a population
group: ∑∑
hh
hhh
wdmwgdm
. Relative incidence is the total transfer amount received by a specific group divided by total consumption (income) for that group, i.e.,: ∑∑
hh
hhh
wywgdm
.

21
Table 3B Summary indicators by class of public transfers: social insurance transfers
Note: see Table 3A
CGH CGH DCIAll Benef. Benef. Q5/Q1 Q1 Q5 Q1 Q5 Q1 Q5 For Q1 For Q1+Q2 Epsilon=2
CHL SIP Unemployment 21.6 5.8 1% 0% 18% 35% 0.1% 0.0% 0.92 0.90 0.83 CHL SIP Disability pension 50.0 2.9 2% 1% 9% 23% 0.5% 0.1% 0.45 0.67 0.41 BRA SIP Seguro desemprego 18.6 2.6 2% 2% 8% 26% 0.2% 0.0% 0.39 0.65 0.35 DOM SIP SS-Health 46.1 N.A. 2% 3% 7% 30% 0.3% 0.1% 0.37 0.55 N.A. CHL SIP Orphan pension 29.4 3.9 0% 1% 5% 39% 0.0% 0.0% 0.25 0.48 0.35 CHL SIP Widow pension 59.3 4.7 4% 6% 6% 43% 1.1% 0.6% 0.30 0.42 0.28 BRA SIP Abono salarial PIS/PASEP 2.0 1.6 3% 11% 6% 31% 0.1% 0.0% 0.29 0.46 0.28 BRA SIP Public Leave Benefits 32.8 3.9 1% 1% 5% 28% 0.1% 0.1% 0.24 0.48 0.24 BRA SIP Public Pension receipts 66.3 8.1 24% 31% 5% 55% 6.5% 4.2% 0.26 0.34 0.23 MEX SIP Indemnizations 24.5 11.6 1% 1% 3% 32% 0.1% 0.0% 0.14 0.35 0.22 CHL SIP Old-age pension 88.3 6.0 8% 21% 3% 49% 2.5% 3.2% 0.16 0.27 0.19 MEX SIP Retirement Pensions 75.7 3.3 1% 9% 3% 66% 0.8% 0.4% 0.16 0.36 0.15 PER SIP Pensions 100.1 3.6 1% 20% 1% 68% 0.7% 6.6% 0.05 0.10 0.11 COL SIP Retirement pension 23.7 5.6 1% 17% 1% 66% 0.1% 0.6% 0.05 0.12 0.09 GUA SIP Retirement pension and survivorship pension 20.7 10.1 1% 9% 1% 81% 0.1% 0.7% 0.06 0.09 0.08 ARG SIP Pensions 106.1 12.0 5% 29% 1% 56% 3.4% 9.0% 0.04 0.14 0.08
Average Unit Value, US$PPP Coverage Abs. Inc Rel. Inc

22
Table 3C Summary indicators by class of public transfers: social assistance transfers CGH CGH DCI
All Benef. Benef. Q5/Q1 Q1 Q5 Q1 Q5 Q1 Q5 For Q1 For Q1+Q2 Epsilon=2TAE-School Assist. Card 10.8 N.A. 8% 1% 35% 7% 0.4% 0.0% 1.75 1.48 3.3 PAE-School Feeding 9.1 N.A. 50% 11% 32% 7% 2.6% 0.0% 1.60 1.46 2.9 SUF 5.5 0.8 31% 1% 60% 1% 1.9% 0.0% 2.98 2.10 2.31 PETI 5.5 0.7 2% 0% 66% 0% 0.1% 0.0% 3.30 2.24 2.26 Solidario 6.2 1.2 3% 0% 56% 2% 0.2% 0.0% 2.81 2.02 2.10 Auxilio Gas 1.5 3.7 16% 0% 48% 2% 0.3% 0.0% 2.39 2.01 1.87 Head of household program 35.9 1.7 30% 1% 32% 1% 35.9% 0.1% 1.60 1.80 1.76 Oportunidades (PROGRESA) 6.8 1.7 32% 2% 35% 4% 2.5% 0.0% 1.73 1.58 1.67 PROMESE-medicines 0.5 N.A. 54% 39% 17% 20% 0.1% 0.0% 0.85 0.90 1.6 INESPRE/ Popular markets 2.1 N.A. 39% 31% 17% 21% 0.4% 0.0% 0.83 0.89 1.5 Bolsa Escola 5.5 5.7 27% 2% 40% 15% 1.6% 0.0% 1.98 1.63 1.47 Desayuno escolar 1.5 1.0 30% 2% 44% 3% 0.8% 0.0% 2.22 1.79 1.32 Comedor infantil 2.3 1.0 2% 0% 43% 3% 0.1% 0.0% 2.13 1.87 1.32 Almuerzo escolar 0.8 0.9 8% 0% 45% 1% 0.1% 0.0% 2.25 1.94 1.28 Disability PASIS 31.3 1.3 7% 0% 35% 2% 2.1% 0.0% 1.74 1.66 1.28 Community child care or kindergarten 26.0 1.0 16% 2% 37% 5% 4.3% 0.1% 1.85 1.49 1.20 FAMI 8.9 1.2 3% 0% 38% 7% 0.3% 0.0% 1.91 1.53 1.14 Restaurante escolar 4.5 1.1 7% 2% 29% 8% 0.3% 0.0% 1.47 1.47 1.08 Preschoool lunch 12.5 1.3 15% 2% 33% 5% 1.7% 0.0% 1.65 1.46 1.05 School snack or lunch 0.8 1.1 22% 4% 30% 6% 0.2% 0.0% 1.48 1.42 1.03 Preschool snack 7.1 1.5 15% 2% 30% 7% 0.9% 0.0% 1.52 1.35 1.02 Renda minima 8.1 3.1 6% 1% 26% 10% 0.4% 0.0% 1.30 1.49 0.95 Old age PASIS 38.6 1.5 6% 1% 26% 5% 1.8% 0.0% 1.32 1.47 0.94 Vaso de leche 0.2 1.4 57% 10% 29% 7% 0.2% 0.0% 1.44 1.36 0.93 Gas Subsidy 15.7 N.A. 74% 93% 9% 34% 3.5% 0.0% 0.46 0.59 0.9 Potable water subsidy 2.9 2.2 14% 2% 24% 7% 0.3% 0.0% 1.18 1.27 0.89 Family allowance 4.6 0.6 28% 15% 24% 7% 1.8% 0.0% 1.19 1.30 0.79 Comedor popular 7.6 1.8 6% 1% 20% 9% 0.6% 0.0% 1.01 1.03 0.67 Powdered milk or glass of milk 2.0 1.3 7% 3% 21% 12% 0.3% 0.0% 1.03 1.21 0.64 School breakfast 6.5 2.5 36% 8% 18% 9% 3.7% 0.2% 0.89 1.14 0.62 School materials packet 2.7 2.3 32% 11% 18% 14% 1.3% 0.1% 0.89 1.06 0.61 Glass of corn mush (atol) 1.9 1.7 41% 19% 17% 14% 1.4% 0.1% 0.86 0.97 0.58 PROCAMPO 6.7 5.8 11% 6% 12% 43% 0.4% 0.0% 0.60 0.60 0.53 School snack 1.7 2.0 38% 22% 13% 15% 1.0% 0.1% 0.66 0.85 0.50 Scholarships* 33.9 5.8 4% 2% 11% 31% 0.7% 0.2% 0.56 0.63 0.46 School scholarship 5.5 7.0 9% 2% 14% 19% 0.2% 0.0% 0.69 0.72 0.45 Scholarships 13.4 10.6 5% 5% 5% 61% 0.2% 0.1% 0.26 0.25 0.35 Other Gov transfers* 8.9 7.4 3% 2% 7% 50% 0.1% 0.0% 0.37 0.54 0.33 School transport subsidy or school scho 6.8 4.3 2% 5% 3% 38% 0.1% 0.1% 0.13 0.17 0.18 Nutrition pension (alimenticia) 36.7 6.6 1% 5% 1% 59% 0.1% 0.8% 0.06 0.17 0.12
Average Unit Value, US$PPP Coverage Abs. Inc Rel. Inc
Note: see Table 3A
23
Figure 1 Simulated impacts of public transfers on inequality
Simulated Inequality Impacts
(1.50)(1.00)(0.50)
-0.501.001.502.002.503.00
Arge
ntin
a
Braz
il
Chi
le
Col
ombi
a
Dom
.R
epub
lic
Gua
tem
ala
Mex
ico
Peru
Poin
t cha
nge:
Pos
itive
(neg
ativ
e)
valu
es in
dica
te a
redu
ctio
n (in
crea
se)
in in
equa
lity
Social InsuranceSocial Assistance
Source: Authors’ estimates from household surveys; Dominican Republic: IDB estimates from ENCOVI (2004).
Note: Under social insurance, we use the average adjusted net pension subsidies (net of average contributions). For the Dominican Republic, social insurance only includes SS Health and not pensions since available evidence suggests full contributions for that scheme, and hence a zero net subsidy.
Figure 2 Simulated impacts of public transfers on poverty
Simulated Impact on Poverty
-
1.00
2.00
3.00
4.00
5.00
Argenti
naBraz
ilChil
e
Colombia
Dom. R
epub
lic
Guatem
ala
Mexico PeruPe
rcen
tage
poi
nt re
duct
ion
in p
over
ty ra
te
due
to tr
ansf
ers
Social InsuranceSocial Assistance
Source: Authors’ estimates from household surveys; Dominican Republic: IDB estimates from ENCOVI (2004).
Note: Under social insurance, we use the average adjusted net pension subsidies (net of average contributions). For the Dominican Republic, social insurance only includes SS Health and not pensions since available evidence suggests full contributions for that scheme, and hence a zero net subsidy.
24
Figure 3 The welfare impact of public transfers depending on society’s ‘concern about inequality’
Distributional Characteristic for Social Insurance Transfers
-
0.50
1.00
1.50
2.00
0.5 1.0 1.5 2.0
Concern for Inequality (Epsilon)
Soci
al W
elfa
re(D
istri
butio
nal C
hara
cter
istic
)
ArgentinaBrazilChileColombiaGuatemalaMexicoPeru
Distributional Characteristic for Social Assistance Transfers
-
0.50
1.00
1.50
2.00
0.5 1.0 1.5 2.0
Concern for Inequality (Epsilon)
Soci
al W
elfa
re(D
istri
butio
nal C
hara
cter
istic)
ArgentinaBrazilChileColombiaDom. RepublicGuatemalaMexicoPeru
Social Welfare impacts of Public Transfers:Distributional Characteristic
- 0.20 0.40 0.60 0.80 1.00 1.20
0.5 1.0 1.5 2.0
Concern for Inequality (Epsilon)
Social Welfare
(Distributional Characteristic)
Social AssistanceSocial Insurance

25
Figure 4 Decomposing the welfare impact of public transfers: targeting and sizing components
Targeting and Sizing Contributions to Social Welfare: Social Insurance
-0.6
-0.4
-0.2
0
0.2
0.4
0.6
0.8
Arge
ntin
a
Braz
il
Chi
le
Col
ombi
a
Gua
tem
ala
Mex
ico
Peru
Dis
tribu
tiona
l Cha
ract
eris
ti c(E
psilo
n =
2)
SizingTargeting
Targeting and Sizing Contributions to Social Welfare: Social Assistance
-1
-0.5
0
0.5
1
1.5
2
2.5
Argenti
naBraz
ilChile
Colombia
Dom. Rep
ublic
Guatemala
Mexico PeruD
istri
butio
nal C
hara
cter
istic
(Eps
ilon
= 2)
SizingTargeting
26
Figure 5 Decomposing the welfare impact of specific types of transfer programmes
Contribution to Social Welfare: Comparing Social Assistance Instruments
(2.0)
(1.0)
-
1.0
2.0
3.0
4.0
CCTs
Other C
ash
Scho
larsh
ipsSc
hool
Feed
ing
Other F
eeding
Dis
tribu
tiona
l Cha
ract
eris
tic(E
psilo
n =
2)
SizingTargeting
Contribution to Social Welfare: Conditional Cash Transfers
(2.0)
(1.0)
-
1.0
2.0
3.0
4.0
ARG-Je
fesBR
A-Pre-
BFP
BRA-P
ETI
CHL-SU
F/So
lidar
io
DR-TAE
MEX-Opo
rtunid
ades
Dis
tribu
tiona
l Cha
ract
eris
tic(E
psilo
n =
2)
SizingTargeting
Contribution to Social Welfare: Scholarships
(2.0)
(1.0)
-
1.0
2.0
3.0
4.0
CH
L-S
chol
arsh
ips
CO
L-S
chol
arsh
ips
GU
A-
Sch
olar
/Tra
nspo
rt ME
X-
Sch
olar
ship
s
Dis
tribu
tiona
l Cha
ract
eris
tic(E
psilo
n =
2)
SizingTargeting
Contribution to Social Welfare: Other Cash Transfers
(2.0)
(1.0)
-
1.0
2.0
3.0
4.0
BRA-RendaMinima
CHL-FamilyAllow ance
CHL-PASIS-Old
CHL-PASIS-
Disabled
MEX-ProcampoD
istri
butio
nal C
hara
cter
istic
(Eps
ilon
= 2)
SizingTargeting
27
Contribution to Social Welfare: School Feeding
(2.0)
(1.0)
-
1.0
2.0
3.0
4.0
Colombia Dom. Republic Guatemala Peru
Dis
tribu
tiona
l Cha
ract
eris
tic(E
psilo
n =
2)
SizingTargeting
Contribution to Social Welfare: Other Feeding Programs
(2.0)
(1.0)
-
1.0
2.0
3.0
4.0
COL-FAM
IGUA-
Glass o
f Milk
GUA-Glas
s of A
tolPE
R-Vas
o Lec
hePE
R-Pop
. Res
taura
ntPE
R-Infa
nt fee
ding
Dis
tribu
tiona
l Cha
ract
eris
tic(E
psilo
n =
2)
SizingTargeting
Source: Authors’ estimates from household surveys; Dominican Republic: IDB estimates from ENCOVI (2004).