
Global-scale analysis of river flow alterations due to water ...
20
Hydrol. Earth Syst. Sci., 13, 2413–2432, 2009 www.hydrol-earth-syst-sci.net/13/2413/2009/ © Author(s) 2009. This work is distributed under the Creative Commons Attribution 3.0 License. Hydrology and Earth System Sciences Global-scale analysis of river flow alterations due to water withdrawals and reservoirs P. D¨ oll, K. Fiedler, and J. Zhang Institute of Physical Geography, Goethe University Frankfurt, Frankfurt am Main, Germany Received: 17 June 2009 – Published in Hydrol. Earth Syst. Sci. Discuss.: 3 July 2009 Revised: 24 November 2009 – Accepted: 6 December 2009 – Published: 22 December 2009 Abstract. Global-scale information on natural river flows and anthropogenic river flow alterations is required to iden- tify areas where aqueous ecosystems are expected to be strongly degraded. Such information can support the iden- tification of environmental flow guidelines and a sustain- able water management that balances the water demands of humans and ecosystems. This study presents the first global assessment of the anthropogenic alteration of river flow regimes, in particular of flow variability, by water with- drawals and dams/reservoirs. Six ecologically relevant flow indicators were quantified using an improved version of the global water model WaterGAP. WaterGAP simulated, with a spatial resolution of 0.5 degree, river discharge as affected by human water withdrawals and dams around the year 2000, as well as naturalized discharge without this type of human interference. Compared to naturalized conditions, long-term average global discharge into oceans and internal sinks has decreased by 2.7% due to water withdrawals, and by 0.8% due to dams. Mainly due to irrigation, long-term average river discharge and statistical low flow Q 90 (monthly river discharge that is exceeded in 9 out of 10 months) have de- creased by more than 10% on one sixth and one quarter of the global land area (excluding Antarctica and Greenland), respectively. Q 90 has increased significantly on only 5% of the land area, downstream of reservoirs. Due to both water withdrawals and reservoirs, seasonal flow amplitude has de- creased significantly on one sixth of the land area, while in- terannual variability has increased on one quarter of the land area mainly due to irrigation. It has decreased on only 8% of the land area, in areas downstream of reservoirs where con- sumptive water use is low. The impact of reservoirs is likely underestimated by our study as small reservoirs are not taken into account. Areas most affected by anthropogenic river Correspondence to: P. D¨ oll ([email protected]) flow alterations are the Western and Central USA, Mexico, the western coast of South America, the Mediterranean rim, Southern Africa, the semi-arid and arid countries of the Near East and Western Asia, Pakistan and India, Northern China and the Australian Murray-Darling Basin, as well as some Arctic rivers. Due to a large number of uncertainties related e.g. to the estimation of water use and reservoir operation rules, the analysis is expected to provide only first estimates of river flow alterations that should be refined in the future. 1 Introduction Freshwater ecosystems, which include rivers, wetlands and lakes as well as their floodplains, have been deteriorating faster than other ecosystems. According to the Millennium Ecosystem Assessment (2005), populations of freshwater species (included in the Living Planet Index) declined, be- tween 1970 and 2000, on average by 50%, compared to 30% for marine and also for terrestrial species. Approximately 20% of the world’s 10 000 described freshwater fish species have been listed as threatened, endangered, or extinct in the last few decades. Over one third (37%) of the freshwater- dependent mammal species assessed for the IUCN Red List were globally threatened, including manatees, river dolphins and porpoises (Millenium Ecosystem Assessment, 2005). Besides, about one half of the 200 species of freshwater turtles were classified as globally threatened in the IUCN Red List. Threats to global freshwater biodiversity can be grouped under five categories: overexploitation, invasion by exotic species, water pollution, destruction or degradation of habitat (e.g. related to changes in fluvial morphology), and alteration of flow regimes (Dudgeon et al., 2006). While the first two relate to the biotic component of freshwater ecosys- tems, the latter affect the abiotic component. Published by Copernicus Publications on behalf of the European Geosciences Union.
-
Upload
khangminh22 -
Category
Documents
-
view
1 -
download
0
Transcript of Global-scale analysis of river flow alterations due to water ...

Hydrol. Earth Syst. Sci., 13, 2413–2432, 2009www.hydrol-earth-syst-sci.net/13/2413/2009/© Author(s) 2009. This work is distributed underthe Creative Commons Attribution 3.0 License.
Hydrology andEarth System
Sciences
Global-scale analysis of river flow alterations due to waterwithdrawals and reservoirs
P. Doll, K. Fiedler, and J. Zhang
Institute of Physical Geography, Goethe University Frankfurt, Frankfurt am Main, Germany
Received: 17 June 2009 – Published in Hydrol. Earth Syst. Sci. Discuss.: 3 July 2009Revised: 24 November 2009 – Accepted: 6 December 2009 – Published: 22 December 2009
Abstract. Global-scale information on natural river flowsand anthropogenic river flow alterations is required to iden-tify areas where aqueous ecosystems are expected to bestrongly degraded. Such information can support the iden-tification of environmental flow guidelines and a sustain-able water management that balances the water demandsof humans and ecosystems. This study presents the firstglobal assessment of the anthropogenic alteration of riverflow regimes, in particular of flow variability, by water with-drawals and dams/reservoirs. Six ecologically relevant flowindicators were quantified using an improved version of theglobal water model WaterGAP. WaterGAP simulated, witha spatial resolution of 0.5 degree, river discharge as affectedby human water withdrawals and dams around the year 2000,as well as naturalized discharge without this type of humaninterference. Compared to naturalized conditions, long-termaverage global discharge into oceans and internal sinks hasdecreased by 2.7% due to water withdrawals, and by 0.8%due to dams. Mainly due to irrigation, long-term averageriver discharge and statistical low flowQ90 (monthly riverdischarge that is exceeded in 9 out of 10 months) have de-creased by more than 10% on one sixth and one quarter ofthe global land area (excluding Antarctica and Greenland),respectively.Q90 has increased significantly on only 5% ofthe land area, downstream of reservoirs. Due to both waterwithdrawals and reservoirs, seasonal flow amplitude has de-creased significantly on one sixth of the land area, while in-terannual variability has increased on one quarter of the landarea mainly due to irrigation. It has decreased on only 8% ofthe land area, in areas downstream of reservoirs where con-sumptive water use is low. The impact of reservoirs is likelyunderestimated by our study as small reservoirs are not takeninto account. Areas most affected by anthropogenic river
Correspondence to:P. Doll([email protected])
flow alterations are the Western and Central USA, Mexico,the western coast of South America, the Mediterranean rim,Southern Africa, the semi-arid and arid countries of the NearEast and Western Asia, Pakistan and India, Northern Chinaand the Australian Murray-Darling Basin, as well as someArctic rivers. Due to a large number of uncertainties relatede.g. to the estimation of water use and reservoir operationrules, the analysis is expected to provide only first estimatesof river flow alterations that should be refined in the future.
1 Introduction
Freshwater ecosystems, which include rivers, wetlands andlakes as well as their floodplains, have been deterioratingfaster than other ecosystems. According to the MillenniumEcosystem Assessment (2005), populations of freshwaterspecies (included in the Living Planet Index) declined, be-tween 1970 and 2000, on average by 50%, compared to 30%for marine and also for terrestrial species. Approximately20% of the world’s 10 000 described freshwater fish specieshave been listed as threatened, endangered, or extinct in thelast few decades. Over one third (37%) of the freshwater-dependent mammal species assessed for the IUCN Red Listwere globally threatened, including manatees, river dolphinsand porpoises (Millenium Ecosystem Assessment, 2005).Besides, about one half of the 200 species of freshwaterturtles were classified as globally threatened in the IUCNRed List. Threats to global freshwater biodiversity can begrouped under five categories: overexploitation, invasion byexotic species, water pollution, destruction or degradation ofhabitat (e.g. related to changes in fluvial morphology), andalteration of flow regimes (Dudgeon et al., 2006). While thefirst two relate to the biotic component of freshwater ecosys-tems, the latter affect the abiotic component.
Published by Copernicus Publications on behalf of the European Geosciences Union.

2414 P. Doll et al.: Global-scale analysis of river flow alterations
Monitoring of freshwater species is required to character-ize the degree to which humans have affected aquatic ecosys-tems. The knowledge of the status and trend of freshwaterspecies, however, is still very poor, in particular in develop-ing countries, and it is not likely to significantly improve inthe near future (Revenga et al., 2005). Therefore, assessmentand monitoring of the physical conditions of the freshwaterhabitat is an option, firstly because it provides a more inte-grated characterization of ecosystem change, and secondlybecause physical data may be available at more locationsthan species data (Revenga et al., 2005). Humans have sig-nificantly influenced most rivers of the world with respectto the physical habitat conditions water quality, fluvial mor-phology, and flow regimes (Dudgeon et al., 2006). Changesin water quality are predominantly due to human and animalexcretions as well as agricultural and industrial emissions,while fluvial morphology has been modified mainly to im-prove navigation and flood protection. River flow regimeshave been altered by water withdrawals as well as by reser-voir construction and management. These alterations do notonly affect river ecosystems themselves but also associatedecosystems like riparian wetlands and floodplains.
Many studies have shown that flow regimes play a majorrole in determining the biotic composition, structure, func-tion and diversity within river ecosystems (Richter et al.,1996; Arthington and Pusey, 1993). The importance of flowvariability for river ecosystems has been well documented(e.g. Poff and Ward, 1989; Poff et al., 1997; Richter et al.,1996, 1997; Puckridge et al., 1998; Clausen and Biggs, 2000;World Commission on Dams, 2000). Researchers now gen-erally agree on the “natural flow paradigm”, stating that thefull range of natural intra- and interannual variability of hy-drological regimes is critical in sustaining native biodiver-sity and integrity of aquatic ecosystems (Richter et al., 1997;Poff et al., 1997). Thus, environmental flow guidelines musttake into account flow variability as expressed by a numberof indicators, not just prescribe minimum flows. The natu-ral flow paradigm also suggests that approaches for definingenvironmental water requirements only as fraction of long-term average flows, like the Smakhtin et al. (2004) approach,are overly simplistic and inappropriate for protecting ecosys-tems.
A comparison of the natural flow regime of a river withthe flow regime that is affected by human intervention pro-vides an indication for the degree of human alteration ordegradation of the freshwater ecosystem. Such a compar-ison requires the identification of appropriate hydrologicalindicators that are relevant for the well-being of the bioticcomponents of the freshwater ecosystem (Black et al., 2005).The Indicators of Hydrologic Alteration (IHA) approach ofRichter et al. (1996) has been widely adopted because of itscomprehensive ability to characterize ecologically relevanthydrological changes. In this method, two sets of flow timeseries representing natural and altered conditions at the samesite are compared using 32 indicators of flow magnitude, fre-
quency, duration, timing and rate of change. Large differ-ences between natural and actual, i.e. anthropogenically al-tered, regimes are likely to indicate that the biotic compo-nents of the aquatic ecosystem have been altered too, andthat biodiversity has been decreased due to human impacts.
Both reservoirs and water withdrawals result in increasedevapotranspiration and thus decreased annual river flow val-ues, and they affect the seasonality of river flow. Reser-voirs lead to decreased seasonal flow amplitudes, while theimpact of water withdrawals depends on their seasonality.For the Krishna River in India, for example, Bouwer etal. (2006) showed that reservoir construction and pertainingirrigation after 1960 had lead to decreased annual runoff, de-creased monsoon season flows and somewhat increased post-monsoon season flows. Studies on both the impact of reser-voirs and water withdrawals on flow regimes and the impactof altered flow regimes on the biotic ecosystem componentmainly concern North American or Australian rivers. Forthe Murrumbidgee River in Australia, for example, Kings-ford and Thomas (2004) described a river flow reduction toabout one third of the natural median flow, and the resultingdegradation of the major wetland caused by damming andsubsequent water withdrawals. This led to a 21% reductionof the number of water bird species and a 90% reduction ofthe total number of water birds between 1983 and 2001. Forthe Brazos River basin in the USA, with large and increasingwater withdrawals and 39 reservoirs, Vogl and Lopes (2009)compared naturalized and anthropogenically impacted riverflow regimes. They identified decreases in the frequency ofhigh flow events (in spring and winter) and increased sum-mer low flows. These changes likely caused the observedincrease of habitat generalist fish species, a decrease of na-tive riverine fishes and an overall homogenization of speciesassemblages. Analyzing the temporal development of 186intermediate-sized rivers affected by dams in the continentalUSA, Poff et al. (2007) found that flow regimes have becomemore homogeneous due to modification of ecologically criti-cal high and low flows. Such a homogenization, which favorsthe spread of cosmopolitan, nonindigenous species, was notidentified for 317 undammed reference rivers.
At the global scale, what is known about the drivers ofriver flow regime alteration, i.e. water use and dams? Totalglobal water withdrawals are estimated to be 4000 km3/yr,approximately one tenth of the renewable water resources(Doll, 2009), but ratios exceed 0.4 in many river basins whichare then called “water-stressed”. These cover about one quar-ter of the global land area outside the ice caps and are thehome of more than 2 billion people (Alcamo et al., 2003a).Consumptive water use (i.e. the fraction of the withdrawnwater that evapotranspirates during use and therefore doesnot return to the river) leads to river discharge reduction andis therefore the relevant quantity for determining human riverflow alterations. It amounts to 1300–1400 km3/yr, of whichmore than 90% are caused by irrigation (Doll, 2009). There-fore, river flow reductions due to human water use are high
Hydrol. Earth Syst. Sci., 13, 2413–2432, 2009 www.hydrol-earth-syst-sci.net/13/2413/2009/

P. Doll et al.: Global-scale analysis of river flow alterations 2415
in semi-arid and arid areas with significant irrigation.Avakyan and Iakovleva (1998) estimated that there were
around 60 000 reservoirs world-wide, but gave no lowersize limit. They estimated that their total capacity exceeds6500 km3 and that their water surface equals 400 000 km2.According to ICOLD (1998), there are more than 45 000large dams (with a dam height of more than 15 m, or ofmore than 5 m if the reservoir volume is above 3 million m3),but part of these dams are run-of-river dams without sig-nificant water storage and thus with a small effect on theflow regime. Chao et al. (2008), mainly based on ICOLDdata, studied the development of total global water storagein reservoirs between 1900 and 2007, taking into accountalmost 30 000 reservoirs with, after 2000, a storage capac-ity of approx. 8300 km3. Unfortunately, neither ICOLD norChao et al. (2008) include the geographical coordinates of thedams and reservoirs. Nilsson et al. (2005) found that 172 outof 292 large river systems (i.e. 60%) are affected by dams.While Europe has almost no unfragmented large river sys-tems, there are many unfragmented systems in North andCentral America (outside the USA). The investigated 292river systems account for 60% of the world’s river discharge.Analyzing around 600 of the largest reservoirs world-wide,Vorosmarty et al. (1997) found that the mean age of riverwater has likely tripled to well over one month, which showsthe increase of transport time of river water due to reser-voirs. Poff et al. (2007) stated that extensive constructionof dams has greatly dampened seasonal and interannual riverdischarge variability, with negative impacts on global bio-diversity in river and riparian ecosystems as biodiversity isgenerated and maintained by geographic variation.
The objective of this study was to analyze the impactof water withdrawals and dams (i.e. reservoirs or regulatedlakes) on monthly and annual river flow regimes world-wide,considering ecologically-relevant hydrologic indicators. Wewanted to represent the alteration of natural conditions thathad occurred by around the year 2000 due to withdrawals anddams only, under climatic conditions that had not yet beenappreciably altered by climate change (i.e. before 1990). Weused the global hydrology and water use model WaterGAP(Alcamo et al., 2003b) which takes into account the impactof reservoirs and water withdrawals on river discharge. Forthis study, we applied the most recent model version 2.1 g. Itdiffers from the previous version 2.1 f as presented in Hungerand Doll (2008) with respect to the implementation of thereservoir algorithm of Hanasaki et al. (2006), and of the newGRanD reservoir data set (Lehner et al., 2008; Lehner etal., 2009). With this version, the impact of more than 6500reservoirs and regulated lakes could be analyzed. The modelwas used to generate time series of anthropogenically alteredriver discharge, and of naturalized discharge that would oc-cur if there were no dams or water withdrawals. This allowedthe quantification of anthropogenic river flow alterations.
In Sect. 2, the methods to compute anthropogenicallyaltered and naturalized river flows, the selected indicatorsof river flow alteration and a simple approach for relatingchanges of annual flows to changes of the number of fishspecies are described. In Sects. 3 and 4, results are presentedand discussed. In the last section, we summarize the studyresults and draw conclusions.
2 Methods
2.1 Computation of natural and anthropogenicallyaltered river flows with WaterGAP
The global water resources and use model WaterGAP con-sists and the WaterGAP Global Hydrology Model WGHMand of a number of sectoral water use models (Alcamo et al.,2003b). With a spatial resolution of 0.5◦ by 0.5◦ (55 km by55 km at the equator), it covers all land areas of the globeexcluding Antarctica. Water use, i.e. water withdrawals andconsumptive water use, is estimated separately for the sectorsirrigation, livestock, households and industry. With a dailytime step, WGHM computes water storage and water flows,including total runoff generation, groundwater recharge andriver discharge, taking into account the impact of human wa-ter use on river discharge and surface water storage (Doll etal., 2003; Doll and Fiedler, 2008). WGHM is tuned in abasin-specific manner against long-term average dischargesat 1235 gauging stations (Hunger and Doll, 2008).
For each grid cell of WGHM, a vertical water balance iscomputed, and the resulting runoff is routed laterally withinthe cell through a groundwater store and various types ofsurface water stores (lakes, reservoirs, wetlands, and rivers).The effect of surface water storage on water balance and flowdynamics is modeled by first routing the runoff generatedwithin the grid cell through a so-called “local” lake/reservoirstorage and a “local” wetland storage compartment. The re-sulting discharge volume is added to the discharge from theupstream grid cell and routed through a so-called “global”lake and/or reservoir compartment and a “global” wetlandstorage compartment, and finally through the river storagecompartment. If there are a number of lakes (or reservoirs orwetlands) within a grid cell, they are lumped into one. “Lo-cal” lakes and reservoirs are lumped together into one “lo-cal” lake, too, while “global” lakes and “global” reservoirsare treated separately within the cell. The water balance of“global” lakes and reservoirs, which can cover more than onegrid cell, is computed in the grid cell where the outflow of thelake or reservoir is located. The difference between precipi-tation and potential evapotranspiration is added to the waterbalance of lakes, reservoirs and wetlands, thus taking intoaccount the effect of the surface water balance on cell runoff.
Global lakes and reservoirs are defined based on their size,exceeding a surface area of 100 km2 or a maximum storagecapacity of 0.5 km3. In former versions of WGHM including
www.hydrol-earth-syst-sci.net/13/2413/2009/ Hydrol. Earth Syst. Sci., 13, 2413–2432, 2009

2416 P. Doll et al.: Global-scale analysis of river flow alterations
WGHM 2.1 f (Hunger and Doll, 2008; Doll and Fiedler,2008), reservoirs were modeled like natural lakes, where out-flow is computed as a nonlinear function of water storage.Evapotranspiration from lakes (and wetlands) is reduced atlow storage values, and outflow is stopped (Hunger and Doll,2008). In WGHM 2.1 g used here, reservoir management issimulated following the approach of Hanasaki et al. (2006)which is explained in Sect. 2.1.3 below. In addition, thedatabase of lakes, reservoirs and wetlands that was used inversion 2.1 f (Lehner and Doll, 2004), has been enhanced byinclusion of a larger number of man-made reservoirs (comp.Sect. 2.1.3).
Important WGHM inputs are time series of monthly val-ues of climate variables as well as information on soil andland cover. Monthly climate data are downscaled to dailydata, in the case of precipitation using the number of wetdays per month. Monthly climate data, except precipitation,are provided by the CRU TS 2.1 data set (Mitchell and Jones,2005). As precipitation input, 0.5◦ gridded monthly time se-ries of the GPCC Full Data Product Version 3 (Fuchs et al.,2008) were used, together with the number of wet days fromthe CRU TS 2.1 data set.
2.1.1 Specification of model runs
Five time series (ANT, NAT, RES, USE, ANT LAKE) ofgridded monthly river discharge from 1961–1990 were com-puted by WHGM, which were then used to quantify the indi-cators of river flow regime alteration described in Sect. 2.2.In our analysis, ANT conditions refer to the flow regime asimpacted by human water withdrawals as well as by reser-voirs and regulated lakes. This simulation is the standardWGHM simulation for which tuning was performed. Dur-ing tuning, observed long-term average discharge at the basinoutlet was compared to modeled long-term average dischargeduring the observation time periods. Modeled discharge tookinto account the time-varying consumptive use during thetuning period, but it was assumed that the reservoirs existedduring the whole tuning period. NAT refers to the naturalizedregime as computed by a run with the tuned model in whichthere are no water withdrawals and in which all reservoirsare removed while regulated lakes are not treated like reser-voirs but like natural lakes. Under RES conditions, there areno water withdrawals but reservoirs and regulated lakes ex-ist. Under USE conditions, the impact of water withdrawalson river discharge is simulated but not the impact of reser-voirs and lake regulation. To show the effect of the newlyimplemented reservoir algorithm, the model run ANT LAKEwas designed in which all reservoirs were treated like naturallakes, like in previous model versions. In the following twosections, the methods to simulate the impact of human wa-ter withdrawals and of dams/reservoirs on river discharge areexplained in detail.
2.1.2 Reduction of river flow due to human waterwithdrawals
For the computation of indicators of river flow alteration dueto human water withdrawals, domestic, industrial and live-stock water use in 2002 as computed by the respective Wa-terGAP water use models was taken into account. Irrigationwater use was computed according to Doll and Siebert (2002)using, as input, 1) version 4.0.1 of the Global Map of Irri-gated Areas GMIA (Siebert et al., 2005), (2) estimates of ac-tually irrigated area per country in 2002 and (3) the climatedata time series 1961–1990, to take into account the effect ofclimate variability on irrigation water use. While domestic,industrial and livestock water uses are assumed to be con-stant within each year, irrigation water use varies from monthto month. In WGHM, the effect of human water withdrawalsis simulated by subtracting total consumptive water use fromriver discharge, or from the water stored in lakes and reser-voirs, if there are any in the grid cell and there is not enoughwater available from the river itself. Consumptive use of acell is supplied from the cell itself, or from the neighboringcell with the highest long-term average river discharge if notenough water is available in the cell itself.
Consumptive water use is particularly high in India, Pak-istan, parts of China and the USA and in the Mediterraneanregion, mainly due to the large irrigation areas there (Fig. 1a).Global consumptive water use has more than doubled be-tween 1951 and 2002, reaching about 1300–1400 km3/yraround 2000 (Fig. 1b). Irrigation accounts for more than 90%of the global consumptive water use. In dry years, irrigationwater requirements are particularly high, which results in astronger anthropogenic reduction of the already naturally lowriver discharge.
Due to various reasons, it is not always possible in WHGMto subtract the total daily consumptive use from rivers, lakesor reservoirs, due to a lack of water. One reason is thelikely overestimation of irrigation water use by the Water-GAP irrigation water use model (Doll and Siebert, 2002),as in dry years, farmers might not have enough water to ir-rigate all fields with the optimal amount. Another reasonmay be long-distance water transfers, which are not repre-sented in WGHM. In addition, non-renewable groundwateris withdrawn in reality, e.g. in the USA, Libya, Saudi-Arabiaor China (Custodio, 2001; Foster and Loucks, 2006). Cur-rently, we cannot model groundwater withdrawals explicitlybecause it is not known (globally) which part of the water usecomes from groundwater or surface water. Thus, in WGHM,we attempt to withdraw all water from surface water sources.If on any day there is not enough water available in sur-face waters to satisfy the consumptive use, the model willtake out this consumptive water use later in the year or inthe next year. This approximates withdrawals from renew-able groundwater resources, as, in reality, groundwater canbe withdrawn even in periods with low river flows. The de-layed satisfaction of water requirement leads to a stronger
Hydrol. Earth Syst. Sci., 13, 2413–2432, 2009 www.hydrol-earth-syst-sci.net/13/2413/2009/

P. Doll et al.: Global-scale analysis of river flow alterations 2417
a)
0
250
500
750
1000
1250
1500
1951
1954
1957
1960
1963
1966
1969
1972
1975
1978
1981
1984
1987
1990
1993
1996
1999
2002
km³/year
householdsindustrylivestockirrigationactual use
b)
Fig. 1. Consumptive water use in 2002, in mm/yr(a), and time series 1951–2002 of global consumptive water use, using climate and irrigatedareas of particular year(b), as simulated by the WaterGAP water use models. In Fig. 1a, the location of the four basins discussed in Sect. 4is shown. In Fig. 1b, actual use refers to the part of the computed consumptive use that can actually be taken out of water storage in theWaterGAP Global Hydrology Model WGHM.
www.hydrol-earth-syst-sci.net/13/2413/2009/ Hydrol. Earth Syst. Sci., 13, 2413–2432, 2009

2418 P. Doll et al.: Global-scale analysis of river flow alterations
Fig. 2. Reservoir area in percent of 0.5◦ grid cell area, and location of regulated lakes.
discharge reduction in the river (as compared to simulationswhere delayed satisfaction is not allowed), which is more re-alistic if groundwater that is connected to surface waters isactually withdrawn. Also, groundwater withdrawals in a cer-tain month lead to delayed response of baseflow to the river,which is also somehow reflected by the delayed satisfactionapproach. Nevertheless, actual temporal variations of the ef-fect of water withdrawals on surface water flows are onlyapproximated very roughly. The “actual use” line in Fig. 1bshows that the fraction of water demand that can be fulfilledfrom renewable water resources has been decreasing in re-cent decades, in line with the increasing demand. The differ-ence between “actual use” and total demand, which reachesa maximum of about 20% of the demand, is expected to becaused mainly by overestimation of actual water withdrawalsdue to deficit (sub-optimal) irrigation, and by withdrawal ofnon-renewable groundwater. Whether the imperfect consid-eration of water use leads to an over- or underestimation ofthe reduction of river flows due to human water use is notknown, both at the global and the grid scales.
2.1.3 Modification of river flows due to reservoiroperation
For this study, we needed to distinguish between man-madereservoirs and regulated lakes, i.e. natural lakes whose out-flows are regulated by a dam. This was required becauseunder naturalized conditions (NAT), reservoirs do not existat all, while regulated lakes are treated as natural lakes. Un-der anthropogenically altered conditions, reservoirs and reg-ulated lakes are modeled by the same algorithm.
The new reservoirs and regulated lakes data set includes6553 reservoirs and 52 regulated lakes (Table 1 and Fig. 2).It was derived by adding additional reservoirs from a pre-liminary (July 2008) version of the GRanD database (Lehneret al., 2008; Lehner et al., 2009) to the 886 reservoirs in-cluded in WGHM 2.1 f. For WHGM 2.1 f, the Global Lakesand Wetlands Database of Lehner and Doll (2004) had al-ready been augmented by 64 reservoirs. The developmentof the GRanD data set aimed at including, as polygons, allreservoirs world-wide with a storage capacity of more than0.1 km3. While for Europe and the USA, this goal was prob-ably reached, it is believed that the dataset is incompleteparticularly in China, India and South America. GRanDdoes not distinguish between regulated lakes and reservoirs.Therefore, all “global” reservoirs (with an area of more than100 km2 or a maximum storage volume of at least 0.5 km3)were checked to decide whether they are actually regulatedlakes. This resulted in the identification of 52 “global” regu-lated lakes, in addition to 1022 “global” reservoirs. “Global”reservoirs and lakes are assumed to be fed by river dischargefrom the upstream cell, while smaller reservoirs are assumedto be “local”, i.e. they are only fed by the runoff generatedwithin the grid cell.
The majority of reservoirs are in North America and Asia(Fig. 2). The surface area of the reservoirs and regulatedlakes is 291 000 km2 and 124 000 km2, respectively, as com-pared to a total of 254 000 km2 in version 2.1 f. Maxi-mum storage capacity of reservoirs and regulated lakes is5930 km3 and 405 km3, respectively, vs. 4642 km3 before(Table 1). Please note that many of the new reservoirs wereformerly included as lakes. The newest dams taken into
Hydrol. Earth Syst. Sci., 13, 2413–2432, 2009 www.hydrol-earth-syst-sci.net/13/2413/2009/

P. Doll et al.: Global-scale analysis of river flow alterations 2419
Table 1. Reservoirs and regulated lakes taken into account in this study. Data based on a preliminary version of the GRanD data base,(Lehner et al., 2008, 2009).
number surface area [km2] storage capacitya [km3]
oldb reser- regul. oldb reser- regul. oldb reser- regul.voirs lakes voirs lakes voirs lakes
Africa 170 678 2 38 899 40 238 67 380 1302.7 1807.3 90.5Asia 171 1952 9 47 914 61 607 35 939 804.7 877.3 206.5Europec 150 1097 15 45 525 42340 10 313 419.0 541.3 53.4Oceaniad 30 238 0 5303 7899 0 80.0 110.0 0N. America 269 2302 25 69 051 87 663 9735 1250.9 1590.7 54.5S. America 96 288 1 47 610 51 169 147 785.7 1002.8 0.6Global 886 6553 52 25 4301 29 0916 123 513 4642.0 5929.5 405.4
a Only 672 reservoirs in “old” version and 6512 reservoirs in the current version of the reservoirs and regulated lakes data set were used tocalculate the storage capacity because of lack of storage capacity data. Storage capacity of regulated lakes includes all 52 regulated lakes.b taken into account in previous WGHM model version 2.1 f (Hunger and Doll, 2008).c Eurasia is subdivided into Europe and Asia along the Ural; Turkey is assigned to Asia.d including Australia, New Zealand, the Pacific island and Papua New Guinea.
account in this study were finished in 2006 but the data setcertainly does not cover all reservoirs that existed in 2006.The Three Gorges Dam on the Yangtze River in China is in-cluded but not the dams at the Narmada River in India.
The reservoir operation algorithm of Hanasaki etal. (2006) was implemented in WGHM for 1074 global reser-voirs and regulated lakes, while flow dynamics of local reser-voirs were modeled like those of natural lakes. One reasonfor the latter is that the required lumping of all local reser-voirs within a grid cell into one local reservoir per cell neces-sarily leads to a “blurring” of the specific reservoir character-istics, such that for local reservoirs, the reservoir algorithm isnot expected to simulate water storage and fluxes better thanthe lake algorithm.
Hanasaki et al. (2006) developed two different algorithms,one for reservoirs with irrigation as their main purpose, andanother for all other reservoir types. In both cases, annual re-lease is a function of the long-term average annual reservoirinflow and relative water storage at the beginning of the oper-ational year. The operational year is computed based on theseasonal flow dynamics since no independent data are avail-able. Different from Hanasaki et al. (2006), in WGHM theannual release is a function of the long-term average valueof reservoirs inflows plus the difference between precipita-tion and evaporation over the reservoir, as the long-term av-erage annual outflow of a reservoir depends not only on theinflows but also on the reservoir water balance, in particu-lar in case of large reservoirs (and regulated lakes). In thecase of non-irrigation reservoirs, monthly outflows are as-sumed to be constant throughout the operational year. Themonthly fluctuation of releases of irrigation reservoirs de-pends on monthly downstream consumptive water use, tak-ing into account water use in the next five downstream cells,
or down to the next reservoir or the river mouth. This is dif-ferent from Hanasaki et al. (2006), who took into accountwater use in a maximum of 10 1◦ grid cells downstream, andpreferred water withdrawals to consumptive use. With theshorter range in the WGHM version, we mostly avoid thatthere is more than one reservoir that could provide water fora certain cell. Overflow occurs if reservoir storage capacitywould be exceeded.
In WGHM, reservoir storage is not allowed to fall below10% of storage capacity, neither due to reservoir releases nordue to consumptive water use. Reservoir evapotranspirationis reduced with decreasing reservoir storage, by multiplyingpotential evaporation with a reduction factorr, computed as
r = 1−
(|S −Smax|
Smax
)2.814
(1)
with S actual reservoir storage [m3] andSmax storage capac-ity of reservoir [m3]. With Eq. (1), reservoir evaporation isreduced by 15% if reservoir storage reaches half the storagecapacity and by approximately 50% if reservoir storage hasdecreased to 20% of storage capacity.
For 900 of the 1074 global reservoirs (and regulated lakes),information was available on the main purpose of the reser-voir, either irrigation (249) or others (651). For the remaining174 water bodies, the main purpose was estimated based onconsumptive irrigation water use in the five grid cells down-stream of the reservoir. If this value use was larger than the75% quantile of the irrigation water use downstream of theknown non-irrigation reservoirs, the reservoir was assumedto be an irrigation reservoir. Six of the 1074 reservoirs hada negative sum of inflow and vertical reservoir water balancein WGHM and had to be treated as natural lakes.
www.hydrol-earth-syst-sci.net/13/2413/2009/ Hydrol. Earth Syst. Sci., 13, 2413–2432, 2009

2420 P. Doll et al.: Global-scale analysis of river flow alterations
The performance of the reservoir algorithm in WGHMwas tested by comparing time series of observed monthlyoutflows from reservoirs to modeled values, distinguish-ing four cases: reservoirs modeled according to the de-scribed reservoir algorithm (ANT), reservoirs modeled aslakes (ANT LAKE), no reservoirs modeled but consumptivewater use taken into account (USE), and naturalized condi-tions without reservoir and use (NAT). The observed reser-voir outflow data were obtained from Hanasaki et al. (2006)and included 29 reservoirs with more than 10 years of datathat are mostly located in USA and Canada. Ten of the reser-voirs are mainly used for irrigation. The best correspondenceto observed reservoir outflows is achieved with ANT (i.e.with the reservoir algorithm) for 9 out of 10 irrigation reser-voirs (Fig. 3b) and for 15 out of 19 non-irrigation reservoirs(Fig. 3a). If these reservoirs are modeled like lakes, modelperformance is mostly better than if it is assumed that thereis no surface water body at all (USE and NAT). However,for many reservoirs the discrepancies between modeled andsimulated monthly outflows remain high, due to erroneouslymodeled reservoir inflows. For simplicity of analysis, wa-ter use for 2002 and not the mostly lower values during theobservation years were taken into account, which is not ex-pected to have a significant impact on the analysis. The rootmean squared errors shown in Fig. 3 are larger than those ofHanasaki et al. (2006), as Hanasaki and colleagues appliedobserved and not modeled river discharge as input to theirreservoir model.
The effect of the reservoir algorithm on the quality of com-puted monthly river discharge at the 1235 tuning stations wasinvestigated by comparing the modeling efficiencies (alsocalled Nash-Sutcliffe coefficients) for a model run using thereservoir algorithm (MEr ) and a model run where reservoirswere modeled as lakes (MEl). Monthly time series of ob-served river discharge were provided by the Global RunoffData Centre (http://grdc.bafg.de). ME is defined as the meansquared error normalized by the variance of the observed datasubtracted from unity, and ranges from minus infinity to one(Janssen and Heuberger, 1995). While a ME-value of onerepresents a perfect fit of simulated and observed time se-ries, values below zero indicate that the average of observeddischarge would be a better estimation than the model. MErepresents model success with respect to the mean as wellas to the variance of the observations. Among the 937 sta-tions with MEr>0, the modeling efficiencies differed by lessthan 0.1 for 836 stations, due mostly to the nonexistence oflarge reservoirs upstream. MEr was 0.1–0.3 units better thanMEl at 32 stations and 0.3–0.5 units better at 36 stations.However, the reservoir algorithm caused a ME decrease of0.1–0.3 (0.3–0.5) at 27 (6) stations.
0 1 2 3 4
Akosombo
Big Bend
Buford
Canyon Ferry
Dw orshak
EB Campbell
Falcon
Flaming Gorge
Fort Peck
Fort Randall
Garrison
Glen Canyon
Grand Rapids
Jenpeg
Kettle Rapids
Libby
Missi Falls
Oahe
Oroville
RMSE
ANTANT LAKEUSENAT
0 2 4 6 8
American Falls
Amistad
Bhumibol
Grand Coulee
Hungry Horse
Navajo
Palisades
Sirikit
Trinity
Yellow tail
RMSE
ANTANT LAKEUSENAT
a)
b)
non - irrigation reservoirs
irrigation reservoirs
Fig. 3. Validation of WGHM reservoir algorithm against observedreservoir outflow for non-irrigation reservoirs(a) and irrigationreservoirs(b). Outflow data from Hanasaki et al. (2006). RMSE:root mean squared error.
2.2 Indicators of river flow regime alteration
We developed six different indicators of river flow regime al-teration that are ecologically relevant and can be computedby WGHM in a rather reliable manner (Table 2). The In-dicators of Hydrologic Alteration set of Richter et al. (1997)was developed to guide the operation of individual reservoirs.
Hydrol. Earth Syst. Sci., 13, 2413–2432, 2009 www.hydrol-earth-syst-sci.net/13/2413/2009/

P. Doll et al.: Global-scale analysis of river flow alterations 2421
Table 2. Six ecologically relevant indicators of river flow alterations due to human water withdrawals and reservoirs.
indicator question definition ecological relevance
ILTA How are long-term average riverflows affected?
differences between long-term averageannual river discharges under anthro-pogenically impacted and naturalizedconditions, in percent of long-term aver-age annual river discharge under natural-ized conditions
number of fish speciesa,groundwater-dep. floodplainvegetation
ILF How are statistical low flowsaffected?
difference betweenQ90 (monthly riverdischarge that is exceeded in 9 out of10 months) under anthropogenically im-pacted and naturalized conditions, in per-cent ofQ90 under naturalized conditions
habitat conditions, connectivitychannel/floodplain, wastewaterdilutionb
ISA How is the seasonal amplitudeaffected?
difference in seasonal amplitude (max-imum minus minimum long-term aver-age monthly river discharge) under an-thropogenically impacted and naturalizedconditions, in % of amplitude under natu-ralized conditions
habitat availability in particular onfloodplains
ISR How is the seasonal regimeaffected?
mean over 12 monthly values of absolutedifferences between under anthropogeni-cally impacted and naturalized condi-tions in % of discharge long-term aver-age monthly river discharges under natu-ralized conditions
habitat conditions, compatibilitywith life cycle of organisms
ITS What seasonal flow shifts haveoccurred?
temporal shift of month with maximumriver discharge, in months (if negative,this month occurs earlier due to anthro-pogenic impact)
compatibility with life cycle of or-ganisms
IIV How is the interannual variability ofmonthly flows affected?
number of months (Jan, Feb, etc.) inwhich the coefficient of variation ofmonthly flows increases minus the num-ber of months in which it decreases (−12,−10,−8, . . . , +8, +10, 12) under anthro-pogenically impacted conditions as com-pared to naturalized conditionsc
habitat conditions for aquatic organ-isms
a Xenopoulos et al. (2005)b Gibson et al. (2005)c Computed only for cells in which the coefficient of variation changes by at least 10% in any month.
In these cases, daily discharge measurements are generallyavailable. Therefore, most of the 32 indicators proposedby Richter and colleagues require daily discharges and thuscannot be computed well by a global hydrological model thatis driven by monthly climate data. Therefore, we only con-sidered indicators that are based on monthly and annual riverdischarge estimates. Please note, however, that neverthe-less the uncertainty of the computed indicators is very high.When comparing observed to simulated (ANT) values of theflow regime indicators used to derive the indicators of riverflow alteration (Q90 as well as mean and interannual variabil-ity of monthly flows), the fit is good in some basins and badin others, often depending on the applied global precipitationdata set.
Indicator ISR is taken from Black et al. (2005; their in-dicator 1a), while ITS is similar to indicator 3a of Black etal. (2005) but applied for monthly instead of daily dischargevalues. Black and colleagues also suggested looking not onlyat the changes of mean values between natural and anthro-pogenic conditions, but also on the changes of the coefficientof variation. We adapted this idea when we devised indicatorIIV .
2.3 Estimation of decrease of freshwater fish richness
Xenopoulos et al. (2005) derived a regression equation be-tween the number of freshwater species in river basins andthe long-term average river discharge (1961–1990) at themouth of the basins. They considered data from 237 river
www.hydrol-earth-syst-sci.net/13/2413/2009/ Hydrol. Earth Syst. Sci., 13, 2413–2432, 2009

2422 P. Doll et al.: Global-scale analysis of river flow alterations
basins located between 42◦ N and 42◦ S. The number of fishspecies mainly relates to endemic fish, with nonindigenousspecies being assumed to be less than 5%. Long-term av-erage discharge was computed with a previous version ofWGHM (Xenopoulos et al., 2005). Fish species numbersin river basins were found to decrease with decreasing long-term average river discharge according to
Log number of fish species in basin=
0.4·log mean annual discharge at basin outlet(m3/s)
+0.6242,r2= 0.57 (2)
Xenopolous et al. (2005) used Eq. (2) to predict decreases offish species richness due to future climate change and futurewater withdrawals. Here, we applied the regression equationto translate indicator ILTA into a direct indicator of a changein the biotic component of freshwater ecosystems. We com-puted how fish species richness under naturalized flow con-ditions has decreased due to human water withdrawals andreservoirs, providing estimates for the upstream basin of each0.5◦ grid cell.
3 Results
3.1 Anthropogenic impact on long-term annual averagedischarge (ILTA )
Total discharge into oceans and internal sinks is computedto be 38 164 km3/yr under anthropogenically altered condi-tions (ANT), compared to 39 549 km3/yr for naturalized con-ditions (NAT) (climate normal 1961–1990, without Antarc-tica). Thus, dams and water withdrawals (in 2002) havelead to a decrease of global river discharge of 3.5% and acorresponding increase in evapotranspiration. Water with-drawals alone (USE) would have caused a discharge decreaseof 2.7%, while dams alone (RES) would have led to 0.8%less discharge.
Figure 4 shows naturalized long-term annual river dis-charge (Fig. 4a) as well the ILTA indicator (Fig. 4b). ILTAindicates that long-term average annual discharge (1961–90)has decreased due to anthropogenic impacts, with decreasesreaching up to 100% of natural discharge. The most affectedareas are the western and central USA, Mexico, the west-ern coast of South America, the Mediterranean rim, South-ern Africa, the semi-arid and countries of the Near East andWestern Asia, Pakistan and India, Northern China and theAustralian Murray-Darling Basin. Both reservoirs (Fig. 4c)and human water use (Fig. 4d) have led to a decrease of dis-charge. According to WGHM, the damming of a few lakes(e.g. Lake Baikal in Russia) has caused a small increase ofdischarge compared to the situation without a dam, i.e. ifthey are modeled like natural lakes (Fig. 4c). This is relatedto the different water level variations in case of reservoirs andnatural lakes, which lead to different evaporation values.
Water withdrawals are by far the dominant reason for theanthropogenic decrease of long-term average annual riverdischarge, the areas of strong decrease (high negative val-ues, Fig. 4d) coinciding with the areas of high consumptivewater use (Fig. 2a). An exception is humid Southeast Asia,where high consumptive irrigation uses do not lead to highILTA values because river discharge values are high. Globally,16% of the global land area (not considering Greenland andAntarctica) suffer from an anthropogenic decrease of long-term average annual river discharge of at least 10% of thenaturalized value (Table 3). With “16% of the global land”area we mean that 0.5◦ grid cells that cover 16% of the globalland are affected by such a decrease. In these areas, the av-erage discharge decrease amounts to 35% (Table 3), and notonly river water levels but also groundwater levels in the ad-jacent floodplains are expected to be significantly decreased,negatively affecting riparian vegetation. Based on the workby Xenopolous et al. (2005), we expect that the decrease oflong-term average river discharge has led to a decrease in thenumber of endemic fish species (comp. Sect. 3.7).
3.2 Anthropogenic impact on statistical monthly lowflow Q90 (ILF )
Naturalized statistical monthly low flowQ90 is zero in manyarid grid cells (Fig. 5a). Reservoirs and withdrawals have ledto wide-spread decreases ofQ90 (negative ILF) but also in-creases along some rivers (Fig. 5b). The increases are causedby reservoirs or the regulation of natural lakes (Fig. 5c), asdams generally have the purpose to make river flow tempo-rally more homogeneous to allow for hydropower produc-tion, flood protection or water supply. Examples are theNile just downstream of Lake Victoria, which is regulatedby a dam for hydropower production, but also the north-ern Nile where low flows have been increased by five damsin Ethiopia as well as by the Aswan Dam. The effects ofa large number of dams are visible in India, SoutheasternAfrica, Spain and in the USA. Some reservoirs in semi-aridregions have led to a decrease ofQ90 (positive ILF) becausethe additional open water surfaces cause higher evaporation(Fig. 5c). This has decreased long-term average dischargeso much that temporal homogenization of discharge cannotbalance this decrease. The negative impact of water with-drawals onQ90 is larger than the impact on long-term av-erage discharge if expressed in % decrease from naturalizedconditions (comp. Figs. 5d and 4d). The main reason for thisis that Q90 values are smaller than long-term average dis-charge values. Decreases have a particular negative impacton habitat availability. Globally,Q90 has decreased by, onaverage, 57% on 26% of the land area, mostly due to humanwater use. It has increased, by at least 10%, on 5% of the landarea, due to reservoirs, with an average increase of 161% ascompared to naturalized conditions (Table 3).
Hydrol. Earth Syst. Sci., 13, 2413–2432, 2009 www.hydrol-earth-syst-sci.net/13/2413/2009/

P. Doll et al.: Global-scale analysis of river flow alterations 2423
a
c
b
d
Fig. 4. Anthropogenic impact on long-term average (1961–90) annual river discharges, ILTA : naturalized river discharge NAT, in km3/yr (a),impact of water withdrawals and reservoirs (ANT): difference between ANT and NAT, in % of NAT(b), impact of reservoirs only (RES):difference between RES and NAT, in % of NAT(c), and impact of water withdrawals only (USE): difference between USE and NAT, in %of NAT (d). Qnat=0: naturalized river discharge value is equal to zero.
Table 3. Global characterization of anthropogenic river flow regime alteration using six indicators (ANT compared to NAT). Greenlandand Antarctica are not taken into account.
indicator % of land area with indicator value average indicator values for≥ |10%| (or ≥ |1 month|, these land areas, in %
in case of indicators ITS and IIV ) (for indicators ITS and IIV in months)a
increase decrease increase decrease
ILTA 0.002 16.2 18.2 −34.8ILF 4.9 26.0 161.4 −57.1ISA 0.6 14.8 25.7 −38.6ISR
b 23.8 41.8ITS 2.7 1.7 1 −2IIV 26.8 7.5 10 −5
a cell area weighted average of grid cell valuesb indicator has absolute values
www.hydrol-earth-syst-sci.net/13/2413/2009/ Hydrol. Earth Syst. Sci., 13, 2413–2432, 2009

2424 P. Doll et al.: Global-scale analysis of river flow alterations
a
c
b
d
Fig. 5. Anthropogenic impact on long-term average (1961–90) monthly low flowsQ90, ILF: naturalizedQ90, in km3/month(a), impact ofwater withdrawals and reservoirs (ANT): difference between ANT and NAT, in % of NAT(b), impact of reservoirs only (RES): differencebetween RES and NAT, in % of NAT(c), and impact of water withdrawals only (USE): difference between USE and NAT, in % of NAT(d).Qnat=0: naturalized river discharge value is equal to zero.
3.3 Anthropogenic impact on amplitude of seasonal
variability of long-term average monthly discharges(ISA)
Due to reservoirs and human water withdrawals, the differ-ence between the minimum and the maximum long-term av-erage monthly discharge decreases downstream of reservoirsand in areas with high consumptive water use (Fig. 6a). Itincreases slightly in areas with low water use, or down-stream of some regulated lake where regulation leads to a lesssmooth outflow (e.g. Lake Baikal and Lake Victoria). Sea-sonal amplitudes decrease mainly because of a decrease inhigh flows, either due to outflow reductions by dams or highconsumptive water use during the high flow months. Sucha decrease has negative impacts on, for example, the floraand fauna of seasonally flooded floodplains. The decreaseof seasonal amplitude due to reservoirs is consistent with theresults of Poff et al. (2007) who analyzed the impact of 186reservoirs in the continental USA, and with observations for
Arctic rivers (e.g. Yang et al., 2004). Globally, the seasonalamplitude decreases on 15% of the land area by at least 10%compared to natural conditions, by on average 39%. It in-creases by at least 10% on less than 1% of the land area, byon average 26% (Table 3).
3.4 Anthropogenic impact on seasonal flow regime (ISR)
Different from ISA, the indicator ISR does not look only atthe months with the highest and lowest flows but consid-ers the anthropogenic changes of all 12 long-term averagemonthly river discharge values. ISR may range between 0%and infinity because for this indicator, absolute differences ofthe monthly discharges under naturalized and anthropogenicdifferences, in percent of the naturalized monthly flows, areaveraged over all 12 months. On almost one quarter of theglobal land area, ISR is 10% or larger, while the averageISR-value for this area is 42% (Table 3). There, natural sea-sonal flow variability has been altered significantly, with neg-ative impacts on habitat availability and the compatibility of
Hydrol. Earth Syst. Sci., 13, 2413–2432, 2009 www.hydrol-earth-syst-sci.net/13/2413/2009/

P. Doll et al.: Global-scale analysis of river flow alterations 2425
a
b
Fig. 6. Anthropogenic impact on seasonal flow amplitudes, ISA, in % of NAT (a), and on seasonal flow regimes, ISR, in % of NAT (b).Qnat=0: naturalized river discharge value is equal to zero.
the flow regime with the life cycle of aqueous organisms.Figure 6b shows the spatial distribution of the indicator. Bothreservoirs and high consumptive water use can cause largechanges in the seasonal flow regime, but the impact of con-sumptive water use is more diffuse and often stronger thanthe impact of reservoirs.
3.5 Anthropogenic shift of month with maximumdischarge (ITS)
ITS indicates where altered river flows dynamics may not becompatible with the life cycle of organisms any more. A shiftin the seasonal occurrence of the maximum mean monthlydischarge value of at least one month occurs rather seldom
www.hydrol-earth-syst-sci.net/13/2413/2009/ Hydrol. Earth Syst. Sci., 13, 2413–2432, 2009

2426 P. Doll et al.: Global-scale analysis of river flow alterations
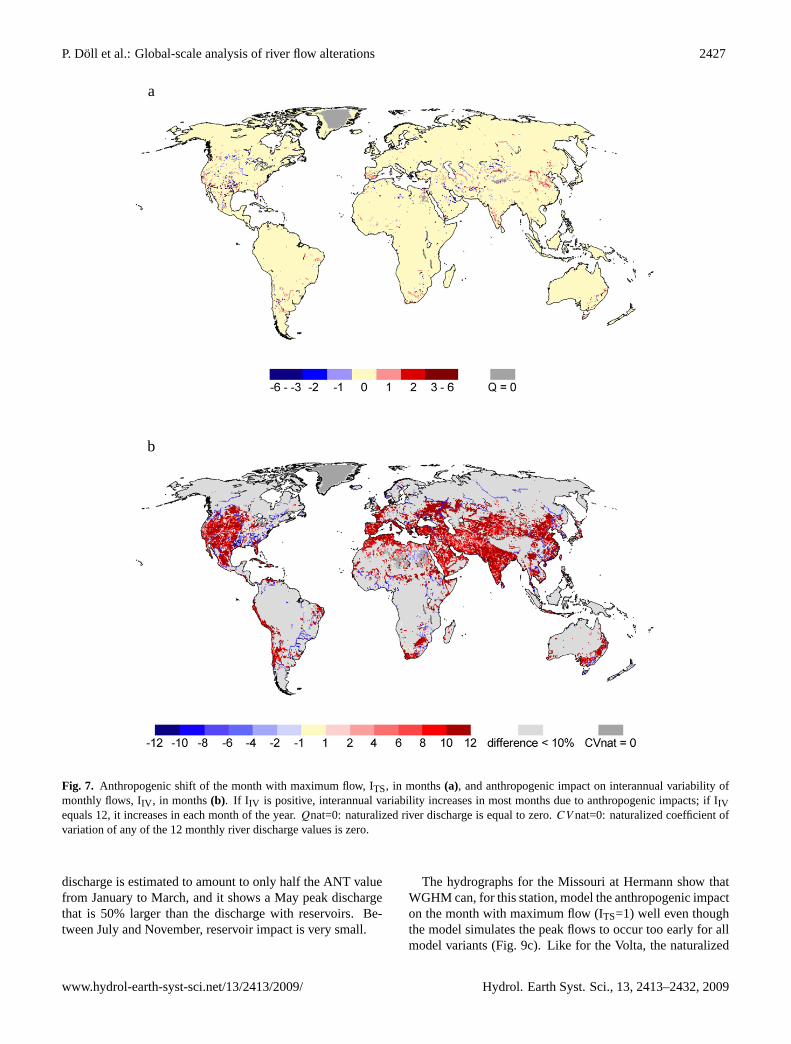
and is almost exclusively due to reservoir operations (Fig. 7a,compare to Fig. 5c). On almost 3% of the land area, maxi-mum seasonal flows occur at least one month later than undernaturalized conditions, and on almost 2% of the land area atleast one month earlier, with typical shifts of 1 to 2 months(Table 3). The USA is particularly affected by temporal shiftsof the occurrence of high flows (Fig. 7a).
3.6 Anthropogenic impact on interannual variability ofmonthly flows (IIV )
Interannual variability of monthly mean flows, as expressedby the coefficient of variation, increases significantly wher-ever there is an even small consumptive water use (Figs. 7band 1a). Please note that IIV is computed only for cells inwhich the coefficient of variation changes by at least 10%in any month. In years with low precipitation and thus lownatural discharge, discharge is strongly decreased by higherthan normal consumptive water use for irrigation. In yearswith high precipitation and natural discharge, discharge isless strongly decreased, as a high precipitation amount leadsto a lower than normal irrigation water use. Therefore, irriga-tion increases interannual variability of river discharge suchthat IIV is positive in irrigation areas. But even the temporallyconstant consumptive water use assumed for households andindustry leads to an increase of IIV , as the coefficient of vari-ation increases with decreasing mean. Interannual variabilitydecreases only downstream of dams where there is no highconsumptive water use (Fig. 7b). The latter is consistent withthe findings of Poff et al. (2007) for the USA.
On more than one quarter of the land area, the numberof months in which interannual variability increases is largerthan the number of months for which interannual variabil-ity decreases due to anthropogenic impacts. For these cells,variability increases, on average, for 11 out of 12 months(IIV =11+(−1)=10, Table 3). On less than 8% of the landarea, interannual variability predominantly decreases, during8 to 9 months on average (Table 3).
3.7 Effect of anthropogenically decreased long-termaverage river flows on the number of fish species
Due mainly to water withdrawals, long-term annual riverdischarge has decreased as compared to natural conditions(Sect. 3.1), and it can be expected that this decrease haslead to a decrease of endemic fish species (Xenopoulos etal., 2005). Using Eq. (2), the decrease in the number of fishspecies upstream of each grid cell due to water withdrawalsand dams, in % of fish species that would exist under nat-uralized long-term average river discharge, was computed(Fig. 8). High decreases of fish species of up to 99% mayhave occurred according to this rough estimation, with thehighest decreases in areas with a very high decrease of long-term average discharge due to water withdrawals (Fig. 4dand Sect. 3.1). On 10% of the land area, the number of
fish species in the upstream basin has decreased by at least10%, while on 0.6%, it has decreased by even 50% and more.The average decrease in areas with at least a 10% decreaseis 24%. We believe that the computed fish species reductionis much smaller than in reality as only the changes of annualriver discharge are taken into account, but not the changes atthe monthly scale.
4 Discussion
Our study has indicated significant flow alterations in regionswith high consumptive water use (i.e. irrigation areas) anddownstream of dams. The question is: how well can we esti-mate river flow alterations due to human water use and damswith WGHM? As four of the six indicators presented here arebased on mean monthly river discharges, we looked at meanmonthly river discharge at four gauging stations for whichobservations and partly also independent estimates of natu-ralized flows were available. All four stations (Colorado atLees Ferry, Missouri at Hermann, Volta at Senchi (Halcrow),and Volga at Volgograd Power Station) are tuning stationsthat are located downstream of large reservoirs, but only thetwo US basins have considerable consumptive water use (Ta-ble 4). For the US basins, local estimates of naturalized riverdischarge were available for 1980–1999 (Haddeland et al.,2006). Please note that the station “Glen Canyon” in Hadde-land et al. (2006) is equivalent to the station “Lees Ferry”.
For the Volta at Senchi, we compared long-term monthlyriver discharge as computed for naturalized conditions (NAT)for the years 1951–1964, i.e. for the time before dam con-struction, with values that were observed during that time pe-riod. In addition, we considered the time period 1968–1984after dam construction, comparing observations to simula-tions under anthropogenic impacts (ANT). Figure 9a showsthat for the time period after dam construction, the verylow observed seasonality of discharge is represented well byWGHM. If Lake Volta is modeled like a natural lake and nota reservoir (ANT LAKE), the fit to the observed discharge isworse, and, for example, discharge in the dry season (Febru-ary to June) is underestimated. Simulated naturalized dis-charge, i.e. discharge before dam construction, has a muchhigher seasonal variability than the anthropogenically im-pacted discharge, with a peak in September. Observed vari-ability, however, is even larger, with a higher peak that isshifted by one month, and zero flow between February andMay. Thus, for this gauging station, WGHM underestimatesISA and ISR, while ITS is estimated correctly.
Discharge of the Volga observed at the Volgograd PowerStation during the period 1961–90 peaks in May, which israther well modeled by ANT even though discharge fromJanuary to March is somewhat underestimated (Fig. 9b). Ifthe upstream reservoirs are simulated like natural lakes, peakdischarge is overestimated, and the impact of reservoirs onpeak flow is strongly underestimated (Fig. 9b). Naturalized
Hydrol. Earth Syst. Sci., 13, 2413–2432, 2009 www.hydrol-earth-syst-sci.net/13/2413/2009/
P. Doll et al.: Global-scale analysis of river flow alterations 2427
a
b
Fig. 7. Anthropogenic shift of the month with maximum flow, ITS, in months(a), and anthropogenic impact on interannual variability ofmonthly flows, IIV , in months(b). If I IV is positive, interannual variability increases in most months due to anthropogenic impacts; if IIVequals 12, it increases in each month of the year.Qnat=0: naturalized river discharge is equal to zero.CV nat=0: naturalized coefficient ofvariation of any of the 12 monthly river discharge values is zero.
discharge is estimated to amount to only half the ANT valuefrom January to March, and it shows a May peak dischargethat is 50% larger than the discharge with reservoirs. Be-tween July and November, reservoir impact is very small.
The hydrographs for the Missouri at Hermann show thatWGHM can, for this station, model the anthropogenic impacton the month with maximum flow (ITS=1) well even thoughthe model simulates the peak flows to occur too early for allmodel variants (Fig. 9c). Like for the Volta, the naturalized
www.hydrol-earth-syst-sci.net/13/2413/2009/ Hydrol. Earth Syst. Sci., 13, 2413–2432, 2009

2428 P. Doll et al.: Global-scale analysis of river flow alterations
Fig. 8. Change of number of fish species upstream of grid cells due to changes in long-term average discharge caused by water withdrawalsand reservoirs, in % of fish species that would exist under naturalized conditions.
Volta at Senchi (Halcrow)
0
2
4
6
8
10
12
14
16
18
Jan Feb Mar Apr May Jun Jul Aug Sep Oct Nov Dec
disc
harg
e [k
m³/m
onth
]
obs. before dam was built (1951-1964)
NAT (1951-1964)
obs. after dam was built (1968-1984)
ANT (1968-1984)
ANT LAKE (1968-1984)
Volga at Volgograd
0
10
20
30
40
50
60
70
80
90
100
Jan Feb Mar Apr May Jun Jul Aug Sep Oct Nov Dec
disc
harg
e [k
m³/m
onth
]
obs
ANT
ANT LAKE
NAT
Missouri at Hermann
0
2
4
6
8
10
12
14
16
18
Jan Feb Mar Apr May Jun Jul Aug Sep Oct Nov Dec
disc
harg
e [k
m³/m
onth
]
Colorado at Lees Ferry
0
1
2
3
4
5
6
Jan Feb Mar Apr May Jun Jul Aug Sep Oct Nov Dec
disc
harg
e [k
m³/m
onth
]
RESUSEnaturalized flow data
RESUSEnaturalized flow data
Fig. 9. Long-term average monthly river discharge at four selected gauging stations: comparison between observed and independent estimatesof naturalized river discharges, and modeled anthropogenically altered (ANT) and naturalized (NAT) conditions. ANT LAKE refers to asimulation in which the global reservoirs are modeled as lakes, while RES and USE refer to simulations with only reservoirs or only use,respectively. Discharge observations were provided by the Global Runoff Data Centre (grdc.bafg.de), while naturalized discharge data arefrom Haddeland et al. (2006). Time period for the Colorado and Missouri 1980–1999, for the Volga 1961–1990. Please note that legend forthe Volga also applies to Missouri and Colorado.
Hydrol. Earth Syst. Sci., 13, 2413–2432, 2009 www.hydrol-earth-syst-sci.net/13/2413/2009/

P. Doll et al.: Global-scale analysis of river flow alterations 2429
Table 4. Characteristics of four selected gauging stations with significant impact of upstream reservoirs or water use: basin and station name,upstream area, observed long-term average river discharge, consumptive use CU in upstream area, reservoir area in % of upstream area andreservoir storage divided by observed discharge (S/Qobs).
basin station tuning upstream observed CU 2002 reservoirS/Qobsperiod areaa discharge upstream area [% of
[km2] [km3/yr] [km3/yr] upstream [yr]area]
Colorado Lees Ferry 1955–84 288 177 12.1 3.70 0.38 3.56
Missouri Hermann 1958–87 1 347 425 76.1 22.76 0.45 1.25
Volga Volgograd Power Plant 1961–90 1 363 415 239.2 3.09 1.38 0.82
Volta Senchi (Halcrow) 1955–84 399 457 32.9 0.18 2.00 4.77
a basin area upstream of gauging station according to WGHM
peak flow is somewhat underestimated by the model whichleads to an underestimation of ISA. Without reservoirs andonly water use (USE), discharge would decrease signifi-cantly throughout the year as compared to naturalized dis-charge, while reservoirs but no water use (RES) would leadto increased discharge in winter (January to March) and de-creased values during the high flow period from April to Au-gust. As upstream water use also affects the simulated reser-voir operation, the effects of reservoirs and use are not addi-tive.
Like for the Volta and the Missouri, naturalized seasonalpeak flow is underestimated by WGHM for the Coloradoat Lees Ferry, while the low seasonal variability of anthro-pogenically impacted discharge is captured well (Fig. 9d).The observed shift of the month with maximum flow is onemonth, but zero months for the simulated values. Again, thepositive effect of modeling the outflow dynamics of reser-voirs differently from those of natural lakes can be observed.Nonetheless, there are also some stations around the globefor which a better fit to observed discharge can be obtained ifreservoirs are modeled like natural lakes. Based on the anal-ysis of the four stations, we might conclude that with respectto the indicators ISA and ISR, our WGHM-based analysis un-derestimates the actual anthropogenic impact. However, dueto the very low number of analyzed stations, this conclusionis not robust.
Haddeland et al. (2006) showed a better fit between thenaturalized flow regime they computed with the hydrologi-cal model and the independent naturalized flow data for theColorado and the Missouri shown in Fig. 9. This might bedue to the fact that they (indirectly) tuned their reservoir algo-rithm to the naturalized flow data available to them: for theColorado, the Missouri and the Columbia. Besides, tuningof their hydrological involved more parameters than tuningof WGHM.
With respect to modeling the impacts of reservoirs on dis-charge dynamics, a major uncertainty is caused by the factthat reservoir operation is done, in reality, in a very site-specific manner that cannot be simulated very well by ageneral algorithm in a global-scale model. The actual num-ber of reservoirs, in particular the number of small reservoirs,is much higher than the number of reservoirs represented inWGHM. Therefore, the impact of reservoirs and regulatedlakes on river flow regimes is certainly underestimated in thisstudy.
With respect to the impacts of water use, uncertainty isrelated to uncertain water use estimates, in particular for irri-gation. Here, even the location of areas equipped for irriga-tion is rather uncertain in many areas (Siebert et al., 2005).Besides, water withdrawals are assumed to be taken fromsurface water or shallow groundwater, such that all waterwithdrawals lead to a river flow reduction. If, however, deepgroundwater without any connection to surface water is with-drawn, river flow might even increase due to the return flowto surface water via artificial drainage or shallow groundwa-ter.
How significant are the anthropogenic changes of riverflow regimes caused by water withdrawals and reservoirs ascompared to the conversion of potential vegetation to agri-cultural land? Conversion to agricultural land has lead todecreased evapotranspiration while water use and reservoirshave increased evapotranspiration. Besides, land conversionhas affected all agricultural lands and not only the approx-imately 20% that are irrigated. Rost et al. (2008) modeledboth the impact of land conversion and the impact of wateruse for the time period 1991–2000. They found that land con-version (without irrigation) has increased global long-termaverage river discharge by 6.6% as compared to the dischargefor potential vegetation, while irrigation has led to a decreaseof 1.5% as compared to only rainfed agriculture. The lattervalue differs from our model analysis, where irrigation water
www.hydrol-earth-syst-sci.net/13/2413/2009/ Hydrol. Earth Syst. Sci., 13, 2413–2432, 2009

2430 P. Doll et al.: Global-scale analysis of river flow alterations
withdrawals are estimated to result in a decrease of globaldischarge of approximately 2.4%. The discrepancy betweenthe two model results may be due to the fact that in themodel of Rost et al. (2008), delayed satisfaction of water re-quirements from surface waters, which approximates waterwithdrawals from renewable groundwater resources, is notimplemented, such that a smaller fraction of the water re-quirements can be fulfilled than in WGHM (see Fig. 1b). Inconclusion, decrease of river discharge by total water with-drawals and dams, by 3.5% as computed in our study, ap-proximately balances half of the discharge increase causedby land conversion, if we consider global averages. How-ever, an aggregation over river basins is more appropriate forecological questions. Rost et al. (2008) found that in riverbasins with extensive irrigation the combined effect of landconversion and irrigation water use was a decrease of riverdischarge, even though they appear to somewhat underesti-mate the effect of irrigation. Thus, we expect that conver-sion and water use in semi-arid areas with significant irriga-tion have lead to an overall decrease of discharge unless deepnon-renewable groundwater is the source of water.
5 Conclusions
This study has provided a first global overview of the im-pacts of human water use and dams on river flow regimes.Six different indicators of river flow alteration were identi-fied that are of specific relevance for the health (e.g. biodi-versity) of the biotic components of freshwater ecosystems.These indicators describe anthropogenic flow changes thatconcern organisms in surface waters as well as groundwater-dependent vegetation in floodplains. Applying the state-of-the-art global water model WaterGAP, which integrates thecomputation of both human water use and terrestrial waterflows and takes into account the impact of more than 6600dams, these indicators were quantified with a spatial resolu-tion of 0.5◦ by 0.5◦.
Total long-term average river discharge into oceans andinternal sinks has been decreased by 3.5% due to water with-drawals and dams. One sixth of the global land area (ex-cluding Greenland and Antarctica) has suffered from a sig-nificant decrease of long-term average annual river discharge(of more than 10%), mainly due to water withdrawals and inparticular irrigation, which accounts for more than 90% ofglobal consumptive water use. The average decrease in theseareas has been 35%. This decrease in annual river dischargemay have lead to a more than 10% decrease of the numberof fish species in the upstream basins of one tenth of the landarea. The monthly statistical low flowQ90 has decreased sig-nificantly on a quarter of the land area, but on 5% of the landarea, downstream of reservoirs, it has increased significantly.Also on one sixth of the land area, seasonal discharge am-
plitudes have decreased significantly, both due to reservoirsand water use. While seasonal variability has thus becomesmaller due to human impacts, interannual variability has in-creased due to water use except in areas downstream of damswith little consumptive water use. A temporal shift of themonth with maximum discharge by at least one month hasoccurred on only 4% of the land area. The spatial patterns ofsignificant alterations are roughly the same for all indicatorsexcept ITS, as high indicator values are in most cases relatedto the spatial patterns of water use and dams.
Identification and quantification of anthropogenic riverflow alterations is a first step for defining environmental flowguidelines. The next step would be to develop quantitativerelationships between indicators of biotic changes (e.g.species richness, traits, assemblage structure, recruitmentsuccess) and degrees of flow alterations (Arthington et al.,2006). Arthington et al. (2006) suggested computing flowalterations either as compared to undisturbed referencestreams, or, if these do not exist, by hydrological modelingas done in this study. They also suggested classifying allrivers according to their natural flow regime, such thatquantitative relationships determined for a few selectedrivers can be applied to rivers for which no ecological dataare available. This approach has the potential to lead toscientifically-based environmental flow guidelines even forthe majority of global rivers that only have very scarceecological data. Such guidelines are urgently required tosupport a sustainable water resources management thatbalances human and ecosystem water demands.
Acknowledgements.We thank Bernhard Lehner and IngjerdHaddeland for providing data. We are grateful to Balazs Feketeand two anonymous reviewers for their thoughtful comments.This study was partly funded by the IPSWaT program of BMBF(German Ministry for Education and Research).
Edited by: K. Bishop
References
Alcamo, J., Doll, P., Henrichs, T., Kaspar, F., Lehner, B., Rosch, T.,and Siebert, S.: Global estimates of water withdrawals and avail-ability under current and future “business-as-usual” conditions,Hydrol. Sci. J., 48, 339–348, 2003a.
Alcamo, J., Doll, P., Henrichs, T., Kaspar, F., Lehner, B., Rosch,T., and Siebert, S.: Development and testing of the WaterGAP2 global model of water use and availability, Hydrol. Sci. J., 48,317–337, 2003b.
Arthington, A. H., Bunn, S. E., Poff, N. L., and Naiman, R. J.: Thechallenge of providing environmental flow rules to sustain riverecosystems, Ecol. Appl., 16(4), 1311–1318, 2006.
Hydrol. Earth Syst. Sci., 13, 2413–2432, 2009 www.hydrol-earth-syst-sci.net/13/2413/2009/

P. Doll et al.: Global-scale analysis of river flow alterations 2431
Arthington, A. H. and Pusey, B. J.: In-stream flow management inAustralia: methods, deficiencies and future directions, AustralianBiology, 6, 52–60, 1993.
Avakyan, A. B. and Iakovleva, V.B.: Status of global reservoirs:The position in the late twentieth century, Lakes & Reservoirs,Research and Management, 3, 45–52, 1998.
Black, A. R., Rowan, J. S., Duck, R. W., Bragg, O. M., and Clel-land, B. E.: DHRAM: a method for classifying river flow regimealterations for the EC Water Framework Directive, Aquat. Con-serv., 15, 427–446, 2005.
Bouwer, L. M., Aerts, J. C. J. H., Droogers, P., and Dolman, A. J.:Detecting the long-term impacts from climate variability and in-creasing water consumption on runoff in the Krishna river basin(India), Hydrol. Earth Syst. Sci., 10, 703–713, 2006,http://www.hydrol-earth-syst-sci.net/10/703/2006/.
Chao, B. F., Wu, Y. H., and Li, Y. S.: Impact of artificial reservoirwater impoundment on global sea level, Science, 320, 212–214,2008.
Clausen, B. and Biggs, B. J. F.: Flow variables for ecological studiesin temperate streams: groupings based on covariance, J. Hydrol.,237, 184–197, 2000.
Custodio, E.: Aquifer overexploitation: what does it mean? Hydro-geol. J., 10, 254–277, 2002.
Doll, P.: Vulnerability to the impact of climate change on renewablegroundwater resources: a global-scale assessment, Environ. Res.Lett., 4, 036006, doi:10.1088/1748- 9326/4/3/035006, 2009.
Doll , P. and Fiedler, K.: Global-scale modeling of groundwaterrecharge, Hydrol. Earth Syst. Sci., 12, 863–885, 2008,http://www.hydrol-earth-syst-sci.net/12/863/2008/.
Doll, P., Kaspar, F., and Lehner, B.: A global hydrological modelfor deriving water availability indicators: model tuning and vali-dation, J. Hydrol., 270(1–2), 105–134, 2003.
Doll, P. and Siebert, S.: Global modeling of irrigation water require-ments, Water Resour. Res., 38(4), 81–810, 2002.
Dudgeon, D., Arthington, A. H., Gessner, M. O., Kawabata Z.-I.,Knowler, D. J., Leveque, C., Naiman, R. J., Prieur-Richard, A.-H., Soto, D., Stiassny, M. L. J., and Sullivan, C. A.: Freshwaterbiodiversity: importance, threats, status and conservation chal-lenges, Biol. Rev., 81, 163–182, 2006.
Foster, S. and Loucks, D. P. (eds.): Non-renewable groundwaterresources: a guidebook on socially-sustainable management forwater-policy makers, IHP-VI Series on Groundwater, 10, UN-ESCO, 103 pp., 2006.
Fuchs, T., Schneider, U., and Rudolf, B.: GPCC Annual Reportfor Year 2007, GPCC/Deutscher Wetterdienst,http://gpcc.dwd.de, 2007.
Haddeland, I., Skaugen, T., and Lettenmaier, D. P.: Anthropogenicimpacts on continental surface water fluxes, Geophys. Res. Lett.,33, L08406, doi:10.1029/2006GL026047,2006.
Hanasaki, N., Kanae, S., and Oki, T.: A reservoir operation schemefor global river routing models, J. Hydrol., 327, 22–41, 2006.
Hunger, M. and Doll, P.: Value of river discharge data for global-scale hydrological modeling, Hydrol. Earth Syst. Sci., 12, 841–861, 2008,http://www.hydrol-earth-syst-sci.net/12/841/2008/.
ICOLD (International Commission on Large Dams): World Regis-ter of Dams (CD-ROM), Paris, France, 1998.
Kingsford, R. T. and Thomas, R. F.: Destruction of wetlandsand waterbird populations by dams and irrigation on the Mur-
rumbidgee River in arid Australia, Environ. Manage, 34(3), 383–396, 2004.
Janssen, P. H. M. and Heuberger P. S. C.: Calibration of process-oriented models, Ecol. Model. 83, 55–66, 1995.
Lehner, B., Reidy Liermann, C., Fekete, B., Vorosmarty, C., Re-venga, C., Crouzet, P., Doll, P., Endejan, M., Frenken, K.,Magome, J., Robertson, J., Rodel, R., Sindorf, N., and Wisser,D.: Development and Strategies for Application of a GlobalReservoir and Dam GRanD) Database, in preparation, 2009.
Lehner, B., Fekete, B., Reidy, C., and Vorosmarty, C.: GlobalReservoir and Dam (GRanD) Database – Project Summary,http://www.gwsp.org/currentactivities.html, 2008.
Lehner, B. and Doll, P.: Development and validation of a globaldatabase of lakes, reservoirs and wetlands, J. Hydrol., 296, 1–22,2004.
Millennium Ecosystem Assessment: Ecosystems and human well-being: wetlands and water synthesis, World Resources Institute,Washington, DC, USA, 2005.
Mitchell, T. D. and Jones, P. D.: An improved method of construct-ing a database of monthly climate observations and associatedhigh-resolution grids, Int. J. Climatology, 25, 693–712, 2005.
Nilsson, C., Reidy, C. A., Dynesius, M., and Revenga, C.: Frag-mentation and flow regulation of the world’s large river systems,Science, 308(5720), 405–408, 2005.
Poff, N. L., Olden, J. D., Merritt, D. M., and Pepin, D. M.: Homoge-nization of regional river dynamics by dams and global biodiver-sity implications, P. Natl. Acad. Sci. USA, 104(14), 5732–5737,2007.
Poff, N. L., Allan, D. J., Brain, M. B., Karr, J. R., Prestegaard, K. L.,Richter, B. D., Sparks, R. E., and Stromberg, J. C.: The naturalflow regime: a paradigm for river conservation and restoration,Bioscience, 47(11), 769–784, 1997.
Poff, N. L. and Ward, J. V.: Implications of stream flow variabil-ity and predictability for lotic community structure: a regionalanalysis of stream flow patterns, Can. J. Fish. Aquat. Sci., 46,1805–1818, 1989.
Puckridge, J. T., Sheldon, F., Walker, K. F., and Boulton, A. J.: Flowvariability and the ecology of large rivers, Mar. Freshwater Res.,49, 55–72, 1998.
Revenga, C., Campbell, I., Abell, R., de Villiers, P., and Bryer,M.: Prospects for monitoring freshwater ecosystems towards the2010 targets, Phil. Trans. R. Soc. B, 360, 397–413.
Richter, B. D., Baumgartner, J. V., Powell, J., and Braun, D. P.:A method for assessing hydrologic alteration within ecosystems,Conserv. Biol., 10(4), 1163–1174, 1996.
Richter, B. D., Baumgartner, J. V. Wigington, R., and Braun, D.P.: How much water does a river need? Freshwater Biol., 37,231–249, 1997.
Rost, S., Gerten, D., Bondeau, A., Lucht, W, Rohwer, J., andSchaphoff, S.: Agricultural green and blue water consumptionand its influence on the global water system, Water Resour. Res.,44, W09405, doi:10.1029/2007WR006331, 2008.
Siebert, S., Doll, P., Hoogeveen, J., Faures, J.-M., Frenken, K., andFeick, S.: Development and validation of the global map of irri-gation areas, Hydrol. Earth Syst. Sci., 9, 535–547, 2005,http://www.hydrol-earth-syst-sci.net/9/535/2005/.
Smakhtin, V., Revenga, C., and Doll, P.: A pilot global assess-ment of environmental water requirements and scarcity, WaterInt., 29(3), 307–317, 2004.
www.hydrol-earth-syst-sci.net/13/2413/2009/ Hydrol. Earth Syst. Sci., 13, 2413–2432, 2009

2432 P. Doll et al.: Global-scale analysis of river flow alterations
Vogl, A. L. and Lopes, V. L.: Impact of water resources develop-ment on flow regimes in the Brazos River, Environ. Monit. As-sess., 157, 331–345, doi:10.1007/s10661-008-0538-5, 2009.
Vorosmarty, C. J., Sharma, K. P., Fekete, B. M., Copeland, A. H.,Holden, J., Marble, J., and Lough, J. A.: The storage and ag-ing of continental runoff in large reservoir systems of the world,AMBIO, 26(4), 210–219, 1997.
World Commission of Dams: Dams and Development, Earthscan,2000.
Xenopoulos, M. A., Lodge, D. M., Alcamo, J., Marker, M., Schulze,K., and van Vuuren, D. P.: Scenarios of freshwater fish extinc-tions from climate change and water withdrawal, Glob. ChangeBiol., 11, 1557–1564, 2005.
Yang, D., Ye, B., and Kane, D.: Streamflow changes over SiberianYenisey River basin, J. Hydrol., 296, 59–80, 2004.
Hydrol. Earth Syst. Sci., 13, 2413–2432, 2009 www.hydrol-earth-syst-sci.net/13/2413/2009/