Global Nuclear Markets – Market Arrangements and Service ...
85
INL/EXT-16-38796 Global Nuclear Markets – Market Arrangements and Service Agreements Brent Dixon Leilani Beard June 2016 The INL is a U.S. Department of Energy National Laboratory operated by Battelle Energy Alliance
-
Upload
khangminh22 -
Category
Documents
-
view
0 -
download
0
Transcript of Global Nuclear Markets – Market Arrangements and Service ...
INL/EXT-16-38796
Global Nuclear Markets – Market Arrangements and Service Agreements
Brent Dixon
Leilani Beard
June 2016
The INL is a U.S. Department of Energy National Laboratory
operated by Battelle Energy Alliance
DISCLAIMER
This information was prepared as an account of work sponsored by an
agency of the U.S. Government. Neither the U.S. Government nor any
agency thereof, nor any of their employees, makes any warranty,
expressed or implied, or assumes any legal liability or responsibility for
the accuracy, completeness, or usefulness, of any information, apparatus,
product, or process disclosed, or represents that its use would not infringe
privately owned rights. References herein to any specific commercial
product, process, or service by trade name, trade mark, manufacturer, or
otherwise, does not necessarily constitute or imply its endorsement,
recommendation, or favoring by the U.S. Government or any agency
thereof. The views and opinions of authors expressed herein do not
necessarily state or reflect those of the U.S. Government or any agency
thereof.
INL/EXT-16-38796
Global Nuclear Markets – Market Arrangements and
Service Agreements
Brent Dixon Leilani Beard
June 2016
Idaho National Laboratory Nuclear Systems Design & Analysis Division
Idaho Falls, Idaho 83415
Prepared for the U.S. Department of Energy
Office of Energy Policy and Systems Analysis Under U.S. Department of Energy-Idaho Operations Office
Contract DE-AC07-05ID14517

iii
Forward
The U.S. Department of Energy’s Office of Energy Policy and Systems Analysis (EPSA) requested an
assessment of global nuclear markets, including the structure of nuclear companies in different countries
and the partnerships between reactor vendors and buyers. EPSA was interested in obtaining information
on the competitive context of international sales of reactors and fuel services. The Idaho National
Laboratory responded to this request with a plan for information gathering and assessment of global
markets in several phases. The first phase researched global sources and developed a collection of
information to assist in the analyses of the global market status and trends in services provided in
conversion, enrichment, reactor design, construction and operation, and used fuel management and
reprocessing. This report summarized this first phase, including analysis conclusions about current global
markets. Additional phases will address specific topics that are of particular interest to EPSA.

iv
v
SUMMARY OF KEY FINDINGS
The U.S. Department of Energy’s Office of Energy Policy and Systems Analysis (EPSA) requested an
assessment of global nuclear markets, including the structure of nuclear companies in different countries
and the partnerships between reactor vendors and buyers.
This report documents the findings of the first phase of the Global Nuclear Markets project, along with a
description of the work performed. This includes findings on the countries and companies involved with
trade in nuclear reactors and fuel services, market arrangements, and service agreements, in conversion,
enrichment, reactor design, construction and operation, and used fuel storage and reprocessing, along with
assessment of the trends in these areas.
The work was conducted by collecting information of nuclear facilities and service providers, and
performing an extensive open-sourced literature search to validate and update the information and to
identify agreements and relationships between countries and companies. Chronological information was
developed to assist in the identification of market trends. Analysis was then performed to assess overall
market conditions and develop insights on developments with the major players.
Extensive lists of existing and planned fuel cycle facilities and reactors under construction or planned
were developed and general relationships between suppliers and customers identified. Specific
relationship identification was limited due to a lack of publicly available information for a systematic
assessment. The main sources of facility information were found to be slightly dated and not always in
agreement, especially with respect to the status of planned reactor projects and the capacities of existing
conversion and enrichment facilities. Efforts to validate data in these areas revealed the constantly
changing nature of the information.
The main conclusions of the work include:
Financing for a new nuclear reactor projects continue to be a significant obstacle for most
countries wanting to include nuclear in their energy mix.
o Countries like China and Russia that have the ability to offer financing terms for reactor
construction that are outside of the OECD Financing Nuclear projects guideline can have
a competitive advantage.
Reactor construction performance seems to have a major impact on where growth is occurring
and which providers are obtaining new business.
o Average construction times under 6 years in Korea and China may be contributing to
domestic growth while also providing a competitive advantage for exports by reducing
perceived project risk.
o Conversely, established vendors that are struggling to complete current projects may be
at a disadvantage for future sales, depending on customer perception of the reasons for
project delays.
Geopolitics may influence reactor projects and reactor vendor choices for smaller countries.
o Russia often has the inside track for new projects in countries with strong political ties.
o China’s initial exports are to Pakistan, which has strong trading ties with China.
Some prototype and demonstration SMRs are under construction and many others are in
development. While many countries have expressed interest in SMRs, significant commercial
orders have not yet materialized.
Some progress in fielding prototype advanced “Generation IV” reactors was observed, especially
for sodium-cooled fast reactors where Russia and India are both currently completing larger
plants. A prototype high temperature gas reactor is under construction in China.
vi
The Fukushima accident continues to have strong repercussions within Japan, with only limited
restarts of existing reactors and lower targets for nuclear energy’s market share going forward.
o Outside of Japan, the impact of Fukushima on the reactor construction industry has been
mixed with countries with struggling programs or overall low energy demand growth
apparently impacted more than countries with thriving programs and higher energy
demand growth.
o The prolonged shutdown of reactors in Japanese reactors and slower growth globally has
had a greater impact on the fuel supply chain.
Each stage of the fuel cycle front end appears to have ample supply capacity to meet current and
near-term demand
o Spot prices for yellowcake, conversion and enrichment are all down significantly since
Fukushima. Some new enrichment facilities have been postponed or cancelled.
o While reactor vendor typically provide fuel for the initial years of operations for new
reactors, more fuel supplier diversification and competition is occurring for refueling of
reactors when fuel contracts come up for renewal.
o The European Union is requiring new reactors to have more than one fuel supplier in the
medium term to improve security of supply.
o Westinghouse is emerging as a second supplier of VVER fuels outside Russia.
vii
CONTENTS
Forward ........................................................................................................................................................ iii
SUMMARY OF KEY FINDINGS ............................................................................................................... v
1. INTRODUCTION .............................................................................................................................. 1
1.1 Background .............................................................................................................................. 1
1.2 Approach .................................................................................................................................. 2
2. THE GLOBAL NUCLEAR LANDSCAPE ....................................................................................... 4
2.1 Reactors .................................................................................................................................... 4
2.2 Fuel Services ............................................................................................................................ 6
2.3 Other Markets .......................................................................................................................... 7
3. AGREEMENTS AND RELATIONSHIPS ........................................................................................ 8
3.1 Types of Agreements ............................................................................................................... 8
3.2 Current Relationships ............................................................................................................... 9
4. THE PLAYERS................................................................................................................................ 11
4.1 The Countries ......................................................................................................................... 11 4.1.1 Suppliers ................................................................................................................... 11 4.1.2 Users ......................................................................................................................... 11 4.1.3 Newcomers ............................................................................................................... 13
4.2 Major Companies ................................................................................................................... 14 4.2.1 Reactor providers ...................................................................................................... 15 4.2.2 Fuel cycle service providers ...................................................................................... 17
5. REACTOR MARKET ...................................................................................................................... 18
5.1 Historic Reactor Market Patterns ........................................................................................... 18
5.2 Current Market Trends ........................................................................................................... 19 5.2.1 Accelerating .............................................................................................................. 19 5.2.2 Maintaining or Stalled ............................................................................................... 21 5.2.3 Phase-out ................................................................................................................... 24
5.3 Current Demand ..................................................................................................................... 25
5.4 Demand Drivers ..................................................................................................................... 28
5.5 Supplier trends ....................................................................................................................... 29 5.5.1 Emerging suppliers ................................................................................................... 29 5.5.2 Struggling suppliers .................................................................................................. 29 5.5.3 Partnering arrangements ........................................................................................... 29
6. FUEL CYCLE SERVICE MARKETS ............................................................................................ 31
6.1 Fuel Cycle Status ................................................................................................................... 32 6.1.1 Uranium .................................................................................................................... 32 6.1.2 Conversion ................................................................................................................ 32 6.1.3 Enrichment ................................................................................................................ 33 6.1.4 Fuel fabrication ......................................................................................................... 35
viii
6.1.5 Spent fuel wet and dry storage .................................................................................. 36 6.1.6 Reprocessing ............................................................................................................. 36
6.2 Supplier Trends ...................................................................................................................... 37
6.3 Developing Relationships ...................................................................................................... 38
7. SPECIAL TOPICS ........................................................................................................................... 39
7.1 Advanced Reactors - Generation IV potential ....................................................................... 39
7.2 Near-Term Reactors - SMR potential .................................................................................... 40
8. CONCLUSIONS .............................................................................................................................. 42
REFERENCES ........................................................................................................................................... 44
Appendix A – Additional Information ........................................................................................................ 51
Appendix B – Data Tables .......................................................................................................................... 57
FIGURES
Figure 1 - Reactor construction start year versus duration showing historic themes – a) United
States, b) Russia, c) S. Korea, d) China ...................................................................................... 19
Figure 2 - Reactor construction start year versus duration in fourteen countries ....................................... 56
TABLES
Table 1 - Major Export Countries and Potential Importers ........................................................................... 9
Table 2 - Listing of countries with involvement in nuclear energy with hyperlinks to country
profiles ........................................................................................................................................ 12
Table 3 - WNA list of countries expressing some level of interest developing nuclear power
programs ..................................................................................................................................... 13
Table 4 - WNA list of newcomer countries by level of progress in developing nuclear power
programs ..................................................................................................................................... 13
Table 5 - Primary Export Companies and the Markets They Serve ........................................................... 16
Table 6 - Countries with smaller long-established nuclear programs and plans for expansion .................. 20
Table 7 - Market shares of new LWR/PHWR reactor construction by vendor .......................................... 26
Table 8 - Supplier countries and reactor vendors for current and likely construction projects .................. 27
Table 9 – Information on current global conversion facilities .................................................................... 33
Table 10 – Information on current major global enrichment facilities (IAEA) .......................................... 35
Table 11 - Information on current global reprocessing facilities ................................................................ 37
Table 12 - Categorization of status of new reactor projects ........................................................................ 52

ix

1
GLOBAL NUCLEAR MARKETS
MARKET ARRANGEMENTS AND SERVICE
AGREEMENTS
1. INTRODUCTION
The purpose of the Global Nuclear Markets project is to provide an assessment of the status and trends in
global nuclear power markets. This report documents the findings of the first phase of the Global Nuclear
Markets project, along with a description of the work performed.
The nuclear power markets addressed in this report include the design/construction of reactors, and the
nuclear fuel cycle services of conversion, enrichment, fuel fabrication, used fuel storage and reprocessing.
A brief description of the nuclear fuel cycle is included as Appendix A-1. These markets are the focus of
this report because they constitute the majority of sales and also influence business relationships in
additional nuclear markets.
A number of additional markets are not covered, including component manufacturing and a wide range of
services such as personnel training, reactor refueling, and regulatory advisory and legal services. These
markets can include substantial sales, especially for components and refueling maintenance. However,
business relationships in these areas are less likely to be tied to business in other nuclear markets.
1.1 Background Civilian nuclear power was originally developed after World War II as a peaceful use of nuclear fission
[1]. A wide range of reactor designs were researched, including those already developed for military
purposes, with four basic designs becoming widely deployed for electricity generation. These included
graphite moderated Gas Cooled Reactors (GCRs), primarily deployed in the United Kingdom (UK) and
France, Pressurized Heavy Water Reactors (PHWRs), primarily deployed by Canada and India, Light
Water Graphite Reactors (LWGRs) deployed by the Soviet Union, and Light Water Reactors (LWRs),
initially deployed by the United States (U.S.) and the Soviet Union and later adopted by others. Of these,
the LWRs were the most successful and account for over 90% of the power reactors in the world. Two
primary designs of LWRs have been deployed throughout the world, the boiling water (BWR) and
pressurized water (PWR). Of all the reactor types, the PWRs, BWRs, and PHWRs are actively being
built today. There are also a very limited number of prototypes/demonstrations of other designs in
operation or under construction, including sodium-cooled fast reactors (SFRs) and high temperature
versions of gas cooled reactors.
The original “Generation I” power reactors were small prototypes, with those completed prior to 1960
under 100 MWe. Larger “Generation II” reactors were widely deployed starting in the 1970s, and are the
majority of reactors operating worldwide today. Evolutionary improvements in economics, safety and
other areas resulted in “Generation III” and Generation III+” advanced LWRs deployed in the 1990s
through today, with most over 1,000 MWe in size and the largest being 1,700 MWe. Research is now
focused on “Generation IV” reactors [2] that move beyond LWR technologies and “Small Modular
Reactors” (SMRs). The SMRs are a reversal to the trend of large reactor designs. The SMR design
approach is to improve economics by using factory fabrication methods and simplified designs and
employ a scalability feature where each reactor being under 300 MWe. The SMRs include a mix of
LWRs and Generation IV advanced reactor types, with the LWR-based designs closer to deployment.
Like reactors, the initial fuel facilities for the nuclear industry were originally developed for military
purposes. As the industry grew and technologies advanced, these were mostly replaced by newer civilian
facilities. The functions of conversion and enrichment are fungible and the markets have evolved to

2
include only a few large facilities world-wide. In contrast, fuel is a highly engineered and custom
fabricated product [3]. Each major reactor vendor initially had their own fuel design and developed
associated fuel fabrication facilities. The most popular designs were the square lattice Westinghouse,
Babcock & Wilcox, and Combustion Engineering PWR assemblies, the hexagonal Russian VVER PWR
assembly, the General Electric square lattice BWR modules, the UK circular array GCR fuel assembly,
the Russian RBMK circular array LWGR bundles, and the CANDU circular array PHWR bundles. The
enrichment of the fuel pellets within each assembly is customized based on the operating cycle of the
individual reactor (typically 12 or 18 months), number of batches in the core, and desired fuel burn-up.
Higher burn-up in LWRs is desirable to limit the frequency of refueling. Consolidation of fuel fabricators
has been occurring and competition for fabrication in reload fuel for most LWRs had developed. The
exception had been VVER fuels, where the Russian state company (Rosatom) had maintained a
monopoly well after the dissolution of the Soviet Union, but is now also seeing competition.
On the back end of the fuel cycle, the majority of fuel is stored on-site at the reactors pending future
disposal or possibly future reprocessing. Fuel reprocessing facilities are currently only operating in
France, Russia and the UK, and few countries currently use reprocessing services. This is primarily
because there is little demand for plutonium, which is the primary reprocessing product. Plutonium can
be used in mixed oxide U/Pu fuel in some LWRs, but the fuel is 3 to 4 times more expensive to fabricate
and only reduces uranium mining and enrichment by ~15%.a
1.2 Approach This work was conducted by first collecting lists of nuclear facilities and service providers, and
performing an extensive literature search to validate and update these lists and to identify agreements
between countries and companies on these lists. Chronological information was developed to assist in the
identification of market trends. Analysis was then performed to assess overall market conditions and
develop insights on developments with the major players.
The primary sources for identifying global facilities and service providers were the International Atomic
Energy Agency (IAEA) and the World Nuclear Association (WNA) , including the IAEA’s Power
Reactor Information System (PRIS) [4], Country Nuclear Power Profiles (CNNP) [5], and the WNA’s
Information Library Country Profiles [6]. Readers not familiar with the nuclear programs of specific
countries are encouraged to access the IAEA and WNA country profiles, as they contain helpful
information on both the history and current status of the programs and provide links into more detailed
information. Table 2 in Chapter 3 provides access to these profiles through hyperlinks. Additional
information was located on the web sites of the Organization for Economic Cooperation and
Development (OECD) – Nuclear Energy Agency (NEA) and the U.S. Energy Information Agency (EIA).
Collectively, there is a large amount of information accessible through these sources, including numerous
databases and report libraries.
The above sources were used to develop lists of facilities and suppliers that were then cross-verified,
augmented, and in some cases brought up to date through web searches. Suppliers were generally
identified by the parent company, with the primary focus to identify the home country of the parent and
capture additional information found. Information on owners and relationships between parent
companies and subsidiaries was captured throughout the effort, but is by no means considered to be
a This may change if fast reactors move from their current prototype status to wider deployment, since they are theoretically able
to continuously recycle plutonium and reduce uranium needs by ~99%. The promise of this “closed” fuel cycle is the main
driver behind maintaining the limited reprocessing and mixed oxide fuel fabrication occurring today.
3
complete as many of these companies have dozens of subsidiaries, subsidiaries of subsidiaries, etc. and
many are also under shared ownership.
Information on agreements and relationships were also developed from news articles, where the primary
source was the Nuclear Energy Institute’s (NEI) NEI SmartBrief, a daily summary of news items for the
nuclear industry. The NEI SmartBrief archives [7] were accessed and searchable files of the briefs
developed for the last seven years. This allows for text searches on agreements, by country, by company,
etc. to find one paragraph summaries of news events with hyperlinks to the originating articles on the
web. While many of the articles are no longer accessible, others can be accessed - especially World
Nuclear News and Reuters, which cover a good percentage of the international news items. This
information source is expected to be quite valuable for researching and addressing new questions that
EPSA may have relative to market trends.
Some additional consistency-checking was performed by reviewing presentations from international
meetings attended by the Principal Investigator (PI) over the last few years.
A number of data challenges were noted during information collection, as described here and more fully
in Appendix A-1. First, different information sources reported status differently, including whether a
project was in planning or cancelled, when construction starts or ends, and how to address pauses in
construction or operations. For example, Table 4 in Section 4.1.3 is how one source listed planning
status. Tracing of subsidiaries back to their parent companies required additional steps. Differing
spelling of foreign company and facility names and reuse of site names for new projects were also
challenges.
A OneNote project file was developed to contain the information gathered and the information was also
summarized in a spreadsheet of suppliers, reactors and fuel cycle facilities that includes numerous
hyperlinks to web sites with more detailed information on facilities and events. This spreadsheet is
sortable and includes proposed, planned, under construction, and closed facilities along with location,
ownership, and other information useful for this effort.
The gathered data and information was then consulted as needed to support the assessments in the body of
this report. While this included development of summary tables and graphs, as well as analyses of
capacities, the data and information was primarily used to look for patterns and form opinions about
market trends.
4
2. THE GLOBAL NUCLEAR LANDSCAPE
Globally, there are currently 445 nuclear reactors with a combined 387 gigawatt (GWe) capacity
operating in 30 countries and 64 reactors under construction in 15 countries. In 2015, 10 new reactors
came online and 8 were permanently shut down, which along with uprates resulted in a net capacity
increase of 4.5 GWe [8]. The OECD International Energy Agency 2015 Global Energy Outlook Report
projects that nuclear power will have to double by 2050 for the world to meet the international climate
change goals and the energy needs of an expanding global population, which is expected to grow to 10
billion by 2050. Many countries continue to express interest in developing or expanding their nuclear
programs, although low oil and gas prices could make it harder for governments to favor policies that
encourage the use of nuclear energy and other clean energy sources.
Some recent developments have marked the significance of global nuclear power. The most recent was
the 2015 Paris Climate Conference, which recognized the importance of nuclear energy to meet global
carbon reduction goals. The International Atomic Energy Agency’s Convention for Supplementary
Compensation for Nuclear Damage (CSC) nuclear liability regime entered into force on April 15, 2015.
China kept its place as the fastest growing market for nuclear energy. Eight reactors came online in 2015,
bringing China’s total to 30 operating reactors; China also announced plans to export its reactor
technology.
Nuclear markets continue to shift, with recent movement toward East Asia, the Middle East, South
America, Africa, and Eastern and Central Europe. This has important implications for the global nuclear
landscape after 2030. The U.S. Government estimates that the global civil nuclear market focused on
reactor sales to be valued to be between $500 and $740 billion over the next 10 years [9].
The potential sales in the coming years are significant, especially for the two sectors of the nuclear market
primarily addressed in this report, reactor builds and fuel services. The report provides a snapshot of the
status of the global new builds, discusses new reactor technologies that will enter the market in the near-
term, and the status of more advanced reactor designs being developed in the long-termer. In the fuel
services the report focuses on supply and demand for conversion, enrichment, fuel fabrication and
reprocessing.
An excellent but somewhat dated resource for detailed information about nuclear markets is a 2008 report
by the Nuclear Energy Agency [10]. A number of companies also sell detailed market analysis reports.
2.1 Reactors
The largest sector within nuclear market is the design and construction of reactors. Roughly 85% of the
cost of nuclear electricity is reactor cost, and much of that cost is the capital cost of the reactors
themselvesb. Due to the complexity of reactors and the evolution of the supplier market over the course
of the last 20-30 years, these costs are spread across multiple vendors of reactor components, from the
heavy forging of reactor vessel heads to steam generations, coolant pumps, valves, etc. A recent trend has
been for newcomer countries to require localization of some portion of the manufacturing capability
domestically as part of the tender and contract requirement.
A common long-term trend within the reactor market is for many larger programs to initially buy a design
from a foreign vendor, then as more units are constructed and the local content of sourced components
b The U.S. Energy Information Agency estimates reactor capital costs contribute 74%, reactor operations and maintenance costs
12%, fuel costs 13% and transmission investments 1% to the total levelized cost of nuclear electricity.-
https://www.eia.gov/forecasts/aeo/electricity_generation.cfm
5
increases, there is an effort to develop a domestic design. France and India are past examples of this
pattern, while China and South Korea are more current examples. France built their PWR reactor fleet in
three design classes, sized at ~900 MWe, 1300 MWe and 1,450 MWe. The first two design classes (54
reactors) were based on a Westinghouse design, while the third (4 reactors) was domestically derived.
France is now exporting the EPR-1750, which is based on the previous designs. Westinghouse also
exported to South Korea. France exported the 900 MWe design to China. Both South Korea and China
now have their own domestic designs, which are being exported to the United Arab Emirates and
Pakistan, respectively, all based on Westinghouse ancestry. Canada exported PHWR technology to India
prior to the 1974 Indian nuclear weapons test that halted trade. India then developed a domestic PHWR
design that is the basis of most of its current reactor fleet.
This history demonstrates a transfer of nuclear reactor designs from the countries that initiated nuclear
energy to the countries that are actively building reactors today. Countries actively building larger fleets
of reactors have the most to gain though innovation of advanced designs. They also have the best ability
to recover design costs through ongoing construction and future exports of that reactor technology.
Innovative advances occur in many areas, including more efficient construction and safer and more
efficient operations, providing more opportunity to accelerate technological innovation. On the other
hand, previous leaders who have seen their domestic programs stagnate have also experienced difficulties
with deploying their latest designs and may lose technological leadership if they are not able to maintain
the level of sales necessary to recover design costs.
Another observation from the research is that countries operating small fleets of older PHWRs tend to
switch to LWRs when additional capacity is developed. Argentina and Pakistan are examples where both
are currently constructing LWRs while Romania is a counterexample where all currently planned reactors
are PHWRsc. Of the countries with larger PHWR fleets, India is continuing to build PHWRs, but is now
also developing LWR projectsd while Canada is concentrating on refurbishment of existing PHWRs [11].
The UK appears to be following this pattern too, with replacement of its current fleet of GCRs with new
LWRs in the works. GCRs are similar to PHWRs in fuel enrichment requirements and discharge rates.
Research and development of advanced designs continues, with new prototype or demonstration fast
reactors recently completed in Russia (BN-800, 880 MWe), China (CEFR, 20 MWe) and India
(Kalpakkam-1, 500 MWe, to be commissioned later this year), and a prototype high temperature gas
reactor under construction in China (Shidao Bay-1, 210 MWe). However, Japan’s prototype fast reactor
(Monju, 246 MWe) is still shut down after a 2010 fuel handling accident until a government committee
decides on a new operator for the reactor’s management and oversight [12]. France shut down its Phenix
prototype fast reactor in 2010, but is programming the construction of the Advanced Sodium
Technological Reactor for Industrial Demonstration (ASTRID) by the end of the 2020s. (The U.S. shut
down its last research fast reactor in 1994.)
Research and development of small modular reactors (SMRs) is also proceeding, but is not as far along,
and current projects are for domestic prototypes or demonstration units. These include the CAREM
prototype in Argentina and the floating reactors in Russia that are under construction, as well as
demonstration units planned in several countries [13], including the U.S. The U.S. efforts include an
early site permit for an SMR at Clinch River recently filed with the NRC, and an agreement signed
c Romania is also planning to host the Advanced Lead Fast Reactor European Demonstrator (Alfred) being developed under an
EU initiative - http://www.world-nuclear-news.org/NN-Consortium-established-to-build-Alfred-2012134.htm
d India has two small (150 MWe) BWRs that have been operating since 1969, but had problems with fuel supply after their
nuclear test and resulting trade embargos. With the recent lifting of the embargo, they are planning to both continue
construction of their domestic PHWRs and construction of imported designs from several countries.
6
between the Department of Energy and Utah Associated Municipal Power Systems (UAMPS) giving
UAMPS a use permit to locate an SMR at the Idaho National Laboratory site. While SMRs
demonstrations are not as far along as some advanced reactors, the designs based on existing LWR
technologies may be deployed commercially earlier than advanced reactors because less technology
development is required. Other SMRs are modular versions of advanced reactors and will require more
development.
2.2 Fuel Services
The nuclear fuel cycle includes front-end processes of uranium mining and milling, conversion from U3O8
to UF6, enrichment of 235U (skipped for most heavy water reactors), conversion to UO2 and fabrication
into fuel assemblies, and back-end processes of on-site wet cooling storage, either cooled storage (wet or
dry) or reprocessing, and eventually disposal of spent fuel or high level waste.
A large number of uranium mines and mills are currently in operation around the world producing U3O8
“yellowcake,” with the primary global suppliers in 2015 being Kazakhstan (39%), Canada (22%) and
Australia (9%).[14] While some existing mines close and some new mines open every year, projections
are for sufficient supplies through at least mid-century. Due to the large number of suppliers, including
many that otherwise do not have nuclear programs, this area was not assessed in this report.
A small number of large capacity conversion plants are in operation globally, most of which have been in
operation for many decades. The only major new construction in this area is in France, where AREVA is
constructing the Comurhex II facility to replace existing Comurhex I facilities commissioned in 1959 and
1961. Global conversion capacity appears to be sufficient to meet global needs [15].
In the enrichment area a major technical revolution has recently been completed with the final large
gaseous diffusion plants being retired and replaced with centrifuge plants. The much more energy
efficient centrifuge plants have lower operating costs which may reset the global price for Separative
Work Units (SWUs), reducing the cost of producing the low enriched uranium (LEU) used in all LWRs.
Global enrichment capacity appears to be sufficient to meet global demand with the current oversupply
projected to continue [16]. Global demand is expected to rise with the restart of more reactors in Japan
coupled with new construction globally, but new enrichment capacity is also planned, primarily in China.
Spot market prices have declined steadily from a recent high of $160/SWU in 2010 to $60/SWU in early
2016 [17].
Unlike the mining, conversion and enrichment markets which produce a common product, the nuclear
fuel fabrication market is highly specialized and produces customized products for each customer. Most
fabrication is performed by the reactor vendor or a subsidiary, at least for the initial cores and first few
reloads, but the trend is toward a more open market for low enriched uranium (LEU) fuels, with multiple
suppliers developing fuel for the main PWR, BWR and VVER reactor designs. Suppliers of LEU fuels
are also becoming multinational, with facilities in multiple countries.
In contrast to the LEU fuel fabrication market, countries with PHWR reactors have or are developing
their own fuel fabrication facilities to provide some or all of their domestic needs. Since PHWRs do not
requiree enriched uranium, it is easier to develop a domestic fuel cycle. Also, due to low burn-up, the
e Some PHWRs are now using slightly enriched uranium (0.9% to 2% 235U) to increase burnup and reduce spent fuel volumes.
7
PHWR fuel must be replaced annually instead of every 4-5f years, making it more advantageous to have a
local source. The primary exporter of PHWR fuel is Canada, the developer of the CANDU family of
PHWRs. However, Russia is also developing PHWR fuel fabrication capabilities [18].
On the back end, used fuel is stored for initial cooling at the reactor site. Subsequent fuel storage mostly
occurs at the reactor site or at centralized locations within the country that irradiated the fuel, though there
is some limited transfer between countries associated with existing or previous reprocessing
arrangements. These include reprocessing in France and the UK for other western European countries
and Japan, and reprocessing in Russia primarily associated with former Eastern Bloc countries that have
Russian design reactorsg. Russia is experimenting with a new marketing model for fuel services, offering
to take back Russian fabricated fuels after irradiation, including fuel supplied to Iran [19] and likely to
also include fuel for the VVER reactors under construction in Belarus and planned for Turkey.
Geologic disposal of spent fuel from a once-through fuel cycle or high level waste from reprocessing is
the final stage of the fuel cycle. Currently no operating facilities exist, but one was just approved for
construction in Finland in November [20].
2.3 Other Markets
The other market sectors were not assessed as part of this effort. These services include operations and
maintenance support, assistance in setting up the country’s regulatory framework, training of reactor
workers, and other services. Reactor vendors may provide some of these services bundled with the
primary reactor contract in newcomer countries.
Worker training continues throughout the life cycle of the associated facilities, becoming part of
operations. Other areas of operations include assistance with maintenance during refueling outages,
which can involve as many as 1,000 people over a period of several months leading up to and during the
actual outage, which typically will last ~3 weeks.
For example, the terms for the current contract for Turkey’s first reactor, Russia’s state-owned company
Rosatom will provide all of the operations [21]. This is the first trial of Rosatom’s “Build, Own, Operate”
(BOO) business model for securing reactor sales in newcomer countries. Until an actual reactor has been
build using this model it is not clear if the BOO will offer an alternative competitive advantage over the
standard model where the host country purchases the reactor technology, and owns and operates the
reactor. In general, newcomer countries view the establishment of a nuclear power program as an
indicator of improved technical stature and desire the highly skilled and high-paying jobs associated with
nuclear operations.
Assistance may also be provided in waste management, including sales of dry storage casks for spent fuel.
Again, this is an area that was not assessed, though some agreements to provide dry storage casks were
noted. Some suppliers of dry casks include U.S. based Holtec International and AREVA Tennessee
(NUHOMS system).
f LWR reactors are typically refueled every ~18 months, with ~1/3rd of the core changed out at each refueling, so individual fuel
assemblies spend 4-5 years total in the reactor before being changed out.
g Currently this is limited to a portion of the used fuel from Ukraine.
8
3. AGREEMENTS AND RELATIONSHIPS
International trade in reactors and materials in the nuclear fuel cycle involve agreements between
countries to allow for trade, followed by agreements and contracts between vendor and customer
companies. This chapter discusses these agreements in general terms, and then provides information on
reactor vendor/customer pairings and on facilities providing products and services in the fuel cycle.
3.1 Types of Agreements All nuclear trade requires agreements governing how trade will proceed. The nature of nuclear energy
and the potential for its misuse necessitates rigorous controls. Peaceful uses of nuclear power are
governed first by a number of international treaties and conventions, With the Treaty on the Non-
Proliferation of Nuclear Weapons (NPT) [22] as the underpinning treaty for the global nuclear
nonproliferation framework. There are 190 parties to the NPT. The only counties not parties to the NPT
are Israel, India and Pakistan. North Korea was a member but withdrew. Countries that join and adhere to
these treaties and conventions are then able to engage in more specific arrangements with other member
countries.
The Nuclear Suppliers Group (NSG) is part of the nonproliferation framework and was established to
develop and implement the Guidelines for nuclear exports and nuclear-related exports through transfers of
nuclear-related dual-use equipment, materials and technologies [23]. The current participating
governments are: Argentina, Australia, Austria, Belarus, Belgium, Brazil, Bulgaria, Canada, China,
Croatia, Cyprus, Czech Republic, Denmark, Estonia, Finland, France, Germany, Greece, Hungary,
Iceland, Ireland, Italy, Japan, Kazakhstan, Republic Of Korea, Latvia, Lithuania, Luxembourg, Malta,
Mexico, Netherlands, New Zealand, Norway, Poland, Portugal, Romania, Russian Federation, Serbia,
Slovakia, Slovenia, South Africa, Spain, Sweden, Switzerland, Turkey, Ukraine, United Kingdom, and
the United States.
Another component of the nonproliferation framework is the International Atomic Energy Agency’s
Safeguards system to include the Additional Protocol. This system of technical measures provides the
world with assurance that nuclear material is not being diverted for proliferation purposes.
Other multilateral agreements provides multi-country governance and cooperation such as the Euratom
Treaty [24], which created a common nuclear marketplace for members of the European Union, or more
commonly bi-lateral agreements between the provider and user countries.
Another form of agreement is a bilateral agreement specific to two countries. In the U.S. the civilian
nuclear cooperation agreement, commonly called “123 Agreement” is an example where the U.S. Atomic
Energy Act of 1954 requires an agreement be established between the U.S. and another country that
defines the legal framework for significant nuclear cooperation with other countries [25]. As the
relationship advances, other types of cooperation mechanisms such as “Implementing Arrangements”
may be established. For example, in 2014 the United States and Vietnam entered into a 123 Agreement,
an Implementing Arrangement was signed in May 2016 to further build on their cooperation in the civil
nuclear field. This enhanced cooperation includes collaboration in the following areas build institutional
connections enhance and promote public and private training and education, assist with the establishment
of an effective regulator, strengthen security, and advance bilateral nuclear trade.
The establishment of these formal government to government agreements on nuclear cooperation provide
the environment and legal foundation for individual companies to cultivate relationships in these other
countries that can lead to more agreements and contracts with the foreign government or foreign
companies, and ultimately for trade to commence.
Before the establishment of nuclear cooperation agreements such as a 123 Agreement in the U.S. and
similar types of agreements with other countries, there is typically significant government to government
engagement. To begin engagement, less formal mechanisms such as Memorandums of Understanding
(MOUs) are established. As cooperation between the two countries deepens, other cooperation

9
mechanisms in areas of mutual benefit are established. These types of agreements often expand the
relationships. The same pattern is followed at the company level once countries have established
relations [26].
The number and type of nuclear cooperation vary in types and level of engagement. Table 1 provides a
listing by exporting countries engagement with countries interested in nuclear energy development.
Table 1 - Major Export Countries and Potential Importers
Exporter/Potential Exporter Cooperator
Canada Germany, Jordan, Mongolia
China Algeria, Australia, Bangladesh, Egypt, Ghana, Italy, Jordan, Kazakhstan, Kenya, Mongolia, Morocco, Namibia, Niger, Nigeria, Oman, Philippines, Saudi Arabia, Senegal, Sudan, Uzbekistan
France Algeria, Argentina, Australia, Euratom Countries, Brazil, Canada, Chile, Gabon, India, Japan, Jordan, Kazakhstan, Kuwait, Mexico, Mongolia, Morocco, Namibia, Niger, Saudi Arabia, South Africa, South Korea, Turkey, United States
Japan Australia, Kazakhstan, Lithuania, Mongolia, Oman, Thailand, Turkey, Uzbekistan, Vietnam
South Korea Australia, Bangladesh, Egypt, Finland, France, Jordan, Kazakhstan, Kenya, Malaysia, Niger, Saudi Arabia, Turkey, Ukraine, United Arab Emirates, Uzbekistan
Russia Algeria, Bahrain, Bangladesh, Belarus, Bolivia, Egypt, Indonesia, Italy, Jordan, Kazakhstan, Laos, Mongolia, Morocco, Myanmar (Burma), Namibia, Nigeria, Poland, Saudi Arabia, Senegal, Syria, Turkey, United Arab Emirates, Uzbekistan, Venezuela, Vietnam
United States Argentina, Brazil, Canada, Euratom Countries, India, Indonesia, Kazakhstan, Kenya, Mexico, Mongolia, Morocco, Oman, Saudi Arabia, South Korea, South Africa, Taiwan, United Arab Emirates, Uzbekistan, Vietnam
3.2 Current Relationships
One objective of this market analysis activity was to identify the current user/provider relationships.
However, a reliable means to systematically identify specific arrangements for fuel services was not
identified. The information that is provided is based on news articles and information on supplier web
sites. This information has significant shortcomings for several reasons:
Supplier web sites generally provide only the magnitude of their market share and summaries of
the number of companies and countries they support.
Many suppliers are vertically integrated such that they are their own customers for some of the
front-end functions, but not exclusively. Some joint ventures also exist where suppliers share
facilities.
Most fuel arrangements are via long-term contracts which include terms that are not typically
disclosed. While spot market prices can indicate general price trends, they do not equate directly
to longer-term contract terms. Press release archives on company web sites were found to only
go back a year or less.
Many news articles were for agreements to collaborate on fuel or provide fuel in the future, with
few firm dates. Quantities were typically not disclosed, so even though facility capacities were
identified, it was not possible to match capacity to individual contracts. The news articles about
10
supplying “nuclear fuel” were often not clear about whether fuel assemblies, fuel pellets or just
uranium was being supplied.
The best information on fuel arrangements in news reports was found to be associated with new reactor
construction, where the news story will usually indicate if fuel is to be provided by the vendor and for
how long. The following information for the four South Korean new builds in the UAE was the most
detailed and also unusual in the use of multiple vendors for each step [27]:
“Enech has now awarded six contracts related to the supply of natural uranium concentrates,
conversion and enrichment services, and the purchase of enriched uranium product. The company
estimates the contracts are worth some $3 billion . . . over a 15-year period starting in 2017 . . .
Under the contracts, both France's AREVA and Russia's Techsnabexport (Tenex) have been
contracted to provide services across the front-end of the fuel cycle, including the supply of uranium
concentrates, as well as conversion and enrichment services. Meanwhile, Canada-based Uranium One
and UK-based Rio Tinto will also supply natural uranium, the USA's Converdyn will provide
conversion services and UK-headquartered Urenco will provide enrichment services. The enriched
uranium will be supplied to Kepco Nuclear Fuels - part of Enec's prime contractor consortium, led by
Korea Electric Power Corporation (KEPCO) - which will manufacture the fuel assemblies for use in
the Barakah plant.”
h Emirates Nuclear Energy Corporation
11
4. THE PLAYERS
This chapter describes the major operators in nuclear markets. In general there are a small number of
suppliers compared to the number of users. The exception to this is the mined uranium market, where
there are a larger number of suppliers.
The suppliers are discussed both by country and by the major companies. Some of the major companies
are multi-nationals while others are basically extensions of their governments. At the company level, the
focus is on the primary or “parent” company. There are a relatively small number of parent companies
that cover the primary suppliers but most have multiple subsidiaries. Some subsidiaries companies only
exist for a single project or product while others are the local in-country extension of the parent
corporation.
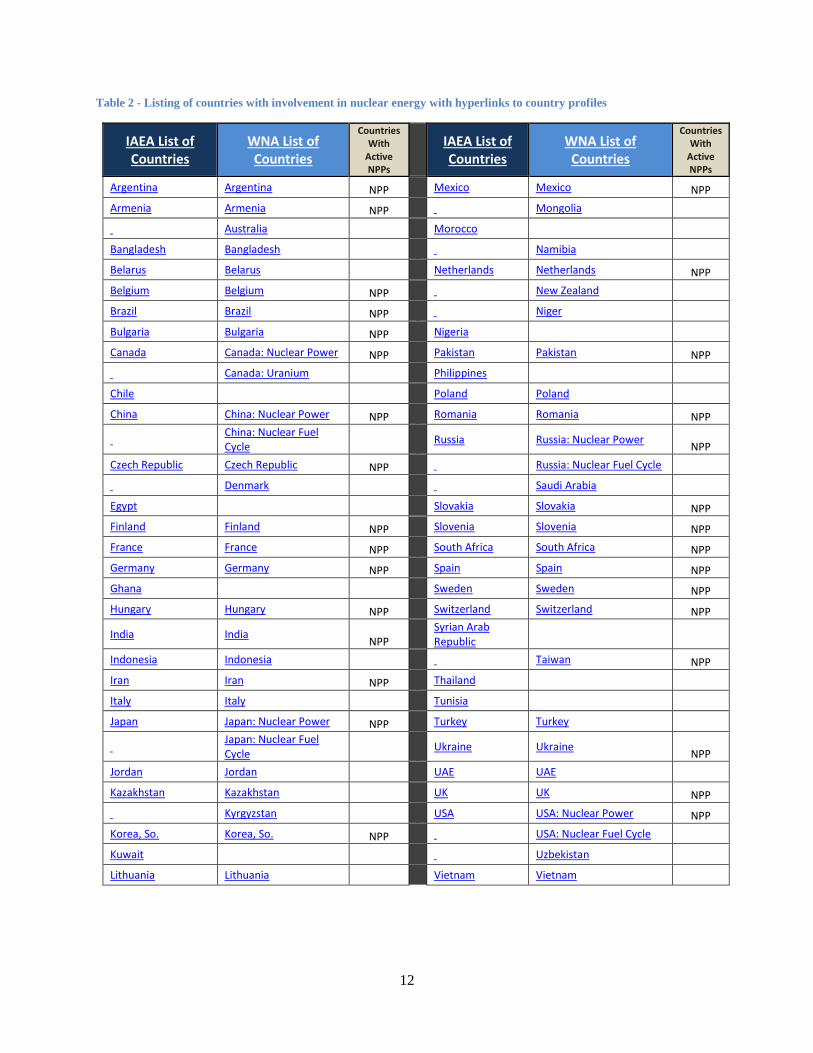
4.1 The Countries Table 2 provides a list of countries with some level of involvement with nuclear energy, and also
indicates which ones have existing nuclear power plants (NPPs). Countries that do not have NPPs may
be listed because they plan to build NPPs soon or because they have current involvement with other parts
of the nuclear fuel cycle (e.g. mining). Note that each entry is a hyperlink to the country profile on either
the IAEA or WNA web sites. The primary reason for including the table in this report is to provide these
country profile hyperlinks, as the profiles can be extensive and are significant sources of information.
The lists do not match because the two organizations use different criteria to decide when to include
countries that do not have NPPs. For political reasons, IAEA includes Taiwan with China.
4.1.1 Suppliers
Seven countries are current providers of reactors for export; Canada, China, France, (Japan/U.S.), Russia,
and South Korea. The U.S. is listed together with Japan as the current exports are from U.S. vendors that
are either owned by or in business partnerships with Japanese companies. Westinghouse Electric
Company is a subsidiary of Toshiba Corporation and GE Hitachi Nuclear Energy is an alliance between
General Electric and Hitachi, with the Japanese company called Hitachi-GE Nuclear Energy, Ltd.
Some reactor provider countries are also the primary suppliers of fuel cycle services for export. Some
facilities that process materials or fabricate fuels for export are also located in other countries, including
Belgium, Germany, Kazakhstan, The Netherlands, Spain, Sweden, and the UK. In addition, many
countries with smaller programs have domestic facilities for one or more components of their fuel cycle.
There are also a number of pilot or demonstration labs/facilities in countries with smaller programs and in
newcomer countries. Lists of non-reactor fuel cycle facilities are provided by function later in this report.
Note that uranium mining/milling is not included in the above discussion and involves several more
countries globally. Of the uranium providers without nuclear programs, Kazakhstan is unique in using its
market clout as leverage to get a foothold in other areas such as hosting a fuel fabrication facility. The
other main uranium supplier without reactors is Australia.
4.1.2 Users
All countries with existing nuclear energy programs and nuclear power plants (NPPs) are users of nuclear
services, whether domestic or foreign. While smaller countries take pride in their ability to host some
parts of their fuel cycles domestically, with few exceptions they rely on others for enrichment and reactor
designs.
12
Table 2 - Listing of countries with involvement in nuclear energy with hyperlinks to country profiles
IAEA List of Countries
WNA List of Countries
Countries With
Active NPPs
IAEA List of Countries
WNA List of Countries
Countries With
Active NPPs
Argentina Argentina NPP Mexico Mexico NPP
Armenia Armenia NPP Mongolia
Australia Morocco
Bangladesh Bangladesh Namibia
Belarus Belarus Netherlands Netherlands NPP
Belgium Belgium NPP New Zealand
Brazil Brazil NPP Niger
Bulgaria Bulgaria NPP Nigeria
Canada Canada: Nuclear Power NPP Pakistan Pakistan NPP
Canada: Uranium Philippines
Chile Poland Poland
China China: Nuclear Power NPP Romania Romania NPP
China: Nuclear Fuel Cycle
Russia Russia: Nuclear Power
NPP
Czech Republic Czech Republic NPP Russia: Nuclear Fuel Cycle
Denmark Saudi Arabia
Egypt Slovakia Slovakia NPP
Finland Finland NPP Slovenia Slovenia NPP
France France NPP South Africa South Africa NPP
Germany Germany NPP Spain Spain NPP
Ghana Sweden Sweden NPP
Hungary Hungary NPP Switzerland Switzerland NPP
India India
NPP Syrian Arab Republic
Indonesia Indonesia Taiwan NPP
Iran Iran NPP Thailand
Italy Italy Tunisia
Japan Japan: Nuclear Power NPP Turkey Turkey
Japan: Nuclear Fuel Cycle
Ukraine Ukraine
NPP
Jordan Jordan UAE UAE
Kazakhstan Kazakhstan
UK UK NPP
Kyrgyzstan USA USA: Nuclear Power NPP
Korea, So. Korea, So. NPP USA: Nuclear Fuel Cycle
Kuwait Uzbekistan
Lithuania Lithuania Vietnam Vietnam
13
4.1.3 Newcomers
Both the IAEA and WNA have developed information on countries showing interest in developing
nuclear energy programs. The most recent IAEA report on status of nuclear energy [28] indicates that 34
countriesi currently without nuclear energy are either “considering, planning, or starting nuclear power
programmes”. Of these, 2 had started construction, another 13 either had made a decision or were
actively preparing for a decision to proceed, and 19 were in earlier stages of consideration.
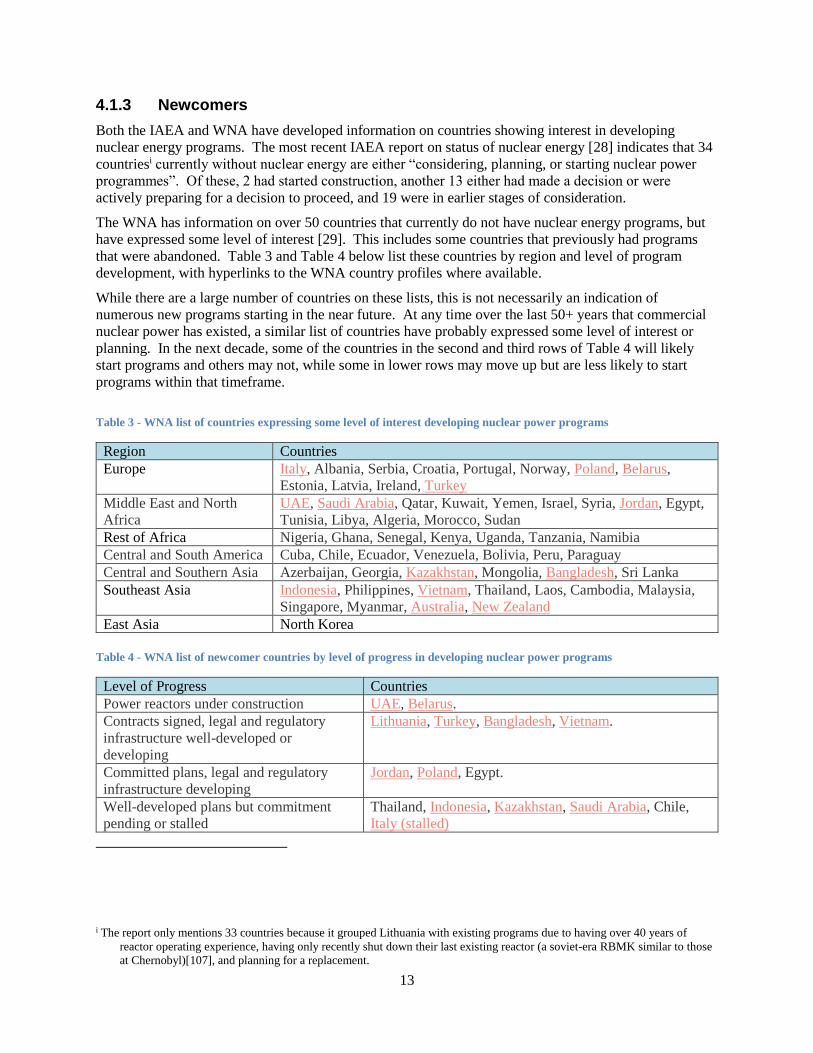
The WNA has information on over 50 countries that currently do not have nuclear energy programs, but
have expressed some level of interest [29]. This includes some countries that previously had programs
that were abandoned. Table 3 and Table 4 below list these countries by region and level of program
development, with hyperlinks to the WNA country profiles where available.
While there are a large number of countries on these lists, this is not necessarily an indication of
numerous new programs starting in the near future. At any time over the last 50+ years that commercial
nuclear power has existed, a similar list of countries have probably expressed some level of interest or
planning. In the next decade, some of the countries in the second and third rows of Table 4 will likely
start programs and others may not, while some in lower rows may move up but are less likely to start
programs within that timeframe.
Table 3 - WNA list of countries expressing some level of interest developing nuclear power programs
Region Countries
Europe Italy, Albania, Serbia, Croatia, Portugal, Norway, Poland, Belarus,
Estonia, Latvia, Ireland, Turkey
Middle East and North
Africa
UAE, Saudi Arabia, Qatar, Kuwait, Yemen, Israel, Syria, Jordan, Egypt,
Tunisia, Libya, Algeria, Morocco, Sudan
Rest of Africa Nigeria, Ghana, Senegal, Kenya, Uganda, Tanzania, Namibia
Central and South America Cuba, Chile, Ecuador, Venezuela, Bolivia, Peru, Paraguay
Central and Southern Asia Azerbaijan, Georgia, Kazakhstan, Mongolia, Bangladesh, Sri Lanka
Southeast Asia Indonesia, Philippines, Vietnam, Thailand, Laos, Cambodia, Malaysia,
Singapore, Myanmar, Australia, New Zealand
East Asia North Korea
Table 4 - WNA list of newcomer countries by level of progress in developing nuclear power programs
Level of Progress Countries
Power reactors under construction UAE, Belarus.
Contracts signed, legal and regulatory
infrastructure well-developed or
developing
Lithuania, Turkey, Bangladesh, Vietnam.
Committed plans, legal and regulatory
infrastructure developing
Jordan, Poland, Egypt.
Well-developed plans but commitment
pending or stalled
Thailand, Indonesia, Kazakhstan, Saudi Arabia, Chile,
Italy (stalled)
i The report only mentions 33 countries because it grouped Lithuania with existing programs due to having over 40 years of
reactor operating experience, having only recently shut down their last existing reactor (a soviet-era RBMK similar to those
at Chernobyl)[107], and planning for a replacement.
14
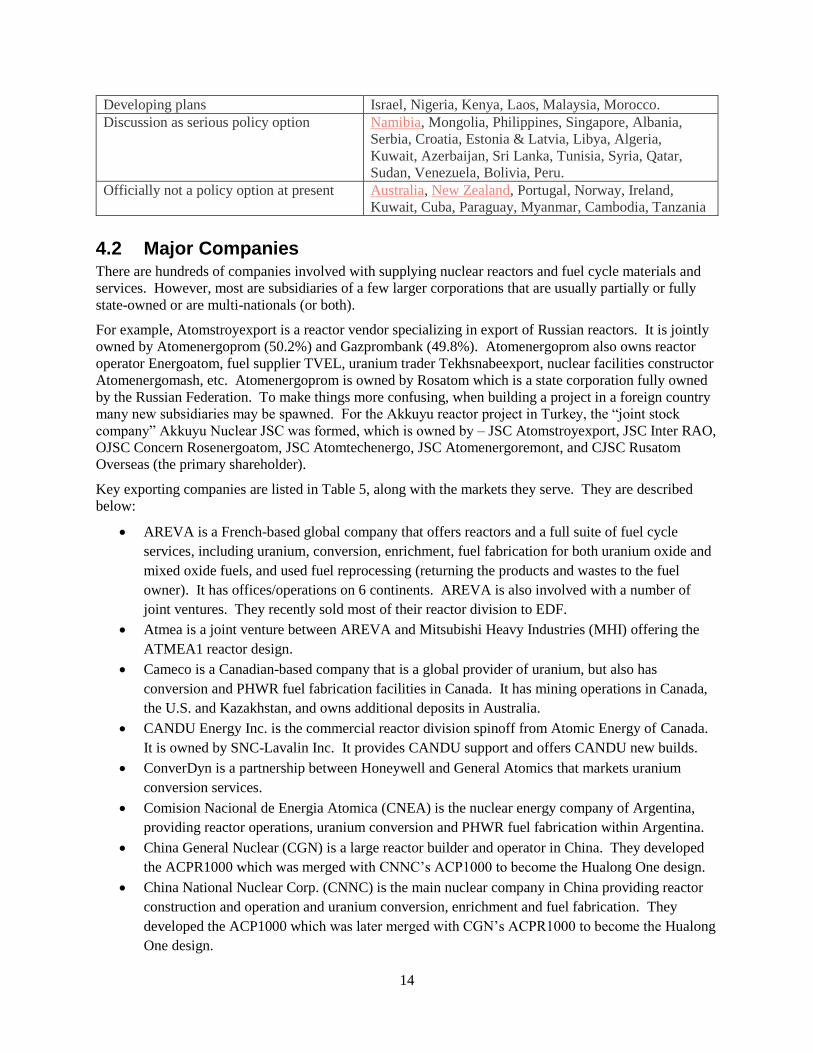
Developing plans Israel, Nigeria, Kenya, Laos, Malaysia, Morocco.
Discussion as serious policy option Namibia, Mongolia, Philippines, Singapore, Albania,
Serbia, Croatia, Estonia & Latvia, Libya, Algeria,
Kuwait, Azerbaijan, Sri Lanka, Tunisia, Syria, Qatar,
Sudan, Venezuela, Bolivia, Peru.
Officially not a policy option at present Australia, New Zealand, Portugal, Norway, Ireland,
Kuwait, Cuba, Paraguay, Myanmar, Cambodia, Tanzania
4.2 Major Companies There are hundreds of companies involved with supplying nuclear reactors and fuel cycle materials and
services. However, most are subsidiaries of a few larger corporations that are usually partially or fully
state-owned or are multi-nationals (or both).
For example, Atomstroyexport is a reactor vendor specializing in export of Russian reactors. It is jointly
owned by Atomenergoprom (50.2%) and Gazprombank (49.8%). Atomenergoprom also owns reactor
operator Energoatom, fuel supplier TVEL, uranium trader Tekhsnabeexport, nuclear facilities constructor
Atomenergomash, etc. Atomenergoprom is owned by Rosatom which is a state corporation fully owned
by the Russian Federation. To make things more confusing, when building a project in a foreign country
many new subsidiaries may be spawned. For the Akkuyu reactor project in Turkey, the “joint stock
company” Akkuyu Nuclear JSC was formed, which is owned by – JSC Atomstroyexport, JSC Inter RAO,
OJSC Concern Rosenergoatom, JSC Atomtechenergo, JSC Atomenergoremont, and CJSC Rusatom
Overseas (the primary shareholder).
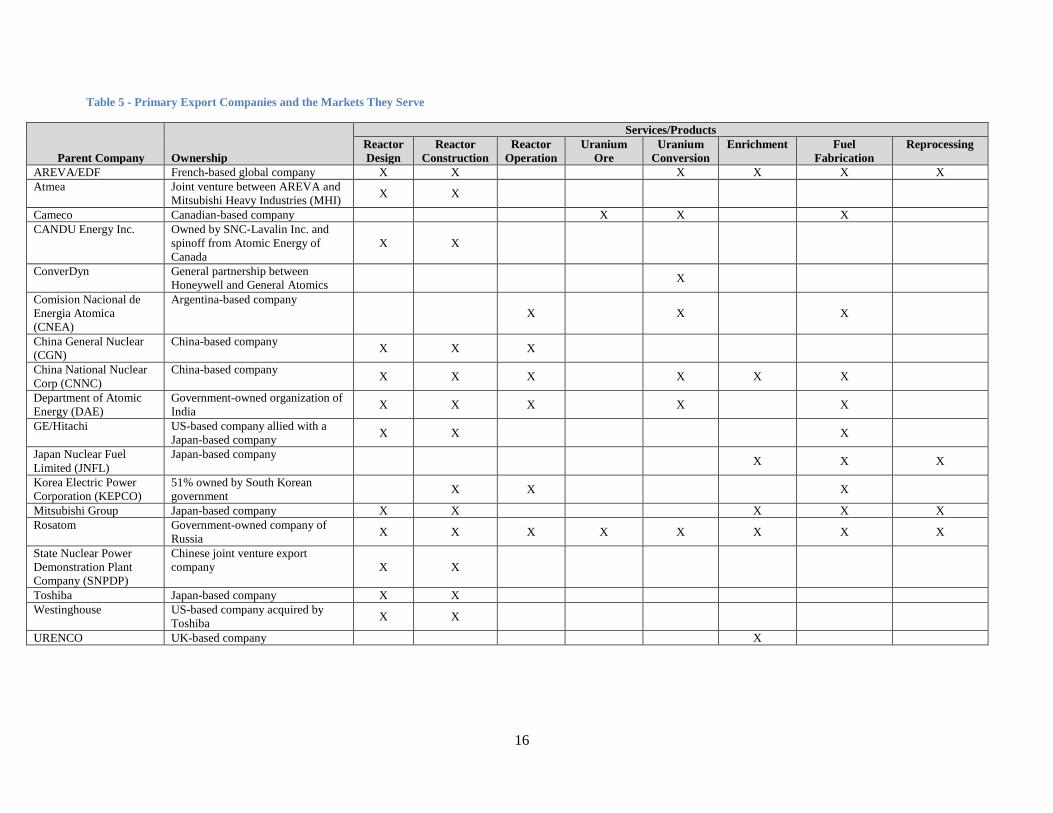
Key exporting companies are listed in Table 5, along with the markets they serve. They are described
below:
AREVA is a French-based global company that offers reactors and a full suite of fuel cycle
services, including uranium, conversion, enrichment, fuel fabrication for both uranium oxide and
mixed oxide fuels, and used fuel reprocessing (returning the products and wastes to the fuel
owner). It has offices/operations on 6 continents. AREVA is also involved with a number of
joint ventures. They recently sold most of their reactor division to EDF.
Atmea is a joint venture between AREVA and Mitsubishi Heavy Industries (MHI) offering the
ATMEA1 reactor design.
Cameco is a Canadian-based company that is a global provider of uranium, but also has
conversion and PHWR fuel fabrication facilities in Canada. It has mining operations in Canada,
the U.S. and Kazakhstan, and owns additional deposits in Australia.
CANDU Energy Inc. is the commercial reactor division spinoff from Atomic Energy of Canada.
It is owned by SNC-Lavalin Inc. It provides CANDU support and offers CANDU new builds.
ConverDyn is a partnership between Honeywell and General Atomics that markets uranium
conversion services.
Comision Nacional de Energia Atomica (CNEA) is the nuclear energy company of Argentina,
providing reactor operations, uranium conversion and PHWR fuel fabrication within Argentina.
China General Nuclear (CGN) is a large reactor builder and operator in China. They developed
the ACPR1000 which was merged with CNNC’s ACP1000 to become the Hualong One design.
China National Nuclear Corp. (CNNC) is the main nuclear company in China providing reactor
construction and operation and uranium conversion, enrichment and fuel fabrication. They
developed the ACP1000 which was later merged with CGN’s ACPR1000 to become the Hualong
One design.
15
Department of Atomic Energy (DAE) is the government organization in charge of India’s
commercial nuclear facilities. Activities include design, construction and operation of PHWRs,
heavy water enrichment, uranium conversion, and fuel fabrication within India.
GE/Hitachi Nuclear Energy is US company formed in an alliance between General Electric and
Hitachi, with the Japanese company called Hitachi-GE Nuclear Energy, Ltd. GE/Hitachi designs
and provides reactors and also owns or jointly owns fuel fabrication facilities.
Japan Nuclear Fuel Limited (JNFL) provides uranium enrichment, owns the Rokkasho
reprocessing plant, and plans to build a MOX fuel fabrication facility. JNFL is a private company
with most of its shares owned by ten Japanese power companies.
Korea Electric Power Corporation (KEPCO) is the main electrical utility in South Korea and is
51% owned by the government. KEPCO constructs, operates, and supplies fuel for the domestic
fleet of reactors and is now starting to export.
Mitsubishi Group provides reactor design, construction, and fuel cycle services, primarily through
MHI, Mitsubishi Nuclear Energy Systems (MNES) and Mitsubishi Nuclear Fuel Co., Ltd (MNF).
They also supply major components, [30] primarily in Japan but also for export. MHI is also in a
joint venture with AREVA called Atmea.
Rosatom is the government-owned parent company of all Russian nuclear energy enterprises. It
provides reactor design, construction, operations, and a full suite of fuel cycle services, including
uranium, conversion, enrichment, fuel fabrication for both uranium oxide and mixed oxide fuels,
and used fuel reprocessing (keeping the products and wastes).
State Nuclear Power Demonstration Plant Company (SNPDP) is a joint venture (55/45) of State
Power Investment Corporation and China Huaneng Group set up to export the CAP1400 reactor.
Toshiba is a major supplier of reactors and reactor fuels, both its own design and of
Westinghouse Electric Company, which it purchased in 2006.
Westinghouse Electric Company is the designer of the AP1000. It is a U.S. subsidiary of
Toshiba.
URENCO is a major supplier of uranium enrichment services, with facilities in The U.S., UK,
Netherlands, and Germany.
In addition to the above list, there are several smaller companies and several government owned facilities
that supply fuel materials or services, primarily for domestic use in their respective countries. There are
also a number of companies developing advanced reactors and small modular reactors.
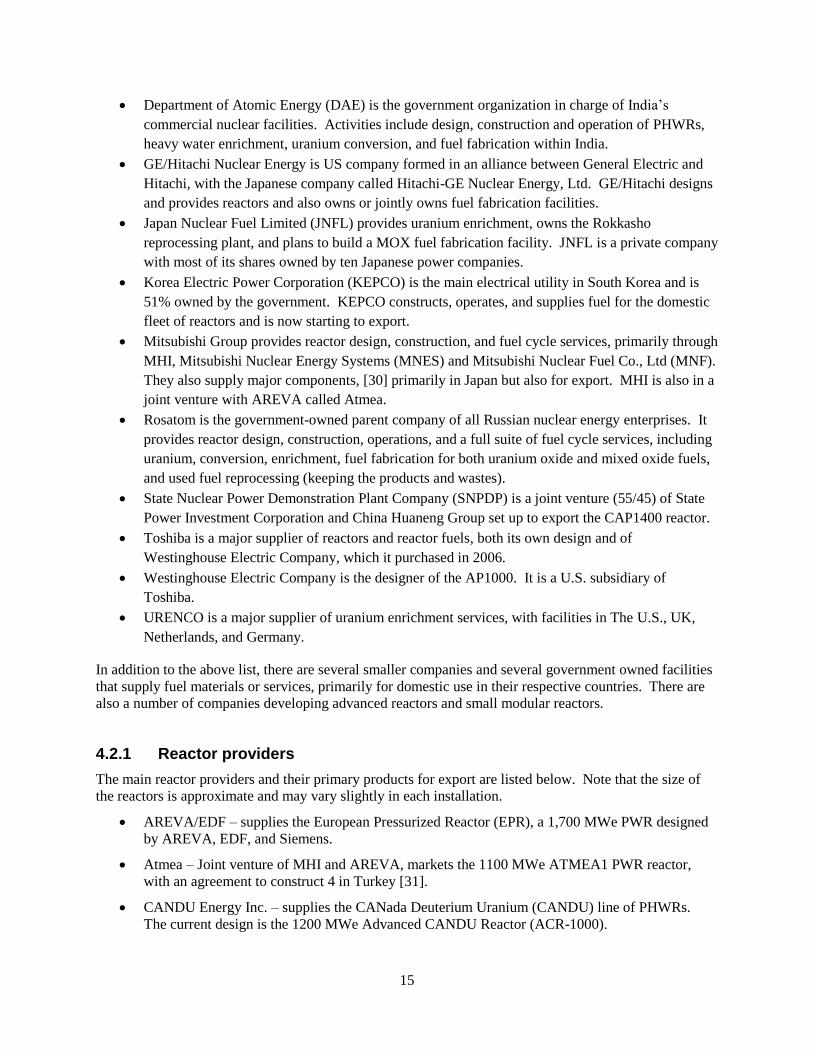
4.2.1 Reactor providers
The main reactor providers and their primary products for export are listed below. Note that the size of
the reactors is approximate and may vary slightly in each installation.
AREVA/EDF – supplies the European Pressurized Reactor (EPR), a 1,700 MWe PWR designed
by AREVA, EDF, and Siemens.
Atmea – Joint venture of MHI and AREVA, markets the 1100 MWe ATMEA1 PWR reactor,
with an agreement to construct 4 in Turkey [31].
CANDU Energy Inc. – supplies the CANada Deuterium Uranium (CANDU) line of PHWRs.
The current design is the 1200 MWe Advanced CANDU Reactor (ACR-1000).
16
Table 5 - Primary Export Companies and the Markets They Serve
Parent Company Ownership
Services/Products
Reactor
Design
Reactor
Construction
Reactor
Operation
Uranium
Ore
Uranium
Conversion
Enrichment Fuel
Fabrication
Reprocessing
AREVA/EDF French-based global company X X X X X X
Atmea Joint venture between AREVA and
Mitsubishi Heavy Industries (MHI) X X
Cameco Canadian-based company X X X
CANDU Energy Inc. Owned by SNC-Lavalin Inc. and
spinoff from Atomic Energy of
Canada
X X
ConverDyn General partnership between
Honeywell and General Atomics X
Comision Nacional de
Energia Atomica
(CNEA)
Argentina-based company
X X X
China General Nuclear
(CGN)
China-based company X X X
China National Nuclear
Corp (CNNC)
China-based company X X X X X X
Department of Atomic
Energy (DAE)
Government-owned organization of
India X X X X X
GE/Hitachi US-based company allied with a
Japan-based company X X X
Japan Nuclear Fuel
Limited (JNFL)
Japan-based company X X X
Korea Electric Power
Corporation (KEPCO)
51% owned by South Korean
government X X X
Mitsubishi Group Japan-based company X X X X X
Rosatom Government-owned company of
Russia X X X X X X X X
State Nuclear Power
Demonstration Plant
Company (SNPDP)
Chinese joint venture export
company X X
Toshiba Japan-based company X X
Westinghouse US-based company acquired by
Toshiba X X
URENCO UK-based company X
17
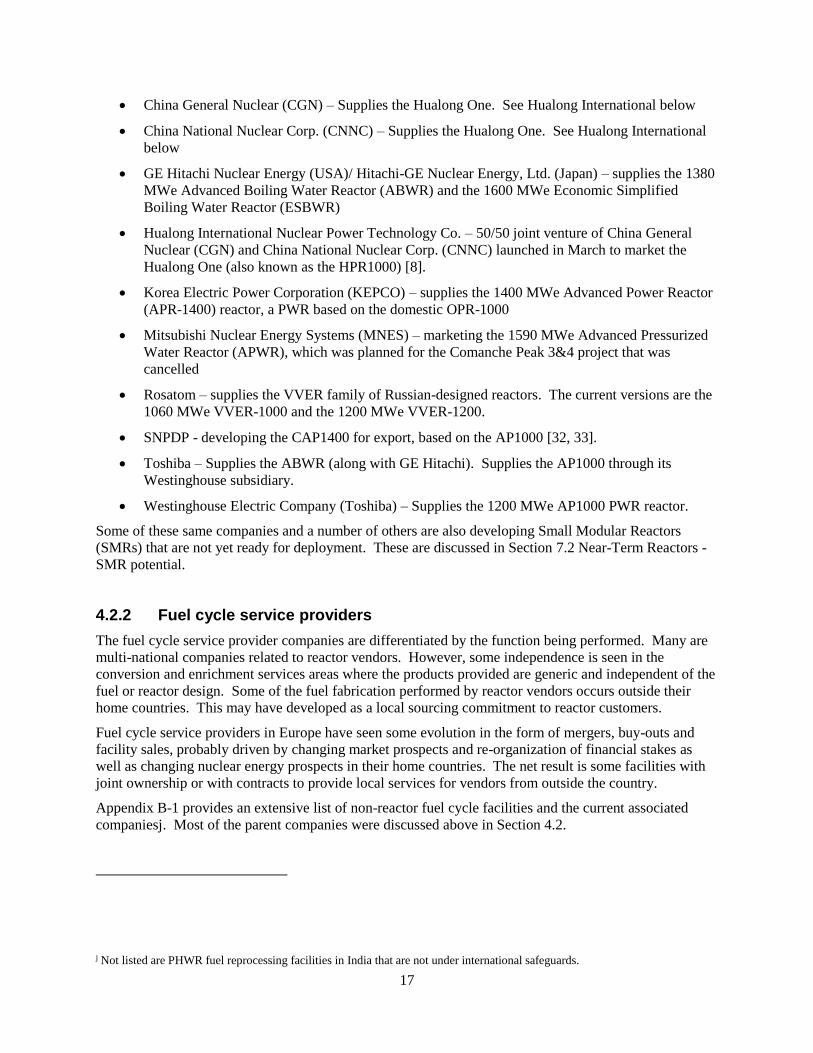
China General Nuclear (CGN) – Supplies the Hualong One. See Hualong International below
China National Nuclear Corp. (CNNC) – Supplies the Hualong One. See Hualong International
below
GE Hitachi Nuclear Energy (USA)/ Hitachi-GE Nuclear Energy, Ltd. (Japan) – supplies the 1380
MWe Advanced Boiling Water Reactor (ABWR) and the 1600 MWe Economic Simplified
Boiling Water Reactor (ESBWR)
Hualong International Nuclear Power Technology Co. – 50/50 joint venture of China General
Nuclear (CGN) and China National Nuclear Corp. (CNNC) launched in March to market the
Hualong One (also known as the HPR1000) [8].
Korea Electric Power Corporation (KEPCO) – supplies the 1400 MWe Advanced Power Reactor
(APR-1400) reactor, a PWR based on the domestic OPR-1000
Mitsubishi Nuclear Energy Systems (MNES) – marketing the 1590 MWe Advanced Pressurized
Water Reactor (APWR), which was planned for the Comanche Peak 3&4 project that was
cancelled
Rosatom – supplies the VVER family of Russian-designed reactors. The current versions are the
1060 MWe VVER-1000 and the 1200 MWe VVER-1200.
SNPDP - developing the CAP1400 for export, based on the AP1000 [32, 33].
Toshiba – Supplies the ABWR (along with GE Hitachi). Supplies the AP1000 through its
Westinghouse subsidiary.
Westinghouse Electric Company (Toshiba) – Supplies the 1200 MWe AP1000 PWR reactor.
Some of these same companies and a number of others are also developing Small Modular Reactors
(SMRs) that are not yet ready for deployment. These are discussed in Section 7.2 Near-Term Reactors -
SMR potential.
4.2.2 Fuel cycle service providers
The fuel cycle service provider companies are differentiated by the function being performed. Many are
multi-national companies related to reactor vendors. However, some independence is seen in the
conversion and enrichment services areas where the products provided are generic and independent of the
fuel or reactor design. Some of the fuel fabrication performed by reactor vendors occurs outside their
home countries. This may have developed as a local sourcing commitment to reactor customers.
Fuel cycle service providers in Europe have seen some evolution in the form of mergers, buy-outs and
facility sales, probably driven by changing market prospects and re-organization of financial stakes as
well as changing nuclear energy prospects in their home countries. The net result is some facilities with
joint ownership or with contracts to provide local services for vendors from outside the country.
Appendix B-1 provides an extensive list of non-reactor fuel cycle facilities and the current associated
companiesj. Most of the parent companies were discussed above in Section 4.2.
j Not listed are PHWR fuel reprocessing facilities in India that are not under international safeguards.
18
5. REACTOR MARKET
5.1 Historic Reactor Market Patterns
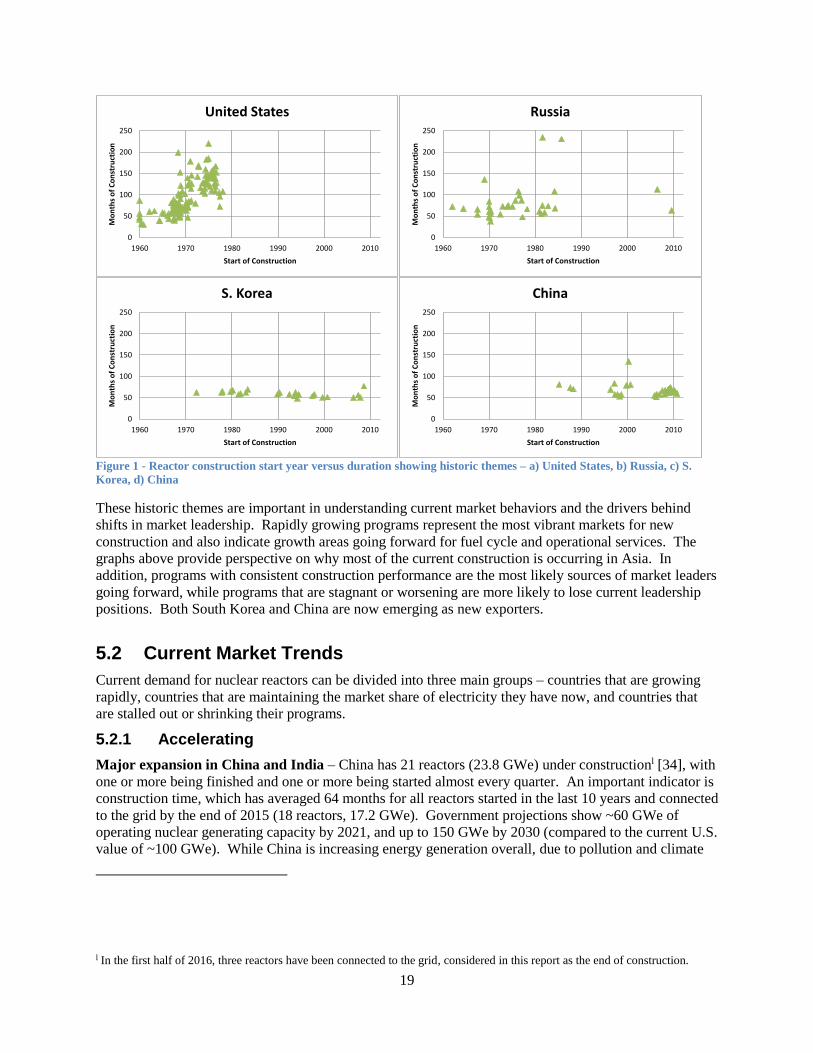
The reactor construction market has been driven by four historic themes prior to 2000. These themes are
briefly discussed here and also shown in Figure 1. Note that projects finished after 2010 and current
projects in progress are not shown, so these graphs do not show current market conditions. This
information is presented in more detail and with additional examples in Appendix A-3.
1. Worsening Construction Performance and Waning Public Support – A number of western
countries stopped developing their nuclear power programs in the ~1980-1990 timeframe due to
the interrelated issues of construction delays and cost overruns, declining public support, and
safety concerns, as well as slowed or uncertain growth in electricity demand (see Figure 1a).
While reactor operators also achieved significantly improved operational performance over the
same period, this did not seem to alter public opinion. Some countries are phasing or have
phased out their programs (Germany, Italy), while others have paused or intended to cancel their
programs with inconsistent policy directions (Spain, Sweden, Belgium, Switzerland). In yet
others countries the “nuclear renaissance” resulted in limited new construction (France, U.S. and
potentially the UK).
2. Major Geopolitical Event - The political turmoil and negative economic growth in the breakup
of the Soviet Union and its Eastern European dependents placed many nuclear power projects in
limbo (see Figure 1b). Russia has recovered sufficiently to resume domestic projects at a reduced
pace. A large share of domestic nuclear power investment in Russia is intended to replace older
units that will be retired. The Russian Federation is now actively pursuing reactor and nuclear
fuel exports. Projects to complete reactors in former Soviet bloc countries have varied based on
the availability of financing and changing political alignments and interests.
3. Consistent/Improving Construction Performance – Larger nuclear power programs in Asia
exhibited a pattern of consistent performance, not experiencing the growing construction delays
of their western counterparts (see Figure 1c). These programs in Japan, South Korea and Indiak
never saw a pause prior to 2011, though Japan is experiencing a major disruption now due to
Fukushima. Going forward, waning public support and safety concerns may move Japan toward
a more restricted program similar to the first bullet above.
4. Rapid Growth and Diversification – More recently, developing countries with rapid energy
demand growth and an associated desire to diversify their energy mix have initiated or are
considering nuclear energy programs (see Figure 1d). China is the lead in this area, but there are
also a growing number of newcomers with similar total energy growth profiles taking the initial
steps to start nuclear energy programs. India is also now shifting to this theme, with more rapid
nuclear construction planned. Note that China also exhibits consistent construction performance.
k India’s project durations have been higher than many other countries, but have seen steady improvement over time.
19
Figure 1 - Reactor construction start year versus duration showing historic themes – a) United States, b) Russia, c) S.
Korea, d) China
These historic themes are important in understanding current market behaviors and the drivers behind
shifts in market leadership. Rapidly growing programs represent the most vibrant markets for new
construction and also indicate growth areas going forward for fuel cycle and operational services. The
graphs above provide perspective on why most of the current construction is occurring in Asia. In
addition, programs with consistent construction performance are the most likely sources of market leaders
going forward, while programs that are stagnant or worsening are more likely to lose current leadership
positions. Both South Korea and China are now emerging as new exporters.
5.2 Current Market Trends
Current demand for nuclear reactors can be divided into three main groups – countries that are growing
rapidly, countries that are maintaining the market share of electricity they have now, and countries that
are stalled out or shrinking their programs.
5.2.1 Accelerating
Major expansion in China and India – China has 21 reactors (23.8 GWe) under constructionl [34], with
one or more being finished and one or more being started almost every quarter. An important indicator is
construction time, which has averaged 64 months for all reactors started in the last 10 years and connected
to the grid by the end of 2015 (18 reactors, 17.2 GWe). Government projections show ~60 GWe of
operating nuclear generating capacity by 2021, and up to 150 GWe by 2030 (compared to the current U.S.
value of ~100 GWe). While China is increasing energy generation overall, due to pollution and climate
l In the first half of 2016, three reactors have been connected to the grid, considered in this report as the end of construction.
0
50
100
150
200
250
1960 1970 1980 1990 2000 2010
Mo
nth
s o
f C
on
stru
ctio
n
Start of Construction
United States
0
50
100
150
200
250
1960 1970 1980 1990 2000 2010
Mo
nth
s o
f C
on
stru
ctio
n
Start of Construction
Russia
0
50
100
150
200
250
1960 1970 1980 1990 2000 2010
Mo
nth
s o
f C
on
stru
ctio
n
Start of Construction
S. Korea
0
50
100
150
200
250
1960 1970 1980 1990 2000 2010
Mo
nth
s o
f C
on
stru
ctio
n
Start of Construction
China
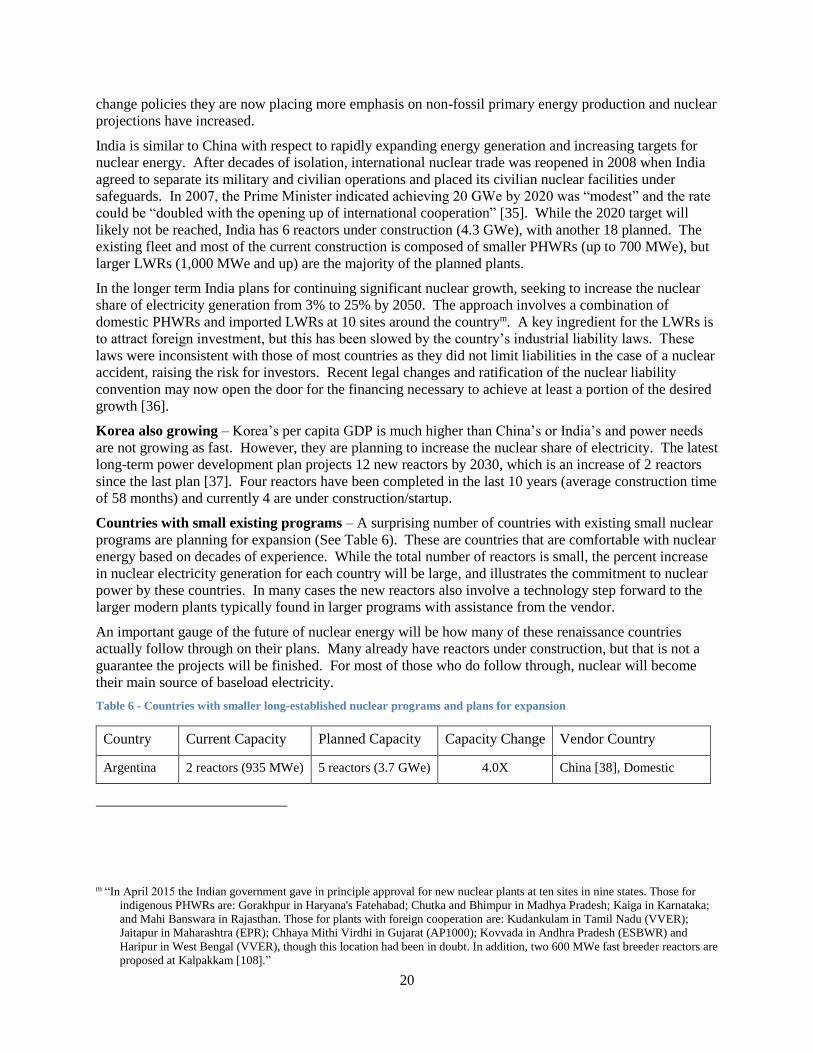
20
change policies they are now placing more emphasis on non-fossil primary energy production and nuclear
projections have increased.
India is similar to China with respect to rapidly expanding energy generation and increasing targets for
nuclear energy. After decades of isolation, international nuclear trade was reopened in 2008 when India
agreed to separate its military and civilian operations and placed its civilian nuclear facilities under
safeguards. In 2007, the Prime Minister indicated achieving 20 GWe by 2020 was “modest” and the rate
could be “doubled with the opening up of international cooperation” [35]. While the 2020 target will
likely not be reached, India has 6 reactors under construction (4.3 GWe), with another 18 planned. The
existing fleet and most of the current construction is composed of smaller PHWRs (up to 700 MWe), but
larger LWRs (1,000 MWe and up) are the majority of the planned plants.
In the longer term India plans for continuing significant nuclear growth, seeking to increase the nuclear
share of electricity generation from 3% to 25% by 2050. The approach involves a combination of
domestic PHWRs and imported LWRs at 10 sites around the countrym. A key ingredient for the LWRs is
to attract foreign investment, but this has been slowed by the country’s industrial liability laws. These
laws were inconsistent with those of most countries as they did not limit liabilities in the case of a nuclear
accident, raising the risk for investors. Recent legal changes and ratification of the nuclear liability
convention may now open the door for the financing necessary to achieve at least a portion of the desired
growth [36].
Korea also growing – Korea’s per capita GDP is much higher than China’s or India’s and power needs
are not growing as fast. However, they are planning to increase the nuclear share of electricity. The latest
long-term power development plan projects 12 new reactors by 2030, which is an increase of 2 reactors
since the last plan [37]. Four reactors have been completed in the last 10 years (average construction time
of 58 months) and currently 4 are under construction/startup.
Countries with small existing programs – A surprising number of countries with existing small nuclear
programs are planning for expansion (See Table 6). These are countries that are comfortable with nuclear
energy based on decades of experience. While the total number of reactors is small, the percent increase
in nuclear electricity generation for each country will be large, and illustrates the commitment to nuclear
power by these countries. In many cases the new reactors also involve a technology step forward to the
larger modern plants typically found in larger programs with assistance from the vendor.
An important gauge of the future of nuclear energy will be how many of these renaissance countries
actually follow through on their plans. Many already have reactors under construction, but that is not a
guarantee the projects will be finished. For most of those who do follow through, nuclear will become
their main source of baseload electricity.
Table 6 - Countries with smaller long-established nuclear programs and plans for expansion
Country Current Capacity Planned Capacity Capacity Change Vendor Country
Argentina 2 reactors (935 MWe) 5 reactors (3.7 GWe) 4.0X China [38], Domestic
m “In April 2015 the Indian government gave in principle approval for new nuclear plants at ten sites in nine states. Those for
indigenous PHWRs are: Gorakhpur in Haryana's Fatehabad; Chutka and Bhimpur in Madhya Pradesh; Kaiga in Karnataka;
and Mahi Banswara in Rajasthan. Those for plants with foreign cooperation are: Kudankulam in Tamil Nadu (VVER);
Jaitapur in Maharashtra (EPR); Chhaya Mithi Virdhi in Gujarat (AP1000); Kovvada in Andhra Pradesh (ESBWR) and
Haripur in West Bengal (VVER), though this location had been in doubt. In addition, two 600 MWe fast breeder reactors are
proposed at Kalpakkam [108].”
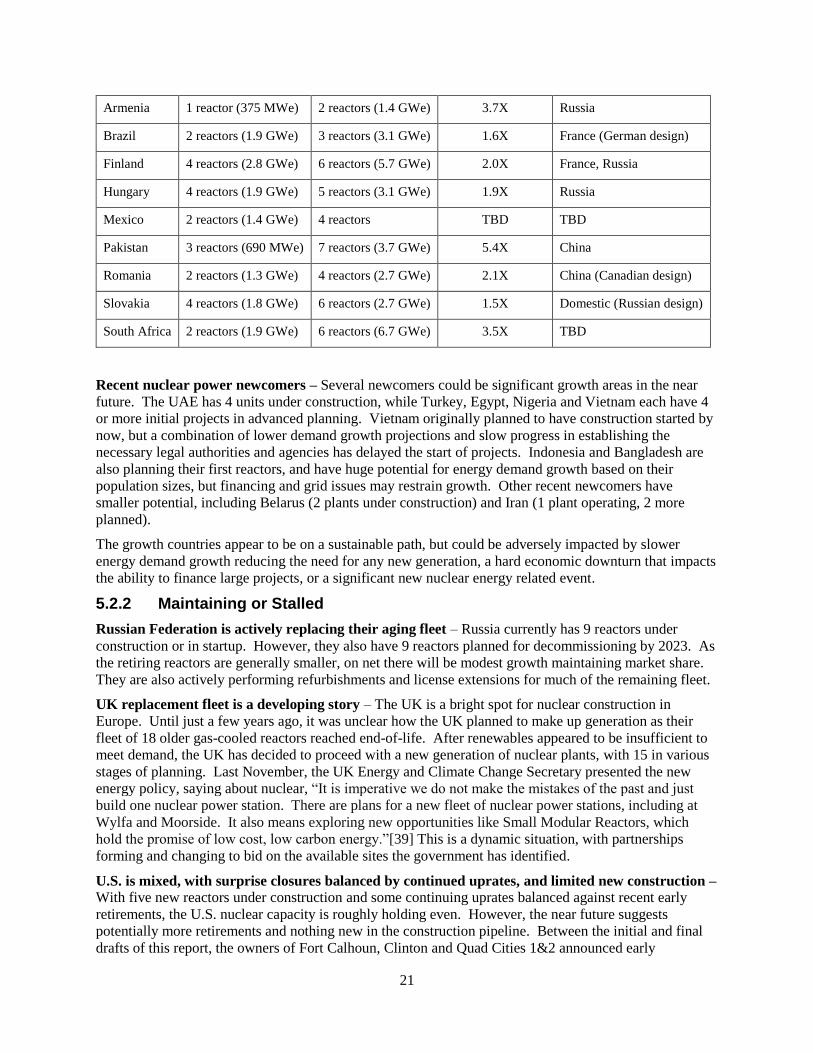
21
Armenia 1 reactor (375 MWe) 2 reactors (1.4 GWe) 3.7X Russia
Brazil 2 reactors (1.9 GWe) 3 reactors (3.1 GWe) 1.6X France (German design)
Finland 4 reactors (2.8 GWe) 6 reactors (5.7 GWe) 2.0X France, Russia
Hungary 4 reactors (1.9 GWe) 5 reactors (3.1 GWe) 1.9X Russia
Mexico 2 reactors (1.4 GWe) 4 reactors TBD TBD
Pakistan 3 reactors (690 MWe) 7 reactors (3.7 GWe) 5.4X China
Romania 2 reactors (1.3 GWe) 4 reactors (2.7 GWe) 2.1X China (Canadian design)
Slovakia 4 reactors (1.8 GWe) 6 reactors (2.7 GWe) 1.5X Domestic (Russian design)
South Africa 2 reactors (1.9 GWe) 6 reactors (6.7 GWe) 3.5X TBD
Recent nuclear power newcomers – Several newcomers could be significant growth areas in the near
future. The UAE has 4 units under construction, while Turkey, Egypt, Nigeria and Vietnam each have 4
or more initial projects in advanced planning. Vietnam originally planned to have construction started by
now, but a combination of lower demand growth projections and slow progress in establishing the
necessary legal authorities and agencies has delayed the start of projects. Indonesia and Bangladesh are
also planning their first reactors, and have huge potential for energy demand growth based on their
population sizes, but financing and grid issues may restrain growth. Other recent newcomers have
smaller potential, including Belarus (2 plants under construction) and Iran (1 plant operating, 2 more
planned).
The growth countries appear to be on a sustainable path, but could be adversely impacted by slower
energy demand growth reducing the need for any new generation, a hard economic downturn that impacts
the ability to finance large projects, or a significant new nuclear energy related event.
5.2.2 Maintaining or Stalled
Russian Federation is actively replacing their aging fleet – Russia currently has 9 reactors under
construction or in startup. However, they also have 9 reactors planned for decommissioning by 2023. As
the retiring reactors are generally smaller, on net there will be modest growth maintaining market share.
They are also actively performing refurbishments and license extensions for much of the remaining fleet.
UK replacement fleet is a developing story – The UK is a bright spot for nuclear construction in
Europe. Until just a few years ago, it was unclear how the UK planned to make up generation as their
fleet of 18 older gas-cooled reactors reached end-of-life. After renewables appeared to be insufficient to
meet demand, the UK has decided to proceed with a new generation of nuclear plants, with 15 in various
stages of planning. Last November, the UK Energy and Climate Change Secretary presented the new
energy policy, saying about nuclear, “It is imperative we do not make the mistakes of the past and just
build one nuclear power station. There are plans for a new fleet of nuclear power stations, including at
Wylfa and Moorside. It also means exploring new opportunities like Small Modular Reactors, which
hold the promise of low cost, low carbon energy.”[39] This is a dynamic situation, with partnerships
forming and changing to bid on the available sites the government has identified.
U.S. is mixed, with surprise closures balanced by continued uprates, and limited new construction –
With five new reactors under construction and some continuing uprates balanced against recent early
retirements, the U.S. nuclear capacity is roughly holding even. However, the near future suggests
potentially more retirements and nothing new in the construction pipeline. Between the initial and final
drafts of this report, the owners of Fort Calhoun, Clinton and Quad Cities 1&2 announced early
22
retirements of those reactors and the owner of Diablo Canyon 1&2 announced their retirement at the end
of their original license instead of applying for a 20 year license extension.
Watts Bar 2 was connected to the grid on June 3 (the first new U.S. reactor in 20 years) and is now
undergoing final operational testing, but the four AP1000 reactors under construction have all experience
schedule delays and are the focus of much analysis to determine how much of the delays and associated
cost overruns are due to these being first-of-a-kind plantsn and how much is systemic and may reoccur in
subsequent construction projects. The AP1000 design had a very successful first round of orders (8
reactors), but follow-on order volume will be impacted by the results of these analyses. So far, the
AP1000 problems seem smaller than those of AREVA’s European Pressurized Reactor (EPR).
The nuclear industry must be evaluated within the bigger economic picture of electricity generation,
where plentiful resources have made natural gas the lowest cost producer in many markets, and legislative
carve-outs for emissions-free electricity generation have generally been restricted to renewables and left
out nuclear. Two factors are of particular importance:
In restructured markets where generation from intermittent renewables has become significant,
nuclear energy has a hard time competing in the volatile hourly electricity pricing. Market share
growth in intermittent renewables (wind, solar) is causing much larger hourly and daily
imbalances between supply and demand. When intermittent sources are producing, a glut in
supply occurs causing depressed (occasional even negative) pricing of electricity for periods of a
few hours at a time – too short for nuclear plants to shut down – and when renewables aren’t
producing and hourly prices jump, then fast reaction natural gas peaking plants garner most of the
added revenue. Note that renewables still can make money even when prices are depressed (even
negative), as long as their $23/MW-hr production tax credit and other incentives provide enough
revenue to offset their operational costs and any negative pricing costs. Grid regulators are
looking at pricing models that give more value to baseload generation, but suppliers of electricity
from renewables and natural gas are fighting these changes because the current system is working
well for them.
Renewable portfolio standards (RPS) provide renewables with a guaranteed market share that will
increase significantly in the future. Currently, 29 states have renewable portfolio standardso
which require a growing portion of total electricity to come from these sources [40, 41]. This
skews the markets in these states in two ways, both detrimental to nuclear power. First is the
direct mandate for renewables, which is additive with existing federal production tax credits and
other incentives. Second, most growth in renewables is in intermittent renewables (wind, solar)
which require backup power, giving a coupled advantage to natural gas plants with their ability to
quickly ramp up generation. Since overall U.S. electricity growth is less than 1% annually,
achievement of the guaranteed renewable market shares and their coupled natural gas back-ups
require other generation to be pushed aside, independent of price.
n These projects are first-of-a-kind on several dimensions, including the first plants built under the new combined construction
and operating license regulatory approach, the first of this Generation III+ design built in the U.S. (and concurrent with the
first globally), and the first reactors constructed in the U.S. using factory fabrication of large modules instead of primarily
on-site construction.
o The Database of State Incentives for Renewables & Efficiency (DSIRE) provides detailed information on specific policies and
incentives - http://www.dsireusa.org/

23
In the medium term, some nuclear plants will be reaching the end of their current 20 year license
extensionsp, but there is an ongoing effort to look at a second round of license extensions to 80 years with
Surry and Peach Bottom likely to be the first applicants [42]. Many plant owners have already replaced
major components such as steam generators to improve plant output and extend plant life.
Canada has been refurbishing, but future direction unclear – A significant portion of the Canadian
fleet has undergone a prolonged refurbishment effort over the last 20 years that is now mostly complete
and has extended the life of the reactors. To date this has included four Bruce units, two Pickering units
[43] and Point Lepreau. Three units were closed instead of going through refurbishment (Gentilly 2 and
two Pickering units). A new round of rolling refurbishments for six Bruce units is planned beginning in
2020. No new reactors are currently under construction, and 4 planned units are currently deferred.
France is planning for zero growth, which will result in declining market share – France has one unit
under construction with significant delays. The current government strategy is to allow growth in non-
nuclear generation to bring the nuclear component down from ~75% of electricity production to 50%
while also requiring any new reactors to be offset by closure of older reactors [44]. This will increase
energy diversity and allow room for more renewable generation. Like the U.S. and Canada, France is
facing the need in the medium term to replace aging units or replace major components to enable life
extensions. Public reaction to the aesthetics and cost of renewables may be a developing factor for
nuclear futures in the mid-term.
Japan seeing limited restarts – Nuclear futures in Japan continue to be uncertain. Sentiment hit bottom
following Fukushima, and there was talk of abandoning nuclear power completely. Nuclear futures are
beginning to turn around, with Sendai-1&2 plants restartedq and several more projected [45] and the
planned nuclear share by 2030 to be 20-22% (versus 30% prior to the accident) [46].
Japan’s longer term growth is still not certain, and the most recent government approved electricity
generation plan has nuclear at 20-22% of total electricity, down from ~30% before Fukushima.r While
over half of the existing reactors have asked for permission to restart, the regulatory review has only been
completed on a handful and approval for restart must be obtained at multiple government levels. To date,
only 2 have resumed continuous operation, while two others were briefly restarted, then halted again by
legal challenges [47]. Some have also been identified for decommissioning. There have been no new
construction starts since Fukushima, but construction has resumed at the plants that were under
construction at the time of the accident. To achieve and maintain the 20-22% energy mix after factoring
in current plants that may be decommissioned may require resuming the slow but steady growth of the
past. However, uncertainty remains high and more time is needed for the nuclear program to stabilize.
Spain backed away from close-out – In 1984, Spain passed a law placing a moratorium on new builds
and limiting existing reactors to 40 years of operation. However, rising costs of incentives for renewables
have resulted in legal changes in 2011 and a number of license extensions have been granted. Spain has 7
plants operating and another in refurbishment and expected to restart soon.
For the above countries, economics and the availability or lack of fossil alternatives appears to be the
main drivers, though sometimes for different reasons. Russia wants to sell its oil and gas, which more
p Reactor licensing in the U.S. includes an initial operating license for 40 years, followed by 20 year extensions. With few
exceptions, owners have filed for extensions to 60 years when their current licenses were nearing their end or when a major
uprate was undertaken. To date none of these initial extensions have been rejected.
q Takahama-3&4 were also briefly restarted, then halted again[47]
r See “Post-Fukushima energy policy changes, 2011” in the WNA country profile at http://www.world-nuclear.org/information-
library/country-profiles/countries-g-n/japan-nuclear-power.aspx
24
domestic nuclear enables, and domestic labor is still relatively cheap. The UK is looking to maintain
energy diversity while meeting CO2 reduction goals. Spain is reacting to the cost of incentivizing
renewables. The U.S. and France are reacting to the rising costs of domestic nuclear projects, even while
the growth countries seem to be able to build the same plants faster and more economically. Japan
remains energy poor and as they recover from the Fukushima-driven shutdowns, they are finding the
options have not changed.
Additional Newcomers – Several additional countries have plans to start nuclear power programs that
are less definite, including Chile, Indonesia, Jordan, and Kazakhstan. Multiple others are considering, but
are far from execution. (A full list of the probable and possible newcomers was provided in Section
4.1.3.) The main inhibitors appear to be financing and inadequate grid systems, along with the effort
required to set up the necessary institutions.
5.2.3 Phase-out
Germany, Belgium still on phase-out path – Germany and Belgium were both on phase-out paths, then
changed plans, and then changed again. Germany had originally planned on phase-out after a government
change in 1998, then cancelled the policy with a new government in 2009, but reinstated it in 2011.
Germany has shut down 10 reactors since 2003.
Belgium’s strategy has swung with changes of government to consider extension of current plants to
retaining the 40 year limitation originally passed in 2003. The prohibition against new plants passed in
2003 has remained in force throughout the other changes. However, unlike Germany no plants have
actually been retired since the policy was put in place. More recently, an additional operating life of 10
years was granted for the Belgian plants given underperformance in renewable energy deployment. A
recent International Energy Agency review of Belgium critiqued the lack of a long-term energy policy,
specifically siting the impact of the nuclear phase-out [48].
Both countries have also imposed new taxes on nuclear production to help pay for expansion of
renewable energy.
Sweden policy mostly negative, public opinion mostly positive – Sweden is currently operating nine
reactors (9 GWe). After Three Mile Island, Sweden had a referendum on phase out of nuclear energy that
resulted in a policy of operating current and under construction plants through end-of-life with no new
construction. In 2010, this was modified to allow replacement construction at existing sites, but in
October 2014 phase-out was again being implemented, even though less than a quarter of the population
supports the position. On June 10, this position was again reversed when the government struck a deal
with the opposition to allow replacement of existing reactors as they reach the end of their economic
lifespans while abolishing the energy tax paid by nuclear energy producers [49]. The government
imposes significant taxes and regulations on nuclear energy while providing significant incentives for
renewables.
Italy remains phased-out – Italy closed out its 4 reactor nuclear fleet following Chernobyl, with the last
two plants shut down in 1990. There was considerable interest in reversing this decision due to high
electricity costs, and a referendum was scheduled for June, 2011. The timing of the Fukushima accident
in March 2011 contributed to the nuclear power plan being rejected in the referendum.
For these close-out countries, the general drivers are fear of accidents and lack of geologic disposal
options. Economics actually appears to be a reason to continue with nuclear, since the alternative is
renewables and the cost of subsidies continues to climb as they gain mandated market share. Successful
builds in Asia and in closer small renaissance and newcomer countries and success in opening a geologic
repository in Finland are probably both needed to soften positions.

25
5.3 Current Demand
As of June 2016, 62 nuclear power reactors are under construction globally, with five more in different
stages of start-up. A summary of these projects are provided here, while additional information on these
projects is provided in Appendix 0. Reactor capacities are gross rated generation.
Argentina – CAREM Prototype (29 MWe)
Belarus – 2 Russian VVERs (1100 MWe each)
Brazil – 1 PWR in collaboration with AREVA (1245 MWe)
China – 20 large PWRs, mostly domestic but includes 4 AP1000s (MHI/Westinghouse), 2 EPRs
(AREVA) and 2 VVERs (Rosatom), 1 prototype high temperature gas reactor (HTGR), plus 3
PWRs in start-up
Finland – 1 EPR (1720 MWe)
France – 1 EPR (1750 MWe)
India – 4 domestic PHWRs (700 MWe each), 1 VVER (1000 MWe), 1 prototype fast breeder
reactor (FBR) (500 MWe)
Japan – 2 domestic BWRs (~1350 MWe each)
South Korea – 3 domestic APR-1400s (1400 MWe each), plus one in start-up
Pakistan – 4 Chinese PWRs (2 at 340 MWe each, 2 at 1150 MWe each)
Russia – 6 VVERs (~1100 MWe each), 2 prototype floating reactors (70 MWe each), plus one
prototype FBR (880 MWe) in start-up
Slovakia – 2 VVERs (471 MWe each)
Taiwan – 2 General Electric BWRs (1300 MWe each), construction suspended s
UAE – 4 KEPCO APR-1400s (~1350 MWe each)
U.S. –4 AP1000 (~1150 MWe each), plus one resumed Westinghouse PWR (1200 MWe) in
start-up,
Table 7 provides a summary of the new construction of reactors by vendor, omitting non-traditional
prototypes (CAREM, HTGR, FBRs, and floating reactors). Both total market share and export market
share are shownt. While China has the largest share of total construction, most is domestic. Construction
in China is 60% domestic and 40% imports. Indian companies dominate domestic construction, but India
has agreements with several foreign reactor vendors to build in India (U.S., France and Russia). Rosatom
s Public support for nuclear power in Taiwan has eroded since Fukushima. Construction on Lungmen-1 is complete and it passed
preoperational testing in August, 2014, but is now sealed for 3 years until a public referendum can occur. Lungmen-2
construction is more than 90% complete but also suspended for 3 years.
http://www.taiwantoday.tw/ct.asp?xItem=232105&ctNode=2182
http://www.world-nuclear-news.org/NN-Political-discord-places-Lungmen-on-hold-2804144.html
t Total market share was determined by dividing the NPPs the Total. Export market share was determined by dividing the Export
NPPs by the Export Total.
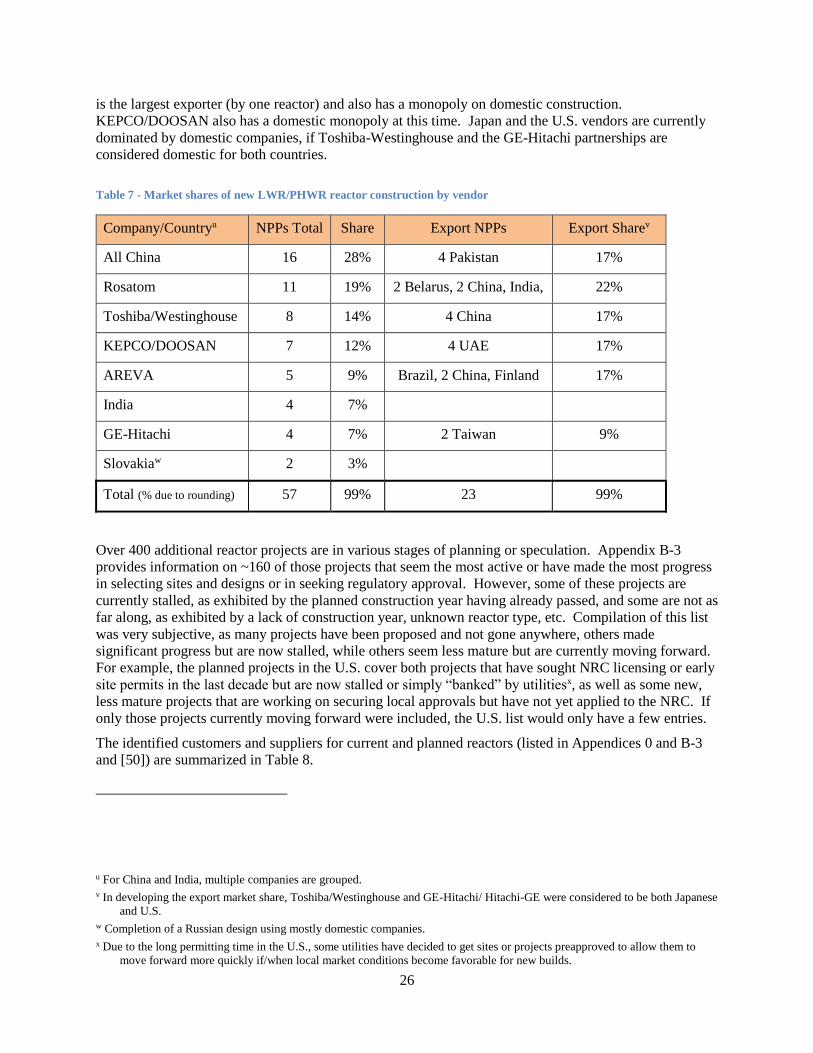
26
is the largest exporter (by one reactor) and also has a monopoly on domestic construction.
KEPCO/DOOSAN also has a domestic monopoly at this time. Japan and the U.S. vendors are currently
dominated by domestic companies, if Toshiba-Westinghouse and the GE-Hitachi partnerships are
considered domestic for both countries.
Table 7 - Market shares of new LWR/PHWR reactor construction by vendor
Company/Countryu NPPs Total Share Export NPPs Export Sharev
All China 16 28% 4 Pakistan 17%
Rosatom 11 19% 2 Belarus, 2 China, India, 22%
Toshiba/Westinghouse 8 14% 4 China 17%
KEPCO/DOOSAN 7 12% 4 UAE 17%
AREVA 5 9% Brazil, 2 China, Finland 17%
India 4 7%
GE-Hitachi 4 7% 2 Taiwan 9%
Slovakiaw 2 3%
Total (% due to rounding) 57 99% 23 99%
Over 400 additional reactor projects are in various stages of planning or speculation. Appendix B-3
provides information on ~160 of those projects that seem the most active or have made the most progress
in selecting sites and designs or in seeking regulatory approval. However, some of these projects are
currently stalled, as exhibited by the planned construction year having already passed, and some are not as
far along, as exhibited by a lack of construction year, unknown reactor type, etc. Compilation of this list
was very subjective, as many projects have been proposed and not gone anywhere, others made
significant progress but are now stalled, while others seem less mature but are currently moving forward.
For example, the planned projects in the U.S. cover both projects that have sought NRC licensing or early
site permits in the last decade but are now stalled or simply “banked” by utilitiesx, as well as some new,
less mature projects that are working on securing local approvals but have not yet applied to the NRC. If
only those projects currently moving forward were included, the U.S. list would only have a few entries.
The identified customers and suppliers for current and planned reactors (listed in Appendices 0 and B-3
and [50]) are summarized in Table 8.
u For China and India, multiple companies are grouped.
v In developing the export market share, Toshiba/Westinghouse and GE-Hitachi/ Hitachi-GE were considered to be both Japanese
and U.S.
w Completion of a Russian design using mostly domestic companies.
x Due to the long permitting time in the U.S., some utilities have decided to get sites or projects preapproved to allow them to
move forward more quickly if/when local market conditions become favorable for new builds.
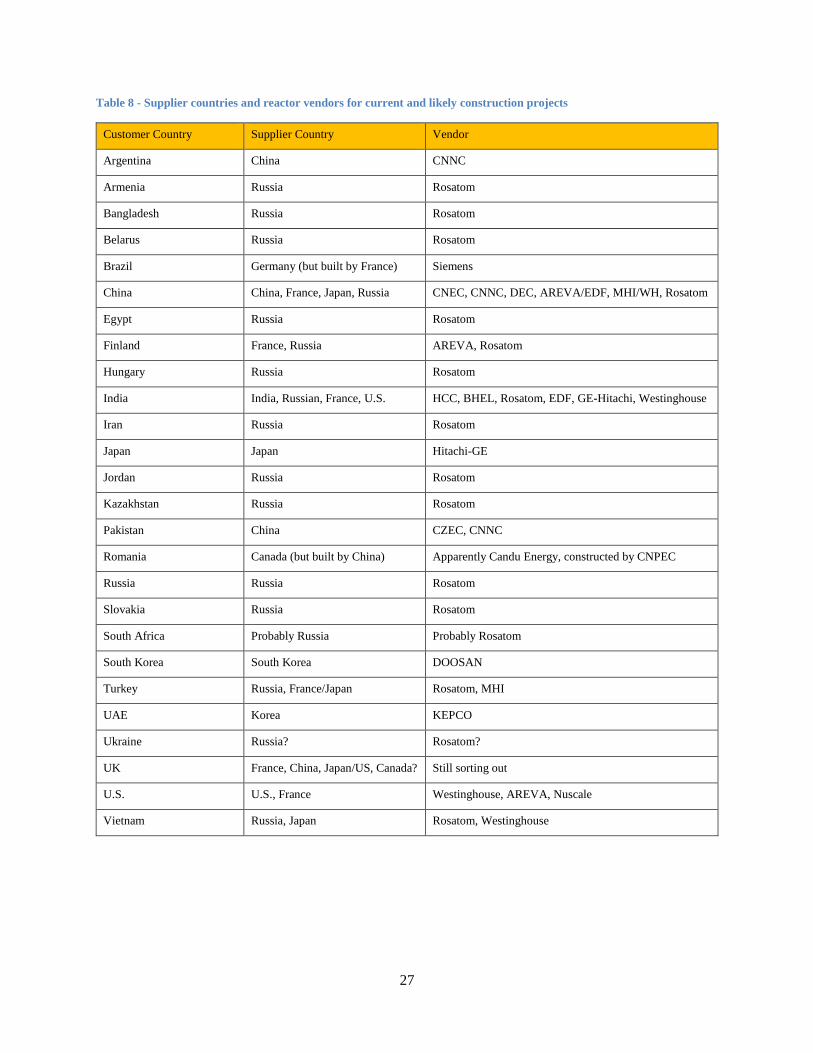
27
Table 8 - Supplier countries and reactor vendors for current and likely construction projects
Customer Country Supplier Country Vendor
Argentina China CNNC
Armenia Russia Rosatom
Bangladesh Russia Rosatom
Belarus Russia Rosatom
Brazil Germany (but built by France) Siemens
China China, France, Japan, Russia CNEC, CNNC, DEC, AREVA/EDF, MHI/WH, Rosatom
Egypt Russia Rosatom
Finland France, Russia AREVA, Rosatom
Hungary Russia Rosatom
India India, Russian, France, U.S. HCC, BHEL, Rosatom, EDF, GE-Hitachi, Westinghouse
Iran Russia Rosatom
Japan Japan Hitachi-GE
Jordan Russia Rosatom
Kazakhstan Russia Rosatom
Pakistan China CZEC, CNNC
Romania Canada (but built by China) Apparently Candu Energy, constructed by CNPEC
Russia Russia Rosatom
Slovakia Russia Rosatom
South Africa Probably Russia Probably Rosatom
South Korea South Korea DOOSAN
Turkey Russia, France/Japan Rosatom, MHI
UAE Korea KEPCO
Ukraine Russia? Rosatom?
UK France, China, Japan/US, Canada? Still sorting out
U.S. U.S., France Westinghouse, AREVA, Nuscale
Vietnam Russia, Japan Rosatom, Westinghouse
28
5.4 Demand Drivers
Looking forward, several factors will impact the demand for new reactors.
High energy demand is a driving factor for construction of new generating facilities, including
additional nuclear facilities in countries such as China and India that already have a nuclear
program. Current newcomer countries and many potential newcomer countries also have high
energy demand. Nuclear power is generally not the initial energy generation technology
deployed in high demand countries, but instead is added later to improve baseload generation and
increase energy diversity.
Financing is a key component of all reactor construction projects going forward. The
Organisation for Economic Co-operation and Development (OECD) Arrangement on Export
Credits [51] provides guidelines for participating countriesy for financing of nuclear projects,
including finance terms (interest rates, load durations, etc.). Reactor export countries that are not
part of this arrangement may offer more favorable financing terms, providing a competitive
advantage. Rosatom has had an advantage in this respect with the ability to obtain government-
backed financing for their export business. Their web site lists funding through export loans,
public loans for the Russian Federation, funding from public banks in Russia, and joint ownership
agreements [52]. However, with the current budget problems in the Russian Federation, this
approach could become more difficult for new projects going forward due to changes in
Rosatom’s governmental support [53]. This in turn may slow some newcomer countries such as
Bangladesh, Egypt, Jordan, Nigeria, and Vietnam, who are looking to Russian financing for their
first nuclear power plants. China also has the ability to provide government-backed financing
outside of the OECD guidelines.
Another key ingredient for export is successful completion of early projects. Project delays
impact not just the image of a vendor, but also potentially their financial health and the ability of
their potential customers to obtain financing for projects that include their designs. Some leading
projects that have had or are experiencing schedule difficulties include:
o Kudankulam-1&2 – Initial Rosatom VVER project in India
o Taishan 1&2 – Initial AREVA EPR project in China
o Sanmen-1&2 – Initial Mitsubishi/Westinghouse AP1000 project in China
o Olkiluoto-3 – Initial AREVA EPR project in Finland
In the case of AREVA, the financial difficulties have resulted in the sale of the majority of their
reactor division to EDF [54] and with EDF taking over AREVA-initiated projects in India [55]
and the UK.
On the other hand, the ambitious 4-reactor KEPCO project in the UAE (Barakah-1-4) appears to
be maintaining schedule. If completed on time, this would likely give KEPCO an advantage in
negotiating new export projects elsewhere.
On the demand side, the slowdown of the economy in China may affect both demand growth and
the ability to finance new construction projects. Recent announcements of 1.8 million layoffs in
the coal and steel industries seem to indicate that China may be starting a new round of
y Participating countries include Australia, Canada, the European Union, Japan, Korea, New Zealand, Norway, Switzerland, and
the United States.
29
restructuring similar to the reforms of the 1990s [56]. So far, the nuclear industry has not been
impacted, and it may be given immunity as China tries to reduce pollution caused in part by
heavy energy sector reliance on coal.
Reactor replacement will also be a driver going forward. According to the IAEA’s Power
Reactor Information System, the median age of the global reactor fleet is just over 30 years, with
the oldest at 47 years. Russia has been building replacement VVER reactors as older RBMK
reactors are retired. The UK is planning for new PWRs to replace aging GCRs. Other countries
are extending the life of current reactors or planning for phase-out.
5.5 Supplier trends
5.5.1 Emerging suppliers
The traditional suppliers of nuclear technology are being challenged by the growth countries as they
develop more experience and capabilities and start to market designs for export. Successful learning in
recent construction and operation of reactors and the ability to construct the same reactor design multiple
times are leading to reduced costs and reduced project risks, which in turn will make financing easier. In
the near term, the ability to finance will be a key in attracting additional customers.
The Korea – UAE deal was the first hint of what is likely coming from Korea and China and eventually
India. When UAE first started looking for a reactor vendor, the competition seemed to involve the
traditional powerhouses, but KEPCO came in with a low bid and won the contract. A similar pattern
occurred when the Czech Republic cancelled an open procurement action for two reactors in 2014 due to
cost concerns [57, 58], then suggested they would restart the process. The bidders on the first
procurement were all traditional vendors (Rosatom, AREVA, and Westinghouse), while both South
Korea and China expressing interest in bidding if the procurement resumed.
These countries are not yet ready to compete in fuel cycle services, though that may also come soon.
Russia is still the supplier of choice for countries with close political ties, but is also emerging as the
supplier of choice for newcomers who need financial assistance. However, this could change as China
uses its financial strength and current construction experience to develop its export business.
5.5.2 Struggling suppliers
Some traditional suppliers are struggling, at least as reactor vendors. AREVA has seen a significant
change of fortune due primarily to delays in their flagship EPR projects, quality control issues, and other
underperforming investments during the last decade. The losses there are impacting the ability to update
and expand fuel services. Fuel facility replacement projects in France have recently been completed or
are going forward (Georges Besse II, Comerhex II), but expansion projects elsewhere have been put on
hold (Eagle Rock). Weak global demand for fuel services is also a current challenge.
Traditional U.S. companies Westinghouse and GE had suffered too long from the domestic construction
drought and were bought up or had to form joint ventures with firms in Japan. For Westinghouse, issues
with the initial AP1000 projects have not been as significant as for the EPR, but none are operating yet.
As current projects are completed and the AP1000s enter operation, the level of second-round sales will
be a strong indicator of the strength of the design. The GE-Hitachi reactors have not been as successful in
gaining sales. For both companies, the fuel service businesses remain healthy, but GE-Hitachi is not as
well positioned to benefit from the growth in China and India.
5.5.3 Partnering arrangements
Due to the cost of nuclear projects, partnering is common on the buyer side. On the seller side, the
international nature of the business results in partnerships forming and dissolving. The posturing for
business in the UK produced some examples:
30
Electricite de France teaming with China General Nuclear Power for Hinkley Point C in the UK,
GE Hitachi and Spain’s Iberdrola partnering on the offer to build PRISM reactors in the UK
Westinghouse taking over the Springfields Fuel site in the UK after Cameco allowed long-term
contracts with the facility to run out
Spains’s Iberdrola, Frances’s ENGIE (formerly GDF Suez), and Scottish and Southern Energy
(SSE) jointly purchased options on a site near Sellafield for future reactor construction in 2009,
with SSE bought out be the other two partners in 2011. In 2013, Westinghouse purchased
Iberdrola’s share.
A Westinghouse-founded company, Nuclear Power Delivery U.K. establishing agreements with
Rolls-Royce, BAE Systems, and Doosan Power Systems
Some companies from close-out countries with a long nuclear history seem to be determining how to
adjust. Siemens is an example:
Ended a joint venture with AREVA in 2009,
Moved to team with Rosatom in 2010
Announced it was leaving the nuclear industry in 2011.
31
6. FUEL CYCLE SERVICE MARKETS
Demand for services mostly follows demand for reactors, but there are some differences. First, as
programs evolve, they tend to develop more domestic capabilities. Second, some countries are changing
fuel fabrication suppliers or trying to develop multiple suppliers. Third, countries that have changed their
nuclear strategies may need to adjust their services to match. For example, a country that is stalled or in
closeout will need fewer reactor construction and support services but will likely need more
decontamination and decommissioning workers.
Fuel cycle services are primarily driven by the installed base of reactors. Historically, PHWRs required
no uranium enrichment, though Canada has been developing reactors that run on very low enrichment
uranium (less than 2% 235U). PHWRs can also use uranium recovered during reprocessing of LWR fuels
without re-enrichment. Due to the low burnup of unenriched fuels, PHWRs require a frequent supply of
fuel and produce a high volume of spent fuel. GCRs and RBMKs use some enrichment (up to 3.5%), but
are also refueled frequently. LWRs currently use enriched uranium in the 4-5% range and have batch
refueling of typically 1/3rd of the core every 12 to 18 months.
Enrichment significantly impacts the dynamics of the fuel cycle front end because, due to a combination
of proliferation concernsz and economies of scaleaa, it is only performed at a limited number of facilities
worldwide. Enrichment also requires conversion of natural uranium oxide (U3O8) into uranium
hexafluoride (UF6). Conversion is a chemical process that efficiently operates at scales that are large
relative to demand and therefore few facilities are needed to support demand. This results in the uranium
flow from a large number of mines being focused to the few conversion and enrichment facilities before
moving on to the fuel fabrication facilities.
Fuel fabrication capacities for both natural uranium oxide fuels for PHWRs and enrichment uranium
oxide fuels for LWRs are well above needs globally. However, unlike the fungible products of the earlier
stages in the fuel cycle, fuel fabrication is highly specialized for specific fuel designs. The trend in the
PHWR fuels area is toward each user developing some domestic capacity to meet needs, with the balance
made up primarily by Canada.
For the LWR fuels, demand in Europe is stagnant and will be dropping due to phase-out in some
countries, while demand in Asia is shifting due to reactors shut down in Japan and new reactors being
completed in China and Korea. To increase flexibility, larger vendors are starting to collaborate/compete,
with the goal of being able to fabricate multiple fuel designs. Direct licensing of a fuel design is one
approach for fabrication of fuels from another vendor. Another approach is for one vendor to purchase a
portion of another vendor or enter into a joint venture. If the owner of the fuel design is not willing to
license the design or enter into a joint venture, the final approach is to obtain regulatory approval to
replace the reactor vendor fuel with fuel of another design that is compatible with the reactor. This is the
approach being taken in Ukraine by Westinghouse [59], using fabrication facilities they own in Sweden.
z Nuclear weapons are constructed from highly enriched uranium or separated plutonium. Thus enrichment and reprocessing
(chemical separations) plants are two facilities of concern for nuclear proliferation. As part of the international safeguards
system, the International Atomic Energy Agency regularly inspects civilian enrichment and reprocessing facilities and
monitors the movement of materials through them.
aa Enrichment facilities are massively modular at the equipment level, with thousands of identical centrifuges in a typical facility.
Smaller facilities are at an economic disadvantage.

32
6.1 Fuel Cycle Status
6.1.1 Uranium
This assessment has not attempted to assess uranium mining and milling due to the numerous mines
globally. A large number of counties have uranium mines. The majority of uranium production in 2015
was in Kazakhstan (39%), Canada (22%), and Australia (9%). A database of existing and near-term
uranium mines was developed in 2011 and a 12 page listing of mines is available on request [60]. A more
up-to-date source is the Uranium Suppliers Annual, which can be purchased from UX Consulting
Companybb.
The trend in uranium extraction has been to move away from deep rock mining and instead concentrate
on open pit mining of near-surface deposits (especially when uranium is a byproduct of extraction of
another element) and in-situ recover mining (ISR). Kazakhstan is the current lead producer of uranium
and uses ISR extensively. The Olympic Dam copper mine in Australia is the largest single uranium
resource in the world, where uranium recovery is a byproduct of copper production.
Uranium is typically available to any nuclear program that has agreed to IAEA safeguards and the
guidelines of the Nuclear Suppliers Group, but typically requires a nuclear cooperation agreement
between the exporting and importing countries. Uranium trade between India and members of the
Nuclear Suppliers Group was stopped in 1974 due to India’s military use of nuclear energy. During this
period, some Indian reactors were sometimes forced to run at reduced power to preserve fuel. Once India
agreed to separate its military and civilian nuclear facilities and bring the civilian facilities under
safeguards, the ban was lifted in 2008 and the major producers quickly established trade [61, 62, 26, 63,
64, and 65].
6.1.2 Conversion
Table 9 lists the main uranium conversion facilities for making UF6. Not listed are facilities for making
unenriched uranium oxide used in PHWRs. Note that different sources often quote different capacities
for these facilities. The UK facility lease recently changed hands and while Westinghouse UK indicates
they have the ability to produce UF6, it was not clear if the facility had resumed operations or was in
standby status. Total capacity is well above the IAEA estimated demand of ~46,000 t HM/yr (plus an
estimate 12,000 t HM/yr from secondary supplies) and comfortably above the WNA estimated demand of
~65,000 tonnes [66], of which ~94% is used in LWRs and required conversion and enrichment.
Since 2005, the spot price for conversion has traded in a range of $6-$13 per kg UF6 with recent prices
near the low end of the range.cc This includes a period when the U.S. facility (Metropolis) had an
extended outage for unexpected repairs, indicating prices are not that sensitive to supply capacity.
Reactor owners and fuel vendors know their needs well in advance, so these plants are assumed to
primarily work via long-term contracts. The customers for these facilities are the uranium enrichment
plants.
bb Available at https://www.uxc.com/p/products/pdf/Flier-USA%202015-12.pdf cc Information on long-term trends in uranium, conversion, and enrichment (SWU) spot prices is available in graphical form at
https://www.uxc.com/p/prices/UxCPriceChart.aspx?chart=spot-u3o8-full
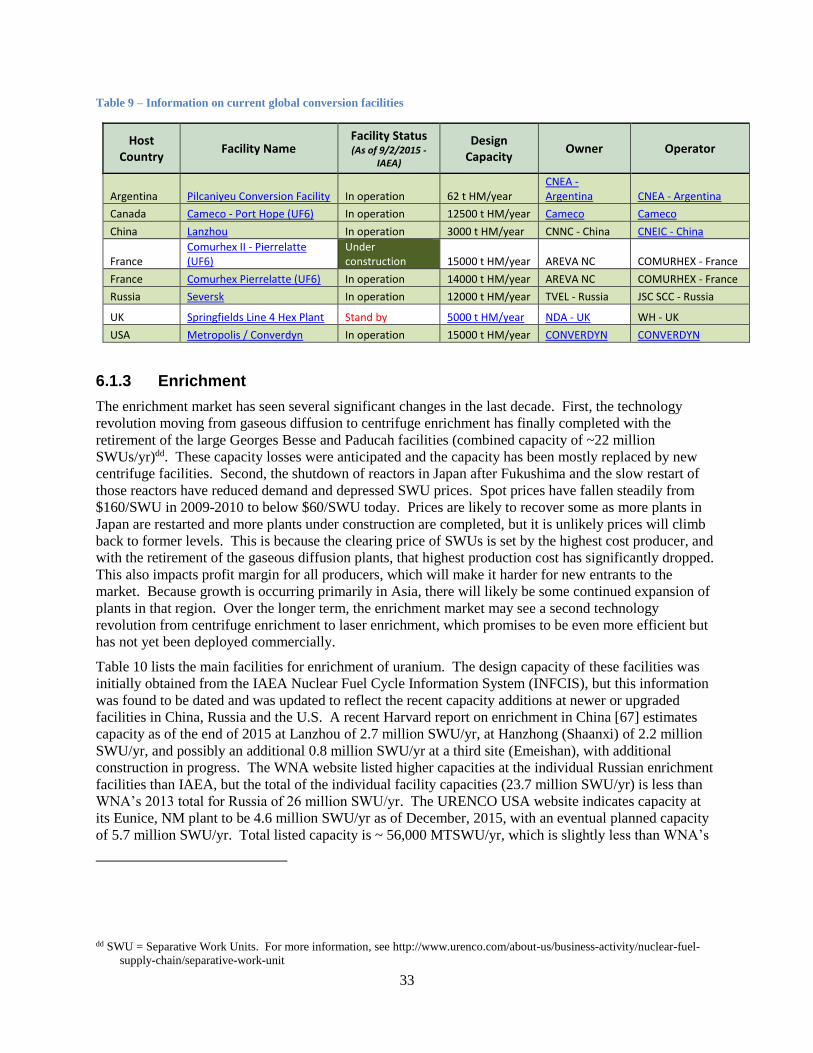
33
Table 9 – Information on current global conversion facilities
Host Country
Facility Name Facility Status (As of 9/2/2015 -
IAEA)
Design Capacity
Owner Operator
Argentina Pilcaniyeu Conversion Facility In operation 62 t HM/year CNEA - Argentina CNEA - Argentina
Canada Cameco - Port Hope (UF6) In operation 12500 t HM/year Cameco Cameco
China Lanzhou In operation 3000 t HM/year CNNC - China CNEIC - China
France Comurhex II - Pierrelatte (UF6)
Under construction 15000 t HM/year AREVA NC COMURHEX - France
France Comurhex Pierrelatte (UF6) In operation 14000 t HM/year AREVA NC COMURHEX - France
Russia Seversk In operation 12000 t HM/year TVEL - Russia JSC SCC - Russia
UK Springfields Line 4 Hex Plant Stand by 5000 t HM/year NDA - UK WH - UK
USA Metropolis / Converdyn In operation 15000 t HM/year CONVERDYN CONVERDYN
6.1.3 Enrichment
The enrichment market has seen several significant changes in the last decade. First, the technology
revolution moving from gaseous diffusion to centrifuge enrichment has finally completed with the
retirement of the large Georges Besse and Paducah facilities (combined capacity of ~22 million
SWUs/yr)dd. These capacity losses were anticipated and the capacity has been mostly replaced by new
centrifuge facilities. Second, the shutdown of reactors in Japan after Fukushima and the slow restart of
those reactors have reduced demand and depressed SWU prices. Spot prices have fallen steadily from
$160/SWU in 2009-2010 to below $60/SWU today. Prices are likely to recover some as more plants in
Japan are restarted and more plants under construction are completed, but it is unlikely prices will climb
back to former levels. This is because the clearing price of SWUs is set by the highest cost producer, and
with the retirement of the gaseous diffusion plants, that highest production cost has significantly dropped.
This also impacts profit margin for all producers, which will make it harder for new entrants to the
market. Because growth is occurring primarily in Asia, there will likely be some continued expansion of
plants in that region. Over the longer term, the enrichment market may see a second technology
revolution from centrifuge enrichment to laser enrichment, which promises to be even more efficient but
has not yet been deployed commercially.
Table 10 lists the main facilities for enrichment of uranium. The design capacity of these facilities was
initially obtained from the IAEA Nuclear Fuel Cycle Information System (INFCIS), but this information
was found to be dated and was updated to reflect the recent capacity additions at newer or upgraded
facilities in China, Russia and the U.S. A recent Harvard report on enrichment in China [67] estimates
capacity as of the end of 2015 at Lanzhou of 2.7 million SWU/yr, at Hanzhong (Shaanxi) of 2.2 million
SWU/yr, and possibly an additional 0.8 million SWU/yr at a third site (Emeishan), with additional
construction in progress. The WNA website listed higher capacities at the individual Russian enrichment
facilities than IAEA, but the total of the individual facility capacities (23.7 million SWU/yr) is less than
WNA’s 2013 total for Russia of 26 million SWU/yr. The URENCO USA website indicates capacity at
its Eunice, NM plant to be 4.6 million SWU/yr as of December, 2015, with an eventual planned capacity
of 5.7 million SWU/yr. Total listed capacity is ~ 56,000 MTSWU/yr, which is slightly less than WNA’s
dd SWU = Separative Work Units. For more information, see http://www.urenco.com/about-us/business-activity/nuclear-fuel-
supply-chain/separative-work-unit
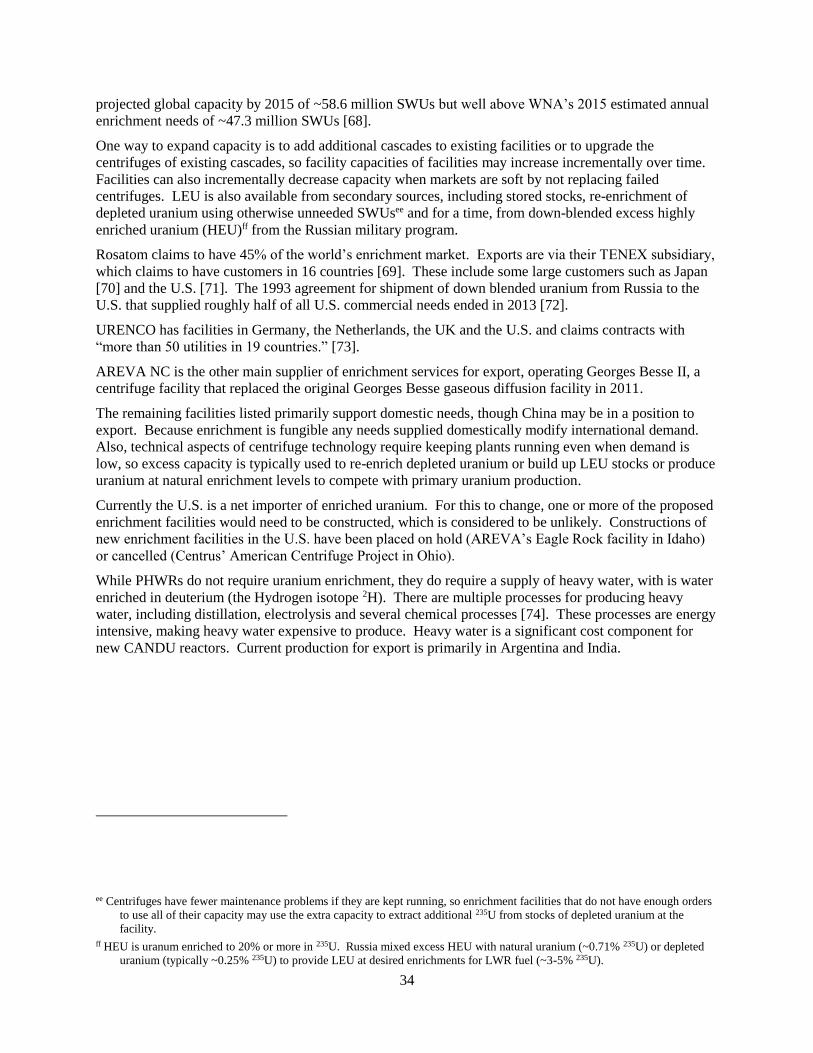
34
projected global capacity by 2015 of ~58.6 million SWUs but well above WNA’s 2015 estimated annual
enrichment needs of ~47.3 million SWUs [68].
One way to expand capacity is to add additional cascades to existing facilities or to upgrade the
centrifuges of existing cascades, so facility capacities of facilities may increase incrementally over time.
Facilities can also incrementally decrease capacity when markets are soft by not replacing failed
centrifuges. LEU is also available from secondary sources, including stored stocks, re-enrichment of
depleted uranium using otherwise unneeded SWUsee and for a time, from down-blended excess highly
enriched uranium (HEU)ff from the Russian military program.
Rosatom claims to have 45% of the world’s enrichment market. Exports are via their TENEX subsidiary,
which claims to have customers in 16 countries [69]. These include some large customers such as Japan
[70] and the U.S. [71]. The 1993 agreement for shipment of down blended uranium from Russia to the
U.S. that supplied roughly half of all U.S. commercial needs ended in 2013 [72].
URENCO has facilities in Germany, the Netherlands, the UK and the U.S. and claims contracts with
“more than 50 utilities in 19 countries.” [73].
AREVA NC is the other main supplier of enrichment services for export, operating Georges Besse II, a
centrifuge facility that replaced the original Georges Besse gaseous diffusion facility in 2011.
The remaining facilities listed primarily support domestic needs, though China may be in a position to
export. Because enrichment is fungible any needs supplied domestically modify international demand.
Also, technical aspects of centrifuge technology require keeping plants running even when demand is
low, so excess capacity is typically used to re-enrich depleted uranium or build up LEU stocks or produce
uranium at natural enrichment levels to compete with primary uranium production.
Currently the U.S. is a net importer of enriched uranium. For this to change, one or more of the proposed
enrichment facilities would need to be constructed, which is considered to be unlikely. Constructions of
new enrichment facilities in the U.S. have been placed on hold (AREVA’s Eagle Rock facility in Idaho)
or cancelled (Centrus’ American Centrifuge Project in Ohio).
While PHWRs do not require uranium enrichment, they do require a supply of heavy water, with is water
enriched in deuterium (the Hydrogen isotope 2H). There are multiple processes for producing heavy
water, including distillation, electrolysis and several chemical processes [74]. These processes are energy
intensive, making heavy water expensive to produce. Heavy water is a significant cost component for
new CANDU reactors. Current production for export is primarily in Argentina and India.
ee Centrifuges have fewer maintenance problems if they are kept running, so enrichment facilities that do not have enough orders
to use all of their capacity may use the extra capacity to extract additional 235U from stocks of depleted uranium at the
facility.
ff HEU is uranum enriched to 20% or more in 235U. Russia mixed excess HEU with natural uranium (~0.71% 235U) or depleted
uranium (typically ~0.25% 235U) to provide LEU at desired enrichments for LWR fuel (~3-5% 235U).
35
Table 10 – Information on current major global enrichment facilities (IAEA)
Host Country
Facility Name
Design Capacity (million SWU/yr)
Owner Operator
China Lanzhou 2 2.7 CNNC - China Unknown
China Shaanxi Uranium Enrichment Plant 2.2 CNNC - China
Shaanxi Uranium Enrichment Plant
China Emeishan Uranium Enrichment Plant 0.8 CNNC - China Unknown
France Georges Besse II 7.5 AREVA NC AREVA NC
Germany Urenco Germany GmbH 4.5 URENCO Enrichment Co. Ltd
URENCO Germany GmbH
Japan Rokkasho Uranium Enrichment Plant 1.05 JNFL - Japan JNFL - Japan
Netherlands Urenco Nederland 4.5 URENCO Enrichment Co. Ltd URENCO Nederland BV
Russia Angarsk 2.6 TVEL - Russia JSC AECC - Russia
Russia Ekaterinburg (Sverdlovsk-44) 10.0 TVEL - Russia JSC UECC - Russia
Russia Krasnoyarsk 8.7 TVEL - Russia JSC PA ECP - Russia
Russia Siberian Chemical Combine (Seversk)
3.0 TVEL - Russia JSC SCC - Russia
UK Urenco UK Ltd 4.0 URENCO URENCO
USA Urenco USA 4.6 URENCO URENCO
6.1.4 Fuel fabrication
Fuel fabrication involves multiple steps and includes conversion of UF6 (LWRs and GCRs) or U3O8
(HWRs) into UO2, fabrication (pressing and sintering) of pellets/pins, fabrication of zirconium cladding
tubes, inserting the fuel in the tubes and building fuel assemblies. Several of these steps may take place
in the same facility or in different facilities in a supply chain. Appendix B-4 provides information on the
facilities performing each of these functions, along with their capacity, owner and operator. The total
capacity is roughly 18,000 tonnes/year, compared to an estimated need of 10,000-11,000 tonnes/year
(~1/3rd HWR and 2/3rd LWR).
While this activity was not able to systematically identify supplier/customer relationships, a number of
relationships were noted. The best assumption for the remaining relationships is that fuel is obtained
from the reactor vendor. The specific arrangements for fuel fabrication identified include:
AREVA claims to supply 35% of the market for light water reactor assemblies and to be
supplying fuel assemblies for 125 of the world’s 288 operating PWRs and BWRs (excluding
VVERs).
o AREVA will supply fuel for 25 years for the new reactors they seek to construct in India
Russia’s Rosatom TVEL claims to have 17% of the fuel fabrication market [75]. TVEL supplies
fuel to power reactors in Russia, Armenia, Bulgaria, China, Czech Republic, Finland, Hungary,
India, Iran, Slovakia, Sweden, and Ukraine, and jointly with AREVA to Germany, Netherlands,
Switzerland, and UK.
o Russia’s TVEL agreed in 2009 to continue to supplying assemblies to Ukraine in the
short term and to assist in a domestic fabrication facility in Ukraine in the longer term
[76]
36
o Russia will supply fuel for the reactors it will construct in Bangladesh and Turkey
Westinghouse claims to manufacture more types of nuclear fuel than any other supplier, including
being a single-source provider for PWRs, BWRs, AGRs, and VVERs. A listing of customers was
not available.
o Westinghouse is supplying assemblies to Ukraine using the fabrication facility in Sweden
[77]
o Westinghouse has agreed to help CNNC produce fuel for the AP1000 plants being built
in China [78]
o Westinghouse supplies fuel to South Africa [79]
o Westinghouse supplies fuel to EDF for use in French reactors, using facilities in Sweden,
the UK, and Spain [80]
o Westinghouse is a second supplier of VVER fuel outside Russia [81].
Cameco is the leading manufacturer of fuel assemblies for CANDU reactors worldwide.
GE-Hitachi is a major provider of fuel for boiling water reactors and also manufactures CANDU
fuel.
Note that there is some overlap apparent from the above claimed markets, indicating some competition.
6.1.5 Spent fuel wet and dry storage
The scope of this study included investigation of trends in spent fuel storage. A total of 30 wet and 100
dry storage facilities were identified, but this is probably an incomplete list, as wet storage is typically
considered part of a reactor plant. Almost all storage was on a reactor site, including a large number of
the dry storage sites identified in the U.S. While some shipment of spent fuel has occurred between
countries, primarily for reprocessing but also for storage in Russia, no major trends were noted.
6.1.6 Reprocessing
Table 11 is a list of operating reprocessing facilities. Reprocessing in the current LWR-only systems is
not particularly economical from a net-present value analysis perspective. While the recovered plutonium
does offset LEU in fuel, reducing uranium and enrichment requirements by ~15%, reprocessing and
mixed U/Pu fuel fabrication are expensive operations. However, the infrastructure and experience are
necessary to enable transition to a closed fuel cycle using FBRs that could eventually eliminate the need
for enrichment and reduce uranium needs by up to 99%. This would make nuclear energy highly
sustainable from a natural resource perspective. For this reason, countries with reprocessing facilities are
also usually researching FBRs.
Only a limited number of countries have their fuel reprocessed to make MOX fuel, so while the capacities
are small compared to the amount of fuel discharged annually, the utilization is below the listed capacity.
Historically the reprocessing market was limited to only three suppliers in France, Russia, and the UK,
and they all primarily reprocessed domestically irradiated fuels with excess capacity available for foreign
customers.
The UK is phasing out of the business and has only been working off existing contracts pending
closure of the Thermal Oxide Reprocessing (Thorp) facility in 2018 [82].
The La Hague facility in France has sufficient capacity to reprocess all domestic fuel as well as
some foreign fuel and has provided reprocessing services to several countries in the past. The
primary foreign customers for La Hague have been Germany and Japan, but with the German

37
phase-out of nuclear energy and Japan constructing their own reprocessing facility, the market is
becoming more limited. The French model is to return reprocessing wastes to the generating
country.
The Russian Mayak facility reprocesses fuel for the Russian Federation and currently for 6
reactors in Ukraine (~107 tHM/yr)gg [83]. While designed for a capacity of 400 tHM/yr, the RT-
1 chemical reprocessing line at Mayak apparently has been running at a reduced level and is
planned to be updated in the next few years [84]. Russia has plans to expand reprocessing
capacity, with a 250 tHM/yr Trial and Demonstration Centre under construction and a new 800
tHM/yr RT-2 line originally planned for completion in 2025 but now postponed. The Russian
model has been to keep reprocessing products and wastes in Russia.
Japan’s facility is in commissioning and not yet operational, but is still viewed as essential for
nuclear energy to play a long-term role in Japan’s quest for energy independence.
India also has limited reprocessing for HWR fuel (not listed), which is typically not reprocessed
due to the low plutonium content. India also has a long-term role for nuclear energy in their
energy independence plans, with the next step involving U/Pu fueled FBRs, followed eventually
by thorium based breeder reactors to utilize their large thorium reserves.
China and South Korea are also considering reprocessing.
Table 11 - Information on current global reprocessing facilities
Host Country
Facility Name Design Capacity Owner Operator
France AREVA NC La Hague - UP2-800 1000 t HM/year COGEMA - France AREVA NC
France AREVA NC La Hague - UP3 1000 t HM/year COGEMA - France AREVA NC
Japan Rokkasho Reprocessing Plant 800 t HM/year JNFL - Japan JNFL - Japan
Russia RT-1, Combined Mayak 400 t HM/year TVEL - Russia Mayak Production Association (PDF)
UK NDA Magnox Reprocessing 1500 t HM/year NDA - UK Sellafield Ltd. (SLC)
UK NDA Thorp 900 t HM/year NDA - UK Sellafield Ltd. (SLC)
6.2 Supplier Trends
One trend that has been ongoing for many years is for new nuclear programs of all sizes to initially buy
from a vendor, then partner and increase domestic content, then begin to develop facilities for additional
parts of the fuel cycle. The main driver is local jobs and local control, often explained in terms of energy
security. They will also develop domestic training and research facilities.
gg Nuclear fuel reprocessing capacity is usually stated in units of tonnes heavy metal per year or tonnes initial heavy metal per
year, where heavy metal refers to the thorium, uranium, plutonium and heavier actinide metals in the fuel. “Initial” refers to
the heavy metal in fresh fuel, some of which is converted to fission products during irradiation.
38
This trend is likely to continue. Representatives to a recent IAEA meeting were asked in a survey [85] to
indicate their country’s current and future indigenous desires for “mastering” mining/milling, conversion,
and fuel fabrication. Within existing programs, 60-70 % indicated current mastery and anticipated
mostly staying at those levels, while newcomers wished to achieve ~50% mastery in the medium term
and 70-80% in the long term.
Reactor vendors still appear to have the upper hand when it comes to fuel supply, even though customers
generally would like to have more than one provider. In the IAEA meeting survey, users of fuel cycle
services indicated a preference for multiple vendors - at least 2 and preferably 3 or more –to guarantee
security of supply, but vendors are typically reluctant to license their fuel designs to others.
If a country is comfortable with the security of supply and has a smaller program, they may forego
development of fuel cycle infrastructure. With supply assurances, some newcomer countries are
declaring they will not develop fuel cycle facilities (other than storage), and in particular will waive their
rights to develop enrichment. This provides non-proliferation assurances while also recognizing the cost
of independent development and the economies of scale of supporting fuel cycle facilities. Two fuel
banks have been established in Russia and Kazakhstan to improve assurance of fuel supply.
6.3 Developing Relationships
Russia’s Rosatom TVEL is actively pursuing licensing of fuel designs and component production to
expand the range of reactors they can support. For example, they recently became a qualified supplier of
pressure tubes for CANDU reactors, a key step in becoming a CANDU fuel provider [18].
Some current Rosatom TVEL customers are considering alternate sources for fuel for VVER reactors.
TVEL is reluctant to license their fuel design and lose their current monopoly, so other fuel vendors have
instead had to develop and test their own independent fuel designs. Ukraine has been actively testing
Toshiba-Westinghouse fuel fabricated in Sweden based on a June 2000 U.S. agreement to help Ukraine
reduce their dependence on Russia [86]. The lengthy process of proving the fuel via lead test assemblies
and partial cores started in 2003 and is finally winding down, with Ukraine expected to soon expand the
use of Westinghouse fuel to additional Russian-designed reactors [87]. Finland operated a similar
qualification program with Westinghouse fuel fabricated in the UK used in batch quantities from 2001-
2007.
The European Union rules require all power plants to have more than one fuel supplier in the long term
[88, 89], and has funded a program to establish security of supply (e.g. a second supplier) for Russian-
designed reactors in the EU [90], which includes Bulgaria, Czech Republic, Finland, Hungary, and
Slovakia. Members of the Slovak Parliament have also expressed interest in diversifying their fuel supply
away from Rosatom, but again significant testing will be required [91].
Rosatom is offering a “build, own, operate” (BOO) arrangement for new reactor construction which
includes supply of fuel and takeback of spent fuel. The four VVER-1200 reactors to be constructed in
Turkey are the first to be contracted under this approach.
39
7. SPECIAL TOPICS
7.1 Advanced Reactors - Generation IV potential
The development of advanced Generation IV (Gen IV) reactors is still ongoing with no commercial
products. Gen IV includes a number of reactor designs offering some combination of higher outlet
temperatures and fast neutrons. The higher outlet temperatures increase thermal efficiency and enable
more process heat applications such as synthetic fuels. The fast neutrons enable closed fuel cycles with
significantly higher resource utilization.
The main classes of Gen IV reactors are Very High Temperature Reactors, Supercritical Water-Cooled
Reactors, Molten Salt Reactors, Sodium Fast Reactors, Lead Fast Reactors, and Gas Fast Reactors.
The most progress is occurring with the sodium-cooled FBRs.
Russia has been developing the technology in steps for decades with a series of these reactors
including BOR-60, BN-350, BN-600 and the recently completed BN-800 (880 MWe) which was
connected to the grid on December 11, 2015. The final planned reactor in the series which would
be the commercial design is the BN-1200 which is indefinitely postponed past 2030 while the
BN-800 is used to improve the fuel design. The BN-800 is the first in the series to use
uranium/plutonium oxide fuel, which is a requirement for closing the fuel cycle.
India built a small test reactor in 1985, then jumped to the prototype FBR (500 MWe), which is
expected to go critical some time in 2016, operating on uranium/plutonium oxide fuel. After a
year of successful operation, plans are to then begin construction of two reactors of the final
commercial design of 600 MWe.
China has a 20 MWe experimental fast reactor that achieved first criticality in 2010. There have
been separate paths forward –
o Construction of the Chinese Demonstration Fast Reactor (1000 MWe) beginning in 2017,
followed by a 1200 MWe commercial design in 2028. This has apparently been scaled
down to the CFR600 and CFR100, following the same schedule.
o Construction of two BN-800 reactors (originally to start in 2013), per an agreement
signed with Russia in 2009. [92]
o Construction of a prototype 600 MWe traveling wave reactor with TerraPower (U.S.
company) is scheduled to begin in 2018 per an agreement signed in September 2015. [93]
France has also been developing fast reactor technology for decades and operated prototype
(Phenix) and demonstration (Super Phenix) facilities that were shut down in 2010 and 1998
respectively. France is now designing the ASTRID demonstration plant, with a construction
decision scheduled by 2019. They are also identifying the fuel cycle facilities required to provide
U-Pu MOX fuel for the reactor.
The U.S. government operated experimental fast reactors from 1951 (EBR-1) to 1994. Several
private efforts to design fast reactors are in progress, with TerraPower’s scheduled project in
China the most advanced.
Japan’s prototype fast reactor (Monju, 246 MWe) is still shut down after a 2010 fuel handling
accident until a government committee decides on a new operator for the reactor’s management
and oversight [12].
The Very High Temperature Reactor (VHTR) effort has made some progress in China. China completed
a demonstration pebble-bed high temperature reactor, HTR-10, in 2003 and now has a 210 MWe

40
demonstration project under construction, HTR-PM. Several other countries have developed designs but
none have proceeded to construction.
A large number of molten salt reactors have been proposed, particularly as the basis of small modular
reactors. None are under construction.
The remaining Gen IV concepts remain in the R&D stage. According to the 2013 update of the Gen IV
roadmap [94], Russia is carrying out design activities for both a lead-cooled (BREST-300) and a lead-
bismuth eutectic cooled (SVBR-100) fast reactor, with both expected to be in operation sometime after
2020. A decision on a supercritical water cooled reactor prototype is scheduled for 2017. The primary
design approaches are a pressure vessel concept, currently led by a EURATOM partnership and a
pressure tube concept proposed by Canada. The design for a small experimental gas-cooled fast reactor is
expected to be developed in the next 10-20 years. More information on Gen IV status is available in a
2014 special edition of Progress in Nuclear Energy [95].
7.2 Near-Term Reactors - SMR potential
The acronym SMR can stand for small modular reactor or small and medium reactor, which can be a
source of confusion. The usage seems to be evolving to standardize on the modular definition, and that is
what is used here. The World Nuclear Association defines SMRs as follows:
“Small modular reactors (SMRs) are defined as nuclear reactors generally 300MWe equivalent or
less, designed with modular technology using module factory fabrication, pursuing economies of
series production and short construction times. This definition, from the World Nuclear Association,
is closely based on those from the IAEA and the U.S. Nuclear Energy Institute.” [96]
A number of different SMR designs have been proposed and some are progressing:
China - The 210 MWe HTR under construction and just discussed as a GEN IV concept is
considered to be a modular design. China also is planning to construct two units of the 100 MWe
ACP100 integral PWR.
Russia – Construction was started in 2007 and expected to be completed in 2019 on a 70 MWe
floating plant composed of two identical 35 MWe reactor units [97]. Russian firms are also
developing a 50 MWe reactor for ice breakers, the RITM-200.
Argentina - Construction was started on a 25 MWe prototype of Argentina’s CAREM reactor in
2014. The prototype is to be followed by a larger 100-200 MWe version.
South Korea – The 90 MWe SMART integral PWR reactor received design certification in 2012.
In 2015, an MOU was signed with Saudi Arabia to construct two SMART reactors there [98] but
no construction schedule has been announced.
India – A cooperation agreement was signed with Sri Lanka in 2015 that included the possibility
of future sales of small-scale reactors [99]. Sri Lanka expressed interest in establishing 600 MWe
of nuclear capacity by 2030. The design was not specified.
U.S./Japan – GE Hitachi proposed constructing two PRISM (311 MWe) sodium fast reactors in
the UK as an option for disposing of the country’s 140 tonne plutonium stockpile [100, 101].
A number of designs have been proposed in the U.S., and two designs have received
governmental support from a cooperative grant of $452M for SMR development and licensing
support.
41
o In 2012, Gen4 Energyhh (25 MWe fast reactor), Holtec (140 MWe PWR) and NuScale
($45 MWe PWR) signed agreements with DOE to work with the Savannah River Site
and Savannah River National Laboratory to select sites for demonstrations.
o In 2013, BWXT’s mPower 180 MWe design was chosen to receive DOE funding in
design development and licensing support, but then stopped development in 2014 after
expending $111M.
o Late in 2013, in a second round of vendor design competition, NuScale was selected and
is receiving a cooperative grant to support design development and licensing for its 45
MWe design. This effort is active, with the Utah Associated Municipal Power Systems
(UAMPS) and Energy Northwest planning for a demonstration at the Idaho National
Laboratory. DOE is providing up to $217M in matching funds to support a design
certification application and licensing support to include the combined construction and
operation license. The demonstration is to be operational by 2024 [102].
o The Tennessee Valley Authority (TVA) has filed an Early Site Permit application for
SMR Deployment at their Clinch River Site, with DOE providing matching funds.
Many other SMR designs are in earlier stages of development. The IAEA published a SMR booklet
[103] describing 31 designs, including 23 water cooled reactors and 9 high temperature gas cooled
reactors. Both the IAEA [104] and the World Nuclear Association’s web page on small reactors [96] do
not provide as much technical detail as the IAEA publication, but have a wider range of concepts,
including fast reactors and molten salt reactors.
While niche applications for SMRs have been proposed, the ultimate intent of proponents is to be able to
compete with LWRs and PHWRs and other forms of electricity generation. The concept is that smaller,
simpler designs coupled with factory fabrication will result in much faster construction, lower lifecycle
costs, and easier financing. SMRs may also be available to a broader market than large reactors due to
the smaller amount of capital that must be financed. However, smaller reactor cores are less efficient
with more neutron leakage and require higher enrichment to achieve the same fuel burn-up. The number
of reactor operators, security personnel and other staffing requirements per MWe of capacity are also
higher. These differences are small, but add up, and explain why the trend over the last half century has
been to ever larger reactors in multi-unit plants. The as yet unproven design and fabrication efficiencies
and lower per-facility financing costs must overcome these negatives.
Many countries with smaller grids have expressed interest in some type of SMRs, but the technology
needs to be demonstrated and cost efficiencies proven to be able to overcome the impacts of loss of
economies of scale before any significant market is expected to develop.
On March 17, the UK government announced an SMR competition. The objective of the initial phase of
the competition is “to gauge market interest among technology developers, utilities, potential investors,
and funders in developing, commercializing and financing SMRs in the UK.” The government also plans
to publish an SMR Delivery Roadmap later this year. [105]
hh Hyperion Power Generation Inc. changed their name to Gen4 Energy, Inc. on March 13, 2012.

42
8. CONCLUSIONS
This report has documented the findings of the first phase of the Global Nuclear Markets project, along
with a description of the work performed.
Extensive lists of existing and planned fuel cycle facilities and reactors under construction or planned
were developed and general relationships between suppliers and customers identified. Specific
relationship identification was limited due to a lack of publicly available information. The main sources
of facility information were often found to be slightly dated and not always in agreement, especially with
respect to the status of planned reactor projects and the capacities of existing conversion and enrichment
facilities. Efforts to validate data in these areas revealed the constantly changing nature of the
information.
The main conclusions of the work include:
Financing for a new nuclear reactor projects continue to be a significant obstacle for most
countries wanting to include nuclear in their energy mix.
o Countries like China and Russia that have the ability to offer financing terms for reactor
construction that are outside of the OECD Financing Nuclear projects guideline can have
a competitive advantage.
Reactor construction performance seems to have a major impact on where growth is occurring
and which providers are obtaining new business.
o Average construction times under 6 years in Korea and China may be contributing to
domestic growth while also providing a competitive advantage for exports by reducing
perceived project risk.
o Conversely, established vendors that are struggling to complete current projects may be
at a disadvantage for future sales, depending on customer perception of the reasons for
project delays.
Geopolitics may influence reactor projects and reactor vendor choices for smaller countries.
o Russia often has the inside track for new projects in countries with strong political ties.
o China’s initial exports are to Pakistan, which has strong trading ties with China.
Some prototype and demonstration SMRs are under construction and many others are in
development. While many countries have expressed interest in SMRs, significant commercial
orders have not yet materialized.
Some progress in fielding prototype advanced “Generation IV” reactors was observed, especially
for sodium-cooled fast reactors where Russia and India are both currently completing larger
plants. A prototype high temperature gas reactor is under construction in China.
The Fukushima accident continues to have strong repercussions within Japan, with only limited
restarts of existing reactors and lower targets for nuclear energy’s market share going forward.
o Outside of Japan, the impact of Fukushima on the reactor construction industry has been
mixed with countries with struggling programs or overall low energy demand growth
apparently impacted more than countries with thriving programs and higher energy
demand growth.
o The prolonged shutdown of reactors in Japanese reactors and slower growth globally has
had a greater impact on the fuel supply chain.
Each stage of the fuel cycle front end appears to have ample supply capacity to meet current and
near-term demand
43
o Spot prices for yellowcake, conversion and enrichment are all down significantly since
Fukushima. Some new enrichment facilities have been postponed or cancelled.
o While reactor vendor typically provide fuel for the initial years of operations for new
reactors, more fuel supplier diversification and competition is occurring for refueling of
reactors when fuel contracts come up for renewal.
o The European Union is requiring new reactors to have more than one fuel supplier in the
medium term to improve security of supply.
o Westinghouse is emerging as a second supplier of VVER fuels outside Russia.

44
REFERENCES
1. Outline History of Nuclear Energy, World Nuclear Association. http://www.world-
nuclear.org/information-library/current-and-future-generation/outline-history-of-nuclear-
energy.aspx
2. A Technology Roadmap for Generation IV Nuclear Energy Systems, Generation IV International
Forum, GIF-002-00, December 2002.
3. Nuclear Fuel Fabrication, World Nuclear Associate, http://www.world-nuclear.org/information-
library/nuclear-fuel-cycle/conversion-enrichment-and-fabrication/fuel-fabrication.aspx
4. Power Reactor Information System, International Atomic Energy Agency,
https://www.iaea.org/PRIS/home.aspx
5. Country Nuclear Power Profiles 2015 Edition, International Atomic Energy Agency, http://www-
pub.iaea.org/MTCD/Publications/PDF/CNPP2015_CD/pages/index.htm
6. Country Profiles, World Nuclear Association, http://www.world-nuclear.org/information-
library/country-profiles.aspx
7. NEI SmartBrief, http://www2.smartbrief.com/news/nei/archive.jsp
8. Hualong One joint venture officially launched, World Nuclear News, March 17, 2016.
http://www.world-nuclear-news.org/C-Hualong-One-joint-venture-officially-launched-
1703164.html
9. 2016 Top Markets Report – Civil Nuclear, International Trade Administration, U.S. Department
of Commerce, May 2016.
10. Market Competition in the Nuclear Industry, Nuclear Energy Agency, Organisation for Economic
Co-operation and Development, 2008. https://www.oecd-nea.org/ndd/pubs/2008/6246-market-
competition.pdf
11. Ontario unveils $12.8B Darlington nuclear refurbishment, CBC News, January 11, 2016.
http://www.cbc.ca/news/canada/toronto/darlington-nuclear-refurbishment-1.3395696
12. Fate of troubled Monju reactor hangs in the balance, The Japan Times, November 23, 2015.
http://www.japantimes.co.jp/news/2015/11/23/reference/fate-of-troubled-monju-reactor-hangs-in-
the-balance/
13. Advances in Small Modular Reactor Technology Developments, International Atomic Energy
Agency, 2014.
14. http://www.world-nuclear.org/information-library/nuclear-fuel-cycle/mining-of-uranium/world-
uranium-mining-production.aspx
15. Conversion and Deconversion, World Nuclear Association, http://www.world-
nuclear.org/information-library/nuclear-fuel-cycle/conversion-enrichment-and-
fabrication/conversion-and-deconversion.aspx
16. Uranium Enrichment, World Nuclear Association, http://www.world-nuclear.org/information-
library/nuclear-fuel-cycle/conversion-enrichment-and-fabrication/uranium-enrichment.aspx
17. The UX Consulting Company, LLC,
http://www.uxc.com/review/UxCPriceChart.aspx?chart=spot-swu-full
18. Summary of Rosatom’s TVEL Fuel Company economic activities in 2013, Rosatom News.
http://www.rosatom.ru/en/presscentre/news/cea55d00423e854e9681d7b32a194887

45
19. Returning spent nuclear fuel to Russia from Iran envisaged in agreements – Rosatom, TASS
Russian News Agency, April 3, 2015. http://tass.ru/en/world/787141
20. Finland approves underground nuclear waste storage plan, Reuters, November 12, 2015.
http://www.reuters.com/article/us-finland-nuclear-idUSKCN0T121120151112
21. Rosatom offers emerging nations nuclear package – paper, Reuters, May 13, 2013.
http://uk.reuters.com/article/uk-rosatom-nuclear-russia-idUKBRE94C09G20130513
22. Treaty on the Non-Proliferation of Nuclear Weapons (NPT), United National Office for
Disarmament Affairs. http://www.un.org/disarmament/WMD/Nuclear/NPT.shtml
23. Nuclear Suppliers Group. http://www.nuclearsuppliersgroup.org/en/
24. Consolidated Version of the Treaty Establishing the European Atomic Energy Community, EUR-
Lex Access to European Union law. http://eur-lex.europa.eu/legal-
content/EN/TXT/?uri=CELEX:12012A/TXT
25. 123 Agreements for Peaceful Cooperation, National Nuclear Security Administration.
http://nnsa.energy.gov/aboutus/ourprograms/nonproliferation/treatiesagreements/123agreementsf
orpeacefulcooperation
26. After a pause of four decades, India to receive nuclear fuel supply for Canada in autumn 2015,
The Economic Times, The Times of India, June 15, 2015.
http://economictimes.indiatimes.com/news/politics-and-nation/after-a-pause-of-four-decades-
india-to-receive-nuclear-fuel-supply-from-canada-in-autumn-2015/articleshow/47669676.cms
27. UAE awards nuclear fuel contracts, World Nuclear News, August 15, 2012. http://www.world-
nuclear-news.org/ENF-UAE_awards_nuclear_fuel_contracts-1508124.html
28. International Status and Prospects for Nuclear Power 2014, Board of Governors General
Conference, International Atomic Energy Agency, GOV/INF/2014/13-GC(38)/INF/6, August 4,
2014.
29. Emerging Nuclear Energy Countries, World Nuclear Organization, http://www.world-
nuclear.org/information-library/country-profiles/others/emerging-nuclear-energy-countries.aspx
30. MHI Export Experiences, https://www.mhi-global.com/ee/nuclear/global/record.html
31. Turkey ratifies agreement for new plant at Sinop, World Nuclear News, April 2, 2015.
http://www.world-nuclear-news.org/NN-Turkey-ratifies-agreement-for-new-plant-at-Sinop-
02041502.html
32. Cooperation Agreement between SNPTC and NECSA Signed under the Witness of Zi Jinping
and Jacob Zuma, SPIC Photo News, December 4, 2015.
http://eng.spic.com.cn/NewsCenter/PhotoNews/201512/t20151209_257136.htm
33. Nuclear Construction 1st Nuclear Power Plant in Turkey, Linkedin Pulse, May 4, 2015.
https://www.linkedin.com/pulse/nuclear-construction-1st-power-plant-turkey-stefania-jourdan-
cara
34. Changjiang-2 on China’s Hainan Island Connected to the Grid, World Nuclear Industry Status
Report, June 21, 2016. http://www.worldnuclearreport.org/Changjiang-2-on-China-s-Hainan-
Island-Connected-to-the-Grid.html
35. Nuclear Power in India, World Nuclear Association, updated February 26, 2016.
http://www.world-nuclear.org/information-library/country-profiles/countries-g-n/india.aspx
36. India ratifies nuclear liability convention, hopes to win foreign investment, Reuters, Feb. 4, 2016.
http://www.reuters.com/article/india-nuclear-idUSKCN0VD2J1
46
37. New power supply plan, The Korea Times, June 9, 2016.
http://www.koreatimes.co.kr/www/news/opinon/2015/06/202_180532.html
38. Hualong One selected for Argentina, World Nuclear News, February 5, 2015. http://www.world-
nuclear-news.org/NN-Hualong-One-selected-for-Argentina-0502154.html
39. New direction for UK energy policy, Press release from the Department of Energy & Climate
Change, November 18, 2015. https://www.gov.uk/government/news/new-direction-for-uk-
energy-policy
40. Nuclear Energy is Valuable, U.S. News & World Report, June 8, 2016.
http://www.usnews.com/opinion/articles/2016-06-08/stop-prioritizing-solar-and-wind-energy-
over-nuclear-power
41. (Nuclear) Power to the People, BloombergView, June 9, 2016.
http://www.bloomberg.com/view/articles/2016-06-09/-nuclear-power-to-the-people
42. Exelon Will Seek License to Run Nuclear Plant for 80 Years, Bloomberg, June 6, 2016.
http://www.bloomberg.com/news/articles/2016-06-06/exelon-said-to-seek-license-to-run-nuclear-
plant-for-80-years
43. Ontario to squeeze more life out of Pickering nuclear station, CityNews, The Canadian Press,
January 11, 2016. http://www.citynews.ca/2016/01/11/ontario-to-squeeze-more-life-out-of-
pickering-nuclear-station/
44. New French energy policy to limit nuclear, World Nuclear News, June 18, 2014.
http://www.world-nuclear-news.org/np-new-french-energy-policy-to-limit-nuclear-1806144.html
45. Japan Utilities Seen Pushing for Atomic Restarts as Reform Looms, Bloomberg Business,
February 14, 2016. http://www.bloomberg.com/news/articles/2016-02-15/japan-utilities-seen-
pushing-for-atomic-restarts-as-reform-looms
46. Japan restarts first nuclear reactor under new safety rules, Today in Energy, U.S. Energy
Information Administration, Aug. 12, 2015.
http://www.eia.gov/todayinenergy/detail.cfm?id=22472
47. Court issues surprise injunction to halt Takahama nuclear reactors, The Japanese Times, March 9,
2016. http://www.japantimes.co.jp/news/2016/03/09/national/court-issues-surprise-injunction-
halt-takahama-nuclear-reactors/
48. IEA urges Belgium to take a long-term approach to energy policy, International Energy Agency,
May 19, 2016. https://www.iea.org/newsroomandevents/pressreleases/2016/may/iea-urges-
belgium-to-take-a-long-term-approach-to-energy-policy-.html
49. In turnaround, Sweden agrees to continue nuclear power, Agence France-Presse, June 10, 2016.
http://www.globalpost.com/article/6775437/2016/06/10/turnaround-sweden-agrees-continue-
nuclear-power
50. NPPs under construction in foreign counties, Rosatom, accessed March 19, 2016.
http://www.rosatom.ru/en/areas_of_activity/npp_design_engineering_construction/npps_under_c
onstruction_in_foreign_countries/ , Projects, Rosatom, accessed June 23, 2016.
http://www.rosatom.ru/en/investors/projects/
51. The Arrangement on Export Credits, Organisation for Economic Co-operation and Development.
http://www.oecd.org/trade/xcred/arrangement.htm
52. Financial solution (within Rosatom’s integrated offer), Rosatom web site.
http://www.rosatom.ru/en/areas_of_activity/additional_service_offerings/financial_solution/
http://www.globalpost.com/article/6775437/2016/06/10/turnaround-sweden-agrees-continue-nuclear-power
47
53. “Survival of the fittest? World’s major nuclear builders are in for a long stretch in the red”, The
Bellona Foundation. http://bellona.org/news/nuclear-issues/2015-05-survival-fittest-worlds-
major-nuclear-builders-long-stretch-red
54. EDF, AREVA agree reactor business worth around 2.5 B euro: sources. Reuters, Jan 13, 2016.
http://www.reuters.com/article/us-areva-edf-idUSKCN0UR2RF20160113
55. EDF signs preliminary deal to build six nuclear plants in India, Reuters, Jan. 26, 2016.
http://in.reuters.com/article/edf-india-nuclear-idINKCN0V41Q0
56. China’s Coming Mass Layoffs: Past as Prologue? The Diplomat, March 3, 2016.
http://thediplomat.com/2016/03/chinas-coming-mass-layoffs-past-as-prologue/
57. Nuclear Power in Czech Republic, Country Profiles, World Nuclear Association, updated January
2016. http://www.world-nuclear.org/information-library/country-profiles/countries-a-f/czech-
republic.aspx
58. Money issues key to new builds in Czech Republic and South Africa, Neutron Bytes, blog posted
May 24, 2015. http://neutronbytes.com/2015/05/24/money-issues-key-to-new-builds-in-czech-
republic-and-south-africa/
59. Westinghouse fuel assemblies arrive at Zaporozhe plant, World Nuclear News, Feb. 24, 2016.
http://www.world-nuclear-news.org/UF-Westinghouse-fuel-assemblies-arrive-at-Zaporozhe-
plant-24021601.html
60. Expanding Primary Uranium Production: A Medium-Term Assessment, R. Eggert, A. Gilmore,
and E. Segal, Division of Economics and Business, Colorado School of Mines, Revision 1, April
1, 2011.
61. Russia-India sign $700mln in nuclear fuel deals, Reuters, February 12, 2009.
http://in.reuters.com/article/idINIndia-37956420090212
62. Kazakhstan and India sign nuclear cooperation accord, World Nuclear News, January 26, 2009.
http://www.world-nuclear-news.org/newsarticle.aspx?id=24507
63. India, Kazakhstan to carry forward civil nuclear cooperation beyond 2014, The Economic Times,
The Times of India, March 5, 2013. http://articles.economictimes.indiatimes.com/2013-03-
05/news/37469802_1_kazatomprom-india-and-kazakhstan-kazakh-counterpart
64. Australia and India sign bilateral, World Nuclear News, September 8, 2014. http://www.world-
nuclear-news.org/NP-Australia-and-India-sign-bilateral-0809147.html
65. Russia and India ready to trade, World Nuclear News, December 5, 2008. http://www.world-
nuclear-news.org/NP_Russia_and_India_to_trade_0512082.html
66. World Nuclear Power Reactors & Uranium Requirements, World Nuclear Association.
http://www.world-nuclear.org/information-library/facts-and-figures/world-nuclear-power-
reactors-and-uranium-requireme.aspx
67. China’s uranium Enrichment Capacity – Rapid Expansion to Meet Commercial Needs, H. Zhang,
Belfer Center for Science and International Affairs, Harvard University, August 2015.
68. Uranium Enrichment, World Nuclear Association. http://www.world-nuclear.org/information-
library/nuclear-fuel-cycle/conversion-enrichment-and-fabrication/uranium-enrichment.aspx
69. Company Profile, TENEX, Rosatom State Corporation Company.
http://www.rosatom.ru/wps/wcm/connect/tenex/site_eng/company/
70. Update 2 – Russia, Japan seek to bolster economic ties, Reuters, May 12, 2009.
http://uk.reuters.com/article/russia-japan-idUKT15134120090512
48
71. Russia, U.S. ink uranium enrichment pact for 2013-2022, Sputnik International, December 21,
2012. http://sputniknews.com/russia/20111221/170411168.html
72. Uranium shipment signals end of U.S. – Russian nuclear deal, Reuters, November 14, 2013.
http://uk.reuters.com/article/uk-russia-usa-nuclear-idUKBRE9AD14Q20131114
73. URENCO’s Customers, URENCO. http://www.urenco.com/about-us/business-activity/urencos-
customers/
74. Heavy Water: A Manufacturers’ Guide for the Hydrogen Century, A.I. Miller, Atomic Energy of
Canada, Canadian Nuclear Society Bulletin, vol. 22, no. 1, February, 2001. https://cns-
snc.ca/media/Bulletin/A_Miller_Heavy_Water.pdf
75. “The TVEL Fuel Company of Rosatom Creating Future Today”, TVEL nuclear fuel brochure.
http://www.tvel.ru/wps/wcm/connect/tvel/tvelsite.eng/resources/b0138d8040dca2c18c70fe60489
32ed2/2_Brochure_nuclear_ENG.pdf?MOD=AJPERES&CONVERT_TO=url&CACHEID=b013
8d8040dca2c18c70fe6048932ed2
76. Russia-Ukraine talks on nuclear fuel supplies near completion, Sputnik International, January 22,
2009. http://sputniknews.com/business/20090122/119755215.html
77. More Westinghouse fuel for Ukraine, World Nuclear News, April 11, 2014. http://world-nuclear-
news.org/ENF-More-Westinghouse-fuel-for-Ukraine-1104144.html
78. Westinghouse signs deals for China nuclear plants, Reuters, January 18, 2011.
http://af.reuters.com/article/energyOilNews/idAFWNA906820110118
79. Westinghouse reaches deal in South Africa, Pittsburgh Business Times, March 12, 2013.
http://www.bizjournals.com/pittsburgh/blog/morning-edition/2013/03/westinghouse-reaches-
deal-in-south.html
80. Westinghouse and EDF sign long-term fuel contract, World Nuclear News, December 18, 2014.
http://www.world-nuclear-news.org/ENF-Westinghouse-and-EDF-sign-long-term-fuel-contract-
18121401.html
81. Diversification of the VVER Fuel Market in Eastern Europe and Ukraine, M. Kirst et al, atw Vol.
60, Issue 3, March 2015. http://www.kernenergie.de/kernenergie-wAssets/docs/fachzeitschrift-
atw/2015/atw2015_03_kirst_vver_fuel.pdf
82. UK considers options for unreprocessed foreign fuel, World Nuclear News, http://www.world-
nuclear-news.org/WR-UK-considers-options-for-unreprocessed-foreign-fuel-0403144.html
83. “New vision on development of nuclear energy generation of Ukraine”, O. Godum, National
Nuclear Energy Generating Company ENERGOATOM, presentation at the Dialogue Forum on
Roadmaps for a Transition to Globally Sustainable Nuclear Energy System, IAEA, Vienna,
Austria, October 2015.
84. Rostechnadzor outlines used fuel targets, World Nuclear News, September 26, 2014,
http://www.world-nuclear-news.org/WR-Rostechnadzor-outlines-used-fuel-targets-
26091401.html
85. Drivers and Impediments for Regional Cooperation on the Way to Sustainable Nuclear Energy
Systems, INPRO Dialogue Forum 8, Vienna International Centre, July 30-August 3, 2012.
86. Ukraine Nuclear Fuel Cycle Chronology, Nuclear Threat Initiative, last updated April 2005.
http://www.nti.org/media/pdfs/ukraine_nuclear_fuel_cycle.pdf?_=1317248570
87. Westinghouse fuel assemblies arrive at Zaporozhe plant, World Nuclear News, February 24,
2016. http://www.world-nuclear-news.org/UF-Westinghouse-fuel-assemblies-arrive-at-
Zaporozhe-plant-24021601.html

49
88. Euratom approves Paks II fuel supply contract, World Nuclear News, April 21, 2015.
http://www.world-nuclear-news.org/UF-Euratom-approves-Paks-II-fuel-supply-contract-
21041501.html
89. The Energy Union on track to deliver, Euratom Supply Agency, Nuclear News Digest, November
2015. http://ec.europa.eu/euratom/observatory_news.html
90. Westinghouse-Led Group Wins EU Backing to Diversity Nuclear Fuel Supply to VVER
Reactors, Westinghouse Electric Company, June 29, 2015.
http://www.westinghousenuclear.com/About/News/View/Westinghouse-led-Group-Wins-EU-
Backing-to-Diversify-Nuclear-Fuel-Supply-to-VVER-Reactors
91. Slovak regulators skeptical on calls for fuel diversification, Atominfo.ru, January 11, 2015.
http://www.atominfo.ru/en/news4/d0335.htm
92. China signs up Russian fast reactors, World Nuclear News, October 15, 2009. http://www.world-
nuclear-news.org/NN_China_signs_up_Russian_fast_reactors_1510091.html
93. TerraPower, CNNC team up on travelling wave reactor, World Nuclear News, September 25,
2015. http://www.world-nuclear-news.org/NN-TerraPower-CNNC-team-up-on-travelling-wave-
reactor-25091501.html
94. Technology Roadmap Update for Generation IV Nuclear Energy Systems, issued by the OECD
Nuclear Energy Agency for the Generation IV International Forum, January, 2014.
https://www.gen-4.org/gif/upload/docs/application/pdf/2014-03/gif-tru2014.pdf
95. Special Section on Status of Generation IV Reactor Development, Progress in Nuclear Energy,
Volume 77, pages 1-420, November 2014.
http://www.sciencedirect.com/science/journal/01491970/77
96. Small Nuclear Power Reactors, Information Library, World Nuclear Association.
http://www.world-nuclear.org/information-library/nuclear-fuel-cycle/nuclear-power-
reactors/small-nuclear-power-reactors.aspx
97. Russian floating nuclear power plant’s port to cost $78.5 million, Bellona, January 14, 2016.
http://bellona.org/news/nuclear-issues/nuclear-russia/2016-01-russian-floating-nuclear-power-
plants-port-to-cost-58-million
98. Saudi Arabia teams up with Korea on SMART, World Nuclear News, March 4, 2015.
http://www.world-nuclear-news.org/NN-Saudi-Arabia-teams-up-with-Korea-on-SMART-
0403154.html
99. India seals nuclear energy pact with Sri Lanka, hopes to push back Chinese influence, Reuters,
February 16, 2015. http://www.reuters.com/article/us-india-sri-lanka-
idUSKBN0LK0Y520150216
100. GE Hitachi backs PRISM to solve UK’s nuclear waste problem, businessGreen, February 24,
2014. http://www.businessgreen.com/bg/feature/2330280/ge-hitachi-backs-prism-to-solve-uks-
nuclear-waste-problem
101. PRISM: Technology to Power and Secure our Energy Future, GE-Hitachi.
http://gehitachiprism.com/
102. NuScale SMR licensing schedule outlined, World Nuclear News, July 2, 2015.
http://www.world-nuclear-news.org/NN-NuScale-SMR-licensing-schedule-outlined-
0207157.html
50
103. Advances in Small Modular Reactor Technology Developments, A Supplement to: IAEA
Advanced Reactors Information System (ARES), International Atomic Energy Agency,
September 2014.
104. Small and Medium Sized Reactor (SMRs) Development, Assessment and Deployment,
International Atomic Energy Agency. https://www.iaea.org/NuclearPower/SMR/
105. UK government launches SMR competition, World Nuclear News, March 18, 2016.
http://www.world-nuclear-news.org/NN-UK-government-launches-SMR-competition-
1803165.html
106. Number of nuclear reactors operable and under construction, World Nuclear Association,
http://www.world-nuclear.org/nuclear-basics/global-number-of-nuclear-reactors.aspx
107. Lithuania shuts Ignalina plant, World Nuclear News, January 4, 2010. http://www.world-
nuclear-news.org/NP-Lithuania_shuts_Ignalina_plant-0401104.html
108. Kudankulam units achieve construction and operation milestones, World Nuclear News, July
16, 2015. http://www.world-nuclear-news.org/RS-Kudankulam-units-achieve-construction-and-
operation-milestones-16071501.html
51
Appendix A – Additional Information
A-1. Overview of the Nuclear Fuel Cycle
The nuclear fuel cycle includes:
Mining and milling of uranium to produce uranium oxide “yellowcake” (U3O8) for nuclear fuel,
with the “natural” uranium having an isotopic content of ~99.29% 238U, ~0.71% 235Uii, and a trace
of 234U.
Conversion of yellowcake into either uranium hexafluoride (UF6) for enrichment or to uranium
oxide (UO3) for use in unenriched fueljj
Enrichment of uranium hexafluoride to increase the amount of the isotope 235U, resulting in a
“low enriched uranium” (LEU) product with a 235U content of typically 3-5%, and a “depleted
uranium” (DU) byproductkk with a 235U content of typically 0.2-0.3%
Fabrication of nuclear fuel assemblies, including conversion of enriched UF6 (or unenriched UO3)
to UO2, making fuel pellets, placing the pellets inside cladding tubes to form fuel rods, and
arraying the fuel rods along with grid spacers and end caps into a fuel assembly.
Loading batches of fuel assemblies into nuclear reactors and obtaining a controlled nuclear chain
reaction in the reactor core to generate heat used to turn steam or gas turbines linked to electrical
generators
Unloading batches of “spent” used fuel assemblies and placing them in storage
Either disposing of the used fuel in a geologic repository or “reprocessing” it to recycle usable
fuel materials and then disposing of the high level waste generated by reprocessing
A-2. Data Collection Challenges and Gaps
Much of the effort documented in this report has involved accessing material developed by organizations
such as IAEA and WNA with much larger budgets, dedicated staff, and established relationships with
information originators.
One issue with the gathered information was inconsistency in how information was reported. The
primary sources are aware of this issue, with differences in what is considered to be the start and end of
construction, how to report construction projects that are suspended, and even in how to report operating
reactors with suspended operations, as described by WNA [106]:
“For example, the Monju reactor in Japan generated electricity for a short time in 1994 and again in
2010. Some organizations consider that Monju entered full operation and is current in a period of
long-term shutdown. Others consider that it is still under construction. Also in Japan, although many
ii The isotope 235U is the only isotope in nature that is “fissile”, meaning that it can maintain a fission chain reaction. A fission
chain reaction occurs when a heavy isotope interacts with a neutron and splits into two or more lighter isotopes plus one or
more neutrons while also releasing large amounts of energy.
jj Pressurized Heavy Water Reactors, like the CANDU can use unenriched uranium (0.71% 235U) or slightly enriched uranium
(~0.71 to 1.0 % 235U) as fuel. These reactors make up ~6% of the total deployed global reactor capacity.
kk There are currently only limited uses for DU, so most of it is stored pending potential future uses or disposed as a waste.
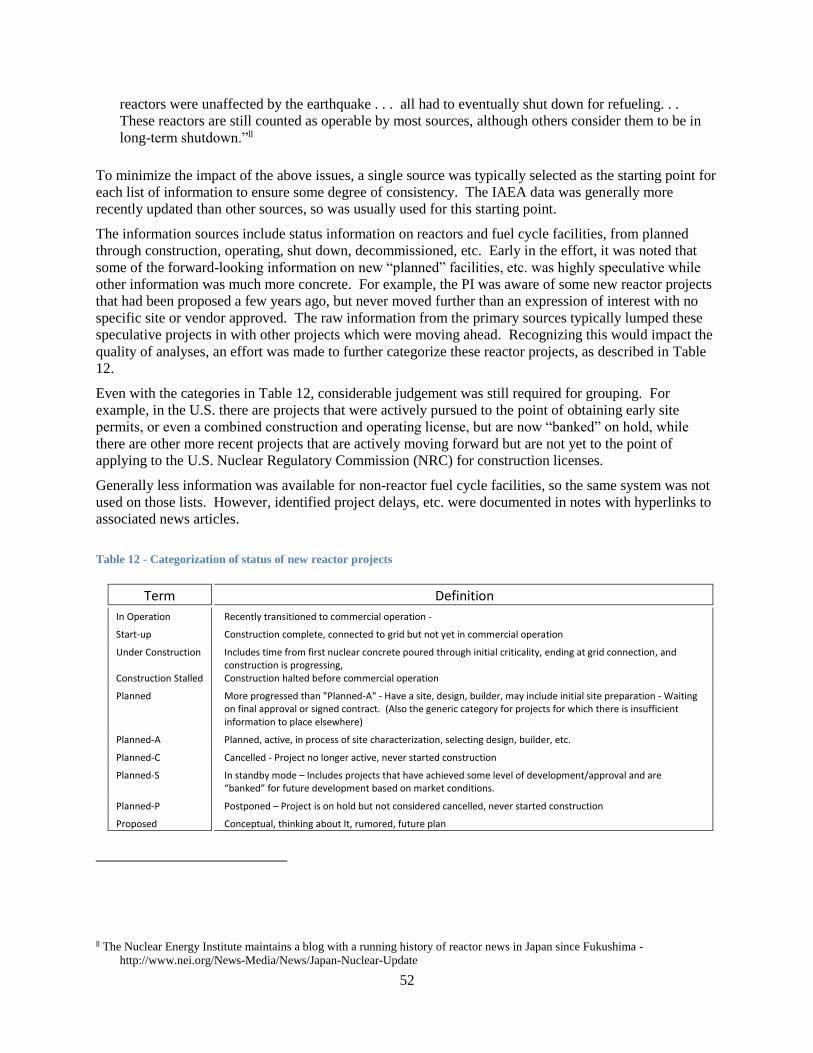
52
reactors were unaffected by the earthquake . . . all had to eventually shut down for refueling. . .
These reactors are still counted as operable by most sources, although others consider them to be in
long-term shutdown.”ll
To minimize the impact of the above issues, a single source was typically selected as the starting point for
each list of information to ensure some degree of consistency. The IAEA data was generally more
recently updated than other sources, so was usually used for this starting point.
The information sources include status information on reactors and fuel cycle facilities, from planned
through construction, operating, shut down, decommissioned, etc. Early in the effort, it was noted that
some of the forward-looking information on new “planned” facilities, etc. was highly speculative while
other information was much more concrete. For example, the PI was aware of some new reactor projects
that had been proposed a few years ago, but never moved further than an expression of interest with no
specific site or vendor approved. The raw information from the primary sources typically lumped these
speculative projects in with other projects which were moving ahead. Recognizing this would impact the
quality of analyses, an effort was made to further categorize these reactor projects, as described in Table
12.
Even with the categories in Table 12, considerable judgement was still required for grouping. For
example, in the U.S. there are projects that were actively pursued to the point of obtaining early site
permits, or even a combined construction and operating license, but are now “banked” on hold, while
there are other more recent projects that are actively moving forward but are not yet to the point of
applying to the U.S. Nuclear Regulatory Commission (NRC) for construction licenses.
Generally less information was available for non-reactor fuel cycle facilities, so the same system was not
used on those lists. However, identified project delays, etc. were documented in notes with hyperlinks to
associated news articles.
Table 12 - Categorization of status of new reactor projects
Term Definition
In Operation Recently transitioned to commercial operation -
Start-up Construction complete, connected to grid but not yet in commercial operation
Under Construction Construction Stalled
Includes time from first nuclear concrete poured through initial criticality, ending at grid connection, and construction is progressing, Construction halted before commercial operation
Planned More progressed than "Planned-A" - Have a site, design, builder, may include initial site preparation - Waiting on final approval or signed contract. (Also the generic category for projects for which there is insufficient information to place elsewhere)
Planned-A Planned, active, in process of site characterization, selecting design, builder, etc.
Planned-C Cancelled - Project no longer active, never started construction
Planned-S In standby mode – Includes projects that have achieved some level of development/approval and are “banked” for future development based on market conditions.
Planned-P Postponed – Project is on hold but not considered cancelled, never started construction
Proposed Conceptual, thinking about It, rumored, future plan
ll The Nuclear Energy Institute maintains a blog with a running history of reactor news in Japan since Fukushima -
http://www.nei.org/News-Media/News/Japan-Nuclear-Update
53
Naming was another difficulty encountered. This took two forms. First, foreign names for sites and
companies sometimes varied in spelling in the literature. An effort was made to confirm site names
through map searches when two very similar names were encountered to determine if they were alternate
spellings of the same name or actually different places/entities. Second, some site names were discovered
to be reused, especially when a previous project at a site failed but a new proposed project was benefiting
from the previous site characterization work. These were harder to identify, and required trying to
determine if the reactor design or size had changed (likely a new project) or if it was only a change in the
company performing construction (likely a restart of a stalled project).
Very little quantitative information was found for fuel services. Typically, news articles only indicated
agreements had been reached to provide uranium, fuel fabrication, etc. to a country and possibly a
company or a specific reactor plant, without duration or quantity information or specification of the
source facilities. This made it very difficult to match suppliers and users for fuel services. An analysis of
the total global fuel requirements indicated there is significantly more capacity in currently operating
fabrication facilities than needed. Supply and demand for the fuel cycle stages is discussed in more detail
in the body of the report.
It was soon determined that the main supplier companies often set up subsidiaries within buyer countries.
These subsidiaries may be jointly owned with a domestic partner. The subsidiaries may be formed as
soon as a supplier develops an interest in the target country’s market (which may not even exist yet). If
successful progress is achieved, the original subsidiary may be continued or replaced with a new
subsidiary with possibly new or different partners. These arrangements often made it difficult to trace
which local company is doing what, so it became much easier to just track the parent company (e.g.
AREVA, Rosatom). An effort was made in the project spreadsheet to develop a listing of parent
companies and subsidiary owners for all fuel cycle facilities with an emphasis on operating facilities and
facilities under construction, but it was not fully populated. It is estimated to be ~70% complete and more
than 90% complete for the major foreign suppliers. The information includes the parent, owner, operator,
and up to three joint venture partners per facility.
The OneNote project file and the project facilities and suppliers spreadsheet are both best described as “in
progress” rather than final products. While significant information is included in a searchable and
filterable format, the validation continues to be an ongoing effort along with information updating based
on new market developments.
A-3. Historic Reactor Market Patterns
The reactor construction market has been driven by four historic themes. These historic themes are
important in understanding current market behaviors and the drivers behind shifts in market leadership.
1. Worsening Construction Performance and Waning Public Support – A number of western
countries stopped developing their nuclear power programs in the ~1980-1990 timeframe due to
the interrelated issues of construction delays and cost overruns, declining public support, and
safety concerns. While reactor operators also significantly improved operational performance
over the same period, this did not seem to impact public opinion.
2. Major Geopolicital Event - The political turmoil and negative economic growth in the breakup
of the Soviet Union and its Eastern European dependents placed many nuclear power projects in
limbo. Russia has recovered sufficiently to resume domestic projects at a reduced pace. Projects
to complete reactors in former Soviet bloc countries have varied based on the availability of
financing and changing political alignments and interests.
54
3. Consistent/Improving Construction Performance – Larger nuclear power programs in Asia
exhibited a pattern of consistent performance, not experiencing the growing construction delays
of their western counterparts.
4. Rapid Growth and Diversification – More recently, developing countries with rapid energy
demand growth and an associated desire to diversify their energy mix have initiated or are
considering nuclear energy programs.
Figure 2 shows the historic reactor construction performance in fourteen countries with significant reactor
fleets based on historic reactor construction data. Note that projects finished after 2010 and current
projects in progress are not shown, so these graphs do not show current market conditions. They also do
not include any impacts of the Fukushima accident.
Belgium, Canada, France, Germany, Spain, Sweden, the UK and the U.S. all fall under the first theme
above, exhibited by generally increasing construction time before new projects stopped due to a negative
feedback loop where poor construction performance and waning public opinion feed off each other. The
timing of the three major reactor accidents has also contributed by giving the feedback loop a push at the
worst times. In Italy, campaigning on a referendum to reverse the earlier phase-out of nuclear energy was
in progress when Fukushima occurred and the referendum was defeated. In the U.S. and France, public
opinion recovered sufficiently after 2000 to support resumption of construction (the nuclear renaissance),
but the combination of Fukushima and poor construction performance on the new projects risk restarting
their feedback loops too. The UK pattern is somewhat different than the others, due in part to the main
deployment being of a different reactor technology (GCRs). The UK is also now considering new
reactors, primarily as replacements for the existing fleet, but using PWRs and possible SMRs.
Russia and Ukraine exhibit the second theme of a major event impacting the nuclear power program. In
this case, members of the former Soviet Union were experiencing generally good construction
performancemm followed by a very sharp increase in construction durationnn and a stoppage of new
projects when the Soviet Union disbanded. The driving event was not related to nuclear power, but the
resulting political and economic impacts sharply reduced the ability to finance and execute major
construction programs while also reducing energy demand. The impacts of the triggering event needed to
be worked through before recovery could occur. In the timeframe graphed, only Russia shows
resumption of construction as its economy recovered, though Ukraine also has plans for new reactors.
The limited construction in both cases is primarily for replacement reactors.
The third group, composed of India, Japan and South Korea, shows no significant change in construction
duration or a general downward trend with no major gapsoo but the timeframe does not include post-
Fukushima. This pattern should be compared to the first group. Current performance in Japan is not part
of this pattern and Japan going forward is more likely to shift to the pattern of the first or second groups
due to (1) worsening public opinion and safety concerns and (2) a major program disruptive event.
China is the only representative of the fourth theme shownpp. The pattern includes a sharp increase in the
number of new constructions with generally consistent or improving construction durations.
mm Bulgaria is an exception with reactor construction projects trending more like the West.
nn To display all graphs on the same scale, one Russian project started in 1986 with a duration of 303 months is not shown.
oo The high outlier in 2002 on the India graph is their first large LWR (a VVER) and first foreign vendor (Russia) since the
1960s.
pp The high outlier in 2000 on the China graph is the China Experimental Fast Reactor.
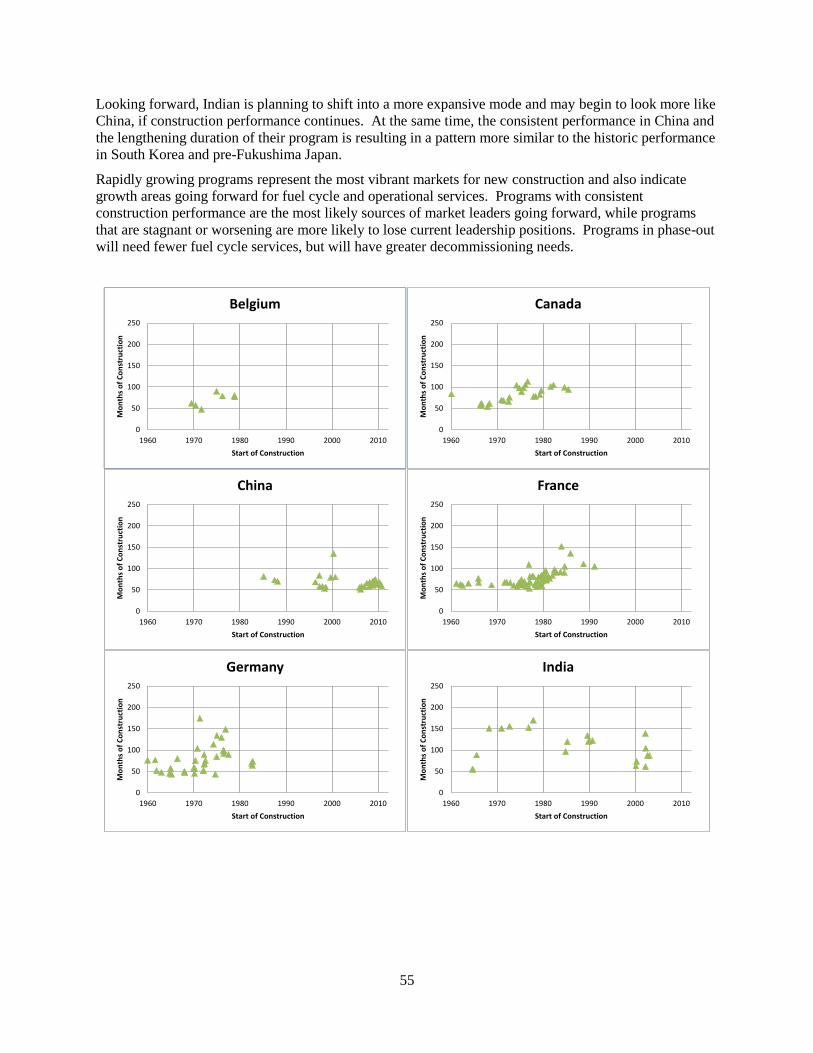
55
Looking forward, Indian is planning to shift into a more expansive mode and may begin to look more like
China, if construction performance continues. At the same time, the consistent performance in China and
the lengthening duration of their program is resulting in a pattern more similar to the historic performance
in South Korea and pre-Fukushima Japan.
Rapidly growing programs represent the most vibrant markets for new construction and also indicate
growth areas going forward for fuel cycle and operational services. Programs with consistent
construction performance are the most likely sources of market leaders going forward, while programs
that are stagnant or worsening are more likely to lose current leadership positions. Programs in phase-out
will need fewer fuel cycle services, but will have greater decommissioning needs.
0
50
100
150
200
250
1960 1970 1980 1990 2000 2010
Mo
nth
s o
f C
on
stru
ctio
n
Start of Construction
Belgium
0
50
100
150
200
250
1960 1970 1980 1990 2000 2010
Mo
nth
s o
f C
on
stru
ctio
n
Start of Construction
Canada
0
50
100
150
200
250
1960 1970 1980 1990 2000 2010
Mo
nth
s o
f C
on
stru
ctio
n
Start of Construction
China
0
50
100
150
200
250
1960 1970 1980 1990 2000 2010
Mo
nth
s o
f C
on
stru
ctio
n
Start of Construction
France
0
50
100
150
200
250
1960 1970 1980 1990 2000 2010
Mo
nth
s o
f C
on
stru
ctio
n
Start of Construction
Germany
0
50
100
150
200
250
1960 1970 1980 1990 2000 2010
Mo
nth
s o
f C
on
stru
ctio
n
Start of Construction
India

56
Figure 2 - Reactor construction start year versus duration in fourteen countries
0
50
100
150
200
250
1960 1970 1980 1990 2000 2010
Mo
nth
s o
f C
on
stru
ctio
n
Start of Construction
Japan
0
50
100
150
200
250
1960 1970 1980 1990 2000 2010
Mo
nth
s o
f C
on
stru
ctio
n
Start of Construction
S. Korea
0
50
100
150
200
250
1960 1970 1980 1990 2000 2010
Mo
nth
s o
f C
on
stru
ctio
n
Start of Construction
Russia
0
50
100
150
200
250
1960 1970 1980 1990 2000 2010M
on
ths
of
Co
nst
ruct
ion
Start of Construction
Spain
0
50
100
150
200
250
1960 1970 1980 1990 2000 2010
Mo
nth
s o
f C
on
stru
ctio
n
Start of Construction
Sweden
0
50
100
150
200
250
1960 1970 1980 1990 2000 2010
Mo
nth
s o
f C
on
stru
ctio
n
Start of Construction
United Kingdom
0
50
100
150
200
250
1960 1970 1980 1990 2000 2010
Mo
nth
s o
f C
on
stru
ctio
n
Start of Construction
Ukraine
0
50
100
150
200
250
1960 1970 1980 1990 2000 2010
Mo
nth
s o
f C
on
stru
ctio
n
Start of Construction
United States
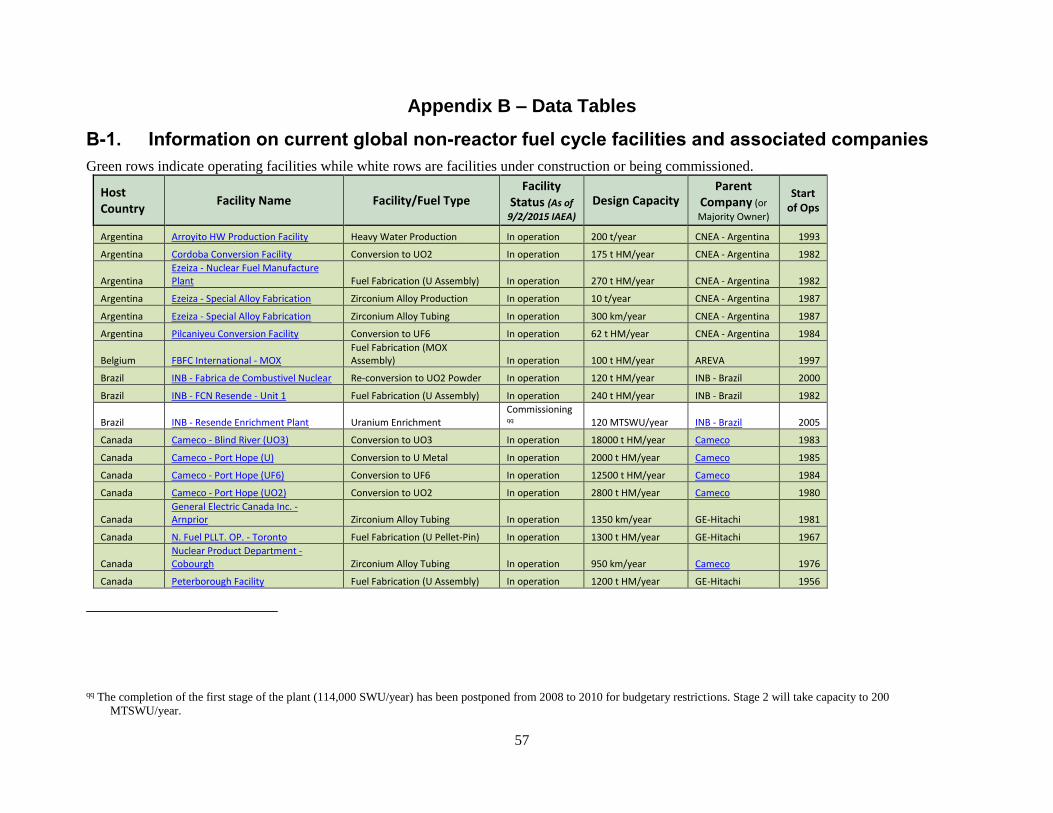
57
Appendix B – Data Tables
B-1. Information on current global non-reactor fuel cycle facilities and associated companies
Green rows indicate operating facilities while white rows are facilities under construction or being commissioned.
Host Country
Facility Name Facility/Fuel Type Facility
Status (As of
9/2/2015 IAEA) Design Capacity
Parent Company (or
Majority Owner)
Start of Ops
Argentina Arroyito HW Production Facility Heavy Water Production In operation 200 t/year CNEA - Argentina 1993
Argentina Cordoba Conversion Facility Conversion to UO2 In operation 175 t HM/year CNEA - Argentina 1982
Argentina Ezeiza - Nuclear Fuel Manufacture Plant Fuel Fabrication (U Assembly) In operation 270 t HM/year CNEA - Argentina 1982
Argentina Ezeiza - Special Alloy Fabrication Zirconium Alloy Production In operation 10 t/year CNEA - Argentina 1987
Argentina Ezeiza - Special Alloy Fabrication Zirconium Alloy Tubing In operation 300 km/year CNEA - Argentina 1987
Argentina Pilcaniyeu Conversion Facility Conversion to UF6 In operation 62 t HM/year CNEA - Argentina 1984
Belgium FBFC International - MOX
Fuel Fabrication (MOX Assembly) In operation 100 t HM/year AREVA 1997
Brazil INB - Fabrica de Combustivel Nuclear Re-conversion to UO2 Powder In operation 120 t HM/year INB - Brazil 2000
Brazil INB - FCN Resende - Unit 1 Fuel Fabrication (U Assembly) In operation 240 t HM/year INB - Brazil 1982
Brazil INB - Resende Enrichment Plant Uranium Enrichment Commissioningqq 120 MTSWU/year INB - Brazil 2005
Canada Cameco - Blind River (UO3) Conversion to UO3 In operation 18000 t HM/year Cameco 1983
Canada Cameco - Port Hope (U) Conversion to U Metal In operation 2000 t HM/year Cameco 1985
Canada Cameco - Port Hope (UF6) Conversion to UF6 In operation 12500 t HM/year Cameco 1984
Canada Cameco - Port Hope (UO2) Conversion to UO2 In operation 2800 t HM/year Cameco 1980
Canada General Electric Canada Inc. - Arnprior Zirconium Alloy Tubing In operation 1350 km/year GE-Hitachi 1981
Canada N. Fuel PLLT. OP. - Toronto Fuel Fabrication (U Pellet-Pin) In operation 1300 t HM/year GE-Hitachi 1967
Canada Nuclear Product Department - Cobourgh Zirconium Alloy Tubing In operation 950 km/year Cameco 1976
Canada Peterborough Facility Fuel Fabrication (U Assembly) In operation 1200 t HM/year GE-Hitachi 1956
qq The completion of the first stage of the plant (114,000 SWU/year) has been postponed from 2008 to 2010 for budgetary restrictions. Stage 2 will take capacity to 200
MTSWU/year.
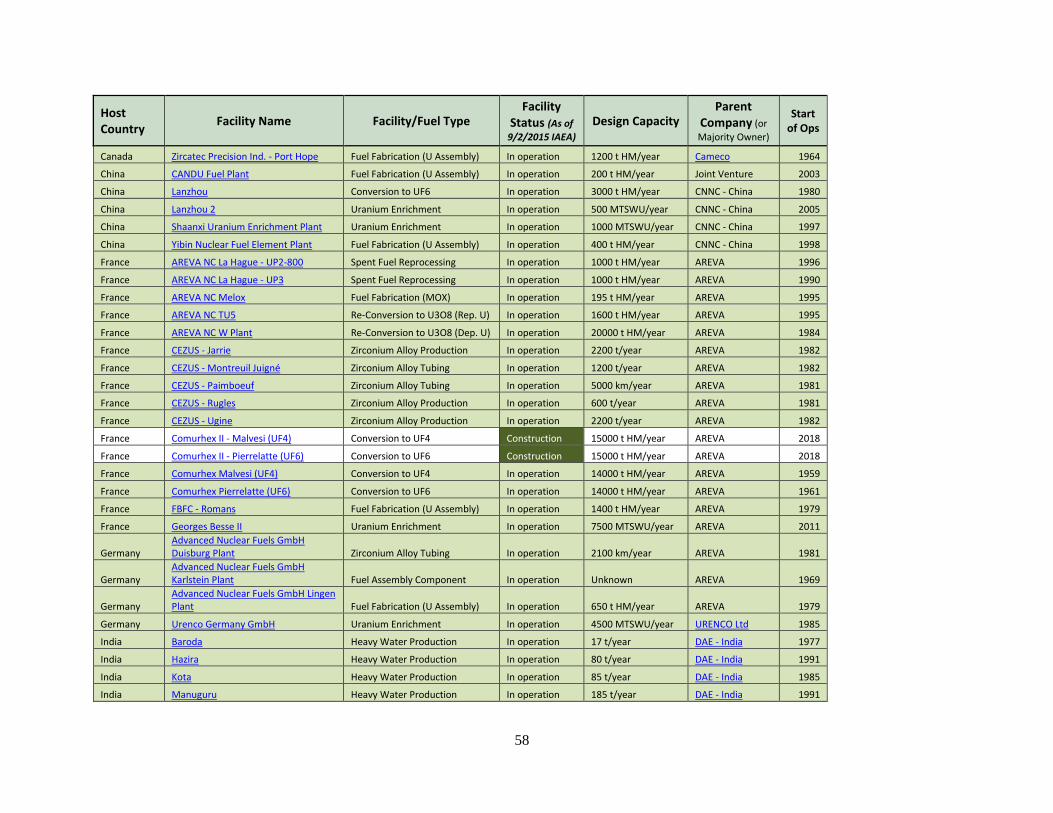
58
Host Country
Facility Name Facility/Fuel Type Facility
Status (As of
9/2/2015 IAEA) Design Capacity
Parent Company (or
Majority Owner)
Start of Ops
Canada Zircatec Precision Ind. - Port Hope Fuel Fabrication (U Assembly) In operation 1200 t HM/year Cameco 1964
China CANDU Fuel Plant Fuel Fabrication (U Assembly) In operation 200 t HM/year Joint Venture 2003
China Lanzhou Conversion to UF6 In operation 3000 t HM/year CNNC - China 1980
China Lanzhou 2 Uranium Enrichment In operation 500 MTSWU/year CNNC - China 2005
China Shaanxi Uranium Enrichment Plant Uranium Enrichment In operation 1000 MTSWU/year CNNC - China 1997
China Yibin Nuclear Fuel Element Plant Fuel Fabrication (U Assembly) In operation 400 t HM/year CNNC - China 1998
France AREVA NC La Hague - UP2-800 Spent Fuel Reprocessing In operation 1000 t HM/year AREVA 1996
France AREVA NC La Hague - UP3 Spent Fuel Reprocessing In operation 1000 t HM/year AREVA 1990
France AREVA NC Melox Fuel Fabrication (MOX) In operation 195 t HM/year AREVA 1995
France AREVA NC TU5 Re-Conversion to U3O8 (Rep. U) In operation 1600 t HM/year AREVA 1995
France AREVA NC W Plant Re-Conversion to U3O8 (Dep. U) In operation 20000 t HM/year AREVA 1984
France CEZUS - Jarrie Zirconium Alloy Production In operation 2200 t/year AREVA 1982
France CEZUS - Montreuil Juigné Zirconium Alloy Tubing In operation 1200 t/year AREVA 1982
France CEZUS - Paimboeuf Zirconium Alloy Tubing In operation 5000 km/year AREVA 1981
France CEZUS - Rugles Zirconium Alloy Production In operation 600 t/year AREVA 1981
France CEZUS - Ugine Zirconium Alloy Production In operation 2200 t/year AREVA 1982
France Comurhex II - Malvesi (UF4) Conversion to UF4 Construction 15000 t HM/year AREVA 2018
France Comurhex II - Pierrelatte (UF6) Conversion to UF6 Construction 15000 t HM/year AREVA 2018
France Comurhex Malvesi (UF4) Conversion to UF4 In operation 14000 t HM/year AREVA 1959
France Comurhex Pierrelatte (UF6) Conversion to UF6 In operation 14000 t HM/year AREVA 1961
France FBFC - Romans Fuel Fabrication (U Assembly) In operation 1400 t HM/year AREVA 1979
France Georges Besse II Uranium Enrichment In operation 7500 MTSWU/year AREVA 2011
Germany Advanced Nuclear Fuels GmbH Duisburg Plant Zirconium Alloy Tubing In operation 2100 km/year AREVA 1981
Germany Advanced Nuclear Fuels GmbH Karlstein Plant Fuel Assembly Component In operation Unknown AREVA 1969
Germany Advanced Nuclear Fuels GmbH Lingen Plant Fuel Fabrication (U Assembly) In operation 650 t HM/year AREVA 1979
Germany Urenco Germany GmbH Uranium Enrichment In operation 4500 MTSWU/year URENCO Ltd 1985
India Baroda Heavy Water Production In operation 17 t/year DAE - India 1977
India Hazira Heavy Water Production In operation 80 t/year DAE - India 1991
India Kota Heavy Water Production In operation 85 t/year DAE - India 1985
India Manuguru Heavy Water Production In operation 185 t/year DAE - India 1991
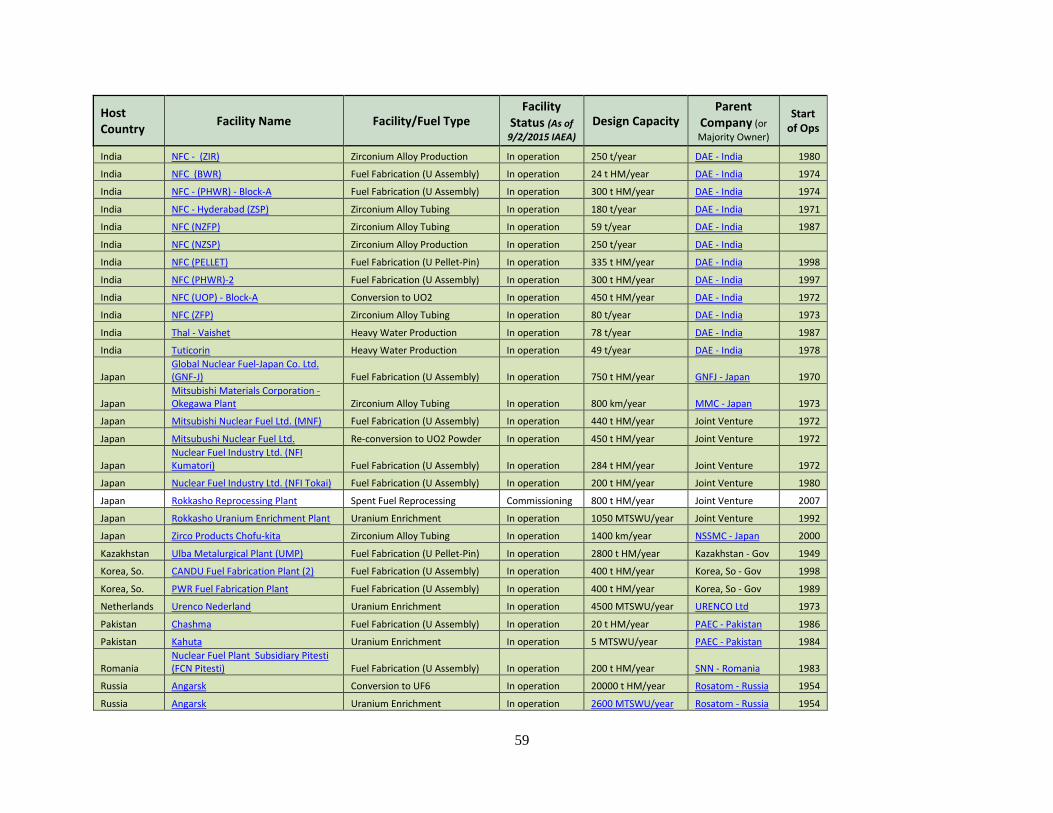
59
Host Country
Facility Name Facility/Fuel Type Facility
Status (As of
9/2/2015 IAEA) Design Capacity
Parent Company (or
Majority Owner)
Start of Ops
India NFC - (ZIR) Zirconium Alloy Production In operation 250 t/year DAE - India 1980
India NFC (BWR) Fuel Fabrication (U Assembly) In operation 24 t HM/year DAE - India 1974
India NFC - (PHWR) - Block-A Fuel Fabrication (U Assembly) In operation 300 t HM/year DAE - India 1974
India NFC - Hyderabad (ZSP) Zirconium Alloy Tubing In operation 180 t/year DAE - India 1971
India NFC (NZFP) Zirconium Alloy Tubing In operation 59 t/year DAE - India 1987
India NFC (NZSP) Zirconium Alloy Production In operation 250 t/year DAE - India
India NFC (PELLET) Fuel Fabrication (U Pellet-Pin) In operation 335 t HM/year DAE - India 1998
India NFC (PHWR)-2 Fuel Fabrication (U Assembly) In operation 300 t HM/year DAE - India 1997
India NFC (UOP) - Block-A Conversion to UO2 In operation 450 t HM/year DAE - India 1972
India NFC (ZFP) Zirconium Alloy Tubing In operation 80 t/year DAE - India 1973
India Thal - Vaishet Heavy Water Production In operation 78 t/year DAE - India 1987
India Tuticorin Heavy Water Production In operation 49 t/year DAE - India 1978
Japan Global Nuclear Fuel-Japan Co. Ltd. (GNF-J) Fuel Fabrication (U Assembly) In operation 750 t HM/year GNFJ - Japan 1970
Japan Mitsubishi Materials Corporation - Okegawa Plant Zirconium Alloy Tubing In operation 800 km/year MMC - Japan 1973
Japan Mitsubishi Nuclear Fuel Ltd. (MNF) Fuel Fabrication (U Assembly) In operation 440 t HM/year Joint Venture 1972
Japan Mitsubushi Nuclear Fuel Ltd. Re-conversion to UO2 Powder In operation 450 t HM/year Joint Venture 1972
Japan Nuclear Fuel Industry Ltd. (NFI Kumatori) Fuel Fabrication (U Assembly) In operation 284 t HM/year Joint Venture 1972
Japan Nuclear Fuel Industry Ltd. (NFI Tokai) Fuel Fabrication (U Assembly) In operation 200 t HM/year Joint Venture 1980
Japan Rokkasho Reprocessing Plant Spent Fuel Reprocessing Commissioning 800 t HM/year Joint Venture 2007
Japan Rokkasho Uranium Enrichment Plant Uranium Enrichment In operation 1050 MTSWU/year Joint Venture 1992
Japan Zirco Products Chofu-kita Zirconium Alloy Tubing In operation 1400 km/year NSSMC - Japan 2000
Kazakhstan Ulba Metalurgical Plant (UMP) Fuel Fabrication (U Pellet-Pin) In operation 2800 t HM/year Kazakhstan - Gov 1949
Korea, So. CANDU Fuel Fabrication Plant (2) Fuel Fabrication (U Assembly) In operation 400 t HM/year Korea, So - Gov 1998
Korea, So. PWR Fuel Fabrication Plant Fuel Fabrication (U Assembly) In operation 400 t HM/year Korea, So - Gov 1989
Netherlands Urenco Nederland Uranium Enrichment In operation 4500 MTSWU/year URENCO Ltd 1973
Pakistan Chashma Fuel Fabrication (U Assembly) In operation 20 t HM/year PAEC - Pakistan 1986
Pakistan Kahuta Uranium Enrichment In operation 5 MTSWU/year PAEC - Pakistan 1984
Romania Nuclear Fuel Plant Subsidiary Pitesti (FCN Pitesti) Fuel Fabrication (U Assembly) In operation 200 t HM/year SNN - Romania 1983
Russia Angarsk Conversion to UF6 In operation 20000 t HM/year Rosatom - Russia 1954
Russia Angarsk Uranium Enrichment In operation 2600 MTSWU/year Rosatom - Russia 1954
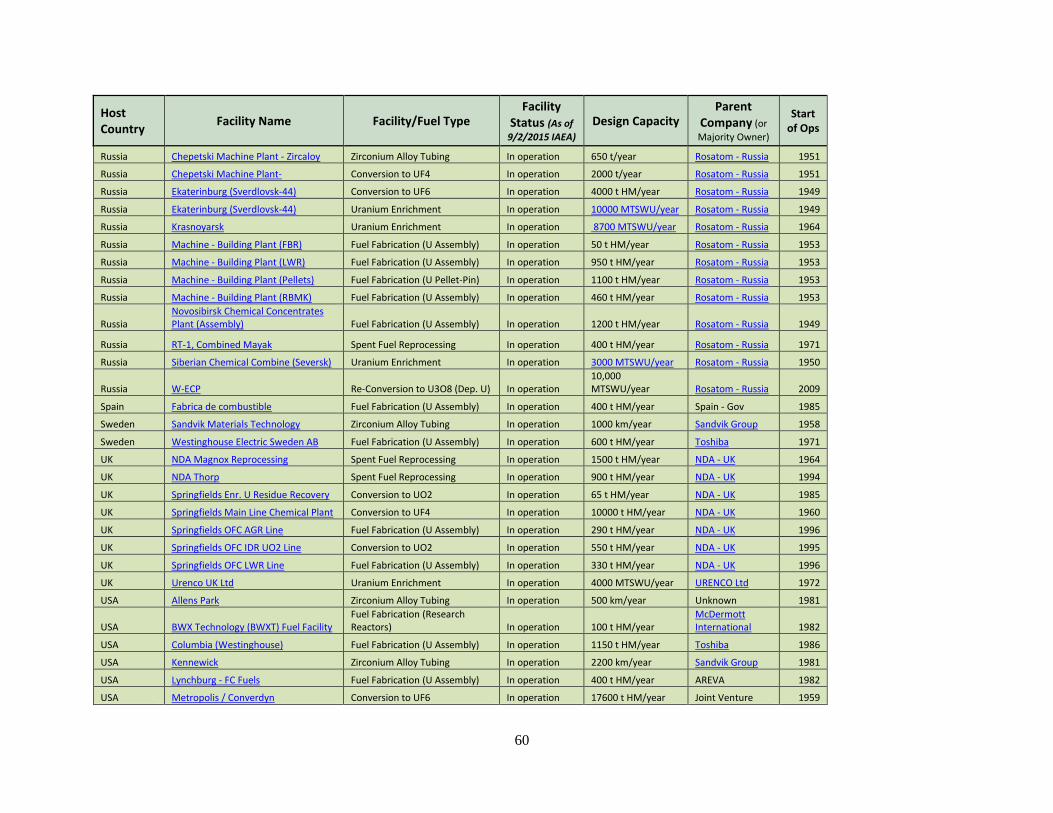
60
Host Country
Facility Name Facility/Fuel Type Facility
Status (As of
9/2/2015 IAEA) Design Capacity
Parent Company (or
Majority Owner)
Start of Ops
Russia Chepetski Machine Plant - Zircaloy Zirconium Alloy Tubing In operation 650 t/year Rosatom - Russia 1951
Russia Chepetski Machine Plant- Conversion to UF4 In operation 2000 t/year Rosatom - Russia 1951
Russia Ekaterinburg (Sverdlovsk-44) Conversion to UF6 In operation 4000 t HM/year Rosatom - Russia 1949
Russia Ekaterinburg (Sverdlovsk-44) Uranium Enrichment In operation 10000 MTSWU/year Rosatom - Russia 1949
Russia Krasnoyarsk Uranium Enrichment In operation 8700 MTSWU/year Rosatom - Russia 1964
Russia Machine - Building Plant (FBR) Fuel Fabrication (U Assembly) In operation 50 t HM/year Rosatom - Russia 1953
Russia Machine - Building Plant (LWR) Fuel Fabrication (U Assembly) In operation 950 t HM/year Rosatom - Russia 1953
Russia Machine - Building Plant (Pellets) Fuel Fabrication (U Pellet-Pin) In operation 1100 t HM/year Rosatom - Russia 1953
Russia Machine - Building Plant (RBMK) Fuel Fabrication (U Assembly) In operation 460 t HM/year Rosatom - Russia 1953
Russia Novosibirsk Chemical Concentrates Plant (Assembly) Fuel Fabrication (U Assembly) In operation 1200 t HM/year Rosatom - Russia 1949
Russia RT-1, Combined Mayak Spent Fuel Reprocessing In operation 400 t HM/year Rosatom - Russia 1971
Russia Siberian Chemical Combine (Seversk) Uranium Enrichment In operation 3000 MTSWU/year Rosatom - Russia 1950
Russia W-ECP Re-Conversion to U3O8 (Dep. U) In operation 10,000 MTSWU/year Rosatom - Russia 2009
Spain Fabrica de combustible Fuel Fabrication (U Assembly) In operation 400 t HM/year Spain - Gov 1985
Sweden Sandvik Materials Technology Zirconium Alloy Tubing In operation 1000 km/year Sandvik Group 1958
Sweden Westinghouse Electric Sweden AB Fuel Fabrication (U Assembly) In operation 600 t HM/year Toshiba 1971
UK NDA Magnox Reprocessing Spent Fuel Reprocessing In operation 1500 t HM/year NDA - UK 1964
UK NDA Thorp Spent Fuel Reprocessing In operation 900 t HM/year NDA - UK 1994
UK Springfields Enr. U Residue Recovery Conversion to UO2 In operation 65 t HM/year NDA - UK 1985
UK Springfields Main Line Chemical Plant Conversion to UF4 In operation 10000 t HM/year NDA - UK 1960
UK Springfields OFC AGR Line Fuel Fabrication (U Assembly) In operation 290 t HM/year NDA - UK 1996
UK Springfields OFC IDR UO2 Line Conversion to UO2 In operation 550 t HM/year NDA - UK 1995
UK Springfields OFC LWR Line Fuel Fabrication (U Assembly) In operation 330 t HM/year NDA - UK 1996
UK Urenco UK Ltd Uranium Enrichment In operation 4000 MTSWU/year URENCO Ltd 1972
USA Allens Park Zirconium Alloy Tubing In operation 500 km/year Unknown 1981
USA BWX Technology (BWXT) Fuel Facility
Fuel Fabrication (Research Reactors) In operation 100 t HM/year
McDermott International 1982
USA Columbia (Westinghouse) Fuel Fabrication (U Assembly) In operation 1150 t HM/year Toshiba 1986
USA Kennewick Zirconium Alloy Tubing In operation 2200 km/year Sandvik Group 1981
USA Lynchburg - FC Fuels Fuel Fabrication (U Assembly) In operation 400 t HM/year AREVA 1982
USA Metropolis / Converdyn Conversion to UF6 In operation 17600 t HM/year Joint Venture 1959
http://www.world-nuclear-news.org/ENF-Capacity_hike_planned_at_Russian_enrichment_plant-0706114.html

61
Host Country
Facility Name Facility/Fuel Type Facility
Status (As of
9/2/2015 IAEA) Design Capacity
Parent Company (or
Majority Owner)
Start of Ops
USA MOX Fuel Fabrication Facility (MFFF) Fuel Fabrication (MOX) Construction 61.5 t DOE - USA - Gov 2016
USA Paducah Re-conversion to UO2 Powder In operation 18000 t HM/year Unknown 2010
USA Portsmouth Re-conversion to UO2 Powder In operation 13500 t HM/year Unknown 2010
USA Richland (ANF) Fuel Fabrication (U Assembly) In operation 700 t HM/year AREVA 1970
USA Urenco USA Uranium Enrichment In operation 3000 MTSWU/year URENCO Ltd 2010
USA Wah Chang - Albany Zirconium Alloy Production In operation 2000 t/year ATI - USA 1956
USA Western Zirconium Zirconium Alloy Production In operation 1350 t/year Toshiba 1980
USA Wilmington Zirconium Alloy Tubing In operation 2200 km/year GE-Hitachi 1981
USA Wilmington (GNF) Fuel Fabrication (U Assembly) In operation 1200 t HM/year GE-Hitachi 1982
B-2. Information on global reactors under construction
NPP Location Country
Planned Operation
Date
Date Started
Construction Reactor Name Type Design/ Model MWe Operator Reactor Supplier
Supplier Country
(Ownership)
Argentina 2018 2/8/2014 Carem-25 PWR CAREM Prototype 29 CNEA CNEA Argentina
Belarus 2016 11/6/2013 Belarusian-1 PWR VVER V-491 1109 BelNPP Atomstroyexport Russia
Belarus 2018 4/26/2014 Belarusian-2 PWR VVER V-491 1109 BelNPP Atomstroyexport Russia
Brazil
6/1/2010 Angra-3 PWR Pre Konvoi 1245 ELETRONU AREVA France
China Start-up 11/21/2010 Changjiang-2 PWR CNP-600 650 HNPC DEC / CNNC China
China 2016 12/23/2010 Fangchenggang-2 PWR CPR-1000 1080 GFNPC DEC / CGN China
China 2016 12/24/2015 Fangchenggang-3 PWR Hualong One 1080 GFNPC DEC / CGN China
China 2016 12/31/2010 Fuqing-3 PWR CPR-1000 1080 FSNPC NPIC / CNNC China
China 2017 11/17/2012 Fuqing-4 PWR CPR-1000 1080 FSNPC NPIC / CNNC China
China 2019 5/7/2015 Fuqing-5 PWR Hualong One 1150 FSNPC NPIC / CNNC China
China 2020 12/22/2015 Fuqing-6 PWR Hualong One 1150 FSNPC NPIC / CNNC China
China 2015 9/24/2009 Haiyang-1 PWR AP1000 1250 SNPC WH / CNEC Japan
China 2016 6/20/2010 Haiyang-2 PWR AP1000 1250 SNPC WH / CNEC Japan
China Start-up 8/15/2009 Hongyanhe-4 PWR CPR-1000 1080 LHNPC DEC / CNEC China
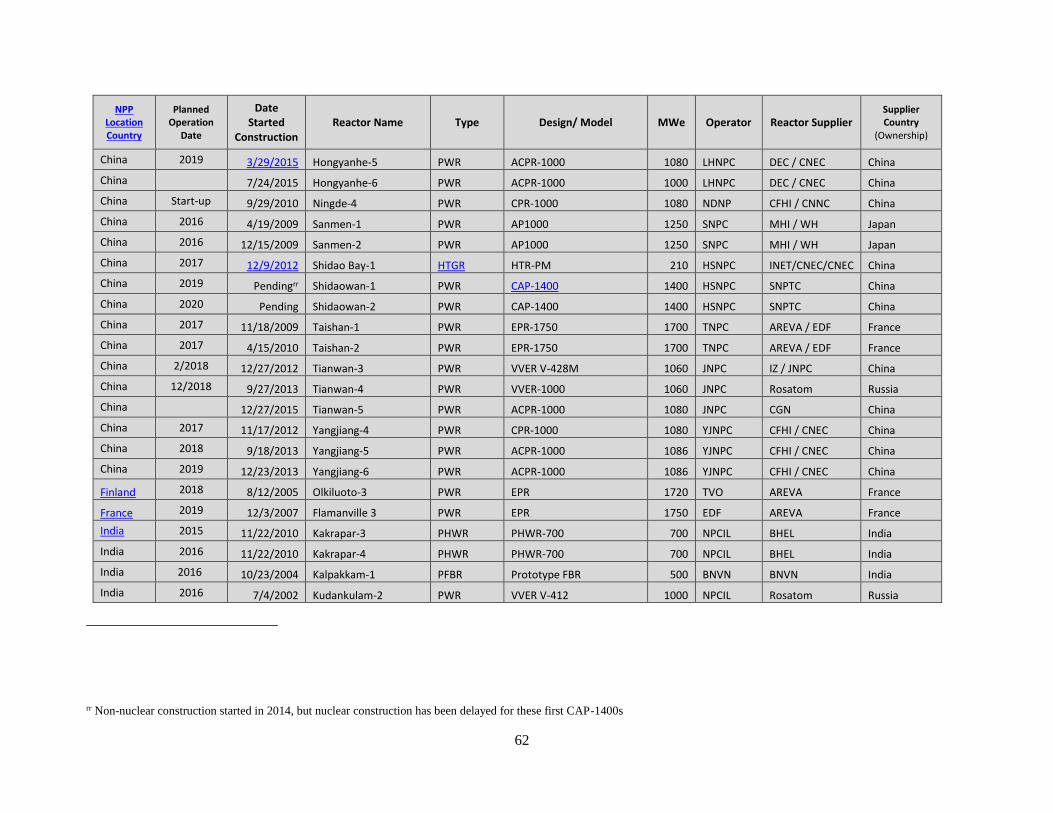
62
NPP Location Country
Planned Operation
Date
Date Started
Construction Reactor Name Type Design/ Model MWe Operator Reactor Supplier
Supplier Country
(Ownership)
China 2019 3/29/2015 Hongyanhe-5 PWR ACPR-1000 1080 LHNPC DEC / CNEC China
China 7/24/2015 Hongyanhe-6 PWR ACPR-1000 1000 LHNPC DEC / CNEC China
China Start-up 9/29/2010 Ningde-4 PWR CPR-1000 1080 NDNP CFHI / CNNC China
China 2016 4/19/2009 Sanmen-1 PWR AP1000 1250 SNPC MHI / WH Japan
China 2016 12/15/2009 Sanmen-2 PWR AP1000 1250 SNPC MHI / WH Japan
China 2017 12/9/2012 Shidao Bay-1 HTGR HTR-PM 210 HSNPC INET/CNEC/CNEC China
China 2019 Pendingrr Shidaowan-1 PWR CAP-1400 1400 HSNPC SNPTC China
China 2020 Pending Shidaowan-2 PWR CAP-1400 1400 HSNPC SNPTC China
China 2017 11/18/2009 Taishan-1 PWR EPR-1750 1700 TNPC AREVA / EDF France
China 2017 4/15/2010 Taishan-2 PWR EPR-1750 1700 TNPC AREVA / EDF France
China 2/2018 12/27/2012 Tianwan-3 PWR VVER V-428M 1060 JNPC IZ / JNPC China
China 12/2018 9/27/2013 Tianwan-4 PWR VVER-1000 1060 JNPC Rosatom Russia
China 12/27/2015 Tianwan-5 PWR ACPR-1000 1080 JNPC CGN China
China 2017 11/17/2012 Yangjiang-4 PWR CPR-1000 1080 YJNPC CFHI / CNEC China
China 2018 9/18/2013 Yangjiang-5 PWR ACPR-1000 1086 YJNPC CFHI / CNEC China
China 2019 12/23/2013 Yangjiang-6 PWR ACPR-1000 1086 YJNPC CFHI / CNEC China
Finland
2018 8/12/2005 Olkiluoto-3 PWR EPR 1720 TVO AREVA France
France
2019 12/3/2007 Flamanville 3 PWR EPR 1750 EDF AREVA France
India 2015 11/22/2010 Kakrapar-3 PHWR PHWR-700 700 NPCIL BHEL India
India 2016 11/22/2010 Kakrapar-4 PHWR PHWR-700 700 NPCIL BHEL India
India 2016 10/23/2004 Kalpakkam-1 PFBR Prototype FBR 500 BNVN BNVN India
India 2016 7/4/2002 Kudankulam-2 PWR VVER V-412 1000 NPCIL Rosatom Russia
rr Non-nuclear construction started in 2014, but nuclear construction has been delayed for these first CAP-1400s
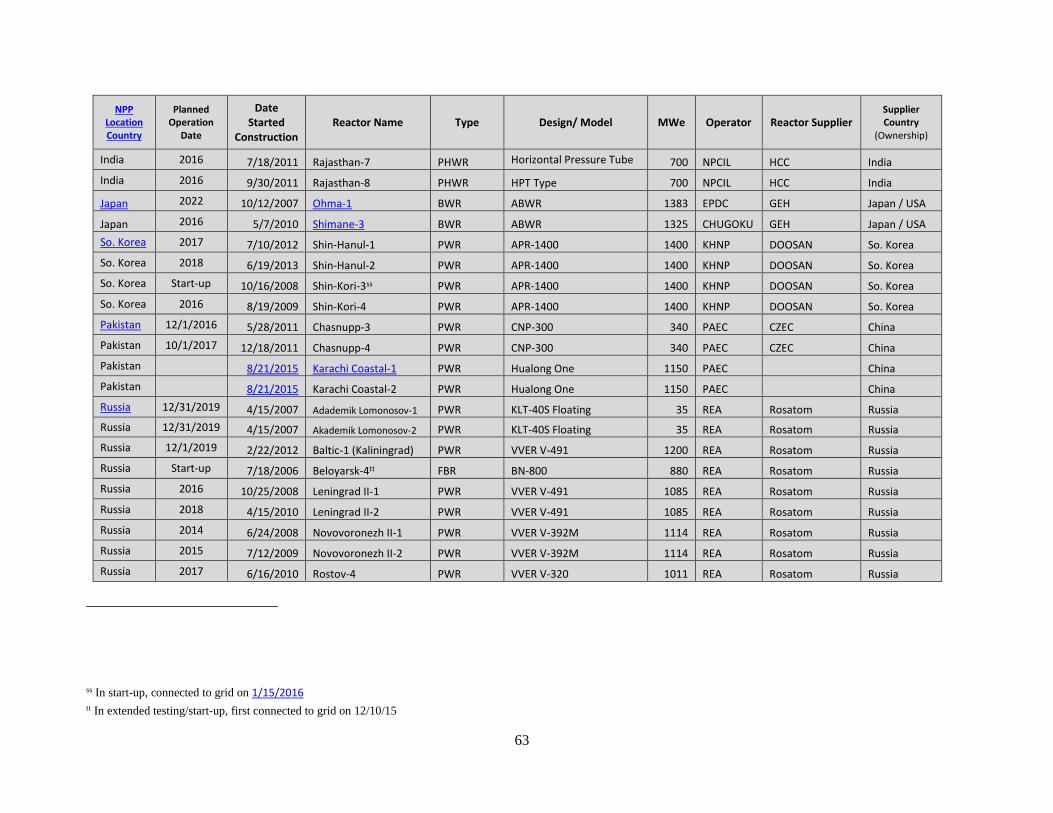
63
NPP Location Country
Planned Operation
Date
Date Started
Construction Reactor Name Type Design/ Model MWe Operator Reactor Supplier
Supplier Country
(Ownership)
India 2016 7/18/2011 Rajasthan-7 PHWR Horizontal Pressure Tube 700 NPCIL HCC India
India 2016 9/30/2011 Rajasthan-8 PHWR HPT Type 700 NPCIL HCC India
Japan
2022 10/12/2007 Ohma-1 BWR ABWR 1383 EPDC GEH Japan / USA
Japan 2016 5/7/2010 Shimane-3 BWR ABWR 1325 CHUGOKU GEH Japan / USA
So. Korea 2017 7/10/2012 Shin-Hanul-1 PWR APR-1400 1400 KHNP DOOSAN So. Korea
So. Korea 2018 6/19/2013 Shin-Hanul-2 PWR APR-1400 1400 KHNP DOOSAN So. Korea
So. Korea Start-up 10/16/2008 Shin-Kori-3ss PWR APR-1400 1400 KHNP DOOSAN So. Korea
So. Korea 2016 8/19/2009 Shin-Kori-4 PWR APR-1400 1400 KHNP DOOSAN So. Korea
Pakistan 12/1/2016 5/28/2011 Chasnupp-3 PWR CNP-300 340 PAEC CZEC China
Pakistan 10/1/2017 12/18/2011 Chasnupp-4 PWR CNP-300 340 PAEC CZEC China
Pakistan 8/21/2015 Karachi Coastal-1 PWR Hualong One 1150 PAEC China
Pakistan 8/21/2015 Karachi Coastal-2 PWR Hualong One 1150 PAEC China
Russia 12/31/2019 4/15/2007 Adademik Lomonosov-1 PWR KLT-40S Floating 35 REA Rosatom Russia
Russia 12/31/2019 4/15/2007 Akademik Lomonosov-2 PWR KLT-40S Floating 35 REA Rosatom Russia
Russia 12/1/2019 2/22/2012 Baltic-1 (Kaliningrad) PWR VVER V-491 1200 REA Rosatom Russia
Russia Start-up 7/18/2006 Beloyarsk-4tt FBR BN-800 880 REA Rosatom Russia
Russia 2016 10/25/2008 Leningrad II-1 PWR VVER V-491 1085 REA Rosatom Russia
Russia 2018 4/15/2010 Leningrad II-2 PWR VVER V-491 1085 REA Rosatom Russia
Russia 2014 6/24/2008 Novovoronezh II-1 PWR VVER V-392M 1114 REA Rosatom Russia
Russia 2015 7/12/2009 Novovoronezh II-2 PWR VVER V-392M 1114 REA Rosatom Russia
Russia 2017 6/16/2010 Rostov-4 PWR VVER V-320 1011 REA Rosatom Russia
ss In start-up, connected to grid on 1/15/2016
tt In extended testing/start-up, first connected to grid on 12/10/15

64
NPP Location Country
Planned Operation
Date
Date Started
Construction Reactor Name Type Design/ Model MWe Operator Reactor Supplier
Supplier Country
(Ownership)
Slovakia
11/9/2016 1/27/1987 Mochovce-3 PWR VVER V-213 471 SEAS SKODA Russia
Slovakia 12/31/2017 1/27/1987 Mochovce-4 PWR VVER V-213 471 SEAS SKODA Russia
Taiwan
TBDuu 3/31/1999 Lungmen-1 ABWR/BWR 1300 TPC GE USA
Taiwan TBD 8/30/1999 Lungmen-2 ABWR/BWR 1300 TPC GE USA
UAE
6/2/2017 7/18/2012 Barakah-1 PWR APR-1400 1345 ENEC KEPCO Korea
UAE 2017 5/28/2013 Barakah-2 PWR APR-1400 1345 ENEC KEPCO Korea
UAE 2018 9/24/2014 Barakah-3 PWR APR-1400 1345 ENEC KEPCO Korea
UAE 2020 7/30/2015 Barakah-4 PWR APR-1400 1400 ENEC KEPCO Korea
USA
Start-up 9/1/1973 Watts Bar-2 PWR W(4-Loop) ICECND 1218 TVA WH Japan
USA 2017 3/9/2013 Summer-2 PWR AP1000 1200 SCEG WH Japan
USA 2018 11/2/2013 Summer-3 PWR AP1000 1117 SCEG WH Japan
USA 2016 3/12/2013 Vogtle-3 PWR AP1000 1200 GEORGIA WH Japan
USA 2017 11/19/2013 Vogtle-4 PWR AP1000 1117 GEORGIA WH Japan
uu The two Lungmen reactors are currently in a government-mandated 3-year suspended status with Lungmen-1 to be sealed once pre-operational safety checks are completed and
construction suspended on Lungmen-2. See http://www.taiwantoday.tw/ct.asp?xItem=232105&ctNode=2182 and http://www.world-nuclear-news.org/NN-Political-discord-
places-Lungmen-on-hold-2804144.html for more information.
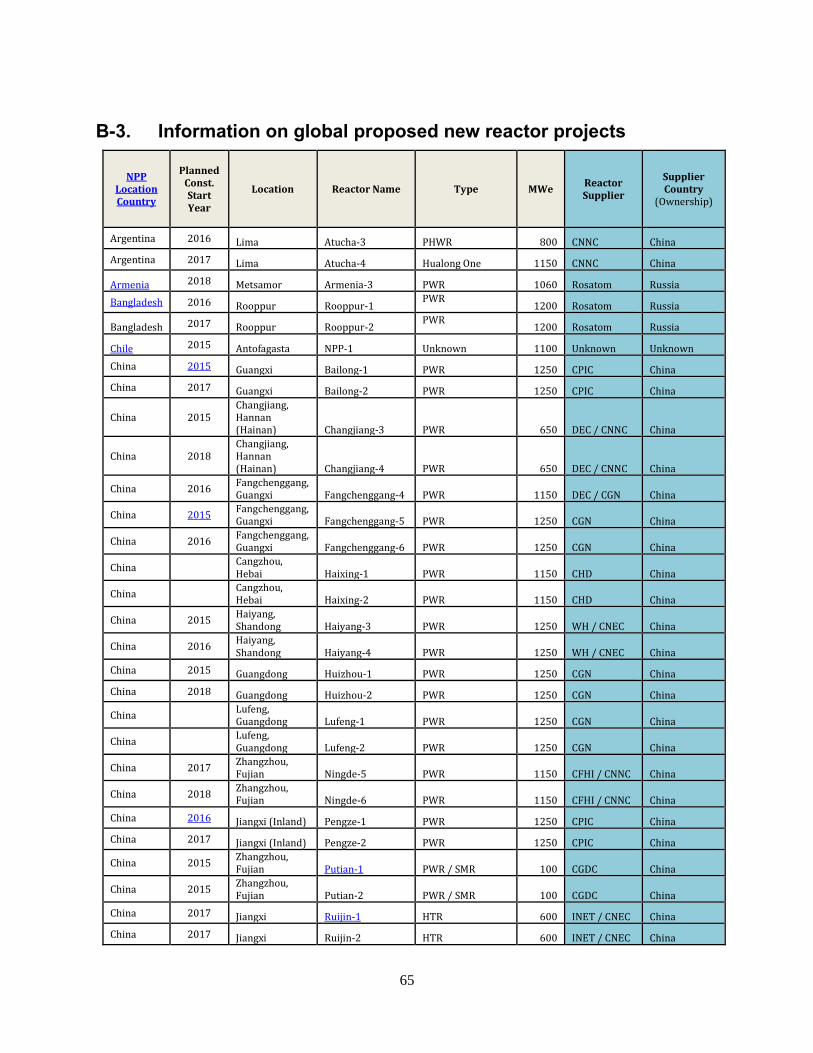
65
B-3. Information on global proposed new reactor projects
NPP Location Country
Planned Const. Start Year
Location Reactor Name Type MWe Reactor Supplier
Supplier Country
(Ownership)
Argentina 2016 Lima Atucha-3 PHWR 800 CNNC China
Argentina 2017 Lima Atucha-4 Hualong One 1150 CNNC China
Armenia
2018 Metsamor Armenia-3 PWR 1060 Rosatom Russia
Bangladesh 2016 Rooppur Rooppur-1 PWR
1200 Rosatom Russia
Bangladesh 2017 Rooppur Rooppur-2 PWR
1200 Rosatom Russia
Chile
2015 Antofagasta NPP-1 Unknown 1100 Unknown Unknown
China 2015 Guangxi Bailong-1 PWR 1250 CPIC China
China 2017 Guangxi Bailong-2 PWR 1250 CPIC China
China 2015 Changjiang, Hannan (Hainan) Changjiang-3 PWR 650 DEC / CNNC China
China 2018 Changjiang, Hannan (Hainan) Changjiang-4 PWR 650 DEC / CNNC China
China 2016 Fangchenggang, Guangxi Fangchenggang-4 PWR 1150 DEC / CGN China
China 2015
Fangchenggang, Guangxi Fangchenggang-5 PWR 1250 CGN China
China 2016 Fangchenggang, Guangxi Fangchenggang-6 PWR 1250 CGN China
China Cangzhou, Hebai Haixing-1 PWR 1150 CHD China
China Cangzhou, Hebai Haixing-2 PWR 1150 CHD China
China 2015 Haiyang, Shandong Haiyang-3 PWR 1250 WH / CNEC China
China 2016 Haiyang, Shandong Haiyang-4 PWR 1250 WH / CNEC China
China 2015 Guangdong Huizhou-1 PWR 1250 CGN China
China 2018 Guangdong Huizhou-2 PWR 1250 CGN China
China Lufeng, Guangdong Lufeng-1 PWR 1250 CGN China
China Lufeng, Guangdong Lufeng-2 PWR 1250 CGN China
China 2017 Zhangzhou, Fujian Ningde-5 PWR 1150 CFHI / CNNC China
China 2018 Zhangzhou, Fujian Ningde-6 PWR 1150 CFHI / CNNC China
China 2016 Jiangxi (Inland) Pengze-1 PWR 1250 CPIC China
China 2017 Jiangxi (Inland) Pengze-2 PWR 1250 CPIC China
China 2015 Zhangzhou, Fujian Putian-1 PWR / SMR 100 CGDC China
China 2015 Zhangzhou, Fujian Putian-2 PWR / SMR 100 CGDC China
China 2017 Jiangxi Ruijin-1 HTR 600 INET / CNEC China
China 2017 Jiangxi Ruijin-2 HTR 600 INET / CNEC China
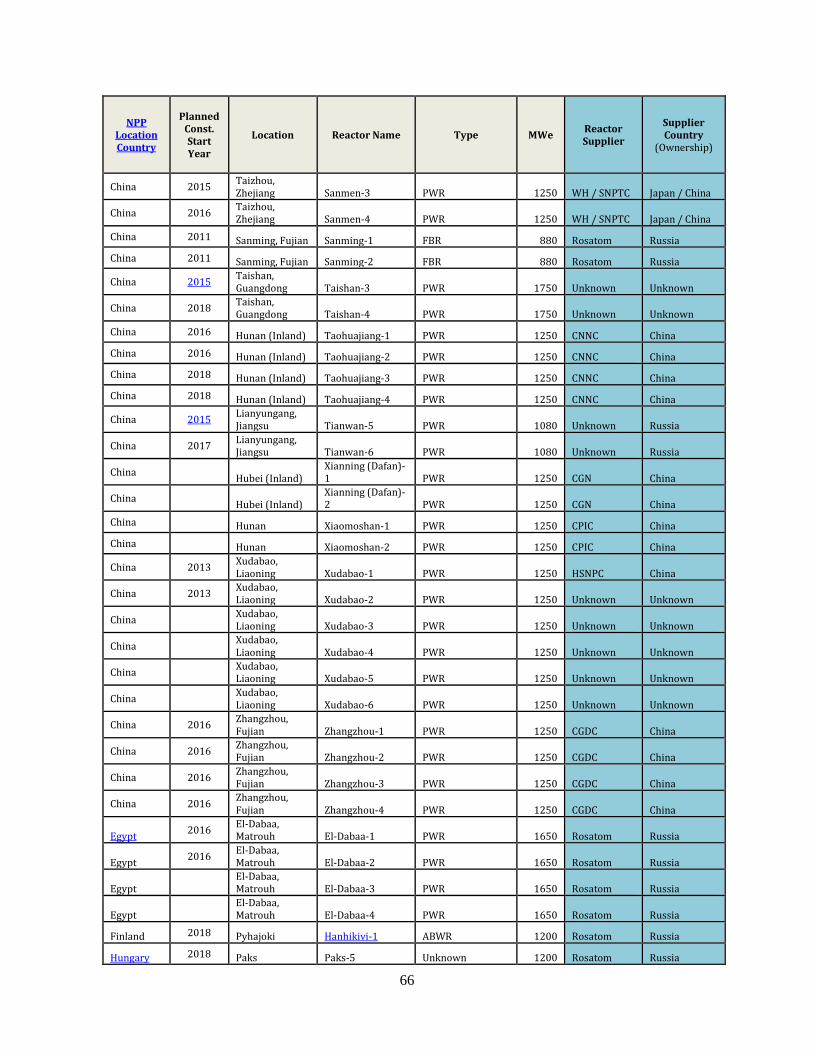
66
NPP Location Country
Planned Const. Start Year
Location Reactor Name Type MWe Reactor Supplier
Supplier Country
(Ownership)
China 2015 Taizhou, Zhejiang Sanmen-3 PWR 1250 WH / SNPTC Japan / China
China 2016 Taizhou, Zhejiang Sanmen-4 PWR 1250 WH / SNPTC Japan / China
China 2011 Sanming, Fujian Sanming-1 FBR 880 Rosatom Russia
China 2011 Sanming, Fujian Sanming-2 FBR 880 Rosatom Russia
China 2015
Taishan, Guangdong Taishan-3 PWR 1750 Unknown Unknown
China 2018 Taishan, Guangdong Taishan-4 PWR 1750 Unknown Unknown
China 2016 Hunan (Inland) Taohuajiang-1 PWR 1250 CNNC China
China 2016 Hunan (Inland) Taohuajiang-2 PWR 1250 CNNC China
China 2018 Hunan (Inland) Taohuajiang-3 PWR 1250 CNNC China
China 2018 Hunan (Inland) Taohuajiang-4 PWR 1250 CNNC China
China 2015
Lianyungang, Jiangsu Tianwan-5 PWR 1080 Unknown Russia
China 2017 Lianyungang, Jiangsu Tianwan-6 PWR 1080 Unknown Russia
China Hubei (Inland)
Xianning (Dafan)-1 PWR 1250 CGN China
China Hubei (Inland)
Xianning (Dafan)-2 PWR 1250 CGN China
China Hunan Xiaomoshan-1 PWR 1250 CPIC China
China Hunan Xiaomoshan-2 PWR 1250 CPIC China
China 2013 Xudabao, Liaoning Xudabao-1 PWR 1250 HSNPC China
China 2013 Xudabao, Liaoning Xudabao-2 PWR 1250 Unknown Unknown
China Xudabao, Liaoning Xudabao-3 PWR 1250 Unknown Unknown
China Xudabao, Liaoning Xudabao-4 PWR 1250 Unknown Unknown
China Xudabao, Liaoning Xudabao-5 PWR 1250 Unknown Unknown
China Xudabao, Liaoning Xudabao-6 PWR 1250 Unknown Unknown
China 2016 Zhangzhou, Fujian Zhangzhou-1 PWR 1250 CGDC China
China 2016 Zhangzhou, Fujian Zhangzhou-2 PWR 1250 CGDC China
China 2016 Zhangzhou, Fujian Zhangzhou-3 PWR 1250 CGDC China
China 2016 Zhangzhou, Fujian Zhangzhou-4 PWR 1250 CGDC China
Egypt
2016 El-Dabaa, Matrouh El-Dabaa-1 PWR 1650 Rosatom Russia
Egypt 2016
El-Dabaa, Matrouh El-Dabaa-2 PWR 1650 Rosatom Russia
Egypt El-Dabaa,
Matrouh El-Dabaa-3 PWR 1650 Rosatom Russia
Egypt El-Dabaa,
Matrouh El-Dabaa-4 PWR 1650 Rosatom Russia
Finland 2018 Pyhajoki Hanhikivi-1 ABWR 1200 Rosatom Russia
Hungary
2018 Paks Paks-5 Unknown 1200 Rosatom Russia
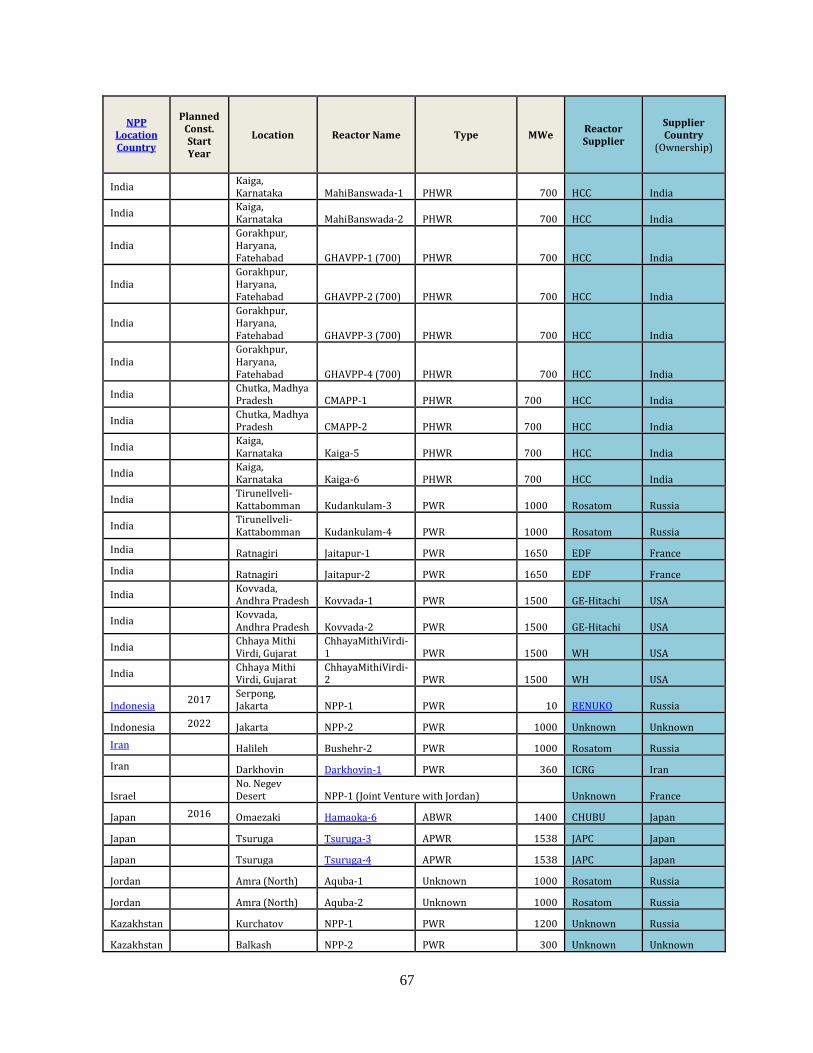
67
NPP Location Country
Planned Const. Start Year
Location Reactor Name Type MWe Reactor Supplier
Supplier Country
(Ownership)
India Kaiga, Karnataka MahiBanswada-1 PHWR 700 HCC India
India Kaiga, Karnataka MahiBanswada-2 PHWR 700 HCC India
India Gorakhpur, Haryana, Fatehabad GHAVPP-1 (700) PHWR 700 HCC India
India Gorakhpur, Haryana, Fatehabad GHAVPP-2 (700) PHWR 700 HCC India
India Gorakhpur, Haryana, Fatehabad GHAVPP-3 (700) PHWR 700 HCC India
India Gorakhpur, Haryana, Fatehabad GHAVPP-4 (700) PHWR 700 HCC India
India Chutka, Madhya Pradesh CMAPP-1 PHWR 700 HCC India
India Chutka, Madhya Pradesh CMAPP-2 PHWR 700 HCC India
India Kaiga, Karnataka Kaiga-5 PHWR 700 HCC India
India Kaiga, Karnataka Kaiga-6 PHWR 700 HCC India
India Tirunellveli-Kattabomman Kudankulam-3 PWR 1000 Rosatom Russia
India Tirunellveli-Kattabomman Kudankulam-4 PWR 1000 Rosatom Russia
India Ratnagiri Jaitapur-1 PWR 1650 EDF France
India Ratnagiri Jaitapur-2 PWR 1650 EDF France
India Kovvada, Andhra Pradesh Kovvada-1 PWR 1500 GE-Hitachi USA
India Kovvada, Andhra Pradesh Kovvada-2 PWR 1500 GE-Hitachi USA
India Chhaya Mithi Virdi, Gujarat
ChhayaMithiVirdi-1 PWR 1500 WH USA
India Chhaya Mithi Virdi, Gujarat
ChhayaMithiVirdi-2 PWR 1500 WH USA
Indonesia
2017 Serpong, Jakarta NPP-1 PWR 10 RENUKO Russia
Indonesia 2022 Jakarta NPP-2 PWR 1000 Unknown Unknown
Iran
Halileh Bushehr-2 PWR 1000 Rosatom Russia
Iran Darkhovin Darkhovin-1 PWR 360 ICRG Iran
Israel No. Negev
Desert NPP-1 (Joint Venture with Jordan) Unknown France
Japan 2016 Omaezaki Hamaoka-6 ABWR 1400 CHUBU Japan
Japan
Tsuruga Tsuruga-3 APWR 1538 JAPC Japan
Japan
Tsuruga Tsuruga-4 APWR 1538 JAPC Japan
Jordan
Amra (North) Aquba-1 Unknown 1000 Rosatom Russia
Jordan
Amra (North) Aquba-2 Unknown 1000 Rosatom Russia
Kazakhstan
Kurchatov NPP-1 PWR 1200 Unknown Russia
Kazakhstan
Balkash NPP-2 PWR 300 Unknown Unknown
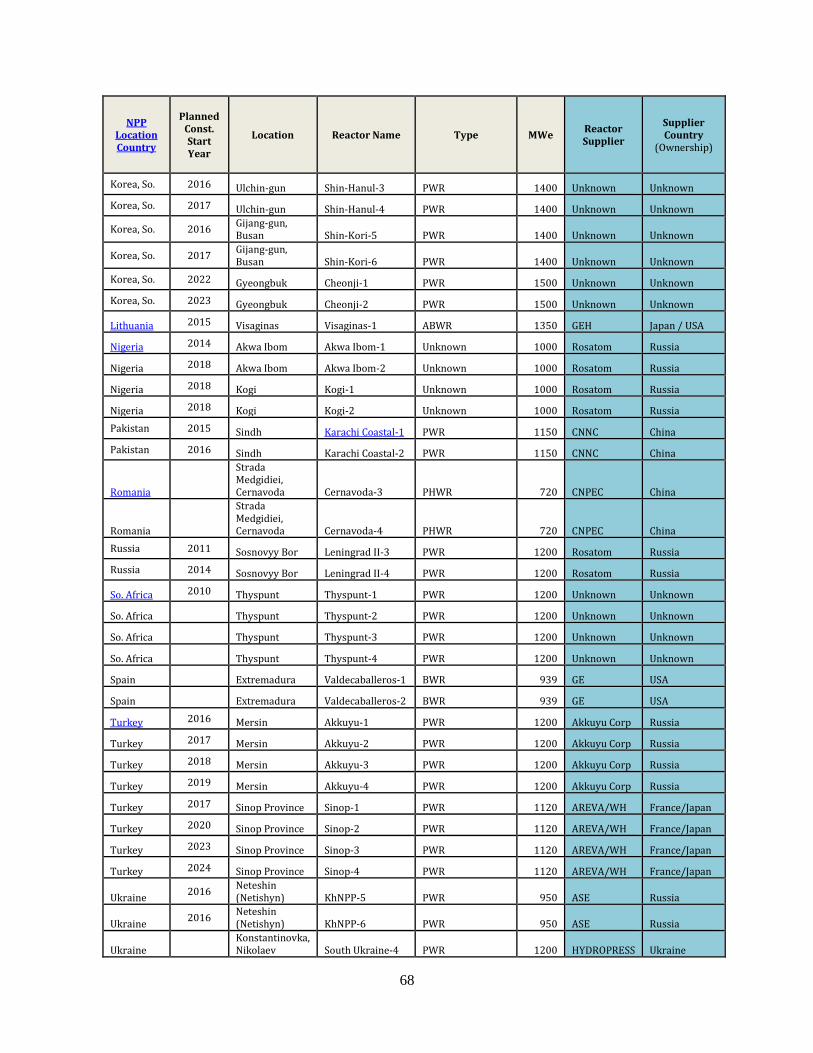
68
NPP Location Country
Planned Const. Start Year
Location Reactor Name Type MWe Reactor Supplier
Supplier Country
(Ownership)
Korea, So. 2016 Ulchin-gun Shin-Hanul-3 PWR 1400 Unknown Unknown
Korea, So. 2017 Ulchin-gun Shin-Hanul-4 PWR 1400 Unknown Unknown
Korea, So. 2016 Gijang-gun, Busan Shin-Kori-5 PWR 1400 Unknown Unknown
Korea, So. 2017 Gijang-gun, Busan Shin-Kori-6 PWR 1400 Unknown Unknown
Korea, So. 2022 Gyeongbuk Cheonji-1 PWR 1500 Unknown Unknown
Korea, So. 2023 Gyeongbuk Cheonji-2 PWR 1500 Unknown Unknown
Lithuania
2015 Visaginas Visaginas-1 ABWR 1350 GEH Japan / USA
Nigeria
2014 Akwa Ibom Akwa Ibom-1 Unknown 1000 Rosatom Russia
Nigeria 2018 Akwa Ibom Akwa Ibom-2 Unknown 1000 Rosatom Russia
Nigeria 2018 Kogi Kogi-1 Unknown 1000 Rosatom Russia
Nigeria 2018 Kogi Kogi-2 Unknown 1000 Rosatom Russia
Pakistan 2015 Sindh Karachi Coastal-1 PWR 1150 CNNC China
Pakistan 2016 Sindh Karachi Coastal-2 PWR 1150 CNNC China
Romania
Strada Medgidiei, Cernavoda Cernavoda-3 PHWR 720 CNPEC China
Romania
Strada Medgidiei, Cernavoda Cernavoda-4 PHWR 720 CNPEC China
Russia 2011 Sosnovyy Bor Leningrad II-3 PWR 1200 Rosatom Russia
Russia 2014 Sosnovyy Bor Leningrad II-4 PWR 1200 Rosatom Russia
So. Africa
2010 Thyspunt Thyspunt-1 PWR 1200 Unknown Unknown
So. Africa
Thyspunt Thyspunt-2 PWR 1200 Unknown Unknown
So. Africa
Thyspunt Thyspunt-3 PWR 1200 Unknown Unknown
So. Africa
Thyspunt Thyspunt-4 PWR 1200 Unknown Unknown
Spain Extremadura Valdecaballeros-1 BWR 939 GE USA
Spain Extremadura Valdecaballeros-2 BWR 939 GE USA
Turkey
2016 Mersin Akkuyu-1 PWR 1200 Akkuyu Corp Russia
Turkey 2017 Mersin Akkuyu-2 PWR 1200 Akkuyu Corp Russia
Turkey 2018 Mersin Akkuyu-3 PWR 1200 Akkuyu Corp Russia
Turkey 2019 Mersin Akkuyu-4 PWR 1200 Akkuyu Corp Russia
Turkey 2017 Sinop Province Sinop-1 PWR 1120 AREVA/WH France/Japan
Turkey 2020 Sinop Province Sinop-2 PWR 1120 AREVA/WH France/Japan
Turkey 2023 Sinop Province Sinop-3 PWR 1120 AREVA/WH France/Japan
Turkey 2024 Sinop Province Sinop-4 PWR 1120 AREVA/WH France/Japan
Ukraine 2016
Neteshin (Netishyn) KhNPP-5 PWR 950 ASE Russia
Ukraine 2016
Neteshin (Netishyn) KhNPP-6 PWR 950 ASE Russia
Ukraine Konstantinovka,
Nikolaev South Ukraine-4 PWR 1200 HYDROPRESS Ukraine
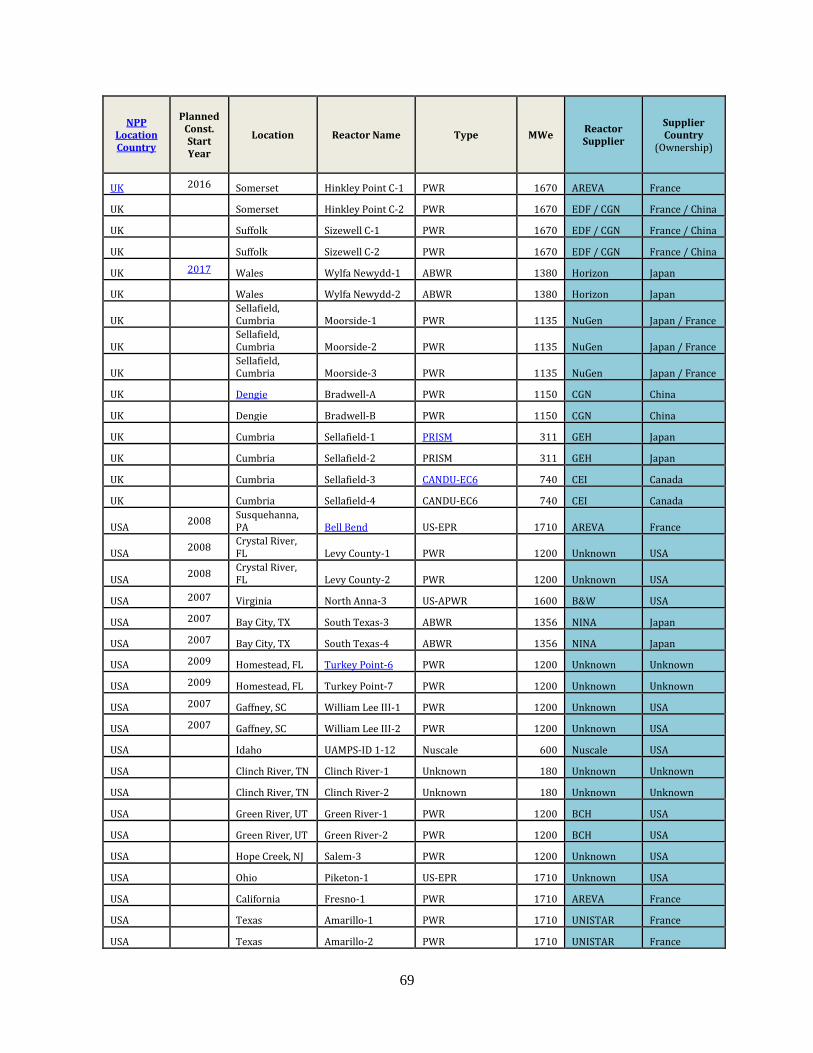
69
NPP Location Country
Planned Const. Start Year
Location Reactor Name Type MWe Reactor Supplier
Supplier Country
(Ownership)
UK
2016 Somerset Hinkley Point C-1 PWR 1670 AREVA France
UK
Somerset Hinkley Point C-2 PWR 1670 EDF / CGN France / China
UK
Suffolk Sizewell C-1 PWR 1670 EDF / CGN France / China
UK
Suffolk Sizewell C-2 PWR 1670 EDF / CGN France / China
UK 2017 Wales Wylfa Newydd-1 ABWR 1380 Horizon Japan
UK
Wales Wylfa Newydd-2 ABWR 1380 Horizon Japan
UK Sellafield,
Cumbria Moorside-1 PWR 1135 NuGen Japan / France
UK Sellafield,
Cumbria Moorside-2 PWR 1135 NuGen Japan / France
UK Sellafield,
Cumbria Moorside-3 PWR 1135 NuGen Japan / France
UK
Dengie Bradwell-A PWR 1150 CGN China
UK
Dengie Bradwell-B PWR 1150 CGN China
UK
Cumbria Sellafield-1 PRISM 311 GEH Japan
UK
Cumbria Sellafield-2 PRISM 311 GEH Japan
UK
Cumbria Sellafield-3 CANDU-EC6 740 CEI Canada
UK
Cumbria Sellafield-4 CANDU-EC6 740 CEI Canada
USA 2008
Susquehanna, PA Bell Bend US-EPR 1710 AREVA France
USA 2008
Crystal River, FL Levy County-1 PWR 1200 Unknown USA
USA 2008
Crystal River, FL Levy County-2 PWR 1200 Unknown USA
USA 2007 Virginia North Anna-3 US-APWR 1600 B&W USA
USA 2007 Bay City, TX South Texas-3 ABWR 1356 NINA Japan
USA 2007 Bay City, TX South Texas-4 ABWR 1356 NINA Japan
USA 2009 Homestead, FL Turkey Point-6 PWR 1200 Unknown Unknown
USA 2009 Homestead, FL Turkey Point-7 PWR 1200 Unknown Unknown
USA 2007 Gaffney, SC William Lee III-1 PWR 1200 Unknown USA
USA 2007 Gaffney, SC William Lee III-2 PWR 1200 Unknown USA
USA
Idaho UAMPS-ID 1-12 Nuscale 600 Nuscale USA
USA
Clinch River, TN Clinch River-1 Unknown 180 Unknown Unknown
USA
Clinch River, TN Clinch River-2 Unknown 180 Unknown Unknown
USA
Green River, UT Green River-1 PWR 1200 BCH USA
USA
Green River, UT Green River-2 PWR 1200 BCH USA
USA
Hope Creek, NJ Salem-3 PWR 1200 Unknown USA
USA
Ohio Piketon-1 US-EPR 1710 Unknown USA
USA
California Fresno-1 PWR 1710 AREVA France
USA
Texas Amarillo-1 PWR 1710 UNISTAR France
USA
Texas Amarillo-2 PWR 1710 UNISTAR France
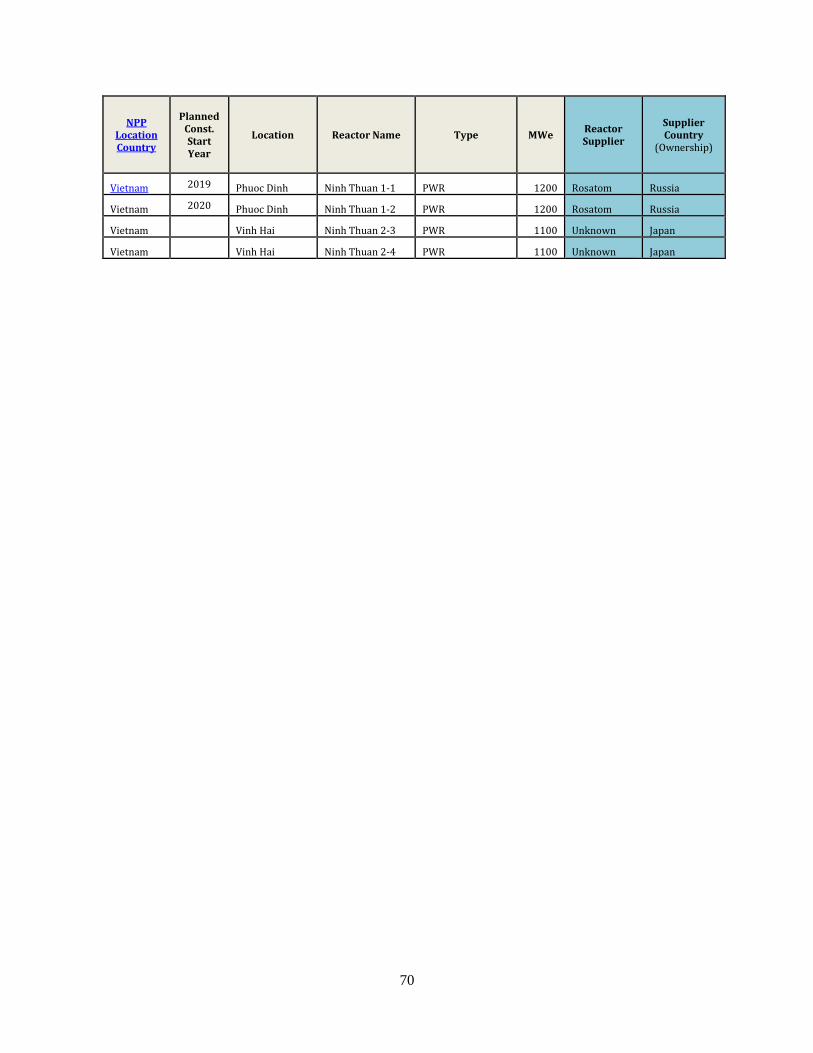
70
NPP Location Country
Planned Const. Start Year
Location Reactor Name Type MWe Reactor Supplier
Supplier Country
(Ownership)
Vietnam
2019 Phuoc Dinh Ninh Thuan 1-1 PWR 1200 Rosatom Russia
Vietnam 2020 Phuoc Dinh Ninh Thuan 1-2 PWR 1200 Rosatom Russia
Vietnam
Vinh Hai Ninh Thuan 2-3 PWR 1100 Unknown Japan
Vietnam
Vinh Hai Ninh Thuan 2-4 PWR 1100 Unknown Japan
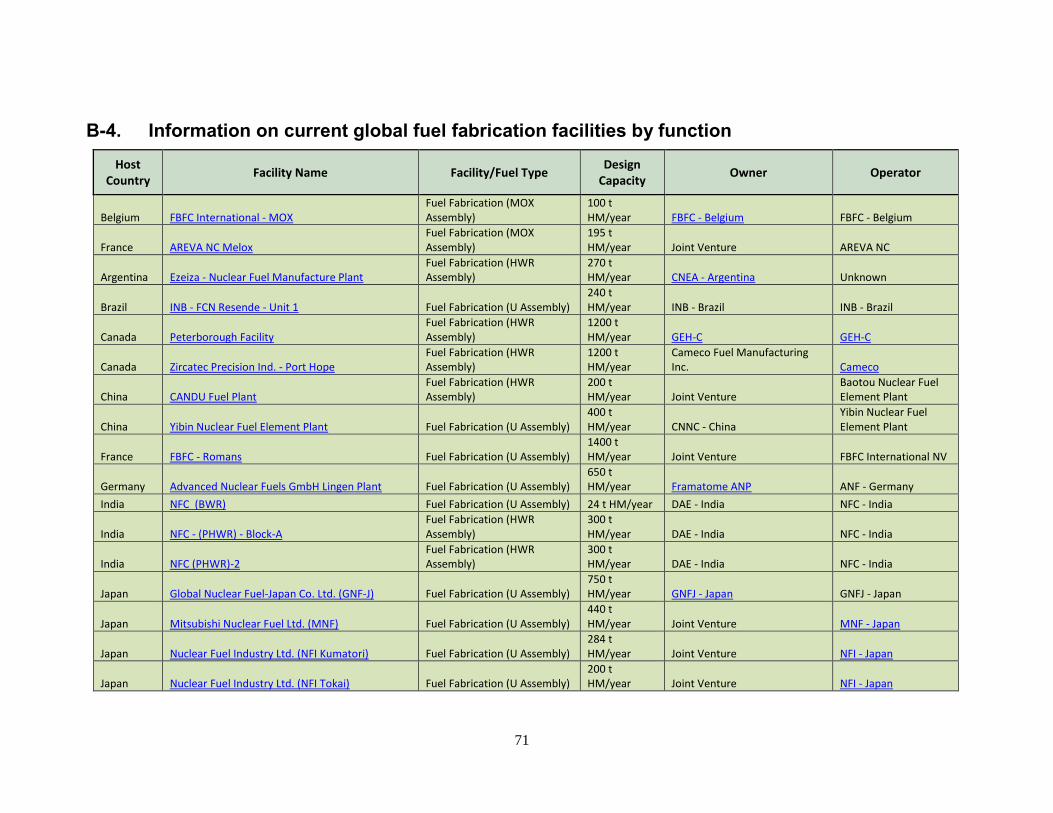
71
B-4. Information on current global fuel fabrication facilities by function
Host Country
Facility Name Facility/Fuel Type Design
Capacity Owner Operator
Belgium FBFC International - MOX
Fuel Fabrication (MOX Assembly)
100 t HM/year FBFC - Belgium FBFC - Belgium
France AREVA NC Melox
Fuel Fabrication (MOX Assembly)
195 t HM/year Joint Venture AREVA NC
Argentina Ezeiza - Nuclear Fuel Manufacture Plant
Fuel Fabrication (HWR Assembly)
270 t HM/year CNEA - Argentina Unknown
Brazil INB - FCN Resende - Unit 1 Fuel Fabrication (U Assembly) 240 t HM/year INB - Brazil INB - Brazil
Canada Peterborough Facility
Fuel Fabrication (HWR Assembly)
1200 t HM/year GEH-C GEH-C
Canada Zircatec Precision Ind. - Port Hope
Fuel Fabrication (HWR Assembly)
1200 t HM/year
Cameco Fuel Manufacturing Inc. Cameco
China CANDU Fuel Plant
Fuel Fabrication (HWR Assembly)
200 t HM/year Joint Venture
Baotou Nuclear Fuel Element Plant
China Yibin Nuclear Fuel Element Plant Fuel Fabrication (U Assembly) 400 t HM/year CNNC - China
Yibin Nuclear Fuel Element Plant
France FBFC - Romans Fuel Fabrication (U Assembly) 1400 t HM/year Joint Venture FBFC International NV
Germany Advanced Nuclear Fuels GmbH Lingen Plant Fuel Fabrication (U Assembly) 650 t HM/year Framatome ANP ANF - Germany
India NFC (BWR) Fuel Fabrication (U Assembly) 24 t HM/year DAE - India NFC - India
India NFC - (PHWR) - Block-A
Fuel Fabrication (HWR Assembly)
300 t HM/year DAE - India NFC - India
India NFC (PHWR)-2
Fuel Fabrication (HWR Assembly)
300 t HM/year DAE - India NFC - India
Japan Global Nuclear Fuel-Japan Co. Ltd. (GNF-J) Fuel Fabrication (U Assembly) 750 t HM/year GNFJ - Japan GNFJ - Japan
Japan Mitsubishi Nuclear Fuel Ltd. (MNF) Fuel Fabrication (U Assembly) 440 t HM/year Joint Venture MNF - Japan
Japan Nuclear Fuel Industry Ltd. (NFI Kumatori) Fuel Fabrication (U Assembly) 284 t HM/year Joint Venture NFI - Japan
Japan Nuclear Fuel Industry Ltd. (NFI Tokai) Fuel Fabrication (U Assembly) 200 t HM/year Joint Venture NFI - Japan
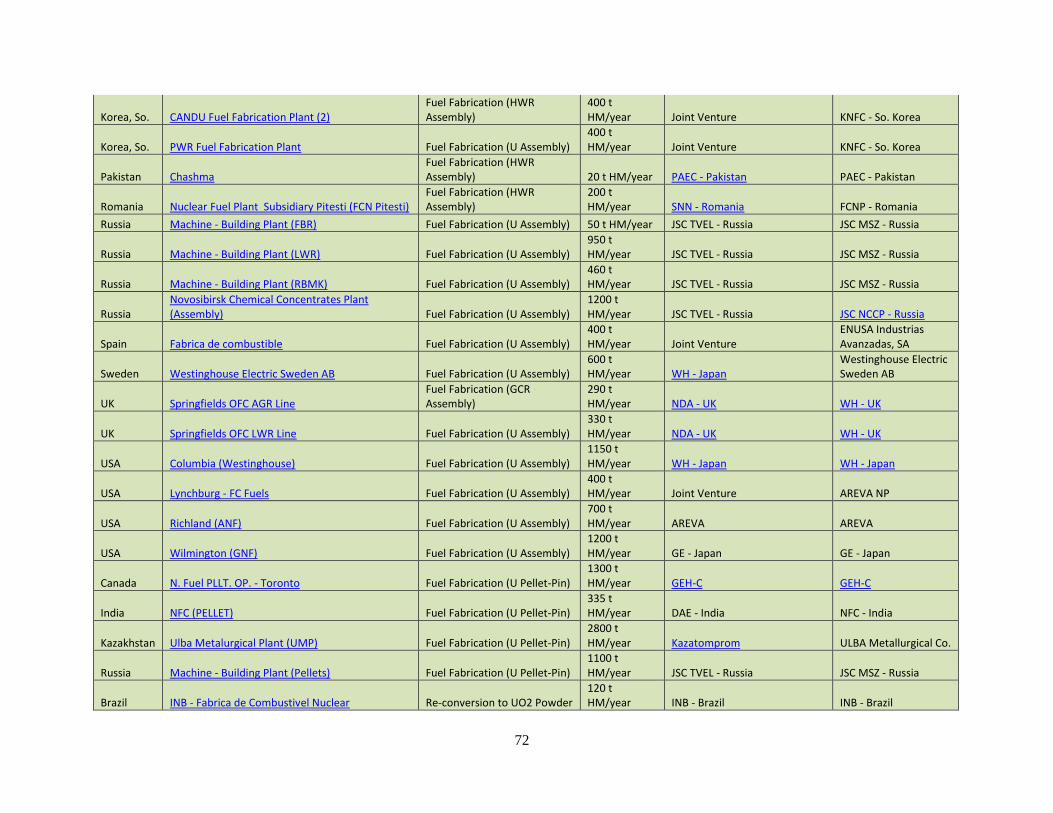
72
Korea, So. CANDU Fuel Fabrication Plant (2)
Fuel Fabrication (HWR Assembly)
400 t HM/year Joint Venture KNFC - So. Korea
Korea, So. PWR Fuel Fabrication Plant Fuel Fabrication (U Assembly) 400 t HM/year Joint Venture KNFC - So. Korea
Pakistan Chashma
Fuel Fabrication (HWR Assembly) 20 t HM/year PAEC - Pakistan PAEC - Pakistan
Romania Nuclear Fuel Plant Subsidiary Pitesti (FCN Pitesti)
Fuel Fabrication (HWR Assembly)
200 t HM/year SNN - Romania FCNP - Romania
Russia Machine - Building Plant (FBR) Fuel Fabrication (U Assembly) 50 t HM/year JSC TVEL - Russia JSC MSZ - Russia
Russia Machine - Building Plant (LWR) Fuel Fabrication (U Assembly) 950 t HM/year JSC TVEL - Russia JSC MSZ - Russia
Russia Machine - Building Plant (RBMK) Fuel Fabrication (U Assembly) 460 t HM/year JSC TVEL - Russia JSC MSZ - Russia
Russia Novosibirsk Chemical Concentrates Plant (Assembly) Fuel Fabrication (U Assembly)
1200 t HM/year JSC TVEL - Russia JSC NCCP - Russia
Spain Fabrica de combustible Fuel Fabrication (U Assembly) 400 t HM/year Joint Venture
ENUSA Industrias Avanzadas, SA
Sweden Westinghouse Electric Sweden AB Fuel Fabrication (U Assembly) 600 t HM/year WH - Japan
Westinghouse Electric Sweden AB
UK Springfields OFC AGR Line
Fuel Fabrication (GCR Assembly)
290 t HM/year NDA - UK WH - UK
UK Springfields OFC LWR Line Fuel Fabrication (U Assembly) 330 t HM/year NDA - UK WH - UK
USA Columbia (Westinghouse) Fuel Fabrication (U Assembly) 1150 t HM/year WH - Japan WH - Japan
USA Lynchburg - FC Fuels Fuel Fabrication (U Assembly) 400 t HM/year Joint Venture AREVA NP
USA Richland (ANF) Fuel Fabrication (U Assembly) 700 t HM/year AREVA AREVA
USA Wilmington (GNF) Fuel Fabrication (U Assembly) 1200 t HM/year GE - Japan GE - Japan
Canada N. Fuel PLLT. OP. - Toronto Fuel Fabrication (U Pellet-Pin) 1300 t HM/year GEH-C GEH-C
India NFC (PELLET) Fuel Fabrication (U Pellet-Pin) 335 t HM/year DAE - India NFC - India
Kazakhstan Ulba Metalurgical Plant (UMP) Fuel Fabrication (U Pellet-Pin) 2800 t HM/year Kazatomprom ULBA Metallurgical Co.
Russia Machine - Building Plant (Pellets) Fuel Fabrication (U Pellet-Pin) 1100 t HM/year JSC TVEL - Russia JSC MSZ - Russia
Brazil INB - Fabrica de Combustivel Nuclear Re-conversion to UO2 Powder 120 t HM/year INB - Brazil INB - Brazil
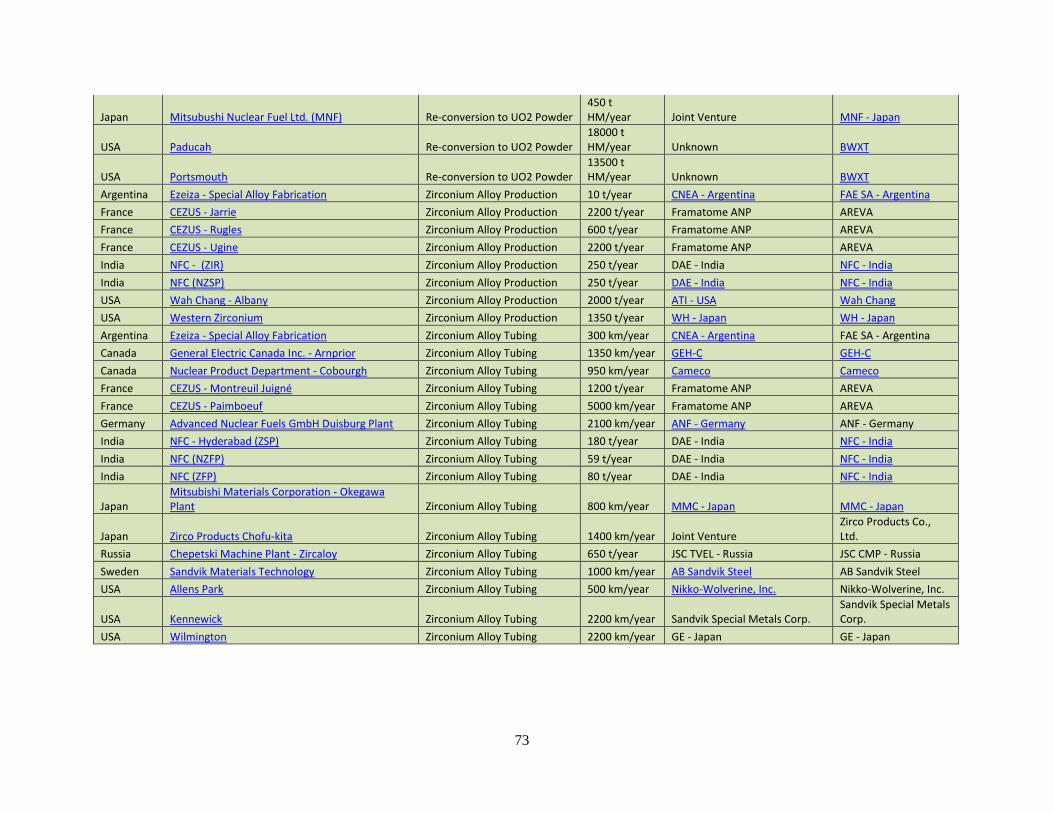
73
Japan Mitsubushi Nuclear Fuel Ltd. (MNF) Re-conversion to UO2 Powder 450 t HM/year Joint Venture MNF - Japan
USA Paducah Re-conversion to UO2 Powder 18000 t HM/year Unknown BWXT
USA Portsmouth Re-conversion to UO2 Powder 13500 t HM/year Unknown BWXT
Argentina Ezeiza - Special Alloy Fabrication Zirconium Alloy Production 10 t/year CNEA - Argentina FAE SA - Argentina
France CEZUS - Jarrie Zirconium Alloy Production 2200 t/year Framatome ANP AREVA
France CEZUS - Rugles Zirconium Alloy Production 600 t/year Framatome ANP AREVA
France CEZUS - Ugine Zirconium Alloy Production 2200 t/year Framatome ANP AREVA
India NFC - (ZIR) Zirconium Alloy Production 250 t/year DAE - India NFC - India
India NFC (NZSP) Zirconium Alloy Production 250 t/year DAE - India NFC - India
USA Wah Chang - Albany Zirconium Alloy Production 2000 t/year ATI - USA Wah Chang
USA Western Zirconium Zirconium Alloy Production 1350 t/year WH - Japan WH - Japan
Argentina Ezeiza - Special Alloy Fabrication Zirconium Alloy Tubing 300 km/year CNEA - Argentina FAE SA - Argentina
Canada General Electric Canada Inc. - Arnprior Zirconium Alloy Tubing 1350 km/year GEH-C GEH-C
Canada Nuclear Product Department - Cobourgh Zirconium Alloy Tubing 950 km/year Cameco Cameco
France CEZUS - Montreuil Juigné Zirconium Alloy Tubing 1200 t/year Framatome ANP AREVA
France CEZUS - Paimboeuf Zirconium Alloy Tubing 5000 km/year Framatome ANP AREVA
Germany Advanced Nuclear Fuels GmbH Duisburg Plant Zirconium Alloy Tubing 2100 km/year ANF - Germany ANF - Germany
India NFC - Hyderabad (ZSP) Zirconium Alloy Tubing 180 t/year DAE - India NFC - India
India NFC (NZFP) Zirconium Alloy Tubing 59 t/year DAE - India NFC - India
India NFC (ZFP) Zirconium Alloy Tubing 80 t/year DAE - India NFC - India
Japan Mitsubishi Materials Corporation - Okegawa Plant Zirconium Alloy Tubing 800 km/year MMC - Japan MMC - Japan
Japan Zirco Products Chofu-kita Zirconium Alloy Tubing 1400 km/year Joint Venture Zirco Products Co., Ltd.
Russia Chepetski Machine Plant - Zircaloy Zirconium Alloy Tubing 650 t/year JSC TVEL - Russia JSC CMP - Russia
Sweden Sandvik Materials Technology Zirconium Alloy Tubing 1000 km/year AB Sandvik Steel AB Sandvik Steel
USA Allens Park Zirconium Alloy Tubing 500 km/year Nikko-Wolverine, Inc. Nikko-Wolverine, Inc.
USA Kennewick Zirconium Alloy Tubing 2200 km/year Sandvik Special Metals Corp. Sandvik Special Metals Corp.
USA Wilmington Zirconium Alloy Tubing 2200 km/year GE - Japan GE - Japan