
Urban Tapestries: Wireless networking, public authoring and social knowledge
Upload
khangminh22Category
view
9download
0
Global Networking in WirelessTeletechnology Business
Lasse Baldauf, Michael Lovejoy, Jarmo Karesto, Laura Paija
Technology Review 114/2001

Global Networkingin Wireless Teletechnology Business
Lasse BaldaufJarmo Karesto
Michael LovejoyLaura Paija
Technology Review 114/2001Helsinki 2001
Tekes – your contact for Finnish technology
Tekes, the National Technology Agency of Finland, is the main financing or-ganisation for applied and industrial R&D in Finland. Funding is granted fromthe state budget.
Tekes’ primary objective is to promote the competitiveness of Finnish indus-try and the service sector by technological means. Activities aim to diversifyproduction structures, increase productivity and exports, and create a foun-dation for employment and social well-being. Tekes supports applied andindustrial R&D in Finland to the extent of some EUR 390 million, annually.The Tekes network in Finland and overseas offers excellent channels for co-operation with Finnish companies, universities and research institutes.
Technology programmes – part of the innovation chain
The technology programmes for developing innovative products and pro-cesses are an essential part of the Finnish innovation system. These pro-grammes have proved to be an effective form of cooperation and networkingfor companies and the research sector. Technology programmes promotedevelopment in specific sectors of technology or industry, and the results ofthe research work are passed on to business systematically. The programmesalso serve as excellent frameworks for international R&D cooperation. Cur-rently, a total of about 50 extensive national technology programmes are un-der way.
_ _ _
Finpro – Finnish business solutions worldwide
Finpro is an efficient expert and service organization. Finpro provides ser-vices, support and information to help Finnish companies enter the interna-tional market as swiftly, safely and efficiently as possible.
In addition to Finpro’s operations in Finland, Finpro has 48 Finland TradeCenters in 38 countries worldwide. Finpro´s global expertise areas focus onthe most important industry sectors of the Finnish economy. Finpro’s com-petence focuses on the industry sectors and market areas where Finnishcompanies have a special competitive advantage or that are interesting aspotential markets.
ISSN 1239-758XISBN 952-457-044-0
Cover: LM&COPage layout: DTPage Oy
Printers: Paino-Center Oy, 2001
Foreword
Networks, inter-firm alliances and cooperation between companies and the research communityare important elements of today’s business operations. Networking means not only vertical rela-tionships, i.e. buyer-supplier relationships, but also cooperation in manufacturing, marketing andin research and development. The depth of cooperation varies however, from subcontracting tostrategic partnerships.
The driving forces behind networking are access to new markets and, increasingly, a tendencyamong firms to focus on core competence of the firm, thus leading to outsourcing of non-criticalactivities. Companies are operating in an industrial ecosystem of mutually supporting, and interde-pendent companies and other partners. To a large extent, today’s competition means competitionbetween these networks.
For the National Technology Agency of Finland, Tekes networking is a strategic objective and acentral element of all R&D projects. The Agency has extensive experience and knowledge of net-working and cooperation trough national technology programmes, but its focus has been mainly onstrategic R&D partnerships between national players.
Although networking is an important element in private and public sector organizations, the impe-tus behind international networking as well as its mechanisms and benefits are not widely known.This report aims at helping companies initiate international cooperation in the field of mobile com-munications; it is designed as a networking aid providing vital information about networking envi-ronments in the most important mobile communications markets.
This report has been prepared by a Finpro working group supported by ETLA, the Research Insti-tute of the Finnish Economy, and other experts in the field of telecommunications. Tekes wishes toexpress its warm thanks to the project team for excellent work collecting benchmarking informa-tion on key players in the telecommunications industry and for analysing international networkingmechanisms. Special thanks are also given to the steering group, composed of companies, theFinpro team and the Tekes representative. Through benchmarking visits and highly productive dis-cussions this group contributed to gaining a deep understanding of the key elements of networking.
We hope you will find this report useful for your international business development.
Tekes, the National Technology Agency of Finland

Table of contents
Foreword
1 Executive summary · · · · · · · · · · · · · · · · · · · · · · · · · · · · · · · · · · · · · · · · · · · · · · · · · · · 1
2 Introduction · · · · · · · · · · · · · · · · · · · · · · · · · · · · · · · · · · · · · · · · · · · · · · · · · · · · · · · · · 3
3 The ICT cluster in the Finnish economy · · · · · · · · · · · · · · · · · · · · · · · · · · · · · · · · · · 6Laura Paija, ETLA3.1 ICT cluster identification · · · · · · · · · · · · · · · · · · · · · · · · · · · · · · · · · · · · · · · · · · · 6
3.1.1 What is a cluster? · · · · · · · · · · · · · · · · · · · · · · · · · · · · · · · · · · · · · · · · · · 63.1.2 The ICT cluster environment · · · · · · · · · · · · · · · · · · · · · · · · · · · · · · · · · · 6
3.2 The economic relevance of the ICT cluster · · · · · · · · · · · · · · · · · · · · · · · · · · · · · 73.2.1 Domestic market position · · · · · · · · · · · · · · · · · · · · · · · · · · · · · · · · · · · · 73.2.2 Foreign trade and international market position · · · · · · · · · · · · · · · · · · · 8
3.3 The evolution of the ICT cluster· · · · · · · · · · · · · · · · · · · · · · · · · · · · · · · · · · · · · · 93.3.1 Network operation – a fragmented monopoly market· · · · · · · · · · · · · · · 93.3.2 The emergence of the telecommunications industry · · · · · · · · · · · · · · 11
3.4 The factors of the competitive advantage · · · · · · · · · · · · · · · · · · · · · · · · · · · · · 133.4.1 Firm strategy, structure and rivalry · · · · · · · · · · · · · · · · · · · · · · · · · · · · 133.4.2 Factor conditions· · · · · · · · · · · · · · · · · · · · · · · · · · · · · · · · · · · · · · · · · · 133.4.3 Demand conditions · · · · · · · · · · · · · · · · · · · · · · · · · · · · · · · · · · · · · · · · 143.4.4 Supporting and related industries · · · · · · · · · · · · · · · · · · · · · · · · · · · · · 143.4.5 Government· · · · · · · · · · · · · · · · · · · · · · · · · · · · · · · · · · · · · · · · · · · · · · 153.4.6 Coincidental factors· · · · · · · · · · · · · · · · · · · · · · · · · · · · · · · · · · · · · · · · 16
3.5 Dynamics in the ICT cluster · · · · · · · · · · · · · · · · · · · · · · · · · · · · · · · · · · · · · · · · 163.5.1 The government as an early catalyst of cluster development · · · · · · · · 163.5.2 Exceptional demand conditions have offered home-base advantage · 173.5.3 Intense firm interaction has induced upgrading · · · · · · · · · · · · · · · · · · 183.5.4 Deterioration in labor supply, improvement in capital supply · · · · · · · · 193.5.5 World-wide liberalization – pivotal and perfectly timed for Finland· · · · 19
3.6 Future opportunities and threats · · · · · · · · · · · · · · · · · · · · · · · · · · · · · · · · · · · · 203.6.1 Market positions at stake in the third generation competition · · · · · · · 203.6.2 Globalization behind most of the opportunities and threats · · · · · · · · · 213.6.3 Small firm size limits seizure of opportunities · · · · · · · · · · · · · · · · · · · · 213.6.4 Dynamic cluster relations support specialization and upgrading · · · · · 223.6.5 Electronic business will have implications on firm interaction · · · · · · · 223.6.6 How to guarantee sufficient supply of skilled labor? · · · · · · · · · · · · · · 233.6.7 Will content production grow into the third base of the ICT cluster? · · 23
4 Trends in wireless services and products · · · · · · · · · · · · · · · · · · · · · · · · · · · · · · · · 25Jarmo Karesto, Finpro4.1 Drivers in wireless content· · · · · · · · · · · · · · · · · · · · · · · · · · · · · · · · · · · · · · · · · 274.2 From mobile phones to wireless devices · · · · · · · · · · · · · · · · · · · · · · · · · · · · · 274.3 Customer segmentation · · · · · · · · · · · · · · · · · · · · · · · · · · · · · · · · · · · · · · · · · · 294.4 Alternative network connections · · · · · · · · · · · · · · · · · · · · · · · · · · · · · · · · · · · · 294.5 Wireless Internet · · · · · · · · · · · · · · · · · · · · · · · · · · · · · · · · · · · · · · · · · · · · · · · · 294.6 Programmability· · · · · · · · · · · · · · · · · · · · · · · · · · · · · · · · · · · · · · · · · · · · · · · · · 30
4.7 Personality · · · · · · · · · · · · · · · · · · · · · · · · · · · · · · · · · · · · · · · · · · · · · · · · · · · · · 304.8 Location identity · · · · · · · · · · · · · · · · · · · · · · · · · · · · · · · · · · · · · · · · · · · · · · · · 304.9 Safety and security · · · · · · · · · · · · · · · · · · · · · · · · · · · · · · · · · · · · · · · · · · · · · · 31
5 Promising standards and technology platforms· · · · · · · · · · · · · · · · · · · · · · · · · · · 33Jarmo Karesto, Finpro5.1 The evolution of third generation cellular networks· · · · · · · · · · · · · · · · · · · · · · 335.2 3G technology strategy plans by operators in major markets· · · · · · · · · · · · · · 365.3 CDMA terminology and definitions · · · · · · · · · · · · · · · · · · · · · · · · · · · · · · · · · · 385.4 W-CDMA · · · · · · · · · · · · · · · · · · · · · · · · · · · · · · · · · · · · · · · · · · · · · · · · · · · · · · 395.5 WAP · · · · · · · · · · · · · · · · · · · · · · · · · · · · · · · · · · · · · · · · · · · · · · · · · · · · · · · · 395.6 I-mode and other Japanese 3G approaches· · · · · · · · · · · · · · · · · · · · · · · · · · · 405.7 Bluetooth · · · · · · · · · · · · · · · · · · · · · · · · · · · · · · · · · · · · · · · · · · · · · · · · · · · · · · 415.8 Wireless local area networks · · · · · · · · · · · · · · · · · · · · · · · · · · · · · · · · · · · · · · · 415.9 Operating systems in mobile devices, EPOC, Palm OS, and Windows CE · · · 415.10 Mobile Internet Protocol Version 6 · · · · · · · · · · · · · · · · · · · · · · · · · · · · · · · · · · 425.11 Major technology suppliers by key categories · · · · · · · · · · · · · · · · · · · · · · · · · 435.12 Useful links to get more free information: · · · · · · · · · · · · · · · · · · · · · · · · · · · · · 44
6 Trends in The Global business environment · · · · · · · · · · · · · · · · · · · · · · · · · · · · · · 45Michael Lovejoy, Finpro6.1 “Turbulent times” · · · · · · · · · · · · · · · · · · · · · · · · · · · · · · · · · · · · · · · · · · · · · · · · 456.2 Convergence · · · · · · · · · · · · · · · · · · · · · · · · · · · · · · · · · · · · · · · · · · · · · · · · · · · 456.3 Globalization · · · · · · · · · · · · · · · · · · · · · · · · · · · · · · · · · · · · · · · · · · · · · · · · · · · 466.4 Transnationalism · · · · · · · · · · · · · · · · · · · · · · · · · · · · · · · · · · · · · · · · · · · · · · · · 476.5 Virtual Integration· · · · · · · · · · · · · · · · · · · · · · · · · · · · · · · · · · · · · · · · · · · · · · · · 476.6 Importance of place· · · · · · · · · · · · · · · · · · · · · · · · · · · · · · · · · · · · · · · · · · · · · · 506.7 New model of production in the ICT industry · · · · · · · · · · · · · · · · · · · · · · · · · · 526.8 Globalization of the EMS model · · · · · · · · · · · · · · · · · · · · · · · · · · · · · · · · · · · · 536.9 Types of outsourcing services offered and utilized · · · · · · · · · · · · · · · · · · · · · · 556.10 Thoughts for the future · · · · · · · · · · · · · · · · · · · · · · · · · · · · · · · · · · · · · · · · · · · 57
7 Generic growth strategies for technology companiesin the network environment · · · · · · · · · · · · · · · · · · · · · · · · · · · · · · · · · · · · · · · · · · · 59Vipul Chauhan, Helsinki Univeristy of Technology,Jarmo Karesto, Finpro7.1 Product strategy · · · · · · · · · · · · · · · · · · · · · · · · · · · · · · · · · · · · · · · · · · · · · · · · 607.2 Strategic roles of collaboration · · · · · · · · · · · · · · · · · · · · · · · · · · · · · · · · · · · · · 617.3 Competence leverage in key customer relationship · · · · · · · · · · · · · · · · · · · · · 627.4 Key customer-driven growth strategies· · · · · · · · · · · · · · · · · · · · · · · · · · · · · · · 637.5 Key customer risk · · · · · · · · · · · · · · · · · · · · · · · · · · · · · · · · · · · · · · · · · · · · · · · 647.6 Managing Intellectual Property · · · · · · · · · · · · · · · · · · · · · · · · · · · · · · · · · · · · · 64
7.6.1 IP Rights Protection: Strategic Aspect · · · · · · · · · · · · · · · · · · · · · · · · · 647.6.2 IP Rights in Relationships · · · · · · · · · · · · · · · · · · · · · · · · · · · · · · · · · · · 64
8 Getting global, road map for technology firms · · · · · · · · · · · · · · · · · · · · · · · · · · · · 65Lasse Baldauf, Finpro8.1 Which direction? · · · · · · · · · · · · · · · · · · · · · · · · · · · · · · · · · · · · · · · · · · · · · · · · 658.2 Needs and requirements for global business · · · · · · · · · · · · · · · · · · · · · · · · · · 658.3 The process for establishing a business abroad · · · · · · · · · · · · · · · · · · · · · · · · 688.4 Wireless telecommunications industry value chain · · · · · · · · · · · · · · · · · · · · · · 698.5 Connections to the business environment · · · · · · · · · · · · · · · · · · · · · · · · · · · · 728.6 Importance of the cluster for SME’s · · · · · · · · · · · · · · · · · · · · · · · · · · · · · · · · · 738.7 Key Success Factors · · · · · · · · · · · · · · · · · · · · · · · · · · · · · · · · · · · · · · · · · · · · · 73

9 Benchmarked companies · · · · · · · · · · · · · · · · · · · · · · · · · · · · · · · · · · · · · · · · · · · · · 75Lasse Baldauf, Finpro9.1 General · · · · · · · · · · · · · · · · · · · · · · · · · · · · · · · · · · · · · · · · · · · · · · · · · · · · · · · 759.2 Motorola· · · · · · · · · · · · · · · · · · · · · · · · · · · · · · · · · · · · · · · · · · · · · · · · · · · · · · · 75
9.2.1 Key figures, major businesses· · · · · · · · · · · · · · · · · · · · · · · · · · · · · · · · 759.2.2 Global map · · · · · · · · · · · · · · · · · · · · · · · · · · · · · · · · · · · · · · · · · · · · · · 759.2.3 Business strategy · · · · · · · · · · · · · · · · · · · · · · · · · · · · · · · · · · · · · · · · · 769.2.4 Research and development· · · · · · · · · · · · · · · · · · · · · · · · · · · · · · · · · · 769.2.5 Distributors · · · · · · · · · · · · · · · · · · · · · · · · · · · · · · · · · · · · · · · · · · · · · · 769.2.6 Contract electronic manufacturers · · · · · · · · · · · · · · · · · · · · · · · · · · · · 76
9.3 Siemens · · · · · · · · · · · · · · · · · · · · · · · · · · · · · · · · · · · · · · · · · · · · · · · · · · · · · · · 779.3.1 Key figures, major businesses· · · · · · · · · · · · · · · · · · · · · · · · · · · · · · · · 779.3.2 Global map · · · · · · · · · · · · · · · · · · · · · · · · · · · · · · · · · · · · · · · · · · · · · · 779.3.3 Business strategy · · · · · · · · · · · · · · · · · · · · · · · · · · · · · · · · · · · · · · · · · 779.3.4 Research and development· · · · · · · · · · · · · · · · · · · · · · · · · · · · · · · · · · 789.3.5 Distributors · · · · · · · · · · · · · · · · · · · · · · · · · · · · · · · · · · · · · · · · · · · · · · 789.3.6 Contract electronic manufacturers · · · · · · · · · · · · · · · · · · · · · · · · · · · · 78
9.4 Matsushita (Panasonic) · · · · · · · · · · · · · · · · · · · · · · · · · · · · · · · · · · · · · · · · · · · 799.4.1 Key figures, major businesses· · · · · · · · · · · · · · · · · · · · · · · · · · · · · · · · 799.4.2 Global map · · · · · · · · · · · · · · · · · · · · · · · · · · · · · · · · · · · · · · · · · · · · · · 799.4.3 Strategy · · · · · · · · · · · · · · · · · · · · · · · · · · · · · · · · · · · · · · · · · · · · · · · · · 799.4.4 Research and development· · · · · · · · · · · · · · · · · · · · · · · · · · · · · · · · · · 809.4.5 Contract manufacturers· · · · · · · · · · · · · · · · · · · · · · · · · · · · · · · · · · · · · 80
9.5 Samsung · · · · · · · · · · · · · · · · · · · · · · · · · · · · · · · · · · · · · · · · · · · · · · · · · · · · · · 809.5.1 Key figures, major businesses· · · · · · · · · · · · · · · · · · · · · · · · · · · · · · · · 809.5.2 Global map · · · · · · · · · · · · · · · · · · · · · · · · · · · · · · · · · · · · · · · · · · · · · · 809.5.3 Strategy · · · · · · · · · · · · · · · · · · · · · · · · · · · · · · · · · · · · · · · · · · · · · · · · · 809.5.4 Research and development· · · · · · · · · · · · · · · · · · · · · · · · · · · · · · · · · · 809.5.5 Contract electronics manufacturers · · · · · · · · · · · · · · · · · · · · · · · · · · · 80
9.6 Nortel Networks · · · · · · · · · · · · · · · · · · · · · · · · · · · · · · · · · · · · · · · · · · · · · · · · · 819.6.1 Key figures, major businesses· · · · · · · · · · · · · · · · · · · · · · · · · · · · · · · · 819.6.2 Global map · · · · · · · · · · · · · · · · · · · · · · · · · · · · · · · · · · · · · · · · · · · · · · 819.6.3 Strategy · · · · · · · · · · · · · · · · · · · · · · · · · · · · · · · · · · · · · · · · · · · · · · · · · 829.6.4 Research and development· · · · · · · · · · · · · · · · · · · · · · · · · · · · · · · · · · 829.6.5 Outsourcing, suppliers · · · · · · · · · · · · · · · · · · · · · · · · · · · · · · · · · · · · · 82
9.7 Cisco Systems· · · · · · · · · · · · · · · · · · · · · · · · · · · · · · · · · · · · · · · · · · · · · · · · · · 829.7.1 Key figures, major businesses· · · · · · · · · · · · · · · · · · · · · · · · · · · · · · · · 829.7.2 Global map · · · · · · · · · · · · · · · · · · · · · · · · · · · · · · · · · · · · · · · · · · · · · · 829.7.3 Strategy · · · · · · · · · · · · · · · · · · · · · · · · · · · · · · · · · · · · · · · · · · · · · · · · · 829.7.4 Research and development· · · · · · · · · · · · · · · · · · · · · · · · · · · · · · · · · · 839.7.5 Distributors · · · · · · · · · · · · · · · · · · · · · · · · · · · · · · · · · · · · · · · · · · · · · · 839.7.6 Contract electronic manufacturers · · · · · · · · · · · · · · · · · · · · · · · · · · · · 83
9.8 Solectron · · · · · · · · · · · · · · · · · · · · · · · · · · · · · · · · · · · · · · · · · · · · · · · · · · · · · · 839.8.1 Key figures, major businesses· · · · · · · · · · · · · · · · · · · · · · · · · · · · · · · · 839.8.2 Global map · · · · · · · · · · · · · · · · · · · · · · · · · · · · · · · · · · · · · · · · · · · · · · 839.8.3 Strategy · · · · · · · · · · · · · · · · · · · · · · · · · · · · · · · · · · · · · · · · · · · · · · · · · 839.8.4 Research and development· · · · · · · · · · · · · · · · · · · · · · · · · · · · · · · · · · 849.8.5 Key customers· · · · · · · · · · · · · · · · · · · · · · · · · · · · · · · · · · · · · · · · · · · · 84
9.9 Celestica · · · · · · · · · · · · · · · · · · · · · · · · · · · · · · · · · · · · · · · · · · · · · · · · · · · · · · 849.9.1 Key figures, major businesses· · · · · · · · · · · · · · · · · · · · · · · · · · · · · · · · 849.9.2 Global map · · · · · · · · · · · · · · · · · · · · · · · · · · · · · · · · · · · · · · · · · · · · · · 859.9.3 Strategy · · · · · · · · · · · · · · · · · · · · · · · · · · · · · · · · · · · · · · · · · · · · · · · · · 859.9.4 Research and development· · · · · · · · · · · · · · · · · · · · · · · · · · · · · · · · · · 859.9.5 Key customers· · · · · · · · · · · · · · · · · · · · · · · · · · · · · · · · · · · · · · · · · · · · 85
9.10 Flextronics · · · · · · · · · · · · · · · · · · · · · · · · · · · · · · · · · · · · · · · · · · · · · · · · · · · · · 859.10.1 Key figures, major businesses· · · · · · · · · · · · · · · · · · · · · · · · · · · · · · · · 859.10.2 Global map · · · · · · · · · · · · · · · · · · · · · · · · · · · · · · · · · · · · · · · · · · · · · · 859.10.3 Strategy · · · · · · · · · · · · · · · · · · · · · · · · · · · · · · · · · · · · · · · · · · · · · · · · · 869.10.4 Research and development· · · · · · · · · · · · · · · · · · · · · · · · · · · · · · · · · · 869.10.5 Key customers· · · · · · · · · · · · · · · · · · · · · · · · · · · · · · · · · · · · · · · · · · · · 86
10 Conclusion · · · · · · · · · · · · · · · · · · · · · · · · · · · · · · · · · · · · · · · · · · · · · · · · · · · · · · · · · 87
Appendix 1 The NACE codes utilized in the calculation of economic indicatorsfor the ICT cluster · · · · · · · · · · · · · · · · · · · · · · · · · · · · · · · · · · · · · · · · · · · · · 89
Appendix 2 Measuring the export specialization of a country · · · · · · · · · · · · · · · · · · · · · 91
Technology Reviews from Tekes · · · · · · · · · · · · · · · · · · · · · · · · · · · · · · · · · · · · · · · · · · 93

1 Executive summary
Production of Telecommunications equipment in Finlandincreased from about 5 Billion Fim in 1990 to nearby 80Billion Fim in 2000. The production incorporates directlyseveral hundred companies in electronics, metal, plasticand software industries and employs approximately 40–50.000 people. Major part of the production was exported.This miraculous development is a sum of many factors,which have successfully supported each other. Liberaliza-tion of telecom services in early stage, building NMT net-work jointly with the other Nordic countries, great successof mobile phones worldwide, opening of telecom servicesfor competition globally and growth of Nokia are all fac-tors which have contributed to the success and created avery strong telecommunication industry in Finland. As aresult the Finnish telecom technology know-how today isworld class.
However this blessed situation is extremely fragile andcontinuous growth is not at all granted. Nokia’s role as a lo-comotive of the whole cluster in Finland will probably notcontinue forever. Nokia is growing fast outside Finland.More and more decision makers in Nokia’s organizationare representing other nationalities than Finns and we allknow how important personal relationships are in business.At this moment the most critical issue is the international-ization of the cluster. If the smaller technology and servicecompanies in the cluster can expand their business to newcustomers globally, it reduces their operational risk and theimpact on the whole Finnish economy.
The companies in telecom business face new type of chal-lenges. Technology is developing fast and the future is notat all predictable. The business is much more innovationdriven than capital driven. Merge of Internet, mobilephones and computers may create totally new needs forservices and products, which are not identified yet. Thebusiness environment is moving fast. Earlier several lo-cally operating companies in each business were sharingthe market but the trend is to smaller number but globallyoperating key players. This is a result of globalization.R&D and production are organized globally according tothe rules of the business not by following artificial bordersand barriers. This new world map shows how R&D and
production are concentrating in few locations. In the “R&Dmap” Finland and Sweden are centrally located besideUSA and Japan. Manufacturing sites are locating nearmain markets. The other trend is networking. Companiesare outsourcing non-critical activities and enhancing col-laboration with partners and even competitors. Nokia is agood example of this. Totally new actors, like global pro-viders of contract manufacturing services, have emerged inthe business rebuilding the value chain. Speed has becomea crucial competitive edge. Cisco System’s famous slogan“Innovations by acquisitions” describes well the phenome-non. Companies are no longer doing everything by them-selves anymore as it was still few years ago.
Globalization and networking open totally new possibili-ties for smaller technology companies but the old strategiesdo not work any more. Global approach, focus on cus-tomer, concentration on core competencies, understandingvalue networks and the progress in business environment,networking with others, speed and capability to finance thefast growth are raw materials in building a successful strat-egy in telecom technology business. A key customer rela-tionship can be a springboard to new customers and even tonew businesses as many of the Nokia’s smaller partnershave recognized. Innovations, work processes, references,social competencies among many others are gaining im-portance beside technical competencies in new businessenvironment.
What should then be done to ensure that success continues?As mentioned earlier the most critical issue is the interna-tionalization of the cluster. It is important to capitalize onthe success with Nokia when entering new markets. Thiscan translate to a speedier access to new customers andability to manage the business through international net-working. The focus of the national system of innovationshould be more on innovativeness, global customer needsand ability to help the smaller companies in organizingtheir operations in international market environment. Thekey issue for public supporting organizations involved is tounderstand the new logic of the global telecom businessand develop their services and mutual cooperation accord-ingly.
1

2 Introduction
This report is an outcome of the Global Networking in Mo-bile Teletech business project conducted by the leadingtechnology companies in mobile business in Finland (CCCGroup, Elektrobit Oy, Fortel Invest Oy, JOT AutomationOy, Orbis Oy and Nokia Mobile Phones) Tekes (the Na-tional Technology Agency) and Technopolis Oyj. Finprohas been in charge of managing the project and producingthis report.
The goal of the project was to support the strategy processof each participant in the fast transforming business envi-ronment. The major focus was on mobile technology busi-ness, global business environment, corporate strategies,networking and small and medium-sized enterprise ap-proach. Mobile services and applications were just brieflydiscussed when they had some relevance with technologybusiness (but otherwise they were left out of this study).
The project was carried out between fall 2000 and summer2001. The working methods were workshops, study toursto USA, Germany and Japan and the company bench-marking studies. ETLA (the Research Institute of FinnishEconomy) and Helsinki University of Technology werehelping by carrying out part of the research work.
The chapter ICT Cluster in Finnish Economy is a brief butan important review of the emergence and development ofthe telecom industry in Finland. The formation of the clus-ter and the growth of Nokia have mainly taken place in1990’s but their roots are much deeper in the history. Spe-cial focus is put on cluster analysis to help the reader to un-derstand the importance of various elements in the businessenvironment which are discussed in later chapters. TheICT Cluster in Finnish Economy chapter was written byLaura Paija from ETLA.
The Chapter Trends in Wireless Services and Productssummarizes the various thoughts and views about theemerging customer needs defining the direction for thewhole business. The chapter is not a comprehensive studyof the subject but rather a summary of the those issues onwhich the leading people in the industry believe today.Customer needs concerning services and physical productsare driving the business but hardware products and soft-ware applications make the services possible.
The chapter Emerging Standards and Technology Plat-forms is worked out similar way as the previous chapter.The focus in this chapter has been on identifying thosetechnological standards, either official or de facto, andplatforms that are supposed to play important role in theforeseeable future. Standards and platforms create a solidbase for fast changing, short time living products and ser-vices aimed at end users. They can also be important cornerstones in strategies of small technology companies.
The chapter Trends in Global Business environment dis-cuss the forces and development trends, which are redraw-ing the business environment making the old strategies ob-solete. Liberalization of global trade and investmentsmakes it possible for businesses to reorganize globallytheir activities following the laws of business, not accord-ing to artificial regulations and boundaries. Fast develop-ing information and communication technologies and lo-gistical services greatly support this trend. Global businessnetworks are emerging. Firms focus on their core compe-tencies and grow their added value through alliances andcooperation. Old value chains are redrawn. Nokia, Elcoteq,JOT Automation and Elektrobit are good examples of com-panies, which have understood the ongoing change andhave been able to quickly utilize the emerging opportuni-ties in their businesses.
The chapter Generic Growth Strategies for TechnologyCompanies in Network Environment focuses on corporatestrategies. This chapter is an introduction to the followingchapter Getting global, Road Map for Technology Firms.The chapter introduces and offers generic strategy alterna-tives for small and medium-sized technology enterprises innetwork environment. This part was created together withthe Institute of Strategy and International Business ofHelsinki University of Technology. In the chapter Gettingglobal, Road Map for Technology Firms the focus isturned to mobile telecom business in global market envi-ronment. The chapter introduces business cases and mod-els and is created by studying various Finnish and interna-tional companies in Europe, USA and Asia.
3

The chapter Benchmarked Companies introduces severalleading technology companies, their strategies and activi-ties in mobile business. The companies were selectedbased on their importance for Finnish industry or based ontheir interesting business models. The benchmarked com-panies were thoroughly studied and interviewed. Summaryof strategies, business models and other key findings arepresented in this chapter.
The last chapter Conclusions outlines the key findings ofthis project and gives recommendations to governmentaland public business development organizations workingclosely with the ITC-cluster.
4
3 The ICT cluster in the Finnish economy
Laura Paija, ETLA
3.1 ICT cluster identification
3.1.1 What is a cluster?1
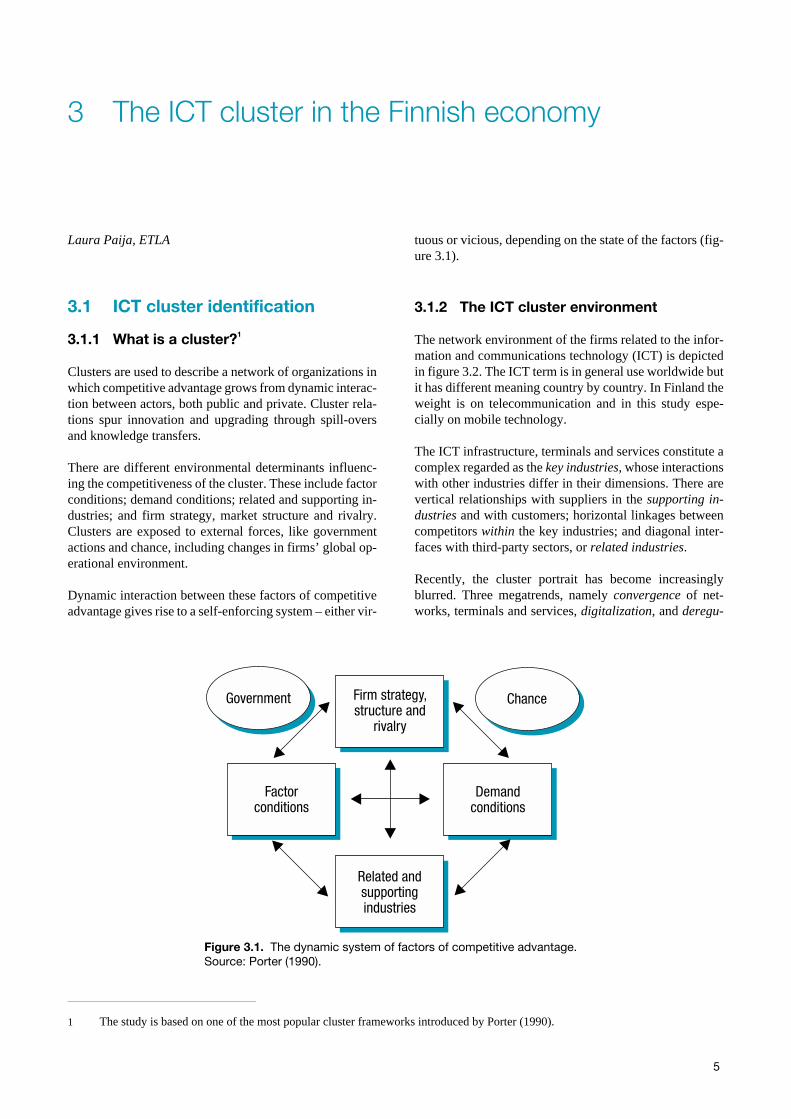
Clusters are used to describe a network of organizations inwhich competitive advantage grows from dynamic interac-tion between actors, both public and private. Cluster rela-tions spur innovation and upgrading through spill-oversand knowledge transfers.
There are different environmental determinants influenc-ing the competitiveness of the cluster. These include factorconditions; demand conditions; related and supporting in-dustries; and firm strategy, market structure and rivalry.Clusters are exposed to external forces, like governmentactions and chance, including changes in firms’ global op-erational environment.
Dynamic interaction between these factors of competitiveadvantage gives rise to a self-enforcing system – either vir-
tuous or vicious, depending on the state of the factors (fig-ure 3.1).
3.1.2 The ICT cluster environment
The network environment of the firms related to the infor-mation and communications technology (ICT) is depictedin figure 3.2. The ICT term is in general use worldwide butit has different meaning country by country. In Finland theweight is on telecommunication and in this study espe-cially on mobile technology.
The ICT infrastructure, terminals and services constitute acomplex regarded as the key industries, whose interactionswith other industries differ in their dimensions. There arevertical relationships with suppliers in the supporting in-dustries and with customers; horizontal linkages betweencompetitors within the key industries; and diagonal inter-faces with third-party sectors, or related industries.
Recently, the cluster portrait has become increasinglyblurred. Three megatrends, namely convergence of net-works, terminals and services, digitalization, and deregu-
5
Firm strategy,structure and
rivalry
Demandconditions
Related andsupportingindustries
Factorconditions
Government Chance
Figure 3.1. The dynamic system of factors of competitive advantage.Source: Porter (1990).
1 The study is based on one of the most popular cluster frameworks introduced by Porter (1990).
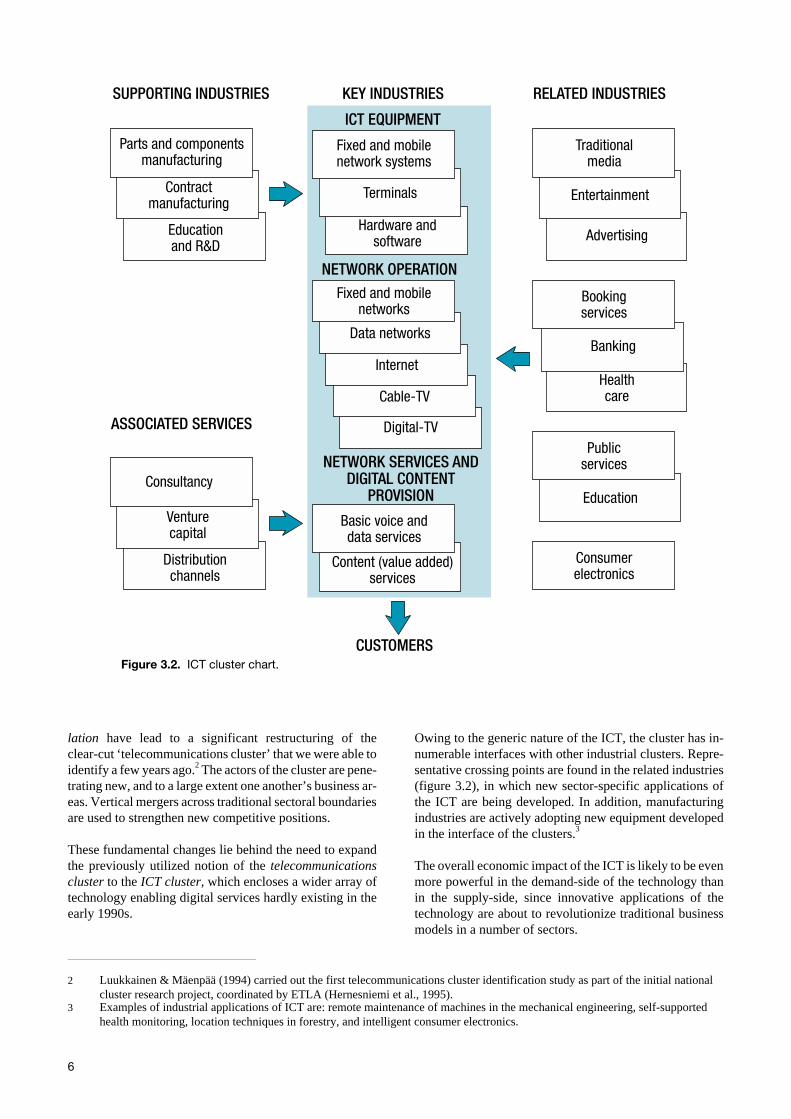
lation have lead to a significant restructuring of theclear-cut ‘telecommunications cluster’ that we were able toidentify a few years ago.2 The actors of the cluster are pene-trating new, and to a large extent one another’s business ar-eas. Vertical mergers across traditional sectoral boundariesare used to strengthen new competitive positions.
These fundamental changes lie behind the need to expandthe previously utilized notion of the telecommunicationscluster to the ICT cluster, which encloses a wider array oftechnology enabling digital services hardly existing in theearly 1990s.
Owing to the generic nature of the ICT, the cluster has in-numerable interfaces with other industrial clusters. Repre-sentative crossing points are found in the related industries(figure 3.2), in which new sector-specific applications ofthe ICT are being developed. In addition, manufacturingindustries are actively adopting new equipment developedin the interface of the clusters.3
The overall economic impact of the ICT is likely to be evenmore powerful in the demand-side of the technology thanin the supply-side, since innovative applications of thetechnology are about to revolutionize traditional businessmodels in a number of sectors.
6
KEY INDUSTRIES
NETWORK OPERATION
NETWORK SERVICES ANDDIGITAL CONTENT
PROVISION
ICT EQUIPMENT
Hardware andsoftware
Terminals
Fixed and mobilenetwork systems
Digital-TV
Cable-TV
Internet
Data networks
Fixed and mobilenetworks
Content (value added)services
Basic voice anddata services
SUPPORTING INDUSTRIES
Educationand R&D
Contractmanufacturing
Parts and componentsmanufacturing
RELATED INDUSTRIES
Advertising
Entertainment
Traditionalmedia
Healthcare
Banking
Bookingservices
Education
Publicservices
Consumerelectronics
ASSOCIATED SERVICES
CUSTOMERS
Distributionchannels
Venturecapital
Consultancy
Figure 3.2. ICT cluster chart.
2 Luukkainen & Mäenpää (1994) carried out the first telecommunications cluster identification study as part of the initial nationalcluster research project, coordinated by ETLA (Hernesniemi et al., 1995).
3 Examples of industrial applications of ICT are: remote maintenance of machines in the mechanical engineering, self-supportedhealth monitoring, location techniques in forestry, and intelligent consumer electronics.
3.2 The economic relevance ofthe ICT cluster
3.2.1 Domestic market position
The key figures of the ICT cluster for 1998 are presented intable 3.1.4 The gross value of the cluster was EUR 17.5 bil-lion. Manufacturing of equipment and their electroniccomponents dominated the cluster, accruing two thirds ofthe production value, while the share of telecommunica-tions services was one fifth of the value. The significanceof software supply and other IT services is underestimated
in the table since ICT equipment include an importantamount of software, and the construction of telecommuni-cations networks involves IT services that is included in thesales of equipment manufactures. The value-added gener-ated in the cluster was in average 43 per cent of the grossvalue, ranging though between the sub-sectors of the clus-ter (see table).
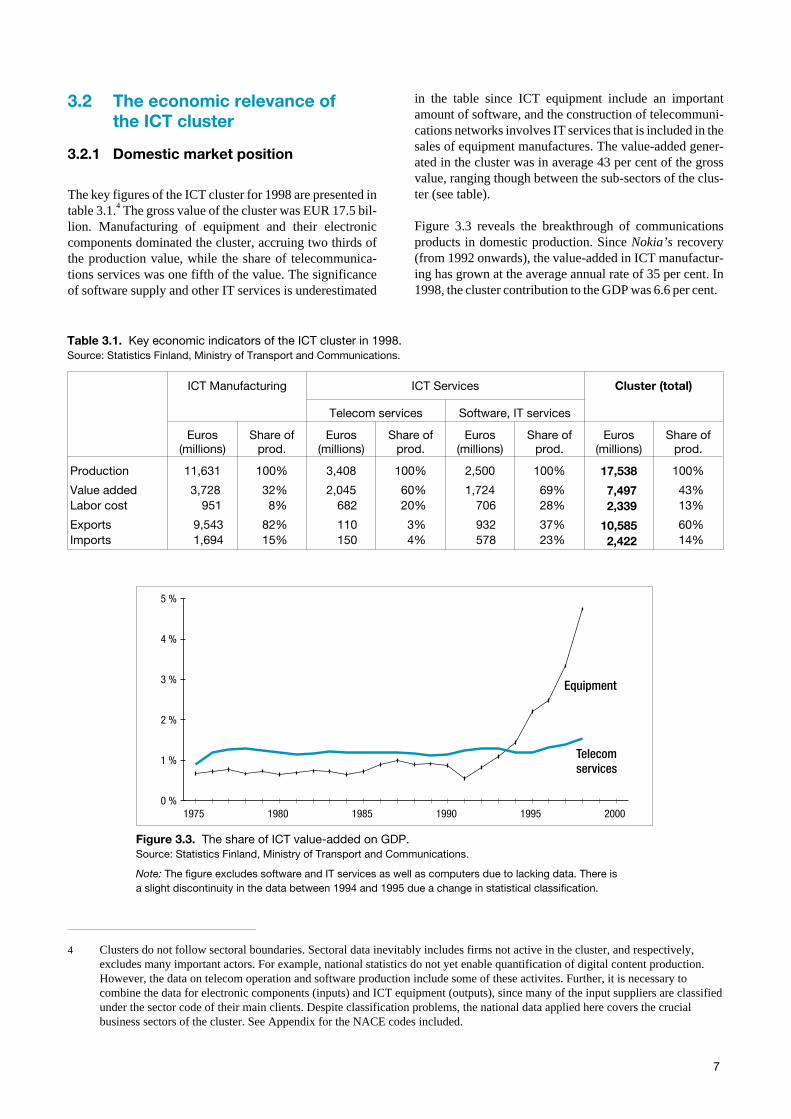
Figure 3.3 reveals the breakthrough of communicationsproducts in domestic production. Since Nokia’s recovery(from 1992 onwards), the value-added in ICT manufactur-ing has grown at the average annual rate of 35 per cent. In1998, the cluster contribution to the GDP was 6.6 per cent.
7
ICT Manufacturing ICT Services Cluster (total)
Telecom services Software, IT services
Euros(millions)
Share ofprod.
Euros(millions)
Share ofprod.
Euros(millions)
Share ofprod.
Euros(millions)
Share ofprod.
Production
Value addedLabor cost
ExportsImports
11,631
3,728951
9,5431,694
100%
32%8%
82%15%
3,408
2,045682
110150
100%
60%20%
3%4%
2,500
1,724706
932578
100%
69%28%
37%23%
17,538
7,4972,339
10,5852,422
100%
43%13%
60%14%
Table 3.1. Key economic indicators of the ICT cluster in 1998.Source: Statistics Finland, Ministry of Transport and Communications.
1975 1980 1985 1990 1995 20000 %
1 %
2 %
3 %
4 %
5 %
Equipment
Telecomservices
Figure 3.3. The share of ICT value-added on GDP.Source: Statistics Finland, Ministry of Transport and Communications.
Note: The figure excludes software and IT services as well as computers due to lacking data. There isa slight discontinuity in the data between 1994 and 1995 due a change in statistical classification.
4 Clusters do not follow sectoral boundaries. Sectoral data inevitably includes firms not active in the cluster, and respectively,excludes many important actors. For example, national statistics do not yet enable quantification of digital content production.However, the data on telecom operation and software production include some of these activites. Further, it is necessary tocombine the data for electronic components (inputs) and ICT equipment (outputs), since many of the input suppliers are classifiedunder the sector code of their main clients. Despite classification problems, the national data applied here covers the crucialbusiness sectors of the cluster. See Appendix for the NACE codes included.
With its 75,000 employees, the ICT cluster accounted for 3per cent of the total national employment in 1998. Nokiaalone employed 21,000 persons in Finland and thus ac-counted directly for almost 30 per cent of the cluster employ-ment. According to estimations Nokia employed indirectlyan additional 14,000 persons through its first-tier subcon-tractor firms.5 As production networks go further to sequen-tial tiers, the employment effect of the major firm is signifi-cant, but cannot be readily quantified. However, without thechronic shortage of skilled labor the employment potentialof the cluster would allow much higher recruitment.
3.2.2 Foreign trade and internationalmarket position
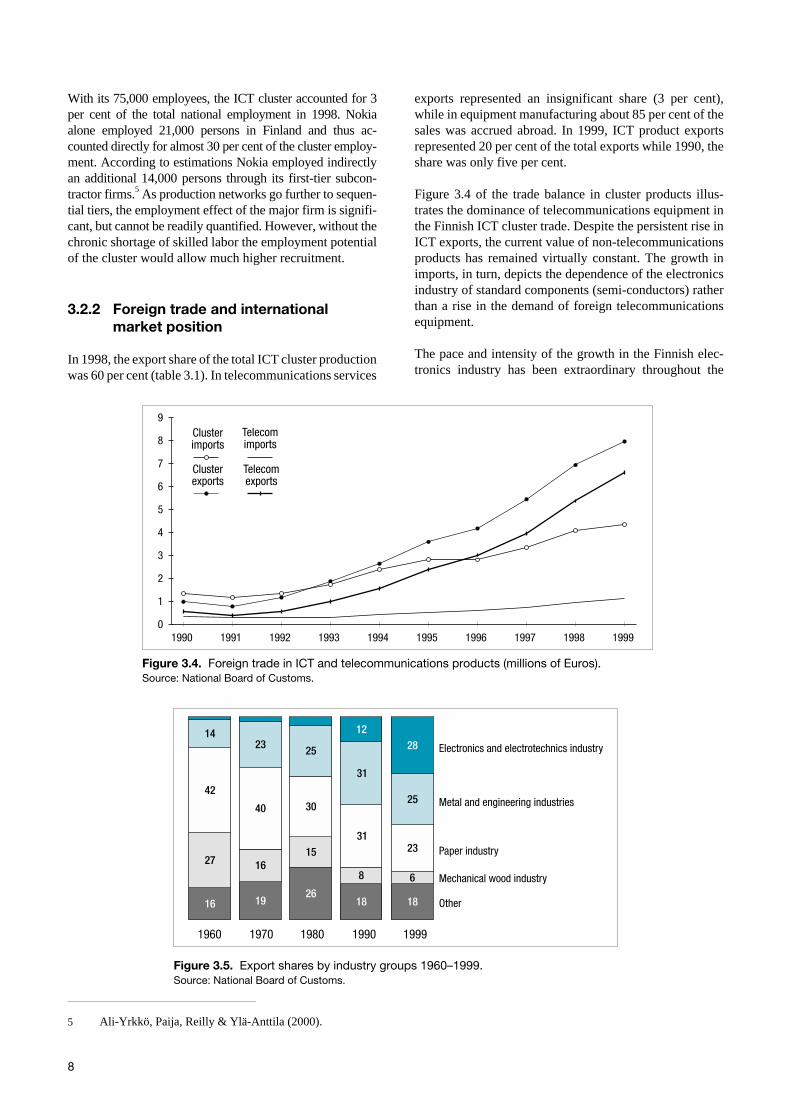
In 1998, the export share of the total ICT cluster productionwas 60 per cent (table 3.1). In telecommunications services
exports represented an insignificant share (3 per cent),while in equipment manufacturing about 85 per cent of thesales was accrued abroad. In 1999, ICT product exportsrepresented 20 per cent of the total exports while 1990, theshare was only five per cent.
Figure 3.4 of the trade balance in cluster products illus-trates the dominance of telecommunications equipment inthe Finnish ICT cluster trade. Despite the persistent rise inICT exports, the current value of non-telecommunicationsproducts has remained virtually constant. The growth inimports, in turn, depicts the dependence of the electronicsindustry of standard components (semi-conductors) ratherthan a rise in the demand of foreign telecommunicationsequipment.
The pace and intensity of the growth in the Finnish elec-tronics industry has been extraordinary throughout the
8
1990 1991 1992 1993 1994 1995 1996 1997 1998 19990
1
2
3
4
5
6
7
8
9Clusterimports
Clusterexports
Telecomimports
Telecomexports
Figure 3.4. Foreign trade in ICT and telecommunications products (millions of Euros).Source: National Board of Customs.
1228
1423 25
31
2542
40 30
3123
27 1615
8 6
16 1926
18 18
Electronics and electrotechnics industry
Metal and engineering industries
Paper industry
Mechanical wood industry
Other
1990198019701960 1999
Figure 3.5. Export shares by industry groups 1960–1999.Source: National Board of Customs.
5 Ali-Yrkkö, Paija, Reilly & Ylä-Anttila (2000).

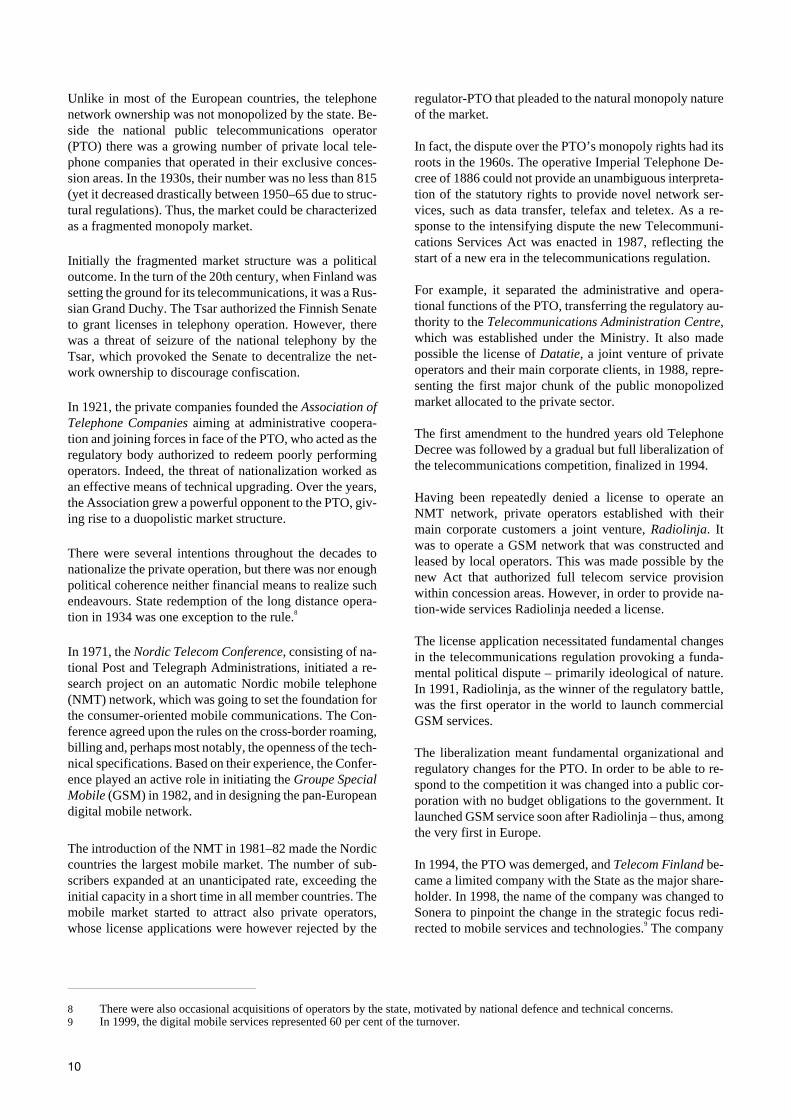
1990s. It has lead to an industrial restructuring in the for-mer forest and metal based economy, in which knowledgehas replaced capital, raw materials and energy as the domi-nant factors of production. During the past decade, Finlandbecame the world leader in high-tech trade surplus (high-tech exports/imports ratio) among indigenous high- techproducers. The share of electronics and electrotechnics ex-ports has almost tripled at the expense of pulp and paperand metals, representing close to 30 per cent of the totalmanufacturing exports in 1999 (figure 3.5).
In OECD comparison, Finland ranked the second in ICTexports specialization after Japan in 1997 (figure 3.6 left;see Appendix 2 for the definition). Limiting the compari-son to telecommunications equipment6 reveals that Finlandhad become the most telecommunications-oriented coun-try in its exports in 1998 (figure 3.6 right). During the1990s, Japan has lost its lead to the two Nordic countries,which have been racing for the leading position. In abso-lute terms, Finland accounted for 4.4 per cent of totalOECD telecommunications equipment exports, being inthe seventh position in cross-country comparison in 1997.7
3.3 The evolution ofthe ICT cluster
3.3.1 Network operation – a fragmentedmonopoly market
Despite the prominent role the telecommunications manu-facturing sector has played in the recent industrial struc-tural change in Finland, a glance at the history reveals thatit was the advanced network operation – rather than equip-ment manufacturing – that formed the ground for the indus-try to develop.
Since its early days, the Finnish telecommunications mar-ket has had a tendency of early adoption of the latest tech-nology – both in the manufacturing and operator sector.The first indication of this feature was the introduction ofthe telephone in Finland only a year after its invention in1876. The first telephone companies were established in1882, and by the end of the century, all the cities of Finlandhad a telephone company.
9
Finland
Sweden
UK
Japan
USA19971990
ICT equipment
Finland
Sweden
UK
Japan
USA
1998
-0.2 0.20 0.4 0.6 0.8 -0.2 0.20 0.4 0.6 0.8
19971990
Telecom equipment
Figure 3.6. Export specialization in 1997 (RSCA index). Source: OECD.
Note: The 1998 data was not yet available for all countries. See Appendix 2 for the definition of the RSCA index.
6 SITC rev3 class 764 (Telecommunications equipment n.e.s & parts n.e.s).7 Shares of OECD telecommunications exports in 1997 (totalling USD 104 billion):
1. USA 20.52. Japan 14.53. UK 9.74. Sweden 9.55. Germany 8.66. France 6.17. Finland 4.48. Korea 4.49. Canada 4.2
10. Mexico 4.2
Unlike in most of the European countries, the telephonenetwork ownership was not monopolized by the state. Be-side the national public telecommunications operator(PTO) there was a growing number of private local tele-phone companies that operated in their exclusive conces-sion areas. In the 1930s, their number was no less than 815(yet it decreased drastically between 1950–65 due to struc-tural regulations). Thus, the market could be characterizedas a fragmented monopoly market.
Initially the fragmented market structure was a politicaloutcome. In the turn of the 20th century, when Finland wassetting the ground for its telecommunications, it was a Rus-sian Grand Duchy. The Tsar authorized the Finnish Senateto grant licenses in telephony operation. However, therewas a threat of seizure of the national telephony by theTsar, which provoked the Senate to decentralize the net-work ownership to discourage confiscation.
In 1921, the private companies founded the Association ofTelephone Companies aiming at administrative coopera-tion and joining forces in face of the PTO, who acted as theregulatory body authorized to redeem poorly performingoperators. Indeed, the threat of nationalization worked asan effective means of technical upgrading. Over the years,the Association grew a powerful opponent to the PTO, giv-ing rise to a duopolistic market structure.
There were several intentions throughout the decades tonationalize the private operation, but there was nor enoughpolitical coherence neither financial means to realize suchendeavours. State redemption of the long distance opera-tion in 1934 was one exception to the rule.8
In 1971, the Nordic Telecom Conference, consisting of na-tional Post and Telegraph Administrations, initiated a re-search project on an automatic Nordic mobile telephone(NMT) network, which was going to set the foundation forthe consumer-oriented mobile communications. The Con-ference agreed upon the rules on the cross-border roaming,billing and, perhaps most notably, the openness of the tech-nical specifications. Based on their experience, the Confer-ence played an active role in initiating the Groupe SpecialMobile (GSM) in 1982, and in designing the pan-Europeandigital mobile network.
The introduction of the NMT in 1981–82 made the Nordiccountries the largest mobile market. The number of sub-scribers expanded at an unanticipated rate, exceeding theinitial capacity in a short time in all member countries. Themobile market started to attract also private operators,whose license applications were however rejected by the
regulator-PTO that pleaded to the natural monopoly natureof the market.
In fact, the dispute over the PTO’s monopoly rights had itsroots in the 1960s. The operative Imperial Telephone De-cree of 1886 could not provide an unambiguous interpreta-tion of the statutory rights to provide novel network ser-vices, such as data transfer, telefax and teletex. As a re-sponse to the intensifying dispute the new Telecommuni-cations Services Act was enacted in 1987, reflecting thestart of a new era in the telecommunications regulation.
For example, it separated the administrative and opera-tional functions of the PTO, transferring the regulatory au-thority to the Telecommunications Administration Centre,which was established under the Ministry. It also madepossible the license of Datatie, a joint venture of privateoperators and their main corporate clients, in 1988, repre-senting the first major chunk of the public monopolizedmarket allocated to the private sector.
The first amendment to the hundred years old TelephoneDecree was followed by a gradual but full liberalization ofthe telecommunications competition, finalized in 1994.
Having been repeatedly denied a license to operate anNMT network, private operators established with theirmain corporate customers a joint venture, Radiolinja. Itwas to operate a GSM network that was constructed andleased by local operators. This was made possible by thenew Act that authorized full telecom service provisionwithin concession areas. However, in order to provide na-tion-wide services Radiolinja needed a license.
The license application necessitated fundamental changesin the telecommunications regulation provoking a funda-mental political dispute – primarily ideological of nature.In 1991, Radiolinja, as the winner of the regulatory battle,was the first operator in the world to launch commercialGSM services.
The liberalization meant fundamental organizational andregulatory changes for the PTO. In order to be able to re-spond to the competition it was changed into a public cor-poration with no budget obligations to the government. Itlaunched GSM service soon after Radiolinja – thus, amongthe very first in Europe.
In 1994, the PTO was demerged, and Telecom Finland be-came a limited company with the State as the major share-holder. In 1998, the name of the company was changed toSonera to pinpoint the change in the strategic focus redi-rected to mobile services and technologies.9 The company
10
8 There were also occasional acquisitions of operators by the state, motivated by national defence and technical concerns.9 In 1999, the digital mobile services represented 60 per cent of the turnover.
underwent a quick metamorphosis from a national tele-phony operator to a global pioneer in Internet and mobileapplications.10 The Government has reduced its ownershipand indicated further privatization in due course.
3.3.2 The emergence of thetelecommunications industry
Unlike in many other countries, in Finland the equipmentmarket has always been open to competition. Up until the1980s, the market was dominated by leading foreign manu-facturers, like Siemens, Ericsson, and ITT. Attracted by themulti-operator market, they had set up production facilitiesin Finland. The established, capital-intensive foreign com-panies put a pressure on the emerging domestic industry.To illustrate, in 1970 the turnover of the Siemens Groupwas EUR 2 billion – almost equaling the total Finnish Statebudget of EUR 2.5 billion.11
The seeds of the Finnish radiophone industry were plantedin three companies, Salora, Suomen Kaapelitehdas, andValtion Sähköpaja in the 1920s. New radio technology wastypically developed in the sideline of main activities by fer-vent engineers, often under suspicion and opposition ofconservative colleagues. During a complex organizationalevolution process, finalized in 1987, the three companiesmerged under Nokia’s roof.
Salora (originally Nordell & Korhonen Ltd, established in1928) was a manufacturer of TV and radio sets, whosebrand grew strong beyond national borders. The develop-ment and production of radiophones initiated in 1964 wasbased on pioneering experiments conducted aside core ac-tivities. Salora’s accumulated experience in serial produc-tion and marketing proved valuable in the later mobilephone business development.
Suomen Kaapelitehdas (lit. Finnish Cable Works, foundedin 1917), in turn, was a producer of telecommunications ca-bles. The trade with the Soviet Union, originated during thedeliveries of war indemnities, was decisive to the develop-ment of the company’s technical skills. As a demandingbut patient customer, the Soviet Ministry of Communica-tions spurred elaboration of modern digital technology.
The radio laboratory of the Ministry of Defence (estab-lished in 1925) initiated public development and produc-tion of radio equipment. The wars against the Soviet Unionrevealed the strategic need for national development of ra-dio technology. After the wars, the activities were industri-alized by founding Valtion Sähköpaja (lit. State Electric
Works), and in 1948, merged with the R&D unit of thePTO. The company was renamed Televa, and in 1976, itbecame a state-owned limited company serving mostlypublic establishments for which it was the prime, but notexclusive provider.
In 1963, the Army gave a decisive stimulus to the domesticindustry by putting out an invitation for tenders for a radio-phone. This was the first in a series of impulses by whichthe Government provoked companies to exceed their ca-pacity to meet demanding technology requirements. Forthe first time the firms were given an economic motive todevelop a radiophone, generally regarded as a toy for amarginal group of users. In fact, rather than a business op-portunity, firms regarded the order as a chance to give aphysical form to the know-how accumulated in the “backstage” of core operations.
Virtually, the Army did not have the funds to redeem thephone, but for the bidding firms12 the prototypes served indeveloping new portable phones, which soon found theirway to export markets.
In 1966, Suomen Kaapelitehdas was merged with SuomenGummitehdas (lit. Finnish Rubber Works) and Nokia, a100 year-old wood grinding mill that gave its name to thenew corporation. The merger of Suomen Kaapelitehdaswith the companies in stable industries secured sustainedR&D investments in telecommunications, which was nowregarded as one of the strategic business areas of the com-pany.
In the 1970s, it became apparent that the market was toosmall and resources too scarce for parallel development ofdigital exchanges in both Televa and Nokia. Consequently,in 1977, the companies combined their R&D and market-ing efforts on digital transfer technology in a joint venture,Telefenno.
Lengthy and laborious R&D in digital technology led fi-nally, in 1982, to the introduction of the first domestic digi-tal exchange – shortly after the leading resource-intensivemanufacturers Ericsson, AlcateI, ITT and Siemens. It wasthe first fully digital exchange installed in the whole Eu-rope, and thus, served in convincing the market of the do-mestic competence vis-à-vis the foreign manufacturers.For years the exchange was the most successful export arti-cle of Nokia.
In 1979, Nokia and Salora, in turn, joined their comple-mentary resources. The fifty-fifty owned Mobira was setup to market and develop radio technology and especiallythe NMT terminal that was under design in the Nordic
11
10 For example, in December 2000, Sonera was awarded as the best mobile operator in the World Communication Awards 2000.Sonera was granted the award in recognition of its high-quality service and technological innovations. The company was alsoregarded as a European forerunner in developing new mobile communications services.
11 Mäkinen (1995).12 Televa, Suomen Kaapelitehdas, Salora, Vaisala and Swedish Sonab.
Telecom Conference. Mobira was the first to launch a ter-minal approved to the NMT network.
The design phase of the NMT standard in the 1970sbrought the Nordic telecommunications administrators andcompanies in close cooperation. While active in terminaldevelopment, the Finnish industry was not yet able to con-tribute to network specifications. Fierce pressure from thePTO’s side to engage the industry in cellular exchange de-velopment materialized finally, in 1981, in the base stationsupplied by Mobira. In the retrospect, it turned out to becrucial in maintaining the company’s position in theemerging market.
The introduction of the NMT in 1981–82 marked the startof a fast-expanding new industry. The specifications werekept open to pursue the objective of the Conference to pro-mote competition in equipment provision. No less than tenmanufacturers entered the Nordic market.
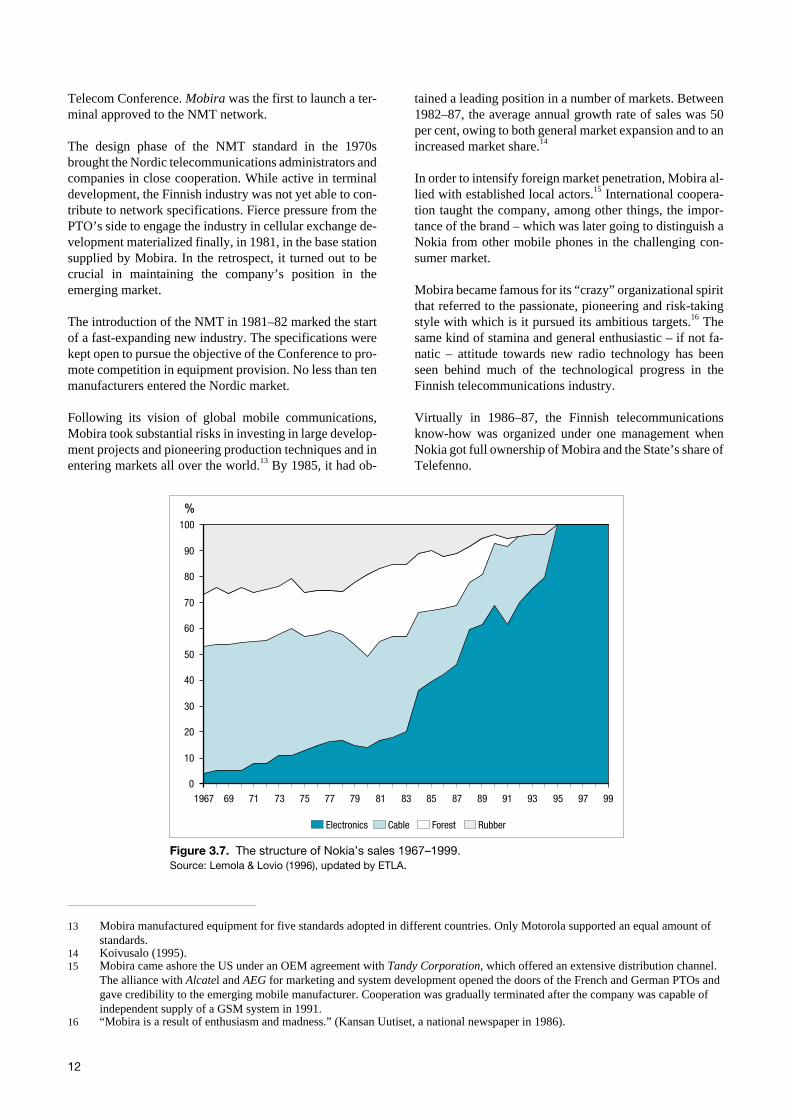
Following its vision of global mobile communications,Mobira took substantial risks in investing in large develop-ment projects and pioneering production techniques and inentering markets all over the world.13 By 1985, it had ob-
tained a leading position in a number of markets. Between1982–87, the average annual growth rate of sales was 50per cent, owing to both general market expansion and to anincreased market share.14
In order to intensify foreign market penetration, Mobira al-lied with established local actors.15 International coopera-tion taught the company, among other things, the impor-tance of the brand – which was later going to distinguish aNokia from other mobile phones in the challenging con-sumer market.
Mobira became famous for its “crazy” organizational spiritthat referred to the passionate, pioneering and risk-takingstyle with which is it pursued its ambitious targets.16 Thesame kind of stamina and general enthusiastic – if not fa-natic – attitude towards new radio technology has beenseen behind much of the technological progress in theFinnish telecommunications industry.
Virtually in 1986–87, the Finnish telecommunicationsknow-how was organized under one management whenNokia got full ownership of Mobira and the State’s share ofTelefenno.
12
0
10
20
30
40
50
60
70
80
90
100
1967 69 71 73 75 77 79 81 83 85 87 89 91 93 95 97 99
Electronics Cable Forest Rubber
%
Figure 3.7. The structure of Nokia’s sales 1967–1999.Source: Lemola & Lovio (1996), updated by ETLA.
13 Mobira manufactured equipment for five standards adopted in different countries. Only Motorola supported an equal amount ofstandards.
14 Koivusalo (1995).15 Mobira came ashore the US under an OEM agreement with Tandy Corporation, which offered an extensive distribution channel.
The alliance with Alcatel and AEG for marketing and system development opened the doors of the French and German PTOs andgave credibility to the emerging mobile manufacturer. Cooperation was gradually terminated after the company was capable ofindependent supply of a GSM system in 1991.
16 “Mobira is a result of enthusiasm and madness.” (Kansan Uutiset, a national newspaper in 1986).
In the search of rapid growth and global market presence,Nokia ran into serious production and financial difficultiesthat almost destroyed the company. Towards the end of thedecade, it started loosing positions in the export markets.The downturn was aggravated by the severe externalchocks, the collapse of the Russian bilateral trade and theabrupt economic recession, which put the future of Nokiaat stake.
The crisis gave a stimulus to a drastic dismantling of busi-ness sectors – varying from tissue paper and rubber bootsto cable machines and consumer electronics – preservingexclusively the telecommunications activities. The struc-tural changes were coupled with an important redesign ofthe company governance.
At the same time, however, the world witnessed a wave oftelecommunications liberalization. The boost in global de-mand for digital mobile equipment with Nokia’s global po-sition built in the 1980s saved the company from a dive thatwould probably have destroyed the company.
Owing to the recession hitting hard on consumer demand,it was crucial to dismantle the luxurious image of the porta-ble phone. With the softer aesthetic design and the user-friendlier customer interface Nokia was the first manufac-turer to invent the key to the consumer markets. Since thefirst consumer-targeted model in 1994, Nokia has high-lighted the life-style feature of communications in brandbuilding – a strategy that explains an important share of itsbreakthrough in the consumer market. In 2000, Nokia wasthe fifth most valuable global brand.17
In 1999, Nokia accounted for about a third of the world mo-bile phone market, and the phones represented almost 70per cent of the turnover. In network systems, the companyholds a market stake of close to 20 per cent.
3.4 The factors of the competitiveadvantage
In order to provide an analysis of the competitive advan-tage of the ICT cluster as suggested in chapter 3.1.1, thefactors involved will be briefly described below.
3.4.1 Firm strategy, structure and rivalry
Nokia dominates the ICT cluster by size and effect. Thecompany accounted for almost 50 per cent of the clustersales and 66 per cent of the cluster exports in 1998. How-ever, there is a number of other ICT companies that have
also established their positions in international markets.Moreover, many companies with their roots deep in theFinnish cluster have attracted foreign acquisitions (e.g.LK-Products, Martis, NK Cables, Solitra).
In the wake of the ICT boom there has been an intensiveemergence of start-ups finding narrow but lucrative nichesin the wireless and Internet applications sectors. Importantconquests have been made notably in the data security do-main. At the other end of the spectrum, there are estab-lished companies with accumulated world-class compe-tence particularly in network technology.
Despite the global business environment the core activitiesof companies, namely the headquarters and R&D, are stillpredominantly located in Finland.18 Established tradition incooperation in the local innovation system and advancedR&D activities anchor companies to their home base. Thefertile environment has attracted a number of leading for-eign companies to base their R&D centres in Finland, too(e.g. ICL, IBM, Siemens, Hewlett Packard, Ericsson).
Today, domestic competition has little effect on firm strat-egy. Competitors, regardless of their origins, operate glob-ally determining the scope and perspective of companystrategies. Unlike in a host of monopolized markets, theFinnish equipment industry has evolved under competitivepressure from the outset.
In network operation, the fragmented, yet monopolisticmarket structure has had implications on the market,non-existent in monopoly markets. For example, the pre-conditions for duopolistic competition were in place at theopening of the market, spurring price efficiency and ser-vice improvements that made the Finnish telecommunica-tions very competitive in international comparison.
The liberalization has affected the strategic relationshipswithin the private sector, as well. In the Finnet Group (thenewly named Association of Telephone Companies), therehave emerged regional alliances to form competing camps,while there are still joint ventures in nation-wide serviceprovision.
3.4.2 Factor conditions
Liberalization of the capital market in Finland at around theturn of the 1990s has revolutionized the institutional envi-ronment of corporate funding. Established structures ofpower concentrations and cross-ownership were disman-tled, providing firms an access to abundant internationalresources at market price.
13
17 Interbrand.18 Nokia, as an example, spends approximately 60 per cent of its R&D input in Finland (Ali-Yrkkö et al., 2000).

Between 1994–1999, the value of private capital invest-ments grew tenfold, to EUR 286 million.19 Perhaps mostnotably, the weight in risk ownership has been shiftingfrom the public to the private sector. The role of the state isbeen refocused on carrying the technology risk, while ven-ture capitalists have come to bear the commercial risk of anew company.
Unequalled opportunities for innovative start-ups haveopened up in the form of “intelligent” venture capital,which has actually become their most common source ofcapital. The share of the ICT sector was 30 per cent of thetotal private capital investments in 1999.20
The level of R&D investments on ICT has been in inten-sive growth. In OECD comparison, the share of privateICT-related R&D of total manufacturing R&D was thehighest in Finland in 1998. During the period 1991–97,Finland turned from a below-average investor into theworld leader. In the public sector there was an outspokenobjective in 1996 to increase systematically the share ofR&D expenditure of the GDP. Today it amounts to over 3per cent being the second highest share in the world afterSweden.
Thus, the critical factor in the development of the cluster isnot scarcity in capital but rather in human resources that isvirtually impeding full-scale exploitation of the availablefunds. There is a structural mismatch in available skills notonly on the macro level, but also within the cluster, notablyin the software industry owing to the fast pace of techno-logical development. Owing to the lengthy lead-time in ed-ucation, the increased intake in the education system hasnot yet alleviated the shortage of skills. Worse yet, the lackof employees draws both students and personnel fromhigher education institutions to the industry, eroding se-verely future resources.
3.4.3 Demand conditions
Since 1996, Finland has been the world leader in mobilepenetration. All in all, households have adopted mobilephones as consumer products: in 1999, they held morewireless terminals (78.5%) than wired (75.8%). 60 per centof households have both terminals, while no less than 20per cent rely solely on mobile communications.21 Also inInternet host penetration rate Finland ranked the second af-ter the US, by 121 per thousand inhabitants in 1999.22
Since the full liberalization in 1994, the telecommunica-tions price level has declined by about 25 per cent in realterms. The sharpest reductions have been witnessed in dig-ital mobile and data services making Finland the leader inlow-cost telecommunications services in the OECD in1998.23 Reasonable pricing together with the cheaper andconsumer-oriented handportables, introduced in the early1990s, boosted swift expansion of the market. Digitalvalue-added services were soon adopted by consumers andhave established their role in every-day communications.
The national attraction towards technology together withthe high level of basic education has been seen behindmuch of the communications boom in Finland. All thesame, the small home market has served as a test laboratoryfor the development of new products and services – despitethe fact that its importance to Finnish firms is decreasing inmonetary terms.
3.4.4 Supporting and related industries
In the recent years, the domestic supporting sector hasevolved very specialized for the needs of the originalequipment manufacturers (OEM). Customers’ growing re-quirements in production volume and product sophistica-tion have generated a number of new companies, and in-duced redirection of activities in the existing ones.
The strength of the domestic supporting sector is in highlycustomized inputs. Special competence resides in the pro-duction of ASIC, rf-filters, hybrid circuits, silicon wafers,printed circuit boards and their surface mounting technol-ogy, as well as in electronic manufacturing services, auto-mation, and precision mouldings. Standard components, inturn, requiring large scale and effective global distributionchannels, are practically fully imported.24
In the wake of Nokia, many of the suppliers have learnedfast the requirements of global operation and grasped theopportunity of rapid growth.25 Domestic partnerships havebeen stretched to foreign markets to benefit from estab-lished operative processes and trust-based relations. Globalextensions of domestic partnerships have involved suppli-ers’ green-field investments as well as acquisitions of thecustomer’s foreign production facilities.
The versatile and world-class supporting sector has greatlyenhanced manufacturers’ possibilities to contract out non-core activities. This has been imperative in the sector inwhich time-based competition and risks involved in con-
14
19 Holtron Ltd.20 Ibid.21 Ministry of Transport and Communications.22 EITO 2000.23 OECD (1999).24 92% of the electronic component market value is composed of imports (Hienonen, 2000).25 Eight suppliers, with Nokia as a prime customer, had gone public by the end of 2000.
tinuous technology race call for disintegration of the pro-duction process.
There is a trend towards growing responsibility of suppli-ers in independent product development by which manu-facturers seek to take advantage of specialized externalknowledge. Suppliers are being increasingly engaged inearly-phase product and production process design to pro-duce more effective and innovative solutions. Indeed, thescope of outsourcing has widened from mere standardoutsourcing to R&D activities.
The relative size of Finnish suppliers in global perspectiveis small. Global operations of customers, most particularlyNokia, put tremendous pressure on suppliers’ capabilitiesand resources. Any firm aspiring to be connected to the net-work will have to be able to grow in pace with the cus-tomer, which has direct bearing on the firm’s risk leverageand management skills required.
As a general rule, the presence of a competitive industrycontributes to the development of related industries. 26 As aprovider of infrastructure technology, the ICT cluster haslinkages to a number of industries providing service prod-ucts, or content, complementing basic network services.27
The digital content industry is still in its early phase in Fin-land, yet there are numerous signs of emerging activities.The notion of digital content embraces a whole array of ser-vice concepts, from transaction and information services toeducation and entertainment. Yet the borders of the ‘con-tent industry’ are difficult to draw, they can be regarded toinclude the ‘digitized products’ of a number of traditionalsectors (see figure 3.2). Non-fixed definitions severelycomplicate quantitative valuation of the industry.
In 1999, there was a group of some fifty firms in the gamesand entertainment software production that generated EUR10-12 million. Despite advanced technological skills, thisgroup still operates in the fringe of the software sector,lacking sectoral concentration and volume. In addition, thesub-sector tends to have difficulty in attracting profes-sional business skills as it suffers from low credibility ascompared with more “serious” software sectors.28 How-ever, technology leadership and new business models en-abled by the Internet (digital mass distribution) providegreat opportunities for the Finnish digital entertainment in-dustry.
All in all, it is clear that the most value-adding applicationsof the Internet and mobile services are still to come. Al-though entertainment will draw the largest demand vol-
umes, applications in, say, education and health care willbe likely among those enhancing the efficiency andwell-fare of the economy.
3.4.5 Government
The appropriate role of the government with regard to clus-ters is to create a context that encourages upgrading, andestablishes a stable economic and political environment.29
Even though all government actions matter for the nationalcompetitiveness, competition, technology and educationare the domains with most direct effects on the ICT clustercompetitiveness.
Competition policy. The competitive conditions in theFinnish telecommunications market – both in manufactur-ing and operation – have differed somewhat from the inter-national tradition. Not only have both the markets beenfragmented in ownership, but also there has not been an ex-clusive symbiosis between the PTO and a national cham-pion in equipment provisioning.
Through the Association of Telephone Companies the pri-vate sector grew a counterweight to the national monopoly,non-existent in most markets prior to the worldwide waveof liberalization in the 1990s. Deregulation and the marketopening were initiated among the first countries, soon afterthe UK and the US in the early 1980s. Thereafter, the regula-tory approach has based on pro-competitive, light-handedregulation and technology neutrality. The market is subjectto general competition and consumer protection legisla-tion.
The approach is still less interventionist than in many otherOECD countries; some mandatory EU requirements havebeen regarded as regressive to the liberal market function-ing of the Finnish market.30 Following the fortifying trendin national telecommunications policies, the Finnish gov-ernment is also looking for an opportunity to withdrawfrom telecommunications activities.
Technology policy. The purposeful orientation in technol-ogy policy has a twenty-year history, materializing in e.g.continuous growth in the R&D share of the GDP. Between1985 and 1999, the share doubled reaching EUR 3.75 bil-lion at the end of the period, of which 30 per cent was pub-lic investments. By the 3.1 per cent GDP share Finland po-sitioned the second in the world in R&D intensity afterSweden.
15
26 Porter (1990).27 A distinction is made between the industries exploiting the network in digital distribution of service products, and those
rationalising their business procedures (electronic business) with the ICT. ‘Related industries’ refer here to the former case.28 Autere, Lamberg & Tarjanne (1999).29 Porter (1998) as in Rouvinen & Ylä-Anttila (1999).30 Ministry of Transport and Communications (2000).
In the 1990s, amidst the general cutback objectives in publicexpenditure, the government decided, in 1996, to system-atize the increase in public R&D funding to sustain the posi-tive development of the electronics sector discernible by thetime. Part of the proceeds from privatization was earmarkedfor public funding of technology development. The objec-tive for the period 2001–2004 is to connect the increase inpublic funding to the general growth rate of the economy.
Digitized content and enabling software applications, askey factors in the ICT cluster’s future success, have beenappointed high status on the national agenda. Concur-rently, there has been a need to redirect the focus in publicfunding. From traditional technology-oriented product andprocess development there has been an extension in focus,towards service products and market-orientation to facili-tate the emergence of export-oriented service products.The shift in policy direction has been manifested in a seriesof digital media technology programs since the mid-1990s.
In addition, there has been a need to re-evaluate the role ofthe public sector in risk funding altogether. The emergenceof abundant private venture capital enables a more focusedpublic strategy in technology risk funding, and a clearerrole differentiation with the private sector financiers. In ad-dition, through technology programs, the public sector hasbeen active in practicing the role of a facilitator betweenfirms and venture capitalists.
Education policy. The threat of exhausted labor resourceshas been attacked by increasing openings in higher educa-tion institutions. Between 1993–98, the total intake in uni-versities grew nearly twofold and in polytechnics nearlythreefold. However, established institutional structures aswell as resources lagging behind increased utilization ofeducational capacity seem to frustrate efficient achieve-ment of policy objectives.
The dialogue between the industry and the government oneducational issues has been active since the upsurge of theindustry. In the early 1998, the government adopted a pro-gram for increasing education in the information industryfields between 1998–2002. The industry has committed it-self to its implementation by providing internships, butavoiding recruitment of under-graduates, and encouraginggraduation of employed students. Moreover, companies aimat increased participation in training and education, and do-nation of equipment for education and research purposes.
3.4.6 Coincidental factors
The turn of the 1990s entailed several external incidentswith momentous implications on the Finnish ICT cluster,without which, it is fair to say, the average 30 per cent an-
nual growth rate of the electronics industry would not havematerialized.
Following the agreements within the EU and the WTO, thetraditionally monopolized telecommunications equipmentand service markets were gradually liberalized, startingwith terminal equipment in 1988 in Europe. The opening ofthe East European market gave an additional boost to mo-bile equipment demand.
The effects of liberalization were momentous. Between1990–98, the value of OECD exports of telecommunica-tions equipment grew almost 2.5-fold, reaching USD 110billion at the end of the period.31 Correspondingly, 96 percent of the OECD market, as measured by telecommunica-tions revenue, was open to competition by the beginning of1999.32
In contrast, the collapse of the Soviet Union together withthe severe recession in Finland hit hard on the ICT clusterdemand in the early 1990s. Without the counterbalancingeffects of market liberalization, the Finnish economywould have taken a somewhat different and slower path inits revival process.
3.5 Dynamics in the ICT cluster
The ICT cluster has been evolving for a hundred years. Thecluster as we see it today looks like a product of a masterplan: a vigorous industrial innovation system with high na-tional competitive advantage. However, it is an outcome ofa dynamic self-reinforcing process in which coincidentalfactors do not play the least consequential role.
In order to get a grasp on the factors behind the ICT clusterdevelopment, the most influential dynamic linkages be-tween the factors of competitive advantage will be ana-lyzed within the framework suggested in chapter 3.1.1. It isobvious that the causes and the effects of interactive factorsbecome blurred and ambiguous, but the framework helpsin providing some systematic in the analysis.
3.5.1 The government as an early catalystof cluster development
The earliest and perhaps most influential factors on clusterdevelopment relate to those government policies that havepromoted competitive market structure.
The foundation of the developed telephony infrastructurewas laid already in the 19th century, under the Tsar’s reign.
16
31 OECD (1999) and OECD trade statistics.32 ITU (1999). The remaining six countries are committed to liberalisation in coming years.
By dividing the network ownership between public andprivate companies, and allowing for a fragmented marketstructure, the Finnish Senate, yet motivated by foreign-pol-icy objectives, contributed more or less unintentionally tothe industry development in a crucial way. The decentral-ized market catalyzed several dynamic implications.
To begin with, the decentralized ownership contributed tothe technical improvement of the infrastructure. First, thecontinuous threat of nationalization of incompetent opera-tors spurred technological upgrading in the private net-work. There were several intentions, throughout the de-cades to nationalize the whole private sector in view of im-proving the technical level of the heterogeneous infrastruc-ture. These proposals were however dismissed due to thelack of political consensus and financial means.33 Second,as cooperative societies, the telephone companies pursuedthe interests of their owners through technical improve-ments and cost-based pricing. Third, as important commu-nal status symbols, telephone companies pursued latesttechnology to promote community authority.
Furthermore, the multi-operator market structure, coupledwith another local peculiarity, free equipment supply, hadfar-reaching dynamic repercussions. The competitive mar-ket regarded as a test laboratory attracted contemporaryleading manufacturers. Not only did their presence stimulatelocal economy through local production facilities andknow-how spillovers to the emerging industry, above all, itspurred operators’ skills in interface technology, required inrendering the competing vendors’ equipment compatible.
Indeed, the technical knowledge cumulated in this fieldwas recognized in international circles. The advanced ex-pertise improved the operators’ bargaining power, en-abling them to press the price below the prevailing level inmanufacturers’ monopolized home markets.34 Virtually,the sophisticated and demanding operator sector proved itssignificance as a collaborative customer during the evolu-tion of the domestic manufacturing industry.
The competitive environment in equipment provisioningwas in contrast with the majority of national markets. Thecompetitive pressure from capital-intensive leaders spurreddomestic firms from the outset.35
In addition, the existence of three independent local actors,(i.e. Suomen Kaapelitehdas, Salora and Valtion Sähkö-paja) generated complementary skills that, combined in al-liances, joint ventures and mergers, gave a boost to thetechnological development that would not have taken place
in a monopolistic market structure. For example, withoutthe joint venture of Televa and Nokia, the creation of thevital digital exchange would hardly have succeeded. Re-spectively, Mobira, as the joint venture of Nokia andSalora, contributed vitally to the timely launch of the firstNMT terminal and to its swift and successful export marketpenetration.
Finally, the public sector proved far-sightedness andnon-protectionist attitude in initiating, together with theother Nordic countries, the creation of a cross-border mo-bile market. The industry, engaged in the standard develop-ment, got a valuable first-mover advantage in the new mar-ket. The standard spread widely in Europe and Asia in the1980s and 1990s.
In the meanwhile, the national champions in Italy, France,and Germany developed their own technologies with localadministrations with meager results: the delayed and poorlyfunctioning services failed to attract users in their home mar-kets, neither was there any success in export markets.
The pro-competitive approach of the public sector wasmanifested again in the 1980s when, among the first in theworld, the gradual dismantling of regulatory restraints oftelecommunications service provision was started. Yet, thedecisive stimulus for liberalization came from the privatesector in the form of Datatie in 1985, followed suite byRadiolinja in 1988.
Had there been no competitive pressure, the PTO wouldhave postponed the introduction of new digital mobile net-work, since there were still important profits to be reapedfrom the analogue NMT network investments. By the sametoken, had the initial application for a second NMT licensebeen granted for the private sector in the 1980s, it wouldhave severely postponed the overall transition to digitaltechnology. Thus, half-incidentally, the two Finnish opera-tors were positioned in the forefront of the explodingglobal mobile market.
3.5.2 Exceptional demand conditionshave offered home-base advantage
The high penetration rate as well as swift adoption of newproducts and services have provided both the manufactur-ing industry and service providers a home base advantagethrough demand conditions that anticipate trends else-
17
33 Between the 1950s and 1960s operators were required to meet certain technical requirements in view of general networkdevelopment, in which occasion the number of independent firms fell dramatically through both public and private take-overs.
34 The Finnish operators were heterogeneous in their technical level and knowledge. The operators able to exploit their proficiencyin bargaining were predominantly the leading actors, the PTO and the Helsinki Telephone Company (HPY).
35 As a local actor Nokia was relatively flexible in responding to customers’ requirements, while foreign suppliers had to consulttheir headquarters prior to any custom-made solutions. Moreover, the established foreign manufacturers had a long tradition inanalogue technology, which handicapped their adoption of digital technology.
where. However, the favorable demand conditions havebeen largely a dynamic outcome of public policy measures.
Initially, the public decision to allow for a number of oper-ators set the basis for exceptional demand conditions forequipment manufacturing. Operators developed into so-phisticated customers through the variety of competingtechnologies, and as such have contributed to the industrydevelopment over time. The PTO’s pressure on the ‘reluc-tant’ industry to develop the first cellular exchange, criticalin the later conquest of international market shares, wasone indication of the advanced customer sector.
Another vital customer segment was the institutions usingclosed networks. The public authorities (notably the Armyand the national railways) put out invitations for tenders foradvanced equipment spurring companies for innovation.Public demand for germinating radio technology know-how was crucial in bringing forth-physical products, withwhich export markets were later penetrated. Private usersof closed networks (taxis, shipping and transport compa-nies, industrial plants) were also important in testing anddeveloping new applications of radio technology.
The turning point in the mobile history was the introduc-tion of the NMT that made the Nordic market the largest inthe world (60–70 per cent of all subscriptions) in 1982–83.36
The home market advantage spurred Mobira to an average50 per cent annual growth between 1982–87, during whichtime the share of exports rose from 50 to 75 per cent.37
The breakthrough of mobile telecommunications in theconsumer market was fuelled by price cuts induced bycompetition, as well as by consumer-friendlier and cheaperhandportables.38 An additional boost was given by the in-creasing supply of value-added services that have beenswiftly adopted as a natural extension of digital communi-cations.
Not surprisingly, the Internet penetration in Finland thesecond highest in the world. The swift and wide coverage isbeing supported by the public effort to build an InformationSociety.39 Respectively, the production of new Internet ap-plications and especially the integration of mobile andInternet technologies have lifted the Finnish industry in theforefront of international development.
3.5.3 Intense firm interaction has inducedupgrading
The Finnish ICT activities cluster heavily around one corecompany, Nokia. A great majority of firms in the electro-technics sector, but also in many other supporting indus-tries are positioned at some level of Nokia’s multi- layerednetwork. The existence of an ICT cluster as we witness ittoday would not have developed without the core com-pany’s global breakthrough.
The origins of the ‘networked Nokia’ are in the 1980s,when the company had to look for outsourcing to managegrowth. Gradually, the interaction between suppliers hasmoved towards increased joint development of productsand processes, in line with Nokia’s intensified concentra-tion in core competence areas. As compared with other theleading manufacturers, Nokia has been in the forefront increating the supplier network and relationships, which hasbeen related to its superior performance.
Not only has the company been able to assign an importantamount of new business to the supporting industries, as apioneering actor, it has also importantly contributed to gen-eral industry upgrading through collaboration. In additionto joint product development, suppliers have also im-proved their operative processes as a consequence of cus-tomer’s proposals.
Indeed, as a global player, Nokia has served as a window tointernational markets, teaching suppliers the requirementsof the global environment, and as such, it has been effec-tive as a reference for a number of companies in extendingtheir customer base. 40 Firms have also extended, to an in-creasing extent, their operations to foreign markets in thefootsteps of Nokia. Despite the many challenges firms arelikely to encounter in global markets, internationalizationwith the key customer has provided some security over theinitial phase. However, despite the two-digit growth ratesof supplier firms, their relative size is still small as con-trasted to the demand of the head company, resulting inmany cases to high dependence rates.
The stream of beneficial effects in network relationship hasbeen, by no means, unilateral. Despite the global manufac-turing networks of Nokia, the advanced know-how and es-
18
36 Pulkkinen (1996).37 Koivusalo (1995).38 As compared with some other markets, in Finland the relatively reasonable pricing is coupled with favourable charging practices,
including the prohibition of terminal subsidies by operators and the ‘caller pays’ principle. They have contributed to low operatorchurn rates and credit losses, and have thus promoted the sound growth in demand (see: Ministry of Transport andCommunications, 2000b).
39 The development of e.g. digital learning environments has top priority on the government agenda. An imposing tribute to thepolicy was the first Bill & Melinda Gates Foundation’s Access to Learning Award to the Helsinki City Library for the exemplaryprovision of Internet access and services to the public.
40 Based on Ali-Yrkkö & Paija (2001).

tablished supplier relationships in the country of originhave not lost their importance, but instead, they have nailedan important share of the company’s product developmentactivities in Finland. The supporting industry has been ableto respond fast to the increasing demands of the globalizingcustomer, especially regarding the variety of advancedcustomized products.
The advanced digital communications infrastructure to-gether with the inspiring cluster environment has inspiredthe development of applications software required in facili-tating Internet-based, mobile and wired, transactions andcontent service provision. In addition, there have appeareda number of new as well as established companies with ser-vices (content and/or its aggregation, digital market mak-ers) designed for digital distribution channels.
As these services are necessary in boosting demand for in-frastructure, the actors concerned, Nokia and Sonera mostnotably, are actively cooperating with service developers,which in turn enhances the preconditions for successful in-novations and their global distribution. The advanced andnew technology-oriented home market, for its part, pro-vides a favorable test field for technology developers.
3.5.4 Deterioration in labor supply,improvement in capital supply
The national innovation system, including the relatedfirms, universities and research units (notably the Techni-cal Research Centre, VTT; founded in 1941) has been acentral engine of technological development. This systemhas been able to generate highly skilled human resourcesthat have been attributed to the innovativeness inherent inthe Finnish cluster. Particularly, in the 1960s there wereseveral outstanding persons both in public research institu-tions and private enterprises that can be named as pioneersin the industry. Informal relations, active cooperation, em-ployee mobility, and the shared interest acceleratedspillovers between units, and boosted collective self-es-teem.
However, emergent exhaustion of labor resources hascompelled firms to look for overseas labor markets and totransfer R&D activities closer to foreign labor resources.Despite government actions to meet demand for skilled hu-man resources there are doubts whether the resources di-rected to this goal are sufficient and efficiently distributed.
The liberalization and the consequent growth of the capitalmarket have been one of the most noteworthy contributorsto the ICT cluster growth. It has induced versatility in thecluster through new companies that have grasped opportu-
nities opened up by new technologies. It has also providedmarket-based risk funding for growth companies, non-ex-istent only a decade ago. Cases like Nokia – with a 90 percent foreign stake – would not have been possible withoutforeign capital.
Further, it has enabled, in the form of stock options, the cre-ation of new tools for employee compensation and motiva-tion, which have served especially start-up companies withlimited liquidity.
Moreover, the newly emerged venture capitalists represent‘intellectual capital’ for small technology-based compa-nies with limited managerial skills, which has greatly im-proved the potential of successful international launch at anearly phase of business development. The availability ofventure capital has reshaped the role of public risk fundingtraditionally the prime resource for risky enterprises. Therehas become new kinds of investment syndicates where thepublic sector carries the technology risk and a venture capi-talist the commercial risk of an enterprise.
Finally, through foreign ownership it has been possible tothe share the risk of a small economy dependent of an un-settled industry.
3.5.5 World-wide liberalization – pivotaland perfectly timed for Finland
The 1990s witnessed intensifying liberalization of worldtrade with powerful implications on the telecommunica-tions sector. First, the entrance of new operators generatednew demand for infrastructure, and second, the increasednumber of operators induced growth in mobile service de-mand stimulating the demand of terminals and additionalnetwork capacity.41
In Finland, the decade began with severe economic shocks,brought about by the recession and the collapse in the So-viet trade. The previous decade had been a period of largeexpansion and internationalization of a new business sectorin the telecommunications industry. However, towards theend of the 1980s, Nokia run into an organizational crisis,which, coupled with the external economic shocks, nearlydestroyed the company.
However, the preconditions for a take-off, developed overthe decades, were in place in Nokia. With redefined strate-gies and proficient management the company was able tograsp the opportunity opened up by the liberalized globalmarket place. The European GSM standard met unantici-pated success in third countries, providing the Nordic play-ers a first mover advantage.
19
41 According to the OECD, the number of operators correlates positively with market growth rate (OECD, 2000).

The successful take-off not only saved the company, but italso set off a fundamental restructuring of the economy.
Radiolinja’s license application was perfectly – but notcalculatedly – timed in the eve of opening global markets.The first GSM network in the world, operated by Radio-linja and supplied by Nokia, put the Finnish telecommuni-cations in the global stage in 1991. The incident promotedefficiently the image of Nokia as an advanced supplieramong the new mobile operators appearing around theworld in opening markets.
In the retrospect, it is astonishing that the political arm-wrestling stirred up by Radiolinja’s license application didnot arouse any industrial policy considerations. The focuswas primarily on ideological issues and on the economicjustification of parallel networks in a small economy.42 Ad-mittedly, the dynamic restructuring process (both withinNokia and between the factors of the cluster system), re-quired for the take-off could not have been foreseen by anyindividual.
This Finnish ICT cluster case provides an excellent illus-tration of a self-enforcing dynamic system that enhancesthe competitive advantage of the cluster and the individualactors within it.
3.6 Future opportunities andthreats
Deregulation of both world trade and telecommunications,and the technological revolution brought about by digitaltechnology have stirred profoundly the operational envi-ronment of firms. Companies seeking for their place in thereorganizing environment are faced with new prospectsand threats, as well.
In Finland, though, the firms in the middle of this revolu-tion posses certain competitive advantages, evolved over ahundred years: The Finnish ICT sector has evolved into adynamic self-enforcing system that supports the actorsconnected to it.
As there is a myriad of business areas in the cluster, the op-portunities and threats of firms will naturally differ in vari-ous sectors. In the following, a general view on the futureconditions, critical to Finnish firms, will be considered.
3.6.1 Market positions at stake in the thirdgeneration competition
The future of the Finnish ICT cluster is entangled with thedevelopment of the global market. The present market po-sitions are at stake as the world is moving over to the thirdgeneration of mobile communications technology. It re-mains to be seen how the excessive sums charged from Eu-ropean UMTS licenses will affect the competitiveness ofthe European telecommunications sector. The price andvariety of services, penetration rates, and virtually, the eco-nomic health of licensees are likely to be affected by the taxlevied on the technology.
There is also a chance that alternative technologies, free ofthe tax burden, gain superior popularity in transferringthird generation services. Indeed, critics have questionedthe value-added of heavy UMTS infrastructure invest-ments altogether.43 Not all third generation licenses requiretelecommunications-based UMTS technology, allowing achoice by a licensee between alternatives.
From the manufacturers’ perspective there is uncertainty towhat extent the UMTS license fees will attenuate opera-tors’ investment appetite, or to what degree equipmentvendors will have to finance their client’s infrastructure in-vestments.
The launch of third generation mobile technology willerase many of the first mover advantages the Nordic com-panies got in the second-generation (GSM) technology. Ja-pan, who issued the spectrums free of charge, will have asecond chance to take over the mobile market dominance,once unintentionally yielded to the Nordic countries.
This time, Japan may have an early-mover advantagegained with the mobile Internet application (i-mode) thathas attracted 15 million subscribers since its launch in Feb-ruary 1999. The mobile Internet application launched inEurope (WAP) did not prove nearly as successful. In addi-tion, the third generation services will be launched in Japanfor testing use in May 2001 while Europe is not expected tofollow until the summer of 2002.
While the US disabled itself in the second-generation mo-bile market by the fragmented domestic infrastructure, inthe next round it will have a competitive advantage in theInternet technology, which offers a gateway to the thirdgeneration mobile market. Established IT companies, likeCisco, Microsoft and 3Com can be regarded as new com-petitors to the traditional mobile equipment manufacturers.
20
42 See Häikiö (1998).43 For example, Helsingin Sanomat 4.9.2000 and the online discussion on Business.fi magazine web site in October 2000.
(http://yhteiso.bisnesfi.fi/bisnesfi/1758804000413183648596133?path=ihmisia%2Fkeskustelu_arkisto&message=473).

3.6.2 Globalization behind most of theopportunities and threats
Many of the future prospects and threats are brought aboutby the globalization of markets. Firms both can and mustaccess foreign markets, independently or with their glob-ally operating clients; physically, or digitally through theInternet.
Finnish firms are in a historical situation by possessing ad-vanced know-how in a boosting market, in which smallfirms can grab important market shares in some of the myr-iad of opening segments. In addition, the market is notlikely to show signs of leveling down in the foreseeable fu-ture.
According to an ETLA estimate, the Finnish ICT clustervalue-added continues to grow at a 14 per cent annual rateover the period 2001–2015. The growth potential lies natu-rally heavily on global demand. Over the same period, theshare of ICT equipment of total OECD manufacturing isestimated to almost double, to over 10 per cent, from the1997 level. The Finnish share of the global market is antici-pated to increase sharply, from 0.9 per cent in 1997 to 3–4per cent towards 2010.44
Finnish firms’ reliance on telecommunications industryhas aroused wide concern about their ability to survive anunexpected slump in demand. Fortunately, the demand forelectronics and software is in strong rise in a number ofnon-ICT industries. Indeed, many of the supplier firmshave already various industries in their client portfolios.Importantly, the demand of ICT-related skills is global, andthe current supply follows far behind global needs. In otherwords, the Finnish ICT knowledge has a wide range of al-ternative uses.
Electronic market places and distribution channels willabolish many of the more or less physical obstacles en-countered previously by small domestic firms. The knowl-edge-intensity and digital form of many ICT productsmakes them most suitable for global electronic trading.
Globalization has brought forth the deficiencies in mana-gerial skills that sufficed in domestic operations. Some ofthe cluster sectors, like software production, with great ex-port potential lack the history in international operationsmanagement. Technological innovativeness does not com-pensate for management and marketing skills, which are inrelatively scarce supply especially in small Finnish tech-nology-oriented firms. Management of rapid growth andearly-phase international market penetration require skills
that are in scarce supply and cannot be created throughlearning.
Fortunately, both public agents and financiers are payingincreasing attention to deficiencies in ICT firms’ skills.Well-coordinated actions between public and private sec-tors are necessary in overcoming business-related prob-lems to exploit the technological lead residing in Finnishfirms. To support sustainable development of the sector,though, the requirements of the industry need to be betterreflected in education strategies.45
3.6.3 Small firm size limits seizure ofopportunities
Globalization, the boost in telecommunications demand,and the networked production paradigm have made topicalthe relatively small size of Finnish firms. Even thoughgrowing demand has pulled firms for growth, the averagesize of Finnish suppliers is still small. There have been con-cerns about the suppliers’ high customer and industry de-pendence.
The small size pertains not only to the production capacity,but also to the ability to bear the risk characteristic to the in-dustry. Product development entails typically R&D invest-ments with lagging and uncertain future revenues. Fundingof such investments is the riskier the smaller the firm is.Partnerships serve as a means of redistributing risk amongseveral players, and therefore, suppliers will have to beable to assume increasing risk related to the technologicaland commercial success of new products.
Scarce financial resources limits the scale to which a firmcan engage in collaborative development projects with thecustomer, and to which it can take risk in seeking for higherfuture revenues. Small firms also typically lack some of themyriad of required managerial skills to qualify as a full-blown partner to global customers.
Thus, firms with insufficient resources risk falling in thecategory of standard subcontractors serving as a capacitybuffer for manufacturers. The customer relationship insuch a case does not offer an equal upgrading stimulus in-herent in collaborative partnerships.
In addition, limited resources are easily occupied by onelarge customer’s needs. In order to serve the key client asmall firm may have to give up other customers, increasingfurther customer dependence.
21
44 The estimate includes the following NACE classes: 30 (Manufacturing of office machines, computers, etc.), 32 (Communicationsequipment etc.), and 641+641 (Postal and telecommunications services). Estimates are based on an ongoing ETLA projectevaluating the long-term growth prospects of the domestic key clusters.
45 See also Autere et al.(1999).
However, awareness of customer and industry risk has in-creased in Finnish firms, inducing purposeful extension ofthe client base. Firms engage largely in independent prod-uct development to increase their own product variety,technological distinctiveness and independence of cli-ents46. Yet, the ideal balance between customized and ownproducts may be hard to find, since scattering of scarce re-sources is likely to hamper their efficient use. In addition,with the present growth rates of the customers in the tele-communications, the enlargement of customer range fur-ther aggravates the pressure on firms’ resources.
Noteworthy though, firms have indicated their willingnessto increase R&D collaboration with their clients and to takemore responsibility in the form of larger sub-deliveries47.Despite the growth in outsourcing, there is still plenty ofroom for increased allocation of work and responsibility.For example, the share of electronic manufacturing ser-vices (EMS) is, at most, 20 per cent of the Finnish originalmanufacturers’ production volume.48
3.6.4 Dynamic cluster relations supportspecialization and upgrading
Increased outsourcing has generated business growth andnew opportunities to a whole array of firms. This, in turn,has increased firm specialization, and supported compa-nies’ efforts in focusing on their core activities. Concen-trated activities increase firms’ flexibility in redirectingtheir focus in case of shifting demand or technologicalchange.
Firm networks are supported by a world-class science sec-tor. The intense interaction between firms, universities andresearch institutes has long traditions, and as such, is re-garded as exceptional by international standards.
Various studies indicate that customers are the most impor-tant external source of firms’ innovation ideas.49 In Fin-land, both the business and consumer clients have providedan important test bed for new applications. To a certain ex-tent, local demand anticipating future trend is a culturalfeature, which gives an industry a unique competitive lead.
Advanced local innovation systems, consisting of theabove actors, are regarded as one of the most valuable fac-
tors improving national competitive advantage. In Finland,specialization and close interface between network actorswill continue to provide inimitable advantages to clusterfirms through increased innovation and efficiency.
3.6.5 Electronic business will haveimplications on firm interaction
Information networks will provide a kind of a short cut toglobal markets for many small and medium-sized firms.Firms of different size have an opportunity of equitable ac-cess to electronic market places. According to the Confed-eration of Finnish Industry and Employers, already about95 per cent of all Finnish industrial companies haveadopted some degree of electronic business, and 80 percent sells its products through information networks.50
There are no peers in Europe in this respect, and thebenchmarks are to be looked for in the US.
There are, however, notable differences in networking be-tween firm size categories, small companies lagging be-hind the industry average. Lack of users’ know-how andhigh price of technical solutions are the prime obstacles insmall firms’ entering the electronic business.51 There is athreat that firms unable to enter the digital market will notonly miss the business opportunities offered by the newtechnology, but they may loose their market position ac-quired in the physical market.
Internet-based firm interaction will have profound effectson supplier chain management. Supplier networks willgain in improved transparency, which will e.g. alleviatefluctuations in production chains. Electronic market placeswill also increase price bidding through increased informa-tion.
However, as firms move from bilateral relations to elec-tronic market places, there are concerns as to the implica-tions of e.g. price bidding on supplier innovation. In otherwords, can firms investing in product development com-pete with their non-innovative, and thus, lower-cost ri-vals?52 Or, to what extent does electronic operating envi-ronment support inter-firm knowledge transfer and innova-tion inherent in physical teamwork? Finally, will increasedefficiency requirements outweigh the gradual but perceiv-able intensification in buyer-supplier cooperation?
22
46 Ali-Yrkkö & Paija (2001).47 Ibid.48 KTM (1999).49 See e.g. Community Innovation Survey (Statistics Finland, 1998).50 Confederation of Finnish Industry and Employers (2000).51 Ibid.52 In the 1980s, the US automobile industry pursued improvement in competitiveness through supplier price bidding. This strategy
damped suppliers’ R&D activities, further deteriorating manufacturers’ competitive edge vis-à-vis their Japanese rivals, whoinstead, put supplier innovation in active use (see e.g. Helper, 1993).
3.6.6 How to guarantee sufficient supplyof skilled labor?
The imminent drying up of available skilled labor re-sources is already limiting the full growth potential of ICTfirms and the efficient exploitation of available public andprivate funds.
Fortunately, the dialogue between the government and theindustry has been very active. Indeed, the increase inhigher education openings has been in expressive rise since1993. However, there is a danger of watering down the ed-ucation system by excessive intakes coupled with ineffi-cient allocation of educational resources. There has been acall for a whole cultural change in the education sectorfrom technology-orientation towards business-orientation,which requires fundamental changes in established struc-tures.
The unforeseeable success of the Finnish ICT industry hasmade it most attractive for talented people. It is now muchup to the public sector to support required institutionalchanges and to guarantee efficient reallocation of resourcesto assure optimal substratum for this critical endowment.In order to keep pace with the fast-developing technology,the industry, in turn, has a crucial role in communicating itsneeds and catalyzing knowledge transfer between the fieldand the education system.
3.6.7 Will content production grow intothe third base of the ICT cluster?
Japanese experience in the mobile Internet (i-mode) im-plies that successful launch of the third generation servicewill depend on the content transferred through terminals.53
Certainly, the next growth sector within the global ICTmarket will be the content industry.
Consequently, favorable development and global compe-tence of the Finnish digital content industry have highrankings on the government agenda. In 1999, the govern-ment initiated the Content Finland Programme, aninter-ministerial agenda for the period 2000–2003 to im-prove the preconditions of Finland to develop into a lead-ing country in providing – in addition to ICT –industrialcontent products.54
The history of the Finnish ICT cluster has a chance to re-peat itself: In the building project of the Information Soci-ety, interaction between the industry and the public sectoras a demanding customer has every opportunity to generatecontent innovations reproducible to export markets.
Recent breakthroughs of the Finnish music industry andcinema indicate a sudden positive change in the tradition ofdomestic entertainment production, and it has conse-quently created a new atmosphere of enthusiasm and im-proved self-esteem in the ‘traditional’ content industry.
However, ‘content’ needs to be understood extensively,beyond traditional definitions limited mostly to media, au-dio/video production and suchlike. Virtually, content canbe regarded to encompass anything that provides value-added to the ICT terminal user.55 In this respect, the oppor-tunities are limitless for Finnish firms to enter the digitalcontent market, in which innovation and advanced technol-ogy environment may outweigh tradition.
References
Ali-Yrkkö J., Paija L., Reilly C. & Ylä-Anttila P. (2000),Nokia – a big company in a small country. ETLA –The Research Institute of the Finnish Economy, SeriesB162. Helsinki: Taloustieto.
Ali-Yrkkö J. & Paija L. (2001). Nokia – An embedded com-pany. ETLA – The Research Institute of the FinnishEconomy. Helsinki: Taloustieto (forthcoming).
Autere J., Lamberg I. & Tarjanne A. (1999). Ohjelmisto-tuotteilla kansainväliseen menestykseen. Teknolo-giakatsaus 74/99, Tekes.
Helsingin Sanomat 4.9.2000, “Umts on jo syntyessäänvanha”.
Confederation of Finnish Industry and Employers (2000),Electronic business in Finnish Industry.
Helper S. (1993), An exit-voice analysis of supplier rela-tions. In Grabher (ed.), The embedded firm. NewYork: Routledge.
Hernesniemi H., Lammi M. & Ylä-Anttila P. (1996), Ad-vantage Finland – The future of Finnish Industries.ETLA – The Research Institute of the Finnish Econ-omy, Series B113. Helsinki: Taloustieto.
23
53 See e.g. several articles in the TIME Magazine in November 27, 2000.54 The programme contains eight ministries under which new content products for a wide range of application areas will be
developed in cooperation with businesses and financiers.55 Iobox, one of the early mover start-ups, offers an extreme example of a content provider that refined consumer communications
(short messages) into digital content by branding.
Hienonen R. (2000), Elektroniikan- ja sähköalan kehitys-näkymät 2000…2005. Helsinki: VTT Automaatio.
Häikiö M. (1998), Alkuräjähdys. with English summary:The Big Bang of GSM – Mobile phone revolution. Thestory of Radiolinja, Finland, 1988-1998. Helsinki:Edita.
ITU (1999), Trends in telecommunications reform 1999.
Koivusalo M. (1995), Kipinästä tuli syttyy – Suomalaisenradiopuhelinteollisuuden kehitys ja tulevaisuudenhaasteet. Espoo: Cetonia Systems.
Ministry of Trade and Industry (1999), Elektroniikansopimusvalmistus. Report of the electronic manufac-turing services (EMS) industry.http://ktm.tt-tietopalvelut.fi/ktm/fin/select1.html
Ministry of Transport and Communications (1999), Suo-men telemaksujen hintataso, Publications 14/99.Hel-sinki.
Ministry of Transport and Communications (2000), Tele-viestintätilasto 2000. Helsinki.
Ministry of Transport and Communications (2000b), CaseMobile Finland. Publications 16/2000.
Mäenpää K. & Luukkainen S. (1994), Teletekniikasta mo-nimuotoiseen viestintään – Teleklusterin kilpailukyky.ETLA– The Research Institute of the Finnish Econo-my, Series B96. Helsinki: Taloustieto.
Mäkinen M. (1995), Nokia Saga. Jyväskylä: Gummerus.
OECD (1999), Communications outlook.
OECD (2000), Cellular mobile pricing structures andtrends. DSTI/ICCP/TISP(99)11/FINAL.
Porter M. (1990), The competitive advantage of nations.London: The Macmillan Press Ltd.
Pulkkinen M. (1996), Miten jättiläisiä horjutetaan? InLemola T. & Lovio R. (1996), Miksi Nokia, Finland.Helsinki: WSOY.
Pulkkinen M. (1997), The breakthrough of Nokia mobilephones, Doctoral Dissertation. Helsinki School ofEconomics and Business Administration, A-122.
Statistics Finland (1998), Innovaatiotutkimus 1996. Tiedeja teknologia 1998:3.
Rouvinen P. & Ylä-Anttila (1999), Finnish cluster studiesand new industrial policy making. In OECD, BoostingInnovation – the cluster approach.
Toivola K. (1992), Poimintoja teletoimen historiasta,vol.4. TELE Matkaviestinverkot.
Turpeinen O. (1996), Yhdistämme, vol.1-2. Helsinki: Edita.
24

4 Trends in wireless services and products
Jarmo Karesto, Finpro
Need for services is the driving force of the computer hard-ware business; the same is true for the wireless telecombusiness. Innovative services and service content will playcritical roles in third generation service take-off and in thewireless hardware business.
Figure 4.1 illustrates one example of the possible businessmodels in the third generation mobile environment. Therewill be several players and functions in the model, each de-pendent on the other. In order to work properly, the valuechain of the business model must be well in balance.
Network operators will be facing new challenges. The oldbusiness models do not work anymore. It is not feasible forsubscribers alone to pay back the huge investments thathave been put into operating licenses and network build-ing. The operator business will be even more downsizedwhen they change from time-based invoicing to pack-
age-based invoicing in data transfer. New business modelsare needed. The operators can create new value-added ser-vices, they can cooperate with service content providersand they can take a dominant role in m-business transactionmanagement. The network operation will probably be sep-arated from the mobile service business and functionwithin its own business area.
The focus of this study is wireless technology develop-ment, not service development; however, as stated previ-ously, these two issues can not be separated. Service devel-opment is the driving force of technology development. Inpractice, however, this concept is not at all so simple. Allthe elements in the value chain must be in balance beforethe business model works properly.
The following diagram (Figure 4.2) shows the complexityof the third generation mobile business. Terminal sale de-pends on terminal prices and service take-up. If the newservices are not attractive or they are high-priced, or theprices of new terminals are high compared to existingprices, the majority of subscribers will be satisfied with the
25
Network Operators and Service Management
Service Management(e.g. ISP or Corporate Network)
Subscriber/User
UMTS
AccessNetworkOperator
Corenetworkoperator
Value AddedService
Providers
ContentProviders
Communications
ServiceBroker
Billing
Accounting
Payment
Home Environment
Figure 4.1. Example of functions in UMTS service delivery. Source: UMTS Forum.

existing services. This is considered to be a risk especiallyin the case of UMTS. High prices paid for UMTS licenseswill slow down the service take-up by keeping the serviceprices high. The majority of subscribers will wait for pricesto come down and this will cause financial problems foroperators. The counter-statement from the operator side isthat this will not happen because they can keep the basicservice fees low in a number of ways; for instance, by mov-ing the cost burden from subscribers to content providersand to the prices of new sophisticated services, and by im-plementing new earning models like selling advertising
space etc. The business logic mirrors that of the Internet.The competition, by improving the services of existing op-erators and challenging technologies like wireless localnetworks, cause sleepless nights for UMTS investors.
What will the services of the future actually be? Figure 4.3provides a useful classification of different wireless ser-vices. Service provision depends on the target customer,whether it is a consumer or business user. Regardless ofcustomer, the service can be either transaction-based or itfacilitates a process.
26
Serviceattractiveness
Serviceprices
Entry ofservice
providers
Servicetake-up
Terminalprices
Terminalvolume
Cost ofnetworkaccess
Technology
Globalstandards
Serviceusability
(interfaces)
Accessnetwork
regulation
Technology
Regulation
Servicevariety
Serviceutility
Figure 4.2. Market dynamics model of UMTS. Source: UMTS Forum.
Personal lifemanagement
Mobile office
Transactions
Cons
umer
Busi
ness
Processfacilitation
B2C/C2C m-transactionsPersonal life management/Mobile office
Services providing true mobilityof everyday activities:
Wireless PDAVoice mailEntertainmentRemote operationE-mailInstant messagingAccess to databases
●
●
●
●
●
●
●
B2B m-transactions
Services aimed at businessesto do B2B m-transactions:
Access to existing B2Be-commerce market placesBusiness versions of currentB2C m-commerce servicese.g. Banking services,real-time tradingFully wireless B2B marketplaces e.g. wireless portal fora big construction project
●
●
●
Business process enhancement
Supporting services to improvebusiness process efficiency andeffectiveness:
Sales force supportField service managementFleet managementRemote monitoring
●
●
●
●
B2C/C2Cm-transactions
Businessprocessenhancement
B2Bm-transactions
Mobile transaction servicesaimed at consumers:
Stock tradingMobile bankingLocation-based advertisingM-tailingM-walletMicro payments
●
●
●
●
●
●
Figure 4.3. Categories of wireless services. Source: Helsinki University of Technology.

DoCoMo’s i-mode service has set trends in third genera-tion mobile services. The huge success of i-mode has beena very positive sign for other operators. The whole i-modevalue chain is managed, however, entirely by DoCoMO.The company’s strategy has been to keep the basic servicefees and terminal prices at the same level as ordinary mo-bile service to guarantee fast service take-off. For subscrib-ers this means enormous improvements to services at a lowprice. Outside Japan, DoCoMo’s model does not apply be-cause the players in the value chain are independent com-panies. There is no one to manage the entire value chain. Insome markets the terminal prices can be subsidized by op-erators, but as is the case in Finland, this is not possible ev-erywhere.
4.1 Drivers in wireless content
There are hundreds of different estimations available in lit-erature and studies about the major applications of wirelessnetworks. It is important to understand what those applica-tions are to understand their implications to terminal de-sign. The following list is a basic summary of the mostcommon services and service content for consumers.
M-Commerce and services• Shopping• Banking• Other financial services
Entertainment• Music• Films• Games• Sports• Chatting
Information• News• Traffic Information• Weather information• Health information• Databases
Mobile office, group management• Communication services (voice, SMS, E-mail,
video conferencing, access to Internet)• Group management services (shared calendars,
group management tools etc)• Remote control
It is noteworthy, but not surprising, that the above list is al-most identical with the list of current Internet content. Mo-bility, however, will provide important additional factorsto the content. The most important mobility-specific fac-tors are location identity and personality. The location ofthe user determines what services are useful for her or himat that moment. The mobile terminal is a personal thing andis basically available all the time. In terms of service andcontent provision, this marks the difference between themobile terminal and the Internet. These factors are dis-cussed in more detail in the following chapters.
4.2 From mobile phones towireless devices
The development of wireless devices will be fast, but prob-ably not as predictable as one might imagine. The most fea-sible scenario at the moment is that there will be a wide va-riety of different types of wireless devices available for dif-ferent uses. The functionality of today’s PDA’s (PersonalDaily Assistant), personal computers and mobile phoneswill merge. I-mode phones in Japan have been trendsettersin this area. The phones are equipped with a large color dis-play with good graphics features. They have on-line Inter-net connection with well-designed and easy-to-use user in-terface. A wide variety of add-on features are available, in-cluding video cameras, earphones etc.
Not everyone will need all the technical features that arebeing developed by engineers. Customer segmentation willtake place. Investments in existing networks, politics, andcompetition will mean that there will not be only one net-work connection in the future, but many. Mobile Internetwill one day be as important a service as voice is today.When wireless devices become a personal thing, function-ality of the device, service offering, and content can be per-sonalized. Location of the user will be a dominant factor inpersonalized service offering. When service content getspersonal, the importance of security will grow, and whenthe basic technology gets smaller in size, additional func-tions can be added.
Designers of wireless devices must take into account manydifferent requirements. These requirements are summa-rized in figure 4.5. The functionality of the new devices issuch that they can utilize the advanced features of comput-ers, the Internet, mobile phones, and PDA’s to fulfill the re-quirements of the new types of services.
27
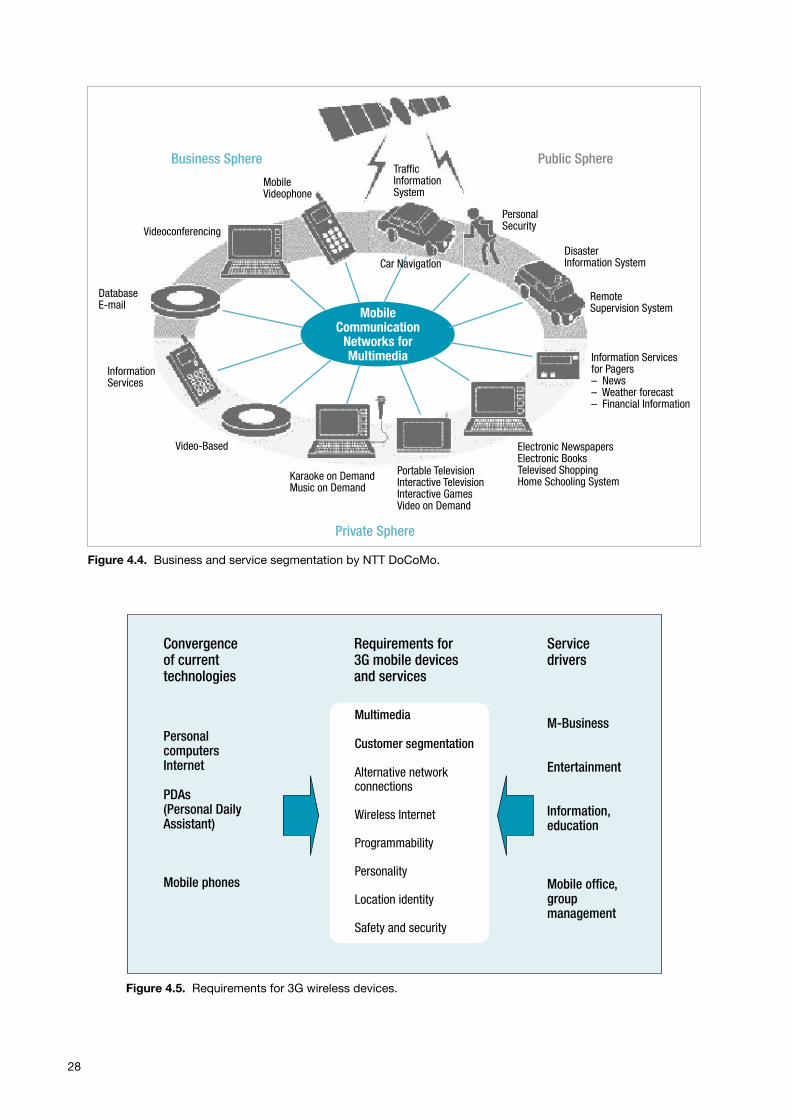
28
Private Sphere
Public SphereBusiness Sphere
MobileVideophone
TrafficInformationSystem
MobileCommunication
Networks forMultimedia
PersonalSecurity
DisasterInformation System
RemoteSupervision System
Information Servicesfor Pagers– News
Weather forecastFinancial Information
––
Electronic NewspapersElectronic BooksTelevised ShoppingHome Schooling System
Portable TelevisionInteractive TelevisionInteractive GamesVideo on Demand
Karaoke on DemandMusic on Demand
Video-Based
InformationServices
DatabaseE-mail
Videoconferencing
Car Navigation
Figure 4.4. Business and service segmentation by NTT DoCoMo.
Multimedia
Customer segmentation
Alternative networkconnections
Wireless Internet
Programmability
Personality
Location identity
Safety and security
PersonalcomputersInternet
PDAs(Personal DailyAssistant)
Mobile phones
Convergenceof currenttechnologies
Requirements for3G mobile devicesand services
M-Business
Entertainment
Information,education
Mobile office,groupmanagement
Servicedrivers
Figure 4.5. Requirements for 3G wireless devices.

4.3 Customer segmentation
When a business reaches the maturity phase and competi-tion leads to a reduction in sales margins, suppliers switchthe focus from technology to serving customer needs.Nokia Mobile Phones has seen tremendous success, in partby understanding the importance of customer segmenta-tion. The younger population prefers different product fea-tures than business people. According to Nokia, the con-sumer business is beginning to resemble the fashion busi-ness. Design, colors, and changing models (at least twice ayear) are becoming important considerations in this busi-ness segment. Easy-to-use user interface and Internetbrowsing capabilities are appreciated in this category.Fashion ideology creates enormous problems for produc-tion, where investments are very capital-intensive and aremade for the long-term. Elderly people create a growingconsumer segment and their needs differ from those ofyounger generations. The special needs of handicappedpeople and other minority groups certainly rouse the inter-est of device manufacturers. Health monitoring featurescan be added to guarantee the owner’s well-being. Nichemarkets can be found everywhere. Hobbies, professions,cultures etc. set different needs. The car industry will createa very interesting market. When cars are equipped with anon-line Internet connection, maps, weather, and traffic in-formation can be easily offered to drivers. The demandingcar environment sets special technical and ergonomic re-quirements for devices.
Businesspeople prefer functionality, good service quality,and global coverage. Communicator-type devices, whichcombine the functionality of computers and mobile phoneswill increase in popularity among businesspeople and otheradvanced users. It is matter of personal taste whether thesedevices are called mobile phones, palm computers orPDAs. Easy-to-use text and graphics entry are importantfeatures regardless of interface. The interface can be a key-board, a mouse, or a pen – all common interfaces of PDAmodels. Sophisticated needs require a large screen withgood graphics.
The third category of users, in addition to private and busi-ness users, is public users. Public organizations, police,taxi etc. have special needs for terminals and are ready topay a premium price for them. This might open businessopportunities for specialized small companies, not only forthe big ones.
4.4 Alternative networkconnections
Today’s dualmode and triplemode phones will not disap-pear in the future. For financial and political reasons, afragmented network environment with multiple standardswill exist, even in the era of 3G networks. Building newUMTS or CDMA2000 networks and establishing servicetake-off will take at least a few years. The existing net-works will continue working until they are forced to beshut down because of decreasing customer space or be-cause the spectrum does not give room for capacity expan-sion or for any other number of reasons. Smaller and morecompressed technology make it possible to build wirelessdevices with several network connections.
Connection to wireless lan (W-lan) is an interesting newfeature of PDAs and communicator-type devices. It pro-vides fast and economic access to the Internet in offices andalso increasingly in public places such as airports and ho-tels, where businesspeople spend a lot of time. W-lan con-nection compensates for the slower speed and more expen-sive cellular connection to the Internet, but does not havethe same coverage and functionality.
Bluetooth technology is widely accepted as the standard toreplace the connection cables connecting peripheral de-vices to office computers and mobile devices in the officeenvironment and at home. The capabilities of Bluetooth areso powerful, however, that its use can easily be expandedbeyond its original scope. Using a mobile phone as a “cashregister” when filling up the car at a gas station or whenpaying a parking fee are examples of the innovative uses ofBluetooth technology.
4.5 Wireless Internet
Wireless Internet connection seems to be a self-evidentfeature for consumers. Once fixed-line Internet consumersare familiar with the system, their expectations are high.I-mode in Japan has already proved that the mobile Internetconcept works. The mobile Internet opens the door to alarge supply of services. The Internet is a service in itselffor users who don’t care whether the connection is basedon W-lan or a cellular network.
29

According to Ericsson (Market Study UMTS, EricssonConsulting 2000), the success of i-mode is built on the fol-lowing factors:
Content• NTT DoCoMo’s i-mode service had sufficient content
since its service launch (67 partners at launch, now 320alliance partners)
Attracting partners• Success in attracting partners using simple technology:
C-HTML
Open to the Internet• The i-mode gateway is fully open to the Internet, where
most of the i-mode web page development is done (al-most 5500 voluntary i-mode pages today, free content)
Shared value chain• The value chain is effectively shared with content pro-
viders so that business can grow exponentially ->Win-win situation
Handsets• Several different small and light handsets available.
Handsets are subsidized, therefore no more expensivethan regular phones
Always connected• Packet data allows users to always be connected• Packet data allows for better tariffs (per packet rather
than per minute)
4.6 Programmability
The increasing capacity of wireless devices will movethem closer to computers. Like computers, the devices willinclude an operating system for running application pro-grams. A battle is going on as to who will be the “Win-dows” of mobile terminals. The main candidates are Epocfrom Symbian, Microsoft Windows CE and Palm OS.Nokia, Ericsson, and Motorola – who actually own thecompany – support Epoc. The user interface of Palm OShas become almost the industry standard among PDAs be-cause of Palm Computer’s strong position in the marketand large application supply. Companies like Nokia, Sony,and Qualcomm are partnering with Palm. It will be inter-esting to see what happens when Palm OS’s user interfaceand wide variety of applications are ported to other manu-facturers’ terminals. Nokia is already showing signs ofmoving in that direction.
Regardless of operating system, wireless devices will beprogrammable and there will be an increasing supply of ap-plication programs from third parties. The Internet pro-vides an easy way to download the applications into termi-nals.
4.7 Personality
Mobility, programmability, configurability, user identifi-cation, and increasing penetration all imply that wirelessdevices are considered to be a personal thing; when thosefeatures are implemented, services can be offered tai-lor-made to individual users. This development has alreadystarted on the Internet and will extend to mobile terminalswhen the mobile Internet is available.
4.8 Location identity
The location of a person is considered to be one of the mostimportant factors when characterizing the user’s personal-ity. It has even been suggested that all the mobile servicesof tomorrow will be location specific. For example, some-one looking for a barbershop is most probably interestedonly in those shops that are in the near vicinity. To allowthe user to target the right service, the terminal must fulfillsome technical requirements: either it must know its loca-tion, or the operator should be able to provide that informa-tion to the service provider; data communication speedmust be high enough to guarantee reasonable service qual-ity; and the terminal screen must be good enough to show amap or other information to guide the customer to the rightlocation.
There are basically two methods of determining the loca-tion of a wireless device. The service operator can locatethe terminal by measuring the strength of the signal that ittransmits to nearby base stations. The accuracy of the loca-tion depends on the number of base stations involved andthe cell size of the network. The smaller the cell size, thebetter the accuracy. One advantage of this method is that noextra functionality is needed in the terminals; the other ad-vantage is that the location can be measured inside build-ings, which is not the case with satellite navigation. Satel-lite navigation is the other method of determining the loca-tion of a wireless device. Currently only GPS (GeographicPositioning System) is available for this purpose. GPS ser-vice is provided and maintained by the US government andwas originally planned for military use only. GPS naviga-tion requires a GPS receiver in each terminal. Navigation isa much more accurate method than bearing by base sta-tions. The location can be determined within a few meters’accuracy. GPS navigation has its limitations too. The GPSreceiver is an additional and expensive feature to add to ter-minals, and GPS navigation works only outdoors. Walls,roofs, and high buildings block the signal. The system isvulnerable, so many business operators might hesitate torely solely upon it. An initiative for the European satellitenavigation system Galileo is under development but willonly be in use by 2005 at the earliest.
30

4.9 Safety and security
The transfer of confidential information in an open Internetenvironment calls for safety and security solutions. De-mand for security solutions will increase dramaticallywhen wireless Internet opens the door to mobile com-merce. The whole concept is very complex and raises manyquestions: how should invoicing technically be handledand who should be in charge of the process, how can a cus-tomer’s identity be guaranteed, and how can data integrityand confidentiality be secured? The answers lie partly onthe terminal side, partly on network technology, and partlyon systems. Most of the problems are similar to those offixed line Internet. Mobility creates new challenges butalso new possibilities. Innovative solutions are needed tocertify the user of a mobile terminal. Third generationwireless device as a personal tool is much more than just aphone and its misuse can create severe problems for itsowner.
Mobility opens the possibility of using the terminal as apayment method. Small amounts of money can be loadedfrom a bank account to a purse located inside the terminal.The owner can make micro payments online from anm-wallet, for example, when ordering goods or servicesthrough the Internet. A combination of the purse andBluetooth connection opens new opportunities to pay forpurchases in shops and in other situations where it is tech-nically possible. Especially convenient is paying for ser-vices in unmanned service stations like parking lots and gasstations.
Safety and security solutions and applications are still un-der development. New solutions, whether software orhardware, are definitely needed.
31

5 Promising standards and technology platforms
Jarmo Karesto, Finpro
The focus of this chapter is on those platforms and stan-dards which are expected to form the cornerstones of thirdgeneration wireless technology. The main purpose of thischapter is to help small and medium-sized electronics andsoftware companies find a solid base for their businessstrategies. Investing in wrong technologies might lead todisaster. Selection of the topics in this chapter is based ondiscussions with managers of leading technology compa-nies in Finland and abroad. However, it’s wise to keep inmind that forecasting is always a risky business.
Third generation mobile networks have taken much of theattention away from other developments in the wirelesstechnology world. Cordless phones, pagers, satellite mo-bile phones and private mobile radio systems also belong inthe category of wireless technology. It is also good to re-member that wireless technology is not a synonym for mo-bile technology. In this chapter the main emphasis will beon UMTS and wireless local area networks (w-lan).
In Europe the focus is clearly on mobile phones and theirsuccessors. The course of this development is towardscommunicators and Internet terminals. In the U.S. the ap-proach seems to be slightly different. The mobile phone isnot considered the only option for creating a data terminal.Vital development is taking place around palm computers,personal assistants (PDA) and wireless local area net-works. A hand-held computer with fast w-lan access is achallenger to mobile WAP phones. It is clear that computercompanies such as HP, Compaq, Dell, Palm and many oth-ers are active in developing devices for future mobileneeds. Software will play an increasingly important role inthese devices of the future. Companies developing user in-terfaces, Internet browsers and operating systems are in-creasingly being seen actively partnering with hardwareproducers. Operating system providers like Microsoft,Symbian, and Palm are mentioned often in these talks. It isvery likely that the new “wireless information devices”will have several alternative connections to voice and datanetworks. For example, in an office environment the de-vice can be connected to a wireless local area network andoutside the office to a mobile cellular network using WAP.
Digi TV will cause a revolution in the broadcasting indus-try. The jump from analog technology to the digital world
will offer two-way communication and many more indi-vidualized customer services than today’s technology. TheTV set has established its position as the principle mediumin almost every household in the developed part of theworld and is quickly gaining popularity in developingcountries. The TV set can be the media device of the future,providing access to entertainment, education, news anddata – independent of time. The traditional TV programsupply will be combined with Internet content.
5.1 The evolution of thirdgeneration cellular networks
The following table shows the evolution of the major cellu-lar telecommunications systems. Many of the first genera-tion networks have already made room in the radio bandspectrum for the second generation networks and emergingthird generation networks.
The jump from first generation networks to second genera-tion networks was a jump from analogue to digital commu-nication. The jump from second to third generation net-works will be a jump from voice communications to multi-media and Internet communication. What will fourth gen-eration technology bring us? Any similar giant leap in tech-nology and services is not visible. Standardization work onfourth generation technologies has already begun, but thefocus is more on improving third generation technologythan on specifying anything new and revolutionary. Ac-cording to Ericsson (Financial Times 2.10.2000), “4Gwould be operational from around 2011, and would buildon a second phase of 3G when all networks become basedon Internet protocol telephony. Fourth generation speedscould be as high as 100 megabits. 4G could be built on the3G telephony spectrum, but higher capacity demand islikely to create a need for even more spectrum.”
The standardization of 3G mobile networks is by far themost comprehensive development effort in cellular tech-nology to date. Work was started in the early 1990’s, at atime when the first mobile networks of the second genera-tion were emerging.
The emphasis of the development is on speeding up thedata transfer capacity to enable mobile Internet access. Thekey objectives of 3G development are as follows:
33
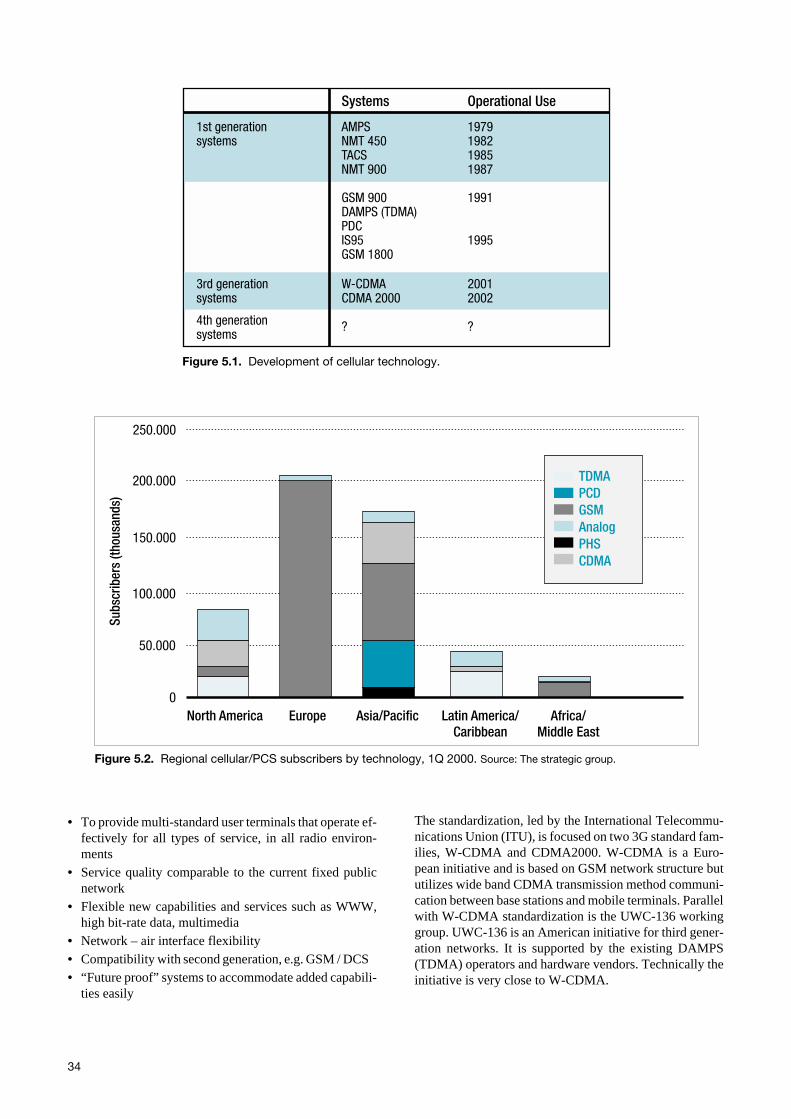
• To provide multi-standard user terminals that operate ef-fectively for all types of service, in all radio environ-ments
• Service quality comparable to the current fixed publicnetwork
• Flexible new capabilities and services such as WWW,high bit-rate data, multimedia
• Network – air interface flexibility• Compatibility with second generation, e.g. GSM / DCS• “Future proof” systems to accommodate added capabili-
ties easily
The standardization, led by the International Telecommu-nications Union (ITU), is focused on two 3G standard fam-ilies, W-CDMA and CDMA2000. W-CDMA is a Euro-pean initiative and is based on GSM network structure bututilizes wide band CDMA transmission method communi-cation between base stations and mobile terminals. Parallelwith W-CDMA standardization is the UWC-136 workinggroup. UWC-136 is an American initiative for third gener-ation networks. It is supported by the existing DAMPS(TDMA) operators and hardware vendors. Technically theinitiative is very close to W-CDMA.
34
Systems Operational Use
AMPSNMT 450TACSNMT 900
GSM 900DAMPS (TDMA)PDCIS95GSM 1800
4th generationsystems
1979198219851987
1991
1995
1st generationsystems
3rd generationsystems
W-CDMACDMA 2000
?
20012002
?
Figure 5.1. Development of cellular technology.
50.000
0
100.000
150.000
200.000
250.000
Subs
crib
ers
(thou
sand
s)
North America Europe Asia/Pacific Latin America/Caribbean
Africa/Middle East
� TDMAPCDGSMAnalogPHSCDMA
�
�
�
�
�
Figure 5.2. Regional cellular/PCS subscribers by technology, 1Q 2000. Source: The strategic group.

CDM2000 is more or less an American initiative. It pro-vides fast data transfer capabilities to the existing CDMA(IS-95) networks. The conversion of existing networks tothe CDM2000 network can be done quite easily. The majorintellectual property rights of CDMA technology belong tothe company Qualcomm. The license fee and royalty dis-putes between Qualcomm and other vendors have beenproblematic. These disputes have delayed the take-off ofCDMA networks on a larger scale. CDMA networks are incommercial operation only in North America, South Ko-rea, Australia and Hong Kong. CDMA network infrastruc-ture technology is supported mainly by North Americanmanufacturers. The major suppliers are Nortel, Lucent,Motorola, and Ericsson. Terminals are manufactured by amuch larger number of companies, including Nokia, Ko-rea’s Samsung, and LG.
At the moment it looks like W-CDMA will be the real uni-versal mobile technology standard of the future for thirdgeneration mobile networks. It is supported by all the exist-ing GSM operators, including those dominating the marketin Europe, Southeast Asia, the Near East, and many otherparts of the world. A big win for W-CDMA was when themajor Japanese operator DoCoMo announced its support.However, it is far too early to forecast the death ofCDMA2000; it has strong support in North America fromoperators such as Sprint and Verizon. Also, when discuss-ing strategic technologies like telecommunications, the im-portance of technology and trade politics should not be un-derestimated. North American manufacturers are actively
pushing CDMA2000 in China with the full support of theU.S. government, but so far without results. The Koreanmarket is also an option. U.S. influence forced Korea toadopt the second generation CDMA technology in the mid90’s. After the liberalization of the market in Korea, themajor mobile operators SK-Telecom and Korea Telecomannounced their support for W-CDMA technology in theirthird generation networks. Korea plays an important role asa technology supplier in Asia. Korean manufacturersSamsung, LG, and Hyundai have been active in developingCDMA technology – and only CDMA technology. Theyare clear leaders in the domestic market. Network technol-ogy is primarily imported from the U.S. Samsung has afoothold also in the U.S. terminal market. Operators’ will-ingness to move to W-CDMA networks threatens theirmarket position. However, it looks like Korea will followthe Japanese example and grant both W-CDMA andCDMA 2000 licenses to soon-to-be-selected third genera-tion mobile operators. Japan has so far been a closed mar-ket with its own mobile standards. Japanese manufacturershave not been able to gain a bigger market share outside Ja-pan. The situation will probably change now that NTTDoCoMo has adopted W-CDMA and has expanded its op-erations beyond Japan by purchasing minor shares of otheroperators in the U.S. and Europe. Japanese manufacturerslike Panasonic, Sony and together with Ericsson mightchallenge Nokia and Motorola in the world market. Thereis no doubt that Japanese companies would have advancedtechnology.
35
GSMTDMA
(IS-136)
T1
GPRS
UWCC
TIA
IS-95B
3GPP2
UWC-136W-CDMA
2G
2.5G
3GUWCC3GPP
cdmaOne
Cdma20001x 3x
CDGGSM
Association
ETSI
EDGE
Figure 5.3. Standardization of 3G. Source: ITU.

5.2 3G technology strategy plansby operators in major markets
Information from European operators is excluded becausethe European GSM operators all use W-CDMA technology.
36
EuropeSoutheast Asia
USA
Japan
China
Korea
GSM
TDMA
CDMA2000
CDMA2000
CDMA2000
GSM
CDMA
PDC
UWC 136
GSM
CDMA
W-CDMA
W-CDMA
W-CDMA
W-CDMA
W-CDMA
?
CDMA
Figure 5.4. Summary of 3G development by major markets.
Operator Numbers ofusers (M)
Market share(%)
2G standard 2.5 G/ 2.75G/ 3G Wirelessweb now
AT&T 12.5 12.5% TDMA GRPS/EDGE/W-CDMA Yes
ALLTEL 5 5% CDMA 1XRR/HDD/ CDMA2000 No
Nextel 4.5 4.5% IDEN Yes
SBC-BellSouth 16.2 16.2% TDMA& GSM
GPRS/EDGE/W-CDMA No
Sprint PCS 6.5 6.5% CDMA 1XRR/HDD/ CDMA2000 Yes
US Cellular 3 3% – – No
VoiceStream 2 2% GSM GRPS/EDGE/W-CDMA No
Verizon 26.5 26.5% CDMA 1XRR/HDD/ CDMA2000 Yes
Source: Los Angeles Times, July 24, 2000
USA
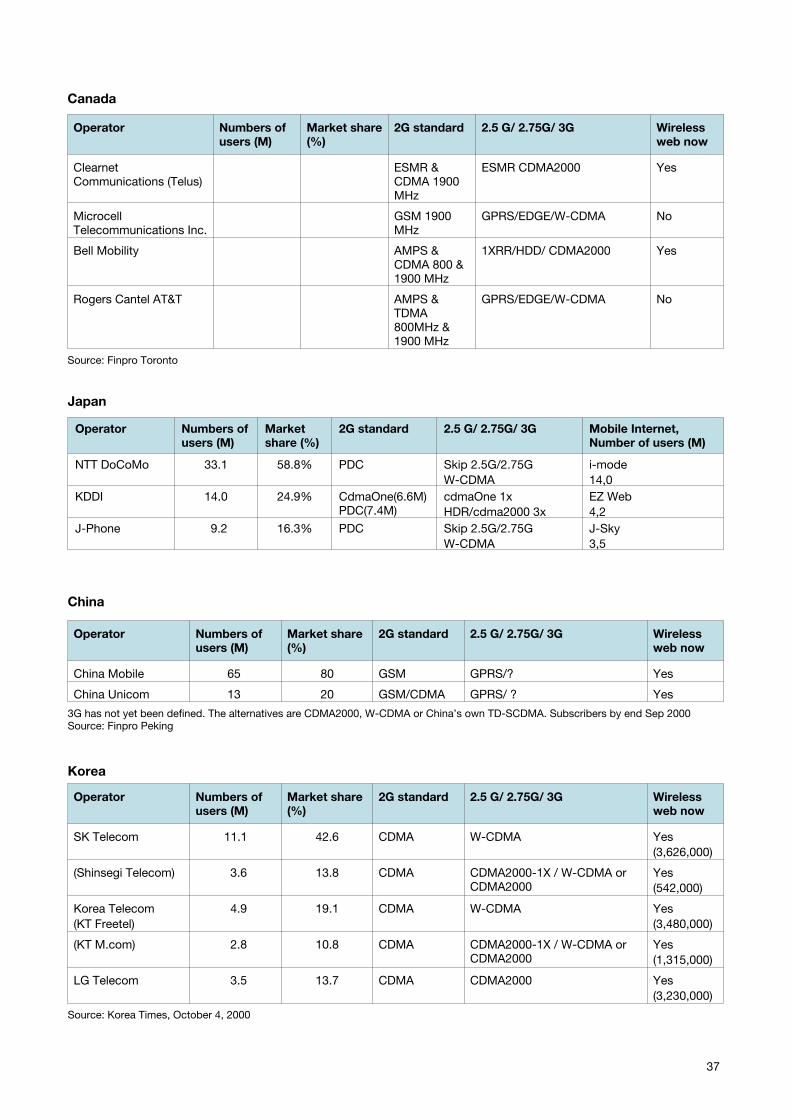
37
Operator Numbers ofusers (M)
Market share(%)
2G standard 2.5 G/ 2.75G/ 3G Wirelessweb now
ClearnetCommunications (Telus)
ESMR &CDMA 1900MHz
ESMR CDMA2000 Yes
MicrocellTelecommunications Inc.
GSM 1900MHz
GPRS/EDGE/W-CDMA No
Bell Mobility AMPS &CDMA 800 &1900 MHz
1XRR/HDD/ CDMA2000 Yes
Rogers Cantel AT&T AMPS &TDMA800MHz &1900 MHz
GPRS/EDGE/W-CDMA No
Source: Finpro Toronto
Canada
Operator Numbers ofusers (M)
Marketshare (%)
2G standard 2.5 G/ 2.75G/ 3G Mobile Internet,Number of users (M)
NTT DoCoMo 33.1 58.8% PDC Skip 2.5G/2.75GW-CDMA
i-mode14,0
KDDI 14.0 24.9% CdmaOne(6.6M)PDC(7.4M)
cdmaOne 1xHDR/cdma2000 3x
EZ Web4,2
J-Phone 9.2 16.3% PDC Skip 2.5G/2.75GW-CDMA
J-Sky3,5
Japan
Operator Numbers ofusers (M)
Market share(%)
2G standard 2.5 G/ 2.75G/ 3G Wirelessweb now
China Mobile 65 80 GSM GPRS/? Yes
China Unicom 13 20 GSM/CDMA GPRS/ ? Yes
3G has not yet been defined. The alternatives are CDMA2000, W-CDMA or China’s own TD-SCDMA. Subscribers by end Sep 2000Source: Finpro Peking
China
Operator Numbers ofusers (M)
Market share(%)
2G standard 2.5 G/ 2.75G/ 3G Wirelessweb now
SK Telecom 11.1 42.6 CDMA W-CDMA Yes(3,626,000)
(Shinsegi Telecom) 3.6 13.8 CDMA CDMA2000-1X / W-CDMA orCDMA2000
Yes(542,000)
Korea Telecom(KT Freetel)
4.9 19.1 CDMA W-CDMA Yes(3,480,000)
(KT M.com) 2.8 10.8 CDMA CDMA2000-1X / W-CDMA orCDMA2000
Yes(1,315,000)
LG Telecom 3.5 13.7 CDMA CDMA2000 Yes(3,230,000)
Source: Korea Times, October 4, 2000
Korea

5.3 CDMA terminology anddefinitions
CDMA is a generic term that describes a wireless air inter-face based on code division multiple access technology.CDMA technology is used both in W-CDMA and CDMA2000 networks.
cdmaOne™ is a trademarked brand name reserved for theexclusive use of CDG (CDMA Development Group) mem-ber companies, that describes a complete wireless systemthat incorporates the IS-95 CDMA air interface, theANSI-41 network standard for switch interconnection andmany other standards that make up a complete wirelesssystem.
cdma2000 is a name identifying the third generation tech-nology that is an evolutionary outgrowth of cdmaOne, of-fering operators who have deployed a second generationcdmaOne system a seamless migration path that economi-cally supports upgrades to 3G features and services withinexisting spectrum allocations for both cellular and PCS op-erators.
IS-95A is a specification currently in use in the U.S., Can-ada, South Korea, Hong Kong and Australia. A specialCDMA 800 MHz version with different channel specifica-tions is in use in Japan.
IS-95B supports high-speed data transmission services.IS-95B can allocate up to eight wireless channels to a singleterminal to provide a maximum of 64 Kbps Circuit Data ser-vice and 115.2 Kbps Packet Data service. The current 14.4Kbps service can only support the message-based data.
cdma2000 has been divided into 2 phases. The first phasecapabilities are defined in a standard known as IS-95 1X or
IS-95C. Completed in July 1999, this phase of cdma2000carries the TIA standard name of IS-2000 and the ITU stan-dard name of MC-1X. 1X introduces 144 Kbps packet datain a mobile environment and speeds beyond this in a fixedenvironment. Features available with 1X are: a two-fold in-crease in both voice capacity and standby time, advancedpacket data services, extended battery life, and improvedsleep mode technology. These capabilities will be avail-able in an existing 1.25 MHz channel. The second releaseof 1X, CDMA2000 1xHDR (High Data Rate), is beingworked on in the TIA and will support faster data speedswith peak rates up to 614 Kbps. The HDR system is opti-mized for packet data services, with a flexible architecturebased on IP protocols. HDR can overlay an existing wire-less network or work as a stand-alone system.
cdma2000 phase two, known as 3X, incorporates the capa-bilities of 1X, supports all channel sizes (5 MHz, 10 MHz,etc.), provides circuit and packet data rates up to 2 Mbps,incorporates advanced multimedia capabilities, and in-cludes a framework for advanced 3G voice services andvocoders, including voice-over packet and circuit data.
As noted above, the 3G solution based on cdmaOne tech-nology is known by many different names, but they are allrelated to a single technology solution. The various namesare a result of the naming conventions of different stan-dards organizations or phases in the standards process:
• IMT-CDMA Multi Carrier 1X/3X(ITU standards name)
• MC-1X and MC-3X (abbreviation of ITUstandards names)
• cdma2000 phase 1 (1X) and phase 2 (3X) · 1XRTTand 3XRTT
• IS-2000 (Telecommunication Industry Association(TIA) standards name for 1X).
38
2 Generation 2.5 Generationnd th
Generation 3rd
1998 1999 2000 2001 2002
IS-95(A)14.4 kbps
IS-95B64.4 kbps
HDR614 kbps
IS-95C 1X144 kbps
3X384 kbps
Figure 5.5. Evolution of CDMA IS-95. Source: Bank of America Securities.

5.4 W-CDMA
GPRS (General Packet Radio Service) is a packet-basedwireless communication service that promises data rates upto 100 Kbps and continuous connection to the Internet formobile phone and computer users. The higher data rateswill allow users to take part in videoconferences and inter-act with multimedia Web sites and similar applications us-ing mobile hand-held devices as well as notebook comput-ers. GPRS is based on Global System for Mobile (GSM)communication and will complement existing servicessuch circuit-switched cellular phone connections and theShort Message Service (SMS). GPRS opens up new oppor-tunities, but also introduces challenges, the most signifi-cant of which are changes in the tariff model and introduc-tion to the new IP infrastructure.
Implementation of EDGE (Enhanced Data rates for GlobalEvolution) is a major step in the evolution of GSM. It willallow GSM operators to use existing GSM radio bands(800, 900, 1800 and 1900 MHz) to offer wireless multime-dia IP-based services and applications at speeds up to384kbit/s.
Introducing EDGE will have little technical impact, since itis fully based on GSM, and will require relatively smallchanges to network hardware and software. Operators donot have to make any changes to the network structure, orinvest in new licenses. For example, EDGE uses the sameTDMA (Time Division Multiple Access) frame structure,logic channel and 200kHz carrier bandwidth as today’sGSM networks, which allows existing cell plans to remain
intact. This makes the technology particularly beneficial toexisting operators seeking a way to roll out wideband ser-vices rapidly and cost-efficiently across large areas of ex-isting networks.
Many GSM operators will implement GPRS in 2001-2002.For those who run out of capacity early, they can eitherconvert some of their GSM spectrum to EDGE (GSM andTDMA operators) or move onward to a new 2GHz spec-trum and build a new W-CDMA base station. In the U.S.,the W-CDMA spectrum is reserved for other use at leastuntil 2006, and even then its availability for 3G mobile net-works is not secured. The U.S. government has not yetmade plans to auction new 3G spectrums. This means thatthe TDMA operators, of which AT&T Wireless is by farthe largest, cannot move to W-CDMA in the U.S.
5.5 WAP
WAP (Wireless Application Protocol) is a global, open,standard protocol for wireless devices that allows users toaccess on-line services. Similar to web browsers in anInternet network, WAP browsers enable mobile Internetaccess. WAP will work across many mobile network tech-nologies, and is intended to attract new subscribers andopen up the mass market for mobile data services.
Despite the huge fuss around WAP services and terminals,the commercial take-off has not yet taken place. This ismainly because of the limited availability of end-user ser-
39
GSM
TDMA(IS-136)
UWC-136
GPRS
W-CDMA
EDGE
2 Generation 2.5 Generationnd th
Generation 3rd
1998 1999 2000 2001 2002
Figure 5.6. Evolution of GSM and TDMA.

vices, and because of poor service quality due to the slowdata transmission capability of ordinary GSM networks.Terminals that are more user-friendly and faster communi-cation connections will help in this matter. So far the highterminal prices of communicators and other WAP phoneshave limited the use mainly to business users.
WAP is, however, an extremely important standard on theroute to mobile Internet services and technology. Avail-ability of packet-switched GPRS service will improve theservice quality substantially. The other major benefit ofGPRS is that customers are charged based on the amount ofdata transmitted, not on connection time, as is the case to-day. Users can have an on-line Internet connection with asmall fixed monthly fee. Additional fees will be chargedfor data transactions and services. This model is in use inDoCoMo’s i-mode service in Japan.
By using a simplified version of HyperText Markup Lan-guage (HTML) called Wireless Markup Language(WML), WAP enables ordinary Internet pages to be modi-fied to fit a hand-held computer or a mobile phone. It willeliminate the need for a portable computer in many appli-cations, as it enables interactive access to data servicesfrom the handset.
5.6 I-mode and other Japanese3G approaches
I-mode is the most well-known mobile Internet service ofthe three services currently available in Japan. The two oth-ers are J-Sky from Japan Telecom and EZ Web from KDD.I-mode is a packet-based service for mobile phones offeredby NTT DoCoMo. Unlike most of the key players in thewireless arena, i-mode eschews the WAP protocol and usesa simplified version of HTML, Compact Wireless MarkupLanguage (CWML), instead of WAP’s Wireless MarkupLanguage. NTT DoCoMo has said that eventually it willsupport WAP and WML, but is not sure when this exactlywill happen.
First introduced in 1999, i-mode was the world’s first smartphone for Web browsing. I-mode is tailor made to work withDoCoMo’s phones. It does not allow the same hardware in-dependence as WAP does. I-mode wireless data service of-fers color and video for many phones. Its mobile computingservice enables users to do telephone banking, make airlinereservations, conduct stock transactions, send and receivee-mail, and access the Internet. By the end of 2000, i-Modehad about 15 million users. See also chapter 4.5, WirelessInternet, for an analysis of the success factors of i-mode.
40
Multimedia
High SpeedAccess
InternetAccess
Digital DataAccess
2 Generationnd
3 Generationrd
short message
2001 2002
internet mailweb access
game
moneytransaction
musicdelivery
visualcommunication
purchase & payment(ex, ITS)
WMLcompact HTML
securityfunction
(SSL)
Java
certificationfunction MPEG7
JAVA terminal (Docomo)
3G WCDMA
2000? technical
eventIMT – 2000P D C P D C+i-mode
cdmaOne+WAP
1999
service in (Docomo)
cdmaOne wide band (KDDI)3G CDMA2000
service in (KDDI)
3G WCDMA service in (J-Phone)
4th
Generation
MPEG7
MP3
Figure 5.7. 3G technology path in Japan. Source: Finpro Tokyo.

5.7 Bluetooth
Bluetooth technology is an initiative of telecom equipmentand computer and chip manufacturers to develop atwo-way digital radio standard for short-range connectionsbetween different devices. Bluetooth is becoming a globalde facto standard for wireless connectivity. Based on alow-cost, short-range radio link, Bluetooth cuts the cordsthat used to tie up digital devices. Bluetooth operates on apublic 2.45 GHz ISM (Industrial, Scientific and Medical)band.
When two Bluetooth-equipped devices come within 10meters range of each other they can establish a connectiontogether. And because Bluetooth uses a radio-based link, itdoesn’t require a line-of-sight connection in order to com-municate. A laptop could send information to a printer inthe next room, or a microwave oven could send a messageto a mobile phone informing that a meal is ready.
In the future, Bluetooth is likely to be standard technologyin tens of millions of mobile phones, PCs, laptops and awhole range of other electronic devices. As a result, themarket is going to demand innovative applications, value-added services, end-to-end solutions and much more.Bluetooth technology opens up limitless possibilities, andbecause the radio frequency used is globally available,Bluetooth can offer fast and secure access to wireless con-nectivity all over the world.
5.8 Wireless local area networks
The wireless lan concept originates from local area net-works. The major producers of w-lan cards and accesspoints are companies like Lucent and 3Com Corporation,but there are also many small companies involved in theproduction. W-lan concepts are aimed at replacing the ex-isting network cabling with wireless access, thereby pro-viding the users mobility within the limits of the network.IEEE 802.11 radios share common spectrum of the 2.45GHz ISM band, the same band as Bluetooth. The datatransmission speed is 11 Mbps, which is about one hundredtimes that of ISDN.
W-lan can create a mobile extension to wired networks inlarge enterprise installations. It can replace wired infra-structure entirely in Small Office/Home Office applica-tions. The technology also interests operators who want tooffer w-lan service in hotels, airports, and other hot spotsfrequented by businesspeople. Operators are also inter-ested in expanding w-lan service to private homes. Thew-lan market is estimated (by the Venture Development
Group) to grow from 745 million dollars U.S. in 2000 to3025 million dollars U.S. in 2004 – an increase of 42% ayear.
Several wireless equipment vendors including Lucent,3Com, Nortel, Cisco, and Apple have a significant invest-ment in wireless LAN products based on 802.11b. Intel,Ericsson, and many others are actively developing theirown w-lan products. At the same time there are plans forproducts that operate on the 5GHz band.
The w-lan concept offers a cheap way of networking com-puters and connecting them to the Internet. It does not pro-vide the freedom and mobility of the 3G network but willclearly compete with or complete 3G solutions in office en-vironments. Portable computers and communicator-typedevices can have connections to both mobile networks andwireless lan.
5.9 Operating systems in mobiledevices, EPOC, Palm OS,and Windows CE
The main competitors in the area of operating systems inthird generation mobile devices are EPOC from Symbian,Palm OS from Palm and Windows CE from Microsoft. Ineach case the philosophy and approach behind the develop-ment differs.
Microsoft’s Windows CE is basically a reduced version ofthe Windows operating system and is designed to work inpalm computers. Currently, for example, Casio, HP andCompaq have licensed Windows CE for their small de-vices. Windows CE turned out to be too heavy for use insmaller mobile devices. Windows CE development hasbeen stalled but Microsoft will certainly not give up on de-veloping new concepts for the mobile environment.
EPOC is based on a previous operating system from Psion,the first major manufacturer of personal digital assistants.The name derived from the company’s belief that the worldis entering “a new epoch of personal convenience.” EPOCadds wireless communication and architecture for addingapplication programs to previous systems. Psion declaredits first version of EPOC to be an open operating systemand licensed it to other equipment makers. In 1998 Psionformed a new company with Ericsson and Nokia, calledSymbian, which now licenses EPOC and continues to de-velop it. Later, Motorola joined the consortium. This part-nership will drive the development of the EPOC operatingsystem, optimized for mobile multimedia communica-
41

tions. Its aim is to set the standard for mobile operating sys-tems and create and open up a mass market for “mobile in-formation devices” – the next generation of palmtop com-puters, PDAs, smartphones, and communicators.
Symbian refers to the class of hardware that EPOC servesas “wireless information devices.” EPOC is a 32-bit oper-ating system that supports a pen-based graphical user inter-face. It is written in the C++ programming language usingan object-oriented programming design. The code is verycompact so that it can fit on a small memory chip. In addi-tion to basic services, the operating system comes with an“application suite” that includes a word processor, e-mailhandler, spreadsheet program, a scheduling application,general purpose database, sketch program, world clock,voice recorder, spell checker, calculator, communicationprograms, and a WEB browser. EPOC can be scaled downfrom relatively large configurations for a fully functionalhand-held computer to small configurations for embeddedsystems programming applications. Symbian provides de-velopment kits for C++, while Java is under development.
Palm is the market leader in hand-held computing, with a78.4% market share worldwide (IDC, 1999), and Palm OShas gained an important position among operating systemsfor hand-held devices. Palm Inc. has partnered with a verydiverse family of companies to make Palm OS® products.Handspring, QUALCOMM, Symbol, and TRG all createtheir own hand-helds based on the Palm OS. IBM sells spe-cially-configured Palm systems. In November 1999, Nokiaand Sony signed on to lead Palm OS in new directions —Nokia and Palm, Inc. are partnering to create Palm OS®smart phones, and Sony and Palm, Inc. are working to-gether to combine the Palm OS with Sony’s world-leadingmultimedia technology.
5.10 Mobile Internet protocolversion 6
The current Internet protocol version 4 (IPv4) was devel-oped to connect stand-alone computers to form a web. Inthe future there will be a huge number of new mobile de-vices connected to the Internet. The key arguments for de-veloping the next generation Internet protocol, IPv6, aresummarized as follows (Nokia):• Future Internet is largely wireless/mobile• IPv6 needed for billions of new wireless devices• Mobile IPv6 is more efficient• Autoconfiguration suitable for the mobile Internet• Security is a key component for success• Authentication, Authorization and accounting play big
roles in cellular rollout• Leverage from current cellular interest
IPv6 is now included as part of IP support in many productsincluding the major computer operating systems. IPv6 hasalso been called “IPng” (IP Next Generation). Formally,IPv6 is a set of specifications from the Internet EngineeringTask Force (IETF). IPv6 was designed as an evolutionaryset of improvements to the current IP Version 4. Networkhosts and intermediate nodes with either IPv4 or IPv6 canhandle packet formatting for either level of Internet Proto-col. Users and service providers can update to IPv6 inde-pendently without having to coordinate with one another.
IPv6’s most obvious improvement over IPv4 is that IP ad-dresses are lengthened from 32 bits to 128 bits. This exten-sion anticipates considerable future growth for the Internetand provides relief from what was perceived as an impend-ing shortage of network addresses.
IPv6 describes rules for three types of addressing: unicast(one host to one other host), anycast (one host to the nearestof multiple hosts), and multicast (one host to multiplehosts).
42
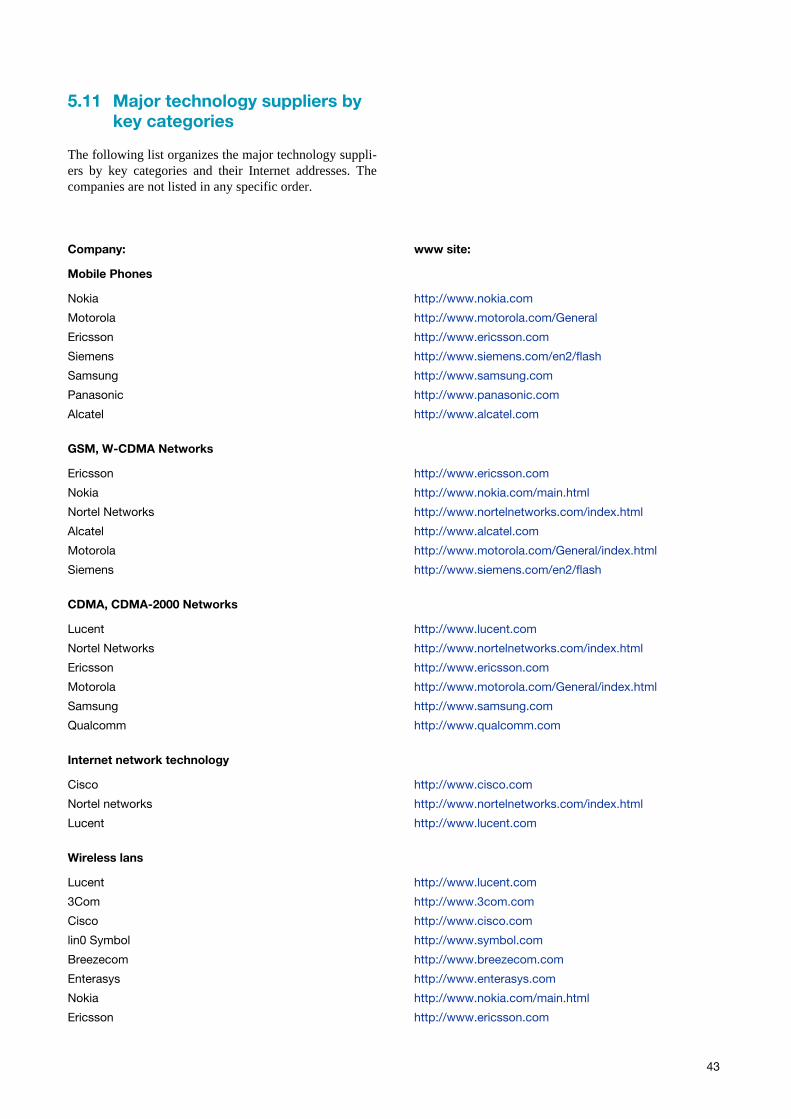
5.11 Major technology suppliers bykey categories
The following list organizes the major technology suppli-ers by key categories and their Internet addresses. Thecompanies are not listed in any specific order.
43
Company: www site:
Mobile Phones
Nokia http://www.nokia.com
Motorola http://www.motorola.com/General
Ericsson http://www.ericsson.com
Siemens http://www.siemens.com/en2/flash
Samsung http://www.samsung.com
Panasonic http://www.panasonic.com
Alcatel http://www.alcatel.com
GSM, W-CDMA Networks
Ericsson http://www.ericsson.com
Nokia http://www.nokia.com/main.html
Nortel Networks http://www.nortelnetworks.com/index.html
Alcatel http://www.alcatel.com
Motorola http://www.motorola.com/General/index.html
Siemens http://www.siemens.com/en2/flash
CDMA, CDMA-2000 Networks
Lucent http://www.lucent.com
Nortel Networks http://www.nortelnetworks.com/index.html
Ericsson http://www.ericsson.com
Motorola http://www.motorola.com/General/index.html
Samsung http://www.samsung.com
Qualcomm http://www.qualcomm.com
Internet network technology
Cisco http://www.cisco.com
Nortel networks http://www.nortelnetworks.com/index.html
Lucent http://www.lucent.com
Wireless lans
Lucent http://www.lucent.com
3Com http://www.3com.com
Cisco http://www.cisco.com
lin0 Symbol http://www.symbol.com
Breezecom http://www.breezecom.com
Enterasys http://www.enterasys.com
Nokia http://www.nokia.com/main.html
Ericsson http://www.ericsson.com

44
PDAs
Palm http://www.palm.com
Handspring http://www.handspring.com
Compac http://www.compaq.com
HP http://welcome.hp.com/country/us/eng
Psion http://www.psion.com
Casio http://www.casio.com
Mobile operating systems and web browsers
Symbian http://www.symbian.com
Palm http://www.palm.com
Microsoft http://www.microsoft.com/ms.htm
Electronic contract manufacturers
Solectron, USA http://www.solectron.com
SCI Systems, USA http://www.scisystems.com
Celectica, Canada http://www.celestica.com/cfm/home.cfm
Flextronics International, USA http://www.flextronics.com
Jabil Circuit, USA http://www.jabil.com
Sanmina http://www.sanmina.com
NatSteel Electronics, Singapore http://www.nel.com.sg
C-MAC Industries, USA http://www.cmac.com
Elcotew Networks, Finland http://www.elcoteq.com
5.12 Useful links to get morefree information
Topic: www site:
IPv6 http://www.ipv6forum.com
Navigation http://www.locationforum.org
w-lan http://wlana.com
Bluetooth http://bluetooth.com
IMT-2000 http://www.itu.int/imt
UMTS http://www.umts-forum.org
CDMA http://qualcomm.com
WAP http://www.wapforum.com
i-mode http://www.nttdocomo.com/top.shtml

6 Trends in The Global business environment
Michael Lovejoy, Finpro
6.1 “Turbulent times”
It seems as if “turbulent times,” to borrow a phrase from apopular management book of the first half of the 1980s,have been a part of the global business environment for along time.56 The turbulence is the result of profoundchanges in the economy, and information and communica-tion technologies are at the root of these changes. AsJean-François Rischard, a Vice President at the WorldBank, wrote in the foreword to one of the bank’s technicalpapers in 199557:
Information technology is demolishing territorial bound-aries today, and bringing nations together in a singleglobal community – but a community more fiercely com-petitive than ever before…The increasing pressures fromthe global markets are forcing everyone to adopt thesetrade practices and standards.
The following sections present some of the major trends inthe business environment that are having a significant im-pact on the shape and direction of trade practices and orga-nizational standards in the information and communicationtechnology (ICT) sector of the global economy. Amongthem are convergence, globalization, transnationalism, vir-tual integration and outsourcing. Suppliers and subcontrac-tors must be aware of these trends and develop their busi-ness and organizational strategies accordingly, both withintheir existing production networks as well as within pro-duction networks that they wish to join.
6.2 Convergence
It’s all about interactive real time multimedia at your fin-gertips. The device in your hand is not just a computer, atelephone, a television or a radio. It is a portal to a rich arrayof information that you can shape to your needs, anytime,
anywhere. Or at least that’s what they tell us we will havesomeday.
What is going to make all of this possible is “conver-gence;” the melding together of all the facets of ICT, as de-picted in Figure 6.1. Unfortunately, the early stages of thismajor technological trend are creating great uncertainty inthe marketplace.
This reality was best captured in Business Week maga-zine’s 7th of August 2000 cover. Atop images of variousmobile electronic devices, the headline read: CHOOSEYOUR WEAPON…, perhaps indicating both the con-sumer’s array of choices as well as industries’ range of un-certainty.
Winners and losers
Convergence may underscore the possibilities that today’swinning technology may be tomorrow’s failed technologyand that the current leading business model may be nextyear’s business disaster. As Ernst (1997) writes:
45
MultimediaNetwork
Equipment
OnlineMultimedia
InteractiveMultimedia
‘Off-lineMultimedia’
Communications– Industry– PSTN– Cable– Satellite– Broadcasting– Mobile Networks
Computer Industry– Computers– Software– Interfaces
Information/Content Industry– Data Bases– Information Services– Audio Visuals– Films– Music– Photos
Figure 6.1. Convergence of ICT technologies.Source: Devotech; OECD, 1997.
56 Drucker, P (1984), Managing in turbulent times.57 Schware R and Kimberly P (1995), Information technology and national trade facilitation, World Bank Technical Paper Number
316 (The World Bank, Washington D.C.)

Rapid technological change…has acted as a “double-edged sword.” In some sectors, trajectory-disrupting inno-vations have dismantled entrenched entry barriers andacted as a powerful equalizer by eroding the competitiveadvantages of erstwhile market leaders.
The history of the electronics industry is replete with exam-ples supporting Ernst’s statement – e.g., IBM in personalcomputers, Motorola in mobile phones, etc.
To avoid such an end, the ICT-related firm must look be-yond the myopia of current product lines and be positionedto anticipate technological change and innovate accord-ingly.
Innovation
Dicken (1998) states:
Innovation – the heart of technological change – is funda-mentally a learning process. Such learning…depends uponthe accumulation and development of relevant knowledgeof very wide variety.
What innovative strategies hope to accomplish at the orga-nizational level is:• Being the pioneer of ideas, services and products.• First to do, others follow.• Thinking beyond the traditional.58
These strategies contribute to the building of intellectualcapital.
Building intellectual capital
As the trend toward convergence accelerates, no one com-pany will possess all of the intellectual capital ‘in-house’that will be required to develop and market innovative ICTproducts that are fully proprietary. Access to externalsources of expertise must be obtained. In this regard, TheIndustrial Research Institute (IRI) found in its R&D TrendsForecast for 2000 for the USA that …R&D is becomingmore externally collaborative. Results from an IRI surveyshowed a greater emphasis on alliances, licensing andoutsourcing. This has certainly been part of the Nokia suc-cess story, as evidenced by ETLA’s recent publication:Nokia’s Network – Gaining Competitiveness from Co-op-eration. (Ali-Yrkkö, 2001)
Links to the best available intellectual capital may involvecollaborative relationships beyond the firm’s home base,since…technological leadership has tended to shift overtime, both nationally and regionally. (Dicken,1998) Per-
haps in recognition of this fact, one Silicon Valley executivesaid: Sometimes people here don’t like me to say this, but notall the world’s talent resides in the state of California.
6.3 Globalization
Globalization, fueled by the pace and reach of ICT, is theoverriding trend that effects the business environment to-day.
What is it?
François Chernais credits the initial ideological usage ofthe word “globalization” to the business managementschools in the USA such as Harvard, Stanford and Colum-bia (Sjolander, 1996). A good example of this view can befound in Professor Theodore Levitt’s article in the Septem-ber – October 1982 issue of the Harvard Business Reviewtitled: “The globalization of markets.” Professor Levittstates:
A powerful force drives the world toward a convergingcommonality, and that force is technology. It has pro-letarianized communication, transport, and travel. It hasmade isolated places and impoverished peoples eager formodernity’s allurements. Almost everyone everywherewants all of the things they have heard about, seen or expe-rienced via the new technologies.
Much of what has been written about “globalization” sinceProfessor Levitt’s article, however, is confusing, becausethere is not a clear enough distinction between its use andthe use of the term “internationalization,” and in some in-stances the two terms are used interchangeably to describethe same thing (Sklair, 1999). Dicken (1998) helps to clar-ify the situation by making an important distinction be-tween internationalization processes, which involve thesimple extension of economic activities across nationalboundaries, and globalization processes, which involvenot only an extension across national boundaries but alsothe functional integration of such internationally dispersed[economic] activities.
Partial vs. Systemic
Functional integration on an international basis is one ofthe keys to comprehending the evolution and structure ofglobal industrial organizations. Merely being present inmany international markets is not enough in itself. As Ernst(1997) suggests in his description of partial and systemicglobalization.
46
58 “Innovation and outsourcing – a partnership driving success”

• Partial globalization is characterized by a loose patch-work of stand-alone affiliates, joint-ventures, and sup-pliers that are scattered across the globe and that co-existwithout much interaction. It is partial in the sense thatthe firm cannot reap the full benefits of international spe-cialization. In essence, this is due to an absence of inter-action across functions and locations and to inadequatecoordination approaches.
• Systemic globalization, on the other hand, implies that acompany attempts to network its operations andinter-firm relationships worldwide, both across func-tions and locations. It is systemic, as the firm can nowgenerate closer, faster, and more cost effective interac-tions between the different nodes of these internationalproduction networks. By providing more cost-effectiveways of coordinating these interactions, systemic glob-alization enables the firm to internalize, on an interna-tional scale, resources and capabilities without runninginto the constraints of excessive centralization.
6.4 Transnationalism
The Transnational Corporation
Dicken (1998) believes that the transnational corporation(TNC) is the key actor in the globalization of economic ac-tivity. He defines the TNC as: …a firm which has thepower to co-ordinate and control operations in more thanone country even if it does not own them.
Dicken (1998) writes that the importance of the TNC canbe found in three basic characteristics:
• its coordination and control of various stages of individ-ual production chains within and between differentcountries
• its potential ability to take advantage of geographicaldifferences in the distribution of factors of production(e.g., natural resources, capital, labour) and in statepolicies (e.g., taxes, trade barriers, subsidies, etc.)
• its potential geographical flexibility - an ability to switchand to re-switch its sources and operations between lo-cations at an international, or even a global scale.
Global R&D
TNC operations abroad involve more than just the manu-facture of products. In line with Ernst’s description of par-tial and systemic globalization, IRI states:
Companies…are integrating their domestic and overseasR&D facilities into global R&D networks.
We see [the] move from simple geographic expansion to in-tegration as representing a new stage in the global man-agement of R&D, defined in a 1996 study by the IndustrialResearch Institute and the Massachusetts Institute of Tech-nology as “the ability of the technology development orga-nization to recognize and respond to technology from allstrategically important locations.59
For a practical example of the influences that have led tothis new stage of global R&D, the following may be as-cribed to the German TNC, Siemens AG:
• Customer orientation – the key to innovation manage-ment
• Access to current innovative hot spots• Local content requirements• International cost differentials• Mergers & acquisitions60
6.5 Virtual integration
Vertical Integration
The “modern corporation” as it has been called in the in-dustrial age was a self-contained, hierarchal, multi-layeredorganization. The vertically integrated “value chain,”which is simply shown in Figure 6.2, was wholly owned toas great an extent as possible, supported by the belief that‘in-house’ capabilities minimized uncertainty and maxi-mized profitability. Behemoths of this ilk became the mod-els of industrial organization on a multinational scale.
47
Sales and Marketing
Purchasing andManufacturing
DesignRelated
Figure 6.2. Vertical integration.Source: Sturgeon (1997).
59 Globalization of R&D enters new stage as firms learn to integrate technology operations”(http://onlinejournal.net/iri/RTM/free/html/43_1_2.html)
60 “Chasing talent” (1 August 2000) (http://eb-mag.com)

In its heyday, the modern corporation’s far-ranging opera-tions functioned in an era that did not experience the samepace of technological change that is encountered today.The environment changed more slowly; it was easier tomodel in corporate plans and easier to control through ad-ministrative systems. The rewards and risks of such an or-ganization are found in Table 6.1.
To be fair, it must be noted that the modern corporation wasnever truly an entity unto itself as can be observed in Figure6.3. Other organizations and stakeholders outside of thecorporation’s proprietary holdings exerted their influ-ences; although, some would argue that it worked the otherway when giant multinationals were concerned. But that isanother story. For the purposes of this chapter, these influ-ences help shape the identities of production chains or sys-tems, and they are explored at the national level in section6.6, below.
The turbulence created by the forces of globalizationbrought the vertical model of business organization intoquestion as original equipment manufacturers (OEMs)strove to innovate and compete in the global marketplace.The so-called modern corporation appeared sluggish in itsresponse to competition.
Sturgeon (1997) finds evidence to suggest that a newmodel of industry organization emerged in the 1990s. Thismodel may be described as follows:
• It focuses on functional specialization versus vertical in-tegration.
• It is the result of the shift away from mass productionand mass consumption to “flexible production” and“customized consumption.”
• It takes advantage of external economies by subcontract-ing with outside suppliers that possess “core competen-
48
Rewards Risks
Improved control/coordinationPotentially faster response timeOpportunity to further improve/harmonizeLarger revenue opportunityHigher margin
More organizational complexityCompromised solutionSlower asset turn, lower ROICErosion of valuationHigher earning volatility
Table 6.1. Rewards and risks of vertical integration.Source: Electronic Business, September 2000; Chase H&Q.
Materia Procurement Transformation Marketing& Sales
Distribution
Technology / Research & Development(product design, process technology, logistics of procurement / distribution)
Services
Transport and Communications Processes(movement of materials, products, people and information)
FINANCIAL SYSTEM
REGULATION, CO-ORDINATION, CONTROL
Figure 6.3. Levels in the production (value) chain. Source: Dicken, 1998.

cies” which exceed those that were previously keptin-house, thus freeing the OEM’s resources for doingwhat it does best – satisfying the customer’s ever chang-ing needs, wherever they may be in the world, throughthe development and marketing of innovative products.
Sturgeon (1997) states:
The totality of the external linkages created by contractingrelationships in larger amalgams of firms have been de-scribed as “production networks.” These production net-works represent a …split between innovation and produc-tion…
Figure 6.4 graphically represents both the shift toward theproduction network of functional specialization as well asthe split between innovative processes and production pro-cesses.
In Sturgeon’s (1997) model of a production network, theOEM, now referred to as the “Brand Name Firm,” has theability, as described earlier by Dicken (1998), to “co-ordi-nate and control operations…even if it does not ownthem.” Nortel Networks describes this as “virtual integra-tion.”
Key examples of how the above model is put into play canbe found in the public filings of two firms in the USA that
offer lines of personal digital assistant (PDA) products –i.e., Palm Pilot™ and Visor™, respectively.
• Palm – We currently outsource all of our manufacturingoperations to Manufacturers’ Services Limited andFlextronics. This outsourcing extends from prototypingto volume manufacturing and includes activities such asmaterial procurement, final assembly, test, quality con-trol and shipment to our distribution centers. These dis-tribution centers are outsourced functions operated byManufacturers’ Services Limited in Salt Lake City, Utahand IEC in Dublin, Ireland. Manufacturers’ ServicesLimited currently assembles Palm devices for us at itsUtah facility which it purchased from 3Com in Novem-ber 1999. Flextronics currently assembles Palm devicesat its facilities in Mexico, California and Malaysia. Ouroutsourced manufacturing strategy allows us to:– minimize our capital expenditures;– conserve the working capital that would be required
to fund inventory;– adjust manufacturing volumes quickly to meet
changes in demand; and– operate without dedicating any space to manufactur-
ing operations.61
• Handspring – All of our Visor handheld computers arecurrently manufactured on a purchase order basis eitherby Flextronics at its facilities in Malaysia or bySolectron at its facilities in Mexico. Flextronics and
49
Vertical Integration
Functional Specialization [Virtual Integration]
Product R&Process R&DProduct DefinitionFunctional DesignForm Design
Prototype FabricationParts PurchasingManufacturingTestingPackaging
Administration Marketing
Traditional Manufacturing Firm Market Channel
DistributorSales Reps.Systems IntegratorsRetail
END
USER
END
USER
Brand Name Firm Turnkey Contractor Market Channel
DistributorSales Reps.Systems IntegratorsRetail
AdministrationProduct R&DProduct DefinitionFunctional DesignForm DesignPrototype FabricationMarketing
AdministrationProcess R&DDesign for ManufacturingParts PurchasingManufacturingTestingPackaging
Figure 6.4. Shift toward the production network form of industry organization. Source: Sturgeon (1997).
61 Palm’s 10-K Annual Report (16 August 2000)
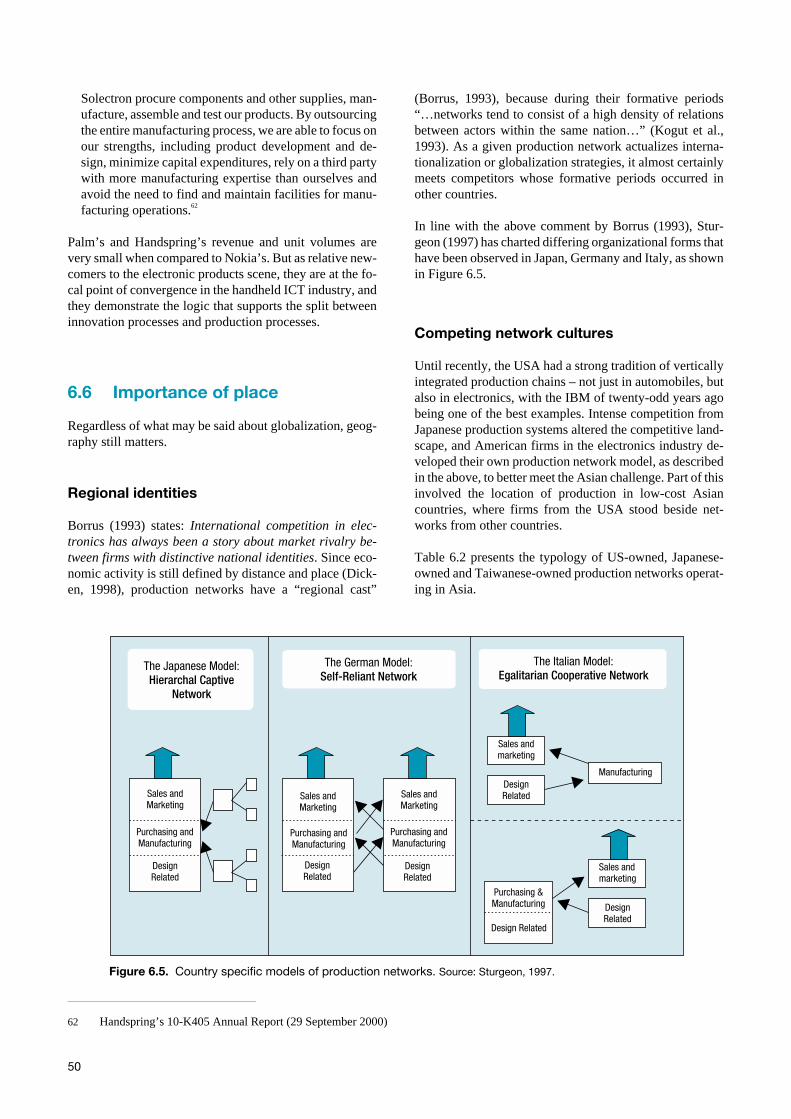
Solectron procure components and other supplies, man-ufacture, assemble and test our products. By outsourcingthe entire manufacturing process, we are able to focus onour strengths, including product development and de-sign, minimize capital expenditures, rely on a third partywith more manufacturing expertise than ourselves andavoid the need to find and maintain facilities for manu-facturing operations.62
Palm’s and Handspring’s revenue and unit volumes arevery small when compared to Nokia’s. But as relative new-comers to the electronic products scene, they are at the fo-cal point of convergence in the handheld ICT industry, andthey demonstrate the logic that supports the split betweeninnovation processes and production processes.
6.6 Importance of place
Regardless of what may be said about globalization, geog-raphy still matters.
Regional identities
Borrus (1993) states: International competition in elec-tronics has always been a story about market rivalry be-tween firms with distinctive national identities. Since eco-nomic activity is still defined by distance and place (Dick-en, 1998), production networks have a “regional cast”
(Borrus, 1993), because during their formative periods“…networks tend to consist of a high density of relationsbetween actors within the same nation…” (Kogut et al.,1993). As a given production network actualizes interna-tionalization or globalization strategies, it almost certainlymeets competitors whose formative periods occurred inother countries.
In line with the above comment by Borrus (1993), Stur-geon (1997) has charted differing organizational forms thathave been observed in Japan, Germany and Italy, as shownin Figure 6.5.
Competing network cultures
Until recently, the USA had a strong tradition of verticallyintegrated production chains – not just in automobiles, butalso in electronics, with the IBM of twenty-odd years agobeing one of the best examples. Intense competition fromJapanese production systems altered the competitive land-scape, and American firms in the electronics industry de-veloped their own production network model, as describedin the above, to better meet the Asian challenge. Part of thisinvolved the location of production in low-cost Asiancountries, where firms from the USA stood beside net-works from other countries.
Table 6.2 presents the typology of US-owned, Japanese-owned and Taiwanese-owned production networks operat-ing in Asia.
50
The Italian Model:Egalitarian Cooperative Network
Sales andmarketing
DesignRelated
Manufacturing
Purchasing &Manufacturing
Design Related
Sales andmarketing
DesignRelated
The Japanese Model:Hierarchal Captive
Network
Sales andMarketing
Purchasing andManufacturing
The German Model:Self-Reliant Network
Sales andMarketing
Purchasing andManufacturing
DesignRelated
Purchasing andManufacturing
DesignRelated
Sales andMarketing
DesignRelated
Figure 6.5. Country specific models of production networks. Source: Sturgeon, 1997.
62 Handspring’s 10-K405 Annual Report (29 September 2000)
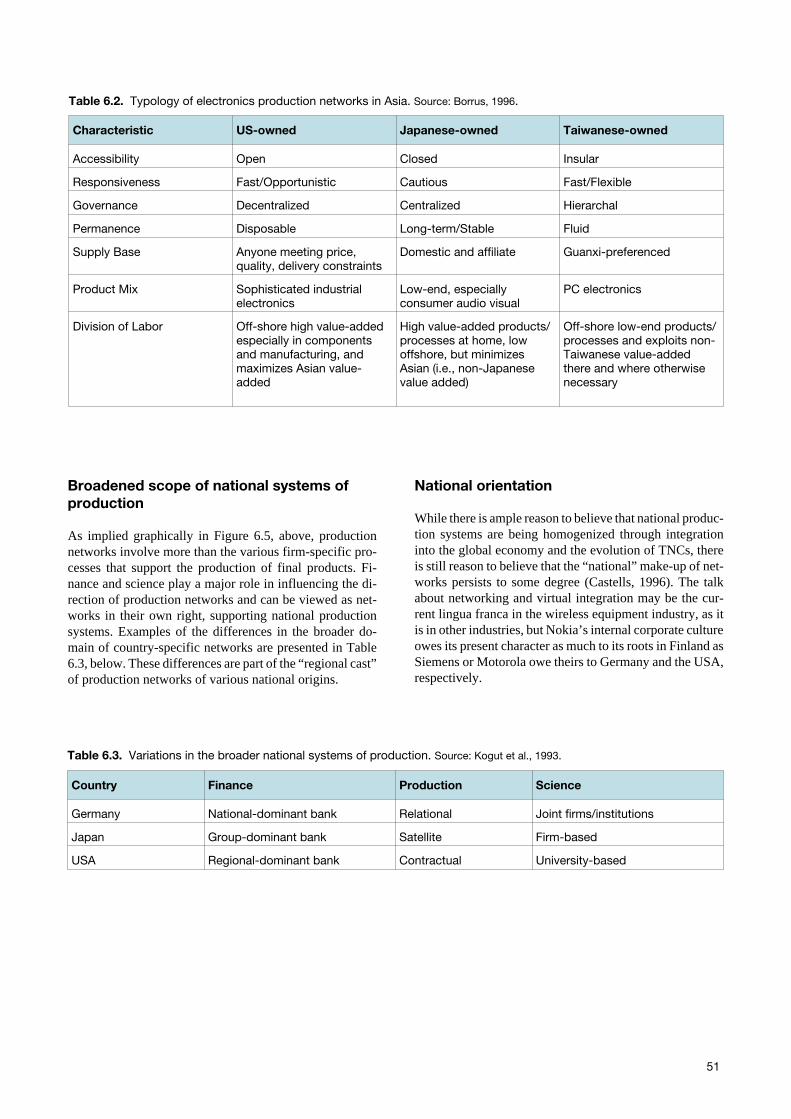
Broadened scope of national systems ofproduction
As implied graphically in Figure 6.5, above, productionnetworks involve more than the various firm-specific pro-cesses that support the production of final products. Fi-nance and science play a major role in influencing the di-rection of production networks and can be viewed as net-works in their own right, supporting national productionsystems. Examples of the differences in the broader do-main of country-specific networks are presented in Table6.3, below. These differences are part of the “regional cast”of production networks of various national origins.
National orientation
While there is ample reason to believe that national produc-tion systems are being homogenized through integrationinto the global economy and the evolution of TNCs, thereis still reason to believe that the “national” make-up of net-works persists to some degree (Castells, 1996). The talkabout networking and virtual integration may be the cur-rent lingua franca in the wireless equipment industry, as itis in other industries, but Nokia’s internal corporate cultureowes its present character as much to its roots in Finland asSiemens or Motorola owe theirs to Germany and the USA,respectively.
51
Country Finance Production Science
Germany National-dominant bank Relational Joint firms/institutions
Japan Group-dominant bank Satellite Firm-based
USA Regional-dominant bank Contractual University-based
Table 6.3. Variations in the broader national systems of production. Source: Kogut et al., 1993.
Characteristic US-owned Japanese-owned Taiwanese-owned
Accessibility Open Closed Insular
Responsiveness Fast/Opportunistic Cautious Fast/Flexible
Governance Decentralized Centralized Hierarchal
Permanence Disposable Long-term/Stable Fluid
Supply Base Anyone meeting price,quality, delivery constraints
Domestic and affiliate Guanxi-preferenced
Product Mix Sophisticated industrialelectronics
Low-end, especiallyconsumer audio visual
PC electronics
Division of Labor Off-shore high value-addedespecially in componentsand manufacturing, andmaximizes Asian value-added
High value-added products/processes at home, lowoffshore, but minimizesAsian (i.e., non-Japanesevalue added)
Off-shore low-end products/processes and exploits non-Taiwanese value-addedthere and where otherwisenecessary
Table 6.2. Typology of electronics production networks in Asia. Source: Borrus, 1996.

Technology Centers
It is apparent that industries tend to cluster in a select num-ber of high-tech centers or regions (Dicken, 1998). Thesecenters are specialized; although, some centers may ad-dress multiple segments of a particular industrial sector –e.g., ICT in Silicon Valley.63
Geographers refer to “agglomeration economies” when de-scribing the spatial clustering of production networks intechnology centers or “industrial districts.” (Sturgeon,1997) Krugman (1991) describes the process:
Because of economies of scale, producers have an incen-tive to concentrate production of each good or service in alimited number of locations. Because of the costs of trans-acting across distance, the preferred locations for each in-dividual producer are those where demand is large or sup-ply of inputs is particularly convenient – which in generalare locations chosen by other producers. Thus concentra-tion of industry, once established, tend to be self-sustain-ing…
As “globalized” production networks of differing nationalorigins cluster around the same technology centers – forexample the Dallas-Fort Worth area of Texas in the USAfor wireless networks – it is logical, to a certain degree, that“best practices” in the industry would be shared and/or imi-tated. A successful business model or organizational para-digm builds a momentum of its own, helped along by cor-porate peers, academics, consultants, financiers, suppliers,distributors, trade publications and newly hired employeesfrom competitors’ organizations.
6.7 New model of production inthe ICT industry
In writing about a new model of industrial organization inthe electronics industry, Sturgeon (1997) states:
…external scale economies are coming to reside in a cadreof specialized merchant suppliers that offer access to afunctionally coherent set of production functions as a ser-vice to their customers, the brand name firms.
These production functions, or rather electronics manufac-turing services (EMS), have been commodified, accordingto Sturgeon, and they can be shared industry-wide, asshown in Figure 6.6.
Evidence to support the industry-wide sharing of EMS canbe found readily enough in the mobile phone business.Alcatel, Ericsson, Motorola and Siemens have announceddecisions to outsource. Simple economics is the reason.And there is just a small pool of EMS companies –Solectron, Celestica and Flextronics – that have the abilityto do the big deals, according to Flextronics’ chairman andchief executive.64 In line with this view is that of Solectron’svice president of strategic marketing, who believes by2004–05 there will be three-to-four megacompanies thatwill control 70% of the EMS business.65 That being said,will the above model become truly ubiquitous?
52
Sales and Marketing
DesignRelated
Purchasing andManufacturing
Sales and Marketing
DesignRelated
Figure 6.6. Shared EMS. Source: Sturgeon, 1997.
63 See The Wall Street Journal (Tuesday, 23 November 1999), The Globe And Mail (Thursday, 24 February 2000), Kauppalehti(Friday, 26 January 2001)
64 “EMS providers see $10 billion windfall from cell phones” (1 May 2001) (http://www.ebnews.com)65 See Electronics 2000 (www.e-insite.net)

6.8 Globalization of the EMSmodel
Worldwide market
The large EMS provider Sanmina reports on its websitethat the global EMS industry will grow by 25% during thecoming year, reaching $122 billion by 2002.66 Figure 6.7provides another forecast, showing the industry will fur-ther increase its revenues to $200 billion by 2004.
The worldwide EMS market makes up only a small portionof the overall OEM assembly market – less than 20%, andthe share is no better in wireless. An analyst at DeutscheBank Alex. Brown was reported to say in January 2001 thatless than 10% of wireless products are produced by EMScompanies.67 Technology Forecasters predicts that this willrise to only 14.5% in 2004.68
There have been major outsourcing announcements byAlcatel, Ericsson, Motorola and Siemens, which calls theabove modest market shares into question. Nevertheless,these estimates are understandable, given the growing mar-ket share by Nokia and the current impenetrable nature ofmany Asian production networks.
Who controls the model?
Control over the EMS industry, in terms of revenue and ge-ography, is highly concentrated. Banc of America Securi-
ties estimates the top ten EMS companies had a 61% mar-ket share in 2000, assuming $100 billion in sales, and thisshare could grow to 75% by 2005.69 While there are manycompanies that offer EMS, when the large market share ofa few companies is considered, it is obvious that a signifi-cant amount of the EMS industry is managed from NorthAmerica, as indicated in Table 6.4.
Growth of Electronics Outsourcing
Technology Forecasters presents what they believe to bethe “Five Waves of Electronics Industry OEM Out-sourcing”:1. North American Computer OEMs2. North American Communications OEMs3. European OEMs4. Japanese / Asian OEMs5. Comprehensive Full Assembly70
North American OEMs
The October 1999 issue of Circuits Assembly stated that theNorth American industry grew by 20% per year from 1984to 1998, when revenues reached $22.5 billion. Frost &Sullivan find that North American EMS revenues grew by47%, from $30 billion in 1999 to $44 billion in 2000.71
Frost & Sullivan note, however, that consolidation hasplayed an important part in this dramatic increase.
Figure 6.8 shows that the majority of EMS services flow tothe computer and communications industries.
53
0
200
400
600
800
1 000
1 200
1999 2004
EMS Sales
OEM AssemblyMarket
Figure 6.7. Worldwide EMS market (US $ in billion).Source: Electronic Trend Publications, October 2000.
Country Company HQs
CanadaFinlandSingaporeTaiwanThailandUSA
51321
38*
Note: Flextronics’ headquarters is in Singapore, but it ismanaged from California.
Table 6.4. Headquarters locations: Top 50 EMS com-panies. Source: Purchasing Magazine, 19 October 2000.
66 See http://www.sanmina.com/company_info/comp_pro/comppro.html67 “Big three move toward outsourcing handsets” (22 January 2001) Wireless Week68 “Wireless outpaces other equipment outsourcing” (http://www.techforecasters.com/content-press.html)69 California Technology Stock Letter (16 March 2001)70 Ibid.71 “Executive Business Briefing” headlinewatch.com (9 April 2001)

Figure 6.9 shows that large companies dominate the NorthAmerican EMS market just as they do in the global EMSmarket.
European OEMs
The European EMS market is not as big as North America’s,but it is growing. Reed Electronics Research predicts thatEMS in Europe will reach $28.9 billion by 2004. This is al-most double the estimate for 2001, as shown in Figure 6.10.
Figure 6.11 shows Germany and the United Kingdom to bethe biggest users of EMS, followed by France, the Scandi-navian countries and Italy.
54
7.58.8
10.412.3
14.6
17.2
0
5
10
15
20
1997 1998 1999 2000 2001 2002
US $
Figure 6.10. Growth of the European EMS market (US $in billions). Source: Electronics Industry Yearbook, 2001 Edition.
0.93.24.34.5
7.5
19.4
25.3
34.9
0
Compu
ter
10
20
30
40
Commun
icatio
ns
Indus
trial
Instru
mentat
ion
Autom
otive
Busine
ss Reta
il
Consu
mer
Electr
onics
Govern
ment/M
ilitary
%
Figure 6.8. Industrial markets served by the North American EMS industry.Source: Circuits Assembly, October 1999.
5434
15
68
0
10
20
30
40
50
60
70
80
Over $300Million
$100 – $300Million
$50 $99.9Million
– $20 $49.9Million
– $5 $19.9Million– Under $5
Million
%
Figure 6.9. Share of North American EMS market by company size (1998).Source: Circuits Assembly, October 2000.

In Figure 6.12, Reed Electronics Research provides an esti-mate of the top industrial markets served by the EMS in-dustry in Europe during 1999.
Again, announcements by Alcatel, Ericsson and Siemenspoint to the future role EMS will play in the wireless seg-ment of the European ICT industry.
Japanese / Asian OEMs
Asian production networks have traditionally relied on in-digenous sources of supply with complex linkages to affili-ates and subcontractors. By their very structure they havebeen closed to outside suppliers.72
In Japan at least, there is evidence that may offer slim sup-port for Technology Forecasters’ prediction of Asian OEMoutsourcing. For example, Electronic Business News re-
ports in its 20 October 2000 issue that Sony Corporationagreed to sell a plant in Japan and a plant in Taiwan toSolectron, thus figuratively opening the door for other Jap-anese OEMs to outsource to EMS companies. Also, in apress release, NEC America announced on 9 February2000 that it was selling its Hillsboro, Oregon, facility in theUSA to the Singapore-based EMS company, NatSteelElectronics Ltd. Whether or not these two examples repre-sent a wave of change in a country that controls approxi-mately 30% of the cost-of-goods sold in global electronicshardware remains to be seen. Sony, for example, plans tosell only seven of its 62 plants to the EMS industry.73
Is the EMS model truly global?
The EMS model, as represented by the contract manufac-turers (CMs), has only captured a small portion of theglobal electronics manufacturing business, as indicated inthe above. Not all OEMs or “brand-named companies”have adopted a strategy that involves a full divorce frommanufacturing, and some, such as Nokia, have been quitesuccessful in doing so. There must be more to outsourcingthan what is presented in the trade publications and aca-demic articles about the growing strength of CMs and theEMS model in the electronics industry. Perhaps the studyby Gartner Research and its affiliated unit, Dataquest, todetermine the real scope of the EMS market will give aclearer picture of the real reach of the model.74
6.9 Types of outsourcing servicesoffered and utilized
Ernst (1997) found that outside purchases of components,software and services, as a percentage of total ex-factoryproduction costs for the typical PC company had increasedfrom less than 60% in the mid-1980s to more than 80% by1997. Taking into account estimates for EMS market sharesin global markets, perhaps there is more depth to out-sourcing than otherwise indicated in EMS market forecasts.
Companies offering outsourcing services
Technology Forecasters Inc. announced in a 2 March 2001press release that the results of a survey it had conductedshowed that EMS companies account for the majority ofoutsourcing by OEMs because they provide more valueadded services. However, OEMs also outsource to othertypes of companies as well.
55
Germany28%
Other15%
Italy7%
France16%
UK23%
Scandinavia11%
Figure 6.11. Top European EMS markets by location (%of total market). Source: The Electronics Industry Yearbook2001.
Computer28%
Tele-communications
15%Automotive16%
Industrial16%
ConsumerElectronics
10%
Other15%
Figure 6.12. Top European EMS by markets by sector(% of total market). Source: Electronic Business, September2000.
72 Borrus M (no date) Riches and rivalry: production networks and the industrial integration of Asia (BRIE Background paper #3)73 California Technology Stock Letter (16 March 2001)74 http://www3.gartner.com/3_consulting_services/marketplace/ems.html

While the survey sample size was not stated, 89% of the re-spondents said they currently outsource and of the 11%who said they were not currently outsourcing, 60% saidthey would do so in the future.
For those OEMs that currently outsource, the types of com-panies they outsource to, on a percentage basis, may beroughly stated as follows:• EMS companies – between 80 to 90%• Original design manufacturers (ODMs) – approximately
20%• Single function assembly houses – between 20 to 30%• Other – less than 10%
Single function assembly is simple enough to understand.There may be confusion, however, over the difference be-tween EMS companies and ODMs, because the latter maybe seen as an effort by some firms in the EMS industry tohighlight the breadth and depth of their services offering.In order to clarify the situation, an EMS or contract manu-facturing company …manufactur[es] products accordingto a design owned by the name brand customer, even whenhelping to design the product. Whereas an ODMmanufactur[es] a product of one’s own proprietary designfor sale to name brand companies.75 The total ODM mar-ket for GSM mobile phones was 4 million units in 2000,and Acer in Taiwan a 75% market share.76
Real reasons for outsourcing
In the 10 October 2000 issue of Purchasing, the magazinepublished the results of its survey of OEMs on their reasons
for outsourcing. Multiple responses were allowed and thepercentage of replies for each reason are as follows:• Manufacturing cost savings – 81%• Avoid capital equipment investment – 57%• Improve time to market – 38%• Increased demand for product – 38%• Obtain technical expertise – 32%• Design assistance – 16%• Improve quality – 16%
Interestingly, the traditional reasons – money, time and ca-pacity – still lead the list of OEM reasons to outsource.What is not identified is the level of globally integratedsupply chain management and purchasing expertise thatmay be behind the major reasons for outsourcing. Servicessuch as these are part of an expanding manufacturing capa-bility.77
Expanded EMS offering
The Electronics Industry Yearbook 2000 states:
Essentially the goal of [EMS companies] is to develop theirbusiness so that OEM companies never see their products.
Such a goal requires that the EMS company offer an entiresuite of services from design to full systems (box build) as-sembly to after sales services. The major EMS companiesare starting list all of these as service options for their cli-ents. Table 6.5 provides a view of recent utilization andplanned offerings.
56
Service 1998OEMsUsing
1998CMs
Offering
2003CMs Plan to
offer
Design
Product definitionProduct designDesign for manufacturingDesign for test
14265550
5355
10094
8794
10095
Final systems
Mechanical AssemblySubassemblyFinal product assemblyFinal product test
30362638
95969898
95100100100
Table 6.5. EMS services sampling (as a %). Source: Electronic Business, September 2000.
75 Gordon P (September 2000) CEM and ODM distinction blur, especially in Taiwan (www.circuitassembly.com)76 See http://www.siliconstategies.com/story/OEG200010302S005177 See Electronics 2000 (www.e-insite.net)

Design outsoucing
Design outsourcing has become a big issue in EMS. In asurvey by Cahners Research, 4 000 senior executives in theelectronics industry were queried about their firms’ utiliza-tion of contract manufacturers (CMs) design-related ser-vices.78 The results of the survey indicted the following:• Thirteen percent (13%) of the respondents said their
firms always use CMs, and 63% said they occasionallyuse them, with the remaining 24% saying never.
• Nine percent (9%) of the respondents said that theirfirms always use CMs to help with their designs, and57% said they occasionally use CMs, with the remainder34% saying never.
• Fifty-nine percent (59%) answered “yes” to the questionas to whether over the next five years they would useCMs for product development, and 41% answered “no.”
• Ninety-nine percent (99%) answered “yes” to the ques-tion as to whether over the next five years their firmwould use CMs for design, and only 1% said “no.”
Questions still remain as to the extent EMS companies willbecome involved in the design of OEM products. As oneperiodical stated, Flextronics’ design capability was notthe reason Motorola signed an outsourcing contract worthpotentially $30 billion.79 The core area of design expertisethat EMS companies will be called on to provide will be inthe area of manufacturing, which is where they are sup-posed to be the most qualified.
One area of outsourcing that does not seem to be capturedin the trade literature is the role of component suppliers inthe outsourced design of proprietary components forOEMs. Also, there is a need for more information on therole of the pure contract design house in OEM outsourcingplans. Since these areas are obviously the most critical inOEM innovation strategies, details as to firms, practicesand spending are closely guarded secrets. Nevertheless, asearlier stated, we know that OEMs are very active in thesetypes of relationships.
After sales service
After sales service – e.g., warranty repairs and logistics –could be a $300 billion business for EMS companies.80
With all of the headaches associated with warranties, this isprobably the in-house responsibility that OEMs do notwant, and yet it is at the center of providing specialized andcustomized service to the customer as well as foremost inpreserving hard-earned brand recognition. Firms that hopeto offer a full-scope outsource solution will have to investheavily in this area, which may have liabilities that are un-foreseen.
6.10 Thoughts for the future
Convergence and globalization are givens in today’s busi-ness environment. Also, it is clear that outsourcing is atrend in the electronics industry. What is not obvious iswhether or not the split between innovation and manufac-turing will result in a shared pool of commodified produc-tion resources, and whether this is what the electronics in-dustry really needs in the long run.
It is true that EMS companies are growing throughoutsourcing contracts and acquisitions, and on the surface afew firms seem to be developing massive global economiesof scale in a wide array of services. However, in order tomaintain control over such vast organizations, aren’t the“mega” EMS companies mimicking what was known asthe “modern corporation,” with all its hierarchy and verti-cal layers?81
It is no secret that EMS companies operate on very thinmargins. When this reality is juxtaposed with the invest-ment required to create the mega EMS company and the re-sulting cost of capital, there is little room for error.
A heavy concentration of manufacturing resources in thehands of just a few companies can be costly – in both goodtimes and bad times. In an ongoing age of rapid change andblurred futures, it may be all too easy to grasp onto what ap-pears to be the logical model, only to later discover that allwas lost. Therefore, careful attention must be given to thewhole issue of networking in the global “teletech” busi-ness; appropriate strategies considered and proper stepsevaluated.
57
78 Carbone J (19 October 2000) Growth means more consolidation, more services(http://www.manufacturing.net/magazine/purchasing/archives/2000)
79 “Designing for dollars” (1 September 2000) (http://eb-mag.com)80 Serant, C (22 June 2000) On-on-one: CEMs find after sales market offers profitable opportunities
(http://www.ebnews.com/story/OEG2000622S0020)81 Flextronics is a case in point with their acquisitions for the purpose of creating their own enclosure company.
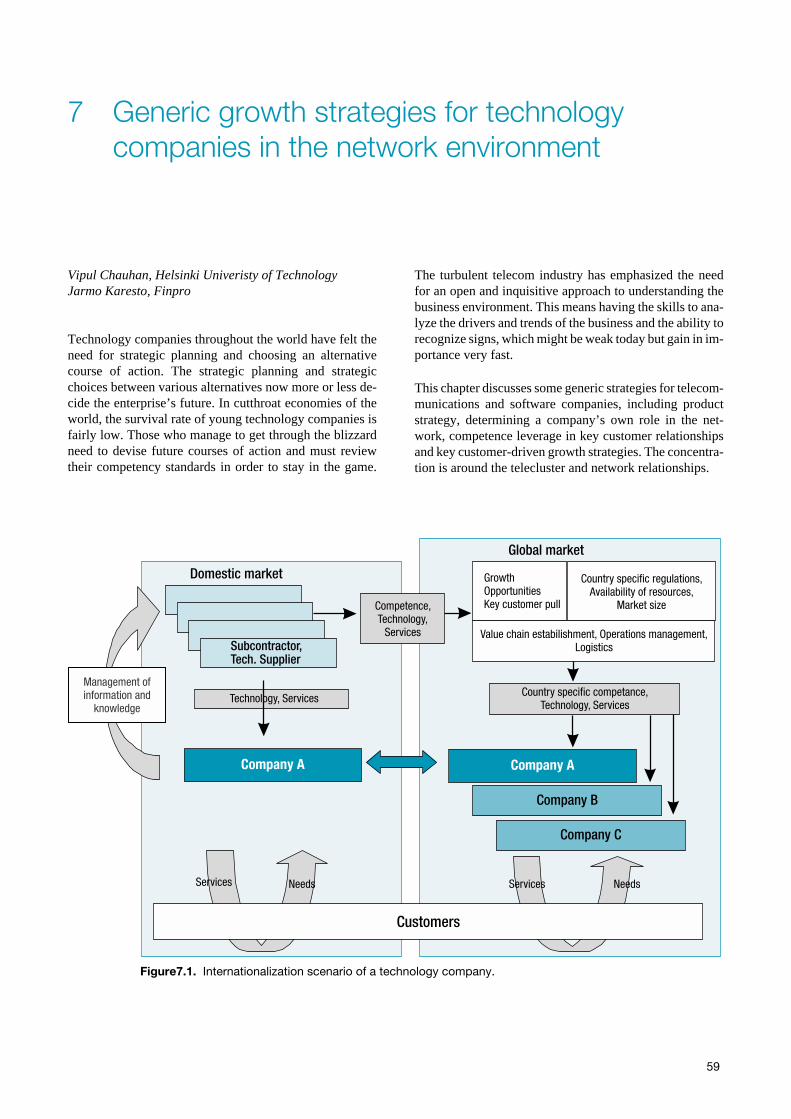
7 Generic growth strategies for technologycompanies in the network environment
Vipul Chauhan, Helsinki Univeristy of TechnologyJarmo Karesto, Finpro
Technology companies throughout the world have felt theneed for strategic planning and choosing an alternativecourse of action. The strategic planning and strategicchoices between various alternatives now more or less de-cide the enterprise’s future. In cutthroat economies of theworld, the survival rate of young technology companies isfairly low. Those who manage to get through the blizzardneed to devise future courses of action and must reviewtheir competency standards in order to stay in the game.
The turbulent telecom industry has emphasized the needfor an open and inquisitive approach to understanding thebusiness environment. This means having the skills to ana-lyze the drivers and trends of the business and the ability torecognize signs, which might be weak today but gain in im-portance very fast.
This chapter discusses some generic strategies for telecom-munications and software companies, including productstrategy, determining a company’s own role in the net-work, competence leverage in key customer relationshipsand key customer-driven growth strategies. The concentra-tion is around the telecluster and network relationships.
59
Company A
Competence,Technology,
Services
Country specific regulations,Availability of resources,
Market size
Company A
Country specific competance,Technology, Services
Management ofinformation and
knowledge
Customers
Services
Company B
Subcontractor,Tech. Supplier
Company C
Needs Services Needs
GrowthOpportunitiesKey customer pull
Value chain estabilishment, Operations management,Logistics
Domestic market
Global market
Technology, Services
Figure7.1. Internationalization scenario of a technology company.

7.1 Product strategy
The most infallible and precise strategy, particularly in thecase of technology-based companies and software houses,is to concentrate on product development. After improvingthe critical management process and operational effi-ciency, the key area to focus on is growth. In developing asuccessful strategy, companies face challenges from thecomplexity of products and customer needs, which aretechnologically driven.
The challenges can be broken down into categories like de-veloping new products, product life cycles, exploiting newand emerging technologies, and pursuit of competing tech-nologies. Product strategy, on the other hand, can be ex-plained as an integral part of the critical management pro-cess.82 The following picture demonstrates the structure ofproduct strategy.
The figure shows a four-level structure of product strategy.The first level indicates that the strategy starts with a clearstrategic vision; this helps the companies to determine thecourse of action and planning for the time to come. Clearvision helps to communicate where the company is head-ing and what it is doing. It also paves the way to get there.
The product platform level is perhaps the most importantand critical of strategy decisions. Open platforms are com-mon agreements between business actors in order to orga-nize and rationalize the technological complexity of busi-ness. The aim is to speed up development and make sav-ings in product development.
Open platforms boost business. They make it easier forcustomers to use the technology that is available if theydon’t have to limit themselves to a single technology pro-vider. On the other hand, by sharing open platforms thetechnology suppliers actually support their own business aswell. For example, Bluetooth, Epoc, and many other plat-forms were jointly created by major mobile phone andcomputer producers.
The platform concept is becoming more common also inin-house product developing. Well-specified platformfunctionality and interfaces help in reorganizing the devel-opment work. Decentralized development work and use ofsubcontractors would hardly be possible without plat-forms.
Some car manufacturers – and lately Nokia Mobile Phones– have announced implementing the platform concept intheir product development to help foster new product cre-ation. Audi, Volkswagen and Skoda are distinctive brandsof Volkswagen GmbH but the cars use the same bases, en-gines, and components. For car manufacturers it is muchfaster to change the look of a car than design a new engineor base. By offering several engines, colors, and interioroptions, the manufacturer can flexibly fulfill the changingneeds and tastes of the end customers.
The third level illustrates the desired structure of productline, whereby companies can decide over a span of timewhat can be introduced into the market. Moreover, productline strategy eases the development of individual productsin a certain product line.
60
Where to Go(Innovative approach)
Focus(Setting of game)
Adoption andAction
Development
Vision
Platforms
Product Line
Product Strategy Structure
Product
Long
Life cycle
Short
Figure 7.2. The structure of strategy process.
82 Grant R.M 1996: Toward a knowledge based theory of the firm, Strategic management Journal, Vol. 17

Product strategy as process
The research conducted by the PRTM83 suggests that prod-uct strategy should be considered an ongoing managementprocess rather than just another managerial activity: a pro-cess that has a defined and explained structure is easier tounderstand and manage. The process may differ from com-pany to company, depending on the type of business, butwill have common constituents like execution, timing, andresponsibility distribution. It is suggested here that a wisely-designed and properly-structured process of product strat-egy helps enterprises to propel their success factors further.
7.2 Strategic roles ofcollaboration
Researchers like Kanter84 and Kay85 have highlighted theadvantages and strategic roles of collaboration in technol-ogy-based companies, and how they aggregate as keybuilding blocks in adding corporate value. Collaborationand relationships are gaining focal attention in analyzinghow companies behave in the market and how they com-pete.
The following figure demonstrates the kinds of relation-ships that can exist in contexts of intensiveness of partner-ship and supply/demand orientation.
The discrete form of relationship is the weakest relation-ship model. A relational agreement exists but none of theinvolved are in a governing role. This kind of relationshipor collaboration is based on opportunity. If there is an op-portunity, then there is a tie between the parties. Largercompanies might seek new technology or skills and give asmall company the opportunity to show what it can offer.The supplier’s impact on the relationship is weak.
The relationship can grow from opportunity-based busi-ness to a recurrent-type of relationship, where the elementsof reciprocity and temporal duration creep into the picture.Partnership bonds are strong, but the parties do not sharethe same visions. The partners focus on operational issuesrather than foreseeing a possibility for strategic alliance.Economic efficiency and mutual trust are the driving forcesbehind the co-operation. Most component manufacturersfall in this category.
Companies that have selected clear service strategy insteadof product strategy generally begin cooperation with thecustomer assuming the dominant role. Focus is clearly on
61
RECURRENT(Economic efficiency/
reliability)
DISCRETE(Opportunity-focussed,
supply-oriented)
STRATEGIC(Shared visions and values,
common goals,focus on innovations)
CO-OPERATIVE(Flexibility, price criteria,
demand orientation)
Intensiveness ofpartnership
HIGH
LOW
Supply/Demand orientation
Figure 7.3. Explaining the categories of relationship forms.
83 ConclusionsReferences:
84 Kanter, Rosabeth Moss85 Kay, John M “Performance measurement in Business Process re-engineering”, By. Cranfield University, Cranfield ,
Bedfordshire, UK.
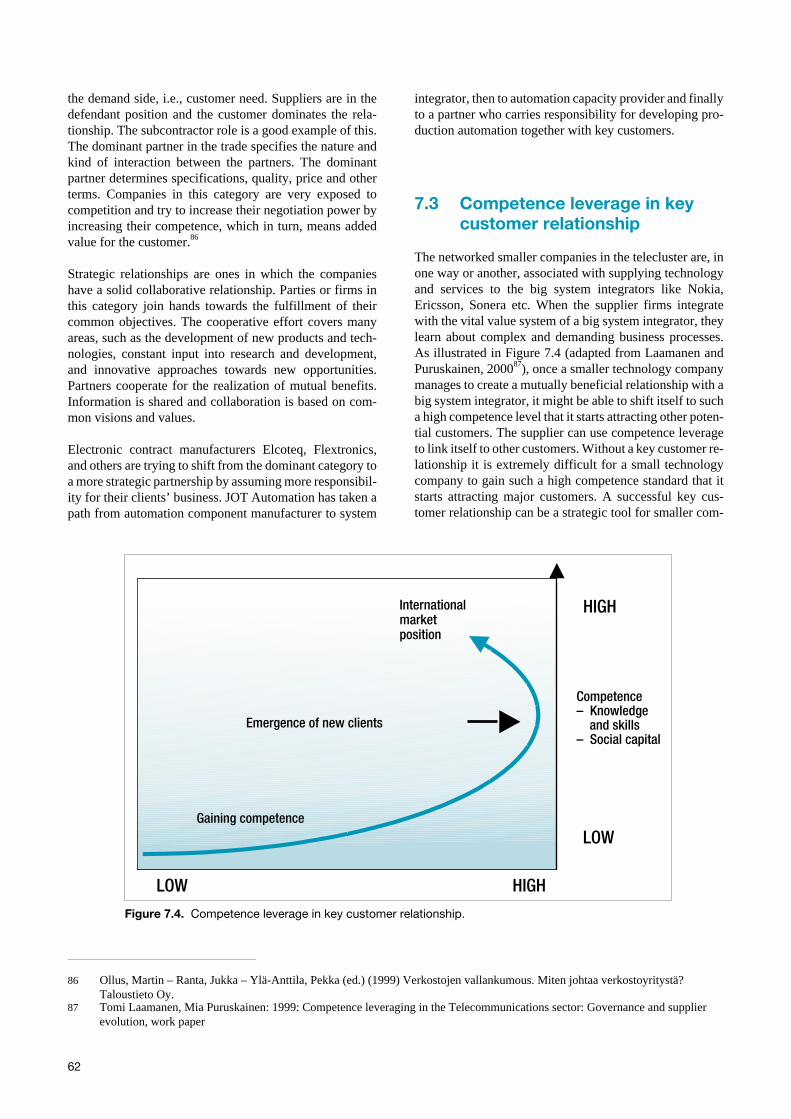
the demand side, i.e., customer need. Suppliers are in thedefendant position and the customer dominates the rela-tionship. The subcontractor role is a good example of this.The dominant partner in the trade specifies the nature andkind of interaction between the partners. The dominantpartner determines specifications, quality, price and otherterms. Companies in this category are very exposed tocompetition and try to increase their negotiation power byincreasing their competence, which in turn, means addedvalue for the customer.86
Strategic relationships are ones in which the companieshave a solid collaborative relationship. Parties or firms inthis category join hands towards the fulfillment of theircommon objectives. The cooperative effort covers manyareas, such as the development of new products and tech-nologies, constant input into research and development,and innovative approaches towards new opportunities.Partners cooperate for the realization of mutual benefits.Information is shared and collaboration is based on com-mon visions and values.
Electronic contract manufacturers Elcoteq, Flextronics,and others are trying to shift from the dominant category toa more strategic partnership by assuming more responsibil-ity for their clients’ business. JOT Automation has taken apath from automation component manufacturer to system
integrator, then to automation capacity provider and finallyto a partner who carries responsibility for developing pro-duction automation together with key customers.
7.3 Competence leverage in keycustomer relationship
The networked smaller companies in the telecluster are, inone way or another, associated with supplying technologyand services to the big system integrators like Nokia,Ericsson, Sonera etc. When the supplier firms integratewith the vital value system of a big system integrator, theylearn about complex and demanding business processes.As illustrated in Figure 7.4 (adapted from Laamanen andPuruskainen, 200087), once a smaller technology companymanages to create a mutually beneficial relationship with abig system integrator, it might be able to shift itself to sucha high competence level that it starts attracting other poten-tial customers. The supplier can use competence leverageto link itself to other customers. Without a key customer re-lationship it is extremely difficult for a small technologycompany to gain such a high competence standard that itstarts attracting major customers. A successful key cus-tomer relationship can be a strategic tool for smaller com-
62
Gaining competence
Emergence of new clients
Competence– Knowledge
and skills– Social capital
Internationalmarketposition
HIGH
LOW
HIGHLOW
Figure 7.4. Competence leverage in key customer relationship.
86 Ollus, Martin – Ranta, Jukka – Ylä-Anttila, Pekka (ed.) (1999) Verkostojen vallankumous. Miten johtaa verkostoyritystä?Taloustieto Oy.
87 Tomi Laamanen, Mia Puruskainen: 1999: Competence leveraging in the Telecommunications sector: Governance and supplierevolution, work paper

panies to expand their business to new customers outsidethe home market and even to new businesses.
When a supplier firm aligns with a system integrator forfulfillment of some common goal, the supplier becomes animportant part of the integrator’s value system. The rela-tionship between a supplier and system integrator is suchthat the supplier now becomes an integral part of the sys-tem integrator’s operation, business processes, and valuecreation. The system integrator injects technical and mana-gerial resources and competencies into the supplier firm.Through this mutually beneficial relationship the supplierfirm gets to raise its competency standards to a higherlevel.
It is important to understand that competence does notmean only technical capabilities and skills, but also socialcapital88. Social capital refers to interaction with people,systems, and organizations. Suppliers that are superior intechnology but are incapable of organizing cooperation are– in the clients’ eyes – uninteresting.
7.4 Key customer-driven growthstrategies
At least from a theoretical point of view, small technologysuppliers should seek cooperation with big world-classsystem integrators to leverage its competence to a world-class level. The Finnish companies Perlos, Electrobit, JOTAutomation, Orbis, and many others have successfullyutililized relationships with Nokia as a springboard for en-tering the global market.
Key customer relationships are multiform and not at allsafe. They open a lot of opportunities but the final successdepends on the managerial skills of the small technologysupplier.
1. Key customers benefit small technology suppliers themost by providing money to finance R&D and produc-tion, especially during the supplier’s infancy stage.The company is then able to concentrate the limited re-sources on essential matters.
2. Key customer relationships help technology com-panies that are in the early stages find their business fo-cus. The customer gives the supplier direction in itsproduct and service development and the burgeoningcompany does not need to waste its limited resourcesfinding its place in the market through trial and error.Early access to emerging business guarantees that thecompany will be ready when the main market opens.89
3. Key customers in the telecommunications business or-ganize their operations on global bases. Both R&D andproduction are networked following the global rules ofthe business. Once becoming part of the value systemof a key customer in one location – say, in Finland orSweden – it seems to be rather easy to expand opera-tions and serve the key customer in global bases. Easeis, however, a rather relative issue. Fast growth and es-tablishment of foreign operations are a challenge evenfor larger companies.Key customer service strategy has been the main strate-gy for most of the successful smaller technology com-panies in the telecommunications business. Nokia’s roleas a driving force behind the internationalization of theFinnish teletechnology industry has been extremely im-portant. After establishing international operations ba-sed on the key customer relationship, the supplier is in abetter position to start looking for other customers.
4. Learning opportunities that arise from key customerrelationships, social capital, and competence leveragewere discussed previously. All these issues are relatedto people and organizations and thus to culture. It isunderstandable that it is easier for a Finnish companyto build intimate relationships with Nokia or Ericssson– both of which are culturally more familiar – thanMotorola in the U.S., or Japanese companies. The im-portance of cultural issues, whether corporate or na-tional, should not be underestimated.
5. Reference is an essential advantage a key customer re-lationship can provide and is valid globally. A smallertechnology company using Nokia as a customer refe-rence gives the potential new customer three importantpieces of information about itself: it can offer interes-ting technology or services, it fulfills world-class qua-lity standards, and its organization is capable of wor-king with an extremely demanding partner.In a business like telecommunications, it is almost im-possible nowadays to approach big companies withouta good reference.
6. The last but not least-important aspect of key customerrelationships is the vision of the development of thebusiness. Close relationships with leading companies inthe business provide timely access to information. Cleartrends and radical changes in the business environmentare easy to recognize. However, it is much more diffi-cult to spot weak signs of development – ones whichmight grow in importance later. Examples of such signsare changes in customer needs, market environment,technology, other businesses or companies etc. This in-formation can help the company’s management buildalternative development scenarios and consider appro-priate strategy options. The earlier the information isreceived, the greater its strategic importance and thelesser the potential for wrong decisions.
63
88 Helena Yli Renko 1995: Social capital, Knowledge Acquisition and Competitive advantage in Technology based young firms,Strategic Management Journal.
89 Geoffrey A. Moore (1995) Inside the Tornado: Marketing Strategies from Silicon Valley’s Cutting Edge.
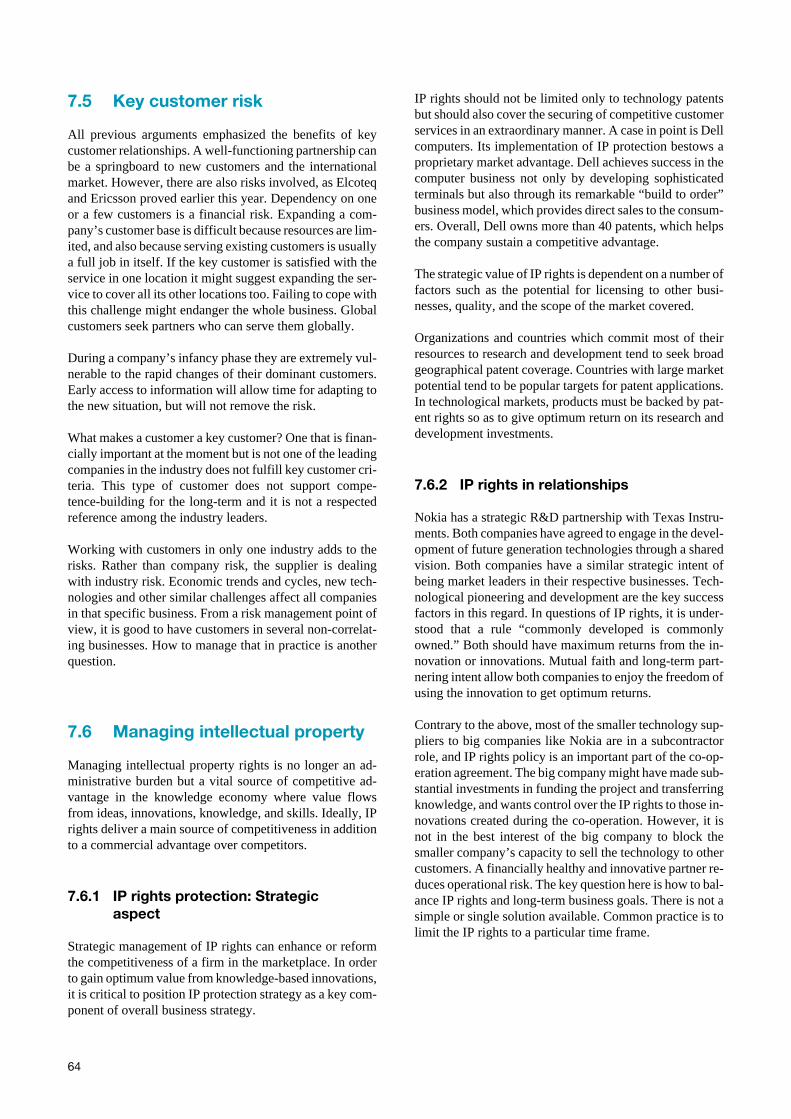
7.5 Key customer risk
All previous arguments emphasized the benefits of keycustomer relationships. A well-functioning partnership canbe a springboard to new customers and the internationalmarket. However, there are also risks involved, as Elcoteqand Ericsson proved earlier this year. Dependency on oneor a few customers is a financial risk. Expanding a com-pany’s customer base is difficult because resources are lim-ited, and also because serving existing customers is usuallya full job in itself. If the key customer is satisfied with theservice in one location it might suggest expanding the ser-vice to cover all its other locations too. Failing to cope withthis challenge might endanger the whole business. Globalcustomers seek partners who can serve them globally.
During a company’s infancy phase they are extremely vul-nerable to the rapid changes of their dominant customers.Early access to information will allow time for adapting tothe new situation, but will not remove the risk.
What makes a customer a key customer? One that is finan-cially important at the moment but is not one of the leadingcompanies in the industry does not fulfill key customer cri-teria. This type of customer does not support compe-tence-building for the long-term and it is not a respectedreference among the industry leaders.
Working with customers in only one industry adds to therisks. Rather than company risk, the supplier is dealingwith industry risk. Economic trends and cycles, new tech-nologies and other similar challenges affect all companiesin that specific business. From a risk management point ofview, it is good to have customers in several non-correlat-ing businesses. How to manage that in practice is anotherquestion.
7.6 Managing intellectual property
Managing intellectual property rights is no longer an ad-ministrative burden but a vital source of competitive ad-vantage in the knowledge economy where value flowsfrom ideas, innovations, knowledge, and skills. Ideally, IPrights deliver a main source of competitiveness in additionto a commercial advantage over competitors.
7.6.1 IP rights protection: Strategicaspect
Strategic management of IP rights can enhance or reformthe competitiveness of a firm in the marketplace. In orderto gain optimum value from knowledge-based innovations,it is critical to position IP protection strategy as a key com-ponent of overall business strategy.
IP rights should not be limited only to technology patentsbut should also cover the securing of competitive customerservices in an extraordinary manner. A case in point is Dellcomputers. Its implementation of IP protection bestows aproprietary market advantage. Dell achieves success in thecomputer business not only by developing sophisticatedterminals but also through its remarkable “build to order”business model, which provides direct sales to the consum-ers. Overall, Dell owns more than 40 patents, which helpsthe company sustain a competitive advantage.
The strategic value of IP rights is dependent on a number offactors such as the potential for licensing to other busi-nesses, quality, and the scope of the market covered.
Organizations and countries which commit most of theirresources to research and development tend to seek broadgeographical patent coverage. Countries with large marketpotential tend to be popular targets for patent applications.In technological markets, products must be backed by pat-ent rights so as to give optimum return on its research anddevelopment investments.
7.6.2 IP rights in relationships
Nokia has a strategic R&D partnership with Texas Instru-ments. Both companies have agreed to engage in the devel-opment of future generation technologies through a sharedvision. Both companies have a similar strategic intent ofbeing market leaders in their respective businesses. Tech-nological pioneering and development are the key successfactors in this regard. In questions of IP rights, it is under-stood that a rule “commonly developed is commonlyowned.” Both should have maximum returns from the in-novation or innovations. Mutual faith and long-term part-nering intent allow both companies to enjoy the freedom ofusing the innovation to get optimum returns.
Contrary to the above, most of the smaller technology sup-pliers to big companies like Nokia are in a subcontractorrole, and IP rights policy is an important part of the co-op-eration agreement. The big company might have made sub-stantial investments in funding the project and transferringknowledge, and wants control over the IP rights to those in-novations created during the co-operation. However, it isnot in the best interest of the big company to block thesmaller company’s capacity to sell the technology to othercustomers. A financially healthy and innovative partner re-duces operational risk. The key question here is how to bal-ance IP rights and long-term business goals. There is not asimple or single solution available. Common practice is tolimit the IP rights to a particular time frame.
64

8 Getting global, road map for technology firms
Lasse Baldauf, Finpro
8.1 Which direction?
Because information and communication technologies arethe major drivers of modern globalization, it is not a sur-prise that the ICT industry is global in reach.
The Finnish ICT cluster has benefited from the global de-mand for wireless ICT and the success of Nokia’s offering.Finnish ICT companies have been able to enter foreignmarkets based on Nokia’s demand for their products andservices. However, the commercial benefit derived fromNokia’s successful penetration of global markets has a po-tential downside. It has been reported in the Finnish busi-ness press that much of the service and supply networksupporting Nokia is too heavily dependent on Nokia.
The Finnish ICT cluster’s heavy dependence on Nokia ex-poses the firms that make up the cluster to a significant de-gree of risk in an uncertain technological landscape. Theoverall health of the Finnish economy is also exposed.Therefore, the primary reason behind the initiation of thisstudy has always been to enable the Finnish ICT cluster, orrather network, to offset its risk through participation inother global ICT-based networks that are centered on lead-ing wireless ICT companies. Any roadmap to gettingglobal must be focused on these networks and the compa-nies that lead them.
8.2 Needs and requirements forglobal business
Nokia operates in all three major continents – Americas,Asia and Europe – in its wireless business. Being part ofthat network, Nokia’s Finnish partners have entered thesemajor markets one way or the other if they wanted to main-tain their close relationship with Nokia. In this case Nokiahas made the business of its subcontractors global eventhough the subcontractors might not have been otherwiseentering these new markets.
Company level considerations
Becoming global creates new demands on the companiesoperations, the main ones being:
• Personnel, the operations know how has to be trans-ferred from the home country to a totally new operatingenvironment. This issue is perhaps one of the most de-manding aspects of becoming a global company. Therehas to be a right mix of the core knows how from the par-ent company with adequate new country knowledge.
• Financial commitments; global operations will increasethe operating budgets
• Strategy evaluation; Companies should look into whatother business opportunities they could accomplish byfollowing their business network to the global markets
Business environment considerations
Some fundamental changes are occurring in the productionnetworks of today as result of the demand for more flexibleproduction networks and the drive of companies to focuson their core competencies.
Ericsson has graphically presented the shift away from ver-tical integration with respect to the telecommunicationsequipment value chain (Figures 8.1 and 8.2).
Perhaps the best case for analyzing the shift away from ver-tical integration in order to achieve flexibility in the tele-communications equipment industry is found in NortelNetwork’s strategy. In its 1999 annual report, Nortel an-nounced that the company was creating seven global sys-tems houses which link customers, design centers, internalmanufacturing, suppliers, contract manufacturers andother parts of the supply chain. Nortel defines the shift as amove toward virtual integration.
Nortel states: “The operations strategy involves the divest-ing and/or outsourcing to contract manufacturers all butNortel Network’s most complex printed circuit board as-sembly, most of Nortel Network’s electromechanical sub-systems manufacturing, and a significant part of the repairbusiness.”
65

Geographical considerations
In chapter 9 of this study some major wireless companiesare benchmarked. Their global locations are shown in theenclosed maps (Figures 8.3 to 8.4).
66
ComponentSupplier
TelecomSupplier
TelecomOperator
Enduser
Figure 8.1. Telecommunications Value Chain, Traditional model. Source: Ericsson.
Content &ServicesPackaging
DistributionContentPresentationGateway
Systems &Platforms
Components&
Sub-systems
Services &Applications
End-UserDevices E
nd
Users
Figure 8.2. Telecommunications Value Chain, New Content & Service Model. Source: Ericsson.
EricssonMotorolaNokiaPanasonicSamsungSiemens
Spain
SingaporeMalaysia
Japan
Scandinavia
Korea
USAChina
MEXICO
BRAZIL
IRELAND
UKE
GermanyE
HungaryE
Figure 8.3. Top six wireless companies’ manufacturing locations.
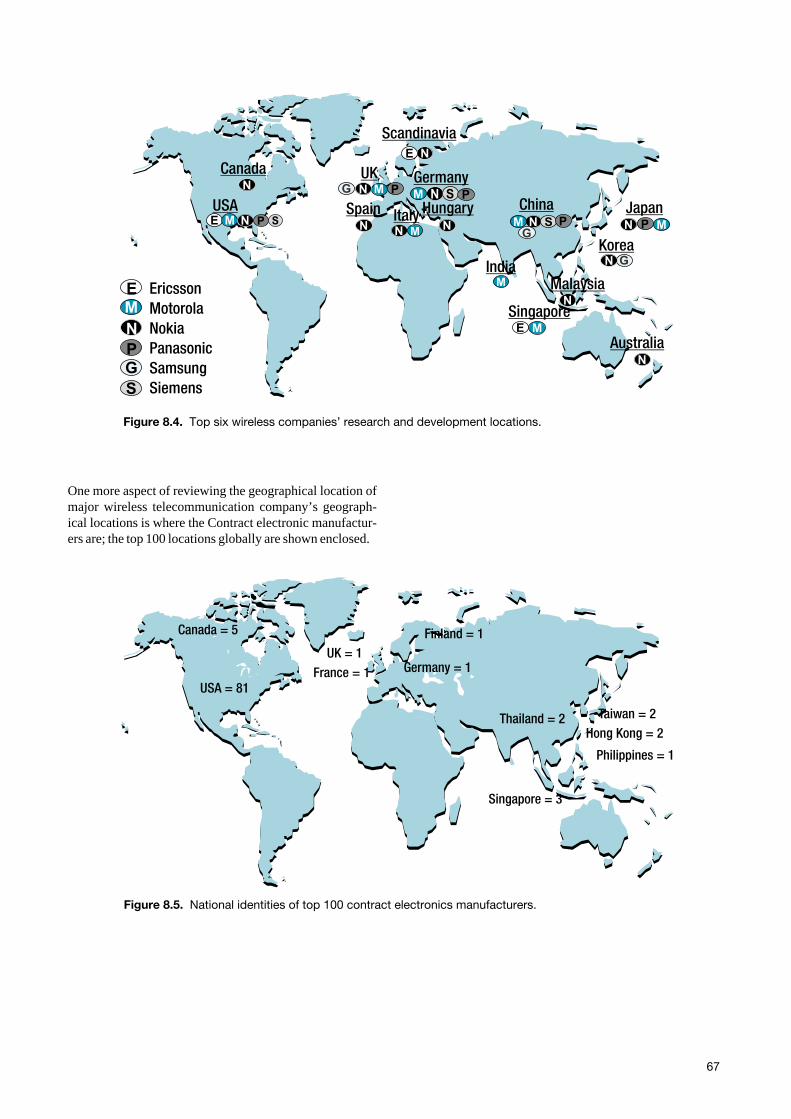
One more aspect of reviewing the geographical location ofmajor wireless telecommunication company’s geograph-ical locations is where the Contract electronic manufactur-ers are; the top 100 locations globally are shown enclosed.
67
EricssonMotorolaNokiaPanasonicSamsungSiemens
Scandinavia
Canada UK
Spain
Malaysia
Singapore
Japan
Korea
Italy
India
Australia
ChinaUSA
Germany
Hungary
Figure 8.4. Top six wireless companies’ research and development locations.
USA = 81
Canada = 5 Finland = 1
Germany = 1
Thailand = 2
France = 1UK = 1
Singapore = 3
Philippines = 1
Hong Kong = 2Taiwan = 2
Figure 8.5. National identities of top 100 contract electronics manufacturers.
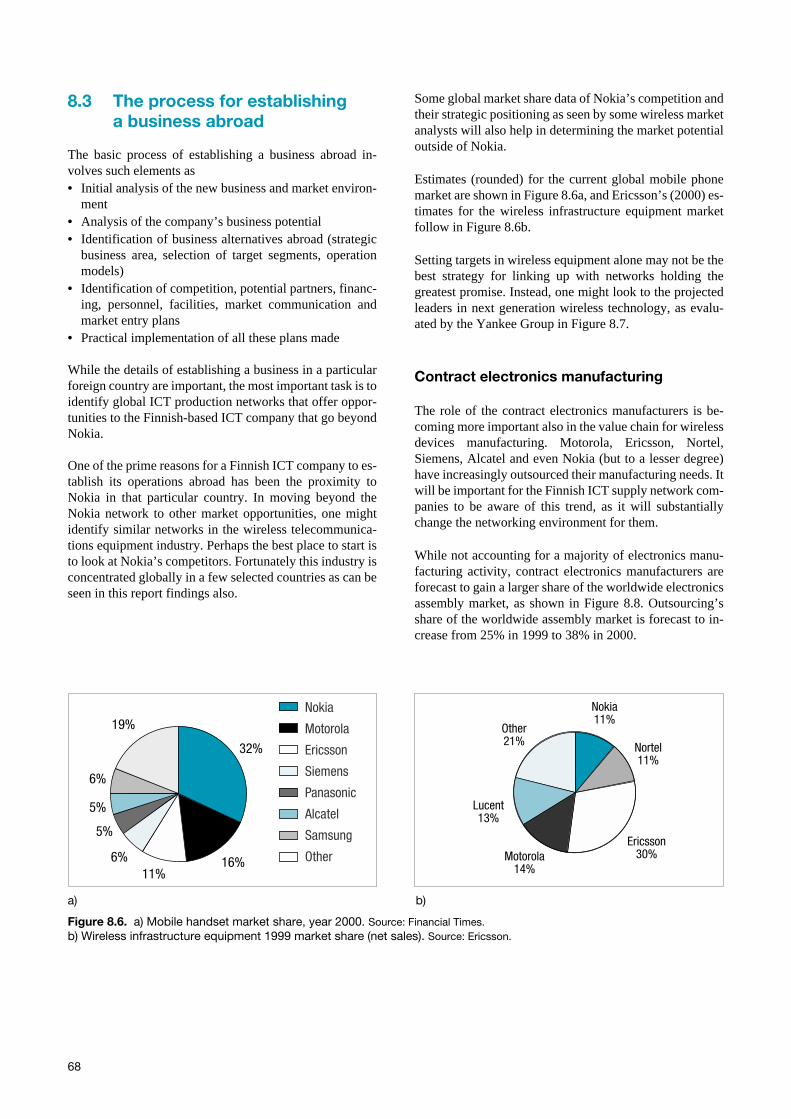
8.3 The process for establishinga business abroad
The basic process of establishing a business abroad in-volves such elements as• Initial analysis of the new business and market environ-
ment• Analysis of the company’s business potential• Identification of business alternatives abroad (strategic
business area, selection of target segments, operationmodels)
• Identification of competition, potential partners, financ-ing, personnel, facilities, market communication andmarket entry plans
• Practical implementation of all these plans made
While the details of establishing a business in a particularforeign country are important, the most important task is toidentify global ICT production networks that offer oppor-tunities to the Finnish-based ICT company that go beyondNokia.
One of the prime reasons for a Finnish ICT company to es-tablish its operations abroad has been the proximity toNokia in that particular country. In moving beyond theNokia network to other market opportunities, one mightidentify similar networks in the wireless telecommunica-tions equipment industry. Perhaps the best place to start isto look at Nokia’s competitors. Fortunately this industry isconcentrated globally in a few selected countries as can beseen in this report findings also.
Some global market share data of Nokia’s competition andtheir strategic positioning as seen by some wireless marketanalysts will also help in determining the market potentialoutside of Nokia.
Estimates (rounded) for the current global mobile phonemarket are shown in Figure 8.6a, and Ericsson’s (2000) es-timates for the wireless infrastructure equipment marketfollow in Figure 8.6b.
Setting targets in wireless equipment alone may not be thebest strategy for linking up with networks holding thegreatest promise. Instead, one might look to the projectedleaders in next generation wireless technology, as evalu-ated by the Yankee Group in Figure 8.7.
Contract electronics manufacturing
The role of the contract electronics manufacturers is be-coming more important also in the value chain for wirelessdevices manufacturing. Motorola, Ericsson, Nortel,Siemens, Alcatel and even Nokia (but to a lesser degree)have increasingly outsourced their manufacturing needs. Itwill be important for the Finnish ICT supply network com-panies to be aware of this trend, as it will substantiallychange the networking environment for them.
While not accounting for a majority of electronics manu-facturing activity, contract electronics manufacturers areforecast to gain a larger share of the worldwide electronicsassembly market, as shown in Figure 8.8. Outsourcing’sshare of the worldwide assembly market is forecast to in-crease from 25% in 1999 to 38% in 2000.
68
a) b)
Figure 8.6. a) Mobile handset market share, year 2000. Source: Financial Times.b) Wireless infrastructure equipment 1999 market share (net sales). Source: Ericsson.
32%
16%11%
6%
5%
5%
6%
19%Nokia
Motorola
Ericsson
Siemens
Panasonic
Alcatel
Samsung
Other
Nokia11%
Nortel11%
Ericsson30%
Other21%
Motorola14%
Lucent13%
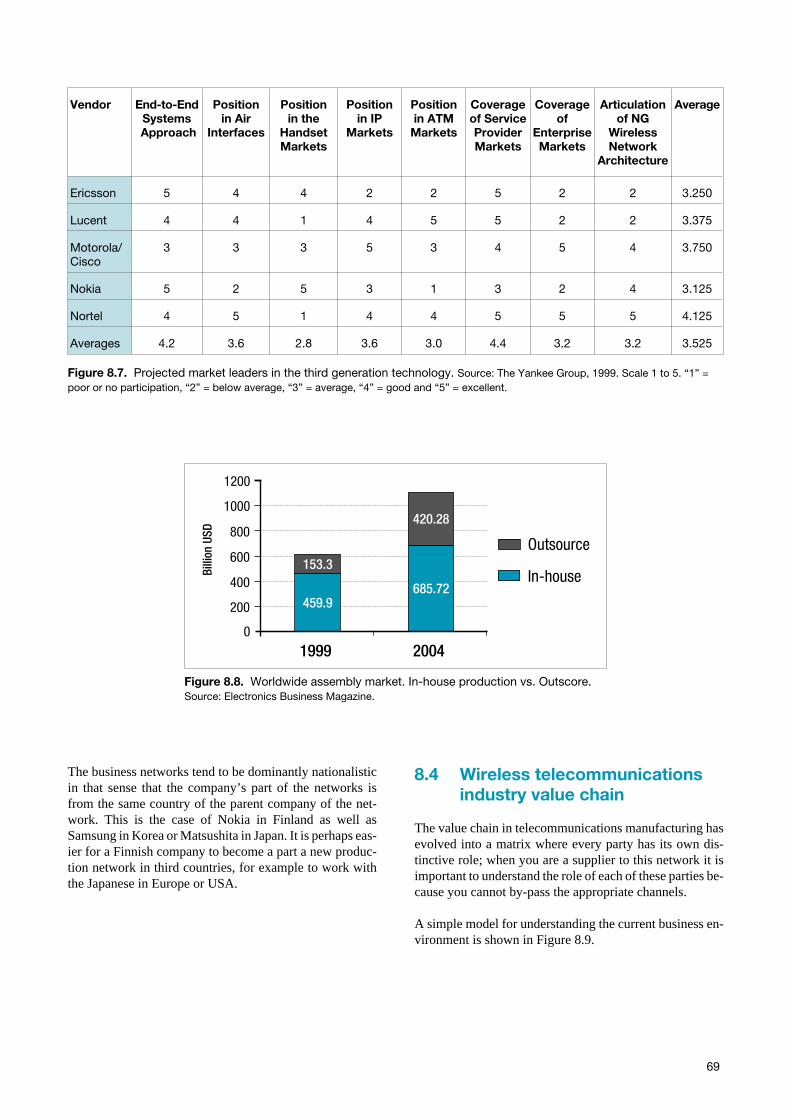
The business networks tend to be dominantly nationalisticin that sense that the company’s part of the networks isfrom the same country of the parent company of the net-work. This is the case of Nokia in Finland as well asSamsung in Korea or Matsushita in Japan. It is perhaps eas-ier for a Finnish company to become a part a new produc-tion network in third countries, for example to work withthe Japanese in Europe or USA.
8.4 Wireless telecommunicationsindustry value chain
The value chain in telecommunications manufacturing hasevolved into a matrix where every party has its own dis-tinctive role; when you are a supplier to this network it isimportant to understand the role of each of these parties be-cause you cannot by-pass the appropriate channels.
A simple model for understanding the current business en-vironment is shown in Figure 8.9.
69
Vendor End-to-EndSystemsApproach
Positionin Air
Interfaces
Positionin the
HandsetMarkets
Positionin IP
Markets
Positionin ATM
Markets
Coverageof ServiceProviderMarkets
Coverageof
EnterpriseMarkets
Articulationof NG
WirelessNetwork
Architecture
Average
Ericsson 5 4 4 2 2 5 2 2 3.250
Lucent 4 4 1 4 5 5 2 2 3.375
Motorola/Cisco
3 3 3 5 3 4 5 4 3.750
Nokia 5 2 5 3 1 3 2 4 3.125
Nortel 4 5 1 4 4 5 5 5 4.125
Averages 4.2 3.6 2.8 3.6 3.0 4.4 3.2 3.2 3.525
Figure 8.7. Projected market leaders in the third generation technology. Source: The Yankee Group, 1999. Scale 1 to 5. “1” =poor or no participation, “2” = below average, “3” = average, “4” = good and “5” = excellent.
459.9685.72
153.3
420.28
200
0
400
600
800
1000
1200
1999 2004
Billi
on U
SD
Outsource
In-house
Figure 8.8. Worldwide assembly market. In-house production vs. Outscore.Source: Electronics Business Magazine.
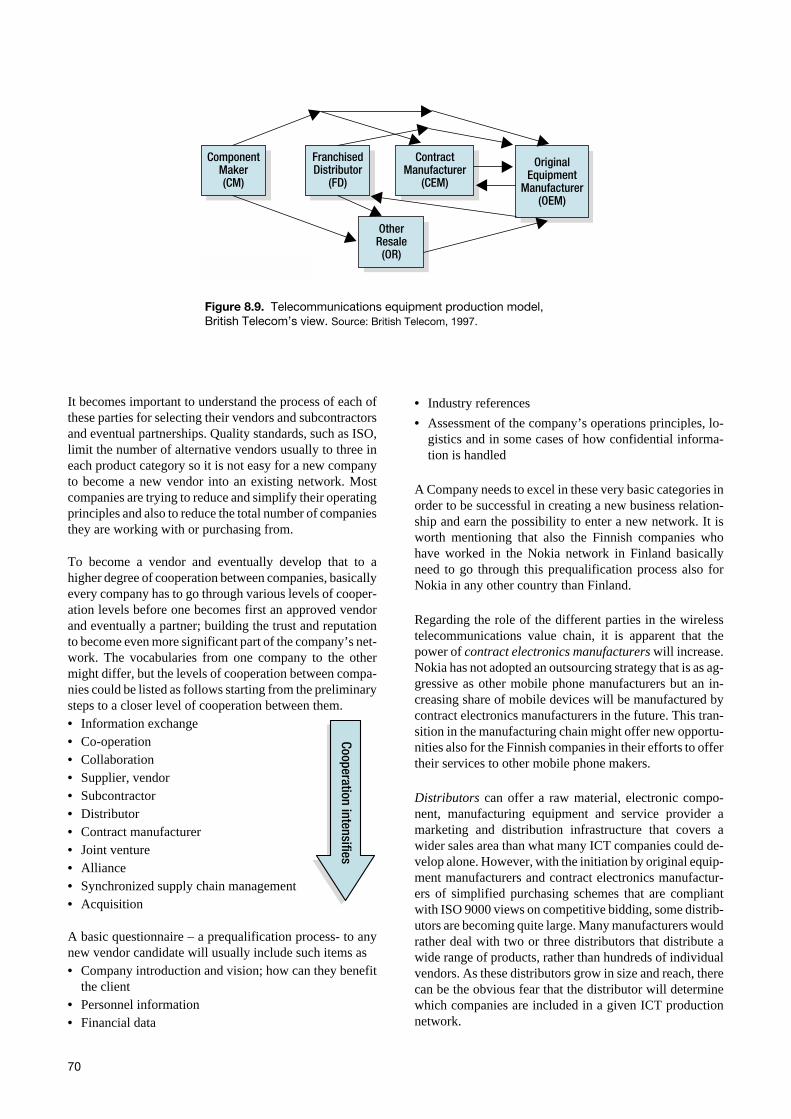
It becomes important to understand the process of each ofthese parties for selecting their vendors and subcontractorsand eventual partnerships. Quality standards, such as ISO,limit the number of alternative vendors usually to three ineach product category so it is not easy for a new companyto become a new vendor into an existing network. Mostcompanies are trying to reduce and simplify their operatingprinciples and also to reduce the total number of companiesthey are working with or purchasing from.
To become a vendor and eventually develop that to ahigher degree of cooperation between companies, basicallyevery company has to go through various levels of cooper-ation levels before one becomes first an approved vendorand eventually a partner; building the trust and reputationto become even more significant part of the company’s net-work. The vocabularies from one company to the othermight differ, but the levels of cooperation between compa-nies could be listed as follows starting from the preliminarysteps to a closer level of cooperation between them.• Information exchange• Co-operation• Collaboration• Supplier, vendor• Subcontractor• Distributor• Contract manufacturer• Joint venture• Alliance• Synchronized supply chain management• Acquisition
A basic questionnaire – a prequalification process- to anynew vendor candidate will usually include such items as• Company introduction and vision; how can they benefit
the client• Personnel information• Financial data
• Industry references
• Assessment of the company’s operations principles, lo-gistics and in some cases of how confidential informa-tion is handled
A Company needs to excel in these very basic categories inorder to be successful in creating a new business relation-ship and earn the possibility to enter a new network. It isworth mentioning that also the Finnish companies whohave worked in the Nokia network in Finland basicallyneed to go through this prequalification process also forNokia in any other country than Finland.
Regarding the role of the different parties in the wirelesstelecommunications value chain, it is apparent that thepower of contract electronics manufacturers will increase.Nokia has not adopted an outsourcing strategy that is as ag-gressive as other mobile phone manufacturers but an in-creasing share of mobile devices will be manufactured bycontract electronics manufacturers in the future. This tran-sition in the manufacturing chain might offer new opportu-nities also for the Finnish companies in their efforts to offertheir services to other mobile phone makers.
Distributors can offer a raw material, electronic compo-nent, manufacturing equipment and service provider amarketing and distribution infrastructure that covers awider sales area than what many ICT companies could de-velop alone. However, with the initiation by original equip-ment manufacturers and contract electronics manufactur-ers of simplified purchasing schemes that are compliantwith ISO 9000 views on competitive bidding, some distrib-utors are becoming quite large. Many manufacturers wouldrather deal with two or three distributors that distribute awide range of products, rather than hundreds of individualvendors. As these distributors grow in size and reach, therecan be the obvious fear that the distributor will determinewhich companies are included in a given ICT productionnetwork.
70
ComponentMaker(CM)
FranchisedDistributor
(FD)
ContractManufacturer
(CEM)
OriginalEquipment
Manufacturer(OEM)
OtherResale
(OR)
Figure 8.9. Telecommunications equipment production model,British Telecom’s view. Source: British Telecom, 1997.
Cooperation intensifies
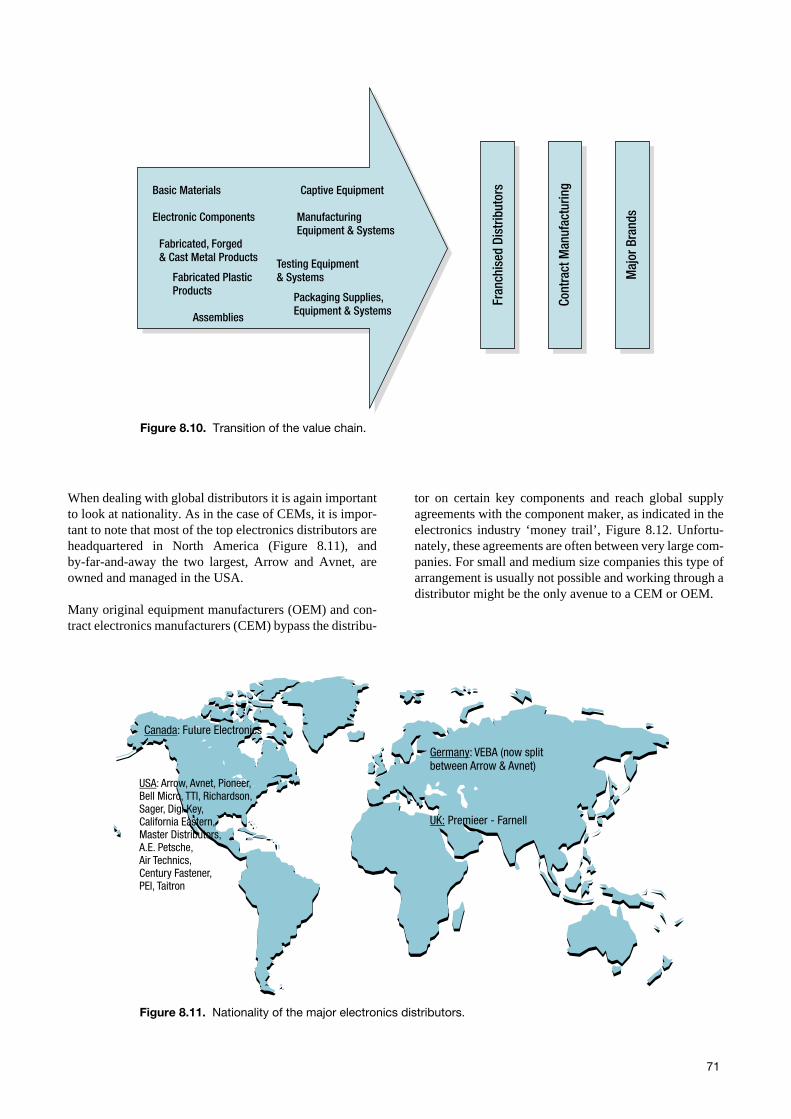
When dealing with global distributors it is again importantto look at nationality. As in the case of CEMs, it is impor-tant to note that most of the top electronics distributors areheadquartered in North America (Figure 8.11), andby-far-and-away the two largest, Arrow and Avnet, areowned and managed in the USA.
Many original equipment manufacturers (OEM) and con-tract electronics manufacturers (CEM) bypass the distribu-
tor on certain key components and reach global supplyagreements with the component maker, as indicated in theelectronics industry ‘money trail’, Figure 8.12. Unfortu-nately, these agreements are often between very large com-panies. For small and medium size companies this type ofarrangement is usually not possible and working through adistributor might be the only avenue to a CEM or OEM.
71
Basic Materials
Fabricated, Forged& Cast Metal Products
Fabricated PlasticProducts
Assemblies
Captive Equipment
Testing Equipment& Systems
ManufacturingEquipment & Systems
Fran
chis
ed D
istr
ibut
ors
Cont
ract
Man
ufac
turin
g
Maj
or B
rand
s
Packaging Supplies,Equipment & Systems
Electronic Components
Figure 8.10. Transition of the value chain.
Canada: Future Electronics
USA: Arrow, Avnet, Pioneer,Bell Micro, TTI, Richardson,Sager, Digi Key,California Eastern,Master Distributors,A.E. Petsche,Air Technics,Century Fastener,PEI, Taitron
Germany
UK:
: VEBA (now splitbetween Arrow & Avnet)
Premieer - Farnell
Figure 8.11. Nationality of the major electronics distributors.

Another resource that should not be overlooked is the pro-fessional sales representative, which is included in the‘Other Retail’ (OR) box in the first graph of this chapter.These firms and individuals are located in a given region orregions and they act as the selling arm for OEMs, CEMs,component makers and even distributors. They are paid ona negotiated commission basis, and they are a cost efficientway of maintaining a presence in a given market.
8.5 Connections to the businessenvironment
Successful internationalization business models and strate-gies appear to center around varying types of formal col-laborative relationships. Dicken in Global Shift (1998) of-fers a view of the different types of collaborative relation-ships in Figure 8.13.
72
OEM
1. COG = Cost of Goods Sold2.
3. FTC estimate; NEDA4. Independent North American
-based Distributors only5. Dataquest
The Electronics IndustryYearbook
OR
CEM
$5405
FD
$43+3
$2+4
CM
$1155
$3632
Figure 8.12. Electronics industry ‘money trail’ (1999 figures, in billions of dollars).
Internationalization Externalization Arms-length transaction
Acquisition Merger Collaborative agreements
Formal Informal
MODES OF COLLABORATON
Research Oriented Technology Oriented Market Oriented
Cooperative R&D
University-based
University-industry
-Government
Equity
Venturecapital
R&DCorporations
Technologysharing
CooperativeProduction
Licensing
Customer-supplierAgreements
Distribution
RegulatoryAssistance
Promotion /Marketing
ServiceMaintenance
Source: Dicken, Global Shift
Figure 8.13. Types of inter-firm collaboration.

8.6 Importance of the cluster forSME’s
Nokia’s network in Finland consists of 300 companies;majority of these are from the SME sector. Nokia’s net-work is about 10% of the total number of ICT companies inFinland. Nokia’s share of the Finnish exports is 20% and itsshare of the Finnish GDP close to 4%.
Due to Nokia having become a global leader in its businesssector, there is a unique opportunity for the Finnish ICTcluster to grow along with Nokia globally. For an SME sec-tor company the importance of a major company such asNokia to take its network overseas is truly unique; other-wise the conditions of operating in an unknown new mar-ket might not be feasible. To be able to use Nokia as a refer-ence is extremely helpful in opening new doors with newclients.
Many if not most of Nokia’s Finnish network companiesdepend heavily on Nokia as a share of their company turn-over. Moving to other markets with or because of Nokiashould be a booster to expand the client base and reduce thedependence on Nokia.
8.7 Key success factors
Practical experience at least from the United States hasshown that those Finnish companies from Nokia’s net-work, who started from the early stages of their presence inthe U.S. marketing also to others, have been successful intheir efforts.
Relationships cost time and effort to establish; there are noshortcuts. When a company enters a new market because ofNokia in this case, there is usually limited capacity person-nel or otherwise to do anything else than to establish a goodworking relationship with Nokia in the new country. It isfor those reasons that marketing to other companies is usu-ally delayed and accordingly it will take that much longerto succeed.
The possibility to use Nokia as a reference is very helpfulin marketing particularly for SME sector companies. Beingan approved Nokia supplier should simplify the process ofbecoming a vendor to others in the same business.
Companies operate in different ways in different countries.Learning to adapt into the new environments is thereforecrucial. Having been successful with Nokia in Finland is agood starting point but the operations in the new countrywill certainly be somewhat different, even to work forNokia there, but definitely for any new clients.
Whether it is in the mobile phone companies, contract elec-tronics manufacturers or distributor business segments ofwireless telecommunication business value chain, the top3-5 companies have a major share of the global market. Tobe able to work in any of those companies’ networks cre-ates the possibility to be a truly global company. Workingfor companies that are not in those top segments of their in-dustries means definitely a more narrow, typically just onecountry or region, business opportunity in geographicalterms.
73

9 Benchmarked companies
Lasse Baldauf, Finpro
9.1 General
Leading mobile phone companies and contract electronicmanufacturers (CEMs) were benchmarked in this study.The handset companies chosen were Motorola, Siemens,Matsushita (Panasonic) and Samsung. The contract elec-tronic manufacturers chosen were Flextronics, Solectronand Celestica. Also, Nortel Networks and Cisco wereadded to the list of benchmarked companies to reflect someadditional operating modes of leading global players in thecommunications industry.
This chapter summarizes the global presence and some net-work partners of these benchmarked companies.
9.2 Motorola
9.2.1 Key figures, major businesses
Motorola is one of the leading providers of wireless com-munications, semiconductors and components, advancedelectronic systems and services.
In year 2000 Motorola revenue totaled $38 Billion with150,000 employees worldwide.
About 39% of the revenue comes from the Personal Com-munications segment, 21% from the Network Systems seg-ment, 19% from the Semiconductor business segment and13% from the Commercial, Government and IndustrialSystems segment and 8% from others.
United States represents 37% of Motorola sales, Europeabout 21%, China 10%, 10% other Asia-Pacific, 8% LatinAmerica, 7% Japan and 7% other markets.
9.2.2 Global map
75
USA: 10 locations
Mexico
Brazil
UK+Ireland
France
Israel
India
ChinaTaiwan
Philippines
KoreaJapan
Singapore
Germany
Figure 9.1. Motorola – Global manufacturing locations.

The primary locations within Motorola in the wireless sec-tor are in Libertyville, Illinois (sector headquarters) andmanufacturing locations in Libertyville and Harvard in Illi-nois, USA, Easter Inch in Scotland, Flensburg in Germany,Tianjin in China, Singapore, Chihuahua in Mexico andJaguariuna in Brazil.
In the software sector Motorola operates in China, India,Malaysia, Australia, Singapore, South Korea, Poland, Rus-sia, Italy, Canada and the U.S.
Motorola announced in 2000 major deals both withFlextronics and Celestica. According to these arrange-ments, Motorola would sell most of its handset manufac-turing facilities and outsource the telephone manufacturingto these CEMs.
9.2.3 Business strategy
Outside of its own vertical integration of component andsemiconductor production, Motorola partners through var-ious strategic alliances. Some major ones are shown in theenclosed matrix (1999 data), Figure 9.2.
One of the major strategic initiatives of Motorola is its alli-ance with Cisco to develop the wireless Internet infrastruc-ture.
As part of its cost cutting strategy, Motorola started a majoroutsourcing of its own manufacturing by selling its manu-facturing facilities to both Flextronics and Celestica.
9.2.4 Research and development
In the past few years Motorola has announced major ex-pansion to its already major extensive presence in its globalResearch and Development area:
• New design center in San Diego, California (1999)• New combined research center in Deer Park,
Illinois (2000)• Opening of Japan R&D center (1999)• New development center, Israel (2000)• New European R&D center for 500 persons in Turin,
Italy (2000)• New GPRS R&D center in Berlin, Germany (2000)• New R&D center in Taiwan (2000)• New R&D Center in Bangalore, India, 150 persons
(2000)• 18 R&D centers in China, 25 by 2001• Application Development Center in Boynton Beach,
Florida
Some of the announced technology areas Motorola worksin are WAP, Bluetooth, Java, VoxML, SyncML, GSM,CDMA, GPRS and iDEN.
In 1999, Motorola had about 20,000 of its employees work-ing in the R&D sector.
9.2.5 Distributors
Motorola’s distributor chain includes these main parts dis-tributors: Avnet, Arrow, Future, Wyle and Newark.
9.2.6 Contract electronic manufacturers
Worldwide Motorola has worked with over 20 CEMs in thepast. The major ones are Flextronics, Celestica, Acer (Tai-wan), Taiwan Semiconductor manufacturing Co. (TSMC)and DBTEL (Taiwan).
76
Nextel
Netscape
UnwiredPlanet
EDS
Psion
Cisco
Qualcomm
Nokia
Motorola
Compaq
MCIWorldcom
Ericsson
Symbian
Eastcom
Sprint PCS
BritishTelecom
Hewlett-Packard
Siemens
Alcatel
Nortel
SunMicrosystems
Microsoft
Intel
Figure 9.2. Motorola strategic alliances matrix.

9.3 Siemens
9.3.1 Key figures, major businesses
Siemens is one of the world’s largest electronics and elec-trical engineering companies. It operates worldwide, deliv-ering advanced solutions for e-business, mobile communi-cations, manufacturing, transportation, health care, energyand lighting industries.
In year 2000 Siemens net sales was 78.4 Billion Euros with447 000 employees worldwide. 40% of those employeesare based in Germany, 26% elsewhere in Europe, 23% inthe Americas and 10% in Asia-Pacific.
The business portfolio of Siemens comprises the followingbusiness segments (net sales in %):Information and Communications (IC) (34,1)
Information and CommunicationNetworks (ICN) (14,9)Information and CommunicationMobile (ICM) (11,7)Siemens Business Services (SBS) (7,5)
Automation and Control (24,9)Power (15,1)Transportation (10,2)Medical (6,6)Lighting (5,6)Infineon Technologies AG (9,5)
9.3.2 Global map
The headquarters of Siemens IC is Munich. Manufacturingplants are located in Bocholt, Germany, Leipzig, Germanyand Kamp-Lintfort, Germany and in 36 other countries.R&D is done mainly in Munich, Ulm and Berlin, but also inAsia, Africa and America.
Siemens Mobile Applications Business Management is lo-cated in:
• Germany
• Finland
• Sweden
• Belgium
Around 30 000 of Siemens R&D people work on software,much of which is embedded in products and solutions pro-vided by Information and Communications, Automationand Control, Power, Transportation, and Medical seg-ments.
9.3.3 Business strategy
Outside of its own vertical integration of component pro-duction, Siemens partners through various strategic alli-ances. Some major ones are shown in the enclosed matrix(Figure 9.4).
77
SalesManufacturing
Figure 9.3. Siemens – global sales and manufacturing locations.

Siemens has major alliances and partnerships with follow-ing companies:• phone.com (WAP gateway)• Yahoo (Content and markets)• Setrix (Telemetry solutions)• GAP (GSM – vending machines)• Brokat (mobile payment)
One of the major strategic initiatives of Siemens is its alli-ance with Kodak to bring mobile imaging solutions to themass consumer market.
Siemens has also announced strategic alliance withToshiba to develop 3G technology. The companies willcombine their respective R&D expertise, capabilities, andresources to ensure the availability of 3G terminals in early2002. Toshiba and Siemens also see the long-term prospectfor cooperation in future 3G terminals.
As part of its investments in mobile communication strat-egy, Siemens took over the Bosch mobile phone businessand started a strategic cooperation with Flextronics whotook over the mobile phone manufacturing from Bosch.
9.3.4 Research and development
Siemens R&D: worldwide about 57,000 employees,thereof 25,000 outside of Germany in 31 countries at 66major development sites.
Siemens Corporate research is located in several R&D cen-ters: in Munich, in Erlangen and in Berlin in Germany andPrinceton NJ, Berkeley in USA.
R&D of Siemens IC is primarily concentrated in Munich,Ulm and Berlin.
9.3.5 Distributors
Siemens’s mobile phone distribution is done mainlythrough net and service operators (in Germany Vodafone,DeTe-Mobil, E-Plus, Debitel etc) In the U.S. marketSiemens has announced a distribution cooperation withCingular Wireless.
9.3.6 Contract electronic manufacturers
The major Siemens partner as a contract manufacturer isFlextronics, who in the year 2000 also took over theSiemens production plant in L’Aquila in Italy. Flextronicsis also producing Siemens mobile phones on their plant inDenmark.
78
Siemens
Proxim
Kodak
SAP
NEC Yahoo! Brokat
CPS
Casio
Intel
SUN
ADC
F-Secure
Portal Software
Compaq
Blue Pumpkin
Hewlett Packard
FlextronicsToshiba
Quintus
Microsoft
Kodak
Symbian
Ericsson MotorolaHarmonic
AltiGen
3comRADVision
Figure 9.4. Siemens (ICN and ICM) partners and strategic alliances matrix.
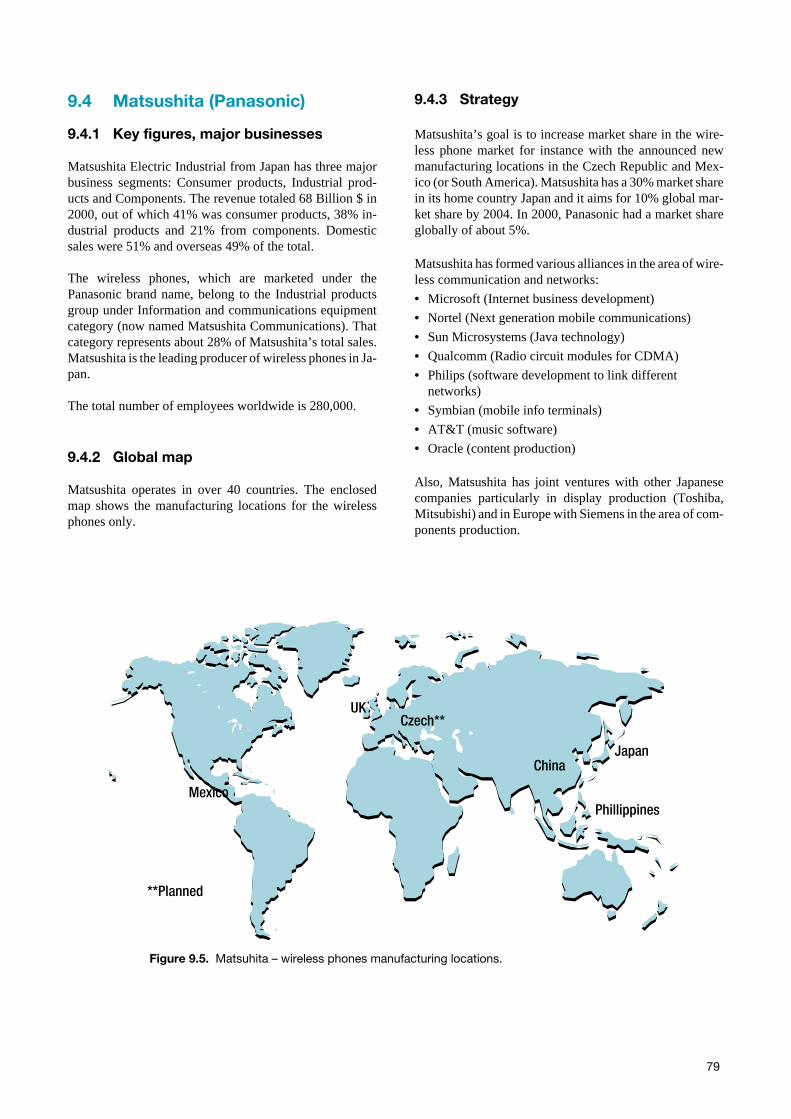
9.4 Matsushita (Panasonic)
9.4.1 Key figures, major businesses
Matsushita Electric Industrial from Japan has three majorbusiness segments: Consumer products, Industrial prod-ucts and Components. The revenue totaled 68 Billion $ in2000, out of which 41% was consumer products, 38% in-dustrial products and 21% from components. Domesticsales were 51% and overseas 49% of the total.
The wireless phones, which are marketed under thePanasonic brand name, belong to the Industrial productsgroup under Information and communications equipmentcategory (now named Matsushita Communications). Thatcategory represents about 28% of Matsushita’s total sales.Matsushita is the leading producer of wireless phones in Ja-pan.
The total number of employees worldwide is 280,000.
9.4.2 Global map
Matsushita operates in over 40 countries. The enclosedmap shows the manufacturing locations for the wirelessphones only.
9.4.3 Strategy
Matsushita’s goal is to increase market share in the wire-less phone market for instance with the announced newmanufacturing locations in the Czech Republic and Mex-ico (or South America). Matsushita has a 30% market sharein its home country Japan and it aims for 10% global mar-ket share by 2004. In 2000, Panasonic had a market shareglobally of about 5%.
Matsushita has formed various alliances in the area of wire-less communication and networks:
• Microsoft (Internet business development)
• Nortel (Next generation mobile communications)
• Sun Microsystems (Java technology)
• Qualcomm (Radio circuit modules for CDMA)
• Philips (software development to link differentnetworks)
• Symbian (mobile info terminals)
• AT&T (music software)
• Oracle (content production)
Also, Matsushita has joint ventures with other Japanesecompanies particularly in display production (Toshiba,Mitsubishi) and in Europe with Siemens in the area of com-ponents production.
79
**Planned
Mexico
UKCzech**
ChinaJapan
Phillippines
Figure 9.5. Matsuhita – wireless phones manufacturing locations.

9.4.4 Research and development
Globally Matsushita has 34,000 researchers and engineersdoing its research and development work. The key areas inthe mobile business development for Matsushita are Japan,China, Europe and USA.
In Japan Matsushita runs several research laboratories andproduct development centers as well as three separateR&D companies.
In the U.S. Matsushita operates R&D facilities in SiliconValley, California and Secaucus, New Jersey.
In Europe, Matsushita operates a Mobile R&D center inBerkshire, United Kingdom. In Germany, Matsushitaopened in 2000 a new laboratory in Luneburg to developinfrastructure systems, particularly base stations.
Also in 2000, Matsushita established Matsushita Researchand Development (China) focusing on the development ofnext generation phones mainly for the Chinese market.
9.4.5 Contract manufacturers
Matsushita has not used Contract electronic manufacturersin its wireless phone production.
9.5 Samsung
9.5.1 Key figures, major businesses
In 1999, Samsung worldwide revenue totaled 83.5 Billiondollars. The main business sectors of Samsung are Elec-tronics, Chemicals, Machinery & Heavy Industry and Fi-nancial Services. About 53% of the total revenue was fromKorean operations and 47% from overseas activity.
The Electronics segment totaled 22.8 B$ in 1999. SamsungElectronics Company includes Information & telecommu-nications, Semiconductors and Major Products (PC:s, TV:setc.) business divisions.
Worldwide Samsung Corporation employs 161,000 peo-ple.
9.5.2 Global map
Samsung corporation has extensive operations all aroundthe world. Samsung Electronics has 25 production bases,
36 marketing subsidiaries and 23 overseas offices in 46countries.
Samsung manufactures wireless phones in Korea, Spainand Brazil.
9.5.3 Strategy
Samsung has set ambitious goals to be one of the top threecompanies in the world in the era of digital convergence. Inthe wireless telecommunications area Samsung empha-sizes the mobile multimedia applications built on theCDMA platform.
In year 2000 Samsung started new phone producing plantsboth in Spain and Brazil to be closer to the markets – in thepast all phone production took place in Korea.
Samsung intends to build the best R&D capability in thebusiness and to globalize its network of operations
Samsung has formed strategic alliances with some majorcompanies such as:• Intel (Joint venture with Samsung Austin semiconduc-
tors)• Microsoft (Next generation wireless phones)• Compaq (Microprosessors)• Siemens (B-CDMA))• IDC (B-CDMA)• Sun Microsystems (Java software)• Commquest (semiconductors)• Yahoo (e-commerce)
Also, Samsung and Japan’s NEC have formed a joint ven-ture to research and produce organic electroluminescentdisplays which use less electricity than current LCD dis-plays on phones and handheld devices.
9.5.4 Research and development
Samsung does not yet have an extensive R&D network out-side of Korea. It has operated a small Research Institute inUnited Kingdom since 1996 and in 2000, Samsung estab-lished a Mobile Communications R&D Center in Beijing,China. The Chinese center will concentrate on the nextgeneration systems such as the 3G market in China.
Samsung has about 11,000 R&D personnel worldwide.
9.5.5 Contract electronics manufacturers
Samsung manufactures its own phones.
80
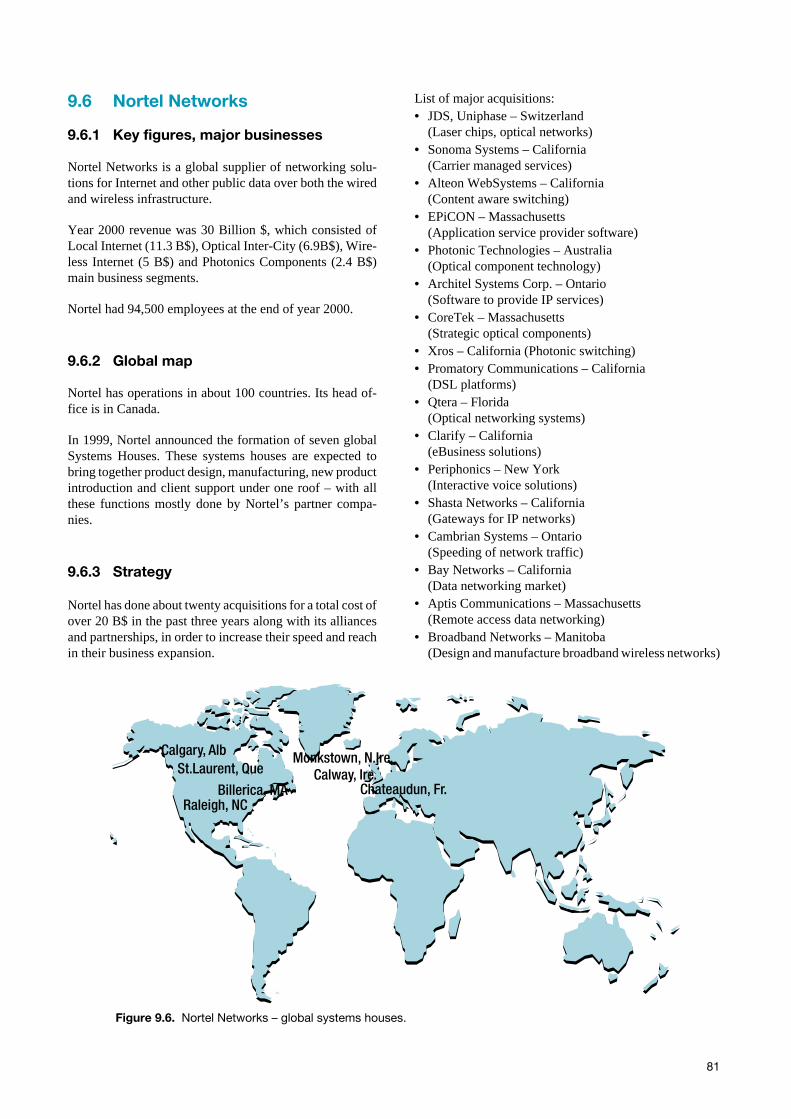
9.6 Nortel Networks
9.6.1 Key figures, major businesses
Nortel Networks is a global supplier of networking solu-tions for Internet and other public data over both the wiredand wireless infrastructure.
Year 2000 revenue was 30 Billion $, which consisted ofLocal Internet (11.3 B$), Optical Inter-City (6.9B$), Wire-less Internet (5 B$) and Photonics Components (2.4 B$)main business segments.
Nortel had 94,500 employees at the end of year 2000.
9.6.2 Global map
Nortel has operations in about 100 countries. Its head of-fice is in Canada.
In 1999, Nortel announced the formation of seven globalSystems Houses. These systems houses are expected tobring together product design, manufacturing, new productintroduction and client support under one roof – with allthese functions mostly done by Nortel’s partner compa-nies.
9.6.3 Strategy
Nortel has done about twenty acquisitions for a total cost ofover 20 B$ in the past three years along with its alliancesand partnerships, in order to increase their speed and reachin their business expansion.
List of major acquisitions:• JDS, Uniphase – Switzerland
(Laser chips, optical networks)• Sonoma Systems – California
(Carrier managed services)• Alteon WebSystems – California
(Content aware switching)• EPiCON – Massachusetts
(Application service provider software)• Photonic Technologies – Australia
(Optical component technology)• Architel Systems Corp. – Ontario
(Software to provide IP services)• CoreTek – Massachusetts
(Strategic optical components)• Xros – California (Photonic switching)• Promatory Communications – California
(DSL platforms)• Qtera – Florida
(Optical networking systems)• Clarify – California
(eBusiness solutions)• Periphonics – New York
(Interactive voice solutions)• Shasta Networks – California
(Gateways for IP networks)• Cambrian Systems – Ontario
(Speeding of network traffic)• Bay Networks – California
(Data networking market)• Aptis Communications – Massachusetts
(Remote access data networking)• Broadband Networks – Manitoba
(Design and manufacture broadband wireless networks)
81
Calgary, AlbSt.Laurent, Que
Billerica, MARaleigh, NC
Monkstown, N.Ire.Calway, Ire.
Chateaudun, Fr.
Figure 9.6. Nortel Networks – global systems houses.

Nortel’s strategic alliances:
• Accenture (Tailored solutions for service providersnetworking needs)
• Microsoft (Integration on voice and data networks)
• Intel (Developing high performance Internet)
• IBM (End-to-end solutions in the Business toBusiness market)
• HP (Combining networking and computingenvironments)
• EMC (Optically enabled enterprise storage networks)
• Sun Microsystems (High performance unifiednetworks)
9.6.4 Research and development
Nortel’s research and development activities focus on itsService Provider and Carrier and Enterprise businesses.Nortel also conducts network planning and systems engi-neering on behalf of, or in conjunction with, major custom-ers. Although Nortel’s products are derived from substan-tial internal research and development activities, these ac-tivities are supplemented by technology acquired or li-censed from third parties.
Research and development activities are conducted at ap-proximately 40 primary locations, 20 of which are predomi-nately research and development locations. Geographicallythese research and development locations are in NorthAmerica (19), Europe (14), and Asia Pacific (4). Nortelemploys approximately 22,500 research and developmentpersonnel.
In addition to the in-house labs listed above, Nortel main-tains R&D partnerships with organizations in Austria,China, France, Germany, India, and Russia.
9.6.5 Outsourcing, suppliers
Until 1999 Nortel manufactured its products in-house.Then it chose seven contract manufacturers for its manu-facturing needs:
SCI Systems Inc., headquartered in Huntsville, Alabama;C-MAC Industries Inc., headquartered in Montreal, Que-bec; Sanmina Corporation, headquartered in San Jose,California; Communications Test Design Inc., headquar-tered in West Chester, Pennsylvania; and United Tri-TechCorporation, headquartered in Cornwall, Ontario.
As far as Nortel’s own supplier network goes, companieshave to qualify in one of four categories as classified byNortel: Reseller, Consultant, Developer or Supplier.
9.7 Cisco Systems
9.7.1 Key figures, major businesses
Cisco Systems revenue for year 2000 totaled 23.8 Billiondollars. Cisco’s head office is in San Jose, California.Worldwide Cisco employs about 43,000 people.
Cisco is the leading company in the networking environ-ment for the Internet. Cisco provides both the hardware andsoftware for the entire end-to-end information network in-frastructure. Cisco serves its customers in three target mar-kets: Enterprises (large corporations, government agen-cies, utilities etc.), Service Providers (telecommunicationscompanies, Internet service providers, cable and wirelesscompanies) and Commercial (Companies with own datanetwork needs)
9.7.2 Global map
Cisco sells its products in 115 countries through a networkof 225 sales and support offices in 75 countries. Throughits acquisitions and its own business expansion overseas,Cisco is expanding to various overseas locations.
9.7.3 Strategy
Cisco has moved a major share of its operations into theInternet environment and is probably the leading companyin that area setting up benchmarks of the new networkedoperating mode for other businesses to follow.
Cisco has acquired a major portfolio of companies in busi-ness areas complementing its own service offerings, whatCisco calls ‘platform acquisitions’. The main business ar-eas Cisco has moved into are optical networking, networkcapacity improvement, network service management andvoice over packets technology.
In addition to the acquisition route, Cisco has formed stra-tegic alliances as follows:• Netigy (speeding network performance applications)• Motorola (end-to-end wireless solutions for Internet)• Microsoft (linking applications and networks)• KPMG Consulting (infrastructure consulting)• Oracle (develop network enhanced database technology
and applications)• Thrupoint (internetworking solutions)• Cap Gemini Ernst&Young (Internet based solutions for
business development)• Compaq (Internet business solutions and services)• EDS (Innovative Internet eBusiness solutions)• HP (reduce network complexity)• IBM (neworking applications)
82

9.7.4 Research and development
Cisco operates two primarily research and development fo-cused sites in the U.S: the New England Development Cen-ter in Chelmsford, Massachusetts (service provider line ofbusiness and software) and in Research Triangle Park inNorth Carolina.
Cisco has announced plans to establish its wireless busi-ness unit in Richardson, Texas and major software devel-opment sites in India and Ireland, possibly in Israel.
Otherwise, Cisco follows its major principle of operationsby doing ‘research and development by acquisitions’.
9.7.5 Distributors
Cisco’s main distributors are Arrow and Avnet.
9.7.6 Contract electronic manufacturers
Cisco uses five major contract manufacturers: SCI, Jabil,Celestica, Solectron, and Flextronics.
Cisco has truly perfected its internet based supply chain:80% of Cisco equipment never gets routed through Ciscopersonnel but the Distributors order the equipment fromthese designated Contract manufacturers and handle all thelogistics involved for Cisco.
9.8 Solectron
9.8.1 Key figures, major businesses
Solectron is the largest Contract electronics manufacturerin the world. Its revenue was 14.1 Billion dollars in 2000and it had 38,000 employees at the end of 2000.
Almost 90% of Solectron revenue come from manufactur-ing operations and about 10% from components such asmemory modules. Solectron provides manufacturing ser-vices to a variety of industries: Avionics, computer indus-try, medical equipment, semiconductors, telecommunica-tions, network equipment and control systems.
9.8.2 Global map
Solectron operates in 56 locations worldwide. 22 of thoselocations include New Product Introduction centers mean-ing that Solectron does new product design and engineer-ing for its customers in those locations.
9.8.3 Strategy
Solectron has acquired manufacturing facilities fromNortel in various locations, IBM’s plants in Brazil.Alcatel’s plant in Puerto Rico, two of Ericsson’s plants inFrance and Sweden.
83
USA, 53 Acq
Sweden, 1 AcqUK, 1 Acq
Danmark, 1 Acq
Israel, 1 Acq
Italy, 1 AcqIreland
India
China
Canada, 1 Acq
Figure 9.7. Cisco – Recent acquisitions and own new global location announcements.

Solectron has also acquired other contract manufacturerslike Bluegum in Australia.
Acer and Solectron have formed a strategic alliance to pro-vide global design, manufacture and service of computers.
Solectron acquired in 2000 four Computer Aided designfacilities from Nortel.
Finally, Solectron has acquired SMART Modular technol-ogies, a leading designer and manufacturer of memorymodules and memory cards.
Solectron is thus growing its service portfolio by acquiringexisting facilities, other smaller contract manufacturersand strengthening its engineering and design capabilities.The component manufacturing sector is also growing.
9.8.4 Research and development
Solectron’s New Product Introduction centers offer a fullrange of electronics product development services, includ-ing design and layout, concurrent engineering, test devel-opment and prototype engineering.
Company’s research and development activities have beenfocused primarily on the development of prototype and en-gineering design capabilities, fine pitch interconnecting
technologies, high reliability environmental stress testtechnology and the implementation of environmentallyfriendly assembly processes.
9.8.5 Key customers
The largest customers have been Cisco (12%), Hewlett-Packard (11%) and IBM. Others include Alcatel, Ericsson,Marconi, Mitsubishi, Motorola, Nokia, Nortel, Qualcomm,Compaq and Dell.
9.9 Celestica
9.9.1 Key figures, major businesses
Celestica revenue was 9.8 Billion dollars and it had 31,000employees in 2000; it is the third largest contract electronicmanufacturer after Solectron and SCI.
Celestica is headquartered in Toronto, Canada.
Celestica’s business segments in the contract manufactur-ing include computer servers, workstations, peripheralsand communication devices.
84
NORTH MF, 13 locationsNPI, 8 locations
AMERICA:
EUROPE: MF, 11 locationsNPI, 8 locations
ASIA: MF, 5 locationsNPI, 5 locations
BRAZIL: MF, 2 locationsNPI, 1 location
MEXICO: MF, 2 locations
MF = ManufacturingNPI = New Product Introduction Center
Figure 9.8. Solectron – global locations.

9.9.2 Global map
9.9.3 Strategy
Celestica is originally a spin-off from IBM. From that timeonwards Celestica has grown by acquiring existing opera-tions also from such companies like Motorola, NEC,Nortel, IBM and Avaya. Each of these deals includes amulti-year supply agreement between Celestica and the ac-quired company previous owners. One third of year 2000growth of Celestica was from acquisitions.
One of Celestica goals is to build a network of 15 globalpartners, all of which would be about 1 Billion $ worth ofrevenue for Celestica.
9.9.4 Research and development
Celestica R&D is built around its five Design Centers (onein Canada, three in U.S. and one in U.K.) where Celesticaoffers its customers a full range of product design servicesfrom system design, software design, testing to new prod-uct introduction range.
9.9.5 Key customers
Key customers include Cisco, Dell, EMC, HP, IBM, JDSUniphase, Juniper Networks, Lucent, Motorola, NEC,Nokia, Nortel, Sun Microsystems and Sycamore Net-works.
9.10 Flextronics
9.10.1 Key figures, major businesses
Flextronics is headquartered in Singapore but operation-ally run from its San Jose, California offices.
The company divisions are Flextronics Design (industrial,electrical and mechanical product development),Flextronics Enclosure Systems (full range of integratedcustom electronic housings), Flextronics Semiconductor(design and manufacturing services), Flextronics NetworkServices (copper and fiber optic telecommunicationsswitch installation, engineering and testing), FlextronicsPhotonics (photonic packaging design and optical manu-facturing) and Multek (full range of PCB fabrication).
In year 2000, Flextronics revenue totaled 5.8 Billion dol-lars and the number of employees was 49,000. Out of thesales, Europe represented 45%, Americas 40% and Asia15%.
9.10.2 Global map
Flextronics has structured its operations worldwide underfour different operation categories:
• Regional manufacturing locations: 39 in Europe, 23 inAmericas and 11 in Asia
85
CANADA: MF, 2 locationsDC, 1 location
EUROPE: MF, 8 locationsDC, 1 (UK)
ASIA: MF, 7 locations
BRAZIL: MF, 2 locations
MEXICO: MF, 1 location
MF = ManufacturingDC = Design Center
USA: MF, 13 locationsDC, 3 location
Figure 9.9. Celestica – global locations.

• Industrial Parks, a network of particularly plastics re-lated production: 2 in Americas, 5 in Europe and 1 inChina.
• Product introduction Centers, located close to OriginalEquipment Manufactureres (OEMs) to join their engi-neering resources: 6 in the U.S., 9 in Europe and 1 inChina
• Design & Engineering centers, product development: 5in The U.S., 6 in Europe and 4 in Asia
9.10.3 Strategy
Flextronics has built its global reach to provide its custom-ers an end-to-end solution for their product needs. In thepast few years Flextronics has invested heavily into itsproduct design and engineering capabilities and also thecomponent end of the business, for instance the enclosurebusiness including acquisistions of those material suppli-ers. Also the Industrial park concept expand Flextronicscapabilities into a larger scope than just the typical assem-bly type of operations of contract electronics manufactur-ers.
Flextronics has acquired various plants from Originalequipment manufacturers, most notably from Motorola.These companies announced a long satnding outsourcingagreement where Motorola would have Flextronics manu-facture a major part of their products in the formerMotorola plants.
9.10.4 Research and development
The backbone of Flextronics’ research and developmentactivities are structured around its Product introductionCenters and Design and Engineering Centers.
In the Americas, all of these 11 centers are in the UnitedStates. The 15 European centers are in 10 countries (Aus-tria, Czech, Ireland, England, Finland, Hungary, Germany,Italy, Sweden and Switzerland) and the 5 others are in Is-rael, China, Malaysia, Singapore and Taiwan.
9.10.5 Key customers
By offering its customers comprehensive services includ-ing engineering, manufacturing and distribution, Flex-tronics has eneterd into multiple partnerships with compa-nies like 3Com, Compaq, Handspring, Cisco, Ericsson,Nortel, Grundig, HP, IBM, Lucent, Microsoft, Nokia,Philips, Sony, Motorola and Siemens.
Flextronics has for instance eight program managers coor-dinating Flextronics’ global activities for these key clients.Five of these program mangers are U.S. based and three inEurope.
86
NORTH AMERICA: MF, 2 locationsPIC, 6DE, 5 locations
locations
EUROPE: MF, 39 locationsPIC, 9
DE, 6
locationsIP, 5 locations
locations
ASIA: MF, 11 locationsPIC, 1 locationIP, 1 location
DE, 4 locations
BRAZIL: MF, 2 locationsIP, 1 location
MEXICO: MF, 2 locationsIP, 1 location
MF = ManufacturingPIC = Production Introduction
CenterIP = Industrial ParkDE = Design & Engineering Center
Figure 9.10. Flextronics – global presence.

10 Conclusion
We are living in the middle of an information technologyrevolution and a globalization of the world economy. Oldstructures in telecommunication business are rapidlychanging and new structures continue to emerge. No oneknows the end results but the effort is strong and the speedis fast.
Finland has been able to gain a very strong position as auser and supplier of information technology and especiallymobile telecommunications technology. Nokia’s impor-tance for the industry in Finland and for the whole econ-omy is unquestionable. However this situation is extremelyfragile and continuous growth is not at all granted. Nokia’srole as a driver of the whole cluster in Finland will proba-bly not continue forever. At this moment the most criticalissue for Nokia’s network partners is to take full advantageof its market leadership posititon and to diversify at thesame time when serving Nokia’s global needs.
Nokia has not only been a good customer for Finnishsmaller companies in Finland but it has also taken its keysuppliers abroad. Smaller companies in Nokia’s supplychain have been able to elevate their technology standardsand other skills to a much higher level. Nokia’s referencevalue is extremely important for small technology compa-nies going overseas. Based on the benchmarking findingsof this study, Nokia is the most global and networked com-pany among its competitors and a trendsetter in this sense.This gives an extra advantage for Finnish companies. Keycustomer relationship in internationally networked busi-ness is crucial but the phenomenon is not thoroughly stud-ied and understood.
Outsourcing trend has been very obvious in mobile phoneproduction. However hardly anyone seems to make anymoney in that trend at the moment. Companies working inthose networks will get squeezed and many if not most inNokia’s networks have been more profitable than may everbe possible in working for the major contract electronicsmanufacturers. How will the value chain be shaped andwhere is the profitability in the future handheld devicebusiness? The profit margins on the hardware side willprobably be shrinking but the content side will be more andmore valuable.
Diversification and convergence trend; merging ofInternet, mobile phones and computers has started. A glutof devices and gizmos are being introduced in the market –most of them will probably have small production runs butwhich devices will survive? The appearance of not only thecomputer industry players – HP, Compaq, Dell – into thehandheld business is obvious but also Microsoft is comingout strong. Its advantage is that almost all computers run onMS platforms; many consumers might want their hand-helds to be as easily as possible compatible with their desk-top tools rather than have a series of non-compatible de-vices for their future communication needs.
The telecommunications business is very much innovationdriven and the main players are focused on a few selectedlocations worldwide. A new business model has emerged,which separates innovation process from production pro-cess. Production and R&D networks are integrated glob-ally following different logic. In the Americas the UnitedStates is dominant. In Asia most of that action is in Japan,Korea and China. In Europe there are still very diversifiedoperations in well over half a dozen countries. Will one ortwo countries in Europe emerge as ‘winners’ – seems diffi-cult to maintain a high profile in all of those current countrylocations in the long run? For instance the contract elec-tronics manufacturer Flextronics is known to pack and gorapidly if they cannot accomplish their goals or they findanother location with lower labor costs. R&D activities arelocating where innovative and skilled people are available.
What should then be done to ensure that the success for theFinnish telecommunications industry continues? Most crit-ical issue is the internationalization and diversification ofthe cluster. This means access to new customers and abilityto manage the business through international networking,which will also reduce the dependency on Nokia.
The focus of the national system of innovation should bemore on the emergence of innovations, global customerneeds and ability to help the smaller companies in organiz-ing their operations in international market environment.The key issue for the public supporting organizations in-volved is to understand the new logic of the global tele-communications business and continue to develop theirservices and focus accordingly.
87

Appendix 1
The NACE codes utilized in the calculation of economic indicatorsfor the ICT cluster
ICT Manufacturing
32100 Manufacture of electronic components30020 Manufacture of computers etc31300 Manufacture of insulated wire and cable32200 Manufacture of radio transmitters etc32300 Manufacture of radio receivers etc
ICT Services
Telecom services
64201 Telephone communication64202 Other telecommunications64203 Data transmission services
Software and IT services
72100 Hardware consultancy72200 Software consultancy and supply72300 Data processing72500 Maintenance of office machinery etc
89
Appendix 2
Measuring the export specialization of a country
Specialization of a country in product exports can be measured by RCA (Revealed ComparativeAdvantage) index, which is calculated as follows:
Where Xij is the exports of the cluster i from the country j, and is total exports from thecountry. The nominator calculates the share of the OECD cluster i (the sum of the cluster i exportsfrom all the OECD countries) of total OECD exports.
RSA can be scaled between –1 and 1, which yields RSCA (Revealed Symmetric Comparative Ad-vantage) index. If RSCA index equals zero, a country is as specialized in the cluster i exports as theOECD in average. If RSCA index exceeds zero, the country is specialized in the cluster exports.
91
RCAX X
X Xij
iji
ij
jij
i jij
=∑
∑ ∑∑
/
/,
∑i
ijX
Technology Reviews from Tekes
93
114/2001 Global Networking in Wireless Teletechnology Business. 93 p. Lasse Baldauf, Michael Lovejoy,Jarmo Karesto, Laura Paija
113/2001 Critical Success Factors in Biopharmaceutical Business: A Comparison Between Finnish andCalifornian Businesses. 23 p. Tanja Rautiainen
112/2001 Finnish Pharma Cluster – Vision 2010.
111/2001 Uuden tietotekniikan vaikutukset liiketoimintaan. 60 s. Jyrki Ali-Yrkkö,Kim Jansson, Iris Karvonen,Veli-Pekka Mattila, Juha Nurmilaakso, Martin Ollus, Iiro Salkari, Pekka Ylä-Anttila
110/2001 Digitaalinen verkostotalous – Tietotekniikan mahdollisuudet liiketoiminnan kehittämisessä. 86 s.Juha Luomala, Juha Heikkinen, Karri Virkajärvi, Jukka Heikkilä, Anne Karjalainen, Anri Kivimäki,Timo Käkölä, Outi Uusitalo, Hannu Lähdevaara
109/2001 Ohjelmistoalan tutkimustoiminta Yhdysvalloissa. Veikko Seppänen, Timo Käkölä, Olli Pitkänen,Reijo Sulonen, Markku Sääksjärvi
108/2001 Software Business Models, A Framework for Analyzing Software Industry. Risto Rajala,Matti Rossi, Virpi Kristiina Tuunainen and Santeri Korri
107/2001 State of Mathematical Modelling and Simulation in the Finnish Process Industry, Universitiesand Research Centres. 95 s. Kimmo Klemola, Ilkka Turunen
106/2001 Research and technology programme activities in Finland. 54 s. Ellen Tuomaala, Satu Raak,Erkki Kaukonen, Jyrki Laaksonen, Mika Nieminen, Pekka Berg
105/2001 Tutkimus- ja teknologiaohjelmatoiminta Suomessa. 50 s. Ellen Tuomaala, Satu Raak,Erkki Kaukonen, Jyrki Laaksonen, Mika Nieminen, Pekka Berg
104/2001 Matemaattiset menetelmät suomalaisten yritysten t&k-toiminnassa. Heikki Haario, Matti Heiliö,Jari Järvinen, Pekka Neittaanmäki
103/2001 Hyvinvointi- ja terveysalan teknologia- ja palvelutuotteet. 64 s. Niilo Saranummi
102/2001 Jätehuollon ja materiaalikierrätyksen teknologiat ja niiden kehittämistarpeet. 44 s.Juhani Anhava, Esa Ekholm, Erkki Ikäheimo, Karri Koskela, Mikko Kurvi, Marko Walavaara
101/2000 Infrarakentamisen ja -palveluiden kehitysnäkymät. INFRA-teknologiaohjelman tarveselvitys. 38 s.Laura Apilo
100/2000 Kartoitus pienhiukkastutkimuksesta Suomessa. 43 s. Jorma Jokiniemi, Mikael Ohlström,Markku Kulmala, Kaarle Hämeri
99/2000 Evaluation of the Dutch and Finnish Situation of Energy Recovery from Biomass and Waste.Ronald de Vries, Ronald Meijer, Lassi Hietanen, Elina Lohiniva, Kai Sipilä
98/2000 Kohti yksilöllistä mediamaisemaa. 120 s. Kuluttajatutkimukset-hanke (Kultu)
97/2000 Content Generation in the Wireless Space with a Focus on Southern California. 64 p. TuomasPollari, Veikko Valli
96/2000 By-products in Earth Construction – Assessment of Acceptability.
95/2000 Metsäklusterin tulevaisuusskenaariot. 68 s. Tarja Meristö, Jyrki Kettunen, Christine Hagström-Näsi
94/2000 Sähkö- ja elektroniikka-alan palvelujen kysynnän ja tarjonnan kohtaamisesta. 49 s. Krista Laine,Heli Penttinen ja Anna Kotsalo-Mustonen
93/2000 Sivutuotteet maarakenteissa, Käyttökelpoisuuden osoittaminen. 86 s. U-M. Mroueh, M. Wahl-ström, E. Mäkelä, P. Heikkinen, R. Salminen, M. Juvankoski, M. Tammirinne, J. Kauppila,J. Sorvari
Subscriptions: www.tekes.fi/eng/publications
Copyright © 2022 FDOKUMEN