global marine insurance report 2017
55
GLOBAL MARINE INSURANCE REPORT 2017 Astrid Seltmann Analyst/Actuary, The Nordic Association of Marine Insurers (Cefor) Vice chair of IUMI’s Facts & Figures Committee
-
Upload
khangminh22 -
Category
Documents
-
view
4 -
download
0
Transcript of global marine insurance report 2017
GLOBAL MARINE INSURANCE REPORT 2017
Astrid Seltmann Analyst/Actuary, The Nordic Association of Marine Insurers (Cefor)Vice chair of IUMI’s Facts & Figures Committee
2
Warning!
Figures reflect the 2017 state of reporting/ estimates and will change retrospectively!
For comparison purposes, do NOT compare figures in this report to last year’s report, but check updated premiums and loss ratios for the last ten years at www.iumi.com !
Global Marine Insurance report
• Global Marine Insurance – Overview
• Cargo – Market & Results
• Hull – Market & Results
• Offshore Energy – Market & Results
______________________________________For for download at www.iumi.com:
• Marine premiums by country
• Loss ratios triangulations: Hull, Cargo, Energy3
Focus/New in 2017
• New: Loss ratios Asia & Latin America (Cargo & Hull, accounting year)
• Cargo: Recent deterioration.
• Hull: Vessel value & claims trends. Major versus serious casualties.
• Offshore energy: Survival training?
• Hurricanes are back, too.
4
Global Marine Insurance report
• Global Marine Insurance – Overview
• Cargo – Market & Results
• Hull – Market & Results
• Offshore Energy – Market & Results
5
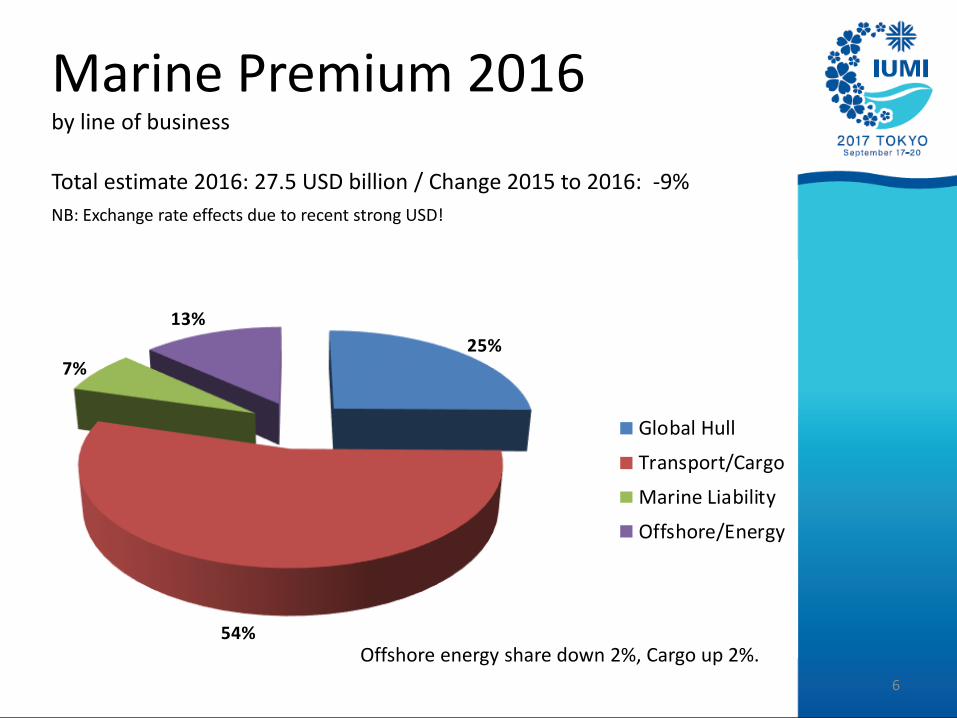
25%
54%
7%
13%
2016
Global Hull
Transport/Cargo
Marine Liability
Offshore/Energy
Marine Premium 2016by line of business
Total estimate 2016: 27.5 USD billion / Change 2015 to 2016: -9%
NB: Exchange rate effects due to recent strong USD!
Offshore energy share down 2%, Cargo up 2%.
6
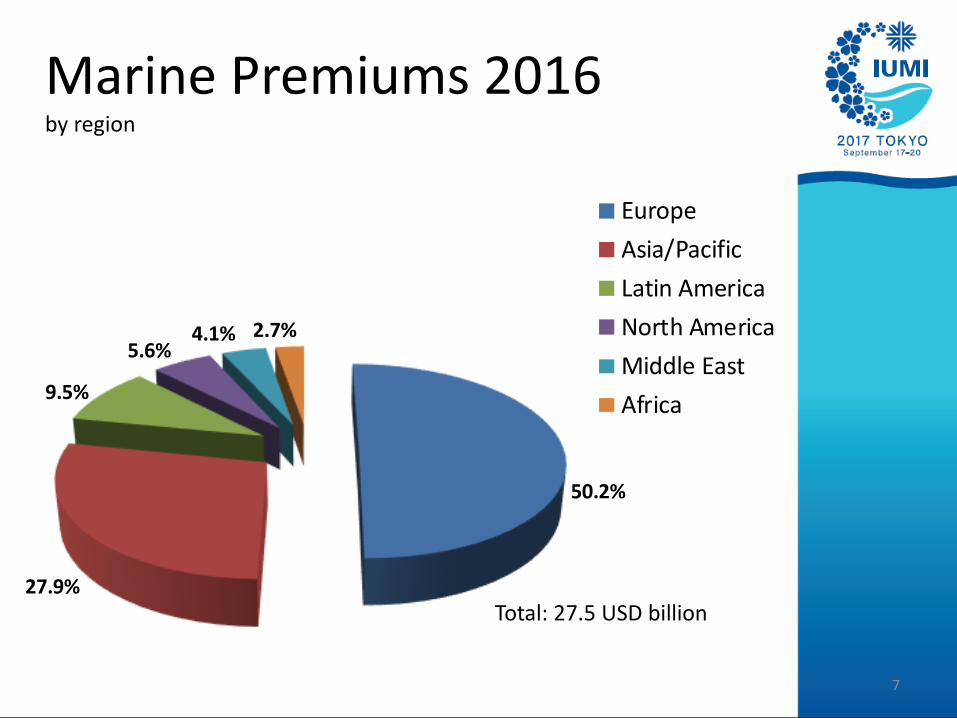
50.2%
27.9%
9.5%
5.6%4.1% 2.7%
2016Europe
Asia/Pacific
Latin America
North America
Middle East
Africa
Total: 27.5 USD billion
Marine Premiums 2016by region
7
0
2,000,000
4,000,000
6,000,000
8,000,000
10,000,000
12,000,000
14,000,000
16,000,000
18,000,000
20,000,000
2010 2011 2012 2013 2014 2015 2016
Europe
Asia/Pacific
Latin America
North America
Middle East
Africa
8
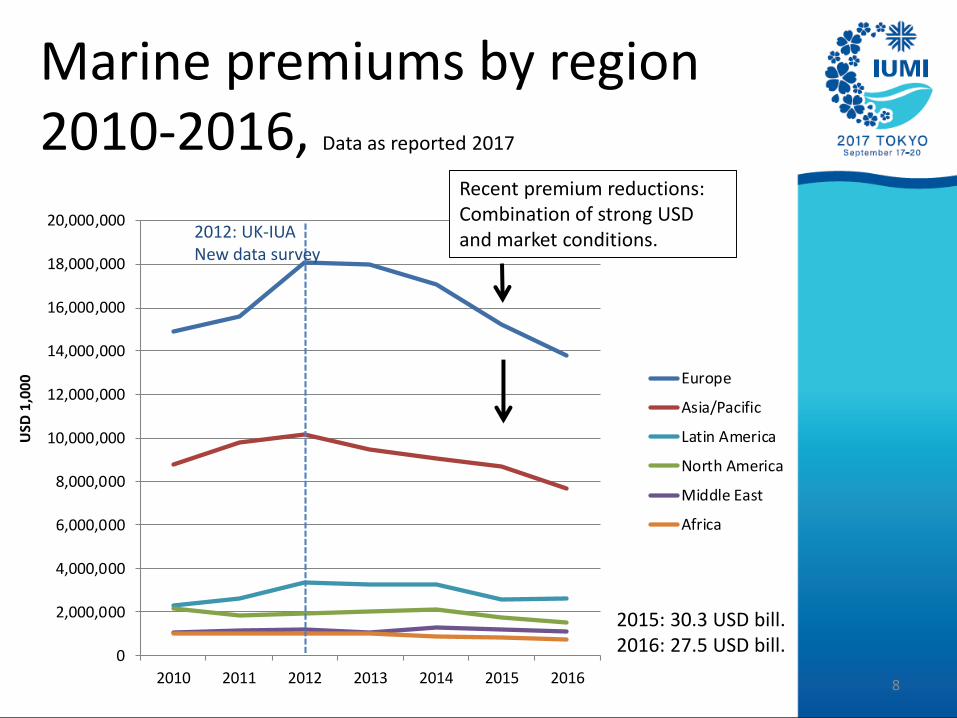
Marine premiums by region2010-2016, Data as reported 2017
2012: UK-IUANew data survey
2015: 30.3 USD bill. 2016: 27.5 USD bill.
Recent premium reductions: Combination of strong USD and market conditions.
50%
70%
90%
110%
130%
150%
170%
2005
2006
2007
2008
2009
2010
2011
2012
2013
2014
2015
2016
CNY (China)
JPY (Japan)
EUR (Euro)
NOK (Norway)
GBP (UK)
BRL (Brazil)
* 2016 rates as of July
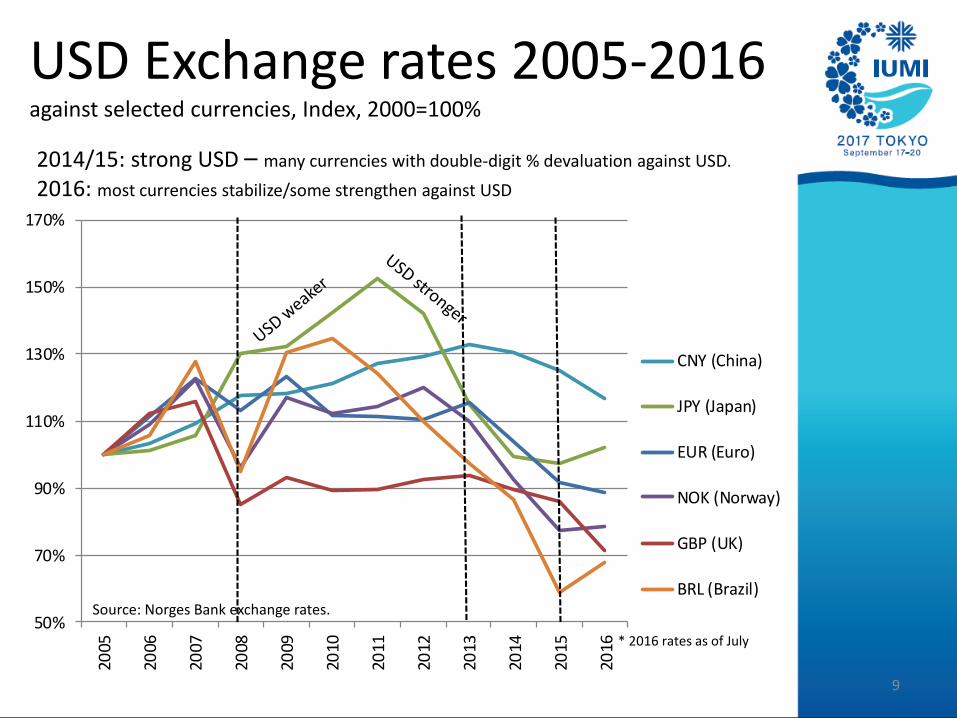
Source: Norges Bank exchange rates.
USD Exchange rates 2005-2016against selected currencies, Index, 2000=100%
9
2014/15: strong USD – many currencies with double-digit % devaluation against USD.
2016: most currencies stabilize/some strengthen against USD
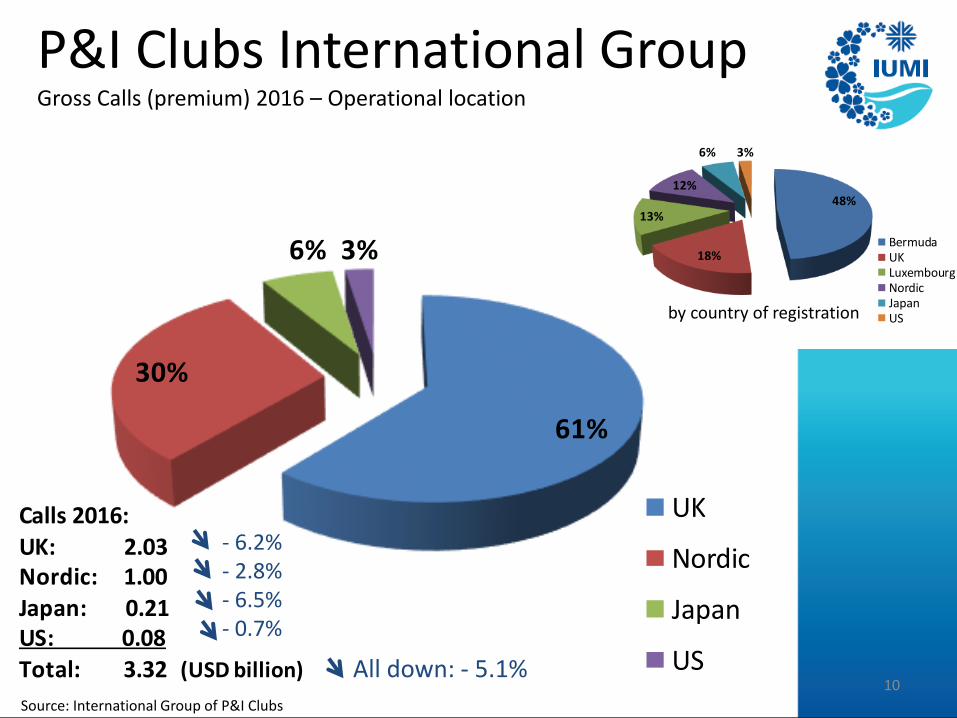
61%
30%
6% 3%
UK
Nordic
Japan
US
Calls 2016:UK: 2.03 Nordic: 1.00Japan: 0.21US: 0.08
Total: 3.32 (USD billion)
48%
18%
13%
12%
6% 3%
BermudaUKLuxembourgNordicJapanUS
P&I Clubs International Group Gross Calls (premium) 2016 – Operational location
All down: - 5.1%
by country of registration
10
- 6.2%- 2.8%- 6.5%- 0.7%
Source: International Group of P&I Clubs
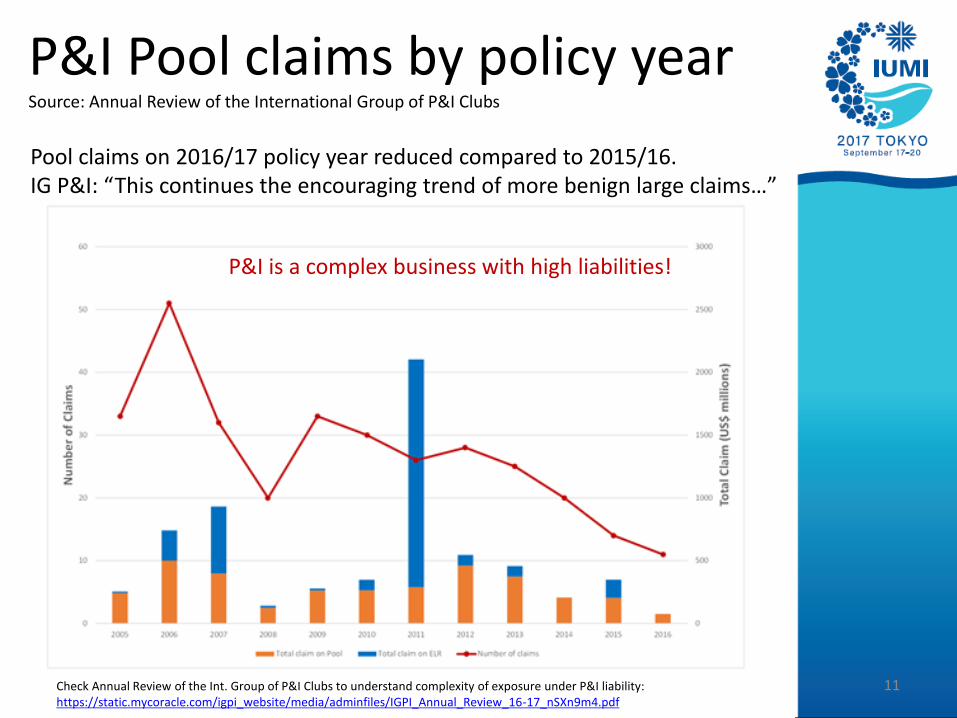
P&I Pool claims by policy yearSource: Annual Review of the International Group of P&I Clubs
11Check Annual Review of the Int. Group of P&I Clubs to understand complexity of exposure under P&I liability: https://static.mycoracle.com/igpi_website/media/adminfiles/IGPI_Annual_Review_16-17_nSXn9m4.pdf
Pool claims on 2016/17 policy year reduced compared to 2015/16.IG P&I: “This continues the encouraging trend of more benign large claims…”
P&I is a complex business with high liabilities!
Global Marine Insurance report
• Global Marine Insurance – Overview
• Cargo – Market & Results
• Hull – Market & Results
• Offshore Energy – Market & Results
12
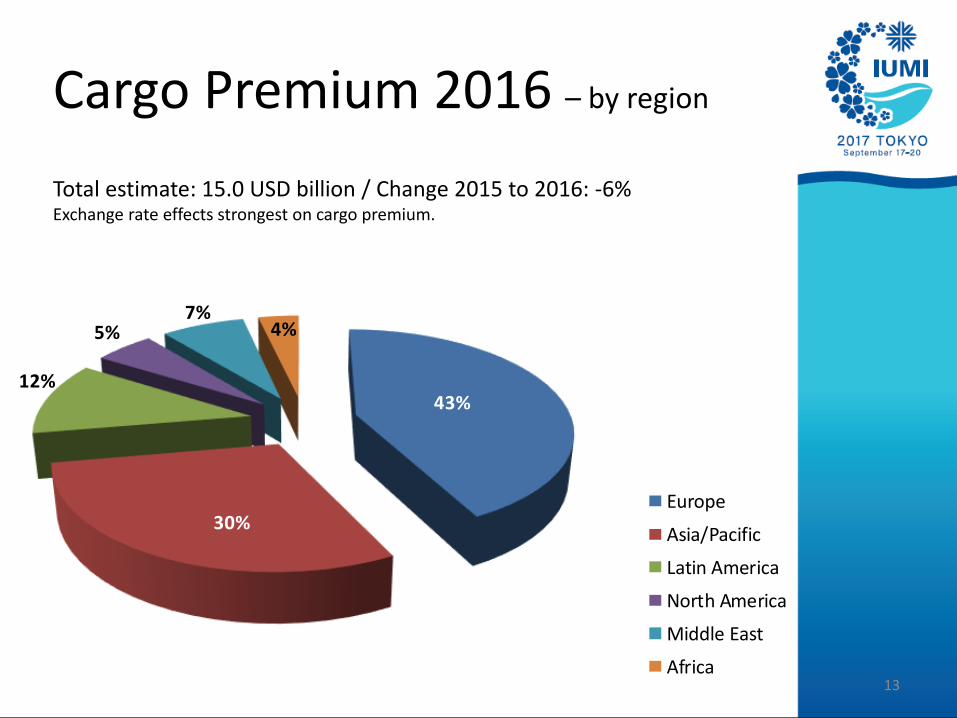
Cargo Premium 2016 – by region
Total estimate: 15.0 USD billion / Change 2015 to 2016: -6%Exchange rate effects strongest on cargo premium.
13
43%
30%
12%
5%7%
4%2016
Europe
Asia/Pacific
Latin America
North America
Middle East
Africa
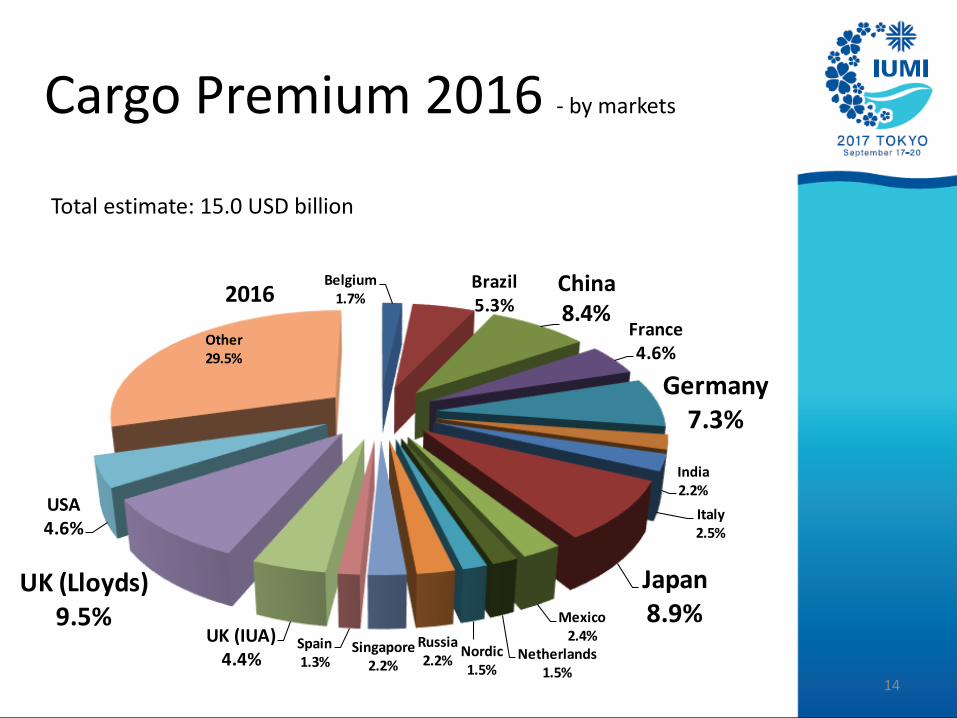
Cargo Premium 2016 - by markets
Total estimate: 15.0 USD billion
14
Belgium1.7%
Brazil5.3%
China8.4%
France4.6%
Germany7.3%
India2.2%
Italy2.5%
Japan8.9%Mexico
2.4%Netherlands
1.5%
Nordic1.5%
Russia2.2%
Singapore2.2%
Spain1.3%
UK (IUA)4.4%
UK (Lloyds)9.5%
USA4.6%
Other29.5%
2016
-
500,000
1,000,000
1,500,000
2,000,000
2,500,000
20
08
20
09
20
10
20
11
20
12
20
13
20
14
20
15
20
16
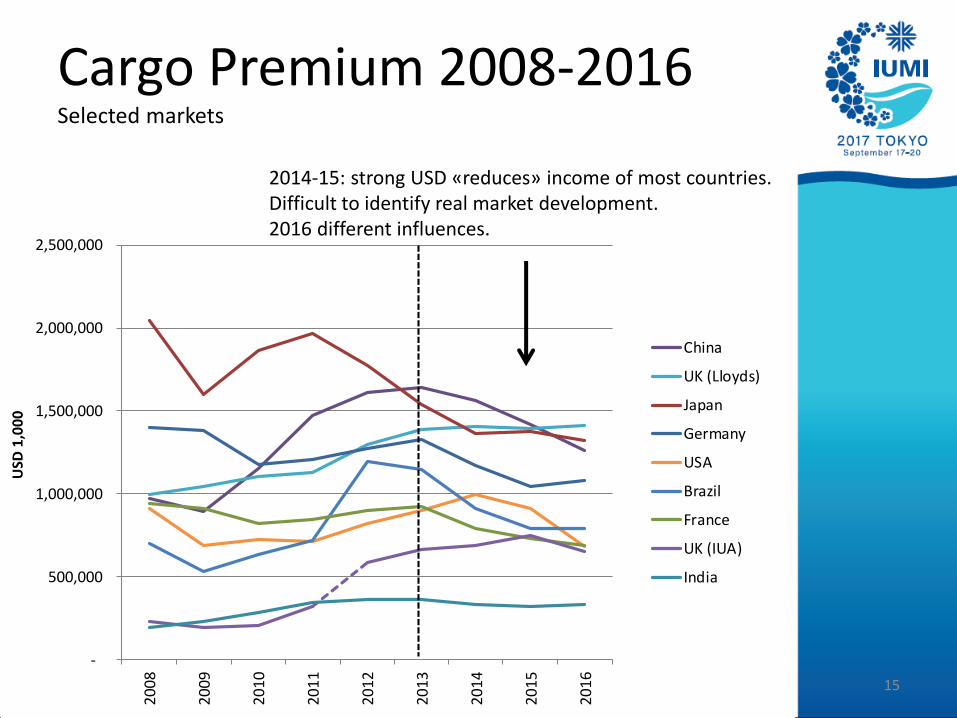
China
UK (Lloyds)
Japan
Germany
USA
Brazil
France
UK (IUA)
India
Cargo Premium 2008-2016Selected markets
2014-15: strong USD «reduces» income of most countries. Difficult to identify real market development.2016 different influences.
15
0%
50%
100%
150%
200%
250%
300%
350%
400%
1995
1996
1997
1998
1999
2000
2001
2002
2003
2004
2005
2006
2007
2008
2009
2010
2011
2012
2013
2014
2015
2016
2017
2018
World Trade Values
World Trade Volume
Global Cargo Premium
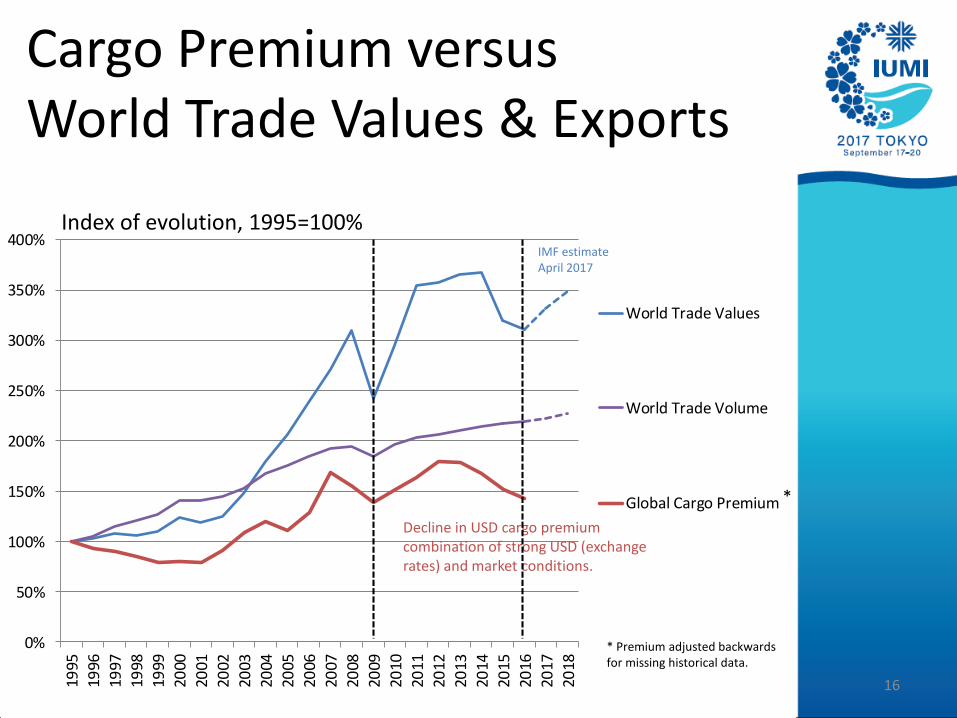
Cargo Premium versus World Trade Values & Exports
Decline in USD cargo premiumcombination of strong USD (exchangerates) and market conditions.
Index of evolution, 1995=100%IMF estimateApril 2017
16
* Premium adjusted backwards for missing historical data.
*
50%
60%
70%
80%
90%
1 2 3 4 5
2009
2010
2011
2012
2013
2014
2015
2016
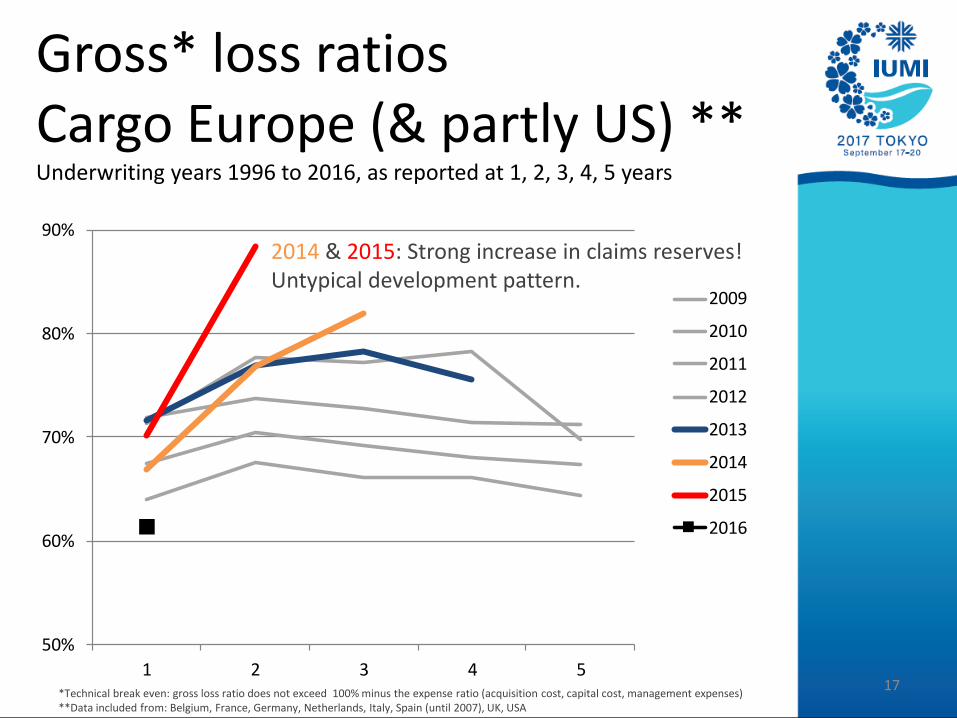
2014 & 2015: Strong increase in claims reserves! Untypical development pattern.
17*Technical break even: gross loss ratio does not exceed 100% minus the expense ratio (acquisition cost, capital cost, management expenses)**Data included from: Belgium, France, Germany, Netherlands, Italy, Spain (until 2007), UK, USA
Gross* loss ratiosCargo Europe (& partly US) **Underwriting years 1996 to 2016, as reported at 1, 2, 3, 4, 5 years
0%
20%
40%
60%
80%
100%
120%
140%
19
96
19
97
19
98
19
99
20
00
20
01
20
02
20
03
20
04
20
05
20
06
20
07
20
08
20
09
20
10
20
11
20
12
20
13
20
14
20
15
20
16
* Technical break even: gross loss ratio does not exceed 100% minus the expense ratio (acquisition cost, capital cost, management expenses)**Data included from: Belgium, France, Germany, Netherlands, Italy, Spain (until 2007), UK, USA
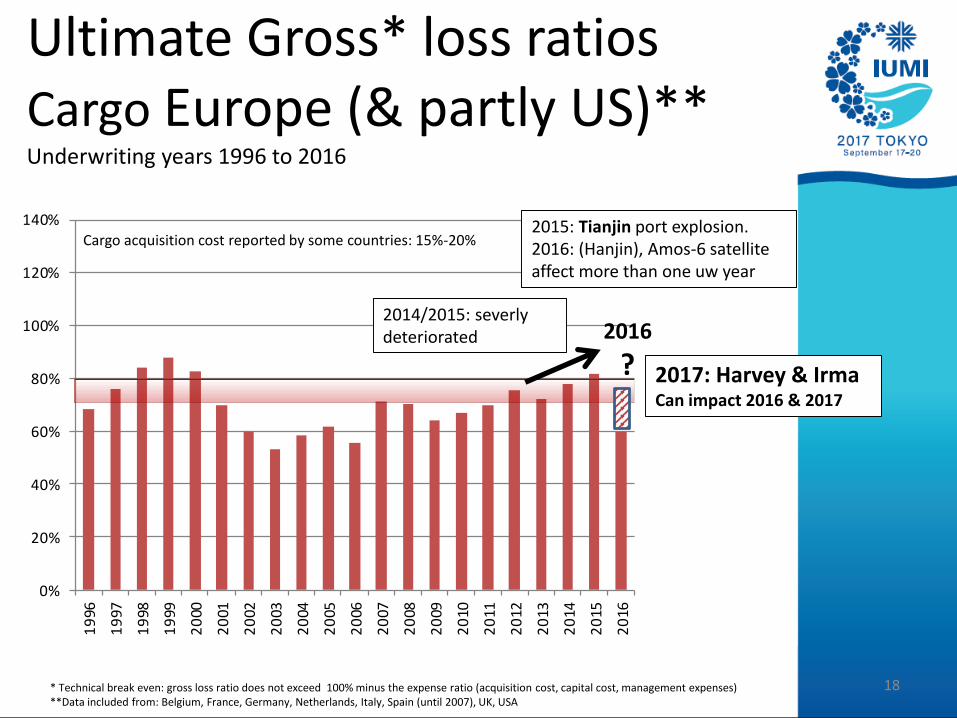
Ultimate Gross* loss ratiosCargo Europe (& partly US)** Underwriting years 1996 to 2016
18
2015: Tianjin port explosion. 2016: (Hanjin), Amos-6 satelliteaffect more than one uw year
Cargo acquisition cost reported by some countries: 15%-20%
2016
?
2014/2015: severlydeteriorated
2017: Harvey & IrmaCan impact 2016 & 2017
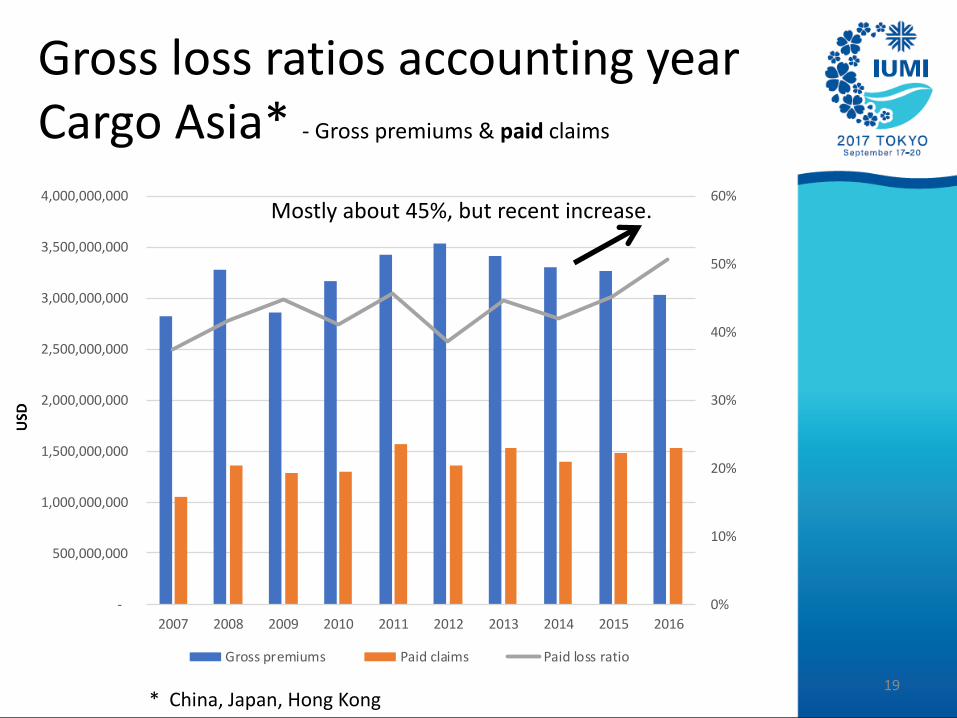
Gross loss ratios accounting yearCargo Asia* - Gross premiums & paid claims
19
0%
10%
20%
30%
40%
50%
60%
-
500,000,000
1,000,000,000
1,500,000,000
2,000,000,000
2,500,000,000
3,000,000,000
3,500,000,000
4,000,000,000
2007 2008 2009 2010 2011 2012 2013 2014 2015 2016
Gross premiums Paid claims Paid loss ratio
* China, Japan, Hong Kong
Mostly about 45%, but recent increase.
0.0%
10.0%
20.0%
30.0%
40.0%
50.0%
60.0%
70.0%
80.0%
-
500,000,000
1,000,000,000
1,500,000,000
2,000,000,000
2,500,000,000
3,000,000,000
2008 2009 2010 2011 2012 2013 2014 2015 2016
Gross premiums Paid claims Paid loss ratio
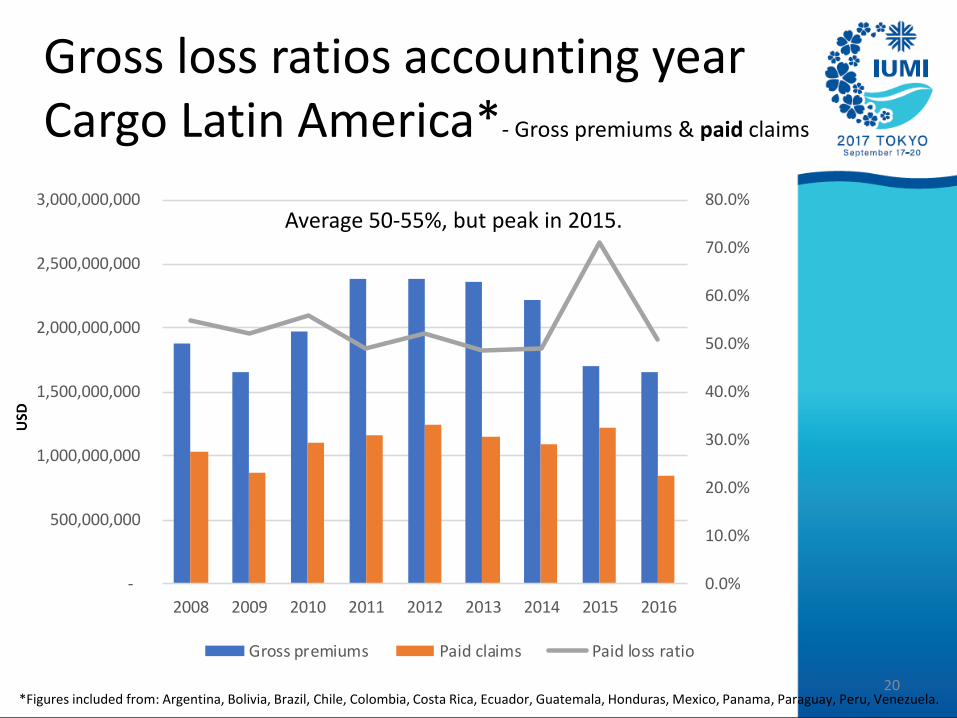
Gross loss ratios accounting yearCargo Latin America*- Gross premiums & paid claims
20
Average 50-55%, but peak in 2015.
*Figures included from: Argentina, Bolivia, Brazil, Chile, Colombia, Costa Rica, Ecuador, Guatemala, Honduras, Mexico, Panama, Paraguay, Peru, Venezuela.
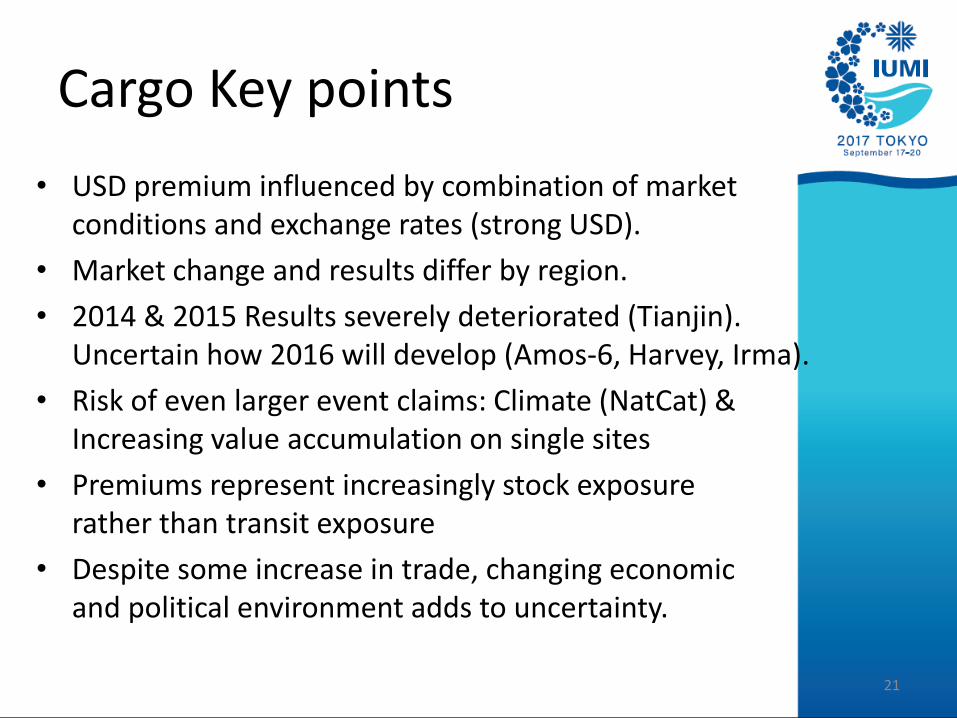
Cargo Key points
• USD premium influenced by combination of market conditions and exchange rates (strong USD).
• Market change and results differ by region.
• 2014 & 2015 Results severely deteriorated (Tianjin).Uncertain how 2016 will develop (Amos-6, Harvey, Irma).
• Risk of even larger event claims: Climate (NatCat) & Increasing value accumulation on single sites
• Premiums represent increasingly stock exposure rather than transit exposure
• Despite some increase in trade, changing economic and political environment adds to uncertainty.
21
Global Marine Insurance report
• Global Marine Insurance – Overview
• Cargo – Market & Results
• Hull – Market & Results
• Offshore Energy – Market & Results
22
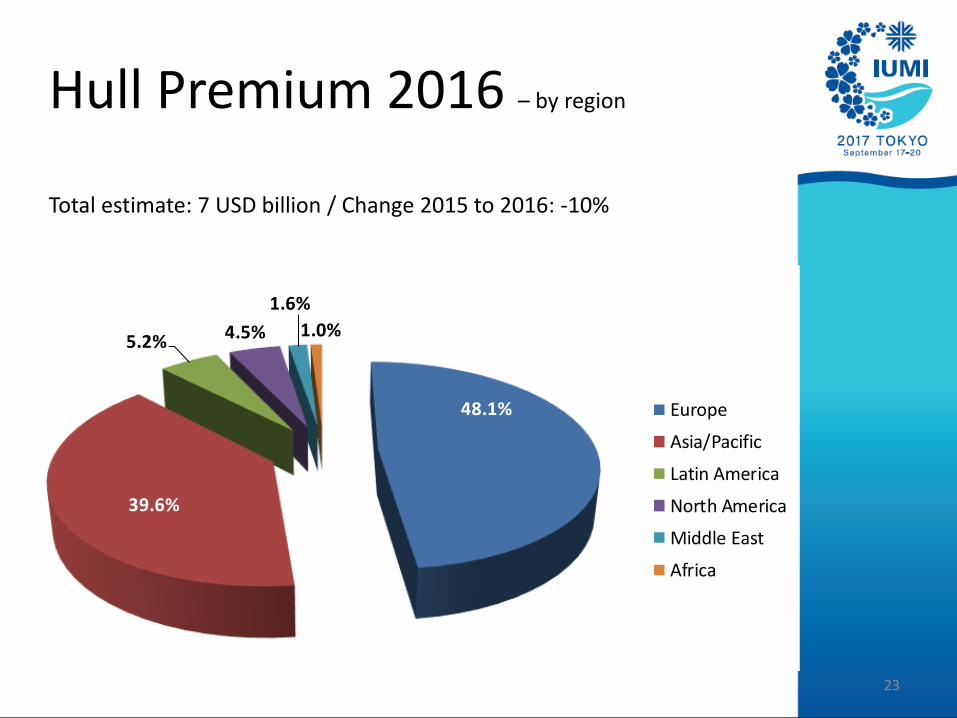
48.1%
39.6%
5.2% 4.5%
1.6%
1.0%2016
Europe
Asia/Pacific
Latin America
North America
Middle East
Africa
Hull Premium 2016 – by region
Total estimate: 7 USD billion / Change 2015 to 2016: -10%
23
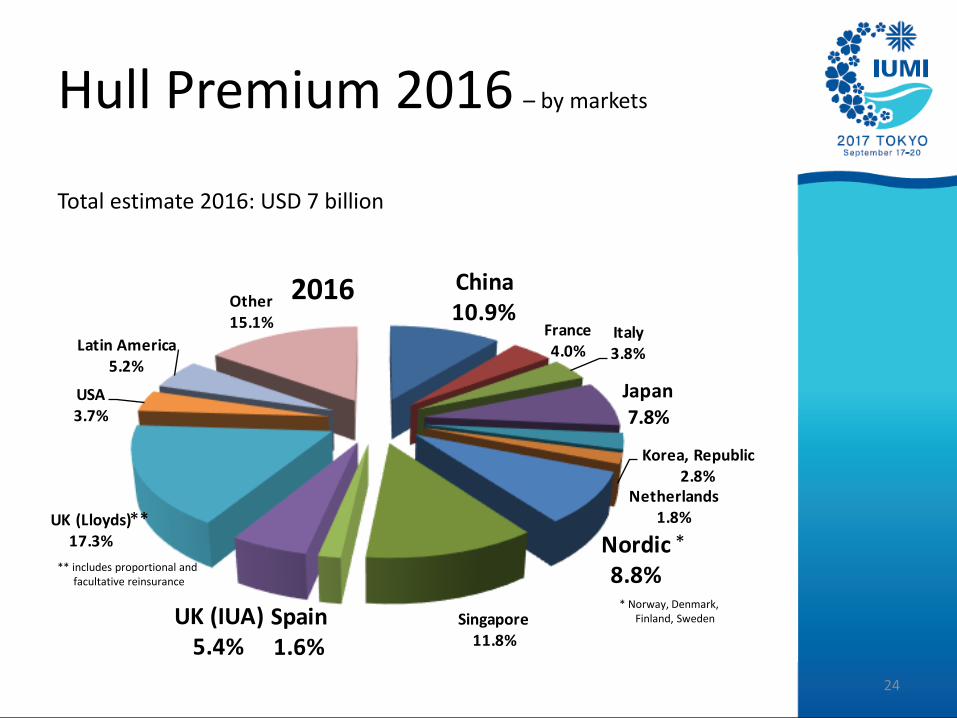
China10.9%
France4.0%
Italy3.8%
Japan
7.8%
Korea, Republic2.8%
Netherlands1.8%
Nordic8.8%
Singapore11.8%
Spain1.6%
UK (IUA)5.4%
UK (Lloyds)17.3%
USA3.7%
Latin America5.2%
Other15.1%
2016
Hull Premium 2016 – by markets
24
Total estimate 2016: USD 7 billion
*
* Norway, Denmark, Finland, Sweden
**
** includes proportional andfacultative reinsurance
0
200,000
400,000
600,000
800,000
1,000,000
1,200,000
1,400,000
1,600,000
20
10
20
11
20
12
20
13
20
14
20
15
20
16
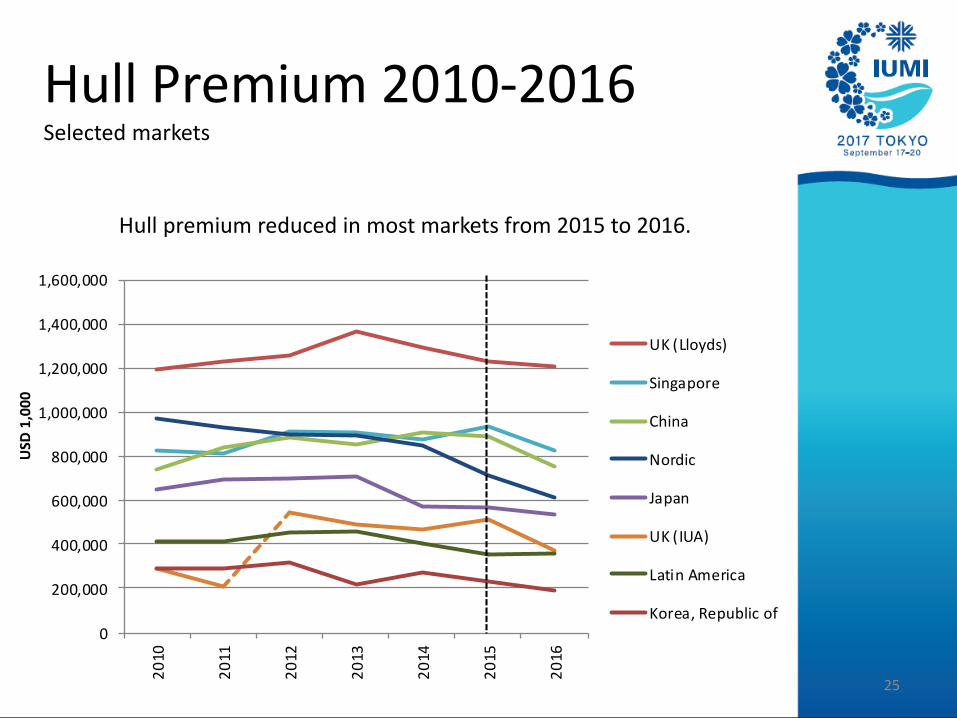
UK (Lloyds)
Singapore
China
Nordic
Japan
UK (IUA)
Latin America
Korea, Republic of
25
Hull Premium 2010-2016Selected markets
Hull premium reduced in most markets from 2015 to 2016.
50%
75%
100%
125%
150%
175%
200%
225%
250%
275%
19
95
19
96
19
97
19
98
19
99
20
00
20
01
20
02
20
03
20
04
20
05
20
06
20
07
20
08
20
09
20
10
20
11
20
12
20
13
20
14
20
15
20
16
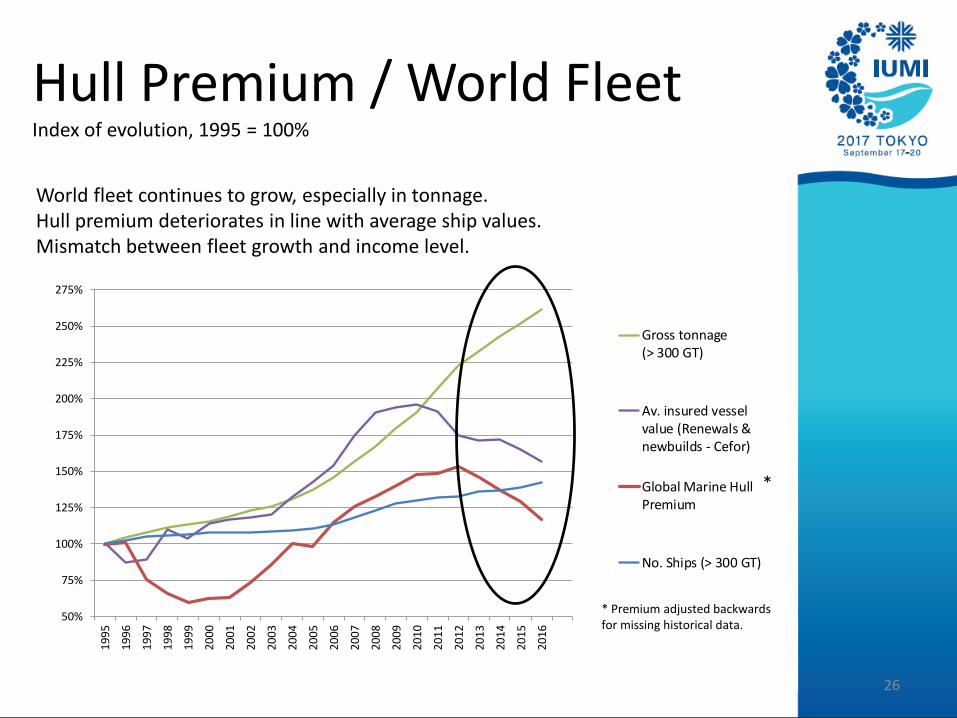
Gross tonnage(> 300 GT)
Av. insured vesselvalue (Renewals &newbuilds - Cefor)
Global Marine HullPremium
No. Ships (> 300 GT)
Hull Premium / World Fleet Index of evolution, 1995 = 100%
World fleet continues to grow, especially in tonnage. Hull premium deteriorates in line with average ship values.Mismatch between fleet growth and income level.
26
*
* Premium adjusted backwards for missing historical data.
40%
50%
60%
70%
80%
90%
100%
1 2 3 4 5
2010
2011
2012
2013
2014
2015
2016
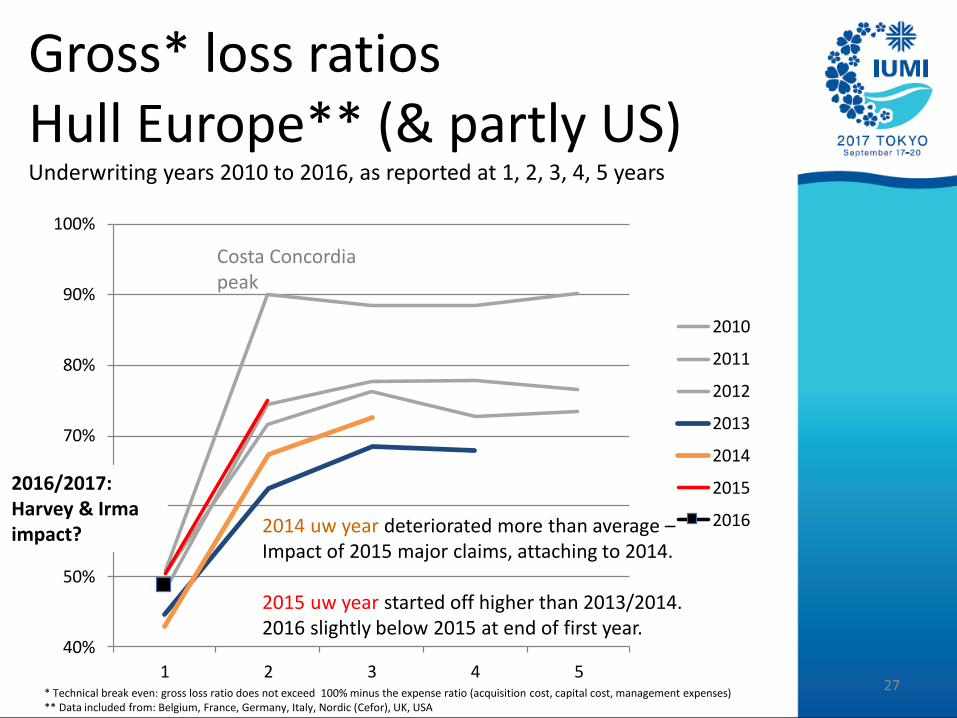
* Technical break even: gross loss ratio does not exceed 100% minus the expense ratio (acquisition cost, capital cost, management expenses)** Data included from: Belgium, France, Germany, Italy, Nordic (Cefor), UK, USA
Costa Concordia peak
27
2014 uw year deteriorated more than average –Impact of 2015 major claims, attaching to 2014.
2015 uw year started off higher than 2013/2014. 2016 slightly below 2015 at end of first year.
Gross* loss ratiosHull Europe** (& partly US)Underwriting years 2010 to 2016, as reported at 1, 2, 3, 4, 5 years
2016/2017: Harvey & Irma impact?
0%
20%
40%
60%
80%
100%
120%
140%
19
96
19
97
19
98
19
99
20
00
20
01
20
02
20
03
20
04
20
05
20
06
20
07
20
08
20
09
20
10
20
11
20
12
20
13
20
14
20
15
20
16
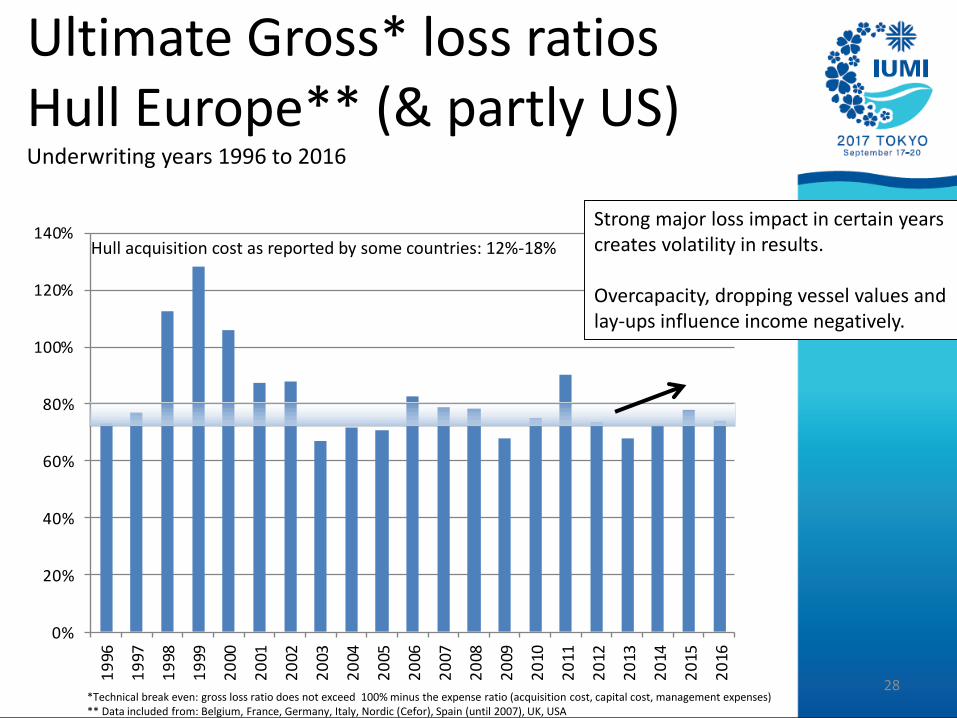
*Technical break even: gross loss ratio does not exceed 100% minus the expense ratio (acquisition cost, capital cost, management expenses)** Data included from: Belgium, France, Germany, Italy, Nordic (Cefor), Spain (until 2007), UK, USA
28
Hull acquisition cost as reported by some countries: 12%-18%
Strong major loss impact in certain yearscreates volatility in results.
Overcapacity, dropping vessel values and lay-ups influence income negatively.
Ultimate Gross* loss ratiosHull Europe** (& partly US)Underwriting years 1996 to 2016
29
0.0%
10.0%
20.0%
30.0%
40.0%
50.0%
60.0%
70.0%
80.0%
-
500,000,000
1,000,000,000
1,500,000,000
2,000,000,000
2,500,000,000
2007 2008 2009 2010 2011 2012 2013 2014 2015 2016
Gross premiums Paid claims Loss ratio - paid claims
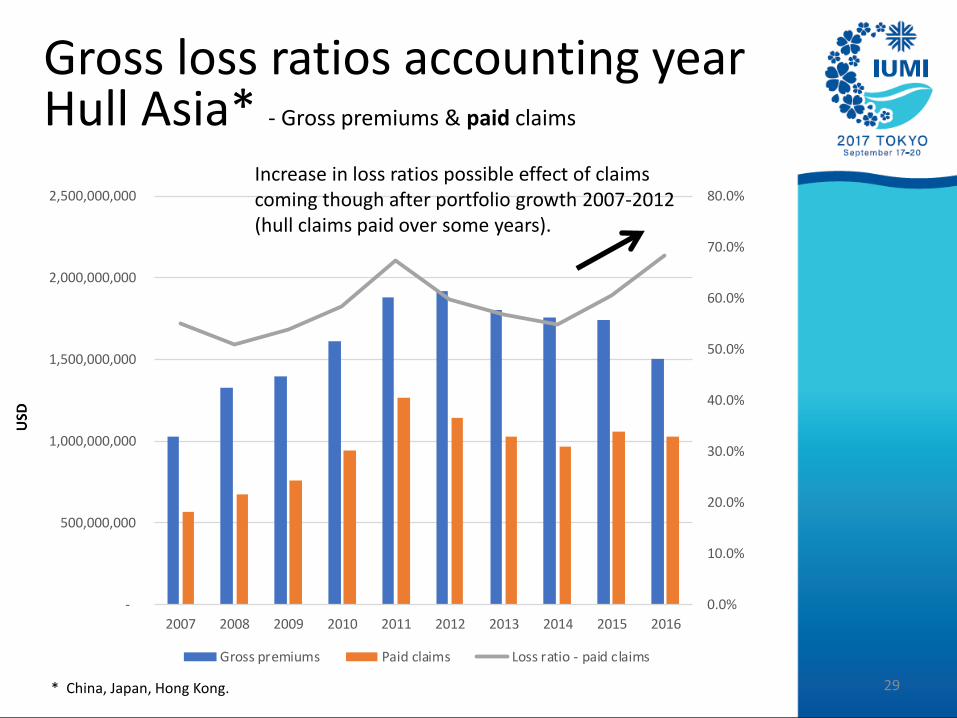
Gross loss ratios accounting yearHull Asia* - Gross premiums & paid claims
* China, Japan, Hong Kong.
Increase in loss ratios possible effect of claims coming though after portfolio growth 2007-2012 (hull claims paid over some years).
30
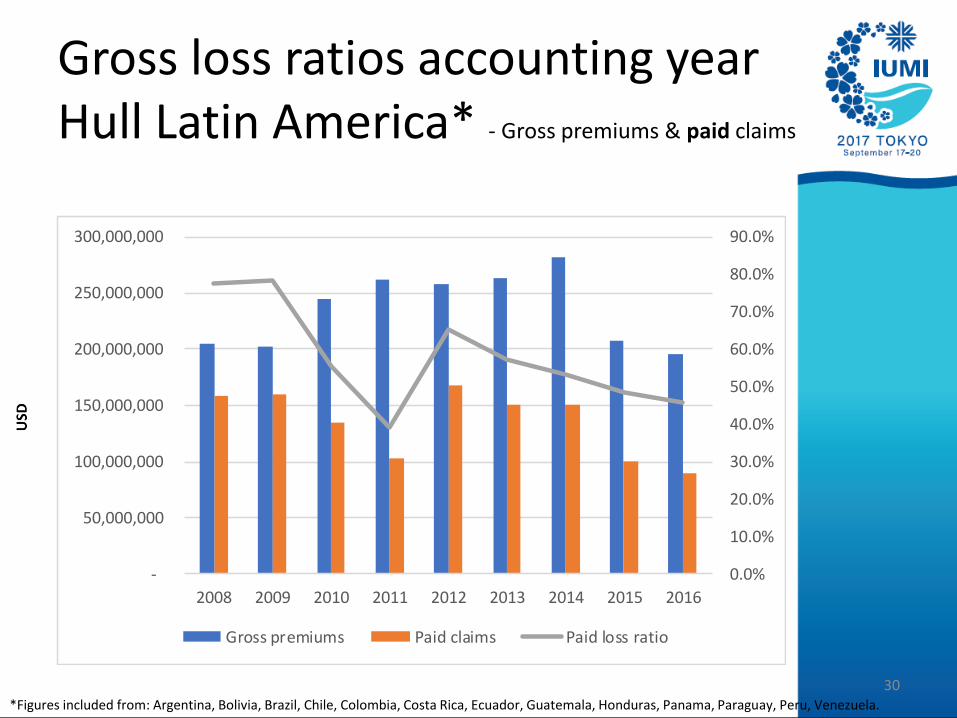
Gross loss ratios accounting yearHull Latin America* - Gross premiums & paid claims
0.0%
10.0%
20.0%
30.0%
40.0%
50.0%
60.0%
70.0%
80.0%
90.0%
-
50,000,000
100,000,000
150,000,000
200,000,000
250,000,000
300,000,000
2008 2009 2010 2011 2012 2013 2014 2015 2016
Gross premiums Paid claims Paid loss ratio
*Figures included from: Argentina, Bolivia, Brazil, Chile, Colombia, Costa Rica, Ecuador, Guatemala, Honduras, Panama, Paraguay, Peru, Venezuela.
Global Marine Insurance report
• Global Marine Insurance Overview
• Cargo – Market & results
• Hull – Focus:
– Portfolio & Claims trends
– ‘Serious’ versus ‘major’ casualties
• Offshore Energy – Market & results
31
Hull Portfolio trends
32
© Astrid Seltmann
Some reduction expected due to aging of vessels, but from 2015 vessel
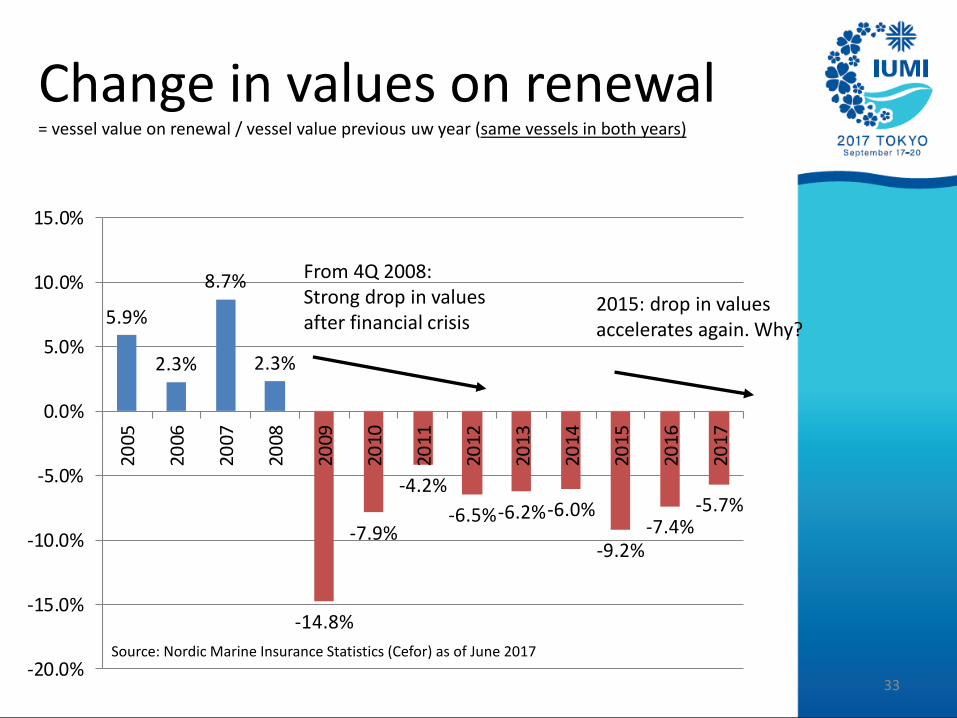
Change in values on renewal = vessel value on renewal / vessel value previous uw year (same vessels in both years)
Financial crisis effect
33
5.9%
2.3%
8.7%
2.3%
-14.8%
-7.9%
-4.2%
-6.5%-6.2%-6.0%
-9.2%-7.4%
-5.7%
-20.0%
-15.0%
-10.0%
-5.0%
0.0%
5.0%
10.0%
15.0%
2005
2006
2007
2008
2009
2010
2011
2012
2013
2014
2015
2016
2017
Source: Nordic Marine Insurance Statistics (Cefor) as of June 2017
From 4Q 2008:Strong drop in values after financial crisis
2015: drop in values accelerates again. Why?
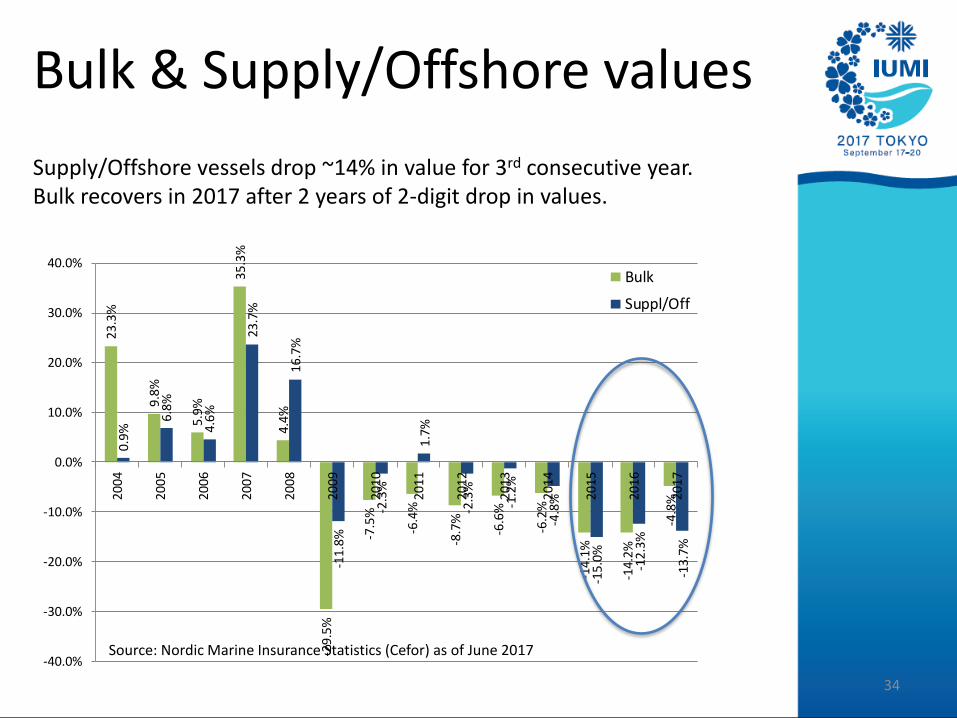
Bulk & Supply/Offshore values23
.3%
9.8%
5.9%
35.3
%
4.4%
-29.
5%
-7.5
%
-6.4
%
-8.7
%
-6.6
%
-6.2
%
-14.
1%
-14.
2%
-4.8
%
0.9
%
6.8%
4.6%
23.7
%
16.7
%
-11.
8%
-2.3
%
1.7%
-2.3
%
-1.2
%
-4.8
%
-15
.0%
-12.
3%
-13.
7%
-40.0%
-30.0%
-20.0%
-10.0%
0.0%
10.0%
20.0%
30.0%
40.0%
2004
20
05
2006
2007
20
08
20
09
2010
2011
20
12
2013
2014
20
15
20
16
2017
Bulk
Suppl/Off
Source: Nordic Marine Insurance Statistics (Cefor) as of June 2017
34
Supply/Offshore vessels drop ~14% in value for 3rd consecutive year.Bulk recovers in 2017 after 2 years of 2-digit drop in values.
0%
1%
2%
3%
4%
5%
6%
20
00
20
01
20
02
20
03
20
04
20
05
20
06
20
07
20
08
20
09
20
10
20
11
20
12
20
13
20
14
20
15
20
16
20
17
> 300 MUSD
100 - 300 MUSD
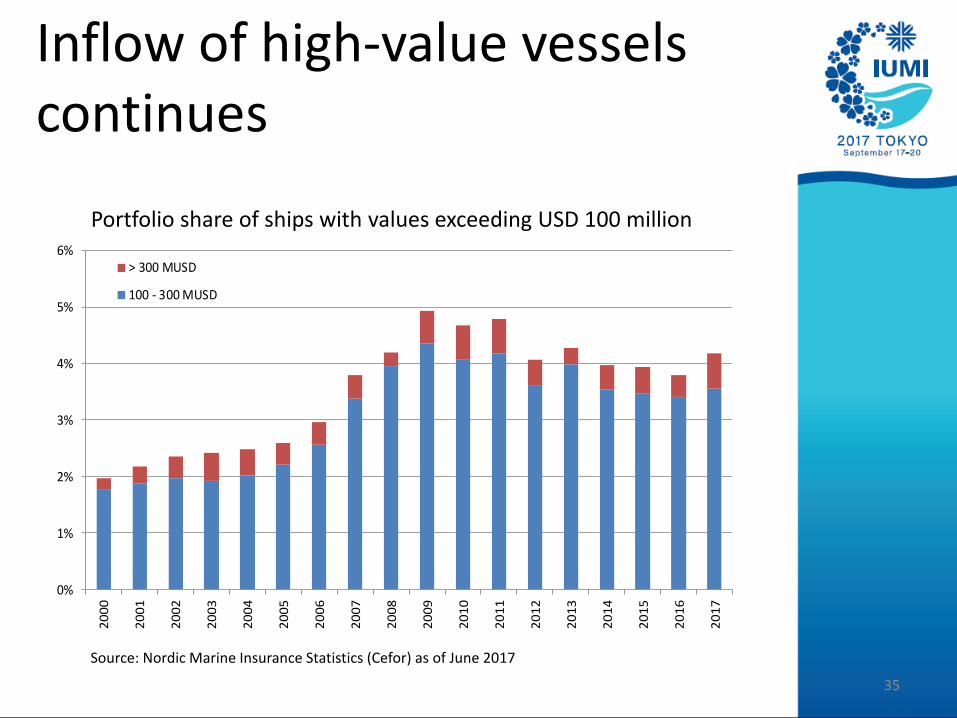
Source: Nordic Marine Insurance Statistics (Cefor) as of June 2017
Inflow of high-value vesselscontinues
Portfolio share of ships with values exceeding USD 100 million
35
Hull claims trends
36
0.00%
0.05%
0.10%
0.15%
0.20%
0.25%
0.30%
0.00%
5.00%
10.00%
15.00%
20.00%
25.00%
30.00%
35.00%
19
96
19
97
19
98
19
99
20
00
20
01
20
02
20
03
20
04
20
05
20
06
20
07
20
08
20
09
20
10
20
11
20
12
20
13
20
14
20
15
20
16
20
17
partial claims <75% SI (left axis) TLO claims >75% SI (right axis)
Source: Nordic Marine Insurance Statistics (Cefor) as of June 2017
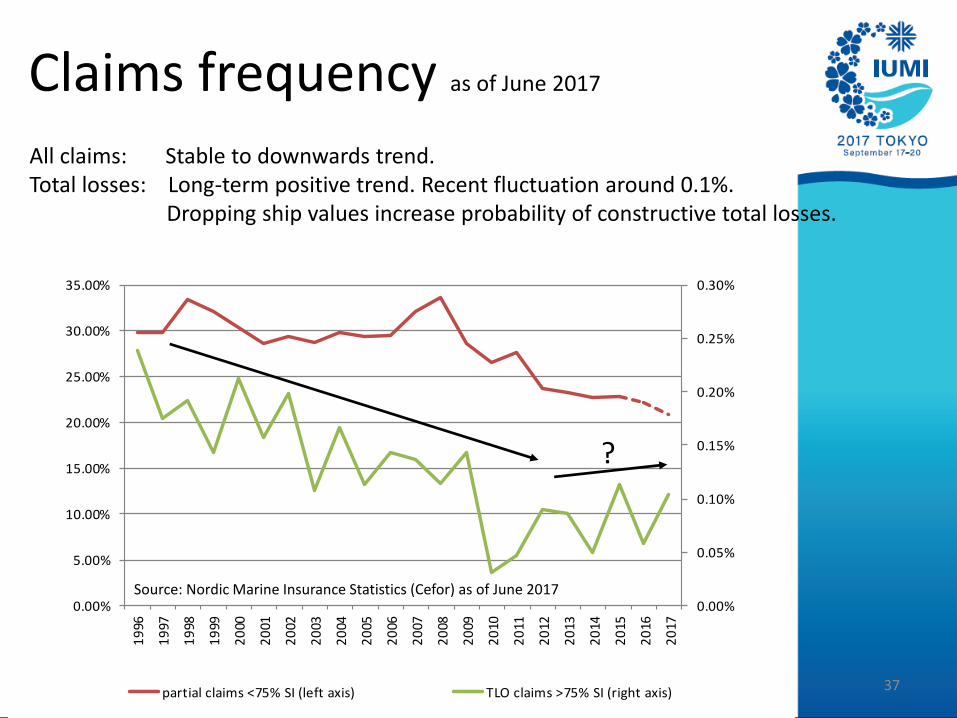
Claims frequency as of June 2017
37
All claims: Stable to downwards trend.Total losses: Long-term positive trend. Recent fluctuation around 0.1%.
Dropping ship values increase probability of constructive total losses.
?
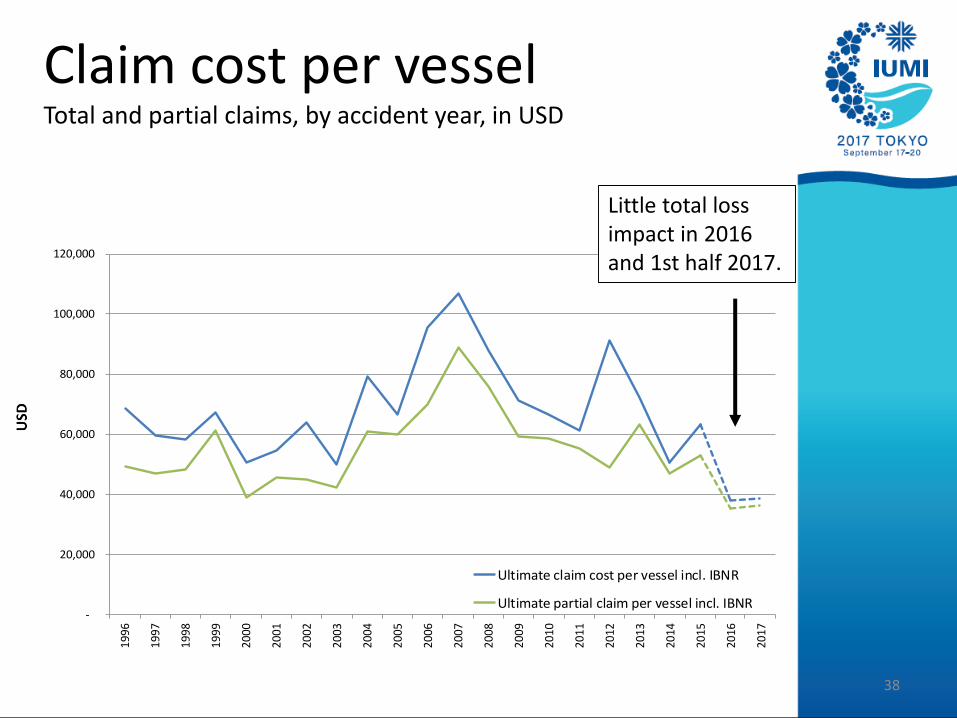
Claim cost per vesselTotal and partial claims, by accident year, in USD
38
-
20,000
40,000
60,000
80,000
100,000
120,000
1996
1997
1998
1999
2000
2001
2002
2003
2004
2005
2006
2007
2008
2009
2010
2011
2012
2013
2014
2015
2016
2017
Ultimate claim cost per vessel incl. IBNR
Ultimate partial claim per vessel incl. IBNR
Little total loss impact in 2016 and 1st half 2017.
0
20,000
40,000
60,000
80,000
100,000
120,000
19
961
997
19
981
999
20
002
001
20
022
003
20
042
005
20
062
007
20
082
009
20
102
011
20
122
013
20
142
015
20
162
017
> 50 MUSD
30 <= 50 MUSD
10 <= 30 MUSD
5 <= 10 MUSD
1 <= 5 MUSD
<= 1 MUSD
IBNR
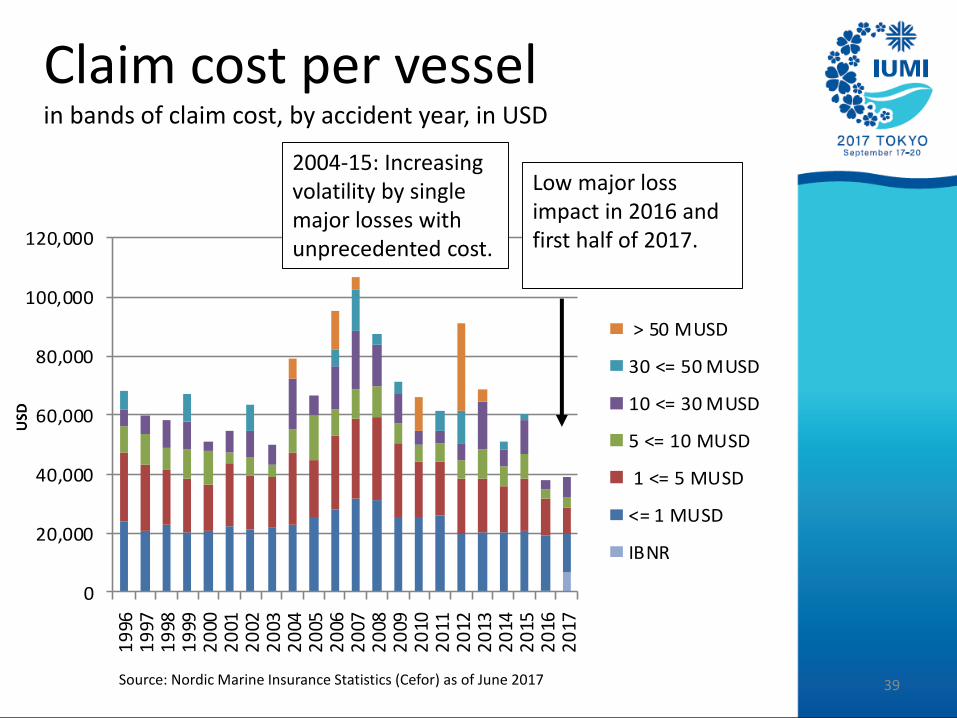
Source: Nordic Marine Insurance Statistics (Cefor) as of June 2017
Claim cost per vesselin bands of claim cost, by accident year, in USD
39
Low major loss impact in 2016 and first half of 2017.
2004-15: Increasingvolatility by single major losses withunprecedented cost.
‘Serious’ versus ‘major’ casualtiesAn excursion into terminology
‘Major claims’ (=extraordinary costly claims)strongly impact marine insurers results.
Marine bodies such as IMO and providers of maritime data (LLI, IHS, Clarkson,…) categorize casualties as ‘serious’ / ‘non-serious’*.
‘Serious’ is related to the nature of the event.
Causality:Major losses usually result from serious casualties.But the majority of serious casualties is not costly.
* Complete definitions (IMO, LLI) at end of presentation. 40
41
-
20
40
60
80
100
120
140
160
180
19
95
19
96
19
97
19
98
19
99
20
00
20
01
20
02
20
03
20
04
20
05
20
06
20
07
20
08
20
09
20
10
20
11
20
12
20
13
20
14
20
15
20
16
20
17
Non-serious / <= 5 MUSD
Serious / <= 5 MUSD
Serious / > 5 MUSD
Non-serious / > 5 MUSD
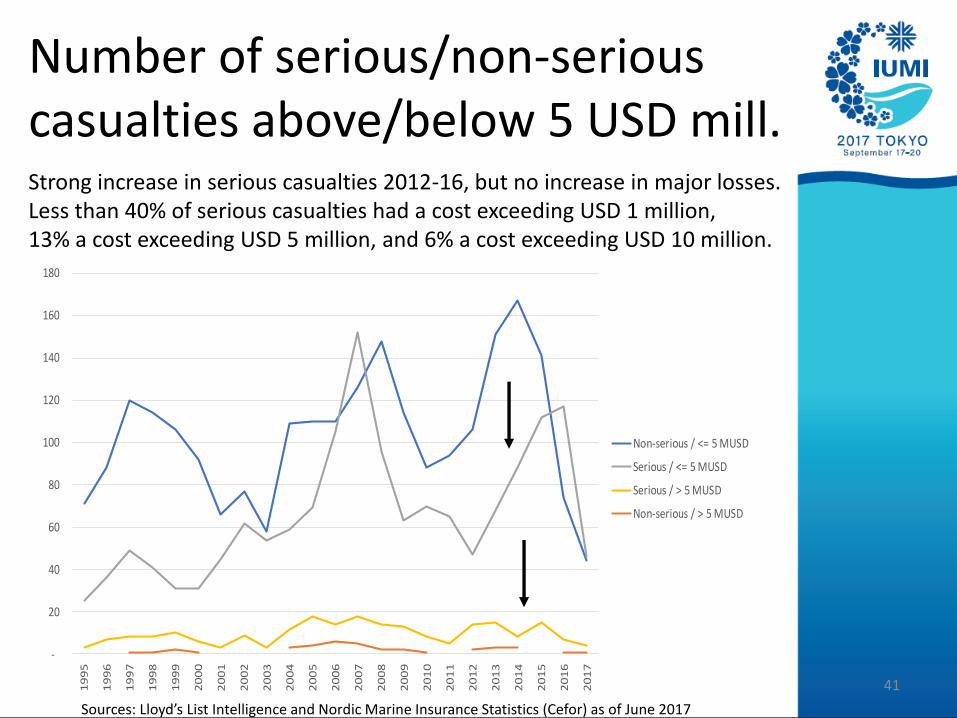
Number of serious/non-serious casualties above/below 5 USD mill.
Sources: Lloyd’s List Intelligence and Nordic Marine Insurance Statistics (Cefor) as of June 2017
Strong increase in serious casualties 2012-16, but no increase in major losses.Less than 40% of serious casualties had a cost exceeding USD 1 million, 13% a cost exceeding USD 5 million, and 6% a cost exceeding USD 10 million.
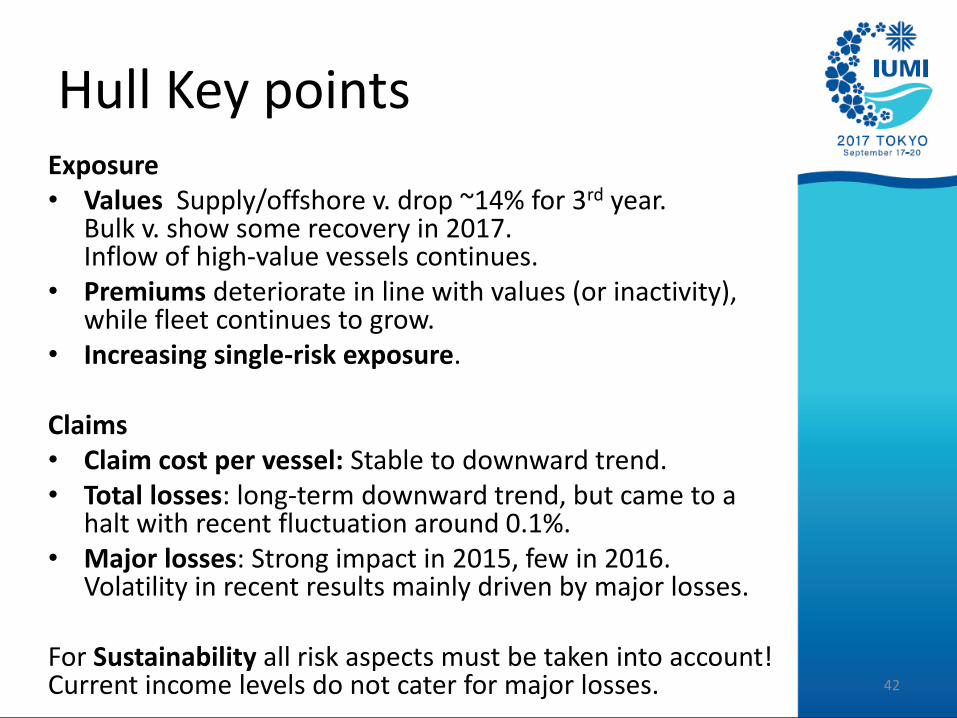
Hull Key pointsExposure• Values Supply/offshore v. drop ~14% for 3rd year.
Bulk v. show some recovery in 2017. Inflow of high-value vessels continues.
• Premiums deteriorate in line with values (or inactivity), while fleet continues to grow.
• Increasing single-risk exposure.
Claims• Claim cost per vessel: Stable to downward trend.• Total losses: long-term downward trend, but came to a
halt with recent fluctuation around 0.1%.• Major losses: Strong impact in 2015, few in 2016.
Volatility in recent results mainly driven by major losses.
For Sustainability all risk aspects must be taken into account! Current income levels do not cater for major losses. 42

Issues to monitor
High-value risks
Arctic risks
Dagfinn Bakke, Foto by Astrid Seltmann
© Astrid Seltmann
© Astrid Seltmann
Navigation
Oil price, fuel quality
New technology
Climate change
Changes in regulation (liabilities)
Human factor/Qualification
Dagfinn Bakke. Foto by Astrid Seltmann)
Value accumulation
Cyber risk
Fire on RoRo & Container vessels
Internet of things/complex technologies
Global Marine Insurance report
• Global Marine Insurance – Overview
• Cargo – Market & results
• Hull – Market & results
• Offshore Energy – Market & results
44
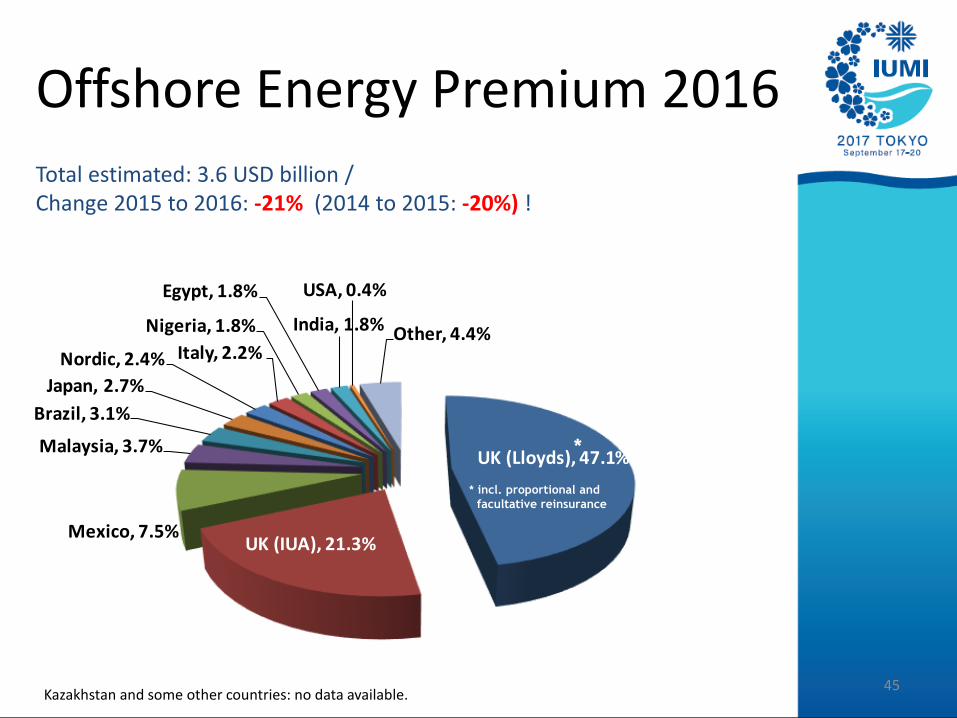
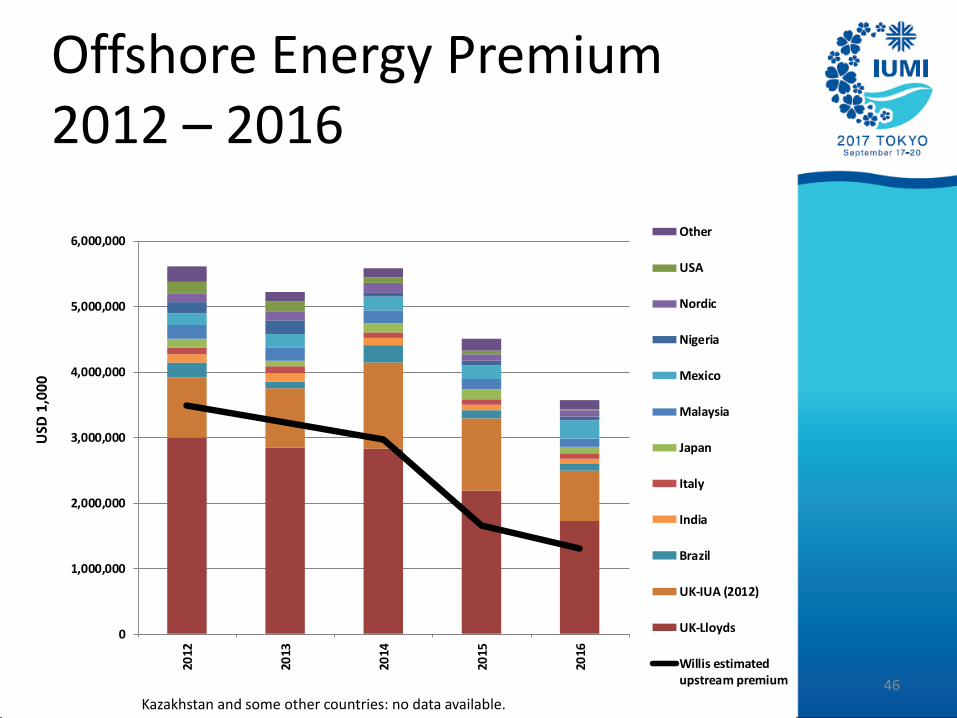
Offshore Energy Premium 2016
Total estimated: 3.6 USD billion / Change 2015 to 2016: -21% (2014 to 2015: -20%) !
45
UK (Lloyds), 47.1%
UK (IUA), 21.3%Mexico, 7.5%
Malaysia, 3.7%
Brazil, 3.1%
Japan, 2.7%
Nordic, 2.4% Italy, 2.2%
Nigeria, 1.8%
Egypt, 1.8%
India, 1.8%
USA, 0.4%
Other, 4.4%
2016
*
* incl. proportional and
facultative reinsurance
Kazakhstan and some other countries: no data available.
0
1,000,000
2,000,000
3,000,000
4,000,000
5,000,000
6,000,000
2012
2013
2014
2015
2016
Other
USA
Nordic
Nigeria
Mexico
Malaysia
Japan
Italy
India
Brazil
UK-IUA (2012)
UK-Lloyds
Willis estimatedupstream premium
Offshore Energy Premium 2012 – 2016
Kazakhstan and some other countries: no data available. 46
Offshore Energy Premium –IUMI versus Willis estimates
• IUMI:– Premiums reported by national associations.– Some double-reporting due to global nature of business.=> Overestimation of actual global premium.
• Willis approach:– Based on Lloyds premium (risk codes EC, EN, EM, EY, EZ).– Grossed up to 100% by assuming Lloyd’s represents 70%.=> Underestimation of actual global premium
• The good news: Both show the same trend!
• The bad news: the trend is downwards!47
0%
50%
100%
150%
200%
250%
300%
350%
400%
450%
500%
20
00
20
01
20
02
20
03
20
04
20
05
20
06
20
07
20
08
20
09
20
10
20
11
20
12
20
13
20
14
20
15
20
16
20
17
Average Day Rates
Global Offshore Energy
Premium
Oil price, Brent Crude
No. Contracted Rigs
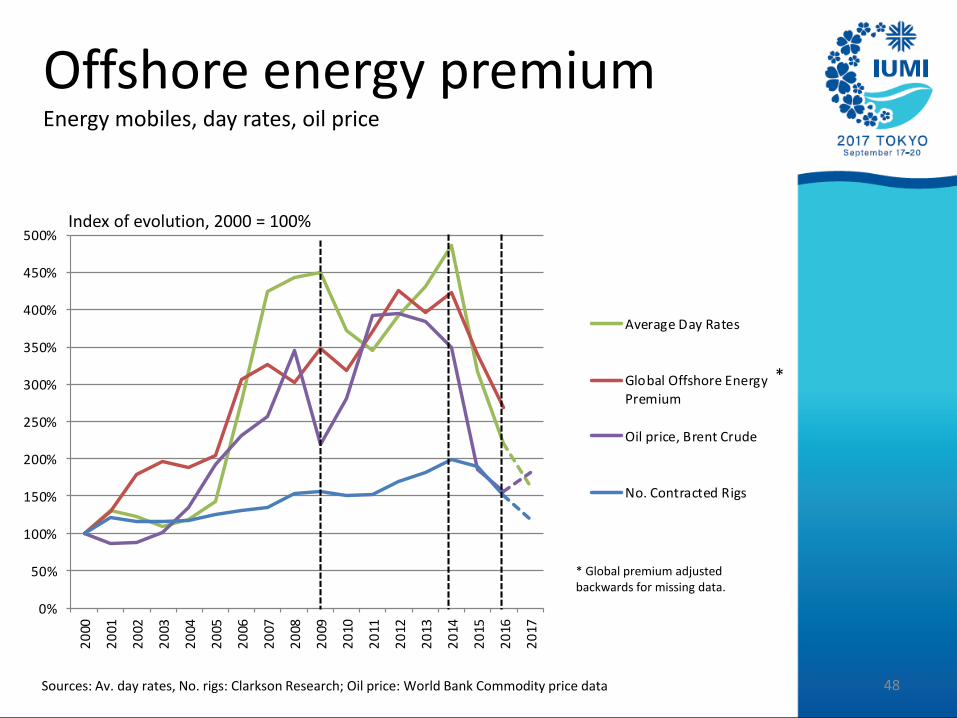
Offshore energy premiumEnergy mobiles, day rates, oil price
Index of evolution, 2000 = 100%
Sources: Av. day rates, No. rigs: Clarkson Research; Oil price: World Bank Commodity price data 48
* Global premium adjusted backwards for missing data.
*
0%
50%
100%
150%
200%
250%
300%
350%
1996
1997
1998
1999
2000
2001
2002
2003
2004
2005
2006
2007
2008
2009
2010
2011
2012
2013
2014
2015
2016
2017
outstanding
paid 10th year
paid 9th year
paid 8th year
paid 7th year
paid 6th year
paid 5th year
paid 4th year
paid 3rd year
paid 2nd year
paid 1st year
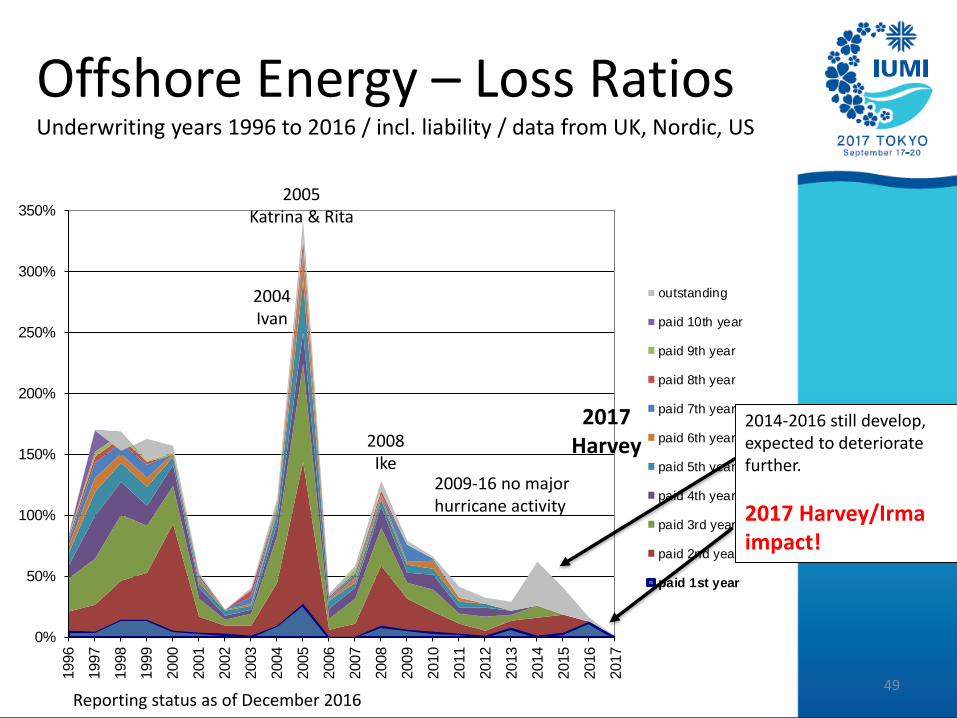
2005Katrina & Rita
2004Ivan
2008Ike
2009-16 no major hurricane activity
Offshore Energy – Loss RatiosUnderwriting years 1996 to 2016 / incl. liability / data from UK, Nordic, US
Reporting status as of December 201649
2014-2016 still develop, expected to deteriorate further.
2017 Harvey/Irma impact!
2017Harvey
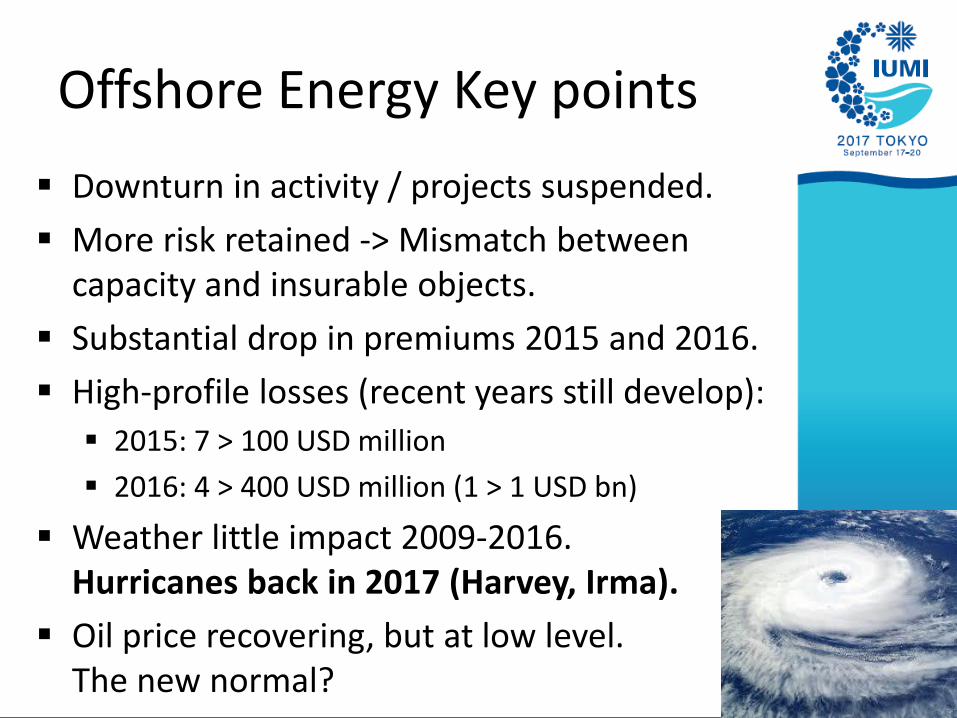
Offshore Energy Key points
▪ Downturn in activity / projects suspended.
▪ More risk retained -> Mismatch betweencapacity and insurable objects.
▪ Substantial drop in premiums 2015 and 2016.
▪ High-profile losses (recent years still develop):
▪ 2015: 7 > 100 USD million
▪ 2016: 4 > 400 USD million (1 > 1 USD bn)
▪ Weather little impact 2009-2016.Hurricanes back in 2017 (Harvey, Irma).
▪ Oil price recovering, but at low level. The new normal? 50
• Overall income reduction. • Major losses
– Moderate recent impact, but can reoccur any time (2017: Harvey, Irma!)
– Drive volatility of results. Current income levels do not cater for major losses.
– Increasing risk exposure (high-value single risks, risk accumulation) may lead to even more costly single major losses.
• Market environment– Moderate trade growth, some oil price
recovery, but still at low levels.– Climate change/NatCat losses. – Political and economic uncertainty. 51
Outlook 2017

52
Astrid SeltmannAnalyst/Actuary
The Nordic Association of Marine Insurers (Cefor)[email protected]
53
Astrid SeltmannAnalyst/Actuary
The Nordic Association of Marine Insurers (Cefor)[email protected]
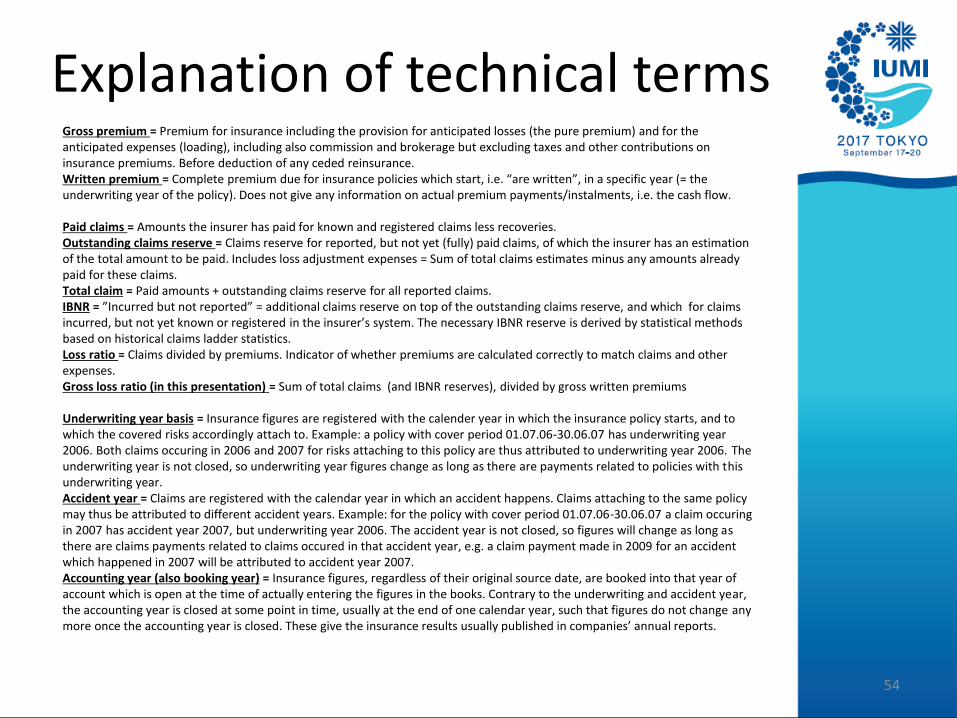
Gross premium = Premium for insurance including the provision for anticipated losses (the pure premium) and for the anticipated expenses (loading), including also commission and brokerage but excluding taxes and other contributions on insurance premiums. Before deduction of any ceded reinsurance.Written premium = Complete premium due for insurance policies which start, i.e. “are written”, in a specific year (= the underwriting year of the policy). Does not give any information on actual premium payments/instalments, i.e. the cash flow.
Paid claims = Amounts the insurer has paid for known and registered claims less recoveries.Outstanding claims reserve = Claims reserve for reported, but not yet (fully) paid claims, of which the insurer has an estimation of the total amount to be paid. Includes loss adjustment expenses = Sum of total claims estimates minus any amounts already paid for these claims. Total claim = Paid amounts + outstanding claims reserve for all reported claims.IBNR = ”Incurred but not reported” = additional claims reserve on top of the outstanding claims reserve, and which for claims incurred, but not yet known or registered in the insurer’s system. The necessary IBNR reserve is derived by statistical methods based on historical claims ladder statistics.Loss ratio = Claims divided by premiums. Indicator of whether premiums are calculated correctly to match claims and other expenses.Gross loss ratio (in this presentation) = Sum of total claims (and IBNR reserves), divided by gross written premiums
Underwriting year basis = Insurance figures are registered with the calender year in which the insurance policy starts, and to which the covered risks accordingly attach to. Example: a policy with cover period 01.07.06-30.06.07 has underwriting year 2006. Both claims occuring in 2006 and 2007 for risks attaching to this policy are thus attributed to underwriting year 2006. The underwriting year is not closed, so underwriting year figures change as long as there are payments related to policies with thisunderwriting year.Accident year = Claims are registered with the calendar year in which an accident happens. Claims attaching to the same policy may thus be attributed to different accident years. Example: for the policy with cover period 01.07.06-30.06.07 a claim occuringin 2007 has accident year 2007, but underwriting year 2006. The accident year is not closed, so figures will change as long as there are claims payments related to claims occured in that accident year, e.g. a claim payment made in 2009 for an accident which happened in 2007 will be attributed to accident year 2007.Accounting year (also booking year) = Insurance figures, regardless of their original source date, are booked into that year of account which is open at the time of actually entering the figures in the books. Contrary to the underwriting and accident year,the accounting year is closed at some point in time, usually at the end of one calendar year, such that figures do not change any more once the accounting year is closed. These give the insurance results usually published in companies’ annual reports.
Explanation of technical terms
54
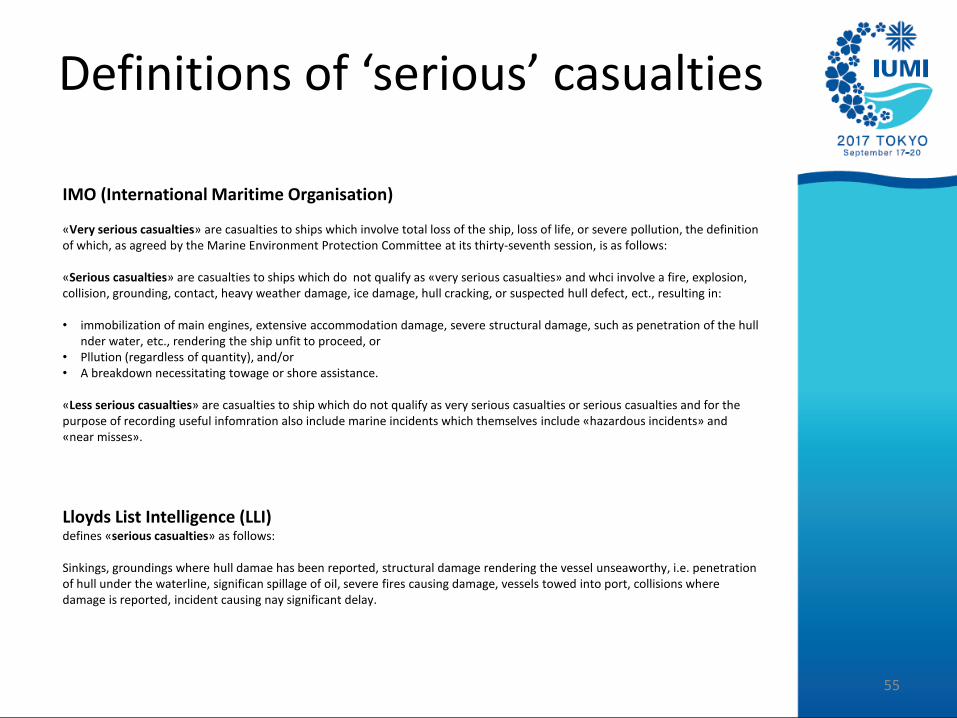
IMO (International Maritime Organisation)
«Very serious casualties» are casualties to ships which involve total loss of the ship, loss of life, or severe pollution, the definitionof which, as agreed by the Marine Environment Protection Committee at its thirty-seventh session, is as follows:
«Serious casualties» are casualties to ships which do not qualify as «very serious casualties» and whci involve a fire, explosion, collision, grounding, contact, heavy weather damage, ice damage, hull cracking, or suspected hull defect, ect., resulting in:
• immobilization of main engines, extensive accommodation damage, severe structural damage, such as penetration of the hull nder water, etc., rendering the ship unfit to proceed, or
• Pllution (regardless of quantity), and/or• A breakdown necessitating towage or shore assistance.
«Less serious casualties» are casualties to ship which do not qualify as very serious casualties or serious casualties and for thepurpose of recording useful infomration also include marine incidents which themselves include «hazardous incidents» and «near misses».
Lloyds List Intelligence (LLI) defines «serious casualties» as follows:
Sinkings, groundings where hull damae has been reported, structural damage rendering the vessel unseaworthy, i.e. penetrationof hull under the waterline, significan spillage of oil, severe fires causing damage, vessels towed into port, collisions wheredamage is reported, incident causing nay significant delay.
Definitions of ‘serious’ casualties
55