Global labour markets, return, and onward migration
27
Global labour markets, return, and onward migration Abdurrahman Aydemir Sabancy University Chris Robinson Department of Economics, University of Western Ontario Abstract. There is increasing evidence that international migration is characterized by frequent return and onward migration. This has important consequences for the contri- bution of immigrants to the economy of the host country. Lack of longitudinal data has prevented much analysis of how frequently international migration involves a sequence of location decisions or how long the typical migrant stays in a host country. A newly available longitudinal data set covering all immigrants to Canada since 1980 provides the opportunity to address these issues. The results show that a large fraction of male immi- grants who are of working age, especially among skilled workers and entrepreneurs, are highly internationally mobile. JEL classification: J61, J11, J68 March´ es globaux du travail, et flux migratoires de retour au pays d’origine ou de d´ epart vers une nouvelle destination. Les flux migratoires internationaux sont caract´ eris´ es par des retours fr´ equents au pays d’origine mais aussi par des d´ eparts vers une nouvelle desti- nation. Voil` a qui a des cons´ equences importantes pour la contribution des immigrants ` a l’´ economie du pays d’accueil. Le manque de donn´ ees longitudinales a empˆ ech´ e jusqu’ici le d´ eveloppement d’analyses de la fr´ equence de ces migrations internationales qui impliquent une s´ equence de d´ ecisions de relocalisation et de la longueur du s´ ejour de l’immigrant typ- ique dans un pays d’accueil. Une nouvelle source de donn´ ees longitudinales couvrant tous les immigrants vers le Canada depuis 1980 permet d’analyser ces questions. Les r´ esultats montrent qu’une forte fraction des hommes immigrants en ˆ age de travailler (et particuli` erement s’il s’agit de travailleurs sp´ ecialis´ es et d’entrepreneurs) sont tr` es mobiles internationalement. Aydemir is also affiliated with Family and Labour Studies, Statistics Canada. The authors wish to thank Audra Bowlus, Miles Corak, Garnett Picot, and participants at a workshop on immigration issues held at Family and Labour Division in March 2005 for their helpful discussions. Thanks are also due to referees on an earlier draft. This project is part of the research program of the Family and Labour Studies Division, Statistics Canada and the CIBC Project on Human Capital and Productivity. Email: [email protected]; [email protected] Canadian Journal of Economics / Revue canadienne d’Economique, Vol. 41, No. 4 November / novembre 2008. Printed in Canada / Imprim´ e au Canada 0008-4085 / 08 / 1285–1311 / C Canadian Economics Association
-
Upload
independent -
Category
Documents
-
view
1 -
download
0
Transcript of Global labour markets, return, and onward migration

Global labour markets, return, andonward migration
Abdurrahman Aydemir Sabancy UniversityChris Robinson Department of Economics,
University of Western Ontario
Abstract. There is increasing evidence that international migration is characterized byfrequent return and onward migration. This has important consequences for the contri-bution of immigrants to the economy of the host country. Lack of longitudinal data hasprevented much analysis of how frequently international migration involves a sequenceof location decisions or how long the typical migrant stays in a host country. A newlyavailable longitudinal data set covering all immigrants to Canada since 1980 provides theopportunity to address these issues. The results show that a large fraction of male immi-grants who are of working age, especially among skilled workers and entrepreneurs, arehighly internationally mobile. JEL classification: J61, J11, J68
Marches globaux du travail, et flux migratoires de retour au pays d’origine ou de departvers une nouvelle destination. Les flux migratoires internationaux sont caracterises pardes retours frequents au pays d’origine mais aussi par des departs vers une nouvelle desti-nation. Voila qui a des consequences importantes pour la contribution des immigrants al’economie du pays d’accueil. Le manque de donnees longitudinales a empeche jusqu’ici ledeveloppement d’analyses de la frequence de ces migrations internationales qui impliquentune sequence de decisions de relocalisation et de la longueur du sejour de l’immigrant typ-ique dans un pays d’accueil. Une nouvelle source de donnees longitudinales couvranttous les immigrants vers le Canada depuis 1980 permet d’analyser ces questions. Lesresultats montrent qu’une forte fraction des hommes immigrants en age de travailler (etparticulierement s’il s’agit de travailleurs specialises et d’entrepreneurs) sont tres mobilesinternationalement.
Aydemir is also affiliated with Family and Labour Studies, Statistics Canada. The authors wishto thank Audra Bowlus, Miles Corak, Garnett Picot, and participants at a workshop onimmigration issues held at Family and Labour Division in March 2005 for their helpfuldiscussions. Thanks are also due to referees on an earlier draft. This project is part of theresearch program of the Family and Labour Studies Division, Statistics Canada and the CIBCProject on Human Capital and Productivity. Email: [email protected]; [email protected]
Canadian Journal of Economics / Revue canadienne d’Economique, Vol. 41, No. 4November / novembre 2008. Printed in Canada / Imprime au Canada
0008-4085 / 08 / 1285–1311 / C© Canadian Economics Association

1286 A. Aydemir and C. Robinson
1. Introduction
Immigration is an important issue in many developed countries. In recent policydebates, two issues are often prominent in the discussion. First is the role that im-migration can play in avoiding population decline or stagnation which is impliedby the low fertility rates in developed countries. The total fertility estimates for2002 are well below replacement for many developed countries such as Australia(1.77), Canada (1.60), Germany (1.39), France (1.74), Italy (1.19), Japan (1.42),Sweden (1.54), and the United Kingdom (1.73) and approximately equal to it forthe United States (2.07).1 Immigration is a possible source of population increaseto make up for the low domestic fertility rates both immediately in the form of thenew immigrants themselves and in the future from the typically higher fertilityrates among immigrant populations compared to native born in the developedcountries. This role of immigration has received considerable attention (see, e.g.,Beach, Green, and Reitz 2003).
The second issue is the role selective immigration can play in raising livingstandards in the host country by increasing the supply of highly skilled workers.It is often claimed that Canada faces a ‘brain drain’ of emigrants to the UnitedStates, and that skilled immigration can more than make up for this. It is generallyrecognized that immigrants are not randomly selected individuals from theircountries of origin. They differ from non-migrants in terms of both observedand unobserved characteristics. These selection effects come from the behaviourof the migrants themselves and the behaviour of the host country in the selectivityimplied by its immigration rules.
The contribution immigrants make to the host country depends on the num-bers and skill levels of immigrants – an issue that has been studied extensively; onhow long they stay – an issue that has received less attention; and on who stays– an issue that has received attention only recently. However, return or onwardmigration, particularly who stays, is increasingly recognized as an important is-sue requiring further study.2 It is important because it can have a major impacton the net addition made to a host country’s population by immigration.3 It alsoaffects, via the selective nature of the process, the quality of the immigrant stock,and ignoring it results in substantial biases in studies of immigrant assimilation(see Jasso and Rosenzweig 1982; Borjas and Bratsberg 1996).
In addition, evidence on out-migration is important for the design of immi-gration policy and has implications for the payoff to the costs incurred for set-tlement and assimilation. Canada and the United States, for example, are majorhost countries and incur settlement and assimilation costs for particular classes
1 Source: The World Factbook (Washington, DC: Central Intelligence Agency 2002); Bartleby.com(2002).
2 While the importance of assessing return migration is increasingly recognized, the phenomenonitself has a long history. Piore (1979), for example, provides estimates of large return migrationflows from the United States in the early part of the 20th century.
3 Warren and Peck (1980) drew attention to the importance of the magnitude of return migrationfor an accurate picture of the net addition made to the United States population by immigrants.

Global labour markets 1287
of immigrants. To the extent that large numbers of immigrants return to theircountry of origin or use the initial host country as a stepping stone to another,the return to these costs will be reduced (see Devoretz and Ma 2002 for discus-sion of this phenomenon). If immigration policy is designed to attract permanentimmigrants, it is important to understand the determinants of return or onwardmigration. Evidence on trends in out-migration is essential to keep policy up todate. The literature on return migration has raised awareness that migration isnot necessarily a permanent move for many migrants. However, return migrationitself has often been taken as permanent, if only because of the data limitationsin treating it differently. In the increasingly global labour market it may be moreappropriate to treat international migration more like internal migration. Indi-viduals may move around from place to place for job-related or other reasonsseveral times in a lifetime. Barriers to the international labour movement havebeen reduced in recent years. In North America, the NAFTA (North Ameri-can Free Trade Agreement) provisions have made some type of movement mucheasier. There has been considerable debate about whether it has stimulated abrain drain of Canadians to the United States, though the literature containsno evidence on whether this is permanent, or part of an increased flow backand forth (see Devoretz and Coulombe 2005). An important new data set forMexico (the Mexican Migration Project) has stimulated a literature that exam-ines back-and-forth movement from a group of Mexican villages to the UnitedStates (Massey, Durand, and Malone (2002), Munshi (2003), Colussi (2004), andAngelucci (2003)).
The previous literature on return migration, briefly reviewed below, has al-ready provided evidence of the total magnitude of return migration in severalcountries and a start has been made on modelling the process and testing hy-potheses regarding the important determinants. There have been large changesin immigration patterns, however, particularly in the source country patterns formigration to developed countries such as Canada and the United States. Changesover time in the characteristics of immigrants and the speed of their assimilationhave been the subject of much debate, but despite the strong connection, changesin the make-up of return or onward migration have not been investigated. Thelack of data has also prevented much analysis of whether international migrationis increasingly composed of a sequence of moves, not a once-for-all move withpossibly a return should the move prove to have been a mistake. A newly avail-able tax-based longitudinal data set, covering immigrants to Canada since 1980,provides the opportunity to address these issues.
The analysis in the paper uses two different measurement approaches to studyreturn and onward migration. One uses landings records, which record all immi-grant arrivals to Canada, together with Canadian Censuses that provide infor-mation on the number and characteristics of immigrants at a point in time aftertheir arrival. Based on the information provided by these repeated cross-sections,out-migration rates, and variation in these rates by characteristics such as countryof origin, the macroeconomic environment at arrival is investigated. The otherapproach uses the landings records and the longitudinal tax-filing information

1288 A. Aydemir and C. Robinson
and infers out-migration by long term absences from the tax files. The two meth-ods provide very similar estimates of out-migration rates and the same qualitativeresults regarding variation in rates by country of origin and phase of the businesscycle at arrival. This suggests that a substantial part of the absences of immigrantsfrom the tax records is associated with not being in the country.
The annual frequency of tax-filing information as opposed to Census infor-mation that is available every five years also allows a finer analysis of the timepath of these absences, and its association with important immigrant character-istics such as visa class and language ability at arrival, which are not available inCensus files. The longitudinal approach using tax files provides evidence on thefactors that determine how long immigrants remain in Canada in their first spellin the country and the extent to which there may be reappearances after a spellof absence. The length of the first spell is particularly important in assessing thetotal or life-cycle contribution of a new immigrant arrival to the population orlabour force.4
The plan of the paper is as follows. In section 2, the previous research on returnmigration is briefly reviewed. It highlights the importance of return migration andthe variation in return migration by source country documented in the previousliterature. In section 3, a variety of evidence is presented on the factors affectingthe length of the first spell of residence in the host country or, conversely, theextent of return or onward migration. This evidence shows a large amount ofreturn or onward migration and substantial variation in magnitudes over timeand by various characteristics, including class of immigrant and source country.For the male cohorts landing around the 1990–1 recession, a substantial fractionleft the country within a relatively short period of time. The migrants from sourcecountries such as Hong Kong or the United States had particularly short stays,as did those entering under the business-class or skilled-class category for sourcecountries in general.
Section 3 also examines the time path of the exits, estimating hazard functionsunder a variety of specifications. There is a very clear pattern of particularly highhazard rates in the first year that subsequently fall rapidly to quite low levels. Thisoccurs for all visa classes, indicating that most of the variation in length of stayis due to the differences in the hazard rates in the first year. For males enteringat ages 25–45, the firs-year hazard rate for the business class, for example, is0.311, compared with 0.167 for refugees and 0.206 for the family class. However,after this period, the hazards are very similar; the gaps are only 0.01 to 0.02between classes. The hazard functions for the migrants from Hong Kong reflectthe very strong influence of the handover to China. In particular, the hazardfunction for the 1980 to 1984 cohorts, who migrated largely before the handoverdiscussions, is very similar to those for other source countries outside of North
4 While the length of the first spell is particularly important, the data show multiple moves amongimmigrants in Canada, confirming that neither initial nor return migration is permanent, butboth are the kind of ‘temporary’ phenomenon observed in worker movement across job locationsin internal migration.

Global labour markets 1289
America. However, for the 1990 to 1994 cohorts there is a dramatic increase inthe first-period hazard relative to the earlier cohorts.
The results in section 3 are derived from tax-filing behaviour rather than directevidence on residence. Tax-filing behaviour is of great interest in itself, in that itallows the assessment of the life-cycle contribution of newly landed immigrants tothe labour market and tax payments. However, the relation to residence is also ofinterest, and section 4 presents a comparison with a Census-based approach thatdirectly measures residence. The Census-based approach is much more limited inwhat can be done because of its repeated cross-sectional, rather than longitudinal,nature and the lack of information on characteristics such as visa status. However,using a synthetic cohort approach with the Census provides an alternative way ofestimating a subset of the results obtained in section 3 using tax-filing behaviour.A comparison of these estimates provides substantial corroboration of the resultsreported in section 3. Some conclusions and an outline of future work are givenin section 5.
2. Previous research on return migration
Empirical studies of out-migration of immigrants have been, until recently, ham-pered by the lack of longitudinal data on immigrants that would directly identifyleavers. Many studies use repeated cross-sectional data, such as a national census,and focus on obtaining estimates of the amount of out-migration. Warren andPeck (1980) for example, use the U.S. censuses for 1960 and 1970, together withImmigration and Naturalization Service (INS) statistics on aliens admitted forpermanent residence, to estimate total emigration in the period 1960 to 1970 andthe fraction of immigrants admitted between 1960 and 1970 that had emigratedby 1970. Their estimates show that more than 1 million foreign-born personsleft the United States during the decade. They conclude that the ‘implications ofsubstantial foreign-born emigration for United States population growth are ob-vious. Rather than 400,000 persons being added to the United States populationeach year (the level of net immigration currently used by the Census Bureau inits population projections), the real addition is probably closer to 250,000 eachyear’ (Warren and Peck 1980, 79).
A related Census-based approach was used for Canada by Lam (1994). Thismethod relies entirely on Census data, using a synthetic cohort approach. Theestimates, based on the micro data files for the Censuses of 1971 and 1981,show a substantial amount of return or onward migration. In addition, byusing the individual characteristics available in both censuses, the covariatesassociated with return migration were investigated. A result in common withthe literature for the United States is the substantial variation by country oforigin.
Jasso and Rosenzweig (1982) were able to use the U.S. Alien Address ReportProgram, which simulates a longitudinal research design. Combining this with

1290 A. Aydemir and C. Robinson
mortality records and survey data, Jasso and Rosensweig (1982) obtain estimatesof cumulative net rates of emigration for the 1971 legal immigrant cohort at abouteight years after entry. An important feature of these estimates is that they wereobtained by country of origin, which permits consideration of some, possibly veryimportant, selection effects in emigration. Like the authors of earlier literature,Jasso and Rosenzweig (1982) estimate large emigration rates: ‘The emigrationrate for the entire cohort could have been as high as 50 percent. Canadian em-igration was probably between 51 percent and 55 percent. Emigration rates forlegal immigrants from Central America, the Caribbean (excluding Cuba), andSouth America were at least as high as 50 percent and could have been as high as70 percent. On the other hand, emigration rates for Koreans and Chinese couldnot have exceeded 22 percent’ (Jasso and Rosenzweig 1982). Borjas and Bratsberg(1996) report a similar pattern of out-migration rates by country of origin.
The major disadvantage of the methods used in this literature to estimate returnmigration is that it cannot examine migration at the individual level becauseof the reliance on Census data to identify leavers. Since there is no individuallink from the administrative data to the Census, individual characteristics of theleavers cannot be identified; only averages can be. Other disadvantages followfrom the fact that the absence of this link requires a variety of adjustments tothe Census figures to make sure that they are comparable to the administrativerecords cohort. These include Census enumeration problems, illegal immigrants,mortality issues, and Census respondent recall of their immigration date manyyears after the fact. The impossibility of an individual-level analysis from thismethod means that many important questions regarding the contribution ofimmigrants cannot be answered.
The Mexican Migration Project (MMP) provides longitudinal data to examinethe patterns of movement of individuals between a group of Mexican villages andthe United States. An early example of the use of this data set is Massey, Durand,and Malone (2002). This data set has provided a great deal of information onthe temporary nature of much of this migration, and the information on poten-tial wages in both locations over time has presented an opportunity to modelthis back-and-forth movement. Recent papers by Munshi (2003), Colussi (2004),and Angelucci (2003) are examples of this modelling effort. The MMP data areuseful for understanding a particular example of back-and-forth internationalmigration for the Mexican case, but are limited to a particular source country. Inaddition, they cannot provide a picture of return or onward migration in totalfor the host country.
Constant and Massey (2002) examine return migration using the GermanSocio-Economic Panel, which provides a source of longitudinal data beginningin 1984 on about 3,000 legal immigrants. This study focuses on examining selec-tivity in return migration and provides evidence on the nature of this selectivity.Like the Census-based studies in Canada and the United States, country of originis very important. The largest immigrant population is from Turkey and theseimmigrants were much less likely to return than immigrants from the EuropeanUnion. Studies based on national longitudinal panels can provide information on
Global labour markets 1291
return and repeat migration, which is not possible with the Census-based stud-ies. They provide clear evidence that return and repeat migration are importantphenomena. However, they are typically limited by relatively small sample sizesfor immigrant populations, especially at a disaggregated level.
3. Data sources
The data sets that form the primary basis for the empirical analysis are the Land-ings Records (LIDS) and the Longitudinal Immigration Data Base (IMDB). TheLIDS file is a rich source of immigration data, recording all landings in Canadafrom 1980 onward and containing a wide variety of personal, demographic, andprogram data, including the immigrant category. The IMDB matches the LIDSwith information from the tax records, thereby providing a longitudinal earningsrecord for immigrants that remain in Canada after landing.5 The longitudinalaspect of IMDB is especially valuable for a variety of important immigration-related questions.
The IMDB provides information on the tax behaviour of immigrants wholanded since 1980.6 However, whether they work or reside in the country in anysubsequent year must be inferred from the tax records. The IMDB tax recordsshow intermittent filing for many immigrants. The IMDB records include manyimmigrants who have landed and filed taxes who go on to have periods of non-filing for up to four years, and yet who subsequently recommence filing. Fromthe IMDB it is not possible to know if these individuals left the country for aperiod and subsequently returned. They may have been permanently residing inthe country and had intermittent periods of non-filing. This intermittent natureof tax filing is of interest in itself. If the lack of tax filing does indicate absence,as an increasingly global labour market might suggest, then it will allow thecalculation of the contribution of a given cohort of immigrants to the workforce.If it indicates instead just the absence of paying taxes, it will allow the calculationof the contribution of the cohort to taxes.
The IMDB provides a unique opportunity to examine the life-cycle profile ofrecent immigrants regarding their residence or tax-filing behaviour in Canada, inthe context of a new global labour market where mobility among immigrants isincreasing. The analysis in this section examines the determinants of the intervalbetween landing and the first consecutive four-year spell of non-filing. The anal-ysis is based on the tax-filing behaviour; hence residence behaviour inferred fromtax files may include some bias if, for example, some individuals do not file tax
5 To be included in the IMDB, an individual has to file at least one tax return after landing.6 Landing refers to the process whereby immigrants arrive in Canada with their landings
documentation that starts their permanent resident status. Temporary residents who are alreadyresiding in Canada and are accepted as immigrants have to leave the country and re-enter withtheir landing documents for their permanent resident status to take effect. Thus, for someindividuals permanent residence may start following a period of temporary residence.

1292 A. Aydemir and C. Robinson
returns for four or more consecutive years, although they are in the country.7
However, comparison with Census data that directly measures residence suggeststhat this bias is likely to be small.8 Recent international migration is viewed asbeing sufficiently influenced by the global labour market to treat all ‘spells’ in agiven country as analogous to job spells. In an internal migration setting, manyindividuals have intermittent spells in various jobs or occupations. All moves arepotentially temporary and all jobs may be returned to. The focus of interest inthis setting is an examination of the determinants of the spell lengths. In thissection, the same approach is used with international migration.
The IMDB contains a rich set of characteristics for all immigrants such asvisa class, education level, and language ability. The IMDB makes it possible toexamine how immigrant life-cycle profiles are related to the various characteristicsthat are used to shape immigration policy. In addition, it is possible to distinguishimmigrants according to source region and the immigrant class under which theyare admitted, such as skilled worker or refugee. The evidence provided belowshows that immigrants admitted from different regions and under different visaclasses have very different life-cycle profiles of residence in Canada.
4. A Duration model for immigrant retention
A duration analysis was conducted on the role of the covariates of interest indetermining survival of immigrants landing in Canada to the end of the firstspell of residence, as indicated by tax-filing behaviour. For the purpose of thisanalysis, a spell is referred to as spell of residence. As noted above, tax filingis not equivalent to residence, but a comparison with census methods reportedin section 4 below suggests that a substantial portion of the absence from taxfiles for immigrants is absence from the country. From the point of view of animmigrant’s contribution to a host country, the spells of tax filing are of interestin themselves. However, the interpretation of the coefficients of the discrete timeduration model reported in this section as reflecting the determinants of residencespells is subject to the caveat that the data refer to tax filing. The data are suchthat, while the landing date is known precisely, that is, no left censoring, the date
7 Defining absences based on shorter spells, such as two years, shows that this type of shorterabsence is more likely to refer to short-term absences from the workforce as more than half of theindividuals who experience such spells reappear in the data. On the other hand, a spell definitionlonger than four years provides results very similar to four-year definition as people who areabsent from tax files for four years are very likely to be absent an additional one or more years.Increasing spell-length definition also requires dropping later cohorts who were not in thecountry long enough – hence, loosing some information. Given very similar estimates between theCensus method and tax filing method based on the four year definition, we prefer this definition.
8 A Census-based approach in section 5 that directly measures residence shows that non-filingbehaviour studied in sections 3 and 4 is mostly associated with absence from the country ratherthan being in the country but not filing. As discussed later, for example, for the 1981 cohort1-year and 20-year Census retention estimates are 76.2% and 67.6%. The estimates from tax-filingmethod for the same periods are 78.6% and 65.5%.

Global labour markets 1293
of the end of the spell is known only within an interval because of the annualnature of tax filing, or is not known at all of because of right censoring.9
This presents a problem for calculating empirical survival and hazard functionsusing the standard Kaplan-Meier method, where survival times are treated asobservations on a continuous variable. Life table analysis can be used to produceempirical survival and hazard function estimates when the survival data have tobe grouped into intervals. The procedure is as follows:
Let τ i be the individual failure or censoring times aggregated into K timeintervals,
Ik = [tk, tk+1), k = 1, 2, . . . , K
dk = number of failures in interval Ik
mk = number of censored spell endings in interval Ik
Nk = number of persons at risk of failure at start of Ik.
(1)
The product limit estimate of the survivor function is defined as
Sk =K∏
k=1
(nk − dk
nk
)(2)
where nk = Nk − mk/2 is the adjusted number at risk at the start of the interval.While this procedure can deal with the fact that the survival data have to be
grouped into intervals, an exact implementation requires the initial point to be thesame. Using data on all immigrants arriving in December allows all the intervalsto be one year. The sample size can be increased by pooling several months and,as an approximation, assuming a common arrival date. The empirical survivorfunction to the first absence for the December sample is given by figure 1, whichestimates a survival rate of about 78% by the end of the first year after arrivaland just above 63% by 20 years after arrival. Most of the first absences take placewithin the first year. This is also reflected in the empirical hazard rate presentedin figure 2. The hazard rate declines sharply in the first year and more graduallythereafter. These figures help to determine the basic shape of the hazard function,facilitating the development of an appropriate specification for the proportionalhazards regression model employed below.
Table 1 presents the estimates from a multivariate analysis of duration to thefirst absence using a discrete time (grouped data) proportional hazards regres-sion framework. The included individual characteristics, all recorded at the time
9 The landings data record the day, the month, and the year of arrival. Therefore, it is possible, forexample, to distinguish immigrants by month of arrival.

1294 A. Aydemir and C. Robinson
Proportionsurviving
0.6
0.8
1.0
0 5 10 15 20Years since arrival
FIGURE 1 Survival functions using Life Tables – all immigrantsSOURCE: Authors’ calculation based on life table analysis
0.0
0.1
0.2
0.3
0 5 10 15
Years since arrival
Hazard rate
FIGURE 2 Estimated hazard rate from Life Tables – all immigrantsSOURCE: Authors’ calculation based on life table analysis

Global labour markets 1295
TABLE 1Discrete time duration model for landing cohorts 1980 to 1996: males, aged 25 to 45 at arrival
Standard Probability ofCoefficient error absence
1981 cohort −0.106 0.092 0.5431982 cohort −0.176 0.106 0.5181983 cohort −0.149 0.114 0.5281984 cohort −0.005 0.111 0.5791985 cohort −0.252 0.113 0.4911986 cohort −0.455 0.102 0.4241987 cohort −0.147 0.093 0.5281988 cohort −0.059 0.088 0.5601989 cohort 0.162 0.084 0.6411990 cohort 0.175 0.082 0.6461991 cohort 0.084 0.080 0.6121992 cohort −0.328 0.086 0.4661993 cohort −0.452 0.094 0.4251994 cohort −0.378 0.094 0.4491995 cohort −0.495 0.096 0.4121996 cohort −0.201 0.088 0.509Non-university post-secondary −0.046 0.039 0.564BA degree or above 0.073 0.037 0.608French 0.110 0.068 0.622English & French 0.175 0.059 0.646Neither English nor French −0.154 0.039 0.526Married −0.193 0.033 0.512Widowed, separated, divorced −0.017 0.093 0.575Business class 0.275 0.065 0.682Skilled class 0.194 0.043 0.653Assisted relative class 0.044 0.055 0.598Refugee class −0.144 0.050 0.529Other admission category −0.009 0.061 0.578Age at arrival 30 to 34 years 0.086 0.037 0.613Age at arrival 35 to 39 years 0.122 0.043 0.626Age at arrival 40 to 45 years 0.099 0.049 0.618Europe −0.619 0.071 0.374Asia, excluding Hong Kong −0.471 0.068 0.419Hong Kong 0.302 0.072 0.692Middle East −0.537 0.087 0.399Africa −0.520 0.083 0.404Caribbean and Guyana −0.828 0.092 0.316South & Central America 0.112 0.083 0.623Oceania and Australia −0.401 0.144 0.442Constant (1980) −3.880 0.100 0.581
Number of observations 111,822Log likelihood −14907.03
NOTESPooled October-December sample. The model includes a piecewise linear baseline hazard for 1–12months, 13–24 months, 25–36 months, 37–60 months, and after 60 months.SOURCE: Calculations by authors based on the Landing Records (LIDS) and the LongitudinalImmigration Database (IMDB) data

1296 A. Aydemir and C. Robinson
of landing, are education level, language ability, marital status, admission cate-gory, age at arrival, and source country. All characteristics are entered as dummyvariable sets to minimize functional form issues. The omitted category is a singleindividual with no post-secondary education, fluent in English, admitted underthe family class with age at landing 25 to 29, and arriving from North Americain the 1980 landing cohort.
The model used is based on Prentice-Gloeckler (1978) and Meyer (1990). Thismodel, called a ‘complementary log-log’ (cloglog) model, can be interpreted as thediscrete time model corresponding to an underlying continuous time proportionalhazards model. The underlying process is assumed to be continuous, but thesurvival time data are recorded in bands (groups). Suppose that there are Nindividuals (i = 1, 2, ..N) each entering a state (landing in Canada) at time t =0. The instantaneous hazard rate function (corresponding to the first absence offour consecutive years from the tax files) for person i at time t > 0 is assumed totake the proportional hazards form:
θi (t, X) = θ0(t) exp(Xitβ), (3)
where θ 0(t) is the baseline hazard function, Xit is a vector of covariates sum-marizing observed differences between individuals at time t, and β is a vectorof parameters. For simplicity, assume that all intervals are of unit length (e.g., amonth), so for each person i the recorded duration corresponds to the interval[ti − 1, ti).
The individuals who are recorded as having left the state (i.e., disappeared) areidentified by the censoring variable zi = 1, while those who are still remainingin the state contribute to the right-censored spell data and are indicated by zi
= 0. The likelihood function for this problem can be written in terms of hazardfunctions as
log L =n∑
i=1
{zi log
{hti
(Xiti
) ti −1∏s=1
[1 − hs(Xis)]
}
+ (1 − zi ) log
{ti∏
s=1
[1 − hs(Xis)]
}}, (4)
where the discrete time hazard in the jth interval is given by
h(tj , Xi j ) = 1 − exp[− exp(xi jβ + γ j )], (5)
and where γ j refers to the baseline hazard.10
10 The interval specific parameter may differ in each interval, allowing for a non-parametricduration dependence. If several intervals are assumed to have same hazard rather than adifferent hazard for each interval, a piece-wise constant baseline hazard is obtained. Baseline

Global labour markets 1297
Let yit = 1 if person i exits the state during the interval [t − 1, t); yit = 0,otherwise. Then the log likelihood can be rewritten as
log L =n∑
i=1
ti∑j=1
{yi j log h j (Xi j ) + (1 − yi j ) log[1 − h j (Xi j )]
}. (6)
The interpretation of the coefficients, βk, is the proportionate change in thehazard θ , given a one-unit change in Xk. The exponentiated coefficients, exp (βk),give hazard ratios, allowing a comparison of hazard rates with the reference group.Given the life table estimates of high hazard rates in the first year followed by asharp decline, a piece-wise constant baseline hazard specification was adopted.The model uses a piecewise linear baseline hazard for 1–12 months, 13–24 months,25–36 months, and after 60 months.
5. Results from the duration analysis
The predicted survival function estimated from the cloglog model with the piece-wise constant baseline hazard specification is very similar to the empirical survivalfunction reported in figure 1, suggesting a good overall fit for the duration model.The first two columns of table 1 present the estimates and standard errors of thecoefficients in the cloglog model. These measure the effect on the hazard of endingthe first spell. Each row in the last column reports the probability that the firstspell ended within 20 years for an individual with the indicated row characteristicand the reference group values for all other characteristics.
5.1. Visa class, source country, and other immigrant characteristicsThere are marked differences for visa class and region of origin that are clearlyapparent from the estimated coefficients in the duration model. Canada’s immi-gration system admits individuals on the basis of family ties; a refugee process;or a points system in a variety of immigrant classes, each with its own criteria foradmission: business class, skilled class, and assisted relative class. These classeshave substantially different implications for the length of stay in Canada. Thecoefficients on the business and skilled classes are significantly higher than forthe family class; the coefficient for refugees is significantly smaller. The length ofstay implied by these coefficients can be quite short, especially for those enteringunder the business or skilled-worker class. Examination of the shape of the haz-ard function shows that this is primarily due to particularly high hazard rates in
hazard can also be specified parametrically, allowing a Weibull model or an nth-orderpolynomial. Note that the specification of the hazard rate implies
log(− log[1 − h j (X)] = Xβ + γ j , (9)
hence the name cloglog model.

1298 A. Aydemir and C. Robinson
0.00
0.05
0.10
0.15
0.20
0.25
0.30
0.35
0 2 4 6 8 10
Years since arrival
Hazard rate
Business class Skilled class Refugee class Family class
FIGURE 3 Discrete hazard rates by visa class: separate visa class samplesSOURCE: Authors’ calculation based on duration model estimates by visa class
the first year after landing. Figure 3 plots the estimated discrete hazard by visaclass using the cloglog variant of the proportional hazards model with a piecewiselinear hazard.11 It is clear that, for all visa classes, the hazard rates are high inthe first year, but subsequently fall rapidly to quite low levels. This indicates thatmost of the variation in stay length is due to the differences in the hazard rates inthe first year.12 The first-period hazard rate for the business class, for example, is0.311 compared with 0.167 for refugees and 0.206 for the family class. After thisperiod, the hazards are all very similar; the gaps are typically only about 0.01 to0.02 between classes.
The return migration literature for the United States shows strong differencesby source country. This is clearly apparent in table 1 for Canada, holding constantother important covariates. The omitted group is North America. Differencesfrom North America in the estimated coefficients for the other cource countriesare generally highly statistically significant and often of large magnitude. All,
11 The plots in this section are for an individual with average values for the other characteristicsused in the duration model. The model is estimated separately by visa class. Pooling across visaclass samples produces an almost identical plot.
12 The estimated hazard rates are discrete, owing to the nature of the data. The rates presented hereare for 12-month intervals. It would be interesting to have more detailed information on the pathof the hazard within the first 12 months. Unfortunately, the nature of the data makes it difficultto get useful hazard information below the level of the 12-month interval. See the appendix for adiscussion of these problems.

Global labour markets 1299
Hazard rate
0.0
0.1
0.2
0.3
0.4
0.5
0 2 4 6 8 1
Years since arrival
0
Europe North America Asia w/o HongKong HongKong Africa
FIGURE 4 Discrete hazard rates by source region: separate source region samplesSOURCE: Authors’ calculation based on duration model estimates by source country
except for the special cases of those from Hong Kong and those from South andCentral America, show coefficients that are significantly smaller than for NorthAmerica, implying stays that are much longer for these groups.13 These majordifferences by source country suggest that any variation in the relative weights ofsource countries over time will have important implications for the permanence ofthe migration and the overall contribution of immigration to the labour market.
Differences in the shape of the hazard function by source country are shown infigure 4, which plots the discrete hazard functions estimated separately by sourcecountry. It is clear from these estimates that the shape of the hazard is differentfor North America and that Hong Kong is an outlier in terms of the magnitudeof the difference in the first-year hazard values. The immigrants from the UnitedStates show a clear tendency for the hazard rates to remain quite high for manyyears after entry. The other source countries show a drop to very low levels afterthe first year. This is consistent with immigration from the United States beingparticularly similar to internal migration. That is, the pattern is consistent witha relatively low cost of migration and a relatively high probability of continuingmovement in response to movement in wage differences or career demands.
Hong Kong is a special case because of the effects on migration to Canada,owing to the impending handover to China that finally took place in 1997. Theright of residence in Canada became particularly attractive and many business
13 The special case of Hong Kong is examined below in more detail.

1300 A. Aydemir and C. Robinson
0
100
200
300
400
500
600
700
800
900
1980 1982 1984 1986 1988 1990 1992 1994 1996 1998Year of arrival
Number of individuals
FIGURE 5 Landings of males aged 25 to 45 from Hong Kong, 1980 to 1996SOURCE: Authors’ calculation based on landings data
Hazard rate
0.0
0.1
0.2
0.3
0.4
0.5
0 2 4 6 8 10Years since arrival
1980 to1984 cohort 1990 to1994 cohort
FIGURE 6 Discrete hazard rates for Hong Kong by cohortSOURCE: Authors’ calculation based on duration model estimates for Hong Kong
people acquired this right through immigrating under the business-class provi-sions. Figure 5 shows landings in Canada from Hong Kong from 1980 to 1996. Itis clear that there were large increases after 1984, when the Joint Declaration wassigned between Britain and China. Figure 6 compares the estimated hazard ratesfor the 1980–4 and the 1990–4 landings from Hong Kong. After the first year,the hazard rates are the same, but the first-period hazard rates are dramatically

Global labour markets 1301
different. For the 1980–4 cohorts, the hazard function is very similar to the func-tion for the rest of Asia (figure 4). However, for the 1990–4 cohorts, while thehazards look the same after the first-period, the first-period hazard rate is muchhigher than for the rest of Asia and the earlier Hong Kong landings. This sug-gests that a significant fraction of these landings may have been stimulated by theattractiveness of establishing citizenship, rather than the prospect of a long-termstay in Canada.14
The other immigrant characteristics recorded in the landing records are edu-cation, marital status, and age at landing. There is evidence of shorter stays forthose who are single, bilingual, and with a BA degree or above. The coefficientsfor bilingual and a BA degree and above are both statistically larger than zero,while the coefficient for married is significantly negative. The implied variation inlength of stay is less than the case for visa class and country of origin. However,the effects are economically significant. Age at landing shows the smallest hazardfor those landing at the youngest age. There is a statistically significant effect, butthe magnitude is modest.
5.2. Business cycle effectsAn important issue in immigration policy is whether fewer immigrants shouldbe admitted during recessions. One concern is that a poor labour market onentry may lead to high unemployment for new immigrants, which may stimulatereturn migration. A full discussion of this issue is beyond the scope of the presentpaper. However, the pattern of coefficients on the landing dates in table 1 areconsistent with some business-cycle effects. The lowest probability of leavingfor the earlier cohorts is the 1986 cohort. This cohort entered at a time whenthe economy had largely recovered from the 1982 recession and when the double-digit unemployment rates from 1982 to 1985 had finally given way to single digits;this cohort’s entry was also sufficiently far from the business cycle trough in theearly 1990s to be largely unaffected by this recession. As the cohort entry dateapproaches this recession, the probability of leaving rises rapidly, peaking at alevel that is 50% higher than the 1986 level. However, there is a surprisingly rapiddecline in the probability of an absence after the 1991 landing cohort at a timewhen the unemployment rate had not begun to fall. In fact the clearest summarydescription of the relation between the probability of absence and the businesscycle is given by a simple regression of the probability of leaving (P) on the changein the unemployment rate in the two years immediately following landing (�U).
14 The specification for table 1 imposes common visa class effects across source countries. Giventhe importance of business-class migrants from Hong Kong, the model was re-estimatedwithout Hong Kong to test the extent to which the large-business and skilled-class effects mayhave been due in part to very large effects from the Hong Kong sample. In fact, when the HongKong observations are dropped, the positive coefficients for business and skilled classes are evenlarger than those reported in table 1.

1302 A. Aydemir and C. Robinson
The resulting estimates are as follows (standard errors in parentheses):
P = 0.521 + 0.021�U R2 = 0.424.
(.014) (.006)
The 24-month unemployment changes are about 2 to 3 percentage points attheir most rapid during recessions and recoveries. For the reference group intable 1, the estimated coefficient from the above regression indicates that entryduring the recession (�U = − 3) is associated with probability of leaving of 0.581compared with 0.461 for entry at recovery (�U = + 3).15
While these results suggest some possible business-cycle effects, they should beinterpreted with caution for a number of reasons. The annual time series permitsonly a small number of degrees of freedom. This constrains the analysis of otherfactors that are changing over time. These include the size of the cohort and theimmigration policy. There is substantial variation in cohort size and in visa-classshares over this period. Moreover, immigration policy, especially in the earlyyears, discouraged entry during recessions and may have resulted in selectioneffects in terms of the type of immigrant admitted.
5.3. Implications of selective survivalThe large differences in survival by characteristics such as visa class and sourcecountry indicate that survival is selective. Since many of these characteristics arerelated to income, the selective nature of survival has implications for skill levelsand earning capacity of the immigrants who remain. While a full analysis of thisissue is beyond the scope of this paper, in this section we describe the differences inincome for immigrants by the characteristics that are the most important sourceof variation in survival. The analysis is limited by the fact that no direct incomemeasure is available for those leaving in the first year when many of the departurestake place. There may be important selection effects that are missed because ofthis data limitation.
Table 2 reports mean log income, in constant 1992 dollars by visa class,source country, language, and education.16 The variation in survival by visaclass reported in table 1 was very large. There was much less survival amongthe business-class and skilled-class entrants compared with family, assisted rela-tive, and refugee. Table 4 shows that the income measure for the skilled class isapproximately 30% higher than for the assisted-relative class, 40% higher than forthe family class, and 50% higher than for refugees and others. The low survivalof the skilled-class entrants therefore results in a lower average income for the
15 Whether there is a downward period of recession or upward period of recovery at entry is moreclearly related to the probability of leaving than to the unemployment level. In fact, in a simpleregression the actual entry unemployment rate has a negative sign.
16 Income is the sum of wages and salaries and self-employment income. Table 2 reports theincome measure taken from the first income report after the landing year, given positiveearnings. Other measures using averages over time show the same pattern.

Global labour markets 1303
TABLE 2Income by visa class, source country, language, and education: males, aged 25 to 45 at arrival
Log Income Count
No post-secondary 9.497 5023Non-university post-secondary 9.676 2723BA degree or above 9.918 3466English 9.766 6605French 9.422 601English & French 9.722 711Neither English nor French 9.514 3290Family class 9.613 2958Business class 9.102 484Skilled class 10.018 3030Assisted relative class 9.722 1201Refugee class 9.470 2516Other admission category 9.507 1017North America 10.107 434Europe 9.987 3247Asia, excluding Hong Kong 9.557 3583Hong Kong 9.178 692Middle East 9.300 961Africa 9.490 879Caribbean and Guyana 9.708 541South & Central America 9.480 142Oceania and Australia 10.061 733
NOTESLog income is the mean of log income, measured in 1992 dollars, in the first earnings observation forthose with positive income. Income is the sum of wages and salaries and self-employment income.SOURCE: Calculations by authors based on the Landing Records (LIDS) and the LongitudinalImmigration Database (IMDB) data
remaining immigrants. Survival is also low for the business-class entrants. Theincome measure shows a particularly low value for this group. It is unclear howthis should be interpreted. On the one hand, this could indicate difficulties ofsetting up highly successful businesses in Canada; alternatively, it could reflectthe standard difficulties of adequately capturing income for self-employed. In ad-dition, relative to the skilled-worker and other visa classes, this is a small group.
Source country shows considerable survival variation in table 1. There wereparticularly large outflows for North, South, and Central America and for HongKong. North, South, and Central America are, in fact, not very important sourcecountries for Canada. It is clear from table 2 that the highest income is reported forNorth America. However, Oceania and Australia is a more important source andhas almost the same income, and Europe is a much more important source andalso has a relatively high income. The differential out-migration from Americansource countries thus has little effect on the average income of the survivingimmigrants. The Hong Kong income level is also low, reflecting the correlationwith business class.

1304 A. Aydemir and C. Robinson
The selectivity in survival has important implications for assimilation studies.Analysis of immigrant earnings using multiple cross-sectional data may providebiased estimates of immigrant outcomes if there is selectivity in the return migra-tion of immigrants. For example, if immigrants with the least favourable outcomeshave a greater propensity to leave the host country, then estimates of earningsassimilation, under the assumption of no selection among the leavers, will be pos-itively biased. Conversely, a large portion of the early leavers from Canada mayhave been the more mobile immigrants who could have done very well in Canadabut had better outside opportunities. The evidence presented here for the Cana-dian data suggests that, since the return migration is both large in magnitude andselective on observed characteristics, potential biases could be quite large.17
6. Immigrant retention: comparison with Census methods
The IMDB provides information on tax filing behaviour rather than residencebehaviour directly. In this section, the results are compared with an analysis usingcensus data that measures residence directly. In the previous literature on returnmigration, a major focus of interest is estimating the retention rate of immigrantsto answer the question: given that return migration takes place, what fractionstay in the host country? Census data are used in this calculation. In this section,estimates of the retention of immigrants in Canada are presented, based on aconceptual framework analogous to that of Borjas and Bratsberg (1996) for theUnited States. They work with a generic out-migration rate defined as
q(t, t′) = I(t) − R(t′)R(t′)
, (7)
where I(t) is the number of persons who immigrate in year t and R(t′) is thenumber of those immigrants who remain as of t
′. The source of I(t) in Borjas and
Bratsberg (1996) is INS microdata that recorded every legal immigrant admittedinto the U.S. between 1 July 1971 and 30 September 1986. The source of R(t′) isthe 1980 Census, so that t′ is 1 April 1980.18 The analogous sources for Canadaare LIDS for I(t) and the relevant Canadian census for R(t
′). The retention of
17 Using Swedish data, Edin, LaLonde, and Aslund (2000) find that failure to adjust for emigrationleads to an overestimation of the rate of economic assimilation for Nordic and OECDimmigrants by around 90%. Similarly, Hu (2000) finds that results from longitudinal datasuggest Census data estimates overstate the rate of growth of immigrant earnings and understatethe worsening of immigrant entry earnings. Jasso and Rosenzweig (1988) find that estimatesobtained from Census data significantly understate the returns to the U.S. experience ofpermanent resident aliens with respect to occupational attainment, owing to selective emigrationof higher-occupation immigrants. On the other hand, Lindstrom and Massey (1994), using U.S.data, find that selective emigration does not significantly affect cross-sectional models.
18 Some adjustment was necessary to make the Census comparable with the INS. In particular, anestimate of illegal immigrants in the Census was necessary, since the INS covers only legalimmigrants. In addition, the immigrant cohorts were ‘aged’ to 1 April 1980 usingage/sex-specific mortality rates to estimate survival. For a detailed description of theadjustments, see Borjas and Bratsberg (1996, 168–70).

Global labour markets 1305
TABLE 3Census based retention rates at 5, 10, 15, and 20 years after landing: males
Retention rates at various years after landing
Year Landings 5 years 10 years 15 years 20 years
All males1981 63,470 80.9 77.5 71.6 68.81986 49,380 90.22 86.6 82.7 ..1991 116,720 72.6 64.0 .. ..1996 111,290 76.3 .. .. ..
Males aged 25 to 35 at landing1981 18,040 76.2 76.9 70.8 67.61986 15,580 88.6 86.3 78.5 ..1991 40,860 63.7 57.2 .. ..1996 32,920 65.8 .. .. ..
NOTESThe number of landings are from the Landings Records and are for the calendar year. The retentionrates are based on the census counts in the relevant census years of individuals recording their yearof migration... – not available for a specific reference period.SOURCE: Landing Records (LIDS) and Census data
immigrants in Canada can then be measured by fraction of immigrants arrivingat time t who are still retained at time t′:
r (t′, t) = t′
I(t). (8)
The time path of the retention percentages for males, r (t′, t), for the one-yearlanding cohorts that match up with the Canadian census periods are given intable 3.19 The time pattern is very similar to that documented in the durationanalysis using the IMDB. The census years 1981 and 1991 were recession years;the 1986 and 1996 years were not. Comparison of each pair of years shows thefive-year survival rates to be substantially lower for the more recent cohorts. Forall males, the 1981 cohort percentage retained after five years is 80.9, comparedwith 72.6 for the 1991 cohort – a decline of 10%. The 10-year survival rates falleven more: the retained percentage for the 1981 cohort after 10 years is 77.5,compared with 64.0 for the 1991 cohort – a decline of 17%. Similarly, across the1986 and 1996 cohorts, there is a fall in the percentage retained after five yearsfrom 90.2 to 76.3 – a decline of 15%.
The population of male immigrants includes both workers and non-workerswhose emigration rates are likely to be influenced by various factors in differentways. In the lower half of table 3, the survival percentages are presented for maleswith age at landing between 25 and 35 to capture a young working-age population.
19 This abstracts from problems of mortality and illegal immigrants dealt with in Borjas andBratsberg (1996), focusing on trends rather than absolute rates. Implicitly, it is assumed thatmortality and illegal immigration rates are stable over the period.
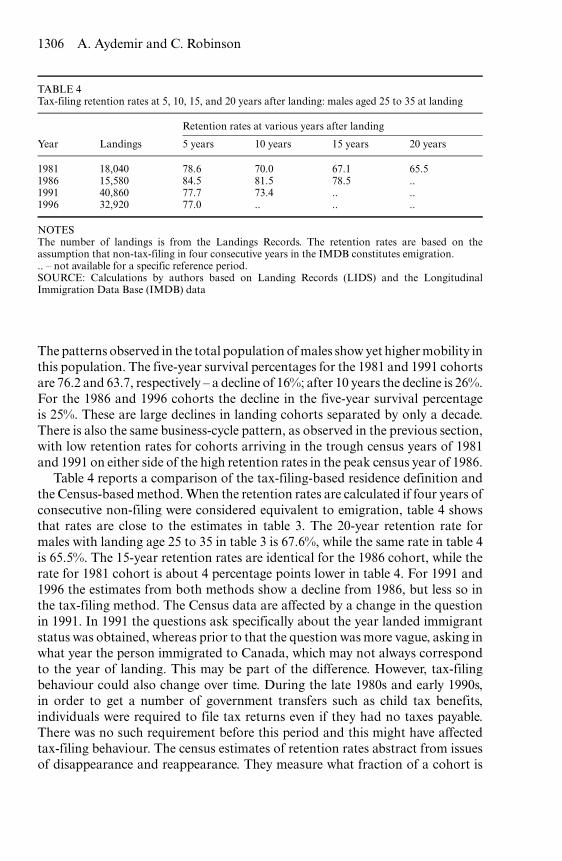
1306 A. Aydemir and C. Robinson
TABLE 4Tax-filing retention rates at 5, 10, 15, and 20 years after landing: males aged 25 to 35 at landing
Retention rates at various years after landing
Year Landings 5 years 10 years 15 years 20 years
1981 18,040 78.6 70.0 67.1 65.51986 15,580 84.5 81.5 78.5 ..1991 40,860 77.7 73.4 .. ..1996 32,920 77.0 .. .. ..
NOTESThe number of landings is from the Landings Records. The retention rates are based on theassumption that non-tax-filing in four consecutive years in the IMDB constitutes emigration... – not available for a specific reference period.SOURCE: Calculations by authors based on Landing Records (LIDS) and the LongitudinalImmigration Data Base (IMDB) data
The patterns observed in the total population of males show yet higher mobility inthis population. The five-year survival percentages for the 1981 and 1991 cohortsare 76.2 and 63.7, respectively – a decline of 16%; after 10 years the decline is 26%.For the 1986 and 1996 cohorts the decline in the five-year survival percentageis 25%. These are large declines in landing cohorts separated by only a decade.There is also the same business-cycle pattern, as observed in the previous section,with low retention rates for cohorts arriving in the trough census years of 1981and 1991 on either side of the high retention rates in the peak census year of 1986.
Table 4 reports a comparison of the tax-filing-based residence definition andthe Census-based method. When the retention rates are calculated if four years ofconsecutive non-filing were considered equivalent to emigration, table 4 showsthat rates are close to the estimates in table 3. The 20-year retention rate formales with landing age 25 to 35 in table 3 is 67.6%, while the same rate in table 4is 65.5%. The 15-year retention rates are identical for the 1986 cohort, while therate for 1981 cohort is about 4 percentage points lower in table 4. For 1991 and1996 the estimates from both methods show a decline from 1986, but less so inthe tax-filing method. The Census data are affected by a change in the questionin 1991. In 1991 the questions ask specifically about the year landed immigrantstatus was obtained, whereas prior to that the question was more vague, asking inwhat year the person immigrated to Canada, which may not always correspondto the year of landing. This may be part of the difference. However, tax-filingbehaviour could also change over time. During the late 1980s and early 1990s,in order to get a number of government transfers such as child tax benefits,individuals were required to file tax returns even if they had no taxes payable.There was no such requirement before this period and this might have affectedtax-filing behaviour. The census estimates of retention rates abstract from issuesof disappearance and reappearance. They measure what fraction of a cohort is

Global labour markets 1307
in the country at a particular point, whether they stayed there all the time, orleft and re-entered. The tax-filing estimates presented in table 4 neglect re-entry.The data show evidence of re-entry, especially for recent cohorts, so that the tax-filing-based retention estimates in table 3 may be underestimates. The magnitudeof the re-entry, however, is modest, so that the degree of under-estimation will besmall.
Overall, the results in table 4 suggest that tax-filing behaviour is closely relatedto residence behaviour as reflected in estimates of retention rates. Of additionalinterest is how close the relationship is in terms of the shape of the hazard rate.
The hazard rate estimates presented in section 3 (figure 2) show a very sharpdrop in the first year. This results in the survival rate falling to about 78% by theend of the first year. After this, the drop is much more gradual. When we usethe 1991 and 1996 Censuses, the same basic pattern appears with a very similarmagnitude for the initial drop. For those landing in 1990, the 1991 Census recordsa survival rate of 79.4%; for those landing in 1995, the 1996 Census shows asurvival rate of 82.5%.20 Subsequent survival rate drops are much smaller. Thesemagnitudes imply very similar hazards to those obtained from the tax-filing-based estimates. Thus, even for the first year after landing, where many of thedisappearances take place, the tax-filing behaviour appears to closely mirror theresidence behaviour, as measured in the Census.21
However, it remains necessary to interpret the results with some caution, sincethe landing date does not necessarily coincide with initial residence in the country.The data set provides evidence on landings, but not on residence prior to landing.Thus, the landings in a particular year could include individuals who came toCanada some years earlier. The hazards reported here are for ‘departure sincelanding.’ These must be higher than the first-year hazard of ‘departure since entry’for a cohort of individuals who either immediately or subsequently ‘land,’ sincesome individuals who leave, say, two years after entry are classified as leavingone year after landing. Conversely, the hazard for departure since landing forsubsequent years will on average be lower than the hazard for departure sinceentry (with either coincident or subsequent landing).22
20 An alternative method to estimate emigration rates using the tax filing behaviour would be touse a sample of tax filers only, that is, those who ever appear in the IMDB. About 10% to 15% ofimmigrants never appear in the tax files. If we restrict our sample to those who ever appear inthe IMDB, then the estimated emigration rates would be half of those implied by the Censusmethod. This bias in estimates highlights the importance of starting with a full count ofimmigrants rather than using tax filers only for the analysis.
21 In addition, the disaggregated patterns obtained using Census-based estimates support thepatterns found using the tax-filing data in the IMBD. See Aydemir and Robinson (2006) formore detailed results on the Census comparison. To the extent that the patterns in the Censusand tax-filing record-approaches are very similar where they overlap, this lends credibility to theuse of the tax-record approach in analyzing the other characteristics available in the IMDB, aswell as to the longitudinal analysis at the individual level, which cannot be carried out by theCensus approach.
22 The incidence of living in Canada prior to ‘landing’ is investigated using the LongitudinalSurvey of Immigrants to Canada (LSIC) that captures a cohort of immigrants that landed

1308 A. Aydemir and C. Robinson
7. Conclusions
International migration is not a permanent move and many immigrants eitherreturn to the source country, perhaps many times, or move on to another coun-try. There is increasing evidence that skilled workers in particular are becomingmore internationally mobile in the new global market. The IMDB presents anopportunity to study this phenomenon as it affects a large group of immigrantsfrom a wide variety of source countries over more than a 20-year period. Sincethe IMDB contains information on all the characteristics used to implement thepoints system used in Canada to determine eligibility for admittance, this evi-dence is particularly relevant for providing background evidence for informeddiscussion of amendments to immigration policy based on changes to the pointssystem.
It is clear that a substantial part of migration to Canada is temporary. Theestimated out-migration rate 20 years after arrival is around 35% among young,working-age, male immigrants. About 6 out of 10 of those who leave do so withinthe first year of arrival, which suggests that many immigrants make their decisionswithin a relatively short period of time after arrival. When we control for othercharacteristics, the out-migration rates are higher among immigrants admittedunder the skilled worker or business class visa. About 4 in 10 left within 10 yearsafter arrival. For the assisted-relative class and the refugees the correspondingrates were around 3 in 10 and 2 in 10. Finally, the out-migration rates are higherfor those who arrive during recessionary periods. Immigrants who arrived in1990, for example, were about 50% more likely to leave than those who arrivedin 1986, when we control for other characteristics.
In view of the potentially temporary nature of all migration, calculation of thecontribution that can be expected from a new immigrant to the population, thelabour force, or the human capital stock of a country has to take into accountthe probability of the immigrant being in the country at each point over theimmigrant’s remaining lifespan. The duration analysis in section 3 presents astart in providing the information needed for this calculation.
Appendix
The primary data used in the analysis are landing dates and subsequent tax-filinginformation. The focus is on the determinants of the length of the first spell
during 2000–1 period. Based on the interview that took place six months after landing, less than6% of working-age male family-class immigrants stated that they lived in Canada prior tolanding. Corresponding figures were 12% and 12.3% for skilled-worker and business-classimmigrants. As discussed in the appendix, achieving landed status could be an incentive forsome immigrants already in Canada who have received good alternative options to remain untillanding and then to leave shortly afterward. These figures of relatively large numbers of thebusiness- and skilled-class groups having prior residence in Canada could account for therelatively large outflow from these groups soon after landing.

Global labour markets 1309
in Canada, starting from the landing date. While the landing date is measuredprecisely from the landing records, the end of the first spell has to be inferredfrom the observed tax-filing behaviour.
A.1. Definition of the end of the first spellThe definition is motivated by the notion of opportunities to file and the benefitsof filing.
• If tax-filing behaviour shows no sequence of four consecutive years of non-filingafter the landing year, the first spell is assumed to be continuing.
• If tax-filing behaviour shows a sequence of four consecutive years of non-filingafter the landing year, the end date for the first spell is assumed to fall betweenJanuary and December of the first year of the first sequence of four consecutiveyears of non-filing.
This definition works best for a sample of immigrants all landing in the samemonth, since opportunities and benefits are likely to depend on the month ofarrival, in terms of both proximity to the normal filing date in April and thelikelihood of having earnings to declare and/or benefits to claim.
A.2. The first-year hazard: landing date and the start of residenceThe start date of the first spell is simply defined as the exact landing date. Abouttwo-thirds of immigrants file a tax return in the same year as landing, which isconsistent with some period of residence prior to landing.23 The status change atlanding is significant. For example, there may be two processes determining theleaving patterns after the ‘pre-landing’ entry to Canada: first, there is a processthat determines the relative attractiveness of actual residence in Canada and thealternatives that are always present; second, there is a value to acquiring landedimmigrant status in Canada, independent of residing in Canada.24 In the pre-landing period there is a hazard for leaving based on the first process, whichis partially offset by the second process – the investment in landed immigrantstatus. In the post-landing period there is only the first process. At the time oflanding this results in a stock of individuals who will wish to leave as soon as thelanded status is received. The existence of this stock means that the estimatedhazard rates, especially in the years closest to landing, should be interpreted withcaution. They are likely to be mixtures of the stock depletion and the hazard dueto the first process.
Since there is monthly variation in the landing date, in principle this could beused to estimate a monthly hazard rate for the first year, given an assumptionon the interval for the leaving date. The yearly interval of possible tax filing
23 A return filed in a given year refers to the previous tax year.24 The results in section 3 for Hong Kong suggest that this is important.

1310 A. Aydemir and C. Robinson
suggests that the assumption of an interval corresponding to a tax year may bea reasonable approximation for estimating yearly hazards. This may break downif it is used to identify the finer gradations of a monthly hazard. The resultsfrom estimating empirical monthly hazard rates by using the monthly variationin arrival times together with a common 12-month interval for the departuredate show a uniformly high hazard for the first 12 months, followed by a discretejump at the 13th month. One interpretation is that the second process is one inwhich all leave in the first month after landing or stay, which, by construction,adds a relatively large and equal amount to all the first 12-month hazards, whichdominates any underlying pattern from the first process, which continues forall other years. That is, the beginning of the common interval is the first timeanyone can leave, whatever month they arrived in. The detailed assumptions thatare made at the monthly level regarding possible filing dates and propensitieswill determine how the stock of leavers from the first process observed at theend of a particular tax year is spread over the first 12 months. Assumptionsthat spread them evenly result in a jump at month 12. Other assumptions couldresult in an alternative distribution, but how to choose among competing possibleassumptions is unclear. In essence, it is asking too much of the data in this taxyear form to provide good monthly detail.
References
Angelucci, Manuela (2005) ‘US border enforcement and the inflow-outflow of Mexicanillegal migration,’ Institute for the Study of Labour (IZA) Discussion Paper Series No.1642
Aydemir, Abdurrahman, and Chris Robinson (2006) ‘Global labour markets, return andonward migration,’ CIBC Centre for Human Capital and Productivity Working Paper2006-1, University of Western Ontario
Beach, Charles M., Alan G. Green, and Jeffrey G. Reitz, eds (2003) Canadian ImmigrationPolicy for the 21st Century (Montreal and Kingston: John Deutsch Institute for theStudy of Economic Policy and McGill-Queen’s University Press)
Borjas, George J., and Bernt Bratsberg (1996) ‘Who leaves? The outmigration of the foreignborn,’ Review of Economics and Statistics 78, 165–76
Colussi, Aldo (2006) ‘Migrants’ networks: an estimable model of illegal Mexican immi-gration,’ Working Paper
Constant, Amelie, and Douglas S. Massey (2003) ‘Self-selection, earnings, and out-migration: a longitudinal study of immigrants to germany,’ Journal of Population Eco-nomics 16, 631–53
Devoretz, Don J., and Diane Coulombe (2005) ‘Labour market mobility between Canadaand the United States: quo vadis 2003?’ in Social and Labour Market Aspects of NorthAmerican Linkages, ed. T. Lemieux and R. Harris (Calgary: University of CalgaryPress)
Devoretz, Don J., and John Ma (2002) ‘Triangular human capital flows between sending,entrepot and the rest of the world regions,’ Canadian Population Studies 29, 53–69
Edin, Per-Anders, Robert J. LaLonde, and Olof Åslund (2001) ‘Emigration of immigrantsand measures of immigrant assimilation: evidence from Sweden,’ Swedish EconomicPolicy Review 7, 163–204

Global labour markets 1311
Hu, Wei-Yin (2000) ‘Immigrant earning assimilation: estimates from longitudinal data,’AEA Papers and Proceedings, American Economic Review 90, 368–72
Jasso, Guillermina, and Mark R. Rosenzweig (1982) ‘Estimating the emigration rates oflegal immigrants using administrative and survey data: the 1971 cohort of immigrantsto the United States,’ Demography 19, 279–90
— (1998) ‘How well do US immigrants do? Vintage effects, emigration selectivity, andoccupational Mobility,’ Research in Population Economics 6, 229–53
Lam, Kit-Chun (1994) ‘Outmigration of foreign-born members in Canada,’ CanadianJournal of Economics 27, 352–70
Lindstrom, David P., and Douglas S. Massey (1994) ‘Selective emigration, cohort quality,and models of immigrant assimilation,’ Social Science Research 23, 315–49
Massey, Douglas S., Jorge Durand, and Nolan J. Malone (2002) Beyond Smoke and Mir-rors: Mexican Immigration in an Era of Free Trade (New York: Russell Sage Foundation)
Meyer, B.D. (1990) ‘Unemployment insurance and unemployment spells,’ Econometrica58, 757–82
Munshi, Kaivan (2003) ‘Networks in the modern economy: Mexican migrants in the U.S.labor market,’ Quarterly Journal of Economics 118, 549–99
Piore, Michael J. (1979) Birds of Passage: Migrant Labor and Industrial Societies (NewYork: Cambridge University Press)
Prentice, Ross L., and Lynn A. Gloeckler (1978) ‘Regression analysis of grouped survivaldata with application to breast cancer data,’ Biometrics 34, 57–67
Warren, Robert, and Jennifer Marks Peck (1980) ‘Foreign-born emigration from theUnited States: 1960 to 1970,’ Demography 17, 71–84