Global Food Security - SOAS Research Online
14
Contents lists available at ScienceDirect Global Food Security journal homepage: www.elsevier.com/locate/gfs Purchase trends of processed foods and beverages in urban India Cherry Law a,d,∗ , Rosemary Green b , Suneetha Kadiyala b , Bhavani Shankar c , Cécile Knai a , Kerry A. Brown a , Alan D. Dangour b , Laura Cornelsen a,d a Faculty of Public Health & Policy, London School of Hygiene & Tropical Medicine, 15-17 Tavistock Place, London, WC1H 9SH, UK b Department of Population Health, London School of Hygiene & Tropical Medicine, Keppel Street, London WC1E 7HT, UK c Centre for Development, Environment and Policy, SOAS University of London, London, WC1H 0XG, UK d (Honorary) College of Medicine & Health, University of Exeter, Exeter, EX1 2LU, UK 1. Introduction India, the country with the second largest population in the world, is facing an evolving challenge of a double burden of malnutrition. India ranks 103rd out of 119 low- and middle-income countries in the Global Hunger Index (von Grebmer et al., 2018). On top of the per- sisting high burden of undernutrition, there is an increasing prevalence of obesity, which is a known risk factor for a range of diseases including several cancers and cardiovascular diseases (CVDs) (World Health Organization, 2018). Between 2005/06 and 2015/16, the prevalence of overweight and obesity grew by nearly 10 percentage points to reach 27.6% among men and 37.6% among women in urban India and 14.8% and 18.2%, respectively, in rural India (Luhar et al., 2018). This nutritional challenge is further complicated by large hetero- geneity across states. From 1998 to 2014, the number of states where prevalence of overweight exceeded 20% increased threefold, from two to six. In some southern states (e.g., Tamil Nadu and Kerala) and in wealthier states (e.g., Punjab and Himachal Pradesh), the percentage of overweight women was greater than those who were underweight (Meenakshi, 2016). Using Global Burden of Disease Study (GBD) data, Prabhakaran et al. (2018) reported an increase in the prevalence of CVDs in every part of India from 1991 to 2016, but demonstrated substantial variations in the burden across states. One of the leading causes of the burden of disease from CVDs, ac- cording to the GBD data, were dietary risks. In 2016 these risks con- tributed to 51.8% and 59.4% of the total disability-adjusted life years from CVDs among Indian women and men respectively (Prabhakaran et al., 2018). In recent decades, researchers have observed an increased intake of sugar, oils and highly processed food in Indian diets (e.g. Meenakshi, 2016; Misra et al., 2011; Popkin et al., 2001; Shetty, 2013), with more apparent changes identified in urban India (Shetty, 2002; Gulati and Misra, 2014). These changes marked some key dietary shifts in the nutrition transition, which have also been observed in other low- and middle-income countries (Drewnowski and Popkin, 1997; Popkin et al., 2012; Popkin, 2014). With the rapid growth of the modern global food retail sector, the consumption of packaged and processed foods has become more common in much of the world (Popkin, 2017). In India, the overall per capita sales of packaged and processed foods nearly doubled from USD 31.3 in 2012 to USD 57.7 in 2018 at constant 2018 prices, according to data from Euromonitor (2019). The 2018 Global Nutrition Report em- phasised the negative dietary impacts of industrially processed and manufactured foods as they often increase the overall dietary content of sugars, saturated and trans-fat, salt and dietary energy density while decreasing the content of protein, dietary fibre, potassium, iron, zinc, magnesium and other micronutrients (Development Initiatives, 2018). It is thus unsurprising that many studies have raised concerns over the health implications of the rising consumption of these foods in India (as well as in other developing countries) (Baker and Friel, 2014; Moodie et al., 2013; Popkin et al., 2012; Thow et al., 2016). The reasons behind such trends are complex. Literature attributes the nutrition transition often to increased globalization, trade and economic growth as well as to accompanying changes in labour markets and life styles more gen- erally(ThowandHawkes,2009; Kearney, 2010; BakerandFriel,2014). The aim of this paper is to analyse purchase trends of eight distinct categories of processed foods and beverages between 2013 and 2017. We use a unique, large and demographically representative dataset from 'Kantar - Worldpanel Division, India' on take-home purchases of packaged food and beverages by urban Indian households. The focus on urban areas is motivated by their considerably higher levels of obesity and overweight in comparison to rural areas. In light of the disparities in nutritional outcomes across states as well as the diversity of Indian diet, we also performed a state-level analysis of the purchase trends. To the best of our knowledge, only a few cross-sectional studies to date have investigated the consumption patterns of processed foods and beverages in India in detail. A systematic review of studies looking at dietary patterns in India identified a diet pattern high in sweets and snacks that was associated with higher diabetes risk (Green et al., 2016). Daniel et al. (2011) found evidence for dietary patterns char- acterised by higher intakes of fried snacks and sweets in Mumbai and Trivandrum. Satija et al. (2015) identified three distinct dietary pat- terns among factory workers from Lucknow, Nagpur, Hyderabad and https://doi.org/10.1016/j.gfs.2019.05.007 Received 22 February 2019; Received in revised form 22 May 2019; Accepted 26 May 2019 ∗ Corresponding author. Faculty of Public Health & Policy, London School of Hygiene & Tropical Medicine, 15-17 Tavistock Place, London, WC1H 9SH, UK E-mail address: [email protected] (C. Law). Global Food Security 23 (2019) 191–204 2211-9124/ © 2019 The Authors. Published by Elsevier B.V. This is an open access article under the CC BY license (http://creativecommons.org/licenses/BY/4.0/). T
-
Upload
khangminh22 -
Category
Documents
-
view
1 -
download
0
Transcript of Global Food Security - SOAS Research Online

Contents lists available at ScienceDirect
Global Food Security
journal homepage: www.elsevier.com/locate/gfs
Purchase trends of processed foods and beverages in urban IndiaCherry Lawa,d,∗, Rosemary Greenb, Suneetha Kadiyalab, Bhavani Shankarc, Cécile Knaia,Kerry A. Browna, Alan D. Dangourb, Laura Cornelsena,da Faculty of Public Health & Policy, London School of Hygiene & Tropical Medicine, 15-17 Tavistock Place, London, WC1H 9SH, UKbDepartment of Population Health, London School of Hygiene & Tropical Medicine, Keppel Street, London WC1E 7HT, UKc Centre for Development, Environment and Policy, SOAS University of London, London, WC1H 0XG, UKd (Honorary) College of Medicine & Health, University of Exeter, Exeter, EX1 2LU, UK
1. Introduction
India, the country with the second largest population in the world,is facing an evolving challenge of a double burden of malnutrition.India ranks 103rd out of 119 low- and middle-income countries in theGlobal Hunger Index (von Grebmer et al., 2018). On top of the per-sisting high burden of undernutrition, there is an increasing prevalenceof obesity, which is a known risk factor for a range of diseases includingseveral cancers and cardiovascular diseases (CVDs) (World HealthOrganization, 2018). Between 2005/06 and 2015/16, the prevalence ofoverweight and obesity grew by nearly 10 percentage points to reach27.6% among men and 37.6% among women in urban India and 14.8%and 18.2%, respectively, in rural India (Luhar et al., 2018).
This nutritional challenge is further complicated by large hetero-geneity across states. From 1998 to 2014, the number of states whereprevalence of overweight exceeded 20% increased threefold, from twoto six. In some southern states (e.g., Tamil Nadu and Kerala) and inwealthier states (e.g., Punjab and Himachal Pradesh), the percentage ofoverweight women was greater than those who were underweight(Meenakshi, 2016). Using Global Burden of Disease Study (GBD) data,Prabhakaran et al. (2018) reported an increase in the prevalence ofCVDs in every part of India from 1991 to 2016, but demonstratedsubstantial variations in the burden across states.
One of the leading causes of the burden of disease from CVDs, ac-cording to the GBD data, were dietary risks. In 2016 these risks con-tributed to 51.8% and 59.4% of the total disability-adjusted life yearsfrom CVDs among Indian women and men respectively (Prabhakaranet al., 2018). In recent decades, researchers have observed an increasedintake of sugar, oils and highly processed food in Indian diets (e.g.Meenakshi, 2016; Misra et al., 2011; Popkin et al., 2001; Shetty, 2013),with more apparent changes identified in urban India (Shetty, 2002;Gulati and Misra, 2014). These changes marked some key dietary shiftsin the nutrition transition, which have also been observed in other low-and middle-income countries (Drewnowski and Popkin, 1997; Popkinet al., 2012; Popkin, 2014).
With the rapid growth of the modern global food retail sector, the
consumption of packaged and processed foods has become morecommon in much of the world (Popkin, 2017). In India, the overall percapita sales of packaged and processed foods nearly doubled from USD31.3 in 2012 to USD 57.7 in 2018 at constant 2018 prices, according todata from Euromonitor (2019). The 2018 Global Nutrition Report em-phasised the negative dietary impacts of industrially processed andmanufactured foods as they often increase the overall dietary content ofsugars, saturated and trans-fat, salt and dietary energy density whiledecreasing the content of protein, dietary fibre, potassium, iron, zinc,magnesium and other micronutrients (Development Initiatives, 2018).It is thus unsurprising that many studies have raised concerns over thehealth implications of the rising consumption of these foods in India (aswell as in other developing countries) (Baker and Friel, 2014; Moodieet al., 2013; Popkin et al., 2012; Thow et al., 2016). The reasons behindsuch trends are complex. Literature attributes the nutrition transitionoften to increased globalization, trade and economic growth as well asto accompanying changes in labour markets and life styles more gen-erally (Thow and Hawkes, 2009; Kearney, 2010; Baker and Friel, 2014).
The aim of this paper is to analyse purchase trends of eight distinctcategories of processed foods and beverages between 2013 and 2017.We use a unique, large and demographically representative datasetfrom 'Kantar - Worldpanel Division, India' on take-home purchases ofpackaged food and beverages by urban Indian households. The focus onurban areas is motivated by their considerably higher levels of obesityand overweight in comparison to rural areas. In light of the disparitiesin nutritional outcomes across states as well as the diversity of Indiandiet, we also performed a state-level analysis of the purchase trends.
To the best of our knowledge, only a few cross-sectional studies todate have investigated the consumption patterns of processed foods andbeverages in India in detail. A systematic review of studies looking atdietary patterns in India identified a diet pattern high in sweets andsnacks that was associated with higher diabetes risk (Green et al.,2016). Daniel et al. (2011) found evidence for dietary patterns char-acterised by higher intakes of fried snacks and sweets in Mumbai andTrivandrum. Satija et al. (2015) identified three distinct dietary pat-terns among factory workers from Lucknow, Nagpur, Hyderabad and
https://doi.org/10.1016/j.gfs.2019.05.007Received 22 February 2019; Received in revised form 22 May 2019; Accepted 26 May 2019
∗ Corresponding author. Faculty of Public Health & Policy, London School of Hygiene & Tropical Medicine, 15-17 Tavistock Place, London, WC1H 9SH, UKE-mail address: [email protected] (C. Law).
Global Food Security 23 (2019) 191–204
2211-9124/ © 2019 The Authors. Published by Elsevier B.V. This is an open access article under the CC BY license (http://creativecommons.org/licenses/BY/4.0/).
T

Bangalore, in which two of them were associated with high intake ofsnacks.
Other existing work on Indian dietary patterns utilised householdlevel data from the National Sample Survey (NSS) and the NationalFamily Health Survey (NFHS). While these cross-section datasets pro-vide detailed records on the consumption of unprocessed foods (grains,meat, fruits etc.), they often do not consistently collect information onquantities of processed foods or beverages consumed. Hence, detailedanalyses on the recent trends in consumption patterns of processedfoods and beverages in India remain a significant gap in the literature.
Our analysis showed substantial variations in the purchase level ofprocessed foods and beverages across states as well as variability oftrends within states over time. We found that beyond dietary staples(processed wheat, oils, milk) per capita take-home purchases of pro-cessed food and beverages are relatively low and infrequent, particu-larly in comparison to middle-income and high-income countries.Sweet snacks, salty snacks, edible oils and ‘other processed foods’ (de-fined below, but which predominantly consist of noodles) were themain categories of foods where volume of purchases have increasedover time whereas soft drink purchases and dairy products beyond milkshowed a slight decline. If the rising trends in snack and oil purchasescontinue, with no further changes in the consumption of other foods,the dietary risks among urban Indian households will change with thepotential for higher prevalence of overweight and further challenges tothe nutritional health of the Indian population.
2. Methods
2.1. Data description
The data were provided by 'Kantar - Worldpanel Division, India', acommercial consumer insight company that operates an ongoing, de-mographically representative panel that provides information on pur-chases of consumer goods, including packaged foods and beverages.Our dataset covers product-level purchases of all packaged foods andbeverages for consumption at home by the urban households on thepanel between January 2013 and December 2017. Similar commercialfood purchase and sales data have been increasingly used in academicresearch to measure dietary patterns, estimate nutritional intake, modeldisease outcomes and evaluate policies, and they are generally con-sidered a good indicator of diets (Bandy et al., 2019). Recent studies, forexample, that have used Kantar Worldpanel data on food purchasesinclude, Caillavet et al. (2018) who analysed trends of food purchasesof French households and Cornelsen et al. (2019) who used the UKhousehold panel to analyse demand for take-home food purchases.
The panel in India, which has been operating since 1981, had amajor update after the 2011 Census to ensure representativeness to theIndian urban population with respect to occupational socio-economicstatus (see table A1 for description), age of the person responsible forfood purchase as well as the state of domicile. Households are inviteddoor-to-door to participate in the panel based on these householdcharacteristics. Representativeness is checked by 'Kantar - WorldpanelDivision, India' on an ongoing basis and new households are invitedwhere drop out occurs. In our data around 95% of the surveyedhouseholds were present in the panel in each year. Despite drop out of5% of participants, sample distribution of socio-economic classes re-mained stable across years (Table A2 in the appendix).
The primary shoppers of the participating households fill in paperdiaries to record all take-home purchases by volume, which excludegifts, free samples or home-made products. To ensure that purchases arerecorded correctly, interviewers from 'Kantar - Worldpanel Division,India' regularly check the information in the paper diaries againstpackaging and wrappers that are collected by households in pre-pro-vided containers. The data recorded covers only the volume of pur-chases and does not include information on monetary expenditure. Thedataset includes information on purchases that are taken home and
excludes purchases for out-of-home consumption.The panel covers urban households from 16 major states and
Guwahati, a major city in Assam (Table 1). Given the lack of data onstate level average incomes over time, we classified the 16 states intothree groups based on the share of urban population living belowpoverty line in 2011–12 as a proxy for income level. This poverty line isestimated by the Indian Government based on private household con-sumer expenditure over a basket of essential goods (Government ofIndia, 2014). States were considered as low-income if over 20% of theirurban population were under the poverty line, middle-income if thepercentage was between 10% and 20% and high-income if it was lessthan 10%.
In total, our dataset consists of 78,320 unique urban householdsacross five years and the sample size of each year ranges from 64,941 to69,035 households of the panel (Table 2).
2.2. Food groups
Due to significant variety of products recorded in the data, ana-lysing purchase trends at product level would make it difficult to un-derstand the overall changes in the purchases of processed foods andbeverages. With consideration of the products’ properties (sweet,savory) and modes of consumption (e.g. major ingredient, snack or partof a meal or cooking process), we separated individual products into theeight food categories outlined below. As we did not have informationon the nutrient content of each of the individual products, we could notdistinguish between healthier and less healthy products within eachgroup.
Sweet snacks: chocolate, honey, biscuits, cookies, jams, peanutbutter, chocolate spread, rusk (excludes prepared sweets and cakes)Salty snacks: crackers, potato chips, banana chips, other saltysnacks;Soft drinks: carbonated drinks, juices, milk-based drinks, squashesand powdered drinks;Milk: liquid milk and milk powder;Dairy products: butter, ghee (clarified butter) and cheese;Edible oils: edible oils and vanaspati (partially hydrogenated vege-table oil);
Table 1Sample distribution and the population below poverty line across states inurban India.
Number households in thepanel in 2013
% of urban population belowpoverty line in 2011–12
High urban income statesKerala 2975 (5%) 5.0Andhra Pradesh 4492 (7%) 5.8Tamil Nadu 5699 (9%) 6.5Maharashtra 7822 (12%) 9.1Delhi 2516 (4%) 9.8Middle urban income statesGujarat 3855 (6%) 10.1Punjab/Haryanaˆ 4516 (7%) 9.2/10.3Rajasthan 2551 (4%) 10.7West Bengal 4203 (6%) 14.7Karnataka 4390 (7%) 15.3Orissa 1825 (3%) 17.3Low urban income statesMadhya Pradesh 5521 (9%) 21.0Jharkhand 3382 (5%) 24.8Chhattisgarh 1309 (2%) 24.8Uttar Pradesh 6477 (10%) 26.1Bihar 2362 (4%) 31.2Guwahati* 1046 (2%) n/a
Note: Figures in parentheses give the percentage of total sample in 2013. ˆThesetwo states are not separated in the data. *Guwahati is excluded in the state-levelanalysis as it is only part of the urban sector of Assam.
C. Law, et al. Global Food Security 23 (2019) 191–204
192

Processed wheat: atta (wheat flour), bread, vermicelli and pasta;Other processed foods: soup, ready-to-eat meal, ready-to-cookmix, frozen food, breakfast cereals, noodles, ketchup, table sauces.
Each of the eight food groups has at least 1 million purchase re-cords. More information on the number of observations and examplesof food items in each food group is given in table A3 in the appendix.
2.3. Estimation of per capita purchase volume
To estimate the population-level volume of per capita purchases ofeach food group in each period (quarter or year), we first estimateweighted total urban market purchases during the period in a foodgroup and then apply population size estimates to derive per capitapurchase. We obtained the urban population figures using the latestofficial census data released in 2011, in each quarter from 2013 to 2017in two steps. First, we computed the quarterly average populationgrowth rates (r )s using Indian Census in 2001 and 2011 with the for-
mula: =r 1spoppop
1/40s
s
, 2011
, 2001, where pops is the population size of state s
in the corresponding census (i.e. 2001 or 2011) and the denominator inthe power term indicates the number of quarters between 2001 and2011. We then projected these growth rates forward from 2011 to es-timate the population size for each state in each quarter up to 2017with the assumption that the average growth rates remained the sameacross quarters. The total population of urban India was obtained bysumming up the population figures of each state in each quarter.
Quarterly trends were estimated by a linear ordinary least squaresregression of purchase quantities on time dummies. For easier inter-pretation, annual purchases of processed foods rather than quarterlypurchases are presented in the state-level analysis.
3. Purchase trends of processed foods and beverages in urbanIndia
Fig. 1 shows the quarterly per capita purchase volume across thefood groups. Further information is provided in the appendix, wheretable A4 summarises the estimated level of annual per capita purchasesin 2013 and 2017 and table A5 gives both the quarterly average and theannual percentage of households who reported purchase in each year.
In Fig. 1, sweet snacks and salty snacks display a clear increasingtrend in take-home purchases with marginal variation seasonally. Onaverage, the per capita annual purchase was 1.64 kg of sweet snacksand 1.06 kg of salty snacks in 2013. By 2017, this rose to 1.93 kg (17%)for sweet snacks and 1.16 kg (9%) for salty snacks. Purchases from bothfood groups were also relatively common, with 80–89% of the re-spondents reporting purchases of products from either of the groups atleast once per quarter over the years.
Edible oils also showed an increasing trend in per capita purchasesbetween 2013 and 2017 (by 0.44 kg, 4%), consistent with the rise inshare of calorie intakes from oils and fats identified in the NSS report onnutritional intake (NSSO, 2014). Oil purchases showed relatively largequarterly fluctuations, particularly in 2014 and 2015, with almost a0.1 kg difference in per capita purchases between the first and fourthquarters of the year. This fluctuation appears to flatten over time.
The level of take-home purchases of soft drinks was low at only1.29 L per capita per year in 2013 which decreased to 1.11 L (14%) by
2017. The purchases were also less common than other food groups,with on average 46% of households reporting a quarterly purchase ofsoft drinks and around 70% reporting a purchase at least once a year.Demand for soft drinks fluctuated seasonally by around 400ml, peakingduring the hottest months of the year (i.e. second quarter). The highestlevel of quarterly take-home purchases was recorded in the secondquarter in 2014 at 0.6 L per capita.
Milk was the most widely purchased group. Over 96% of surveyedhouseholds reported at least one purchase of milk quarterly and 99%purchased milk annually. For each quarter, each person purchased onaverage 16–17 L of milk for home consumption, which was equivalentto over 64 L of per capita milk purchase per year. Despite seasonalfluctuations by 200–400ml, the overall trend was stable. In contrast,there was a decreasing trend in the purchases of the other dairy pro-ducts and the total annual purchase was low (less than 0.77 kg percapita), including around 28% of respondents who did not purchase anyother dairy products during a year.
Processed wheat displayed a relatively stable purchase trend butgrowing quarterly fluctuation with more purchases made, on average,during the second quarter of the year. In 2013, the per capita purchasein the second quarter was 10.85 kg, around 2.69 kg higher than in thefourth quarter. This difference rose to 4.32 kg in 2015 and to 5.23 kg by2017. It should be noted that these figures are likely to underestimatethe total purchase of processed wheat products as unpackaged wheatflour is not captured by the data.
On average, 73% of the respondents purchased ‘other processedfoods’ at least quarterly. While the overall volume was low but with aslightly increasing trend, there was a sharp drop in 2015. This wasdriven largely by the temporary nationwide ban on the sale of Magginoodles over food safety concerns in June 2015 (The Times of India,2017). Overall, Maggi noodles account for more than half of the volumeof ‘other processed foods’ bought (0.52 kg in 2013). Despite the 2015decline, a 9% increase was identified in ‘other processed food’ pur-chases between 2013 and 2017. Once Maggi noodles were excluded, therate of increase rose to 22% during the same period. (Appendix, figureA1).
4. State level heterogeneity in purchases of processed foods andbeverages
Substantial state level differences in the take-home purchases ofprocessed foods and beverages were observed (Figs. 2–5). Consistentwith the trends highlighted in section 3, Fig. 2a and b shows that moststates experienced a rise in take-home purchases of salty snacks (n=10out of 16 states) and sweet snacks (n=12). Kerala had the lowest levelof annual purchases of both snacks and to the contrary of more thanhalf of the states, saw a decreasing trend. From 2013 to 2017, the percapita purchase of salty snacks in Kerala dropped by 41% from 0.46 kgto 0.27 kg while that of sweet snacks declined by 23% from 0.85 kg to0.65 kg. The level of salty snacks bought for home consumption alsodecreased in Delhi, Karnataka and Tamil Nadu. The level of sweetsnacks purchases was far higher in Delhi than in any of the other states(around 4 kg per year). The purchase level of salty snacks did not differacross states by level of poverty, although the middle-income statesshowed most consistent rise in purchases. A similar pattern was alsoseen for sweet snacks with the exception of Delhi where purchase level
Table 2Sample size across years.
2013 2014 2015 2016 2017
Total number of households 64,941 69,035 67,523 67,865 66,574Households from previous year n/a 61,873 (90%) 66,260 (98%) 64,657 (95%) 63,900 (96%)New households n/a 7162 (10%) 1263 (2%) 3208 (5%) 2674 (4%)
*Corresponding percentages to the full sample are given in parenthesis.
C. Law, et al. Global Food Security 23 (2019) 191–204
193

Fig. 1. Quarterly purchase patterns of processed foods and beverages in urban India, 2013-17.
C. Law, et al. Global Food Security 23 (2019) 191–204
194

Fig. 2. Annual per capita purchase of sweet and salty snacks across Indian states, 2013–2017.
C. Law, et al. Global Food Security 23 (2019) 191–204
195
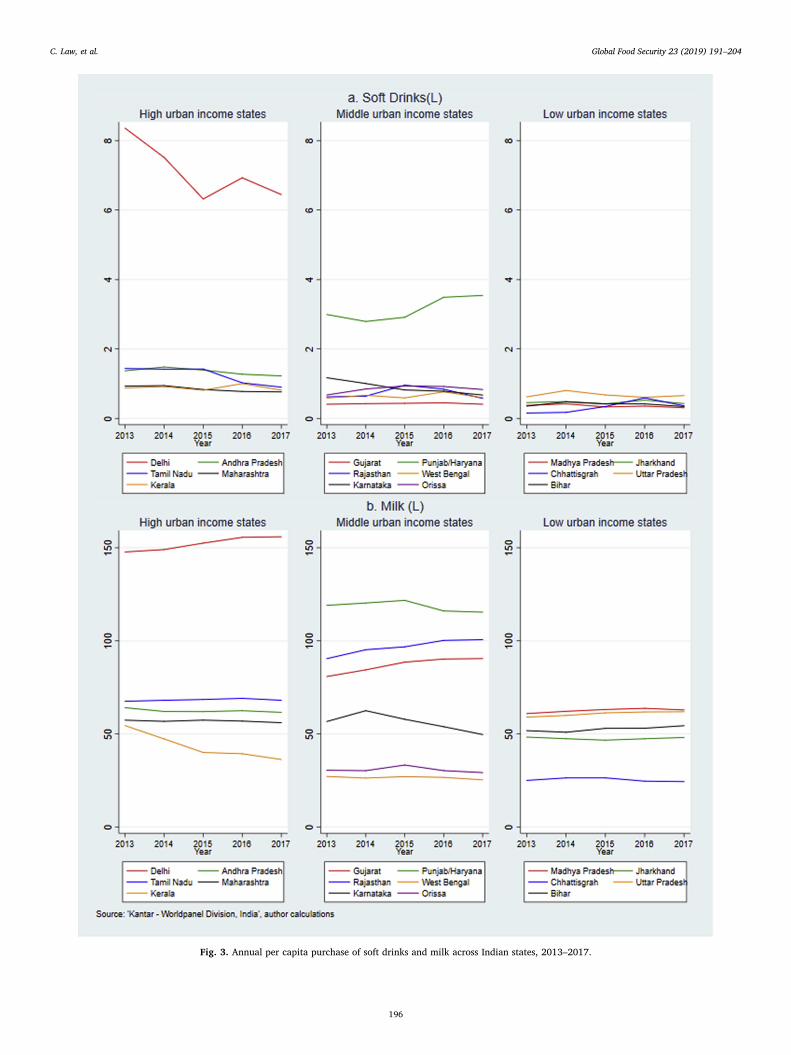
Fig. 3. Annual per capita purchase of soft drinks and milk across Indian states, 2013–2017.
C. Law, et al. Global Food Security 23 (2019) 191–204
196

Fig. 4. Annual per capita purchase of edible oils and dairy products across Indian states, 2013–2017.
C. Law, et al. Global Food Security 23 (2019) 191–204
197

Fig. 5. Annual per capita purchase of processed wheat and ‘other processed foods’ across Indian states, 2013–2017.
C. Law, et al. Global Food Security 23 (2019) 191–204
198

(4–4.5 kg) was twice the level of remaining states (1–2.5 kg).Turning to Fig. 3a, the top panel shows that wealthier states in
general purchased relatively more soft drinks than those in the middleand low-income states, with the predominant difference being betweenDelhi and the rest of the states. While most states had a stable purchasepattern of soft drinks, Delhi displayed a 23% drop in per capita pur-chase (1.91 L) over the five years. During the same period, Punjab/Haryana experienced an 18% (0.57 L) increase in soft drinks broughtper capita. In rest of the states the average purchases were below 2 L peryear and had less prominent trends.
Fig. 3b demonstrates large variations in milk purchases across In-dian states with the highest level in Delhi (annual purchases of 155 Lper capita in 2017), compared to the lowest level in Chhattisgarh (24 Lin 2017). The largest reduction in packaged milk purchases was inKerala, declining from 55 L per capita in 2013 to 36 L in 2017. Karna-taka also slowed a decreasing trend starting from 2014. At the sametime, Delhi, Rajasthan and Gujarat increased their take-home purchasesof milk by around 10 L per capita over the five years.
Kerala had the lowest level of per capita purchases of edible oils(Fig. 4a) (< 4.5 kg in 2017). Compared to other food groups, there wasa smaller gap between the edible oil purchase between Delhi and otherstates. The purchase level increased fastest in Rajasthan (19%) andGujarat (12%). In particular, Gujarat also bought the highest volume ofedible oils per capita over the period of interest (17.74 kg in 2017).Only a few states purchased more than 1 kg dairy products (other thanmilk) per capita a year (Fig. 4b). The level was highest in Rajasthan andDelhi (2.97 kg and 2.92 kg in 2013), followed by Gujarat (1.44 kg in2013). For most states, the purchase pattern of dairy products wasstable. In Kerala and Chhattisgarh, less than 0.13 kg dairy productswere purchased per capita per year.
Purchase patterns of processed wheat are relatively stable in high-income states (Fig. 5a) but slightly downward in low-income states.Among all states, Rajasthan experienced the fastest increase in purchaseof processed wheat over five years with estimated annual per capitapurchases reaching 89 kg in 2017, exceeding that of Delhi (79 kg).Lastly, Fig. 5b shows the per capita purchase trends of ‘other processedfoods’. In line with Fig. 1, most states display a sharp drop in 2015although the decline is more apparent in higher-income states; parti-cularly those with relatively higher levels of purchases (Delhi and TamilNadu). In absolute terms, Delhi experienced the biggest annual de-crease of ‘other processed food’ purchases, from 1.91 kg in 2014 to1.41 kg in 2015 (26%). In Rajasthan and Chhattisgarh a rapid increasewas seen in the last two years as purchase level doubled by 2017.
5. Discussion
Processed foods have risen to public health policy focus because ofconcerns over their impacts on health (e.g. beverages, snacks and readymeals are often high in sugar, fat and/or salt content) and their con-sumption is identified as a risk factor for obesity and several non-communicable diseases. Our analysis of take-home purchases of pack-aged and processed foods in urban India showed that, with the excep-tion of staples such as packaged milk, processed wheat or edible oils,purchases of processed foods and beverages on average, are still rela-tively low at population level.
The per capita level of salty snack purchases remains low in urbanIndia (1.1 kg in 2017) in comparison to the US and the UK where itreached 9.5 kg and 7 kg respectively in 2015 (IFT, 2016). Similarly, thelevel of sweet biscuit purchases was much higher in Western Europeand the US (5.9 kg and 6.3 kg per capita respectively in 2017) than inurban India (1.9 kg in 2017). Comparing to other middle incomecountries, the level of savory snack purchases in urban India was higherthan in Pakistan (0.2 kg per capita) or Vietnam (0.8 kg) but lower thanin Thailand (1.5 kg) or China (1.8 kg) in 2017 (Euromonitor, 2019). Forsweet snacks, the level of purchase in urban India was similar to China,Vietnam and Pakistan (1.3–1.5 kg per capita in 2017) but higher than in
Thailand (0.7 kg) (Euromonitor, 2019). The overall level of purchasesof soft drinks was also low (1.1 L per capita in 2017) in comparison tothe average per capita annual sales of 20.9 L in lower middle incomecountries (Monteiro et al., 2013) and much lower when comparing tohigh-consumption countries such as Mexico where 231.2 L of soft drinkswere sold per capita in 2017 (Euromonitor, 2019).
Sweet and salty snacks as well as edible oils were the main foodgroups for which volume of purchases increased over time. Purchases of‘other processed foods’, which predominantly consist of noodles, alsoshowed an increasing trend especially if the sharp decline driven byfood safety concerns in Maggi Noodles in 2015 is excluded (figure A1).These trends are in general support of a nutrition transition taking placein India, demonstrating higher processed food consumption along withincome growth (5% per year between 2013 and 2017 (World Bank,2019)) and greater urbanisation (Popkin, 2006; Popkin and Ng, 2007;Hawkes et al., 2017). In addition to growing wealth, access to processedfoods is also facilitated by the rising number of modern grocery retailers(Hawkes et al., 2017) which increased by 13.9% between 2013 and2017 (Euromonitor, 2019).
The rising trend in purchases of snacks, edible oils and ‘other pro-cessed foods’ might also have been driven by the growing Indian policyfocus on promoting food processing as well as liberalization of foreigndirect investment in food processing and retailing which enhanced theavailability and affordability of processed foods (Thow et al., 2016).Furthermore, literature on the nutrition transition suggests that tradeliberalization, food industry marketing, expansion of the global massmedia, increasing female economic participation and changes in ac-tivity patterns are other factors that might have contributed to therising processed food consumption (Kearney, 2010; Baker and Friel,2014). Considering the complexity of these drivers, as well as hetero-geneity in trends observed, it is clear that detailed empirical analysesare needed to disentangle their roles in driving the trends in urbanIndia.
It is also clear that the upward trend in purchases snack foods islikely to contribute to the rising dietary risk of disease. Equally, thegrowing level of edible oil purchases is a potential health concern as oilscan increase energy density of foods consumed which is a risk factors toobesity and NCDs. For example, a diet with higher intakes of butter,hydrogenated oil, ghee, vegetable oil, mustard oil, fish, high-fat dairyproducts and refined grain was found to be associated with an increasedrisk of general as well as of central obesity in women in West Bengal(Ganguli et al., 2011).
Kerala, the most literate state in India (as per the Census of India,2011), was the only state displaying decline in both sweet and saltysnacks purchases by urban households. These changes might be ex-plained by a greater awareness of the health impacts of snack con-sumption due to the higher general education level of the population; aswell as the public health focus of the forward thinking Keralan stategovernment: NITI Aayog ranked Kerala as the top performing Indianstate in the health sector due to its sustained focus on health andconsistent performance on several health outcomes (NITI Aayog, 2018).Recent state level dietary health interventions have particularly focusedon reducing dietary related NCD health outcomes. For example, a14.5% `fat’ tax on junk food was announced in 2016 (The EconomicTimes, 2016) and most recently the Keralan government is developingan action plan to combat trans-fat consumption, with the support ofWHO and the FSSAI (The New Indian Express, 2019).
One key finding of this paper is the slight decrease in take-homepurchases of soft drinks in urban India, especially in Delhi and TamilNadu which are the wealthier states. Soft drinks have in particular beentargeted by policies in an attempt to reduce their consumption and thussugar intake. Unless purchases for consumption out-of-home, whichthese data do not capture, have an opposite trend, the slight reductionin soft drink purchases for home consumption observed is encouragingfor reducing the risk of obesity in those states (World HealthOrganization, 2003). In contrast, the evidence of increased soft drink
C. Law, et al. Global Food Security 23 (2019) 191–204
199

purchases in Punjab/Haryana and Chhattisgarh may exacerbate thenutritional challenges in these regions. In 2017, the Indian governmentimposed a 28% Goods and Service tax rate with 12% additional taxlevied on aerated drinks (Government of India, 2017b; Government ofIndia, 2017a). This tax on sugary drinks, if sustained, could help po-tentially combat any rising intake of soft drinks. However, to fullyunderstand the potential of the tax, further information is needed onadded sugar consumption from other sources (e.g. hot beverages, home-made beverages such as juice or lemonade, as well as from foods).
With the exception of soft drinks, the state-level disparity in pack-aged food purchases does not seem to be related to the income status ofstates (measured according to share of population living under theGovernment defined poverty line), which warrants further analysis ofalternative measures for incomes, as well as other structural driverssuch as production, trade and foreign investment, in addition to culturaldifferences. For example, local dietary preferences could help explainwhy the purchases of processed wheat were higher in Rajasthan thanKerala as wheat is the basic meal in North India while rice is the keystaple in the Southern regions (Sen, 2004). Difference in staple foodsmay also lead to variations in cooking methods across states and hencecontribute to the state-level disparity in edible oil purchases (Gulati andMisra, 2017).
5.1. Strengths and limitations
Our study has a number of strengths. First, the data come from alarge and longitudinal, demographically representative sample ofhouseholds. Retention of the households in the panel is high with only5% of households drop-out and are replaced periodically. Product leveldata also allow flexibility in creating food groups. Second, no other datasource covers this range of products across states and over time. Othernationwide household surveys are often limited in the level of in-formation collected in regard to packaged and processed foods andbeverages while dietary surveys with more detailed consumption re-cords of these foods tend to be limited in geographical coverage. Moreimportantly, these surveys only provide cross-sectional data on over ashort time period and therefore may not be as suitable to study changesin the dietary patterns over time.
There are some limitations to consider when interpreting the find-ings of this study. First, given that these data have not, to our knowl-edge, been used in academic research, we compared our estimates ofper capita annual purchases in 2013 with those obtained from the latestround of NSS data (2011–12), which is the official government surveyon food expenditures on all food items consumed in the last 30 days. Weselected food items that were easily identifiable and comparable in bothdatasets. From table A6 in the appendix, it can be seen that for somefood items, i.e. cold beverages, milk (in liquid form) and edible oils, thediscrepancy between the estimates from our data and that from NSSdata is small (i.e. around 10%), but for other food items, notably butter,the former estimates appear to be considerably higher. This could bedue to: i) an increase in consumption of these foods in 2013; ii) anunderestimation from NSS data as it only covers 30 days and purchaseof dairy products may not take place sufficiently frequently; iii) anoverestimation bias in the data from ‘Kantar – Worldpanel Division,India’. The latter is relatively less likely as purchase records werechecked against the wrappers of the purchases regularly by inter-viewers.
Second, the data excludes food purchases made for out-of-home andon-the-go consumption. According to market data from theEuromonitor, the number of food service units in India has grown by19.5% between 2012 and 2017, including a 27.5% increase in thenumber of fast food units. Number of transactions grew in food serviceby 31.7% including in fast food outlets by 48.2% (Euromonitor, 2019).While more detailed research is lacking in this area, with rising income,replacing home-cooked meals with food prepared and eaten out-of-
home, is forecasted to be a growing trend in particular among youngadults (Euromonitor, 2019).
Third, we had to project urban population size estimates as officialdata are unavailable beyond 2011. Population trends, particularly inurban areas, can change rapidly and therefore affect our estimation ofper capita purchase trends. In this regard, we compared our populationprojections of urban India from 2013 to 2017 with those projected bythe World Bank (see table A7 in the appendix) and found less than 3%difference in estimates which shows accuracy in the methods appliedfor projections. However, this does make state-level analysis somewhatmore susceptible to bias as population growth can vary to a greaterextent depending on changes in birth and death rates as well as inter-state migration. Similarly, rapid changes in poverty levels by state overfive years could have affected the comparison of purchases across theincome-level of states and could explain a lack of clear patterns.
Lastly, while the purchase trends of processed foods and beveragesvary greatly across states and are indicative of some changes in thedietary patterns at population level, it is difficult to directly link theseto nutrition or health outcomes. A plethora of multi-dimensional factorsinfluence a particular NCD aetiology and pathogenesis and greater in-formation (e.g., dietary intake, nutrient status and health status) wouldbe required at an individual or local community level to complete theseanalyses.
5.2. Further research and conclusion
Further research is needed to identify the drivers of state-specifictrends because one-size-fits-all national picture is unlikely to be suffi-ciently informative for nutrition-related programming and policy-making in India (Cavatorta et al., 2015). Another fruitful avenue wouldbe to analyse how the trends and levels of processed food purchasesdiffer across socio-economic classes and other demographic character-istics since wealthier people tend to allocate their food expendituredifferently from poorer people (Deaton and Drèze, 2009; Borkotoky andUnisa, 2018). Finally, it is also important to investigate the purchasetrends among sub-populations of regular consumers of packaged andprocessed foods, their socio-demographic characteristics and possiblelinkages to dietary and health outcomes.
In conclusion, our analysis showed varying levels of packaged andprocessed food purchases as well as heterogeneous patterns over timeand across the urban areas of the Indian states. Beyond dietary staples(wheat, oil, milk) the level of purchases of packaged and processedfoods and beverages was low. However, the rapidly rising level ofpurchases of sweet snacks, salty snacks, edible oils and ‘other processedfoods’, contributing to increasing intake of sugar, salt and fats, are ofconcern from public health perspective and may require further policyefforts to combat against (Moodie et al., 2013; Monteiro et al., 2013).With no further changes in the consumption of other foods, the dietaryrisks among urban Indian households might increase, leading to higherprevalence of overweight and thus further complicating the nutritionalchallenges faced by the country. Nonetheless, policies targeting pro-cessed foods alone are not sufficient to tackle all food security chal-lenges in India (Pingali et al., 2017). Improving the nutrient quality ofthe food system and ensuring equity of access and availability to nu-trient rich unprocessed foods remains a key to ending malnutrition inall its forms.
Funding
This study forms part of the Sustainable and Healthy Food Systems(SHEFS) programme supported by the Wellcome Trust’s Our Planet,Our Health programme [grant number: 205200/Z/16/Z]. LC is fundedvia UK Medical Research Council Fellowship MR/P021999/1. Fundingbodies had no role in the data collection, analysis or interpretation, andno role in the study design or in writing the manuscript.
C. Law, et al. Global Food Security 23 (2019) 191–204
200

Appendix
Table A1Sample distribution of socio-economic class, 2013–2017
Classes Definitions
Upper class Minimum literacy/school up to 4 years & minimum 6 durables in their householdUpper middle class Minimum literacy/school up to 4 years & minimum 5 durables in their householdMiddle class Minimum literacy/school up to 4 years & minimum 3 durables in their householdLower class Illiterate and no durable or minimum 1 durable in their home
Table A2Definitions of socio-economic classes
2013 2014 2015 2016 2017
Upper class 24527 (38%) 25295 (37%) 24619 (36%) 25578 (38%) 25591 (38%)Upper middle class 18709 (29%) 19127 (28%) 18745 (28%) 18538 (27%) 17977 (27%)Middle class 14884 (23%) 15260 (22%) 15017 (22%) 14723 (22%) 14353 (22%)Lower class 6821 (11%) 9354 (14%) 9144 (14%) 9026 (13%) 8655 (13%)
Note: Figures in parentheses give the percentage of total sample. Households are classified into different SEC groups based on the education level of the primaryshopper and the number of assets possessed by the household (Refer to table A2).
Table A3Number of observations and food item examples of each food group
Food Groups No of purchase records Food items Product examples
Sweet snacks 4,686,606 Chocolate Cadbury Dairy Milk ChocolateHoney Apis Himalaya HoneyBiscuits Treff Marie SpecialJams Kissan Fruity MangoPeanut butter American Garden CreamyChocolate spread Pillsbury Chocolate SpreadRusk Baker Street Jeera Rusk
Salty snacks 14,423,632 Crackers Royal Krack KrackarBanana chips Sri Annai Banana ChipsPotato chips Bingo Red Chilli BijliOther salty snacks Crax Natkhat Masala
Soft drinks 2,341,924 Carbonated drinks Pepsi Cola Pet BottleJuices Tropicana 100% OrangeMilk based drinks Nestle Nesquik ChocolateSquashes and powdered drinks Rasna Fruit Plus Orange
Milk 107,048,570 Liquid milk Cavin's Toned MilkMilk powder Sunfresh Dairy Whitener
Edible oils 7,582,521 Edible oils Aadhar Sunflower Oilvanaspati Dalda Vanaspati
Dairy products 1,868,296 Butter Amul Yellow ButterGhee (Clarified butter) Hatsun Ghee (Pouch)Cheese Britannia Milkman Mozzarella
Processed wheat 11,696,969 Atta Aashirvaad Multigrain AttaBread Bonn Premium BreadVermicelli Tasty Treat VermicelliPasta Bambino Cheese Pasta
Other processed foods 5,195,869 Soup Knorr Mushroom SoupReady to eat meal Kohinoor Paneer MakhaniReady to cook mix Aachi Biryani Rice MixFrozen food Safal Green PeasBreakfast cereals Horlicks OatsNoodles Maggi Masala NoodlesKetchup Reliance Tomato KetchupTable sauces∗ Ching's Chilli Sauce
∗ Table sauces do not include Indian pickles such as chutneys.
C. Law, et al. Global Food Security 23 (2019) 191–204
201

Table A4Estimated per capita annual purchase of food groups, by states, 2013–2017
Sweet Snacks Salty Snacks Soft Drinks Milk Dairy Product Edible Oils Processed Wheat Other Processed Foods
(KG) (KG) (L) (L) (KG) (KG) (KG) (KG)
All-urban 2013 1.64 1.06 1.29 66.51 0.77 11.48 35.43 0.812017 1.93 1.16 1.11 66.32 0.74 11.92 35.71 0.88
18% 9% −14% 0% −4% 4% 1% 9%Kerala 2013 0.85 0.46 0.88 54.46 0.10 5.29 7.10 1.38
2017 0.65 0.27 0.82 36.26 0.10 4.43 6.19 1.52−24% −41% −7% −33% 0% −16% −13% 10%
Andhra Pradesh 2013 0.88 0.48 1.37 64.10 0.19 12.20 11.74 0.432017 1.11 0.97 1.23 61.59 0.17 12.48 13.23 0.34
26% 102% −10% −4% −11% 2% 13% −21%Tamil Nadu 2013 1.75 1.13 1.44 67.53 0.34 10.11 7.55 1.50
2017 2.09 1.06 0.90 68.07 0.31 10.95 7.04 1.8819% −6% −38% 1% −9% 8% −7% 25%
Maharashtra 2013 2.18 0.86 0.93 57.40 0.39 14.58 41.68 0.802017 2.62 1.03 0.76 56.04 0.45 14.89 40.60 0.70
20% 20% −18% −2% 15% 2% −3% −13%Delhi 2013 4.10 1.97 8.36 147.78 2.92 12.67 77.57 1.97
2017 4.50 1.81 6.45 155.93 2.84 13.63 79.46 1.9110% −8% −23% 6% −3% 8% 2% −3%
Gujarat 2013 0.99 1.25 0.41 80.83 1.44 15.82 26.18 0.402017 1.03 1.63 0.41 90.48 1.44 17.74 30.02 0.45
4% 30% 0% 12% 0% 12% 15% 13%Punjab/Haryana 2013 1.22 0.86 2.99 119.09 1.01 9.75 45.42 0.90
2017 1.58 1.01 3.54 115.43 0.99 9.53 48.61 1.0430% 17% 18% −3% −2% −2% 7% 16%
Rajasthan 2013 1.13 1.03 0.62 90.45 2.97 11.65 58.26 0.522017 2.01 1.48 0.58 100.65 2.85 13.88 88.94 1.00
78% 44% −6% 11% −4% 19% 53% 92%West Bengal 2013 1.95 1.24 0.59 27.15 0.32 9.66 20.36 0.74
2017 2.18 1.34 0.60 25.34 0.31 10.12 19.40 0.8612% 8% 2% −7% −3% 5% −5% 16%
Karnataka 2013 1.67 1.30 1.17 56.69 0.52 11.42 16.27 0.692017 1.93 1.12 0.67 49.67 0.44 10.87 12.78 0.44
16% −14% −43% −12% −15% −5% −21% −36%Orissa 2013 1.37 1.01 0.68 30.48 0.30 8.58 20.74 0.62
2017 1.50 1.07 0.83 29.22 0.22 8.77 16.31 0.679% 6% 22% −4% −27% 2% −21% 8%
Madhya Pradesh 2013 1.60 1.80 0.38 60.92 1.04 12.61 50.91 0.462017 2.12 1.82 0.31 62.90 0.94 12.76 52.75 0.59
33% 1% −18% 3% −10% 1% 4% 28%Jharkhand 2013 0.93 0.75 0.45 48.29 0.13 9.34 50.21 0.79
2017 1.02 0.90 0.43 48.08 0.12 9.93 45.55 0.8610% 20% −4% 0% −8% 6% −9% 9%
Chhattisgarh 2013 0.84 0.67 0.16 25.03 0.08 13.49 38.56 0.522017 2.67 1.63 0.36 24.37 0.12 14.03 29.41 1.06
218% 143% 125% −3% 50% 4% −24% 104%Uttar Pradesh 2013 1.71 1.00 0.62 59.04 0.70 9.69 56.60 0.59
2017 1.75 0.98 0.66 61.91 0.69 10.10 54.07 0.552% −2% 6% 5% −1% 4% −4% −7%
Bihar 2013 0.86 0.69 0.36 51.75 0.28 8.96 59.00 0.322017 1.18 0.72 0.34 54.40 0.16 9.70 45.49 0.34
37% 4% −6% 5% −43% 8% −23% 6%
Note: States are listed in ascending order of its percentage of population living under poverty line in 2011–12.
Table A5Proportion of households with purchase records of the corresponding food group
2013 2014 2015 2016 2017 Quarterly average from 2013 to 2017
Sweet snacks 0.95 0.95 0.96 0.96 0.97 0.89Salty snacks 0.92 0.92 0.92 0.92 0.92 0.80Soft drinks 0.72 0.70 0.69 0.70 0.69 0.46Milk 0.99 0.99 0.99 0.99 0.99 0.96Edible oils 0.91 0.92 0.92 0.92 0.92 0.90Dairy products 0.74 0.72 0.72 0.73 0.73 0.53Processed wheat 0.96 0.96 0.96 0.95 0.96 0.90Other processed foods 0.90 0.91 0.87 0.87 0.90 0.73
C. Law, et al. Global Food Security 23 (2019) 191–204
202

Fig. A1. Quarterly purchase patterns of other processed foods (excluding Maggi noodles) in urban India, 2013–17.
Table A6Difference in per capita annual purchase in urban India using NSSO data and ‘Kantar – Worldpanel Division, India’ data
NSSO* (2011–12) 'Kantar – Worldpanel Division, India' (2013) Estimation difference ('Kantar – Worldpanel Division, India'/NSSO)
Cold Beverages - bottled/canned (ml) 984 898ˆ 0.91Edible oils (g) 10236 10903 1.07Milk in liquid form (ml) 65064 65578 1.01Butter (g) 48 85 1.77Ghee (g) 600 669 1.11
*Calculated based 30-day per capita consumption reported by NSSO (NSSO report: http://mospi.nic.in/sites/default/files/publication_reports/Report_no558_rou68_30june14.pdf) ˆEstimates based on the annual purchase of carbonated drinks.
Table A7Estimates of total urban population in India based on Indian Census and World Bank (WB) database, 2011–2017
Estimates from Indian Census* Estimates from WB Difference (Indian Census/WB)
2011 377,106,125 390,085,540 0.972012 387,663,731 399,558,252 0.972013 398,516,913 409,178,263 0.972014 409,673,943 419,003,394 0.982015 421,143,331 429,068,623 0.982016 432,933,820 439,386,539 0.992017 445,054,399 449,964,523 0.99
Note: With the exception of 2011, the population figures were estimated using the annual population growth rate calculated from Indian Census (2001), 2011. Thepopulation estimates from WB are available at https://data.worldbank.org/indicator/SP.URB.TOTL?locations=IN.
References
Baker, P., Friel, S., 2014. Processed foods and the nutrition transition: evidence from Asia.Obes. Rev. 15 (7), 564–577.
Bandy, L., Adhikari, V., Jebb, S., Rayner, M., 2019. The use of commercial food purchasedata for public health nutrition research: a systematic review. In: de Souza, R.J. (Ed.),PLOS ONE. vol. 14, e0210192 1.
Borkotoky, K., Unisa, S., 2018. Inequality in food expenditure in India and the con-tributing factors. J. Quant. Econ. 16 (3), 647–680.
Caillavet, F., Darmon, N., Létoile, F., Nichèle, V., 2018. “Is nutritional quality of food-at-home purchases improving? 1969–2010: 40 years of household consumption surveysin France. Eur. J. Clin. Nutr. 72 (2), 220–227.
Cavatorta, E., Shankar, B., Flores-Martinez, A., 2015. Explaining cross-state disparities inchild nutrition in rural India. World Dev. 76, 216–237.
Census of India (2011), Government of India, New Delhi.Cornelsen, L., Mazzocchi, M., Smith, R.D., 2019. Fat tax or thin subsidy? How price in-
creases and decreases affect the energy and nutrient content of food and beveragepurchases in Great Britain. Soc. Sci. Med. 230, 318–327.
Daniel, C.R., Prabhakaran, D., Kapur, K., Graubard, B.I., Devasenapathy, N.,Ramakrishnan, L., George, P.S., Shetty, H., Ferrucci, L.M., Yurgalevitch, S.,Chatterjee, N., Reddy, K., Rastogi, T., Gupta, P.C., Mathew, A., Sinha, R., 2011. Across-sectional investigation of regional patterns of diet and cardio-metabolic risk inIndia. Nutr. J. 10 (1), 12.
Deaton, A., Drèze, J., 2009. Food and nutrition in India: facts and interpretations. Econ.Pol. Wkly. 47 (7), 42–65.
C. Law, et al. Global Food Security 23 (2019) 191–204
203

Development Initiatives, 2018. 2018 Global Nutrition Report: shining a light to spuraction on nutrition. Available at: https://globalnutritionreport.org/reports/global-nutrition-report-2018/, Accessed date: 16 January 2019.
Drewnowski, A., Popkin, B.M., 1997. The nutrition transition: new trends in the globaldiet. Nutr. Rev. 55 (2), 31–43.
Euromonitor, 2019. Passport Global Market Information Database. EuromonitorInternational, London.
Ganguli, D., Das, N., Saha, I., Biswas, P., Datta, S., Mukhopadhyay, B., Chaudhuri, D.,Ghosh, S., Dey, S., 2011. Major dietary patterns and their associations with cardio-vascular risk factors among women in West Bengal, India. Br. J. Nutr. 105 (10),1520–1529.
Government of India, 2014. Agricultural statistics at a glance. Available at: https://eands.dacnet.nic.in/PDF/Agricultural-Statistics-At-Glance2014.pdf, Accessed date: 8November 2018.
Government of India, 2017a. Notification No.1/2017-Compensation cess (rate. Availableat: https://cbec-gst.gov.in/pdf/compensation-tax/notfctn-1-compensation-cess-english.pdf, Accessed date: 12 November 2018.
Government of India, 2017b. Rate OF GST ON goods. Available at: http://gstcouncil.gov.in/sites/default/files/NOTIFICATION PDF/goods-rates-booklet-03July2017.pdf,Accessed date: 12 November 2018.
von Grebmer, K., Bernstein, J., Hammond, L., Patterson, F., Klaus, L., Fahlbusch, J.,Towey, O., Foley, C., Gitter, S., Eckstrom, K., Fritschel, H., 2018. 2018 Global HungerIndex: Forced Migration und Hunger.
Green, R., Milner, J., Joy, E.J.M., Agrawal, S., Dangour, A.D., 2016. Dietary patterns inIndia: a systematic review. Br. J. Nutr. 116 (01), 142–148.
Gulati, S., Misra, A., 2017. Abdominal obesity and type 2 diabetes in Asian Indians:dietary strategies including edible oils, cooking practices and sugar intake. Eur. J.Clin. Nutr. 71 (7), 850–857.
Gulati, S., Misra, A., 2014. Sugar intake, obesity, and diabetes in India. Nutrients 6 (12),5955–5974.
Hawkes, C., Harris, J., Gillespie, S., 2017. Changing diets: urbanization and the nutritiontransition. In: 2017 Global Food Policy Report. International Food Policy ResearchInstitute (IFPRI), Washington D.C., pp. 34–41.
IFT, 2016. Global savory snacks market to reach $138+ billion by 2020 - IFT.org.Available at: http://www.ift.org/food-technology/daily-news/2016/september/07/global-savory-snacks-market-to-reach-$138-billion-by-2020.aspx, Accessed date: 16January 2019.
Kearney, J., 2010. Food consumption trends and drivers. Philos. Trans. R. Soc. Lond. Ser.B Biol. Sci. 365 (1554), 2793–2807.
Luhar, S., Mallinson, P.A.C., Clarke, L., Kinra, S., 2018. Trends in the socioeconomicpatterning of overweight/obesity in India: a repeated cross-sectional study usingnationally representative data. BMJ open 8 (10), e023935.
Meenakshi, J.V., 2016. Trends and patterns in the triple burden of malnutrition in India.Agric. Econ. 47 (S1), 115–134.
Misra, A., Singhal, N., Sivakumar, B., Bhagat, N., Jaiswal, A., Khurana, L., 2011. Nutritiontransition in India: secular trends in dietary intake and their relationship to diet-related non-communicable diseases. J. Diabetes 3 (4), 278–292.
Monteiro, C.A., Moubarac, J.-C., Cannon, G., Ng, S.W., Popkin, B., 2013. Ultra-processedproducts are becoming dominant in the global food system. Obes. Rev. 14, 21–28.
Moodie, R., Stuckler, D., Monteiro, C., Sheron, N., Neal, B., Thamarangsi, T., Lincoln, P.,Casswell, S., 2013. Profits and pandemics: prevention of harmful effects of tobacco,alcohol, and ultra-processed food and drink industries. The Lancet 381 (9867),670–679.
NITI Aayog, 2018. Healthy States, Progressive India: Report on the Ranks of States andUnion Territories | NITI Aayog, (National Institution for Transforming India),Government of India. Available at: https://niti.gov.in/content/healthy-states-progressive-india-report-ranks-states-and-union-territories, Accessed date: 13 May2019.
NSSO, 2014. “Nutritional intake in India, 2011‐12, NSS 68th round. Available at: http://mospi.nic.in/sites/default/files/publication_reports/nss_report_560_19dec14.pdf,Accessed date: 11 February 2019.
Pingali, Prabhu, Mittra, Bhaskar, Rahman, Andaleeb, 2017. The bumpy road from food tonutrition security–Slow evolution of India's food policy. Global food security 15,
77–84.Popkin, B., Ng, S.W., 2007. The nutrition transition in high- and low-income countries:
what are the policy lessons? Agric. Econ. 37, 199–211.Popkin, B.M., 2006. Global nutrition dynamics: the world is shifting rapidly toward a diet
linked with noncommunicable diseases. Am. J. Clin. Nutr. 84 (2), 289–298.Popkin, B.M., 2014. Nutrition, agriculture and the global food system in low and middle
income countries. Food Policy 47, 91–96.Popkin, B.M., 2017. Relationship between shifts in food system dynamics and accelera-
tion of the global nutrition transition. Nutr. Rev. 75 (2), 73–82.Popkin, B.M., Adair, L.S., Ng, S.W., 2012. Global nutrition transition and the pandemic of
obesity in developing countries. Nutr. Rev. 70 (1), 3–21.Popkin, B.M., Horton, S., Kim, S., Mahal, A., Shuigao, J., 2001. Trends in diet, nutritional
status, and diet-related noncommunicable diseases in China and India: the economiccosts of the nutrition transition. Nutr. Rev. 50 (12), 379–390.
Prabhakaran, D., Jeemon, P., Sharma, M., Roth, G.A., Johnson, C., Harikrishnan, S.,Gupta, R., Pandian, J.D., Naik, N., Roy, A., Dhaliwal, R.S., Xavier, D., Kumar, R.K.,Tandon, N., Mathur, P., Shukla, D.K., Mehrotra, R., Venugopal, K., Kumar, G.A.,Varghese, C.M., Furtado, M., Muraleedharan, P., Abdulkader, R.S., Alam, T., Anjana,R.M., Arora, M., Bhansali, A., Bhardwaj, D., Bhatia, E., Chakma, J.K., Chaturvedi, P.,Dutta, E., Glenn, S., Gupta, P.C., Johnson, S.C., Kaur, T., Kinra, S., Krishnan, A., Kutz,M., Mathur, M.R., Mohan, V., Mukhopadhyay, S., Nguyen, M., Odell, C.M., Oommen,A.M., Pati, S., Pletcher, M., Prasad, K., V Rao, P., Shekhar, C., Sinha, D.N., Sylaja,P.N., Thakur, J.S., Thankappan, K.R., Thomas, N., Yadgir, S., Yajnik, C.S., Zachariah,G., Zipkin, B., Lim, S.S., Naghavi, M., Dandona, R., Vos, T., Murray, C.J.L., Reddy,K.S., Swaminathan, S., Dandona, L., 2018. “The changing patterns of cardiovasculardiseases and their risk factors in the states of India: the Global Burden of DiseaseStudy 1990–2016. The Lancet Global Health 6 (12), e1339–e1351.
Satija, A., Hu, F.B., Bowen, L., V Bharathi, A., Vaz, M., Prabhakaran, D., Reddy, K.S., Ben-Shlomo, Y., Davey Smith, G., Kinra, S., Ebrahim, S., 2015. Dietary patterns in Indiaand their association with obesity and central obesity. Publ. Health Nutr. 18 (16),3031–3041.
Sen, C.T., 2004. Food Culture in India. Greenwood Press.Shetty, P., 2013. Nutrition transition and its health outcomes. Indian J. Pediatr. 80 (S1),
21–27.Shetty, P.S., 2002. Nutrition transition in India. Publ. Health Nutr. 5 (1), 175–182.The Economic Times, 2016. “Kerala: in a first, Kerala imposes 14.5% ‘fat tax’ on junk food
- the Economic Times. Available at: https://economictimes.indiatimes.com/news/politics-and-nation/in-a-first-kerala-imposes-14-5-fat-tax-on-junk-food/articleshow/53113799.cms, Accessed date: 10 April 2019.
The New Indian Express, 2019. “Kerala's action plan against trans fat within this week.Available at: https://www.fssai.gov.in/dam/jcr:65396482-4792-4b12-bd80-037292e9627d/FSSAI_News_Kerala_Express_11_02_2019.pdf, Accessed date: 13 May2019.
The Times of India, 2017. Maggi market share: Maggi noodles has cornered 60% marketshare: nestle India CMD - Times of India. Available at: https://timesofindia.indiatimes.com/business/india-business/maggi-noodles-has-cornered-60-market-share-nestle-india-cmd/articleshow/56838663.cms, Accessed date: 19 February2019.
Thow, A.M., Hawkes, C., 2009. The implications of trade liberalization for diet andhealth: a case study from Central America. Glob. Health 5, 5.
Thow, A.M., Kadiyala, S., Khandelwal, S., Menon, P., Downs, S., Reddy, K.S., 2016.Toward food policy for the dual burden of malnutrition. Food Nutr. Bull. 37 (3),261–274.
World Bank, 2019. World Bank development indicators. Available at: https://data.worldbank.org/country/india, Accessed date: 11 April 2019.
World Health Organization, 2003. Diet, nutrition, and the prevention of chronic diseases:report of a joint WHO/FAO expert consultation. Available at: https://books.google.co.uk/books?hl=en&lr=&id=S6YsDwAAQBAJ&oi=fnd&pg=PA4&dq=Diet,+nutrition+and+the+prevention+of+chronic+diseases+-&ots=t8XSmoQFFh&sig=9JUU92rnsKFh7kR952SFWlINNjY, Accessed date: 15 January 2019.
World Health Organization, 2018. Obesity and overweight. Available at: https://www.who.int/en/news-room/fact-sheets/detail/obesity-and-overweight, Accessed date:11 February 2019.
C. Law, et al. Global Food Security 23 (2019) 191–204
204


![[Document title] - Food Security Cluster](https://static.fdokumen.com/doc/165x107/63150bb56ebca169bd0b096c/document-title-food-security-cluster.jpg)