
Age estimates of coastal terraces in the Andaman and Nicobar ...
Upload
nevada-renoCategory
view
8download
0
Earth Planets Space, 58, 141–148, 2006
Global deformation from the great 2004 Sumatra-Andaman Earthquakeobserved by GPS: Implications for rupture process and global reference frame
Corne Kreemer, Geoffrey Blewitt, William C. Hammond, and Hans-Peter Plag
Nevada Bureau of Mines and Geology, and Seismological Laboratory, University of Nevada, Reno, MS 178, NV 89557-0088, U.S.A.
(Received June 30, 2005; Revised October 17, 2005; Accepted November 9, 2005; Online published February 17, 2006)
Static coseismic offsets >1 mm are observed up to 7800 km away from the great Sumatra-Andaman earthquakeof 26 Dec. 2004 using global GPS network data. We investigate the rupture process based on far-field continuousGPS data. To reduce error in the coseismic offset estimates due to post-seismic deformation in the days followingthe main shock, we simultaneously fit a model of co- and postseismic offsets for nearby stations SAMP (500 km)and NTUS (900 km). The 3-month cumulative postseismic displacement for station SAMP amounts to 20% ofthe coseismic displacement, and can be well modeled by velocity-strengthening afterslip. We find that coseismicslip on the northern rupture segment is ∼3 m, which is consistent with seismic estimates. Our best estimate ofthe moment magnitude is Mw = 9.13 if we take into account the expected increase of the shear modulus withdepth (for uniform µ = 30 GPa, the moment-magnitude would only be 8.97). Our geodetic results, and thus ourinferred rupture model, are different from a similar study using far-field data of Banerjee et al. (2005). Thesedifferences highlight the challenge in earthquake studies on a global scale in terms of the sensitivity of far-fieldoffset estimates to the analysis strategy and reference frame treatment. Our predicted coseismic offsets from thisevent are at least 1 mm across almost the entire globe. This warrants a reconsideration of how to maintain theglobal terrestrial reference frame affected by earthquakes of Mw > 9.0.Key words: GPS, Great Sumatra-Andaman Earthquake, earthquake rupture, coseismic displacements, postseis-mic deformation.
1. IntroductionThe great Sumatra-Andaman earthquake of 26 Decem-
ber, 2004 is the first earthquake to be observed by moderngeodetic techniques across the globe. This event providesunprecedented opportunities to study such an earthquake ona global scale, to verify our geodetic and geophysical mod-els, and to infer solid earth deformation processes on a largerange of time and spatial scales.
Much debate has occurred on the magnitude estimateof this earthquake using seismologic data. The originalbroad-band estimate from the Harvard CMT project wasMw = 9.0. The initial analysis of the Earth’s free oscil-lations yielded Mw = 9.3 (Stein and Okal, 2005). Bothestimates have since then been revised; long period analy-sis is now consistent with ∼Mw = 9.2 (Lay et al., 2005),and a revision of the free oscillation analysis is now consis-tent with Mw = 9.15 (Park et al., 2005). The time that wasneeded for the different analyses to converge towards a con-sistent value leaves room for much improvement. Space-geodesy can provide an independent, and potentially (near)real-time, magnitude estimate. Also, GPS can provide addi-tional constraints on the rupture process. Current estimatesfrom seismology can vary significantly depending on thechoice of analysis (Ammon et al., 2005).
Limited analysis of the time-series of SAMP and NTUS
Copyright c© The Society of Geomagnetism and Earth, Planetary and Space Sci-ences (SGEPSS); The Seismological Society of Japan; The Volcanological Societyof Japan; The Geodetic Society of Japan; The Japanese Society for Planetary Sci-ences; TERRAPUB.
was presented by (Khan and Gudmundsson, 2005). A muchmore detailed study was presented by Vigny et al. (2005),who used a large amount of regional data (and some fromfar-field IGS stations) to put strong constraints on the ex-tend and total slip along the rupture. Their analysis was,however, hindered by not taking into account possible post-seismic offsets for continuous sites in the 14 days after theevent, and by using an elastic half-space model instead of aspherical model approach.
In this study we focus on the ability to put constraints onthe rupture process using far-field GPS static offsets. Wefocus on far-field offsets, because an Mw > 9.0 event willcreate offsets over a large part (or all) of the globe suchthat the offset estimates are particularly sensitive to analy-sis approach (e.g., common-mode analysis) and referenceframe treatment. Many other future subduction zone earth-quakes are located in regions where only far-field data willbe available. Banerjee et al. (2005), hereafter referred toas BPB, analyzed the time-series of 41 mainly far-field sta-tions. They showed millimeter static offsets at GPS stationsthousands of kilometers away from the earthquake rupture.We also calculate far-field static offsets, but using a differ-ent processing technique and applying a different analysisapproach. Straight-forward estimates of static offsets fromtime-series for stations near the rupture are problematic, be-cause of possible rapid postseismic deformation. We offeran alternative treatment of the time-series for those stations;i.e. SAMP and NTUS.
141

142 C. KREEMER et al.: 2004 SUMATRA-ANDAMAN EARTHQUAKE DEFORMATION OBSERVED BY GPS
Fig. 1. Time-series of east and north components of the daily positions for four representative stations (IISC, DGAR, KUNM, TNML). Days are relativeto December 26, 2004 (day 0). Error-bars are formal 1-sigma uncertainties. Time-series have been detrended using the secular station velocity, andare shown here relative to the average position (dashed line) of the 28 days before December 26, 2004. The average position (dashed line) of the 28days after the earthquake is indicated as well, and is reported for all stations in Table 1.
2. DataGPS data from 1 January 2000 to 27 March 2005 were
processed from 27 stations within 7800 km of the rupturezone using the GIPSY OASIS II software package from theJet Propulsion Laboratory (JPL). All stations are part ofthe network maintained by the International GPS Service(IGS), except SAMP, which is maintained by the BAKO-SURTANAL Indonesian network. Station coordinates wereestimated every 24 hours using the precise point position-ing method (Zumberge et al., 1997) with ambiguity res-olution applied successfully across the entire network byautomatic selection of the ionospheric- or pseudorange-widelane method (Blewitt, 1989). Satellite orbit and clockparameters, and daily coordinate transformation parametersinto the global reference frame (ITRF2000) were providedby JPL. Ionosphere-free combinations of carrier phase andpseudorange were processed every 5 minutes. Estimatedparameters included a tropospheric zenith bias and two gra-dient parameters estimated as random-walk processes, andstation clocks estimated as a white-noise process.
Station velocities were estimated using all available datafrom 1 January 2000 to 25 December 2004 (with most sta-tions providing data for the entire period). These velocitieswere then used to detrend all the data (through 27 March
2005). To reduce the impact of coseismic displacementson the reference frame, all daily solutions were then trans-formed (by a 7-parameter Helmert transformation) onto theconstant velocity solution using only stations >4000 kmfrom the epicenter. Formal errors for daily station positionswere computed assuming 10-mm 1-standard deviation er-rors in the ionosphere-free carrier phase data. These errorswere then realistically scaled by a factor of 2.1 (to normal-ize the reduced χ2 of the fit to the constant velocity model).2.1 Time-series
To estimate the static coseismic displacements we cal-culated the difference between the average position for 28days before and 28 days after the earthquake. The daily so-lution for 26 December, 2004 was not used. For the twoclosest stations, SAMP and NTUS, we followed a differ-ent procedure (see Section 2.2). We show the daily eastand north positions for this time interval for stations IISC,DGAR, KUNM, and TNML (Fig. 1). These are indicativetime-series, and similar data were also shown by BPB fromtheir analysis.2.2 Postseismic afterslip
The time-series of stations SAMP and NTUS indicate anon-linear trend after the earthquake (Fig. 2). Therefore,to properly estimate the coseismic displacements for these

C. KREEMER et al.: 2004 SUMATRA-ANDAMAN EARTHQUAKE DEFORMATION OBSERVED BY GPS 143
Fig. 2. Detrended time-series of the east and north components of the dailypositions for stations NTUS and SAMP relative to the average positionof the 20 days before December 26, 2004 (day 0). Shown are theresults of a simultaneous solution for the best-fitting coseismic offsets(Table 1) and a logarithmic decay function (dashed lines) assuming thatthe postseismic displacements are due to afterslip.
stations, we use a method different from that applied tothe other far-field stations. GPS postseismic time-seriesafter other (subduction-type) earthquakes have been ana-lyzed elsewhere to evaluate different possible mechanismsthat could explain the data (e.g., Melbourne et al., 2002).Studies have found that afterslip occurring down-dip fromthe rupture plane is the dominant mechanism for subduc-tion zone thrust events in Kamchatka and the Japan Trench(e.g., Heki et al., 1997; Burgmann et al., 2001). For theDecember 26, 2005, event Vigny et al. (2005) noted thatthe apparent logarithmic decay in the time-series of regionalGPS sites suggested that the postseismic deformation mayindicate an afterslip process.
For SAMP and NTUS we have used the times-seriesfrom 20 days before 26 December, 2004 until 27 March,2005 (i.e., the day before the Mw = 8.7, Northern Suma-tra event) to simultaneously solve for the horizontal coseis-mic offsets and a logarithmic function describing the after-slip process after the event (Fig. 2). The 20 days prior tothe event are used to constrain an average pre-seismic po-sition. The inferred coseismic offsets are reported in Ta-ble 1. For the postseismic time-series we fit the followingfunction for each station: u = a ln(bt + 1) (Marone et al.,1991). Here, b is the decay constant, and we solve for asingle b value using the four time-series (east and north) ofboth stations. We find that b = 0.11 day−1, or 40.2 yr−1,which implies that ∼65% of the postseismic displacementsexpected within the first year has occurred within the 91days that we analyzed after the earthquake. For our best-fitmodel we find a(x) = −11 mm and a(y) = −3 mm forSAMP, and a(x) = −1 mm and a(y) = 1 mm for NTUS.
Table 1. GPS-derived coseismic offsets.Site Lon. Lat. D east north σeast σnorth
(◦E) (◦N) (km) (mm) (mm) (mm) (mm)
ALIC 133.9 −23.7 5220 −1.9 1.1 0.4 0.4
BAHR 50.6 26.2 5313 0.1 2.5 0.4 0.4
BAKO 106.8 −6.5 1757 2.3 3.7 1.3 0.6
COCO 96.8 −12.2 1722 1.3 4.9 0.6 0.4
DARW 131.1 −12.8 4440 −3.6 0.8 0.6 0.4
DGAR 72.4 −7.3 2688 5.4 6.0 0.6 0.4
GUAM 144.9 13.6 5677 −4.2 2.3 0.6 0.4
HRAO 27.7 −25.9 7841 1.5 −0.4 0.6 0.6
HYDE 78.6 17.4 2340 5.8 −1.4 0.6 0.4
IISC 77.6 13.0 2142 11.7 −1.1 0.6 0.4
KARR 117.1 −21.0 3654 −1.9 2.3 0.6 0.4
KIT3 66.9 39.1 4870 1.0 1.1 0.6 0.6
KUNM 102.8 25.0 2605 −6.2 −5.0 1.1 0.6
LAE1 147.0 −6.7 5953 1.9 −2.0 0.8 0.6
LHAS 91.1 29.7 2973 −1.1 −1.3 0.8 1.1
MALI 40.2 −3.0 6047 2.0 0.7 0.8 0.6
MBAR 30.7 −0.6 7072 1.4 0.5 0.6 0.4
MALD 73.5 4.2 2304 9.9 4.0 1.1 0.6
NTUS1 103.7 1.3 1064 −22.0 8.0 0.6 0.4
PIMO 121.1 14.6 3208 −7.9 0.7 0.6 0.6
REUN 55.6 −21.2 5003 1.6 3.7 1.3 0.6
SAMP1 98.7 3.6 498 −139.0 −9.0 1.1 0.6
SEY1 55.5 −4.7 4394 −3.5 −3.1 0.8 0.4
TNML 24.8 121.0 3744 −5.5 −1.8 0.6 0.4
TOW2 147.1 −19.3 6281 1.6 −0.7 0.6 0.4
TSKB 140.1 36.1 5956 −2.6 −1.8 0.4 0.6
WUHN 114.4 30.5 3711 −3.9 −1.9 0.6 0.6
D, distance from site to epicenter.1 our coseismic offsets for SAMP and NTUS are determined simultane-ously with parameters for a postseismic afterslip process (see Fig. 2). Theuncertainties for these sites were determined similarly to those of othersites.
The 3-month cumulative postseismic displacements repre-sent 20% and 14% of the initial coseismic displacementsfor SAMP and NTUS, respectively.2.3 Coseismic displacements
The inferred coseismic displacements are listed in Ta-ble 1 and shown in Fig. 3. Generally, displacements are to-wards the epicenter, with amplitude decaying with distance.The magnitude of the far-field displacements northeast andsouthwest of the rupture are greater than to the northwestand southeast, consistent with a thrust mechanisms along a∼northwest-southeast trending fault. For example the siteTNML moves nearly twice the distance of KARR whichhas a similar epicentral distance.
Our results and those of BPB exhibit a similar generalpattern. Although differences at any individual site maynot be significant, some important systematic differencesexist (Fig. 3). Our estimate for NTUS is more than 1.5larger than that of BPB. For stations IISC, HYDE, andTNML, predicted directions between both studies are veryclose, but BPB offsets are ∼130–170% larger. A similardiscrepancy in rate also exists for PIMO, WUHN, DGAR,(and to lesser extent KUNM), however BPB estimates areall directed considerably more southward than our predicteddirections. Also for stations LAE1, BAKO, and COCO arethe BPB estimates directed more southward. For African

144 C. KREEMER et al.: 2004 SUMATRA-ANDAMAN EARTHQUAKE DEFORMATION OBSERVED BY GPS
Fig. 3. Observed coseismic displacements from this study and Banerjee et al. (2005). Uncertainties are shown as 68% confidence ellipses. Rupturesegments used in this study and by Banerjee et al. (2005) are shown in dark gray (there are shallow and deep segments). The dashed displacementsfor station SAMP are plotted at half the scale as the other vectors.
stations (for which BPB did not present estimates) we findconsistent eastward offsets of ∼1.5–2.1 mm.
3. Rupture ModelThe far-field coseismic displacements are sensitive to the
distribution of coseismic slip along the Indian-Burma plateboundary during the earthquake. For simplicity and com-parison, we model the rupture as slip on planes identical tothose found by BPB. The location and dip of the ruptureplanes is rather well supported by the seismicity (Engdahlet al., 1998; Lay et al., 2005). The difference between ourfar-field offsets and those of BPB requires changes in therake and slip parameters inferred by BPB (their model M3).Like BPB, we use a layered spherical Earth model (Pollitz,1996) and the PREM elastic stratification (Dziewonski andAnderson, 1981) to calculate static offsets. We use spheri-cal harmonic degrees from l = 1 to l = 1500.
In the M3 model of BPB the fault rupture is divided into3 segments. The northern segment has uniform slip up to 30km depth only, with the segment divided along strike intofour sub-segments, each with their own estimated rake. Thecentral and southern segment each has one rake estimate,and has a deep (i.e., 30–50 km) as well as shallow segment,
each with similar slip offsets.In our first model (A), we estimate the misfit between our
observations and the predicted static offsets when we usethe rake and slip estimates of BPB. We present our misfitin terms of χ2
ν , which is the reduced χ2 (i.e., χ2 dividedover N − n, with N the number of data constraints, and nthe number of free model parameters) (Table 2). We willsee next that the data fit for model A is relatively poor.Our coseismic observations imply therefore a considerablydifferent rupture model than the one of BPB.
In our second model (B) we keep the rake estimates ofBPB and solve for the slip offsets for the three segmentssuch that the χ2
ν is minimized. Fault parameters are shownin Table 2. χ2
ν estimates are relatively insensitive to smallvariations in slip, therefore we find a range of model pa-rameters that would result in roughly the same χ2
ν . We usethis range to assign uncertainties in our model parameters(Table 2).
In model C we solve simultaneously for slip offsets forthe three segments, as well as for rake estimates for the foursub-segments of segment 1, and for segment 2. Like BPB,we set the rake for segment 3 to 90◦. For this model wefind left-lateral oblique slip for Segment 1. This result is
C. KREEMER et al.: 2004 SUMATRA-ANDAMAN EARTHQUAKE DEFORMATION OBSERVED BY GPS 145
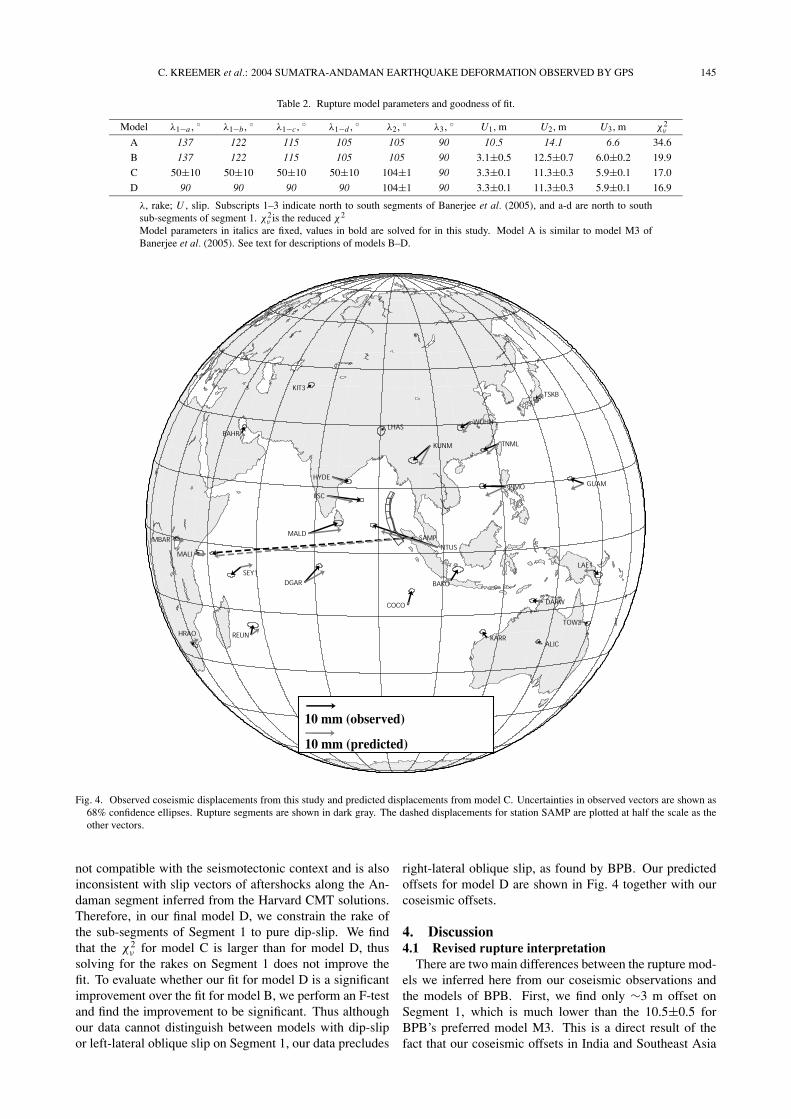
Table 2. Rupture model parameters and goodness of fit.
Model λ1−a , ◦ λ1−b , ◦ λ1−c , ◦ λ1−d , ◦ λ2, ◦ λ3, ◦ U1, m U2, m U3, m χ2ν
A 137 122 115 105 105 90 10.5 14.1 6.6 34.6
B 137 122 115 105 105 90 3.1±0.5 12.5±0.7 6.0±0.2 19.9
C 50±10 50±10 50±10 50±10 104±1 90 3.3±0.1 11.3±0.3 5.9±0.1 17.0
D 90 90 90 90 104±1 90 3.3±0.1 11.3±0.3 5.9±0.1 16.9
λ, rake; U , slip. Subscripts 1–3 indicate north to south segments of Banerjee et al. (2005), and a-d are north to southsub-segments of segment 1. χ2
ν is the reduced χ2
Model parameters in italics are fixed, values in bold are solved for in this study. Model A is similar to model M3 ofBanerjee et al. (2005). See text for descriptions of models B–D.
Fig. 4. Observed coseismic displacements from this study and predicted displacements from model C. Uncertainties in observed vectors are shown as68% confidence ellipses. Rupture segments are shown in dark gray. The dashed displacements for station SAMP are plotted at half the scale as theother vectors.
not compatible with the seismotectonic context and is alsoinconsistent with slip vectors of aftershocks along the An-daman segment inferred from the Harvard CMT solutions.Therefore, in our final model D, we constrain the rake ofthe sub-segments of Segment 1 to pure dip-slip. We findthat the χ2
ν for model C is larger than for model D, thussolving for the rakes on Segment 1 does not improve thefit. To evaluate whether our fit for model D is a significantimprovement over the fit for model B, we perform an F-testand find the improvement to be significant. Thus althoughour data cannot distinguish between models with dip-slipor left-lateral oblique slip on Segment 1, our data precludes
right-lateral oblique slip, as found by BPB. Our predictedoffsets for model D are shown in Fig. 4 together with ourcoseismic offsets.
4. Discussion4.1 Revised rupture interpretation
There are two main differences between the rupture mod-els we inferred here from our coseismic observations andthe models of BPB. First, we find only ∼3 m offset onSegment 1, which is much lower than the 10.5±0.5 forBPB’s preferred model M3. This is a direct result of thefact that our coseismic offsets in India and Southeast Asia

146 C. KREEMER et al.: 2004 SUMATRA-ANDAMAN EARTHQUAKE DEFORMATION OBSERVED BY GPS
are much lower than their estimates. Our result is muchmore consistent with the <2 m obtained for the Andaman(i.e., northern) segment from seismic modeling (Ammon etal., 2005; Lay et al., 2005). Secondly, our data does notrequire oblique slip on the Andaman segment (however, itdoes for the Nicobar (middle) segment), as found by BPB.
All geodetic models on the earthquake rupture from bothour study and BPB are in two major ways in disagreementwith seismic models of the earthquake rupture (Ammon etal., 2005; Ishii et al., 2005; Kruger and Orhnberger, 2005)and other observations (Bilham et al., 2005). First, the seis-mic models suggest that the maximum peak in seismic en-ergy or displacement is near northern Sumatra, and not nearthe Nicobar Islands where the segment with the highest slip(Segment 2) of the geodetic models is located. The geode-tic results are more in agreement with the analysis of nor-mal modes excited by the event. Those studies place thecentroid at 7.5◦ north latitude (Park et al., 2005; Stein andOkal, 2005), close to where the far-field coseismic offsetsconstrain the maximum slip to be, and significantly north ofthe CMT epicenter. Secondly, Bilham et al. (2005) inferredfrom vertical offset observations respectively 15–23 m and5–10 m for slip along parts of the Nicobar and Andamansegments of the rupture, consistently more than our andBPB estimates for the Nicobar segment and our result forthe Andaman segment. However, the large observed offsetsare concentrated along only very small portions of the rup-ture (e.g., Simeulue Island) and such details are not resolv-able using far-field offsets alone, but has been seen/modeledwith regional GPS data (Vigny et al., 2005). For the south-ern segment geodetically derived estimates of ∼6 m are notinconsistent with the average 7 m found from seismic mod-eling (Lay et al., 2005). Clearly, to understand better, orresolve, the difference between the seismic and geodeticresults, regional geodetic data is important (Vigny et al.,2005).
Some of the discrepancies noted above are expressedin the inferred moment magnitude between the differentgeodetic and geologic models. When using a shear modu-lus of µ = 30 GPa, which is generally used for continentalearthquakes, model C corresponds to an M0 = 3.63 × 10²²
N m, equivalent to Mw = 8.97. This value is much lowerthan that of BPB or published seismic estimates derivedfrom long-period broadband data (Lay et al., 2005) or freeoscillations (Park et al., 2005; Stein and Okal, 2005). Theonly way to reconcile our moment estimate with the seis-mic estimates is to assume larger values for the shear mod-ulus than 30 GPa. It has been shown (Bilek and Lay, 1999)that the shear modulus can increase significantly with depthalong a subduction interface, with values lower than 30GPa in unconsolidated sediments at very shallow depths,and values over 100 GPa at 40–50 km depth. The PREMmodel also implies a depth increase of the shear moduluswith depth. When we chose a permissible shear modulusof 40 GPa as average for the 0–30 depth segments, and 100GPa as average for the 30–50 km depth segments (Bilek andLay, 1999), we obtain Mw = 9.13 (M0 = 6.11×10²² N m),which is very close to the Mw = 9.15 from the latest anal-ysis of free oscillations (Park et al., 2005). Thus, if our co-seismic offsets, our rupture analysis, and the result by Park
et al. (2005) are all reasonable, then our results indicate asignificant increase of the shear modulus with depth, as ex-pected. Improved knowledge of the shear modulus and itsvariation with depth (as well as other parameters that mayvary between subduction zones) is therefore an importantasset in magnitude determination using GPS. In any case,geodesy can provide important (near) real-time constraintson the earthquake size and thereby alleviate the difficultiesto derive the magnitude quickly from seismology.4.2 Afterslip implications
Our analysis of the postseismic time-series for NTUS andSAMP indicate that postseismic displacements are not sub-parallel to coseismic displacements. More specifically, forstations SAMP and NTUS the direction of postseismic off-set is ∼10◦ more southward and ∼20◦ more northward, re-spectively, compared to the coseismic direction. That is, forSAMP postseismic displacements are directed more normalto southern rupture plane, and for NTUS more parallel tosouthern rupture plane, compared to coseismic offsets. Fur-ther north, near Phuket, Thailand, Vigny et al. (2005) foundthe post- and coseismic offsets to be parallel. Although ourresults are important to infer the actual afterslip process,particularly where it is occurring with respect to the rupture,we can not infer any more details on the afterslip process.Because of our emphasis on far-field GPS sites, and becausepostseismic processes are still ongoing as of this writing, wehave not analyzed all the near-field geodetic data needed todefinitively constrain postseismic afterslip in the vicinity ofthe rupture plane. However, our results suggest that after1 year the postseismic displacement at SAMP and NTUSwill be 30% and 23% of the coseismic displacement, re-spectively. This is relatively small compared to some casesobserved elsewhere (e.g., Heki et al., 1997; Marquez Azuaet al., 2002), and is also small compared to our prelimi-nary analysis of postseismic time-series after the Mw = 8.7March 28, 2005, event for which afterslip seems rapid andextensive (at SAMP 80% of coseismic offset is predictedto be accumulated as postseismic displacement 1 year afterthat event). The difference in postseismic offsets, and re-lated afterslip processes, for the two Sumatra earthquakesmay be explained, among several reasons, by the consid-eration that the rupture of the first event broke the surface,and the second did not. This would be consistent with thefact that the first event generated a large tsunami, and thesecond event did not. Moreover, it could explain the rapidafterslip we observe after the second event in terms of after-slip within the sediments up dip from the rupture.4.3 Implications on global geodetic reference frame
We have shown that observed coseismic offsets are gen-erally well above 1 mm at 7000 km from the earthquakerupture. We find from our model C that expected displace-ments are in fact >1 mm for almost anywhere across theEarth’s surface (Fig. 5). This has profound implications forthe realization of the terrestrial reference frame, as stationcoordinates are currently being measured with 1 mm-levelprecision. This reference frame problem only arises nowbecause this is the first earthquake in history that has de-formed the entire Earth’s surface at a detectable level. Thelast earthquake of Mw > 9.0 occurred ∼40 years ago (inAlaska), well before modern space geodesy even existed.

C. KREEMER et al.: 2004 SUMATRA-ANDAMAN EARTHQUAKE DEFORMATION OBSERVED BY GPS 147
Fig. 5. Contours (in millimeters) of predicted total horizontal displacements from our coseismic model C. The expected displacements are >1 mmalmost everywhere on the Earth’s surface.
One immediate problem is to define the meaning of acoseismic offset when the entire Earth surface has movedcoseismically. Prior to the 2004 Sumatra earthquake, thedefinition was simply in terms of how far a station hadmoved with respect to stations in the far field, where it waspossible to find a station sufficiently far from the earthquakethat its displacement was completely negligible. This isno longer the case. In our analysis, we have defined thereference frame in terms of the average position of stationsmore than 4000 km from the rupture, but this is clearly anad hoc solution until clearer conventions are debated andagreed upon.
One rigorous solution we propose would be to use amodel of the surface displacement in a reference frame thathas no-net translation with respect to the modeled centerof mass of the entire Earth (including the static ocean re-sponse), and no-net rotation with respect to the modeledEarth surface. Observed coseismic displacements couldthen be defined within a frame where there is no-net transla-tion or rotation of the residual station coordinates (observedminus the modeled displacements). One challenge with thisapproach is that various models might explain the observeddeformation to within the errors. Another challenge is thattypically such models are adjusted to fit the data, and thatcare must be taken to ensure that this is done in a way that isself-consistent with the reference frame definition. A thirdchallenge is that, as we have shown for some stations, co-seismic offsets might represent only a fraction of the totalstation motion caused by the earthquake. And finally, forsome far-field stations coseismic offsets may be of the sameorder of magnitude, or smaller, than the effects of possiblestation instability or incorrectly modeled tropospheric delay(see, for instance, the anomalous offset at SEY1).
A related problem is how to define the coordinates ofthe entire global geodetic network now that such a greatearthquake has taken place. Clearly this relates to the above
problem, in that offsets could be estimated within a model-specific frame, and added to the pre-seismic coordinates.However, note that this requires that a conventional earth-quake displacement model be selected (and clearly speci-fied) in order to maintain a conventional international ter-restrial reference frame. In principle, such a model shouldbe specified for all great earthquakes. The process towarddeveloping and agreeing upon a conventional model for ev-ery great earthquake would certainly be a challenge for thegeodetic community.
5. ConclusionsWe have estimated and analyzed coseismic static off-
sets of far-field GPS stations from the 26 December, 2004,earthquake. In this process we also found and analyzedsignificant postseismic displacements for nearby stations(specifically SAMP), which are consistent with a velocity-strengthening afterslip process. At many locations, our co-seismic offsets are systematically different than those ob-tained by BPB. These differences are the result of usingdifferent analysis strategies and underscore the need fora conventional geodetic approach when dealing with dis-placements from an earthquake with Mw > 9.0. The maindifference between our rupture model and that of BPB isthat we find a much lower slip on the northern rupture seg-ment, which is more consistent with seismic studies. Con-sequently we find a much lower Mw than BPB and, moreimportantly, than independent earthquake studies using freeoscillations. The only way to resolve this difference isto use a significant increase in shear modulus with depthwhen estimating our seismic moment. We argue that anMw = 9.13 from our result is permissible. Our predictedcoseismic offsets from this event are at least 1 mm acrossalmost the entire globe. This warrants a reconsideration ofhow to maintain the global terrestrial reference frame af-fected by earthquakes of Mw > 9.0.

148 C. KREEMER et al.: 2004 SUMATRA-ANDAMAN EARTHQUAKE DEFORMATION OBSERVED BY GPS
Acknowledgments. We thank F. Pollitz for his help and for mak-ing his spherical coseismic programs available, and two anony-mous reviewers for comments on the manuscript. We are gratefulto the International GPS Service and BAKOSURTANAL for mak-ing GPS data freely available and to the Jet Propulsion Laboratoryfor the GIPSY OASIS II software and precise GPS orbit products.
ReferencesAmmon, C. J., C. Ji, H.-K. Thio, D. Robinson, S. Ni, V. Hjorleifsdottir,
H. Kanamori, T. Lay, S. Das, D. Helmberger, G. Ichinose, J. Polet, andD. Wald, Rupture process of the 2004 Sumatra-Andaman earthquake,Science, 308, 1133–1139, 2005.
Banerjee, P., F. F. Pollitz, and R. Burgmann, The size and duration of theSumatra-Andaman earthquake from far-field static offsets, Science, 308,1769–1772, 2005.
Bilek, S. L. and T. Lay, Rigidity variations with depth along interplatemegathrust faults in subduction zones, Nature, 400, 443–446, 1999.
Bilham, R., R. Engdahl, N. Feldl, and S. P. Satyabala, Partial and completerupture of the Indo-Andaman plate boundary 1847–2004, SeismologicalResearch Letters, 76, 299–311, 2005.
Blewitt, G., Carrier phase ambiguity resolution for the Global PositioningSystem applied to geodetic baselines up to 2000 km, Journal of Geo-physical Research, 94, 10,187–10,283, 1989.
Burgmann, R., M. G. Kogan, V. E. Levin, C. H. Scholz, R. W. King, and G.M. Steblov, Rapid aseismic moment release following the 5 December,1997 Kronotsky, Kamchatka, earthquake, Geophysical Research Let-ters, 28, 1331–1334, 2001.
Dziewonski, A. M. and D. L. Anderson, Preliminary reference Earthmodel, Physics of the Earth and Planetary Interiors, 25, 297–356, 1981.
Engdahl, E. R., R. van der Hilst, and R. Buland, Global teleseismic reloca-tion with improved travel times and procedures for depth determination,Bulletin of the Seismological Society of America, 88, 722–743, 1998.
Heki, K., S. Miyazaki, and H. Tsuji, Silent fault slip following an interplatethrust earthquake at the Japan Trench, Nature, 386, 595–598, 1997.
Ishii, M., P. M. Shearer, H. Houston, and J. E. Vidale, Extent, durationand speed of the 2004 Sumatra-Andaman earthquake imagined by theHi-Net array, Nature, 435, 933–936, 2005.
Khan, S. A. and O. Gudmundsson, GPS analysis of the Sumatra-Andaman
earthquake, EOS Transactions, 86, 89–94, 2005.Kruger, F. and M. Orhnberger, Tracking the rupture of the Mw = 9.3
Sumatra earthquake over 1,150 km at teleseismic distance, Nature, 435,937–939, 2005.
Lay, T., H. Kanamori, C. J. Ammon, M. Nettles, S. N. Ward, R. C. Aster,S. L. Beck, M. R. Brudzinski, R. Butler, H. R. DeShon, G. Ekstrom, K.Satake, and S. Sipkin, The Great Sumatra-Andaman earthquake of 26December 2004, Science, 308, 1127–1133, 2005.
Marone, C. J., C. H. Scholz, and R. Bilham, On the mechanics of earth-quake afterslip, Journal of Geophysical Research, 96, 8441–8452, 1991.
Marquez Azua, B., C. DeMets, and M. Masterlark, Strong interseismiccoupling, fault afterslip, and viscoelastic flow before and after theOct. 9, 1995 Colima-Jalisco earthquake: Continuous GPS measure-ments from Colima, Mexico, Geophysical Research Letters, 29, 1281,doi:10.1029/2002GL014702, 2002.
Melbourne, T. I., F. H. Webb, J. M. Stock, and C. Reigber, Rapid post-seismic transients in subduction zones from continuous GPS, Journal ofGeophysical Research, 107, 2241, doi:10.1029/2001JB000555, 2002.
Park, J., T. A. Song, J. Tromp, E. Okal, S. Stein, G. Roult, E. Clevede, G.Laske, H. Kanamori, P. Davis, J. Berger, C. Braitenberg, M. van Camp,X. Lei, H. Sun, H. Xu, and S. Rosat, Earth’s free oscillations excitedby the 26 December 2004 Sumatra-Andaman earthquake, Nature, 308,1139–1144, 2005.
Pollitz, F. F., Coseismic deformation from earthquake faulting on a layeredspherical Earth, Geophysical Journal International, 125, 1–14, 1996.
Stein, S. and E. Okal, Speed and size of the Sumatra earthquake, Nature,434, 581–582, 2005.
Vigny, C., W. J. F. Simons, S. Abu, R. Bamphenyu, C. Satirapod, N.Choosakul, C. Subarya, A. Socquet, K. Omar, H. Z. Abidin, and B. A.C. Ambrosius, Insight into the 2004 Sumatra-Andaman earthquake fromGPS measurements in southeast Asia, Nature, 436, 201–206, 2005.
Zumberge, J. F., M. B. Heflin, D. C. Jefferson, and M. M. Watkins, Pre-cise point positioning for the efficient and robust analysis of GPS datafrom large networks, Journal of Geophysical Research, 102, 5005–5017, 1997.
C. Kreemer (e-mail: [email protected]), G. Blewitt, W. C. Hammond,and H.-P. Plag
Copyright © 2022 FDOKUMEN


![SIPUNCULANS IN HUMP CORAL PORITES LUTEA, THE ANDAMAN SEA, THAILAND. [1994]](https://static.fdokumen.com/doc/165x107/6322f3f063847156ac06da7d/sipunculans-in-hump-coral-porites-lutea-the-andaman-sea-thailand-1994.jpg)