15. Footnotes, Indexes, Contents, and Outlines ... - Govinfo.gov
Upload
independentCategory
view
3download
0
EARTHQUAKE ENGINEERING AND STRUCTURAL DYNAMICSEarthquake Engng Struct. Dyn. 2009; 38:1027–1049Published online 16 January 2009 in Wiley InterScience (www.interscience.wiley.com). DOI: 10.1002/eqe.882
Global damage indexes for the seismic performance assessementof RC structures
Roberto Scotta1,∗,†, Leopoldo Tesser1, Renato Vitaliani1 and Anna Saetta2
1Department of Structural and Transportation Engineering, University of Padua, 35131 Padua, Italy2Department of Architectural Construction, University IUAV, 30135 Venice, Italy
SUMMARY
When performing the seismic risk assessment of new or existing buildings, the definition of compactindexes able to measure the damaging and safety level of structures is essential, also in view of theeconomic considerations on buildings rehabilitation. This paper proposes two series of indexes, named,respectively, Global Damage Indexes (GDIs), which are representative of the overall structure performance,and Section Damage Indexes (SDIs), which assess the conditions of reinforced concrete (RC) beam-columnsections. Such indexes are evaluated by means of an efficient numerical model able to perform nonlinearanalyses of the RC frame, based on the continuum damage mechanics theory and fiber approach. Animprovement of a two-parameter damage model for concrete, developed by some of the authors, whichguarantees a better correlation between the Local Damage Indexes (LDIs) and the material’s mechanicalcharacteristics, is also presented. For the reinforcement, a specific LDI, named ‘steel damage index’, whichtakes into account the plastic strain development and the bar buckling effect, is proposed. The numericalmodel has been employed to simulate several experimental tests, in order to verify the accuracy of theproposed approach in predicting the RC member’s behavior. Nonlinear static and dynamic analyses oftwo RC frames are carried out. The robustness of the method, as well as the effectiveness of the GDIs inassessing the structural conditions, are demonstrated here. Finally, comparisons between the evolution ofGDIs and the achievement of the performance levels as proposed in FEMA 356 are reported. Copyrightq 2009 John Wiley & Sons, Ltd.
Received 5 May 2008; Revised 30 October 2008; Accepted 11 November 2008
KEY WORDS: seismic assessment; nonlinear analysis; bar buckling; damage indexes; fibers approach
1. INTRODUCTION
The accurate prediction of the structural response of reinforced concrete (RC) buildings subjectto strong earthquakes has necessarily to be performed by means of numerical nonlinear analyses.
∗Correspondence to: Roberto Scotta, Dipartimento di Costruzioni e Trasporti, Via Marzolo 9, 35131 Padova, Italy.†E-mail: [email protected]
Copyright q 2009 John Wiley & Sons, Ltd.

1028 R. SCOTTA ET AL.
In such analyses, the behavior of each structural member and of the structure on the whole, evenbeyond the elastic field, must be described accurately.
The beam fiber approach, [1–3], is gathering increasing interest as an alternative to the concen-trated plastic hinge procedure to perform nonlinear analysis of framed RC structure, e.g. for theseismic hazard assessment of existing buildings (dynamic and pushover analyses). The appeal ofusing a fiber approach is that neither the preliminary positioning of the plastic hinge nor the defi-nition of their moment-rotation characteristic curves are needed, even if the number of unknownsremains far lower than that of the classical finite element model. Some problems could arise,with fiber approach, when dealing with the localization problem and the mesh dependency of thesolutions [4]. The models based on damage mechanics have shown both the numerical efficiencyand the accuracy necessary for a description of brittle materials behavior, and in particular ofconcrete [5–13].
The recent seismic standards associate the achievement of structural performance with compli-ance with the prescribed levels of structural damage. In particular, FEMA 356 [14] defines theimmediate occupancy (IO), the life safety (LS) and the collapse prevention (CP) levels. Thesedamage levels are often evaluated as limiting values of some generalized deformations that involveeach structural member or the structure as a whole. It must be underscored that the concept ofperformance levels, as proposed in FEMA 356 [14] to assess the seismic safety of buildings,cannot be applied when a distributed damage model (like the fiber one) is adopted instead of aplastic hinge model. Within a strain-based continuum damage approach, the deformation devel-opment is connected with the material damaging in nonlinear field. Therefore, the definition of asuitable correlation between the displacement capacity, in any limit state, of the structure and itsdamage level may be potentially useful to draw reliable technical and economical considerationson the seismic safety of buildings. DiPasquale and Cakmak [15] proposed an objective globaldamage index (GDI) defined as a function of the variation of the structure fundamental frequency.This formulation can be applied to an entire structure but not to any of its substructure. Besides,the calculation of the fundamental frequency is not always possible and requires high computa-tional costs. Hanganu et al. [12] developed a local and global damage assessment methodologyfor RC structures based on a concrete damage model. According to this work, the GDIs werecomputed as average of the local ones weighted by the elastic energy. Perhaps the knowledge ofthe damage state of an RC structure seems incomplete as the damage indexes referred only tothe concrete material. In fact, when the structural behavior is determined by steel yielding, theconcrete damage indexes alone cannot give a real description of the performance of the structureitself [16].
In this paper, an effective and reliable method to perform nonlinear analyses of reinforcedconcrete frame systems has been developed, based on the theory of damage mechanics to describethe materials behavior and on the fiber approach to model the structural behavior. An improvedtwo-parameter plastic damage law for concrete, derived from the works by Faria et al. [7] and Saettaet al. [9, 10], is proposed. As for the reinforcing steel, a specific index, named ‘steel damage index’,is proposed to measure the plastic strain development in steel, that is, to measure the ductilitylevel required of the steel. The reinforcement constitutive law accounts also for the possibility ofbuckling of the compressed longitudinal bar, e.g. [17–21]. The concept of GDIs is introduced as ameasure of the overall structural conditions. Their formulation has been improved according to thenew proposed damage model to summarize the performance level of the entire structure efficiently.Some acceptance criteria, usable with a distributed damage model, are proposed starting from thedefinition of suitable global structural performance indexes. Using the proposed approach, some
Copyright q 2009 John Wiley & Sons, Ltd. Earthquake Engng Struct. Dyn. 2009; 38:1027–1049DOI: 10.1002/eqe

GLOBAL DAMAGE INDEXES 1029
preliminary numerical tests have been carried out to validate the proposed model in comparisonwith available experimental results. Nonlinear analyses of two reinforced concrete frame structures,one of which designed in accordance to the European seismic provisions [22], have been performedin both static and dynamic conditions. A comparison with FEMA 356 [14] in characterizing theframe performance level is finally presented. The obtained results confirm the reliability of theproposed method and the effectiveness of the GDIs for a careful description of the structural state.
2. CONCRETE DAMAGE MODEL
The readers can refer to the works by Faria et al. [7] and Saetta et al. [9, 10] for an exhaustiveexplanation of the basic damage model formulation and notations.
The following expression summarizes the constitutive law adopted for concrete:
�i j =(1−d+)�+i j +(1−d−)�−
i j (1)
where �i j is the damaged Cauchy stress tensor, derived from the positive part �+i j and negative
part �−i j of the effective (i.e. elastic) stress tensor, as corrected, respectively, by two independent
local damage parameters d+ and d−, named, respectively, Tensile and Compressive Local DamageIndexes (LDIs), which are null for the virgin material and approach the unit as damage increasesup to complete degradation.
In the previous works by the same authors [9, 10], the following damage parameter evolutionlaws were proposed:
d+ =1−r+0
�+ exp
[A+(1− �+
r+0
)]and d− =1−r−
0
�− (1−A−)−A− exp
[B+
(1− �−
r−0
)](2)
where r+0 and r−
0 are initial damage thresholds, A+, A− and B− are suitable material parameters,�+ and �− are, respectively, the tensile and compressive uniaxial stresses equivalent to �+
i j and �−i j .
In particular the parameter A+ depends on the tensile fracture energy G f of the material throughthe following expression:
A+ =[(G f E)/(lch f+2
0 )−0.5]−1 (3)
where f +0 is the peak tensile strength of the material and lch is the ‘characteristic length’, which
depends on the size of the finite elements adopted within an approximate energy correctionapproach [10].
Between others, the evolution of d− depends on the two parameters A− and B− that have tobe chosen by making the numerical curve fit the experimental or analytical constitutive curve inuniaxial compression. Besides the uncertainties arising from the fact that parameters A− and B−do not have a physical meaning, it turned out that the constitutive law is excessively sensitive tothe value of B−, which appears in the exponential of the formula.
To overcome these drawbacks, an innovative formulation of the compressive damage parameterd− is proposed as an improvement of the second of (2). It takes inspiration from the classical
Copyright q 2009 John Wiley & Sons, Ltd. Earthquake Engng Struct. Dyn. 2009; 38:1027–1049DOI: 10.1002/eqe

1030 R. SCOTTA ET AL.
constitutive law for concrete proposed by Kent and Park [23], which requires only parameters ofclear physical meaning. In uniaxial condition it writes:
� = fcc
[2
�
�c0−(
�
�c0
)2]
for 0��>�c0 (4)
� = fcc�−�cu
�c0−�cufor �c0����cu (5)
� = 0 for �cu>� (6)
where fcc is the uniaxial compressive strength of the confined concrete evaluated according toMander et al. [24], �c0 is the corresponding strain and �cu is the ultimate deformation for whichthe proposal by Paulay and Priestley [25] has been adopted:
�cu =−0.4%−1.4 ·�s ·fy
| fc0| ·�sm (7)
with �s the geometric transverse reinforcement ratio, fy the transverse reinforcement tensile yieldstrength, �sm the corresponding steel ultimate deformation and fc0 the uniaxial unconfined peakcompressive concrete strength.
Since in this work we are focused on a fiber approach, the description of the new damageformulation for compressed concrete is given only for uniaxial stress states.
As usual the concrete constitutive law in the compression field writes:
�=(1−d−)�− (8)
being �− =E0�=E0[�−�p] the elastic or effective stress corresponding to the reversible part � oftotal strain through E0=2 fcc/�c0, that is the initial elastic modulus of concrete.
According to Faria et al. [7], the plastic strain evolution is given by
�p =�·H(d−) · � with
⎧⎨⎩
�=�0�
�c0for 0>���c0
�=�0 for �c0��(9)
where the material parameter ��0 has been enhanced by taking into account its dependence on thestrain level, and H(d−) is the Heaviside function computed for the compressive damage rate (i.e.plastic strain accumulates only when an increase of damage takes place). Finally, the followingexpression of the damage evolution law in compression is proposed:
d− = 1− 1
(2−�)
[2− �−
�−0
]for 0>�−��−
0 (10)
d− = 1− 1
(2−�)
�−0
�−
[�−u − �−
�−u − �−
0
]for �−
0 >�−��−u (11)
d− = 1 for �−u >�− (12)
Copyright q 2009 John Wiley & Sons, Ltd. Earthquake Engng Struct. Dyn. 2009; 38:1027–1049DOI: 10.1002/eqe

GLOBAL DAMAGE INDEXES 1031
where �−0 and �−
u are the equivalent stresses corresponding, respectively, to the total strains �c0and �cu .
Equations (8)–(12) can be easily extended to generic 2D or 3D stress cases.It should be noted that the newly proposed constitutive and damage evolution laws depend
only on material parameters whose meanings are well known and are obtainable by standardexperimental tests. A characteristic of the new approach is that the compressive concrete LDI atthe peak strength point �c0 depends only upon the parameter �0: for example, d− =0.286 for thevalue �0=0.6 that has been assumed in all the numerical analyses presented in following.
3. REINFORCING STEEL BUCKLING AND DAMAGE MODEL
In the numerical procedure it has been assumed that the reinforcing steel bars inside the concreteare subjected to uniaxial stress state and that the flexural stiffness of rebars can be neglected.An elasto-plastic kinematic hardening constitutive law has been assumed for the reinforcing steel.The bars fail when a prescribed plastic strain accumulation limit is achieved. Such ultimate limitis the one recorded in a monotonic, or low-fatigue cyclic, experimental test. Starting from thisassumption, two distinct indexes measuring the amount of plastic strain developed in tension andin compression have been introduced. Such indexes, respectively, named ‘tensile and compressivesteel damage indexes’, in analogy with the concrete ones, are defined as follows:
d+(−)s =
(1− W+(−)
W+(−)
)/(1− W+(−)
u
W+(−)u
)(13)
In Equation (13) W is the work necessary to deform the elastic–plastic material, while W is thecorresponding work for hypothetical elastic behavior (elastic strain energy). The quantities Wu andWu are the same quantities at the ultimate limit strain of the material. As usual, suffixes ‘+’ and‘−’ refer to the tensile and compressive strain state, respectively.
In the initial elastic field, the steel damage parameters are null. The unitary value is reachedwhen the bar strain exceeds the ultimate plastic limit strain in tension or in compression: in thiscase the bar breaks irreversibly and both the damage parameters are permanently set equal to 1.
A different condition for which the compressive steel damage index d−s can temporary assume
a unitary value is when a compressed bar buckles, as explained below.The buckling phenomenon takes place when longitudinal reinforcing bars inside RC members
undergo lateral deformation when subjected to compressive strain. It is mainly associated withgeometrical nonlinearity and can reduce the ultimate strength and ductility of the whole structureconsiderably, e.g. [17].
The critical buckling load depends on the bar’s lateral restraints, i.e. on ties arrangement, coverand core concrete and on their damage conditions.
On the basis of the work by Bresler and Gilbert [18], Pantazopoulou [21] has proposed thefollowing expression for the critical load:
PE =(4�2Er Ib)/L2b+�kL2
b (14)
where Ib is the moment of inertia of the bar, �=(�2+4)/(16�2) is a constant coefficient, Lb isthe wave length of the buckled bar that may span several tie spacings and k=K/S is a fictitiousdistributed tie stiffness equal to the ratio between the stiffness of the system of stirrups K and
Copyright q 2009 John Wiley & Sons, Ltd. Earthquake Engng Struct. Dyn. 2009; 38:1027–1049DOI: 10.1002/eqe

1032 R. SCOTTA ET AL.
the tie spacing S. The symbol Er stands for the ‘reduced modulus’ assumed equal to the steelhardening modulus in the stress–strain path.
In the case of a longitudinal bar, the stiffness K can be calculated considering the axial or theflexural resistance of stirrups, depending on the rebar arrangement and on the geometrical andmechanical properties of the stirrups themselves. The wave length was calculated by minimizationof Pcr with respect to Lb, leading to:
Lb=[4�2Er Ib/(�k)]1/4 (15)
rounded to a multiple of actual tie spacing S.An alternative estimate of the wave length was proposed by Dhakal and Maekawa [17]. The
value of the tie stiffness Kn , necessary to stabilize the longitudinal bar in the nth buckling mode,that is, having Ln =nS, was obtained by searching the minimum of the potential energy withrespect to the maximum amplitude.
In all the previously cited works, the direct interaction between the longitudinal bar and theconcrete core has been disregarded, except for the modification introduced in the tie stiffness.Actually, a certain interaction may take place, since the longitudinal and transversal reinforcementsact as a net that opposes the transverse concrete core expansion of axially loaded members dueto the Poisson effect and to the cracking phenomena. Bayrak and Sheikh [26] have accounted forthis interaction considering an equivalent distributed load that the core concrete exerts on the rebarin order to evaluated their lateral deflection, but disregarding the second-order effect due to axialload in the longitudinal bars.
Owing to the different simplifications assumed, most of the proposed formulas, when appliedto experimental tests in which rebars had actually buckled, frequently give a prediction of criticalaxial stress even greater than the steel’s ultimate strength.
In general, the buckling phenomenon depends on the slenderness of the compressed member.For very slender bars, the critical buckling load tends toward the theoretical Euler buckling load,whereas the ultimate steel compressive strength condition gives the ultimate load of short bars. Inmost practical cases, considering the usual diameter of reinforcing bars, and stirrups spacing anddiameter, the slenderness assumes an intermediate value and, therefore, the critical buckling loadis highly influenced by several aspects that are neglected in the existing theories, such as initialimperfection, shear distortion, local hardening of the steel material and the interaction with thecompressed core concrete. Tests conducted on bare bars cannot account for these phenomena, whilethe available tests of RC members often do not report the critical buckling stresses of the bars,but only parameters referring to the onset of the buckling phenomenon. Other tests are thereforeneeded to validate the existing formulations for the critical buckling load estimation, or to developnew ones.
In this paper, the procedure by Dhakal and Maekawa [17] has been adopted for the evaluation ofthe wave length. The slenderness of the bar was assessed by taking into account the reinforcementarrangement and the tie stiffness, then the linear buckling load PE was determined by means ofEquation (14).
Finally, the expected critical load Pcr and the corresponding critical stress have been obtainedby dividing the linear buckling load PE by a coefficient that accounts for all the simplificationsassumed in the calculation:
Pcr= PE/ (16)
Copyright q 2009 John Wiley & Sons, Ltd. Earthquake Engng Struct. Dyn. 2009; 38:1027–1049DOI: 10.1002/eqe
GLOBAL DAMAGE INDEXES 1033
-8 -6 -4 -2 0 2 4 6 8x 10⁻³
–600
–400
–200
0
200
400
600
Strain
Str
ess
[MP
a]
AC
B
D E
F
G
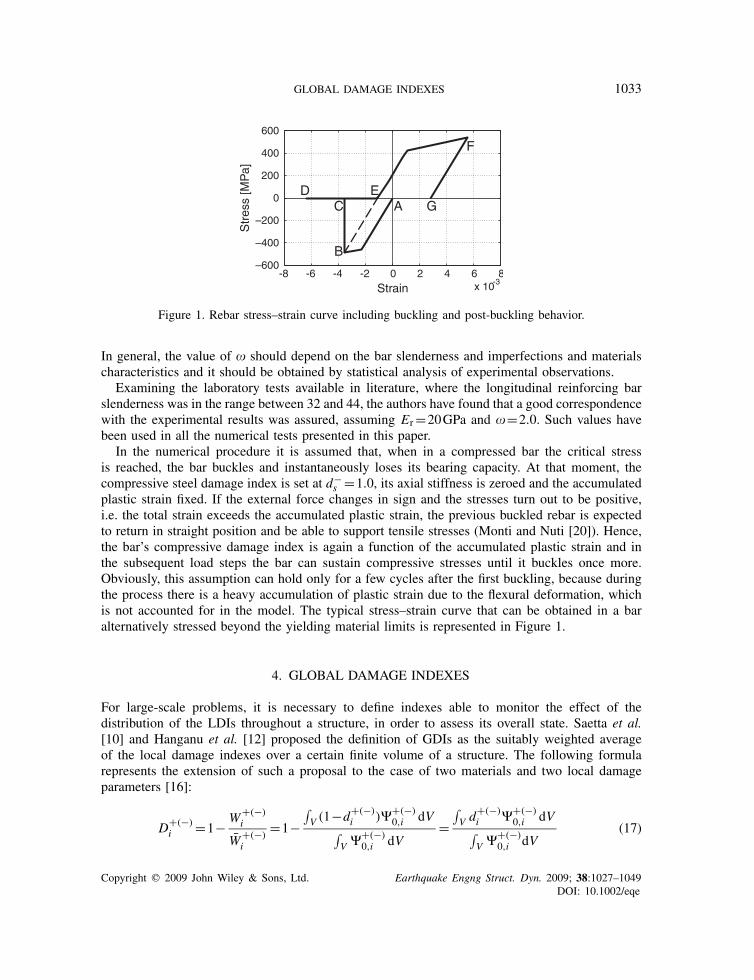
Figure 1. Rebar stress–strain curve including buckling and post-buckling behavior.
In general, the value of should depend on the bar slenderness and imperfections and materialscharacteristics and it should be obtained by statistical analysis of experimental observations.
Examining the laboratory tests available in literature, where the longitudinal reinforcing barslenderness was in the range between 32 and 44, the authors have found that a good correspondencewith the experimental results was assured, assuming Er=20GPa and =2.0. Such values havebeen used in all the numerical tests presented in this paper.
In the numerical procedure it is assumed that, when in a compressed bar the critical stressis reached, the bar buckles and instantaneously loses its bearing capacity. At that moment, thecompressive steel damage index is set at d−
s =1.0, its axial stiffness is zeroed and the accumulatedplastic strain fixed. If the external force changes in sign and the stresses turn out to be positive,i.e. the total strain exceeds the accumulated plastic strain, the previous buckled rebar is expectedto return in straight position and be able to support tensile stresses (Monti and Nuti [20]). Hence,the bar’s compressive damage index is again a function of the accumulated plastic strain and inthe subsequent load steps the bar can sustain compressive stresses until it buckles once more.Obviously, this assumption can hold only for a few cycles after the first buckling, because duringthe process there is a heavy accumulation of plastic strain due to the flexural deformation, whichis not accounted for in the model. The typical stress–strain curve that can be obtained in a baralternatively stressed beyond the yielding material limits is represented in Figure 1.
4. GLOBAL DAMAGE INDEXES
For large-scale problems, it is necessary to define indexes able to monitor the effect of thedistribution of the LDIs throughout a structure, in order to assess its overall state. Saetta et al.[10] and Hanganu et al. [12] proposed the definition of GDIs as the suitably weighted averageof the local damage indexes over a certain finite volume of a structure. The following formularepresents the extension of such a proposal to the case of two materials and two local damageparameters [16]:
D+(−)i =1− W+(−)
i
W+(−)i
=1−∫V (1−d+(−)
i )�+(−)0,i dV∫
V �+(−)0,i dV
=∫V d+(−)
i �+(−)0,i dV∫
V �+(−)0,i dV
(17)
Copyright q 2009 John Wiley & Sons, Ltd. Earthquake Engng Struct. Dyn. 2009; 38:1027–1049DOI: 10.1002/eqe

1034 R. SCOTTA ET AL.
where index i stands for the different materials, that is, c for concrete or s for reinforcing steel,W+(−)
i is the total elastic strain energy due to the positive (negative) strains, W+(−)i is the total
actual potential energy due to the same strains in the damaged material, �0 is the elastic strainenergy density, V is the integration volume.
Conceptually, the GDIs assume the significance of the unit complement of the ratio betweenthe potential energy of the actual damaged structure and the hypothetical potential energy of anelastic structure undergoing the same displacement field. They approach the unit as strain localizesinside a limited zone, transforming the structures into a kinematism.
It has to be stressed that only in the case of a fixed load pattern monotonically increasing, theGDIs are as irreversible as the local ones. Whereas, in a generic load path, since the elastic strainenergies are not increasing functions, also the GDIs are not always monotonically increasing.Nevertheless, the statement that GDIs approaching 1.0 means the crisis of the structure still holds.
Equation (17) defines four distinct GDIs, i.e. D+c , D
−c , D
+s and D−
s that are tensile and compres-sive damage indexes for concrete and reinforcing steel, respectively. The D−
c parameter givesan overall measure of compressive concrete damaging and therefore is related with the loss ofload-carrying capacity of the structure due to excessive compression in concrete. In particular, D−
capproaches the unit as strain localizes inside the compressive damaged zones, up to the formationof a kinematic mechanism of the whole structure, or part of it.
The D+c parameter measures the tensile concrete damaging and its cracking level. Since the
tensile stresses are usually supported by the reinforcing bars, D+c does not represent a safety index,
but offers only useful indications on the serviceability limit state requirements.Definition of further global indexes can be thought out similarly, such as a unique GDI D
weighted over all the different materials forming the structure.
5. LDIS AND GDIS IN THE BEAM FIBER MODEL
The damage evolution laws previously defined have been implemented into a research numericalcode using the standard finite element method. This code deals with 2D frames described by beamfiber elements. Preservation of plain section is assumed, implying a perfect bonding between thereinforcement bars and the surrounding concrete. The damage parameters are evaluated in eachfiber, at the node and in the middle of each element. The integral of Equation (17), appropriatefor continuous media, reduces to a sum when applied to finite elements:
D+(−)i =1−
∑e a
T∫V (e),i B
Tr+(−) dV∑e a
T∫V (e),i B
Tr+(−) dV(18)
In these equations V (e), i indicates the volume of the beam element e of the material i . The sumsare extended to the elements of the whole structure, or any part of it and a and B are the usualnodal displacements vector and matrix B=LN of finite element approach.
Besides the GDIs, in a beam fiber approach, the damage indexes of a single section of eachelement (hereinafter SDI=Section Damage Index) can also be defined. In this case, the LDIs ofthe considered section are averaged over a unitary beam length. Considering the potential energydue to the axial and flexural internal forces separately, more specific SDI could be formulated tostate whether the damage distribution in the considered section and for a specific load combinationproduces more effect in the flexural or in the axial strength of the member. The SDIs allow easy
Copyright q 2009 John Wiley & Sons, Ltd. Earthquake Engng Struct. Dyn. 2009; 38:1027–1049DOI: 10.1002/eqe

GLOBAL DAMAGE INDEXES 1035
monitoring, in every instant of the load process, of the state of the more critical sections of thestructure in a way similar to that proposed by FEMA 356 for concentrated hinges approach.
In order to avoid loss of objectivity due to strain softening localization issues [13], the minimumlength of the damaged zone (the plastic hinge length) should be pre-set, and the suitable beamelement size be selected accordingly. In this work, the empirically validated expression of Paulayand Priestley [25] has been used:
L p =0.08 ·L+0.022 · fy ·db (19)
where L is the length between the end of the member and the point of contraflexure, db and fyare, respectively, the diameter of the longitudinal reinforcing bars and the yield strength.
6. VALIDATION EXAMPLES
The ability of the new FEM damage model to simulate the real behavior of RC structures has beenproved by numerical simulation of some experimental test results.
The tests available at the site of the PEER Structural Performance Database [27], which hasbeen instituted to provide researchers with the necessary information to evaluate and develop RCseismic models, have been used. For each test the PEER site provides the data on the materials,the longitudinal and transversal reinforcement characteristics, the test geometry configuration, thefailure classification, the force-deflection history and the relative displacements, the axial load andthe observed damage.
In particular, tests that showed a flexure critical behavior and also the appearance of rebarbuckling have been considered. This is due to the fact that the main aim of this work is thedevelopment of global indexes for axial and flexural collapse phenomena. Therefore, all theselected test examples deal with structures specifically designed to avoid other modes of failure,e.g. involving shear, torsion, anchorage. However, since fiber models are potentially able to handlesuch different failure phenomena, (as demonstrated, for example, in [28, 29] for shear, in [30, 31]for bond slip and in [32] for torsion), future developments of the proposed model will considerthe possibility of different failure mechanisms and then it could be applied to a structure that wasactually tested, that had members with other modes of failure than the flexural and axial ones.
6.1. Validation test N.1
The first test example was carried out by Gill et al. [33]. It deals with an axially loaded cantileversubjected to imposed horizontal displacements at the top (Figure 2(a)).
The column has a square section 550mm×550mm and length 1200mm. The compressive axialload is 1815 kN and the axial load ratio is about 0.260. The cylindrical strength of the concrete isequal to 23.1MPa and the steel yield stress is equal to 297MPa for stirrups and to 375MPa for thelongitudinal reinforcement. The latter has a failure strength of 636.6MPa and the ultimate plasticstrain is assumed equal to about 1.0%. The column reinforcements consist of 12#24 longitudinalbars with a 40mm clear cover and stirrups 4#10@80mm.
The critical buckling stress evaluated with the proposed method is about 1075MPa, that isgreater than the tensile strength, therefore, rebar buckling is not expected.
Figure 2(b) shows the horizontal displacement history imposed at the top of the column.
Copyright q 2009 John Wiley & Sons, Ltd. Earthquake Engng Struct. Dyn. 2009; 38:1027–1049DOI: 10.1002/eqe

1036 R. SCOTTA ET AL.
0 100 200 300 400 500 600–40
–20
0
20
40
Load stepD
ispl
acem
ent [
mm
]
9
6
3
3
0
6
9
L
P
(b)(a)
Figure 2. Test 1 (Gill et al. [33])—scheme of the cantilever (a) and top imposed displacements history (b).
–1 –0.5 0 0.5 1x 10⁻⁴
–1000
–500
0
500
1000
Curvature [mm-1]
Ben
ding
Mom
ent [
kNm
]
–40 –20 0 20 40–1000
–500
0
500
1000
Displacement [mm]
Load
[kN
]experimental
damage model
damage model
(a) (b)
Figure 3. Test 1—numerical bending moment-base curvature diagram (a) and experimental and numericalforce–top displacement diagrams comparison (b).
Named �yp =3.75mm the displacement at which the first yielding of the longitudinal reinforce-ment occurs, the ratio =�y/�yp represents the ductility, i.e. the measure of penetration into theplastic field. The history of imposed horizontal displacement consists of an initial cycle between=±1.0, then the cycle size increases up to a final value =±9.0. The bending moment-basecurvature diagram (Figure 3(a)) and the force–top displacement diagram (Figure 3(b)) are partic-ularly significant. Both diagrams highlight the initial elastic phase in which the steel has not yetyielded, followed by the phases of steel yielding evidenced by the stiffness reduction.
At the level =3.0 the bending moment-curvature diagram shows, in the unloading path, aweakness around the value M=200kNm, followed by stiffness recovery immediately after theinversion of the curvature sign. This fact, which has been observed also in the experimental tests,can be explained considering that at =3.0 cycle the first strong plasticization of the steel intraction occurs and therefore an appreciable crack opening and damage appears in the compressedconcrete side. At the successive displacement inversion, the steel previously in traction is initiallycompressed, without the concrete contribution because the cracks are still open, and yields. Byincreasing the displacement, the crack closes back, allowing the concrete to be recompressed. At
Copyright q 2009 John Wiley & Sons, Ltd. Earthquake Engng Struct. Dyn. 2009; 38:1027–1049DOI: 10.1002/eqe

GLOBAL DAMAGE INDEXES 1037
0 2 4 6 80
0.2
0.4
0.6
0.8
1.0
Load cycles
Ki /
Ky
0 2 4 6 80
0.2
0.4
0.6
0.8
1.0
Load cycles
GD
Is
GDI c+GDI c-GDI s+GDI s-
1.0 1.4 6.0 9.01.0 1.4 9.03.0
(a) (b)
Figure 4. Test 1—column stiffness reduction (a) and GDIs evolution (b).
this point the section shows a stiffness recovery and the bending moment value reaches the samelevel of the previous cycle. The same mechanism can explain the parts of the diagram with anintermediate slope at =6.0 cycles. During the first of these cycles the compressed concrete isfurther damaged and so the bending moment value is slightly reduced. The same conclusions canbe even better testified by the shape of the load-top displacement diagram in Figure 3(b). It canbe appreciated how the numerical results fit the experimental data closely. The obtained resultscan be used to evaluate the stiffness reduction experienced by the column with the increase of thedisplacement cycles. The stiffness is calculated as the ratio between the load value, at the maximumand the minimum point of the load history, and the related displacement value. Figure 4(a) showsthe stiffness reduction versus load cycles diagram, evidencing the sudden reduction of the sectionstiffness as soon as the yield displacement is exceeded. The evolution of the tension and compressionGDIs is represented in Figure 4(b), for concrete and steel. In this figure, the GDIs appear to be notdecreasing quantities, since they are evaluated only at the load steps in which a relative maximumof the top displacement is reached. As expected D−
c increases with the imposed displacement andfor the level of =9 it approaches the unit. The residual stiffness for =9 is given only by thesteel reinforcements, since the concrete, at this load level, is almost completely damaged.
6.2. Validation test N.2
The second example demonstrates the importance of considering the bar buckling in an RC columnto estimate its strength and ductility correctly.
The test has been carried out by Saatcioglu and Grira [34]. As in the first case, it deals with anaxially loaded cantilever subjected to imposed horizontal displacements at the top.
The column has a 350mm×350mm square section and length 1645mm. The compressive axialload is 961 kN and the axial load ratio is about 0.231. The concrete cylindrical strength is equal to34MPa and steel yield stress is equal to 580MPa for stirrups and to 455.6MPa for the longitudinalreinforcement. The latter has a 660.0MPa tensile strength. The ultimate plastic strain is assumedequal to 1.0%.
The column reinforcements consist of 12#19.5 longitudinal bars with a 29mm clear cover andstirrups 4#6.6@76mm. The predicted wave length is equal to 228mm, that is 3 times the hoopspacing and the critical buckling stress is about 490MPa.
The top horizontal yield displacement is about 14mm.
Copyright q 2009 John Wiley & Sons, Ltd. Earthquake Engng Struct. Dyn. 2009; 38:1027–1049DOI: 10.1002/eqe

1038 R. SCOTTA ET AL.
0 2 4 6 8 100
50
100
150
200
Ductility
Load
[kN
]
0 2 4 6 80
0.2
0.4
0.6
0.8
1.0
Ductility
GD
Is
experimental
damage model with buckling
damage model without buckling
GDI c+GDI c-GDI s+GDI s-
(a) (b)
Figure 5. Test 2 [34]—force–top displacement diagram (a) and evolution of GDIs inthe analysis including bar buckling (b).
Two nonlinear static analyses have been conducted with the proposed damage model. Bothanalyses assume that the amplitude of the horizontal displacement monotonically increasing. Thefirst one disregards, while the second includes, the possibility of bar buckling. The numericaland experimental results are compared in Figure 5(a) in terms of load-displacement diagrams:the improvement of the analysis when the buckling phenomenon is taken into account is clearlyproved.
Figure 5(b) depicts the evolution of the GDIs for the analysis with the buckling effect included.It can be observed that the concrete under compression starts to damage almost immediately due tothe combined effects of the axial and flexural solicitations. After few load steps, the first externalconcrete fiber suffers the initiation of crushing. The steel rebars yield initially in traction andthen in compression. When in the compressive rebars the critical buckling stress is achieved, thecorresponding GDI shows a sudden increase. At this step the tensile stresses are supported bythe intermediate rebar but their distance from the compressive concrete fibers decreases; hence,causing progressive strength decay.
The GDIs evolution can also explain the significant difference between the models with andwithout buckling: actually when the first rebar buckling occurs, the corresponding concrete damageindex is not yet close to unit value and the concrete section can sustain further compressive stresses,but the column stiffness and strength without the contribution of the compressed rebars are farreduced.
6.3. Validation test N.3
The third validation analysis reproduces the test by Tanaka and Park [35] and, similar to the previoustests 1 and 2, deals with an axially loaded cantilever subject to imposed horizontal displacements atthe top. The column has a 400mm×400mm square section and length 1600mm. The compressiveaxial load is 819 kN and the axial load ratio is about 0.2. The measured cylindrical strength of theconcrete is equal to 25.6MPa and the steel yield stress is equal to 333MPa for the stirrups andto 474MPa for the longitudinal reinforcement. The latter has a 721MPa tensile strength and theultimate plastic strain is assumed equal to about 1.0%.
The column is reinforced with 8#20mm longitudinal bars with a 40mm clear cover and3#12@80mm stirrups. The predicted wave length is equal to 160mm, that is, 2 times the hoop
Copyright q 2009 John Wiley & Sons, Ltd. Earthquake Engng Struct. Dyn. 2009; 38:1027–1049DOI: 10.1002/eqe

GLOBAL DAMAGE INDEXES 1039
–100 –50 0 50 100 150–200
–100
0
100
200
Displacement [mm]
Load
[kN
]
experimentaldamage model
0 1 2 3 4 5 60
0.2
0.4
0.6
0.8
1
Ductility
GD
Is
GDI c+GDI c-GDI s+GDI s-
(a) (b)
Figure 6. Test 3 [35]—force–top displacement (a) and evolution of GDIs (b) diagrams.
spacing, and the estimated rebar’s critical buckling stress is about 620MPa. In the experiment thelongitudinal reinforcement buckling had caused the decay of the strength and the column collapsein the last cycle.
Even in this test, experimental and numerical results show a good correspondence in terms offorce–top displacement diagrams (Figure 6(a)). The evolution of maximum GDIs is representedin Figure 6(b). Damage indexes grow significantly as a greater penetration in the ductility field isimposed to structure. Thanks to the different GDIs, it is easy to understand which material andwhich stress state (tension of compression) are more critical for the structure. In addition, in thisexample the GDIs assume unit values at the end of the test when the structure collapse has beenrecorded.
6.4. Conclusions to the validation tests
In all the performed validation analyses it has been demonstrated that the proposed model care-fully reproduces the concrete characteristics and accurately describes the peculiar behavior of thereinforced concrete members. The GDIs appear to be effective compact measures of the structuralintegrity and failure mode.
7. NONLINEAR ANALYSES OF AN HIGH DUCTILITY RC FRAME
7.1. Building design
In this section, the nonlinear static and dynamic analyses of an RC building carried out with thedeveloped numerical code are presented. The aim is to prove the ability of the proposed modelto describe the nonlinear behavior of the designed RC frame and to test the efficacy of SDIs andGDIs. The analyses deal with the typical transversal frame of an RC four-storey structure, framedin two orthogonal directions with symmetrical plan configurations, designed according to EuropeanStandards EC2 [36] and EC8 [22]. The structure is designed as belonging to high ductility class(DCH) and fulfills both the vertical and horizontal regularity requirements. The frame geometryis shown in Figure 7.
Copyright q 2009 John Wiley & Sons, Ltd. Earthquake Engng Struct. Dyn. 2009; 38:1027–1049DOI: 10.1002/eqe

1040 R. SCOTTA ET AL.
16.0 m
12.8
m
30.0 m
Beams section:w 40 , h 35 cm
Columns section:w 40 , h 40 cm
ag
Figure 7. Building’s typical floor and frame geometry.
The frame is 16.40m wide and 12.80m high, the inter-storey height is 3.20m. The interspacebetween the bearing frames is 6.0m. The columns have 40×40cm cross-section and are reinforcedsymmetrically with about 2.36% longitudinal reinforcement ratio; the beams section is w40×h35cm, with longitudinal reinforcement ratio varying between 1.86% for the first floor and 1.29%for the others. The stirrups are arranged according to the EC8 prescriptions and the maximumtransverse reinforcement ratios are about 0.50% for the column and about 0.63% for the beams. Theelementary load conditions are: self-weight and permanent loads 7.0kN/m2, live load 2.0kN/m2. Aseismic design spectrum for ground type B and PGA=0.35g is considered. The importance factor�I chosen is equal to 1.0 and the behavioral factor q=5.85 is assumed for the DCH frame. Thematerials characteristics are fck =25.0MPa for concrete and fyk =430MPa for reinforcing steel.The corresponding mechanical characteristic properties, according to the EC8 prescription for newstructures properties, are introduced in the fiber damage model. For each different type of confiningreinforcement, different values of ultimate concrete strain and strength are chosen according toEquation (7). Referring to the column’s longitudinal rebars, the critical buckling stress is evaluated,after verifying that the designed stirrups remain elastic under the axial and transverse static andseismic internal forces. The critical buckling stress of the ground floor column’s rebars results to beabout 1190MPa, greater than the steel yield strength; hence, the steel buckling was not expected.
7.2. Nonlinear static analysis of the frame
Two nonlinear static analyses of the designed frame have been carried out, considering two differentload patterns applied to the frame: the uniform one, i.e. proportional to the mass, and the modalone, i.e. proportional to the first modal shape. For the uniform load pattern, Figure 8(a) showsthe results in terms of the capacity curve with superimposed evolutions of GDIs averaged on theentire structure. It is worth noting that D−
c starts from a non-zero value. This starting damagelevel is due to the vertical loads, which have been considered as acting on the structure before thebeginning of pushover analysis. For the same reason, D+
c starts from a value already approachingthe unit, the concrete being almost completely cracked under the vertical load alone.
The first element yielding is identified by the appearance of a non-zero value of the tensile steelGDI for a top displacement of 78mm.
The maximum base shear is equal to about 700 kN corresponding to about 200mm top displace-ment. Then the structure shows a softening phase during which the compressive concrete andsteel GDIs quickly grow. The 80% of the residual peak strength is reached at about 524mm top
Copyright q 2009 John Wiley & Sons, Ltd. Earthquake Engng Struct. Dyn. 2009; 38:1027–1049DOI: 10.1002/eqe

GLOBAL DAMAGE INDEXES 1041
Figure 8. Capacity curves and evolutions of GDIs: uniform (a) and modal (b) pushover analyses.
Figure 9. Uniform pushover analysis—deformed shape and contour of tensile steel SDI at �=200mm(a) and compressive concrete SDI at failure �=625mm (b).
displacement. In the subsequent strength decrease, both compressed concrete and steel GDIs tendto the unit value. The formation of a plastic hinge at the peak force step can be easily identified bymeans of the contour map of the tensile steel SDI in Figure 9(a). The first and main bar yieldingtakes place on the right section of the first floor’s fourth beam. All the beams of the first floorenter in the nonlinear field, since in all their right sections there is appearance of damage index.
For the uniform pushover analysis, the distribution of d−c SDI is depicted in Figure 9(b), at the
imposed top displacement of 625mm close to structure failure. It shows clearly that the maximumdamage accumulates at the bases of the ground floor columns: therefore, it can be concludedthat the failure of the structure occurs by concrete crushing in those members, due to excessivecompressive stresses. Similar considerations can be drawn for the modal pushover analysis, whosemain results are summarized in Figure 8(b), in terms of base shear-top displacement curve andGDIs evolution curves.
7.3. Nonlinear dynamic analysis of the frame
In this section, the results obtained by the nonlinear dynamic analysis of the frame subjected to a setof spectrum-compatible seismic excitations are presented. Eighteen different spectrum-compatibleaccelerograms with 0.35 PGA have been generated. Half of them have a duration of 10 s, the other
Copyright q 2009 John Wiley & Sons, Ltd. Earthquake Engng Struct. Dyn. 2009; 38:1027–1049DOI: 10.1002/eqe

1042 R. SCOTTA ET AL.
0 1 2 3 4 50
2
4
6
8
10
12
Period [s]
Spe
ctru
m [m
/s2 ]
average spectrum
elastic spectrum
0.9 elastic spectrum
Figure 10. Check of compatibility of simulated earthquake accelerograms with EC8 elastic spectrum.
Figure 11. Horizontal displacement time histories (a) and evolution of GDIs for a 20 s accelerogram (b).
of 20 s. The proof of the compatibility of the 18 accelerograms’ average spectrum with the EC8design spectrum is shown in Figure 10. Thereby the response of the structure subjected to eachaccelerogram has been evaluated, mainly in terms of GDIs.
For the sake of brevity, the complete results, in terms of displacements, GDIs histories, damagepatterns and bending moment-curvature diagrams, are reported for only one of the accelerograms,with a duration of 20 s, even if the analysis has been extended for further 10 s. Figure 11(a) showsthe time-displacement histories of each floor. During the oscillations the frame reaches a maximumtop displacement value of about 159mm after 16.9 s from the beginning of the analysis. At theend the frame settles in a new equilibrium configuration, characterized by residual displacements.
The evolution of the GDIs versus time is depicted in Figure 11(b). Each time that the structureachieves an increase of maximum displacement, the peak of GDIs grows: after 16.9 s of analyses,the maximum values of D−
c =0.43 and D+s =0.33 are reached as well. These values of the peak
of GDIs testify that the frame is only partially damaged from the earthquake. The contours ofthe SDIs identify the section where the steel plasticization starts. Figure 12(a), which shows thed+s SDI at 1.7 s when the first relative maximum of storey left displacement took place, shows that
the sections that yielded first are the left ones of the third floor’s beams.The maximum values of d−
c , and d+s and d−
s SDIs are reached after 16.9 s from the beginningof the analyses. Their distributions are depicted in Figures 12(b), 13(a) and (b), respectively, and
Copyright q 2009 John Wiley & Sons, Ltd. Earthquake Engng Struct. Dyn. 2009; 38:1027–1049DOI: 10.1002/eqe

GLOBAL DAMAGE INDEXES 1043
Figure 12. Contour of d+s SDI after 1.7 s (a) and of d−
c SDI after 16.9 s (b).
Figure 13. Contour of d+s SDI (a) and of d−
s SDI (b) after 16.9 s.
make it possible to appreciate how the plastic hinge is well distributed all over the beam endsections accordingly with the hierarchy criteria of the high ductility class for which the structurehas been designed. The greater values of the d−
c SDI are located at the base of the ground columns,these elements being subject to the most severe combination of axial and flexural internal forces.The higher values of d+
s SDI occur in the first and second floor beams’ end sections, while smallervalues of d−
s SDI are in the base sections of the ground floor’s columns.The results obtained by the 18 dynamic analyses, represented by means of the maximum base
shear-maximum displacement points, are compared in Figure 14 with the capacity curves obtainedfrom the pushover analyses. It can be noted that almost all of the 18 points from NLD analyses fallwithin the two pushover curves corresponding to uniform and linear distribution of forces. It hasto be remarked that the maximum top displacements from the NLD are all lower than the valueof about 600mm that the pushover analyses indicate as the point of structural failure. This resultmatches the observation that the maximum values of GDIs obtained from NLD are far lower thanthe unit and indicates that the level of assumed PGA can be safely sustained by the frame, eventhough with considerable damaging. In other words, it is possible to affirm that the compliancewith the CP Limit of FEMA 356 has been verified.
From the NLD analyses results it possible to say that each accelerogram requires different valuesof ductility, even if the maximum base shear is almost constant, being limited by the maximumstrength of the frame.
Copyright q 2009 John Wiley & Sons, Ltd. Earthquake Engng Struct. Dyn. 2009; 38:1027–1049DOI: 10.1002/eqe

1044 R. SCOTTA ET AL.
Figure 14. Comparison between pushover curve and nonlinear dynamic maximum results.
Figure 15. Maximum D+c GDI (a), D+
s GDI (b) and D−s GDI (c) versus maximum top displacement.
Figure 15 also proves that the maximum displacement experienced by the frame increases,on average, as the seismic duration increases, from 10 to 20 s. In particular, the maximum topdisplacement increases from 145mm for the group of 10 s duration excitations to 392mm for the20 s group. The good correlation between the maximum displacement level and the maximumvalues of GDIs reached during the time history is demonstrated in Figure 15(a)–(c). For the specificanalyzed frame, there is a fairly linear proportion between the maximum top displacement andthe steel and compressed concrete GDIs. The well-balanced design of the frame is testified bythe fact that the steel’s tensile GDI and the concrete’s compressive GDI evolve in similar waywith displacements. Obviously, such considerations cannot be immediately generalized, but holdonly for the considered frame, at least until after considerable more analyses are performed. Inthe authors’ experience, the statement that the D+
c GDI is not useful to assess the structuralperformance at ultimate limit state, since it always tends toward the unit value, even with lowdisplacement levels, is generally valid.
7.4. Global damage indexes and performance levels
On the basis of the preliminary studies presented in this section, a comparison between the GDIs,as proposed within the fiber damage model approach, and the performance levels defined in FEMA356, although the latter applies to existing buildings only, is presented. To make such a comparison
Copyright q 2009 John Wiley & Sons, Ltd. Earthquake Engng Struct. Dyn. 2009; 38:1027–1049DOI: 10.1002/eqe

GLOBAL DAMAGE INDEXES 1045
Figure 16. Comparison between plastic hinge model and fiber damage model: uniform(a) and modal (b) pushover analysis.
possible, nonlinear pushover analyses of the RC frame with a concentrate plasticity model havealso been performed. The yielding and ultimate bending moment and the yielding rotation of theplastic hinges have been evaluated according with the prescription of EC2. The ultimate rotationcapacity of the plastic hinges for the newly designed buildings has been assumed a value whichis double the one provided by FEMA 356 for existing buildings.
Figure 16(a) (for uniform load pattern) and Figure 16(b) (for modal load pattern) demonstratethat with such assumptions the two distinct methods to performs the pushover analyses, i.e. thefiber beam approach and the concentrate hinge one, agree, the respective capacity curves beingvery close together.
In the same figures, the evolution of the GDIs with top displacement and the FEMA 356performance level limits is also plotted to demonstrate the ability of the proposed GDIs to describeboth the structure’s status and performance. First of all, it is possible to verify that the immediateoccupancy performance level effectively corresponds to the onset of non-zero values of the tensilesteel GDI. This result has a general validity, since the IO level is defined as the occurrence of firstrebar yielding in some point of the structure. At IO level, the compressive concrete GDI rangesbetween 0.15 and 0.2 with the proposed damage model. With regard to the LS level, it correspondsto both D−
c and D−s GDIs within the interval 0.75–0.80, whereas the D+
s GDI is around 0.65.Finally, at the CP level, the D−
c and D−s GDIs fall in the interval 0.9–1.0, i.e. they approach
the unit, and the D+s GDI is around 0.80.
It must be remarked that the values of the GDIs must always be judged in relation to the definitionand evolution laws adopted for LDIs. To give general validity to the proposed methodology, moretests need to be performed, both on new and existing structures.
8. NONLINEAR ANALYSIS OF AN EXISTING RC FRAME
8.1. Building design
This section shows the application of the proposed damage model to a weak-columns RC frame,corresponding to an existing building. To accomplish this aim, the DCH frame analyzed in theprevious section has been modified by reducing both the transversal and the longitudinal steel barsof the ground floor columns, keeping the same concrete section sizes. Referring to the FEMA
Copyright q 2009 John Wiley & Sons, Ltd. Earthquake Engng Struct. Dyn. 2009; 38:1027–1049DOI: 10.1002/eqe

1046 R. SCOTTA ET AL.
356, and according to typical existing building details, the longitudinal reinforcement ratio isassumed equal to 1.51% and the transverse reinforcement ratio has been kept constant along thecolumn length and equal to 0.25%. Therefore, the design of the first storey columns has been madedisregarding the capacity hierarchy provisions.
The reduction of the longitudinal rebar ratio changes the cracked stiffness and the strength ofthe selected sections, whereas the lower transverse reinforcement ratio induces a reduction of theultimate strain and strength of the concrete material model according to Equation (7). For thisreinforcement arrangement, the critical buckling stress of the column’s longitudinal rebar is about374MPa, that is equal to the yield strength. This is due to the fact that a sudden fall of the Youngmodulus appears at that point. Hence, steel buckling can be expected during the analysis.
8.2. Nonlinear static analysis of the frame
To illustrate the difference between the damage model including, and the one disregarding thebuckling model, the capacity curves obtained with the two hypotheses, for uniform and modalload patterns, respectively, are presented in Figure 17(a). The model that doesn’t take into accountthe buckling phenomenon shows a capacity curve with higher peak strength, as well as higherductility, as against the model that takes buckling into account. Such increases are not justified bythe validation examples and by the literature. Concerning the fiber damage model including thebuckling phenomenon, the deformed shape and the D−
c SDI contour map corresponding to thecollapse state of the modal pushover analysis are presented in Figure 17(b). It can be noted thathow the failure of the entire structure is due to a local collapse, since the compressive concretedamage is mostly concentrated in the ground floor column.
8.3. Global damage indexes and performance levels
This section shows the comparison between the GDIs evaluated by using the fiber damage modelincluding the buckling phenomena, and the FEMA 356 performance levels evaluated by using aconcentrated plasticity approach. As for the plastic hinge model used in the previous section, all theplastic hinges of the ground floor columns have been modified according to the new reinforcementratio, and the ultimate rotational capacity has been directly obtained from the FEMA 356 provisionsfor existing building. Figure 18(a) (for uniform load pattern) and Figure 18(b) (for modal loadpattern) show the results in terms of capacity curves with the evolutions of GDIs averaged on
Figure 17. Pushover analyses: different model capacity curves (a) and contour of D−c SDI at �=180mm (b).
Copyright q 2009 John Wiley & Sons, Ltd. Earthquake Engng Struct. Dyn. 2009; 38:1027–1049DOI: 10.1002/eqe

GLOBAL DAMAGE INDEXES 1047
Figure 18. Comparison between plastic hinge model and fiber damage model: uniform(a) and modal (b) pushover analysis.
the entire structure superimposed, and compared with the FEMA performance level limits. Thepushover curves display a low ductility behavior of the frame and both analyses show a failure dueto a weak storey mechanism that occurred at the ground floor. In this case, the structural damageis concentrated in a limited part of the structure and the local collapse causes global collapse.Nonetheless, being the GDIs weighted average of LDIs, assuming the elastic energy as weight, theGDIs themselves grow up to values close to 1, even if only some parts of the structure collapseand the other parts remain nearly elastic. In this example, the first non-zero values of D+
s and thevalues of about 0.2 of the D−
c GDIs characterize the IO limits, similarly to the previous exampledesigned in high ductility. The maximum gradients of D−
c and D−s GDIs correspond to the peak
strength of the capacity curves. At this point, the GDI values range between 0.6 and 0.7 andindicate the LS level. The LS limit calculated by the FEMA is slightly anticipated. In this casesuch a limit is very close to the main bar buckling occurrences and the D−
c and D−s maximum
gradients. The final D−c and D−
s GDIs values, which range between 0.8 and 1.0, sanction the globalcollapse of the structure and the achievement of the CP performance level. It is worth noting thatthe ultimate values of D+
s vary between 0.35 and 0.45, demonstrating the low energy dissipationcapacity of the weak-columns frame compared with the DCH one. Every sudden increase of theD−s GDI means that the buckling phenomenon has occurred at least in one element section. This
section can be easily identified with the aim of the D−c SDI contour maps.
9. CONCLUSIONS
In the framework of continuum damage theory, a new two-parameter damage model for concretehas been proposed. In particular, a new concrete compressive damage evolution law has beendeveloped to evaluate the effect of confining reinforcement in RC structure better. With the aimof describing, in a unitary approach, the steel behavior, specific ‘steel damage indexes’ have beenformulated, taking into account the plastic strain development and the possibility of rebar buckling.A new methodology to estimate the critical buckling load has been formulated, which turned outto be in good agreement with experimental results. An improved and generalized definition of theGDIs has finally been proposed, in order to obtain powerful tools to estimate the performance andthe state of an RC structure.
Copyright q 2009 John Wiley & Sons, Ltd. Earthquake Engng Struct. Dyn. 2009; 38:1027–1049DOI: 10.1002/eqe

1048 R. SCOTTA ET AL.
The improved model has been implemented into a fiber research FEM code, which has been usedto carry out nonlinear analyses of tests examples and of an RC concrete frame structure. In particular,the reliability of the model has been demonstrated by comparison with trusted experimental testson RC column axially loaded and subjected to imposed transversal displacements, some of whichhad presented the rebar buckling.
The static and dynamic nonlinear analyses of two RC frames, respectively, one designed inhigh ductility class and one with weak-columns at the ground floor, have been carried out andthe model has demonstrated its ability to describe the dynamic behavior, the failure mechanismand the energy dissipation of both frames efficiently and accurately. In particular, the GDIs havedemonstrated that they can interpret the development of the overall structural decaying correctly.The contour maps of SDIs have made it possible to evaluate the damage distribution all over thestructure.
Finally, the two RC frames investigated with the fiber approach have been studied with aconcentrated plastic hinge approach as suggested by FEMA 356. A clear correlation between theGDIs here proposed and the Performance Level proposed by FEMA has been demonstrated forthe test examples. Even though more analyses and comparisons have to be performed, especiallywith regard to existing buildings, the method proposed here appears to be a tool that could beused profitably for the structural seismic safety assessment, when distributed nonlinear models areemployed. Further efforts have to be spent to extend the proposed approach in three-dimensionalcodes and to keep into account failure mechanism of the beams related to shear and torsionsolicitations, as well as to failure of anchorage.
REFERENCES
1. Lai S, Will G, Otani S. Model for inelastic biaxial bending of concrete members. ASCE Journal of StructuralEngineering 1984; 110:2563–2584.
2. Spacone E, Filippou FC, Taucer FF. Fiber beam-column model for nonlinear analysis of R/C frames. I:formulation. Earthquake Engineering and Structural Dynamics 1996; 25:711–725.
3. Spacone E, Filippou FC, Taucer FF. Fiber beam-column model for nonlinear analysis of R/C frames. II:applications. Earthquake Engineering and Structural Dynamics 1996; 25:727–742.
4. Coleman J, Spacone E. Localization issues in nonlinear force-based frame elements. ASCE Journal of StructuralEngineering 2001; 127:1257–1265.
5. Lubliner J, Oliver J, Oller S, Onate E. A plastic-damage model for concrete. International Journal of Solids andStructures 1989; 25:299–326.
6. Mazars J, Pijaudier-Cabot G. Continuum damage theory—application to concrete. ASCE Journal of EngineeringMechanics 1989; 115:345–365.
7. Faria R, Oliver J, Cervera M. A strain-based plastic viscous-damage model for massive concrete structures.International Journal of Solids and Structures 1998; 35:1533–1558.
8. Lee J, Fenves GL. Plastic-damage model for cyclic loading of concrete structures. ASCE Journal of EngineeringMechanics 1998; 124:892–900.
9. Saetta A, Scotta R, Vitaliani R. Mechanical behavior of concrete under physical-chemical attacks. ASCE Journalof Engineering Mechanics 1998; 10(124):1100–1109.
10. Saetta A, Scotta R, Vitaliani R. Coupled environmental-mechanical damage model of RC structures. ASCEJournal of Engineering Mechanics 1999; 8(125):930–940.
11. Scotta R, Vitaliani R, Saetta A, Onate E, Hanganu A. A scalar damage model with a shear retention factor for theanalysis of reinforced concrete structures: theory and validation. Computers and Structures 2001; 79:735–755.
12. Hanganu AD, Onate E, Barbat AH. A finite element methodology for local/global damage evaluation in civilengineering structures. Computers and Structures 2002; 80:1667–1687.
13. Legeron F, Paultre P, Mazars J. Damage mechanics modeling of nonlinear seismic behavior of concrete structures.ASCE Journal of Structural Engineering 2005; 131:946–955.
Copyright q 2009 John Wiley & Sons, Ltd. Earthquake Engng Struct. Dyn. 2009; 38:1027–1049DOI: 10.1002/eqe

GLOBAL DAMAGE INDEXES 1049
14. Federal Emergency Management Agency. Prestandards and commentary for the seismic rehabilitation of buildings.FEMA 356, Federal Emergency Management Agency, Washington, DC, 2000.
15. DiPasquale E, Cakmak AS. Detection of seismic structural damage using parameter-based global indices.Probabilistic Engineering Mechanics 1990; 51:60–65.
16. Saetta A, Scotta R, Tesser L, Vitaliani R. Nonlinear analysis of reinforced concrete structures with a fibertwo-parameters damage model. 2nd Fib International Congress, Naples, 5–8 June 2006.
17. Dhakal RP, Maekawa K. Reinforcement stability and fracture of cover concrete in reinforced concrete members.ASCE Journal of Structural Engineering 2002; 128:1253–1262.
18. Bresler B, Gilbert H. Tie requirements for reinforced concrete columns. ACI Journal 1961; 58:555–570.19. Papia M, Russo G, Zingone. Instability of longitudinal bars in RC columns. ASCE Journal of Structural
Engineering 1998; 92:605–616.20. Monti G, Nuti C. Nonlinear cyclic behavior of reinforcing bars including buckling. ASCE Journal of Structural
Engineering 1992; 118:3268–3284.21. Pantazopoulou SJ. Detailing for reinforcement stability in RC members. ASCE Journal of Structural Engineering
1998; 124:623–632.22. Comite Europeen de Normalisation (CEN). Eurocode 8: Design of Structures for Earthquake Resistance Part 1:
General Rules, Seismic Actions and Rules for Buildings. Comite Europeen de Normalisation: Bruxelles, 2004.23. Kent DC, Park R. Flexural members with confined concrete. ASCE Journal of Structural Division 1971; 97:
1969–1990.24. Mander JB, Priestley MJN, Park R. Observed stress-strain behavior of confined concrete. ASCE Journal of
Structural Engineering 1988; 114:1827–1849.25. Paulay T, Priestley MJN. Seismic Design of Reinforced Concrete and Masonry Buildings. Wiley: New York,
1992.26. Bayrak O, Sheikh S. Plastic hinge analysis. ASCE Journal of Structural Engineering 2001; 127:1092–1100.27. Berry M, Parrish M, Eberhard M. PEER Structural Performance Database. User’s Manual. Pacific Earthquake
Engineering Research Centre: University of California, Berkeley, 2004.28. Taylor RL, Filippou FC, Saritas A, Auricchio F. A mixed finite element method for beam and frame problems.
Computational Mechanics 2003; 31:192–203.29. Marini A, Spacone E. Analysis of reinforced concrete elements including shear effects. ACI Structural Journal
2006; 103:645–655.30. Monti G, Spacone E. Reinforced concrete fiber beam element with bond-slip. ASCE Journal of Structural
Engineering 2000; 126:654–661.31. Salari MR, Spacone E. Finite element formulations of one-dimensional elements with bond-slip. Engineering
Structures 2001; 23:815–826.32. Trogrlic B, Mihanovic A. The comparative body model in material and geometric nonlinear analysis of space
R/C frames. Emerald Engineering Computations 2008; 25:155–171.33. Gill WD, Park R, Priestley MJN. Ductility of rectangular reinforced concrete columns with axial load. Report 1,
Department of Civil Engineering, University of Canterbury, Christchurch, New Zealand, 1979.34. Saatcioglu M, Grira M. Confinement of reinforced concrete columns with welded reinforcement grids. ACI
Structural Journal 1999; 96:29–39.35. Tanaka H, Park R. Effect of lateral confining reinforcement on the ductile behavior of reinforced concrete
columns. Report 2, Department of Civil Engineering, University of Canterbury, Christchurch, New Zealand, 1990.36. Comite Europeen de Normalisation (CEN). Eurocode 2: Design of Concrete Structures Part 1-1: General Rules
and Rules for Buildings. Comite Europeen de Normalisation: Bruxelles, 2003.
Copyright q 2009 John Wiley & Sons, Ltd. Earthquake Engng Struct. Dyn. 2009; 38:1027–1049DOI: 10.1002/eqe
Copyright © 2022 FDOKUMEN