Global Climate Change and the Coastal Areas of the Río de la ...
138
Global Climate Change and the Coastal Areas of the Río de la Plata A Final Report Submitted to Assessments of Impacts and Adaptations to Climate Change (AIACC), Project No. LA 26
-
Upload
khangminh22 -
Category
Documents
-
view
1 -
download
0
Transcript of Global Climate Change and the Coastal Areas of the Río de la ...

Global Climate Change and theCoastal Areas of the Río de la Plata
A Final Report Submitted to Assessments of Impacts andAdaptations to Climate Change (AIACC), Project No. LA 26

(Page intentionally left blank)

Global Climate Change and theCoastal Areas of the Río de la Plata
A Final Report Submitted to Assessments of Impacts andAdaptations to Climate Change (AIACC), Project No. LA 26
Submitted by Vicente BarrosCIMA/Faculty of Sciences, University of Buenos Aires, Buenos Aires,
Argentina
2005
Published byThe International START Secretariat
2000 Florida Avenue, NWWashington, DC 20009 USA
www.start.org

Contents
About AIACC…………………………………………………………………………...page v
Summary Project Information…………………………………………………………page vi
Executive Summary……………………………………………………………………page vii
1 Introduction ..............................................................................................................................................................1
2 Characterization of Current Climate and Scenarios of Future Climate Change ......................................4
2.1 ACTIVITIES CONDUCTED..................................................................................................................................42.2 DESCRIPTION OF SCIENTIFIC METHODS AND DATA......................................................................................4
2.2.1 General overview of the methodology..................................................................................................42.2.2 Tides and the river level rise....................................................................................................................52.2.3 Storm surges .............................................................................................................................................102.2.4 Mean wind field.......................................................................................................................................132.2.5 The main Plata tributaries: Paraná and Uruguay rivers ..................................................................242.2.6 The greatest discharges of the Paraná River.......................................................................................252.2.7 Geology, geomorphology and Delta accretion ..................................................................................282.2.8 Topography...............................................................................................................................................382.2.9 Hydrodynamic modelling......................................................................................................................462.2.10 Flood modelling.......................................................................................................................................58
2.3 RESULTS ...........................................................................................................................................................612.3.1 Hydrologic scenarios...............................................................................................................................612.3.2 Recurrent flood Maps .............................................................................................................................672.3.3 Permanent flood.......................................................................................................................................722.3.4 Relative weight of the forcings of the Plata River level....................................................................732.3.5 The wind influence in the levels of the Plata River...........................................................................75
2.4 CONCLUSIONS.................................................................................................................................................763 Socio-Economic Features......................................................................................................................................77
3.1 ACTIVITIES CONDUCTED................................................................................................................................773.2 DESCRIPTION OF SCIENTIFIC METHODS AND DATA....................................................................................77
3.2.1 Delimitation of study area .....................................................................................................................773.2.2 Available demographic information....................................................................................................783.2.3 Critical review of the concept of vulnerability...................................................................................79
3.3 SOCIAL VULNERABILITY INDEX: SELECTED DEFINITION AND INDICATORS................................................803.4 RESULTS ...........................................................................................................................................................803.5 CONCLUSIONS.................................................................................................................................................82
4 Impacts and Vulnerability...................................................................................................................................83
4.1 ACTIVITIES CONDUCTED................................................................................................................................834.2 DESCRIPTION OF SCIENTIFIC METHODS AND DATA....................................................................................83
4.2.1 Socio economic vulnerability to recurrent floods..............................................................................834.2.2 Exposure of facilities to recurrent flooding ........................................................................................834.2.3 Current and future damage costs .........................................................................................................844.2.4 Public services infrastructure ................................................................................................................844.2.5 Building infrastructure ...........................................................................................................................894.2.6 Economic quantification of flood damages ........................................................................................90
4.3 RESULTS ...........................................................................................................................................................934.3.1 Socio economic vulnerability to recurrent floods..............................................................................94

4.4 CONCLUSIONS...............................................................................................................................................1035 Adaptation.............................................................................................................................................................105
5.1 ACTIVITIES CONDUCTED..............................................................................................................................1055.2 DESCRIPTION OF SCIENTIFIC METHODS AND DATA..................................................................................105
5.2.1 La Boca neighbourhood........................................................................................................................1055.2.2 Avellaneda Municipality......................................................................................................................106
5.3 RESULTS .........................................................................................................................................................1075.3.2 Other vulnerable areas of metropolitan area of Buenos Aires......................................................112
5.4 CONCLUSIONS...............................................................................................................................................1136 Capacity Building Outcomes and Remaining Needs .................................................................................114
6.1 WORKSHOPS..................................................................................................................................................1146.2 OTHER TRAINING ACTIVITIES SUPPORTED BY THE PROJECT ......................................................................1146.3 COURSES ........................................................................................................................................................114
6.3.1 Course for students ...............................................................................................................................1146.3.2 Courses on climate change for journalists ........................................................................................115
6.4 STUDENTS ......................................................................................................................................................1156.5 GENERAL CAPACITY BUILDING ACCOMPLISHMENTS.................................................................................1156.6 REMAINING CAPACITY NEEDS......................................................................................................................116
7 National Communications, Science-Policy Link Ages and Stakeholder Engagement.......................117
7.1 NATIONAL COMMUNICATION.....................................................................................................................1177.2 CONTRIBUTION TO UNFCCC ACTIVITIES ..................................................................................................1177.3 IPCC ..............................................................................................................................................................1177.4 NATIONAL POLICIES.....................................................................................................................................1177.5 STAKEHOLDER ENGAGEMENT......................................................................................................................117
8 Outputs of the Project.........................................................................................................................................119
8.1 PUBLISHED IN PEER-REVIEWED JOURNALS..................................................................................................1198.2 OTHER OUTPUTS............................................................................................................................................119
9 Policy Implications and Future Directions....................................................................................................121
10 References.........................................................................................................................................................122

v
About AIACCAssessments of Impacts and Adaptations to Climate Change (AIACC) enhances capabilities in thedeveloping world for responding to climate change by building scientific and technical capacity,advancing scientific knowledge, and linking scientific and policy communities. These activities aresupporting the work of the United Nations Framework Convention on Climate Change (UNFCCC) byadding to the knowledge and expertise that are needed for national communications of parties to theConvention.
Twenty-four regional assessments have been conducted under AIACC in Africa, Asia, Latin America andsmall island states of the Caribbean, Indian and Pacific Oceans. The regional assessments includeinvestigations of climate change risks and adaptation options for agriculture, grazing lands, waterresources, ecological systems, biodiversity, coastal settlements, food security, livelihoods, and humanhealth.
The regional assessments were executed over the period 2002-2005 by multidisciplinary, multi-institutional regional teams of investigators. The teams, selected through merit review of submittedproposals, were supported by the AIACC project with funding, technical assistance, mentoring andtraining. The network of AIACC regional teams also assisted each other through collaborations to sharemethods, data, climate change scenarios and expertise. More than 340 scientists, experts and studentsfrom 150 institutions in 50 developing and 12 developed countries participated in the project.
The findings, methods and recommendations of the regional assessments are documented in the AIACCFinal Reports series, as well as in numerous peer-reviewed and other publications. This report is onereport in the series.
AIACC, a project of the Global Environment Facility (GEF), is implemented by the United NationsEnvironment Programme (UNEP) and managed by the Global Change SysTem for Analysis, Researchand Training (START) and the Third World Academy of Sciences (TWAS). The project concept andproposal was developed in collaboration with the Intergovernmental Panel on Climate Change (IPCC),which chairs the project steering committee. The primary funding for the project is provided by a grantfrom the GEF. In addition, AIACC receives funding from the Canadian International DevelopmentAgency, the U.S. Agency for International Development, the U.S. Environmental Protection Agency, andthe Rockefeller Foundation. The developing country institutions that executed the regional assessmentsprovided substantial in-kind support.
For more information about the AIACC project, and to obtain electronic copies of AIACC Final Reportsand other AIACC publications, please visit our website at www.aiaccproject.org.

vi
Summary Project InformationRegional Assessment Project Title and AIACC Project No.
Global Climate Change and the Coastal Areas of the Río de la Plata (LA 26)
Abstract
The Argentine coast of the Plata River, including the metropolitan area of Buenos Aires, is subjectto flooding when there are strong winds from the southeast, called sudestadas. As sea level rises asa result of global climate change, storm surge floods will become more frequent in this denselypopulated area. To investigate vulnerabilities of local populations to flooding, and examinepotential adaptation options, present and future scenarios of recurrent flooding provoked bystorm surges were developed for the Argentine coastal areas of the Plata River. Future scenarioswere developed for the decades of 2030 and 2070 using a hydrodynamic model of the Riverforced by sea level, and surface winds. The model was calibrated and tuned to reproduce thestatistics of the River level at the places with tide data and was used to the estimate of themaximum storm tide values along the coast of the Plata River, overcoming the lack of basic data.Sea level rise and meteorological fields to determine surface winds were taken from the IPCCThird Assessment Report. For calculating the reach of floods over land, it was necessary toconstruct a digital topographic map with enough resolution to describe the flooded areas. Resultsfrom the model and the digital model were combined in a geographic information system (GIS)to calculate the spatial reach of flooding at different return periods, both for current and forfuture scenarios.
The areas at risk of flooding during this century in Plata River coasts are very small, but the socialand economic impact of the increasing frequency of floods by storm surges will be important.The number of people facing a risk of at least one flood every 100 years would be about 1,700,000in the 2070 decade, more than three times the present population. By the same decade, those thatwould suffer floods every year would be 230,000, about six times the population that arecurrently exposed to annual flooding. Under the assumptions that no adaptation measureswould be implemented, the estimate of losses including real estate damages and the incrementaloperational costs of the coastal facilities for the period 2050-2100 would range from 5 to 15 billionUSD dollars depending on the speed of the sea level rise and of the rate of growth of theinfrastructure.
Administering Institution
UBATEC SA, University of Buenos Aires, Buenos Aires. Argentina.
Participating Stakeholder Institutions
Fundación Ciudad, Buenos Aires, Argentina.
Countries of Primary Focus
Argentina and Uruguay
Case Study Areas
Metropolitan area of Buenos Aires, La Boca and Avellaneda neighborhoods.
Systems and Sectors Studied
Coastal zones, human settlements, infrastructure, real estate
Groups Studied

vii
Urban poor
Sources of Stress and Change
Sea level rise and change in surface level atmospheric circulation
Project Funding and In-kind Support
AIACC: US$ 115,000 grant; University of Buenos Aires: US$ 25,000 financial contribution andUS$ 100,000 in-kind contribution; University of la República US$ 10,000 in-kind contribution.
Investigators
Principal Investigator: Vicente Barros, CIMA/Faculty of Sciences, University of Buenos Aires,Ciudad Universitaria, 1428 Buenos Aires, Argentina. E-mail: [email protected]
Other Investigators: Susana Bischoff, Faculty of Sciences, University of Buenos Aires, Argentina;Walter Vargas, Faculty of Sciences, University of Buenos Aires, Argentina; Jorge Codignotto,Faculty of Sciences, University of Buenos Aires, Argentina; Angel Menéndez, Faculty ofEngineering, University of Buenos Aires, Argentina; Claudia Natenzon, Faculty of Filosophy,University of Buenos Aires, Argentina; Rubén Caffera, Department of Physics, University of laRepública, Uruguay; Mario Bidegain, Department of Physics, Uruguay; Roberto Kokot, Faculty ofSciences, University of Buenos Aires, Argentina; Inés Camilloni, CIMA/Faculty of Sciences,University of Buenos Aires, Argentina; Enrique D’Onofrio, Department of Hydrography,Argentine Navy; Mónica Fiore, Department of Hydrography, Argentine Navy; Moira Doyle,CIMA/Faculty of Sciences, University of Buenos Aires, Argentina; Gustavo Escobar, Faculty ofSciences, University of Buenos Aires, Argentina; Walter Dragani, Faculty of Sciences, Universityof Buenos Aires, Argentina; Silvia Romero, Department of Hydrography, Argentine Navy; ElviraGentile, Faculty of Filosophy, University of Buenos Aires, Argentina; Julieta Barrenechea, Facultyof Filosophy, University of Buenos Aires, Argentina; Sebastián Ludueña, Sub Secretary of WaterResources, Argentina; Sergio Martin, Faculty of Sciences, University of Buenos Aires, Argentina;Ana Micou, Faculty of Filosophy, University of Buenos Aires, Argentina; Ana Murgida, Facultyof Filosophy, University of Buenos Aires, Argentina; Mariano Re, Faculty of Engineering,University of Buenos Aires, Argentina; Ezequiel Marcuzzi, Faculty of Sciences, University ofBuenos Aires, Argentina; Victor Kind, Faculty of Engineering, University of Buenos Aires,Argentina; Silvia González, Faculty of Filosophy, University of Buenos Aires, Argentina; andDiego Ríos, Faculty of Filosophy, University of Buenos Aires, Argentina.

viii
Executive Summary
Research problem and objectives
The Plata River is a fresh water estuary of unique features. At its source, it has already a width of 50 Km,and broadens up to 90 Km in the section Montevideo – Punta Piedras (Fig. 1). The estuary, upstream ofthis section, is known as the inner Plata River. The front of salinity is downstream near this section, but atthe outer part of the estuary the salinity is still lower than in the ocean, though gradually increases up tothe Punta del Este – Punta Rasa section where it reaches the oceanic values. In this section, considered theouter limit of the Plata River, the width of the estuary is 200 Km.
The dimensions and shape of the Plata River together with its very slight slope of the order of 0.01 m /Km favour the propagation from the ocean of astronomic and storm surge tides without discontinuities.Because of the progressive reduction of the estuary’s depth and width towards its interior, these tidesincrease in height as they propagate towards its interior.
The strong winds from the southeast drag the waters towards the Plata River and produce very highlevels, especially if they are simultaneous with high astronomic tides. These events are locally known assudestadas and are the cause of floods along the low coasts of the Argentine margin. The typical durationof the flood caused by the sudestadas ranges from a few hours up to 2 or 3 days. These storm surges arehigher on the Argentine coast than in the Uruguayan one due to the effect of the Coriolis force, but inaddition, because of its lower coasts, the sudestada floods usually only influence the Argentine margin.The more affected areas are the south Samborombón Bay, the low coasts of the southern Great BuenosAires, and the zones near the outlets of the Riachuelo and of the Reconquista River, as well as the front ofthe Paraná Delta.
The coasts of the Plata River house near 14 million inhabitants, most of which live in the Metropolitanregion that includes Buenos Aires city. As the sea level rises as a result of Climate Change, storm surgefloods will become more frequent in this densely populated area. The following questions guided most ofthe Project activity: How many people are currently affected by recurrent floods and how frequent? Whatare their adaptation capabilities? What is the damage to the infrastructure and to the real-estate propertycaused by these floods? Considering the likely sea level rise in the twenty first century: How will itchange the return periods of floods and consequently how much additional population will be affected?How and where will the social vulnerability to floods worsen and how much will it increase the cost ofthese events? Finally, it was intended to estimate if there were areas enduring floods, how many peoplewill be affected by them? In brief, the objective of the Project was to assess the social and economicvulnerability to the water level rise in the Argentine coast of the Plata River that will be caused by theClimate Change.
Approach
Mean and storm surge levels were simulated by a two-dimensional hydrodynamic model with highspatial (2.5 km) and temporal (1 minute) resolution. The model is based on a finite difference implicitalternating direction method. It is forced with the astronomical tide at the southern border, the riverdischarges at the upstream border and the wind field over the whole domain. The model domain is largeenough to include the fetch zone for the storm surges, which are then entirely generated within it. Themodel was calibrated to astronomical tides and storm surges for the period 1990-1999. Then, it wasverified that it reproduces the statistical distribution of the water level at the Buenos Aires port. Afterconfidence in its capacity to reproduce the basic features of storm surges was acquired, the tuning of themodel allowed estimating the maximum tide values of flood events along the coast of the Plata River,thus overcoming the lack of basic data.
For calculating the reach of floods over land, for each level on a point of the coast, the surrounding areathat is below this level on the land was assumed flooded. This method does not consider the backwatereffect on the tributaries, and thus underestimate the flooded area near the mouth of them. To apply this

ix
technique, it was necessary to have altitude maps with enough resolution to describe the flooded areas.The pre-existing documentation of land altitudes (maps or data at some locations) was old and outdatedto take account of the man made modifications of the terrain during the last 20 years, especially on thePlata River coast. In addition, this documentation had a low vertical resolution that was in generalinsufficient to cope with the description of the changes that will be caused by mean water level risescenarios of less than 0.50 m. Thus, it was necessary to develop a new digitized model of the land altitudewith 0.25 m vertical and 1 Km horizontal resolution, using field measurements taken with a differentialGPS and data from satellite interferometer radars. GPS measurements were taken at places that providedkey information according to the geomorphologic maps that were constructed for this purpose. Thesedata was complemented with the information of pre existing lower resolution topographies and withexisting altitude measurements at certain points that were taken at request of the Buenos Aires City.
The assessment of social vulnerability was made through the integration of the physical and socialinformation in a geographical information system (GIS). This system facilitated the estimate of theaffected population, the public service infrastructures and the real-estate damages under differentpossible scenarios. The social information for current conditions was taken from the 1991 census and theeconomic one was estimated, in case of the infrastructure of services, by the technical data provided bythe companies: Real-estate values were estimated by current commercial values considering ninedifferent zones of different socio economic status.
For future scenarios, the socioeconomic conditions for future scenarios were considered constant in time,which is clearly a very strong simplification. On the other hand, the water level conditions wereestimated using sea level and climate values of the A2 scenario reported by the IPCC (2001) as forcingentries to the hydrodynamic model of the Plata River estuary. The SRES A2 scenario makessocioeconomic assumptions and GHG emission trends that are relatively similar to the current ones andtherefore its sea level rise and climatic scenario are approximately what could be expected if not drasticand rapid reductions of GHG emissions will be made in the next decades.
The natural processes of erosion and accretion, as well as the geological conditions of the coast wereevaluated, but they are not included in this report. They are considered to be processes of the secondorder in an environment under strong pressure due to the changes introduced by the direct anthropicaction and the rapid increase of the level of the Plata River. The exception is the Paraná delta growth.Information and old maps of the Paraná delta since 1608 to the present were compiled to document thedelta advance in the last 200-100 years.
The number of persons affected by floods was estimated from the spatial population distribution and theflooded area corresponding to every return period. Though population information is disaggregated insmall areas, social indicators were only available at district level. Therefore, the social structuralvulnerability, which is measured from the social economic indicators, was estimated at district scale,which is only an approximation of its spatial distribution. The indicators that are representative of theresponse capacity to cope with the different stages of the flood emergency were combined to develop asocial index of structural vulnerability. These indicators include aspects of demography, quality of lifeand productive and consumption processes.
An index of exposition to floods was calculated from the return period of floods calculated for every cellof 1 Km2. It was assumed to be approximately the inverse of the return period. Then, an index of socialvulnerability to the floods was developed combining this index of exposition to the floods with the socialstructural vulnerability index through the product of both and a normalization, so the final index rangesfrom 1 to 100 in the area of the study.
The evaluation of the current and future costs includes the real-estate property and the infrastructure ofthe water supply, the sewage system, the plants of power generation, the highways and the railroads. Foreach one of these systems, the incremental costs were evaluated as a function of the level rise of the PlataRiver over its current value. The incremental costs were calculated by the effects of level rise of the riverin every installation according to the technical data supplied by the operators of each facility.
The damage to the real-estate property of each event was estimated as a percentage of its current real-estate value, which includes the direct costs of repair, losses of furniture and costs of depreciation. The

x
areas under potential flood threat of present or future flood were classified in 9 different zones accordingto their current features and real-estate value.
The real-estate cost in each zone for a given event was calculated in accordance with the percentage of theflooded area of the zone and with its total real-estate value.
In order to estimate the mean annual value of the losses due to floods for the current scenario and for thefuture ones, the damages of each event to each of the components of the infrastructure and to both publicand private real-estate property were added. Then, the losses of each flood-type event were combinedwith the recurrence of this type of event to estimate the annual average cost
Two study cases were conducted to gain insight on the social and institutional responses to recurrentfloods during the past and in present times. The selected cases were La Boca neighbourhood in the Cityof Buenos Aires, and the Avellaneda Municipality, in the Metropolitan Area of Buenos Aires. In bothcases, their long tradition in dealing with recurrent floods gave indications on how the population of theGreat Buenos Aires may respond when major adaptation will be required. In both cases, the Projectconducted interviews with officials in charge of the institutions that deal with the different phases offloods (planning, disaster response, etc) as well as with key informers.
Results
The mean Plata River level rise will be a few centimetres greater than the sea level rise because of thewind rotation to the east, which incidentally is already taken place. For the same reason, the level rise inthe Uruguayan coast will be higher than in the Argentine coast and more important towards the interiorof the River.
The areas with risk of enduring flooding during this century in Plata River coasts are very small. Thesouthern coast of the Samborombón Bay presents the large area with such risk. In addition in that area,the characteristics of the soil that could be eroded in relatively little time may accelerate the permanentflooding. The growing front of the Paraná delta has also risk of enduring flooding. However, at present isscarcely settled, but may become an area of social vulnerability if it is occupied in the future. If the spatialdistribution of the population in the metropolitan area of Buenos Aires does not change too much in thiscentury, then the people to be affected by permanent flooding would be very small. Therefore, it isconcluded that assessing climate change risk in the coastal areas of metropolitan region of Buenos Aires ismore a matter of dealing with increasing inland reach of the storm surges than with permanent flooding.
The areas that are now more exposed to storm surge floods are the coast of the Great Buenos Aires to thesouth east of the city, part of the district of Tigre and the coast of the Samborombón. According to the A2SRES scenario, the social vulnerability to floods will become worst in this century along the margins ofthe Reconquista and Matanzas-Riachuelo rivers and in the south of the Great Buenos Aires in zonesrelatively far from the coast.
In a scenario of 0.4 m sea level rise for the 2070 decade with a modest 1% annual rate increases in thepopulation without considerable changes in its distribution and no new defences built, the populationwith risk of some flood (recurrence every 100 years) will amount to about 1,700,000, more than threetimes the present population in such conditions. Those with risk of flood every year will be about 230,000,six times the population that suffer now such recurrence.
Under the assumptions that will not be adaptation measures and any change in real estate property, theestimate of losses including real estate damages and the incremental operational costs of the coastalfacilities for the period 2050-2100 would range from 5 to 15 billion US dollars depending on the speed ofthe sea level rise. Most of this cost originates in real-estate damage. Of course, these assumptions areunlikely to be fulfilled because it will be some sort of adaptation, but the estimates based on them allowassessing the economic burden of Climate Change in the Metropolitan region of Buenos Aires if notaction is taken, from just only one of its impacts, namely the increasing inland reach of the storm surges.
Regarding adaptation, in the areas with frequent flooding, the existence of informal alert networksamong the neighbours tends to diminish the vulnerability to floods. However, in these areas, the

xi
increasing number of newcomers is reducing the collective cultural adaptation to floods. Other flaw inpresent adaptation is that defences against floods were designed without considering the future Riverlevel rise, what may reduce its efficiency in the future.
The institutional responses to floods, although following a similar organization pattern differs from onedistrict to another in its functioning and coordination. In some cases the lack of cooperation between theresponsible institutions creates an additional source of vulnerability.
In the past the occupation of the small areas of very low lands was avoided. This adaptation strategy isbeing ignored now, and the current trends of occupation of lands with flood risk, by both very poorsettlements and gated communities of upper middle class people are not favouring the collectiveadaptation to present and future scenarios of recurrent floods.
Scientific findings
The hydrodynamic model of the estuary was in use to perform an analysis of sensitivity of the Plata Riverreaction to the changes in the variables that determine its level; that is, the sea level, the direction andintensity of the winds and the stream flows contributed by the main tributaries, that is to say the Paranáand the Uruguay rivers. Though the winds cause the greatest variations in the estuary level bygenerating important tides and are also the major cause of the seasonal variations throughout the year,the foreseen sea level changes during the twenty first century will be the principal factor of change in themean level of the estuary. The rotation expected in the mean winds from the northeast towards the eastwill contribute also to the increase of the mean Plata River level continuing the trend observed in the last30 years, adding in this century, probably 5 to 10 cm, but this rise will be lower than the contribution ofthe sea level rise. The discharges from the tributaries, just like in the past, will only contribute a fewcentimetres in cases of exceptional discharges and only near the delta front.
Capacity building outcomes and remaining needs
The active participation in the AIACC Workshops and in other training activities contributed to thecapacity building of the Project participants. Other relevant activities directed to increase awareness inthe society were a course at a Master level in the University of La República, Uruguay in cooperationwith the Project ¨Assessing Global Change Impacts, Vulnerability, and Adaptation Strategies forEstuarine Waters of the Rio de la Plata¨. This cooperation was extended to two courses for journalists inBuenos Aires and Montevideo. The Project supported the thesis of highly qualified students; five of themwere either presented or are in the writing phase and were important contributions to the Project. A newand very important experience for most of the investigators of the Project was the work with stakeholdergroups.
Climate trends in Argentina were significant during the last decades. Thus, it is necessary to start or insome cases improve the current autonomous adaptation and consequently, it is necessary to buildadditional capacities in the study and development of adaptation to climate change.
National Communications, Science-Policy Linkages and StakeholderEngagement
The Project results will be the basic input for the vulnerability study of the coastal area of the region ofBuenos Aires this new study as an enabling activity for the second National Communication Argentina tothe UNFCCC. This task to start on July 2005 was assigned to the Argentine Co PIs of the Project.
The Secretary of Environment and Sustainable Development has developed the Environmental Agendafor Argentina. This planning was based on technical reports and workshops. The climate change issuewas addressed in 14 reports of which 2 were on the Plata River coast and were based on the Projectresults.
The project aimed to achieve an inter-consultation relationship with selected stakeholder organizations.This task focused in the evaluation of the project scope, development and results by the stakeholders.

xii
Institutional actors were consulted both as privileged users of the information produced by the projectand, as key informants due to their expertise and involvement in the issue of floods and theirmanagement. The methodology applied was the induction of a communicative process, with the finalityto go beyond isolated consulting, establishing ruled and continuous mechanisms of association andinterchange with stakeholders during the development of the project
Policy implications and future directions
The results of the Project and their dissemination between the stakeholders provide the basis forregulations of the coastal space favouring the use of activities compatible with recurrent floods. The lackof consideration of climate change in the planning and design of structural works that prevailed untilnow, it is likely to be abandoned, as the results from the Project become known by the specialists and thestakeholders. It is important that projects like the present one be undertaken to address the climate drivenextreme events in the context of the climate change and of other changing factors in other systems andregions of the country.

1
1 IntroductionThe metropolitan area of Buenos Aires including the city of La Plata extends along the coast of the PlataRiver estuary for about 80 Km. The area is the residence to 12 out of the near 14 million inhabitants thatlive along both coasts of the estuary. Figure 1.1 shows the Plata River estuary and the main geographicalreferences addressed throughout this report.
The dimensions and shape of the Plata River together with its very slight slope of the order of 0.01 m /Km favour the propagation of level changes from the ocean into the River, being them either slow trendsor rapid storm surge tides locally known as sudestadas. Thus, the coastal zones of the Plata River areexpected to become more frequent flooded, as the sea level rises as a result of global warming.
Fig.1.1: The Plata River estuary
To address the additional effects of these floods as a result of Climate Change, it is necessary to knowtheir present impacts. Therefore, part of the Project aimed to characterize with a quantitative approachthe current effects of these flood events to assess how many people are currently affected in their homesby recurrent floods, in which zones they live, and with which frequency are affected. Other importantaspects to characterize the present conditions were the social structure of the people perturbed and thedamage to the infrastructure and to the real-estate property caused by these floods. All these impacts willbe worsened during the twenty first century, raising several questions. Some of them were addressed inthe Project; such as how the return periods of floods will change, how many additional people will beaffected, how much the social vulnerability to floods will deteriorate and in which zones, and how muchwill increase the cost of these events if not additional defences are added. Other aspect was to determineif there will be areas with enduring flood, In brief, the objective of the Project was to assess the social andeconomic vulnerability to the Plata River level rise that will be caused by the Climate Change in theArgentine coast.
The level of the shoreline at the port of Buenos Aires is 0.99 m over the mean sea level. The waters thatexceed this value flood over the land. Nevertheless, because of certain step at the beach, in most of the

2
coast of the metropolitan area, the alert level is only at 1.80 m. Table 1 shows the time of recurrence forcertain flood heights calculated with the record of tides of the last 50 years at the Buenos Aires port.
Time of recurrence (years) Height over the mean sea level(m)2.5 2.505 2.8011.2 3.1027.5 3.4079 3.70366 4.00
Table 1.1: Level of the Plata River over mean sea level at the port of Buenos Aires for the indicated times ofrecurrence (D'Onofrio, Fiore and Romero 1999).The values on Table 1.1 are only valid for the port of Buenos Aires because the maximum of the stormsurge tide intensifies as advances towards the interior of the estuary. The time of return of the floods inother localities along the coast of the Plata River cannot be calculated straightforward from long tiderecords because they do not exist. To overcome this obstacle, it was developed a method that calculate thetime of return of extreme water levels along the right margin of the Plata river using a hydrodynamicmodel of the Plata estuary. This model was previously adjusted to simulate the level of the Plata Riverunder a wide variety of conditions. The development and adjustment of this model was one of the maincomponents of the Project.
Future scenarios of mean water level were built forcing the model with the mean sea level taken fromscenarios of the IPCC Third Assessment Report and with winds calculated from global climate modelsselected from the IPCC web page. The River levels corresponding to the different return periods wereestimated for each scenario adding to the present value the estimated mean River level rise.
The construction of a digital model of the land surface was another important element of the Project. Thistool was necessary to calculate the return periods of floods over land, and it was constructed with 0.25 mvertical and 1 Km horizontal resolution, using field measurements taken with a GPS differential systemand data from satellite interferometer radar. GPS measurements were taken at places that provided keyinformation according to the geomorphologic maps that were constructed for this purpose. These datawas complemented with the information of pre existing lower resolution topographies and with altitudemeasurements taken by the Buenos Aires City at certain points.
Other component of the Project was the assessment of the socioeconomic conditions. For the present time,social data were taken from census and for future scenarios, socio-economic conditions were consideredas in present time. Though this a simplistic approach, the history of Argentina during the last century,indicates that unthinkable socioeconomic scenarios had nonetheless taken place and there are few signsthat the socioeconomic indicators may improve too much in the future. Demographic growth followed amore predictable path until now and therefore a simple hypothesis of a 1 % annual growth was adopted.The indicators for the social vulnerability index were selected according to its suitability for theconstruction of the index and their statistical availability.
All the information, physical and social was included in a geographical information system (GIS). Thissystem allowed a geographical and quantitative description of present and future scenarios. For eachwater height on the coast, the area that is below this height on the land was assumed flooded. Then, withthe help of the GIS, it was calculated the distribution of two indexes, one of exposure to recurrent floodsand other of social vulnerability to recurrent floods. The number of persons affected for every returnperiod of flooding was estimated from the spatial population distribution and the flooded areacorresponding to that return period.

3
Finally, with the recurrence of floods over land, the GIS facilitated the assessment of the costs resultingfrom the damage to the real-estate property and to the main components of the infrastructure byrecurrent floods in present or future scenarios.
Natural processes of erosion and accretion, as well as the geological conditions of the coast wereevaluated, but they were considered as second order processes in an environment that is under thepressure of anthropogenic change and of rapid eustatic rise resulting from the sea level change.
Other aspects more qualitative were analyzed separately from the GIS, like the strategies of adaptationadopted by the population and their influence on the future vulnerability, as well as the cultural andinstitutional factors that play an important role in present adaptation.

4
2 Characterization of Current Climate and Scenarios of FutureClimate Change
2.1 Activities Conducted
Since the purpose of the Project was to asses the vulnerability of the coastal areas of the Plata River toclimate change, the activities were not oriented to the characterization of the current climate in general,but to those aspects of climate that were relevant to the hydrology of the Plata River and its trends.Therefore, the tides and the river level trends in the last century, the surge storms and its relation to therecurrent floods of the Argentine coast were analyzed. Since the wind field affects the River level, itstrends were analyzed for both current and future scenarios. The other forcing of the Plata River is thedischarge of the tributaries that only have a minor impact when attain extreme values. Thus, the extremedischarges of the two main tributaries were also studied.
A new digital model of the topography with the required resolution to assess the flooded areas underdifferent scenarios was developed. To construct this model, it was necessary to have geomorphologymaps and as a base for them of the geology. Therefore maps of both aspects were also constructed.
It was developed a two-dimensional hydrodynamic model to simulate the water level of the Plata River.The mode that was calibrated for astronomic and storm tides, and it was validated for both, its mainfields and its statistical distribution of levels. The model was used to develop present and futurescenarios of both recurrent and enduring floods. Other use of the hydrodynamic model was to assess therelative weight of the different forcings of the Plata River level, namely to the tributary discharges, windand sea level.
Finally, combining results of the model with wind trends on the region as well as level trends at BuenosAires and Montevideo it was understood the importance of wind in the seasonal and spatial differencesas well as in the different trends of the Plata River levels.
2.2 Description of Scientific Methods and Data
This description is divided in many parts because of the complexity of the system under study. However,to facility the general understanding, the first section describes what can be considered the generalmethodology of the Project regarding the characterization of the present and future scenarios of floods.Then, the scientific methods and data of different and particular aspects are described in the followingnine sections.
2.2.1 General overview of the methodology
The integration of physical and social information in a geographical information system (GIS) facilitatedthe assessment of the geographic distribution of the population that would be affected by floods, as wellas the public and services infrastructure and the real-estate damages under different possible scenarios.The methodology, used to generate the required physical information, is addressed in the nextparagraphs. The integration with social information to assess potential damages and vulnerability tofloods is discussed in chapter 4.
Scenarios of the Plata river level were developed using sea level and climate scenarios SRES A2 of theIPCC Third Assessment Report (IPCC 2001) as input to a hydrodynamic model of the estuary of the RP.
Mean and the extreme levels at the Argentine coast of the Plata River were simulated by a hydrodynamicmodel. The model is forced by astronomic tides in its south boundary, the discharges of the main PRtributaries near its northwester boundary and the surface wind field over its entire domain. This domainis big enough to simulate the generation and development of storm tides produced by the dragging effectof winds inside it. The spatial resolution of the model is 2.5 Km and the time step is of one minute. The

5
model was calibrated according to both the astronomic and storm tides for the period 1990-1999 and itwas verified that simulates adequately the statistical distribution of water levels at the Buenos Airescoast. Once the model achieved the ability to reproduce the basic features of storm waves along the coast,its final adjustment allowed the estimate of the maximum value of them all along the coast of the PlataRiver so overcoming the lack of basic information, which was available only in a few places along thecoast.
The relationship between winds and water levels is non linear, and therefore, it is not possible to obtainthe mean water level field directly from the mean wind field. Hence, future scenarios of the mean levelrise were developed forcing the model with the mean level of the sea according with the scenarios of theIPCC (2001) and with daily winds calculated from climatic scenarios taken from the same Report. Forfuture scenarios, the flood levels corresponding to each return period were estimated adding theestimated mean increase of the level in that scenario to current levels.
The spatial distribution of flooding over land was estimated using the water levels and a digital model ofthe surface altitude. The resolution of this model is 0.25 m in altitude and 1 Km in the horizontal scale. Itwas built combining measurements taken with a geo position differential satellite system (GPS) andsatellite radar data. The measurements with GPS were taken in key places according to geo morphologicmaps that were made for this purpose, section 2.2.7. This information was completed with data from pre-existing low resolution maps (Geographical Military Institute) and some previous existing measurementstaken by the City of Buenos Aires at certain sites. The four sources of data have limitations that arediscussed in section 2.2.8. Nevertheless, they complemented each other and allowed to develop anacceptable digital model of the surface according with the purpose of this study. The digital modelincludes the Argentine coast of the Plata River from the Paraná Delta to Punta Rasa and extends withinthe continent up to the altitude of 5 m over the mean sea level.
For each water level at a given coast site, it is assumed that the land of the surrounding area under thislevel will be flooded. This approach, neither considers the defended areas, which are relatively verysmall, nor the backwater effect in the tributaries that can produce floods over these levels. In the first case,errors in the region totals, either in the flooded surface, population involved or real estate damage, arenot important. However, errors by underestimation in the second case are larger. Thus, the regional totalscould result in some underestimation.
2.2.2 Tides and the river level rise
Because of the shape and distribution of the depth contours that run parallel to the coastline, theArgentine Sea is open to the great surrounding ocean basin in which astronomical tidal waves propagatefrom SE to NW (Balay 1961). These waves refract on the continental slope, undergoing, from there on, allkind of transformations due to the progressive water shallowing, the meteorological action, and the Earthrotation effects. Because of these facts, tides in the Argentine coasts have very different forms andamplitudes. A way of classifying tides is the method suggested by Courtier (Defant 1961). This methodcharacterizes four main forms of the tide, based on the result of dividing the sum of the amplitudes ofdiurnal waves K1 and O1 by the sum of the semidiurnal M2 and S2, the major constituents in each group.
22
11
SM
OKF
+
+=
The result (F) will be a number smaller than 1 if semidiurnal constituents predominate and greater than 1when diurnal constituents predominate. If 0.25 ! F < 1.5, the tide is mixed and predominatelysemidiurnal. In most of the cases there are two high tides and two low tides per day, with strong diurnalinequalities, although occasionally there can be only one high tide and one low tide per day (Balay 1961).The latter takes place at maximum moon declination. This form can be observed in the Plata River, wherethe tidal component M2 represents more than 65% of the tide wave energy (D`Onofrio et al. 1999).
From co tidal analysis it is known that wave tide propagation along the Argentine coastline up to thePlata River takes approximately 26 hours at a velocity of about 200 km/h, while it takes about 12 hours to

6
travel along the Plata River at a mean velocity of 30 km/h. The slow down at the Plata estuary is due tothe smaller mean depth in the area of only about 5m.
There are two amphydromic points, one at approximately 41° S and the other one at 47° S. From theequal amplitude charts it can be seen that the amplitude of M2 varies from about 4 m in the extremesouth of Argentine to less than 0.30 m in the inner Plata River. Thus, the Plata River can be characterizedby a micro tidal regime of a few centimetres of amplitude and then, the meteorological components;especially the wind regime acquires a decisive relevance in the River dynamics. The wind over thesurface of the water influences its level, the vertical mixing and the wave tide velocity.
The Plata River is under the influence of the South Atlantic subtropical High. Consequently, winddirections depend basically on the position of this pressure system prevailing from the northeast all overthe year. In winter, the shift to the north of this system increases the frequency of winds from the west,while in summer, when it moves southwards, there are more frequent winds from the east and southeast.The average wind intensity in the region is fairly uniform, about 5 m/s.
Sea level rise has been observed in most of the coasts of the planet during the last decades. Because ofthat, the level trends in the Plata River were explored. At the coast of Buenos Aires, there are hourly datarecorded since 1905. Data were referred to a level called the zero of the Riachuelo that is about a meterbelow the mean maximum water level, Fig 2.1.
There are periodic low-frequency astronomic contributions to tides, between 8 and 19 years, which mightmask any trend in the scale of 50 years or less (Godin 1972). To attenuate these contributions a low passfilter was used. This filter was designed starting from the Kaiser – Bessel window (Hamming, 1977)following Harris’s (1978) technique. After that filtering, annual mean water levels were calculated as thearithmetic average of hourly tide levels.
Figure 2.2 shows the series of annual mean levels, the filtered signal and the calculated linear regressionfor the period 1905 – 2001 of the filtered series. The trend obtained was 1.7 ± 0.1 mm/year with acorrelation coefficient of 0.96. The rise in the twentieth century was about 17 cm, approximately 50 % ofwhich occurred in the last 3 decades.

7
Fig.2.1: Relation between topographic (IGM) and tidal references in the Rio de la Plata

8
Fig.2.2: Annual mean water levels, filtered series and linear regression calculated over the latter, BuenosAires
Figure 2.3 shows the mean water levels corresponding to the trimesters, per decade, displaying theadjusted straight lines by least squares. Slopes are in mm/10 years. It can be seen that the highest meanlevels correspond to the summer trimester, while the winter trimester has the lowest mean water levels.These differences in water level are mainly due to meteorological contributions, but can be minor effectsfrom long-term tide constituents such as Sa (solar annual) and Ssa (solar semiannual) and variations inwater density. The comparison with Montevideo, which is at the outer part of the estuary, and for thisreason less affected by the mean wind variations indicates that the wind effect is important, Fig. 2.4. Thisaspect will be discussed in section 2.2.10, and a full discussion of the spatial and seasonal influence ofwind on the Plata River level will be addressed in section 2.3.5.
Although, trends in Montevideo are qualitative similar to those of Buenos Aires, they are lower and thewinter trend has a slightly lower slope than other seasons. The differences are larger in the last threedecades, when the level at Buenos Aires augmented 12 cm, while at Montevideo increased only 5 cmduring the same period. As will be seen in section 2.2.4, water level trends at the Rio de la Plata estuaryare consistent with the low-level circulation trend and constitute additional evidence on the southwardshift of the regional circulation during the last decades.

9
Fig. 2.3: Seasonal mean water levels per decade and corresponding linear regressions, Buenos Aires
Fig 2.4: As in fig.2.3, but for Montevideo

10
2.2.3 Storm surges
Major storm surges are the cause for floods in the Argentine coast of the Plata River. Some low areas ofthe city of Buenos Aires and its surroundings are affected by such events, associated with strongsoutheasterly winds over the Plata River estuary, and for that reason locally known as sudestadas. Thisphenomenon is normally accompanied with persistent, though in general not heavy rainfalls. The higherlevel registered at the coast of Buenos Aires was 3.90 m over the mean sea level in April 15, 1940. Theincreasing trend in the mean sea level in the context of a global warming process may lead to a rise ofabout 1 m during the present century. Under such conditions all the area of the metropolitan BuenosAires that is below 5 m over the mean sea level would be potentially threaten by extraordinary storms.This area includes not only the coastal fringe of the Plata River, but also the populated margins of theMatanza-Riachuelo and Reconquista rivers.
The first storm flood in this area that has been reliably recorded took place on the 5th and 6th of June, 1805.On that occasion strong southeast winds caused a river level rise that seriously affected the coastal area,and caused several ships to sink in the port of Buenos Aires. During the nineteenth century, manydifferent intensity southeaster winds continued to produce considerable damage and even killed people.Unfortunately for these cases, there are no water level records available, as systematic measurements ofthe River levels referred to land benchmarks had not been initiated yet.
Meteorological data used for the storm surge analysis was taken from the NCEP/NCAR reanalysis(Kalnay et al., 1996) for 1951/2000 in the domain between 20º S and 60º S and 80º W and 40º W. Thehydrological data (1951/2000) was provided by the Naval Hydrographic Institute. There was a gap ofmissing data during 1963 and 1964.
Storm surge levels were obtained from the difference between observed hourly levels and theircorresponding astronomic tide predicted levels. Considering the length of the records and the possiblemodifications of astronomical tide by changes in the coasts and in the depth of the estuary, harmonicanalyses were performed for periods of 19 years, using a least square method (Foreman, 1977, 1978).Estimated harmonic constants were calculated for its use in the tide predictions of each period. Thisallowed minimizing possible trends due to tide amplitude variations caused by changes in themorphology of the area between 1950 and 2000. In order to evaluate the quality of the obtainedremainders, yearly spectral analyses were performed. From the spectra analysis, it appears that theenergy present in the semidiurnal and diurnal tide bands is two orders of magnitude lower than theenergy of the astronomical tide, what guarantees that storm surges were correctly separated fromobserved levels.
The maximum value of the two components that define the level of the water, astronomical tide andstorm surge, does not necessarily occur simultaneously. Therefore, since the warning level of the river is2.50 m (Balay 1961) and the astronomical mean maximum tide is approximately 0.90 m (D’Onofrio et al1999), it was adopted as a criterion for defining the meteorological tide, the level of 1.60 m persisting forat least 24 hours. With this criterion an important percentage of the cases actually exceed the 2.5 m mark.There were 297 cases in the 50-year period that satisfied both height and duration thresholds. Hereafter,the term sudestadas will be restricted to these cases.

11
Fig.2.5: Annual distribution of sudestadas in the Plata River
Sudestadas occur during the whole year, the least frequently in winter, Fig 2.5. However, the ones that dooccur in winter have an intense and considerably developed low-pressure system in the north-eastern ofArgentina or Uruguay characteristic of cyclogenesis, and produce, in the average, higher peak levels thanthe others.
Fig .2.6: Distribution of maximum storm tide heights over the threshold of 1.60m
The storm surge height distribution has a decreasing exponential shape, Fig 2.6. Storm surges with peakheight higher than 3 m have near to 1 % probability. Although this percentage implies only 3 cases in 50years, this level must however be taken as guidance for protection management.

12
Fig.2.7: Distribution of the “sudestada” durations
Figure 2.7 shows the empirical distribution of the sudestada duration. It should be considered thataccording to the sudestada definition used here, their duration has to be longer than 24 hours. The meanvalue was 47 hours, the maximum 175 hours and the standard deviation 22 hours. Like in the previouscase, the distribution has a decreasing exponential shape.
Sudestadas ongoing for more than 60 hours are only reached with a probability lower than 20 %. Thus,approximately 80 % of all the sudestada events registered in this period persisted less than two days and ahalf (20 to 60 hours). This is the most likely range considered when estimating the costs associated withthe risks of sudestadas in the Plata and therefore, although their impact can be acute, is short in time, thusmoderating its social and economic adverse effects.
The three principal components of atmosphere circulation field at 1000 hPa accompanying the sudestadasexplain 75 % of the variance. These patterns show that sudestadas are associated with, either acombination of high pressure system to the south of the RP and a relative low pressure to the north (firstand second PC modes not shown) or a very deep low pressure area to the north of the Plata River (thirdPC mode not shown). These three cases are associated with south-eastern winds, which produceimportant tide waves on the Plata River.

13
Fig. 2.8: Decadal distribution of sudestadas in the Rio de la Plata
Almost all the sudestadas associated with the third PC occur in winter and they reach in the averagegreater peak levels than the others. These cases are associated with an intense low-pressure system northof the RP, which are typically due to the frequent cyclogenesis in that region. In many of these cases,intense precipitation occurs in Buenos Aires.
The mean frequency of sudestadas occurrence for the 1950-2000 period was about 6 events/year. Figure 2.8shows the mean decadal frequency of sudestadas for the last five decades. During the 1961-1970 period,there was a reduction in the absolute frequency respect to 1951-1960. However, in the following decades,there was a positive trend in this frequency going from 44 cases in 1961-1970 to 79 cases in 1990 - 2000.The beginning of this trend at the 1970 decade was simultaneous with other climate and hydrologicaltrends in the region.
2.2.4 Mean wind field
Until about 1980, when satellite information became abundant, meteorological data over the SouthAtlantic heavily depended on opportunity observations made by merchant ships. This data wereunfortunately very sparse, both in space and time and only restricted to the surface level. In the case ofwind observations, the density and quality of observation were considerably worse than in pressure, butsince sea level pressure (SLP) is strongly coupled with wind, it may be considered representative of theatmosphere low-level circulation.
SLP analysis presents another advantage; spatial low frequency dominates the time-averaged features ofSLP fields, and thus, data from continental synoptic stations that have been more systematically observedreinforce the credibility of SLP fields off the coast of South America. In addition, the ocean near the SouthAmerican coast has had a better coverage of merchant ships than the middle of the South Atlantic Ocean.Therefore, for all these reasons, the study of a possible trend in the low-level atmospheric circulation ofthe western border of the South Atlantic high (WBSAH) during the second part of the last century wasmade analyzing SLP.
SLP monthly means of the 1951-2000 period were taken from the reanalysis of the National Centre forEnvironmental Prediction (NCEP). These reanalyses are available in 2.5° latitude by 2.5° longitude grid.The domain analysed was between 25°S and 45° S and 65° W y 45° W. Seasonal averages were calculatedfrom monthly means as follows: December, January and February for summer, and so on for the rest ofthe seasons. NCEP reanalyses were run with a frozen model and a database that includes conventionalsurface observations and satellite observations and constitutes one of the most consistent atmosphericglobal data set (Kalnay et al. 1996).
2.2.4.1 The shift of the annual mean field
Decadal averages of NCEP reanalysis of SLP and of surface winds indicate a shift to the south of thepressure field over the area covered by the WBSAH. Fig. 2.9 illustrates this displacement, showing the1951/1960 and the 1990/2000 mean fields, as well as their difference field
a) b)

14
c)
Fig. 2.9: Annual mean fields of sea level pressure and wind: a) 1951-1960, b) 1991-2000, c) differencebetween 1991-2000 and 1951-1960.
The SLP difference field, Fig 2.9c, implies that between latitudes 33° S and 40°S, this change enhanced(reduced) the eastern (western) component of the mean surface wind and indicates a southward shift ofthe anticyclonic circulation. This shift resulted in increasing wind drag on the surface water that, becauseof the shape of the Rio de la Plata estuary, could have caused a water level rise in its inner part(Simionato et al 2003).2.2.4.2 Seasonal and interannual variability
In order to express in a synthetic form the change of the SLP annual cycle during the 1950-2000 period, itwas performed a principal component analysis (PCA) on the matrix data composed of the SLP seasonalmeans of each year. Since for decades or even centuries, the seasonal variability (annual cycle) is expectedto overweight the interannual variability, the first PCs are expected to represent roughly the seasonalvariability while their loading factors might provide information on the interannual variability of theannual cycle.
Following the precedent idea, a rotated PCA in T mode, with the correlation matrix as input allowed theidentification of two SLP patterns that jointly explain 91.2 % of the variance. The other modes explainindividually very small percentages of variance, i.e. less than 4 % each. The PC1 is characterized by astrong meridional gradient south of 35°S, typical of the mean westerly flow, Fig. 2.10a. North of thislatitude, there is a pattern that resembles the WBSAH in the east, and the Chaco low in the west. The PC2field shows an intensified circulation with respect to the PC1 pattern, both in the WBSAH and its ridge at37° S and in the Chaco low centre to the west of 60° W, Fig. 2.10b. PCA 1 represents quite well the broadfeatures of the mean winter SLP field over the region, while PCA 2 does the same with the mean summerSLP field (NCAR/NCEP reanalysis). Even without examining the SLP seasonal fields, the inspection offactor loading (FL) values, with FL1 close to one in winter and similarly with FL2 in summer, permits toregard them as the respective seasonal patterns. In winter, the first PC amounted 20.7 % of the totalvariance out of the 25.2 % explained by all the modes in that season, while the second PC only explains2.9%, Table 2.9. This implies that the PC1 explains more than 80 % of the winter variance, while the PC2does only 11.5 %. Similarly, the PC2 explains 73 % of the summer variance. In spring, as in summer thePC2 is the dominant pattern, while in autumn is the PC1. However, in both cases the dominant PCexplains less variance than in winter or summer. From now on, these two first PCs patterns will bereferred to as the winter and the summer modes.

15
a) b)
Fig. 2.10: Principal components (PC) of annual mean sea level pressure a) PC1 b) PC2
MODE 1 MODE 2 TOTAL
TOTAL 46.1 45.1 100.0SUMMER 5.2 18.2 25.1AUTUMN 15.1 7.5 24.8WINTER 20.7 2.9 25.2SPRING 5.1 16.4 24.9
Table 2.1: Explained variance of the first two modes of the SLPThe annual average series of the FLs corresponding to the winter and summer modes are consistentlypositive, and the winter FL has a negative trend while the summer one has a positive one. In both cases,these trends started at the early 70¨s consistent with the observed trends of the SLP at the South Americancoast, where the maximum pressure along the coast according with the reanalysis shifted about 1.2° oflatitude southward since the early 70s. This trend is significant at a 0.05 confidence level. This implies agrowing predominance of the summer surface circulation type at expenses of the winter one, andtherefore an intensification of the WBSAH circulation and its shift to the south.2.2.4.3 GCM verification
-65 -60 -55 -50 -45
PC1 - NCEP - 46.1%
-45
-40
-35
-30
-25
-65 -60 -55 -50 -45
PC2 - NCEP - 45.1%
-45
-40
-35
-30
-25

16
The region surrounding the Plata River is the area of the present study, Fig. 2.11a. The skill of the GCMsto simulate the observed features of the mean SLP over this region was checked against the NCEP
Fig. 2.11: Monthly spatial correlation coefficients between sea level pressure from the NCEP reanalyzesand six GCMs
reanalyzes. Monthly spatial correlation coefficients were calculated between the GCM outputs and theNCEP reanalyzes. Most of the models had a poor correlation with the reanalysis data during the australwinter months of July, August and September (the only exception was the ECHAM4/OPYC3 model) andhigh correlation during the austral summer and autumn, Fig. 2.11b.
Table 2.2 shows the four models that have the best correlation with NCEP reanalysis during the wintermonths in the selected area. From now on, we will restrict our analysis to these models.
Model Institution PeriodHADCM3 Hadley Centre for Climate Prediction and Research 1950-1999CSIRO-Mk2 Australia's Commonwealth Scientific and Industrial
Research Organization1961-1999
GFDL-R30 Geophysical Fluid Dynamics Laboratory 1961-1999ECHAM4/OPYC3 Max Planck Institute für Meteorologie 1990-1999
Table 2.2: Global Climate Models considered in the analysis
correlation coefficient
-0.4
-0.2
0.0
0.2
0.4
0.6
0.8
1.0
J F M A M J J A S O N D
HADCM3
CSIRO
CCCMA
NCAR
ECHAM4
GFDL
-65 -60 -55 -50 -45
-45
-40
-35
-30
-25
-20
-65 -60 -55 -50 -45
NCEP
-45
-40
-35
-30
-25
-65 -60 -55 -50 -45
HADCM3
-45
-40
-35
-30
-25

17
∞
∞
∞
∞
∞
∞
∞
∞
Fig. 2.12: Annual mean sea level pressure (hPa) for 1950-2000 derived from the NCEPreanalyzes (right top), HADCM3 (left top) and difference between NCEP reanalyzes and HADCM3(bottom)
Table 2.2 also indicates the GCM experiment periods, which starts in the past and extends into the futureforced by GHG concentrations resulted from the socio-economic SRES-A2 scenario. The fact that the othermodels do not simulate well the SLP of this region during winter months does not mean that they couldnot do better in other regions.
As an example of how these models simulate the observed mean SLP field, Fig. 2.12 presents the NCEPand the HADCM3 model fields for the 1950-2000 period, as well as their difference.
2.2.4.4 Seasonal variability and trends in the CGM experiments
A further verification of the GCM experiments capabilities to simulate the regional SLP fields was madeanalyzing their SLP annual cycle modes. In addition, trends in these modes can also give some insight in
-65 -60 -55 -50 -45
NCEP - HADCM3
-45
-40
-35
-30
-25

18
the nature of the observed trend discussed in section 2.10. The ECHAM4/OPYC3 was not included in thisanalysis because its outputs were available only since 1990.
The same PC technique as the one explained in section 4.8 was applied to the SLP field of each model.With some differences, the first two PCs of the three models reproduce the basic features of the respectiveNCEP reanalysis modes, Fig 4.11. In the case of HADCM3 experiment, the order of the first two PC waspermuted, but this is not important as the difference of explained variance between the first two modes isminimal as in the NCEP reanalysis, Table 4.9 and Table 2.11.
Table 2.3: Explained variance of the first two modes of the SLP for three GCM experimentsOn the contrary, in the case of the other two model experiments, the PC1 explained variance increaseswith respect to NCEP reanalysis at PC2 expense. To avoid confusion, hereinafter, we will refer to thesePC patterns as mode 1 (winter mode) and mode 2 (summer mode). Table 2.3 shows the linear correlationcoefficient between the respective spatial modes and the NCEP reanalysis modes. These correlationcoefficients confirm the visual impression that comes from figures 2.10 and 2.13 that these modes arepractically the same.
MODE 1 MODE 2 TOTALHADCM3 CSIRO
Mk2GFDLR30
HADCM3 CSIROMk2
GFDLR30
HADCM3 CSIROMk2
GFDLR30
TOTAL 42.8 52.3 54.2 47.1 43.9 36.4 100.0 100.0 100.0SUMMER 0.5 1.3 1.4 23.8 23.0 22.4 25.1 24.9 24.8AUTUMN 11.6 17.5 16.3 10.4 6.3 4.8 24.9 24.9 24.8WINTER 22.2 24.3 24.3 0.7 0.3 0.3 25.1 25.3 25.3SPRING 8.5 9.2 12.1 12.2 14.3 8.9 24.9 24.9 25.1

19
a) b)
-65 -60 -55 -50 -45
PC2 - HADCM3 - 42.8%
-45
-40
-35
-30
-25
-65 -60 -55 -50 -45
PC1 - HADCM3 - 47.1%
-45
-40
-35
-30
-25
-65 -60 -55 -50 -45
PC1 - CSIRO Mk2 - 52.3%
-45
-40
-35
-30
-25
-65 -60 -55 -50 -45
PC2 - CSIRO Mk2 - 43.9%
-45
-40
-35
-30
-25
-65 -60 -55 -50 -45
PC1 - GFDL R30 - 54.2%
-45
-40
-35
-30
-25
-65 -60 -55 -50 -45
PC2 - GFDL R30 - 36.4%
-45
-40
-35
-30
-25

20
c) d)
Fig 2.13: Principal components (PC) of annual mean sea level pressure for three GCM experiments, a)winter mode, b) summer mode and their respective factor loadings c) and d)
As in the NCEP reanalysis, the first two modes explain near 90 % of the variance, 89.9 % in the HADCM3,86.2 % in the CSIRO-Mk2 and 88.5 in the GFDL-R30 experiments. These modes are even more clearlyidentified with winter (mode 1) and summer (mode 2) circulation as they explain only a minimal part ofthe explained variance of the opposed season, Table 4.9. It can be concluded that the three experimentssimulate the more distinctive features of the SLP seasonal variability of the region studied. Moreover,they also reproduce the general trend of the SLP seasonal variability, as their first two FLs present trendssimilar in sign to those of the NCEP reanalysis.
2.2.4.5 Future scenarios
The same PC technique used in section 2.10 and 2.12 was applied to the four MCG SLP field series duringthe period described in the right column of table 2.10. Again, the first two modes were very similar to therespective modes corresponding to the past period of both the GCM and of NCEP, Fig. 2.14 and table2.12. As in the case of the NCEP reanalysis and of the MCG simulated fields of the last part of thetwentieth century, the first two modes account for about 90 % of the variance with the exception of theECHAM4/OPYC3 experiment in which these two modes account for nearly 80 %. In addition, they havesimilar partition of variance in seasons as before, Table 2.13. It seems that the SLP changes in the futurescenarios are not so important to substantially alter these patterns and their seasonal variability.
The four models maintain the observed trends of the summer and winter modes into the future. The rightcolumn of figure 2.14 shows the mean explained variance of these two modes during each decade, as wellas their sum.
0.2
0.3
0.4
0.5
0.6
0.7
0.8
0.9
1.0
1952 1957 1962 1967 1972 1977 1982 1987 1992 1997
HADCM3CSIROGFDL
0.2
0.3
0.4
0.5
0.6
0.7
0.8
0.9
1952 1957 1962 1967 1972 1977 1982 1987 1992 1997
HADCM3CSIROGFDL

21
Period 1951-2000
1961-2000 1961-2099 1991-2099
ModelorReanalysis
NCEP HADCM3
CSIRO-Mk2
GFDL-R30
HADCM3
CSIRO-Mk2
GFDL-R30
ECHAM4/OPYC3
Mode 11951-2000
NCEP 1.00 0.95 0.97 0.96 0.94 0.97 -0.96 0.87
HADCM3
0.94 1.00 0.98 0.96 0.94 0.97 -0.96 0.87
CSIRO-Mk2
0.96 0.97 1.00 0.98 0.97 1.00 -0.98 0.93
1961-2000
GFDL-R30
0.95 0.97 0.99 1.00 0.97 0.99 -1.00 0.94
HADCM3
0.92 0.99 0.94 0.95 1.00 0.97 -0.98 0.92
CSIRO-Mk2
-0.96 -0.97 -1.00 -0.99 -0.94 1.00 -0.99 1.00
1961-2000
GFDL-R30
0.95 0.98 0.98 1.00 0.97 -0.98 1.00 -0.95
1991-2000
ECHAM4/OPYC3
0.83 0.88 0.79 0.80 0.89 -0.80 0.81 1.00
Mode 2
Table 2.4: Correlation matrix between mode 1 and 2 of SLP in the NCEP reanalysis and in four GCM experiments
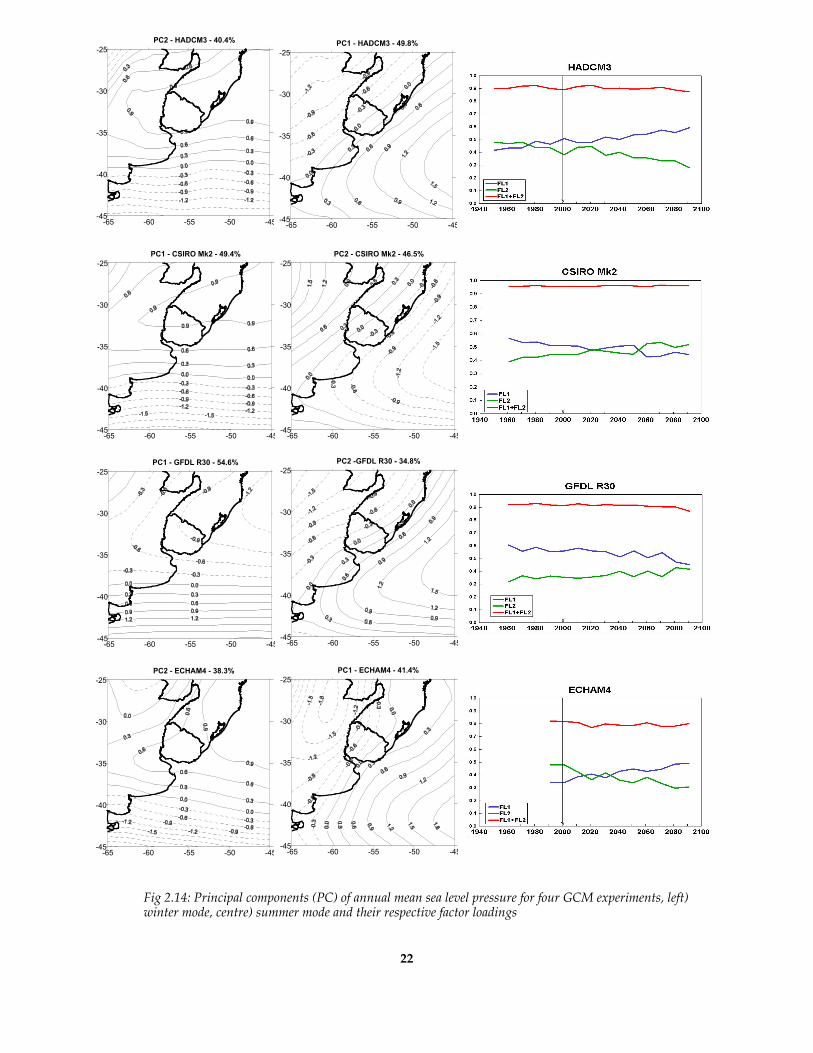
22
Fig 2.14: Principal components (PC) of annual mean sea level pressure for four GCM experiments, left)winter mode, centre) summer mode and their respective factor loadings
-65 -60 -55 -50 -45
PC2 -GFDL R30 - 34.8%
-45
-40
-35
-30
-25
-65 -60 -55 -50 -45
PC1 - ECHAM4 - 41.4%
-45
-40
-35
-30
-25
-65 -60 -55 -50 -45
PC2 - HADCM3 - 40.4%
-45
-40
-35
-30
-25
-65 -60 -55 -50 -45
PC1 - HADCM3 - 49.8%
-45
-40
-35
-30
-25
-65 -60 -55 -50 -45
PC1 - CSIRO Mk2 - 49.4%
-45
-40
-35
-30
-25
-65 -60 -55 -50 -45
PC2 - CSIRO Mk2 - 46.5%
-45
-40
-35
-30
-25
-65 -60 -55 -50 -45
PC1 - GFDL R30 - 54.6%
-45
-40
-35
-30
-25
-65 -60 -55 -50 -45
PC2 - ECHAM4 - 38.3%
-45
-40
-35
-30
-25

23
The MCG experiments present some differences on the initial partition of the percentage of variancebetween the summer and winter mode, but all four shows the same kind of evolution, with the summermode growing at expense of the winter mode According to the SRES A2 scenarios of the four models,future changes will be more important in spring and autumn than in winter and summer, Table 2.5.However, it cannot be ruled out, some changes in the solstice seasons because, model experimentsoverestimate, with respect to the NCEP reanalysis, the explained variance of mode 1 in winter and mode2 in summer. Nevertheless, changes in the transition seasons indicate a trend toward a longer period withprevailing summer low-level atmospheric circulation and shorter periods with dominant winter low-level atmospheric flow.
The growth of the summer mode at expense of the winter mode implies both, an intensification of theanticyclonic circulation and a shift to the south of the axis of maximum pressure. The average shift for thefour experiments is about 2° of latitude in 150 years. This is a considerable displacement when comparedwith the seasonal shift of about 10° of latitude between the extreme months of January and July. If thisclimate scenario will become real, this trend may produce important climate changes in subtropical SouthAmerica. Presumably, these changes could have already started because the observed shift was almostsimultaneous with the positive tendency in precipitation initiated during the sixties (Barros et al 2000).Other change, probably related to the observed shift in the SLP pattern, was the positive trend in autumntemperatures (Bejarán and Barros, 1998).
The trend toward increasing (decreasing) predominance of the summer (winter) mode has a directimplication on the Plata estuary wind field. The SLP meridional gradient is proportional to the easternwind component (geostrophic relationship) or more realistically because of friction effect to thesoutheasterly wind component. This wind component is directed to the Plata River mouth and. asexplained before, because of the shape and very small slope of the River, contributes to rise its level in itsinner stretch. Thus, it is possible that the level of the Plata River in its inner stretch has increased not onlydue to the sea level rise, but also because of the rotation of the wind field. In addition, according to themodel results, it is likely that this effect will continue in the twenty first century.
MODE 1 HADCM3 MODE 2 HADCM319512000
20012050
20512099
19512099
19512000
20012050
20512099
19512099
TOTAL 15.5 13.6 11.3 40.4 TOTAL 14.9 16.3 18.7 49.9SUMMER 0.2 0.1 0.1 0.5 SUMMER 7.8 8.1 7.9 23.7AUTUMN 4.4 3.5 2.3 2.3 AUTUMN 3.1 3.9 4.7 11.8WINTER 7.5 7.8 7.3 7.3 WINTER 0.3 0.2 0.3 0.8SPRING 3.3 2.5 1.3 1.3 SPRING 3.7 4.4 5.5 13.6
MODE 1 CSIRO Mk2 MODE 2 CSIRO Mk219612000
20012050
20512099
19512099
19612000
20012050
20512099
19512099
TOTAL 15.3 17.6 16.5 49.4 TOTAL 12.2 16.2 18.1 46.5SUMMER 0.4 0.2 0.2 0.8 SUMMER 6.4 8.6 8.5 23.5AUTUMN 5.2 5.9 4.4 15.5 AUTUMN 1.7 2.7 4.0 8.3WINTER 7.0 8.8 8.6 24.4 WINTER 0.1 0.1 0.1 0.3SPRING 2.7 3.0 3.0 8.7 SPRING 3.9 5.2 5.2 14.4

24
MODE 1 GFDL R30 MODE 2 GFDL R3019612000
20012050
20512099
19512099
19612000
20012050
20512099
19512099
TOTAL 16.6 19.6 18.4 54.6 TOTAL 9.8 12.9 14.1 36.8SUMMER 0.5 0.3 0.3 1.1 SUMMER 6.2 8.2 8.4 22.8AUTUMN 5.1 5.8 5.2 16.1 AUTUMN 1.2 1.8 2.5 5.5WINTER 7.0 8.5 8.3 23.8 WINTER 0.1 0.1 0.2 0.3SPRING 4.0 4.9 4.6 13.6 SPRING 2.3 2.8 3.1 8.2
MODE 1 ECHAM4 MODE 2 ECHAM419912000
20012050
20512099
19512099
19912000
20012050
20512099
19512099
TOTAL 4.5 18.8 15.0 38.3 TOTAL 2.9 17.8 20.7 41.4SUMMER 0.0 0.4 0.5 0.9 SUMMER 1.8 10.2 10.3 22.4AUTUMN 1.6 5.6 3.7 10.9 AUTUMN 0.3 3.4 4.9 8.7WINTER 2.2 10.5 9.5 22.2 WINTER 0.1 0.5 0.6 1.2SPRING 0.7 2.2 1.3 4.2 SPRING 0.6 3.7 4.8 9.2
Table 2.5: Explained variance of the first two modes of the SLP for four GCM experiments and for different periods
2.2.5 The main Plata tributaries: Paraná and Uruguay rivers
Most of eastern subtropical South America, about 3.1 x 10⁶ km2, constitutes the Plata Basin (Fig. 2.15). Thetwo main tributaries are, by far, the Paraná and Uruguay rivers contributing with the 97% of thedischarge into the Plata River. In turn, the Paraná has an important tributary, the Paraguay River.
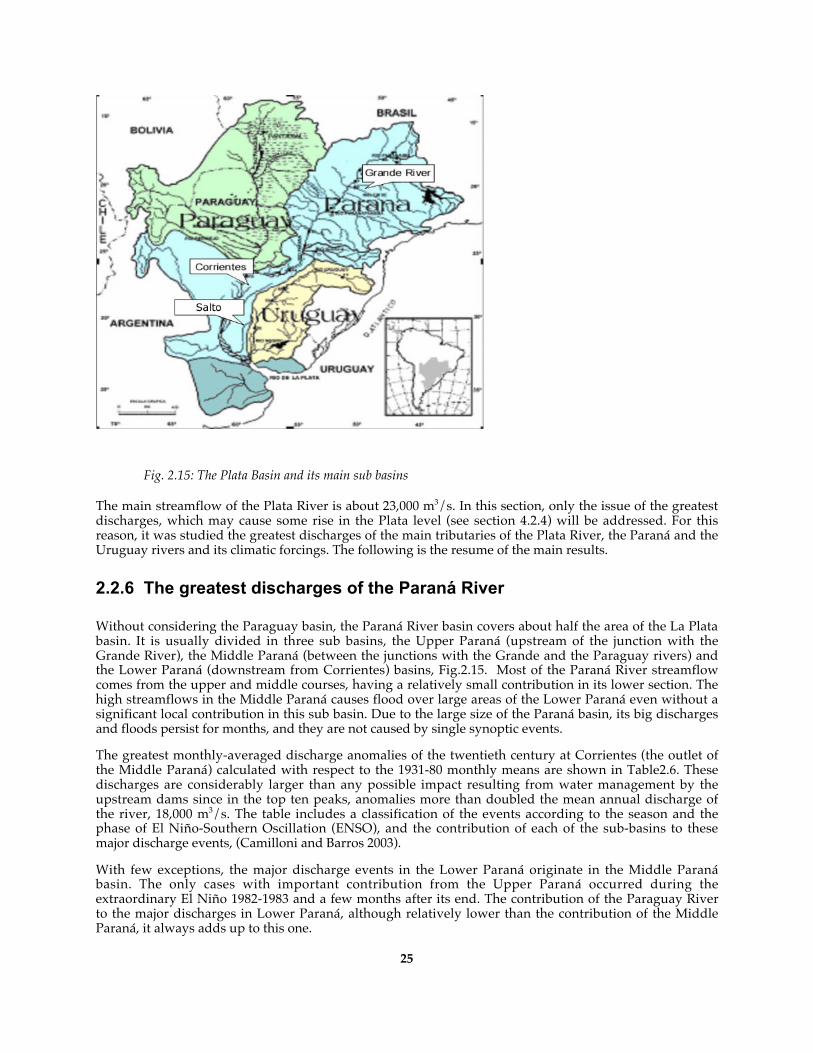
25
Fig. 2.15: The Plata Basin and its main sub basins
The main streamflow of the Plata River is about 23,000 m3/s. In this section, only the issue of the greatestdischarges, which may cause some rise in the Plata level (see section 4.2.4) will be addressed. For thisreason, it was studied the greatest discharges of the main tributaries of the Plata River, the Paraná and theUruguay rivers and its climatic forcings. The following is the resume of the main results.
2.2.6 The greatest discharges of the Paraná River
Without considering the Paraguay basin, the Paraná River basin covers about half the area of the La Platabasin. It is usually divided in three sub basins, the Upper Paraná (upstream of the junction with theGrande River), the Middle Paraná (between the junctions with the Grande and the Paraguay rivers) andthe Lower Paraná (downstream from Corrientes) basins, Fig.2.15. Most of the Paraná River streamflowcomes from the upper and middle courses, having a relatively small contribution in its lower section. Thehigh streamflows in the Middle Paraná causes flood over large areas of the Lower Paraná even without asignificant local contribution in this sub basin. Due to the large size of the Paraná basin, its big dischargesand floods persist for months, and they are not caused by single synoptic events.
The greatest monthly-averaged discharge anomalies of the twentieth century at Corrientes (the outlet ofthe Middle Paraná) calculated with respect to the 1931-80 monthly means are shown in Table2.6. Thesedischarges are considerably larger than any possible impact resulting from water management by theupstream dams since in the top ten peaks, anomalies more than doubled the mean annual discharge ofthe river, 18,000 m3/s. The table includes a classification of the events according to the season and thephase of El Niño-Southern Oscillation (ENSO), and the contribution of each of the sub-basins to thesemajor discharge events, (Camilloni and Barros 2003).
With few exceptions, the major discharge events in the Lower Paraná originate in the Middle Paranábasin. The only cases with important contribution from the Upper Paraná occurred during theextraordinary El Niño 1982-1983 and a few months after its end. The contribution of the Paraguay Riverto the major discharges in Lower Paraná, although relatively lower than the contribution of the MiddleParaná, it always adds up to this one.

26
Corrientes Date and ENSO phase
Upper Paraná Middle Paranácontribution
Paraguay
Jun 1983Autumn (+)
38335 8505 24179 5635
Jun 1992Autumn (+)
26787 470 21852 4449
D Dec 1982Summer (0)
26131 4380 17011 4633
Mar 1983Autumn (+)
24231 8368 12519 3354
Jun 1905Autumn (+)
24153 N/A N/A N/A
May 1998Autumn (+)
22999 380 18052 4559
Oct 1998 Springneutral
21006 794 16176 4077
Oct 1983Spring neutral
20451 5914 12343 2235
Jul 1982Winter (0)
18809 2907 12720 3145
Feb 1997Summer neutral
17657 874 15021 1776
Sep 1989 Springneutral
16698 990 12332 3370
Table 2.6: Major discharge anomalies (m3/s) at Corrientes and the corresponding ones at the Upper Paraná.Paraguay and the Middle Paraná. (0) and (+) stands for El Niño periods as follows: (0) for the onset year of El Niñoand (+) for the following year. N/A means no data.The middle Paraná basin is at the midpoint of the dipole structure of precipitation associated to the SouthAtlantic convergence zone (SACZ). Thus, the major discharges of the Paraná River are not associated tothe intensification of any of the phases associated to this dipole; rather, they are associated to anotherforcings. In fact, according to table 2.13, El Niño (EN) is the most important forcing, although not the onlyone. The six greatest peaks occurred during EN events, five of them in the autumn of the year followingthe beginning of the events, autumn (+), (Camilloni and Barros 2003).
Figure 2.16 shows the composite of the precipitation anomaly during the autumn (+) of El Niño events.The magnitude of the anomaly, centered at this basin, almost doubled the mean rainfall in this part of theMiddle Paraná basin. In these cases, the warm anomalies in the tropical Pacific Ocean forces anatmospheric circulation that favours in the upper troposphere the advection of cyclonic vorticity and atlow levels the advection of heat and moist from the tropical continent over the Plata Basin; bothadvections favour the precipitation processes, which originate great discharges in the Paraná River andfloods in the lower section of this river. This type of floods occurred with more frequency since thechange in the phase of El Niño events during the 1980 decade (1983, 1992 y 1998) coinciding with a greatchange in the atmospheric circulation observed during the middle of the 1970 decade that could berelated to global warming.

27
Fig. 2.16: Anomaly precipitation (mm) for March-April-May (+)
2.2.6.1 Floods in the Uruguay River
Compared with the Paraná and Paraguay basins, the Uruguay River basin is relatively small, extendingover an area of less than 0.4 x 10⁶ km2. Because of its size, its narrow transverse section and the steppedterrain, the lag between rainfall and the river discharge takes only a few days. Most of the largedischarges persisted for only a week or less, with the exception of two events in 1983 and 1998 that werepart of flood wave of about 2 months. Both occurred during the strongest El Niño (EN) events of thecentury. This indicates that the main discharges are usually caused by synoptic events or by a shortsuccession of them, although these events could be modulated by some remote forcings as El Niño.
Since the greatest discharges in the Paraná River lasts for many months, there is a fair chance that theycan be superposed to a great peak of the Uruguay River, even more when the greatest discharges in bothrivers tend to occur with higher probability during EN events. In fact, during June 1992, both rivers hadgreat discharges that added up to 76,500 m3/s. In view that this was not the case of the greatestdischarges at both rivers, an extreme total discharge of near 100,000 m3/s in the Plata River cannot bediscarded. This implies an anomaly of about 75,000 m3/s. In section 2.2.4, it is explored the effect ofsuch possible discharge on the level of the Plata River at several locations of both margins.
Date Discharge anomaly (m3/sec)9 June 1992 31,78417 April 1959 30,57521 July 1983 27,8317 January 1998 27,67716 April 1986 26,7795 May 1983 25,6788 March 1998 25,30215 June 1990 24,35524 October 1997 23,96720 June 1972 20,66024 April 1987 20,187

28
9 September 1972 18,6641 May 1998 18,08916 November 1982 17,31719 November 1963 16,86720 September 1965 15,913
Table 2.7: Extreme daily discharge anomalies (larger than 3") of the Uruguay River at the gauging station of Salto(1950-2000
2.2.7 Geology, geomorphology and Delta accretion
2.2.7.1 Geology
The geological and geomorphologic aspects of the coastal area of the Plata River including itsgeomorphologic evolution and sediment transports were addressed during the Project. The coastaldynamics during past and present times was also discussed, making a special reference to the ParanáDelta advance.
Two maps, based on the identification of the geological units that emerge at the La Plata River coasts,were constructed to help the description of the geology of the area. The identification of the geologicalunits was carried out using aerial photographs of 1:40,000 scale, and satellite images of the Landsat 5 TMsatellite (Thematic Mapper) which possess a spatial resolution of 30 metres and sensors in 7 spectralbands, from the visible to the infrared. Some specific geological features of interest for the coastaldynamics are pointed up in the following paragraphs. For description purposes the coast was divided intwo zones, from the Paraná Delta to Punta Piedras, and the Samborombón bay coast from Punta Piedrasto Punta Rasa.2.2.7.2 Paraná Delta - Punta Piedras sector
The general geology of the coastal area in the Paraná Delta is constituted by unconsolidated sedimentscorresponding to the sandy fraction in the levee areas and to clayey silts in the islands and submergedfront, Fig. 2.17. There is also presence of sandy sediments in the submerged delta. Likewise, areas ofsandy coastal ridges and clayey silty tidal flats constitute the coastal front between the Delta and PuntaPiedras. In this part of the coast of the Plata River, there are deposits of estuary beach containingabundance of molluscs. Inside the tributary valleys, fine sediments, typical of swamps and coastalmarshes ecosystems, replace the shell and sand deposits.
About 2,000 years ago took place the stabilization of the sea level and thereafter some of the Buenos Airesterritory was subject to light erosive processes. In the Plata River headwaters, the formation of the ParanáDelta continued with the advance of islands and bars, as well as of the great front barely submergedunder the waters of the estuary.
Currently, the coastal area located between the Paraná Delta front and La Plata City has been greatlymodified by human activities. The analysis of outcrops should be done retrospectively because less than ahundred years ago it was still feasible to watch them, while today they have been removed or covered.The best watching places were on the scarpment as well as in the valleys of the streams that reached thecoast.

29
Fig. 2.17: Geology of the coastal fringe of the Plata River between the Paraná Delta and Punta Piedras
2.2.7.3 Samborombón Bay
The data presented in this section were obtained from samplings made for this Project and from previousworks (Tricart 1973; Fidalgo et al 1975; Parker et al 1990; Codignotto and Aguirre 1993 and Kokot 1999).The coast is constituted by clayey sediments corresponding to tidal flats deposits and a cheniers line,where a crab’s community area is located. In the continental area, outside of the present riverside line,there are coastal ridges and barrier islands of the Holocene constituted by sand and containing abundantmarine molluscs, Fig 4.2. Spalletti et al. (1987) studied the sedimentology, while Codignotto and Aguirre(1993) and Aguirre (1996) described the geomorphology, genesis and associated fauna of these deposits.

30
Fig. 2.18: Geology of the Samborombón Bay between Punta Piedras and Punta Rasa
The outcrops between Punta Rasa and Punta Médanos (located southward the study area) correspond todunes deposits and Holocene beach ridges deposits, constituted by medium and fine sands andcontaining bivalves and gastropod fauna, partially cemented with calcium carbonate. The area wasformed during the last Holocene transgression (Dangavs 1983) and it has grown starting from a cape thatwas located southern to Punta Médanos (Violante 1988) where the deposits were studied by Teruggi(1949).

31
The beach ridges deposits corresponding to barrier spits that constitute the present coastal line betweenPunta Rasa and the south of Punta Médanos are composed by sands with fossil mollusc remains(Codignotto and Aguirre 1993; Kokot 1997). There is also find fine sandy deposits and organic remains offossil island barriers. Clays, silts and fine sands constitute the tidal flat deposits, while in the mainstreams valleys there are alluvial deposits, mainly sandy ones.2.2.7.4 Geomorphology
The geomorphology of the area was interpreted from three sources: the satellite image Landsat 5TM224/085 obtained at March the 3rd of 1998 and provided by the National Commission of Space Research(CONAE) with a spatial resolution of 30 metres, aerial photographs of a scale of 1:40,000 and field tasks.Two maps were constructed, figures 2.19 and 2.20.
The digital treatment of the satellite image, combining bands and the application of filters alloweddifferentiating among the areas of interest, separating units that are enhanced in the image by theunequal presence of water and vegetation. As a result, the areas affected by tidal floods and storm surgesare clearly distinguishable in the interpretation of the geomorphologic maps. The obtained informationfrom satellite analysis also allowed determining the wetlands and the other geomorphologic units.Paraná Delta – Punta Piedras sector
From the front of the Delta towards the city of Buenos Aires, the coastal area shows the presence of apalaeocliff in whose base there is a estuarial terrace conformed by beach ridges cords, tidal flats andbeaches. The group constitutes a low area subject to floods caused by storm surges. The coastal area ofthe city of Buenos Aires was completely modified by fillers. The city of Buenos Aires can also be dividedin two areas of different characteristics because of its geomorphologic attributes, a high area, presentingaltitudes above the 20 metres over the sea level, and a lower area, corresponding to the coast whosevariable altitude is approximately less than 5 meters over the sea level (Fig. 2.19).
The two areas, differentiated by their altitude, correspond to two geomorphologic features. The high areabelongs to the geomorphologic province of the Pampa Undulate, presenting a relief formed mainly byfluvial action. The observed undulations correspond to a system of rivers and watersheds in anenvironment modified by human action.

32
Fig. 2.19: Geomorphology of the coastal fringe of the Plata River between the Paraná Delta and PuntaPiedras
The lowest area corresponds to the coast of the Plata River. It is an accretion area originated during theHolocene, corresponding to fine sand beaches and silt-clayey tidal flats lying on a compact material layerof calcareous crust. Artificial fills, port constructions and coastal defences currently expanded the area, asit is shown in the figure 2.19. Deposits of clays, plastic silt-clayey floors and sandy floors also constitutethese lands.
Sometimes, the coastal area is flooded by the waters of the estuary, because of meteorological tides locallynamed sudestadas. The most recent deposits are those of the Paraná delta whose southern submergedborder, the prodelta, is reaching the coastal area of Buenos Aires City.
2.2.7.5 Samborombón Bay sector
The different geomorphologic units that compose this zone are shown in the figure 2.20. The northernarea corresponds to a higher zone, where the landscape was originated by fluvial action and it constitutesa plain area furrowed by some rivers that flows into the Samborombón Bay and others that drain to thecoastal area located to the north of Punta Piedras. This relief presents a barely developed cliff thatseparates the Samborombón Bay continental lands from areas constituted by tidal flats, which areclassified as follows:

33
∞ Ascended tidal flats: Not attained to current marine action; they were originated during theHolocene marine transgression, ageing about 6000 years AP (Codignotto and Aguirre 1993). Dueto the scarce slope of the area, there is not a well organized drainage. Nevertheless, the drainageis organized following trajectories that are controlled by the old tidal creeks.
∞ Extraordinary tidal flats: Area flooded at times by extraordinary tides. When the sea level risesbecause of storm surges, there is an immersion of a strip of about two kilometres wide, which isgenerally higher than the mean high tide level. Therefore, a sublitoral environment is developedconstituted by an area of high crabs community (Tricart 1973) where a series of lagoons areflooded during the extraordinary storm tides. In general, the tidal creeks do not connect theselagoons and the water level is lowered slowly by evaporation. In this coastal area the waves arenot very effective due to the control action generated by the contact with the scarcely leanedbottom. Nevertheless, along the coast it is noticed certain erosion effect.
∞ Semidiurnal tidal flat: Corresponds to the coastal strip that is exposed during the semidiurnaltidal cycle. It is a surface slightly leaning toward the sea and furrowed by tidal creeks, whichreach great development between General Lavalle and San Clemente del Tuyú (the two urbanareas indicated in Fig 2.20). Next to this last town, the tidal creeks orientation is controlled by thepresence of beach ridges.

34
Fig. 2.20: Geomorphology of the coastal area of the Samborombón Bay
Other geomorphologic units are:
∞ Cheniers: Ridge morphology area of scarce relief located in the central area of Samborombón Bay.

35
∞ Beach Ridges: Placed in the north - centre of Samborombón Bay and in the southern area,conforming Punta Rasa and a spit that extends between Punta Médanos and Punta Rasa.Codignotto and Aguirre (1993) explained the genesis of the area, and Kokot (1997) studied thebeach ridges deposits and explained the coastal dynamics.
∞ Dunes: Corresponds to the area of coastal dunes located in the eastern coast of the PuntaMédanos - Punta Rasa area.
Alluvial plains: The most important are those corresponding to the Salado and Samborombón rivers,located in the northern area of Samborombón Bay. This geoform can also be defined in the mouths ofsome smaller streams next to the General Lavalle locality.
2.2.7.6 Sediment transport
The inner area of the Plata estuary, which extends from the Paraná Delta to the section that goes fromColonia to Buenos Aires, is influenced by the advance of the Paraná Delta represented by low bottoms,denominated Playa Honda. In this area, the average depth is 2.5 meters, increasing toward the outerzone.
It is possible to recognize a flow with suspension materials almost continuous with a S-SE direction. It isobserved at 700 / 800 m from the coast, and more intensively in the centre of the estuary and in thecreeks. It transports silt-clayey sediment, contributed mainly by the Paraná River that flocculates whencontacting the brackish waters. The concentrations are variable and present values between 15 and 250mg/l.
Besides this current, there are others of tractive type whose directions respond to the action of the waveson the coastline. These currents are denominated drift currents. The more important, thoughdiscontinuous, tractive drift current carrying on thick material coming from the erosion of the coast has amain course toward the N-NO and takes place in the interface between water and land. The origin anddynamics of this current responds to the storm surge pulses. The N-NO direction of the tractive current isevidenced by the orientation of the outlets of the small tributaries and creeks, and in the areas withdeposits of removed materials, either of natural or artificial origin. These last ones include many types ofresiduals, deposited along the coast with the objective to win land to the River. It is important to pointout that the direction of the tractive current sometimes shifts due to the incidence of waves from thenorth-east.2.2.7.7 Recent geomorphologic evolution
During the last 7,000 years there were relative sea level rises and descents in the area of the Plata estuary,which were accompanied with erosion and accumulation. To these processes, it should be added theadvance of the Paraná Delta front. These factors coupled with the development of the human activitiesduring the last 100 years determined the configuration of the coastline. Since the year 1907 humanactivities increased the land area of the coastal sector between the city of Buenos Aires and the Delta frontin approximately 10 Km2.
The coast of the City does not exhibit natural areas because all the sectors were modified by humanaction. Where the filling tasks advanced more, the depths offshore jump quickly to 1.3 m to 2 m becausethe natural slope of the bottom was broken by the filling and the construction of coastal defences.
At the Samborombón bay, the present coastal forms have been developed over a Pleistocene erosiveplatform. Fig, 2.21 shows the coastal shoreline during late Pleistocene when the sea was approximately 10m under the current level (A). Thereafter the Holocene transgression- regression took place and the sealevel reached 5 m over the actual sea level (B) and during the subsequent Holocene regression the levellowered, reaching 2.5 m over the current sea level 3,500 years BP (C). Finally, the part D of the figureshows the current contour and the coastal dynamics. The incidence of the south easterly wavesconcentrated the erosion on a tip located between Mar Chiquita and P. Médanos. This process allowedthe formation of beach ridges, which drifted toward the south and formed the Mar Chiquita lagoon; at

36
the same time, a barrier spit of great growth was generated to the north. The relict forms of both barriersare between 5 m and 2.5 m high over the present sea level, Fig. 2.21.
Fig. 2.21: Evolution of the Samborombón bay during the high quaternary (Codignotto and Aguirre 1993)
In the present, between Punta Médanos and Punta Rasa, the only natural accretion sector has howevererosion processes caused by human activities. Also, in the Samborombón Bay coastal fringe there areclear signs of incipient erosion, mainly at the ascended tidal flats (1.80m-0.25m over the sea level) and atthe tidal flat.2.2.7.8 The Paraná Delta
The Paraná Delta showed a striking advance inside the Plata estuary that has been known by someresearchers, but it was not documented. Therefore, in view of the current Climate Change and itsconsequent sea level rise, it was studied if the Delta front advance has increased, diminished ormaintained its growth rate. For this purpose, a map showing the mobility of the deltaic front through thetime was elaborated making use of the historic information, Fig.2.22.
Cartographic information from 54 maps, which cover the period between years 1731 and 2003, wascarefully analyzed. In addition, bibliographical information referred in Furlong (1936, 1963), in theMinistry of Public Works (1908) and in Outes (1930) was also consulted. A time consuming work wascarried out to determine the value of these information. It should be pointed out that the oldest

37
cartographic information has very important uncertainties that had to be compensated by a critical andmeticulous analysis
The mouth of the Reconquista River was almost free of obstacles in 1731 flowing into the Plata estuary;between 1802 and 1829 was partially obstructed by islands, and finally since 1890 there was any longer adirect connection between the Reconquista and the Paraná de las Palmas rivers.
With the Luján River happened something similar. It was free of obstacles in the maps corresponding tothe years 1731, 1756 and 1783, but not in the outline made in 1731 and in the maps dated in the years 1762and 1784. For these reasons there it is certain confusion around the eighteen century situation, althoughcredit was given to a 1731 outline since was sketched by a resident or direct observer of theneighbourhood. In any case, it is clear that the mouth of the Lujan River at the Paraná de las Palmas wasfound it further from the delta front as more recent the maps were.
The outline corresponding to the year 1731 shows that both the Lujan and Reconquista Rivers flowed intoParaná de las Palmas. There is some confusion between the maps of the nineteen century because therewere islands at their mouths. On the other hand in later maps (at the end of that century), the continuouscontribution of sediments made both rivers to flow directly into Río de La Plata estuary. Finally, since thebeginning of twentieth century only the Luján River flows into the Plat River after receiving the waters ofthe Reconquista River.
Fig. 2.22: Progress of the Paraná delta during the last 250 years
The delta advance during the last 250 years can be summarised as follows:
∞ Between 1750 and 1800 the delta front advanced 9 km, that is to say, an average of 180 meters peryear.

38
∞ Between 1800 and 1850 the front of the delta advanced 5 km which results in a rate of 100 metersin average per year.
∞ During the period between 1850 and 1900 the delta prograded 5 km, at an average rate of 100meters per year.
∞ Between 1900 and 1950 the delta advanced 3 km, at an average rate of 60 meters per year.
∞ Between 1950 and 2002 the delta advanced 4.5km resulting in a rate of 90 meters per year.
∞ Finally the current data indicate an advance between 60 and 70 meters per year.
The growth rate decrease of the Paraná delta can be observed more clearly in the figure 2.2.6.7.
Fig. 2.23: The Paraná Delta Front advance
The reduction of the speed in the progress of the Delta is compatible with an increment of the river level,which was 17cm in the Buenos Aires port during the twenty century. On the other hand, theextraordinary and long lasting flood of the Paraná River in 1982/1983 deposited an unusual amount ofheavy sediments on the bottom of the Rio de la Plata, and thus, favored the later progress of the deltafront.
The 1982/1983 flood was unusually long because started some months before the strong El Niño event,and remained during six months after the end of this event. It seems that the long lasting flood of 1982/83was the consequence of three consecutive climate forcings, only one of them was a very strong El Niñoevent (Camilloni and Barros 2000, Barros et al 2004). Therefore, it seems unlikely the occurrence ofanother long lasting flood such as that of 1982/83 during the next decades. If this were the case, the rateof growth of the delta front will diminish again, as the water level of the Rio de la Plata continues toincrease. Other less likely scenario could be the occurrence of another long lasting flood as the one of1982/83. In such a case, after this episode, it could be anticipated a faster growth of the delta front
2.2.8 Topography
For calculating the return periods of floods over land, a digital model of the surface altitude over sea levelwas constructed with 0.25 m vertical and 1 Km horizontal resolution, using field measurements taken

39
with a GPS differential system and data from satellite radar. GPS measurements were taken at places thatprovided key information according to the geomorphologic maps that were constructed to help theconstruction of the digital model. These data was complemented with the information of preexistinglower resolution topographic maps and with altitude measurements taken by the Buenos Aires city atcertain points. The four sources of data present difficulties. The topographic maps have an altituderesolution of 1.25 m and in some areas 2.5 m, too low for the study of present floods and for assessment offuture changes in the affected areas. The GPS measurements, taken as unique source, would require toolengthy and costly campaigns. In addition, access to certain areas is very difficult and furthermore thissystem presents difficulties when used in urban areas due to interferences caused by trees, buildings, andcars that interrupt the satellites reception. This was a problem in part of Buenos Aires City, but a fewhundreds observations of altitude data were available from former measurements ordered by the BuenosAires administration. However, these data was restricted to a certain areas within the city boundaries.Radar data are very accurate, but the built areas and trees introduce errors.
The first step was the cartographic compilation of available information and construction of a digital mapin Autocad format. The coordinates were Gauss-Krügger, a system used by the local MilitaryGeographical Institute. The map includes the Argentine coastal area of the Plata River from the ParanáDelta to Punta Rasa and extends inland to the altitude of 5 m over mean sea level.
Field measurements with a GPS differential system were obtained during 12 campaigns. Themeasurements were taken at places that bring key information. The data were processed with thesoftware Ashtec. It indicates the height of the ellipsoid according to the system WGS 84.
The digital model of the surface altitude over sea level was started with the initial input of radar datawith a horizontal resolution of 90 m. The data were filtered, eliminating noises caused by the presence ofbuildings, vegetation and small ponds. For this purpose, the other three sources of data were used. Theinitial radar data of 90 m horizontal resolution were used to produce an altitude model of a 1 km cell sizethat includes the maximum, average and minimum value. In urban and suburban areas, the minimumvalue is likely more representative of the real mean altitude because it may stand for the areas without orwith less buildings and trees. In addition, these minimum values are more functional to the purpose ofthe map, which is to asses the frequency of flooding. Finally, a 1000 m horizontal resolution grid cell wasbuilt. The constructed digital model covers the Argentine coastal area of the Plata River from the ParanáDelta to the Cape Rasa and extends inland up to 5 m over mean sea level, Figs. 2.24 and 2.25. Althoughthe digital map has a resolution of 0.25 m, figures 2.24 and 2.25 show only a 0.5 m resolution to avoid aconfusing depiction.

40
Fig. 2.24: Topography of the coastal fringe of the Plata River between the Paraná Delta and Punta Piedras.Altitudes over the zero IGM; see Fig. 4.1
As it will be seen in section 4.3.4, the sea level rise will propagate almost 100 % into most of the innerPlata River. However, as long as this rise will be not more than 50 cm, almost no land would bepermanent flooded in the sector between the delta front and Punta Piedras because as seen in figure 2.24,only very small areas are below the 1.5 m mark over the IGM zero. This altitude (1.5 m) would be reachedby the shoreline after a 0.5 m rise in the water level at Buenos Aires, Fig. 2.1. On the other hand, in theSamborombón Bay, a 0.5 m rise will lead to some permanent flood in some areas that are below 0.50 m,Fig. 2.25.

41
Fig. 2.25: Topography of the coastal area of the Samborombón Bay. Altitudes as in Fig 2.24

42
Wave climate
The purpose of this activity was to produce a quantitative estimate of the wave climate in the inner PlataRiver considering a possible future change in local winds. First, sea and swell climate in the outer PlataRiver were statistically analyzed from direct observations obtained at the outer Plata River. Second,propagation and transformation of sea and swell, from the outer Plata River throughout the intermediateand inner regions, were computed and analyzed. Present wave climate (directional wave heights andperiods) was estimated by a hindcasting methodology based on ten-year statistics of winds measured atthe Aeroparque meteorological station.
There are no direct measurements of waves in the Plata River except for a single 5-year record of wavedata gathered in the outer area. Based on these data, Anschütz (2000) showed that wave climate in theouter Plata River is a combination of swell (wave generated far away, not related to local wind) and sea(wave generated by local wind). The analysis of the waverider data revealed predominant heightsbetween 0.5 to 1.5 m. When sea prevailed, periods were between 4 and 6 s, when swell prevailed theywere between 10 to 12 s. In the inner Plata River, wind waves have been neither measured nor modeled.Consequently, a realistic wind wave climate in this area was not available.2.2.8.1 Sea and swell climate in the outer Plata River
A single series of 11,297 records, gathered from June 1996 to November 2001 was obtained with adirectional wave recorder Datawell Waverider in the outer Plata River at latitude 35°40’ S and longitude55° 50’ W, Fig. 4.2.
Table 2.26 shows the number of occurrences for the eight directions analyzed. SE direction, followed by Eand S are the main directions of propagation with 41%, 28% and 14% of occurrences, respectively.Frequencies for the rest of the directions are equal or lower than 5%.
The bi-dimensional distribution for the direction with largest number of occurrences, i.e. SE, is shown inFig. 4.2. Two domains with very high number of events around periods of 10 s and heights of 0.8 m
(swell) and periods of 5 s and heights of 1.25 m (sea) can be clearly identified.
Fig. 2.26: Hindcasting point and directional wave recorder location are indicated. Depth contours inmeters are depicted

43
Considering the general orientation (NW-SE) of the Plata estuary and its very shallow waters, only thosewaves propagating from the southeast could reach the inner part. Thus, swell and sea propagating fromthe outer to the inner part of the estuary would be the long and short swell, respectively, within theintermediate and inner regions.
Direction Number of events Percentage%
N 278 2NE 237 2E 3161 28SE 4646 41S 1607 14SW 539 5W 420 4NW 409 4
Table 2.8: Number of events for each of the eight analyzed wave directions at the outer Plata River
Fig. 2.27: Bidimensional distribution of heights and periods. Mean sea and swell characteristics areindicated
2.2.8.2 Swell climate in the inner Plata River
Wave propagation and transformation from the outer Plata River towards the coast of Buenos Aires wereanalyzed by means of a numerical model of wave transformation (Dragani and Mazio, 1991). The wavenumber, a parameter which must satisfy the modified dispersion relation at any point (Watanabe, 1982),

44
was computed considering realistic bathymetry and stationary, but spatially variable current fieldcorresponding to flood and ebb conditions. Refraction, shoaling and friction effects along the wave raywere computed based on a bathymetric grid of 1 Km spatial resolution obtained from the nautical charts(SHN 1999a and SHN 1999b). The refraction coefficient was computed by the classical methodologygiven by Griswold (1963). The shoaling coefficient was based on wave velocity at any point by applyingthe linear wave-theory. To obtain the rate at which energy was removed from waves we adopted theformulation given by Putnam and Johnson (1942). Energy dissipation was computed along the ray usingan integral expression given by Vincent and Carrie (1988).
Fig. 2.28: Refraction diagram corresponding to wave coming from Southeast. Refraction, shoaling anddissipation coefficients are indicated. An intermediate ray (dashed line) reaching the inner Plata River isincluded
We herein assumed that waves propagate as swell from the outer Plata River towards the inner part ofthe river under non-locally generated wave conditions. Two different swell conditions were analyzed:short swell, associated to sea in the outer part of the river and long swell, associated to swell in the outerPlata River. Results show that shallow water effects (especially refraction) are less evident over shortswell, thus being the most likely one to reach the intermediate and inner Plata River. Outputscorresponding to short swell coming from the southeast are shown in Figure 2.28. The figure depicts arefraction diagram for twenty rays directed towards the NW from the outer part of the river.
Shallow waters and banks were identified as areas where wave braking (rays caustics) occurred. Causticsseem to have an important role in wave propagation and transformation towards the inner Plata River,thus producing the consequent wave attenuation. Figure 2.28 also shows that rays strongly divert at theintermediate part of the river producing two areas of caustics: one located between Punta Piedras andAtalaya, (near the coast of Buenos Aires) and another southeast of Colonia (near the coast of Uruguay). Inorder to analyze the wave transformation between the outer and inner regions, an additional ray, able toreach the inner region was computed (dashed line in Figure 2.28). Heights of waves propagating from theouter to the inner part of the river were attenuated 95 % by refraction, shoaling and friction effects.Consequently, predominant wave climate in the upper Plata River can be described considering onlywind waves locally generated (sea).

45
2.2.8.3 Sea climate in the inner Plata River
The Wave Hindcasting Method (CERC 1984) and the improvements given by CERC (2002) were appliedat a coastal point near Buenos Aires City (Fig. 6. 1). The methodology was applied in shallow waters, offthe surf zone, where local depth is of approximately 2 m. Monthly wind statistics (SMN, 1992) wereobtained from hourly data gathered at the Aeroparque meteorological station, located on the coast ofBuenos Aires City (Fig. 6.1). Based on these data, it was estimated mean wave heights. Directional meanwinds used in the wave hindcasting are presented in Table 2.27.
Index Direction Frequency( %)
Mean windms-1
ms-1
(m s-1)
Fetch(Km)
HMO
(m)TP
s(sec.)
1 N 15.8 4.9 36 0.49 3.52 NE 11.5 4.6 45 0.50 3.73 E 18.4 4.9 125 0.90 5.34 SE 12.2 5.8 150 1.22 5.55 S 13.7 6.1 2 0.15 1.46 SW 7.5 5.5 2 0.13 1.47 W 7.8 5.2 2 0.12 1.48 NW 6.6 5.2 22 0.41 3.19 Calms 6.5 - - - -
Table 2.9: Directional mean wind and probability of occurrence at Aeroparque on the coast of Buenos Aires City, edirectional fetch, heights and periods obtained by hindcastingFetch-limited conditions have been considered herein given the nature of the meteorological dataavailable and considering the geographical characteristics of the inner Plata River. Under theseconditions, the supposition is made that winds have been blowing long enough for wave heights to reachequilibrium at the end of the fetch. The parameters required for hindcasting are fetch and wind speed, thelatter being representative of the average value over the fetch. The wave parameters computed are theenergy-based wave height and the peak spectral period.
In shallow waters the deep-water methodology is applicable CERC (2002). Shallow-water formulae arequite close to the ones of deep-water wave growth for the same wind speeds, up to a point where anasymptotic depth-dependent wave height is attained. In light of this evidence it is convenient todisregard bottom friction effects on wave growth in shallow waters (CERC, 2002).
Table 4.2 shows that the East direction presents the highest frequency (18.4% of cases), N, NE, SE and Sdirections present similar frequencies (ranging from 11.5 to 15.8%) and SW, W, NW directions and calmsare the least frequent ones, with values ranging from 6.5 to 7.8%. Directional mean wind intensity (from4.6 to 6.1 ms-1) is quite uniform for all directions.
Table 4.2 also presents mean wind intensity, frequency, and fetch for the eight analyzed directions andthe heights (HMO) and periods (TP) estimated by hindcasting. The largest heights and the longestperiods resulted for the Southeast 1.22 m and 5.5 s and for the East 0.9 m and 5.3 s, respectively. Theshortest heights and periods resulted for the West with 0.12 m and 1.4 s, for the Southwest with 0.13 mand 1.4 s and for the South with 0.15 m and 1.4 s.

46
2.2.8.4 Effect of the local wind change on the wave climate of the inner Plata River
The western border of the South Atlantic High is moving southward, see section 4.2.4. This displacementhas produced increased frequencies in east winds over the Plata Estuary. It was assessed the changes inthe wave climate in the inner Plata River considering a possible future change in local winds. Since waveclimate in the inner Plata River can basically be represented by sea, the hypothesis is that in this case, thesmall changes both in frequency and intensity of local winds should affect the wave climate. Therefore,present and future mean directional wave heights are estimated and compared. Based on the resultsdescribed in section 4.2.4, a possible scenario with an increase of 30% and 10% respectively in the eastwind frequency and intensity was analyzed. In this hypothetical scenario it is assumed a decrease of thesame magnitude would occur in frequency of the west direction. Results of the hindcasting show that,mean East wave height and mean total wave height will increase within the inner Plata River. Presentmean East wave heights (0.90 m) will increase by 0.12 m (13 %) and their frequencies will increase by 30% (from 18 to 24 %). The mean period for East waves will not change significantly (less than 4 %, from 5.3to 5.5 s). The ratio between the future and the present total average energy would be about 1.3. Thismeans that, an increase of 30 % could occur under this future scenario of climatic change. An increase inthe mean wave energy would implicate a higher capability of water to maintain sediments suspendedwithin the water column and thus an increase in the suspended sediment transport which could modifythe sediment transport dynamics and would affect the deposition rates.
Another conclusion is that the coast of Buenos Aires City will be more frequently exposed to waveeffects, giving rise to intensified associated littoral processes. Given the predominant orientation of thecoast of Buenos Aires, the tractive currents carrying on thick material, north-westward will be increasedas well as the drift currents along the shore, see section 2.2.7.3. Therefore, it should be expected anincrement of both the accretion of sediments upstream the structures and of the erosion of the shoredownstream the coastal emplacements.
Although there are many uncertainties in these predictions, the potential impacts of future changes in thewave climate need to be assessed. Likewise, decision-makers should thoroughly consider the possibleimpacts on the coast of Buenos Aires City.
2.2.9 Hydrodynamic modelling
There are several relatively recent papers that offer a physical characterization of the Plata River,including the continental platform (Framiñán et al. 1999, Campos et al. 1999, Piola et al. 2000, Menéndez2001). On the other hand, there is more experience in the development and application of numericalhydrodynamic models to the Plata River being treated as a shallow water system, for which is sufficient atwo-dimensional description in the horizontal plane. It is important to stress that, in order to simulatestorm waves, the two-dimensional horizontal analysis turns out to be sufficient, since its wave length isquite larger than its depth (Whitham 1974, Menéndez and Norscini 1982).
Though there were initial attempts in the decade of 1970, the first systematical development of ahydrodynamic model was presented in 1986 (Molinari 1986), that used the software HIDROBID II(Menéndez 1990). Improvements and applications of this model continued in successive theses(Albarracín 1987, Olalde 1988). Since then, many other models of the river have been developed(Simionato and others 2002). A new version of the HIDROBID II, named RP200 has a great spatialresolution (mesh of 1 Km per side) and has been carefully calibrated (Jaime and Menéndez 1999).2.2.9.1 The RPP-2D model
Hydrodynamic model RPP-200 was taken as the basic model to develop the RPP-2D model, based onsoftware HIDROBID II, a 2.5 km x 2.5 km resolution 2D-Horizontal model. This software is based on thenumeric resolution of the shallow water equations. Its performance was shown to be comparable to moresophisticated, but much higher time-computer demanding 3Dmodels like the HANSOM-CIMA.

47
Fig. 2.29: Calculation domain of model RPP-2D
Given its barotropic nature, the software cannot represent the vertical stratification due to the effect of thesalinity. The domain of the RPP-2D model is large enough to include the Plata River and an extendedarea of its maritime front to simulate the generation of storm waves, Fig, 2.29.
The theoretical model considers as driving forces the gravity, the Coriolis acceleration (inertia force dueto the rotation of the Earth) and the superficial tensions due to the action of the wind. On the other hand,it includes the resistance to the movement resulting from the generation of turbulence at the bottom(historically named "friction"). It can have any form at the bottom, but constant in time (fixed bottom).The hypothesis of quasi-two-dimensional flow means that the movement is essentially bidirectional andthe speed is practically uniform along the vertical direction and, consequently that the verticalacceleration is negligible with respect to gravity, resulting in a hydrostatic distribution of pressures.
The shallow water equations results after filtering over the statistical ensemble of Navier-Stokes'equations (Reynolds' equations), followed by the vertical integration and the application of thesimplifying hypotheses of the theoretical model (Abbott 1979) are:
()()000()11()()0 ()11()()0 fxsxgxxxyfysygxyyyhhuhvtxyhzuuuuvfvghThTtxyxhhhxhyhzvvvuvfughThTtxyyhhhxhyττρρρρττρρρρ∂∂∂++=∂∂∂∂+∂∂∂∂∂++−++−−−=∂∂∂∂∂∂∂+∂∂∂∂∂+++++−−−=∂∂∂∂∂∂
where x and y are the spatial coordinates, u and v the mean vertical speeds in those directions,respectively, fg the Coriolis factor, #sx y #sy the sliding tensions on the bottom and T the tensor of theeffective tensions (includes the effects of viscosity, turbulence and differential advection).
The numerical scheme of resolution of these equations used in the software HIDROBID II is based on themethod of the finite differences. The grid is of the alternated type (the two components of the speed and

48
the water level are centered on different nodes). The method is implicit with alternated directions(Menéndez 1990).
The domain of the model RPP-2D is delimited by physical and mathematical contours. The physicalcontours are the Uruguayan and Argentine coasts. The mathematical contours are on the Maritime Front:the parallels 35.8° S in the north and 40.5° S in the south and the meridian 51.5° W in the west. The Frontof the Paraná Delta is considered to be also a physical contour, with the exception of the mouths of theParaná and Uruguay rivers, which constitute mathematical contours.
The bottom depth information was obtained from the combination of two data bases, one provided bythe Service of Naval Hydrography (SHN) of Argentina (Dragani 2002) about the Plata River and itsMaritime Front and the other one supplied by the same SHN consisting of information of Plata Riverdigitized depths (CARP 1989) In the numeric model of the terrain a spatial rectangular discriminationgrid was adopted, with cells of 2500 m per side ($x = $y), on a system of coordinates orientated accordingto the cardinal directions. It resulted 382 cells grid in east-west direction and 408 cells in the directionnorth-south, of which about 55 % falls over the continent, so that they do not intervene directly in thecalculation. Depth values were assigned to each of the cells of the model grid by a process ofinterpolation with the "krigging" technique. The depth so generated is referred to the chart of localreduction, with distance to the geode surface that is variable; therefore the surface of reference of thedepth is not an equipotential one. However, it was verified that this systematic error has no quantitativesignificance in the results.
The drag of the bottom is significant only in the inner Plata River where depths are low, losingimportance on the outer part of the river, and at the Maritime Front. Thus, it was adopted a uniformvalue for the drag coefficient of Manning’s for the whole domain of the model, namely 0,015, which wasobtained in the calibration of the RP2000 (Jaime and Menéndez 1999).
The discharge of each of the two large tributaries (Paraná and Uruguay) was forced as a boundary. It canbe a constant discharge in time, if the interest is to represent mean conditions, or a variable onedepending on the process to be simulated. It is not necessary to include the modulation effect caused bythe tide wave in the discharge (a priori unknown), since it only affects a very short area near theboundary (Jaime and Menéndez 1999).
The model has three oceanic borders (East, North and South), which constitute mathematic contours. TheEast border was considered as impenetrable on the basis that the wave energy that crosses it is very lowin relation with the one that propagates along the continental platform (tests carried out imposing thetidal wave showed that this approach is satisfactory). The north edge was treated as a not reflectingcontour, allowing the exit of the waves that affect it without reflecting information. Astronomic wavetides are imposed as a contour condition in the south edge of the model, on the basis of the existingknowledge that in this region tide waves effectively propagates from south to north. The tide wave isbuilt by combining the information registered in the Mar del Plata station (since it is the closest stationwith reliable historical records), suitably corrected in amplitude and phase, to represent the oscillation onthe coast, and the information obtained from the global model of tides RSC94 (Cartwright and Ray 1990),to represent the oscillation off-shore. The latter tool comes from a model of generalized response andfrom the utilization of the weight of its responses, derived from Proudman's functions, calculated for a 1 ºgrid that covers the area located between the latitudes -68 º and 68 º. The solution of the tide is based onthe contribution of the measurements of the altimeters TOPEX-POSEIDON and information of abouttwenty stations of tide observation. The combination between the coastal oscillation and the off-shorewave was made adjusting the incoming wave with a certain angle respect to the normal to the contourand with an exponential decay of its eastward amplitude, compatible with its Kelvin wave character.
The wind fields forcing the water surface were generated from the NCEP/NCAR's reanalyses (Kalnay etal 1996). These have a space resolution of 1,9048 ° of latitude and 1,875 ° of longitude (Fig. 2.30) and atime resolution of 6 hours. The data base matches with a grid T62 Gaussian with 192 x 94 points locatedinside the latitudes 88,54N-88,54S and 0E-358,125E.

49
Fig. 2.30: Example of the wind field from NCEP/NCAR
Since NCEP/NCAR's wind fields underestimate the intensities of the observed winds, following theexperience of the model HANSOM-TOP (Simionatto et al 2002) these intensities were increased in a factorof the form 1+exp [-(W/X) m], where W is the module of the wind speed, X a speed value (of the order ofthe larger intensities of the data base) and m an exponent. The utilization of this factor seeks to duplicatethe values of the very low intensities of winds and to keep the most intensity winds unaltered. In theRPP-2D model, routines that take the information of the NCEP/NCAR fields and perform a bi-linearinterpolation in the whole domain were implemented.
Since the software HIDROBID II is based on an implicit scheme of finite differences, it does not haveserious limitations for the time step value. Therefore, the election of this step is mainly conditioned by theprecision criteria required. As the phenomenon of the most rapid scale of the present problem are thesuperficial waves, which move on the much slower flow at Lagrange's speed, the temporary step ofcalculation $t should be chosen on such a way that represents adequately the displacement of thesewaves along the domain. Then the following condition can be imposed on the temporary step:maxxtcΔΔ:
where cmax is the maximum speed intended to be adequately solved. Then, since the wave energy isconcentrated basically in the continental platform, the wave speed in that zone has been considered themaximum speed (the oceanic depth is significantly greater than the Plata river one). Since the maximumspeed in the platform is of about 30 m/s, then $t % 80 seg. Thus, a 60 seconds step was used andconsequently 720 steps were needed to represent a 12 hours tidal oscillation.2.2.9.2 Calibration of the model
First, the model was calibrated to a pure astronomical tide scenario (only the oscillatory component waspresent) aiming to reproduce the waves predicted in the Tides Tables of the SHN and of the SOHMA(Service of Oceanography, Hydrography and Meteorology of the Navy, Oriental Republic of theUruguay), from the classic harmonic analysis of the records, for all the interior monitoring stations at thecalculation domain.
The south edge contour condition was adjusted, establishing the criteria to correct the amplitude andphase of the tidal wave to the Mar del Plata station, representing the variation of the water level on thecoast, but assuming the entry angle and the parameter of exponential decay eastward in order to becompatible with the tide wave of the global model. The application of a low pass filter to the dataprovided by the tides tables allowed to distinguish an oscillation of low frequency (period of around 14days) in almost all the stations, of variable amplitude from one station to another. The above mentionedoscillations were not considered for modeling, and therefore, were eliminated. Results for many places atthe coast showed a quite satisfactory agreement. As an illustration, Figure 2.31 shows the comparisonbetween water level Tide Table data and model results.

50
a)
b)
Fig. 2.31: Comparison of water level from tide tables and model for pure astronomical tide in Buenos Airesa), and Montevideo b)
A second step in the calibration aimed to simulate the conditions of monthly mean level. The decade thatgoes through 1990 and 1999 was taken as representative of the present conditions. a)
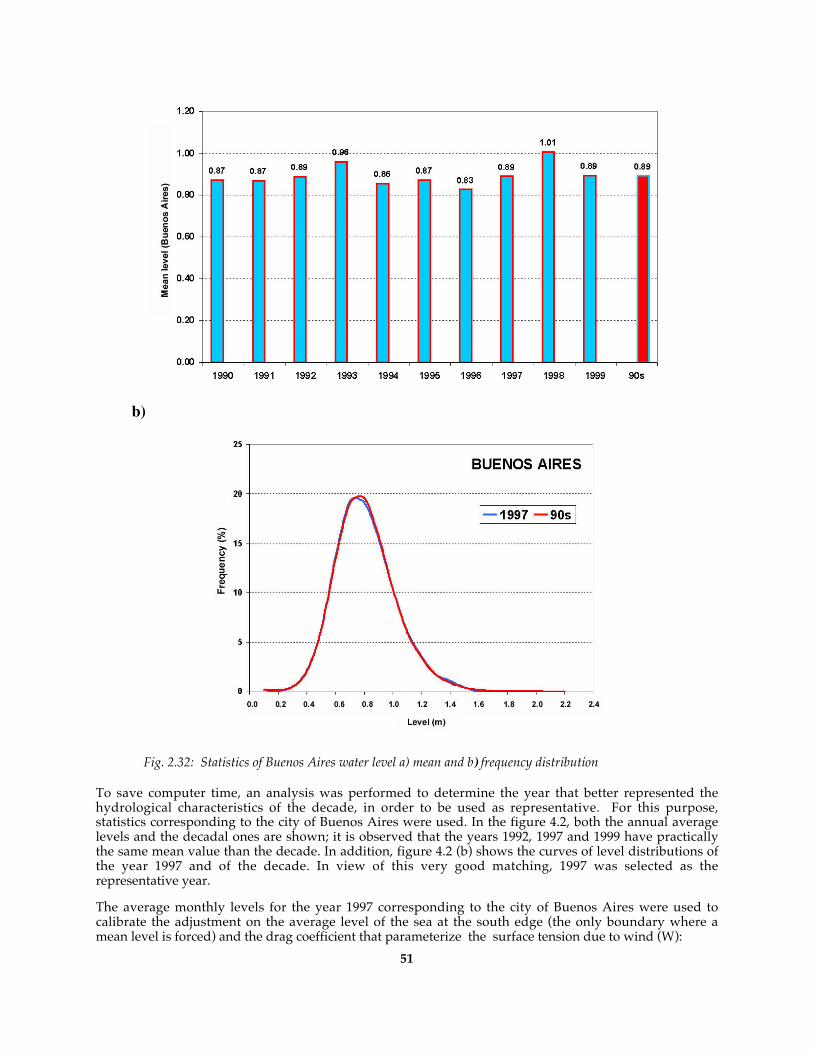
51
b)
Fig. 2.32: Statistics of Buenos Aires water level a) mean and b) frequency distribution
To save computer time, an analysis was performed to determine the year that better represented thehydrological characteristics of the decade, in order to be used as representative. For this purpose,statistics corresponding to the city of Buenos Aires were used. In the figure 4.2, both the annual averagelevels and the decadal ones are shown; it is observed that the years 1992, 1997 and 1999 have practicallythe same mean value than the decade. In addition, figure 4.2 (b) shows the curves of level distributions ofthe year 1997 and of the decade. In view of this very good matching, 1997 was selected as therepresentative year.
The average monthly levels for the year 1997 corresponding to the city of Buenos Aires were used tocalibrate the adjustment on the average level of the sea at the south edge (the only boundary where amean level is forced) and the drag coefficient that parameterize the surface tension due to wind (W):

52
sxDxsyDyCWWCWWττ==
The value 0.77 m with respect the reference plane for the mean sea level was selected. As for CD, the lawof variation as a function of wind speed shown in the figure 2.33 was chosen.
Fig. 2.33: The adopted drag coefficient CD
In this form, the agreement shown in the figure 2.33 was obtained. It can be observed that the annualmean level can be calculated with great accuracy whereas the mean seasonal levels reproduce the samecycle as the observed ones, with a maximum difference of about 10 cm (for the summer). This shows howadequate is to utilize the NCEP/NCAR wind fields for the representation of the mean seasonalconditions, in spite of their relatively low resolution
Fig. 2.34: Mean water level at Buenos Aires from model and records
In a third step, the objective was to simulate the curve of frequency of water levels in the city of BuenosAires, considering again as representative of the 1990 decade, the year 1997. In this case, the coefficients Xand m of alteration of the winds provided by NCEP/NCAR were adjusted, selecting the values X = 54Km/h and m = 1, obtaining the agreement shown in the figure 4.2 (the class interval is 10 cm), which canbe considered satisfactory. This indicates that NCEP/NCAR wind fields also are adequate for therepresentation of the level statistics. Furthermore, this result is of importance for the simulation of theextreme levels reached during storm surges.

53
Fig. 2.35: Frequency distribution of water levels in Buenos Aires for year 1997 observed and simulated bythe RPP-2D model
Finally, the final adjustment of the parameters were simultaneous with the comparison of theperformance of the model in the simulation of large storm waves as a way of guaranteeing that the modelis capable of dealing with these extreme events. Events of storm of varied levels of significance anddifferent characteristics in the period 1980-2000 were identified, and used for comparison: 06/Dec/1982,06/Mar/1988, 12/Nov/1989, 31/Aug/1991, and 16/May/2000. The comparison for a storm event ispresented in Figure 4.2.9.8, showing a good agreement taking into account the relatively poor windinformation. The agreement is considered to be acceptable bearing in mind that with the NCEP/NCARwind data it is not possible to expect a precise representation of isolated events. Nevertheless, it isverified that the extension of the domain of the model RPP-2D is sufficient to include the fetch of thestorms.
Fig. 2.36: Observed and simulated water level at Torre Oyarvide station for the November 1989 storm

54
2.2.9.3 Model verification
Once calibrated the model, its verification was made through its application to situations different fromthe ones used in the calibration.
As an illustration, figure 4.2 shows the results for four years of the 1990 decade. It is observed that, in allthe cases, the trend of seasonal variation of the water level is correctly represented, but the quantitativedifferences between observed and simulated seasonal levels widen, now, to a maximum of 20 cm.
a) 1990 b) 1991
c) 1993 d) 1994
Fig. 2.37: Observed and RPP-2D model simulated annual and seasonal mean levels in Buenos Aires forfour different years
In addition, information of the sea level with respect to the geode of reference provided by satelliteTOPEX-POSEIDON for the period 1992-2001 was used for verification of levels. The measurementsbelong to 148 stations located inside the domain of the RPP-2D model. The number of data of each stationis variable. For information sake, in the figure 2.290 are shown the measurements corresponding tostation 3092, located in the neighborhood of Punta del Este, on the Uruguayan coast, which is the onewith the greater number of observations. It is interesting to see the large variability of values observed. Tocompare this information with results of the RPP-2D model, the data in the direction towards the PlataRiver was analyzed, to check the gradient in this direction, Fig. 2.29.

55
Fig. 2.38: Level data from the TOPEX-POSEIDON satellites for station 3092
Fig. 2.39: Sampling points
The observed data were averaged at every point according to the season. Only were considered thepoints with more than 200 observations and those that were not in the inner Plata River, where toomarked variations were detected. Besides, it was obtained the mean seasonal simulated levels making theaverage of the series of instantaneous levels. In the figure 2.29 (a) and (b) are presented the comparisonsbetween information and results of the model for mean summer and winter conditions during the 1990decade along the axis of the data cloud. It is observed that the model turns out to be a suitableinterpolator of the satellite information, identifying clearly the trends of the superficial gradient, whichindicates major (minor) levels of the River in relation to the ocean conditions for summer (winter).
a)

56
b)
Fig. 2.40: Mean levels a) Summer, b) Winter
Comparisons of the curves of level frequency for the rest of the decade of 90 were performed. Asillustration, figure 2.41a shows the results for four years of the decade. It is observed that the level ofagreement is similar to the one obtained for the calibration year.

57
a) 1990 b) 1991
c) 1993 d) 1994
Fig.2.41: Comparison of the frequency distributions of water levels at Buenos Aires obtained frommeasurements and simulated by the RPP-2D model
Finally, speed records of currents obtained by the company Hidrovía S.A., concessionary of the dredgingmaintenance of the navigation channels, were used for further comparison. They correspond to 10stations located in the middle stretch of the river, relatively close from one another. Figure 2.29 presentsthe comparison between two components of the horizontal mean speed according to the records of one ofthese stations. Bearing in mind again that, with the base of wind information of NCEP/NCAR, the modelcannot represent the detail of events, the agreement is considered to be highly satisfactory.a)

58
b)
Fig. 2.42: Comparison between recorded and calculated flow velocities, for a normal tide scenario: a)component west-east and b) component south-north. Red observed, blue model
2.2.10 Flood modelling
As explained before, floods in the coasts of the Plata River are caused by storm surges, forced by strongsouth easterly winds. The return period or recurrence time for each maximum level is a common tool forassessing the flood risk at coastal locations. Fig, 2.43 shows the recurrence period for annual peak levelsin Buenos Aires city, according to the 1905-2002 series data.

59
Fig. 2.43: Return period of the annual maximum level in Buenos Aires port
The only available long record of water levels on the Argentine coast of the Plata River is Buenos Aires.This is a serious limitation to asses flooding return periods, because, the wave tides increases its height aspropagates from the ocean into the Plata River. This effect appears because the depth and the widthdecrease upstream from the ocean. To extend the results shown in fig 2.43 to all the right coast of thePlata River, it was developed a methodology that makes use of the RPP-2D model. The methodology alsopermits to avoid running the model for considerable simulated time, say 50 to 100 years, which is notalways possible when there are only limited computer resources.
The method consists in defining a typical storm surge that can be representative of the greatest stormsurges, both in its space and time pattern, even with different maximum heights. For this storm surge, themaximum height at each point on the coast has a value that determines its constant scale factor thatresults from its rate with the maximum value at a reference place. In our study the reference place is theport of Buenos Aires where given a level height, its recurrence is known.
As typical storm surge was selected the one of May 2000, whose wave tide had a well defined peak. Themodel was run during 15 days starting in May 8th and finishing in May 22nd. The storm peak happened inMay 16th.
Along the Argentine coast were defined 24 locations as shown in Fig. 2.44. In each of them wasdetermined from the model simulation, the maximum level produced by the wave storm passage. Thisvalue, when compared with the respective one of Buenos Aires, gives the constant scale factor.

60
Fig. 2.44: Locations for the determination of flood level
As an example, Fig. 2.45 presents, the wave storms resulting at each location for the 100 years recurrenceperiod. As expected, the amplitude of the wave amplifies as the wave propagates to the inner part of theRiver. This is even more clearly seen in the curve of the maximum levels at each location correspondingto the same wave, fig 2.46.
Fig. 2.45: Storm waves for the 100 year recurrence period at each location along the coast, constructedfrom their respective scale factor.

61
Fig. 2.46: Maximum heights calculated for the storm surge tide with return period of 100 years
2.3 Results
Results that are consider central to the Project in connection with present and future scenarios arepresented in the first three sections Other results, mainly of scientific interest are presented in sections2.3.4 and 2.3.5.
2.3.1 Hydrologic scenarios
In order to address the questions concerning climate change, it is necessary to specify some type of futureclimatic scenario. In this project, the scenario SRES A2 defined by the Third Report of the Inter-governmental Panel for the Climatic Change (IPCC) was chosen. Socioeconomic trend assumptions inthis scenario are similar to the current ones, and therefore the resulting trends of greenhouse effect gasesemissions would reflect what would come if the humanity does not take rapid and drastic measures toreduce these emissions. Nevertheless, some other estimate were also made with a greater rise that arecompatible with the SRES A2 uncertainties and with the current rate of sea level rise as calculated fromthe Topex- Poseidon satellite complex.
The model RPP-2D was used to develop water level scenarios for the twenty first century. Scenarios weredeveloped for the 2030 and 2070 decades, preserving the same astronomic tides and mean discharges ofthe tributaries as in the 1990 decade and changing the winds fields and the mean level of the sea. As willsee in section 2.3.4, these are the key variables for future change in the Plata River levels.
In the case of the winds, there are two problems, in general GCM underestimate the frequency andintensity of perturbations of the zonal flow. In addition, the available climate scenarios from IPCC 2001did not have daily data, but only monthly averages. On top of that, not even monthly averages of surfacewinds were available.
To find a way to assess wind change, it was made the assumption that although mean winds wouldchange, their variability will remain the same as well as their relationship with the pressure field. Thenthe following procedure was followed. First, it was found a multiple regression adjustment betweensurface daily pressure and the wind at each point of the NCEP/NCAR grid over the hydrodynamicmodel domain and for every month. This was made with NCEP/NCAR reanalysis data, and almostwithout exception the regression explained more than 95 % of the variance of both, the zonal and themeridional wind components.
The second step was to choose the model that best reproduces the present surface pressure climate in theregion of concern. Although, regarding the surface pressure field, the ECHAM4 had as good performance

62
as the HADCM3, the last was chosen because best reproduces other features of the regional climate, likeprecipitation and temperature, (Camilloni 2004). The next step was to calculate the surface pressure meandifference between the field given by the model for each month for the 2030s and 2070s and the 1990s.These differences were assumed to be the same as the one between the ¨true¨ fields in the given scenarioat the 2030 and 2070 decades and the 1990 observed decade. Then the daily surface pressure scenario foreach month of the future decades was calculated adding the difference so calculated to the daily surfacepressure of the NCEP/ NCAR reanalysis. Finally, with the daily surface pressure field, the daily windfield was calculated according with the regression equations in the 16 points located between thelatitudes 32.5 º S and 40 º S and the longitudes 50 º W and 60 º W, all of them over the water domain of themodel RPP-2D.
The sea level rise was taken from the SRES A2 mean scenario (IPCC 2001) for every decade, but a highervalue was also considered in the case of the 2070 decade, more consistent with present trends, Table 2.4.
Decade Scenario Sea level rise (cm)2030-2040 Mean 102070-2080 Mean 282070-2080 High 40
Table 2.10: sea level rise scenarios consideredEffect of the wind change
The first experiments only included the wind field change to quantify its relative contribution. Figure2.47 shows the mean level changes in future scenarios with respect to present (1990 decade). In bothscenarios the level increases all over the Plata River.
For the decade of 2030, a significant rise, greater than 5 cm, is only at the sources the river, in theneighborhoods of the Paraná Delta front. On the other hand, for 2070 decade, this or a greater rise takesplace in the whole inner part of the River and the over the Uruguayan coast.
a) 2030 b) 2070

63
Fig. 2.47: Level rise for A2 mean scenario only forced by the change in the wind field as predicted by theRPP-2D model
2.3.1.1 Effect of the whole change
Future scenarios were developed including the combined effect of the wind change and mean sea levelrise. The tributary changes would have a minor effect as will be seen later in the sensitivity study andwere not included. Figure 4.13 shows the average annual and seasonal present levels, as well as the futurelevels for Buenos Aires in the mean A2 scenarios of the 2030 and 2070 decades. The annual mean rises areslightly larger than those corresponding to the mean sea level due to the effect of the wind change, inagreement with the experiments made with only wind change.

64
Fig. 2.48: Mean level rise in Buenos Aires for the A2 mean scenario as predicted by the RPP-2D model
Figures 2.49 show the annual mean level rise for both decades in the mean A2 scenario. In both cases, therise at every section of the river is higher on the Uruguayan coast. Figure 2.50 shows the mean seasonalrise for the same scenario in the 2070 decade, but for every season.
a) 2030 b) 2070
Fig. 2.49: Level rise for the A2 mean scenario as predicted by the RPP-2D model

65
a) Summer b) Autumn
c) Winter d) Spring
Fig.2.50: Level rise for the A2 mean scenario as predicted by the RPP-2D model for the 2070 decade
The frequency distributions of levels for both decades in the mean A2 scenario are shown in the figure2.51. Besides the shift expected in the mode, there is a growth in the dispersion of the frequencies to bothhigher and lower levels and a reduction of the mode frequency.

66
Fig. 2.51: Frequency distribution of levels for current conditions and for the A2 mean scenario as predictedby the RPP-2D model
Fig. 2.52 shows the flood levels at Buenos Aires as a function of the return periods for current conditionsas well as for the A2 mean scenario in the 2030 and 2070 decades. The typical storm surge was calibratedto attend the present levels corresponding at the return periods depicted in Fig 2.52. Then, this typicalstorm was run forced by the corresponding 2030 and 2070 sea level scenarios. The increment of the waterlevels in each case is about the same as that of the sea level rise indicating that there are not importantnon linear effects. Therefore, the levels that correspond to each time of return were estimated for eachscenario adding to the levels of the current scenarios the increase of the mean estimated level. As will beseen in the sensitivity studies (section 2.3.4), this is consistent with the fact that most of the level responsewould come from the sea level rise.
Fig. 2.52: Return period for the maximum annual level in Buenos Aires for present and future mean A2scenarios

67
2.3.2 Recurrent flood Maps
For every recurrence time, the corresponding level along the coast can be obtained from the scale factorwith respect to Buenos Aires (as illustrated in figure 2.46 for the 100 year return period). Then, for eachsite along the coast, the surrounding land area below this level is considered flooded. With this approach,the backwater effect on tributary rivers and brooks is ignored and therefore, the estimated flooded areason their valleys are underestimated. The combination of the recurrence levels and the digital surface mapof the coastal zone is performed in a GIS.
Fig 4.17 shows the flooded areas for present conditions (1990 decade) and for different return periods aswell as for the SRS A2 scenario in the 2030 decade. Figures 2.54 is similar, but for SRES A3 scenario at the2070 decade. The case of the 2070 sea level rise of 0.4 m with respect to present will be referred to as2070max . The same information is presented in figures 2.55 to 2.3.2.8, but now for each return period (1, 5,20, 50, and 100 years), making more clear the changes from present to future scenarios. The black and redcolours in figure 2.53 that are indicative of the areas flooded at the respective return periods weresuperimposed on a satellite image where the huge metropolitan area of Buenos Aires and the smaller oneof La Plata can be identified.
Fig. 2.53: Flooded areascorresponding to return periodsin years as indicated 1990 decadeconditions (upper panel), 2030decade in the SRS A2 scenario(lower panel)

68
Fig. 2.54: As in figure2.53, but for the 2070decade in the SRS A2scenario
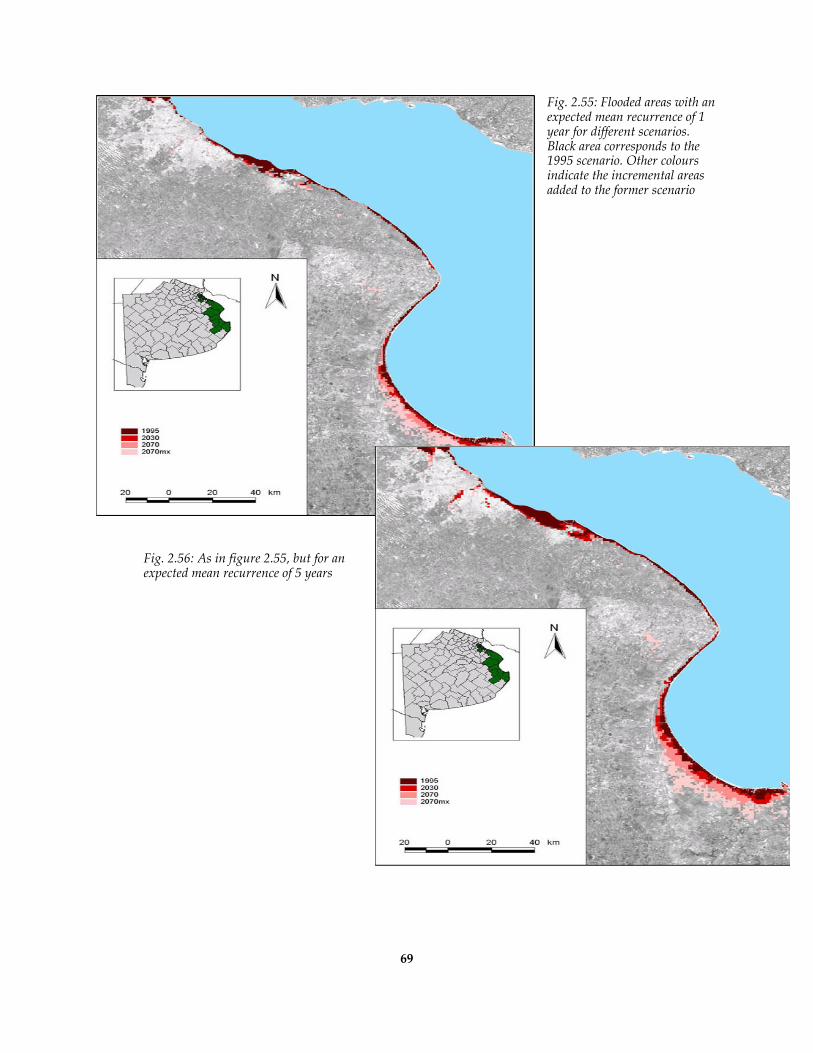
69
Fig. 2.55: Flooded areas with anexpected mean recurrence of 1year for different scenarios.Black area corresponds to the1995 scenario. Other coloursindicate the incremental areasadded to the former scenario
Fig. 2.56: As in figure 2.55, but for anexpected mean recurrence of 5 years

70
Fig.257: As in Fig.2.55, but foran expected mean recurrence of20 years
Fig. 2.58: As in Fig.2.55, but for anexpected mean recurrence of 50 years

71
Fig. 2.59: As in Fig.2.55, butfor an expected meanrecurrence of 100 years.

72
On the average, floods can be expected every year over a large coastal area in the south of theMetropolitan Buenos Aires, as well as in the coast of the Samborombón bay. The valleys of theReconquista and Matanzas- Riachuelo rivers have also risk of floods, but only every 20 years. At thesouth of the Samborombón Bay there is a large area, well inland that surrounds the city of GeneralLavalle that presents return periods of floods between 50 and 100 years. In the future, the return periodsof floods will become shorter in the mentioned valleys, which are now densely populated areas. The moststriking change in terms of flooded area is on the south of the Samborombón Bay, as expected accordingto its altitude over mean sea level, fig. 2.25.
2.3.3 Permanent flood
As anticipated in section 2.2.8, the areas that will result with enduring floods in the studied scenarios arerelatively small and only constrained to the Samborombón Bay, especially in its southern part. Fig 2.53depicts the places that will suffer permanent flood in the 2070max scenario.
Fig. 2.60: Area of enduring floods in the 2070max scenario. Red as calculated from the GIS, pink as likely tobe partially flooded.
Since the terrain is rather flat, with lagoon and tide channels, the horizontal resolution of 1 Km may notbe adequate to describe the real situation, where could be small marsh areas and isolated small islands.Therefore in the figure, the area that could be in such state is depicted in pink colour. At the same time,since the soil in this area is not composed of well consolidated elements, it is very likely that will beeroded in relatively few years.
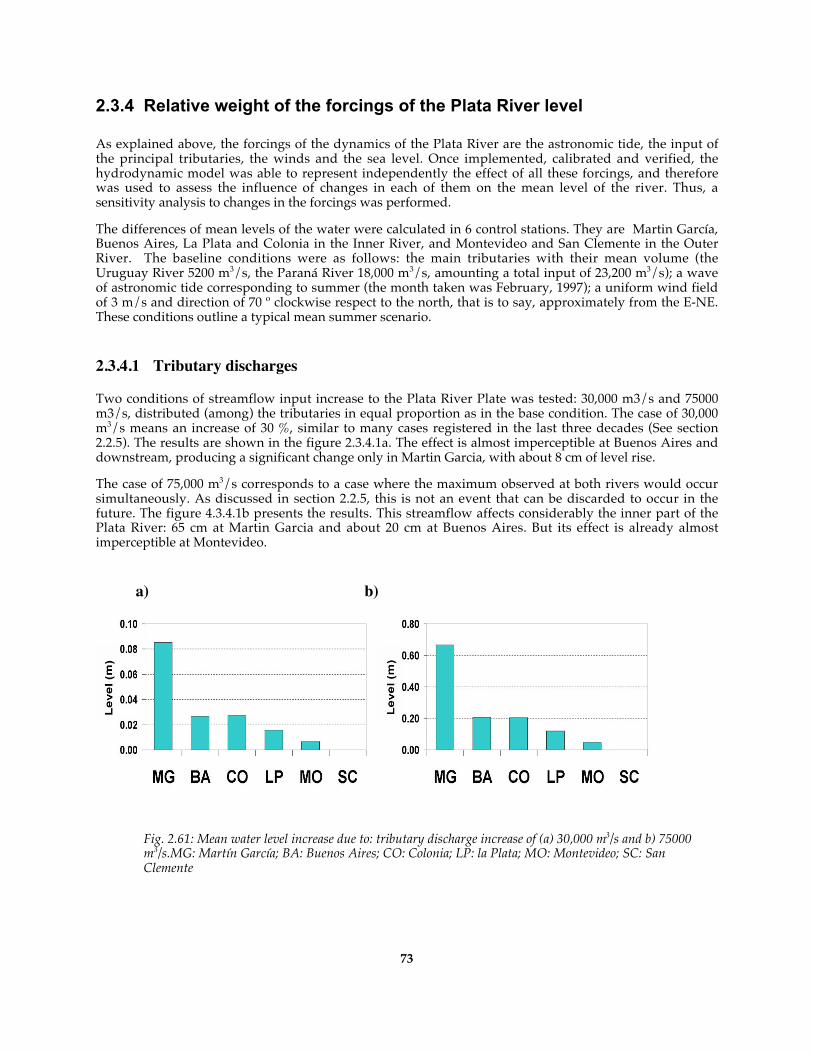
73
2.3.4 Relative weight of the forcings of the Plata River level
As explained above, the forcings of the dynamics of the Plata River are the astronomic tide, the input ofthe principal tributaries, the winds and the sea level. Once implemented, calibrated and verified, thehydrodynamic model was able to represent independently the effect of all these forcings, and thereforewas used to assess the influence of changes in each of them on the mean level of the river. Thus, asensitivity analysis to changes in the forcings was performed.
The differences of mean levels of the water were calculated in 6 control stations. They are Martin García,Buenos Aires, La Plata and Colonia in the Inner River, and Montevideo and San Clemente in the OuterRiver. The baseline conditions were as follows: the main tributaries with their mean volume (theUruguay River 5200 m3/s, the Paraná River 18,000 m3/s, amounting a total input of 23,200 m3/s); a waveof astronomic tide corresponding to summer (the month taken was February, 1997); a uniform wind fieldof 3 m/s and direction of 70 º clockwise respect to the north, that is to say, approximately from the E-NE.These conditions outline a typical mean summer scenario.
2.3.4.1 Tributary discharges
Two conditions of streamflow input increase to the Plata River Plate was tested: 30,000 m3/s and 75000m3/s, distributed (among) the tributaries in equal proportion as in the base condition. The case of 30,000m3/s means an increase of 30 %, similar to many cases registered in the last three decades (See section2.2.5). The results are shown in the figure 2.3.4.1a. The effect is almost imperceptible at Buenos Aires anddownstream, producing a significant change only in Martin Garcia, with about 8 cm of level rise.
The case of 75,000 m3/s corresponds to a case where the maximum observed at both rivers would occursimultaneously. As discussed in section 2.2.5, this is not an event that can be discarded to occur in thefuture. The figure 4.3.4.1b presents the results. This streamflow affects considerably the inner part of thePlata River: 65 cm at Martin Garcia and about 20 cm at Buenos Aires. But its effect is already almostimperceptible at Montevideo.
a) b)
Fig. 2.61: Mean water level increase due to: tributary discharge increase of (a) 30,000 m3/s and b) 75000m3/s.MG: Martín García; BA: Buenos Aires; CO: Colonia; LP: la Plata; MO: Montevideo; SC: SanClemente

74
2.3.4.2 Winds
A test scenario was run with an increase of 33 % in the intensity (4 m/s) and a change in the direction ofthe winds, which rotate eastward (reaching 90 º), compatible with the climatic trend observed for summer(See section 4.2.4). The results of the simulation are shown in the figure 4.19. Increases of the level areobserved in the inner Plata River, just as expected, reaching values of 4 cm in La Plata and Colonia andabout 8 cm in Buenos Aires.
Fig. 2.62: Change in the mean level due to an increment and rotation of wind to the east as described in thetext
Changes in the levels of the outer Plata River are also sensitive to the direction of the winds, changingfrom the decreases observed in figure 2.62 to almost not changes when the wind turns slightly moretowards the North-East.2.3.4.3 Mean sea level change
A situation with an increase of 25 cm of the average level of the sea with respect the present conditionswas tested. This value is representative of the order of magnitude of the expectable increase during thefirst part of the twenty first century. Figure 2.63 shows that the response all over the estuary is practicallythe same, with a very slight reduction of the rise, scarcely perceptible in Martin García, which is 3 cmlower than the sea level rise.
Fig. 2.63: Change in the mean level due to an increment of mean sea level of 0.25 m
2.3.4.4 Response comparison
According to the expected possible variations in the forcings of the Plata River level, the mean sea levelrise would be the prevailing mechanism of change of the mean level of the Plata River for the present

75
century. The mean sea level rise not only would be the more important in magnitude, but it will affect thewhole estuary. It follows in importance the wind effect, which according to its likely expected changeswould generate mean level rises of the order of 10 cm in the inner part of the river.
Finally, the minor effect is that of the changes in the tributary discharges, which only for very exceptionaland extreme events would produce important increases in Buenos Aires. More regular extreme eventsonly would cause a few centimeters rise up to Martin García.
2.3.5 The wind influence in the levels of the Plata River
In the preceding section was shown that changes in wind intensity and direction can modify the meanlevel of the Plata River. According to the model sensibility study, an augment of the easterly componentis expected to rise the mean level of the inner Plata River, especially at the Argentine coast and decreasethis level at the outer part of the estuary, especially in the Uruguayan coast.
In the Argentine inner coast there are long records at Buenos Aires and at the Uruguayan outer coast,there is equally long records at Montevideo. In section 2.2.4, we have seen that the easterly componentincreased since the 1950 decade. Consistent with this wind trend, and with the sensibility results of themodel, the level trend in Montevideo was lower than in Buenos Aires, section 2.2.2. The difference in bothtrends was greater in the last three decades, as the level at Buenos Aires augmented 12 cm, while atMontevideo only increased 5 cm. The difference can be attributed to the wind change.
Another indication of the influence of the wind field on the mean level of the Plata River is the differentseasonal behavior of this level at Buenos Aires and Montevideo. The seasonal variability of the level atMontevideo is such that the maximum level is attained in autumn and the minimum in spring, andsummer level is higher than winter. This cycle corresponds to the water density variation thataccompanies the annual cycle of temperature in the sea. Because of its inertia, the sea reaches the warmesttemperature, and consequently the maximum expansion, during the early autumn and the coldesttemperature and minimum expansion in the early spring. On the other hand, in Buenos Aires, themaximum level is in summer and the minimum in winter, indicating that the wind effect overcomes thedensity effect in the summer/autumn and in the winter/spring parts of the year. Indeed, the easterlycomponent of wind in the Plata River is considerably stronger in summer than in autumn, while the samehappens with the westerly component in winter with respect to spring.
The future evolution of the regional sea level pressure (SLP) fields was discussed in section 2.2.4. Thetrend toward increasing (decreasing) predominance of the summer (winter) mode will affect the Rio de laPlata estuary wind field. The SLP meridional gradient is proportional to the eastern wind component(geostrophic relationship) or more realistically because of the friction effect to the southeasterly windcomponent.
Table 2.1, shows the mean meridional SLP gradient across the RP estuary for different periods and modelexperiments. This gradient is different between models and between them and NCEP, but all have thesame positive trend including the same decline in the nineties. This might imply that the water level ofthe RP estuary in its inner stretch has increased not only due to the sea level rise but also because of therotation of the wind field, and that this effect could continue in the future.

76
Model/Reanalysis
1951-1960 1961-1970 1971-1980 1981-1990 1991-2000 2001-2050 2051-2099
NCEP 1.0 1.2 1.1 1.6 1.4 ---- ----
HADCM3 0.9 0.9 1.0 1.1 1.0 1.3 1.9
CSIRO-Mk2 --- 0.4 0.2 0.4 0.3 0.5 0.7
GFDL-R30 --- 0.4 0.5 0.7 0.6 0.6 2.3
ECHAM4/OPYC3 --- --- --- --- 1.7 2.0 2.3
Table 2.64: Average (55°-57.5°W) SLP difference (hPa) between 32.5° and 37.5°S
2.4 Conclusions
The mean level rise of the Plata River will be a few centimetres greater than the sea level rise because ofthe wind rotation to the east that is already taken place. For this reason the level rise in the Uruguayancoast will be higher than in the Argentine coast and more important towards the interior of the River.Since, in general the coast in the Uruguayan margin is high; the only prejudice of this rise will be in thereduction of the shores, that however is an important asset because of the economic profile of Uruguay asa destination from tourists of the neighbouring countries.
The areas with risk of enduring flood during this century in the Argentine coast of the Plata River arevery small. The southern coast of the Samborombón Bay presents the large area with such risk that couldbe enhanced by the characteristics of the soil, which is composed of not well consolidated elements andtherefore could be eroded in relatively few years. Other area of permanent flood risk is the front of theParaná delta, which may become an area of social and economic vulnerability if it is occupied in thefuture.
Therefore, the major impact of the Climate Change regarding coastal flooding will be in the increasingfrequency of floods caused by storm surges. These floods can be expected now every year over a largeand wide fringe in the south of the Great Buenos Aires, as well as in the coast of the Samborombón bay.The valleys of the Reconquista and Matanzas- Riachuelo rivers have also risk of these floods, but onlyevery 20 years. In the future, the return periods of floods will become shorter everywhere, but especiallyin these valleys, which are densely populated areas. The most striking change in terms of land areas tobecome recurrently flooded will be on the south of the Samborombón bay.
According to the expected changes in the forcings of the Plata River level, the mean sea level rise wouldbe the prevailing mechanism of change during the present century, being the more important inmagnitude and affecting the whole estuary. Wind changes would generate mean water level rises of afew centimeters in the inner part of the river. This rises can be matched by very exceptional and extremedischarges of the tributaries, but only for few days or eventually months.
The wind is however, the most important forcing in causing the recurrent floods on the Plata coast. Inaddition, its annual cycle is also responsible for most of the seasonal changes in the mean River level andfor the differences between the observed water level trends in Montevideo and Buenos Aires.

77
3 Socio-Economic Features
3.1 Activities Conducted
We made a critical review of the concept of vulnerability, considering the need of defining indexes thatreflect the conditions a priori of catastrophic events, which however condition the capacity of responseand adaptation during and after these events. Then, it followed a delimitation of the area of the study.
For current conditions, social data were taken from census, and for future scenarios, as a first approach,socio-economic conditions were considered as in present time. Though this a simplistic approach, thehistory of Argentina during the last century, indicates that once unthinkable socioeconomic scenarios hadnonetheless taken place and there are few signs that the socioeconomic indicators may improve in thefuture. Demographic growth followed a more predictable path and therefore a simple hypothesis of a 1 %annual growth was adopted. The last step was to map the indicators and social indexes in a GIS
3.2 Description of Scientific Methods and Data
Available demographic and social information was taken from the national census of 1991. Though therewas a more recent census in 2001, most of the social variables were not yet processed at the time thisactivity was undertaken. The companies in charge of public services provided the technical data thatpermitted to assess the cost of floods in their facilities. In the case of real-estate property, the costassessment was carried out according to the mean value of each zone.
The socioeconomic conditions for future scenarios were considered equal to the present ones, which isclearly a very strong simplification. It was considered that it is practically impossible to make projectionsof these conditions to 30 or 80 years ahead in such changeable world and country. Anyhow, the resultsare indicative of the impacts that the Climatic Change would cause in the current social-economicconditions and are useful to show the trends and the principal aspects that would be necessary to attend.
3.2.1 Delimitation of study area
To develop a social vulnerability index and its expression in a GIS context, it was necessary, as a first step,to choose the geographic area of study. The delimitation of the study region and the political-administrative units involved were done using two conditions: that the administrative units were locatedon the coastal zone of the Plata River, and that part of it was below 5 m above mean sea level. The 5 metermark was based on the assumption of a maximum scenario of mean sea level rise in the year 2100 ofabout 1m and considering that the maximum tidal peak registered until now was near 4 m.
It should be noted that the application of an exclusively physical-natural criterion in the delimitation ofthe study area for the characterization of social vulnerability was not possible for two reasons:
i) When the littoral area is affected, the rest of the territory that is part of the political-administrative unitsinvolved will also suffer the socioeconomic effects of the phenomenon. Political decisions that may beproposed and eventually taken on the potentially affected area are largely circumscribed to the political-administrative units involved.
ii) The socioeconomic and demographic information compiled from the National Censuses of Populationand Housing (CNPyV), necessary for the characterization of social vulnerability is consolidated inpolitical-administrative units (Municipalities/Districts) and it is available at smaller units (censusfractions and radii) only for population data.
Low areas bordering the Reconquista River in San Fernando County, and low areas in the floodplain ofthe Matanza-Riachuelo basin, located within Buenos Aires city were included, although they have nocoast over the Plata River. The low areas of the continental sector of Tigre County, which clearly illustrate

78
the growth of gated urban polderized neighborhoods, were also included. Fig 3.1 illustrates the selectedarea.a)
b
)
Fig. 3.1: The study area, a) the north sector and b) the south sector
3.2.2 Available demographic information
Information of the political-administrative units and their corresponding census fractions and radii,according to the 1991 CNPyV, carried out by the National Institute for Statistics and Censuses (INDEC)

79
was processed in a GIS program ArcView 3.1 and interpolated to the same grid of 1Km2 used for thedigital model of the topography.
Figure 3.2 shows the population density. It is seen the maximum density over the City of Buenos Airesand the shape of the metropolitan area of Buenos Aires as well as the city of La Plata to the southeast of it.
Fig. 3.2: Population density (hab/Km2)
3.2.3 Critical review of the concept of vulnerability
For this research, social vulnerability has been defined based on the conditions of the social group (social,economic, cultural, political dimensions), prior to the occurrence of the catastrophic event, in terms of itscapacity to face it and recover from it.
The social ensemble -all those who are subject to being potentially affected by a possible disaster - shouldbe identified. The members of this group share certain features defined in terms of exposure (territorialand material aspects) but are however heterogeneous in terms of response capacity (economic, cultural,and political aspects). This ensemble is consequently heterogeneous. The differences within it must betaken into account when establishing priorities in a context of resource shortage.
Some authors view heterogeneity in a dichotomous way, linking it to a poverty or non-poverty situationand consequently, to a situation of social inclusion or exclusion. Other authors identify a series of nuancesand grades, in which multiple intermediate situations exist between both extremes. Who is to beincluded, or not, within the vulnerable group depends on the criterion to be applied. The first vision(dichotomous) considers a group and excludes another. But in reality, social vulnerability ismultidimensional. Therefore, the nuances and grades that express this multi-dimensional conditionshould be retained in the analysis.

80
3.3 Social vulnerability index: Selected definition and indicators.
An index of social vulnerability makes possible to identify situations of greater social vulnerability withina given group of units. Its scope and limitations are related to the objective of identifying units in whichthe process is apparently more intense.
In this case, the index includes indicators related to the following aspects: a) demography b) livingconditions of the population and c) structural production and consumption processes. The demographicsub index includes the following indicators: total population, population's density, index of potentialdependence (children and elderly).
The conditions of life sub index includes the following indicators: population’s percentage of homes withunsatisfied basic needs (NBI), percentage of homes with women in charge, total rate of infantile mortality,and population’s percentage without access to health services.
The work, production, consumption sub index includes unemployment rate, aggregated gross product,registered cars rate (inhabitants / car rate), and percentage of workers without social benefits.
These indicators were chosen on the basis of data availability for all the administrative units undersurvey. The data employed were those corresponding to the Buenos Aires province for the year 1991, thelast census available to date for most of the indicators and administrative units. In all cases, aclassification in five categories was made, using the system of natural breaks provided by the GIS. Thenthe data were plotted and classified in five categories, and the breaks were analyzed according to thecurves. In most cases, the categories proposed by the GIS were accepted, while in some were adjusted,changing the (upper or lower) limit so as to obtain a more significant variation of the data, andconsequently, the highest possible heterogeneity. Each sub index results from the sum of the valuesassigned to its four indicators. Finally, the values were grouped in four categories as depicted in table3.1.
Index ClassesDemographicSub index
Conditions oflifeSub index
ProductiveSub index
SocialVulnerabilityIndex
Very low 1 7-8 6-9 6-10 24 - 29Low 2 9 10-11 11-12 30 - 33High 3 10-11 12-13 13-15 34 - 38Very high 4 12-15 14-17 16-18 39 - 43
Table 3.1: The composition of the Social Vulnerability Index
3.4 Results
The geographical distribution of the sub indexes can be seen in Table 3.2. Figure 3.3 presents also amapping of the social vulnerability index. According with this social vulnerability index, E. Echeverria inthe south of the Great Buenos Aires and General Sarmiento in the north are the two districts with highersocial vulnerability. However, since they are districts that only have a minor exposure to floods, they arenot highly vulnerable to them, although in the second case would be vulnerable in the future because ofthe River level rise. If this index were combined with physical conditions, Berazategui and Berisso wouldbe the districts with higher social vulnerability to floods.
On the other hand, General Lavalle, Magdalena y Tordillo, districts of definite rural profile rural, presentthe lowest indexes of social vulnerability. The only urban district with a comparable low index of socialvulnerability is Vicente López, next to the city of Buenos Aires, a residential area of predominantly highincome population.

81
DepartmentsDemographicSub index
Conditions of lifeSub index
ProductiveSub index
SocialVulnerabilityIndex
Esteban Echeverria 3 3 3 4General Sarmiento 4 4 4 4Berazategui 3 3 3 3Berisso 2 3 3 3Castelli 1 4 2 3Ensenada 2 3 3 3General San Martin 3 3 1 3La Costa 1 2 4 3La Matanza 3 3 3 3Lanas 3 3 2 3Lomas de Zamora 4 3 2 3Quilmas 4 3 3 3San Fernando 1 4 3 3Tigre 3 4 3 3Avellaneda 3 3 1 2Capital Federal 4 1 1 2Chascomus 2 2 2 2La Plata 3 3 1 2Moron 3 2 2 2San Isidro 3 2 1 2Tres de Febrero 3 3 1 2Dolores 1 3 2 2Maipú 2 3 2 2General Lavalle 1 2 1 1Magdalena 1 1 2 1Vicente Lopez 4 1 1 1Tordillo 1 1 2 1
Table 3.2: Social Vulnerability Index of the administrative units of the study area. References: 1=very low; 2= low;3=middle; 4=high

82
Fig. 3.3: Index of social vulnerability
3.5 Conclusions
The coastal area of the Plata River under risk of potential floods during this century is heterogeneous interms of social vulnerability. E. Echeverria and General Sarmiento are the two districts with higher socialvulnerability. However, since they are districts that only have a minor exposure to floods, they are nothighly vulnerable to them. The other two districts that follow in social vulnerability, Berazategui andBerisso, are at the same time highly exposed to recurrent floods as will be seen in the next chapter.

83
4 Impacts and Vulnerability
4.1 Activities Conducted
Assessment of vulnerability followed a geographical approach integrating physical and socialinformation in a GIS. The GIS was used to estimate the population affected and the public serviceinfrastructure and real estate property damage for different return periods of flooding.
Based on the areas flooded at given return periods, it was calculated the social and the economic impactsfor current conditions as well as for future climate and sea level scenarios. The first was done through theconstruction of an index of social vulnerability to recurrent floods combining an exposition to the floodsindex with the social vulnerability index.
Economic impact followed two approaches, one that produced an inventory of the facilities on the areathat will become exposed to flood during this century, and another that assessed the costs of the damagedcaused by the recurrent floods in the public services facilities along the coast and in the real estateproperty,
4.2 Description of Scientific Methods and Data
The methods and data used were different for the assessment of the social vulnerability to recurrentfloods and for the economic damages of them.
4.2.1 Socio economic vulnerability to recurrent floods
An index of exposure to floods was calculated with the minimum return period of flood that correspondsto every cell of 1 Km2. It was calculated as approximately the inverse of the minimum return period(MPR). Its formulation is 20/ (MPR) +1. The idea behind this formulation is that although the expositionindex should somehow be inverse to MPR, the implications of a flood that happens every 20 years islarger than one twentieth of the one that takes place every year since it affects zones where thephenomenon is less expected and generates negative expectations that are already incorporated in theother case.
On the other hand, there is not much differences in the perception of the flood risk, if this has arecurrence of 20, 50 or 100 years, since in any of these cases, some precaution has to be considered. Forthis reason, the index reflects little changes for areas with expected recurrence values greater than 20years.
Finally, an index of social vulnerability to recurrent floods was developed combining the index of socialvulnerability with the one of exposure to the floods through the product of both. Later the obtainedindexes were normalized in order to rank them from zero to 100 in the area of the study.
The number of persons affected in their households by a flood that happens with a certain return periodwas estimated according with the spatial distribution of the population on the area that would be floodedwith that time of recurrence.
4.2.2 Exposure of facilities to recurrent flooding
The exposition of the public buildings were estimated by a survey performed in 27 administrative units,the City of Buenos Aires and in 26 municipalities, which has all or part of its territory below 5 m over themean sea level.
The survey was conducted by internet, mail, telephone and fax. In some rural districts, it was necessarypersonal interviews. With the obtained information, a preliminary database was constructed that was

84
checked and adjusted with personal interviews at each of the 28 administrative offices of the studiedregion.
4.2.3 Current and future damage costs
An identification of the most relevant infrastructure was undertaken to assess the first order effects of thePlata level rise. The most relevant infrastructure is that of the public services and the real estate property.
4.2.4 Public services infrastructure
4.2.4.1 Water supply
The water supply service in the metropolitan area of Buenos Aires is operated by the private companyAguas Argentinas, who has two water supply plants, the San Martín Plant, located in the city of BuenosAires and the Belgrano Plant, located in the southern area of the Great Buenos Aires. The helpful andadverse effects of the Rio de la Plata level variations in the operation of both plants are summarized inTable 2.5.
Water supply plantsHelpful Adverse
LOW LEVELS
Low performance of raw water pumps ,,,,,,,,,,,,,,,,,,,,Coastal pollution – Rise in chemicaldoses
,,,,,,,,,,,,,,,,,,,,
HIGH LEVELS Hydraulic limitations in drainage ....................Coastal pollution after flood - Rise inchemical doses
,,,,,,,,,,,,,,,,,,,,
Save pumping energy ,,,,,,,,,,,,,,,,,,,,
Table 4.1: Effects of the Plata River level variation over water supply plantsIn case of low levels, the water pumps show a lower hydraulic yield. At the San Martín Plant, the mainelevating pumps are the most sensitive to low waters, being the first ones to go out of service. Excessvibrations are also a common difficulty. These problems lead to higher energy consumption and lowerwater elevation volumes. Regarding the quality of water during low waters, there appear higherconcentrations of pollutants (organic matter, chlorides, ammonium, conductivity, and alkalinity). Thisrequires an increase of the chemical doses.
In case of high levels, a saving in water elevation energy is obtained, but hydraulic difficulties appear atthe drainages, as conduits start to work under pressure conditions instead of as an open channel.
As for the quality of water, the main difficulty associated with a significant and long lasting flood is theblockage effect exerted on the drainages, which prevents its normal discharge. The problem manifestwhen the flood ends, as the retained drainage volume discharges abruptly, transporting its high load ofpollutants into the Plata River. The resultant worsening of the water quality, which lasts several days,implies the increase of chemical doses.
For scenarios of mean level rise in the Plata River, the most significant effect, from the economical pointof view, is the saving in water elevation energy. Hence, curves that represent this saving, for different

85
water level increases, were determined for each plant based on average daily volume, variation ofpumping height, pumping yield, and unit cost.4.2.4.2 Sewer Outlets
The sewerage system in the metropolitan area of Buenos Aires is also operated by the private companyAguas Argentinas. There are two elevating stations, Wilde and Boca-Barracas, and two treatment plants forsewer liquids, Sudoeste and Norte. The probable effects of the increase in the Plata River level on theseplants are summarized in Table 4.2.
Elevating stations Treatment plantsHelpful Adverse Helpful Adverse
LOW LEVELS
No effects
HIGH LEVELSIncrease of mean pumping energy ,,,,,,,,,,,,,,,,
Increase of pumping energy duringextreme events
,,,,,,,,,,,,,,,,
Increase of streamflow ,,,,,,,,,,,,,,,, ,,,,,,,,,,,,,,,,
Overflow of sewer liquid duringelectrical failures
,,,,,,,,,,,,,,,, ,,,,,,,,,,,,,,,
Table 4.2: Effects of the Plata River level on the sewerage plantsFor the Plata River levels higher than IGM 1.97 m, the consumption of electric power increases due tohigher elevation levels, especially at Wilde station. The cost of the extra pumping due to the elevation ofthe Plata River level has been determined based on the mean daily volume, the pumping level, theequipments performances, and the unit cost. As an example, for the Boca-Barracas station an increase of0.20 m in water level would mean an increment of 2.5 % in the pumping cost. In the case of the treatmentplants, the energy consumption would not change.4.2.4.3 Electric power production and transport facilities
The existing utilities in the area that could be expose to floods are Central Costanera, Central Puerto andCentral Dock Sud, Fig. 2.5. Their inputs for the electric power generation are basically natural gas andoccasionally fuel oil. Central Costanera is located at the Matanza-Riachuelo outlet. Central Puerto is withinthe Buenos Aires harbor, and consists of two plants Puerto Nuevo and Nuevo Puerto. Central Dock Sud is tothe south of Buenos Aires City; their total installed capacity is 2.165 MW.

86
Fig. 4.1: Location of power plants
Central Dock Sud has eight gas fed turbo – generators, with a total power of 211 Mw. The increase ofpumping energy costs for Central Dock Sud, due to the Plata level rise was determined based on theavailable data. The corresponding costs for Central Costanera and Central Puerto were estimatedaccording to their relative rate of discharge with respect to Central Dock Sud.
Central Dock SudHelpful Adverse
LOW LEVELS
No effects
HIGH LEVELSIncrease of mean pumping energy ,,,,,,,,,,,,,,,,
Increase of pumping energy during extreme events ,,,,,,,,,,,,,,,,
Table 4.3: Effects of the Plata level on the on Central Dock Sud utilityThe electrical service supply in the metropolitan area of Buenos Aires is provided by the privatecompanies Edesur and Edenor. Fig. 6.2.3.2 shows the location of the Edesur transformation stations thatcould be exposed to floods as River level rise. They were divided into different groups, according to theirtopographic level, starting from the most vulnerable to floods. It has been assumed the existence oftransformation stations from middle to low voltage, with a densification of one every eight blocks.Typical costs of these installations were estimated together with their percentage of damage as a functionof the flood height. Based on that information, curves of cost due to damages were obtained as a functionof the water level rise.

87
The curve of cost corresponding to Edenor facilities was obtained from the previous one, by assuming tobe proportional to the number of transformation stations that each company has at the area with riskflood.
Fig. 4.2: Location of the Edesur transformation stations
4.2.4.4 Roads
The likely effects on the road system because of the Plata River level rise are:
∞ Flooding by superficial waters. The associated damages are proportional to the water depth, itspermanence and the density of traffic during the event.
∞ Rising of the water table. This weakens the base and sub-base, and slows down the runoff.
The road system in the metropolitan area of Buenos Aires is formed by highways, fast lanes, and theurban road network, Fig. 4.3 shows those that could be exposed to floods.
The main highway is Buenos Aires-La Plata Highway, shown in Fig. 4.4. About 13 km are below IGM 5m, of which 4 km are below IGM 4 m, which means that will be increasingly vulnerable to floods.
The fast ways are Acceso Sudeste, Lugones Ave and Cantilo Ave. The Acceso Sudeste is the most exposed tofuture Plata River floods. Damage curves were obtained for the combination of highways and fast waysfor every flood level, estimating the length of flooded roads and the repairing costs.

88
Fig. 4.3: Location of highways and fast lanes
Fig.4.4: Buenos Aires – La Plata Highway
To estimate the damage of floods to the urban road infrastructure, the following zones were defined:Buenos Aires City, the Matanza River basin, the coastal fringe between Avellaneda and Berazategui and

89
the Reconquista River basin. For each of them, the following variables were quantified: percentage ofurbanization, density of kilometers of road per unit area, percentage of roads or streets made of concrete,asphalt and bare soil. Based on these parameters, the flooded road lengths were calculated for differentRiver levels, as well as their repairing cost, thus finding the damage curve as a function of River level.4.2.4.5 Railway system
The metropolitan area of Buenos Aires has 850 km of railways, most of them of double track. In the areabelow 5 m over mean sea level, there are about 115 km of railroads. Damages related to the River levelrise are caused by the elevation of the water table, the presence of superficial waters that weakens theembankments, and, for the higher levels, damage of the structure itself.
The corresponding curve of damages was obtained based on an indicative value for the cost of therailway kilometer, the length of railway at different altitude bands and the percentage of damageaccording to the water depth.
4.2.5 Building infrastructure
4.2.5.1 Housing
The damages on the building infrastructure are the most significant from the economic and social point ofview. Because, the areas exposed to floods have different real estate features, some level of desegregationwas necessary to make an evaluation of the costs of floods. Therefore, a zoning of the vulnerable area wasperformed, resulting in the identification of nine units, Fig. 4.2.3.5
For each zone, several hypotheses were made to estimate housing damages as a function of the followingparameters: costs of housings per unit area, percentages of area flooded by each River level, andpopulation density. The damages of houses were estimated as a percentage of its real estate value. Whenthe flood level reaches less than 0.5 m at the houses, this percentage varies from 12 to 16 % according withthe zoning. If the water level reaches more than 0.5 m, then this percentage augments to 25% or 30 %according to the zoning. Based on these assumptions and the mentioned parameters, a curve of damageswas built, Fig. 4.5

90
Fig.4.5: Zoning of the vulnerable building infrastructure
Daños por evento en viviendas
-
20.000.000
40.000.000
60.000.000
80.000.000
100.000.000
120.000.000
140.000.000
160.000.000
- 0,50 1,00 1,50 2,00 2,50 3,00 3,50
Incremento nivel Río de la Plata (m)
Co
sto
de
re
pa
rac
ión
da
ño
s (
$)
Fig. 4.6: Curve of damages in $ (pesos) to the building infrastructure as a function of the Plata River levelrise in m (1 $ = 0.33 US$).
4.2.5.2 Public buildings
For each zone, the damages to health, safety, and education buildings were calculated according to thenumber of these buildings that was estimated according to the population density. Hence, the damagesfor each River level were estimated based on the percentage of area affected, as for the previous case.
4.2.5.3 Furniture
Furniture losses were estimated as a percentage of the damage to building infrastructure. Then, its curvedepicting the cost as a function of the River level was obtained from the corresponding housing damagescurve.
4.2.6 Economic quantification of flood damages
As explained in section 2.3.3, the rise in the mean level of the Plata River will not produce any significantpermanent flood in the metropolitan area of Buenos Aires. Hence, the impact on the infrastructure will belinked to the greater duration and frequency of the recurrent floods associated to storm events.
The costs were estimated in Argentine pesos, which during the time of the present study was stabilized atthe exchange rate of one American dollar (1 US$) for three Argentine pesos (3 $).4.2.6.1 Curve of total damages
The curve of total damages was obtained as the sum the individual curves of damages mentioned insection 4.2.3. This is shown in Fig. 4.9 for the range of level rise in the Plata River going from 0.25 to 3 m.

91
Up to approximately 2.25 m there is an exponential growth, which turns into a quasi-linear response forhigher level rises.
Daños totales por eventoa la infraestructura
-
20.000.000
40.000.000
60.000.000
80.000.000
100.000.000
120.000.000
140.000.000
160.000.000
180.000.000
200.000.000
0 0,5 1 1,5 2 2,5 3 3,5
Incremento nivel Río de la Plata (m)
Co
sto
de
los
dañ
os
($)
Fig. 4.7: Curve of total damages in $ (pesos) to the infrastructure as a function of the Plata River level risein m. (1 $ = 0.33 US$)
4.2.6.2 Frequency of water levels
Based on recorded hourly data for the 1990 decade at Buenos Aires, the curves of frequency of occurrenceand of time over each level for the Plata River were built. Using model RPP-2D, the same curves wereobtained for scenarios with 0.50 m and 1 m mean sea level rise. These results are shown in Fig. 4.8 andFig. 4.9, referred to MOP zero (0.56 m below the IGM zero).
Curvas de frecuencia de niveles del Río de la Plata en Buenos Aires
0,000
0,020
0,040
0,060
0,080
0,100
0,120
0,140
0,160
0,180
0,200
-2,00 -1,00 0,00 1,00 2,00 3,00 4,00 5,00
Nivel MOP (m)
Fre
cuen
cia
Condición actual Nivel mar +0.50 m Nivel mar más 1.00 m

92
Fig. 4.8: Frequency of occurrence of the Plata River level at Buenos Aires for current conditions (1990decade) in blue, for a scenario of men sea level rise of 0.50 m in pink and for a scenario of mean sea level riseof 1m in yellow. Duración de niveles del Río de la Plata
0,00
0,10
0,20
0,30
0,40
0,50
0,60
0,70
0,80
0,90
1,00
-3,00 -2,00 -1,00 0,00 1,00 2,00 3,00 4,00 5,00
Nivel MOP (m)
Fre
cuen
cia
de
exce
den
cia
Presente + 0.50 m + 1 mFig. 4.9: Frequency of time over each Plata River level at Buenos Aires for current conditions (1990 decade)in pink, for a scenario of men sea level rise of 0.50 m in light blue and for a scenario of mean sea level rise of1m in orange
Curvas de recurrencia de niveles extremos en el Río de la Plata en Buenos Aires
2,00
2,50
3,00
3,50
4,00
4,50
5,00
5,50
6,00
1 10 100 1000
Período de retorno (años)
Niv
el
MO
P (
m)
Nivel Actual Escenario + 0,50 m nivel mar Escenario + 1,00 m nivel marFig. 4.10: Recurrence period in years (abscise) for extreme high levels in m in the ordinate (MOP level) inthe Plata River for current conditions (1990 decade) in blue; for a scenario of men sea level rise of 0.50 m inpink and for a scenario of mean sea level rise of 1m in orange

93
To complement the information provided by figures 4.9 and 4.9, figure 2.12 present the curves for therecurrence period of annual maxima peak water levels associated to storm surges. Again, the curve forcurrent conditions is based on recorded data, while the inferences for 0.50 and 1 m mean sea levelincrease were obtained with model RPP-2D.4.2.6.3 Current and future damages
Combining the obtained information, it was assessed the annual damage for the current condition and fortwo future scenarios, with 0.50 and 1.00 m mean sea level rise. Previously, it was necessary to merge theresults from the recurrence period of extreme values and from the frequency of occurrence of ordinarywater levels. For the case of extreme events we have:
CA = CU * P
Where CU: Cost per event; CA: Cost per year; P = 1/T: Number of events per year; T: Return period
On the other hand, for the case of ordinary water levels we have: f: frequency of occurrence associated toa water level range then D = 365 * f is the number of days per year with water levels within that range.
To link this continuous analysis to an event analysis like the previous one, the parameter D wasinterpreted as a succession of events of mean duration d. Hence,
P = D / d = 365 * f / d
To make the transition smooth, the event which occurs only one day per year, i.e., that with f = 1/365,should have P = 1. Hence, it was taken d = 1 day.
The annual damage, for each level of the Plata River, is the sum of the damages produced by all theevents occurring during one year. In turn, the annual damage associated to an event of a given waterlevel, is the unit cost associated to that event times the number of times it happens during the year. In thisway, it was obtained the curve shown in Fig. 4.5. The low annual damage observed for the three curvesfor the highest levels is due to the very low probability of occurrence of these levels.
The total annual damages can be computed through integration of the curves of figure. 4.11.
4.3 Results
Daños provocados por los eventos
-
20.000.000
40.000.000
60.000.000
80.000.000
100.000.000
120.000.000
0,50 1,00 1,50 2,00 2,50 3,00 3,50 4,00 4,50
Nivel del río de la Plata (MOP m)
Co
sto
an
ual
($)
daño actual daño 0,50 daño 1,00

94
Fig. 4.11: Total damage in $(pesos) to the infrastructure asa function of the Plata Riverlevel in m (MOP level) forcurrent conditions (1990decade) in blue; for a scenario ofmen sea level rise of 0.50 m inpink and for a scenario of meansea level rise of 1m in orange.(1 $ = 0.33 US$).
4.3.1 Socio
economic
vulnerability to
recurrent
floods
The areas that are more exposed to storm surges are the coast of the Great Buenos Aires, to the south eastof the city, a coastal fringe in the district of Tigre in the extreme north of the Great Buenos Aires and allthe coast of the Samborombón Bay Fig. 4.12a.
Fig. 4.12: Exposure index to recurrent floods. Current conditions in the upper panel, and 2030 scenario inthe lower one

95
Fig. 4.13: As figure 4.12, butfor 2070 scenarios. SRES A2 inthe upper panel and in the caseof a sea level rise of 0.40 m inthe lower one (2070 max )

96
Changes in the index of exposure to floods, in the RP coast of the city of Buenos Aires and in the north ofit, would not be considerable even in the scenario of 2070max. On the contrary, to the south of the city,and in the valleys of the Matanzas–Riachuelo and Reconquista rivers, populated predominantly with lowincome and high structural social vulnerability people, will be a rise of exposure to recurrent floods Fig.4.12b and 4.13.
The figure 4.14 shows the index of social vulnerability to recurrent floods. The qualitative geographicpattern is similar to the one of the exposure index because of the coincidence of the areas of maximumexposure with those of high structural social vulnerability. However, there are some differences like inthe north the highly exposed coast of the district of Tigre that only has in the average a mediumstructural social vulnerability. The areas with maximum social vulnerability to floods are to the south ofthis district in the Reconquista valley as well as in the south of the Great Buenos Aires.

97
Fig. 4.14: Index of social vulnerability to recurrent floods. Current conditions
Fig. 4.15: Differences betweenthe indexes of socialvulnerability to recurrentfloods. Scenario 2030 minuspresent in the upper panel and2070 max minus present in thelower panel

98
Changes in the index of social vulnerability to floods in the 2030 and in both scenarios in the 2070 worsenthe situation of the already more vulnerable areas along the valleys of the Reconquista and Matanzas-Riachuelo rivers and in the south of the Great Buenos Aires in zones relatively far from the coast and wherebecause of that cannot be expected an expansion of affluent population on gated communities, Fig. 4.15.
If it is assumed that that population density and distribution will not have considerable changes, in thescenario of maximum sea level rise in the 2070 decade, the people living in the area with flood risk with areturn period of 100 years will be about 900.000, almost doubling the present population with such risk.The relative increment of affected population is even larger for recurrence time of 1 to 5 years, which willtriple in the 2070max scenario, Table 4.12. These figures were calculated without considering the verylikely growth of population. With a modest 1% annual growth of the population during the next 70 years,maintaining the present geographical distribution, the number of people affected for each return periodin the year 2070 would double the values of. This means that the population with risk of some flood,recurrence every 100 years will amount to about 1,700,000.
Return Period (years)
1 5 10 20 50 1001990/2000 33.000 83.000 139.000 190.000 350.000 549.0002030/2040 102.000 297.000 390.000 500.000 643.000 771.000
2070/2080 113.000 344.000 463.000 563.000 671.000 866.000
Table 4.16: Present population living in areas that are, or will be, flooded under different scenarios

99
4.3.1.1 Exposure of facilities to recurrent flooding
Through a survey conducted in 27 administrative units, it was identified the facilities that are sited inareas with altitude below 5m over mean sea level. As it was explained before, these areas have a potentialrisk of flooding sometime during the present century. Table 6.3.2.1 shows the number of facilities,disaggregated according to their type.
Almost all public offices buildings correspond to municipality or provincial facilities. The districts thatare more exposed with respect to these buildings are Berisso and Ensenada, because all of them are inareas below 5m over mean sea level, followed by the districts of Tigre (72 %), San Fernando (53%) andAvellaneda (47 %). In the rest of the districts, most of the public offices are over the 5m level (75% ormore). The exposure of the heath centres has similar distribution. Ensenada and Berisso have the greaterpercentaje of health centres below the 5 m level, 89 % and 94 % respectively, followed by San Fernando(65%) and Avellaneda (51%).
Public offices 125Welfare 17Heath centres 205Education 928Police and security 92Transport 41Industries 1.046Recreation 306
Table 4.17: Amount of facilities below 5m over mean sea level in the Argentine coast of the Plata RiverIn Ensenada, Berisso and Avellaneda there is a large percentage of schools and other buildings devoted toeducation that are in areas below the 5 m level, that is 96, 82 and 67 respectively. However, the city ofBuenos Aires has the greater number of these buildings in such situation, namely 182, but its percentagein the city is only 10 %.
With respect to the industries, again Ensenada and Berisso have the totality of them below the 5m level.Other districts with considerable exposure are Avellaneda (82%), San Fernando (61%) and Lanús (51%).In absolute values, San Fernando has the greater number of exposed industries, followed by Lanús andQuilmes.
It can be concluded that Ensenada and Berisso appears as the most vulnerable districts because most ofthe public offices, health centres and industries could be flooded sometime this century. Other areas withimportant vulnerability are Avellaneda and San Fernando.4.3.1.2 Costs of Current and future damages
The frequency of events which produce damages increases with the sea level rise as shown in Fig. 4.3.

100
Frecuencia de eventos con daño
-
0,10
0,20
0,30
0,40
0,50
0,60
0,70
0,80
0,90
1,00
Actual 0,50 m 1,00 m
Condición
Fre
cuen
cia
de
even
tos
Fig. 4.18: Frequency of events producing damages
The total annual damages can be computed through integration of the curves of the curves of figure 4.2.They are shown for current conditions and for the scenarios of 0.5 m and 1m of sea level rise in figure4.19. Daños anuales
-
100.000.000
200.000.000
300.000.000
400.000.000
500.000.000
600.000.000
700.000.000
800.000.000
900.000.000
1.000.000.000
Actual 0,50 m 1,00 m
Condición
Dañ
o an
ual (
$)
Fig. 4.19: Total annual damages for current conditions (1990 decade) in $ (pesos) and for scenarios of meansea level rise of 0.50 m and 1m. (1 $ = 0.33 US$).
4.3.1.3 Future scenarios
Scenarios corresponding to 2030, 2070 and 2100 were considered. For each year, two values for sea levelrise were considered. One value corresponds to the SRES A2 scenario as reported by IPCC 2001. Theother, correspond to a scenario of maximum rise that considers the uncertainty of the socio economicscenarios. In the case of 2070, this scenario gives a rise of about 0.40 m. Since this rise was also consideredfor the A2 in the year 2100, it was consider an even more extreme rise of 0.50 m. Model RPP-2D providedthe corresponding water level rise in Buenos Aires, which are shown in the following table.
Year Mean sea level rise (m) Mean level rise at Buenos Aires (m)

101
A2 Extreme high A2 Extreme high2030 0.10 0.19 0.10 0.182070 0.28 0.50 0.27 0.482100 0.41 0.74 0.39 0.70
Table 4.3: Mean sea level rise and mean River rise at Buenos Aires in m4.3.1.4 Damages considering different scenarios of growth in the infrastructure
Table 4.4 present the damages associated to the above described scenarios, both if no change of theinfrastructure value is considered, which constitutes a lower bound to expected damages and fordifferent growth rates of the infrastructure. This growth and of the associated value can be expected dueto the following factors: population growth, increase of urbanization, increase and/or improvement ofpublic infrastructure and evolution of the Gross Product of the area
The evolution of each components of the infrastructure (railways, roads, water supply plants, electricalsupply, housing, etc.) can obviously have its own characteristics, in response to the needs of differentsectors. Instead of analyzing the probable evolution of each component, it was simply assumed differentrates of increase of the total infrastructure value. Thus, the total damage was calculated multiplying thedamages corresponding to the present infrastructure by the percentage of increase in the future.
A2 scenarioInfrastructure growth rate %
Year Mean levelrise at BuenosAires (m)
Mean level atBuenos Aires(m at MOP)
0 0.5 1.0 1.5
Currentconditions
0.00 0.89 24 24 24 24
2030 0.10 0.99 37 42 48 552070 0.27 1.16 61 85 118 1632100 0.39 1.28 78 126 203 327Extreme rise scenario
Infrastructure growth rate %Mean levelrise at BuenosAires (m)
Mean level atBuenos Aires(m at MOP)
0 0.5 1.0 1.5
Currentconditions
0.89 24 24 24 24
2030 0.18 1.07 37 56 64 722070 0.48 1.37 61 125 174 2412100 0.70 1.50 78 308 497 798
Table 4.4: damages in M of U$S associated to different mean sea level rise and different scenarios of growth in theinfrastructureAnnual growth rates of 0.5 %, 1 % and 1.5 % of the value of infrastructure were considered to estimate theprobable damages for the period 2004-2100 in both A2 and the extreme sea level rise scenarios. Table6.3.3.2 shows the results, which are illustrated also in the figures 4.4, 6.3.3.4 and 4.22.

102
Daños anuales por incremento del nivel del Río de la Plata
-
100
200
300
400
500
600
2000 2010 2020 2030 2040 2050 2060 2070 2080 2090 2100
Mill
on
es
Año
Co
sto
an
ual
( m
illo
nes
$/añ
o)
Condición media Condición máximaFig. 4.20: Annual damages in millions of $ (pesos) as a function of time in a scenario of no change of theinfrastructure with time. (1 $ = 0.33 US$). Climate A2 scenario in blue, extreme scenario in pink
Daños anuales por incremento del nivel del Río de la PlataCondiciones medias y crecimiento de la infraestructura
-
100,00
200,00
300,00
400,00
500,00
600,00
700,00
800,00
900,00
1.000,00
2000 2010 2020 2030 2040 2050 2060 2070 2080 2090 2100
Millo
ne
s
Año
Co
sto
an
ua
l (
mil
lon
es
$/a
ño
)
0,50% 1% 1,5% 0%Fig. 4.21: Annual costs of damages in millions of $ (pesos) up to year 2100 for the A2 climate scenario ofmean sea level rise considering different annual growth rate in the infrastructure. Light blue 0%; blue 0.5%; pink 1.0 % and orange 1.5 % .(1 $ = 0.33 US$).

103
Daños anuales por incremento del nivel del Río de la PlataCondiciones máximas y crecimiento de la infraestructura
-
500,00
1.000,00
1.500,00
2.000,00
2.500,00
2000 2010 2020 2030 2040 2050 2060 2070 2080 2090 2100
Mill
on
es
Año
Co
sto
an
ual
( m
illo
nes
$/añ
o)
0,50% 1% 1,5% 0%Fig. 4.22: Annual costs of damages in millions of $ (pesos) up to year 2100 for the extreme mean sea levelrise scenario considering different annual growth rate in the infrastructure. Light blue 0%; blue 0.5 %;pink 1.0 % and orange 1.5 % .(1 $ = 0.33 US$).
The costs of damages in the A2 scenario are almost linear with time, except for the case of the growth ofthe infrastructure. In the case of the extreme mean sea level rise scenario, there is an abrupt increase inthe cost trend after 2070.
If the growth rate of the infrastructure is assumed to have at least a minimum annual growth of the orderof 0.5 % or more, the accumulated costs in the second half of the century will range from 5 to 15 billiondollars depending on the climate scenario and the growth rate of the infrastructure.
4.4 Conclusions
The areas with population vulnerable to storm surge floods are the coast of the Great Buenos Aires to thesoutheast of the city, particularly in the districts of Ensenada and Berisso, and to the north, in part of thedistricts of San Fernando and Tigre. In Tigre there is a mixture of vulnerable population of low social-economic level and closed middle-high class neighborhoods. Other area with great exposure to floods ispart of the district of Avellaneda, close and south of the city. The neighborhood of La Boca in the city wasexposed to floods in the past, but as will be seen in chapter 7, the defenses built to contain the floods fromthe Plata and its tributary, the Riachuelo have reduced the flood risks.
According to the A2 SRES scenario, the social vulnerability to floods will become worst during thiscentury along the valleys of the Reconquista and Matanzas-Riachuelo rivers and in the south of the GreatBuenos Aires in zones relatively far from the coast. These are already areas oh high social vulnerabilitythat will be worsened by the increasing recurrence and spatial reach of the storm surges. On the otherhand, it is expected that the coastal zone of the Buenos Aires City and the districts located to the north ofit will not suffer important changes in the danger to flood exposition.
In a scenario of 0.5 m sea level rise with a modest 1 % annual rate increases in the population withoutconsiderable changes in its distribution and without new defences, the population with risk of some flood(recurrence every 100 years) in the 2070 decade will amount to about 1,700,000, more than three times thepresent population in such conditions. Those with risk of flood every year will be about 230,000, six timesthe population that suffer now such recurrence. These figures indicate that, although slow, the river levelrise will create severe socio economic problems if not early planning is undertaken.
The mean cost of the current damages to the coastal infrastructure was estimated in the order of the 24millions of American dollars per year. Most of this cost originates in real-estate damages. On the other

104
hand, damages were only estimated for the zones of greater value in the city of Buenos Aires and thenearby districts, not including the zones with lower real-estate value in the flood valley of theReconquista River, and in districts of Tigre and San Fernando, or their gated neighbourhoods. Therefore,the calculated values represent a minimum estimate of the total cost.
This cost of the recurrent floods will increase during this century because of both, the sea level rise andconsequently the greater frequency and reach of the floods, and the growth of the infrastructure and itsvalue. If a moderate growth rate of the infrastructure is assumed, the accumulated costs in the secondhalf of the century will range from 5 to 15 billion dollars depending on the actual climate scenario andgrowth rate of the infrastructure.

105
5 Adaptation
5.1 Activities Conducted
Study cases were performed with the intention to gain insight on the different dimensions (socio-economic, institutional and cultural) of the responses to recurrent floods in the past and present. Theselected cases were La Boca neighbourhood, in the City of Buenos Aires, and the AvellanedaMunicipality, in the Metropolitan Area of Buenos Aires. In both cases, the social vulnerability index haslow values, section 5.3, but they were selected because their long tradition in dealing with recurrentfloods can give indications on how the population of Buenos Aires may behave when a major adaptationresponse will be required.
In both cases, the Project conducted interviews with officials in charge of the institutions that deal withsome of the aspects of floods (planning, disaster response, etc) as well as with key stakeholders.
It was also analyzed the past and current trends of occupation of lands subject to recurrent floods inother areas, in view of the growing tendency to build gated communities on the shore of the Plata or of itssmall tributaries.
5.2 Description of Scientific Methods and Data
In the past, La Boca neighbourhood has suffered periodic floods due to storm surges in the Plata Riverand /or to intense rainfalls. Part of the Avellaneda Municipality, separated from La Boca by theRiachuelo, also suffers floods due to the same causes. The recurrent floods and, because of them, theirrelatively small real estate value turn these neighbourhoods in marginal areas, even considereddangerous in the urban social imaginary. In both case studies, the flood danger is seen as the mostimportant among of the natural threats. They originate either in intense rainfall, which provoke theinundation of the streets or in storm surges in the Plata River, known as sudestadas. When bothphenomenon occur simultaneously (section 2.2.3), the sudestadas block the normal drainage and worsenthe flood caused by the intense rainfall. In those cases, polluted waters add nuisances to the alreadystressed population. In the neighbourhood of La Boca, for example, the contaminated waters of theRiachuelo sometimes spring to surface through the storm outlets of the streets and drainpipes, reachingin the lowest sectors more than 1.50 meters height.
The capacity of response has to do, among other aspects, with the knowledge, the values, the perceptions,etc. that the civil society and the government institutions have of their potential dangers. These aspectswere study in both cases with the same general methodology, but with different specific approachesaccording to the nature of the problems and the sources of information.
Past and current trends on the use of low lands subject to floods in other metropolitan areas of the GreatBuenos Aires were discussed in connection with their implications on present and future adaptation.
5.2.1 La Boca neighbourhood
La Boca is one of the oldest neighbourhoods of the City of Buenos Aires. It is located at the southeast ofthe city on the low lands of the flood valley of the Riachuelo. The historic chronicles describe La Boca as alow, swamp zone, with lagoons and tall grass. This morphology disappeared under the asphalt, thoughthe area continued to be exposed to floods.
This neighbourhood was considered to be marginal from its beginnings. With regard to some indicatorsthat reflect the conditions of life in the neighbourhood, according to information of 1991, La Boca has thehighest percentage of tenants of the Federal Capital (44 % of the homes). The homes with criticalovercrowding (more than 3 persons per room) were 5 %, whereas the average for Buenos Aires city is 2%. Its high exposition to floods and pollution from the Riachuelo has kept this neighbourhood as

106
marginal area. However, at the beginning of the 1990 decade there were some changes aiming to improvethe conditions of life in this neighbourhood. By the end of 1993 (year in which occurred ten floods), it wasannounced the construction of a coastal defence to avoid the flooding from the Riachuelo waters. Theproject included the reconstruction of the existing net of rainfall outlets. The coastal defence wasinaugurated in 1998 whereas the new rainfall outlet network has not been yet finished.
Within the context of this defence construction, the floods due to sudestadas seem to be "forgotten",which leads to a reconfiguration of the situation of risk in the neighbourhood. The defences generated afeeling of confidence, which may be a disadvantage in the future, if the sea level rise would make thisdefence insufficient.
To identify floods and their impacts, the DesInventar data base of journal information on catastrophes,developed by the Network of Social Studies of Latin America was used. This consult was complementedwith own searches in local newspapers. Both sources, permitted to collect basic information of the criticalmoments of floods, the impacts on the neighbourhood (persons, goods and services affected), the type ofactions started from the government (local, national) and from the civil society in order to respond to theemergency, and the actions of prevention that were implemented. The approach for the diagnosis of thecultural adaptation was based on the identification of some key stakeholder that was interviewed,providing information that complemented other sources.
All specific bibliography and documents related to floods in La Boca and in the city of Buenos Aires wereconsulted to trace institutional responses. The institutions acting in the different phases of the disaster(prevention, response, rehabilitation) during the catastrophic floods of the decade of 1990 that affected LaBoca neighbourhood were identified as well as the direct and indirect actions, both of structural and nonstructural type.
5.2.2 Avellaneda Municipality
The rapid process of urbanization provoked a fragmentation of the Avellaneda Municipality inneighbourhoods and slums, which were planned in agreement with the interests and possibilities of theowners and the real-estate companies who advanced on low and easily flooded areas. In some cases, theland was refilled to raise the level of some of areas. These types of interventions were carried out by theneighbours, as well as by economic groups without any regulation. Later, some infrastructure planned tomodify the original runoff of the district was built with public funding, including three importantchannels that solved some of the flood problems in certain areas. As in La Boca, the pollution from theMatanza-Riachuelo River amplifies the harmful effect of the floods. In addition, there are overflows ofsmall streams and brooks heavily contaminated.
The adaptation responses were analyzed around three selected dimensions: socio-economic, institutionaland cultural. The socioeconomic information was taken from the national censuses of population of 1991and 2001, the national economic census of 1994 and the statistical Buenos Aires yearbook of 1999.
For the institutional responses, regulations associated with the management of the disasters, especiallyfloods were surveyed and analyzed. In addition, interviews with the competent institutions wererealized. The institutions involved in disaster activities are specified in a law of the province of BuenosAires, who determines the integration of the Civil Defence system at the county level. The more activeinstitutions in the management floods in the case of Avellaneda were the Civil Municipal Defence, theVoluntary Firemen of Avellaneda, the Marine Police and Red Cross Argentina.
These institutions were interviewed with specific guidelines. The questions were concerning thefollowing aspects:
∞ Description of general aspects of the institution;
∞ Actions performed by the institutions before, during and after the occurrence of the disaster;
∞ The form in which they are articulated with other institutions before, during and after theoccurrence of the disaster;

107
∞ Their opinions with regard to other institutions,
∞ The aspects that they would improve to optimize the management of the flood-related disasters.
The interviews had individual character and the executives of the four mentioned institutions wereinterviewed during November and December 2003 in their respective offices. Results of their views onthe role of the institutions were compared with the sensu stricto duties that appears in the regulations("the must be ") as well as with the effective form in which they are accomplished by the institutions.
To approach the cultural responses, primary sources of information were analyzed, obtained throughinterviews to neighbours of the floodable areas. The interviews to these neighbours were made at theirhomes or at community centres where they develop their activities. Some of them were involved in theneighbourhoods’ community centres; others were store-keepers or just neighbours with an extensivehistory in the place. Among the aspects that were surveyed from the people interviewed, are thefollowing:
∞ Their history as neighbours of the County;
∞ Experiences concerning the floods;
∞ Strategies elaborated to mitigate the harmful effects;
∞ Form of organization among the neighbours as a result of the floods;
∞ The way of perceiving other affected neighbours;
∞ Total or partial solutions that they know or would take in relation to the problem of floods;
∞ Social representations concerning floods.
5.3 Results5.3.1.1 La Boca neighbourhood
Most of the measures to attenuate impacts of floods come from the governmental sector. Themanagement involve the phases of prevention, response and rehabilitation. Table 5.1 shows a synthesis ofthe institutions involved, according to the corresponding phase. Table 5.2 shows actions related to thefloods, considering the type of measure and its state of execution.
Government of the City of Buenos Aires
Prevention Response RehabilitationDepartment of Logistics and Emergencies, Direction of Social Emergencies and CivilDefence
Department of Public Worksand Services,Hydraulics Direction
Medical Care EmergencySystem
Department of Health

108
Department of Logistics and Emergencies, Public SpacesEmergency Corp Department of Public
Works and Services
Table 5.1: Institutions of the City of Buenos Aires involved in flood management
Type of measure Current conditionsPolicy / Action
Structure Nostructure Projected In
Preparation In process
Plan of flood control:Coastal defence
Plan of flood control:Renewing the rainfalldrainage
Hydraulic Master Plan
Alert system forsudestadas and severestorms
Civil DefenceMetropolitan Master Plan
Table 5.2: Actions and policies; in Green for La Boca only; in light blue for the city of Buenos Aires including LaBoca5.3.1.2 The prevention phase
In the national sphere the institutions that perform actions in the prevention phase are the NationalMeteorological Service (NMS), the Hydrographic Naval Service of (NSH) and the National Direction ofCivil Defence. At the city level, the most out-standing institutions are the Department of Public Worksand the Department of Logistics and Emergencies. Besides, and in case that a flood overcomes the level ofcrowning of the coastal defence, the Firemen are in charge of raising the level to a safety height5.3.1.3 Flood managements measures
The first direct actions tending to solve the problem of floods were of construction type. It was aconstruction of a partial network of rainfall outlets made between 1874 and 1919. In 1934 levels ofguarantee were established for the streets and for the houses (filling the low areas) that were surpassed afew years later with the major flood registered up to that moment in April, 1940. These were the onlystructural interventions until the decade of 1990 when the defence was built in La Boca and Barracas. Thisdefence consists in a wall of concrete that prevents the inflow of the Riachuelo water. The height abovesea level of the wall is 4.22, which corresponded to a recurrence of 245 years. Since the defence constitutesan obstacle for the evacuation of the rainfall waters, 7 stations of pumping and a collectors' system thatgathers the rainfall water towards the pumps were constructed. The opening and the closing of thehatches, as well as the functioning of the pumps, is controlled by a computer that receives the informationtransmitted by sensors that detect the level of the water.
Since its inauguration, the defence resisted several floods, the greatest of which took place on May 2000with a peak of 3.05 meters. It is necessary to emphasize that only the record of historical sudestadas was

109
taken into account in the design of this defence without considering the future rise of the River level.Meanwhile, the neighbourhood continues being flooded by intense rainfalls because the renewing of therain outlets is not yet finished.
The implementation of direct non structural measures is more recent. The system of alert of sudestadasand severe storms in the City of Buenos Aires and the province of Buenos Aires was formalized in 1987through an agreement between technical institutions (the NMS and the NSH) and the Civil Defence. Theagreement was reviewed in 1993 and since then, the SHN issues the hydrological warnings and the SMNthe meteorological alerts.
More recently the Main Metropolitan Plan of Civil Defence was appointed by law to establish a "BasicNorm of Planning" for disaster situations, which must contain, coordinate and regulate all the specificplans of the different sectors, institutions and organisms involved with the occurrence of a catastrophe.The Plan constitutes a set of general guidelines for what has to be done by every institution involved ineach phase (prevention, response, and rehabilitation). Apart from these aspects, the Plan contemplatesthe dissemination of information and the training of the population.
As synthesis of the indirect actions led by the local government, it is possible to say that, after a longtradition of exposure to floods, the construction of the coastal defence seems to have opened the doors forthe neighbourhood progress. Anyhow, it is necessary to emphasize that all these actions are takenwithout bearing in mind that the risk of sudestadas still exists and will growth as the sea level willcontinue rising during this century. There was also a permanent fragmentation in the decisions on urbanpolicies that seems to be reversed recently.5.3.1.4 The response phase
With an alert notice of sudestada by the SHN or one of a severe storm by the SMN, the Department ofLogistics and Emergency starts systematic actions to protect the neighbours. These actions consist ofsurveys in the more critical sites of the neighbourhood, in order to anticipate the problems and solvethem.
Simultaneously, the communication of the risk to the population is started. The warnings are spreadthrough the massive means of communication (plates in television, warnings in the radio broadcastings).There are also recommendations and advices that the population should follow.
The helpfulness of the system of communication is weakened by the lack of previous preparation andtraining of the population (what to do, where to meet in case of need of self-evacuation, etc.). Being thesudestada a hydrometereologic phenomenon a unique forecast would avoid some confusion among thepopulation due to the emission of partial forecasts by the NMS and the SHN. On the other hand, and forthe case of the severe storms, it is not enough with two daily reports.
Apart from the system of official alert, the affected population has its own shock-absorbing networks ofalert and of self-help and evacuation. The neighbours established information links, spreading the newsabout the alert state and have their own perception to anticipate the flood and their own strategy on howto protect their personal goods for different flood levels. Faced to the flood, the settlers appealfundamentally to their own relatives and friends. In general, it is possible to say that in La Boca there wasalways a local organization to cope with floods. Nevertheless, the population at risk is seldom consultedand planning is still restricted to the design by specialists.5.3.1.5 The reconstruction phase
In the case of Buenos Aires, every catastrophic flood starts claims from the neighbours and the massmedia, which is answered by the public officials with announcements of new infrastructure or thefinishing of those that are already under construction. In addition, the answers from the publicadministrations (especially those depending from the Government of the City) do emphasis theextraordinary characteristics of the natural event (whether rainfall or sudestada). This reaction doesanything but to outplace the responsibility, trying to associate it with climatic unforeseen factors.

110
5.3.1.6 Cultural capacities for adaptation
The oldest residents of the neighbourhood have some knowledge of the dynamics of the river, and theypay attention to the signs that precede a flood. They developed strategies of response that complementthe managing of the flood through the official alerts. The same thing happens with measurescorresponding to the preventive phase, among which is frequent the elevation of their houses, even afterthe ending of the defence wall.
The neighbourhood is having a rapid renovation of its population. The newcomers are people of lowincome, in most of the cases emigrants from neighbour countries. It is quite possible that the culturalcapacities of adaptation will decrease, since the new comers do not have the local experience to face thefloods and even, in some cases, tend to ignore the advices from the institutions involved in themanagement of the floods.5.3.1.7 The Avellaneda Municipality
The areas of the County most vulnerable to floods are occupied by very low economic income peoplewho live in precarious settlements. The comparison of the census information, between 1991 and 2001indicate that there was a significant demographic expansion of the precarious and illegal settlements inthe floodable areas of the Avellaneda's Municipality. This trend clearly complicates the social adaptationto recurrent floods.
Other vulnerable areas are some neighbourhoods of average and average-low sectors in the towns ofDock Sur, Sarandí and Villa Domínico. Most of the population of these neighbourhoods rarely get selfevacuated or requires official help during the floods.
5.3.1.8 Institutional responses
In Avellaneda, the institutional aspects of the disaster management are the major weakness in theresponse and adaptation processes to floods. The activity of the institutions, both at the prevention andat the emergency or response phase, as well as the interrelations between them is described in thefollowing paragraphs.
In the province of Buenos Aires, of which Avellaneda is part, there is a legal framework by which at eachmunicipality, the Municipal Commissions of Civil Defence (MCCD), under the dependence of theProvincial Direction of Civil Defence, is the maximum organism in the management of disasters. InAvellaneda the MCCD is formed as follows:
∞ Major (Chairman),
∞ Civil Defence Director (CDD) (Secretary),
∞ Government Secretaries –Health, Welfare, Public Works and Services, etc.
∞ Avellaneda’s Voluntary Firemen,
∞ Dock Sud Naval Police Command, (PNDS)
∞ Red Cross –Villa Domínico Office (CRAFVD)
∞ And leaders of civil organizattions as it is the case of the Scouts.
∞ These institutions, with the exception of the Voluntary Firemen of Avellaneda who possess anautomatic warning system, act under request and under the coordination of the MCCD in themoment of the disasters.
The CDD is seen by authorities as a political position, and it is renewed with the local government changeevery four years or sometime more frequently. This attitude goes against the need to keep the policies

111
with certain continuity. In addition, many of the members of the MCCD are also part of the political staffof the Municipality.
Concerning the practices associated with the prevention phase, one of the principal functions of theMCCD is to develop a Municipal Plan of Emergencies, in which emergency hypothesis are formulatedand developed. The floods appear as one of the principal hypotheses of emergency, but the plan is notwell disaggregated to cope with the different situations in which this type of disasters appears. TheMCDD uses a map of exposure in which the areas considered more exposed to floods are shown. Themap is very precarious and does not contain any type of gradient by which some differentiation isestablished with regard to the degree of exposure. The major weakness is that the Municipal Plan ofEmergencies is not well known by the people or the organizations of the civil society. Up to the moment,there is no public easily accessible information for the public on how to act before, during and after thedisaster.
During the emergency, the CDD is in charge of coordinating the rest of the institutions that form a part ofthe MCCD. In this instance all the secretariats of the government are at his disposition (available meansand personnel). There is practically no involvement from the civil society.5.3.1.9 Institutional conflicts
One of the main points of conflict between the institutions involved in the management of the floodcaused disasters in the County is related to the very existence of the MCCD. Although, the MCCD wasconstituted in conformity with the Provincial Law, the CRAFVD and the PNDS that are part of it are notcalled to participate in the meetings. The view of these organizations is that the MCCD meetings lookmore like a cabinet meeting of the municipal government than an authentic MCCD.
The Voluntary Firemen of the County, in turn, have a troubled relation with both Civil Defence and theGovernment of the Municipality in general. This tense situation between the Municipality and theVoluntary Firemen of Avellaneda was amplified due to the mutual lack of fulfilment of assumedcommitments as well as the lack of transference of information needed for planning.
Finally, another example of the disarticulation between the main institutions in charge of themanagement of the disasters is associated with the practices of prevention. Periodically the CRAFVD, thePNDS and the Voluntary Firemen stations of Avellaneda perform joint emergency practices without theparticipation of the Municipal CDD, the designed coordinating institution.5.3.1.10 Cultural adaptation
All the interviewed social actors were born and currently live in Avellaneda and many take part in NGOs(Non-Governmental Organizations) that work on local problems. This circumstance favours theirinteraction with a wide range of people, and therefore resulting efficient collectors of the localexperiences.
The building systems adopted by the neighbours expose material signs that express the recognition ofthe inherent risk of flood. Among them, the more obvious is the elevation of the level of the houses.Often, these practices are transmitted from generation to generation with the aim to safeguard the livesand the material goods at the moment of the flood.
Another factor that enhances the danger of floods is the rise of the phreatic layer. Several of theinterviewee assured that in many zones of the County the layer is at less than 0.5m from the surface. Thissituation has repercussion on the building structures and in the building technologies. For instance, nowater is added to the mortar for the construction of the columns and foundations because the water isabsorbed from the soil by the materials spilt in the columns.
In case of the most affected zones, the extension of networks of cooperation and of self-help depend onthe number of relatives and friends in the neighbourhood, which may offer their houses for shelter or thematerials for the elevation of the housing, etc. The establishment of the networks of solidarity and therelevance given to them by the neighbours themselves also shows the insufficient participation of theState in the prevention and mitigation of the recurrent floods. Another preventive measure adopted bythe neighbours is associated with the alert notice, even before its public announcement. The warning is

112
often mouth to mouth transmitted, after telephonic consultation to the PNDS regarding the height of thePlata River.
5.3.2 Other vulnerable areas of metropolitan area of Buenos Aires
5.3.2.1 Past adaptation strategies and their influence on future vulnerability
Before about 1950, the areas exposed to frequent floods and no close to the downtown city like La Bocaand Avellaneda, either remained not inhabited or in some cases were scarcely occupied by poorsettlements where the people intruded the land without formal property or permission. Thus, very lowareas, which will be likely permanently flooded by 2070/2080, are still scarcely populated because theyare frequently flooded by storm surges or are in process of being elevated to be used as gatedcommunities. As a result of this adaptation to current storm surge conditions, the social impact of futurepermanent flooding will be small. Therefore, climate change vulnerability in the coastal zone of the PlataRiver will come from future increase of the exposure to extreme surges.
Neighborhoods that currently have relatively low recurrence of floods, and because of that are denselyoccupied, are those where the storm surge recurrence changes will create the greater impact. They aremostly in the valleys of the Reconquista and Matanzas rivers and are now occupied by different socialstratus, ranging from middle class to socially vulnerable population. Thus, these changes will lead tosocial damages as well as to important real state losses as was discussed in chapter 6.5.3.2.2 Present trends and their influence on future vulnerability
During the 1950 decade started the occupation of low lands with precarious and usually illegalsettlements. Obviously, this trend went against the collective adaptation to recurrent flooding. Theselands were occupied by a population with unsatisfied basic needs, higher than national average childmortality rate and a high percentage of population without access to social security. In many cases,women are family heads. Social vulnerability of these settlements is worsen by the floods and willdeteriorate more in future as the sea level rise will increase the frequency of floods in these areas. Themost socially vulnerable areas that are at the same time affected by floods are not over the coast of thePlata rover, but on the flood valleys of two tributaries of it, the Reconquista and the Matanzas-Riachuelorivers.
Other two areas of the Great Buenos Aires that have large social vulnerability and flood exposure are thesouthern coast of the Plata River, 20 to 50 Km to the southeast of the Buenos Aires city and the county ofTigre, immediately to the south of the Paraná Delta. Starting in the eighties but with definite momentumsince the nineties there was a dramatic change in the urban tendencies that affected partially these zones.New highways and increased demand for private gated towns are making these areas attractive as newsettlements for the upper middle class. In this new process, the drive to gated community come from twomain social perceptions: the fear linked with the increasing lack of security, and the idea that nature,country and green scenery are better conditions of life (Ríos 2002). At the beginning of the nineties, gatedcommunities had an area rounding 34 square kilometers; while by the 2000 this area has grown nearly tentimes: 306 square kilometers (Maestrojuan et. al. 2000).
Argentina does not escape to the global phenomenon of population migration towards the coasts. Thus, itis very common that many gated community were localized in initially cheap suburban lands, as thosethat are frequently flooded. To have an idea of the momentum of this process until 1998, only in thedistrict of Tigre, 90 gated communities had been authorized, out of which, 50 are already constructed.This trend is likely to increase in the next years. New projects spring all along the coast, both in the southeastern and in the northern extremes of the Buenos Aires metropolitan area, and even in the front of theParaná delta (Rios 2002).
The modification of the low level environment by closed towns has many effects, mainly in thehydrological drainage, which affects the people living around the gated communities. The urbanizationof initially low sectors, historically frequently flooded, requires a massive transformation of the terrainand of the surface drainage with the destruction and replacement of the original ecosystems in order toobtain an assumed secure height. However, before the AIACC results were made public, most of the

113
gated communities considered adequate the height of 4.4 m over sea level, which may not be so safe inthe future. With the spread out of these gated urbanizations a new situation of vulnerability and risk hasbeen aroused. Habitants inside the urbanization have seen their crime insecurity mitigated, but theyhave now the flood threat. Population outside these gated towns, while living with crime insecurity,unemployment, violence, etc. is in top of that damaged by the lost of drainage due to the land elevationof the gated towns (Rios 2002).
5.4 Conclusions
In the areas with long tradition of coexistence of population with floods, such as La Boca and Avellaneda,the existence of informal networks of alert, self-help and evacuation among the neighbours themselves,added to the practice of own strategies to anticipate the arrival of the flood, tend to diminish thevulnerability to floods. However, in both areas as well as in other areas where the occupation of landswith risk of floods is more recent, the increasing number of newcomers is reducing the collective culturaladaptation to floods.
After its completion in 1998, the works of coastal defence in the city of Buenos Aires have mitigatedsuccessfully the last floods. Anyhow, La Boca neighbourhood continues being flooded as consequence ofsevere storms, since the renovation of the rainfall drainages has not been yet concluded. To this, must beadded that the defence was designed without considering the future River level rise, what may reduce itsefficiency in the future. In this city, although there are measures and plans of flood management, they areseparated from the urban global environmental policy of the city, which can help to promote thevulnerability in the future.
The institutional responses to floods, although following a similar organization pattern differs from onedistrict to another in its functioning and coordination. In the case of Avellaneda, the lack of cooperationbetween the responsible institutions creates an additional source of vulnerability and it illustrates whathappens in some other districts.
Except in La Boca and Avellaneda, where the people found that its proximity to downtown compensatedthe annoyance of the recurrent floods, the rest of the coastal areas subject to floods were little populateduntil recent decades. This past adaptation prevented the occupation of the small areas of very low landsthat will result enduringly flooded sometime this century. However, the current trends of occupation oflands with flood risk, by both very poor settlements and gated communities of upper middle class peopleare not favouring the collective adaptation to present and future scenarios of recurrent floods.

114
6 Capacity Building Outcomes and Remaining Needs
6.1 Workshops
Investigators and Students participate AIACC workshops and several other meetings in order to gainmore knowledge and experience. Following is the list of meetings attended:
AIACC Global Kick-off Meeting11-15 February 2002, Nairobi, Kenya. Participants from the Project:Vicente Barros (PI), Claudia Natenzon (Co PI) and Angel Menendez (Co PI).
AIACC Project Development Workshop: Development and Application of Scenarios in Impacts,Adaptation and Vulnerability Assessments15-26 April 2002, Norwich, UK. Participant from the Project:Inés Camillon.i
AIACC Project Development Workshop: Climate Change Vulnerability and Adaptation3-14 June 2002, Trieste. Participants from the Project: Claudia Natenzon (Co PI), Jorge Codignotto (Co PI),Mariano Re (Student) and Julieta Barrenechea.
Climate Change in the Plata River. Joint workshop with AIACC Project ¨Assessing Global ChangeImpacts, Vulnerability, and Adaptation Strategies for Estuarine Waters of the Rio de la Plata¨ September25-27 2002, Montevideo, Uruguay. Participants from the Project: Vicente Barros (PI), Angel Menendez (CoPI), Claudia Natenzon (Co PI), Roberto Kokot, Mariano Re (Student), Inés Camilloni, Walter Vargas (Co PI),Susana Bischoff (Co Pi) and Gustavo Escobar.
First AIACC Regional Workshop for Latin America and Caribbean May 27-30, 2003, San Jose, Costa Rica.Participants from the Project: Vicente Barros (PI), Claudia Natenzon (Co PI), Roberto Kokot, Mariano Re(Student), Carlos Rinaldi (Director of the Argentine second National Communication) and Andrea Ferrarazo fromFundación Ciudad.
2nd AIACC Regional Workshop for Latin America and Caribbean August 24-27, 2004, Buenos Aires,Argentina Participants from the Project: All investigators and students of the Project. Bellagio Synthesisreport on Vulnerability March 7-12, 2005, Bellagio, Italy. Partipant from the Project: Vicente Barros (PI).
6.2 Other training activities supported by the Project
Moira Doyle and Inés Camilloni participated of the PRECIS workshop in the CPETEC (Brazil) organizedby CPTEC, CIMA and MET OFFICE. November 1 –5, 2004
6.3 Courses
6.3.1 Course for students
The course was on ¨Assessing Global Change Impacts, Vulnerability, and Adaptation Strategies forEstuarine Waters of the Rio de la Plata¨
A course on Climate variability and anthropic influences was lectured at the University of la República(UdlR) in Montevideo during October 2002 as a joint activity with AIACC Project ¨Assessing GlobalChange Impacts, Vulnerability, and Adaptation Strategies for Estuarine Waters of the Rio de la Plata¨.The course has credits for the Master of Science program on Environmental Sciences of the UdlR.Professors from the Project were V. Barros (PI) and S. Bischoff.

115
6.3.2 Courses on climate change for journalists
Two short courses were offered for journalists, one in Buenos Aires (Argentina) in July 5, 2004 and theother in Montevideo (Uruguay) in July 13. They were designed to help the participants to cover theclimate change issue and the results of both Projects. In Buenos Aires, the participants were 13 journalistsfrom different media, about half of them from the two most important newspapers of Argentina, Clarinand La Nacion, which sell daily 400,000 and 170,000 newspapers respectively.
This activity was very opportune as was done in advance to the COP X that was held in December inBuenos Aires and helped to have better and wider coverage of this event. There was an immediateresponse with three articles in the leading newspapers of the country, two in La Nación and one inClarín. The three articles together amounted more than 500 cm. The notes in these newspapers leaded to awave of comments on the radio and in some cases to interviews to the scientists of the Project. The wavereached even to the media in Uruguay with comments in television and newspapers.
In Montevideo, (Common activity with Project AIACC¨Assessing Global Change Impacts, Vulnerability,and Adaptation Strategies for Estuarine Waters of the Rio de la Plata¨) the participants were journalistsfrom magazines and students of Communication. Between the journalists, there were some from theimportant magazine Busqueda. There were two notes in Busqueda and in Montevideo Digital, as in thecase of the course in Buenos Aires, these notes leaded to a wave of comments and interviews on radioand television, and even in two newspapers, including the most important of the country, El Pais.
6.4 Students
The Project supported the development of highly qualified students, who made their thesis in differentaspect of it.Victor Kind attained his degree of Hydraulic Engineer with a thesis on the salinity front of thePlata River. Diego Ríos obtained his degree of Licenciate in Geography with his thesis on gatedcommunities. Three other theses are at its final stage, i.e. they are in the writing phase. One is for a doctordegree in Geography, Lic. Silvia Gonzalez (Buenos Aires flooding), the second is for a Master degree inEnvironmental Sciences, Eng. Mariano Re (The hydrodynamic modeling of floods) and the third for thedegree of Licentiate in Atmospheric Sciences, Ezequiel Marcuzzi (El Niño and extreme precipitations).
6.5 General capacity building accomplishments
Since the Project integrate research from climate, oceanography, geology, geography and social sciences,the Co PIs of the Project gained experience in multidisciplinary work and learned to synthesize resultsfrom different disciplines.
During the Project, the participants developed some models and tools and learn to use others. Theseactivities resulted in increased individual capacities in many techniques. As an example should bementioned the development of the hydrodynamic model of the Plata Estuary, the analysis of regionalresults from GCM, the development of a high resolution topography and the development of socialvulnerability indexes. A new and very important experience for most of the investigators of the Projectwas the work with stakeholder groups.
Institutional capacity building resulted from the strengthening of three groups for further investigationsin climate change Two of these groups are the at the University of Buenos Aires, one devoted to regionalclimate at the Center of Research on Sea and Atmosphere (CIMA), and the other to human geographyand social sciences (PIRNA) at the institute of Geography. The third is at the National Institute of Water(INA) working in hydrodynamic modeling. It is important to stress the establishment of networks ofpersons and institutions between these three mentioned groups and others at the University of BuenosAires and other institutions as the University of la República in Uruguay and the Department ofHydrography of the Argentine Navy.
116
Not less important was the contribution of the project to increase public awareness and understanding ofclimate change and related issues. This was done through workshops for stakeholders, conferences by theCo PIs and numerous notes and interviews in the media.
6.6 Remaining capacity needs
In these last three years, the requirements of information on climate change, and in the related regionalimpacts from both, the government and civil society have created a growing demand of trained personnelin different aspects of climate change. Since, climate trends in Argentina were very important in the lastdecades, it is necessary to start adaptation or in some cases improve the current autonomous adaptation.Thus, it seems important to build additional capacities with focus on adaptation to climate change.

117
7 National Communications, Science-Policy Linkages andStakeholder Engagement
7.1 National Communication
The activities of the second National Communication of Argentina to the UNFCCC were assigned toconsultants, scientific groups or institutions according to bids that were defined according to quality. TheArgentine Co PIs of the Project gained the vulnerability study of the coastal area of the region of BuenosAires. The Project results will be the basic input for this new study for the second NationalCommunication that will start on July 2005.
Recently, the third National Communication of Uruguay was started. The Uruguayan Co PIs of theProject are working in the climate scenarios for this Communication.
7.2 Contribution to UNFCCC activities
In the COP-10, Buenos Aires December 2004, Vicente Barros (PI) was part of the Argentine delegation. Inthis COP, in the side event on Science in Support of Adaptation to Climate Change organized by STARTand UNEP, the PI of the Project made a presentation on ¨Key Messages for Adaptation from RecentAssessments¨. Inés Camilloni, Jorge Codignotto (Co PI), Vicente Barros (PI) and Angel Menendez (Co PI)presented results of the Project in another side event on the Argentine Agenda on Climate Changeorganized by the Di Tella Foundation.
7.3 IPCC
Jorge Codignotto (Co PI) is participating in the Fourth Assessment Report as lead author in the group 2,chapter 5 coastal systems and low lying areas.
7.4 National Policies
The Secretary of Environment and Sustainable Development has developed the Environmental Agendaduring 2004. This planning was developed through technical reports and workshops that were held in allthe regions of the country. The Climate Change vulnerability section was developed by the Di TellaFoundation Reports in a series of 14 reports, of which 2 were on the Plata River coast and were almostcompletely based on the Project results.
7.5 Stakeholder engagement
The Project and its objectives were initially presented to a small number of key stakeholders during thefirst year. Four of them answer a detailed questionnaire in connection with the objectives and activities ofthe Project They were City Foundation, Redes, the Federal Emergency System (SIFEM), and theDefendant of the People of Buenos Aires. The first two were NGOs that helped to enlarge the number ofstakeholders in touch with the Project, while the remaining two were key instances in the administrationof floods as coordinator, the first, and as control instance, the second. Some of the suggestions received inthis inter-consultation process helped to reshape the tools to be developed by the Project. Example of thiswas the risk maps that were asked by the SIFEM.
In addition, the Project was presented to a larger number of stakeholders in the workshop on SocialPertinence of the research developed at the University of Buenos Aires (UBA) in the area of floods. Thismeeting was part of the process of external evaluation of UBA activities. The Project was invited toparticipate because it received collateral funds from the UBA in the framework of a special program. Theaim of this meeting was to the assessment of the research work in terms of its socioeconomic application.The modality adopted was to send the documentation of the projects selected to the participants. The

118
meeting took place on Tuesday 8 October 2002. Its objective was to evaluate, through a participatoryprocess, the pertinence of the scientific research and its social benefits from the point of view of thestakeholders.
The public institutions that participated invited by UBA were the Department of Water ResourcesManagement from the National Secretariat of Water Resources, the Civil Defense Department of theBuenos Aires Province, the Secretariat of Environmental Policy and Food Security of the Municipality ofAvellaneda, the Sanitation and Hydraulic Works Department of the Buenos Aires Province and twoNGO, GAO (Associated Management of the West) and Pro – Tigre. The participants found useful theProject objectives and the Department of Water Resources Management from the National Secretariat ofWater Resources asked for continue support to this type of projects.
In March 5, 2003, a workshop to present the initial results of the Project to stakeholders and to receivefrom them suggestions and demands was held. There were forty participants from 30 governmental andnon-governmental organizations. In the same workshop, it was also presented results from the Universityof Buenos Aires Project on Floods on the Paraná and Uruguay Rivers that provide the collateral funds tothis Project. As a result of this workshop, the Project received a considerable help in information frommany stakeholders, and it was started a close work with the City Foundation.
The City Foundation is an important institution that works on the City of Buenos Aires and Great BuenosAires issues. It has a program called ¨Buenos Aires and the River¨. This NGO gathers many of thestakeholders of coastal risks. It participated actively in the Project through two activities. It organized andmoderated the final workshop with stakeholders and helped in the design and edition of paperbackmaterial oriented to the general public for dissemination of the project results.
Final Workshop on Climate Change and the water level rise of the Plata River
The City Foundation provided the methodology, co-organized the meeting with the Project and chairedthe discussion sessions. The workshop with the personnel of the Project and 96 participants from NGOs,technical public officers, executives and technicians from the private sector was held in July 27, 2004 inBuenos Aires. The workshop had three sessions; in the first, the final results of the Project were presentedby a panel of researches in a plenary. These results were discussed by three separate groups during thesecond session. Finally, in the third session, again in plenary, questions and recommendations from eachgroup were addressed to the panel, for answers and discussions. The three groups were integrated bytechnical public officers, executives and technicians from the private sector, and NGO and conspicuousstakeholders.
The workshop recommended further dissemination of the information produced by the Project and therevision of the regulation on soil use in the coast of the city and the Province of Buenos Aires to avoid theurbanization of the coastal low lands and to encourage the use of this space in recreational activitiescompatible with recurrent floods. It was also recommended a brief dossier for decision makers andlegislators to alert them about the damage that could happen if no adaptation actions were considered ontime. Finally, it asked for the elaboration of a communication document for the general public to alertthem about the inconvenience of investing, building or settling in areas that could possibly get morefrequently flooded in the future. This document was elaborated and it is referred in the next paragraph
Paperback material for dissemination of the project
This material was elaborated by the Project and was adapted by specialists in communication of the CityFoundation, who also edited and published it. The document has 42 pages and includes about 30illustrations.
The engagement with stakeholders opened numerous opportunities for further work either to the coregroup of the Project, or to some individual researchers. The most important outcome of this activity isthat it will be very difficult that the Project results will not be used in the future planning the Plata Rivercoast.

119
8 Outputs of the project
Until now, the outputs of the Project are mainly about specific aspects treated by only one discipline.More integrated products are expected for the next months,
8.1 Published in peer-reviewed journals
Inés Camilloni and Vicente Barros 2003: Extreme discharge events in the Parana´ River and their climateforcing. Journal of Hydrology, 278 94–106
Discusses the major discharges and their climatic forcings of the greatest tributary of the Plata River
Gustavo Escobar, Walter Vargas and Susana Bischoff 2004: Wind tides in the Rio de la Plata estuary:Meteorological conditions. Int. J. Climatol. 24, 1159–1169.
It is a statistical analysis of the storm surge conditions that produce floods in the Argentine coast of thePlata River
Walter Dragani and Silvia Romero 2004: Impact of a possible local wind change on the wave climate inthe inner Plata River. International Journal of Climatology 24, 1149-1157
Presents the study of the waves in the Plata River under present wind conditions and in a future scenariothat maintain the current trend on surface winds
Vargas Walter, Escobar Gustavo, Bischoff Susana, Berman Ana Laura 2005: Las sudestadas, climatologíay circulación asociada. Accepted in Geoacta
It is again a statistical study of the storm surge tides. However in this case, the paper focused in the fieldsassociated or not to heavy rains during the storm surge. It is in Spanish
8.2 Other outputs
Vicente Barros, Inés Camilloni, and Angel Menendez 2003: Impact of Global Change on the Coastal Areasof the Rio de la Plata. AIACC Notes, Vol.2, 1, 9-11
Discuss the sensibility of the level of the Plata River to its natural forcings. In addition discuss thesouthwards trend of the surface pressure field during the last decades and its effects on the surface windfield.
Claudia E. Natenzon 2003: Inundaciones catastróficas, vulnerabilidad social y adaptaciones en un casoargentino actual. Cambio climático, elevación del nivel medio del mar y sus implicancias. ClimateChange Impacts and Integrated Assessment EMF Workshop IX. July 28 -August 7, Snowmass, Colorado.
Discuss social implications of the recurrent floods in the Argentine coast of the Plata River.It is written inSpanish
Mariano Ré and Ángel N. Menéndez 2003. Modelo Numérico del Río De La Plata y Su Frente
Marítimo para la predicción de los efectos del Cambio Climático. Mecánica Computacional Vol. XXII. M.Rosales, V. Cortínez and D Bambill (Editors). Bahía Blanca, Argentina, November 2003
It describes the modelling of the Plata River, its calibration and validation. It is in Spanish
Gustavo Escobar, Inés Camilloni and Vicente Barros 2003: Desplazamiento del Anticiclón Subtropical delAtlántico Sur y su relación con el cambio de vientos sobre el Estuario del Río de La Plata. Tenth LatinAmerican and Iberic Congress of Meteorology. La Habana, May 2003, CD-Rom.

120
It shows the shift of the South Atlantic subtropical high towards the south in the last decades, it waspresented in a Latin American congress and it is in Spanish. It was edited in CD.
Mariano Ré, Martín Kind and Ángel N. Menéndez 2004: La elección del dominio de cálculo, el modelomatemático y la escala de resolución en la modelación numérica. XIV Congreso sobre MétodosNuméricos y sus Aplicaciones, ENIEF 2004, Bariloche, noviembre de 2004.
The paper discusses mathematical aspects of the Plata estuary modelation. It was presented in a nationalcongress and therefore, it is in Spanish
Vicente Barros, Angel Menendez, Claudia Natenzon, Jorge Codignotto, Roberto Kokot and SusanaBischoff 2005: El cambio climático y la costa argentina del Rio de la Plata. Fundación Ciudad, BuenosAires, February 2005. 42pp.
It is booklet to disseminate the Project results to the general local public. Consequently, it is in Spanish. Ithas three sections. One devoted to global Climate Change, the second to the regional climate andhydrological trends and the third on the results of the Project. The edition was made by the CityFoundation for a total number of 500 booklets.
El Cambio Climático en el Río de la Plata. Editors Vicente Barros, Angel Menendez and Gustavo Nagy,CIMA, Buenos Aires, May 2005. 200 pp
It is a book with 19 chapters that contain a selection of 15 technical reports from the Project and theAIACC project Assessing Global Change Impacts, Vulnerability, and Adaptation Strategies for EstuarineWaters of the Rio de la Plata, preceded by 4 introductory chapters on climate change and regional climateand hydrological trends. It has 200 pages, not including figures, which are edited in an attached CD. It isin Spanish, and it is directed to the local technical public. The edition was made by CIMA for a totalnumber of 500 books.

121
9 Policy Implications and Future Directions
The increasing frequency of recurrent floods reaching progressively more land added to the pressurefrom different and competitive human pressures over the coastal areas of the Plata River requires a publicregulation of these areas. The results of the Project and their dissemination between the stakeholdersprovide a technical basis for such regulations.
The works of defence produces a sense of security, which in view of the increasing trend in the Riverlevel, and consequently of extreme storm surges, conceal a risk that will grow with time. As aconsequence, defences seen as final control of floods could facilitate in the future the densification of thepopulation in exposed areas increasing social and economic vulnerability. In each case, the convenienceof such defences must be carefully weighted against non-structural measures. One of the measures can bethe regulation of the coastal space, favouring the use of activities compatible with the recurrent flooding.
The System of Alert for Severe Storms and Sudestadas needs to be improved. It is necessary to establish ahydro-meteorological network in the sub basins of the rivers and brooks that cross the metropolitan areaof Buenos Aires, ending in the Plata River. The system should have operative hydrodynamic models ofthese sub basins as well of the Plata River. The system has to be organized as a part of a broader nationalmeteorological and hydrological system of alert for severe storms, with instantaneous information on lineto issue immediate alert warnings whenever needed.
The Civil Defence Metropolitan Master Plan should be improved enhancing the participation of the civilsociety in the education, planning and information processes. The results of the present Project as well astheir dissemination will be of help in this aspect.
The lack of consideration of the implications of climate change in the planning and design of structuralworks that prevailed until now has to be abandoned. Since this attitude was basically originated in thelack of knowledge, it is very likely that will be rapidly modified after the dissemination of the Projectresults, namely the books referred in section 10.2.
Until recently, in the Argentine society, it prevailed the conception of natural disasters as exceptionalevents (punctual and static) opposite to the normality of the daily life of a society. The above-mentionedconception allowed the improvisation and the lack of plans and regulations to incorporate the exposureto floods within an integral management before, during and after the events. The catastrophic resultsproduced severe critics to the authorities in charge that was always refuted by them on the basis of theextraordinary nature of the event. Recently, the increasing frequency of extreme precipitations and thetoll of lives causes by the subsequent floods have started to change the view of the natural catastrophes asexceptional and unforeseen events, and as a result of that, some officials are even facing penal trials. Theavailability of sound technical studies well disseminated between public and private stakeholders willcontribute to speed up this new view with respect to natural extreme events. This new view, in turn, willforce the responsible officials to work more efficiently and coordinate better the tasks of differentinstitutions involved. It is therefore important that projects like the present one will be undertaken toaddress the climate driven extreme events in other systems and regions of the country in the context ofthe climate change and of other changing factors.

122
10 References
Albarracín, J. 1987: Análisis de la Hidrodinámica del Río de La Plata a partir de una SimulaciónNumérica, Tesis de grado para la Licenciatura en Oceanografía, ITBA). Director: A. N. Menéndez,Informe LHA-INCYTH 065-001-88.
Anschutz G. 2000:. Comparison between SAR-ERS and Waverider Buoy meaurements in the outer Rio dela Plata estuary. In CoastalWave Meeting, 25–28 September, Barcelona, Spain.
Balay MA. 1961: El Río de la Plata entre la atmóosfera y el mar. Publicación H-621. Servicio deHidrografía Naval, Armada Argentina, Buenos Aires Center; 1–72.
Barros, V., E. Castañeda and M. Doyle 2000: Recent precipitation trends in Southern South America to theEast of the Andes: an indication of a mode of climatic variability. Chapter of “Southern HemispherePaleo and Neoclimates Concepts, Methods, Problems”. Ed P Smolka and W. Wolkheimer. Springer.
Barros, V., L Chamorro, G. Coronel and J. Báez: The major discharge events in the Paraguay River;Magnitudes, source regions and climate forcings. J Hydrometeorology 2004 Vol 5, 1061-1070.
Bejarán, R. and V. Barros 1998: Sobre el aumento de la temperatura en los meses de otoño en ArgentinaSubtropical, Meteorológica, 23, 15-25.
Camilloni.2004: Representación del Clima del sur de América del Sur por los modelos climáticos globales)Fundación Di Tella. Proyecto ARG/03/001. 16 pp.Camilloni, I and V. Barros 2000: The Paraná River Response to El Niño 1982-83 and 1997-98 events. J. of
Hidrometeorology. 1, 412-430.Camilloni, I and V. Barros 2003: Extreme discharge events in the Paraná River and their climate forcing.: J.
of Hydrology, 278, 94-106Campos, J. D., C. A. Lentini, J. L. Miller and A. R. Piola 1999: Interanual variability of the sea surface
temperature in the South Brazilian Bight, Geophysical Research Letters, 26 (14), 2061-2064.CARP 1989: Estudio para la Evaluación de la Contaminación en el Río de la Plata, SHN y SOHMA.Cartwright, D. E. and R. D. Ray 1990: Oceanic tides from Geosat altimetry, Journal of Geophysical Research,
95, 3069-3090.Codignotto, J .O and Aguirre, M.L. 1993: Coastal evolution, changes in sea level and molluscan fauna in
northeastern Argentina during the Late Quaternary. Marine Geology, (110): 163-175.CERC 1984: Wave and Water Level Prediction. In Shore Protection Manual, Ch. 3, vol. 1. US Government
Printing Office WashingtonDC; 1–143.CERC 2002: Meteorology and Wave Climate. In Coastal Engineering Manual, Ch. 2, vol. 2. US Army
Coastal Engineering ResearchD´Onofrio E., Fiore M. and S. Romero 1999: Return Periods of extreme water levels estimated for some
vulnerable areas of Buenos Aires. Continental Shelf Research, 4: 341-366.Dangavs, N. V. 1983: Geología del complejo lagunar Salada Grande de General Lavalle y General
Madariaga, provincia de Buenos Aires. Revista de la Asociación Geológica Argentina, 38(2): 161-174.Defant A., 1961: Physical Oceanography. Volume II. Pergamon Press. 598pp.Dragani, W. 2002: SHN, comunicación personal.Dragani, W. C. and Mazio, C.A., 1991. Refracción de olas. Depto. Oceanografía, Servicio de Hidrografía
Naval, Buenos Aires, Informe Técnico nro. 61/91, pp. 48.Fidalgo, F., F. De Francesco and R. Pascual 1975: Geología superficial de la Llanura Bonaerense. VI
Congreso geológico argentino. Relatorio. Bahía Blanca. pag. 103-138.Foremann M. G., 1977: Manual for tidal heights analysis and prediction. Pac. Mar. Sci. Rep. 77 – 10, 97 pp.Foremann, M. G. 1978: Manual for tidal heights analysis and prediction. Pac. Mar. Sci. Rep. 78 – 6, 70 pp.Framiñán, M. B., M. P. Etala, E. M. Acha, R. A. Guerrero, C. A. Lasta and O. Brown 1999: Physical
characteristics and proceses of the Río de la Plata estuary in G. M. Perillo, M. C. Piccolo, M. Pino(Eds), Estuaries of South America, their geomorfology and dynamics, Springer-Verlag, Berlin, pp. 161-194.
Furlong 1963: Cartografía Histórica Argentina. Mapas, Planos y Diseños que se conservan en el ArchivoGeneral de la Nación, Tomos I, II y III, Buenos Aires.
Furlong, G. 1936: Cartografía jesuítica del Río de la Plata. En: Publicaciones del Instituto deInvestigaciones Históricas N° 71 de la Facultad de Filosofía y Letras de la Universidad de BuenosAires, Casa Jacobo Peuser, Buenos Aires.
Godin G., 1972. The analisys of tides.Liverpool University Press, 264pp.

123
Griswold GM. 1963: Numerical calculation of wave refraction. Journal of Geophysical Research 68(6):1715–1723. Hamming R.A., 1977. Digital filters. Prentice - Hall, 223pp.Harris F., 1978. On the use of windows for harmonic analysis with discrete Fourier transform.
Proceedings of the IEEE, 66-1, 51, 83pp.Intergovernmental Panel on Global Change (IPCC) 2001: IPCC WGI Third Assesment Report: The
Scientific Basis, Chapter 2. Cambridge University Press.Jaime, P. y A. N. Menéndez 1999: Modelo hidrodinámico Río de la Plata 2000, Report LHA-INA 183-01-
99, INA.Kalnay, E., M. Kanamitsu, R. Kistler, W. Collins, D. Deaven, L. Gandin, M. Iredell, S. Sha, G. White, J.
Woollen, Y. Zhu, M. Chelliah, W. Ebisuzaki, W. Higgins, J. Janowiak, K. C. Mo, C. Ropelewski, J.Wang, A. Leetmaa, R. Reynolds, R. Jenne, y D. Joseph, 1996: The NCEP/NCAR 40-year ReanalysisProject. Bull. Amer. Meteor. Soc. 77, 437 – 471.
Kokot 1999: Cambio Climático y evolución costera en Argentina. Doctoral Thesis, FCEyN (UBA) 329 pp.Kokot, R. 1997: Littoral drift, Evolution and Management in Punta Médanos, Argentina. Journal of Coastal
Research, 13(1):192-197.Maestrojuan, P., M. Marino, y G. de la Mota 2000: Enclaves urbanos atípicos en el Área Metropolitana de
Buenos Aires: Su impacto socio- territorial. Ed. Oikos, Buenos Aires.Menendez 1990: Sistema HIDROBID II para simular corrientes en cuencos, Revista internacional de métodos
numéricos para cálculo y diseño en ingeniería, Vol 6, 1.Menendez 2001: Description and modeling of the hydrosedimentologic mechanisms in the Rio de la Plata
River, VII International Seminar on Recent Advances in Fluid Mechanics, Physics of Fluids andAssociated Complex Systems, Buenos Aires.
Menéndez, A. N. and R. Norscini 1982: Spectrum of Shallow Water Waves: An Analysis, Journal of theHydraulics Division, ASCE, Vol. 108, No. HY1, January.
Ministerio de Obras Públicas, Dirección General de Obras Hidráulicas, Bs. As., 1908: Memoria sobre elRío de la Plata, presentada al XI Congreso Internacional de Navegación.
Molinari, G. N. 1986: Simulación numérica de la circulación en el Río de la Plata, Tesis de grado para laLicenciatura en Oceanografía, ITBA. Director: A. N. Menéndez, Informe LHA-INCYTH S5-017-86.
Olalde, A. M. 1988: Simulación numérica de corrientes de deriva en el Río de la Plata, Tesis de grado parala Licenciatura en Oceanografía, ITBA, Director: A. N. Menéndez, Informe LHA-INCYTH 065-002-88.
Outes, F. 1930: Cartas y planos inéditos de los siglos XVII y XVIII y del primer decenio del XIXconservadas en el Archivo de la Dirección de Geodesia, Catastro y Mapa de la provincia de BuenosAires, Talleres S.A. Casa Jacobo Peuser.
Parker, G., C. Paterlini, P. Costa, R. Violante, S. Maarcolini and J. Cavalotto 1990: La sísmica de altaresolución en el estudio de la evolución costera del noreste bonaerense durante el Cuaternario.International Syumposium on Quaternary Shorelines: Evolution, Processes and Future Changes.Abstracts: 52. La Plata.
Piola, A. R., E. J. Campos, O. O. Möller, M. Charo and C. Martinez 2000: Subtropical Shelf Front offeastern South America, Journal of Geophysical Research, 105(C3), 6565-6578.
Putnam, J. A. and J. W. Johnson, 1942, The dissipation of wave energy by bottom friction, Transactions ofthe American Geophysical Union, 30, 1, 67-74.
Ríos, D. 2002: Vulnerabilidad, urbanizaciones cerradas e inundaciones en el partido de Tigre durante elperíodo 1990-2001. Tesis de Licenciatura en Geografía Facultad de Filosofía y Letras, UBA, 191 pp.
SHN, 1999a, Río de la Plata Medio y Superior, Carta Náutica H116, 4th ed., Servicio de HidrografiaNaval, Armada Argentina, Buenos Aires.
SHN, 1999b, Río de la Plata Exterior, Carta Náutica H113, 2nd ed., Servicio de Hidrografia Naval,Armada Argentina, Buenos Aires.
Simionato C, Vera C and F. Siegismund 2003: Surface wind variability on seasonal and interannual scalesover Río de la Plata. Submitted to Journal of Coastal Research.
Simionato, C., W. Dragani, M. N. Nuñez and M. Engel 2002: A set of 3-d nested models for tidalpropagation from the Argentinean Continental Shelf to the Río de la Plata Estuary, Part I M2,submitted to Continental Shelf Research.
SMN 1992: Estadisticas Climatologicas 1981 –1990, Serie B, Nro. 37, Servicio Meteorológico Nacional,Fuerza Aérea Argentina, Buenos Aires.
Spaletti, L. A., S. Matthews and D. Poiret 1987: Sedimentology of the Holocene littoral ridges ofsamborombón Bay (Central Buenos Aires province, Argentina). Quaternary of South America andAntarctic Peninsula, 5:111-132. Rotterdam.

124
Teruggi, M. E. 1949: Contribución a la Psamografía Argentina. Las arenas de la zona de Mar de Ajó. NotasMuseo de la Plata. Tomo XIV. Geol. N° 61. La Plata.
Tricart, J. 1973: Geomorfología de la Pampa Deprimida. Colección Científica INTA, 12. 202pp. BuenosAires.
Vincent, C. and A. Carrie, 1988: Evaluation of an energy-propagation wave refraction model. ContinentalShelf Research, 8(3), 287-305.
Violante, R. A. 1988: Geología de la "planicie costera" entre Villa Gesell y Faro Querandí, provincia deBuenos Aires. Doct. Thesis , Fac. Cs. Nat. Mus. (UNLP).
Watanabe, A., 1982: Numerical modelling of nearshore currents and beach deformation. CoastalEngineering in Japan, 25, 147-161.
Whitham, G. B. 1974: Linear and nonlinear waves, Interscience, New York.

For copies of final reports from the AIACC project and other information about the project,please contact:
AIACC Project OfficeThe International START Secretariat2000 Florida Avenue, NW, Suite 200
Washington, DC 20009 USATel. +1 202 462 2213Fax. +1 202 457 5859Email: [email protected]
Or visit the AIACC website at:www.aiaccproject.org