Prescription, Compliance, and Burden Associated with Salt ...
Upload
khangminh22Category
view
0download
0
Findings from the Global Burden of Disease Study 2017
Findings from the Global Burden of Disease Study 2017
This booklet was prepared by the Institute for Health Metrics and Evaluation (IHME) through core funding from the Bill & Melinda Gates Foundation. The views expressed are those of the authors. The contents of this publication may be reproduced and redistributed in whole or in part, provided the intended use is for noncommercial purposes, the contents are not altered, and full acknowledgment is given to IHME.
This work is licensed under the Creative Commons Attribution-NonCommercial-NoDerivs 4.0 Unported License. To view a copy of this license, please visit https://creativecommons.org/licenses/by-nc-nd/4.0/. For any usage that falls outside of these license restrictions, please contact IHME Global Engagement at [email protected].
Citation: Institute for Health Metrics and Evaluation (IHME). Findings from the Global Burden of Disease Study 2017. Seattle, WA: IHME, 2018.
Cover photo by Annie Spratt.
INSTITUTE FOR HEALTH METRICS AND EVALUATION2301 FIFTH AVE., SUITE 600 SEATTLE, WA 98121 USA
www.healthdata.org
To request copies of this report, please contact IHME:
Telephone: +1-206-897-2800
Fax: +1-206-897-2899
Email: [email protected]
Printed in the United States of America
© 2018 Institute for Health Metrics and Evaluation

Contents
5 Joint Introduction by Dr. Tedros and Dr. Murray
6 Acronyms
7 Glossary of terms
8 Global trends in mortality and life expectancy
10 Global trends in causes of death
12 Global trends in disability
14 Global trends in healthy life expectancy and early death and disability
16 Global trends in risk factors leading to early death and disability
18 Global trends in population and fertility
20 Future health trends: findings from the GBD 2016 study
22 Progress and challenges in pursuing the health-related Sustainable Development Goals
25 Downloadable GBD 2017 study data
25 Downloadable GBD 2016 Forecasting study data


GBD 2017 STUDY FINDINGS | 5
A quarter century ago, the World Bank revealed the first glimpse of the Global Burden of Disease Study (GBD).
The study was met by many in the international health metrics sciences community with curiosity and skepticism. No one had ever attempted to quantify 107 diseases and injuries in every region of the world.
Twenty-five years later, the GBD has evolved into a broad resource of what injures, disables, and kills people across countries, as well as by time, age, and sex. The 2017 study comprises seven papers and a complete edition of the international medical journal The Lancet. In addition, for the first time, the GBD seeks to quantify population and levels of fertility in every nation. The number of collaborators totaled 3,676 from 146 countries and territories; it includes 38 billion estimates of 359 diseases and injuries and 84 risk factors in 195 countries and territories.
Comprehensive data is essential for informing policy dialogue and measuring progress in health and development. The World Health Organization (WHO) works closely with countries to produce internationally comparable statistics. Currently only 49 countries report high-quality cause-of-death data to WHO, and almost all of these are in Europe and the Americas.
WHO is committed to supporting countries to improve their systems for gathering robust health data. The GBD is an important independent resource that helps fill large gaps in existing health data through innovative statistical modelling. In May of this year, WHO and the Institute for Health Metrics and Evaluation (IHME), which coordinates the study, agreed to establish a broad collaboration, including on the GBD. Our organizations – and both of us personally – are committed to improving the accuracy, timeliness, and policy-relevance of health data and information. The memorandum of understanding we signed will result in increased awareness and understanding of health problems globally, as well as the evaluation of strategies to address them. Moreover, this agreement highlights our shared commitment to ensure that health policy is based on the most accurate and up-to-date data available.
IHME’s GBD is an important tool to support health evidence worldwide, and facilitates bringing together global experts and scholars in the field to help improve health systems.
We encourage elected and appointed health officials, researchers, policy-makers, and others to explore the 2017 study.
CHRISTOPHER J.L. MURRAY
DirectorInstitute for Health Metrics and Evaluation
TEDROS ADHANOM GHEBREYESUS
Director-GeneralThe World Health Organization
Geneva, December 2018
GBD 2017:
Joint Introduction by Dr. Tedros and Dr. Murray

6 | GBD 2017 STUDY FINDINGS
AcronymsCKD Chronic kidney disease
COPD Chronic obstructive pulmonary disease
DALYs Disability-adjusted life years
GBD Global Burden of Diseases, Injuries, and Risk Factors Study
HALE Healthy life expectancy
NCDs Non-communicable diseases
NTDs Neglected tropical diseases
SDGs Sustainable Development Goals
SDI Socio-demographic Index
STIs Sexually transmitted infections
TB Tuberculosis
YLDs Years lived with disability
YLLs Years of life lost

GBD 2017 STUDY FINDINGS | 7
Glossary of termsDisability-adjusted life years (DALYs) Years of healthy life lost to premature death and disability. DALYs are the sum of
years of life lost (YLLs) and years lived with disability (YLDs).
Expected (value) Predicted indicator value based on the country’s per capita income, educational attainment, and total fertility rate.
Healthy life expectancy (HALE) The number of years that a person at a given age can expect to live in good health, taking into account mortality and disability.
Life expectancy Number of years a person is expected to live based on their present age. For GBD, the life expectancy for an age group (e.g., 50- to 54-year-olds), is determined from the first year in the age range.
Maternal mortality ratio The number of maternal deaths per 100,000 live births. GBD defines maternal deaths as any death of a woman while pregnant or within one year of termination of pregnancy, irrespective of the duration and site of the pregnancy, from any cause related to or aggravated by the pregnancy or its management but not from accidental or incidental causes. Ages included range from 10 to 54 years.
Replacement rate The total fertility rate at which a population replaces itself from generation to generation, assuming no migration, or approximately 2.05 live births per woman.
Risk factors Potentially modifiable causes of disease and injury.
SDG index A composite measure, ranging from 0 to 100, of overall progress toward meeting the SDGs. It takes into account 40 of the 41 performance indicators for the health-related SDGs.
Socio-demographic Index (SDI) A summary measure that identifies where countries or other geographic areas sit on the spectrum of development. Expressed on a scale of 0 to 1, SDI is a composite average of the rankings of the incomes per capita, average educational attainment, and fertility rates of all areas in the GBD study.
Super-regions Seven world regions whose constituent countries are grouped on the basis of cause of death patterns:
Central Europe, Eastern Europe, and Central AsiaHigh-incomeLatin America and CaribbeanNorth Africa and Middle EastSouth AsiaSoutheast Asia, East Asia, and OceaniaSub-Saharan Africa
Total fertility rate The average number of children a woman would bear if she survived through the end of the reproductive age span (age 10 to 54 years) and experienced at each age a particular set of age-specific fertility rates observed in the year of interest.
Under-5 mortality The probability (expressed as the rate per 1,000 live births) that children born alive will die before reaching the age of 5 years.
Years lived with disability (YLDs) Years of life lived with any short-term or long-term health loss.
Years of life lost (YLLs) Years of life lost due to premature mortality.

8 | GBD 2017 STUDY FINDINGS
LIFE EXPECTANCY AND MORTALITY 2017 STUDY HIGHLIGHTS
Global trends in mortality and life expectancy
Life expectancy, 2017*
60 70 8052 85
Years
What’s new in this study“Global, regional, and national age-sex-specific mortality and life expectancy, 1950–2017: a systematic analysis for the Global Burden of Disease Study 2017” is based on more data than ever before and includes 622 new data sources, for a total of 8,259 data sources. The 2017 study produced and used a new set of population estimates, which has led to substantial changes in mortality estimates in many countries. The analysis has been extended in time by two decades to start in 1950, and the statistical methods have been improved.
Highlights » There was rapid progress in life expectancy from 1950 to 2017:
» Males, up from 48 years in 1950 to 71 years in 2017
» Females, up from 53 years in 1950 to 76 years in 2017
» Among age groups, the under-5 age group experienced huge reductions in mortality between 1950 and 2017, while adults have made much less progress, particularly adult males.
» While females tend to live longer than males, the gap in life expectancy between them varies substantially by level of socioeconomic development.
*Data shown in the figure represent life expectancy at birth for both sexes.
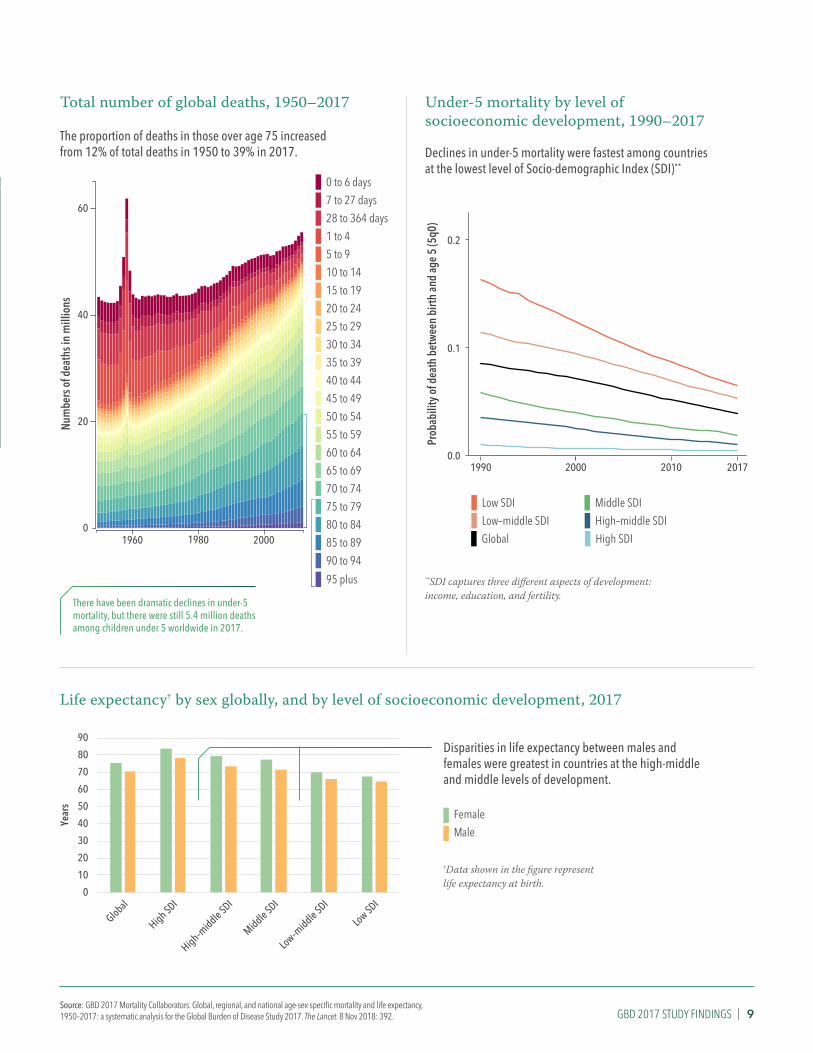
GBD 2017 STUDY FINDINGS | 9Source: GBD 2017 Mortality Collaborators. Global, regional, and national age-sex-specific mortality and life expectancy, 1950–2017: a systematic analysis for the Global Burden of Disease Study 2017. The Lancet. 8 Nov 2018: 392.
Total number of global deaths, 1950–2017
The proportion of deaths in those over age 75 increased from 12% of total deaths in 1950 to 39% in 2017.
There have been dramatic declines in under-5 mortality, but there were still 5.4 million deaths among children under 5 worldwide in 2017.
Num
bers
of d
eath
s in
mill
ions
0 to 6 days7 to 27 days28 to 364 days1 to 45 to 910 to 1415 to 1920 to 2425 to 2930 to 3435 to 3940 to 4445 to 4950 to 5455 to 5960 to 6465 to 6970 to 7475 to 7980 to 8485 to 8990 to 94
0
20
40
60
1960 1980 2000
95 plus
Under-5 mortality by level of socioeconomic development, 1990–2017
Declines in under-5 mortality were fastest among countries at the lowest level of Socio-demographic Index (SDI)**
**SDI captures three different aspects of development: income, education, and fertility.
Low SDILow–middle SDI
0.0
0.1
0.2
1990 2000 2010 2017
Prob
abili
ty o
f dea
th b
etw
een
birth
and
age
5 (5
q0)
Global High SDIHigh–middle SDIMiddle SDI
Life expectancy† by sex globally, and by level of socioeconomic development, 2017
Disparities in life expectancy between males and females were greatest in countries at the high-middle and middle levels of development.
MaleFemale
0
10
20
30
40
50
60
70
80
90
Global
High SDI
High–middle SDI
Middle SDI
Low–middle SDI
Low SDI
Year
s
†Data shown in the figure represent life expectancy at birth.

10 | GBD 2017 STUDY FINDINGS
What’s new in this study“Global, regional, and national age-sex-specific mortality for 282 causes of death in 195 countries and territories, 1980–2017: a systematic analysis for the Global Burden of Disease Study 2017” estimated mortality for 282 causes of death in 195 countries from 1980 to 2017, adding 18 causes to its estimates compared to GBD 2016. In 2017, the GBD study added numerous data sources, including 127 country-years of vital registration data and 502 country-years of cancer registry data.
Highlights » Between 1990 and 2017, early death from enteric infections*,
respiratory infections and tuberculosis, and maternal and neonatal disorders dropped, with the greatest declines in the least developed countries.
» Progress in reducing mortality from some common diseases has stalled or reversed, primarily for non-communicable diseases such as cardiovascular diseases and cancers.
» An unintended consequence of greater access to health care globally is increases in mortality from diseases and disorders linked to antibiotic resistance.
CAUSES OF DEATH 2017 STUDY HIGHLIGHTS
Global trends in causes of death
Leading causes of early death, 1990 and 2017
Ischemic heart disease, neonatal disorders, stroke, lower respiratory infections, diarrhea, road injuries, and chronic obstructive pulmonary disease (COPD) accounted for more than 1 million deaths each worldwide in 2017.
5 Stroke
3 Diarrheal diseases
1 Neonatal disorders
4 Ischemic heart disease
2 Lower respiratory infections
4 Lower respiratory infections
3 Stroke
5 Diarrheal diseases
1 Ischemic heart disease
2 Neonatal disorders
6 Congenital birth defects 6 Road injuries
9 Measles
7 Tuberculosis
10 Malaria
8 Road injuries
10 Malaria
9 Congenital birth defects
7 COPD
8 HIV/AIDS
Communicable, maternal, neonatal, and nutritional diseasesNon-communicable diseases
Injuries
1990 rank** 2017 rank
11 COPD
19 HIV/AIDS
11 Tuberculosis
39 Measles
Same or increase
Decrease
*Enteric infections include diseases such as diarrhea, typhoid and paratyphoid fevers, and other intestinal infections.
**Ranking based on number of years lived with disability (YLLs) at all ages

GBD 2017 STUDY FINDINGS | 11Source: GBD 2017 Causes of Death Collaborators. Global, regional, and national age-sex-specific mortality for 282 causes of death in 195 countries and territories, 1980–2017: a systematic analysis for the Global Burden of Disease Study 2017. The Lancet. 8 Nov 2018: 392.
-15% -10% -5% 0% 5% 10% 15%-17% 17%
Annual rate of change
Change in mortality‡ due to extensively drug-resistant tuberculosis, 2007–2017
Since 2007, there have been rapid increases in emerging diseases and disorders due to antibiotic use or resistance, including extensively drug-resistant tuberculosis, cellulitis, and Clostridium difficile diarrhea.
‡Reflects annual rate of change in all-ages deaths per 100,000
Global mortality† from cardiovascular diseases, 2007–2017
Medications that prevent deaths from cardiovascular diseases, such as those that lower blood pressure and cholesterol, are among the most cost-effective interventions available to health systems. Despite this, mortality from cardiovascular diseases has increased since 2007 worldwide.
†Death rate at all ages and for both sexes
Deaths from armed conflict and terrorism, 2007–2017
Deaths from armed conflict and terrorism increased rapidly, rising by 118% from 2007 to 2017
20072008
20092010
20112012
20132014
20152016
2017
0
100k
200k
Deat
hs
2007 2008 2009 2010 2011 2012 2013 2014 2015 2016 2017
Deat
hs p
er 1
00,0
00
200
210
220
230
240

12 | GBD 2017 STUDY FINDINGS
What’s new in this study“Global, regional, and national incidence, prevalence, and years lived with disability for 354 diseases and injuries for 195 countries and territories, 1990–2017: a systematic analysis for the Global Burden of Disease Study 2017” is based on more data than ever before and includes 68,781 data sources used for the analysis of nonfatal causes of disease and injury. GBD 2017 added 19 new causes to its nonfatal analysis, for a total of 354 causes. The study includes a more detailed analysis of disability than previous versions of GBD.
Highlights » Globally, the total burden of disability increased by 52%
between 1990 and 2017.
» The burden of disability is driven mainly by non-communicable diseases, which caused 80% of disability in 2017.
» Disability from metabolic conditions, such as type 2 diabetes and fatty liver disease, increased around the world and across levels of development.
YEARS LIVED WITH DISABILITY 2017 STUDY HIGHLIGHTS
Global trends in disability
Years lived with disability (YLDs*), 2017
Number of total YLDs, global, both sexes, by age group and cause, 2017
*YLDs represent time lived in less-than-ideal health. Nutritional deficiencies primarily include iron deficiency anemia; mental disorders are mainly composed of anxiety and depression; musculoskeletal disorders consist largely of back pain and neck pain; and sense organ diseases mostly include hearing loss and vision loss.
0–6 days
7–27 days
28–364 days
1–4 years
5–9 years
10–14 years
15–19 years
20–24 years
25–29 years
30–34 years
35–39 years
40–44 years
45–49 years
50–54 years
55–59 years
60–64 years
65–69 years
70–74 years
75–79 years
80–84 years
85–89 years
90–94 years
95+ years
YLD
s
0
10M
20M
30M
40M
50M
60M
HIV/AIDS & STIsRespiratory infections & TBEnteric infectionsNTDs & malariaOther infectious diseasesMaternal & neonatal conditionsNutritional deficienciesCancersCardiovascular diseasesChronic respiratory diseasesDigestive diseasesNeurological disordersMental disordersSubstance use disordersDiabetes & CKDSkin diseasesSense organ diseasesMusculoskeletal disordersOther non-communicableTransport injuriesUnintentional injuriesSelf-harm & violence
STIs = sexually transmitted infectionsTB = tuberculosisNTDs = neglected tropical diseasesCKD = chronic kidney disease
The burden of disability is most concentrated in working-age people.

GBD 2017 STUDY FINDINGS | 13Source: GBD 2017 Disease and Injury Incidence and Prevalence Collaborators. Global, regional, and national incidence, prevalence, and years lived with disability for 354 diseases and injuries for 195 countries and territories, 1990–2017: a systematic analysis for the Global Burden of Disease Study 2017. The Lancet. 8 Nov 2018: 392.
Leading causes of disability, 1990 and 2017
Global all-age YLDs
1990 rank
5 COPD
3 Dietary iron deficiency
1 Low back pain
4 Depressive disorders
2 Headache disorders**
2017 rank
4 Diabetes
3 Depressive disorders
5 Age-related hearing loss
1 Low back pain
2 Headache disorders**
Communicable, maternal, neonatal, and nutritional diseasesNon-communicable diseases
6 Age-related hearing loss 6 COPD†
9 Diabetes 7 Dietary iron deficiency
**Headache disorders mainly include migraine.†Chronic obstructive pulmonary disease
Differences in disability by sex
In general, females have had – and continue to experience – higher levels of disability than males.
0 2,000 4,000 6,000 8,000 10,000 12,000 14,000
2017
1990
Age-adjusted YLDs per 100,000
MaleFemale
Disability and development
Years lived with disability by Socio-demographic Index (SDI) grouping – YLDs per 100,000, age-adjusted, 2017
SDI captures three different aspects of development: income, education, and fertility.
High SDI
High-middle SDI
Middle SDI
Low-middle SDI
Low SDI0
2k
4k
6k
8k
10k
12k
YLDs
per
100
,000
HIV/AIDS & STIsRespiratory infections & TBEnteric infectionsNTDs & malariaOther infectious diseasesMaternal & neonatal conditionsNutritional deficienciesCancersCardiovascular diseasesChronic respiratory diseasesDigestive diseasesNeurological disordersMental disorders
Substance use disordersDiabetes & CKDSkin diseasesSense organ diseasesMusculoskeletal disordersOther non-communicableTransport injuriesUnintentional injuriesSelf-harm & violence
STIs = sexually transmitted infectionsTB = tuberculosisNTDs = neglected tropical diseasesCKD = chronic kidney disease
While diabetes emerged as the fourth-leading cause of disability globally in 2017, many of the top leading causes of disability in 1990 remain so in 2017, namely low back pain, headaches, and depression. This reflects a lack of progress in addressing these conditions.

14 | GBD 2017 STUDY FINDINGS
Global trends in healthy life expectancy and early death and disability
What’s new in this study“Global, regional, and national disability-adjusted life-years (DALYs) for 359 diseases and injuries and healthy life expectancy (HALE) for 195 countries and territories, 1990–2017: a systematic analysis for the Global Burden of Disease Study 2017” is based on more data than ever before. Nineteen new causes were added for a total of 359 causes. The study also includes a more detailed analysis of healthy life expectancy.
Highlights » Globally, in 2017, life expectancy was 73 years, but healthy
life expectancy was only 63 years. This means on average 10 years of life were spent in poor health in 2017.
» Trends in early death and disability,* 1990–2017:
» 41% decrease in communicable diseases and neonatal disorders
» 40% increase in non-communicable diseases
» Large disparities persist in health and disease burden by sex and level of development
DISABILITY-ADJUSTED LIFE YEARS AND HEALTHY LIFE EXPECTANCY 2017 STUDY HIGHLIGHTS
Years someone can expect to live in full health in 2017
Healthy life expectancy** at birth, both sexes, 2017
45 50 55 60 65 70 74
Years of healthy life
**Healthy life expectancy is the number of years that a person at a given age can expect to live in full health, taking into account mortality and disability.
*Early death and disability is measured in terms of number of all-ages disability-adjusted life years (DALYs).
There are large inequalities across countries in healthy life expectancy, which is the number of years a person can expect to live in full health.

GBD 2017 STUDY FINDINGS | 15Source: GBD 2017 DALYs and HALE Collaborators. Global, regional, and national disability-adjusted life-years (DALYs) for 359 diseases and injuries and healthy life expectancy (HALE) for 195 countries and territories,1990–2017: a systematic analysis for the Global Burden of Disease Study 2017. The Lancet. 8 Nov 2018: 392.
Leading causes of early death and disability‡ at lowest and highest levels of development, 2017
‡Ranking based on number of all-ages DALYs§SDI captures three different aspects of development: income, education, and fertility. COPD = chronic obstructive pulmonary disease.
While females tend to live longer than males, many of these extra years are spent in poor health
Extra years† lived by females compared to males in good health versus poor health, 2017
Extra years lived by females in poor healthExtra years lived by females in good health
SDI = Socio-demographic Index
92%34%
31%
35%41%
48%45%49%30%37%
37%
42%32%
33%
44%32%
22%34%34%
27%29%
South AsiaAndean Latin America
Western sub-Saharan AfricaCentral sub-Saharan Africa
AustralasiaWestern Europe
North Africa and Middle EastHigh-income North America
Eastern sub-Saharan AfricaCaribbean
OceaniaEast Asia
Southern Latin AmericaCentral Latin America
High-income Asia PacificSoutheast AsiaCentral Europe
Southern sub-Saharan AfricaTropical Latin America
Central AsiaEastern Europe
0
Extra years lived by females
1284
†Extra years of life expected at birth
Performance in healthy life expectancy across regions
Healthy life expectancy above or below expected*** amount, GBD super-regions, 2017
-2
0
2
Diffe
renc
e be
twee
n ob
serv
ed a
nd e
xpec
ted
heal
thy
life
expe
ctan
cy (y
ears
)
Central Europe, Eastern Europe, and Central AsiaSub-Saharan AfricaSouth AsiaNorth Africa and Middle EastHigh-incomeSoutheast Asia, East Asia, and OceaniaLatin America and Caribbean
Low Socio-demographic Index (SDI)§ countries
5 Congenital defects
3 Diarrheal diseases
1 Neonatal disorders
4 Malaria
2 Lower respiratory infections
High SDI countries
4 Lung cancer
3 Stroke
5 COPD
1 Ischemic heart disease
2 Low back pain
Communicable, maternal, neonatal, and nutritional diseasesNon-communicable diseases
***Based on level of socioeconomic development
Lower is better

16 | GBD 2017 STUDY FINDINGS
RISK FACTORS 2017 STUDY HIGHLIGHTS
Global trends in risk factors leading to early death and disability
What’s new in this study“Global, regional, and national comparative risk assessment of 84 behavioural, environmental and occupational, and metabolic risks or clusters of risks for 195 countries and territories, 1990–2017: a systematic analysis for the Global Burden of Disease Study 2017” is based on more data than ever before and includes 46,749 sources used for the analysis of risk factors affecting health. GBD 2017 added one new risk factor (bullying victimization) to the analysis. The study also examines how risks change according to level of development and includes a more accurate method of estimating smoking risk.
Highlights » The amount of early death and disability linked to
risk factors declined between 2007 and 2017.
» Leading risk factors changed considerably between 1990 and 2017. In 1990, the leading risk factors for early death and disability (number of all-ages DALYs) were child wasting, short gestation for birth weight, and low birth weight for gestation. In 2017, they were high blood pressure, smoking, and high blood sugar.
Changes in early death and disability linked to risk factors
Annual change in rate of disability-adjusted life years (DALYs) attributable to risk factors, both sexes, age-adjusted, 2000–2017
-8% -6% -4% -2% 0% 4%
Annual change in rate
2%
In sub-Saharan Africa, decreases in early death and disability linked to risk factors were especially pronounced.

GBD 2017 STUDY FINDINGS | 17Source: GBD 2017 Risk Factor Collaborators. Global, regional, and national comparative risk assessment of 84 behavioural, environmental and occupational, and metabolic risks or clusters of risks for 195 countries and territories, 1990–2017: a systematic analysis for the Global Burden of Disease Study 2017. The Lancet. 8 Nov 2018: 392.
Leading risk factors causing early death and disability, by sex, 2017
*Rank based on number of all-ages DALYs
Performance in high blood pressure and smoking among GBD super-regions
As of 2017, the leading global risk factors causing early death and disability for all ages combined were high blood pressure and smoking. The disease burden caused by these two risk factors, compared to the burden expected based on the level of socioeconomic development, varied considerably by region.
Age-adjusted DALY rates from high blood pressure, both sexes, observed compared to expected, 2017
Age-adjusted DALY rates from smoking, both sexes, observed compared to expected, 2017
Males*
5 Short gestation for birth weight
3 High fasting plasma glucose
1 Smoking
4 Alcohol use
2 High systolic blood pressure
Females*
4 Short gestation for birth weight
3 High body mass index
5 Low birth weight for gestation
1 High systolic blood pressure
2 High fasting plasma glucose
Metabolic risksBehavioral risks
0
500
1,000
1,500
2,000
2,500
3,000
3,500
4,000
4,500
Southeast Asia
, East A
sia,
and Oceania
Central E
urope, Easte
rn Europe,
and Central A
sia
High-income
Latin Americ
a and Caribbean
North Afric
a and Middle East
South Asia
Sub-Saharan Africa
Obse
rved
and
exp
ecte
d at
tribu
tabl
e DA
LY ra
te p
er 1
00,0
00
0
500
1,000
1,500
2,000
2,500
3,000
3,500
4,000
4,500
Southeast Asia
, East A
sia,
and Oceania
Central E
urope, Easte
rn Europe,
and Central A
sia
High-income
Latin Americ
a and Caribbean
North Afric
a and Middle East
South Asia
Sub-Saharan Africa
Obse
rved
and
exp
ecte
dat
tribu
tabl
e DA
LY ra
te p
er 1
00,0
00
Observed
Expected
Observed
Expected

18 | GBD 2017 STUDY FINDINGS
The new GBD estimates improve upon previously available estimates in three key ways:
Precision. GBD estimates improve upon the current standard for population estimation. The current standard uses five-year age estimates (for example, number of 5- to 9-year-olds in a population) that are then converted into single-year age groupings (for example, number of 6-year-olds in a population). This conversion requires mathematical steps
Other key trends » The global population increased from
2.6 billion in 1950 to 7.6 billion in 2017.
» Despite this growth, roughly half of 195 countries recorded total fertility rates below the replacement rate of approximately 2.05 in 2017.
Global trends in population and fertility
POPULATION AND FERTILITY 2017 STUDY HIGHLIGHTS
This update to the Global Burden of Diseases, Injuries, and Risk Factors study (GBD) includes an important new feature: for the first time, population and fertility
estimates were produced by the GBD collaborators. Those estimates confirm and extend our understanding of key population trends, including those related to health.
Recent population growth has been highest in Africa, Asia, and Latin America
Population growth rate, 2010–2017
that can introduce errors and uncertainty. Instead, GBD produces single-year age estimates in every calendar year from 1950 through 2017. This approach is more accurate.
Standardization. GBD uses the same methodology to estimate population for every location and year. That ensures valid comparisons between different places and times.
Transparency. All data sources and methods used are published and publicly accessible free of charge.
What’s unique about the GBD population and fertility estimates?
<-1.5%-1.5% to -1%-0.99% to -0.5%-0.49% to 0%0% to 0.49%0.5% to 0.99%1% to 1.49%1.5% to 1.99%2%+
GBD 2017 STUDY FINDINGS | 19
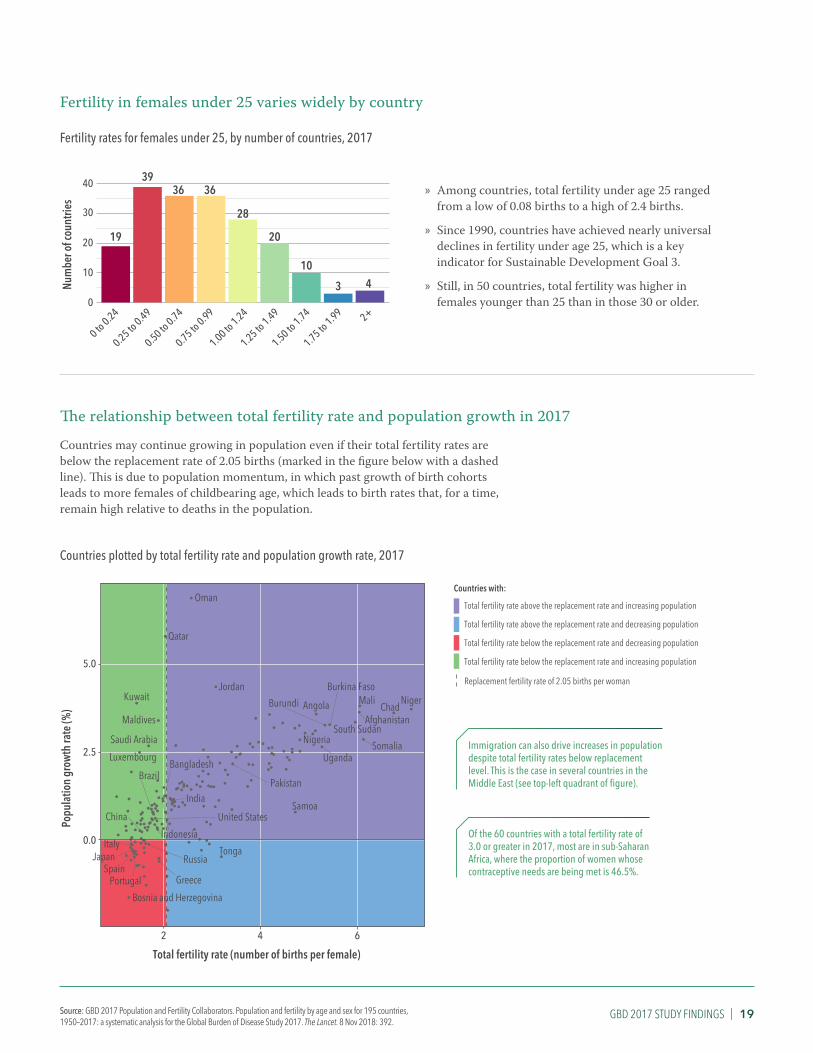
Fertility in females under 25 varies widely by country
Fertility rates for females under 25, by number of countries, 2017
» Among countries, total fertility under age 25 ranged from a low of 0.08 births to a high of 2.4 births.
» Since 1990, countries have achieved nearly universal declines in fertility under age 25, which is a key indicator for Sustainable Development Goal 3.
» Still, in 50 countries, total fertility was higher in females younger than 25 than in those 30 or older.
The relationship between total fertility rate and population growth in 2017
Countries may continue growing in population even if their total fertility rates are below the replacement rate of 2.05 births (marked in the figure below with a dashed line). This is due to population momentum, in which past growth of birth cohorts leads to more females of childbearing age, which leads to birth rates that, for a time, remain high relative to deaths in the population.
Countries plotted by total fertility rate and population growth rate, 2017
Immigration can also drive increases in population despite total fertility rates below replacement level. This is the case in several countries in the Middle East (see top-left quadrant of figure).
Of the 60 countries with a total fertility rate of 3.0 or greater in 2017, most are in sub-Saharan Africa, where the proportion of women whose contraceptive needs are being met is 46.5%.
19
3936 36
28
20
10
3 4
0
10
20
30
40
2+
Num
ber o
f cou
ntrie
s
1.75 to 1.99
0 to 0.24
0.25 to 0.49
0.50 to 0.74
0.75 to 0.99
1.00 to 1.24
1.25 to 1.49
1.50 to 1.74
●●
●
●
●
●●
●
●
●
●●
●
●
●
●
●
●
●
●
●
●
●
●
●
●
●●●
●
●
●
●
●
●●
●
●
●
●●
●
●
● ●●●
●●
●
●●
●
●
●
●
●
●●
●●
●
●● ●●
●
●
●
●
●
●
● ●
●
●●
●●
●
●●
●
●●●
●●
●
●
●
●
●
●
●
●●
●
●
●
●● ●
●
●
●
●●
●
●●●
●
●
●
●
●
●
●
●
●
●
●
●
●
●
●
●
●
●●
●
●
●
●●
●●
●
●
●
●
●
●
●
●
●
● ●●●
●
●
●
●●
●
●●●
●
●
●
●
● ●
●
● ●
●
●
●
●
●●
●●●
●
●
●
●
●●
●
●
●●
●
●
●
● ●
●
●
Maldives
Samoa
Tonga
Bosnia and HerzegovinaGreece
Luxembourg
Portugal
JordanKuwait
Oman
Qatar
Saudi Arabia
Afghanistan
Pakistan
AngolaBurundi
SomaliaUganda
Burkina Faso
ChadMali Niger
NigeriaSouth Sudan
ChinaIndonesia
RussiaJapanItaly
Spain
United States
BrazilBangladesh
India
0.0
2.5
5.0
2 6
Total fertility rate (number of births per female)
Popu
latio
n gr
owth
rate
(%)
4
Total fertility rate above the replacement rate and increasing population
Total fertility rate above the replacement rate and decreasing population
Total fertility rate below the replacement rate and decreasing population
Total fertility rate below the replacement rate and increasing population
Countries with:
Replacement fertility rate of 2.05 births per woman
Source: GBD 2017 Population and Fertility Collaborators. Population and fertility by age and sex for 195 countries, 1950–2017: a systematic analysis for the Global Burden of Disease Study 2017. The Lancet. 8 Nov 2018: 392.

20 | GBD 2017 STUDY FINDINGS
The added value of this studyThe study, “Forecasting life expectancy, years of life lost, and all-cause and cause-specific mortality for 250 causes of death: reference and alternative scenarios for 2016–40 for 195 countries and territories using data from the Global Burden of Disease Study 2016,” is unprecedented, tracking 250 causes of death and 79 risks in an integrated and comprehensive way. Health forecasts and alternative future scenarios can influence long-term planning and investments. The study shows that people’s health can improve, but such improvement demands attention, resources, action, and continued prioritization of these drivers of health.
Highlights » Globally, life expectancy overall is expected to increase by 4.4
years between 2016 and 2040. But if less progress is made, life expectancy could decrease by 0.4 years for males and stagnate for females; if more progress is made, it could increase by 7.8 years for males and 7.2 years for females.
» There is significant risk that the progress made in slowing the HIV epidemic could be reversed without a continued robust investment in health. This could, in turn, threaten recent gains in life expectancy in eastern and southern Africa.
» The future is not pre-ordained; the potential is large, in all countries, to alter the trajectory of health through reducing exposure to key risk factors and increasing educational attainment and income per person.
GBD 2016 FORECASTING STUDY HIGHLIGHTS
Future health trends: findings from the GBD 2016 study
Change in life expectancy,* 2016–2040, both sexes
*Differences in life expectancy shown are based on what has been observed historically and the future trend based on that observation.
0 to <11 to <22 to <33 to <44 to <55 to <66 to <77 to <88 to <1010 to 12
All countries are likely to experience at least a slight increase in life expectancy by 2040

GBD 2017 STUDY FINDINGS | 21Source: Foreman et al. Forecasting life expectancy, years of life lost, and all-cause and cause-specific mortality for 250 causes of death: reference and alternative scenarios for 2016–40 for 195 countries and territories using data from the Global Burden of Disease Study 2016. The Lancet. 16 October 2018.
Life expectancy, 1990–2040 Potential loss of life** averted through reduction of exposure to key risk factors, 2040
**Measured as the difference between the 2040 “reference” (the future trend based on what has been observed historically) and 2040 “better” (what can be expected if more progress is made) scenarios in terms of YLLs attributable to risk factors
Leading causes of early death, 2016 and 2040†
Communicable, maternal, neonatal, and nutritional diseasesNon-communicable diseases
Injuries
Leading causes in 2016
5 Road injuries
3 Lower respiratory infections
1 Ischemic heart disease
4 Diarrheal diseases
2 Stroke
Leading causes in 2040
6 Malaria
10 Neonatal encephalopathy
8 HIV/AIDS
9 COPD
7 Preterm birth complications
13 Lung cancer
5 Chronic kidney disease
3 Lower respiratory infections
1 Ischemic heart disease
4 COPD
2 Stroke
6 Alzheimer's disease
10 Diarrheal diseases
8 Road injuries
9 Lung cancer
7 Diabetes
15 Diabetes
16 Chronic kidney disease
18 Alzheimer's disease
12 HIV/AIDS
18 Preterm birth complications
21 Neonatal encephalopathy
22 Malaria
Same or increase
Decrease
65
70
75
80
1990 2000 2010 2020 2030 2040
Year
s
FemaleMale
What has been observed historicallyand the future trend based on that observation
What can be expected if more progress is madeWhat can be expected if less progress is made
0
10,000,000
20,000,000
30,000,000
40,000,000
50,000,000
60,000,000
70,000,000
80,000,000
90,000,000
High body mass
index
High blood pressure
High blood sugar
Smoking
Ambient partic
ulate matte
r pollu
tion
Alcohol u
se
High total ch
olesterol
Impaire
d kidney functi
on
Diet high in
sodium
Short gesta
tion fo
r birth
weight
Year
s of l
ife lo
st (Y
LLs)
†Ranking based on number of all-ages YLLs

22 | GBD 2017 STUDY FINDINGS
SUSTAINABLE DEVELOPMENT GOALS 2017 STUDY HIGHLIGHTS
What’s new in this study“Measuring progress from 1990 to 2017 and projecting attainment to 2030 of the health-related Sustainable Development Goals for 195 countries and territories: a systematic analysis for the Global Burden of Disease Study 2017” includes an updated and improved analysis of progress toward the SDGs. It produces estimates for 41 of the 52 health-related SDG indicators, including estimation of four additional indicators compared to the GBD 2016 study. It also includes subnational analyses of SDG progress for a subset of countries and analysis of trends by sex for select indicators. The study also uses revised methods to project progress between 2017 and 2030.
Highlights » Based on past trends, most countries’ Sustainable
Development Goals (SDG) index* scores are projected to rise between 2017 and 2030.
» By 2030, the under-5 mortality, neonatal mortality, maternal mortality ratio, and malaria indicators had the most countries likely to attain their targets.
Progress and challenges in pursuing the health-related Sustainable Development Goals
Global average SDG index score, 2017: 59.4 out of 100
SDG index* score, 2017
*The SDG index is a composite measure, ranging from 0 to 100, of overall progress toward meeting the SDGs. It takes into account 40 of the 41 performance indicators for the health-related SDGs.
Note: Population census coverage is not included because of its binary status and because it does not have forecasts.
Under 25.825.8 to <32.832.8 to <40.840.8 to <55.355.3 to <59.459.4 to <63.663.6 to <66.166.1 to <69.369.3 to <74.5≥74.5
SDG index score

GBD 2017 STUDY FINDINGS | 23Source: GBD 2017 SDG Collaborators. Measuring progress from 1990 to 2017 and projecting attainment to 2030 of the health-related Sustainable Development Goals for 195 countries and territories: a systematic analysis for the Global Burden of Disease Study 2017. The Lancet. 8 Nov 2018: 392.
Differences by sex in 2017
The analysis broke down several SDG indicators by sex. Here, we highlight three indicators: rate of new HIV cases, deaths due to road injuries, and prevalence of alcohol use. As shown below, males had worse outcomes for most indicators.
Global rate of new cases of HIV, 2017** Global deaths due to road injuries, 2017** Global prevalence of alcohol use, 2017**
0.14
0.07
0
0.05
0.10
0.15
Female Male
Incid
ence
rate
(age
-adj
uste
d ca
ses p
er 1
,000
)
21.5
7.0
0
10
20
30
Female MaleMor
talit
y ra
te (a
ge-a
djus
ted
deat
hs p
er 1
00,0
00)
18.5
6.4
0
10
20
30
Female Male
Prev
alen
ce o
f alco
hol u
se (%
)† 25
15
5
Looking ahead to 2030Despite the progress made so far, achievement of many SDGs by 2030 is in doubt. In order to meet the SDGs, the pace of progress on many health-related indicators will need to accelerate substantially between 2017 and 2030.
Global under-5 mortality rate, 1990–2030
Mor
talit
y ra
te (p
er 1
,000
live
birt
hs)
40
50
60
70
19901995
20002005
20102015
20202025
2030
20
30
SDG target: Reduce under-5 mortality to 25 per 1,000 live births or below by 2030
Past trendAnticipated future trendFuture trend needed to meet SDG target
Global maternal mortality ratio, 1990–2030
SDG target: Reduce maternal mortality ratio to 70 per 100,000 live births or below by 2030
Mor
talit
y ra
tio (p
er 1
00,0
00 li
ve b
irths
)
100
150
19901995
20002005
20102015
20202025
2030
Global prevalence of overweight in children aged 2 to 4, 1990–2030
SDG target: Eliminate child overweight by 2030
Prev
alen
ce (%
)
19901995
20002005
20102015
20202025
2030
0
5
10
15
20
25
**Median estimates†Heavier drinking was weighted more than light drinking.
On track to meet the SDG target


GBD 2017 STUDY FINDINGS | 25
Downloadable GBD 2017 study dataResults dataGBD Compare data visualization: http://vizhub.healthdata.org/gbd-compare
GBD Results Tool: http://ghdx.healthdata.org/gbd-results-tool
GHDx: http://ghdx.healthdata.org/gbd-2017
Includes population and fertility data, covariates, and other datasets not available via visualization tools.
Input dataCauses of Death (COD) Visualization: https://vizhub.healthdata.org/cod/
Data Input Sources Tool (input data sources and relevant metadata): http://ghdx.healthdata.org/gbd-2017/data-input-sources
CodeStatistical, analytical, processing, and estimation code used to generate the GBD results: http://ghdx.healthdata.org/gbd-2017/code
GBD 2017 Online Tools OverviewA basic guide to the suite of web‐based tools for the GBD study: http://www.healthdata.org/sites/default/files/files/Data_viz/GBD_2017_Tools_Overview.pdf
Downloadable GBD 2016 Forecasting study dataGBD Foresight data visualization: https://vizhub.healthdata.org/gbd-foresight

DOWNLOAD RESULTS AND OTHER GBD DATA:
http://ghdx.healthdata.org/gbd-2017
Copyright © 2022 FDOKUMEN